2005 coastal habitat protection plan chapter...
TRANSCRIPT
2005 COASTAL HABITAT PROTECTION PLAN
CHAPTER 3. SHELL BOTTOM 3.1. DESCRIPTION AND DISTRIBUTION Definition
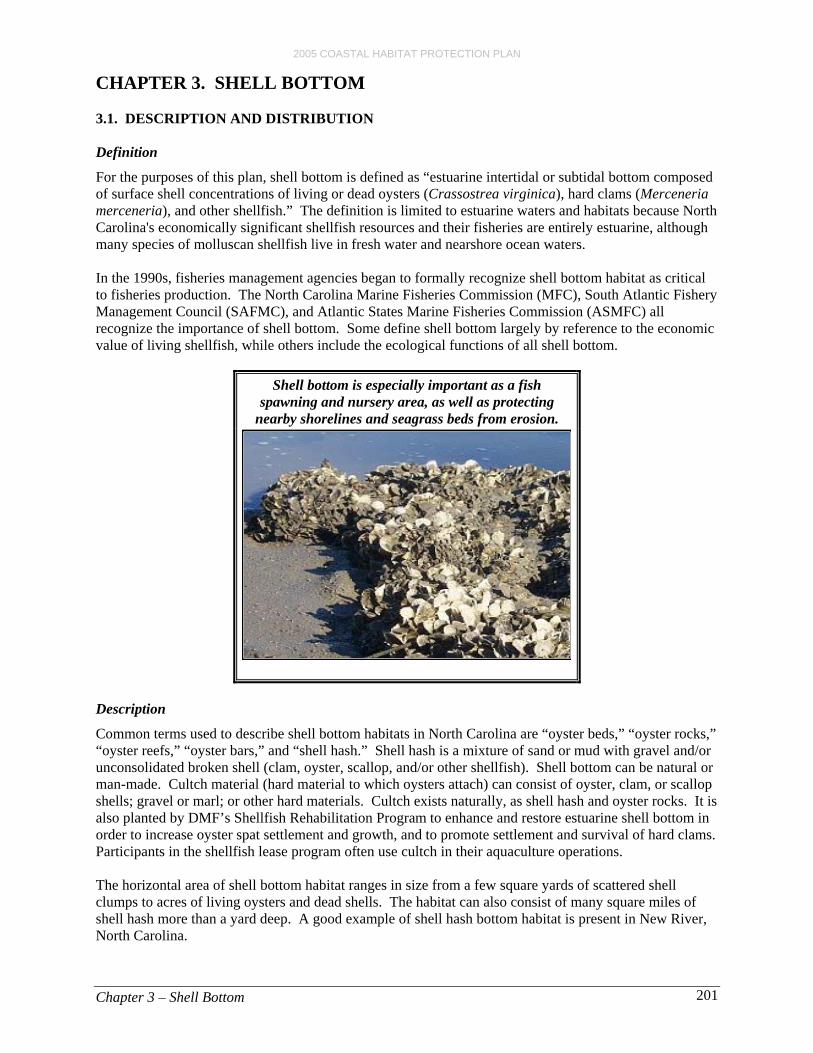
For the purposes of this plan, shell bottom is defined as “estuarine intertidal or subtidal bottom composed of surface shell concentrations of living or dead oysters (Crassostrea virginica), hard clams (Merceneria merceneria), and other shellfish.” The definition is limited to estuarine waters and habitats because North Carolina's economically significant shellfish resources and their fisheries are entirely estuarine, although many species of molluscan shellfish live in fresh water and nearshore ocean waters. In the 1990s, fisheries management agencies began to formally recognize shell bottom habitat as critical to fisheries production. The North Carolina Marine Fisheries Commission (MFC), South Atlantic Fishery Management Council (SAFMC), and Atlantic States Marine Fisheries Commission (ASMFC) all recognize the importance of shell bottom. Some define shell bottom largely by reference to the economic value of living shellfish, while others include the ecological functions of all shell bottom.
Shell bottom is especially important as a fish
pawning and nursery area, as well as protectings nearby shorelines and seagrass beds from erosion.
Description
Common terms used to describe shell bottom habitats in North Carolina are “oyster beds,” “oyster rocks,” “oyster reefs,” “oyster bars,” and “shell hash.” Shell hash is a mixture of sand or mud with gravel and/or unconsolidated broken shell (clam, oyster, scallop, and/or other shellfish). Shell bottom can be natural or man-made. Cultch material (hard material to which oysters attach) can consist of oyster, clam, or scallop shells; gravel or marl; or other hard materials. Cultch exists naturally, as shell hash and oyster rocks. It is also planted by DMF’s Shellfish Rehabilitation Program to enhance and restore estuarine shell bottom in order to increase oyster spat settlement and growth, and to promote settlement and survival of hard clams. Participants in the shellfish lease program often use cultch in their aquaculture operations. The horizontal area of shell bottom habitat ranges in size from a few square yards of scattered shell clumps to acres of living oysters and dead shells. The habitat can also consist of many square miles of shell hash more than a yard deep. A good example of shell hash bottom habitat is present in New River, North Carolina.
Chapter 3 – Shell Bottom 201

2005 COASTAL HABITAT PROTECTION PLAN
Shell bottom is both intertidal and subtidal and can consist of fringing or patch reefs (Coen et al. 1999). In North Carolina, oysters accumulate on existing oyster beds, outcroppings of fossil shell beds, as well as on wedge rangia, hard clam, and bay scallop shell beds (DMF 2001a). Oysters attach to exposed roots at the margin of salt marsh, pilings, seawalls, and rip-rap. Intertidal oyster reefs in North Carolina were characterized into three “landscapes” or combinations of adjacent habitats (Bahr and Lanier 1981; Grabowski et al. 2000). These were:
• Salt marsh landscape – on the edges and points of salt marsh away from seagrass beds • Seagrass landscape – nestled between seagrass beds and salt marshes • Mud flat landscape – on mud flats isolated from vegetative structure
Intertidal oyster reefs in the central and southern estuarine systems may only be a few oysters thick. However, subtidal oyster mounds in Pamlico Sound may have been several meters tall (Lenihan and Peterson 1998). Habitat requirements
Oysters are the principal builders of natural shell bottom in North Carolina’s estuaries. Marshall (1995) identified the most critical habitat for oyster populations as oyster beds and rocks, which the oysters themselves form by the accumulation of shells and oysters over time. The North Carolina Oyster Fishery Management Plan also recognized that the condition of oyster beds or rocks is the most important factor affecting oyster stock abundance because the shell material on those rocks is the most abundant and preferred substrate for the settlement of larval oysters (DMF 2001a). The oyster’s reproductive, morphological, physiological and behavioral adaptations have, in the past, allowed it to persist in immense numbers throughout the estuary (Kennedy 1991). The normal growing temperatures for eastern oyster range from 10 to 30°C (Burrell 1986). Their optimum salinity ranges from 14 to 30 ppt (Castagna and Chanley 1973). The optimum salinity for oyster larvae is somewhat lower than normal growing salinities for spat and adults (Loosanoff 1953; Chanley 1958; Davis 1958). Studies have shown that lower salinities combined with higher temperatures increases oyster mortality (Loosanoff 1953; Funderburk et al. 1991). Oyster distribution and abundance in low salinity waters are therefore limited by salinity and high temperature. However, predation by boring sponges, oyster drills, whelks, annelid worms, and starfish is also reduced in low salinity waters (Gunter 1955; Bahr and Lanier 1981). Increased mortality in the upper and lower regions of the estuary leaves moderate salinity areas with the highest abundance of subtidal oysters in North Carolina. Oyster growth in the intertidal waters varies significantly with temperature, tidal flows, and food quality and availability. Oxygen levels and suspended sediment can affect survival and viability of oysters. Dissolved oxygen (DO) less than 1 to 2 mg/l is generally lethal or harmful to oysters, depending on the time of exposure and life stage of the oyster. Oyster eggs are affected most by suspended sediment, while larvae are slightly more turbidity tolerant, and adult oysters have significantly greater tolerance for suspended matter.28
Although oysters can tolerate extremes in salinity, temperature, turbidity and low dissolved oxygen, spawning success requires optimum salinities, temperatures and good water currents to disperse the larvae. Successful spat settlement and survival requires refuge from predators (Bartol and Mann 1999; Coen et al. 1999); clean, firm surfaces, preferably oyster shell (Kennedy et al. 1996); and good water circulation (Burrell 1986). Adult oysters also require adequate water circulation to deliver food and 28 Studies have found that suspended sediment concentrations of 250 mg/L resulted in 27% mortality in oyster eggs, 500 mg/L
resulted in 69% mortality, and 1000 mg/L caused 97-100% mortality (Davis and Hidu 1969a). Larvae were slightly more turbidity tolerant, with 50% mortality occurring at 1000 to 1500 mg/L after 12 days of exposure. These researchers also documented growth reductions in oyster larvae at suspended sediment concentrations of 750 mg/L. Concentrations above 750 mg/L are representative of the amount of turbidity caused by storms or dredging activities (Davis and Hidu 1969a). Adult oysters are able to feed in water containing up to 0.4 g/l of suspended matter (Nelson 1938; Nelson 1960).
Chapter 3 – Shell Bottom 202
2005 COASTAL HABITAT PROTECTION PLAN
oxygen and to remove wastes and sediment. For subtidal oyster reefs, vertical height affects growth and survival rates for individual oysters by maximizing circulation benefits (Lenihan and Peterson 1998; Lenihan et al. 1999; Peterson et al. 2000a). The vertical structure of oyster reefs physically locates the oysters off the bottom to avoid anoxic water (Lenihan and Peterson 1998) or smothering by sediment (Coen et al. 1999). Lower reefs may be exposed to higher sedimentation rates and increased exposure to anoxia resulting in higher mortality rates. Distribution
The primary shell-building organism in North Carolina estuaries, the eastern oyster, ranges from the Gulf of St. Lawrence in Canada through the Gulf of Mexico to the Bay of Campeche, Mexico and to the West Indies (Bahr and Lanier 1981). To the degree commercial fishery landings may indicate abundance, the highest documented oyster abundance along the Atlantic coast is in the Chesapeake Bay (DMF 2001a). Historically, Maryland’s landings of 15 million bushels dwarfed North Carolina’s highest annual oyster landings of 1.8 million bushels in 1902 (DMF 2001a). Oysters are found along a majority of the North Carolina coast from extreme southeastern Albemarle to the estuaries of the southern part of the state to the South Carolina border (DMF 2001a). Oyster reefs occur at varying distances up North Carolina’s estuaries, depending upon salinity, substrate, and flow regimes. In the wind-driven Pamlico Sound system north of Cape Lookout, oyster reefs consist overwhelmingly of subtidal beds. South of Cape Lookout, subtidal rocks also occur in the New, Newport, and White Oak rivers (DMF 2001a). Extensive intertidal oyster rocks occur in North Carolina’s southern estuaries, where the lunar tidal ranges are higher. Substantial shell hash is present in New River, eastern Bogue Sound, and along the edges of many streams and channels, such as portions of the Atlantic Intracoastal Waterway (ICW) in the southern coastal area. In the Albemarle-Pamlico estuary, oysters are concentrated in the lower portion of Pamlico Sound tributaries, along the western shore of Pamlico Sound, and to a lesser extent behind the Outer Banks. (Epperly and Ross 1986) (Map 3.1). Shellfish habitat and abundance mapping
The DMF Shellfish Habitat and Abundance Mapping Program began creating detailed bottom type maps in 1988. These maps are being compiled using standardized surveys from the South Carolina border north through Core Sound, along the perimeter of Pamlico Sound, and in Croatan/Roanoke sounds (Map 3.2). The program delineates all bottom habitats, including shell bottom, and samples the density of oysters, clams, and bay scallops in these habitats. This program has differentiated 24 different bottom types based on combinations of depth, bottom firmness, vegetation density, and density of surface shells. This program defines shell habitat (shell bottom) as significant cover (>30% of bottom) of living or dead shells. Some of the other fish habitats mapped by the program include salt marsh, submerged aquatic vegetation, and soft bottom. A stratified random sampling design is used to provide statistically sound shellfish density estimates by area and habitat. As of January 2003, mapping has been completed from Carolina Beach to Ocracoke Inlet, including Core Sound. The following specific areas have also been mapped: Shallowbag Bay, portions of Pamlico Sound in the vicinity of Oregon Inlet, and South River (Carteret County) (Map 3.2). This area represents approximately 42% (222,643 acres) of the total area (about 530,000 acres) intended for mapping (Map 3.2). As of 2003, West Bay in southwestern Pamlico Sound has also been completed. Of the entire area mapped by January 2003 (222,643 acres), approximately 6% (12,502 acres) of the bottom was classified as shell bottom (Table 3.1). The Southern Estuaries have the greatest proportion of shell bottom (17%) of the areas mapped to date. Private shellfish leases were delineated but not included
Chapter 3 – Shell Bottom 203

2005 COASTAL HABITAT PROTECTION PLAN
in these estimates. Shellfish leases cover additional shell bottom areas in the Core/Bogue (357 acres) and New/White Oak (498 acres) of the shellfish mapping study area. As of January 2003, there were 281 shellfish leases in coastal North Carolina occupying 2,079 ac, which comprises less than 1% of the shellfish mapping study area.29
Table 3.1. Shell bottom habitat mapped within Coastal Habitat Protection Management Units by the
North Carolina Division of Marine Fisheries' Shellfish Habitat and Abundance Mapping Program (January 2003).
Table 3.1. Shell bottom habitat mapped within Coastal Habitat Protection Management Units by the North Carolina Division of Marine Fisheries' Shellfish Habitat and Abundance Mapping Program (January 2003).
1 Percent (%) is the amount of shell bottom/total area mapped within each MU. Total mapping study area is shown on
Map 3.2.
1 Percent (%) is the amount of shell bottom/total area mapped within each MU. Total mapping study area is shown on
Map 3.2.
Total shell bottom
acres % complete acres%
complete acres%
complete acresAlbemarle 1,687 2.8 0 0.0 33 1.9 32.8Core/Bogue 148,994 94.7 1,875 1.3 5,420 3.6 7,294.6Neuse 3,120 13.3 0 0.0 26 0.8 25.9New/W. Oak 34,495 94.4 346 1.0 333 1.0 679.5Pamlico 8,498 3.8 22 0.3 93 1.1 114.7Southern Estuaries 25,603 82.6 2,577 10.1 1,775 6.9 4,352.1Coastal Ocean 246 56.2 0 0.2 2 0.8 2.3Total * 222,643 41.9 4,820 2.2 7,681 3.5 12,501.8
Management unit
Total area mapped1Shell bottom (intertidal)
Shell bottom (subtidal)
The highest average shellfish density (45.5 shellfish/m2) within the mapped area was in the Core/Bogue MU. Maps 3.3a-c show the spatial distribution of shellfish density on shell bottom.30
The highest average shellfish density (45.5 shellfish/m2) within the mapped area was in the Core/Bogue MU. Maps 3.3a-c show the spatial distribution of shellfish density on shell bottom.30
3.2. ECOLOGICAL ROLE AND FUNCTIONS 3.2. ECOLOGICAL ROLE AND FUNCTIONS Ecosystem enhancement Ecosystem enhancement
Water Quality Enhancement Water Quality Enhancement
The direct and indirect ecosystem services of the oyster reef, such as filtering capacity, transfer of production between bottom and water column, nutrient dynamics and sediment stabilization, have been largely ignored or underestimated (Coen and Luckenbach 1998). The ASMFC reports that shell bottom provides food, refuge and nursery grounds for coastal fisheries. Shell bottom also indirectly benefits the fisheries by providing water filtration. Kennedy (1991) suggested that the filtering activities of the massive concentrations of oysters historically present in the Chesapeake Bay might have resulted in different assemblages of plankton, with fewer sea nettles, microplankton and bacterioplankton. Before the end of the 19th century, oysters in the Chesapeake Bay could filter the entire volume of the bay in a little more than three days (Newell 1988). Newell’s estimate of the filtering capacity of Chesapeake Bay oyster populations in 1988 was 325 days. Other researchers agree that the loss of oyster populations removes one potentially important means of controlling nuisance phytoplankton blooms and other negative impacts of nutrient enrichment and coastal eutrophication (Officer et al. 1982; Dame et al. 1984; Lenihan and Peterson 1998; Coen et al. 1999; Jackson et al. 2001). Jackson et al. (2001) attributed much of the decline in water quality in Pamlico Sound and Chesapeake Bay to loss of bio-filtration capacity attributable to the drastic decline (>90%) in oyster biomass. 29 However, the contribution of shellfish leases to overall shell bottom is unknown because they contain areas that do not meet
the definition of shell bottom. So the estimates for overall shell bottom coverage are somewhat underestimated. 30 More information on the distribution of shell bottom is provided in the Status and trends section (3.3).
Chapter 3 – Shell Bottom 204

2005 COASTAL HABITAT PROTECTION PLAN
Shell bottom enhances water quality by transferring phytoplankton production to benthic production through filter feeding (Officer et al. 1982; Cloern 2001; DMF 2001a; Newell et al. 2002). Increased shell bottom and oyster biomass reduce the impacts of eutrophication. After being recycled by oysters, nutrients are deposited around the base of oyster beds where nitrogen is removed (Newell et al. 2002). The organic deposits from oyster filtering can be released by erosion, sediment reworking by animals, or resuspension with possible uptake by adjacent SAV (Peterson and Peterson 1979). With more nutrients denitrified or stored in the sediment, the frequency of hypoxia (<2 mg/l of dissolved oxygen) and anoxia (no dissolved oxygen) events in the water column should decrease. The oyster shells themselves also store carbon in the form of calcium carbonate (Hargis and Haven 1999). The sequestered carbon is thus taken out of atmospheric circulation, serving as one means to partially offset the observed trend of increasing concentrations of CO2, an important greenhouse gas associated with global warming. Habitat Modification
The oyster’s structural modification of habitat is important to the estuarine system. As shell bottom increases, wave energy decreases, stabilizing sediment and decreasing erosion (Lowery and Paynter 2002). High-relief shell bottom alters currents and water flows, influencing patterns of fish settlement, predation and predator feeding success (Breitburg et al. 1995; Coen et al. 1999). On the down-current side of the reef, flow velocity is reduced and larval fish species can maintain their positions during the high-flow portions of the tidal cycle (Breitburg et al. 1995). Oyster reefs can also constrict tidal flow to certain areas, resulting in island formation (Bahr and Lanier 1981). By reducing wave energy along the shoreline, shell bottom aids in stabilizing creek banks and reducing salt marsh erosion (Bahr and Lanier 1981; Dame and Patten 1981; Marshall 1995; Breitburg et al. 2000). The presence of shell bottom reduces turbidity by filtering water and physically trapping and stabilizing large quantities of suspended sediment and organic matter with the shell structure (Haven and Morales-Alamo 1970; Dame et al. 1989; Coen et al. 1999; Grabowski et al. 2000). This, in turn, improves water clarity, which increases productivity of the water column and SAV. The reduction in turbidity has a positive effect on SAV by increasing light penetration to the plants, creating more suitable conditions for SAV growth, survival, and expansion (Meyer and Townsend 2000). As an example, prior to large-scale losses of shell bottom in the Chesapeake Bay, bay waters were reported to be much less turbid than current conditions, which allowed submerged aquatic vegetation to thrive (Coen et al. 1999; Jackson et al. 2001). Because of these ecosystem benefits provided by oysters to other habitats, Lenihan and Peterson (1998) proposed that oysters might now be more economically valuable as a habitat than a fishery. Productivity
Primary producers on shell bottom include algae (epiphytic microalgae, attached macroalgae) and organic films of bacteria and fungi. These organisms provide food for resident secondary consumers. Many crab species (including the mud crabs and pea crab), barnacles, soft-shelled clams, hard clams, mussels, anemones, polychaetes, amphipods, hydroids, bryozoans, flatworms, mussels, and sponges make up the oyster reef community. All of these species recycle nutrients and organic matter and many become prey for finfish, shrimps and blue crab (Bahr and Lanier 1981). Grass shrimp (Palaemonetes spp.), an important link in food webs, prefer oyster reefs to other surfaces when avoiding predators (Posey et al. 1999). Resident species (e.g., gobies) are significant zooplankton predators. Live oyster shell bottom also enhances secondary productivity in the estuary by providing hard, complex substrate, allowing colonization by an abundance of plants and animals on the shell substrate. This in turn supports many resident and transient fish and invertebrates that are ecologically and economically important.
Chapter 3 – Shell Bottom 205

2005 COASTAL HABITAT PROTECTION PLAN
Fish utilization
Shell bottom provides critical fisheries habitat not only for oysters, but also for recreationally and commercially important finfish, other mollusks, and crustaceans. The ecological functions of oyster reefs related to oyster production are well known and accepted (Coen et al. 1999). These functions include aggregation of spawning stock, chemical cues for successful spat settlement, and refuge from predators and siltation. Oysters have also been described as “ecosystem engineers that create biogenic reef habitat important to estuarine biodiversity, benthic-pelagic coupling, and fishery production”31 (Lenihan and Peterson 1998). Data quantifying fish use of habitats vary from presence/absence and numerical abundance, to actual fish production value. In North Carolina, 18 fishery species have been documented utilizing both natural and restored oyster reefs in Pamlico Sound, including Atlantic croaker, southern flounder, Spanish mackerel, spotted seatrout, weakfish, American eel, and black sea bass (Lenihan et al. 2001). Numerical abundance and production compared to other habitats provides additional information on the importance of habitat for fish. The species found most abundantly on oyster reefs compared to adjacent soft bottom were silver perch, sheepshead, pigfish, pinfish, toadfish, and Atlantic croaker. Southern flounder was collected on both oyster reefs and adjacent soft bottom areas, while bluefish and Atlantic menhaden were not collected near oyster reefs (Lenihan et al. 2001). Several studies have found higher abundance and diversity of fish on shell bottom than adjacent soft bottom, particularly pinfish, blue crabs, and grass shrimp (Harding and Mann 1999; Posey et al. 1999; Lenihan et al. 2001). A study in Back Sound also found that crabs were more abundant on shell bottom than restored SAV beds (Elis et al. 1996). Breitburg (1998) concluded that the importance of shell bottom to highly mobile species is very likely underestimated, partially due to the difficulty in sampling oyster beds. Peterson et al. (2003a) estimated the amount of fish production that shell bottom provides in addition to adjacent soft bottom habitats. Using results from numerous studies, they compared the density of fish at different life stages on oyster reefs and adjacent soft bottom habitats. The published growth rates of species were then used to determine the amount of production gained from shell bottom. The species were separated into recruitment-enhanced, growth-enhanced, and not enhanced groups. Recruitment-enhanced species are those having early life stages showing almost exclusive association with shell bottom. For other species with higher abundance in shell bottom, diet and life history studies were used to determine the fraction of their production associated with the consumption of shell bottom-enhanced species. Species consuming relatively more shell bottom-enhanced species were classified as growth-enhanced. Analysis of the studies revealed that every 10m2 of newly constructed oyster reef in the southeast United States is expected to yield a benefit of an additional 2.6 kg of fish production per year for the lifetime of the reef (Peterson et al. 2003a).32
Fish that utilize shell bottom can be classified into three categories: resident, transient, and facultative (Coen et al. 1999; Lowery and Paynter 2002). Resident species live on shell bottom and depend on it as their primary habitat. Transient species are wide-ranging species that use shell bottom for refuge and forage along with other habitats. Facultative species depend on shell bottom for food, but utilize other
31 Benthic-pelagic coupling refers to the transfer of production from the oyster beds to the mobile species foraging on the beds
(Lenihan and Peterson 1998), benefiting both estuarine and ocean fisheries. It also refers to the transfer of phytoplankton production and other fine particulates to the bottom.
32 For individual species, the amount of additional production ranged from 0.08 (spottail pinfish) - 158.80 (bay anchovy) fish/10m2. Of the 53 species of fish and shellfish for which data were available, ten were recruitment-enhanced and ten were growth-enhanced. About half of the 20 shell bottom-enhanced species were fishery species (sheepshead, black sea bass, gray snapper, white perch, gag, pigfish, southern flounder, and tautog). The recruitment-enhanced species included stone crabs, sheepshead, blennies/gobies, skilletfish, gray snapper, gag, toadfish, and tautog. Growth enhanced species included bay anchovy, black sea bass, sheepshead minnow, spottail pinfish, silversides, white perch, pigfish, and southern flounder.
Chapter 3 – Shell Bottom 206

2005 COASTAL HABITAT PROTECTION PLAN
habitats with vertical relief or shelter sites. At least seven fish species have been identified as resident species—naked goby, striped blenny, feather blenny, freckled blenny, skilletfish, and oyster toadfish (Coen et al. 1999, Lowery and Paynter 2002). These species were also considered recruitment-enhanced by Peterson et al. (2003a). Resident fish are important prey for transient and facultative predator species (Coen et al. 1999). For example, Breitburg (1998) found high densities of juvenile striped bass (15.4 individuals/m2 of reef surface) aggregating near the reef surface feeding on naked goby larvae congregated on the down-current side of the reef. Other common predator species sampled on oyster reefs in North Carolina are red and black drum, Atlantic croaker, sheepshead, weakfish, spotted seatrout, summer and southern flounder, blue crab, and oyster toadfish. Of these species, however, only sheepshead, southern flounder, and oyster toadfish were considered shell bottom-enhanced by Peterson et al. (2003a). Production of black drum, Atlantic croaker, blue crab, and summer flounder were classified as not enhanced by shell bottom. Oyster reefs in higher salinity waters are critical habitat for predators such as juvenile gag, snappers (Lutjanus spp.) and stone crab (Wenner et al. 1996; Peterson et al. 2003a). There is some variation in fish use among salinity gradients as well. Oyster reefs in higher salinity waters tend to support a greater number of associated species than reefs in lower salinity waters (Sandifer et al. 1980). Studies summarized by Coen et al. (1999), which included work in North Carolina, identified 72 facultative, resident and transient fish species in close proximity to oyster reefs. The ASMFC-managed species categorized as transient and also important to North Carolina’s coastal fisheries are American eel, Atlantic croaker, Atlantic menhaden, black sea bass, bluefish, red drum, spot, striped bass, summer flounder, tautog, and weakfish. Only black sea bass and tautog were considered shell-bottom enhanced by Peterson et al. (2003a). A partial list of macrofaunal species observed in collections from oyster habitat is provided in Table 3.2. Those species that use shell bottom as spawning and/or nursery areas are identified, as are those species that forage on shell bottom habitat and/or use it as a refuge (SAFMC 1998a; Lenihan et al. 1998; Coen et al. 1999; Grabowski et al. 2000). More than 30 species are listed in Table 3.2, and there are many more not listed, emphasizing the importance of shell bottom as fisheries habitat.
Chapter 3 – Shell Bottom 207

2005 COASTAL HABITAT PROTECTION PLAN
Table 3.2. Partial listing of finfish and shellfish species observed in collections from shell bottom in
North Carolina, and ecological functions provided by the habitat.
Refuge Spawning Nursery Foraging Corridor
American eel X X X X X UStriped bass X X X V- Albemarle Sound, Atlantic
Ocean, O- Central/Southern
Anchovies (striped, bay) X X X Blennies X X X X Black drum X XBlue crab X X X X X X COyster X X X X X CGobies X X X X Grass shrimp X X X X Hard clam X X X X X UMummichog X X X Oyster toadfish X X X X XRed drum X X X X X RSheepshead minnow X X Silversides X Skilletfish X X X Spotted seatrout X X VStone crab X X X XWeakfish X X X X X V
Atlantic croaker X X CBrown shrimp X X X X X VSouthern flounder X X OSpot X X X X X VStriped mullet X X C
Atlantic spadefish X C 4
Black sea bass X X X X X V- north of Hatteras, O- south of Hatteras
Gag X X X X X VGulf flounder XPigfish X XPinfish X X X X XPink shrimp X X X X X VSheephead X X X X X C 4
Spanish mackerel X VSummer flounder X X X X V
3 V=viable, R=recovering, C=Concern, O=overfished, U=unknown (DMF 2003a). 4 Status of reef fish complex as a whole. Sheepshead and Atlantic spadefish have not been evaluated in NC.
Shell Bottom Functions 1
Stock Status 3
ANADROMOUS & CATADROMOUS FISH
ESTUARINE AND INLET SPAWNING AND NURSERY
MARINE SPAWNING , LOW-HIGH SALINITY NURSERY
MARINE SPAWNING , HIGH SALINITY NURSERY
2 Existing commercial or recreational fishery. Fishery and non-fishery species are also important as prey
Species*
* Scientific names listed in Appendix I. Names in bold font are species whose relative abundances have been reported in the literature as being generally higher in shell bottom than in other habitats. Note that lack of bolding does not imply non-selective use of the habitat, just a lack of information.1 Sources: Pattilo et al. 1997; SAFMC 1998; Lenihan et al. 1998, 2001; Coen et al. 1999; Grabowski et al. 2000; Peterson et al. 2003
Fishery 2
Chapter 3 – Shell Bottom 208

2005 COASTAL HABITAT PROTECTION PLAN
Refuge
The complex three-dimensional shell habitats provide food, refuge, and attachment areas for larval, juvenile, adult, and spawning finfish, crustaceans and mollusks (Arve 1960; Wells 1961; MacKenzie 1983; Zimmerman et al. 1989; Meyer et al. 1996; Breitburg 1998; Lenihan et al. 1998; Coen et al. 1999; Harding and Mann 1999). Oyster reefs provide more area for attachment of oysters and other sessile organisms. More habitat niches occur in oyster reefs than on the surrounding flat or soft bottom habitats. Bartol and Mann (1999) found the quality and quantity of interstitial spaces (spaces between the shells within the shell matrix) to be critical to recruiting oysters, as well as to the survival of other oyster reef species. Survival was greater in the interstitial spaces than at the reef surface. The crevices in shell bottom provide refuge for small, slow-moving macrofauna, such as polychaete worms, blue crabs, hard clams, amphipods and other species (Zimmerman et al. 1989; SAFMC 1998a). Mud crabs utilize shell bottom as refuge from oyster toadfish, blue crabs and wading birds (Meyer 1994). While crabs utilize the shell structure to hide from predators in the day, sampling found that they migrate to the open mud flats at night to feed (Grabowski et al. 2000). Competition for shell bottom habitat as refuge is greatest within similar size categories of fauna (Coen et al. 1999). Shell bottom substrates provide significant protection from predators for adult and juvenile hard clams. Peterson et al. (1995) reported that young clams survived better in shell bottom than open soft bottom areas. The DMF specifically manages some intertidal oyster cultch planting sites in the southern coastal area to take advantage of this hard clam–oyster shell relationship. After oysters are harvested off the planted site, the areas are opened specifically for clam harvest by hand gears. Fishermen dig under the cultch to take high concentrations of hard clams that recruited under the oyster shell. Once the clam harvest is over, the areas are re-planted with cultch, and the two-year cycle begins again. Subtidal oyster reefs may be relatively more important to commercially important finfish than intertidal reefs, because subtidal reefs often provide the only structured habitat in submerged areas (Grabowski et al. 2000). In contrast, intertidal reefs are often surrounded by other structured habitats, such as salt marshes and SAV beds. From southeastern North Carolina to northern Florida, where SAV does not occur, shell bottom represents the dominant structural habitat in the mid-intertidal to shallow subtidal waters (Posey et al. 1999). In other intertidal estuaries in North Carolina where little or no SAV is present, shell bottom also provides critical structural refuge, along with salt marsh (Eggleston et al. 1998). Spawning
Resident species, such as gobies (naked and green), Atlantic midshipman, and northern pipefish depend on shell bottom as breeding habitat (Hardy 1978a, 1978b; Johnson 1978; Coen et al. 1999). Other species documented to spawn on shell bottom include the oyster toadfish, mummichog, sheepshead minnow, eastern oyster, grass shrimp, and hard clams (NOAA 2001). Toadfish attach their eggs to the underside of oyster shells, whereas gobies, blennies, and skilletfish place their eggs in recently dead oyster shell (Coen et al. 1999). Well-developed oyster reefs with clean oyster shells in a variety of sizes were shown to accommodate reproduction by the greatest densities of all resident species (Breitburg 1998). Nursery
Shell bottom protects oyster spat and other juvenile bivalves, finfish and crustaceans from predators. Juvenile clams, in particular, settle in shell substrate for the protection it provides (Wells 1957; MacKenzie 1977; Peterson 1982; DMF 2001b). The nursery area function of shell bottom was demonstrated by Eggleston et al. (1998) who found that juvenile blue crabs and grass shrimp were equally abundant on shell bottom and SAV in Back Sound, North Carolina. Twelve of the 18 mobile and economically important coastal fisheries species sampled by Lenihan et al. (2001) on natural and restored oyster reefs in Pamlico Sound were juveniles.
Chapter 3 – Shell Bottom 209

2005 COASTAL HABITAT PROTECTION PLAN
In a study where shell structure was added to mud flat reefs, juvenile fish abundance increased on the augmented reefs compared to surrounding soft bottom (Grabowski et al. 2000). The study also found that this initial increase was higher than increases that occurred when SAV and/or salt marsh were added in the same area. The ASMFC considers shell bottom as important nursery habitat for juvenile fish such as sheepshead, gag, snappers, stone and blue crabs, and penaeid shrimps (Lowery and Paynter 2002). An analysis by Peterson et al. (2003a) confirmed that sheepshead, gag, and stone crab were recruitment enhanced, as well as many non-fishery species, including anchovies, blennies, gobies, oyster toadfish, and skilletfish. While oyster reefs are the most recognized shell bottom habitat, shell hash concentrations on tidal creek bottoms provide important nursery habitat for young fish. For example, the preferred habitat of juvenile drum species in South Carolina is high marsh areas with shell hash and mud bottoms (Daniel 1988). However, the extent of shell hash in North Carolina tidal creeks is currently unknown; known locations of shell hash include concentrations along the Intracoastal Waterway. The nursery value of designated nursery areas could be enhanced by low-density plantings of cultch material. However, the enhancement of fish stocks provided by planting could be negated if recruitment is not limiting the adult population. The recruitment enhancement provided by low-density cultch planting in nursery areas should be evaluated. Foraging
Shell bottom provides important foraging area for a variety of aquatic organisms. Fish, shrimp and crabs forage on the worms, algae, crustaceans, mollusks, and other invertebrates present on and in shell bottom habitat. Concentrations of prey organisms among the shell attract both specialized and opportunistic predators. Eggs from oysters and other organisms, and larvae from species belonging to the oyster shell bottom community, are eaten by protozoans, jellyfishes, ctenophores, hydroids, worms, mollusks, adult and larval crustaceans, and fishes (Loosanoff 1965). Blue crabs forage heavily on oyster reefs (Menzel and Hopkins 1955; Krantz and Chamberlin 1978; Mann and Harding 1997). Stomach contents of common finfish predators sampled near shell bottom in Middle Marsh, North Carolina, included fish, shrimp, tanaids, amphipods, isopods, polychaetes, bivalves, gastropods, and tunicates, as well as plant, algal and detrital material (Grabowski et al. 2000). Grabowski et al. (2000) calculated an index of reef affinity (association) for fish species and analyzed the relative proportion of stomach contents originating from oyster reef versus non-reef habitats. Results showed:
• Pigfish and pinfish foraged more on reefs (amphipods, bivalves, gastropods and polychaetes). • The ubiquitous spot foraged on both reef and non-reef habitats. • Gulf and southern flounder foraged on species slightly more common on reefs. • Blacktip sharks, spotted seatrout, and bluefish exhibited a feeding preference for oyster reef prey
(fish, shrimp and crabs). • Red drum foraged slightly more off reefs. • Blacknose sharks rarely foraged on reef habitats.
The growth-enhanced species/groups identified in Peterson et al. (2003a) included sheepshead minnow, silversides, pigfish, southern flounder, and black sea bass. These results differ somewhat from those of Grabowski et al. (2000). The discrepancies between Peterson et al. (2003a) and Grabowski et al. (2000) could be due to regional differences in fish habitat use, or other unknown factors. Sheepshead also have an affinity for slow or sessile invertebrates found abundantly on shell bottom (Pattilo et al. 1997). Corridor and Connectivity
Shell bottom serves as a nearshore corridor to other fish habitats, such as salt marsh and SAV for finfish and crustaceans; therefore, it plays a significant ecological role in landscape-level processes (Coen et al.
Chapter 3 – Shell Bottom 210

2005 COASTAL HABITAT PROTECTION PLAN
1999; Micheli and Peterson 1999). Vicinity (isolation) and connectivity of intertidal oyster reefs to other fish habitats, especially SAV, are two factors that affect fish utilization of shell bottom. For example, connectivity of oyster reefs to SAV enhanced blue crab predation, whereas isolation of oyster reefs enhanced hard clam survivorship (Micheli and Peterson 1999). In Middle Marsh, North Carolina, gag, gray snapper, and spottail pinfish preferred shell bottom habitat adjacent to SAV beds (Grabowski et al. 2000), allowing access to both refuge and prey. 3.3. STATUS AND TRENDS Status of shell bottom habitat
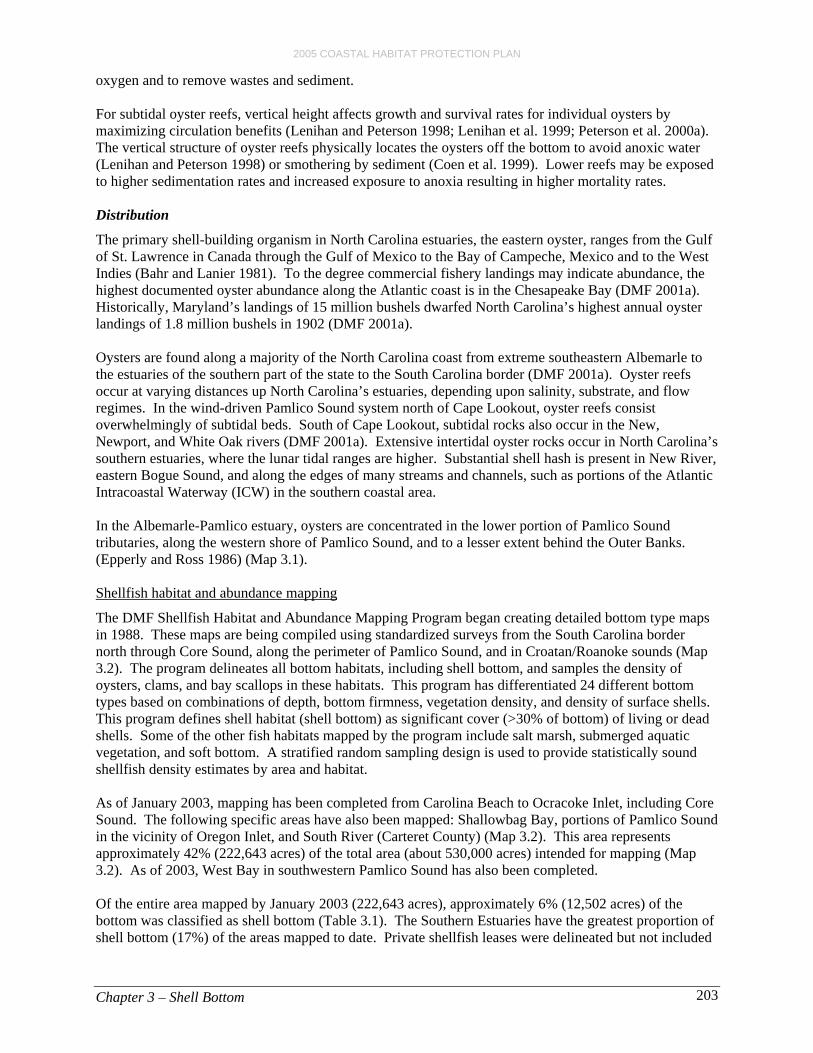
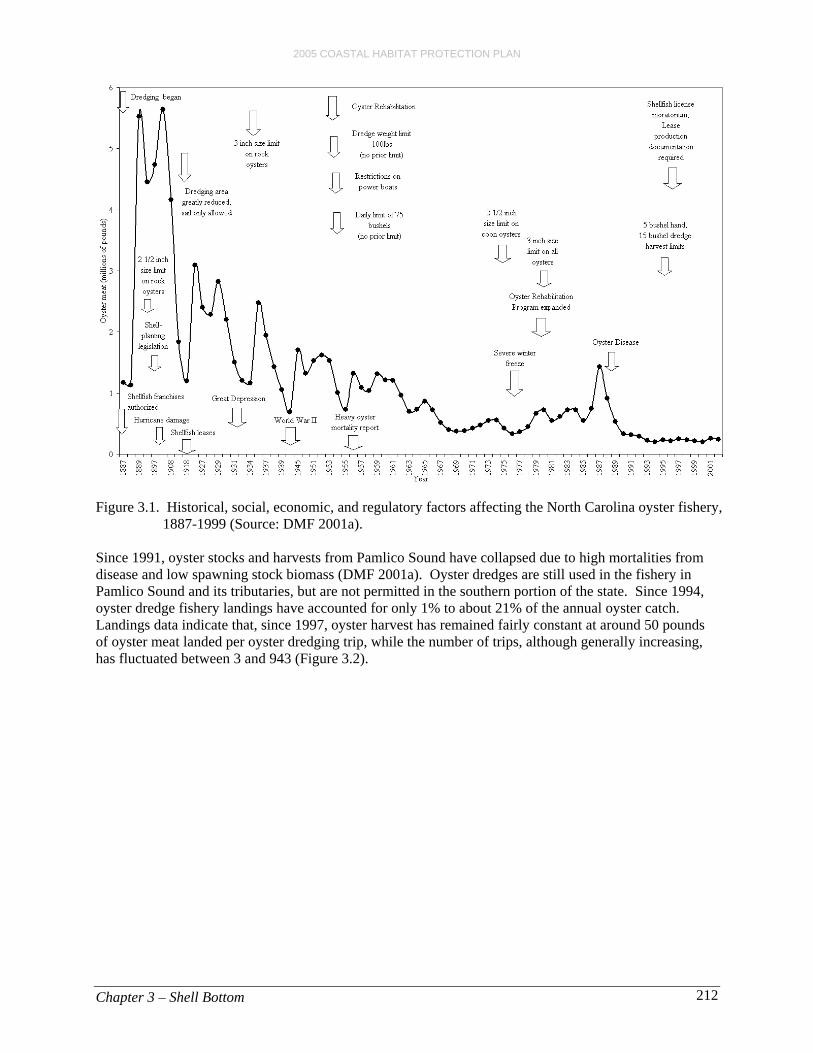
During the colonial period in the mid-Atlantic, oyster reefs grew so extensively that they were considered to be a hazard to navigation (Newell 1988). U.S. Navy Lieutenant Francis Winslow documented the historical distribution of oyster beds in North Carolina in 1886-1887. Winslow (1889) surveyed 1,325,419 acres in 17 areas extending from Croatan and Roanoke sounds west to the lower Pamlico and south to the eastern edge of Bogue Sound, and located 8,328 acres of public and private oyster beds (0.6% of the bottom). Allowing for expansion of oyster beds, Winslow et al. (1889) also located 20,554 acres of “public oyster grounds.” In the North River estuary of Carteret County, Winslow (1889) found 243 acres of natural oyster beds, 310 acres of private beds, and about 600 acres of additional public oyster grounds. In the same general area during the 1990s, the DMF Shellfish Habitat and Abundance Mapping Program estimated there were 445 acres of shell bottom. The DMF mapping program includes scattered, individual shellfish and shellfish clusters as shell bottom, while Winslow (1889) only counted shellfish clusters, making comparisons difficult. DMF’s Shellfish Mapping data on shellfish cluster abundance are therefore more inclusive than the Winslow data. However, DMF mapping data could be analyzed by shellfish density to approximate changes in abundance. Other studies suggest that viable oyster beds have been displaced downstream roughly 10-15 miles in the Pungo, Pamlico, and Neuse rivers since the late 1940s (Jones and Sholar 1981; Steel 1991). The DMF’s Shellfish Habitat and Abundance Mapping Program has not yet mapped these estuarine systems, as mapping existing shell bottom for protection is prioritized. Current priority for the Shellfish Mapping Program is the lower Neuse River, followed by areas to the north. Because this detailed mapping process is time consuming, change analysis would need to be limited to a subset of priority areas. Priorities should be based on a combination of functional significance, economic value, and the magnitude of growth and development threatening the area. The status of shell bottom can also be evaluated using area-specific oyster harvest and effort data, fishery-independent sampling data, or site-specific studies on reproduction, growth, and recruitment. Based on harvest data, North Carolina oyster stocks were in a state of decline for most of the 20th century (DMF 2001a). North Carolina’s oyster landings have generally declined from a peak coinciding with the introduction of the oyster dredge in 1889 to today’s low harvest (Figure 3.1). Data on landings by gear type indicate that, between 1887 and 1960, most oysters were harvested by dredge when compared to all hand methods (DMF 2001a). Chestnut (1955) reported that 90% of the oysters landed in North Carolina came from dredging operations in the Pamlico Sound. These harvesting practices were the primary cause of initial degradation and loss of shell bottom habitat in the Pamlico Sound area (DMF 2001a; Jackson et al. 2001).
Chapter 3 – Shell Bottom 211
2005 COASTAL HABITAT PROTECTION PLAN
Figure 3.1. Historical, social, economic, and regulatory factors affecting the North Carolina oyster fishery, 1887-1999 (Source: DMF 2001a).
Since 1991, oyster stocks and harvests from Pamlico Sound have collapsed due to high mortalities from disease and low spawning stock biomass (DMF 2001a). Oyster dredges are still used in the fishery in Pamlico Sound and its tributaries, but are not permitted in the southern portion of the state. Since 1994, oyster dredge fishery landings have accounted for only 1% to about 21% of the annual oyster catch. Landings data indicate that, since 1997, oyster harvest has remained fairly constant at around 50 pounds of oyster meat landed per oyster dredging trip, while the number of trips, although generally increasing, has fluctuated between 3 and 943 (Figure 3.2).
Chapter 3 – Shell Bottom 212

2005 COASTAL HABITAT PROTECTION PLAN
Figure 3.2. Oyster dredge effort by trips in North Carolina and pounds of oyster meat landed per trip
during 1994-2000 (DMF, unpub. data).
0
100
200
300
400
500
600
700
800
900
1000
1994 1995 1996 1997 1998 1999 2000 2001 2002
Trip
s
0
10
20
30
40
50
60
70
Poun
ds/tr
ip
TripsPounds/ trip
Oyster populations in the southern portion of the coast have suffered only moderately from disease and, due to a prohibition on the use of mechanical oyster harvest methods south of Pamlico Sound, these populations have not been impacted by those methods (DMF, unpub. data). The harvest of oysters in this area is primarily limited by availability of open areas, since harvest closures have increased over time due to pollution, fishing effort is high, and oyster beds are easily accessible. In North Carolina coastal waters overall, cumulative and secondary effects from severe disease infestations, coupled with continued decline in suitable habitat, have seriously impacted oyster stocks.33 Average oyster spatfall in the Pamlico Sound area for the 1989–1999 period was less than half the value for the 1979–1988 period (DMF 2001a) (Figure 3.3). Unpublished DMF spatfall data for cultch planting sites over the past 24 years indicate a decline in maximum spatfall relative to similar surveys reported by Chestnut (1955). Some researchers suspect that oysters are becoming spawner-limited, while others attribute the decline to stress and mortality from infectious diseases that affect primarily larger, more fecund (egg-producing) adults (Choi et al. 1994; Lenihan et al. 1999; DMF 2001a), or to physical damage from dredging (Marshall et al. 1999). However, there has been no reported decline in spatfall in the southern coastal area of North Carolina (R. Carpenter, DMF, pers. com., 2002). 33 Fishing gear and disease impacts are given a more thorough discussion in the Section 3.4 (Threats and Management Needs).
Chapter 3 – Shell Bottom 213

2005 COASTAL HABITAT PROTECTION PLAN
0
0.5
1
1.5
2
2.5
3
3.5
4
79 81 83 85 88 90 92 94 96 98
Year
Spat
Per
Uni
t Cat
ch
Figure 3.3. Pamlico Sound area average oyster spatfall per unit catch, 1978–1999 (DMF, unpub. data). Status of associated fishery stocks
Based on the link between fishery species and shell bottom established in Section 3.2, some inferences can be made using the status and trends of fishery species that are highly dependent on shell bottom habitat (bolded species in Table 3.2). However, utility of the inferences is severely limited because the majority of shell bottom loss occurred before detailed fishery statistics were collected (prior to 1972). Another problem is the difficulty of sampling in oyster beds. The DMF’s juvenile surveys use seines and bottom trawls, which are ineffective for sampling in oyster beds. Appropriate sampling gear should be used to gather baseline data on juvenile abundance in shell bottom areas. Recent fishery statistics provide a benchmark for future analysis, especially trip ticket data collected since 1994. Of at least twenty-eight species (other than oysters) showing some preference for shell bottom (Table 3.2) habitat, ten species, comprising at least thirteen stocks, were evaluated for fishery status. Of the eleven stocks whose status was known, three were designated Overfished (27%), one was Concern (9%), one was Recovering (9%), and six were Viable (55%) (Figure 3.4). Specifically, the southern flounder stock, the central-southern stock of striped bass, and the black sea bass stock south of Cape Hatteras are classified as Overfished; blue crab and red drum are classified as Concern and Recovering, respectively (DMF 2003a). Viable stocks include spotted seatrout, shrimp, gag, the ocean and Albemarle Sound stocks of striped bass, and the black sea bass stock north of Cape Hatteras. The stock status of hard clams, stone crabs, black drum and other shell bottom-associated fishery species is unknown.
Chapter 3 – Shell Bottom 214

2005 COASTAL HABITAT PROTECTION PLAN
Viable 55%
Recovering9%
Concern9%
Overfished27%
striped bass (Albemarle Sound & Atlantic Ocean )spotted seatroutshrimpblack sea bass (north of Cape Hatteras)gag
striped bass (Central/Southern stock)southern flounderblack sea bass (south of Cape Hatteras )
blue crab
red drum
Figure 3.4. Percent of fish stocks showing some preference for shell bottom habitat that were
classified as Overfished, Concern, Recovering, or Viable in the 2003 DMF Stock Status Report.
Unviable stock status could be attributed to a variety of causes ranging from habitat loss, disease, and overfishing, to annual variation in climatic conditions. Compounding this uncertainty is the fact that status of shell bottom-associated species, such as hard clams, sheepshead, and black drum, is currently unknown. More information is needed on the status of hard clams, sheepshead, black drum, and resident non-fishery species (i.e., oyster toadfish) as indicators of shell bottom conditions. Due to the limitations of using fisheries-dependent data (landings data) to indicate stock trends, fisheries independent-data should be collected for these species to develop independent indices. Status and trends of hard clams are currently being evaluated by DMF. The capacity of shell bottom habitat to affect water quality and overall community structure would probably be the best indicator of status and trends in shell bottom habitat. However, before this function could be used as an indicator, research is needed on the critical amount and quality of living and dead shell bottom in a water body below which significant changes in biotic community structure occur. Shell bottom restoration
State efforts to restore oyster habitat and enhance oyster fishery production began around the turn of the century (Marshall et al. 1999). These efforts relied mostly on planting a variety of natural cultch, including oyster, clam, and scallop shells, and, more recently, limestone marl. Experimental oyster cultch plantings began in 1900, and state-sponsored cultch planting began in 1915 (Marshall et al. 1999). Between 1915 and 1934, a total of 1,856,379 bushels of shells and seed oysters were planted in North Carolina’s estuaries. The Oyster Rehabilitation Program officially began in 1947 and resulted in planting 838,088 bushels of shell and 350,734 bushels of seed oysters over its first 10 years. Since 1970, North Carolina has relied almost exclusively on cultch planting as a means of enhancing oyster production (Figure 3.5). From 1958 to 1994, 12,475,000 bushels of shell material were planted, for an annual
Chapter 3 – Shell Bottom 215

2005 COASTAL HABITAT PROTECTION PLAN
average of 337,162 bushels (Marshall et al. 1999). Over the entire period of cultch planting from 1915-1994, about 15 million bushels of oysters were planted in North Carolina waters. This volume of shells would contain the equivalent of 4.5 billion 2-inch oyster shells. Using a minimum 30% area coverage (100 2-inch shells/m2) as defining shell bottom, the volume of shell cultch planted from 1915-1994 could cover as much as 11,120 acres (45,000,000 m2). However, this is an overestimate of actual shell bottom area gained, because the shell plantings consist of piles of variable thickness rather than a single uniform layer. Also, many of the cultch areas are replanted due to flattening by waves and/or commercial harvesting. Despite these planting efforts, the oyster harvest continued to decline (Marshall et al. 1999).
0
100,000
200,000
300,000
400,000
500,000
600,000
700,000
800,000
1947
1950
1953
1956
1959
1962
1965
1968
1971
1974
1977
1980
1983
1986
1989
1992
1995
1998
2001
Bus
hels
Seed OystersCultch material
Figure 3.5. North Carolina oyster rehabilitation activities for 1947 – 1994 (data stacked to show
cumulative total). The peak in 1988 was due to special state disaster funding during the red tide of 1987-88. (Source: Marshall et al. 1999)
Similar to natural shell bottom, restored oyster reefs provide bottom habitat for economically important species (Breitburg 1998; Lenihan et al. 1998; Coen et al. 1999; Harding and Mann 1999; Grabowski et al. 2000; Lenihan et al. 2001; Peterson et al. 2003a). Recent studies have examined the habitat value of constructed oyster reefs compared to natural oyster reefs. The researchers found that landscape characteristics seemed to influence fish species' relative abundance (i.e., connectivity with SAV and/or salt marsh). Fish abundance was significantly greater on restored oyster reefs adjacent to SAV than on mud flat and/or salt marsh restored reefs (Grabowski et al. 2000). Restored intertidal oyster reefs produced significantly more economically valuable oysters ($95.68/10 m2) than estimates of oyster production on subtidal reefs ($11.61/10 m2). The value of legal oysters present on mud flat reefs ($129.38/10 m2) exceeded that for oysters on salt marsh ($50.50/10 m2) or SAV restored reefs ($24.25/10 m2). They estimated that the long-term value of commercial fisheries landings from restored reefs was greater than the oyster harvest for both intertidal and subtidal shell bottoms.
Chapter 3 – Shell Bottom 216

2005 COASTAL HABITAT PROTECTION PLAN
The habitat benefits of cultch plantings may only be limited or temporary if the shell bottom is removed or damaged by towed fishing gears or other harvesting gears (Marshall et al. 1999). Cultch plantings in the southern areas (Onslow, Pender and New Hanover counties) are frequently replanted after harvesting to replenish cultch material for recruitment (Marshall et al. 1999). It generally takes about 3-4 years before oysters on planted sites reach harvestable size in the Pamlico Sound system, while oysters reach the minimum legal size of 3 inches in about two years in the southern coastal area. Faster growth in this area is due to higher rates of water exchange caused by greater tidal flow than in most of Pamlico Sound. The increased flow brings in more food and prevents oxygen depletion problems. The majority of cultch planting sites during 1990-1994 were in Pamlico Sound, lower Neuse River and lower Pamlico River (Marshall et al. 1999). The same general areas were also planted in 2001 and 2002 (Maps 3.4a-b). Most of the recent (2001-2002) oyster restoration effort has been conducted in large bays around Pamlico Sound and in smaller tributaries of other estuaries (Maps 3.4a-b). The majority of these sites are “new” plantings on basically barren sediment (Marshall et al. 1999). Criteria for site selection include suitable sediment types, currents, protection from storm damage, historical productivity, salinity patterns, and existing shellfish concentrations. The presence of bottom disturbing fisheries, such as trawling, hydraulic clamming, and long haul seining, is also considered. Recommended sites for cultch plantings are often narrow bands of mixed sand and mud sediment between shallow, hard, nearshore sediment and soft offshore sediment. In deep water, large oyster mounds are constructed to increase recruitment and reduce effects of low oxygen on the bottom. The planting sites are monitored for oyster recruitment and survival over a period of three years (DMF 2001a). Using vessels currently in operation, cultch can be planted in water as shallow as two feet (Marshall et al. 1999). Since the early 1980s, the DMF has concentrated primarily on cultch plantings and small-scale, high quality seed transplanting activities, also referred to as the “relay program.” In the relay program, oysters are removed from dense oyster populations in prohibited areas and relocated to open harvest areas with depleted resources. The relay program is very small and concentrated in the south, where there is very little effect on the seed source areas (M. Street, DMF, pers. com., 2003). The primary purpose of the DMF cultch-planting program since it began has been oyster fishery enhancement. The DMF enhancement efforts have also been directed at providing stable long-term oyster habitat because research in recent years shows that oyster reefs have important ecological and economic value as coastal fisheries habitat. This broadening of focus for the protection/restoration program has occurred since the late 1990s. As of 2001, there were five constructed/artificial reef sanctuaries in North Carolina located in Bogue Sound, West Bay (Tump Island), Deep Cove (Swan Quarter), Croatan Sound, and behind Hatteras Village (DMF 2001a). Work is currently underway to enhance several existing restoration sites and create additional sites. These areas are no-take, no-disturbance sanctuaries (C. Hardy, DMF, pers. com., 2002). In other states, sanctuaries are a major component of restoration efforts (CBP 2000). Creation of additional “no take” subtidal oyster sanctuaries has been recommended by Frankenberg (1995), the Chesapeake Research Consortium (1999), and Lenihan et al. (1998). There are multiple ecological benefits of constructed and natural oyster sanctuaries, including the following (Breitburg et al. 2000): • Protection of brood stock, • Enhancement of oyster populations in surrounding harvested areas through larval dispersion, • Protection of disease-resistant oysters, improving the genetic pool for disease resistance, and • Protection of associated fisheries and other organisms from predation through development and
maintenance of maximum vertical relief and structural complexity. The first true oyster reef restoration project in North Carolina occurred in 1992-1993 when 13 acres of oyster producing habitat were created as mitigation for the loss of 16 acres of estuarine bottoms and 1.5 acres of wetlands in Roanoke Sound (Marshall et al. 1999). The DMF is monitoring the site as part of a
Chapter 3 – Shell Bottom 217

2005 COASTAL HABITAT PROTECTION PLAN
mitigation agreement with the U.S. Army Corps of Engineers (COE). More recently, the DMF has performed mitigation projects for the North Carolina Department of Transportation, and additional projects creating more than 70 acres of shell bottom are planned with the COE (Marshall et al. 1999). Research is continuing on how to better construct these sites to provide effective oyster habitat. However, in the Pamlico Sound region where spatfall continues to decline (Marshall et al. 1999), more planting and longer protection of sites may be required to achieve the same results as previous restoration efforts. Restoration efforts must use knowledge of larval availability in order to be most effective. In southern waters, the amount of shell habitat is generally stable, but the amount of harvestable area is decreasing as closures increase because of contamination from storm water runoff (R. Carpenter, DMF, pers. com., 2002). Restoration of shell bottom is also undertaken by non-profit groups. One such project has been initiated in Pamlico Sound by The Nature Conservancy, in cooperation with NOAA’s Community-Based Restoration Program and several partners. The goal of the Project is to enhance the biological diversity of Pamlico Sound by establishing a self-sustaining complex of living oyster reefs throughout the estuary. The Conservancy has enlisted the cooperation of marine scientists to ensure the most up-to-date techniques for siting, construction, and management are used. Some criteria for site selection include depth, salinity, shellfishing-prohibited status, disease-resistant salinities, reef footprints, presence of larvae, and proximity to SAV, salt marsh, fish nursery areas, or Military Protected Areas. States and territories containing anadromous, estuarine, and marine species are eligible to compete for Community-Based Restoration grants typically ranging from $25,000 to $75,000.34 As the number of oyster restoration projects grows, the need for an overall strategy for shell bottom restoration also increases. Any expansions of the current restoration/enhancement effort will require additional sources and funding for oyster cultch or limestone marl. Funding for the acquisition of cultch material was drastically cut in DMF’s 1990 budget. As a result, the DMF currently has more planting capability than available cultch material. Funding for acquisition of cultch material must be increased to more efficiently use the existing planting capabilities of DMF. The DMF began a voluntary shell-recycling program in 2004 using local coordinators to collect discarded shells from individuals and businesses. The shells are later transferred to stockpile facilities before being planted in new or expanding oyster sanctuaries. The amount of cultch volunteered could somewhat offset the amount of funding needed for additional cultch material. However, the amount of cultch volunteered is probably secondary to the public awareness gained from a shell-recycling program. 3.4. THREATS AND MANAGEMENT NEEDS Although shell bottom consists of both living and non-living shell material, annual recruitment of live shellfish is needed to sustain the supply of shell material and three-dimensional structure of oyster reefs. Therefore, any activities that directly remove or destroy live shellfish, or indirectly prevent or slow growth and survival, are threats to shell bottom habitat. Mollusks that contribute shell material include oysters, hard clams, bay scallops, as well as many non-fishery species. Since oysters are the dominant contributor to shell bottom, the threats discussed below focus primarily on oyster reefs. Physical threats
Mobile bottom disturbing fishing gear
Mechanical fishing gear includes any gear that is towed or run by engine power including dredges, hydraulic clam dredges, clam kicker, bottom trawls, or patent tongs. Over-harvesting and habitat destruction from oyster dredging were the initial causes for the large-scale decline in oyster resources from approximately the late 1800s to the mid-1900s, particularly in the northern portion of North 34 For information on guidelines and requirements for the grants, visit <http://www.conserveonline.org>, or the NOAA Fisheries
Restoration Center at <http://www.nmfs.noaa.gov/habitat/restoration>.
Chapter 3 – Shell Bottom 218
2005 COASTAL HABITAT PROTECTION PLAN
Carolina. Although other factors had contributed to the decline in the oyster fishery, tonging and dredging had the greatest impact on the physical structure of the reefs (Hargis and Haven 1988; Rothschild et al. 1994). One full season of oyster dredge harvesting effort reduced the mean height of restored subtidal oyster reefs by 30% (Lenihan and Peterson 1998; DeAlteris et al. 1999). Because of this high removal rate, DMF has added shell to heavily fished subtidal areas approximately every 3 to 4 years to maintain the fishery (Frankenberg 1995). Oyster dredges reduce the vertical relief of subtidal oyster reefs resulting in several negative habitat impacts (Lenihan and Peterson 1998; Lenihan et al. 1999):
• Scattering of shell and oysters into less suitable substrates. • Destabilization of the reef structure, which increases vulnerability to damage by future storms. • Removal of live and dead oysters and portions of the upper layers of the shell which:
ο Decreases potential number of spawning adults (spawning stock biomass). ο Decreases area available for settlement by oyster larvae. ο Subjects newly settled oysters to lower oxygen and increased sediment due to lower depth in
water column. • Reduction in the small spaces within the oyster reef that function as refuge and foraging areas for
juvenile fish. • Decreased resistance to disease 35.
Between the 1970s-1990s, the negative impact of the oyster dredge on shell habitat was recognized, and areas were designated where all mechanical methods for shellfish harvest were prohibited (Maps 3.5a-c). These mechanical methods include towed dredges, hydraulic dredges, patent tongs, rakes powered by engine, and clam trawling (“kicking” clams with vessel propellers so they are caught in a small trawl). Trawling, dredging, and all mechanical shellfish harvest methods are prohibited in MFC designated Primary Nursery Areas (PNAs), and trawling is prohibited in permanent Secondary Nursery Areas and Shellfish Management Areas [MFC rules 15A NCAC 03N .0104 and .0105, 03J .0103], protecting shell bottom in these shallow water areas. The rules defining nursery areas have been in effect since 1977. Maps 3.5a-c depict the areas where trawling and dredging are not allowed by MFC rules (including PNAs, mechanical harvest prohibited areas, SAV beds). However, trawling over bottom in tributaries of Pamlico Sound, where productive oyster beds once existed, continues, possibly preventing oysters from reestablishing in part of their historic range (Frankenberg 1995). Construction of oyster sanctuaries in locations of historic abundance and restriction of trawling over restored shell bottom are necessary to restore shell bottom in these northern subtidal areas. There are also areas where trawling is prohibited, but oyster dredging is not. Oyster dredging in these areas should also be prohibited. Use of oyster dredges has been severely limited by the MFC in recent years due to habitat impacts. However, the historic subtidal oyster beds have not recovered (Lenihan and Peterson 1998). Degraded water quality, partially due to reduced filtering by oysters after stocks were greatly reduced, and increased disease occurrence from environmental stress are thought to have prevented full recovery (Lenihan and Micheli 2000; Jackson et al. 2001). Approximately 222,224 acres of shellfish bottom in the Neuse, Pamlico, Tar-Pamlico, and Albemarle MUs are open to oyster dredging at least temporarily. Forty-five percent of this area is within the Pamlico Sound MU. Oyster dredging is prohibited in the southern portion of the state’s estuarine waters because the majority of shell bottom resources south of Pamlico Sound are intertidal. Considering the average number of oyster dredge trips reported from 1994 through 2000, there has been approximately 1 trip/year for every 380 acres of the shellfish mapping study area open to dredging. The total amount of damage to shell bottom depends on the effect of each trip and the relative amount of shell 35 see discussion under “Disease”
Chapter 3 – Shell Bottom 219

2005 COASTAL HABITAT PROTECTION PLAN
bottom within the mapping area. One of the recommendations of the North Carolina Oyster Management Plan is the adoption of criteria to designate additional areas where mechanical harvest methods are prohibited (DMF 2001a). The new additions are intended to protect shellfish beds in potential hand harvest areas. Trawling for shrimp, crabs, and finfish, and long haul seining and dredging for crabs have similar types of habitat impacts as oyster dredges, but at reduced levels of disturbance (DMF 2001a). The weight and movement of trawl doors or chain towed across the seafloor can disrupt the structure of the oyster mound, removing the upper layers of shells or scattering oysters (DMF 2001a). Long haul seines dragged through shell bottom can also damage oyster mound structures by entangling, uprooting, and scattering shell. Frankenberg (1995) studied the state of the oyster fishery and concluded that, because of its intensity, trawling had a significant negative impact on live shell bottom habitat. Illegal trawling in prohibited areas can also be a problem, and the penalties for getting caught are minimal. Stronger penalties are needed for trawling over oyster rocks, where prohibited by the MFC. There are approximately 16,000 trips annually with these gears, primarily (>70%) shrimp trawling (DMF, unpub. data). About 75% of the trips occur in estuarine waters, and the rest are mainly within the Territorial Sea. Virtually all shrimp and crab trawling occurs on sand/mud bottoms. Shell bottom is protected from bottom trawling in trawl net prohibited areas [MFC rule 15A NCAC 3J .0104]. Furthermore, it is illegal to use trawls on shell bottom designated as Shellfish/Seed Management Areas [MFC rule 15A NCAC 03K .0103(b)]. These areas are designated by proclamation and must be marked with signs or buoys. The DMF lacks the resources to mark, maintain, and enforce restrictions on all shell bottoms. Additional marking of productive shell bottom would provide increased protection of this habitat from destructive fishing gears. However, additional law enforcement resources are necessary to mark and enforce increased closed areas. Hand harvest
The harvest of clams or oysters by tonging or raking on intertidal oyster beds causes damage to not only living oysters but also the cohesive shell structure of the reef (Lenihan and Peterson 1998). This destruction has been an issue where oysters and hard clams co-exist, primarily around the inlets in the northern part of the state and on intertidal oyster beds in the south (DMF 2001a). Studies by Noble (1996) and Lenihan and Micheli (2000) quantified the effects of oyster and clam harvest on oyster rocks. The former study found that the density of live adult oysters was significantly reduced where clam harvesting occurred. Mortality was attributed to oysters being cracked or punctured and subsequently dying or being eaten by predators, or by being smothered beneath sediments associated with clam digging. Conversely, oyster harvesting had little effect on clam populations. DMF conducted field investigations of the status of oyster rocks in Ward Creek, Carteret County, to assess the destruction of oyster rocks by individuals taking clams by legal hand harvest methods (Noble 1996). The 1995 survey determined that the oyster rocks had been impacted and, subsequently, the affected portion of Ward Creek was designated a shellfish management area and was temporarily closed to clamming from December 1995 to March 1996. Oysters could only be harvested by hand in the Ward Creek shellfish management area during the 1995–1996 oyster season. Based on visual inspection and field sampling in 1996, the structural integrity and oyster abundance on six of the eight oyster rocks surveyed were good and, in most cases, had improved following the implementation of the shellfish management area restrictions. Because the restrictions were successful in curbing the destruction and deterioration of Ward Creek oyster rocks, it was recommended that the shellfish management area designation be continued to protect oyster rock habitat in Ward Creek. The investigators concluded that, by preventing the destruction of oyster rocks, optimum substrate for oyster-spat settlement and critical habitat for other estuarine species would be preserved. The MFC has recognized that clamming can have a negative impact on oyster habitat and has adopted rules that prohibit the harvest of clams on posted oyster beds and restrict the areas and gear that can be
Chapter 3 – Shell Bottom 220

2005 COASTAL HABITAT PROTECTION PLAN
used to take clams and oysters (DMF 2001b). The posting of all natural oyster beds has never been attempted, because of the large number of areas that would have to be posted and the lack of sufficient resources and enforcement to keep them marked. The DMF has designated some areas as Shellfish Management Areas where enhancement activities are conducted (shell is added and/or oysters are transplanted) and clamming is restricted or prohibited. Existing Shellfish Management Areas, about 752 acres of shell bottom, are shown in Map 3.4a-b. Creation of additional Shellfish Management Areas would reduce habitat damage and enhance spatfall of oysters and clams in areas where hand-harvesting activity is intense. More enforcement would also be needed to enforce the restrictions associated with Shellfish Management Areas. Water-dependent development
Water-dependent development includes any permanent, man-made structures that are designed for access to the water (Kelty and Bliven 2003). These include marinas, docks, piers, and bulkheads. Although the construction of water-dependent structures may actually increase substrate for oysters, activities associated with water-dependent development can harm shell bottom. Dredging of channels for navigational purposes can remove, damage, or degrade existing shell bottom. Dredging creates turbidity that can clog oyster gills or cover the oysters completely. Even low levels of siltation affect growth of oyster beds by reducing larval attachment. Although there are no major new channels being constructed at this time in North Carolina’s estuarine waters, maintenance dredging, construction of new marinas and docking facilities, and new dredging for deep water access continue to be potential problems. Primary Nursery Areas are currently protected from dredging projects for deep-water access. However, there are other areas with shallow oyster beds that are not protected from such dredging. Oyster beds in closed shellfishing waters are particularly vulnerable to loss and degradation from marina dredging. These areas should be evaluated for protection as Strategic Habitat Areas. Turbidity and siltation over shell bottom can also occur from increased boating activity near the marina or dock. Boats running in shallow water cause resuspension of fine sediments, which is similar to the effect of dredging on nearby oyster beds. However, the impact of both dredging and boating activity on oysters has been difficult to quantify (Kelty and Bliven 2003). Current (January 2003) CRC marina siting rules discourage significant degradation of existing shellfish resources [CRC rule 15A NCAC 07H .0208]. Marina siting data collected by DCM during 1994-1995 indicate that 44% of the 182 coastal marinas adjacent to mapped bottom areas were located within 100 m (328 ft) of shell bottom (DCM, unpub. data), indicating the potential for shell bottom to be affected by marina-related activities. Marinas can also negatively impact shell bottom through water quality degradation due to increased runoff and erosion from adjacent developed areas and discharges from boats.36 Due to the potential for physical and water quality impacts, a variety of rules apply to development of new marinas. The DCM is responsible for permitting marinas under the CAMA. The CAMA permitting process requires coordination with DEH, DMF, DWQ, and other state and federal agencies. If the marina is located in waters that would be classified as shellfishing waters (SA) by the EMC, then a review of the status of the waters is required. If the waters are currently classified as open to shellfishing, then DWQ would recommend denying the permit to protect the designated use of those waters. However, if the waters are closed to shellfishing or not classified as SA, then the marina may be allowed. This policy can unintentionally result in degraded areas being targeted for additional development and further degradation, rather than restoration. A variety of working groups have recommended the development of a coastal marina policy that encompasses all associated regulatory activities conducted within the DENR (NC Coastal Futures Committee 1994, Waite et al. 1994). Development of this policy continues to be a management need. 36 Water quality impacts are discussed under “Water quality degradation.”
Chapter 3 – Shell Bottom 221
2005 COASTAL HABITAT PROTECTION PLAN
Scouring of the bottom by frequent boat traffic associated with dock concentrations can have an effect similar to dredging. Unlike marinas, individual docks and piers can be built in open shellfish waters. Dock proliferation in coastal waters is a growing concern for resource managers. Concerns raised at a NOAA workshop regarding environmental impacts of boating associated with small docks and piers included erosion of marsh edge and tidal flats, and resuspension of sediment and resulting turbidity (Kelty and Bliven 2003). The workshop participants agreed that boating traffic associated with docks is far from a benign influence on aquatic and marine environments. Evaluation of the impact of dock-associated boating on shell bottom habitat is therefore a research need. Prohibiting construction of docks or replacement of severely damaged docks (>50%) in documented shellfish beds may be required to minimize degradation and loss of habitat. Water quality degradation
Sediment
In addition to direct physical damage to the shell mound structure, bottom disturbing fishing gear, including hydraulic clam dredges, clam trawls (kickers), and shrimp and crab trawls can impact oyster reefs indirectly by re-suspending sediment. As sediment disperses away from the disturbance and settles to the bottom, it can bury oyster larvae, adults, or shell, deterring successful recruitment of larvae due to lack of an exposed hard substrate (Coen et al. 1999). Excessive sedimentation can also harm shellfish by clogging gills, increasing survival time of pathogenic bacteria, or increasing ingestion of non-food particles (SAFMC 1998a). Oyster eggs and larvae are most sensitive to suspended sediment loading (Davis and Hidu 1969a). Sediment was listed by DWQ as a problem parameter for 964 miles of North Carolina waterways in 125 water bodies, including 25 water bodies in the Cape Fear River basin, 18 in the Neuse River basin, and 11 in the Tar-Pamlico River basin in 1998-1999 (DWQ 2000a). All of these river basins contain shell bottom habitat. There are many other sources of human-induced turbidity and sediment pollution. Any activity that involves clearing of vegetation, grading, and ditching of land can potentially increase erosion and sediment loading in stormwater runoff. These activities include, but are not limited to, construction of residential, commercial, or transportation structures; forestry harvesting; and agricultural activities. Increased sedimentation in headwaters from upland development has caused environmental stress and possibly some mortality to upstream oyster stocks (Ulanowicz and Tuttle 1992; Mallin et al. 1998). There is anecdotal evidence that sedimentation from upstream development (primarily road construction) has silted over numerous oyster beds in trunk estuaries such as the Newport River, where Cross Rock (a large oyster rock) has been buried under 1-2 feet of soft sediment (P. Pate, DMF, pers. com., 2004; C. Peterson, UNC-CH, pers. com., 2004). Improved voluntary and regulatory land use strategies must be implemented to reduce nonpoint source pollution in coastal waters and subsequent habitat degradation. Mitigation should be required from upstream development projects that result in habitat loss downstream. Shoreline erosion increases the amount of sediment transported into the estuarine system. While bulkheads can retain some upland sediment, such structures can increase erosion at the base of and downstream from the hardened structures, causing chronic increased turbidity in those areas.37
Sediment in excessive amounts is also a problem because it transports fecal coliform in stormwater farther downstream and allows the bacteria to persist longer in the water column than such bacteria would live in clear waters (Schueler 1999). While fecal coliform bacteria do not affect the viability of oysters, pathogenic bacteria can make oysters unfit for human consumption. Sediment was the largest cause of water quality degradation in the Albemarle-Pamlico estuarine area (DEM 1989).
37 The Water Column chapter contains a more thorough discussion of sedimentation and turbidity.
Chapter 3 – Shell Bottom 222

2005 COASTAL HABITAT PROTECTION PLAN
Nutrients
Increased nutrient loading can indirectly damage live shell bottom by increasing the occurrence of plankton blooms and low oxygen events. Research indicates that the magnitude and frequency of eutrophication in coastal waters has increased (Paerl et al. 1995; NRC 2000). Increasing eutrophication, in turn, has caused the frequency, duration, and spatial scale of low or no oxygen events (hypoxia and anoxia, respectively) to intensify over time in many estuaries (Lenihan and Peterson 1998). Prolonged periods of low oxygen conditions in the water column can cause mass mortality of fishery-disturbed oyster beds or the non-mobile organisms attached to them. Dissolved oxygen concentrations less than 2 mg/l are fatal to sessile biota and stressful to most motile finfish and shellfish species (Sparks et al. 1958; Funderburk et al. 1991; Paerl et al. 2001). Low dissolved oxygen can occur naturally when the water column becomes stratified (not wind mixed) and biological processes deplete oxygen. In the Neuse River estuary in 1993, Lenihan and Peterson (1998) found that protracted hypoxia/anoxia caused mass mortality of oysters, other invertebrates, and fishes on a low profile oyster reef at all water depths greater than 5 m. Occupancy of crab burrows on an oyster reef decreased from 100% at all depths prior to hypoxia to 0% at 6 m from the water’s surface, 75% at 4 m, and 80% at 3 m immediately after a hypoxic event. Mobile invertebrates such as mud crabs (Panopeus herbstii) avoided oxygen depletion by moving upward on the reef where possible. As the frequency of hypoxic events increases, food availability for species that forage on oyster reefs, such as red drum, weakfish, summer flounder, spot, Atlantic croaker, striped bass, and black sea bass, will decrease, particularly in deeper habitats and where oyster reef height has been reduced by fishing efforts. Data have shown that eutrophication, as indicated by nutrient concentrations and high chlorophyll a concentrations, is a concern in North Carolina coastal waters. According to the DWQ 305(b) report (DWQ 2000a), there are approximately 35,410 acres of waters impaired by excessive chlorophyll a levels. In an EPA sponsored four-year study in North Carolina, low dissolved oxygen (DO) (potentially related to eutrophication) and low infaunal communities within shellfish waters were most frequently reported in Pamlico River and the lower portion of Neuse River (Hackney et al. 1998). One site in Alligator Bay and another at the mouth of Cape Fear River also had moderate contamination and low DO. There are multiple sources and activities that contribute to excessive nutrient loading of surface waters, including fertilizer use, discharge of animal and human waste, filling of wetlands, loss of riparian buffers, increased stormwater runoff from developed areas, ditching and channelization, and atmospheric nitrogen deposition from animal operations, internal combustion engines, and industrial burning (Cooper and Brush 1991; Paerl et al. 1995). Catastrophic weather events, such as hurricanes, can also greatly increase delivery of nutrients to coastal waters. The Neuse and Tar rivers carried the equivalent of over half their normal nitrogen and phosphorus loads during one month of flooding following Hurricane Floyd during September–October 1999 (Bales et al. 2000). High volumes of floodwater discharge following the hurricanes and other tropical storms in North Carolina in the 1990s resulted in large-scale events of hypoxia in estuarine waters. In the estuaries of the Cape Fear River, hypoxia (0–2 mg/L) persisted for several weeks following Hurricane Fran and Bertha in 1996 (Mallin et al. 1999b). Similarly, bottom water hypoxia, followed by increased algal blooms and fish disease, occurred in Pamlico Sound following Hurricanes Dennis, Floyd, and Irene in 1999 (Paerl et al. 2001). Salinity and light penetration also decreased temporarily in both areas. These effects often occur naturally following hurricanes because of the large quantities of swamp water flooding and heavy precipitation. However, environmental damage was considerably increased due to failure of municipal and private waste treatment systems and subsequent sewage diversions into rivers, as well as breaching, overtopping, or flooding of swine waste lagoons by river water, allowing large quantities of swine waste to enter coastal waters (Mallin et al. 1999b). Nitrogen, phosphorus and sediment loading from waste treatment facilities, animal operations and other sources must be reduced upstream of shell bottom habitat to minimize mortality to
Chapter 3 – Shell Bottom 223

2005 COASTAL HABITAT PROTECTION PLAN
shellfish and associated organisms. Construction of high profile oyster reefs in deeper waters is needed to serve as refuge areas during low oxygen events. Several initiatives have already been taken to reduce nutrient levels in some areas of the coast. The EMC has designated several coastal river basins as Nutrient Sensitive Waters, requiring removal of wastewater discharges and other management actions to reduce nutrient inputs (Maps 2.2a-b). The EMC initiated a 50-ft streamside buffer and mandated a 30% reduction in nitrogen loading in the Neuse and Tar-Pamlico river basins. Several mitigation and restoration projects have been constructed in these river basins, as well. A 12.4 acre tidal wetland was constructed at a large row crop farm in 1999 adjacent to the South River. This stream drains to the lower Neuse River in the vicinity of past algal blooms, anoxia and hypoxia events, and fish kills. Results from 2000 and 2001 indicate that the wetland area effectively reduced nitrogen in runoff by approximately 30% (Poe et al. 2002). Efforts in wetland restoration, shoreline conservation (vegetative buffers, setbacks), and stormwater management should be a priority in watersheds draining to shell bottom habitat, particularly where oxygen and nutrient problems have been documented. Nutrient loading from point sources must also be reduced through increased inspections and maintenance of sewage treatment facilities, collection infrastructure, and on-site wastewater systems. In systems with an abundance of “black waters” (or swamp water), such as the lower Cape Fear River, investigations should focus on separating nutrient impacts on DO from impacts due to inflow of low DO swamp waters.38
Toxic chemicals
Toxic chemicals can enter estuarine waters and accumulate in the sediment or in filter-feeding shellfish at concentrations that are reported to cause biological effects to oysters and other organisms. Under some conditions, such as spills, toxic chemicals may occur in acutely toxic concentrations. Heavy metals, petroleum products, chlorinated hydrocarbons, polycyclic aromatic hydrocarbons (PAHs), and pesticides (organophosphates) can enter estuarine waters from stormwater runoff in developed areas (Dauer et al. 2000; Williamson and Morrisey 2000). Heavy metals and PAHs may be of particular concern with regard to oyster resources due to bioaccumulation and human health concerns (Sanger and Holland 2002). Oyster embryos and larvae are more sensitive to toxic chemical effects than adults and juveniles, which are generally more tolerant of contaminants than other estuarine species (Funderburk et al. 1991). Oyster larvae are very sensitive to mercury and silver, and moderately sensitive to copper and zinc. Oyster larvae are relatively insensitive to other heavy metals and most of the pesticides tested (Funderburk et al. 1991). The substances having the most chronic effect on oysters include tributyltin, a few heavy metals, and petroleum hydrocarbons. For acute toxicity and sublethal effects on juvenile oysters, chlorinated pesticides and PCB (such as Arochlor 1016) are thought to be most damaging. Acute toxicity and chronic or sublethal effects of certain toxic chemicals to oysters and clams, as well as the current North Carolina saltwater surface water quality standards [EMC rule 15A NCAC 02B .0200], are listed in Table 3.3. In most cases, existing surface water quality standards are sufficiently stringent to protect these species. There are a couple of pesticides listed in the table for which there is no standard. However, EMC rule 15A NCAC 02B .0208 allows for the calculation of criteria to prevent chronic toxicity due to any toxicant not listed in the rules. 38 See the Water Column chapter for more information on water quality degradation affecting shell bottom.
Chapter 3 – Shell Bottom 224

2005 COASTAL HABITAT PROTECTION PLAN
Table 3.3. Comparison of acute toxicity and chronic or sublethal toxicity (µg/l) for oyster and clams with North Carolina’s saltwater surface water quality standards of the North Carolina.
1 Geometric means of literature values from Funderburk et al. (1991). 2 No numeric standard in rules at this time (2002), but currently use “no toxics in toxic amounts” Environmental Management
Commission rule 15A NCAC 2B .0208 to control for substances not listed in the rules.
Acute Chronic Acute Chronic (ug/L)Aldrin (insecticide) 15 0.1 - 202.5 0.003Arsenic (metaloid) 7500 - - - 10Atrazine (herbicide) >30,000 >10,000 - - 2
Cadmium (heavy metal) 2579/39 39 - - 5Chlordane (insecticide) 8 6 - - 0.004Chromium VI (heavy metal) 10,300 - - - 50 (as total)Copper (heavy metal) 38 50 22 25 3Dieldrin (insecticide) 67 13 - - 0.0002Lead (heavy metal) 2450 - 780 - 25Mercury (heavy metal) 8 12 20 14 0.025PCB (polychlorinatedbiphenyl) 10 13.9 - - 0.000079Permethrin (insecticide) >1,000 - - - 2
Toxaphene (insecticide) 23 40 <250 1,120 0.00020.002(as trialkyltin includes tributyltin)
Zinc (heavy metal) 263 200 190 - 86
N.C. surface saltwater standardsEastern oyster (µg/l)1 Hard clam (µg/l)1
Contaminant
0.08Tributyltin (antifoulant) 1.5 0.7 0.05
Several studies have documented the effects of toxins associated with marinas on the estuarine environment (Wendt et al. 1990; Steel 1991; Sanger and Holland 2002). Heavy metals and PAHs can cause acute toxicity (mortality) and sublethal stress on oysters (all life stages) and other benthos and fish prey organisms. These toxic chemicals can inhibit reproductive development, release of gametes, fertilization, larval development, and growth of juvenile oysters. The primary biological effect on oysters from marinas examined in South Carolina was a significant reduction in the density of recruited oyster spat at the marina sites compared to control sites (Wendt et al. 1990). No effect was observed on reproduction (reproductive cycle and gonadal index) or the condition of adult oysters. Three PAHs were detected in marina sediments at concentrations known to be carcinogenic. During the summer months, with increased activity at the marina, several PAHs were detected in oyster tissue at greater levels than occurred at control sites. Copper concentrations in oysters were considerably higher at the marina than at control sites. Other data from South Carolina showed that concentrations of copper and zinc in oysters were elevated above statewide averages around a large shipyard and boat repair complex (SC DHEC 1987). Leaching of wood preservatives from dock and bulkhead structures may also contaminate live oysters. Chromated copper arsenate (CCA), the most common wood preservative in the United States, consists of copper, chromium, and arsenic. This wood preservative has been shown to leach those heavy metals into adjacent sediments and impact marine benthos (Weis and Weis 1994; Weis et al. 1998). The toxicity of copper, chromium, and arsenic to aquatic organisms is well known (Weis et al. 1998) and all three metals are listed as priority pollutants by the EPA (Hingston et al. 2001). Copper appears to have the most toxic
Chapter 3 – Shell Bottom 225

2005 COASTAL HABITAT PROTECTION PLAN
effect on marine organisms and also consistently appears to leach the greatest amount (Weis and Weis 1994). Weis et al. (1995) found that oysters living on CCA-treated wood in a residential canal had fifteen times more copper (∼ 200 µg/g wet weight) and 2-3 times more arsenic than reference oysters, and significantly more digestive system malfunctions. Copper is known to cause this pathology (Weis et al. 1995). Sediment contaminated with CCA has caused toxicity and some mortality to oysters, amphipods, polychaetes, fiddler crabs, mud snails, fish embryos, and sea urchin (Weis et al. 1998). Elevated concentrations of metals and reduced abundance and diversity of the benthic community were found to extend approximately 10 meters from CCA treated bulkheads and one meter from docks, decreasing with distance from the structure (Weis and Weis 1994; Weis et al. 1998). Sediment contamination was higher in a residential bulkheaded canal than adjacent to bulkheaded open water. The extent of sediment contamination from CCA could be significant considering the magnitude of preserved timber used in the marine environment for bulkheads, docks, and marinas (Weis and Weis 1994). A pilot study conducted by DMF along approximately seven miles of estuarine shoreline in the southern portion of the coast (Pages Creek and Intracoastal Waterway) found that approximately 21% of the shoreline within the study area was hardened in 1984. By 2000, 37% of the shoreline in the same area was hardened. Because a small proportion (<5% in 1984 and 2000) of structure identified in the pilot study as hardened included non-wooden structures (e.g., boat ramps and rip-rap), the reported percentages may slightly overestimate the total extent of the shoreline exposed to CCA. Nevertheless, the most affected area of shoreline was along the waterway, where boat wakes and greater fetch increase erosion problems. In this area, 54% of the project area was hardened. However, even along a protected creek with a wide marsh fringe and little obvious erosion problems, 38% of the shoreline has been hardened. Along Yeopim Creek, a tributary of Albemarle Sound, approximately 1% of the shoreline was hardened in 2000. This methodology for assessing shoreline hardening could be used for a larger portion of the coast to spatially delineate and quantify where and how much of the shoreline is hardened. Toxicity of wood decreases with time, about 50% each day after immersion, with most leaching occurring in the first five to six days (Sanger and Holland 2002), and 99% of the leaching completed in three months. However, dock pilings and bulkheads are replaced periodically, providing a continual source of newly treated wood in coastal waters. The EPA is requiring new labeling on all CCA products specifying that no use of CCA will be allowed after December 2003. In February 2002, the wood-treating industries made a voluntary decision to transition away from use of arsenic treated wood (CCA) by the end of 2003. However, according to the CCA Compliance Strategy developed by the Office of Enforcement and Compliance Assurance (OECA) (http://www.epa.gov/pesticides/factsheets/chemicals/cca_strategy5.pdf , June 2004), the CCA prohibition excludes “wood for marine construction” (i.e., subject to immersion or exposed to salt water or brackish water), and pertains only to wood “intended for most [but not all] residential settings” (<http://www.epa.gov/pesticides/factsheets/chemicals/cca_qa.htm>, August 2004). Moreover, “existing stocks of [CCA-treated] wood may be sold by retailers until such stocks are exhausted, and consumers may continue to buy and use the wood for as long as it is available” (<http://www.epa.gov/pesticides/factsheets/chemicals/cca_guidance_q_a.htm>, August 2004). Furthermore, alternative wood preservatives containing copper or other chemicals may have similar toxicity to marine organisms. Any new wood preservative products should be evaluated for impacts to marine benthos, including oysters39. Fecal coliform bacteria
Elevated levels of fecal coliform bacteria in shellfish and adjacent waters do not kill oysters or clams. Such levels indicate contamination of waters, shellfish, and sediments from warm-blooded animal waste. Because of the sources and pathways of fecal coliform, high bacteria levels are an indication that other 39 See Water Column chapter for management needs concerning toxic contaminants affecting shell bottom.
Chapter 3 – Shell Bottom 226
2005 COASTAL HABITAT PROTECTION PLAN
water quality problems may also exist that could impact growth, survival, reproduction, or recruitment of fisheries resources and potentially impact human health through harvest and consumption of contaminated shellfish. Water quality monitoring in several tidal creeks in New Hanover County found a positive correlation between fecal coliform abundance and turbidity, nitrates, and orthophosphates (Mallin et al. 2000b; 2001b). There was also a correlation between levels of fecal coliform and levels of other pollutants such as toxins and sediment. Similar spatial patterns of increased fecal coliform as well as increased nitrates, chlorophyll a, and, to some extent, turbidity, were observed at upstream locations in the same study. Highest concentrations at upstream areas were attributed to proximity to development sources and reduced flushing and dilution compared to higher salinity waters near the ICW (Mallin et al. 1998). The majority of fecal coliform contamination has been attributed to nonpoint stormwater runoff (DEM 1994; Frankenberg 1995; Schueler 1999; Reilly and Kirby-Smith 1999; DMF 2001a). The relative importance of other nonpoint sources of fecal coliform pollution has also been investigated. For example, Mallin and Wheeler (2000) found that runoff from golf courses was not a significant source of fecal coliform bacteria to tidal creeks in southeastern North Carolina, although they did contribute to elevated nutrient levels in the water.40
Disease
When oysters suffer physiological stress induced by extreme environmental conditions, such as low dissolved oxygen or poor water quality, they become more susceptible to parasitism and disease, such as Dermo and MSX (Lenihan et al. 1999). The parasites Perkinus marinus (Dermo) and Haplosporidium nelsoni (MSX) have caused significant oyster mortality (Andrews 1988; Hargis and Haven 1988; Kennedy 1996; Lenihan et al. 1999). Disproportionate infection of larger, more fecund (egg producing) oysters (Mackin 1951; Ray 1954; Andrews and Hewatt 1957) may at least partially explain the decline in reproduction and subsequent spatfall that has occurred since 1988 (Marshall et al. 1999), prompting major concerns for oysters as a natural and economic resource. Dermo has been responsible for the majority of adult oyster mortalities in North Carolina in recent years. Although reported to occur in this state in the 1950s (Chestnut 1955), disease assessments were not attempted until large-scale oyster mortalities occurred during late 1988. Dermo was found at nine of 11 sampling sites, while MSX was found at the other two. While both MSX and Dermo have been documented, Dermo was the major cause of adult mortalities (DMF 2001a). Oysters typically begin suffering Dermo-related mortality at the age of two years or approximately 2.5 inches in shell height (DMF 2001a). Rates of Dermo infection in oysters generally increase with water temperature and salinity (Paynter and Burreson 1991). The highest rates of infection occur where salinity ranges from 16 – 20 ppt (Lenihan et al. 1999). The MSX dies when salinities are below 10 ppt for at least two weeks. Heavy rainfall from the several hurricanes in North Carolina during 1996-1999 reduced Pamlico Sound salinities, and consequently, the occurrence of MSX in that area (DMF 2001a). Location and severity of Dermo infection have varied over the years, but were as high as 98 – 100% through much of the 1990s. It became evident that oysters in the smaller, saltier southern estuaries had higher survival rates and infection rates similar to those occurring in Pamlico Sound oysters. Conditions in these small, high salinity areas with high tidal flow may inhibit mortality by flushing out parasites at a high rate and/or having salinities too high for the Dermo parasite (DMF 2001a). A possible link among low DO, increased availability of iron, and increased parasite activity supports this concept, because these estuaries rarely experience low DO events (DMF 2001a). Research on experimental oyster reefs in the Neuse River and Pamlico Sound (Lenihan et al. 1999) found that oysters at the base of the reefs, where currents were slowest, food quality lowest, and sedimentation 40 A more in-depth discussion of fecal coliform is provided in the Water Column chapter.
Chapter 3 – Shell Bottom 227

2005 COASTAL HABITAT PROTECTION PLAN
rates highest, had the highest prevalence and intensity of infection with Dermo. In the areas studied, adequate height of the shell bottom structures was necessary for the oysters to grow well and survive disease and pollution. The upper portions of taller structures also allowed a safe refuge for mobile invertebrates and fish when low oxygen events occurred. Maintenance of high-profile oyster rocks is critical for subtidal oysters to perform their ecological functions, as well as provide resources for harvest. Human activities that artificially increase salinity can also indirectly cause additional mortality of oysters from Dermo. Such activities include inlet deepening for navigational channels (SAFMC 1998a) and extensive withdrawal of groundwater and surface water during drought conditions. Cape Fear and Beaufort inlets have been extensively deepened for access to the state ports. Shellfish waters in these areas are the most vulnerable to increases in salinity. The relative contribution of channel deepening to saltwater intrusion and subsequent oyster mortality must be evaluated in order to determine appropriate management action. To protect and restore the oyster resource of the Chesapeake Bay by minimizing the spread of Dermo, a group of scientists from North Carolina, Virginia, and Maryland recommended that a policy be established whereby infected oysters would not be moved into salinities lower than where they set or into areas where disease levels were low, and optimally, infected oysters would not be moved at all (Chesapeake Research Consortium 1999). However, other scientists feel that Dermo is now so widespread that relocation of oysters is not a problem. Some oysters, although exposed to disease, are able to survive. These “disease resistant” individuals are important to the survival and recovery of oyster populations in North Carolina (Breitburg et al. 2000). Harvesting of large oysters or relaying of large oysters from closed to open harvest areas selectively eliminates this disease-resistant genetic pool from the populations. Establishment of oyster sanctuaries seeded with disease-resistant brood stock or allowed to naturally develop disease-resistant oysters would enhance the oyster’s ability to survive and provide disease-resistant broodstock for repopulating highly impacted areas. Introduced and nuisance species
Nuisance and non-native aquatic species are becoming more of a problem throughout the United States. North Carolina shell bottom is at risk from the accidental or intentional introduction of these species. Non-native species enter North Carolina waters through river systems, created waterways such as the ICW, ships discharging ballast water of foreign origin, boats entering North Carolina waters from other areas, and the sale of live fish and shellfish for bait or aquaculture (North Carolina Sea Grant 2000). Oysters have already been impacted by the introduction of the parasites Dermo and MSX. It is suspected that the MSX parasite was introduced with Pacific oysters (Crassostrea gigas) (DMF 2001a). Intentional introductions of non-native species are covered under state laws and rules of several commissions. Proposals to introduce organisms not native to North Carolina into the coastal waters of North Carolina, or organisms native to North Carolina when the individuals in question originate outside North Carolina, are subject to MFC rule 15A NCAC 3I .0104. An applicant must submit a written application to the Fisheries Director with sufficient information for the Director to “determine that the action will not pose a significant danger to any native marine resource or the environment.” The Director can require an applicant to conduct analyses to aid in evaluation of the application, and hold public meetings concerning the proposal. The Fisheries Director determines whether or not to issue the requested permit. Zebra mussels (Dreissena polymorpha) have not been reported in North Carolina, but have been found in northern Virginia and 20 other states (<http://nas.er.usgs.gov/zebra.mussel/>, 2004). Due the rapid rate that this non-native has spread in the United States since first found in 1986, researchers feel that zebra mussels are likely to infest all southeastern states eventually, with negative impacts to the native freshwater and low salinity mollusks (Neves et al. 1997). Zebra mussels frequently clog intake pipes and
Chapter 3 – Shell Bottom 228

2005 COASTAL HABITAT PROTECTION PLAN
smother native mussels and large crustaceans (i.e., crayfish). Most estuarine shell bottom (oyster beds) would not be affected, however, since the upper salinity tolerance limit of zebra mussels is <10 ppt (North Carolina Sea Grant 2000). Although the spread of zebra mussels in Lake Erie has improved water clarity, the effect on most fish populations is still largely unknown (<http://nas.er.usgs.gov/zebra.mussel/ docs/sp_account.html>, January 2004). Planktivorous species and life stages would most likely be affected due to competition with the mussel. North Carolina Sea Grant has pursued multi-state and regional efforts to address the issue of aquatic nuisance species introduction and dispersal, primarily through education on the ecological impacts and methods to prevent or control dispersion (North Carolina Sea Grant 2000). It is estimated that 13 species of freshwater mussel could be extirpated from North Carolina streams and rivers if zebra mussels were to invade (North Carolina Sea Grant 2000). Among those native mussel species, four species could become extinct. As North Carolina's oyster populations have declined, interest in establishing a non-native oyster population has grown. While some oyster introductions have revived or expanded oyster fisheries in some parts of the world (especially in Europe), others have failed or caused problems, such as the destruction of native species by exotic diseases (Andrews 1980; DMF 2001a). If the native oyster stocks cannot recover naturally, establishment of non-native oyster populations could provide complex structure for fish habitat (if the introduced species were reef-builders - some oysters are not), water filtration functions, and preserve a traditional North Carolina fishery. The Pacific oyster (Crassostrea gigas) and Suminoe oyster (Crassostrea ariakensis) have been the leading candidates for non-native introductions. Researchers have conducted overboard tests in North Carolina with Pacific oysters and work is underway with the Suminoe oyster (C. Peterson, UNC-CH, pers. com., 2002). The shells of Pacific oyster were found to be too thin to resist predation by native oyster drills (DeBrosse and Allen 1996). The Suminoe oyster has proven more promising. Laboratory and field studies conducted on C. ariakensis in Chesapeake Bay indicate rapid growth and survival under a wide range of coastal and estuarine conditions (Richards and Ticco 2002). C. ariakensis also shows greater disease resistance than native oysters. There is currently much debate and uncertainty regarding the introduction of non-native oysters (Richards and Ticco 2002). Concerns include long-term survival of introduced species, competition with native oysters, unknown reef-building attributes, cross-fertilization with native species (reducing viability of spat and decreasing reproductive success), and introduction of non-native pests with the introduced oysters (DMF 2001a). Policy makers are being faced with a dilemma of incomplete knowledge of the species’ life history, lack of consensus among scientists regarding the impact of non-native oysters on Atlantic coastal ecosystems, and pressure from commercial and economic interests to revive a once prosperous oyster industry (Richards and Ticco 2002). The DMF Fishery Management Plan for Oysters (DMF 2001a) recommended that testing continue on aquaculture use of non-spawning, non-native oysters before decisions are made opposing or supporting introduction. A comprehensive study of non-native oyster introductions was completed by the National Research Council of the National Academy of Science in 2003 (NRC 2003). The study identified concerns that should be addressed by decision-makers when the introduction of a non-native oyster is under consideration. The concerns included:
• Viability of introduced stocks in Atlantic coast waters • Co-introduction of new pathogens and parasites • Economic and social impacts of a non-native oyster introduction • Adequacy of regulatory and institutional structure for monitoring and overseeing the
interjurisdictional aspects of open water aquaculture The study concluded that C. ariakensis is probably well suited for growth and reproduction in the Chesapeake Bay and similar estuarine habitats on the Atlantic coast. The risk of introducing non-native
Chapter 3 – Shell Bottom 229

2005 COASTAL HABITAT PROTECTION PLAN
pathogens and parasites could be reduced by following International Council for Exploration of the Seas protocols. However, it will not be easy for the oyster industry to adapt to dependence on hatchery production of Asian oysters. Furthermore, the existing regulatory and institutional framework was found inadequate for handling interjurisdictional issues. Based on this evaluation, limited aquaculture of triploid oysters was considered the most defensible management option. Other options included prohibition of non-native oyster introduction and introduction of reproductive diploid oysters. The principal recommendation from NRC (2003) was to establish standards and protocols for non-native oyster aquaculture that minimize and monitor the unintentional release of reproductive C. ariakensis. The recommendations provided in NRC (2003) should be considered in developing a comprehensive oyster restoration plan. Existing management measures
No amount of oyster restoration will erase the effect of continuing pollution of aquatic systems (Boesch et al. 2001). Therefore, both restoration efforts and water quality management actions reducing direct and indirect shell bottom loss and degradation are necessary to enhance coastal fish habitat. Several existing management actions provide some protection or enhancement of shell bottom habitat, including shellfish size and harvest limits, habitat restoration, and closure of areas to harvest or use of certain fishing gears. By EMC rules, all shellfish waters with significant resources are classified as SA waters and are, by definition, High Quality Waters (HQW). In addition, some waters that are classified SA also carry the Outstanding Resource Waters (ORW) classification based on recreational or environmental special uses. These waters are afforded additional protection from construction and runoff under EMC, CRC and Sedimentation Control Commission rules. Maps 2.3a-b show HQW and ORW areas for the CHPP area. The HQW and ORW areas cover 8% and 24% of the shellfish mapping study area, respectively. A total of 142,017 acres out of 362,450 acres of ORW in the CHPP MUs are within the DMF shellfish mapping study area. Of the total bottom area mapped by DMF to date (January 2003), 55% (126,583 acres) is classified ORW. Under MFC rules, oyster reefs are protected from early harvest by size limit and culling tolerance rules [MFC rule 15A NCAC 03K .0202]. By rule, the minimum size at which oysters can be harvested is based on shell lengths not less than 2.5 in. The Fisheries Director has, by proclamation (an administrative order authorized by the MFC), further restricted harvest to oysters of at least 3 inches in length. The intent of the size limit is to allow oysters to spawn before they are removed from the population, as well as to protect sublegals as fecundity increases (C. Hardy, DMF, pers. com., 2002). Oysters reach sexual maturity in their first year and harvestable size in about 3-4 years in Pamlico Sound (Ortega et al. 1990). This size limit provides some protection for young oysters throughout their range in North Carolina and for beds of stunted oysters along the boundary of their range. Stunted oyster beds occur where the salinity range is only marginally suitable for larval survival and growth. Some planted areas can be designated by proclamation of the Fisheries Director as “Shellfish/Seed Management Areas” (SSMAs) [MFC rule 15A NCAC 03K .0103]. These areas include shellfish populations or shellfish enhancement projects that may produce commercial quantities of shellfish or shellfish suitable for transplanting as seed [MFC rule 15A NCAC 03K .0103a]. Use of trawl nets, long haul seines, and swipe nets is prohibited in SSMAs and, unless open to oyster harvest by proclamation, they are closed to all oyster harvest. There are currently 628 acres of SSMA in the Southern Estuaries and New/White Oak MUs that are part of the DMF shellfish mapping study area (Table 3.4). Cultch planting sites in the Pamlico Sound have not been designated as SSMAs because of the difficulties in enforcing the prohibition of shellfish harvesting on these areas (i.e., small numbers of Marine Patrol Officers patrolling large water bodies (M. Marshall, DMF, pers. com., 2002)). In addition to protection from certain fishing gears in Shellfish/Seed Management Areas, shell bottom is also protected from shellfish harvest in military restricted areas. These areas have served as target and bombing ranges since the World War II period. Military restricted areas cover 24,051 acres of the
Chapter 3 – Shell Bottom 230

2005 COASTAL HABITAT PROTECTION PLAN
shellfish mapping study area, and all of these areas have been mapped (Table 3.4). Other area designations protecting shell bottom from specific fishing gear impacts include nursery areas, mechanical oyster harvest prohibited areas, trawl net-prohibited areas, and crab spawning sanctuaries. These areas cover more than half of the shellfish bottom mapping area, leaving the largest unrestricted areas in west and northwest Pamlico Sound, the lower Pamlico and Neuse rivers, and around Roanoke Island (Maps 3.5a-c). A number of cultch planting sites in the Pamlico Sound area are also closed to mechanical harvest by proclamation annually (Map 3.4a), although none have been designated shellfish management areas (DMF 2001a). Given adequate enforcement capabilities, additional cultch enhanced and naturally occurring shell bottom (intertidal and subtidal) should be designated as DMF Shellfish Management Areas to protect them from fishing gear impacts. Table 3.4. Amount of bottom habitat mapped (acres) by the North Carolina Division of Marine
Fisheries Shellfish Habitat and Mapping Program within areas receiving specific North Carolina Marine Fisheries Commission designations that restrict fishing activities (as of January 2003).
Marine Fisheries Commission restrictedfishing area designation
Amount within the shellfish bottom mapping area
Currently mapped area % complete
Crab spawning sanctuaries 17,673 12,831 73% Mechanical clam harvest areas 39,446 29,878 76% Mechanical oyster harvest prohibited 289,617 169,925 59% Military restricted areas 24,051 24,051 100% Permanent Secondary nursery areas 34,825 243 1% Primary nursery areas 46,941 31,045 66% Shellfish/seed management areas (SSMA) 628 489 78% Special secondary nursery areas 30,686 21,889 71% Taking crabs with dredges 43,318 2,044 1% Trawl nets prohibited 138,812 37,959 27%
Another designation that indirectly provides protection from harvesting in North Carolina is the Division of Environmental Health’s (DEH) shellfish harvest closure areas. Based on surveys and bacterial sampling, the DEH may designate waters as closed to shellfish harvesting, on either a full-time basis (permanent closure) or rainfall-dependent basis (conditionally approved). Maps 2.19a-c show the extent of shell bottom within the various DEH shellfish area designations. It should be noted that significant portions of closed shellfish waters are located in areas not suitable for shellfish propagation and maintenance due to low salinity levels or other conditions. There are also some closed areas that have robust oyster populations (C. Peterson, UNC-CH, pers. com., 2003). The value of closed shellfishing waters as oyster sanctuaries should be evaluated.41
3.5. SUMMARY OF SHELL BOTTOM CHAPTER Shell bottom habitat is unique because it is the only coastal fish habitat that is also a fishery species (oysters). The ecological value of shell bottom has only recently been recognized to be as or more significant than the fishery itself, since it provides numerous habitat and water quality functions that are vital for fishery and non-fishery species. The ability of shell bottom to withstand moderate turbidity levels allows oysters to clear the water column, encouraging growth of SAV and benthic microalgae. Oysters, SAV, and benthic microalgae quickly process dissolved and suspended material from the water column, thus facilitating the estuaries’ role in storage and cycling of nutrients. This process reduces the
41 More discussion of trends related to the DEH areas is provided in the Water Column chapter.
Chapter 3 – Shell Bottom 231

2005 COASTAL HABITAT PROTECTION PLAN
likelihood of coastal eutrophication and its detrimental effects on fish and fisheries. Oyster beds also increase shoreline complexity, can alter circulation patterns, and enhance fish use of marsh edge habitat. Shell bottom also provides hard structure for attachment of diverse invertebrate species and protective cover for small mobile finfish and invertebrates. Gobies, blennies, hard clams, mud crabs, blue crabs, anchovies, oyster toadfish, and sheepshead are a few of the typical residents of oyster reefs. Research has shown that abundance and production of numerous fishery and prey species are enhanced more by shell bottom than by the surrounding soft bottom. Some of the important fishery species whose production is enhanced by shell bottom include hard clam, black sea bass, gag, tautog, and southern flounder. Shell bottom is federally designated as a Habitat Area of Particular Concern for estuarine dependent snapper-grouper species. The restoration of living oyster beds is therefore critical to the proper functioning and protection of surrounding coastal fish habitats and numerous fishery species. Shell bottom habitat declined for most of the 20th century. The current distribution of shell bottom has shrunk to a mere fraction of its historical range, when oyster rocks were so abundant that they were considered a hazard to navigation. Anecdotal information suggests that oyster beds have been displaced roughly 10-15 miles (16-24 kilometers) downstream in the Pamlico and Neuse estuaries and completely covered by sediment in other areas. Furthermore, North Carolina’s commercial oyster landings have declined about 90% from 1889 to today’s low harvest. Most shell bottom losses have been subtidal beds in Pamlico Sound, where DMF has also found declines in spatfall. Although mechanical harvesting of oysters has been greatly restricted, reefs have not recovered, possibly due to stress from water quality degradation and increased occurrence of disease (Dermo, MSX). The loss of habitat could be particularly damaging to fishery stocks associated with shell bottom that are classified as Overfished by DMF, such as southern flounder, black sea bass south of Cape Hatteras, or the central/southern stock of striped bass. Oyster dredging, beginning in 1889, is believed to be the major cause of the initial decline in shell bottom. Today the dredge harvest has greatly diminished in North Carolina, although about 42% of shallow estuarine bottom (where oysters could live) is still open to mechanical harvest methods, all in Pamlico Sound. Dredging removes oysters and reduces the vertical profile of oyster rocks, increasing the susceptibility of remaining shell bottom at that location to low dissolved oxygen and possible mortality. Hand harvest methods for oysters and clams can also be destructive, but on a much smaller scale. Other bottom disturbing fishing gears, such as trawls, prevent the establishment of oyster reefs in areas within their historic range. Dredging for navigation channels or marina basins also impacts shell bottom. The downstream displacement of oysters in the Neuse and Pamlico rivers is probably the result of extensive drainage networks designed to increase the flow of stormwater (fresh water) into coastal waterways, decreasing salinity in the downstream portions of those rivers. While drainage for agriculture has changed little, drainage for urban/suburban development is increasing steadily. Runoff from agriculture, urban/suburban development, and transportation infrastructure carries sediment, nutrient, and toxic chemical pollutants. Sediment, the number one pollutant of waterways in the United States, clogs oyster gills and buries shells. Excess nutrients can fuel algal blooms and low dissolved oxygen events, and in turn, cause mortality of benthic organisms on deep, subtidal shell bottom. Heavy metals, petroleum products, pesticides, and other toxic chemicals in the runoff can kill sensitive oyster larvae. To offset the decline in oyster habitat, restoration efforts were begun in 1958, and some protected areas have been established. While almost all work in the past has focused on restoring oysters for harvest, some recent efforts have been designed to restore or enhance shell bottom for habitat purposes. However, the magnitude of losses still greatly exceeds gains from restoration. Large areas of shell bottom habitat are still unprotected from direct physical removal or damage via human-related activities, as well as from indirect damage from water quality degradation. In order to restore shell bottom habitat, the destruction of oyster beds from fishing practices, channel or marina dredging, and pollutant loading must be reduced and oyster habitat restoration must increase significantly.
Chapter 3 – Shell Bottom 232
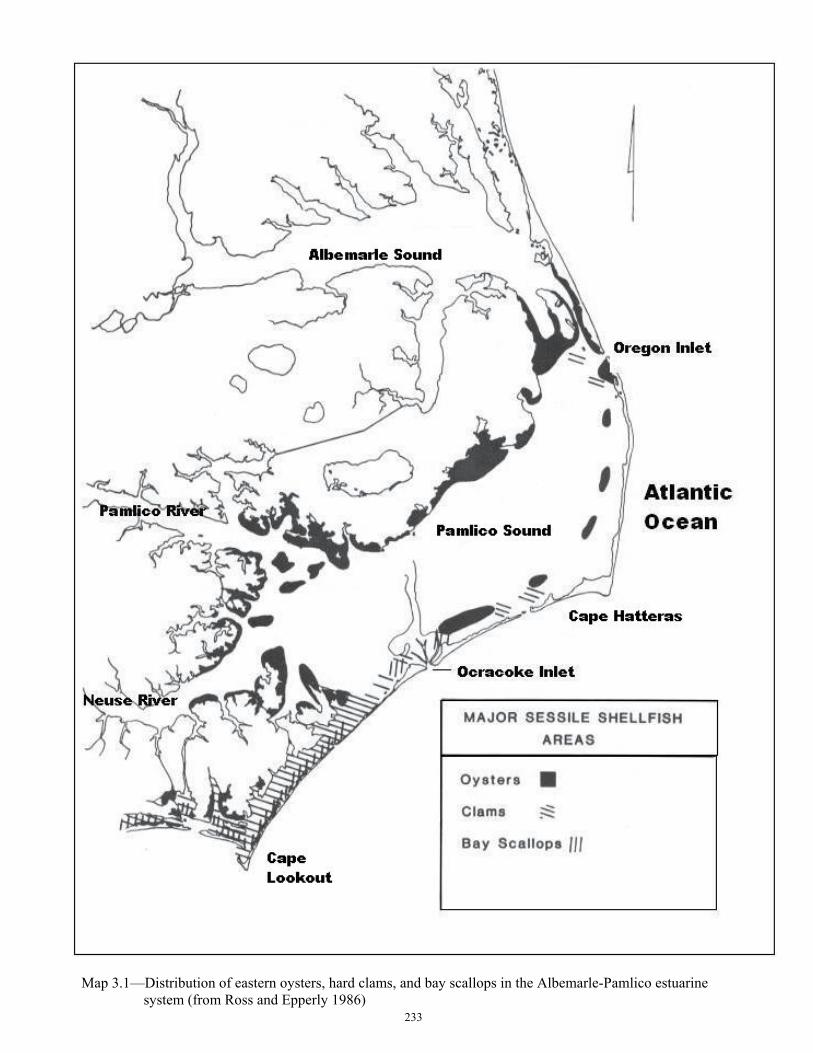
Map 3.1—Distribution of eastern oysters, hard clams, and bay scallops in the Albemarle-Pamlico estuarine system (from Ross and Epperly 1986)
233

This Page was Intentionally Left Blank
234

Albemarle Sound
Pamlico Sound
Atlantic Ocean
Cape Fear
CapeLookout
CapeHatteras
OregonInlet
Pamlico River
Neuse River
NAD83NC State PlaneJanuary 2003
N
EW
S
10 0 10 20 30 Kilometers
10 0 10 20 30 Miles
LEGEND
Hydrography
Shellfish area boundary
Bottom mapped (DMF bottom mappingas of January 2003)
CHPP Management Units
Locator Map
Map 3.2-Areas for which the bottom type has been mapped or will be mapped by the North Carolina Division of Marine Fisheries' Shel
Coastal Habitat Protection Plan
235
Map information were collected from variousfederal, state, and private organizations.Every effort has been made to ensurethe quality and accuracy of this information.
lfish Habitat and Abundance Mapping Program.

This Page was Intentionally Left Blank
236

#
Oriental
#
Beaufort
#
Atlantic Beach
#
Morehead City
CapeLookout
Neuse River
South River
Pamlico Sound
Core Sound
Atlantic Ocean
NorthRiverNewport
River
Loca
tor m
ap
10 0 10 20 30 Miles
10 0 10 20 30 40 Kilometers
NAD83 State Plane
N
EW
S
CHPP Management Unit boundaries
Rivers and Streams
LEGENDEstimated shellfish density on
shell bottom areas(individuals/square meter)
Bottom mapped withinshellfish mapping study area
Shell bottom without shellfish density estimate
0 - 11 - 100100 - 250250 - 450450 - 750
Municipalities
Map 3.3a. Estimated density of shellfish in estuarine waters from Ocracoke Inlet to Atlantic Beach, North Carolina
237
NC
January 2002Map information were collected from variousfederal, state, and private organizations.Every effort has been made to ensurethe quality and accuracy of this information.
Coastal Habitat Protection Plan

This Page was Intentionally Left Blank
238

#
Jacksonville
Bogue SoundNewRiver
White OakRiver
Neuse River
Atlantic Ocean
#
Oriental
#Swansboro
#
Morehead City
BeaufortInlet
BogueInlet
New RiverInlet
TopsailIsland 10 0 10 20 30 40 Kilometers
10 0 10 20 30 Miles
Municipalities
450 - 750250 - 450100 - 2501 - 1000 - 1
Shell bottom without shellfish density estimateBottom mapped withinshellfish mapping study area
Estimated shellfish density on shell bottom areas
(individuals/square meter)
LEGEND
Rivers and StreamsCHPP Management Unit boundaries
NAD83C State Plane
N
EW
S
Loca
tor m
ap
Map 3.3b. Estimated density of shellfish in estuarine waters from Beaufort Inlet to Topsail Island, North Carolina
239
N
Coastal Habitat Protection Plan
Map information were collected from variousfederal, state, and private organizations.Every effort has been made to ensurethe quality and accuracy of this information.
January 2002

This Page was Intentionally Left Blank
240

10 0 10 20 30 Kilom
10 0 10 20 Mi
CapeFear
Cape FearRiver
Carolina Beach
Atlantic Ocean
Carolina Beach Inlet
Wilmington
Wrightsville Beach
Municipalities
450 - 750250 - 450100 - 2501 - 1000 - 1
Shell bottom without shellfish density estimateBottom mapped withinshellfish mapping study area
Estimated shellfish density on shell bottom areas
(individuals/square meter)
LEGEND
Rivers and StreamsCHPP Management Unit boundaries
NAD83NC State Plane
N
EW
S
Loca
tor m
ap
Map 3.3c. Estimated density of shellfish in estuarine waters from Topsail Island, North Carolina to the South Carolina border241
eters
les
Coastal Habitat Protection Plan
Map information were collected from variousfederal, state, and private organizations.Every effort has been made to ensurethe quality and accuracy of this information.
January 2002

This Page was Intentionally Left Blank
242

Map information were collected from variousfederal, state, and private organizations.Every effort has been made to ensurethe quality and accuracy of this information.
#Y
#Y
#Y#Y
#Y#Y#Y
#Y
#Y
#Y
#Y
#Y #Y#Y
#Y
#Y#Y#Y
#Y
#Y#Y
#Y
#Y#Y
$Z$Z$Z$Z$Z$Z
$Z$Z$Z$Z$Z$Z
$Z$Z
$Z$Z$Z$Z
$Z$Z
$Z$Z$Z$Z
$Z$Z
$Z
$Z$Z
$Z$Z
$Z$Z
$Z$Z$Z$Z
$Z$Z$Z$Z
$Z$Z
$Z$Z
wan River
New River
White OakRiver
Pamlico River
Albemarle Sound
CapeLookout
Pamlico Sound
Roanoke River
CapeHatteras
Neuse River
Core So
und
Bogue Sound
Alligator River
Croatan Sound
Atlantic Ocean
OcracokeInlet
OregonInlet
WestBay
NewportRiver
10 0 10 Miles
10 0 10 20 30 Kilometers
loca
tor m
ap
Coastal Habitat Protection PlanN
EW
S
NAD 83NC State PlaneOctober 2002
Cultch planting sites 2001#Y
CHPP management units
Legend
$Z Cultch planting sites 2002
Map 3.4a---Locations where the North Carolina Division of Marine Fisheries planted oyster cultch during 2001 and 2002 in estuarine waters from New River northward
243

This Page was Intentionally Left Blank
244

#Y#Y#Y#Y#Y#Y#Y #Y#Y#Y#Y#Y#Y
#Y#Y
#Y
#Y#Y#Y
#Y#Y
#Y#Y#Y#Y#Y#Y#Y #Y#Y#Y#Y#Y#Y#Y#Y
New River
Cape Fear River
White Oak River
CapeFear
Jacksonville
Wilmington
NAD83January 2002
N
EW
S
10 0 10 Kilometers
10 0 10 Miles
LEGEND
Shell Seed Managment Locations
Hydrography
CHPP ManagementUnits
Locator Map
Map information were collected from variousfederal, state, and private organizations.Every effort has been made to ensurethe quality and accuracy of this information.
Coastal Habitat Protection Plan
#Y
Municipalities
Map 3.4b---Existing North Carolina Division of Marine Fisheries Shell Seed Management areas (also cultch planting sites)245

This Page was Intentionally Left Blank
246

Pamlico RiverPamlico Sound
White Oak River
CapeHatteras
Neuse River
Atlantic Ocean
OcracokeInlet
Loca
tor m
ap
10 0 10 20 Miles
10 0 10 20 30 Kilometers
NAD83NC State PlaneJanuary 2002
N
EW
S
LEGEND
Mechanical oyster methods prohibited
Primary nursery areas;no dredging or trawling
Permanent secondary nursery areas or no trawling areas
CHPP Management Units
Creeks and Rivers
Coastal Habitat Protection Plan
Map information were collected from variousfederal, state, and private organizations.Every effort has been made to ensurethe quality and accuracy of this information.
Map 3.5a---Areas where mechanical oyster harvesting and bottom trawling are prohibited in the Pamlico Sound system, North Carolina247

This Page was Intentionally Left Blank
248

Bogue Sound
NewRiver
Pamlico Sound
White Oak River
BeaufortInlet
Core Sound
Neuse River
CapeLookout
Atlantic Ocean
NewportRiver
NorthRiver
10 0 10 20 30 Kilometers
10 0 10 20 Miles
Permanent secondary nursery areas or no trawling areas
Primary nursery areas;no dredging or trawling
Mechanical oyster methods prohibited
LEGEND
NAD83NC State PlaneJanuary 2002
N
EW
S
Loca
tor m
ap
Creeks and Rivers
Map information were collected from variousfederal, state, and private organizations.Every effort has been made to ensurethe quality and accuracy of this information.
Coastal Habitat Protection Plan
Map 3.5b---Areas where mechanical oyster harvesting and bottom trawling are prohibited in the central coastal area of North Carolina
CHPP Management Units
249

This Page was Intentionally Left Blank
250

Cape Fear RiverCapeFear
AtlanticOcean
10 0 10 20 Kilometers
10 0 10 Miles
Permanent secondary nursery areas or no trawling areas
Primary nursery areas;no dredging or trawling
Mechanical oyster methods prohibited
LEGEND
NAD83NC State PlaneJanuary 2002
N
EW
S
Loca
tor m
ap
Creeks and Rivers
Coastal Habitat Protection Plan
Map information were collected from variousfederal, state, and private organizations.Every effort has been made to ensurethe quality and accuracy of this information.
Map 3.5c---Areas where mechanical oyster harvesting and bottom trawling are prohibited in the southern coastal area of North Carolina
CHPP Management Units
251

This Page was Intentionally Left Blank
252