2005 _ parker county _ poolville isd _ 2005 texas school survey of drug and alcohol use _ elementary...
Upload: texas-school-survey-of-drug-and-alcohol-use-elementary-reports
Post on 14-Apr-2018
215 views
TRANSCRIPT

7/30/2019 2005 _ parker county _ poolville isd _ 2005 texas school survey of drug and alcohol use _ elementary report
http://slidepdf.com/reader/full/2005-parker-county-poolville-isd-2005-texas-school-survey-of-drug-and 1/38

7/30/2019 2005 _ parker county _ poolville isd _ 2005 texas school survey of drug and alcohol use _ elementary report
http://slidepdf.com/reader/full/2005-parker-county-poolville-isd-2005-texas-school-survey-of-drug-and 2/38
PoolvilleSpring 2005
________________________________________________________________________________
Table T-1: How recently, if ever, have you used...
Ever School Not Past NeverUsed Year Year Used
________________________________________________________________________________Any tobacco product All 12.5% 6.0% 6.4% 87.5%________________________________________________________________________________Cigarettes All 10.0% 4.9% 5.1% 90.0%________________________________________________________________________________Smokeless tobacco All 2.6% 1.2% 1.4% 97.4%
________________________________________________________________________________
Table T-2: Average number of times selected tobacco products were used by thosewho reported use of ..
Any tobacco product
School LifetimeYear
All 2.5 3.6
Cigarettes
School LifetimeYear
All 2.8 3.9
Smokeless tobacco
School LifetimeYear
All * *
________________________________________________________________________________
Table T-3: Average age of first use of tobacco:
All
Tobacco *
________________________________________________________________________________
Table T-4: Average age of first use of tobacco by family situation:
Two Parent Family
Never 7/Under 8 9 10 11 12/Over
All 91.2% * % * % 3.8% 1.9% 3.2% * %

7/30/2019 2005 _ parker county _ poolville isd _ 2005 texas school survey of drug and alcohol use _ elementary report
http://slidepdf.com/reader/full/2005-parker-county-poolville-isd-2005-texas-school-survey-of-drug-and 3/38
PoolvilleSpring 2005
________________________________________________________________________________
Other Family Situation
Never 7/Under 8 9 10 11 12/Over
All 82.9% 4.1% * % 4.1% * % 8.9% * %
________________________________________________________________________________
Table T-5: About how many of your close friends use ...
Any tobacco product?
NeverHeard of None Some Most
All * % 62.3% 32.6% 5.1%
Cigarettes?
NeverHeard of None Some Most
All 1.3% 64.8% 31.4% 2.6%
Smokeless tobacco?
NeverHeard of None Some Most
All * % 90.0% 7.5% 2.5%
________________________________________________________________________________
Table T-6: Have you ever been offered ...
Any tobacco product?
NeverHeard of Yes No
All * % 28.8% 71.2%
Cigarettes?
NeverHeard of Yes No
All * % 27.5% 72.5%
Smokeless tobacco?
NeverHeard of Yes No
All * % 9.8% 90.2%

7/30/2019 2005 _ parker county _ poolville isd _ 2005 texas school survey of drug and alcohol use _ elementary report
http://slidepdf.com/reader/full/2005-parker-county-poolville-isd-2005-texas-school-survey-of-drug-and 4/38
PoolvilleSpring 2005
________________________________________________________________________________
Table T-7: How dangerous do you think it is for kids your age to use ...
Any tobacco product?
Never Very Not at All Do NotHeard of Dangerous Dangerous Dangerous Know
All * % 67.8% 28.4% 1.3% 2.5%
Cigarettes?
Never Very Not at All Do NotHeard of Dangerous Dangerous Dangerous Know
All * % 59.7% 36.4% 1.3% 2.6%
Smokeless tobacco?
Never Very Not at All Do NotHeard of Dangerous Dangerous Dangerous Know
All * % 60.5% 34.3% 1.3% 3.8%

7/30/2019 2005 _ parker county _ poolville isd _ 2005 texas school survey of drug and alcohol use _ elementary report
http://slidepdf.com/reader/full/2005-parker-county-poolville-isd-2005-texas-school-survey-of-drug-and 5/38

7/30/2019 2005 _ parker county _ poolville isd _ 2005 texas school survey of drug and alcohol use _ elementary report
http://slidepdf.com/reader/full/2005-parker-county-poolville-isd-2005-texas-school-survey-of-drug-and 6/38
PoolvilleSpring 2005
________________________________________________________________________________
Table A-1: How recently, if ever, have you used..
Ever School Not Past NeverUsed Year Year Used
________________________________________________________________________________Any alcohol product All 38.1% 28.1% 10.1% 61.9%________________________________________________________________________________Beer All 31.1% 20.9% 10.2% 68.9%________________________________________________________________________________Wine coolers All 19.7% 15.7% 4.0% 80.3%________________________________________________________________________________Wine All 15.9% 8.4% 7.5% 84.1%________________________________________________________________________________Liquor All 14.8% 9.8% 5.0% 85.2%
________________________________________________________________________________
Table A-2: Average number of times selected alcohol products were used by those
who reported use of ..
Any alcohol product
School LifetimeYear
All 3.8 4.5
Beer
School LifetimeYear
All * *
Liquor
School LifetimeYear
All * 1.9
Wine
School LifetimeYear
All 1.5 1.5
Wine coolers
School LifetimeYear
All 2.6 3.1

7/30/2019 2005 _ parker county _ poolville isd _ 2005 texas school survey of drug and alcohol use _ elementary report
http://slidepdf.com/reader/full/2005-parker-county-poolville-isd-2005-texas-school-survey-of-drug-and 7/38
PoolvilleSpring 2005
________________________________________________________________________________
Table A-3: In the past year, how many times have you had two or more drinks at
one time of ..
Beer?
Never 1 Time 2 Times 3+ Times Ever
All 77.5% 13.3% 4.2% 5.1% 22.5%
Wine Coolers?
Never 1 Time 2 Times 3+ Times Ever
All 82.4% 8.1% 5.6% 3.9% 17.6%
Wine?
Never 1 Time 2 Times 3+ Times Ever
All 88.2% 8.9% 2.9% * % 11.8%
Liquor?
Never 1 Time 2 Times 3+ Times Ever
All 85.2% 9.4% 2.7% 2.7% 14.8%
________________________________________________________________________________
Table A-4: Average age of first use of alcohol:
All
Alcohol 9.3Beer 9.0
Wine Coolers 10.1Wine 10.3Liquor 10.4
________________________________________________________________________________
Table A-5: Average age of first use of alcohol by family situation:
Two Parent Family
Never 7/Under 8 9 10 11 12/Over
All 67.1% 3.2% 3.5% 7.4% 9.1% 6.6% 3.2%
Other Family Situation
Never 7/Under 8 9 10 11 12/Over
All 55.3% 17.1% 14.5% * % * % 8.9% 4.1%

7/30/2019 2005 _ parker county _ poolville isd _ 2005 texas school survey of drug and alcohol use _ elementary report
http://slidepdf.com/reader/full/2005-parker-county-poolville-isd-2005-texas-school-survey-of-drug-and 8/38
PoolvilleSpring 2005
________________________________________________________________________________
Table A-6 : Lifetime prevalence of use of alcohol by reported conduct problems
this school year:
No Absences or Cut Sent toConduct Problems School Principal Both
Alcohol 26.9% * % 53.9% * %
________________________________________________________________________________
Table A-7: When you drink alcohol, do you get it from ..
Home?
Don'tDrink Yes No
All 64.0% 24.2% 11.7%
Friends?
Don'tDrink Yes No
All 66.7% 3.7% 29.6%
Somewhere else?
Don'tDrink Yes No
All 68.4% 5.5% 26.2%
________________________________________________________________________________
Table A-8: About how many of your close friends use ..
Any alcohol product?
NeverHeard of None Some Most
All * % 59.8% 30.4% 9.8%
Beer?
NeverHeard of None Some Most
All * % 68.4% 25.3% 6.3%
Wine coolers?
NeverHeard of None Some Most
All 12.3% 62.3% 20.3% 5.1%

7/30/2019 2005 _ parker county _ poolville isd _ 2005 texas school survey of drug and alcohol use _ elementary report
http://slidepdf.com/reader/full/2005-parker-county-poolville-isd-2005-texas-school-survey-of-drug-and 9/38
PoolvilleSpring 2005
________________________________________________________________________________
Wine?
NeverHeard of None Some Most
All * % 87.6% 9.9% 2.5%
Liquor?
NeverHeard of None Some Most
All 5.5% 76.4% 13.0% 5.1%
________________________________________________________________________________
Table A-9: Have you ever been offered ..
Any alcohol product?
NeverHeard of Yes No
All * % 35.9% 64.1%
Beer?
NeverHeard of Yes No
All 1.4% 35.1% 63.5%
Wine coolers?
Never
Heard of Yes No
All 14.7% 16.1% 69.2%
Wine?
NeverHeard of Yes No
All 2.9% 7.8% 89.4%
Liquor?
NeverHeard of Yes No
All 7.1% 16.4% 76.5%

7/30/2019 2005 _ parker county _ poolville isd _ 2005 texas school survey of drug and alcohol use _ elementary report
http://slidepdf.com/reader/full/2005-parker-county-poolville-isd-2005-texas-school-survey-of-drug-and 10/38
PoolvilleSpring 2005
________________________________________________________________________________
Table A-10: How do your parents feel about kids your age drinking beer?
Don't Don't Think Don'tLike It Care It's OK Know
All 74.7% 2.5% 1.3% 21.5%
________________________________________________________________________________
Table A-11: How dangerous do you think it is for kids your age to use ..
Any alcohol product?
Never Very Not at All Do NotHeard of Dangerous Dangerous Dangerous Know
All * % 66.2% 28.7% 1.3% 3.8%
Beer?
Never Very Not at All Do NotHeard of Dangerous Dangerous Dangerous Know
All * % 46.6% 38.2% 6.5% 8.7%
Wine coolers?
Never Very Not at All Do NotHeard of Dangerous Dangerous Dangerous Know
All 7.9% 42.4% 27.1% 12.2% 10.3%
Wine?
Never Very Not at All Do Not
Heard of Dangerous Dangerous Dangerous Know
All * % 43.4% 40.0% 9.0% 7.7%
Liquor?
Never Very Not at All Do NotHeard of Dangerous Dangerous Dangerous Know
All 3.9% 60.1% 32.2% 1.3% 2.6%

7/30/2019 2005 _ parker county _ poolville isd _ 2005 texas school survey of drug and alcohol use _ elementary report
http://slidepdf.com/reader/full/2005-parker-county-poolville-isd-2005-texas-school-survey-of-drug-and 11/38

7/30/2019 2005 _ parker county _ poolville isd _ 2005 texas school survey of drug and alcohol use _ elementary report
http://slidepdf.com/reader/full/2005-parker-county-poolville-isd-2005-texas-school-survey-of-drug-and 12/38
PoolvilleSpring 2005
________________________________________________________________________________
Table D-1: How recently, if ever, have you used..
Ever School Not Past NeverUsed Year Year Used
________________________________________________________________________________Marijuana All 2.3% 2.3% * % 97.7%
________________________________________________________________________________
Table D-2: Average number of times marijuana was used by those reporting usage:
School LifetimeYear
All * *
________________________________________________________________________________
Table D-3: Average age of first use of marijuana:
All
Marijuana *
________________________________________________________________________________
Table D-4: Average age of first use of marijuana by family situation:
Two Parent Family
Never 7/Under 8 9 10 11 12/Over
All 96.7% * % * % * % * % 1.6% 1.6%
Other Family Situation
Never 7/Under 8 9 10 11 12/Over
All 100.0% * % * % * % * % * % * %
________________________________________________________________________________
Table D-5 : Lifetime prevalence of use of marijuana by reported conductproblems this school year:
No Absences or Cut Sent toConduct Problems School Principal Both
Marijuana * % * % 5.8% * %

7/30/2019 2005 _ parker county _ poolville isd _ 2005 texas school survey of drug and alcohol use _ elementary report
http://slidepdf.com/reader/full/2005-parker-county-poolville-isd-2005-texas-school-survey-of-drug-and 13/38
PoolvilleSpring 2005
________________________________________________________________________________
Table D-6: About how many of your close friends use marijuana?
NeverHeard of None Some Most
All 17.0% 68.1% 9.9% 5.0%
________________________________________________________________________________
Table D-7: Have you ever been offered marijuana?
NeverHeard of Yes No
All 18.7% 11.3% 70.0%
________________________________________________________________________________
Table D-8: How do your parents feel about kids your age smoking marijuana?
Don't Don't Think Don'tLike It Care It's OK Know
All 82.1% 1.3% * % 16.6%
________________________________________________________________________________
Table D-9: How dangerous do you think it is for kids your age to use marijuana?
Never Very Not at All Do NotHeard of Dangerous Dangerous Dangerous Know
All 8.7% 73.3% 13.0% 2.4% 2.5%

7/30/2019 2005 _ parker county _ poolville isd _ 2005 texas school survey of drug and alcohol use _ elementary report
http://slidepdf.com/reader/full/2005-parker-county-poolville-isd-2005-texas-school-survey-of-drug-and 14/38
PoolvilleSpring 2005
________________________________________________________________________________
Table I-1: How recently, if ever, have you used..
Ever School Not Past NeverUsed Year Year Used
________________________________________________________________________________Inhalants All 9.9% 9.9% * % 90.1%
________________________________________________________________________________
Table I-2: Have you ever sniffed any of the following inhalants to get high?
Correction Fluid/Whiteout
Not Used Used
All 98.6% 1.4%
Gasoline
Not Used Used
All 98.8% 1.2%
Glue
Not Used Used
All 100.0% * %
Paint Thinner
Not Used Used
All 97.6% 2.4%
Spray Paint
Not Used Used
All 97.4% 2.6%
Other Inhalants
Not Used Used
All 95.0% 5.0%
________________________________________________________________________________
Table I-3: Average number of times inhalants were used by those reporting usage:
School Lifetime
Year
All * 2.8
7/30/2019 2005 _ parker county _ poolville isd _ 2005 texas school survey of drug and alcohol use _ elementary report
http://slidepdf.com/reader/full/2005-parker-county-poolville-isd-2005-texas-school-survey-of-drug-and 15/38
PoolvilleSpring 2005
________________________________________________________________________________
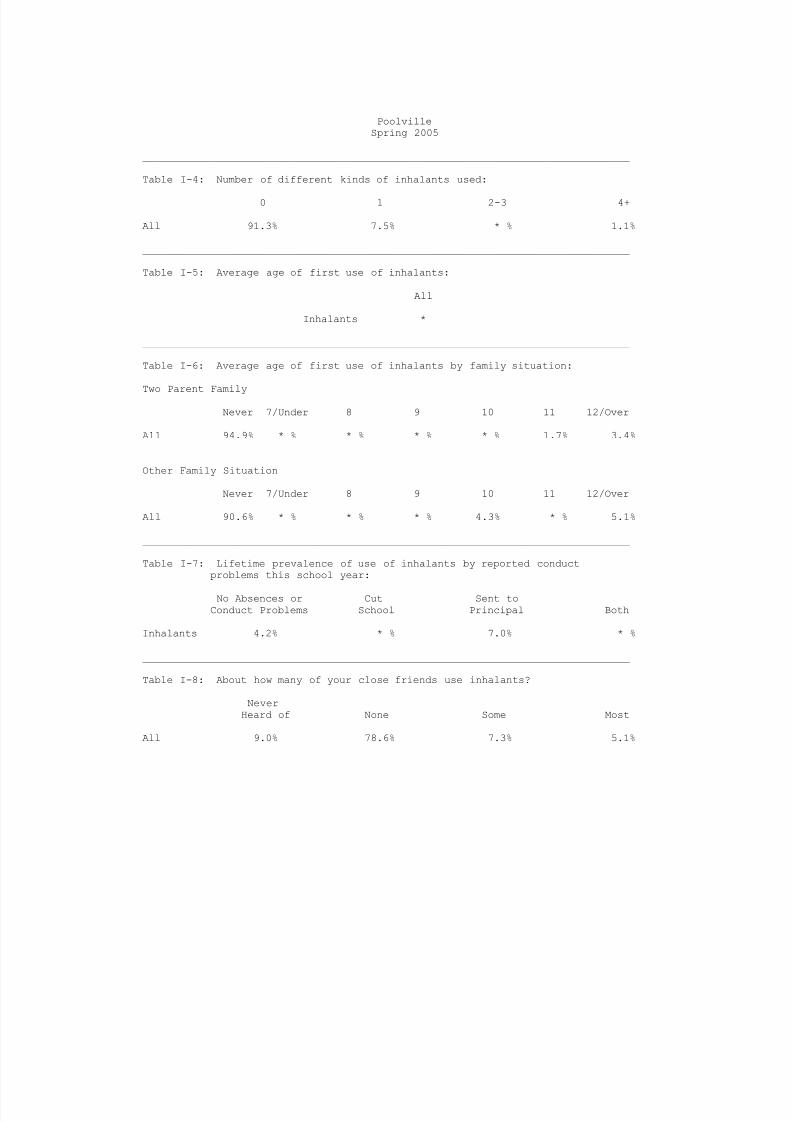
Table I-4: Number of different kinds of inhalants used:
0 1 2-3 4+
All 91.3% 7.5% * % 1.1%
________________________________________________________________________________
Table I-5: Average age of first use of inhalants:
All
Inhalants *
________________________________________________________________________________
Table I-6: Average age of first use of inhalants by family situation:
Two Parent Family
Never 7/Under 8 9 10 11 12/Over
All 94.9% * % * % * % * % 1.7% 3.4%
Other Family Situation
Never 7/Under 8 9 10 11 12/Over
All 90.6% * % * % * % 4.3% * % 5.1%
________________________________________________________________________________
Table I-7: Lifetime prevalence of use of inhalants by reported conductproblems this school year:
No Absences or Cut Sent toConduct Problems School Principal Both
Inhalants 4.2% * % 7.0% * %
________________________________________________________________________________
Table I-8: About how many of your close friends use inhalants?
NeverHeard of None Some Most
All 9.0% 78.6% 7.3% 5.1%

7/30/2019 2005 _ parker county _ poolville isd _ 2005 texas school survey of drug and alcohol use _ elementary report
http://slidepdf.com/reader/full/2005-parker-county-poolville-isd-2005-texas-school-survey-of-drug-and 16/38
PoolvilleSpring 2005
________________________________________________________________________________
Table I-9: Have you ever been offered inhalants?
NeverHeard of Yes No
All 6.9% 9.6% 83.5%
________________________________________________________________________________
Table I-10: How dangerous do you think it is for kids your age to use inhalants?
Never Very Not at All Do NotHeard of Dangerous Dangerous Dangerous Know
All 4.1% 66.5% 20.0% 2.7% 6.7%

7/30/2019 2005 _ parker county _ poolville isd _ 2005 texas school survey of drug and alcohol use _ elementary report
http://slidepdf.com/reader/full/2005-parker-county-poolville-isd-2005-texas-school-survey-of-drug-and 17/38

7/30/2019 2005 _ parker county _ poolville isd _ 2005 texas school survey of drug and alcohol use _ elementary report
http://slidepdf.com/reader/full/2005-parker-county-poolville-isd-2005-texas-school-survey-of-drug-and 18/38
PoolvilleSpring 2005
________________________________________________________________________________
Table X-1: Since school began in the fall, have you gotten information on drugs
or alcohol from ..
An Assembly Program?
No Yes
All 30.6% 69.4%
Guidance Counselor?
No Yes
All 24.3% 75.7%
Visitor to Class?
No Yes
All 32.6% 67.4%
Someone Else at School?
No Yes
All 70.8% 29.2%
Your Teacher?
No Yes
All 47.9% 52.1%
Any School Source?
No Yes
All 5.1% 94.9%

7/30/2019 2005 _ parker county _ poolville isd _ 2005 texas school survey of drug and alcohol use _ elementary report
http://slidepdf.com/reader/full/2005-parker-county-poolville-isd-2005-texas-school-survey-of-drug-and 19/38

7/30/2019 2005 _ parker county _ poolville isd _ 2005 texas school survey of drug and alcohol use _ elementary report
http://slidepdf.com/reader/full/2005-parker-county-poolville-isd-2005-texas-school-survey-of-drug-and 20/38
PoolvilleSpring 2005
Table B1: Prevalence and recency of use of selected substances by grade--> All Students
Ever School Not Past Never
Used Year Year Used________________________________________________________________________________Tobacco All 12.5% 6.0% 6.4% 87.5%________________________________________________________________________________Alcohol All 38.1% 28.1% 10.1% 61.9%________________________________________________________________________________Inhalants All 9.9% 9.9% * % 90.1%________________________________________________________________________________Marijuana All 2.3% 2.3% * % 97.7%________________________________________________________________________________
Table B2: Prevalence and recency of use of selected substances by grade--> Male Students
Ever School Not Past NeverUsed Year Year Used
________________________________________________________________________________Tobacco All 10.8% 2.6% 8.2% 89.2%________________________________________________________________________________Alcohol All 43.2% 29.8% 13.4% 56.8%________________________________________________________________________________Inhalants All 8.5% 8.5% * % 91.5%________________________________________________________________________________Marijuana All 2.6% 2.6% * % 97.4%________________________________________________________________________________
Table B3: Prevalence and recency of use of selected substances by grade--> Female Students
Ever School Not Past NeverUsed Year Year Used
________________________________________________________________________________
Tobacco All 13.8% 8.8% 5.0% 86.2%________________________________________________________________________________Alcohol All 33.9% 26.6% 7.3% 66.1%________________________________________________________________________________Inhalants All 11.1% 11.1% * % 88.9%________________________________________________________________________________Marijuana All 2.1% 2.1% * % 97.9%________________________________________________________________________________
Table B4: Prevalence and recency of use of selected substances by grade--> White Students
Ever School Not Past NeverUsed Year Year Used
________________________________________________________________________________Tobacco All 14.0% 7.4% 6.5% 86.0%
________________________________________________________________________________Alcohol All 40.5% 29.3% 11.1% 59.5%________________________________________________________________________________Inhalants All 9.5% 9.5% * % 90.5%________________________________________________________________________________Marijuana All 1.4% 1.4% * % 98.6%________________________________________________________________________________
7/30/2019 2005 _ parker county _ poolville isd _ 2005 texas school survey of drug and alcohol use _ elementary report
http://slidepdf.com/reader/full/2005-parker-county-poolville-isd-2005-texas-school-survey-of-drug-and 21/38
PoolvilleSpring 2005
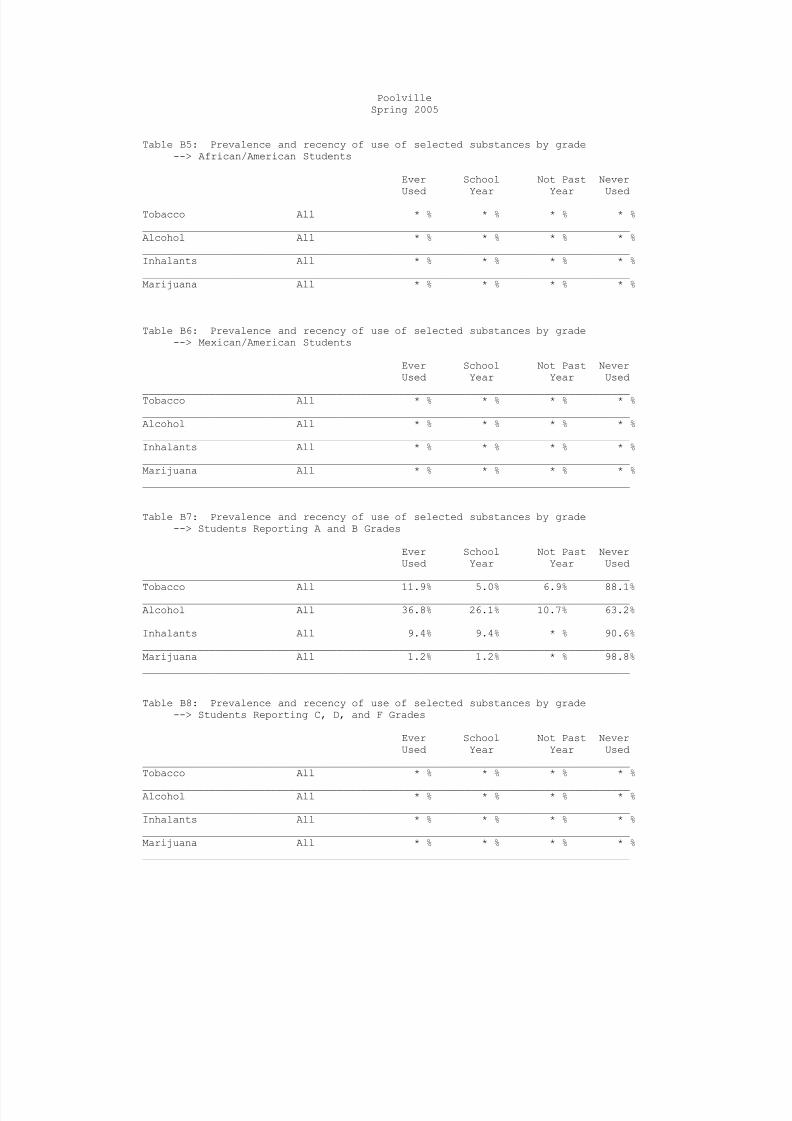
Table B5: Prevalence and recency of use of selected substances by grade--> African/American Students
Ever School Not Past Never
Used Year Year Used________________________________________________________________________________Tobacco All * % * % * % * %________________________________________________________________________________Alcohol All * % * % * % * %________________________________________________________________________________Inhalants All * % * % * % * %________________________________________________________________________________Marijuana All * % * % * % * %________________________________________________________________________________
Table B6: Prevalence and recency of use of selected substances by grade--> Mexican/American Students
Ever School Not Past NeverUsed Year Year Used
________________________________________________________________________________Tobacco All * % * % * % * %________________________________________________________________________________Alcohol All * % * % * % * %________________________________________________________________________________Inhalants All * % * % * % * %________________________________________________________________________________Marijuana All * % * % * % * %________________________________________________________________________________
Table B7: Prevalence and recency of use of selected substances by grade--> Students Reporting A and B Grades
Ever School Not Past NeverUsed Year Year Used
________________________________________________________________________________
Tobacco All 11.9% 5.0% 6.9% 88.1%________________________________________________________________________________Alcohol All 36.8% 26.1% 10.7% 63.2%________________________________________________________________________________Inhalants All 9.4% 9.4% * % 90.6%________________________________________________________________________________Marijuana All 1.2% 1.2% * % 98.8%________________________________________________________________________________
Table B8: Prevalence and recency of use of selected substances by grade--> Students Reporting C, D, and F Grades
Ever School Not Past NeverUsed Year Year Used
________________________________________________________________________________Tobacco All * % * % * % * %
________________________________________________________________________________Alcohol All * % * % * % * %________________________________________________________________________________Inhalants All * % * % * % * %________________________________________________________________________________Marijuana All * % * % * % * %________________________________________________________________________________

7/30/2019 2005 _ parker county _ poolville isd _ 2005 texas school survey of drug and alcohol use _ elementary report
http://slidepdf.com/reader/full/2005-parker-county-poolville-isd-2005-texas-school-survey-of-drug-and 22/38
PoolvilleSpring 2005
Table B9: Prevalence and recency of use of selected substances by grade--> Students Living With 2 Parents
Ever School Not Past Never
Used Year Year Used________________________________________________________________________________Tobacco All 9.0% 1.6% 7.4% 91.0%________________________________________________________________________________Alcohol All 33.8% 25.4% 8.4% 66.2%________________________________________________________________________________Inhalants All 10.3% 10.3% * % 89.7%________________________________________________________________________________Marijuana All 3.2% 3.2% * % 96.8%________________________________________________________________________________
Table B10: Prevalence and recency of use of selected substances by grade--> Students Not Living With 2 Parents
Ever School Not Past NeverUsed Year Year Used
________________________________________________________________________________Tobacco All 21.3% 17.1% 4.1% 78.7%________________________________________________________________________________Alcohol All 49.5% 35.0% 14.5% 50.5%________________________________________________________________________________Inhalants All 8.9% 8.9% * % 91.1%________________________________________________________________________________Marijuana All 0.0% * % * % 100.0%________________________________________________________________________________
Table B11: Prevalence and recency of use of selected substances by grade--> Students Living in Town More Than 3 Years
Ever School Not Past NeverUsed Year Year Used
________________________________________________________________________________
Tobacco All 11.7% 3.6% 8.1% 88.3%________________________________________________________________________________Alcohol All 33.6% 26.3% 7.3% 66.4%________________________________________________________________________________Inhalants All 6.0% 6.0% * % 94.0%________________________________________________________________________________Marijuana All 0.0% * % * % 100.0%________________________________________________________________________________
Table B12: Prevalence and recency of use of selected substances by grade--> Students Living in Town 3 Years or Less
Ever School Not Past NeverUsed Year Year Used
________________________________________________________________________________Tobacco All 18.0% 13.7% 4.3% 82.0%
________________________________________________________________________________Alcohol All 49.6% 35.1% 14.5% 50.4%________________________________________________________________________________Inhalants All 21.8% 21.8% * % 78.2%________________________________________________________________________________Marijuana All 8.2% 8.2% * % 91.8%________________________________________________________________________________

7/30/2019 2005 _ parker county _ poolville isd _ 2005 texas school survey of drug and alcohol use _ elementary report
http://slidepdf.com/reader/full/2005-parker-county-poolville-isd-2005-texas-school-survey-of-drug-and 23/38
PoolvilleSpring 2005
The FREQ Procedure
GENDER
Q1 Frequency Percent
-------------------------------Female 43.83813 54.80Male 36.16187 45.20
GRADE LEVEL
Q2 Frequency Percent--------------------------------Grade 4 26.08696 32.61Grade 5 33.04348 41.30Grade 6 20.86957 26.09
DO YOU LIVE WITH BOTH PARENTS?
Q3 Frequency Percent
-----------------------------------No 22.09009 27.61Yes 57.90991 72.39
AGE
Q4 Frequency Percent--------------------------------------9 7.023411 8.7810 20.44233 25.5511 31.77933 39.7212 17.12543 21.4113 or older 3.62949 4.54
ETHNICITY
Q5 Frequency Percent-----------------------------------------Mexican/American 7.926562 10.02Native/American 4.042554 5.11Other 2.976636 3.76White 64.14688 81.10
Frequency Missing = 0.9073724008
WHAT GRADES DO YOU USUALLY GET
Q6 Frequency Percent-----------------------------------Mostly A's 33.87571 42.83Mostly B's 41.11179 51.98
Mostly C's 4.105128 5.19
Frequency Missing = 0.9073724008
The frequencies have been weighted so that theanalysis reflects the distribution of students by grade
level in the district

7/30/2019 2005 _ parker county _ poolville isd _ 2005 texas school survey of drug and alcohol use _ elementary report
http://slidepdf.com/reader/full/2005-parker-county-poolville-isd-2005-texas-school-survey-of-drug-and 24/38
PoolvilleSpring 2005
The FREQ Procedure
LIVED IN THIS TOWN FOR MORE THAN 3 YEARS
Q7 Frequency Percent
-----------------------------------Don't Know 5.204445 6.58No 22.02752 27.85Yes 51.86067 65.57
Frequency Missing = 0.9073724008
EITHER PARENT GRADUATE FROM COLLEGE
Q8 Frequency Percent-----------------------------------Don't Know 34.25537 43.36No 21.89815 27.72Yes 22.84314 28.92
Frequency Missing = 1.0033444816
QUALIFY FOR A FREE/REDUCED PRICE LUNCH?
Q9 Frequency Percent-----------------------------------Don't Know 26.22862 33.16No 18.2103 23.02Yes 34.65371 43.81
Frequency Missing = 0.9073724008
PARENTS ATTEND PTA MEETINGS?
Q10 Frequency Percent-----------------------------------
No 48.06841 60.77Yes 31.02422 39.23
Frequency Missing = 0.9073724008
EVER INHALED GASOLINE TO GET HIGH?
Q11a Frequency Percent---------------------------------Not Used 75.11265 98.81Used 0.907372 1.19
Frequency Missing = 3.9799800175
The frequencies have been weighted so that theanalysis reflects the distribution of students by grade
level in the district

7/30/2019 2005 _ parker county _ poolville isd _ 2005 texas school survey of drug and alcohol use _ elementary report
http://slidepdf.com/reader/full/2005-parker-county-poolville-isd-2005-texas-school-survey-of-drug-and 25/38
PoolvilleSpring 2005
The FREQ Procedure
EVER INHALED PAINT THINNER TO GET HIGH?
Q11b Frequency Percent
---------------------------------Not Used 76.17857 97.55Used 1.910717 2.45
Frequency Missing = 1.9107168824
EVER INHALED GLUE TO GET HIGH?
Q11c Frequency Percent---------------------------------Not Used 75.11265 100.00
Frequency Missing = 4.8873524183
EVER INHALED WHITEOUT TO GET HIGH?
Q11d Frequency Percent---------------------------------Not Used 75.05007 98.60Used 1.065919 1.40
Frequency Missing = 3.8840079367
EVER INHALED SPRAY PAINT TO GET HIGH?
Q11e Frequency Percent---------------------------------Not Used 75.20862 97.44Used 1.973291 2.56
Frequency Missing = 2.8180892831
EVER USED OTHER INHALANTS TO GET HIGH?
Q11f Frequency Percent---------------------------------Not Used 72.32796 95.02Used 3.788036 4.98
Frequency Missing = 3.8840079367
CIGARETTE USE DURING LIFETIME
Q12a Frequency Percent---------------------------------------Never heard of 3.010033 3.91
Never used 66.27871 86.051-2 times 5.919873 7.6911+ times 1.814745 2.36
Frequency Missing = 2.9766355359
The frequencies have been weighted so that theanalysis reflects the distribution of students by grade
level in the district

7/30/2019 2005 _ parker county _ poolville isd _ 2005 texas school survey of drug and alcohol use _ elementary report
http://slidepdf.com/reader/full/2005-parker-county-poolville-isd-2005-texas-school-survey-of-drug-and 26/38
PoolvilleSpring 2005
The FREQ Procedure
SNUFF/CHEWING TOBACCO USE IN LIFETIME
Q12b Frequency Percent
---------------------------------------Never heard of 2.006689 2.67Never used 72.13601 95.911-2 times 1.065919 1.42
Frequency Missing = 4.7913803375
BEER USE DURING LIFETIME
Q12c Frequency Percent---------------------------------------Never heard of 2.006689 2.61Never used 53.31047 69.211-2 times 18.66699 24.243-10 times 3.03921 3.95
Frequency Missing = 2.9766355359
WINE COOLER USE DURING LIFETIME
Q12d Frequency Percent---------------------------------------Never heard of 10.96999 14.41Never used 50.42559 66.251-2 times 11.83975 15.553-10 times 1.065919 1.4011+ times 1.814745 2.38
Frequency Missing = 3.8840079367
WINE USE DURING LIFETIME
Q12e Frequency Percent
---------------------------------------Never heard of 3.010033 3.90Never used 62.55325 81.151-2 times 11.52265 14.95
Frequency Missing = 2.914061364
LIQUOR USE DURING LIFETIME
Q12f Frequency Percent---------------------------------------Never heard of 6.020067 7.72Never used 60.22947 77.291-2 times 10.77383 13.82
3-10 times 0.907372 1.16
Frequency Missing = 2.0692631352
The frequencies have been weighted so that theanalysis reflects the distribution of students by grade
level in the district

7/30/2019 2005 _ parker county _ poolville isd _ 2005 texas school survey of drug and alcohol use _ elementary report
http://slidepdf.com/reader/full/2005-parker-county-poolville-isd-2005-texas-school-survey-of-drug-and 27/38
PoolvilleSpring 2005
The FREQ Procedure
INHALANT USE DURING LIFETIME
Q12h Frequency Percent
---------------------------------------Never heard of 8.90073 11.70Never used 63.20611 83.111-2 times 3.03921 4.003-10 times 0.907372 1.19
Frequency Missing = 3.9465821087
MARIJUANA USE DURING LIFETIME
Q12i Frequency Percent---------------------------------------Never heard of 17.11521 21.68Never used 60.00413 76.023-10 times 0.907372 1.1511+ times 0.907372 1.15
Frequency Missing = 1.0659186536
CIGARETTE USE IN PAST SCHOOL YEAR
Q13a Frequency Percent---------------------------------------Never heard of 2.006689 2.61Never used 71.22864 92.481-2 times 2.880663 3.743-10 times 0.907372 1.18
Frequency Missing = 2.9766355359
SNUFF/CHEWING TOBACCO USE IN PAST YEAR
Q13b Frequency Percent
---------------------------------------Never heard of 2.006689 2.68Never used 71.97747 96.111-2 times 0.907372 1.21
Frequency Missing = 5.1084728431
BEER USE IN PAST SCHOOL YEAR
Q13c Frequency Percent---------------------------------------Never heard of 2.006689 2.61Never used 58.32297 75.881-2 times 15.62778 20.33
3-10 times 0.907372 1.18
Frequency Missing = 3.1351817888
The frequencies have been weighted so that theanalysis reflects the distribution of students by grade
level in the district

7/30/2019 2005 _ parker county _ poolville isd _ 2005 texas school survey of drug and alcohol use _ elementary report
http://slidepdf.com/reader/full/2005-parker-county-poolville-isd-2005-texas-school-survey-of-drug-and 28/38
PoolvilleSpring 2005
The FREQ Procedure
WINE COOLER USE IN PAST SCHOOL YEAR
Q13d Frequency Percent
---------------------------------------Never heard of 11.97334 15.38Never used 53.30625 68.461-2 times 10.77383 13.843-10 times 0.907372 1.1711+ times 0.907372 1.17
Frequency Missing = 2.1318373072
WINE USE IN PAST SCHOOL YEAR
Q13e Frequency Percent---------------------------------------Never heard of 2.006689 2.64Never used 67.40721 88.601-2 times 6.668699 8.77
Frequency Missing = 3.9174058456
LIQUOR USE IN PAST SCHOOL YEAR
Q13f Frequency Percent---------------------------------------Never heard of 5.016722 6.69Never used 62.23616 83.001-2 times 7.734618 10.31
Frequency Missing = 5.0125007622
INHALANT USE IN PAST SCHOOL YEAR
Q13h Frequency Percent---------------------------------------Never heard of 7.052588 9.16Never used 64.14688 83.351-2 times 3.946582 5.133-10 times 0.907372 1.1811+ times 0.907372 1.18
Frequency Missing = 3.0392097079
MARIJUANA USE IN PAST SCHOOL YEAR
Q13i Frequency Percent---------------------------------------Never heard of 18.11855 23.87Never used 55.96157 73.74
3-10 times 0.907372 1.2011+ times 0.907372 1.20
Frequency Missing = 4.1051283615
The frequencies have been weighted so that theanalysis reflects the distribution of students by grade
level in the district

7/30/2019 2005 _ parker county _ poolville isd _ 2005 texas school survey of drug and alcohol use _ elementary report
http://slidepdf.com/reader/full/2005-parker-county-poolville-isd-2005-texas-school-survey-of-drug-and 29/38
PoolvilleSpring 2005
The FREQ Procedure
AGE WHEN FIRST USED CIGARETTES
Q14a Frequency Percent
-----------------------------------------7 or younger 0.907372 1.189 years old 1.973291 2.56
10 years old 1.065919 1.3911 years old 3.788036 4.92Never heard/used 69.22617 89.95
Frequency Missing = 3.0392097079
AGE WHEN FIRST USED SNUFF/CHEW TOBACCO
Q14b Frequency Percent-----------------------------------------9 years old 1.065919 1.40
Never heard/used 75.05007 98.60
Frequency Missing = 3.8840079367
AGE WHEN FIRST USED BEER
Q14c Frequency Percent-----------------------------------------7 or younger 5.602781 7.388 years old 4.105128 5.409 years old 2.131837 2.81
10 years old 3.197756 4.2111 years old 4.853955 6.3912 or older 0.907372 1.19Never heard/used 55.15862 72.62
Frequency Missing = 4.0425541895
AGE WHEN FIRST USED WINE COOLERS
Q14d Frequency Percent-----------------------------------------8 years old 0.907372 1.219 years old 5.267019 7.03
10 years old 5.171047 6.9011 years old 1.973291 2.6312 or older 3.62949 4.85Never heard/used 57.94331 77.37
Frequency Missing = 5.1084728431
The frequencies have been weighted so that theanalysis reflects the distribution of students by grade
level in the district
7/30/2019 2005 _ parker county _ poolville isd _ 2005 texas school survey of drug and alcohol use _ elementary report
http://slidepdf.com/reader/full/2005-parker-county-poolville-isd-2005-texas-school-survey-of-drug-and 30/38
PoolvilleSpring 2005
The FREQ Procedure
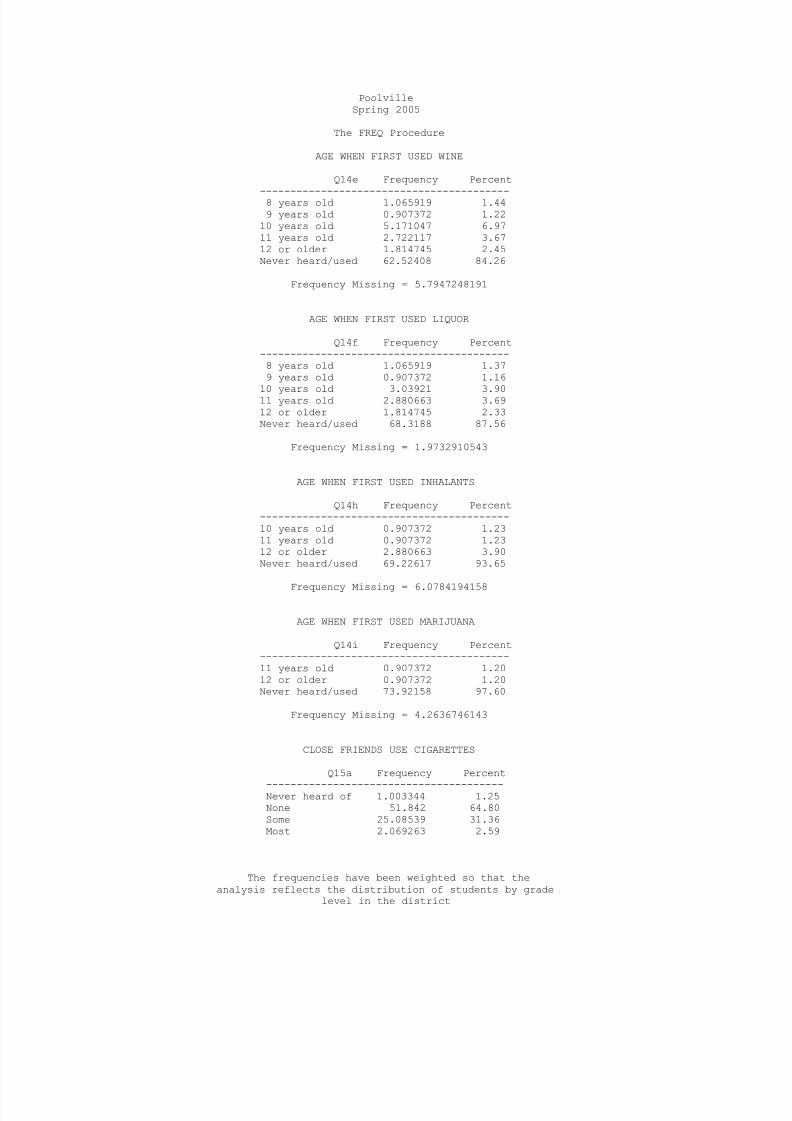
AGE WHEN FIRST USED WINE
Q14e Frequency Percent
-----------------------------------------8 years old 1.065919 1.449 years old 0.907372 1.22
10 years old 5.171047 6.9711 years old 2.722117 3.6712 or older 1.814745 2.45Never heard/used 62.52408 84.26
Frequency Missing = 5.7947248191
AGE WHEN FIRST USED LIQUOR
Q14f Frequency Percent-----------------------------------------8 years old 1.065919 1.379 years old 0.907372 1.16
10 years old 3.03921 3.9011 years old 2.880663 3.6912 or older 1.814745 2.33Never heard/used 68.3188 87.56
Frequency Missing = 1.9732910543
AGE WHEN FIRST USED INHALANTS
Q14h Frequency Percent-----------------------------------------10 years old 0.907372 1.2311 years old 0.907372 1.2312 or older 2.880663 3.90Never heard/used 69.22617 93.65
Frequency Missing = 6.0784194158
AGE WHEN FIRST USED MARIJUANA
Q14i Frequency Percent-----------------------------------------11 years old 0.907372 1.2012 or older 0.907372 1.20Never heard/used 73.92158 97.60
Frequency Missing = 4.2636746143
CLOSE FRIENDS USE CIGARETTES
Q15a Frequency Percent
---------------------------------------Never heard of 1.003344 1.25None 51.842 64.80Some 25.08539 31.36Most 2.069263 2.59
The frequencies have been weighted so that theanalysis reflects the distribution of students by grade
level in the district

7/30/2019 2005 _ parker county _ poolville isd _ 2005 texas school survey of drug and alcohol use _ elementary report
http://slidepdf.com/reader/full/2005-parker-county-poolville-isd-2005-texas-school-survey-of-drug-and 31/38
PoolvilleSpring 2005
The FREQ Procedure
CLOSE FRIENDS USE SNUFF/CHEWING TOBACCO
Q15b Frequency Percent
---------------------------------------None 71.00752 89.96Some 5.953271 7.54Most 1.973291 2.50
Frequency Missing = 1.0659186536
CLOSE FRIENDS USE BEER
Q15c Frequency Percent---------------------------------------None 52.87874 68.43Some 19.54519 25.29Most 4.853955 6.28
Frequency Missing = 2.7221172023
CLOSE FRIENDS USE WINE COOLERS
Q15d Frequency Percent---------------------------------------Never heard of 8.963305 12.29None 45.41309 62.28Some 14.81638 20.32Most 3.725462 5.11
Frequency Missing = 7.0817638974
CLOSE FRIENDS USE WINE
Q15e Frequency Percent
---------------------------------------None 66.6292 87.61Some 7.513498 9.88Most 1.910717 2.51
Frequency Missing = 3.9465821087
CLOSE FRIENDS USE LIQUOR
Q15f Frequency Percent---------------------------------------Never heard of 4.013378 5.50None 55.75518 76.40Some 9.486789 13.00Most 3.725462 5.10
Frequency Missing = 7.0191897255
The frequencies have been weighted so that theanalysis reflects the distribution of students by grade
level in the district
7/30/2019 2005 _ parker county _ poolville isd _ 2005 texas school survey of drug and alcohol use _ elementary report
http://slidepdf.com/reader/full/2005-parker-county-poolville-isd-2005-texas-school-survey-of-drug-and 32/38
PoolvilleSpring 2005
The FREQ Procedure
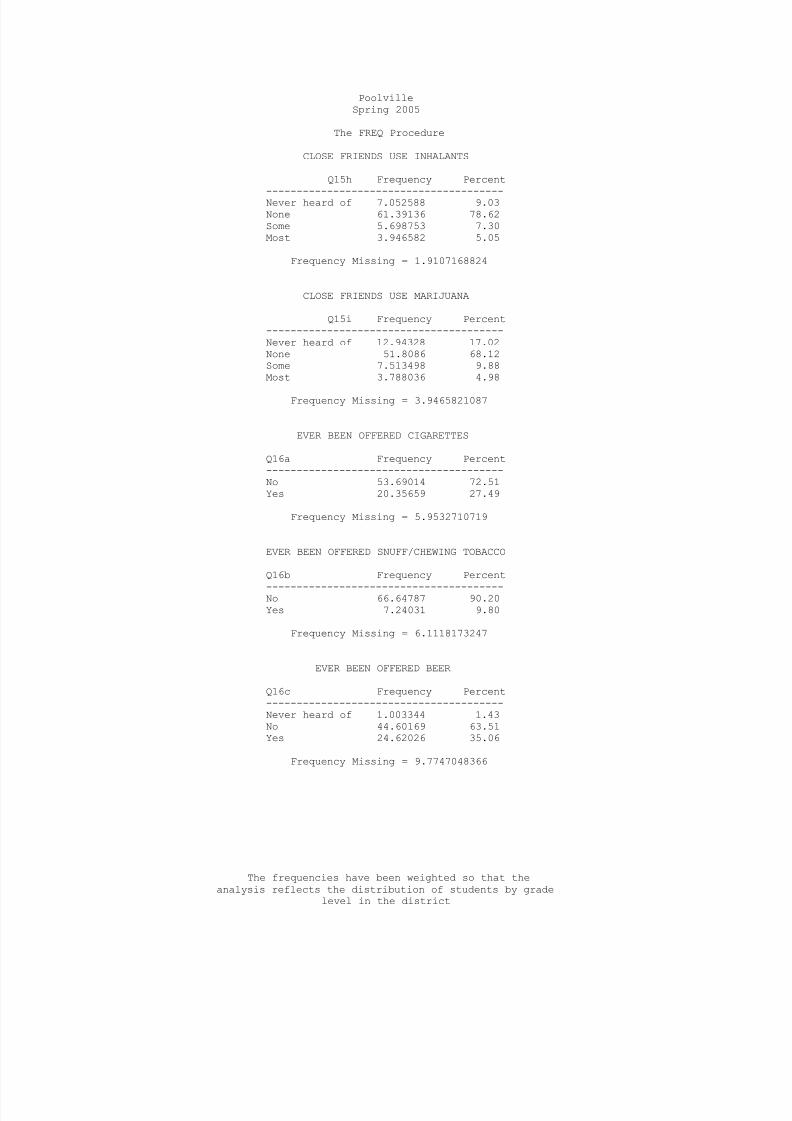
CLOSE FRIENDS USE INHALANTS
Q15h Frequency Percent
---------------------------------------Never heard of 7.052588 9.03None 61.39136 78.62Some 5.698753 7.30Most 3.946582 5.05
Frequency Missing = 1.9107168824
CLOSE FRIENDS USE MARIJUANA
Q15i Frequency Percent---------------------------------------Never heard of 12.94328 17.02None 51.8086 68.12Some 7.513498 9.88Most 3.788036 4.98
Frequency Missing = 3.9465821087
EVER BEEN OFFERED CIGARETTES
Q16a Frequency Percent---------------------------------------No 53.69014 72.51Yes 20.35659 27.49
Frequency Missing = 5.9532710719
EVER BEEN OFFERED SNUFF/CHEWING TOBACCO
Q16b Frequency Percent
---------------------------------------No 66.64787 90.20Yes 7.24031 9.80
Frequency Missing = 6.1118173247
EVER BEEN OFFERED BEER
Q16c Frequency Percent---------------------------------------Never heard of 1.003344 1.43No 44.60169 63.51Yes 24.62026 35.06
Frequency Missing = 9.7747048366
The frequencies have been weighted so that theanalysis reflects the distribution of students by grade
level in the district
7/30/2019 2005 _ parker county _ poolville isd _ 2005 texas school survey of drug and alcohol use _ elementary report
http://slidepdf.com/reader/full/2005-parker-county-poolville-isd-2005-texas-school-survey-of-drug-and 33/38
PoolvilleSpring 2005
The FREQ Procedure
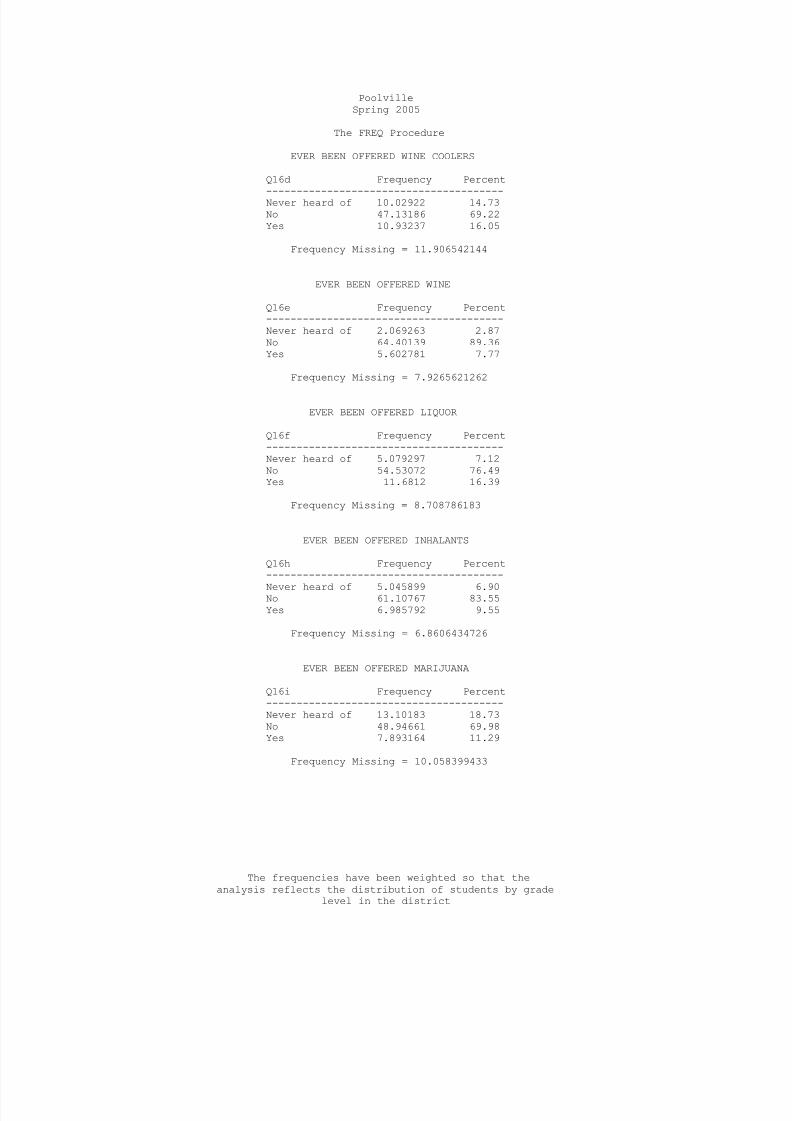
EVER BEEN OFFERED WINE COOLERS
Q16d Frequency Percent
---------------------------------------Never heard of 10.02922 14.73No 47.13186 69.22Yes 10.93237 16.05
Frequency Missing = 11.906542144
EVER BEEN OFFERED WINE
Q16e Frequency Percent---------------------------------------Never heard of 2.069263 2.87No 64.40139 89.36Yes 5.602781 7.77
Frequency Missing = 7.9265621262
EVER BEEN OFFERED LIQUOR
Q16f Frequency Percent---------------------------------------Never heard of 5.079297 7.12No 54.53072 76.49Yes 11.6812 16.39
Frequency Missing = 8.708786183
EVER BEEN OFFERED INHALANTS
Q16h Frequency Percent---------------------------------------
Never heard of 5.045899 6.90No 61.10767 83.55Yes 6.985792 9.55
Frequency Missing = 6.8606434726
EVER BEEN OFFERED MARIJUANA
Q16i Frequency Percent---------------------------------------Never heard of 13.10183 18.73No 48.94661 69.98Yes 7.893164 11.29
Frequency Missing = 10.058399433
The frequencies have been weighted so that theanalysis reflects the distribution of students by grade
level in the district

7/30/2019 2005 _ parker county _ poolville isd _ 2005 texas school survey of drug and alcohol use _ elementary report
http://slidepdf.com/reader/full/2005-parker-county-poolville-isd-2005-texas-school-survey-of-drug-and 34/38
PoolvilleSpring 2005
The FREQ Procedure
IS ALCOHOL OBTAINED FROM HOME
Q17a Frequency Percent
-------------------------------------Do Not Drink 49.33049 64.05No 9.025879 11.72Yes 18.66699 24.24
Frequency Missing = 2.9766355359
IS ALCOHOL OBTAINED FROM FRIENDS
Q17b Frequency Percent-------------------------------------Do Not Drink 49.33049 66.68No 21.93154 29.64Yes 2.722117 3.68
Frequency Missing = 6.0158452438
IS ALCOHOL OBTAINED SOMEWHERE ELSE
Q17c Frequency Percent-------------------------------------Do Not Drink 49.39307 68.38No 18.89233 26.16Yes 3.946582 5.46
Frequency Missing = 7.7680158734
DANGEROUS FOR KIDS TO USE CIGARETTES
Q18a Frequency Percent---------------------------------------
Very dangerous 46.03254 59.72Dangerous 28.07676 36.42Not at all 1.003344 1.30Don't know 1.973291 2.56
Frequency Missing = 2.914061364
DANGEROUS TO USE SNUFF/CHEWING TOBACCO
Q18b Frequency Percent---------------------------------------Very dangerous 45.47566 60.54Dangerous 25.75298 34.29Not at all 1.003344 1.34Don't know 2.880663 3.84
Frequency Missing = 4.8873524183
The frequencies have been weighted so that theanalysis reflects the distribution of students by grade
level in the district

7/30/2019 2005 _ parker county _ poolville isd _ 2005 texas school survey of drug and alcohol use _ elementary report
http://slidepdf.com/reader/full/2005-parker-county-poolville-isd-2005-texas-school-survey-of-drug-and 35/38
PoolvilleSpring 2005
The FREQ Procedure
DANGEROUS FOR KIDS TO USE BEER
Q18c Frequency Percent
---------------------------------------Very dangerous 36.39143 46.60Dangerous 29.82471 38.19Not at all 5.108473 6.54Don't know 6.764671 8.66
Frequency Missing = 1.9107168824
DANGEROUS FOR KIDS TO USE WINE COOLERS
Q18d Frequency Percent---------------------------------------Very dangerous 31.47068 42.41Dangerous 20.1168 27.11Not at all 9.055055 12.20Don't know 7.672044 10.34
Never heard of 5.890697 7.94
Frequency Missing = 5.7947248191
DANGEROUS FOR KIDS TO USE WINE
Q18e Frequency Percent---------------------------------------Very dangerous 32.57 43.36Dangerous 30.01665 39.96Not at all 6.764671 9.01Don't know 5.761327 7.67
Frequency Missing = 4.8873524183
DANGEROUS FOR KIDS TO USE LIQUOR
Q18f Frequency Percent---------------------------------------Very dangerous 46.16191 60.06Dangerous 24.71624 32.16Not at all 1.003344 1.31Don't know 1.973291 2.57Never heard of 3.010033 3.92
Frequency Missing = 3.1351817888
The frequencies have been weighted so that theanalysis reflects the distribution of students by grade
level in the district
7/30/2019 2005 _ parker county _ poolville isd _ 2005 texas school survey of drug and alcohol use _ elementary report
http://slidepdf.com/reader/full/2005-parker-county-poolville-isd-2005-texas-school-survey-of-drug-and 36/38
PoolvilleSpring 2005
The FREQ Procedure
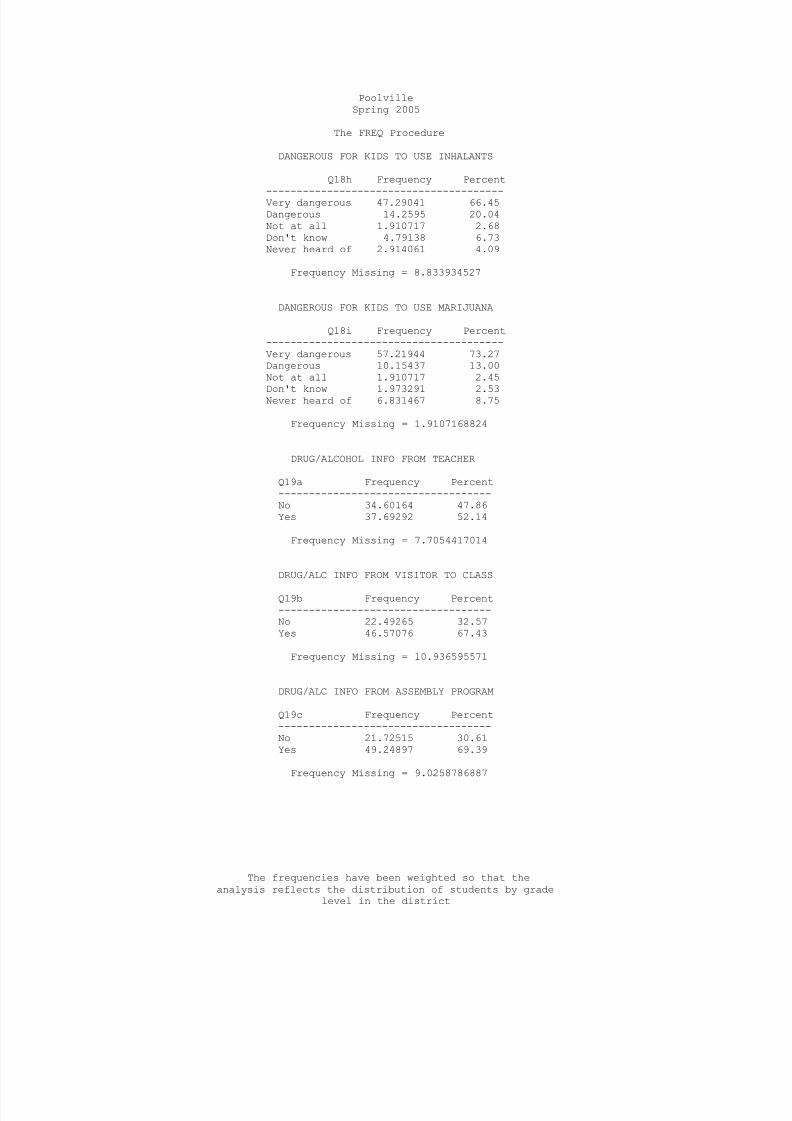
DANGEROUS FOR KIDS TO USE INHALANTS
Q18h Frequency Percent
---------------------------------------Very dangerous 47.29041 66.45Dangerous 14.2595 20.04Not at all 1.910717 2.68Don't know 4.79138 6.73Never heard of 2.914061 4.09
Frequency Missing = 8.833934527
DANGEROUS FOR KIDS TO USE MARIJUANA
Q18i Frequency Percent---------------------------------------Very dangerous 57.21944 73.27Dangerous 10.15437 13.00Not at all 1.910717 2.45
Don't know 1.973291 2.53Never heard of 6.831467 8.75
Frequency Missing = 1.9107168824
DRUG/ALCOHOL INFO FROM TEACHER
Q19a Frequency Percent-----------------------------------No 34.60164 47.86Yes 37.69292 52.14
Frequency Missing = 7.7054417014
DRUG/ALC INFO FROM VISITOR TO CLASS
Q19b Frequency Percent-----------------------------------No 22.49265 32.57Yes 46.57076 67.43
Frequency Missing = 10.936595571
DRUG/ALC INFO FROM ASSEMBLY PROGRAM
Q19c Frequency Percent-----------------------------------No 21.72515 30.61Yes 49.24897 69.39
Frequency Missing = 9.0258786887
The frequencies have been weighted so that theanalysis reflects the distribution of students by grade
level in the district

7/30/2019 2005 _ parker county _ poolville isd _ 2005 texas school survey of drug and alcohol use _ elementary report
http://slidepdf.com/reader/full/2005-parker-county-poolville-isd-2005-texas-school-survey-of-drug-and 37/38
PoolvilleSpring 2005
The FREQ Procedure
DRUG/ALC INFO FROM GUIDE COUNSELOR
Q19d Frequency Percent
-----------------------------------No 18.01414 24.28Yes 56.19114 75.72
Frequency Missing = 5.7947248191
DRUG/ALC INF FROM SOMEONE ELSE AT SCHOOL
Q19e Frequency Percent-----------------------------------No 51.07844 70.81Yes 21.05757 29.19
Frequency Missing = 7.8639879542
BEER, TWO OR MORE AT ONE TIME Q20a Frequency Percent
---------------------------------Never 58.06846 77.471 time 9.962427 13.292 times 3.135182 4.183+ times 3.788036 5.05
Frequency Missing = 5.0458986711
WINE COOLERS, TWO OR MORE AT ONE TIME
Q20b Frequency Percent---------------------------------Never 60.23369 82.35
1 time 5.919873 8.092 times 4.105128 5.613+ times 2.880663 3.94
Frequency Missing = 6.8606434726
WINE, TWO OR MORE AT ONE TIME
Q20c Frequency Percent---------------------------------Never 64.49737 88.181 time 6.510153 8.902 times 2.131837 2.91
Frequency Missing = 6.8606434726
The frequencies have been weighted so that theanalysis reflects the distribution of students by grade
level in the district

7/30/2019 2005 _ parker county _ poolville isd _ 2005 texas school survey of drug and alcohol use _ elementary report
http://slidepdf.com/reader/full/2005-parker-county-poolville-isd-2005-texas-school-survey-of-drug-and 38/38
PoolvilleSpring 2005
The FREQ Procedure
LIQUOR, TWO OR MORE AT ONE TIME
Q20d Frequency Percent
---------------------------------Never 63.11436 85.241 time 6.985792 9.432 times 1.973291 2.663+ times 1.973291 2.66
Frequency Missing = 5.9532710719
MISSED SCHOOL WITHOUT PARENT'S CONSENT
Q21 Frequency Percent-----------------------------------No 78.99666 100.00
Frequency Missing = 1.0033444816
SENT TO PRINCIPAL/DEAN SINCE SEPTEMBER
Q22 Frequency Percent-----------------------------------No 47.75554 60.45Yes 31.24112 39.55
Frequency Missing = 1.0033444816
PARENTS FEEL ABOUT KIDS DRINKING BEER
Q23 Frequency Percent----------------------------------------Don't like it 58.97583 74.66Don't care 1.973291 2.50
Think it's O.K. 1.065919 1.35Don't know 16.98162 21.50
Frequency Missing = 1.0033444816
PARENTS FEEL ABOUT KIDS USING MARIJUANA
Q24 Frequency Percent----------------------------------------Don't like it 64.83313 82.07Don't care 1.065919 1.35Don't know 13.09761 16.58
Frequency Missing = 1.0033444816
The frequencies have been weighted so that theanalysis reflects the distribution of students by grade
level in the district