2005 transmission business briefing€¦ · · 2009-02-12transmission business briefing atc’s...
TRANSCRIPT

1
Transmission Business Briefing
ATC’s service area

2
Our progress in five years
A more reliable transmission systemInvested $481 million to:
Upgrade more than 565 miles of power linesImprove 79 substationsBuild 75 miles new power linesConnect 1,767 megawatts new generation

3
What this work means
ATC now can:Deliver up to 12,765 megawatts to customers in Wisconsin, Michigan and Illinois Maintain 99.96% availability ratingSupport 828 MW new peak usageIncrease import power by 1,000 MW

4
Thevital link

5
Moving power intoor through our system
Specific projects (completed):Blackhawk-Colley Road (Rock County)Christiana-Kegonsa (Dane County)Eau Claire-Arpin (Wood County)Kewaunee Area Projects (Kewaunee County)Manistique-Hiawatha (Schoolcraft and Mackinac counties)North Appleton-Lost Dauphin (Outagamie and Brown counties)North Appleton-White Clay (Outagamie and Shawano counties)Paris-St. Martins (Kenosha, Racine, and Milwaukee counties)Rhinelander Area Projects (Lincoln, Oneida and Langlade counties)Wempletown-Paddock (Rock County and northern Illinois)Whitewater-Mukwonago (Walworth and Waukesha counties)

6
27 projects completed since 2004
Four projects placed in service
Six projects placed in service
One project placed in service
Eleven projects placed in service
Five projects placed in service

7
10-Year system assessmentFifth year of assessment and reportCovers years 2005 through 2015Identifies conditions that drive plans for upgrades and expansionIdentifies projects needed to improve system adequacy and reliability

8
Multi-level planning process
ATC Planning Zone
Individual Issue
Regional/National
ATC System
Bot
tom
Up Top D
own

9
Changes since 2004

10
Assessment enhancements and additionsInteractive Web site with links
www.atc10yearplan.com
Transmission Access Initiative20-year analysis goals
Started in 2005 TYA, finish for 2006 TYASystem consistencyIdentify generation sites
ATC regional studies involvementMaintenance projects greater than $500,000Prioritization methodology tool

11
Assessment enhancements and additionsReactive power analysis
Reduce generation MVAr capability by 10%First contingenciesNo significant impact
Multiple outage analysisAdditional steady state and dynamics studiesRechecked critical contingenciesMeet national reliability standards with load shedding/operatingprocedures
All projects assessment2010 and 2014 studiesProject synergy (don't create new problems)

12
System expansion drivers
Electric load growthTransmission-distribution interconnectionsTransmission service limitationsNew generationTransmission service requestsSystem repair or replacementEconomic strategic expansion

13
Types of ProjectsLine projects Substation Projects
New line New SubstationRebuilt line Existing substation expansionReconductor line Equipment additions andUprate line replacementsConvert voltage

14
Project classifications
Project not includedProject not included
Project included to show impact on system
System solution included in power flow
models
Project is placeholder and among several solutionsbeing evaluated and studied
Project identified aspreferred solution to transmission issue
Project approved andunder construction orbeing engineered forconstruction
Project implementation
phase
No action on preparing or submitting an application
Application has not been submitted
Application under review or approved
Construction application
For regulatory review
Studies are not completeStudies are not completeStudies completed
ATC planning workand analysis
ProvisionalProposedPlannedProject Activity

15
Load interconnection requests
2282795106Totals31216135691234234801021493192116229113151
TotalReplaceAddNewZone
New transmission to distribution substationsAdd transmission to distribution transformers at existing substationsReplace transmission to distribution transformers at existing
substations

16
Generator requests placed in service
370Sheboygan6/2/20051,767Total
300Fox Energy6/1/2005150West Campus5/1/2005655Riverside6/15/200460Kaukauna CT6/1/200443Kewaunee uprate3/19/2004
105Pulliam CT, Petenwell/Big Pond6/1/200353Combined Locks200131Eden/Little Badger2000
MegawattsRequests On-LineDate

17
= Generationinterconnection requests
as of July 1, 2005

18
Chronic transmission loadingrelief incidents - 2004
19White Clay-Morgan 138 kVStiles-Pioneer 138 kV
22Pulliam-Stiles 138 kVWhite Clay-Morgan 138 kV
154Morgan-Plains 345 kVStiles-Amberg/Stiles-Crivitz 138 kV
24Oak Creek banks T851/T895Oak Creek 345/230 kV transformer
29Lost Dauphin-Red Maple 138 kVHighway V-Preble 138 kV
10Eau Claire-Arpin 345 kV
29Wempletown-Paddock 345 kVAlbers-Paris 138 kV
Total Declarations
Anticipated Element OutageLimiting Element

19
Zone 1 – North Central WisconsinGrowth projections
Population: 0.6% from 2005-2010Employment: 1.2% from 2005-2010
Environmental considerationsNorth: woodlands and lakesSouth: agriculturalNational forests and wildlife refuges
Electricity demand and generationExpected load growth: 2% from 2006-2014 (2006 peak load is 1,789 MW)Net importer of power during peak demand periodsNew generation: Weston 4 (550 MW)

20
Zone 1 system conditions2006
Low voltages in Rhinelander loop Low voltages in Tomah areaOverloaded facilities for Weston-Sherman St. outage
2010Same problems as in 2006, but worse if planned and proposed projects are not completedWidespread overloaded facilities in Wausau area with addition of Weston G4 without Gardner Park-Central Wisconsin 345 kV line and 115 kV reinforcements

21
Zone 1 system conditions
2014Emerging overloads to system feeding the Rhinelander loopEmerging overloads and low voltages in the Wautoma, Berlin and Ripon areasAdditional generation requests in the Wausau or Plover areas may impact transmission system plans

22
Most notable projects include:
PlannedArrowhead-Weston 345 kV line (2006/2008)Gardner Park-Central Wisconsin 345 kV line (2009)
ProposedWeston-Sherman St.-Hilltop rebuild (2007)Cranberry-Conover 115 kV line (2008)
ProvisionalMonroe County-Council Creek 161 kV line (2010)
Zone 145+ projects 2005-2015
2
5
7
8
9

23
Zone 2 – Northern Wis./Mich. UPGrowth projections
Population: 0.2% from 2005-2010Employment: 1.3% from 2005-2010
Environmental considerationsHeavily forested areasMany lakes, rivers and streams
Electricity demand and generationExpected load growth: 0.8% from 2006-2014
2006 peak load is 906 MWMore generation (at maximum output) than peak loadNormal operating condition: net importer of power

24
Zone 2 system conditions2006
Low voltages in west side from Conover to OntonagonLow voltages in far eastern areaSeverely limited import capability from Wisconsin
2010Same problems as in 2006, but worse if planned and proposed projects are not completedCranberry-Conover-Plains improves voltages and reliabilityHiawatha-Pine River-Mackinac (Straits) and Hiawatha-Indian Lake improves area voltagesVarious Zone 4 projects significantly improve import capability

25
Zone 2 system conditions
2014Poor condition and system reliability issues requires rebuild oftwo 69 kV lines to 138 kV operationHigher than expected load growth could require additional capacitor projects at Hiawatha, M38 and Empire SubstationsBlaney Park-Munising rebuild/conversion addresses overloads and voltages in Central UPChalk Hills-Chandler rebuild/conversion improves reliability and diversifies ties between Zone 2 and Zone 4

26
Zone 2 35+ projects 2005-2015Most notable projects include:
PlannedStiles-Amberg 138 kV line rebuild (2006)String second Hiawatha-Indian Lake circuit and convert both to138 kV (2006/2009)
ProposedCranberry-Conover 115 kV line and Conover-Iron River-Plainsrebuild and conversion to 138 kV (2008)
ProvisionalHiawatha-Pine River-Mackinac (Straits) 69 kV line rebuild andconversion to 138 kV (2009)Blaney Park-Munising 69 kV line rebuild and conversion to138 kV (2012)
1
2
5
6
7

27
Zone 3 – Southern Wis./Northern Ill.Growth projections
Population: 0.8% from 2005-2010Employment: 1.5% from 2005-2010
Environmental considerationsWetlands, major rivers, numerous lakes
Electricity demand and generationExpected load growth: 3.3% from 2006-2014; higher in Madison area
2006 peak load is 3,290 MWMore generation (at maximum output) than peak loadNormal operating condition: net importer of power

28
Zone 3 system conditions2006
Low voltages, especially in Madison area, and transmission facility overloads identified through out area are current and emerging concernsHigher than average load growth in Rock and Walworth countiesIntact system is supported by new generation on the UW CampusA substantial amount of power is imported into Dane County
2010Same problems as in 2006, but worse if planned and proposed projects are not completedNorth Madison-Waunakee 138 kV line addresses cascading overloads in the Madison AreaStony Brook-Jefferson line along with the Rockdale-Mill Road 345 kV line addresses voltage problems and line overloads in Jefferson CountyN. Lake Geneva-White River-S. Lake Geneva 138 kV project will temporarily improve voltages in southwest Zone 3

29
Zone 3 system conditions2014
Widespread voltage collapse in Madison area a concernLow voltages on 69 kV and 138 kV in Wisconsin Dells areaLow voltages at/near Richland Center and along 69 kV line from Gran Grae to Lone Rock requires reinforcementWest Middleton-Rockdale 345 line along with additional 138 kV lines addresses serious voltage problems in Dane CountyLake Delton-Birchwood 138 kV line addresses voltages and reliability for Wisconsin Dells area load Eden-Muscoda-Richland Center 69 kV line and Eden-Hillman voltage conversion addresses widespread voltage problems in southwest Wisconsin
30
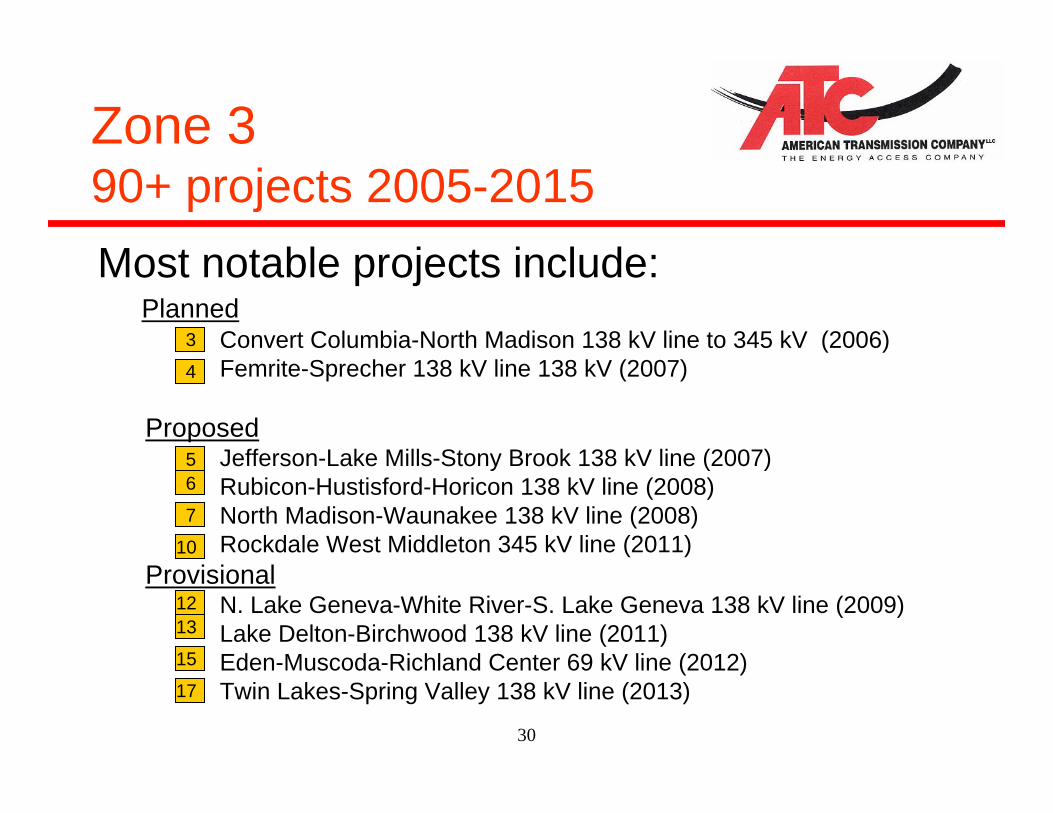
Zone 3 90+ projects 2005-2015Most notable projects include:
PlannedConvert Columbia-North Madison 138 kV line to 345 kV (2006)Femrite-Sprecher 138 kV line 138 kV (2007)
ProposedJefferson-Lake Mills-Stony Brook 138 kV line (2007)Rubicon-Hustisford-Horicon 138 kV line (2008)North Madison-Waunakee 138 kV line (2008)Rockdale West Middleton 345 kV line (2011)
ProvisionalN. Lake Geneva-White River-S. Lake Geneva 138 kV line (2009)Lake Delton-Birchwood 138 kV line (2011)Eden-Muscoda-Richland Center 69 kV line (2012)Twin Lakes-Spring Valley 138 kV line (2013)
3
4
56
7
10
1213
15
17

31
Zone 4 – Northeast WisconsinGrowth projections
Population: 0.8% from 2005-2010Employment: 1.2% from 2005-2010
Environmental considerationsMajor lakes: Michigan and WinnebagoState forests and Horicon National Wildlife Refuge
Electricity demand and generationExpected load growth: 2.5% from 2006-2014
2006 peak load is 3,251 MWMore generation than peak loadNet exporter during lighter load periods

32
Zone 4 system conditions2006
Green Bay area is severely congestedVoltage problems in Door CountySeverely limited import capability between Wisconsin and Upper Peninsula
2010Low import capability into Manitowoc areaMorgan-Werner West provides an “electrical bypass” of Green Bay relieving the overloaded facilities (2009)Canal-Dunn Road 138 kV improves Door County voltages, but not completely (2008)Stiles-Amberg double circuit 138 kV line rebuild addresses facilities in poor condition and transfer capability between Wisconsin and Upper Peninsula (2006)

33
Zone 4 system conditions
2014Continuing voltage problems in Door CountyDunn Road-Egg Harbor 69 kV line further improves Door County voltage problems (2010)Pulliam-Suamico-Sobieski-Pioneer 69 kV rebuild and 138 kV conversion projects address facility overloads, load serving issues and facilities in poor condition (2008/2015)

34
Zone 440+ projects 2005-2015
Most notable projects include:Planned
Werner West 345/138 kV Substation (2006)Stiles-Amberg double circuit 138 kV line rebuild (2006)Morgan-Werner West 345 kV line & Clintonville-Werner West 138 kV line (2009)
ProposedCanal-Dunn Road 138 kV line (2008)Dunn Road-Egg Harbor 69 kV line (2010)
ProvisionalPulliam-New Suamico 69 kV line rebuild & conversion to 138 kV New Suamico-Pioneer 69 kV line rebuild & conversion to 138 kV (2015)
4
3
5
6
7
813

35
Zone 5 – Southeast WisconsinGrowth projections
Population: 0.5% from 2005-2010Employment: 1.0% from 2005-2010
Environmental considerationsMost densely populated zoneAgricultural land use is commonLake Michigan, major rivers and Kettle Moraine State Forest
Electricity demand and generationExpected load growth: 1.6% from 2006-2014
2006 peak load is 4,728 MWMore generation than peak loadNet exporter during lighter load periods

36
Zone 5 system conditions2006
Continued load growth in Waukesha, Washington and Jefferson counties driving need for voltage supportNew generation in greater Milwaukee area will drive many system improvements within next decadeWaukesha-Duplainville-Sussex 138 kV line constructed in 2005 addresses load serving and voltage support issues in Sussex area
2010Weak 138 kV network in Waukesha, Washington, and Jefferson needs supportCornell-Range Line and St. Lawrence-Pleasant Valley-Saukville 138 kV line rebuild addresses facility condition and overloads related to new generation at Port Washington (2008) Looping Ramsey-Harbor 138 kV line into Kansas and Norwich substations creating Kansas-Harbor and Ramsey-Norwich lines relieves overloads related to new generation at Oak Creek (2009)
37
Zone 5 system conditions2014
Transmission additions and modifications required by new Port Washington and Oak Creek generation projects removed most overloads and low voltages seen in 2006 and 2010Twin Lakes-Spring Valley line will improve the Lake Geneva area and provide support to the far southwest part of Zone 5 (2013)Rockdale-Concord-Bark River-Mill Road 345 kV line along with Bark River and Concord substation expansions for 345 kV facilities and 345/138 kV transformation addresses (2011)
Voltage profiles in Jefferson, Waukesha and Washington countiesReduces loading on weak parallel 138 kV network Reduces system losses andIncreases east-west transfer capability

38
Zone 5 projects30+ projects 2005-2015
Most notable projects include:
PlannedCornell-Range Line and St. Lawrence-Pleasant Valley-Saukville 138 kV line reconductor (2008)Expand 345/230/138 kV Substations at Oak Creek (2009)Convert Bark River-Mill Road 138 kV line to 345 kV (2011)
ProposedExpand Hale (Brookdale) Substation (2013)Loop Zion-Arcadian 345 kV line into Pleasant Prairie Substation (2013)Oak Creek-Hale-Granville 345 kV line (2013)
1
2
3
4
5
6
7

39
Major projects indesign or under construction
Zone 4Uprate North Appleton-Rocky Run 345 kV line
Zone 3Convert Columbia-N. Madison 138-kV to 345 kV operation
Zone 2Rebuild and convert one Hiawatha-Indian Lake 69 kV line to double circuit 69 kV
Zone 1Gardner Park (Weston) 345/115 kV Substation
Zone 1Arrowhead-Gardner Park (Weston) 345 kV lineAreaProject

40
Major projects fully approved by PSC
* Approved but not yet under construction
Zone 4Werner West 345/138 kV substation
Zone 3Turtle-Bristol 69 kV line rebuild to 138 kV and operated at 69 kV
Zone 3Sprecher-Femrite 138 kV line
Zone 3N. Beaver Dam-E. Beaver Dam 138 kV lineAreaProject *

41
Major projectsawaiting regulatory approval
Zone 4Morgan-Werner West 345 kV line and Werner West-Clintonville 138 kV line
Zone 3Jefferson-Lake Mills-Stony Brook 138 kV line
Zone 1&2Cranberry-Conover 115 kV line and rebuild/convert Conover-Plains to 138 kV operation
Zone 1West-Serman St.-Hilltop 115 kV line to double-circuit 115 KV
Zone 1Gardner Park-Central Wisconsin 345 lineAreaProject

42
Major projects eliminated
Oak Creek Study Results52014
Replace 22 138 kV over-dutied breakers at Harbor, Everett and Haymarket substations
Oak Creek Study Results52012
Expand 345 kV switchyard at Bain Substation and string Bain-Racine 345 kV circuit
Oak Creek Study Results52009Replace 138 kV over-dutied
breakers at Bluemound SS
Oak Creek Study Results52009
Install two 345 kV series breakers at Pleasant Prairie on lines to Racine and Zion
Another alternative selected (Bain) 52006Reconfigure 345 kV bus at Pleasant
Prairie
Reasonfor Removal
PlanningZone
Former In-service
dateProjects Cancelled

43
Cost estimatesEstimated capital costs
2004* 2005TYA TYA
Asset renewal $163 $238 MillionGeneration interconnections $167 $339 MillionDistribution interconnections $242 $234 MillionInfrastructure relocation $3 $4 MillionNetwork $2143 $2411 MillionProtection and control $87 $83 MillionTotal $2.8 3.4 BillionTotal for projects in TYA $2.1 2.4 Billion
* Values same in 2004 TYA Update

44
Reasons for cost increasesIncreases in the cost of steel and construction laborRevisions to planned, proposed and provisional projects based on current analyses Start-up of new, large projects

45
Project prioritizationindex: factors considered
Safety/service restorationSystem reliability/securityRegulatory mandatesLoad serving/interconnectionTransaction limit alleviationStrategic expansionInfrastructure updateIn-service dateCascading outageEquipment damage/loss of loadReduced redispatch/transmission load relief mitigation

46
Transmission Business Briefing
Questions?

47
2005 Transmission Business Briefing