2005 water quality annual report - northwestern...
TRANSCRIPT

U.S. Army Corps of Engineers Northwestern Division
Columbia Basin Water Management Division Portland, Oregon
2005
Water Quality Annual Report
Prepared with input from: Columbia Basin Water Management Division
Portland District Seattle District
Walla Walla District


Table of Contents
1. Executive Summary 6
2. Water Quality Management Program 8
2.1. Introduction 8
2.2. Organization and Coordination 8 2.2.1. Assigned Responsibilities 10 2.2.2. Collaboration with Corps Labs and Centers of Expertise 12 2.2.3. Coordination through National Corps Communities of Practice 13 2.2.4. Cooperation with Other Agencies and Groups 13
3. Northwestern Division Columbia Basin 13
3.1. Key Northwestern Division (NWD) Policy Issues on Total Maximum Daily Loads (TMDLs) and Use Attainability Analysis (UAA) 13
3.1.1. Regulation Changes 14
3.2. Columbia Basin Water Management Division (CBWMD), Reservoir Control Center Activities 15
3.2.1. Introduction 15 3.2.2. Summary of Water Quality Conditions, Data Collection and Analysis and Other Activities/Investigation 16 3.2.3. Spill management of the Lower Columbia and Snake Rivers 16 3.2.4. TDG and Temperature Monitoring of the Columbia and Snake Rivers 17 3.2.5. TDG Modeling 17 3.2.6. Temperature Modeling 17 3.2.7. Water Quality Data Management 17 3.2.8. Total Maximum Daily Loads (TMDLs) 18 3.2.9. Use Attainability Analysis (UAA) 18 3.2.10. Regional Coordination of Water Quality Issues 18 3.2.11. Laboratory and Field Equipment and Technical Capabilities 19 3.2.12. Data Management Activities 19 3.2.13. Water Quality Reports 20 3.2.14. Meeting, Conferences and Training 20 3.2.15. Training Attended in FY05 20 3.2.16. Required/Recommended Future Training for FY06 20 3.2.17. Personnel and Expenditures 21 3.2.18. In House Expenditures 21 3.2.19. Contracts 21 3.2.20. Special Coordination with other Corps Entities 21 3.2.21. CBWMD, RCC Water Quality Unit Summary 21
1

4. Portland District Activities 22
4.1. Introduction: 22
4.2. Summary of Water Quality Conditions, Data Collection and Analysis, and other Activities/Investigations 23
4.2.1. Bonneville, The Dalles, John Day Dams and the SRS 24 4.2.2. Applegate and Lost Creek Dams 24 4.2.3. Blue River and Cougar Dams 25 4.2.4. Cottage Grove Dam 26 4.2.5. Detroit and Big Cliff Dams 26 4.2.6. Dexter Dam 26 4.2.7. Fern Ridge Dam 26 4.2.8. Green Peter and Foster Dams 26 4.2.9. Hills Creek Dam 26 4.2.10. Lookout Point Dam 27 4.2.11. Willow Creek Dam 27 4.2.12. TMDL Activities 29
4.3. Laboratory and Field Equipment, and Technical Capabilities 29
4.4. Regulation Changes 30
4.5. Data Management Activities 30
4.6. Water Quality Reports 30
4.7. Meetings, Conferences, and Training 31 4.7.1. Attended FY05 31 4.7.2. Required/Recommended Future Training for In-House Staff Members 31
4.8. Personnel and Expenditures 31 4.8.1. In-House Expenditures 31 4.8.2. Contracts 32
4.9. Special Coordination with other Corps Entities 32
4.10. Portland District Summary 32
5. Seattle District Activities 33
5.1. Introduction 33
5.2. Summary of Water Quality Conditions, Data Collection/Analysis and other Activities/Investigation 34
5.2.1. Chief Joseph Dam and Lake Rufus Woods 35 5.2.2. Libby Dam and Lake Koocanusa 37 5.2.3. Albeni Falls Dam and the Pend Oreille River 38
2
5.2.4. Howard A. Hanson Dam and the Green River 40 5.2.5. Lake Washington Ship Canal and Hiram Chittenden Locks 41 5.2.6. Mud Mountain Dam and the White River 42 5.2.7. Wynoochee Dam 43 5.2.8. TDG Fixed Monitoring Program 43 5.2.9. TMDL Updates 44
5.3. Laboratory and Field Equipment, and Technical Capabilities 45
5.4. Regulation Changes 46
5.5. Data Management Activities 46
5.6. Water Quality Reports 47
5.7. Meetings, Conferences, and Training 47 5.7.1. Participation in FY05 47 5.7.2. Required/Recommended Future Training for In-House Staff 48
5.8. Personnel and Expenditures 48 5.8.1. In-House Expenditures 48 5.8.2. Contracts 48
5.9. Special Coordination with other Corps Entities 49
5.10. Seattle District Summary 49
6. Walla Walla District Activities 51
6.1. Introduction 51
6.2. Water Quality Conditions, Data Collection/Analysis and Activities/Investigations 52 6.2.1. McNary Project and Reservoir 52 6.2.2. Ice Harbor Project and Reservoir 53 6.2.3. Lower Monumental Project and Reservoir 53 6.2.4. Little Goose Project and Reservoir 54 6.2.5. Lower Granite Project and Reservoir 54 6.2.6. Dworshak Project and Reservoir 55 6.2.7. Mill Creek and Virgil B. Bennington Lake 56 6.2.8. Lucky Peak Reservoir (Boise River) 56 6.2.9. Lewiston Levees 56 6.2.10. TDG Fixed Monitoring Program 56
6.3. Laboratory and Field Equipment and Technical Capabilities 57
6.4. Regulation Changes 57
6.5. Data Management Activities 57
3
6.6. Water Quality Reports 57
6.7. Meetings, Conferences and Training 58 6.7.1. Training Attended in FY04 58 6.7.2. Required/Recommended Future Training for In-House Staff 58
6.8. Personnel and Expenditures 58 6.8.1. In House Expenditures 58 6.8.2. Contracts 59
6.9. Special Coordination with other Corps Entities 59
6.10. Walla Walla District Summary 59
6.11. Water Quality Objectives for Next Year: 2006 60
7. Summary 61
7.1. Summary of Personnel 61
7.2. Summary of Projects 61
7.3. Summary of Contracts 63
4

List of Acronyms The following acronyms are used throughout this report: BiOP – Biological Opinion BPA – Bonneville Power Administration CBWMD – Columbia Basin Water Management Division CROHMS- Columbia River Operational Hydromet System CWA – Clean Water Act CWMS – Corps Water Management System DCP – Data Collection Platform EPA – Environmental Protection Act ER – Engineering Regulations ERDC - Engineer Research and Development Center FMS – fixed monitoring station FTE – Full Time Employee HEC – Hydrologic Engineering Center NMFS – National Marine Fisheries Service NOAA Fisheries - National Oceanic and Atmospheric Agency, Fisheries (formerly NMFS) NPDR – North Pacific Division Regulations NWD – Northwestern Division NWP – Portland District NWW – Walla Walla District NWS – Seattle District RCC – Reservoir Control Center SYSTDG – System Total Dissolved Gas TDG – total dissolved gas TMDL – Total Maximum Daily Load TMT – Technical Management Team UAA - Use Attainability Analysis USFS – United States Forest Service USGS – United States Geological Survey WDOE – Washington Department of Ecology WQ – Water Quality
5
1. Executive Summary This report on the 2005 Water Quality Program was prepared in conformance with ER 1110-2-8154 and NPDR 1110-2-101. This report focuses on water quality and includes some sediment quality as is appropriate. The report only covers programs and activities within the Columbia Basin of the Northwestern Division (Portland, Seattle and Walla Walla Districts). 2005 regional highlights for the Columbia Basin of the Northwestern Division include the following:
• There were 11.0 FTEs working in Water Quality programs in the Columbia Basin achieving a wide array of objectives and goals, as described in this report.
• Columbia Basin Water Quality Management Program contracts totaled $1.84 Million. • The Columbia Basin Water Management Division’s (CBWMD) Reservoir Control
Center (RCC), Water Quality Unit applied for and obtained a multiyear Total Dissolved Gas (TDG) variance from the state of Washington. This variance will remain in effect through February 2008. A 5-year TDG waiver from the State of Oregon was issued in 2003.
• The Reservoir Control Center, Water Quality Unit assisted in coordination for the development of a new Oracle-based Columbia Water Management System database system (Oracle-CWMS). Since full conversion to this new database system has not yet occurred, the Division is continuing to use the existing Columbia River Operational Hydrological Management System (CROHMS, a CDB-DSS database system).
• The RCC Water Quality Unit successfully used the SYSTDG model during the 2005 spill season. Also, additional tools were developed to calculate new values needed in forecasting TDG level and potential future modifications were identified.
• The RCC Water Quality Unit successfully managed the spill on the Columbia and Snake Rivers.
• The RCC Water Quality Unit conducted temperature modeling on the Dworshak reservoir to assist TMT in their decisions on how to use the 80ft water releases.
• The RCC Water Quality Unit participated in coordination related to various issues including TMDL’s, UAA’s, total dissolved gas, and water temperature through regional forums.
• Portland District successfully installed and operated aeration equipment at Willow Creek reservoir that improved water quality conditions at the lake, including higher dissolved oxygen levels, and lower methane, hydrogen sulfide, and nutrient concentrations. Monitoring will continue in 2006.
• Portland District completed the CE-QUAL-W2 temperature models for Hills Creek, Lookout Point, and Dexter reservoirs. Models are being developed for Green Peter, Foster, and Willow Creek reservoirs. Portland District continues their efforts to be consistent with State TMDL requirements and evaluate future BiOp requirements.
• Portland District worked on improving operations of the Selective Withdrawal Tower at Cougar reservoir to benefit downstream fish by meeting temperature requirements.
• Portland District continued follow-up real-time TDG monitoring and temperature data collection at the Columbia River projects. Regular water quality monitoring continued at several Willamette and Rogue projects.
6

• The Portland District reviewed the draft Willamette Basin TMDL for temperature, bacteria, and turbidity within the Willamette System and temperature in the Rogue System and provided comments to the Oregon DEQ. Refer to section 4.2.12.
• The Portland District continued the collection of temperature data at selected sites below Lost Creek and Applegate reservoirs to obtain data on downstream impacts to water temperature.
• The Seattle District continued routine water quality sampling at Howard Hanson Dam (Howard Hanson Reservoir and the Green River).
• The Seattle District continued real-time data collection of temperature and salinity in the Lake Washington Ship Canal to assist in operational decisions of the locks for control of saltwater intrusion into Lake Washington.
• The Seattle District continued to monitor total dissolved gas (TDG) at five (5) permanent sites located at the forebay and tailwater of Chief Joseph Dam, the forebay and tailwater of Albeni Falls Dam, and the tailwater of Libby Dam.
• The Seattle District continued a temperature study at Libby Dam forebay to assess the accuracy of the automated temperature string on the face of the dam.
• The Seattle District continued a water temperature study upstream and downstream of Albeni Falls Dam to establish baseline information for the Pend Oreille River system and Lake Pend Oreille for future TMDLs, and to study how Albeni Falls Dam may impact the Pend Oreille River system.
• The Seattle District implemented a water quality monitoring program at Albeni Falls Dam to establish baseline information on the physical, chemical, and biological conditions of the Pend Oreille River and Lake Pend Oreille.
• Walla Walla District managed the operation and data collection for sixteen fixed monitoring stations (FMS) for TDG, barometric pressure and temperature. Stations are located at Dworshak Dam tailwaters, in the forebay and tailwaters of the four Lower Snake River dams, at McNary Dam forebay and tailwater on the Columbia River and on the Clearwater River.
• Walla Walla District performed a comprehensive review and evaluation of TDG monitoring stations that resulted in recommendations for remedial measures with respect to producing high quality objective data. Based on this work, the forebay fixed monitoring sites at McNary Dam, Ice Harbor, Lower Monumental, and Little Goose Dams were relocated, and at Lower Granite was placed deeper, prior to the start of the 2005 spill season. These station relocations are intended to avoid thermal influences that are experienced on the face of the dams. Also, as a result of the studies, Walla Walla recommended that the McNary Oregon site is to be discontinued at the end of 2005.
• Walla Walla District provided technical assistance for data collection strategies with emphasis on evaluating water temperature effects from alternative river operations and providing data input for a working model. Water temperature data was collected at various pool locations in the Snake River Dam Reservoirs, Dworshak Reservoir and also in Snake River tributaries. Meteorological data, discharge and temperature data was summarized. Data evaluations were made based on heat flux and temperature variability.
• The Walla Walla District performed temperature monitoring continued as part of a multi-phase study to characterize temperature regimes and determine effects of temperature differentials on fish passage in adult fishways at McNary and the four Lower Snake River Dams.
7

• Walla Walla District’s water quality section conducted water quality and limnological sampling at District reservoirs, and ponds. Technical assistance was provided for water and wastewater programs at Lower Granite and Little Goose Dams.
2. Water Quality Management Program
2.1. Introduction The U.S. Army Corps of Engineers (Corps) Northwestern Division (NWD) covers the largest geographical area of any division, spreading over 12 states and managing two major river basins. There are two regions and five districts in NWD: The Columbia Basin portion of NWD focuses on the Columbia Basin its tributaries and is comprised of the Columbia Basin Water Management Division (CBWMD) and the three districts: Portland, Oregon; Seattle, Washington; and Walla Walla, Washington. The Missouri River Basin Region focuses on the Missouri River basin and its tributaries and is comprised of two districts: Omaha, Nebraska; and Kansas City, Missouri. This report covers only the water quality programs associated with the Columbia Basin, and as a result, covers only CBWMD, and Portland; Seattle and Walla Walla Districts’ water quality activities. Omaha and Kansas City Districts submit a separate Annual Water Quality Report covering the water quality program in the Missouri River Basin. The Corps’ Water Quality Program is described in two main Engineering Regulations (ER): ER1110-2-8154 Water Quality and Environmental Management for Corps Civil Works Projects (January 31, 1995) and ER 1110-2-1462 Water Quality and Water Control Considerations for Non-federal Hydropower Development at Corps of Engineers Projects (February 20, 1991). There are other engineering regulations that include water quality indirectly, such as ER 15-2-14 and ER 1130-2-540. This report conforms to ER 1110-2-8154, and with NPDR 1110-2-101, Water Control Management - Quality, dated December 19, 1986.
2.2. Organization and Coordination The NWD Columbia River Basin water quality program is divided into four sections: The Water Quality Unit at the Columbia Basin Water Management Division (CBWMD) Reservoir Control Center (RCC); Portland District; Walla Walla District and Seattle District. The Water Quality Unit in RCC is responsible for water quality issues associated with spill for fish passage on the Columbia and Snake Rivers. This effort crosses three district boundaries, four state lines, numerous tribal reservations, and one international border. As a result, the Water Quality Unit addresses water quality issues regionally and coordinates with other federal and state agencies on various water quality issues that affect the Columbia and Snake Rivers. The Portland District covers most of the state of Oregon (except for the easternmost portion of the State) and a portion of southwest Washington. Walla Walla District covers most of the state of Idaho, the easternmost part of Oregon, and the southeastern part of Washington. Seattle District covers most of Washington, northwestern Montana and northern Idaho. At the district level, all three NWD Columbia Basin districts are assigned broad responsibilities in developing and implementing water quality management programs as outlined in the
8
Engineering Regulations. The water quality management programs can be divided into six major areas and they are:
1. Water Quality Monitoring - water quality monitoring for problem specific and routine activities.
2. Construction – Construction related studies to establish baseline conditions before construction and then compare water quality conditions after construction.
3. Environmental Restoration – Water quality activities related to environmental restoration planning studies and activities.
4. Clean Water Act and Endangered Species Act Issues – Water quality activities associated with these laws (see ER, Engineering Technical Letter and the 2004 Biological Opinion and Remand)
5. Planning Assistance to States - Water quality activities associated with cost sharing programs with the states to achieve common goals such as data collection for Total Maximum Daily Loads (TMDLs).
6. Restoration of Abandoned Mines (RAMS) – Water quality activities associated with restoration of abandoned mines or the effects of mining waste on rivers.
Districts are responsible for identifying and monitoring the water quality of their projects, especially in sensitive areas or where environmental regulations exist. They inform state and federal agencies of any water quality changes that may be of concern. They report emergency events to the Division’s Readiness Management (Operations, Construction & Readiness Directorate). Some of their water quality activities overlap with other programs, such as the Defense Environmental Restoration Program and EPA Superfund Program. Water quality problems that can be resolved through reservoir operations are reported to RCC for appropriate actions. Primary responsibility for reservoir water quality programs rests within the Engineering Hydrology and Hydraulics Branch. The Portland District Reservoir Control and Water Quality Section manages the Districts’ water quality program and resides within the Engineering Hydrology and Hydraulics Branch. The Seattle District Water Management Section manages the NWS water quality program and resides within the Technical Services Branch and Engineering and Construction Division. In Walla Walla District, the Engineering Hydrology and Hydraulics Branch and Operations Natural Resource Management Section through their Environmental Compliance Coordinators (Environmental Review Guide for Operations Coordinators) deal with water quality issues. All NWD Columbia Basin districts have direct access to the Corps Engineer Research and Development Center (ERDC) in Vicksburg, MS and the Hydrologic Engineering Center (HEC) in Davis, CA for physical and mathematical modeling support. Each district reports its water quality activities annually to the Northwestern Division, CBWMD for review, synthesis, reporting and posting on the Internet.
9

2.2.1. Assigned Responsibilities
2.2.1.1. Columbia Basin Water Management Division Responsibilities The CBWMD, RCC Water Quality Unit covers the states of Oregon, Washington, Idaho and Montana. The RCC Water Quality Unit is responsible for addressing water quality issues in two of the six major areas listed above and they are: Water Quality Monitoring and Clean Water Act and Endangered Species Act. The following is a brief discussion of the RCC Water Quality Unit involvement in these areas:
• Water Quality Monitoring - The RCC Water Quality Unit negotiates, reviews and assists in establishing regional consensus and approval on the locations and representativeness of the TDG Fixed Monitoring Stations (FMS). The RCC Water Quality Unit also ensures that the real time water quality data is managed so that it is available for use in real time operations. The RCC Water Quality Unit ensures that the web reports from the CROHMS and CWMS databases are being posted every morning.
• Clean Water Act and Endangered Species Act issues - The RCC Water Quality Unit uses the TDG FMS data to set spill levels at nine dams to facilitate the migration and survival of endangered fish in the Columbia and Snake Rivers. The RCC Water Quality Unit negotiates reviews and assists in establishing regional consensus on Total Maximum Daily Loads (TMDLs) for TDG and temperature. The RCC Water Quality Unit also gathers and reports the resulting TDG and Temperature data from all three districts in the Annual TDG and Temperature Report which is published primarily for the States. There are also other reports prepared by the RCC WQ Unit.
2.2.1.2. Portland District’s Responsibilities The Portland, Oregon District covers most of the state of Oregon, except for eastern Oregon. Portland District is responsible for addressing various types of water quality issues in the six major areas listed above. The following is a brief discussion of the areas the districts involvement is in:
• Water Quality Monitoring - Portland District maintains the total dissolved gas monitoring system for three large dams on the Columbia River (Bonneville; The Dalles and John Day). They also collect samples, perform studies and maintain monitoring systems for temperature and turbidity on several rivers in Oregon such as the Willamette, Toutle, Santiam, McKenzie and Rogue Rivers and also Willow Creek.
• Construction Related Studies – Portland District provided funding to USGS to collect turbidity data from Fern Ridge Dam. This data was required by DEQ for the emergency construction permit to rebuild Fern Ridge Dam’s drainage system in the embankment.
• Environmental Restoration - Portland District has performed environmental restoration planning studies and restoration activities. The District is preparing for a future Sediment Retention Structure (SRS) temperature study by locating possible sites for the temperature loggers on the Toutle River near the SRS.
• Clean Water Act and Endangered Species Act issues – Portland District conducts routine water quality monitoring at projects and, in the future will be involved in TMDL and ESA studies and monitoring.
10
• Planning Assistance to States - Portland District performed shared cost studies to collect temperature data to assist the states in establishing temperature TMDLs.
• Restoration of Abandoned Mines - Portland District can provide State DEQ with cost shared funding for abandoned mine clean-up studies.
2.2.1.3. Seattle District’s Responsibilities Seattle District covers most of Washington, northern Idaho, and northwestern Montana. The following is a brief discussion of the District’s involvement in the six areas:
• Water quality monitoring - Seattle District is responsible for the TDG and temperature monitoring system for three dams in the Columbia Basin: Chief Joseph Dam on the Columbia River, Albeni Falls Dam on the Pend Oreille River; and Libby Dam on the Kootenai River. The District also conducts water quality monitoring for various chemical and biological parameters including, conventionals nutrients, metals, phytoplankton, and zooplankton at several reservoirs and rivers in Washington Idaho, and Montana.
• Construction related studies - The District’s water quality team provides technical expertise in regards to water quality issues that may be involved in various COE construction projects. When necessary, they also design and implement monitoring and sampling programs for these projects.
• Environmental restoration - Seattle District provides water quality assistance to environmental restoration projects whenever necessary.
• Clean Water Act and Endangered Species Act issues - Seattle District is involved in various water quality monitoring programs to ensure that all projects operate in accordance with the Clean Water Act and the Endangered Species Act. Further details are described in section 5.
• Planning assistance to states - The Seattle District performed no shared cost studies to assist the states.
• Restoration of abandoned mines - The Seattle District currently has one project funded through the Corps Restoration of Abandoned Mine Sites (RAMS) program, and attends RAMS meetings. The District continues to be an active participant in the RAMS program.
2.2.1.4. Walla Walla District’s Responsibilities Walla Walla District covers most of the state of Idaho, the eastern most part of Oregon, and the southeastern part of Washington. Walla Walla District is responsible for addressing various types of water quality issues in three of the six major areas listed above. The following is a brief discussion of the districts involvement in the three areas:
• Water Quality Monitoring - Walla Walla District is responsible for the Total Dissolved Gas (TDG) monitoring system for six dams: one large dam on the Columbia River (McNary); one on the Clearwater River (Dworshak) and four on the lower Snake River (Lower Granite; Little Goose; Lower Monumental; and Ice Harbor). District water quality personnel cooperate with the Pasco Office of the United States Geological Survey (USGS) to operate 16 TDG monitoring stations. Eight of the stations are operated year round and the balance of these operates from 1 April to 15 September. All
11

sixteen stations transmit data via the Geostationary Orbiting Environmental System (GOES) satellite system. The parameters include total gas pressure, temperature, and depth of instrument (stage). The District also collects water samples, performs studies and maintains monitoring systems for temperature and turbidity on several rivers in Oregon, Washington, and Idaho.
• Construction Related Studies - Walla Walla District prepared a water quality statement of work for the 2006 Maintenance dredging program in the Lower Granite Reservoir.
• Environmental Restoration - Walla Walla District had no water quality related environmental restoration projects in FY05.
• Clean Water Act and Endangered Species Act issues - Walla Walla District Planning section maintains compliance with the Clean Water Act and Endangered Species Act. Their activities include consultation, coordination, obtaining permits and clearances. The District also provided expert testimony and affidavits in support of litigation involving environmental issues and water quality. The water quality staff performed studies and provided results in support of the settlement related to the Lewiston Levees.
• Planning Assistance to States - Walla Walla District performed no shared cost studies to assist the states.
• Restoration of Abandoned Mines - Walla Walla District discussed restoration of some Idaho mines in previous years but nothing has become of it.
2.2.2. Collaboration with Corps Labs and Centers of Expertise The Water Quality Unit in the Reservoir Control Center collaborates with Dr. Michael Schneider of the Engineer Research and Development Center (ERDC) on the further development of the total dissolved gas model called SYSTDG that estimates production, fate, and transport of total dissolved gas on the Columbia and Snake Rivers. The SYSTDG development included updates of the model users. Dr. Schneider also provides continued training on the SYSTDG model. The RCC Water Quality Unit’s collaboration with Dr. Schneider also involved using his expertise in CE-QUAL-W2 temperature model. The Portland District collaborated with Dr. Michael Schneider of the ERDC whom prepared the Total Dissolved Gas Characterization of the Lower Columbia River below Bonneville Dam report. The Portland District and Dr. Schneider also met to discuss temperature management issues at Applegate reservoir and how to proceed with the scoping/planning process related to the UAA. The Seattle District collaborated with Dr. Michael Schneider of the ERDC on the development of a temperature profile model at Libby Dam. The Seattle District obtained a Water Operations Technical Support (WOTS) grant in 2005 from ERDC for Dr. Schneider to develop a model that will evaluate temperature profile characteristics at Libby Dam for the management of the selective withdrawal system to provide downstream water temperatures to benefit the Endangered Kootenai River White Sturgeon spawning and survival. The model was not finalized in 2005 and additional WOTS support will be requested by the Seattle District in 2006 to finish the modeling project. The water quality group at Walla Walla District contracted ERDC for three tasks. First, Drs. Todd Bridges, Jeffrey Stevens, and June Mirecki completed a probabilistic risk assessment regarding pumpage from four Lewiston, Idaho levee ponds into the Clearwater River and their
12

potential impact on endangered salmonids. Dr. Michael Schneider received funding for two projects. One was to continue development of the SYSTDG model as part of RPA 133 to include data screening filters and statistical tests, as well as refinement of existing equations used to predict in-river TDG concentrations. Second, Dr. Schneider expanded the spatial application of CEQUAL-W2 as part of RPA 143 to include Dworshak Reservoir and the Snake River to Hells Canyon Dam.
2.2.3.
2.2.4.
Coordination through National Corps Communities of Practice Jim Adams, Water Quality Unit Team Leader, RCC and David Ponganis, Senior Environmental Specialist with the District Support Team at NWD Portland, represents the NWD Columbia Basin Region at one national Corps committee, the Corps’ Committee on Water Quality. The District water quality specialists have not been directly involved in national corps committees.
Cooperation with Other Agencies and Groups District and Division staffs routinely coordinate with Federal, State, and local agency environmental quality counterparts. The listing of twelve Pacific salmon species under the Endangered Species Act (ESA) has made this coordination critical since the Corps is responsible for the operation of its project for multiple purposes. All water users have a vested interest in what operation is being planned by the Corps, where, when, and how. Columbia Basin Water Management Division’s Water Quality Unit of the RCC, plays an active role in implementing the spill measures contained in the Action Agency’s UPA and NOAA Fisheries 2004 Biological Opinion. There is continual dialogue between RCC and the Bonneville Power Administration (BPA), U.S. Bureau of Reclamation, Public Utility Districts, state and federal fishery agencies and Indian Tribes. The RCC makes all final reservoir regulation decisions and spill changes, frequently based on recommendations from the Technical Management Team (TMT), a mid-management level group set up by NOAA Fisheries in 1995 and chaired by the Corps representative. Walla Walla District (NWW) studies of sediment pollution for dredging activities were performed in cooperation with the United States Environmental Protection Agency (EPA) and the state of Washington Department of Ecology (WDOE). The NWW has water quality personnel in key positions on the Regional Sediment Evaluation Team (RSET). This is a multi-agency interstate work group dedicated to the production of a regional sediment evaluation framework document. Coordination with the WDOE, State of Idaho Division of Environmental Quality (IDEQ), NOAA Fisheries, and ODEQ is performed for NPDES permitting activities.
3. Northwestern Division Columbia Basin
3.1. Key Northwestern Division (NWD) Policy Issues on Total Maximum Daily Loads (TMDLs) and Use Attainability Analysis (UAA) ISSUE: The Clean Water Act (CWA) provides for the states to set water quality standards and for water bodies not meeting state’s standards, development of Total Maximum Daily Load (TMDLs), which are load allocations assigned to pollutant contributors. There are several draft and final TMDLs in the Pacific Northwest where there are no feasible solutions to meet the load
13
reduction in water temperatures allocated to Corps dams. There is continued interest by ASA (CW), HQUSACE, Bureau of Reclamation HQ and EPA HQ to develop guidance on how to address federal dams not meeting state water quality standards and conducting pilot projects within Oregon as a national demonstration that state water quality standards can be modified in an efficient and expedited manner to be consistent with congressionally authorized project purposes. NWD is working with ASA (CW), USACE, EPA, Reclamation and Oregon Department of Environmental Quality (ODEQ) to develop guidance and initiate a pilot application of the process. This could result in modification of the state water quality standard consistent with the congressionally authorized project uses. CURRENT STATUS: • The CWA regulations at 40 CFR 131.10 provide for conducting a Use Attainability Analysis
(UAA). 40 CFR 131.10(g)(4) provides for creating a sub-category use when attainment of a use is not “feasible” because of dams.
• ODEQ convened a workgroup of Federal, state, and tribal representatives, as well as stakeholders, including environmental, industry, and agriculture interests, to develop internal ODEQ guidance on how to conduct a UAA. EPA, Reclamation and Corps developed a common definition of feasibility in May 2005 as guidance to the ODEQ. ODEQ released the guidance for public review in summer 2005.
• NWP, NWD, and ODEQ have agreed to use Applegate Dam as a pilot project. In January 2006, the Corps, EPA and ODEQ met to further discuss Applegate as a pilot project. Agencies agreed to develop options on next steps.
• In February 2006, EPA is disapproving some of the State of Washington’s proposed water temperature standards. At least one Corps project will be subject to more stringent temperature standards. EPA Region X is considering a regional workshop to address the issue of dams and attainability of state water temperature standards.
BACKGROUND: Many of the Corps dams/reservoirs in Oregon and Washington cannot attain the states’ temperature standards by virtue of their existence and the resultant heat input from the sun. Regarding water temperature, a TMDL has been issued for the Applegate Dam, a draft TMDL for the Willamette Basin dams, and a preliminary draft TMDL for the Columbia and Snake rivers dams. All TMDLs allocate a reduction in water temperature to Corps dams. There is no feasible operation or modification of these projects to achieve the allocated load reductions. This issue was raised to HQUSACE and ASA(CW) in 2002 as a national issue.
3.1.1. Regulation Changes In 2003, the National Wildlife Federation (NWF) sued NOAA Fisheries and challenged NOAA Fisheries 2000 BiOp on operation of the Federal Columbia River Power System (FCRPS) for salmon and steelhead. In the May 7, 2003, federal court decision, Portland-based U.S. District Court Judge Redden found the 2000 BiOp for the FCRPS did not adequately define the Action Area (the area affected by the federal hydro system) and did not adequately assure that offsite mitigation measures will occur. The court remanded the 2000 BiOp to NOAA Fisheries to correct the flaws.
14
On November 30, 2004 NOAA Fisheries issued a new biological opinion (BiOp) on operations of the Federal Columbia River Power System (2004 BiOp). The BiOp assessed the activities set forth in the Action Agencies (Corps, Bonneville, and Reclamation) Updated Proposed Action (UPA), November 24, 2004, upon which the revised BiOp is based. The Final BiOp and UPA were refined in response to comments received on NOAA Fisheries' draft BiOp and the Action Agencies draft UPA. The Final BiOp and UPA guide the 2005 spill and operations of the Federal Columbia River Power System. In the December 16, 2005 federal court decision, Portland-based U.S. District Court Judge Redden found the 2004 BiOp for the FCRPS to be inadequate and required the federal agencies (Corps; NOAA Fisheries and Bureau of Reclamation) to develop a BiOp that would meet the court’s concerns. Efforts will continue through 2006 to develop the new BiOp. During 2005, the National Wildlife Federation, State of Oregon and CRITFC sued NOAA Fisheries and the Corps challenging NOAA Fisheries 2004 BiOp regulations on the summer spill operations at McNary and the Snake River projects. In June 2005, Judge James Redden of the Oregon Federal District Court granted a preliminary injunction requested by plaintiffs in NWF v. NMFS and ordered the U.S. Army Corps of Engineers (Corps) to provide additional summer spill for migrating juvenile salmon and steelhead at Federal Columbia River Power System dams on the Columbia and Snake rivers. This court decision was appealed to the federal appeals court and then to the ninth circuit, where the federal agencies lost. These events changed the regulations for spill in 2005 and set precedent for the National Wildlife Federation, State of Oregon and CRITFC continuing legal actions to modify spill and flow regimes on the Columbia and Snake Rivers during 2006. In the December 16, 2005 federal court decision, the spill regime for 2006 was modified significantly but the flow regime was not.
3.2. Columbia Basin Water Management Division (CBWMD), Reservoir Control Center Activities
3.2.1. Introduction The Water Quality Unit in the Reservoir Control Center (Water Management Division, Directorate of Programs) addresses water quality issues that need a regional approach such as TDG management and TMDLs on the Columbia and Snake Rivers. The RCC Water Quality Unit also provides technical and policy guidance on NWD Columbia Basin water quality programs. The RCC Water Quality Unit is responsible for monitoring TDG and water temperature conditions in the forebays and the tailwaters of the lower Columbia/lower Snake River dams and selected river sites. Based on the data obtained from the TDG monitoring efforts, the RCC Water Quality Unit set fish spill levels at the dams (daily if necessary) so that the river waters are close to, but do not exceed State Water Quality Standards. This team also addresses variances from State TDG standards for the purpose of facilitating juvenile fish passage with the appropriate States and tribes impacted by the program implemented in the Federal Columbia River Power System (FCRPS) for which the Corps has responsibility. During 2004 and 2005, the Corps had discussions with the State of Washington about replacing the year-to-year variances with long-term variances. The Washington Department of Ecology
15
granted a three year TDG variance in March 2005. This variance will remain in effect through February 2008. The Corps already has in place a long-term variance from the State of Oregon that runs through the 2007 spill season. The overall goals and objectives of the RCC Water Quality Unit are summarized in the following list:
• Participate in the development of a CENWD Columbia Basin Water Quality Unit to provide regional program management guidance.
• Monitor and adjust spill levels at nine Corps dams in the Columbia Basin during the fish spill season to maintain temperatures at 68F and TDG levels below the state standards. In Washington and Oregon, the state standard is 115% in the forebays and 120% in the tailraces. In Idaho, where the Dworshak Dam is located, the state standard is 110% TDG.
• Coordinate with appropriate State water quality agencies to satisfy the criteria specified in the multi-year TDG variances of the 110% state standards.
• Work with the Hydrologic Engineering Branch (HEB), at NWD Portland office, to ensure that water quality data is migrated into the new Corps Water Management System (CWMS).
• Develop and implement 1-year and 5-year Water Quality Plans as specified in the November 24, 2004 Updated Proposed Action (UPA).
• Maintain staff capability in state-of-the-art water quality technologies such as TDG and temperature modeling, and data correction and validation software.
• Implement reliable and adequate monitoring programs to support water management functions in an efficient and expeditious manner.
• Foster close cooperation with other Federal, State, and local agencies involved in water quality programs.
3.2.2.
3.2.3.
Summary of Water Quality Conditions, Data Collection and Analysis and Other Activities/Investigation The RCC Water Quality Unit does not manage or work on project specific water quality issues, such as PCB contamination below Bonneville Dam. Rather, the RCC Water Quality Unit works on water quality issues that are regional in nature and span the watershed through multiple district and state boundaries thus are regional water quality issues. These regional water quality issues for the Columbia and Snake Rivers include: spill management, TDG and temperature monitoring, TDG and temperature modeling, water quality data management, TMDLs, and Use Attainability Analysis (UAA). The following is a brief description of the work performed on these regional water quality issues.
Spill management of the Lower Columbia and Snake Rivers Each year, in accordance with ESA and CWA responsibilities, the RCC Water Quality Unit adjusted the spill caps daily for the projects on the Lower Columbia and Snake Rivers from April 3 through August 31st. To adjust the spill caps, the RCC Water Quality Unit reviewed a total of 16 factors, such as reviewing the TDG and temperature monitoring data, climate and flow forecasts, spill graphs, and simulation results from the SYSTDG model. The number and types of TDG and temperature exceedances were tracked during 2005 spill season. The results were
16

posted on the Technical Management Team website for the regional organizations to review and reported in the Annual TDG and Temperature Report.
3.2.4.
3.2.5.
3.2.6.
3.2.7.
TDG and Temperature Monitoring of the Columbia and Snake Rivers Since the Water Quality Unit reviews the real time water quality monitoring data to set spill caps each day, the monitoring data must come in and be posted on the Internet promptly. If the monitoring data is not posted, the Water Quality Unit takes steps to ensure that the problem is identified and corrected. When there are changes proposed to the monitoring system, the Water Quality Unit interacts with the districts and the Regional Forum Water Quality Team to obtain comments and recommendations.
TDG Modeling During the 2005 spill season, the Water Quality Unit continued to use the SYSTDG model as a tool for the setting of spill caps at the lower Columbia and Snake river projects. The WQU also assisted in the development of additional tools to improve forecasting TDG levels and gain greater expertise with the model. The WQ Unit also developed a list of future developments to SYSTDG. Dr. Michael Schneider, with BPA Administration funding, is working on these improvements that will include accurately reflecting National Weather Service Forecasted climate change in the SYSTDG model.
Temperature Modeling During 2005, no specific water temperature modeling using CEQUAL W2 was performed for the Columbia and Snake rivers, although there were discussions of releases from Brownlee Reservoir. Discussions are being renewed, so temperature modeling will be an important continuing need. Since 2003, the Regional Forum Technical Management Team (TMT) has requested assistance from the WQU to manage cool water releases from Dworshak reservoir. In 2004, the Water Quality Unit provided this assistance by designing a spreadsheet mass-balance model to estimate the storage of cold water in the reservoir. Use of this model continued in the 2005 fish migration season. However, due to limitations of this model, the WQU expects to develop the technical expertise using the CEQUAL W2 model for this purpose in the future.
Water Quality Data Management The Water Quality Unit was involved in ensuring that all water quality data related issues are addressed in the CROHMS data management system conversion to CWMS. To achieve this goal, the RCC Water Quality Unit is involved in the CWMS pathname committee, reviewing the water quality parameter pathnames from the CBT and GOES data feeds. During 2004, the RCC Water Quality Unit also developed a punch list with all the water quality web page reports that need to be converted. During 2005, the water quality web reports were successfully converted and the water quality parameter pathnames were reviewed and revised. The CWMS and CROHMS data was also compared to find any errors in the conversion. Since technical difficulties occurred with the conversion, the Water Quality Unit discontinued tracking conversion errors since many of them would be corrected in the ongoing conversion process.
17

3.2.8.
3.2.9.
3.2.10.
Total Maximum Daily Loads (TMDLs) The Water Quality Unit worked in support of the implementation team in reviewing and providing input to the States of Oregon and Washington, and the Environmental Protection Agency Region X on the development of TMDLs for total dissolved gas and water temperatures for waters in the Columbia Basin.
Use Attainability Analysis (UAA) The Corps has actively worked with the Oregon Department of Environmental Quality on the development of ODEQ’s Internal Management directive for conducting a Use Attainability Analysis. This included participation in a workgroup of Federal, state, and tribal representatives and other interest groups.
Regional Coordination of Water Quality Issues There are many different regional water quality issues that involve a considerable amount of coordination with other state and federal agencies regional organizations. The following are a list of the coordination the Water Quality Unit performs during the year:
• The Water Quality Unit coordinates and schedules short and long-term reservoir operations for water quality issues that impact fish passage and fishery research.
• The Water Quality Unit represents the Corps as an active participant in the Regional Forum Water Quality Team on all water quality issues associated with Columbia and Snake River operations.
• The Water Quality Unit coordinates various sections of the annual TDG and Temperature Report with the Corps districts to prepare the final report, which is used to obtain TDG state variances.
• The Water Quality Unit coordinates the water quality gage functioning with the Corps Districts to ensure that the real time water quality data is of good quality.
• The Water Quality Unit coordinates with Hydrologic Engineering Branch (HEB) to ensure that water quality data is being entered into the CROHMS and CWMS databases, web reports are being posted, and data is available.
• The Water Quality Unit coordinates with the Regional Forum Water Quality Team (WQT) on technical water quality issues that affect the Columbia Basin river system. This activity includes technical exchange of information on TDG, building consensus toward common goals and technical approaches, and peer review.
• The Water Quality Unit coordinates the Dissolved Gas Plan of Action each year with the Regional Forum Water Quality Team. The Dissolved Gas Plan of Action is used by the Regional Forum Technical Management Team in making recommendations on the operation of the Federal Columbia River Power System for multi-purpose uses. The Plan stipulates what to measure, how, where, and when to take the measurements and how to analyze and interpret the resulting data. The Plan also provides for periodic review and alteration or reduction of efforts when monitoring results and/or new information from other sources justifies a change.
• The Water Quality Unit coordinates various sections from NWD, Columbia Basin Water Management, and Corps Districts to prepare an Annual Water Quality Report that describes the water quality actions the districts and RCC Water Quality Unit performed.
18
• The Water Quality Unit coordinates with various regional entities to update the Water Quality Plan for Total Dissolved Gas and Water Temperature in the Mainstem Columbia and Snake Rivers. This report describes both the short-term and long-term plans for the reduction of TDG and management of water temperatures.
• The Water Quality Unit coordinates with EPA, the states and the tribes as they work on a combined approach to TMDL issues in the Columbia and Snake River mainstems. The Corps attempted to keep abreast of these issues and provide support where feasible.
3.2.11.
3.2.12.
Laboratory and Field Equipment and Technical Capabilities The RCC Water Quality Unit does not have a Corps owned laboratory facilities, perform laboratory activities or collect samples that need analyses.
Data Management Activities The Columbia Basin Water Management Division (CBWMD) serves as the data collection site for the water control and real-time water quality data, which includes data from fixed monitoring stations (FMS). At the present time, CBWMD’s water control and real-time water quality data are stored in two data management systems: the old system called Columbia River Operational Hydrological Management System (CROHMS), a HEC-DSS database and the new system called Corps Water Management System (CWMS), an Oracle data management system. The CBWMD is in the process of converting from CROHMS to CWMS. Once the conversion is complete, the CROHMS data management system will be discarded. During 2005, the RCC Water Quality Unit renamed over 3,500 water quality real time data pathnames in CROHMS and CWMS to ensure they are named according to the new naming convention described in the Columbia River Region data dictionary. The Water Quality Unit obtained approval and established the procedure for entering water quality research data into CWMS database. One complete data set was submitted for entry during 2005 and there are 41 additional studies that need to be entered. This work is expected to span over several years. The Water Quality Unit also attends the CROHMS/CWMS conversion meetings to ensure water quality needs are addressed. The RCC Water Quality Unit has a web page where various kinds of information associated with the Columbia Basin water quality program are posted and it is found at http://www.nwd-wc.usace.army.mil/TMT/wqwebpage/mainpage.htm. The Plan of Action for TDG monitoring, and the Annual TDG and Temperature Report are among the documents posted at the website. These reports include information on the FMS data quality assurance and quality control. Refer to the Annual TDG Report for a summary of the FMS Program. The RCC Water Quality Unit ensures that various kinds of data and information are also posted to the regional Technical Management Team (TMT) homepage for dissemination to regional users and researchers. The RCC Water Quality Unit developed a data correction protocol on how water quality data will be corrected during 2006. Because of the court cases and state TDG variances, it became important that the data be corrected daily so that the monthly reports to the court and to the states will accurately reflect operations. The Water Quality unit will be implementing the data correction protocol during 2006.
19
3.2.13.
3.2.14.
3.2.15.
3.2.16.
Water Quality Reports Annually, the CBWMD publishes a number of reports and the following is a list of them:
• The Annual Water Quality Report • The Annual Total Dissolved Gas and Temperature Monitoring Report • The Annual TDG Monitoring Plan of Action • Total Dissolved Gas Management Plan • Spill Cap Guidance Document
Meeting, Conferences and Training The following is a list of the meetings and conferences that the Water Quality Unit attended and participated in: 1. Water Quality Unit staff (Jim Adams, Laura Hamilton and Tina Lundell) attended weekly
to biweekly in-house meetings of the Regional Forum Technical Management Team discussing flow augmentation and spill operations for the protection of endangered fish.
2. Jim Adams attended the monthly NOAA Fisheries Regional Forum Water Quality Team meetings concerning Total Dissolved Gas and water temperature
3. Jim Adams attended the semi-annual Trans-boundary gas group meeting held in April 2005 at Sandpoint, Idaho and in October 2005 at Trail, BC.
4. Jim Adams held the fall TDG Monitoring Coordination Meetings with the Districts; Bureau of Reclamation, and the Public Utilities Districts on November 8th, 2005.
5. Jim Adams attended the Committee on Water Quality meeting that was held from August 29th to September 1st in San Francisco.
6. Laura Hamilton attended numerous in-house meetings on the CWMS transition and CWMS pathnames.
Training Attended in FY05 The Water Quality Unit attended several training classes and they were: 1. Laura Hamilton attended an in-house training session on an Introduction to the
CWMS/CROHMS data management system that HEB offered in June 2005. 2. Laura Hamilton attended a LEAD training class held in Portland, Oregon on February 7 –
11, 2005. 3. Tina Lundell was on her one-year Engineer-In-Training (EIT) rotation from July 26, 2004
– September 2, 2005. The following training was part of her EIT rotation: • Intern Leadership Development Course (ILDC) on January 31– February 4, 2005 in Ft.
Huachuca, AZ. • Hydraulic Design trip to ERDC (WES) in Vicksburg, MS on January 31, 2005. • CQM class for Construction on April 15, 2005. Tina received her QA Certification. • SpeechCraft for EIT’s, part of the Toastmasters program, from April – June, 2005.
Required/Recommended Future Training for FY06 The Water Quality Unit plans to attend several training classes and they are:
20

1. Laura Hamilton will attend the Intermediate Microsoft Excel class held in Portland, Oregon
on April 19, 2006. 2. Tina Lundell will attend the Oregon Water Quality Conference on February 17, 2006. 3. Tina Lundell will attend the CE-QUAL-W2 Model week-long class in June, 2006 at
Portland State University.
3.2.17.
3.2.18.
3.2.19.
3.2.20.
3.2.21.
Personnel and Expenditures During 2005, the RCC Water Quality Unit Water Quality Management Program consists of the following personnel:
• Jim Adams: Water Quality Team Leader, GS-13, 1 FTE. • Laura Hamilton: Environmental Engineer, GS-12, 1 FTE. • Tina Lundell*: Engineer In Training/Hydraulic Engineer, GS-9, 1 FTE.
*Tina Lundell graduated with a BS in civil engineering in June 2004 and had been on her 1 year Engineer In Training (EIT) rotation through September 2, 2005; upon completion of her rotation, she returned to RCC as a Hydraulic Engineer with the Water Quality Unit.
In House Expenditures CBWMD did not purchase any equipment in 2005.
Contracts CBWMD awarded no contracts in 2005.
Special Coordination with other Corps Entities Columbia Basin Water Management Division (CBWMD) continues efforts with the Portland, Walla Walla and Seattle Districts, reviewing the current SYSTDG numerical modeling capabilities with a focus on how it serves the needs of the region in 2005.
CBWMD, RCC Water Quality Unit Summary After having beta testing the new SYSTDG model during the 2004 spill season, and implementing modifications identified during the 2004 and 2005 spill season, the SYSTDG model is fully established as a real time spill season tool. It was very useful in preparing the forecasted TDG levels for the Corps declarations for the 2005 and 2006 court cases. As the spill program continues to evolve, there will also be modifications to the model. RCC Water Quality unit finds the SYSTDG model very useful and is perusing future develops such as accurately reflecting National Weather Service forecasted climate change in the SYSTDG model. This is a future improvement that RCC Water Quality Unit requested and Dr. Michael Schneider, with Bonneville Power Administration funding, is working on. The SYSTDG users’ manual with a step-by-step guide on how to use SYTDG in real time operations written in 2004 was updated during 2005. After much coordination, Lower Snake River and McNary Dam fixed monitoring stations located in the project forebays were moved in March 2005 to sites that were more representative
21
of river conditions. These gages were also lowered from 5 m to 12-15 m depth which could affect the amount of spill for fish passage. This was part of the RPA 132 action items of the 2004 BiOp. The Water Quality Unit provided the regional forum Technical Management Team (TMT) with technical information on Dworshak water temperature releases. Before 2003, Dworshak releases were set at 48oF and maintained throughout July and August. During 2003, based on mass and temperature balance calculations, the Water Quality Unit said that it was possible to go to lower temperatures, so Dworshak water temperature releases were 45oF for 7 weeks. During the 2004 spill season the Water Quality Unit used the mass and temperature balances again with some different assumption and predicted that the water could be released at lower temperature than 45 if desired. So the Dworshak water temperature releases were set for 43oF for 10 days and 45oF for the rest of the spill season (10 weeks). During 2005, the RCC Water Quality Unit provided TMT information on how TMT’s decision to release 43 to 44oF water effected the temperature stratification in the reservoir. Since the CBWMD’s water control and real-time water quality data management system is being converted from the old CROHMS system to the new CWMS system, there are many changes necessary to make a successful conversion. During 2004, the Water Quality Unit participated in creating a pathname naming convention and writing a data dictionary. During 2005, the Water Quality Unit reviewed and modified over 3,500 pathnames to ensure that they are according to the data dictionary. The RCC Water Quality Unit participates in the CROHMS/CWMS transition and pathname committees, performing many tasks that would ensure all water quality data related issues are addressed in the CROHMS data management system conversion to CWMS.
4. Portland District Activities
4.1. Introduction: The Portland District manages water quality at thirteen reservoirs within the Willamette River Basin, two reservoirs within the Rogue River Basin, the Sediment Retention Structure near Mt. St. Helens, and one reservoir on the Willow Creek tributary of the Columbia River. The Portland District also oversees the collection of data at a network of TDG fixed stations on the Lower Columbia River between John Day Dam and Camas, Washington. The objectives for FY05 were as follows:
1. Continue to operate and maintain stream-gauging programs in the Willamette and Rogue River Basins, Oregon, Willow Creek basin, Toutle River basin, Washington, and in the Lower Columbia River main stem.
2. Continue coordination with resource agencies to assure Portland District's compliance with Federal and State water quality regulations at existing and proposed Federal projects.
3. Provide support for the Restoration of Abandoned Mines Program (RAMS) as needed. Coordinate with Program Management and NWD.
4. Continue studies of mercury contamination in Cottage Grove and Dorena Reservoirs as funding permits.
22
5. Continue selective withdrawal at Willow Creek Reservoir to aid locals and meet proposed temperature TMDL below Willow Creek Project.
6. Coordinate operation and maintenance of aeration equipment at Willow Creek Reservoir to improve water quality. Aeration reduces methane, hydrogen sulfide, ammonia and nutrients in hypolimnetic waters while increasing the concentration of oxygen.
7. Consult with project operators and resource personnel and review historic and current data to determine future water quality monitoring needs and problem specific water quality studies to conduct at Corps projects.
8. Continue to implement the District Fixed Monitoring Program (FMP) for monitoring Total Dissolved Gas (TDG) below Corps Projects in the lower Columbia River. Evaluate the need for adding, dropping, and moving FMP sites to improve monitoring TDG in order to comply with State water quality standards and ESA requirements.
9. Continue to monitor TDG below Corps Projects in the Willamette and Rogue Basin on an as-needed basis.
10. Continue to seek improvements in operation of the selective withdrawal tower at Cougar Reservoir to better meet downstream temperature targets for fish.
11. Continue to support efforts to set up water quality models of District Projects that have water quality problems. Provide support to ERDC for reviving and using the old WESTEX temperature model of Lost Creek reservoir for improving temperatures and outflows for the benefit of fish. Develop a CE-QUAL-W2 model of Willow Creek Reservoir.
12. Support the State of Oregon DEQ in developing TMDLs for the Willamette by providing data and comments.
13. Continue participation in developing a Water Quality Plan for District projects in the Lower Columbia River as required in the NMFS Biological Opinion on saving threatened fish species.
14. Continue to request funding from Operations Division for water quality monitoring activities in the Lower Columbia River projects as is required by the CWA and Corps Policy. The three lower Columbia River Projects do not have official water quality budgets (except for monitoring TDG as required by RPAs in the ESA BiOP for endangered salmon).
15. Develop budget projections for TMDL and BiOp work in the Willamette Basin.
4.2. Summary of Water Quality Conditions, Data Collection and Analysis, and other Activities/Investigations The Reservoir Regulation & Water Quality Section of Portland District is responsible for monitoring water quality at 20 projects – 3 in the Columbia basin, 1 in the Toutle River basin, 2 in the Rogue basin, 13 in the Willamette basin, and 1 in Willow Creek basin. Columbia Basin
23

4.2.1. Bonneville, The Dalles, John Day Dams and the SRS Routine TDG data was collected at these projects to determine compliance with State standards. This year a new tailwater station (CCIW) was established below Bonneville dam in spill at the south side of Cascade Island. The site was used to set spill and the Warrendale site was kept operational to indicate TDG levels for local fish habitat. Spill operations were determined by the 7 gas monitoring sites at the three lower Columbia River projects. TDG data and measures of water quality compliance were reported in the Annual TDG Report to NWD that was prepared by the USGS. The Sediment Retention Structure (SRS) about 20 miles below Mt. St. Helens on the North Fork of the Toutle River is now full of sediment. The purpose of the project was to trap sediment from flowing down the river. Initially, the project would fill with water behind the dam to a depth of about 35 feet. Over the years the area behind the dam filled with sediment. Now, water flows though the area as a river and flows over the spillway. The SRS had an affect on river temperatures. It dampened the daily diel variation in temperatures and actually served to reduce temperatures below the project because of reduced surface-to-volume related reductions in temperature (Toutle River SRS Mount St. Helens Washington, Limnological and Water-Quality Studies 1985-1990, Final Report, Douglas W. Larson, Portland State University, September 2002). Now that the SRS is full of sediment and a more natural flow is occurring, natural stream temperatures are expected in the reaches above and below the project. Natural conditions, because of volcanic activity, have created a braided, open stream that experiences frequent shifts in streambed location. The net result of this is open exposure to the sun and increased water temperatures. These temperatures exceed the State standard, which is probably too stringent for this part of the river. In the future Portland District plans to measure river temperatures to near the SRS. In the summer of 2005 water quality personnel scouted possible sites to locate temperature loggers in the North Fork Toutle River above and below the SRS. Rogue Basin
4.2.2. Applegate and Lost Creek Dams John Salinas, the Cascade Research Group, collected temperature data for the third year in a row at selected sites below Lost Creek and Applegate reservoirs to obtain data on how far downstream each project impacts water temperature. Work on this project ended in fall of 2005. The data will be used to help predict how far downstream each project can influence water temperatures. It will be used to aid the Corps in determining how well it can meet TMDL and fish targets as well as in the Use Attainability Analysis (UAA) at Applegate Project. A UAA is an analysis to determine if the Project can meet the temperature TMDL. The District feels that the project can not meet the TMDL target temperatures in the fall. The Applegate UAA is considered of national importance to the Corps since other projects will be in a similar position of not being able to meet the TMDL. The Corps would like to negotiate a reasonable study of operational and structural changes that will not be too costly since there are many projects where temperature TMDLs will and are being developed.
24
Willamette Basin
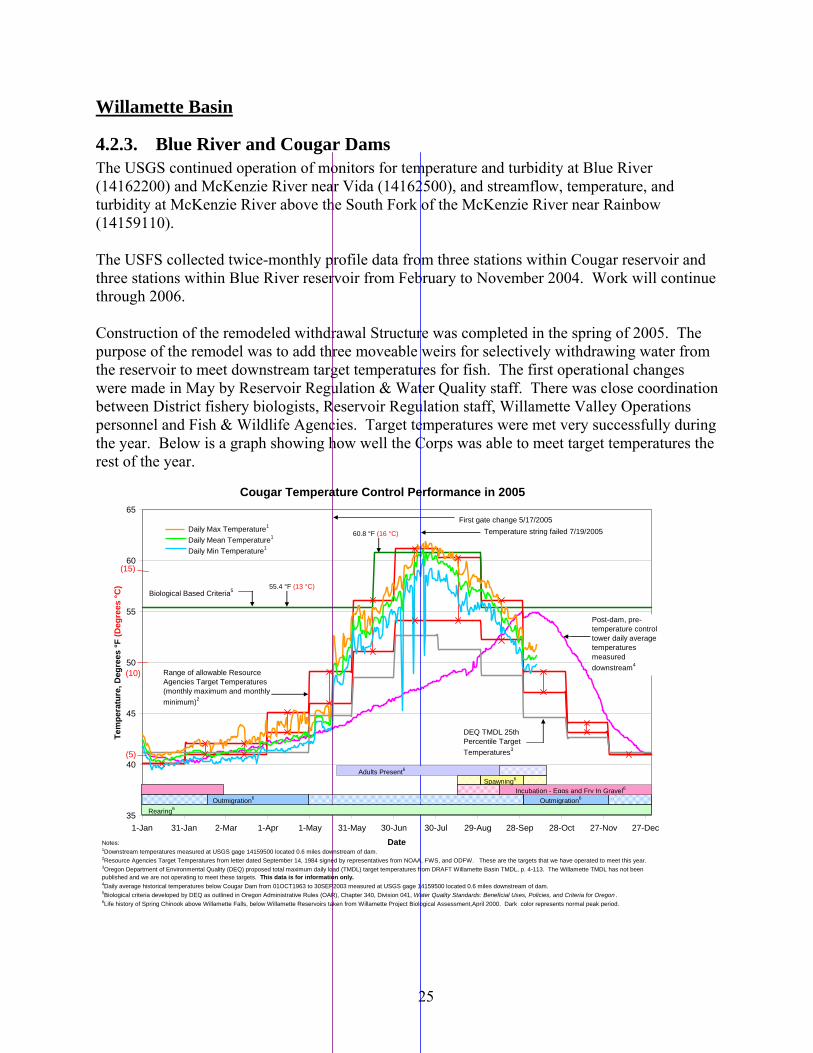
4.2.3. Blue River and Cougar Dams The USGS continued operation of monitors for temperature and turbidity at Blue River (14162200) and McKenzie River near Vida (14162500), and streamflow, temperature, and turbidity at McKenzie River above the South Fork of the McKenzie River near Rainbow (14159110). The USFS collected twice-monthly profile data from three stations within Cougar reservoir and three stations within Blue River reservoir from February to November 2004. Work will continue through 2006. Construction of the remodeled withdrawal Structure was completed in the spring of 2005. The purpose of the remodel was to add three moveable weirs for selectively withdrawing water from the reservoir to meet downstream target temperatures for fish. The first operational changes were made in May by Reservoir Regulation & Water Quality staff. There was close coordination between District fishery biologists, Reservoir Regulation staff, Willamette Valley Operations personnel and Fish & Wildlife Agencies. Target temperatures were met very successfully during the year. Below is a graph showing how well the Corps was able to meet target temperatures the rest of the year.
Cougar Temperature Control Performance in 2005
35
40
45
50
55
60
65
1-Jan 31-Jan 2-Mar 1-Apr 1-May 31-May 30-Jun 30-Jul 29-Aug 28-Sep 28-Oct 27-Nov 27-Dec
Date
Tem
pera
ture
, Deg
rees
°F (D
egre
es °C
)
Outmigration6
Notes: 1Downstream temperatures measured at USGS gage 14159500 located 0.6 miles downstream of dam.2Resource Agencies Target Temperatures from letter dated September 14, 1984 signed by representatives from NOAA, FWS, and ODFW. These are the targets that we have operated to meet this year.3Oregon Department of Environmental Quality (DEQ) proposed total maximum daily load (TMDL) target temperatures from DRAFT Willamette Basin TMDL, p. 4-113. The Willamette TMDL has not been published and we are not operating to meet these targets. This data is for information only.4Daily average historical temperatures below Cougar Dam from 01OCT1963 to 30SEP2003 measured at USGS gage 14159500 located 0.6 miles downstream of dam.5Biological criteria developed by DEQ as outlined in Oregon Administrative Rules (OAR), Chapter 340, Division 041, Water Quality Standards: Beneficial Uses, Policies, and Criteria for Oregon .6Life history of Spring Chinook above Willamette Falls, below Willamette Reservoirs taken from Willamette Project Biological Assessment,April 2000. Dark color represents normal peak period.
DEQ TMDL 25th Percentile Target Temperatures3
Range of allowable Resource Agencies Target Temperatures (monthly maximum and monthlyminimum)2
(15)
(10)
(5)
Outmigration6
Rearing6
Incubation - Eggs and Fry In Gravel6Spawning6
Adults Present6
Biological Based Criteria5
Daily Max Temperature1
Daily Mean Temperature1
Daily Min Temperature1
Temperature string failed 7/19/2005First gate change 5/17/2005
55.4 °F
60.8 °F
(13 °C)
(16 °C)
Post-dam, pre-temperature control tower daily average temperatures measured downstream4
25

4.2.4.
4.2.5.
4.2.6.
4.2.7.
4.2.8.
4.2.9.
Cottage Grove Dam Under the auspices of the Restoration of Abandoned Mines Program (RAMS), Portland District Reservoir Regulation & Water Quality personnel coordinated with ODEQ and congressional representatives in providing information pertinent to obtaining congressional approval of funding for clean-up of the Black Butte mercury mine in the watershed above Cottage Grove Reservoir.
Detroit and Big Cliff Dams Portland District continued supporting the Bureau of Reclamation’s Agrimet weather station at Detroit reservoir. The data from this station was used in a CE-QUAL-W2 temperature model of Detroit Reservoir. The model will be useful for meeting TMDL and ESA requirements in the future. The station is turning out to be heavily used by others besides the COE – USFS, the Oregon State Climatologist and others.
Dexter Dam In early August a blue-green algae bloom was detected in Dexter Reservoir by locals.
Fern Ridge Dam Portland District provided funding to the USGS to collect turbidity in the forebay and below the reservoir during emergency construction of the dam’s drainage system in the embankment. This data was required by DEQ as part of the construction permit.
Green Peter and Foster Dams Laurie Rice started learning how to use the CE-QUAL-W2 temperature model of the reservoirs in order to deal with modeling our ability to meet the proposed temperature TMDLs below these projects.
Hills Creek Dam Hills Creek experienced another blue-green algae bloom this year in mid August and was posted for a short time by the Forest Service at Larison Cove and the eastern arm of the reservoir. Below is a typical example of the posting used at a project. August 19, 2005
Media Contact: Bonnie Widerburg (503) 731-4180 Technical Contact: Dave Stone, DHS (503971) 673-0444
Local: Willamette National Forest, Middle Fork Ranger District (541) 782-2283
Public health advisory issued for eastern-most arm of Hills Creek Reservoir A health advisory prompted by high algae levels found in the eastern-most arm of Hills Creek Reservoir (upstream/above Forest Service Bridge on F.S. Road 2118), located five miles southeast of Oakridge, was issued today by the Oregon Department of Human Services (DHS), and the Willamette National Forest. Water sampling by the U.S. Forest Service has confirmed the presence of blue-green algae that can produce toxins harmful to humans and animals, said Dave Stone, DHS toxicologist.
26
These levels are likely to be associated with dangerous toxin concentrations in the water, according to World Health Organization guidelines. Swallowing or inhaling water droplets should be avoided, as well as skin contact with water by humans or animals. Drinking water from this area of Hills Creek Reservoir is especially dangerous. The toxins cannot be removed by boiling, filtering or treating water. DHS strongly recommends that if people choose to eat fish from this area of Hills Creek Reservoir, they should remove all fat, skin and organs before cooking since toxins are more likely to collect in these tissues. Symptoms of numbness, tingling and dizziness can lead to difficulty breathing or heart problems and require immediate medical attention. Symptoms of skin irritation, weakness, diarrhea, nausea, cramps and fainting should also receive medical attention if they persist or worsen. Children and pets are particularly susceptible.
The public will be advised when the concern no longer exists. With proper precautions to avoid water contact, people are encouraged to visit the eastern-most arm of Hills Creek Reservoir and enjoy activities such as camping, hiking, biking, picnicking, catch-and-release fishing and bird watching. For local information contact the Willamette National Forest at (541)-782-2283 or on the web at http://www.fs.fed.us/r6/willamette/ For health information, contact Dave Stone, DHS toxicologist at (971) 673-0444 or check the Web at http://oregon.gov/DHS/ph/envtox/maadvisories.shtml
4.2.10. Lookout Point Dam Goodman Creek in late July and Hampton Public Boat Launch in late August also experienced a blue-green algae bloom and were posted by the Forest Service. Willow Creek Basin
4.2.11. Willow Creek Dam Aeration of the Willow Creek Project occurred from April through November. To monitor the effectiveness of aeration, the Portland District contracted Dr. Marvin Lilley, University of Washington, to monitor methane, hydrogen sulfide, nutrients, ammonia, metals, zooplankton, and phytoplankton at Willow Creek. Data was collected three times during June, August, and October of 2005. Portland District also monitored the project oxygen levels frequently during the summer and fall. Data shows that the aerators are increasing the circulation in the reservoir, with the result that temperatures in the reservoir from top to bottom are more uniform with bottom waters warmer by several degrees C. Oxygen levels are higher at depth, while phosphorus and methane levels are decreased, and hydrogen sulfide is not detectable. However, continued monitoring will be required to evaluate the long-term effectiveness of the plan. The graph below shows the results of water quality monitoring at the project during aeration. The
27

first graph shows that by mid August the temperature at all depths converges on around 21 degrees C (69.8 F). A temperature TMDL for Willow Creek is under preparation by DEQ. The aeration project at Willow Creek may have to be re-evaluated depending on the temperature TMDL that is under preparation by DEQ. The temperature standard the TMDL will be based on is 20 degrees C (68 F). Starting in mid August and continuing into early September (data not shown) release water from the reservoir may exceed the 20 degree C standard. The second figure below shows how the aerators affect dissolved oxygen concentration and temperature structure. Temperature in 2005 was more uniform from top to bottom whereas in 2003, before aeration, the reservoir was more stratified showing a epilimnion, metalimnion and hypolimnion. The most important effect of the aeration is the improved DO concentrations in bottom waters. This should improve habitat for aquatic organism.
Temperature profiles - Willow Creek Reservoir - Spring and Summer 05
5
6
7
8
9
10
11
12
13
14
15
16
17
18
19
20
21
22
23
24
31-Mar 14-Apr 28-Apr 12-May 26-May 9-Jun 23-Jun 7-Jul 21-Jul 4-Aug 18-Aug
degr
ees
C
1.5 m 3.0 m 10.0 m 15 m 25.0 m
28

Willow Creek Dam: October 2003 and 2005
0.0
5.0
10.0
15.0
20.0
25.0
0 5 10 15 20 25
Depth (m)
Tem
p an
d DO
Temp øC (101403)
Temp øC (101105)
DO mg/l (101403)
DO mg/l (101105)
4.2.12. TMDL Activities The Portland District entered into discussions with Oregon Department of Environmental Quality (DEQ) regarding the TMDL for Applegate Reservoir in southern Oregon. It is the Corp’s position that the TMDL cannot be met for a few weeks in the fall. In fact, the Corps may not be able to meet TMDLs at several projects in the fall in the Willamette as well. The Clean Water Act (CWA) allows entities to enter into what’s called a “Use Attainability Analysis” (UAA) when the entity cannot meet the designated use upon which a TMDL is based. The Corps decided to use the Applegate Project as a test case for the UAA process. The Applegate UAA is being followed closely by headquarters since it may have national implications in how the Corps approaches temperature TMDLs and designated uses below its projects. A UAA requires evaluations of operational and structural changes to a project in order to attempt to meet a temperature TMDL. A UAA also requires an economic analysis of costs versus benefits of proposals for meeting the TMDL. One possible outcome of a UAA is that a designated use be changed to a sub-category use. The Portland District continued negotiations with DEQ concerning the requirements of a UAA that would satisfy the CWA. Portland District provided DEQ comments on its proposed turbidity standard and on the State of Washington’s proposed temperature standard. The District continues to alter and refine out-year budget proposals for future water quality activities that may be required by future TMDLs.
4.3. Laboratory and Field Equipment, and Technical Capabilities Portland District water quality program requires various types of lab analysis, field equipment and technical expertise. The following is a list of how these needs are met. 1. Portland District does not operate or own laboratory facilities. Nutrient samples were
analyzed by the University of Washington. Phytoplankton samples were analyzed by Aquatic Analysts. Zooplankton samples analyzed by ZP’s Taxonomic Services.
29

2. The Portland District uses several environmental contractors to obtain field samples for water quality and sediment quality sampling and analysis. A partial list of these contractors includes: Hart Crowser Inc., Cascade Research Group, Aquatic Analysts, Inc., USGS Oregon District, and the COE Engineer Research and Development Center (ERDC).
3. The USGS laboratory at the Water Resources Division was used for calibration, maintenance and repair of TDG saturometers and DCPs for the Fixed Monitoring Stations (FMSs).
4. Analysis equipment available for routine water quality monitoring include 3 Hydrolab multi-probe water quality samplers (containing one or more of the following probes: total dissolved gas, turbidity, conductivity, pH, dissolved oxygen, temperature, depth, 3 TDG saturometers (installed and maintained by the USGS), Orion pH, dissolved oxygen and conductivity meters, Hach turbidity meters, and NIST certified thermometers and barometers. Sampling equipment available includes Van Dorn-type grab samplers, a Ponar sediment sampler, a box corer, and a gravity corer. A 16-foot john boat is available for reservoir work.
5. The Portland District purchased 9 new DCPs for transmitting TDG data via the GOES satellite.
6. The District has the capability to perform water quality modeling of reservoirs using CE-QUAL-W2 and HEC5Q.
4.4. Regulation Changes There have been no changes in regulations that affected the Portland District water quality program during 2005.
4.5. Data Management Activities The Portland District employs the DASLER database to store its water quality data. 1. Wendy Briner and Laurie Rice loaded all of the 2005 water quality data into the DASLER
database and continued loading the remaining historical data into the database. 2. Daily reservoir reports and total dissolved gas monitoring reports for the Columbia River
are available via the District WEB site under the Water Management page. The Columbia Basin Water Management Division office is responsible for maintenance of the data access.
3. Water quality monitoring data collected by contractors are being stored in a Water Quality Data folder on a central server. This allows data to be available in a central location for backups and updating.
4.6. Water Quality Reports Portland District staff coordinated and contracted to have written several major reports associated with various water quality activities, including the following: 1. Tanner, D.Q., Johnston, M.W., and Bragg, H.M. (2005) Total Dissolved Gas and Water
Temperature in the Lower Columbia River, Oregon and Washington, 2005, Data Series 148.
2. Carroll, Joe H., Willow Creek Reservoir, Water Quality Profiling, 2005, U.S. Army Corps of Engineers.
3. Laurie Rice prepared an operations manual for using the HEC5Q temperature model to set the outlet gates at Cougar Reservoir for achieving downstream target temperatures.
30

4.7. Meetings, Conferences, and Training
4.7.1.
4.7.2.
4.8.1.
Attended FY05 • Portland District staffs attended several meetings, conferences and training, including:
Jim Britton and Wendy Briner attended the SETAC conference in Portland on November 16-18, 2005.
• Donna Ebner and Wendy Briner attended a Prospect class on Hydrologic Analysis for Ecosystem Restoration at Davis, CA, May 2-6, 2005
• Wendy Briner and Laurie Rice attended CE-QUAL-W2 training at Portland State University in June.
• Wendy Briner attended an Environmental Law Center conference on Sediment Quality in September.
• Laurie Rice attended a Transport of Sediment and Contaminants in Surface Water course at the University of California-Santa Barbara; January 16-21, 2005.
Required/Recommended Future Training for In-House Staff Members The following is a list of future training that in-house staffs plan to take:
• Wendy Briner will attend Prospect training in June on Riparian Zone Ecology and Restoration.
• Donna Ebner plans to attend the same course in the future. • Laurie Rice will be attending a regulatory class this spring. • Laurie Rice will be attending a Water Quality class later in the year.
4.8. Personnel and Expenditures The following is a summary of the personnel and expenditures including in house expenditures and contracts.
In-House Expenditures The Portland District’s Water Quality Management Program consists of the following personnel: • Jim Britton: Biologist, GS-12, 1 FTE. • Wendy Briner: Biologist, GS-11, 1 FTE. • Donna Ebner: Hydrologist, GS-11, 1/2 FTE. • Laurie Rice: Civil Engineer, GS-11, 1/2 FTE.
In addition to water quality monitoring, Wendy Briner and Donna Ebner also work with the sediment quality group. Laurie Rice assists with sediment and water quality numerical modeling. Table 3 is a summary of the in house expenditures.
31

Table 3 In House Expenditures
Company Purchase Cost Sutron DCPs $19,050 Total $19,050
4.8.2. Contracts Table 4 is a summary of the contracts that Portland District water quality program has:
Table 4 Portland District Contracts
Company/Agency NWP Project Amount of Contract University of Washington Willow Creek $38,000 Rogue River Community College Lost Creek/Applegate $29,500 OA Systems Cougar and Willow Creek $3,500 USFS Cougar/Blue River $9,900 USGS Columbia River TDG $187,100 USGS Cougar/McKenzie/Fern R. $138,790 HIFERDC Col R. TDG SUTRON lease $12,480 BOR Weather Stations $10,500 CRG, ZP, ABA, PNW Willow Creek $2,600 Total $432,370
4.9. Special Coordination with other Corps Entities Portland District participated in meetings with State and potential Federal partners to develop a plan for additional assessment at Black Butte Mine and corresponded with RAMS coordinators to attempt to secure funding for the plan. No funding was received in FY05.
4.10. Portland District Summary During 2005, the Portland District Reservoir Regulation and Water Quality Section continued to perform routine water quality data collection and evaluation at district projects. Achievement of the water quality management program 2005 objectives and goals are summarized below.
• Portland District continued the operation of aeration equipment at Willow Creek reservoir that improved water quality conditions at the lake, including higher dissolved oxygen levels, and lower methane, hydrogen sulfide, and nutrient concentrations. Monitoring will continue in 2006.
• The operation of Cougar Temperature Tower commenced in May. Downstream target temperature for the benefit of fish was achieved to a degree better than expected for the first year of operation.
• Real-time TDG monitoring and temperature data collection continued at the Columbia River projects. Regular water quality monitoring continued at several Willamette and Rogue projects.
32
5. Seattle District Activities
5.1. Introduction The Water Management Section of the Technical Services Branch runs the Seattle District’s water quality management program. The program is designed to monitor water quality at Seattle District projects and in waters located within the Seattle District’s boundaries. Objectives and goals of the water quality management program include, but are not limited to:
• Define baseline water quality conditions for each project. • Establish and maintain a water quality monitoring and data evaluation program that
ensures achievement of water quality management objectives and to evaluate project performance and water quality trends.
• Identify existing and potential water quality problems, and develop and implement appropriate solutions.
• Maintain coordination, communication, and collaboration with all interested government and nongovernmental entities with regard to activities that may affect or be affected by water quality or water control decisions.
To meet the objectives and goals listed above, the Seattle District Water Management Section performs routine water quality data collection and evaluation at district projects, implements special studies and research projects, and coordinates monitoring efforts with local, state, and federal agencies. The water quality management program fiscal year 2005 objectives and goals are summarized below.
• Continue routine water quality sampling at Libby Dam (Lake Koocanusa and the Kootenai River) and at Howard Hanson Dam (Howard Hanson Reservoir and the Green River).
• Continue the real-time data collection of temperature and salinity in the Lake
Washington Ship Canal to assist in operational decisions of the locks for control of saltwater intrusion into Lake Washington.
• Continue real-time data collection system of hydrological, meteorological, and water
quality data at rivers and reservoirs throughout Washington, Northern Idaho, and Western Montana.
• Continue the temperature study at Libby Dam forebay to assess the accuracy of the
automated temperature string on the face of the dam. Accurate readings are imperative for the selective withdrawal system and management of downstream water temperatures.
• Continue to work together with the Bureau of Reclamation to implement joint operations
between Grand Coulee Dam and Chief Joseph Dam to reduce total dissolved gas levels on the Columbia River system.
33

• Continue to provide water quality and hydraulic expertise and support in the design and installation of flow-deflectors at Chief Joseph Dam to reduce TDG levels.
• Continue to monitor total dissolved gas (TDG) at five (5) permanent sites located at the
forebay and tailwater of Chief Joseph Dam, the forebay and tailwater of Albeni Falls Dam, and the tailwater of Libby Dam.
• Complete a total dissolved gas management study at Libby Dam to provide a feasibility
assessment of various structural and operational alternatives to allow higher flows past the dam while reducing TDG saturations in the Kootenai River below the dam.
• Complete the 2003 total dissolved gas exchange study at Albeni Falls Dam to evaluate
TDG in the Pend Oreille River during various spill conditions. • Research and lease a new Gas Works water quality monitoring site for the Lake
Washington Ship Canal data collection program. The previous site was discontinued at the end of 2004.
• Implement a water quality study at Albeni Falls Dam to establish baseline information
on the physical, chemical, and biological condition of Lake Pend Oreille and the Pend Oreille River system.
• Complete a water quality study at Chief Joseph Dam to establish baseline information on
the physical, chemical, and biological condition of Lake Rufus Woods and the Columbia River.
• Complete a sediment quality study at Chief Joseph Dam to establish baseline information
on the physical and chemical condition of sediments in Lake Rufus Woods. • Continue a water temperature study upstream and downstream of Albeni Falls Dam to
establish baseline information for the Pend Oreille River system and Lake Pend Oreille for future TMDLs, and to study how Albeni Falls Dam may impact the Pend Oreille River system.
• Move Albeni Falls Tailwater TDG monitoring station closer to the dam to a location that
is more representative of downstream conditions.
5.2. Summary of Water Quality Conditions, Data Collection/Analysis and other Activities/Investigation The Seattle District water quality program activities during 2005 cover the Columbia River, Kootenai River, Pend Oreille River, Green River, White River, Wynoochee River, and the Lake Washington Ship Canal. Chief Joseph Dam and Lake Rufus Woods are located on the Columbia River. Libby Dam and Lake Koocanusa are located on the Kootenai River. Albeni Falls Dam and Lake Pend Oreille are located on the Pend Oreille River. Howard Hanson Dam and Reservoir are located on the Green River. Mud Mountain Dam is located on the White River.
34

Wynoochee Dam and Reservoir are located on the Wynoochee River. The Hiram Chittenden Locks are located on the Lake Washington Ship Canal. The following is the general overview of the water quality conditions, data collection/analysis and activities performed at these projects during 2005.
5.2.1. Chief Joseph Dam and Lake Rufus Woods
5.2.1.1.Water Quality Conditions and Issues • Current Conditions: Good • Current Issues: Total dissolved gas, temperature • Historical Problems: Total dissolved gas, temperature • Future Problems: Total dissolved gas, temperature, nutrients, phytoplankton
5.2.1.2.Data Collection and Analysis • The Seattle District continued real-time monitoring of total dissolved gas and
temperature at forebay and tailwater fixed monitoring stations during the spill season from April 1 to September 30, 2005.
• The District completed the 2004 water quality monitoring program in November of 2004
and began to QA/QC and analyze the data in 2005. Water quality grab samples were collected at monthly intervals in Lake Rufus Woods at three stations from February through November 2004. Water column composite samples were analyzed for conventionals, nutrients, and metals. Photic zone composite samples were analyzed for chlorophyll a and phytoplankton, while a ten (10) meter vertical tow was analyzed for zooplankton. Vertical profiles of temperature, dissolved oxygen, pH, and conductivity were recorded at each station. A downstream station on the Columbia River was monitored at monthly intervals, with samples being analyzed for conventionals, nutrients, and metals.
• The District completed the 2004 sediment quality monitoring program in November of
2004 and began to QA/QC and analyze the data in 2005. Sediment samples were collected at five (5) stations in Lake Rufus Woods between Grand Coulee Dam and Chief Joseph Dam in November 2004. Samples were analyzed for metals, organics, and particle size. An understanding of Lake Rufus Woods’ sediment quality is important because studies conducted during the past two decades have shown substantial sediment contamination of Lake Roosevelt and the upper Columbia River with metals.
• The District completed a temperature study of Lake Rufus Woods in November of 2004
and finalized a temperature monitoring report in 2005. Temperature strings were deployed in the reservoir between Grand Coulee Dam and Chief Joseph Dam. Temperatures at all sites in the reservoir followed a similar pattern of warming from June through September and cooling in October. Temperature patterns measured at the upstream stations during the June through August time period suggest that daily water temperature cycles were being largely controlled by Grand Coulee powerhouse operations. Vertical thermal gradients were apparent only in the forebay. These
35
gradients were weak and largely dominated by daily warming of waters resulting in a 2 to 3 °C difference in temperatures between the surface and bottom.
5.2.1.3.Research and Development • None during 2005.
5.2.1.4.Special Studies • The Seattle District participated in the design, modeling and water quality evaluation of
flow deflectors at Chief Joseph Dam. Deflector construction is scheduled to begin in 2006 and to be completed by 2009. The Seattle District has worked together with the U.S. Army Corps of Engineers Engineering Design Research Center on a hydraulic model for the design of the flow deflectors. In addition, the district has overseen construction specifications to assure that state, tribal, and federal water quality criteria will be met during deflector construction.
• The Seattle District completed a baseline assessment of fish hatchery water sources at
Chief Joseph Dam in 2005. Water quality samples collected from the relief tunnel, irrigation well, and forebay during 2004 were characterized by good water quality with only a few exceedances of the Washington Department of Fish and Wildlife (WDFW) recommended criteria for aquaculture and the WDOE and Colville Confederated Tribe (CCT) chronic criteria for surface waters. Exceedances of the WDFW criteria for pH occurred at the irrigation well while exceedances of the WDFW criteria for aluminum occurred at the relief tunnel and irrigation well. No PCBs or pesticides were detected during the study. Historical elevated concentrations of mercury and nitrite measured in the relief tunnel and forebay were not observed during the current study. Mercury concentrations measured during 2004 in the relief tunnel, irrigation well, and forebay were low and well below water quality criteria. Additionally, nitrite was not detected in any sample during the study. These data suggest that elevated concentrations of mercury and nitrate may not be a water quality concern for the proposed hatchery.
5.2.1.5.Coordination with Other Agencies • The Seattle District worked together with the Bureau of Reclamation, the Bonneville
Power Administration, National Marine Fisheries, the Colville Confederated Tribe, and the Washington Department of Ecology on implementing joint operations of Grand Coulee Dam and Chief Joseph Dam in order to reduce TDG in the Columbia River.
5.2.1.6.Scheduling for Project Evaluations • During 2006, water quality and sediment quality data collected during 2004 will be
evaluated and a water quality monitoring report completed.
5.2.1.7.Problems with Contracted Work • No problems with contracted work occurred at Chief Joseph Dam.
5.2.1.8.Innovative Techniques to Improve Water Quality • Joint operations between Grand Coulee and Chief Joseph Dam were investigated in order
to reduce TDG levels. A study conducted by the National Marine Fisheries (NMFS)
36

Water Quality Team (WQT) subgroup concluded that reductions to TDG saturations could be achieved in the Mid-Columbia River through joint operations of Grand Coulee Dam and Chief Joseph Dam. The study investigated the consequences of TDG saturation in the Mid-Columbia River from spilling via the outlet works at Grand Coulee Dam versus spilling via the existing spillway (no flow deflectors) at Chief Joseph Dam. The evaluation of water quality benefits were based on reducing TDG saturation above and below Chief Joseph Dam while maintaining a constant joint power output from both projects. Empirical equations were used to estimate the TDG exchange and power production from both projects subject to various background TDG levels, river flows, and power scenarios.
• Installation of flow deflectors at Chief Joseph Dam to reduce TDG contributions from
Chief Joseph Dam. During 2005, the Seattle District continued modeling and evaluating deflector designs for the installation of flow deflectors on all 19 spillway bays at Chief Joseph Dam.
5.2.2. Libby Dam and Lake Koocanusa
5.2.2.1.Water Quality Conditions and Issues • Current Conditions: Good • Current Issues: Total dissolved gas, temperature • Historical Problems: Nutrients, metals, temperature • Future Problems: Total dissolved gas, temperature
5.2.2.2.Data Collection and Analysis • Water quality monitoring at Libby Dam, Lake Koocanusa, and the Kootenai River
during 2005 consisted of a real time vertical profile temperature monitoring station in the forebay and a temperature monitoring station at the tailwater.
• The District continued real-time monitoring of total dissolved gas and temperature at the
tailwater fixed monitoring station during the spill season from April 1 to September 30, 2005.
5.2.2.3.Research and Development • None during 2005.
5.2.2.4.Special Studies • The Seattle District completed a total dissolved gas management study at Libby Dam to
provide a feasibility assessment of various structural and operational alternatives that could increase flows released from Libby Dam and reduce TDG in the Kootenai River below the dam.
• A temperature study of Lake Koocanusa continued in 2005. The purpose of the study
was to examine the thermal properties in the forebay to aid in determining Libby Dam release temperatures that would benefit downstream sturgeon populations. A single
37

temperature string was deployed in the forebay consisting of Vemco data loggers attached at various depths between the surface and bottom of the reservoir. Temperature was recorded every hour from April through November 2005.
5.2.2.5.Coordination with Other Agencies • None in 2005.
5.2.2.6.Scheduling Evaluations • In 2006, water quality data collected between 1975 and 2004 will be evaluated and the
results summarized in a report.
5.2.2.7.Problems with Contracted Work • No problems with contracted work.
5.2.2.8.Innovative Techniques to Improve Water Quality • None in 2005.
5.2.3. Albeni Falls Dam and the Pend Oreille River
5.2.3.1.Water Quality Conditions and Issues • Current Conditions: Good • Current Issues: Temperature, TDG • Historical Problems: Temperature, metals • Future Problems: Temperature, TDG, nutrients, metals, macrophytes
5.2.3.2.Data Collection and Analysis • The Seattle District continued real-time monitoring of total dissolved gas and
temperature at forebay and tailwater fixed monitoring stations during the spill season from April 1 to September 30, 2005.
• The District implemented a water quality monitoring program in 2005. Water quality
grab samples were collected at monthly intervals in Lake Pend Oreille at three stations from February through November. Water column composite samples were analyzed for conventionals, nutrients, and metals. Photic zone composite samples were analyzed for chlorophyll a and phytoplankton, while a ten (10) meter vertical tow was analyzed for zooplankton. Vertical profiles of temperature, dissolved oxygen, pH, and conductivity were recorded at each station. Water quality monitoring will establish baseline information on the physical, chemical, and biological condition of Lake Pend Oreille and the Pend Oreille River, and will better define the relationship between Albeni Falls Dam and the water quality in the Pend Oreille River.
5.2.3.3.Research and Development • None during 2005.
38

5.2.3.4.Special Studies • The Seattle District continued a two year temperature study of Lake Pend Oreille and the
Pend Oreille River system during 2005. Temperature monitoring is needed to establish adequate baseline information for the Pend Oreille River and Lake Pend Oreille during the summer months. This data will allow the Seattle District to define the potential relationship between Albeni Falls Dam operations and the temperature in the Pend Oreille River system upstream and downstream of the dam. An understanding of the possible impact of Albeni Falls Dam operations on the temperature in the Pend Oreille River system is of paramount importance because of the proposed Pend Oreille River Total Daily Maximum Load (TMDL) for temperature that may be implemented by the Washington State Department of Ecology (WDOE), the Idaho Department of Environmental Quality (IDEQ) and the United States Environmental Protection Agency (EPA). Baseline data will allow the Seattle District to share data and work together with these agencies to develop a meaningful Pend Oreille River temperature TMDL.
The objective of the monitoring program is to determine (1) the existing temperature of tributaries to Lake Pend Oreille and the Pend Oreille River, (2) the existing temperature regime in Lake Pend Oreille, and (3) the existing temperature in the Pend Oreille River upstream and downstream of Albeni Falls Dam. To meet the project objectives described above, automated thermal loggers were deployed at several stations in the Lake Pend Oreille and Pend Oreille River watershed, including the Clark Fork River, Lightning Creek, Pack River, and the Priest River. All temperature data was collected using Vemco and Onset automated thermal loggers programmed to record date, time and temperature in degrees Celsius every hour. Temperature loggers were deployed in March of 2005 and retrieved in November of 2005. Data will be analyzed and reported in 2006.
5.2.3.5.Coordination with Other Agencies • Seattle District worked in conjunction with the Washington Department of Ecology and
the Idaho Department of Environmental Quality to monitor water temperatures and total dissolved gas in the Pend Oreille River system for the development of a future temperature and total dissolved gas TMDL.
5.2.3.6.Scheduling Evaluations • During 2006, (1) water quality data from the 2005 sampling program will be compiled
and evaluated (2) temperature and total dissolved gas data collected during 2005 will also be compiled and evaluated (3) temperature data collected from the Pend Oreille system in 2004 and 2005 will be evaluated.
5.2.3.7.Problems with Contracted Work • No problems with contracted work.
5.2.3.8.Innovative Techniques to Improve Water Quality • None during 2005.
39
5.2.4. Howard A. Hanson Dam and the Green River
5.2.4.1.Water Quality Conditions and Issues • Current Conditions: Good • Current Issues: None • Historical Problems: Temperature, turbidity • Future Problems: Temperature, turbidity, nutrients, algae
5.2.4.2.Data Collection and Analysis • Water quality samples were collected at Howard Hanson Reservoir from April through
October 2005. The goal of the monitoring program was to characterize the water quality of Howard Hanson Reservoir during a normal water storage year to establish baseline conditions from which determination of potential water quality impacts from future elevated reservoir storage conditions can be assessed. Specifically, there was concern about the potential for increased reservoir elevations to lead to increased concentrations of nutrients, organic matter, and phytoplankton in the reservoir. To meet the project goals, water quality was monitored from one upstream river station and two in-reservoir stations every three weeks during normal pool elevations. Water quality parameters of concern included temperature, dissolved oxygen, nutrients (i.e. phosphorus and nitrogen), organic matter, chlorophyll a, and phytoplankton. Additional water quality parameters such as pH, conductivity, and alkalinity were monitored to help with the basic understanding of the limnology of the reservoir.
• The District implemented real-time monitoring of turbidity and temperature at the
tailwater fixed monitoring station. A new water quality monitoring station was installed on the Green River upstream of Howard Hanson Reservoir to monitor real-time turbidity and temperature.
5.2.4.3.Research and Development • None during 2005.
5.2.4.4.Special Studies • None during 2005.
5.2.4.5.Coordination with Other Agencies • Coordinated with Tacoma Public Utilities to monitor water quality at Howard Hanson
Reservoir.
5.2.4.6.Scheduling Evaluations • During 2006, the Seattle District will compile and evaluate water quality data collected
between 2002 and 2005.
5.2.4.7.Problems with Contracted Work • None during 2005.
40

5.2.4.8.Innovative Techniques to Improve Water Quality • None during 2005.
5.2.5. Lake Washington Ship Canal and Hiram Chittenden Locks
5.2.5.1. Water Quality Conditions and Issues • Current Conditions: Fair • Current Issues: Saltwater intrusion • Historical Problems: Saltwater intrusion, contaminated sediments • Future Problems: Contaminated sediments, benthic oxygen demand
5.2.5.2.Data Collection and Analysis The Seattle District is responsible for the Lake Washington Ship Canal (LWSC) water quality monitoring program. The goal of this program is to monitor saltwater intrusion into the LWSC to ensure that lock operations do not result in exceeding the Washington Department of Ecology 1 part-per-thousand salinity water quality criteria at the University Bridge. The data collected may also be used in the future for modeling of the interaction and effects that the locks have on Lake Washington and Lake Union. The program collects hourly readings from several depths at five different locations from April through October. In 2005, due to the lease expiration of the Gas Works site and a delay in the leasing of a new site, only four locations were monitored. The sensors are calibrated in the field monthly to ensure proper readings. They are then removed from November through March when flows are highest and there is no risk of saltwater encroachment on Lake Washington. From November through February sensors are cleaned and repaired. Sensors are calibrated in March to ensure proper function before deployment in April.
5.2.5.3.Research and Development • Water quality loggers were installed in Shilshole Bay downstream of the locks and fish
ladder to collect vertical profiles of salinity and temperature from June through September 2005. These data were used by Seattle District fishery biologists researching the movement and behavior of salmon and steelhead downstream of the fish ladder.
5.2.5.4.Special Studies • None in 2005.
5.2.5.5.Coordination with Other Agencies • The Seattle District continued to work together with the Washington Department of
Ecology to minimize saltwater intrusion into Lake Washington.
5.2.5.6.Scheduling Evaluations • No evaluations scheduled at this time.
5.2.5.7.Problems with Contracted Work • None in 2005.
41
5.2.5.8.Innovative Techniques to Improve Water Quality • The Seattle District uses numerous operational methods to minimize salt water intrusion
such as fewer lockages or using the small lock instead of the large lock, which uses about 25 times less water. Mechanical methods used to reduce salt water intrusion include salt water barriers installed in each lock as well as a salt water drain that removes denser salt water from the fresh water ship canal.
5.2.6. Mud Mountain Dam and the White River
5.2.6.1.Water Quality Conditions and Issues • Current Conditions: Good • Current Issues: Turbidity, sediments • Historical Problems: Turbidity, sediments • Future Problems: Turbidity, sediments
5.2.6.2.Data Collection and Analysis The Seattle District continued to monitor temperature and turbidity above and below Mud Mountain Dam to aid in regulating release patterns and to comply with state and federal regulations. Most water quality problems at Mud Mountain Dam are related to a high suspended-solids load associated with upstream glacial melt and erosion of sediment accumulations upstream of the project and in the reservoir. During and immediately following high flows and in association with some project maintenance procedures, relatively short-term high turbidity levels will be experienced that will exceed State of Washington water quality standards.
5.2.6.3.Research and Development • None during 2005.
5.2.6.4.Special Studies • None during 2005.
5.2.6.5.Coordination with Other Agencies • None during 2005.
5.2.6.6.Scheduling Evaluations • No evaluations scheduled at this time.
5.2.6.7.Problems with Contracted Work • No contracted work.
5.2.6.8.Innovative Techniques to Improve Water Quality • None during 2005.
42

5.2.7.
5.2.8.
Wynoochee Dam
5.2.7.1.Water Quality Conditions and Issues • Current Conditions: Good • Current Issues: Temperature • Historical Problems: Temperature • Future Problems: Temperature
5.2.7.2.Data Collection and Analysis • During the summer stratification period, Tacoma Public Utilities and the City of
Aberdeen collected in-situ measurements of temperature, dissolved oxygen, pH and specific conductivity at various depths in the water column, and furnished copies of the data to the Seattle District. The data were used to monitor reservoir thermal stratification at Wynoochee Dam.
• The intake temperature panel system was used to regulate downstream temperatures
during operation of the hydroelectric plant. The downstream temperature control point for the Wynoochee Project is the USGS River Gauging Station known as the Wynoochee River at Grisdale Gauge. A sensor at that gauging station reports river temperature on a real-time basis. In addition to the Grisdale Gauge, there is a sensor monitoring the temperature of the water in the hydroelectric plant tailrace.
5.2.7.3.Research and Development • None during 2005.
5.2.7.4.Special Studies • None during 2005.
5.2.7.5.Coordination with Other Agencies • The Seattle District coordinates all water quality monitoring at Wynoochee Dam with
Tacoma Public Utilities.
5.2.7.6.Scheduling Evaluations • No evaluations scheduled at this time.
5.2.7.7.Problems with Contracted Work • None during 2005.
5.2.7.8.Innovative Techniques to Improve Water Quality • None during 2005.
TDG Fixed Monitoring Program • The Seattle District operates and maintains five total dissolved gas (TDG) and
temperature fixed monitoring stations between April 1 and September 30 at three
43

projects in the Columbia Basin. Two stations (forebay and tailwater) are located at Chief Joseph Dam on the Columbia River, two stations (forebay and tailwater) are located at Albeni Falls Dam on the Pend Oreille River, and one station (tailwater) is located at Libby Dam on the Kootenai River. The purpose of the monitoring program is to provide real-time TDG data to the U.S. Army Corps of Engineers to allow for the understanding and management of flow and spill at dams on the Columbia River system.
5.2.9. TMDL Updates • Total maximum daily load (TMDL) plans have been proposed or issued on or near water
bodies that impact Albeni Falls Dam and Chief Joseph Dam.
5.2.9.1.Albeni Falls Dam and the Pend Oreille River Basin Regulating Agency Actions:
• Temperature TMDL: The Washington Department of Ecology has issued a proposal for a temperature TMDL on the Pend Oreille River from the Idaho Border to the Canadian Border. The Idaho Department of Environmental Quality is proposing a temperature TMDL on the river from Lake Pend Oreille to the Washington State Border.
• Total Dissolved Gas TMDL: The Washington Department of Ecology has issued a
proposal for a total dissolved gas TMDL on the Pend Oreille River from the Idaho Border to the Canadian Border.
• Nutrient TMDL: The Idaho Department of Environmental Quality has developed and
implemented a nearshore nutrient TMDL for Lake Pend Oreille and anticipates issuing a nutrient TMDL proposal for the Pend Oreille River downstream of Lake Pend Oreille to the Washington State Border.
Seattle District Actions:
• The Seattle District continued a two year temperature study of Lake Pend Oreille and the Pend Oreille River system during 2005. Temperature monitoring will establish baseline information for the Pend Oreille River and Lake Pend Oreille during the summer months. This data will allow the Seattle District to define the potential relationship between Albeni Falls Dam operations and the temperature in the Pend Oreille River system upstream and downstream of the dam.
• The District continued real-time monitoring of total dissolved gas and temperature at the
Albeni Falls Dam forebay and tailwater fixed monitoring stations during the spill season from April 1 to September 15, 2005.
• The District continued a total dissolved gas exchange study at Albeni Falls Dam, which
investigated how project operations and spill patterns can reduce gas saturations in the Pend Oreille River downstream of the dam.
44

• The District implemented a water quality monitoring program at Albeni Falls Dam during 2005 to determine existing concentrations of conventionals, nutrients and metals in the Pend Oreille River system.
5.2.9.2.Chief Joseph Dam and the Columbia River Basin Regulating Agency Actions:
• Total Dissolved Gas TMDL: In 2004, the Washington Department of Ecology, EPA and the Spokane Tribe issued a total dissolved gas TMDL on the Mid-Columbia River and Lake Roosevelt from the Canadian Border to the confluence with the Snake River.
• Temperature TMDL: The Washington Department of Ecology and EPA proposed a temperature TMDL on the Columbia River from the Canadian Border to the mouth. The status of this TMDL is uncertain.
• Toxics TMDL: The Washington Department of Ecology and EPA have proposed a
possible TMDL for contaminated sediments in Lake Roosevelt. Seattle District Actions:
• The District continued real-time monitoring of total dissolved gas and temperature at forebay and tailwater fixed monitoring stations during the spill season from April 1 to September 30, 2005.
• The District continued a joint operations procedure with Grand Coulee Dam to reduce
TDG in the Mid-Columbia River by switching spill via the outlet works at Grand Coulee to the existing spillway at Chief Joseph.
• The District continued the design, modeling, and construction of flow deflectors at Chief
Joseph dam to reduce the TDG produced by spillway releases of water. • The District completed a water quality and sediment quality monitoring program at Chief
Joseph Dam and Lake Rufus Woods. Water quality monitoring will establish baseline information on the physical, chemical, and biological condition of Lake Rufus Woods and the Columbia River, and will better define the relationship between Chief Joseph Dam and the water quality in the Columbia River. Sediment quality monitoring will establish baseline information to help the Seattle District define the relationship, if any, between contaminated sediments in Lake Roosevelt upstream of Grand Coulee Dam and sediments in Lake Rufus Woods, upstream of Chief Joseph Dam.
5.3. Laboratory and Field Equipment, and Technical Capabilities Seattle District water quality program requires various types of lab analysis, field equipment and technical expertise. The following is a list of how these needs are met.
• The Seattle District continues to use a variety of environmental contractors for water quality and sediment quality sampling and analysis. A partial list of these contractors includes Aquatic Research, Analytical Resources, Seattle Public Utilities, Columbia Basin Environmental, USGS, and the COE Engineer Research and Development Center (ERDC).
45

• The Seattle District maintains its own on-site laboratory for the collection and analysis of water and sediment samples. Analysis equipment available includes Hydrolab multi-probe water quality samplers (containing one or more of the following probes: total dissolved gas, turbidity, conductivity, pH, dissolved oxygen, temperature, depth), Orion pH, dissolved oxygen and conductivity meters, Hach turbidity meters, Vemco and Onset temperature loggers, and NIST certified thermometers and barometers. Sampling equipment available includes vertical point water samplers, a Ponar sediment sampler, and a simple plankton net. In addition, each project in the Seattle District operates and maintains sampling boats equipped with winches and depth sounders. The on-site laboratory is equipped to handle the calibration of field instruments and the QA/QC of total dissolved gas and temperature instruments. The laboratory has equipment to maintain and repair Hydrolab and Orion sampling equipment. In addition, the laboratory has sieves and ovens for sediment analysis.
• Equipment is purchased each year as needed and as funding permits in order to possess
and maintain reliable and accurate equipment for measuring various water quality parameters. Laboratory equipment purchases in 2005 include but are not limited to Hydrolab MiniSonde 4a water quality probes and cables for the Lake Washington Ship Canal, Albeni Falls Dam, and Libby Dam projects, and Onset temperature loggers for the Albeni Falls Dam and Libby Dam projects. In addition, purchases of other equipment to assist in field collection such as water quality standards, flashlights, tools, hardware, and cables were made in 2005.
5.4. Regulation Changes • None during 2005.
5.5. Data Management Activities The Seattle District water quality program is managing water quality data with current technology, which includes the following actions:
• Water Management Section’s primary real-time data management system is a microcomputer database using HEC-DSS with a user-friendly Visual Basic front-end. This database system has facilitated access and communication with the District's water control and water quality data collection system and has improved accessibility for data analysis and presentation. The Northwestern Division, North Pacific Region maintains a homepage that makes much of this data available to the public via the Internet. Data collection continues to be performed by Seattle District Office.
• The database DASLER (Data Management and Analysis System for Lakes, Estuaries,
and Rivers) was adopted in June 2003 in order to manage historic and current grab sample water quality data. The Seattle District will transfer grab sample data from DASLER to the EPA’s water quality database STORET. Data continues to be entered into the database.
46
5.6. Water Quality Reports Seattle District water quality staff wrote, coordinated or contracted to have written several major reports associated with various water quality activities, and the following is a list of them:
• Easthouse, K.B. and A.S. Klein. 2005. Total dissolved gas and temperature monitoring
at Chief Joseph Dam, Washington, Albeni Falls Dam, Idaho, and Libby Dam, Montana 2005: Data review and quality assurance. Final report prepared by the U.S. Army Corps of Engineers, Seattle District.
• Easthouse, K.B. and A.S. Klein. 2005. Water temperature studies at Chief Joseph Dam, Washington 2003: Data review and quality assurance. Final report prepared by the U.S. Army Corps of Engineers, Seattle District.
• Easthouse, K.B. and A.S. Klein. 2005. Forebay water temperature profile studies at
Libby Dam, Montana 2002 to 2004. Final report prepared by the U.S. Army Corps of Engineers, Seattle District.
• Easthouse, K.B. and A.S. Klein. 2005. Libby Dam January 2005 relay maintenance
operations total dissolved gas monitoring study. Final report prepared by the U.S. Army Corps of Engineers, Seattle District.
• Schneider, M., 2005. Final Draft Total Dissolved Gas Exchange at Albeni Falls Dam
May – June 2003. Draft report prepared for the U.S. Army Corps of Engineers, Seattle District by the U.S. Army Corps of Engineers, Engineer and Research Development Center (ERDC), Dallesport, WA.
• U.S. COE. 2005. Albeni Falls Dam: Pend Oreille River and Lake Pend Oreille
Temperature Monitoring Plan. U.S. Army Corps of Engineers, Seattle District. • U.S. COE. 2005. Howard A. Hanson Reservoir Water Quality Sampling and Analysis
Plan. U.S. Army Corps of Engineers, Seattle District. • U.S. COE. 2005. Albeni Falls Dam: Pend Oreille River and Lake Pend Oreille Water
Quality Monitoring Plan: 2005. U.S. Army Corps of Engineers, Seattle District. • U.S. COE. 2005. Lake Washington Ship Canal Water Quality Monitoring and Analysis
Plan. U.S. Army Corps of Engineers, Seattle District.
5.7. Meetings, Conferences, and Training
5.7.1. Participation in FY05 Seattle District staff attended several meetings, conferences and training, including:
• Kent Easthouse and Amy Klein attended the Transboundary Gas Group meeting in Sandpoint, ID, April 2005.
47

• Kent Easthouse attended the Tri-State Water Quality Council meeting in Butte, MT, October 2005.
• Kent Easthouse attended the Pend Oreille River Watershed Advisory Group (WAG)
meeting in Newport, WA, January 2005. • Amy Klein attended FE425: Wildland Hydrology course at the University of
Washington in 2005.
5.7.2.
5.8.1.
5.8.2.
Required/Recommended Future Training for In-House Staff The following is a list of future training for in-house staff:
• Kent Easthouse and Amy Klein: Recommend attending the EPA’s STORET database training course in 2006.
• Amy Klein: Recommend attending data quality assurance training courses in 2006. • Amy Klein: Recommend attending the EPA’s water quality standards course in 2006. • Amy Klein: Recommend attending the U.S. Army Corps of Engineers RES-SIM course
in 2006.
5.8. Personnel and Expenditures The following is a summary of the personnel and expenditures including in house expenditures and contracts.
In-House Expenditures The Seattle District’s Water Quality Management Program consists of the following personnel:
• Kent Easthouse: Water quality scientist, GS-12, 1 FTE. • Ray Strode: Lead technician, GS-11, ¼ FTE. • Linda Herman: Database administrator, GS-11, ¼ FTE. • Amy Klein: Biologist, GS-11, 1 FTE.
Contracts The Seattle District contracts are summarized on the following table:
48

Seattle District Water Quality Contracts Awarded in 2005
Amount
1. Columbia Basin Environmental: Dissolved gas sensor operation and maintenance for Chief Joseph Dam, Albeni Falls Dam, and Libby Dam.
$25,000
2. Aquatic Research Inc.: Water quality laboratory water and sediment analysis
$20,200
3. Aquatic Analysis: Chief Joseph Dam and Lake Rufus Woods phytoplankton analysis.
$2,500
4. Seattle Public Utilities: Howard Hanson Reservoir phytoplankton analysis
$1,000
5. Spokane Tribal Laboratories: Howard Hanson Reservoir and Chief Joseph zooplankton analysis
$2,500
Total $51,200
5.9. Special Coordination with other Corps Entities • None during 2005.
5.10. Seattle District Summary During 2005, the Seattle District Water Management Section continued to perform routine water quality data collection and evaluation at district projects, implement special studies and research projects, and coordinate monitoring efforts with local, state, and federal agencies. Achievement of the water quality management program 2005 objectives and goals stated in the Introduction Section are summarized below.
• Objective 1: Continue routine water quality sampling at Libby Dam (Lake Koocanusa and the Kootenai River) and Howard Hanson Dam (Howard Hanson Reservoir and the Green River.
Status: The objective was achieved at Howard Hanson Dam in 2005 but water
quality sampling did not occur at Libby Dam in 2005.
• Objective 2: Continue real-time data collection of water quality temperature and salinity
at the Lake Washington Ship Canal to assist in operational decisions of the ship canal and the locks for control of saltwater intrusion into Lake Washington.
Status: This water quality objective was achieved in 2005.
• Objective 3: Continue real-time data collection system of hydrological, meteorological,
and water quality data at rivers and reservoirs throughout Washington, Northern Idaho, and Western Montana.
Status: This water quality objective was achieved in 2005.
49
• Objective 4: Continue a temperature study on the Pend Oreille River system near Albeni Falls Dam to assist in the development of an appropriate temperature TMDL and promote a better understanding how Albeni Falls Dam may impact the Pend Oreille River system.
Status: This water quality objective was achieved in 2005.
• Objective 5: Continue the temperature study at Libby Dam forebay to assess the
accuracy of the automated temperature string on the face of the dam. Accurate readings are imperative for the selective withdrawal system and management of downstream water temperatures.
Status: This water quality objective was not achieved in 2005. Although sensors
were deployed, they were vandalized and the data unusable. Monitoring will resume in 2006.
• Objective 6: Continue to work together with the Bureau of Reclamation’s Grand Coulee
Dam and the Corps’ Chief Joseph Dam to implement joint operations between Grand Coulee Dam and Chief Joseph Dam to reduce total dissolved gas levels on the Columbia River system.
Status: This water quality objective was achieved in 2005.
• Objective 7: Continue to provide water quality and hydraulic expertise and support in
the design and installation of flow-deflectors at Chief Joseph Dam to reduce TDG levels.
Status: This water quality objective was achieved in 2005.
• Objective 8: Continue to monitor total dissolved gas (TDG) at five (5) permanent sites
located at the forebay and tailwater of Chief Joseph Dam, the forebay and tailwater of Albeni Falls Dam, and the tailwater of Libby Dam.
• Status: This water quality objective was achieved in 2005. • Objective 9: Complete a total dissolved gas management study at Libby Dam to provide
a feasibility assessment of various structural and operational alternatives to allow higher flows past the dam while reducing TDG saturations in the Kootenai River below the dam.
Status: This water quality objective was achieved in 2005.
• Objective 10: Complete the 2003 total dissolved gas exchange study at Albeni Falls
Dam to evaluate TDG in the Pend Oreille River during various spill conditions.
50
Status: This water quality objective was not achieved in 2005. A final report is expected by May 2006.
• Objective 11: Research and lease a new Gas Works water quality monitoring site for the
Lake Washington Ship Canal data collection program.
Status: This water quality objective was achieved in 2005. • Objective 12: Implement a water quality study at Albeni Falls Dam to establish baseline
information on the physical, chemical, and biological condition of Lake Pend Oreille and the Pend Oreille River system.
Status: This water quality objective was achieved in 2005.
• Objective 13: Complete a water quality study at Chief Joseph Dam to establish baseline
information on the physical, chemical, and biological condition of Lake Rufus Woods and the Columbia River.
Status: This water quality objective was achieved in 2005.
• Objective 14: Continue a water temperature study upstream and downstream of Albeni Falls Dam to establish baseline information for the Pend Oreille River system and Lake Pend Oreille for future TMDLs, and to study how Albeni Falls Dam may impact the Pend Oreille River system.
Status: This water quality objective was achieved in 2005.
• Objective 15: Move Albeni Falls Tailwater TDG monitoring station closer to the dam to
a location that is more representative of downstream conditions. Status: This water quality objective was achieved in 2005.
6. Walla Walla District Activities
6.1. Introduction The Walla Walla District project area includes; McNary Reservoir in the Mid Columbia River, 134 miles of reservoirs on the lower Snake River, Dworshak Reservoir and the Clearwater river system from Orofino to Lewiston, Idaho. Ongoing monitoring and evaluation of temperature and TDG measurements at District projects continued in water- year 2005. Efforts were made to improve water quality sampling measures and obtain high quality data. The data is relevant in controlling dissolved gas supersaturation in the river systems and identifying management operations to effect basin wide changes in dissolved gas saturation levels. Work efforts continued in order to evaluate the effects of temperature differentials on fish passage. These efforts included the multi-agency SYSTDG model. Walla Walla District provided funding to the Engineering Research and Development Center (ERDC) to develop computations for this model. Alternative or corrective measures will be identified and tested as part of a multi phase plan.
51
6.2. Water Quality Conditions, Data Collection/Analysis and Activities/Investigations The Walla Walla District water quality program activities during 2005 covered the Lower Snake River, Boise River, and the Lower Columbia River. The Lower Snake Projects include Lower Granite; Little Goose; Lower Monumental; and Ice Harbor. The Boise River has one project and it is Lucky Peak reservoir. McNary dam is the only project on the Columbia River that Walla Walla District manages. The following is the general overview of the water quality conditions, data collection/analysis and activities at these projects performed during 2005.
6.2.1. McNary Project and Reservoir Reservoir temperature data proximal to forebays was collected in 2004 using Onset® temperature sensors during the continuing Review and Evaluation of TDG Forebay Fixed Monitoring Stations Study. The results of the Reasonable Prudent Action (RPA) 132 study recommended that McNary Oregon forebay be removed from service since it is not representative of the River temperature regime. The station will probably be removed in FY06. Hourly measurements for TDG, barometric pressure (BP) and temperature at the McNary Washington Forebay (MCQW) and McNary Tailwater (MCPW) were 100 percent complete for all of the parameters. The McNary Oregon Forebay (MCQO) data was 100 percent complete for barometric pressure; 98.5 percent complete for TDG; and 96.2 percent complete for temperature. Quality Assurance / Quality Control (QA/QC) records for field calibration revealed only minor differences at the Tail water station (MCPW) between the in-place and replacement sondes with overall averages of 0.20 mm Hg for BP, -0.3 percent TDG saturation, and -0.3 degrees C. At the Washington Forebay FMS station the overall averages of 0.7 mmHg for BP; -0.3 percent TDG saturation; and -0.01 degrees C were observed. At the Oregon Forebay FMS station the overall averages of -0.5 mmHg, -0.2 percent saturation; and 0.00 degrees C were observed. The McNary Oregon Forebay TDG Fixed Monitoring Site (FMS) station scheduled to be decommissioned on FY06. Studies from 2003 to 2005 under RPA 132 showed the station did not provide representative data. The study also recommended the McNary Washington Forbay site was sufficiently representative to operate as the McNary forebay monitoring site. A TDG FMS site is also operated at Pasco, Washington on the East bank of the River as part of the McNary TDG FMS. This station provides the district with a boundary condition. The station data was 100 percent complete for barometric pressure and temperature, but only 94.8 percent complete for TDG. The primary problem was low measurement due to poor circulation in the pipe. This problem was fixed early in the spill season and the station performed well for the rest of the year. At Pasco, the overall averages were -0.3 mmHg for the BP; -0.8 percent saturation for the TDG; and -0.27 degrees C for the temperature. OA Systems Inc., collected temperature data for the McNary Computational Fluid Dynamics (CFD) Temperature Model in 2004 and 2005. This data included several transects taken across the forebay. This data will be used to validate the CFD model being constructed for the analysis of potential modifications to dam operations and structural modifications. The objectives of this model are:
-Development and use of a Computational Fluid Dynamics (CFD) Temperature Model.
52

-Evaluation of alternatives to improve temperature conditions at McNary Dam -Evaluate and recommend operational or structural modifications to improve fish survival
Limnological field water quality data was collected at Columbia River miles 295 and 326. Zooplankton, chlorophyll ά and phytoplankton were identified and enumerated at sample sites. Four serial sample trips were conducted in the summer months.
6.2.2.
6.2.3.
Ice Harbor Project and Reservoir Hourly measurements for TDG, BP and temperature at the Ice Harbor Forebay (IHRA) and McNary Tailwater (IDSW) were 100 percent complete and 99 percent complete respectively, for all of the parameters. QA/QC records for field calibration revealed only minor differences at the tail water station (IDSW) between the in-place and replacement sondes with overall averages of 0.20 mm Hg for BP, -0.1 percent TDG saturation, and -0.02 degrees C. At the forebay FMS station (IHRA) the overall averages of -0.2 mmHg for BP; -0.3 percent TDG saturation; and 0.0 degrees C were observed. Reservoir temperature monitoring continued. Temperatures were also monitored mid pool, at the boat restricted zone buoy and face of the dam. The relocation of the forebay station to the upstream lock guidewall was to avoid thermal induced pressure spikes. Evaluation of temperature differentials is ongoing at the fishways. Ice Harbor adult fish passage facilities have not been identified as having significant temperature differentials. Information from multiple studies indicates a temperature gain from Lower Granite to Ice Harbor. This is noticeable particularly when releases at Dworshak Reservoir were being used to cool the Snake River. Limnological field data was collected at Snake River mile 18 near Fishhook Park. Zooplankton, chlorophyll ά and phytoplankton were identified and enumerated at sample sites. Four serial sample trips were conducted in the summer months.
Lower Monumental Project and Reservoir Hourly measurements for TDG, BP and temperature at the Lower Monumental Forebay (LMNA) and Lower Monumental Tailwater (LMNW) were 100 percent complete for all of the parameters. QA/QC records for field calibration revealed only minor differences at the tailwater station (LMNW) between the in-place and replacement sondes with overall averages of -0.6 mm Hg for BP, -0.2 percent TDG saturation, and -0.09 degrees C. At the Forebay FMS station (LMNA) the overall averages of 0.09 mmHg for BP; -0.3 percent TDG saturation; and 0.02 degrees C were observed. Temperatures were rather uniform early and late in the season at the adult fish passage facilities. However pronounced temperature differentials (>5 degrees C) occurred in the summer months between the adult fishway downstream ends and upstream exit pools at Lo Mo North. Limnological field data was collected at Snake River mile 50. Zooplankton, chlorophyll ά and phytoplankton were identified and enumerated at sample sites. Four serial sample trips were conducted in the summer months.
53
6.2.4.
6.2.5.
Little Goose Project and Reservoir Hourly measurements for TDG, BP and temperature at the Little Goose Forebay (LGSA) and Little Goose Tailwater (LGSW) were 100 percent complete for all of the parameters. QA/QC records for field calibration revealed only minor differences at the tail water station (LGSW) between the in-place and replacement sondes with overall averages of 0.1 mm Hg for BP, -0.4 percent TDG saturation, and -0.01 degrees C. At the forebay FMS station (LGSA) the overall averages of 0.35 mmHg for BP; -0.3 percent TDG saturation; and -0.01 degrees C were observed. Wastewater treatment facility compliance testing was performed. Test results and NPDES (National Pollution Discharge Elimination System) reports were forwarded to regulatory agencies. From June 1st to September, 30th, 2005 several Onset® temperature data loggers were installed in the adult fish ladders to take hourly temperature readings. The project biologists download the sensors every 3 weeks. The data set for all fish facilities are compiled and annotated annually at the district office. An ongoing problem was discovered by Rex Baxter (fisheries biologist with operations division) with a temperature differential from the top of the ladder to the bottom of the ladder. The problem is greatest in the summer months where temperature differentials exceed 10ºC in the summer months. This is hypothesized to contribute to the problem of adults stopping movement in and out of the ladder when the temperature differential is most pronounced. A part of the phase two study, biologists are comparing past radio tag data to see if this data correlates with the Onset® data. The problem is worse at Lower Granite than Little Goose. Limnological field data was collected at Snake River mile 82 near Central Ferry. Zooplankton, chlorophyll ά and phytoplankton were identified and enumerated at sample sites. Four serial sample trips were conducted in the summer months.
Lower Granite Project and Reservoir Hourly measurements for TDG, BP and temperature at the Little Goose forebay (LWGA) and Little Goose tailwater (LGNW) were 100 percent complete for all of the parameters. The Peck, Idaho station (PEKI) was 100 percent complete for water temperature and barometric pressure, but TDG was 95.2 percent complete. QA/QC records for field calibration revealed only minor differences at the tail water station (LGNW) between the in-place and replacement sondes with overall averages of -0.2 mm Hg for BP, -0.3 percent TDG saturation, and -0.07 degrees C. At the Forebay FMS station (LWGA) the overall averages of -0.7 mmHg for BP; -0.1 percent TDG saturation; and 0.00 degrees C were observed. The primary data anomalies at Peck were due to data spikes and a faulty membrane on the TDG sensor. At the Peck, ID station overall averages of 0.0 mmHg for BP; -0.1 percent TDG saturation; and 0.03 degrees C were observed. From June 1st to September, 30th, 2005 several Onset® temperature data loggers were installed in the adult fish ladders to take hourly temperature readings. The project biologists download the sensors every 3 weeks. This problem is worst at Lower Granite in comparison to the other fish facilities. This problem is currently in phase two study. The third phase will consist of a design and feasibility study with the fourth phase being construction and post construction biological
54
analysis. The phase three design and feasibility study is scheduled to begin sometime in FY07 or FY08. The Lower Granite wastewater treatment facility received an updated digital timer to better regulate oxygenation in the raw water aeration tank. Dissolved oxygen continued to be routinely monitored and adjusted in the system to maintain quality compliant effluents. Phil Fishella provided training for the Lower Granite wastewater treatment operators. Compliance testing was performed. Test results and NPDES reports were forwarded to regulatory agencies. Limnological samples were taken at Snake River miles 108 and 129 for a variety of water quality parameters. Sampling also included zooplankton, chlorophyll ά and phytoplankton identification and enumeration. Samples were also taken in the Clearwater River between Clearwater River Miles 2 and 3. Four serial sample trips were conducted in the summer months. Three temporary water quality monitoring sites were installed on floating pontoons in the Snake and Clearwater Rivers near their confluence to collect ancillary water quality data to support on-going data collection activities. This data will be used to assess natural background conditions and variability prior to the proposed 2005-2006 dredging project and development of the Programmatic Sediment Management Plan. A YSI 6600 sonde, and a Stevens/Greenspan CS304 sonde was deployed at mid-column depth from each pontoon. The instruments were deployed at 2.5m, 8m, and 14m at CWMB (Clearwater Memorial Bridge, ID), SR141 (Southway Bridge on the Snake River, Washington), and SRRW (Red Wolf Bridge, Washington), respectively.
6.2.6. Dworshak Project and Reservoir Hourly measurements for TDG, BP and temperature at the Dworshak Tailwater (DWQI) were 100 percent complete for barometric pressure; 94 percent complete for TDG; and 98.9 percent complete for temperature. QA/QC records for field calibration revealed only minor differences at the Tail water station (DWQI between the in-place and replacement sondes with overall averages of -0.1 mm Hg for BP, -0.1 percent TDG saturation, and -0.02 degrees C. The Anatone, Idaho station (ANQW) was 100 percent complete for all parameters. The ANQW the overall averages of 0.1 mmHg for BP; -0.4 percent TDG saturation; and 0.00 degrees C were observed. The Lewiston, Idaho station (LEWI) was 100% for all parameters. The LEWI overall averages of 0.17 mmHg for BP; -0.3 percent TDG saturation; and -0.09 degrees C were observed. As part of an ongoing temperature monitoring program in Dworshak Reservoir chain thermistors are in place at six reservoir and eight stream sites. The thermisters consisted of a float and varied numbers of Onset® or Apprise® SDI-12 chains at each station. In the streams, two Onset® (one primary and redundant sensor) temperature loggers were installed at one point. In 2005 temperature data was downloaded twice. Major repairs to the float systems were completed in FY04. A cooperative project with Idaho Fish and Game (IDFG) was accomplished on the Dworshak reservoir. IDFG collected the field data and water samples during the latter half of June, July, August, and September. Walla Walla District funded the analyses nutrient, zooplankton,
55

chlorophyll ά and phytoplankton samples. Seventy-six samples were analyzed for nutrient samples and 40 biological samples were analyzed.
6.2.7.
6.2.8.
6.2.9.
6.2.10.
Mill Creek and Virgil B. Bennington Lake No routine water quality activities were conducted at this project. Most of the identified water quality problems associated with turbidity increase occurring during the periods of extended precipitation. Most of the problems were reported by anglers.
Lucky Peak Reservoir (Boise River) A sample and analyses program analogous to the one prescribed for the lower Snake River and McNary Reservoir was also completed for Lucky Peak Reservoir. Sampling sites consisted of five reservoir stations with the same suite of analytes included in the lower Snake River/ McNary Reservoir sample plan. Four sample trips were also conducted during this season.
Lewiston Levees Local citizen environmental action groups after viewing satellite thermal imagery generated legal concerns involving discharges from the levee ponds. An out of court settlement required the Corps to consult with the Fish and Wildlife service under Section 7 of the Endangered Species Act (ESA). The settlement also required temperature monitoring data, water quality data (organics, metals and nutrients), and information to assist the USEPA in issuing a section 402 NPDES permit to the city of Lewiston. Water quality personnel installed a series of Onset® temperature data loggers in the levee pond pump houses, above the discharges and below the discharges. The temperature data loggers were installed from July to the end of August, 2005. A temperature report to in support of the ESA consultation was submitted to Walla Walla District Office of Counsel in 2005. In March, 2005 and October, 2004, OA Systems Inc., sampled the levee pond effluents for pesticides, herbicides, nutrients, metals, dioxins, petroleum products and volatile organic compounds. The only water quality concern found during this study was high levels (in excess of 10 mg/L) of nitrate in the “A” pond. The nitrate was historically associated with an adjacent city waste water treatment facility and county solid waste composting activity. ERDC was contracted to provide a biological risk assessment. Results of this study showed there was no measurable water quality or thermal pollution effects caused by transferring water from the levee ponds to the Clearwater River.
TDG Fixed Monitoring Program Hourly TDG, temperature, and barometric data were recorded during the 2005 water year at 16 FMS stations. Half of the stations were operated throughout the year and the other half were monitored from 1 April to 15 September. Field instrument calibration revealed only minor differences between the in place sonde and replacement sondes. Hourly barometric pressure, TDG and temperature data were greater than 94 percent complete at all stations. Total gas saturation did not exceed 125 percent at any TDG station between 1 April and 15 September.
56
6.3. Laboratory and Field Equipment and Technical Capabilities Walla Walla District water quality program requires various types of lab analysis, field equipment and technical expertise. The following is a description of how these needs are met. Walla Walla District maintains the capacity to collect water and sediment samples throughout the district. Equipment available includes:
a. A two-man canoe. b. An 18-ft outboard jet boat. c. One 23-ft aluminum work vessel. d. A Ford F350 super duty service body truck (GSA). e. Two acoustic doppler profilers. f. Sixty-five water quality multi-probe profilers. g. Comprehensive groundwater sampling apparatus, plus biological sample and analysis equipment. h. Sediment Ponar and core samplers, winches and other related instruments and equipment.
The laboratory also monitors and maintains contracts for the analysis of metals and organic contaminants in support of District missions. The laboratory has detailed apparatus for the evaluation of most wastewater parameters.
6.4. Regulation Changes No new regulations were created at the District level.
6.5. Data Management Activities The Walla Walla District water quality program is managing water quality data with current technology, which includes the following actions:
• Russ Heaton worked on sediment quality data including previously collected sediment quality data into the SEDQUAL database.
6.6. Water Quality Reports Walla Walla District water quality staffs wrote, coordinated, or contracted to have written several major reports associated with various water quality activities, and the following is a list of them:
• Phil Fishella provided input to the Laboratory Analysis Contract which will be fulfilled through a Seattle District Contract.
• Dr. Steve Juul and Russ Heaton provided input to the 2005 Total Dissolved Gas
monitoring plan and Dissolved Gas monitoring Report. • Dr. Steve Juul completed a water temperature monitoring report outlining the methods
materials and findings from the 2005 Lewiston Pond studies.
57
6.7. Meetings, Conferences and Training 1. Dr. Steve Juul attended numerous meetings as a PDT member of the Lower Snake River
Channel Maintenance Dredging. 2. Dr. Steve Juul was involved in the Fort Hall Section 203 - Planning Assistance to States
Study. The section 905B report will be completed in 2006. 3. Dr. Steve Juul is involved as a PDT member on the Dworshak Nutrient Enrichment Program. 4. Phil Fishella served as chemical committee member for RSET. He participated in
Committee scheduled phone conferences, submitted technical information and attended the RSET meeting in Olympia.
5. Phil Fishella submitted comments to Washington Department of Ecology in regards to the
Walla Walla River TMDL Studies. 6. Russ Heaton was deployed to Iraq and in support of Hurricane Katrina Relief (New Orleans;
9th ward), for the National Guard during most of fiscal 2005. 7. Russ Heaton attended the Regional Sediment Evaluation Framework (RSET) meeting at
Portland Oregon in September, 2005.
6.7.1.
6.7.2.
6.8.1.
Training Attended in FY04 No training was received in FY05. Phil Fishella conducted several training sessions in wastewater and drinking water management to Lower Granite and Corps project employees. He helped correct wastewater system operational problems.
Required/Recommended Future Training for In-House Staff No future training recommended at this time.
6.8. Personnel and Expenditures
In House Expenditures The Walla Walla District’s Water Quality Management Program consists of the following personnel during 2005:
Dr. Steve Juul: Water Quality Specialist, GS-12, 1 FTE. Phil Fishella: Limnologist, GS-11, 1 FTE Russ Heaton: Limnologist, GS-11, 0.5 FTE.
The Walla Walla District Hydrology water quality section employs a water quality specialist and two limnologists. They have over 15 years experience in the limnology and water quality related fields. The staff has technical expertise in; watershed assessments, TDG and water quality monitoring system design and analysis, instream flow incremental methodology, lake and stream
58

restoration, hazardous materials, aquatic plant management, fish management, wetland ecology, wastewater and drinking water management.
6.8.2. Contracts The Walla Walla District contracts are summarized in Table 1 below:
Table 1
Walla Walla District Contracts for 2005
Agency Contract Project AmountNWW OA Systems Inc., of Amarillo, TX Lewiston Levee Pond, ID, water sampling $165,467
NWW ERDC - Vicksburg, MSLewiston Levee Pond, ID, Biological Risk
Assessment $25,041NWW OA Systems of Amarillo, TX McNary temperature data collection $39,900
NWW OA Systems Inc., of Amarillo, TXRepair of Dworshak TDG monitoring site
sonde deployment pipe $22,459
NWW OA Systems Inc., of Amarillo, TXRPA 132 Review of McNary TDG monitoring
sites $113,665.86
NWW ERDC - Vicksburg, MSRPA 133 SYSTDG model equation
modifications $18,416.73
NWW OA Systems Inc., of Amarillo, TXRPA 143 McNary Temperature Modeling
Study $348,587.66
NWW ERDC - Vicksburg, MSRPA 143 McNary Temperature Modeling
Study $163,616.36
NWW OA Systems Inc., of Amarillo, TX
Install water quality monitoring floats on the Clearwater - Snake River confluence Programatic Dredge Material Study $16,000
NWW USGS - Pasco, WA Routine Maintenance of TDG FMS stations $300,000
NWW OA Systems Inc., of Amarillo, TX
Limnological Analysis of Lucky Peak, Dworshak, Lower Snake, and the McNary
Reservoirs $146,446Total $1,359,600
6.9. Special Coordination with other Corps Entities Dr. Michael Schneider of the Corps of Engineers ERDC was involved in scopes of work for RPA 143. Mike also is developing and updating the SYSTDG for RPA-133, a system wide TDG gas model for spill management, which is currently in draft form.
6.10. Walla Walla District Summary Hourly TDG, temperature, and barometric data were recorded during the 2005 water year at 16 FMS stations. Half of the stations were operated throughout the year and the other half were monitored from 1 April to 15 September. Field instrument calibration revealed only minor differences between the in place sonde and replacement sondes. Hourly barometric pressure, TDG, and temperature data were greater than 94 percent complete at all stations. Total gas saturation did not exceed 125 percent at any TDG station between 1 April and 15 September. In efforts to provide high quality data and improve the TDG system, representativeness of existing TDG fixed forebay monitors were evaluated. Forebay monitors were relocated this year to the upstream to the end of the lock guidewall at Ice Harbor, Lower Monumental, Little Goose
59

and McNary. The fixed forebay monitor at Lower Granite and Washington were placed deeper, to depths of about 12 to 15 meters to avoid temperature layering. The McNary, Oregon fixed TDG monitoring site was determined to be inadequate to characterize TDG and temperate. Studies from 2003 to 2005 under RPA 132 showed the station was not representative. The study also recommended the McNary Washington Forbay site as being sufficiently representative to act a forebay monitoring site analogous to the same sites located on the Snake and Lower Columbia Rivers. The McNary Oregon site will be discontinued at the end of this year’s monitoring season. Water temperatures were characterized in the ongoing Adult Lower Snake River Dam Fishways Study. The fishways at Lower Granite, Little Goose and Lower Monumental North were emphasized for corrective measures in the multi-phase study. This was due to frequently occurring temperature differentials during summer months of greater than 5 degrees F° between the downstream ladder entrance and the exit pools. The phase three design and feasibility study is scheduled to begin sometime in FY07 or FY08. In reservoir and stream site temperature station data was downloaded from arrays at Dworshak Reservoir. Station equipment was replaced or repaired as needed. The TDG pipe installation was repaired in the North Fork of the Clearwater below Dworshak dam. Conventional water quality data was collected in 2005 on the Clearwater, Lower Snake River, Columbia River, and Lucky Peak. Four serial sample trips were conducted for the purpose of limnological data collection. The sample parameters included chlorophyll a, nutrients, zooplankton, Secchi disk, and phytoplankton. Water and wastewater compliance testing was performed at Little Goose and Lower Granite projects.
6.11. Water Quality Objectives for Next Year: 2006 OBJECTIVE 1: Produce a comprehensive report on monitoring activities from the FY06 confluence dredging activities. The report will focus on turbidity, ammonia, pH, and dissolved oxygen. OBJECTIVE 2: Continue to incrementally build the sediment database using the SEDQUAL database program? OBJECTIVE 3: Complete RPA 143. OBJECTIVE 4: Begin a water quality study to determine the risk associated with extending the TDG monitoring system maintenance to three week or monthly intervals in the Walla Walla District. OBJECTIVE 5: Develop a long term water quality monitoring plan at the Lewiston Levee ponds in cooperation with the Clarkston Resource Manager.
60
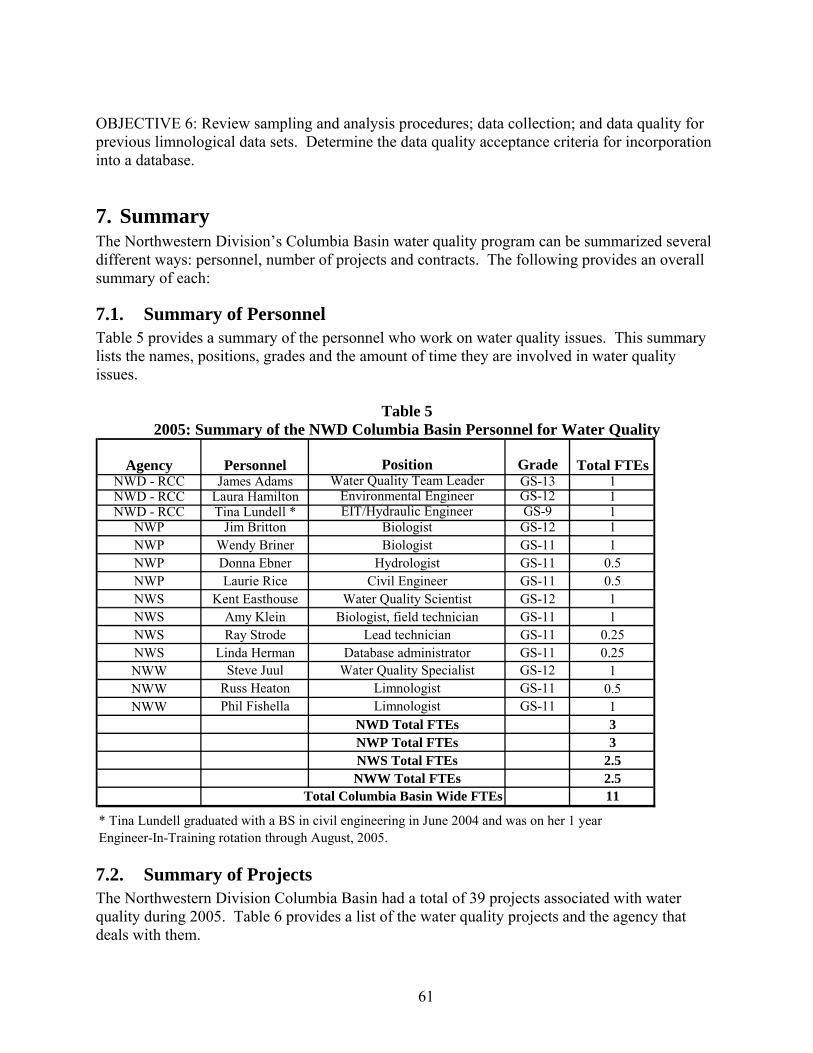
OBJECTIVE 6: Review sampling and analysis procedures; data collection; and data quality for previous limnological data sets. Determine the data quality acceptance criteria for incorporation into a database.
7. Summary The Northwestern Division’s Columbia Basin water quality program can be summarized several different ways: personnel, number of projects and contracts. The following provides an overall summary of each:
7.1. Summary of Personnel Table 5 provides a summary of the personnel who work on water quality issues. This summary lists the names, positions, grades and the amount of time they are involved in water quality issues.
Table 5 2005: Summary of the NWD Columbia Basin Personnel for Water Quality
Agency Personnel Position Grade Total FTEsNWD - RCC James Adams Water Quality Team Leader GS-13 1NWD - RCC Laura Hamilton Environmental Engineer GS-12 1NWD - RCC Tina Lundell * EIT/Hydraulic Engineer GS-9 1
NWP Jim Britton Biologist GS-12 1NWP Wendy Briner Biologist GS-11 1NWP Donna Ebner Hydrologist GS-11 0.5NWP Laurie Rice Civil Engineer GS-11 0.5NWS Kent Easthouse Water Quality Scientist GS-12 1NWS Amy Klein Biologist, field technician GS-11 1NWS Ray Strode Lead technician GS-11 0.25NWS Linda Herman Database administrator GS-11 0.25NWW Steve Juul Water Quality Specialist GS-12 1NWW Russ Heaton Limnologist GS-11 0.5NWW Phil Fishella Limnologist GS-11 1
NWD Total FTEs 3NWP Total FTEs 3NWS Total FTEs 2.5NWW Total FTEs 2.5
11
* Tina Lundell graduated with a BS in civil engineering in June 2004 and was on her 1 year Engineer-In-Training rotation through August, 2005.
Total Columbia Basin Wide FTEs
7.2. Summary of Projects The Northwestern Division Columbia Basin had a total of 39 projects associated with water quality during 2005. Table 6 provides a list of the water quality projects and the agency that deals with them.
61

Table 6 2005: List of the NWD Columbia Basin Personnel Water Quality Projects
Agency ProjectNWD - RCC Spill Management of the Columbia and Snake RiversNWD - RCC TDG and Temperature Monitoring of the Columbia and Snake RiversNWD - RCC TDG ModelingNWD - RCC Temperature ModelingNWD - RCC Water Quality Data ManagementNWD - RCC Total Maximum Daily Loads (TMDLs)NWD - RCC Use Attainability Analysis (UAA)NWD - RCC Regional Coordination and Water Quality Issues
NWP Bonneville, The Dalles, John Day Dams and the SRSNWP Applegate and Lost Creek DamsNWP Blue River and Cougar DamNWP Cottage Grove DamNWP Detroit and Big Cliff DamsNWP Dexter DamNWP Fern Ridge DamNWP Green Peter and Foster DamsNWP Hills Creek DamNWP Lookout Point DamNWP Willow Creek DamNWP TMDL ActivitiesNWS Chief Joseph Dam and Lake Rufus WoodsNWS Libby Dam and Lake KoocanusaNWS Albeni Falls Dam and the Pend Oreille RiverNWS Howard Hanson Dam and the Green RiverNWS Lake Washington Ship Canal and Hiram Chittenden LocksNWS Mud Mountain Dam and the White RiverNWS Wynoochee DamNWS TDG Fixed Monitoring ProgramNWS TMDL UpdatesNWW McNary Project and ReservoirNWW Ice Harbor Project and ReservoirNWW Lower Monumental Project and ReservoirNWW Little Goose Project and ReservoirNWW Lower Granite Project and ReservoirNWW Dworshak Project and ReservoirNWW Mill Creek and Virgil B. Bennington LakeNWW Lucky Peak Reservoir (Boise River)NWW Lewiston LeveesNWW TDG Fixed Monitoring ProgramNWD Total number of projects = 8NWP Total number of projects = 12NWS Total number of projects = 9NWS Total number of projects = 10
62
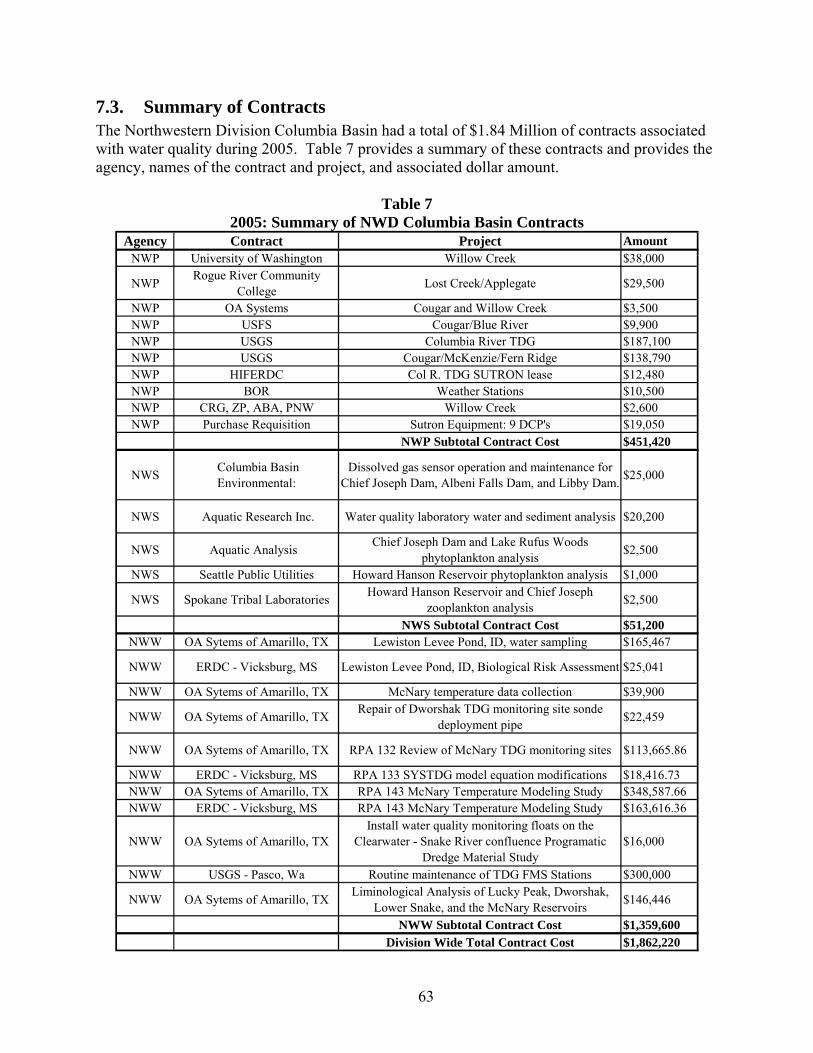
7.3. Summary of Contracts The Northwestern Division Columbia Basin had a total of $1.84 Million of contracts associated with water quality during 2005. Table 7 provides a summary of these contracts and provides the agency, names of the contract and project, and associated dollar amount.
Table 7
2005: Summary of NWD Columbia Basin Contracts Agency Contract Project Amount
NWP University of Washington Willow Creek $38,000
NWP Rogue River Community College Lost Creek/Applegate $29,500
NWP OA Systems Cougar and Willow Creek $3,500 NWP USFS Cougar/Blue River $9,900 NWP USGS Columbia River TDG $187,100 NWP USGS Cougar/McKenzie/Fern Ridge $138,790 NWP HIFERDC Col R. TDG SUTRON lease $12,480 NWP BOR Weather Stations $10,500 NWP CRG, ZP, ABA, PNW Willow Creek $2,600 NWP Purchase Requisition Sutron Equipment: 9 DCP's $19,050
NWP Subtotal Contract Cost $451,420
NWS Columbia Basin Environmental:
Dissolved gas sensor operation and maintenance for Chief Joseph Dam, Albeni Falls Dam, and Libby Dam. $25,000
NWS Aquatic Research Inc. Water quality laboratory water and sediment analysis $20,200
NWS Aquatic Analysis Chief Joseph Dam and Lake Rufus Woods phytoplankton analysis $2,500
NWS Seattle Public Utilities Howard Hanson Reservoir phytoplankton analysis $1,000
NWS Spokane Tribal Laboratories Howard Hanson Reservoir and Chief Joseph zooplankton analysis $2,500
NWS Subtotal Contract Cost $51,200 NWW OA Sytems of Amarillo, TX Lewiston Levee Pond, ID, water sampling $165,467
NWW ERDC - Vicksburg, MS Lewiston Levee Pond, ID, Biological Risk Assessment $25,041
NWW OA Sytems of Amarillo, TX McNary temperature data collection $39,900
NWW OA Sytems of Amarillo, TX Repair of Dworshak TDG monitoring site sonde deployment pipe $22,459
NWW OA Sytems of Amarillo, TX RPA 132 Review of McNary TDG monitoring sites $113,665.86
NWW ERDC - Vicksburg, MS RPA 133 SYSTDG model equation modifications $18,416.73NWW OA Sytems of Amarillo, TX RPA 143 McNary Temperature Modeling Study $348,587.66NWW ERDC - Vicksburg, MS RPA 143 McNary Temperature Modeling Study $163,616.36
NWW OA Sytems of Amarillo, TXInstall water quality monitoring floats on the
Clearwater - Snake River confluence Programatic Dredge Material Study
$16,000
NWW USGS - Pasco, Wa Routine maintenance of TDG FMS Stations $300,000
NWW OA Sytems of Amarillo, TX Liminological Analysis of Lucky Peak, Dworshak, Lower Snake, and the McNary Reservoirs $146,446
NWW Subtotal Contract Cost $1,359,600Division Wide Total Contract Cost $1,862,220
63