2006-3-7--p-the polish textile sector and its competitiveness on the single european market with...
TRANSCRIPT

8/10/2019 2006-3-7--P-The Polish Textile Sector and Its Competitiveness on the Single European Market With Special Emphas…
http://slidepdf.com/reader/full/2006-3-7-p-the-polish-textile-sector-and-its-competitiveness-on-the-single 1/5
7FIBRES & TEXTILES in Eastern Europe July / September 2006, Vol. 14, No. 3 (57)
G E N E R
A L P R O
B L E M S
I N
T H E
F I B R E
A N D
T E
X T I L E I
N D U S T
R I E S
Consequences of marketliberalisation within theEuropean Union and the WTO
In the early 1990s, products exported by the
Polish textile and clothing industry showed
the best cost competitiveness rates on thesingle European market compared with
exports from other labour-intensive indus-
tries, because the wages paid in our country
were lower than in Western Europe.
The direct export of textiles and clothing
products which the Treaty on European
Union classied as ‘sensitive’ goods was
granted duty-free and non-quota access to
the EU market as late as 1998. However,
products exported from Poland to the
EU under so-called outside processing
were exempted from import restrictionsas early as 1995, and they played a very
important role among EU imports. Em-
pirical research on the German market
even shows that between 1992 and 1995
such products topped the list of imports
rst was woven ladieswear and second
woven menswear [1] in Germany, as Po-
land’s main trading partner which placed
most orders for clothing production in our
country. Empirical research also reveals
that 1998 was the rst year when Poland
started gradually losing her previously
high comparative advantage in the exportof textiles and clothing articles to western
European countries, including the EU.
The main reason was the heavy burden of
The Polish Textile Sector and itsCompetitiveness on the Single EuropeanMarket, with Special Emphasis
on Blankets, Travelling Rugs and Towels
Zoa Wysokińska
Technical University of ŁódźFaculty of Textile Engineering and Marketing
Department of World Economyand Textile Marketing
ul. Żeromskiego 116, Łódź 90-543E-mail: [email protected]
non-wage costs imposed on enterprises’
payrolls, but the situation was aggravated by the increasing competition of exports
owing to Western European markets
from Southeast Asia, mainly China and
India, but also other countries, mainly
in the Mediterranean Basin (e.g. Tunisia,
Morocco), which were granted preferen-
tial access to the Community’s market.
Despite the situation and the declining
volume of textiles and clothing articles
exported to the EU over the next years,
Polish exports still show relatively high
rates of cost competitiveness (see Table 1),as a result of considerably lower wages in
Poland than in the rest of the EU, and of
the country’s geographical proximity,
which makes it a more preferable supplier
than countries in Southeast Asia. Another
important factor is the huge experience of
Polish manufacturers and workers operat-
ing in the textile and clothing industry,
combined with the high quality of their
products and services, as acknowledged by the award of numerous certicates.
Most textiles and clothing articles manu-
factured in Poland meet EU norms and
standards as regards product quality,
environmental safety and consumer safe-
ty [2]. In the Community, three directives
regulate the textile market:
n
Council Directive 73/44/EEC of 26
February 1973 on the approximation
of the member states’ laws concern-
ing the quantitative analysis of ter-
nary bre mixtures. The Directive provides for sampling rules, identies
the quantitative analysis methods
which serve the determination of the
bre composition of ternary textile
bre mixtures, and presents examples
of calculating the percentage content
of components in some ternary textile
bre mixtures;
Table 1. Ranking of revealed comparative advantages in the Polish export of textiles andclothing articles to EU between 2001 and 2002, according to CPA (Classication of Productsby Activity) operated in the EU. Source: calculated by the author, based on GUS (CentralStatistical Ofce) data. Note: Aosityve rate indicates the comparative advantage of Poland’sexport over EU’s export; commodity groups with advantage have been bolded.
CPAcode
ProductsRCA rate in years
2001 2002
1821 Workwear 4.30 3.93
1740 Made-up textile articles, except clothing 3.56 3.79
2470 Man-made bres 2.07 1.94
1710 Textile yearn and thread 0.31 1.74
1754 Other textiles and other products 1.34 0.96
1752 Cordage, rope, twine and netting 0.34 0.31
1823 Underwear -0.04 -0.06
1751 Carpets and rugs -0.59 -0.58
1760 Knitted or crocheted fabrics -0.17 -0.17
1772 Knitted and crocheted pullovers, cardigans and similar articles -0.20 -0.652111 Pulp -1.03 -1.24
1824 Other wearing apparel and accessories -1.37 -1.33
2614 Glass bres -2.61 -2.54
AbstractThe aim of the paper is an analysis of the Single European Market based on selected products:cotton and man-made blankets and travelling rugs, towels and kitchen cloth. The analysis is prepared on the basis of international statistical sources with special reference to: Eurostatand UNCTAD data bases. The period of time covered by the analysis is connected with theaccession of the New Member States to the European Union and with some changes in theCommon Foreign Trade Policy of the EU within the WTO.
Key words: European Single Market, blankets and travelling rugs, towels and kitchen cloth.
8/10/2019 2006-3-7--P-The Polish Textile Sector and Its Competitiveness on the Single European Market With Special Emphas…
http://slidepdf.com/reader/full/2006-3-7-p-the-polish-textile-sector-and-its-competitiveness-on-the-single 2/5
FIBRES & TEXTILES in Eastern Europe July / September 2006, Vol. 14, No. 3 (57)8
n Council Directive 96/74/EC of 16
December 1996 on textile names that
denes the notion of a textile article,
prescribes the allowed tolerance for
‘pure’ products (100%), provides
for the marking (labelling) of textile
articles, and modies Directive 73/
44/EEC with respect to new analyti-cal methods for the binary and ternary
textile articles offered by the techno-
logical progress. This Directive has
Annexes including:
n a table of textile bres,
n agreed allowances used to calculate
the mass of bres contained in tex-
tile products,
n products that cannot be made sub-
ject to mandatory labelling or mark-
ing,
n products to which inclusive label-
ling or marking can be applied, and
n a list of amendments introduced by
Directive 96/74/EC to the previ-
ously operative directives on textile
products.
n Directive 97/37/EC of 19 June 1997
introducing three new bres to the An-
nexes of Directive 96/74/EC.
Even though Polish enterprises usually
meet all the above requirements, qual-
ity certicates recognised by the Single
Market are a key to the enterprises’ inter-
nationalisation, a process which has been
quite limited in Poland so far [3].
Polish small- and medium-sized enter-
prises can apply for assistance offered
under EU structural funds, for instance
from the sectoral programme ‘Improve-
ment of Enterprise Competitiveness
in the Years 2003-2006’ and from
PHARE 2 pre-accession programmes. In
the late 1990s, the textile and clothing
industry export from the Łódź region
lost its dynamics, but the industry has
retained its major role in the industrial
structure in Łódź and the surrounding
region. Nevertheless, the industry has to
boost its marketing activities, both on the
local markets and in the Community, by
launching intensive campaigns advertis-
ing branded products and promoting the
best brands on the EU market, as well
as setting up its own stores/boutiques
in other member states and/or outlets in
international retail chains. Another effec-
tive option, particularly for the SMEs, is
e-commerce development and the estab-
lishment of online stores offering limitedlines of products meeting the needs of
more sophisticated individual customers.
On 1 May 2004, Poland implemented
the EU external customs tariff, which
increased the competitive pressures of
third-country imports on our market, as
the tariff prescribes lower duties on such
goods. For the same reason, however, the
country will be better protected against
unfair foreign competition, such as
dumping, subsidised imports or so-called
excessive import, because the common
trade policy that Poland is part of as an
EU member state ensures a more effective
enforcement of EU customs regulations.
Following Poland’s entry into the EU
customs union, the average rate charged
on manufactured goods on Poland’s ex-
ternal border was considerably reduced
(by more than half). The reduction of
customs duties also affected textiles and
clothing, especially products included in
PCN Chapters 61 and 62 (duties on knit-
wear fell by c. 70%, and on other cloth-
ing by c. 80%). In Chapter 53 (“other
vegetable textile bres”), the number
of adjusted rates was the lowest, and in
Chapter 60 (“knitted or crocheted fab-
rics”) it was the highest.
Almost all customs rates on silk products
were reduced, but the group has only
4 product items whose import share is
estimated at more than €20,000 euro.
Customs rates were raised only for some
selected items in PCN Chapters 54, 55, 56
and 59. These are man-made staple bres
and laments; wadding; felt and non-wo-
vens; special yarns, twine, cordage, ropes
& cables and articles thereof, and impreg-
nated, coated, covered or laminated & tex-
tile articles suitable for industrial use1).
The reduction in customs rates on most
textiles and clothing articles actually
means that many ready-made products
(particularly clothing, including knit-
wear) are exposed to stronger competi-
tion on our domestic market, and also
that cheaper intermediate goods can be
purchased from third countries, particu-larly China and other Southeast Asian
countries.
On the other hand, rules governing the
harmonisation of textiles and clothing
articles with the GATT/WTO regula-
tions required all products in categories
such as yarn, fabrics, ready-made textile
products and apparel to conform with
GATT 1994 rules after 1 January 2005.
All restrictions imposed by the Multi-
bre Agreement (MFA) were transferred
to the new Agreement on Textiles &Clothing (ACT). The decade-long har-
monisation process was broken down
into four stages. 16% of textile and cloth-
ing articles were subjected to the ACT
rules by 1 January 1995, another 17%
were harmonised by 1 January 1998, still
another 18% by 1 January 2002 and the
remaining 49% of products were covered
by the ATC by 1 January 2005 [5].
An analysis of the Single
European Market basedon selected products –cotton and man-madeblankets and travelling rugs,towels and kitchen cloth.
From Eurostat and UNCTAD data, it
appears that between 1992 and 2003
(a period of 11 years) the global output
of the examined products increased
considerably; it almost doubled with
respect to toilet linen and kitchen linen,
quadrupled for cotton blankets and trav-
elling rugs, and it grew almost sevenfold
in the case of man-made blankets and
travelling rugs. The reason was the ex-
traordinary expansion of China into the
world markets, including the EU market,
but denitely most strongly into the US
market. Various Third World countries,
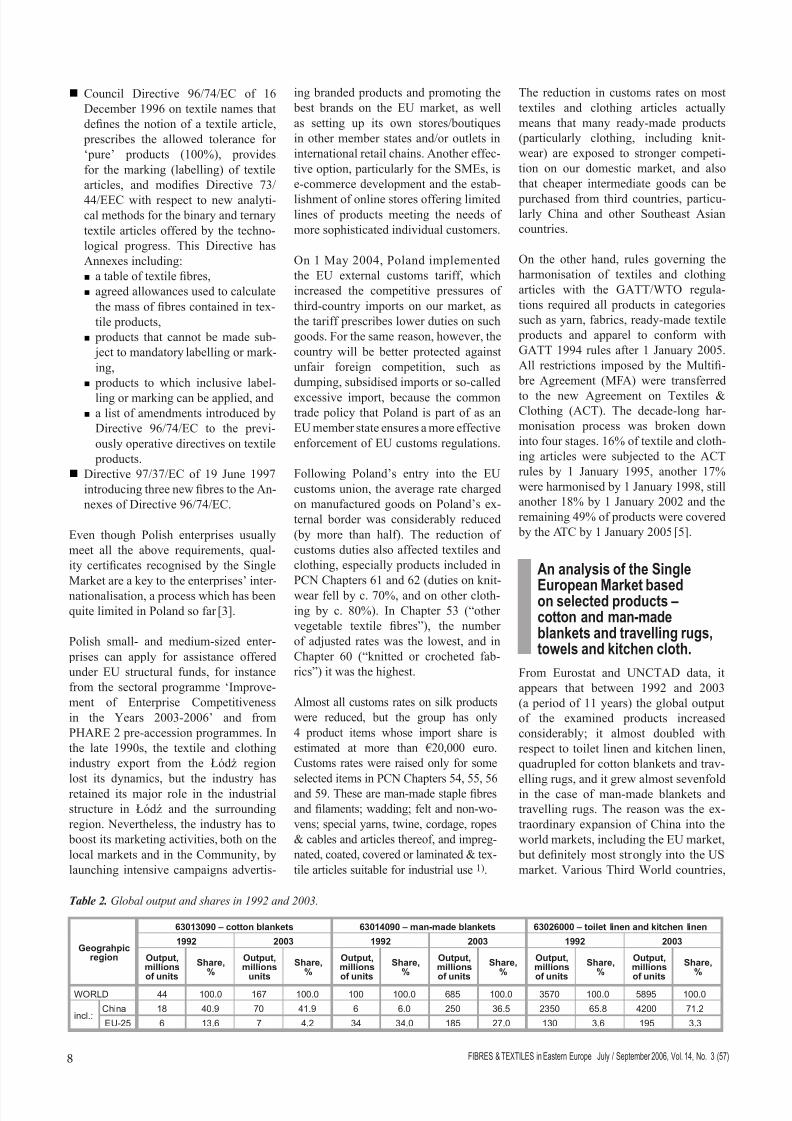
Table 2. Global output and shares in 1992 and 2003.
Geograhpicregion
63013090 – cotton blankets 63014090 – man-made blankets 63026000 – toilet linen and kitchen linen
1992 2003 1992 2003 1992 2003
Output,millionsof units
Share,%
Output,millions
units
Share,%
Output,millionsof units
Share,%
Output,millionsof units
Share,%
Output,millionsof units
Share,%
Output,millionsof units
Share,%
WORLD 44 100.0 167 100.0 100 100.0 685 100.0 3570 100.0 5895 100.0
incl.:China 18 40.9 70 41.9 6 6.0 250 36.5 2350 65.8 4200 71.2
EU-25 6 13.6 7 4.2 34 34.0 185 27.0 130 3.6 195 3.3
8/10/2019 2006-3-7--P-The Polish Textile Sector and Its Competitiveness on the Single European Market With Special Emphas…
http://slidepdf.com/reader/full/2006-3-7-p-the-polish-textile-sector-and-its-competitiveness-on-the-single 3/5
9FIBRES & TEXTILES in Eastern Europe July / September 2006, Vol. 14, No. 3 (57)
being unable to catch up with their
competitors in high-tech industries, also
decide to boost the production of textiles
manufactured using technologies that are
easier to apply.
Global output estimates in the years 1992
and 2003 are given in Table 2.
Table 2 shows that the production of man-
made blankets expanded substantially.
Between 1992 and 2003, China enlarged
her production by around 40 times, and
her participation in the global output in-
creased from 6.0 to 36.5%. In the same
period, the EU’s output dropped from
34.0% to 27.0% of the global output,
even though its production grew vefold.
The output of cotton blankets showed
a smaller increase (c. 4 times). Chinaslightly improved her contribution to the
global output, from 40.9 to 41.9%, i.e. by
one percentage point. Although the EU’s
output grew by c. 15%, it was dispropor-
tionately low compared with the average
growth in the world; as a result, EU mar-
ket’s share decreased from 13.6% to 4.2%.
Regarding the production of toilet linen
and kitchen linen, China is an all-time
monopolist and has maintained her mar-
ket share within 65 - 70% of the global
output. Additionally, China has been
slightly increasing her share from year to
year. In the period in question, the EU’s
production expanded by 50%, but its
contribution to the global output some-
what dropped, from 3.6 to 3.3%.
Among developing countries, we can dis-
tinguish many states that are already im-
portant global players today, and which
are generally continuing their expansion.
In particular, the group includes Far-East
countries such as Pakistan, South Korea.,
Thailand, Indonesia, and Vietnam, and in
other parts of the world Turkey, Egypt,
Syria, Brazil, Columbia and Israel.
Assessment of the compe-titive positions of the 25 EUmember states within themarket volume, years 2000and 2005 (market volumecalculated as production+ import–export)
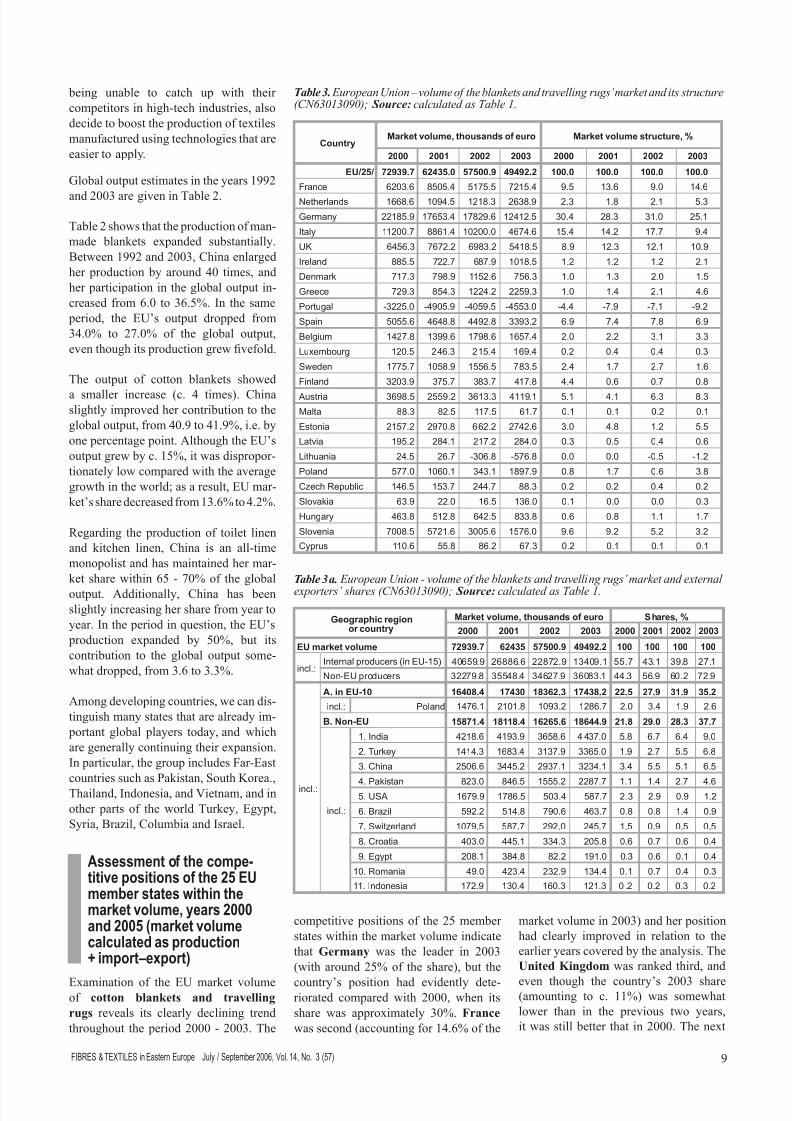
Examination of the EU market volumeof cotton blankets and travelling
rugs reveals its clearly declining trend
throughout the period 2000 - 2003. The
Table 3. European Union – volume of the blankets and travelling rugs’ market and its structure(CN63013090); Source: calculated as Table 1.
Country
Market volume, thousands of euro
Market volume structure, %
2000 2001 2002 2003 2000 2001 2002 2003
EU/25/ 72939.7 62435.0 57500.9 49492.2 100.0 100.0 100.0 100.0
France 6203.6 8505.4 5175.5 7215.4 9.5 13.6 9.0 14.6
Netherlands 1668.6 1094.5 1218.3 2638.9 2.3 1.8 2.1 5.3
Germany 22185.9 17653.4 17829.6 12412.5 30.4 28.3 31.0 25.1
Italy 11200.7 8861.4 10200.0 4674.6 15.4 14.2 17.7 9.4
UK 6456.3 7672.2 6983.2 5418.5 8.9 12.3 12.1 10.9
Ireland 885.5 722.7 687.9 1018.5 1.2 1.2 1.2 2.1
Denmark 717.3 798.9 1152.6 756.3 1.0 1.3 2.0 1.5
Greece 729.3 854.3 1224.2 2259.3 1.0 1.4 2.1 4.6
Portugal -3225.0 -4905.9 -4059.5 -4553.0 -4.4 -7.9 -7.1 -9.2
Spain 5055.6 4648.8 4492.8 3393.2 6.9 7.4 7.8 6.9
Belgium 1427.8 1399.6 1798.6 1657.4 2.0 2.2 3.1 3.3
Luxembourg 120.5 246.3 215.4 169.4 0.2 0.4 0.4 0.3
Sweden 1775.7 1058.9 1556.5 783.5 2.4 1.7 2.7 1.6
Finland 3203.9 375.7 383.7 417.8 4.4 0.6 0.7 0.8
Austria 3698.5 2559.2 3613.3 4119.1 5.1 4.1 6.3 8.3
Malta 88.3 82.5 117.5 61.7 0.1 0.1 0.2 0.1
Estonia 2157.2 2970.8 662.2 2742.6 3.0 4.8 1.2 5.5
Latvia 195.2 284.1 217.2 284.0 0.3 0.5 0.4 0.6
Lithuania 24.5 26.7 -306.8 -576.8 0.0 0.0 -0.5 -1.2
Poland 577.0 1060.1 343.1 1897.9 0.8 1.7 0.6 3.8
Czech Republic 146.5 153.7 244.7 88.3 0.2 0.2 0.4 0.2
Slovakia 63.9 22.0 16.5 136.0 0.1 0.0 0.0 0.3
Hungary 463.8 512.8 642.5 833.8 0.6 0.8 1.1 1.7
Slovenia 7008.5 5721.6 3005.6 1576.0 9.6 9.2 5.2 3.2
Cyprus 110.6 55.8 86.2 67.3 0.2 0.1 0.1 0.1
Table 3a. European Union - volume of the blankets and travelling rugs’ market and external
exporters’ shares (CN63013090); Source: calculated as Table 1.
Geographic regionor country
Market volume, thousands of euro Shares, %
2000 2001 2002 2003 2000 2001 2002 2003
EU market volume 72939.7 62435 57500.9 49492.2 100 100 100 100
incl.:Internal producers (in EU-15) 40659.9 26886.6 22872.9 13409.1 55.7 43.1 39.8 27.1
Non-EU producers 32279.8 35548.4 34627.9 36083.1 44.3 56.9 60.2 72.9
incl.:
A. in EU-10 16408.4 17430 18362.3 17438.2 22.5 27.9 31.9 35.2
incl.: Poland 1476.1 2101.8 1093.2 1286.7 2.0 3.4 1.9 2.6
B. Non-EU 15871.4 18118.4 16265.6 18644.9 21.8 29.0 28.3 37.7
incl.:
1. India 4218.6 4193.9 3658.6 4 437.0 5.8 6.7 6.4 9.0
2. Turkey 1414.3 1683.4 3137.9 3365.0 1.9 2.7 5.5 6.8
3. China 2506.6 3445.2 2937.1 3234.1 3.4 5.5 5.1 6.5
4. Pakistan 823.0 846.5 1555.2 2287.7 1.1 1.4 2.7 4.6 5. USA 1679.9 1786.5 503.4 587.7 2.3 2.9 0.9 1.2
6. Brazil 592.2 514.8 790.6 463.7 0.8 0.8 1.4 0.9
7. Switzerland 1079.5 587.7 292.0 245.7 1.5 0.9 0.5 0.5
8. Croatia 403.0 445.1 334.3 205.8 0.6 0.7 0.6 0.4
9. Egypt 208.1 384.8 82.2 191.0 0.3 0.6 0.1 0.4
10. Romania 49.0 423.4 232.9 134.4 0.1 0.7 0.4 0.3
11. Indonesia 172.9 130.4 160.3 121.3 0 .2 0.2 0.3 0.2
competitive positions of the 25 member
states within the market volume indicate
that Germany was the leader in 2003
(with around 25% of the share), but the
country’s position had evidently dete-riorated compared with 2000, when its
share was approximately 30%. France
was second (accounting for 14.6% of the
market volume in 2003) and her position
had clearly improved in relation to the
earlier years covered by the analysis. The
United Kingdom was ranked third, and
even though the country’s 2003 share(amounting to c. 11%) was somewhat
lower than in the previous two years,
it was still better that in 2000. The next
8/10/2019 2006-3-7--P-The Polish Textile Sector and Its Competitiveness on the Single European Market With Special Emphas…
http://slidepdf.com/reader/full/2006-3-7-p-the-polish-textile-sector-and-its-competitiveness-on-the-single 4/5
FIBRES & TEXTILES in Eastern Europe July / September 2006, Vol. 14, No. 3 (57)10
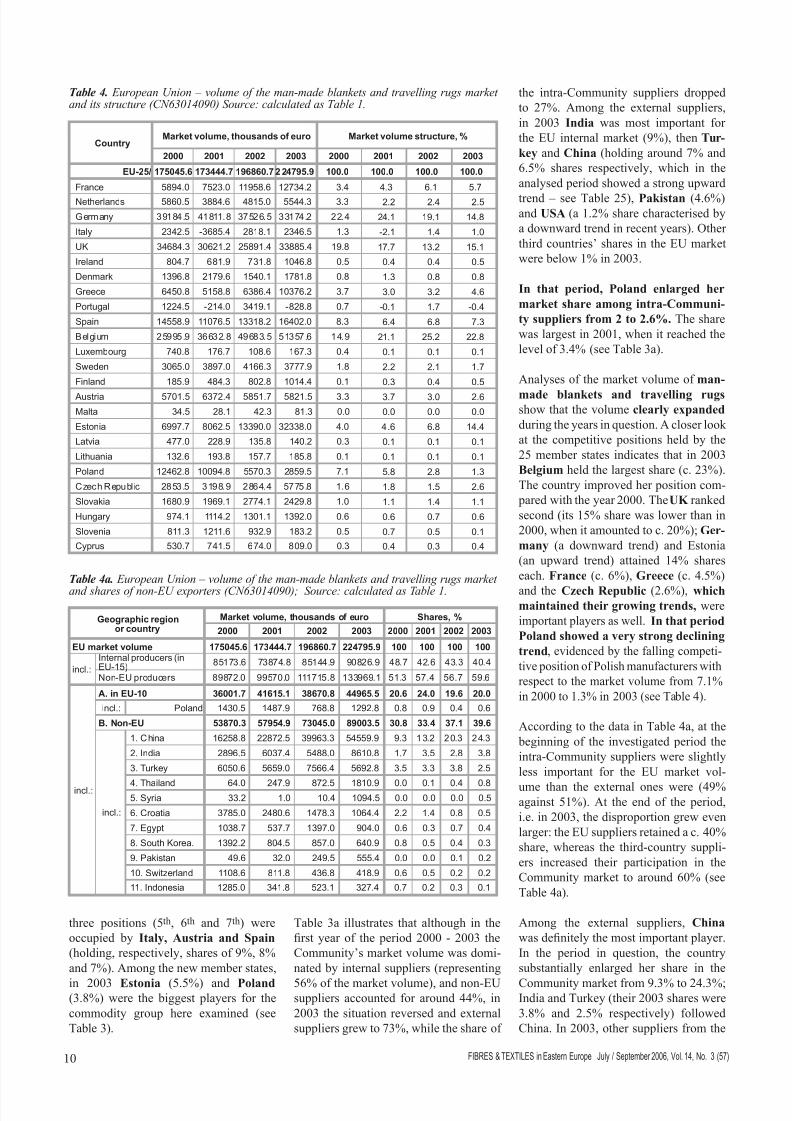
Table 4. European Union – volume of the man-made blankets and travelling rugs marketand its structure (CN63014090) Source: calculated as Table 1.
Country
Market volume, thousands of euro
Market volume structure, %
2000 2001 2002 2003 2000 2001 2002 2003
EU-25/ 175045.6 173444.7 196860.7 2 24795.9 100.0 100.0 100.0 100.0
France 5894.0 7523.0 11958.6 12734.2 3.4 4.3 6.1 5.7
Netherlands 5860.5 3884.6 4815.0 5544.3 3.3 2.2 2.4 2.5
Germany 39184.5 41811.8 37526.5 33174.2 22.4 24.1 19.1 14.8
Italy 2342.5 -3685.4 2818.1 2346.5 1.3 -2.1 1.4 1.0
UK 34684.3 30621.2 25891.4 33885.4 19.8 17.7 13.2 15.1
Ireland 804.7 681.9 731.8 1046.8 0.5 0.4 0.4 0.5
Denmark 1396.8 2179.6 1540.1 1781.8 0.8 1.3 0.8 0.8
Greece 6450.8 5158.8 6386.4 10376.2 3.7 3.0 3.2 4.6
Portugal 1224.5 -214.0 3419.1 -828.8 0.7 -0.1 1.7 -0.4
Spain 14558.9 11076.5 13318.2 16402.0 8.3 6.4 6.8 7.3
Belgium 25995.9 36632.8 49683.5 51357.6 14.9 21.1 25.2 22.8
Luxembourg 740.8 176.7 108.6 167.3 0.4 0.1 0.1 0.1
Sweden 3065.0 3897.0 4166.3 3777.9 1.8 2.2 2.1 1.7
Finland 185.9 484.3 802.8 1014.4 0.1 0.3 0.4 0.5
Austria 5701.5 6372.4 5851.7 5821.5 3.3 3.7 3.0 2.6
Malta 34.5 28.1 42.3 81.3 0.0 0.0 0.0 0.0
Estonia 6997.7 8062.5 13390.0 32338.0 4.0 4.6 6.8 14.4
Latvia 477.0 228.9 135.8 140.2 0.3 0.1 0.1 0.1
Lithuania 132.6 193.8 157.7 185.8 0.1 0.1 0.1 0.1
Poland 12462.8 10094.8 5570.3 2859.5 7.1 5.8 2.8 1.3
Czech Republ ic 2853.5 3198.9 2864.4 5775.8 1.6 1.8 1.5 2.6
Slovakia 1680.9 1969.1 2774.1 2429.8 1.0 1.1 1.4 1.1
Hungary 974.1 1114.2 1301.1 1392.0 0.6 0.6 0.7 0.6
Slovenia 811.3 1211.6 932.9 183.2 0.5 0.7 0.5 0.1
Cyprus 530.7 741.5 674.0 809.0 0.3 0.4 0.3 0.4
the intra-Community suppliers dropped
to 27%. Among the external suppliers,
in 2003 India was most important for
the EU internal market (9%), then Tur-
key and China (holding around 7% and
6.5% shares respectively, which in the
analysed period showed a strong upward
trend – see Table 25), Pakistan (4.6%)and USA (a 1.2% share characterised by
a downward trend in recent years). Other
third countries’ shares in the EU market
were below 1% in 2003.
In that period, Poland enlarged her
market share among intra-Communi-
ty suppliers from 2 to 2.6%. The share
was largest in 2001, when it reached the
level of 3.4% (see Table 3a).
Analyses of the market volume of man-
made blankets and travelling rugsshow that the volume clearly expanded
during the years in question. A closer look
at the competitive positions held by the
25 member states indicates that in 2003
Belgium held the largest share (c. 23%).
The country improved her position com-
pared with the year 2000. The UK ranked
second (its 15% share was lower than in
2000, when it amounted to c. 20%); Ger-
many (a downward trend) and Estonia
(an upward trend) attained 14% shares
each. France (c. 6%), Greece (c. 4.5%)
and the Czech Republic (2.6%), whichmaintained their growing trends, were
important players as well. In that period
Poland showed a very strong declining
trend, evidenced by the falling competi-
tive position of Polish manufacturers with
respect to the market volume from 7.1%
in 2000 to 1.3% in 2003 (see Table 4).
According to the data in Table 4a, at the
beginning of the investigated period the
intra-Community suppliers were slightly
less important for the EU market vol-
ume than the external ones were (49%against 51%). At the end of the period,
i.e. in 2003, the disproportion grew even
larger: the EU suppliers retained a c. 40%
share, whereas the third-country suppli-
ers increased their participation in the
Community market to around 60% (see
Table 4a).
Among the external suppliers, China
was denitely the most important player.
In the period in question, the country
substantially enlarged her share in the
Community market from 9.3% to 24.3%;India and Turkey (their 2003 shares were
3.8% and 2.5% respectively) followed
China. In 2003, other suppliers from the
Table 4a. European Union – volume of the man-made blankets and travelling rugs market
and shares of non-EU exporters (CN63014090); Source: calculated as Table 1.
Geographic regionor country
Market volume, thousands of euro Shares, %
2000 2001 2002 2003 2000 2001 2002 2003
EU market volume 175045.6 173444.7 196860.7 224795.9 100 100 100 100
incl.:
Internal producers (inEU-15)
85173.6 73874.8 85144.9 90826.9 48.7 42.6 43.3 40.4
Non-EU producers 89872.0 99570.0 111715.8 133969.1 51.3 57.4 56.7 59.6
incl.:
A. in EU-10 36001.7 41615.1 38670.8 44965.5 20.6 24.0 19.6 20.0
incl.: Poland 1430.5 1487.9 768.8 1292.8 0.8 0.9 0.4 0.6
B. Non-EU 53870.3 57954.9 73045.0 89003.5 30.8 33.4 37.1 39.6
incl.:
1. China 16258.8 22872.5 39963.3 54559.9 9.3 13.2 20.3 24.3
2. India 2896.5 6037.4 5488.0 8610.8 1.7 3.5 2.8 3.8
3. Turkey 6050.6 5659.0 7566.4 5692.8 3.5 3.3 3.8 2.5
4. Thailand 64.0 247.9 872.5 1810.9 0.0 0.1 0.4 0.85. Syria 33.2 1.0 10.4 1094.5 0.0 0.0 0.0 0.5
6. Croatia 3785.0 2480.6 1478.3 1064.4 2.2 1.4 0.8 0.5
7. Egypt 1038.7 537.7 1397.0 904.0 0.6 0.3 0.7 0.4
8. South Korea. 1392.2 804.5 857.0 640.9 0.8 0.5 0.4 0.3
9. Pakistan 49.6 32.0 249.5 555.4 0.0 0.0 0.1 0.2
10. Switzerland 1108.6 811.8 436.8 418.9 0.6 0.5 0.2 0.2
11. Indonesia 1285.0 341.8 523.1 327.4 0.7 0.2 0.3 0.1
three positions (5th, 6th and 7th) were
occupied by Italy, Austria and Spain
(holding, respectively, shares of 9%, 8%
and 7%). Among the new member states,
in 2003 Estonia (5.5%) and Poland(3.8%) were the biggest players for the
commodity group here examined (see
Table 3).
Table 3a illustrates that although in the
rst year of the period 2000 - 2003 the
Community’s market volume was domi-
nated by internal suppliers (representing
56% of the market volume), and non-EUsuppliers accounted for around 44%, in
2003 the situation reversed and external
suppliers grew to 73%, while the share of

8/10/2019 2006-3-7--P-The Polish Textile Sector and Its Competitiveness on the Single European Market With Special Emphas…
http://slidepdf.com/reader/full/2006-3-7-p-the-polish-textile-sector-and-its-competitiveness-on-the-single 5/5
11FIBRES & TEXTILES in Eastern Europe July / September 2006, Vol. 14, No. 3 (57)
Received 07.04.2004 Reviewed 10.10.2004
to 3.3%), Austria (from 2.2% to 2.8%)
and Poland (from 1.9% to 3.7%). The
following countries deteriorated their
competitive positions, although in rela-
tive terms they remained high: Germany
(from 21.8% to 19.0%), France (from
15.2% to 14.1%), and Latvia (from 2.8%
to 1.1%). Throughout the period Greece
(with her c. 2.5% share), Sweden (c. 2%)
and Denmark (c. 1.5%) continued to be
important market players (see Table 5).
Data in Table 5a indicate that at the outset
of the period the intra-Community sup-
pliers were already considerably less
important for the EU market volume than
the third-country suppliers were (20%
against 80%). At the end of the period,
the disproportion had even increased, be-
cause the internal suppliers had managedto retain only a 13% share in the EU mar-
ket, whereas suppliers established in the
third countries had increased their slice
to around 85% (see Table 5a).
In the latter group Turkey was the major
player, steadily enlarging her EU mar-
ket share, followed by Pakistan, China,
India, Brazil, Egypt, Israel, Columbia,
Indonesia, Bangladesh and Bulgaria (see
Table 5a).
In the years in question, Poland’s share inthe market of intra-Community suppliers
declined from 0.9% to 0.5% (see Table 5a).
Editional Note
1) Developed on the basis of [4].
References
1. Z. Wysokińska, Tendencje rozwoju go-
spodarki światowej , tendencje rozwoju
światowego popytu oraz popytu importo-
wego na głównych rynkach towarowychświata, [in:] Z. Wysokińska, J. Witkowska,
Tendencje popytu na wybranych rynkach
zagranicznych, 1992, Ed. Univ. of Łódź.
2. See also A. Marzec, Tekstylia, [w:]
Warunki i zadania w zakresie handlu
zagranicznego po akcesji Polski do Unii
Europejskiej, RCSS, vol. III, Warsaw,
2003, pp.72-79.
3. J. Witkowska, Z. Wysokińska, SMEs In-
ternationalisation in the CEE Countries in
the European Integration Process, Uni-
versity of Vaasa Publishing House, 2003.
4. Ministry of Economy and Labour data,
http://clo.mg.gov.pl/asp/ts_analiza.asp
5. Agreement on Textiles and Clothing,
www.wto.org
Table 5. European Union – volume of the toilet linen and kitchen linen market and its structure(CN63026000); Source: calculated as Table 1.
Country
Market volume, thousands of euro
Market volume structure, %
2000 2001 2002 2003 2000 2001 2002 2003
EU-25 1181163.8 1182790.4 1122696.8 1132365.7 100.0 100.0 100.0 100.0
France 178997.1 197065.6 165248.7 160033.3 15.2 16.7 14.7 14.1
Netherlands 32472.0 33302.9 33717.4 37826.6 2.7 2.8 3.0 3.3
Germany 257696.0 243838.1 210525.4 214890.9 21.8 20.6 18.8 19.0
Italy 202777.8 232648.5 212465.3 227702.6 17.2 19.7 18.9 20.1
UK 197231.6 202952.7 192479.1 190808.9 16.7 17.2 17.1 16.9
Ireland 3211.0 3377.5 4915.7 13719.6 0.3 0.3 0.4 1.2
Denmark 19113.2 16401.5 18853.7 14878.4 1.6 1.4 1.7 1.3
Greece 27122.0 27456.9 27866.7 26921.2 2.3 2.3 2.5 2.4
Portugal -22221.8 -7478.8 -6585.2 -37673.3 -1.9 -0.6 -0.6 -3.3
Spain 105391.1 106374.2 107096.2 117147.9 8.9 9.0 9.5 10.3
Belgium 38324.5 36466.7 41717.9 41438.6 3.2 3.1 3.7 3.7
Luxembourg 1935.9 1561.7 1787.0 2126.4 0.2 0.1 0.2 0.2
Sweden 26063.7 24395.9 19009.8 20880.7 2.2 2.1 1.7 1.8
Finland 12796.0 13190.4 11115.2 13070.4 1.1 1.1 1.0 1.2
Austria 25899.0 34689.2 39035.5 31437.6 2.2 2.9 3.5 2.8
Malta 1.3 0.7 -4.2 1.1 0.0 0.0 0.0 0.0
Estonia -7263.6 -7008.5 -5156.2 -4556.1 -0.6 -0.6 -0.5 -0.4
Latvia 32807.5 18256.8 12932.0 12657.7 2.8 1.5 1.2 1.1
Lithuania 545.2 876.3 774.5 1451.1 0.0 0.1 0.1 0.1
Poland 22493.9 17286.8 27043.1 42279.0 1.9 1.5 2.4 3.7CzechRepublic
25794.7 -14138.9 4188.0 3222.3 2.2 -1.2 0.4 0.3
Slovakia 2383.4 3358.9 3838.3 4070.5 0.2 0.3 0.3 0.4
Hungary -613.0 1205.0 978.8 -1000.2 -0.1 0.1 0.1 -0.1
Slovenia -1797.7 -3292.8 -687.4 -972.4 -0.2 -0.3 -0.1 -0.1
Cyprus 3.0 3.3 -458.3 2.7 0.0 0.0 0.0 0.0
Table 5a. European Union – volume of the toilet linen and kitchen linen market and sharesheld by external exporters (CN63026000); Source: calculated as Table 1.
Geographic regionor country
Market volume, thousands of euro Shares, %
2000 2001 2002 2003 2000 2001 2002 2003
EU market volume 1181163.8 1182790.4 1122696.8 1132365.7 100 100 100 100
incl.:
Internal producers (inEU-15) 235936.5 200378.0 182995.1 152601.4 20.0 16.9 16.3 13.5
Non-EU producers 945227.3 982412.4 939701.8 979764.4 80.0 83.1 83.7 86.5
incl.:
A. in EU-10 387768.9 385156.5 366754.3 366600.6 32.8 32.6 32.7 32.4
incl.: Poland 10181.8 8087.8 6472.4 6078.8 0.9 0.7 0.6 0.5
B. Non-EU 557458.3 597255.9 572947.5 613163.8 47.2 50.5 51.0 54.1
incl.:
1. Turkey 210951.4 223215.2 214270.3 253228.0 17.9 18.9 19.1 22.4
2. Pakistan 59241.3 63774.3 74447.0 76518.9 5.0 5.4 6.6 6.8
3. China 50440.1 54417.3 51230.1 54045.5 4.3 4.6 4.6 4.8
4. India 53554.0 56778.6 45757.1 46044.8 4.5 4.8 4.1 4.1
5. Brazil 41313.3 37281.3 39767.5 39076.4 3.5 3.2 3.5 3.5
6. Egypt 26171.3 26325.4 24590.2 27950.1 2.2 2.2 2.2 2.5
7. Israel 10287.2 16860.2 18693.9 18140.9 0.9 1.4 1.7 1.6
8. Columbia 12784.9 14629.9 13792.7 13013.7 1.1 1.2 1.2 1.1
9. Indonesia 12587.4 11334.7 12775.1 9548.3 1.1 1.0 1.1 0.8
10. Bangladesh 7387.5 10382.4 9870.5 9282.6 0.6 0.9 0.9 0.8
11. Bulgaria 3144.1 2732.7 3374.4 4162.9 0.3 0.2 0.3 0.4
third countries, such as Thailand, Syria,
Croatia, Egypt, South Korea, Pakistan
and Indonesia generally held shares
within 1%, but Croatia suffered a serious
loss (see Table 4a).
Poland’s participation in the market ofintra-Community suppliers declined in
the analysed period from 0.8% to 0.6%
(see Table 4a).
Regarding toilet linen and kitchen lin-
en, an investigation into their market vol-
ume reveals its declining trend in 2003
compared with 2000. Trend analysis
made on a member state basis indicates
that Italy improved her competitive
position in the period (from 17.2% to20.1%), likewise Spain (from 8.9% to
10.3%), the Netherlands (from 2.7%