2006 annual ownership report
TRANSCRIPT

i

2006 Annual Ownership Report
ii

2006 Annual Ownership Report
iii
2006 ANNUAL OWNERSHIP REPORT
Contact Information
Comments and suggestions about the report
can be submitted to
Undersecretariat of Treasury
General Directorate of State Owned Enterprises
via phone numbers ++90 – 312 (204 61 90 - 204 61 88)
or via e-mail [email protected]

2006 Annual Ownership Report
iv

2006 Annual Ownership Report
v
MINISTER’S PREAMBLE
Public resource usage in an effective and efficient manner and informing the public about this issue within the context of accountability is one of the main policies of our government.
In this context, it is important for the general public to be informed about the activities of state owned enterprises which operate in agriculture, transportation, communication, energy and mining industries and have a great impact on the economy via utilization of public resources.
Although the main objective of our government is to create a free market economy and sustain economic growth through private sector operations by privatizing state owned enterprises, it is also among our priorities to make public enterprises operate according to modern corporate governance principles.
The Undersecretariat of Treasury, which exercise the ownership function of the State, has taken on great reponsibillity by publishing the review of performances of enterprises and by informing the public about them besides creating policies in order to make them operate effectively and efficiently.
I hope this first Annual Ownership Report fullfills the information needs of the public and I thank to all of the Treasury staff which takes part in the preparation process of this report.
Ali BABACAN
Minister of State and Chief Negotiator

2006 Annual Ownership Report
vi

2006 Annual Ownership Report
vii
UNDERSECRETARY’S PREAMBLE
The adoption of corporate governance principles and improvement of accountability and transparency level are very important for attaining a competitive market and for carrying out the responsibilities of public bodies to all stakeholders.
The Undersecretariat of Treasury exercising the ownership function of the State in a large number of public enterprises is expected not to deviate from this point of view. This standpoint requires informing the public about the operations, financial stance, directors and performance of public enterprises.
As the shareholder of the SOEs which comprise a significant part of the current economic program, our main objective of publishing this annual report is to introduce the SOE system to the public, to convey the developments and restructuring efforts in 2006 and to contribute to the development of corporate governance.
The Undersecretariat of Treasury endeavors for SOEs in its portfolio to be managed in an efficient and effective manner, to create more value added to the economy and consequently to increase their values. In this regard, some provisions related to corporate governance were included in the 2007 General Investment and Financing Program Decree for the first time. With contribution of State Planning Organization, Privatization Administration and Capital Markets Board, we embarked on a project which aims to improve the corporate governance of State Owned Enterprises.
I hope this Annual Ownership Report prepared for the first time with the governance concerns will be useful and I would like to express my thanks to my colleagues who devoted their efforts to this report
İbrahim H. ÇANAKCI Undersecretary

2006 Annual Ownership Report
viii

2006 Annual Ownership Report
ix
GENERAL DIRECTOR’S PREAMBLE
Public agencies which exercise the ownership function of the State and public enterprises which operate in different sectors constitute a very scattered picture in our country. Besides some non-financial and financial public enterprises wholly owned by the Undersecretariat of Treasury, there are also other enterprises and subsidiaries performing in the market, which are owned by Privatisation Administration, other central government bodies and local governments.
As of December 31st 2006, there are 20 state owned enterprises and 4 subsidiaries in the Treasury’s portfolio. These enterprises constitute a very important role in the real economy with the total gross sale figure of 44 Billion YTL corresponding to 7,7% of the GDP in 2006. Furthermore, these enterprises still maintain their importance in terms of executing current economic program.
The Undersecretariat of Treasury finds it useful and regards it as a duty to disclose the results of the operations of the enterprises under its portfolio in terms of improving the corporate governance principles.
So as to improve the accountability and transperancy level, the Treasury has started to announce periodically the financial accounts of SOEs on its web page within the context of national announcement program conducted by Turkish Statistical Institute.
2006 Annual Ownership Report is divided into three parts. The first one covers the problems of managing state owned enterprises in Turkey and the position of the Treasury as a shareholder. The second part includes the aggregated analysis about the accounts of SOEs under the Treasury Portfolio and the last part assesses the 2006 performances of SOEs seperately.
The data in the report consists of the inputs which are collected from the financial and other tables sent by SOEs. The data between 2002 and 2004 had been audited by High Auditing Board and approved by the Parliament. Whereas, the accounts concerning 2005 and 2006 has not been audited yet. However, it is not expected that the financial figures will change too much.
I express my thanks to my colleagues who prepared this Report for the first time and I wish the Report would be beneficial for our stakeholders.
M. Sefa PAMUKSUZ General Director

2006 Annual Ownership Report
x

1
CONTENTS
MINISTER’S PREAMBLE .......................................................................................................................... V EXECUTIVE’S PREAMBLE .................................................................................................................... Vİİ GENERAL DIRECTOR’S PREAMBLE .....................................................................................................İX CONTENTS ................................................................................................................................................. 1 LIST OF TABLES ........................................................................................................................................ 3 LIST OF GRAPHS ....................................................................................................................................... 3 LIST OF BOXES.......................................................................................................................................... 3 ABBREVIATIONS ....................................................................................................................................... 4 CHAPTER 1: INTRODUCTION ................................................................................................................... 5 CHAPTER 2: PUBLIC ENTERPRISES AND SOES .................................................................................. 6 CHAPTER 3: TREASURY PORTFOLIO ..................................................................................................... 8
3.1. OUR PORTFOLIO ................................................................................................................................. 8 3.2. OUR TASK .......................................................................................................................................... 8 3.3. OUR OBJECTIVES AND GOALS ............................................................................................................ 10 3.4. SOE – CENTRAL BUDGET RELATION................................................................................................... 11
3.4.1. Transfers from Budget to SOEs.............................................................................................. 11 3.4.2. Transfers from SOEs to Budget.............................................................................................. 11
CHAPTER 4: 2006 PERFORMANCE OF ALL SOES............................................................................... 13 4.1. FINANCIAL ANALYSIS ......................................................................................................................... 13
4.1.1. Income Statement .................................................................................................................. 13 4.1.2. Balance Sheet ........................................................................................................................ 14 4.1.3. Ratio Analysis......................................................................................................................... 15 4.1.4. Value Added ........................................................................................................................... 16
4.2. EMPLOYMENT ................................................................................................................................... 17 4.2.1. Personnel Numbers................................................................................................................ 18 4.2.2. Personnel Costs ..................................................................................................................... 18 4.2.3.Average Personnel Costs ........................................................................................................ 19 4.2.4. Personnel Profile .................................................................................................................... 19
4.3. OTHER INDICATORS ........................................................................................................................... 20 4.4. MAIN PROBLEMS OF SOES ................................................................................................................ 20
CHAPTER 5: PERFORMANCES OF THE SOES .................................................................................... 22 5.1. ENERGY AND MINING SECTORS ................................................................................................ 23
5.1.1. BOTAŞ ................................................................................................................................... 25 5.1.2. EÜAŞ...................................................................................................................................... 28 5.1.3. TEİAŞ ..................................................................................................................................... 31 5.1.4. TETAŞ .................................................................................................................................... 34 5.1.5. TKİ.......................................................................................................................................... 36 5.1.6. TTK......................................................................................................................................... 38 5.1.7. TPAO...................................................................................................................................... 40 5.1.8. ETİ MADEN ............................................................................................................................ 43

2006 Annual Ownership Report
2
5.2. TELECOMMUNICATION & TRANSPORTATION SECTORS......................................................... 45 5.2.1. TCDD ..................................................................................................................................... 47 5.2.2. DHMİ ...................................................................................................................................... 51 5.2.3. KIYEM .................................................................................................................................... 54 5.2.4. PTT......................................................................................................................................... 57
5.3. AGRICULTURE SECTOR .............................................................................................................. 59 5.3.1. EBK ........................................................................................................................................ 61 5.3.2. TİGEM .................................................................................................................................... 63 5.3.3. TMO ....................................................................................................................................... 66 5.3.4. ÇAYKUR ................................................................................................................................ 70 5.3.5. TŞFAŞ .................................................................................................................................... 74
5.4. OTHER SECTORS......................................................................................................................... 78 5.4.1. DMO ....................................................................................................................................... 80 5.4.2. MKEK ..................................................................................................................................... 82 5.4.3. SÜMER HALI.......................................................................................................................... 84
CHAPTER 6: APPENDICES ..................................................................................................................... 86 APPENDIX 1: LIST OF PUBLIC ENTERPRISES AND THEIR SUBSIDIARIES........................................ 88 ANNEX 2: FINANCIAL TABLES OF SOES UNDER TREASURY PORTFOLIO ........................................ 92
Income Statement ............................................................................................................................ 94 Balance Sheet .................................................................................................................................. 95 Financial Ratios ................................................................................................................................ 96 Non Tax Revenues........................................................................................................................... 97
APPENDIX 3: EMPLOYMENT DATA OF SOES UNDER TREASURY PORTFOLIO ................................. 98 SOE Personnel Numbers and Costs .............................................................................................. 100 Personnel Profile ............................................................................................................................ 101
APPENDIX 4: OTHER SELECTED INDICATORS OF SOES UNDER TREASURY PORTFOLIO........... 104 E APPENDIX 5: AGGREGATED FINANCIAL TABLES (TREASURY AND PRİVATİZATİON ADMINISTRATION
PORTFOLİO)............................................................................................................................................ 108 Income Statement .......................................................................................................................... 110 Balance Sheet ................................................................................................................................ 111 Financial Ratios .............................................................................................................................. 112

2006 Annual Ownership Report
3
LIST OF TABLES Tables PageTable 3.1: Capital Structure of Treasury Portfolio 9Table 3.2: SOE – Central Government Budget Relation 11Table 4.1: Income Statements 13Table 4.2: Balance Sheets 14Table 4.3: Financial Ratios 15Table 4.4: Personnel Numbers 18Table 4.5: Personnel Costs 18Table 4.6: Personnel Costs / (Cost of Sales + General and Administrative Expenses)
(%) 19
Table 4.7: Average Personnel Costs 19Table 4.8: Other Indicators (YTL) 20Table 4.9: Other Indicators (%) 20Table 5.1: BOTAŞ’s Receivables 26Table 5.2: TPAO – Domestic Investment Expenditures 41Table 5.3: KIYEM Breakdown of Sales 55Table 5.4: TMO Purchases 67Table 5.5: TMO Sales (Selected Crops) 68Table 5.6: ÇAYKUR Sales and Production 70Table 5.7: TŞFAŞ Sales, Production and Purchases 74Table 5.8: DMO Sales & Revenue Data 79
LIST OF GRAPHS Graphs PageGraph 1: Value Added 16Graph 2: Tea Leaf Purchases 70Graph 3: Tea Leaf Support Payments 71
LIST OF BOXES Box PageBox 1: What is an SOE? 5Box 2: Corporate Governance 10Box 3: Primary Balance of SOEs 12Box 4: Status Change of Temporary Workers into Permanent Workers 17

2006 Annual Ownership Report
4
ABBREVIATIONS AOÇ Atatürk Farm and Forest Enterprise SÜMER HALI Carpeting Company
BO Build-Operate TCDD Turkish State Railways
BOT Build-Operate-Transfer TEDAŞ Electricity Distribution Co.
BOTAŞ Petroleum Pipeline Corporation TEİAŞ Electricity Transmission Co.
CPM Capital Markets Board of Turkey TEKEL Tobacco Co.
ÇAYKUR Tea Enterprise TEMSAN Turkish Electromechanics Industry
DHMİ State Airports Authority TETAŞ Electricity Trading and Contracting Co.
DMO State Supply Office TİGEM Agriculture Enterprises
EBK Meat and Fish Board TKİ Turkish Coal Enterprise
EMRA Energy Market Regulatory Authority TMO Turkish Grain Board
ETİ MADEN Eti Mine Works TOR Transfer of Rights
EÜAŞ Electricity Generation Co. TPAO Turkish Petroleum Corporation
KBİ Blacksea Copper Company TRT Turkish Radio and Television
KIYEM Coastal Safety TSKGV Turkish Armed Forces Foundation
MARA Ministry of Agriculture and Rural Affairs TŞFAŞ Turkish Sugar Factories Corporation
MKEK Mechanical and Chemical Industry Corporation TTK Turkish Hard Coal Enterprise
PA Privatisation Administration TÜDEMSAŞ Turkish Railway Machines Co.
PB Primary Balance TÜİK Turkish Statistical Institute
PEI Public Economic Institution TÜLOMSAŞ Turkish Locomotive Co.
PMUM Balance and Settlement Market TÜVASAŞ Turkish Wagon Co.
PTT Post and Telegraph Organization UT The Undersecretariat of Treasury
SEE State Economic Enterprise YDK Prime Ministry High Auditing Board
SOE State Owned Enterprise YPK High Planning Council
SPO State Planning Organization
*Information about the SOEs and the subsidiaries can be obtained from the address below; http://www.hazine.gov.tr/stat/kit_ist.htm.

2006 Annual Ownership Report
5
CHAPTER 1: INTRODUCTION
State owned enterprises (SOE) have been contributing to the economic growth since the initial years of the Turkish Republic by using the natural resources for the benefit of the economy, giving opportunity to industrial investments, increasing the employment and providing the capital accumulation via State1.
The precedence of SOEs in the Turkish economy have been sustained for years particularly in the capital-intensive sectors. However, when the private sector has managed to make investments by gaining enough capital accumulation and experience and when the liberal economy policies have started to gain importance, the contribution of SOEs to the economy has decreased. Furthermore, the turmoils in the Turkish economy and the problems attached to the characteristics of public enterprises have affected the SOEs adversely.
While the value added of SOEs to the economy was around 7% of the GDP during 1990s, this figure decreased to the 2% of GDP mostly because the number of SOEs has decreased as a result of privatisation and the private sector has started to operate within the sectors open to the competition.
Public enterprises have difficulties while competing with the private companies because they are subject to strict rules and regulations and their managers have limited role while making operational decisions such as employment, investment and pricing.
In this framework, as it is mentioned in the 9th development Plan, an initiative for a new legislation has been started in order to eliminate problems in the SOE system. Moreover, a project about the implementation of the corporate governance principles in the public enterprises has been conducted with the cooperation of Undersecretariat of Treasury, State Planning Organization, Privatization Administration and Capital Markets Board.
1 The idea of founding SOEs in our country arised at İzmir Economic Congress (17 February 1923) in accordance with the aim of “Strenghtening the Economical Domination”
Box 1: What is an SOE?
In Turkish acquis, state owned enterprises (SOEs) are those subject to the Decree Law No. 233 and the common name of the SEEs and PEIs whose whole capital belong to the state.
State Economic Enterprises (SEE): The enterprises which operate in a free market with profit making motive. Such as, MKEK (Military Equipment), EÜAŞ (Electric Generation), ÇAYKUR (Tea), BOTAŞ (Natural Gas), TTK (Hard Coal) and TKİ (Lignite)
Public Economic Institutions (PEI): The institutions which produce public goods and services carrying monopolistic characteristics by taking into account the public welfare. TCDD (Railways), KIYEM (Coastal Safety), PTT (Post Office) and DHMİ (Airport Administration) are the PEIs.
In this context, even there is a state ownership in state banks and the enterprises in the privatisation program, they are not included in the SOE classification because they are not subject to Decree-Law No. 233.

2006 Annual Ownership Report
6
CHAPTER 2: PUBLIC ENTERPRISES AND SOEs
According to the international definition, public enterprises are “the enterprises in which the capital ratio of central authority and local government is more than 50 percent or in which the capital ratio of central authority and local government is less than 50 percent but the government controls the management” 2. As it is defined in the former section, SOEs in Turkey are the subcategory of public enterprises.
In our country, different public administrations exercise the ownership function of the state in public enterprises. Moreover, there is not any public institution/agency responsible for coordination of state’s ownership functions in public enterprises and collecting their data.
It is also common to encounter with a situation in which the public enterprises are associated with a public body other than the shareholder administration. In this dual structure, to set the priorities of the enterprises and to coordinate the performances compatible with general economic policies become much more important.
On the other hand, public enterprises have many subsidiaries. Also, it is not possible to reach the consolidated data of all subsidiaries.
So, the public enterprises and their subsidiaries which are subject to different laws can be classified as follows3:
The Ones Related To Central Government
SOEs and Subsidiaries subject to Decree Law 233 4 and of which UT owns the whole capital,
The state banks which UT owns the whole capital (Ziraat Bank, Eximbank and Kalkınma Bank (99,08%)),
Enterprises subject to Turkish Commercial Law and UT owns the whole capital (TURKSAT),
Enterprises which UT owns the fraction of the capital (Türk Telekomünikasyon A.Ş.),
Enterprises under the portfolio of PA which exercises the ownership function of the state (such as TEKEL, TEDAŞ)
2 2006/111/EC EU Commission Transparency Directive. 3 Please look at Annex-1 for the detailed list of public enterprises and their subsidiaries. 4 Decree Law 233 published in the Official Gazette (date:18.06.1984; number:18435)

2006 Annual Ownership Report
7
Public enterprises where it is not clear which government agncy exercises the ownership function (such as AOÇ and TRT),
Enterprises whose shareholder is the Undersecretariat of Defence Industries5.
Housing Development Administration and its subsidiaries
Social Security Institutions’ subsidiaries
Enterprises under the control of The Savings Deposit Insurance Fund (SDIF)
Revolving funds
Non – Budgetary Funds (Defense Industry Support Fund, Fund for the Encouragement of Social Assistance and Solidarity, Privatisation Fund etc)
The Ones Related To Local Governments
Local governments’ enterprises and their subsidiaries are established to conduct the local activities in a simple and flexible way. Local governments exercise the shareholder function in these enterprises.
As it is seen above, there are many enterprises and subsidiaries which are under the control of central and local governments. The list in the Annex-1 includes the names of the enterprises which are gathered by the working group within the context of Coordination Council for the Improvement of the Investment Environment (YOİKK) Project.
The public sector accounts are constituted of the accounts of the general government and public enterprises. In order to improve fiscal transperancy and accountability, Public Financial Management And Control Law No: 5018 forces the public instutions within the general government (central government, social security institutions and local government) to monitor and report their accounts and annual reports. This Law also distributes the responsibilities between various public administrations.
From this point of view, it will be useful to monitor, report and disclose the accounts of the public enterprises for fiscal transperancy. UT monitors and reports the accounts of its enterprises and PA’s companies. However, it is very important to define the public enterprises in a broder terms and to collect and to disclose their accounts.
5 The enterprises, their subsidiaries and indirect subsidiaries of Turkish Armed Forces Foundation are not included in this list though they can be classified as public enterprises because the management control is at the hands of government officials. This Foundation has a special status.

2006 Annual Ownership Report
8
CHAPTER 3: TREASURY PORTFOLIO
There were 26 enterprises in 2006, of which 20 were SOEs, 4 public banks and 2 other under Treasury portfolio.6 The UT performs the state ownership function through General Directorate of State Owned Enterprises.
3.1. Our Portfolio
List and capital structures of SOEs, public banks and others in our portfolio as of 2006 are presented in Table 3.1.
All enterprises except TPAO, TŞFAŞ, Kalkınma Bankası and Türk Telekomünikasyon A.Ş. are wholly owned by the state. As of 2006, YTL 27 billion of YTL 31 billion subscribed capital was paid.
3.2. Our Task
According to Law No. 4059, the duty of UT regarding the SOEs are as follows:
♦ Exercising the ownership functions of the state,
♦ Manage the relations between Treasury and the SOEs,
♦ Prepare the general financing and investment program of the SOEs together with SPO, present the program for Council of Ministers approval, monitor the course of the program and make necessary revisions according to developments during the year,
♦ Monitor the SOEs’ operations whether they comply to related legislation or not,
♦ Provide that SOEs operate effectively and efficiently; or fulfill duties given by High Planning Council, High Privatisation Council or other authorities related to preparation for privatization of an SOE.
6 In our portfolio, there are also some public participations. The shares in these participations, including heritages to Treasury, are negligible in terms of percentages; therefore they are not included in this report.

2006 Annual Ownership Report
9
Table 3.1: Capital Structure of the Treasury Portfolio (as of 31.12.2006 - Million YTL) Subscribed
CapitalPaid-in Capital
Treasury’s Share (%)
MKEK 300 231 100,0 ETİ MADEN 100 89 100,0 TTK 3.000 2.926 100,0 TKİ 360 360 100,0 EÜAŞ 1.300 1.300 100,0 TEİAŞ 330 326 100,0 TETTAŞ 179 73 100,0 TPAO 950 950 97,0 BOTAŞ 1.830 1.830 100,0 TMO 961 961 100,0 ÇAYKUR 469 465 100,0 TİGEM 300 269 100,0 DMO 26 26 100,0 TCDD 8.000 6.089 100,0 PTT 800 731 100,0 DHMİ 1.700 376 100,0 KIYEM 42 42 100,0 SÜMER HALI 50 37 100,0 EBK 400 332 100,0 TŞFAŞ 1.600 1.534 99,9 SOE TOTAL 22.697 18.947
T.C.ZİRAAT BANK 2.500 2.222 100,0 T.H.T.EMLAK BANK 750 749 100,0 T. KALKINMA BANK 160 160 99,0 EXİMBANK 1.000 929 100,0 PUBLIC BANKS TOTAL 4.410 4.060
TÜRKSAT 438 438 100,0 TÜRK TELEKOM 3.500 3.500 45,0
GRAND TOTAL 31.046 26.945 Source: UT

2006 Annual Ownership Report
10
3.3. Our Objectives and Goals
The UT aims to improve the efficiency and value of SOEs by fulfilling its duties effectively. The policies are implemented by setting annual investment and financing program, monitoring SOE performance and ensure that they operate with conformity to this program. In the long term, SOEs are expected to operate efficiently and effectively under market conditions and achieve a status that can compete with private firms.
Box 2: Corporate Governance
OECD Principles of Corporate Governance
OECD Guidelines on Corporate Governance of State Owned Enterprises
Organisation for Economic Cooperation and Development (OECD) prepared Principles of Corporate Governance in 1999 and Guidelines on Corporate Governance of State Owned Enterprises in 2005. The guidelines is available at www.oecd.org. The guidelines cover six main topics:
I. Ensuring an Effective Legal and Regulatory Framework for State-Owned Enterprises: The legal and regulatory framework for state-owned enterprises should ensure a level-playing field in markets where state-owned enterprises and private sector companies compete in order to avoid market distortions.
II. The State Acting as an Owner: The state should act as an informed and active owner and establish a clear and consistent ownership policy, ensuring that the governance of state-owned enterprises is carried out in a transparent and accountable manner, with the necessary degree of professionalism and effectiveness.
III. Equitable Treatment of Shareholders: The state and state-owned enterprises should recognise the rights of all shareholders and in accordance with the OECD Principles of Corporate Governance ensure their equitable treatment and equal access to corporate information.
IV. Relations with Stakeholders: The state ownership policy should fully recognise the state-owned enterprises’ responsibilities towards stakeholders and request that they report on their relations with stakeholders.
V. Transparency and Disclosure: State-owned enterprises should observe high standards of transparency in accordance with the OECD Principles of Corporate Governance.
VI. The Responsibilities of the Boards of State-Owned Enterprises: The boards of state-owned enterprises should have the necessary authority, competencies and objectivity to carry out their function of strategic guidance and monitoring of management. They should act with integrity and be held accountable for their actions.
The Project on Corporate Governance of SOEs in Turkey
Studies regarding the governance of SOEs started in 2002 and several drafts have been prepared. However, those studies have not gone beyond the phase of compilation of public institutions‘ suggestions on draft law. The last draft law prepared in 2005 has become absolute.
In the scope of YOİKK objectives, a project on Corporate Governance of SOEs in Turkey has been initiated again, this time with contribution of SPO, PA and CMB.
List of public enterprises has been compiled, corporate governance of public enterprises in other countries has been surveyed and SOEs in Turkey are evaluated in the framework of good governance principles.
With the help of the findings in this study, we will set an SOE model suitable for our country and prepare a draft law. It is foreseen that, the draft will be finalized and project will be completed by the end of December 2008.

2006 Annual Ownership Report
11
3.4. SOE – Central Government Budget Relation
The financial relation between SOEs and Central Government Budget comprises transfers from SOEs to budget and transfers from budget to SOEs. (See Table 3.2)
3.4.1. Transfers from Budget to SOEs
Transfers from Treasury Budget to SOEs in our portfolio occur by two means.
Capital Transfers: Regarding our responsibilities towards SOEs and public banks, capital transfers are performed in accordance with related budget laws.
Duty Loss / Income Loss Payments: Duties given by Council of Ministers to SOEs in accordance with Decree Law No. 233 and to public banks in accordance with Law No. 4603 are compensated from the budget in compliance with the legislation mentioned.
3.4.2. Transfers from SOEs to Budget
Other than tax and other legal liabilities, transfers from SOEs to budget are made by two means.
Dividend Payments: Those payments are calculated in accordance with related legislation and paid to the Treasury.
Treasury Levy Payments: In reference to the Law No. 5018 Article 78, up to 15 percent of gross sales of some specific SOEs is paid to the budget7.
Table 3.2: SOE –Central Government Budget Relations (Million YTL) 2005 - 2006
2005 2006 Amount % Increase
Transfers from Budget to SOEs Capital Transfers 921 1.917 996 108Duty Loss / Income Loss Payments 502 710 208 41Total 1.423 2.627 1.204 85 Transfers from SOEs to Budget Dividend Payments 1 2.128 3.428 1.301 61Treasury Levy Payments 166 191 25 15Total 2.294 3.619 1.325 581 Including Telekom Source: UT
7 The SOEs to pay Treasury Levy and the payment ratio are determined by Decree of Council of Ministers No: 2005/9916. Those SOEs are TPAO, DHMİ, KIYEM and DMO.

2006 Annual Ownership Report
12
In 2006, YTL 2,6 Billion were transferred to SOEs, which contributed an amount of YTL 3.6 Billion to the budget8. (Table 3.2)
8 For details, see Annex 1- Non - Tax Revenues Table or Table 7: Non - Tax Revenues Table available at http://www.hazine.gov.tr/stat/kit_ist.htm.
Box 3: Primary Balance of SOEs One of the fundamental objectives of the economic program being implemented is the realization of Primary Balance (PB) targets for public sector. Our Undersecretariat is responsible for target setting and monitoring of SOEs and some companies in the privatization portfolio, which are a part of the Consolidated Government Sector monitored and reported in this respect. PB of SOEs is calculated starting from the Profit / Loss figure and subtracting some non - cash revenue and expenses and adding some non – revenue and non – expense cash recipts and disbursements and exclusion of interest related accounts. PB is calculated annually based on above the line method and it is monitored monthly based on below the line method. In this respect, calculation method of SOE PB is on accrual basis; therefore it has some differences from that of the central government. Above the line PB Below the line PB (+) Profit / Loss (+) Increase in financing (-) Non-cash revenues (-) Increase in debts (+)Non-cash expenses (+) Increase in receivables (+) Non-revenue cash inflows (-) Interest Income (-) Non-expense cash outflows (+) Interest expense (-) Interest Income (+) Interest expense

2006 Annual Ownership Report
13
CHAPTER 4: 2006 PERFORMANCE OF ALL SOEs
In this section the aggregated data and analysis of the SOEs under Treasury portfolio are presented. 9
4.1. Financial Analysis
4.1.1. Income Statement
The gross sales of 20 SOEs and 4 subsidiaries under Treasury portfolio has reached to 44 Billion YTL with an increase of 26%. But their net profit has declined to 1,2 Billion YTL with a decrease of 23% 10 .
Table 4.1: Aggregated Income Statement (Current Prices - Billion YTL)
2004 2005 2006 Change (%)
(1) (2) (3) (2)/(1) (3)/(2)Gross Sales 29.332 34.886 44.061 19 26
Domestic Sales 27.264 31.893 39.924 17 25 Export Sales 1.156 1.383 1.614 20 17 Duty Losses 692 1.364 1.408 97 3
Discounts From Sales 192 218 529 14 143Cost of Goods Sold 25.145 30.865 39.928 23 29Operating Expenses 1.738 1.885 2.159 8 15Operating Profit or Loss 2.258 1.917 1.445 -15 -25Ordinary Revenues From Other Operations 3.449 1.175 3.775 -66 221Ordinary Expenses From Other Operations 2.159 552 2.271 -74 311
Provisions 72 266 218 271 -18Financing Expenses 719 428 992 -40 132
Interest Expenses 405 279 437 -31 57Exchange Rate Differences 310 146 552 -53 277
Extra Ordinary Revenues and Profit 371 1.159 642 213 -45Extra Ordinary Expenses And Losses 1.437 1.755 1.434 22 -18Profit – Loss 1.762 1.516 1.166 -14 -23Net Profit – Loss 1.232 1.028 799 -17 -22Net Profit – Loss / GDP 0,29 0,21 0,14 Source: SOEs and UT
9 The tables in this report cover the data of last three years. Data of last five years can be seen in the annexes. Financial data of 2005 and 2006 are not officially audited and so temporary figures. Data used in the report covers the figures of the SOEs in the Treasury Portfolio as of 2006. In other words, the tables do not cover the figures of the SOEs transferred to the Privatization Administration’s Portfolio before 2006 like TEDAŞ and TEKEL. 10 The accounts of TÜVASAŞ, TÜLOMSAŞ, and TÜDEMSAŞ which are the subsidiaries of TCDD and TEMSAN, one of the subsidiaries of EÜAŞ, are monitored separately from the main SOE. In 2007 TEMSAN’s status is turned to an SOE.

2006 Annual Ownership Report
14
The main reason for the profit shrinkage is the increase in ‘the cost of goods sold’ by 29% despite to the increase in the gross sales by 23%. The sudden depreciation of YTL in May and June of 2006 has affected the input costs of energy SOEs, namely EÜAŞ, TEİAŞ, TPAO and BOTAŞ.
The main reason of 97% increase in the duty loss amounts which is a part of the gross sales in 2005 figures is the high grain purchases of TMO.
Financial expenses are reduced by 40% in 2005 but increased by 132% in 2006. The main reasons behind this issue are the fluctuation in the exchange rates occurred in May and June of 2006 and the financial expenses of the BOTAŞ.
The increases of the other ordinary revenues and ordinary expenses in 2006 are respectively 221% and 311% and composed of the exchange profit and losses from the exchange rates, especially of TPAO and BOTAŞ.
4.1.2. Balance Sheet
The consolidated balance sheet figures of 20 SOEs and 4 subsidiaries in the Treasury portfolio has reached to 73 Billion YTL with an increase of 18% in 2006 from 62 Billion YTL in 2005. In this period the ratio of balance sheet figures to the GDP remained unchanged. (Table 4.2)
One of the most important points in the balance sheet figures is the 4% decrease in stocks. The main reason in this case is the transfer of 3 sugar factories of TŞFAŞ to the PA portfolio from Treasury Portfolio. Table 4.2: Aggregated Balance Sheet (Current Prices - Billion YTL)
2004 2005 2006 Change (%)
(1) (2) (3) (2)/(1) (3)/(2)TOTAL ASSETS 56.072 61.834 72.784 10 18Current Assets 24.647 29.980 38.835 22 30 Liquid assets and Securities 2.238 2.632 3.009 18 14 Trade and Other Receivables 15.495 18.839 26.866 22 43 Inventories 4.464 5.422 5.194 21 -4Fixed Assets 31.425 31.854 33.949 1 7 Trade and Other Receivables 1.478 2.035 1.845 38 -9 Financial Fixed Assets 1.209 1.187 1.219 -2 3 Tangible Fixed Assets 28.105 27.724 29.423 -1 6Short Term Liabilities 17.074 19.728 25.693 16 30 Financial Liabilities 2.654 2.267 3.776 -15 67 Trade and Other Liabilities 9.700 12.187 16.046 26 32 Taxes Payable and Other Fiscal Liabilities 983 1.018 1.212 4 19Long Term Liabilities 6.252 7.075 8.494 13 20 Financial Liabilities 5.547 5.548 6.175 0 11 Trade and Other Liabilities 61 50 556 -17 1011Equity 32.746 35.030 38.596 7 10 Nominal Capital 16.603 19.175 22.952 15 20 Paid in Capital 13.862 16.830 18.825 21 12TOTAL ASSESTS / GDP 13,0 12,7 12,6 Source: SOEs and UT

2006 Annual Ownership Report
15
Increases in the balance sheet are mainly composed of the increases in receivables and the Short term liabilities. SOEs had to fulfill their financial obligations with debts (lending or not-paying some taxes) due to the unability to collect their receivables.
4.1.3. Ratio Analysis
Current Ratio: Current ratio, which shows the capability of paying short term liabilities and sufficiency of net working capital, has not changed much from 2005 to 2006. It was 1,52 in 2005 and 1,51 in 2006.
Table 4.3: Financial Ratios 2004 2005 2006Liquidity Ratios
Current Ratio 1,44 1,52 1,51Acid-Test Ratio 0,84 0,95 1,01Cash Ratio 0,10 0,13 0,11Inventory Turnover 1,52 1,56 1,88Cash Collection Period (Days) 149 166 190Cash Conversion Cycle (Days) 99 100 101
Capital Structure and Long Term Financing Position Financial Leverage 0,42 0,43 0,47Long Term Liabilities / Capital 0,19 0,20 0,22Equity / Assets 0,58 0,57 0,53Interest Coverage Ratio 3,45 4,54 2,18
Rate of Investment Returns Return on Assets (ROA) (%) 3,43 2,25 2,22Return on Equity (ROE) (%) 4,26 3,03 2,17
Operational Ratios Gross Sales Profit Ratio 0,14 0,11 0,08Operating Profit / Sales 0,08 0,06 0,03Profit Before Tax / Sales 0,06 0,04 0,03Net Profit / Sales 0,04 0,03 0,02
Asset Utilization Ratios Sales / Liquid Assets 17,50 13,72 15,91Sales / Receivables 2,42 2,16 1,90Sales / Assets 0,52 0,56 0,60
Source: UT
Acid-Test Ratio: The ratio of the liquid assets, securities and current receivables to the short term liabilities gives the acid-test ratio which was 0,95 in 2005 rose up to 1,01 in 2006

2006 Annual Ownership Report
16
Stock Turnover Ratio: This ratio which shows how many times the firm turns over its stocks along a year rose up to 1,88 in 2006 from 1,56 of 2005.
Cash Collection Period (Days): The length of collecting receivables was 166 days in 2005 and it rose up to 190 days in 2006 due to collecting problems of especially energy SOEs (electricity and natural gas)
Cash Conversion Cycle (Days): This ratio which is around 100 days in both 2005 and 2006, measures in how many days the cash is spent and collected..
Financial Leverage: This ratio shows the percentage of total assets financed by liabilities. In 2005 the financial leverage was 0,43 and it rose up to 0,47 in 2006
Interest Coverage Ratio: This ratio which was 4,54 in 2005 and fell down to 2,18 in 2006, is used to determine how easily a company can pay interest on outstanding debt. The lower the ratio, the more the company is burdened by debt expense.
Return on Assets (ROA) (%): This ratio which was 2,25 in 2005 has fallen down to 2,22 in 2006, measures if the assets in the firm used effectively.
Return on Equity (ROE) (%): This ratio measures the profit per share that the shareholders transfer to the firm. This ratio was 3,03% in 2005 and fallen down to 2,17% in 2006. This ratio rises up to 5% if the SOEs receiving budgetary capital injections (TTK and TCDD) are excluded.
Operation and Asset Utilization Ratios: A downward trend is observed. As an example, the ratio of operating profit to the sales has fallen down to 3% from 6% in 2006 compared to the 2005 figures.
4.1.4. Value Added
The value added is calculated as the sum of net profit, interest payments, provisions, current year’s amortization and the employment costs. The ratio of the value added was 2,4% of the GDP in 2003 and it falls down to 1,7% in 2006.
Chart 1: Value Added
8.800
9.0009.200
9.4009.600
2004 2005 20060,00,51,01,52,02,5
Current Prices (Billion YTL) % GDP (Right Axis)

2006 Annual Ownership Report
17
Box 4: Status Change of Temporary Workers Into Permanent Workers
Although the employment of temporary workers was foreseen as temporary, seasonal or campaign jobs that are needed to be done for a certain period of time in a year, ongoing employment policies in public sector have caused either employment of temporary workers in permanent tasks or periodic jobs that need to be done at certain time intervals. Thus, the temporary workers have turned into permanent workers or workers of continuously repeated contracts.
With Law No: 5620, the statute of temporary workers has been rearranged according to their de facto duties and/or the total work days they have been employed in a financial year. The Law covers SOEs, firms that are in the portfolio of Privatization Administration, central governments and local administrations. In SOEs, temporary workers that were employed more than 6 months in 2006 and temporary workers that worked in the same conditions in 2005 or 2006 with the excuses described in the Law who are currently unemployed due to their temporary worker status, have become permanent workers. On the other hand, from now on, SOEs can only employ temporary workers for seasonal or periodic jobs if they work less than 6 months. The contracts of temporary workers, who have reached 56 in women and 58 in men and have deserved to get a pension, are ended with all their financial legal rights paid.
26.000 temporary workers in SOEs are expected to turn to permanet worker status.
4.2. Employment
Personnel regime of the SOEs has been regulated by Decree Law No.399. Three different kinds of employee statute exist within SOEs.11.
Civil Servant
Civil servants are either subject to Law No. 657 or Decree Law No: 399. These personnel are generally employed as administrative staff who is responsible for performing fundamental and permanent tasks. The titles of civil servants that are subject to Decree Law No: 399, are listed in the first table attached to the Decree.
Contracted Personnel
Contracted personnel are subject to Decree Law No: 399. The titles of contracted personnel are listed in the second table attached to the Decree. The contracted personnel are not qualified as workers. Their main duty is to perform non-administrative tasks.
Workers
The workers are employed according to the Labor Law No: 4857. There are three different statuses for workers.
Union Workers: These workers have the right to involve in collective bargaining processes.
Non-Union Workers: Non-union workers are employed according to Labor Law No:4857 but they are not allowed to involve in collective bargaining processes due to their administrative duties.
11 The statistics of firms that are in the portfolio of Undersecretariat of Treasury and Privatization Authority can be reached at http://www.hazine.gov.tr/stat/kit_ist.htm.

2006 Annual Ownership Report
18
Temporary Workers: Temporary workers are employed in periodic or seasonal for a maximum time of 11 months in a year. Law No: 5620 that passed in 2007 has rearranged the statute of temporary workers. (Box 4)
In SOEs, the salaries of civil servants and contracted personnel are determined with Budget Laws, High Planning Council Decisions and Decrees of Council of Ministers. On the other hand, the wages of workers is determined by collective bargaining.
4.2.1. Personnel Numbers
The policy of decreasing the number of personnel has been adopted with the aim of rationalization of employment, improvement of personnel profile by replacement of redundant workers with qualified workers and improving the competition ability of SOEs. The Annual Decree of Council of Ministers on SOEs allows them to hire 10% of previous year’s attritions, with some exceptions on expert and internationally-enforced positions . The priority in new employment is to hire highly qualified personnel in order to increase the average qualifications of the staff.
In 2000, the average number of personnel employed in Treasury Portfolio was 229.000. The number has been reduced to 171.000 employees in 2006. The number of average personnel employed by SOEs has decreased in 2005 and 2006 by 3,9% and 2,9% respectively. (Table 4.4).
Table 4.4: Personnel Numbers (Yearly Average)
2004 2005 2006 Change(%)
(1) (2) (3) (2)/(1) (3)/(2)Civil Servant + Contracted 84.446 80.190 79.179 -5,0 -1,3Worker 98.898 95.987 91.847 -2,9 -4,3Total 183.344 176.177 171.026 -3,9 -2,9
Source: SOEs and UT
4.2.2. Personnel Costs
In line with the policy of decreasing the number of personnel, personnel costs are also in a declining trend. The employment costs of SOEs that are in the Treasury Portfolio have only increased by 4% and reached a total amount of 5,2 Billion YTL.
Table 4.5: Personnel Costs (Million YTL)
2004 2005 2006 Change(%)
(1) (2) (3) (2)/(1) (3)/(2)Civil Servant + Contracted 1.659 1.763 1.912 6,2 8,4Worker 2.837 3.211 3.260 13,2 1,5Total 4.497 4.974 5.171 10,6 4,0
Source: SOEs and UT

2006 Annual Ownership Report
19
Another indicator for this decrease is the share of personnel costs in total operating costs that are reflected in income statement. The share of personnel costs in the operating costs fell from 36% in 2000 (Appendix 3) to 12% in 2006. (Table 4.6).
Table 4.6: Total Personnel Costs / Total Operating Cost (%)
2004 2005 2006
Civil Servant + Contracted 6,2 5,4 4,5Worker 10,6 9,8 7,7Total 16,7 15,2 12,3Source: UT
4.2.3.Average Personnel Costs
The average personnel cost in SOEs is higher than that of public and private sector. Per month average cost of civil servants and contracted personnel employed in SOEs was 2,012 YTL in 2006. The average cost for workers in the same period realized as 2,957 YTL (Table 4.7).
Table 4.7: Average Personnel Costs (YTL/Month)
2004 2005 2006 Change (%)
(1) (2) (3) (2)/(1) (3)/(2)Civil Servant + Contracted 1.638 1.832 2.012 11,9 9,8
Worker 2.391 2.788 2.957 16,6 6,1
Total 2.044 2.353 2.520 15,1 7,1Source: UT
4.2.4. Personnel Profile
The efforts to reduce the number of personnel while upgrading their quality have not yet given desired results in profile outcomes. The statistics on the personnel profile are presented at the end of the Report. (Appendix 3). According to data collected from SOEs, personnel profile is summarized below:
♦ Average working duration, 16 years
♦ Average age, 42
♦ High school or lower education level, 79%
♦ Women participation, 7,2%
♦ Foreign language skill, 0,7%

2006 Annual Ownership Report
20
♦ The personnel employed for social responsibility and legal obligations are
3% disabled, 1,7% convicted previously 0,3% veteran-martyr relatives 0,5% from Social Services and Child Protection Agency 6,4% special security personnel.
4.3. Other Indicators
The Investment expenditures of SOEs have constantly increased over the last 3 years and reached to the 0,48% of GDP from 0,35% of GDP. The main reasons behind this increase are the new oil wells of TPAO and the investments made by TCDD for high – speed trains (Table 4.8 and Table 4.9.)
Table 4.8: Other Indicators (Billion YTL)
2004 2005 2006 Change (%)
(1) (2) (3) (2)/(1) (3)/(2)Investment Expenditures 1.494 2.229 2.746 49,2 23,2Primary Balance 1.958 546 2.270 -72,1 315,6Budgetary Transfers (Capital, Duty Loss) 1.303 1.423 2.627 9,2 84,6Source: UT and SPO
The Primary balance figure rose up to 2.270 million YTL in 2006 from 546 million YTL in 2005. The most important part in this improvement is the increases in the budgetary transfers figures and improvement of primary balance of TMO in 2006 compared to that of in 2005.
Table 4.9: Other Indicators (Percentage to GDP - %)
2004 2005 2006
Investment Expenditures 0,35 0,46 0,48Primary Balance 0,45 0,11 0,39Budgetary Transfers* 0,30 0,29 0,46*Capital, Duty Loss Source: UT and SPO
4.4. Main Problems of SOEs
Although they operate in a competitive environment and are expected to make profit, SOEs have to face with various problems just because they are state enterprises.
The primary problems can be summarized as followings below:

2006 Annual Ownership Report
21
♦ Pricing Policy: In the Annual Investment and Financing Program Decree12, it is stated that the SOEs “are free to set their prices of goods and services in line with the principles and policies of the ongoing economic program by taking the necessary measures needed for cost efficiency”. However, in practice they have to cope with some problems to realize it.
♦ Duty Losses: Although SOEs do not have any financial problems on accrual basis caused by duty loss mechanism, they usually have problems on cash basis because of the late payments from the central budget.
♦ Non flexible employment policies: SOEs do not have the flexibility on employment issues as much as the private companies, like hiring – firing personnel and wage policies. Additionally, many public institutions other than SOEs are involved in the hiring process.
♦ Investment: investment decisions are one of the most important issues for a company. The Boards of Directors of the SOEs are not independent in decision making process. Their investment projects have to be approved by the SPO.
♦ Procurement Rules: SOEs are subject to the public procurement law unlike their rival firms in private sector. Because of the restrictions in procurement legislation they do not have enough flexibility required for commercial operations.
♦ Board of Directors: Current legal structure of the board of directors is far from modern corporate governance principles.
♦ Auditing: The official auditing process of High Auditing Board takes a long time, around 18 months. Moreover, there are many other institutions like related ministry, State Supervisory Council, Prime Ministry Inspection Board which also have the right to audit and inspect them. SOEs are not subject to the external independent auditing.
12 Decree of Council of Ministers No: 2006/11106 of date September,16, 2006
2006 Annual Ownership Report
22
CHAPTER 5: PERFORMANCES OF THE SOEs
In this section, general introductory information about 20 SOEs in the Treasury portfolio has been presented, and their performance in 2006 is summarized separately.
In analyzing SOEs’ 2006 performances, their operation areas, problems and 2006 developments have been summarized, and financial analysis has been done through several financial ratios.
More detailed data can be reached at the firms’ web sites or in their annual reports.
The list of Board of Directors consists of members as of 31 July 2007, whereas subscribed and paid-in capital amounts represent the figures in Treasury accounts as of 31 December 2006.
SOEs have been classified by their sectors, namely energy and mining, transportation and communication, agriculture and other.

2006 Annual Ownership Report
23
5.1. ENERGY AND MINING SECTORS

2006 Annual Ownership Report
24

2006 Annual Ownership Report
25
5.1.1. BOTAŞ Petroleum Pipeline Corporation Board of Directors ♦ Hüseyin Saltuk Düzyol (Chairman and General Director) ♦ Osman Göksel (Deputy General Director) ♦ Rıza Çiftçi (Deputy General Director) ♦ Representative (NA – Related Ministry Representative) ♦ Representative (NA – Related Ministry Representative) ♦ Representative (NA – Treasury Representative)
Capital Structure Treasury Share : 100% Subscribed Capital:1,83 Billion YTL Paid-in Capital : 1,83 Billion YTL
Related Ministry Ministry of Energy and Natural Resources
Web Address http://www.botas.gov.tr
Petroleum Pipeline Corporation (BOTAŞ) was founded on August 15, 1974 by the Turkish Petroleum Corporation (TPAO) as a subsidiary company under the auspices of the Decree No 7/7871. The primary founding mission of BOTAŞ was the transportation of petroleum through pipelines. Due to Turkey's increasing need for clean and cheap energy sources, the importance of natural gas has increased. Therefore, BOTAŞ has been assigned to expand the pipelines and make natural gas agreements.
Considering the company's existing and future tasks, BOTAŞ was restructured in 1995 by the authority of the Decree of Council of Ministers No. 95/6526 as an SEE obtaining therefore the status of an independent company. BOTAŞ's monopoly rights on natural gas import, distribution, sales and pricing that were granted by Decree No.397 dated February 9, 1990, was abolished by the Natural Gas Market Law No. 4646 which was enacted on May 2, 2001. The Law covers the import, transmission, distribution, storage, marketing, trade and export of the natural gas and the rights and obligations of all real and legal entities related to these activities.
BOTAŞ’s market share in internal transportation is 98%; and its share in natural gas importation is 100%.
Major Developments and Issues
As a result of expansion of natural gas use in the country, new pipelines have been instructed. At the end of the year 2006; the length of the pipelines has reached to 10 km with a supply to 43 provinces. Thus; the consumption of natural gas has increased to 30 billion m3 by 13% rise compared to the previous year.
Today, BOTAŞ imports 32 billion m3 natural gas from different countries including Russia. In order to improve the participation of private sector; BOTAŞ has tendered import contracts for 16 billion m3 natural gas. However, only 250 million m3 of the tendered amount has been transferred yet.

2006 Annual Ownership Report
26
Due to the increasing petroleum prices; natural gas purchase price has also increased by 122% in 2002-2006 periods. Nevertheless, in that time period, the rise in sales prices could be reflected by 82% to households, and 60% to the industry. The price for EÜAŞ, Build-Operate-Transfer (BOT) and Build-Operate (BO) power stations is calculated by adding a margin on purchase price.
On the other hand; BOTAŞ has been experiencing financial difficulties because of collection problems (EGO and EÜAŞ). As a result, to fulfill its financial obligations from abroad, BOTAŞ has begun to get commercial bank loans which has rise to 1.74 billion YTL. The interest for the credit is 197.5 million YTL at the end of 2006; and it is 500 million YTL until May 15, 2007.
Financial Analysis
BOTAŞ experienced operating loss in 2006. The problems related to price adjustment mechanism and collection and the decrease in expected revenue from Iraq-Turkey Natural Gas Pipeline have also triggered BOTAŞ’s financial difficulties. However, with the help of company’s other revenues, its profit has reached to 45 million YTL for this period.
BOTAŞ’s receivables excluding interest is over 4 billion YTL. Due to the problems in energy sector related to collection, street lighting, high loss/leakage and timely pricing, BOTAŞ can not collect cash from EÜAŞ; and the receivables from that company increased continuously.
Receivables of BOTAŞ on July 13, 2007 can be seen in Table 5.1.
Table 5.1: Receivables of BOTAŞ (Million YTL) COMPANY Principle Interest Total %
EGO 677 0 677 6,5EÜAŞ 3.201 5.547 8.748 83,4HEAŞ 299 489 788 7,5EÜAŞ+HEAŞ 3.500 6.036 9.536 90,9İZGAZ(Treasury) 40 0 40 0,4İZGAZ (In effect) 20 0 20 0,2BOT+BO 58 9 66 0,6İGDAŞ 0 2 2 0,0TÜGSAŞ 4 18 22 0,2Other 84 15 99 1,2TOTAL 4.383 6.080 10.464 100,0Source: BOTAŞ

2006 Annual Ownership Report
27
Law No: 5669, which aims to expedite for the collection of receivables from EGO, was accepted in Parliament on May 25th, 2007. It is stipulated that the minimum 80% of the Ankara’s natural gas distribution company which the Metropolitan Municipality (EGO) owns will be privatized within 2 years. Moreover, it is envisaged in the Law that within one month following the completion of privatization date, outstanding receivables of EGO to BOTAŞ will be paid.
SELECTED INDICATORS 2005 2006 % Increase(Million YTL) Gross sales 8.155 12.307 50,9Operating profit or loss 232 -150 -164,6Profit or loss 245 45 -81,8Total Assets 8.400 11.742 39,8Acid – Test Ratio 0,81 0,81 -0,2Average Collection Period (Days) 156 160 2,5Cash Conversion Cycle (Days) 96 97 1,2Return on Equity (ROE) (%) 6,7 1,2 -81,7Total Employment Figure (Average) 2.745 3.110 13,3Total Employment Cost 116 159 36,6Value Added 905 655 -27,5Investment Expenditure 573 543 -5,2Payments to Budget (Dividend and Treasury Levies) 0 0 -Payments from Budget (Capital and Duty Loss) 0 0 -Primary Balance 55 -424 -876,5Source: BOTAŞ, UT and SPO
Employment cost of the company has increased parallel to the new staffing; but the value added figure has decreased. Furthermore, whereas the primary surplus of the company was 55 million YTL for the year 2005, it became -424 Million YTL in 2006.

2006 Annual Ownership Report
28
5.1.2. EÜAŞ Electricity Generation Incorporated Company Board of Directors ♦ Sefer Bütün (Chairman and General Director) ♦ Nurettin Kulalı (Deputy General Director) ♦ M.Ahmet Dere (Related Ministry Representative) ♦ Mehmet Faruk Akşit (Related Ministry Representative) ♦ Member (Empty – Related Ministry Representative) ♦ Edip Yılmaz (Treasury Representative)
Capital Structure Treasury Share : 100% Subscribed Capital: 1,3 Billion YTL Paid-in Capital : 1,3 Billion YTL
Related Ministry Ministry of Energy and Natural Resources
Web address http://www.euas.gov.tr
Electricity Generation Incorporated Company (EÜAŞ) was established to carry out its generation activities as an SOE according to the Decree Law No. 233 and 399, the Decree of Council of Ministers No. 2001/2026 and Electricity Market Law No. 4628. Its Articles of Association was published in Official Gazette No. 26241on 27th of July in 2006.
EÜAŞ is an SEE which is established to generate electricity efficiently and profitably under the guidance of economic and energy policies of the State. Other functions of EÜAŞ are:
♦ to contract electrical energy sales and /or sub sevices ♦ to take over the due facilities, to operate the generation facilities of which have
not taken over by the private sector, via by herself and/or subsidiaries, or to take out the system when necessary.
♦ to get the licences from the Energy Market Regulatory Authority (EMRA) according to its field of activity and to pay licences costs to EMRA. To act according to these licences.
♦ to procure all kinds of studies, projects, constructions and facilities needed for electricity generation.
♦ to procure all kinds of goods and services for maintenance, repair, rehabilitation, operation and development of the generation facilities domestically and/or via import.
♦ To operate , the mines to be used for electricity generation at the existing or future thermal power plants and other resources or to make it generated via service procurement.
In 2006 EÜAŞ’s market share was 48%.

2006 Annual Ownership Report
29
Major Developments and Issues
In the year 2006 there were both structural and legal changes in the electricity energy sector. A Loan Agreement of “Electricity Generation Rehabilitation and Restructuring Project” was signed on 12.09.2006 between World Bank and EÜAŞ. The rehabilitation of Afşin Elbistan A thermic plant started with this loan agreement. On the other hand, with the exception of hydroelectric plants held in EÜAŞ body, 6 portfolio generation groups were established. On 12.02.2006 Afşin Elbistan-B plant with 1440 MW installed capacity became operational. It is expected that the production figure will be 8 billion kwh in a year, if it goes into a full capacity production.
The efforts on the preparation of regulation for “Hand over of hydro plants which were built by DSİ to EÜAŞ” continued in 2006.
In June 2006, transition period contracts about energy purchase and sale were signed between EÜAŞ’s portfolio generation groups and distribution companies which have retail sale licence. The period is set not to exceed 5 years.
EÜAŞ’s thermic plants working by natural gas was affected from increased natural gas prices (Price of natural gas is linked to price of petroleum). In addition to this private sector producers gave up producing electricity due to the high natural gas prices. Thus EÜAŞ had to produce more than it had planned.
Moreover EÜAŞ has been still negatively effected from the debt and receivable problem among energy SOEs.
Financial Analysis
In 2005 EÜAŞ’s total assets were 16,1 billion YTL. In 2006 it increased by 20% and reached to 19,3 billion YTL. High increases in” Commercial and other receivables” and “short term loan capital” figures are caused by the increase of EÜAŞ’s short term debts to other energy SOEs .
In 2006 gross sales increased by 41.7% and reached to 5,7 billion YTL, profit of the period decreased to 269 million YTL by 42.4%. (In 2006 EÜAŞ’s total energy production was 84.4 billion kwh, total energy sales was 80.5 billion kwh)
Despite 42 % increase in sales, 59% increase in cost of goods sold lowered the profitability. In 2005 financing costs decreased 47% but in 2006 it increased 261%. This high increase was due to the fluctuation of foreign exchange rates occured in May 2006.
Current ratio has been 1.4 for the last 3 years. Acid test ratio has been increasing since 2004, and in 2006 it became 1.1.

2006 Annual Ownership Report
30
Due to the fact that average average collection day of its receivables increased from 327 days in 2005 to 400 days in 2006. Since the company can’t collect its receivables on time from distribution companies and TETAŞ, cash conversion cycle increased rapidly in 2006.
SELECTED INDICATORS 2005 2006 % Increase(Million YTL) Gross sales 4.024 5.702 41,7Operating profit or loss 1.119 923 -17,5Profit or loss 468 269 -42,4Total Assets 16.116 19.337 20,0Acid – Test Ratio 0,98 1,07 8,4Average Collection Period (Days) 327 400 22,3Cash Conversion Cycle (Days) -5 44 -1.009,5Return on Equity (ROE) (%) 3,6 2,2 -38,0Total Employment Figure (Average) 11.910 13.134 10,3Total Employment Cost 392 427 8,9Value Added 1.708 1.955 14,4Investment Expenditure 415 244 -41,3Payments to Budget (Dividend and Treasury Levies) 0 0 -Payments from Budget (Capital and Duty Loss) 0 0 -Primary Balance 984 1.055 7,2Source: EÜAŞ, UT and SPO
In 2006 EÜAŞ’s value added was around 1,9 billion YTL and primary surplus was 1 billion YTL. In 2006 EÜAŞ was the third company in the Istanbul Chamber of Industry’s (ISO) biggest industrial company list according to the sales from production.

2006 Annual Ownership Report
31
5.1.3. TEİAŞ Electricity Transmission Company Board of Directors ♦ İlhami Özşahin (Chairman and General Director) ♦ Halil Alış (Deputy General Director) ♦ Kemal Yıldır (Deputy General Director) ♦ Bilal Eryılmaz (Related Ministry Representative) ♦ Mehmet Kamil Şani (Related Ministry Representative) ♦ İrfan Tokgöz (Treasury Representative)
Capital Structure Treasury Share : 100% Subscribed Capital : 330 Million YTL Paid in Capital : 326 Million YTL
Related Ministry Ministry of Energy and Natural Resources
Web Address http://www.teias.gov.tr
Electricity Transmission Company (TEİAŞ) started its operations in 01.10.2001 in order to take over the transmission lines and to provide electricity transmission and balancing and settlement services. The Articles of Association of TEİAŞ was published in Offical Gazette No. 24447 on 26.06.2001.
The company is subject to Decree Laws No.233 and 399 which concerns SOEs. It has obtained the transmission license from EMRA in 2003 and it operates in accordance with regulations envisaged in new market model.
TEİAŞ is the sole owner of the transmission license in Turkey. Main responsibilities of the company are; planning, operating and rehabilitating the 400 and 154 kV transmission lines to provide high quality and continuous energy supply, preparing necessary tariffs, overseeing the central dispatch system and undertake the required balancing and international interconnection operations and preparing the electricity generation capacity projection report in line with the demand projections of distribution companies.
The company’s market share is 100%.
Major Developments and Issues
The balancing and settlement market which was in virtual mode between November 2004 and August 2006 became operational starting from 01.08.2006. Recently, the share of this market ranges 5% - 10% subject to the degree of discrepancy between demand and supply for each distribution company.
In July 2007, Turkey’s Electricity Energy Generation Capacity Projection for 10 Year (2007-2016) has been published. This report is revised annually based on the recent market data.

2006 Annual Ownership Report
32
In 2007, the increase in electricity demand is 8,5% compared to previous year. The annual consumption is 189.4 TWh and installed capacity is 40.7 GW.
Regarding interconnections with Europe, Turkey aims to become a member of Union for the Co-ordination of Transmission of Electricity (UCTE). The necessary work has been started in 2005 and is projected to be completed in 2008.
TEİAŞ faces significant receivables problem as other energy SOEs have. Owing to the arrears of EÜAŞ and its affiliates, TEİAŞ has to get external financing in order to undertake its investments. Transmission lines require expropriation which may extend the time for the completion of necessary investments.
Furthermore, the company lacks enough technical personnel compared to other countries. For example, number of personnel per kilometer is 0.026 in Turkey, whereas this figure is 0.081 in France and 0.043 in Spain. Therefore, the priority is given to the hiring of the technical personnel.
Financial Analysis
Main cost items of TEİAŞ include transmission investments and expenditures related with providing transmission services, such as operating expenses, replacement costs and ancillary service costs. The tariffs to finance these costs are; Connection and Use of System Tariff and Transmission Tariff. These tariffs are regulated by EMRA which envisages a ceiling on income of TEİAŞ.13 The tariffs are differential for consumers and producers. Furthermore, there is also tariff differential among different regions in Turkey.
80% of the sales revenue proceeds from public companies, whereas private sector’s share is only 20%.
The sales revenue of TEİAŞ is related with installed capacity of producers and consumption capacity of consumers rather than electricity transmitted through lines.
The revenue from Balancing and Settlement Market is reflected to financial tables of TEİAŞ. Accordingly, the gross sales revenue in 2005 was 787 Million YTL whereas it is 1.730 Million YTL in 2006. On the other hand, cost of the goods sold increased 821 Million YTL between 2005 and 2006.
The total value of assets is 7.32 Billion YTL.
In 2006, Average collection period was 304 days. This is mainly due to the receivables from EUAS and its affiliates. The total amount of receivables is 753 Million YTL.
13 Income ceiling is adjusted every year according to the energy price index, preset efficiency factor and realization of deficit or surplus of the previous years income.

2006 Annual Ownership Report
33
SELECTED INDICATORS 2005 2006 % Increase(Million YTL) Gross sales 787 1.730 119,7Operating profit or loss 83 150 81,5Profit or loss 112 89 -20,9Total Assets 6.491 7.318 12,8Acid – Test Ratio 3,45 1,74 -49,5Average Collection Period (Days) 274 304 10,9Cash Conversion Cycle (Days) 197 128 -34,9Return on Equity (ROE) (%) 1,9 1,1 -43,2Total Employment Figure (Average) 8.604 8.500 -1,2Total Employment Cost 262 278 6,1Value Added 764 847 10,9Investment Expenditure 230 276 20,1Payments to Budget (Dividend and Treasury Levies) 0 0 -Payments from Budget (Capital and Duty Loss) 0 0 -Primary Balance 242 218 -9,8Source: TEİAŞ, UT and SPO
In 2005, the profit margin was 14% whereas in 2006 this ratio decreased to 4%. On the other hand, return on capital was 1,1% in 2006, decreasing from 1,9% in 2005.
The company provided primary surplus both in 2005 and 2006.

2006 Annual Ownership Report
34
5.1.4. TETAŞ Turkish Electricity Trading and Contracting Incorporated Company Board of Directors ♦ Hacı Duran Gökkaya (Chairman and General Director ) ♦ Selahattin Çimen (Related Ministry Representative) ♦ Hüseyin Karakaya (Related Ministry Representative) ♦ Member (Empty-Related Ministry Representative ) ♦ Member (Empty-Related Ministry Representative) ♦ Nevzat BAHRAN (Treasury Representative)
Capital Structure Treasury Share :100% Subscribed Capital:179 Million YTL Paid-in Capital : 73 Million YTL
Related Ministry Ministry of Energy and Natural Resources
Web Address http://www.tetas.gov.tr
Turkish Electricity Trading and Contracting Incorporated Company (TETAŞ) was established to do electricity trading and contracting activities depending on Decree Laws No. 233 and 399, The Decree of Council of Ministers No. 2001/2026 and Electricity Market Law No. 4628. Its Articles of Association was published in Official Gazette No. 24447 on 29th of June in 2001.
TETAŞ is an SEE which is founded to trade electricity under the guidance of economic and energy policies of the State. Other functions of TETAŞ are: to take over the energy purchase and sale contracts from TEAŞ and TEDAŞ which were signed in according to related legislation, under the restriction of the Law No. 4628 to do energy sale contracts and energy purchase contracts (last for less than one year), to import / export electricty from / to countries which has suitable interconnection conditions, to prepare the wholesale tariffs and implement the approved tariffs, to take electricity from the hydro plants which EÜAŞ owns, to take the necessary measures to obtain consistent, low-cost electricity, to modify the energy sale and purchase agreements according to changing sectoral and legal conditions within the approval of the UT.
In 2006 TETAŞ’s market share was 100%.
Major Developments and Issues
According to the Law No: 5496, transitional period contracts concerning energy purchase and sale were signed between TETAŞ and distribution companies in June 2006.
Within the context of these contracts EÜAŞ’s hydro plants would sell 25 billion kwh electricity to TETAŞ in a year. TETAŞ would provide electricity both from EÜAŞ’s hydro plants and BOT, BO, Transfer of Rights (TOR) plants which would lead to a decrase in the average purchasing costs. TETAŞ would sell this electricty to 20 distribution companies with the price approved by EMRA.

2006 Annual Ownership Report
35
Since BOT, BO, TOR contracts which lasts 15-20 years were not signed under the competitive conditions and since these plants mostly depend on natural gas (85% of sales of BO, 100% of sales of BOT are Treasury guaranteed) TETAŞ’s purchasing cost increases.
Financial Analysis
SELECTED INDICATORS 2005 2006 % Increase(Million YTL) Gross sales 10.077 10.726 6,4Operating profit or loss 38 96 152,1Profit or loss 66 48 -26,6Total Assets 6.415 7.587 18,3Acid – Test Ratio 1,00 1,01 1,3Average Collection Period (Days) 221 250 13,4Cash Conversion Cycle (Days) 46 49 6,9Return on Equity (ROE) (%) 40,2 27,7 -31,1Total Employment Figure (Average) 213 215 0,9Total Employment Cost 5,4 5,1 -4,7Value Added 91 55 -39,6Investment Expenditure 0,0 0,3 31.516,2Payments to Budget (Dividend and Treasury Levies) 0 0 -Payments from Budget (Capital and Duty Loss) 10 14 38,5Primary Balance 63 32 -49,7Source: TETAŞ, UT and SPO
In 2005 TETAŞ’s total assets were 6,4 billion YTL. In 2006 it increased 18% and reached to 7,6 billion YTL. In 2006 commercial and other receivables item increased 21% and reached to 7,4 billion YTL. Problems arising from unability to collect the receivables increased the amount of short term liabilities.
In 2006 TETAŞ’s gross sales increased 6.4% and reached to 10,7 billion YTL (In 2006 total energy sales were 118 billion kwh). In 2006 profit of the period decreased 27% to 48 million YTL.
Current ratio and acid test ratio of TETAŞ was around 1. Average collection period of its receivables which was 221 days in 2005, increased to 250 days in 2006. Moreover its financial structure mostly depended on short and long term liabilities. Equity/Liability ratio was 0,02.
In 2006 TETAŞ’s primary surplus decreased 50% and realized 32 million YTL.

2006 Annual Ownership Report
36
5.1.5. TKİ Turkish Coal Enterprise Board of Directors ♦ Selahaddin Anaç (Chairman and General Director ) ♦ Yaşar Topçuoğlu (Deputy General Director) ♦ Ziya Coşar (Related Ministry Representative) ♦ Mehmet Tombul (Related Ministry Representative) ♦ Representative (NA - Related Ministry Representative) ♦ Nurşen Demirbilek (Treasury Representative)
Capital Structure Treasury Share : 100% Subscribed Capital : 360 Million YTL Paid-in Capital : 360 Million YTL
Related Ministry Ministry of Energy and Natural Resources
Web Address http://www.tki.gov.tr
The coal production units that were under the control of Etibank Company, had been transferred to Turkish Coal Enterprise (TKİ) in 1957 by the Law No. 6974. As an SEE, TKİ started its activities after its Articles of Association was published in Official Gazette No.18588 on November, 1984. TKİ is also subject to the Mining Law No. 3213
In accordance with the Government’s general energy policy, TKİ has been assigned to produce lignite and some other types of coal and to meet the country’s coal demand.
55% of the total lignite production capacity of Turkey comes from TKİ. The Company’s production depends on the requirements of the power generation companies and the demands of heating and industry. 22% of total Electricity Generation Company (EÜAŞ)’s electricity production in 2006 was performed by the input that TKİ has provided.
Major Developments and Issues
The Company distributes coal, not less than 500 kg, to poor families by Governorships, since 2003. In the period of 2005-2006 1,3 million tones of coal were distributed through out the country.
TKİ can not collect its receivables from EÜAŞ. The receivables from EÜAŞ were 135 million YTL in December, 2006.
Financial Analysis
The sales revenue of the company has increased by 17% to 1,4 billion YTL, and the profit of the period has increased by 38% to 40 million YTL in 2006. However, to meet its financial needs, TKİ get commercial bank loans and the interest expense of this loans came up to 13 million YTL at the end of 2006.
Acid test ratio which was over 1 in 2004 had a declining trend in 2005 and 2006.
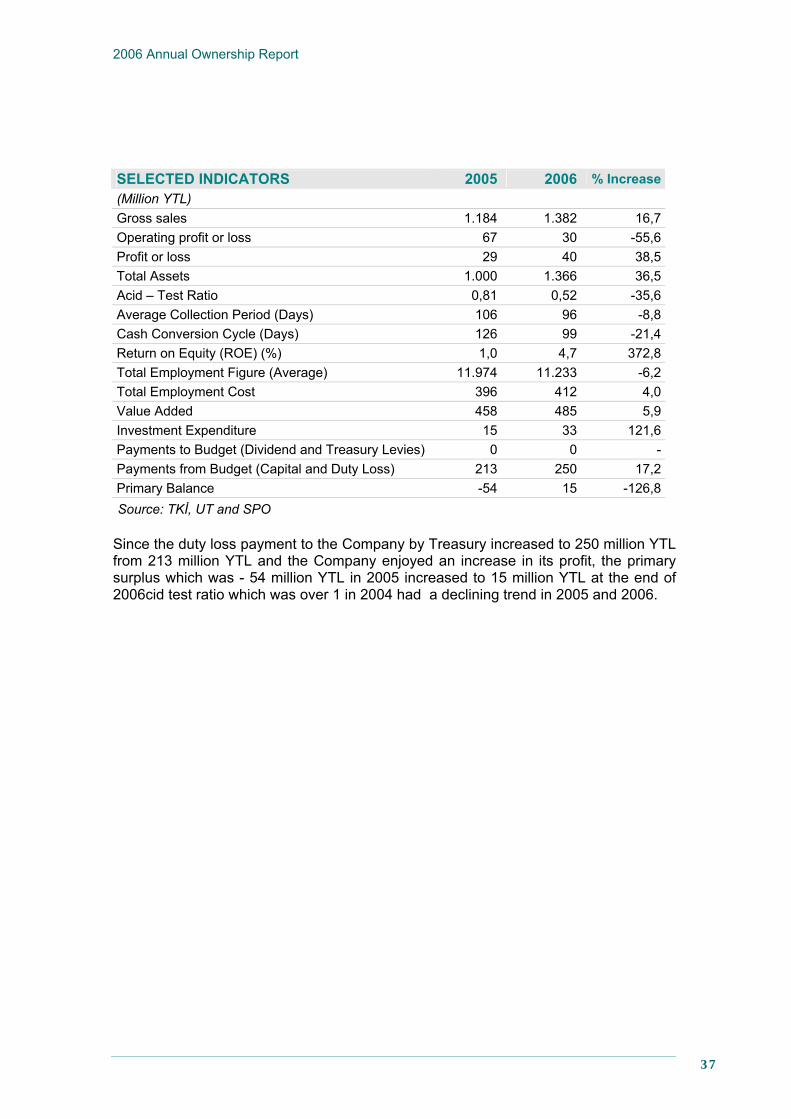
2006 Annual Ownership Report
37
SELECTED INDICATORS 2005 2006 % Increase(Million YTL) Gross sales 1.184 1.382 16,7Operating profit or loss 67 30 -55,6Profit or loss 29 40 38,5Total Assets 1.000 1.366 36,5Acid – Test Ratio 0,81 0,52 -35,6Average Collection Period (Days) 106 96 -8,8Cash Conversion Cycle (Days) 126 99 -21,4Return on Equity (ROE) (%) 1,0 4,7 372,8Total Employment Figure (Average) 11.974 11.233 -6,2Total Employment Cost 396 412 4,0Value Added 458 485 5,9Investment Expenditure 15 33 121,6Payments to Budget (Dividend and Treasury Levies) 0 0 -Payments from Budget (Capital and Duty Loss) 213 250 17,2Primary Balance -54 15 -126,8Source: TKİ, UT and SPO
Since the duty loss payment to the Company by Treasury increased to 250 million YTL from 213 million YTL and the Company enjoyed an increase in its profit, the primary surplus which was - 54 million YTL in 2005 increased to 15 million YTL at the end of 2006cid test ratio which was over 1 in 2004 had a declining trend in 2005 and 2006.

2006 Annual Ownership Report
38
5.1.6. TTK Turkish Hard Coal Enterprise Board of Directors ♦ Rıfat Dağdelen (Chairman and General Director) ♦ Çetin Onur (Deputy General Director) ♦ Mustafa Şimşek (Deputy General Director) ♦ Mahmut Yılmaz (Related Ministry Representative) ♦ Burhan İnan (Related Ministry Representative) ♦ Mehmet Açıkel (Treasury Representative)
Capital Structure Treasury Share : 100% Subscribed Capital : 3,0 Billion YTL Paid-in Capital : 2,9 Billion YTL
Related Ministry Ministry of Energy and Natural Resources
Web Address http://www.taskomuru.gov.tr
By the Law No.2818 dated on June 14, 1935, the foreign private property of hard coal sites were nationalized for public use and transferred to Etibank Company. After that, Ereğli Coal Company (EKİ) started to operate these sites. In 1957, EKİ joined TKİ; however by the Decree Law No.96 (October 10, 1983) it had been transformed to a new body called Turkish Hard Coal Company (TTK). The Articles of Association was published in the Official Gazette on December 11, 1983. The Company is still an SEE and subject to the Decree Law No.233.
TTK has the responsibility for the operating of Zonguldak Harbor in addition to mining activities.
TTK has nearly a 100% market share in hard coal production in the country; however it has around 2% market share in domestic coal market.
Major Developments and Issues
In 2006, the Company was granted a permission to hire 1.123 personnel.
The Company has initiated restructuring works to increase the efficiency and decrease the operational costs. In this context, some works have been outsourced to private companies by international tenders. Moreover, TTK has let private companies to build coal washing systems; so that washing costs have fallen around by one third.
In Zonguldak region, the hard coal reserve is over 1.331 billion tones, and its lifetime is 130 years. Because of the geologic structure of the region, coal production is highly labor intensive.
TTK has high labor costs. In order to fulfill domestic demand from domestic resources and supply safety in electricity generation, capital injections are made from the central

2006 Annual Ownership Report
39
budget to this loss making company to meet its obligations arising from wage, salary, premium and SSI payments. The ratio of workers working underground to the others is lower than the world standards.
Financial Analysis
Because of the structural problems, TTK makes loss continuously and is financially supported by the Government.
SELECTED INDICATORS 2005 2006 % Increase(Million YTL) Gross sales 194 244 25,6Operating profit or loss -326 -307 -5,9Profit or loss -358 -357 -0,2Total Assets 290 361 24,7Acid – Test Ratio 0,29 1,85 544,2Average Collection Period (Days) 104 104 0,3Cash Conversion Cycle (Days) 103 118 15,1Return on Equity (ROE) (%) -507,8 -184,9 -63,6Total Employment Figure (Average) 13.385 12.685 -5,2Total Employment Cost 411 391 -4,8Value Added 77 66 -14,3Investment Expenditure 26 24 -6,5Payments to Budget (Dividend and Treasury Levies) 0 0 -Payments from Budget (Capital and Duty Loss) 385 573 48,7Primary Balance 24 216 802,0Source: TTK, UT and SPO
The sales revenue of TTK increased by 26% in 2006 compared to the year 2005, and came up to 244 million YTL. The reason for the increase in sales was the coal purchased from private sector producing in the zone hired by TTK. The coal -purchased from leased areas- brings down the average coal cost of the Company; providing an advantage for TTK.
The profit of the period, which was 358 million YTL in 2005, ended up to 357 million YTL.
Despite the operational costs, the Company’s primary surplus is positive because of the capital injections and duty loss payments from the Treasury. In this context, 385 million YTL was transferred to the Company in 2005 and 573 million YTL in 2006.

2006 Annual Ownership Report
40
5.1.7. TPAO Turkish Petroleum Corporation. Board of Directors
♦ Mehmet Uysal (Chairman and General Director) ♦ Representative (NA – Deputy General Director) ♦ Representative (NA – Deputy General Director) ♦ Cumali Kınacı (Related Ministry Representative) ♦ Yusuf Yazar (Related Ministry Representative) ♦ İsmet Salihoğlu (Treasury Representative)
Capital Structure Treasury Share : 96,99% Subscribed Capital: 950 Million YTL Paid-in Capital : 950 Million YTL
Related Ministry Ministry of Energy and Natural Resources
Web Address http://www.tpao.gov.tr
Turkish Petroleum Corporation (TPAO) was founded in 1954 by Law No. 6327 as the only national oil company of Turkey with the responsibility of being involved in hydrocarbon exploration, drilling, production, refinery and marketing activities on behalf of the state.
Until 1983, as an integrated oil company, it was engaged in all the activity fields of oil industry from exploration to production, refinery, marketing and transportation. After the enactment of Decree Law No.233 in 1984, TPAO, as a national oil company, has been involved only in upstream (exploration, drilling and production) sector and the other activities (refining, trading, transportation) have been removed from the company’s field of activity.
In the Turkish petroleum and natural gas sector, a number of companies was established by TPAO as subsidiaries such as İPRAŞ, PETKİM, İPRAGAZ, TÜMAŞ, İGSAŞ, DİTAŞ, BOTAŞ, ADAŞ (POAŞ), Kıbrıs Türk Petrolleri Ltd., ISILİTAŞ, which were structured as independent companies privatized or liquidated afterwards.
TPAO carries on its activities according to Petroleum Law No.6326, Natural Gas Market Law No.4646 and Petroleum Market Law No.5015 in the fields of upstream (exploration, drilling, well completion and production), natural gas storage, participation in oil and natural gas transportation pipeline projects and, by its subsidiaries, oil and trade transportation.
The domestic market share of TPAO was 71% by the end of 2006.
Major Developments and Issues
The rapid increase in the prices of crude oil and natural gas prices leaded to huge increases in import costs of energy importing countries, including Turkey, and highlighted the long-term supply security issue. In this context, increasing the share of
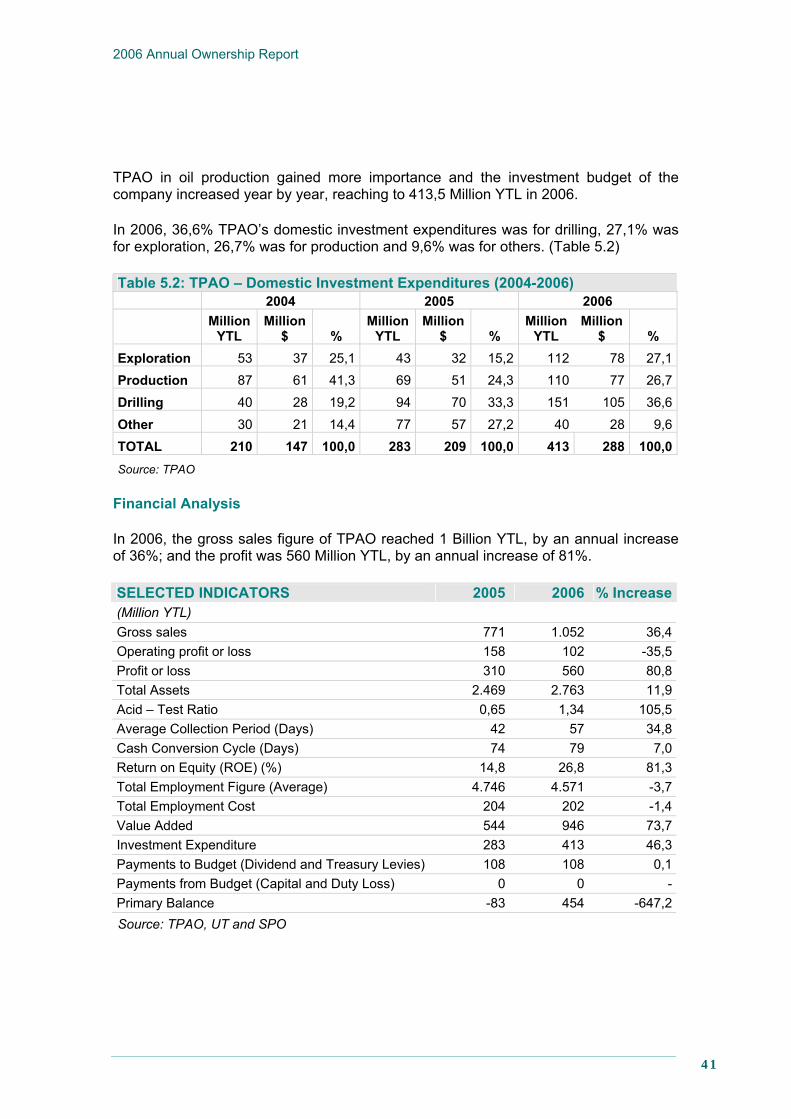
2006 Annual Ownership Report
41
TPAO in oil production gained more importance and the investment budget of the company increased year by year, reaching to 413,5 Million YTL in 2006.
In 2006, 36,6% TPAO’s domestic investment expenditures was for drilling, 27,1% was for exploration, 26,7% was for production and 9,6% was for others. (Table 5.2)
Table 5.2: TPAO – Domestic Investment Expenditures (2004-2006) 2004 2005 2006
Million
YTL Million
$ % Million
YTL Million
$ % Million
YTL Million
$ % Exploration 53 37 25,1 43 32 15,2 112 78 27,1Production 87 61 41,3 69 51 24,3 110 77 26,7
Drilling 40 28 19,2 94 70 33,3 151 105 36,6
Other 30 21 14,4 77 57 27,2 40 28 9,6TOTAL 210 147 100,0 283 209 100,0 413 288 100,0Source: TPAO
Financial Analysis
In 2006, the gross sales figure of TPAO reached 1 Billion YTL, by an annual increase of 36%; and the profit was 560 Million YTL, by an annual increase of 81%.
SELECTED INDICATORS 2005 2006 % Increase(Million YTL) Gross sales 771 1.052 36,4Operating profit or loss 158 102 -35,5Profit or loss 310 560 80,8Total Assets 2.469 2.763 11,9Acid – Test Ratio 0,65 1,34 105,5Average Collection Period (Days) 42 57 34,8Cash Conversion Cycle (Days) 74 79 7,0Return on Equity (ROE) (%) 14,8 26,8 81,3Total Employment Figure (Average) 4.746 4.571 -3,7Total Employment Cost 204 202 -1,4Value Added 544 946 73,7Investment Expenditure 283 413 46,3Payments to Budget (Dividend and Treasury Levies) 108 108 0,1Payments from Budget (Capital and Duty Loss) 0 0 -Primary Balance -83 454 -647,2Source: TPAO, UT and SPO

2006 Annual Ownership Report
42
Due to the increases in both the international crude oil prices and the crude oil production of TPAO, the company’s domestic and abroad revenues also increased and this caused the total current assets figure to reach 613,4 Million YTL in 2006, which was 256,4 Million YTL in the previous year.
Since TPAO collected its receivables from SOCAR, the Azerbaijani National Oil Company, amounting to $323 Million and paid its long-term bank loans of $285 Million, the company’s long term liabilities figure decreased from 482,3 Million YTL to 254,7 Million YTL in 2006. On the other hand, the shareholders equity / assets ratio increased from 70% to 82% in 2006 as the company did not get any bank loans or accumulate debts.
From 2005 to 2006, the current ratio increased from 1,1 to 2,4 and the acid test ratio increased from 0,65 to 1,34.
TPAO’s average collection period, which was 42 days in 2005, was 57 days in 2006 and the inventory turnover figure decreased from 0,84 to 0,72.
TPAO, paying dividend amounting to 26 Million YTL and treasury levy amounting to 82 Million YTL, made up 946 Million YTL of added value, which was 74% more than that of in 2005, and generated primary surplus, contrary to the previous year. Besides, the return on equity ratio of the company reached to 27% in 2006.

2006 Annual Ownership Report
43
5.1.8. ETİ MADEN Eti Mine Works Board of Directors
♦ Orhan Yılmaz (Chairman and General Director) ♦ Adnan Yılmaz (Deputy General Director) ♦ Muhsin Ganioğlu (Deputy General Director) ♦ Yücel Yalçınoğlu (Related Ministry Representative) ♦ Muhittin Gündüz (Related Ministry Representative) ♦ İbrahim Sepici (Treasury Representative)
Capital Structure Treasury Share : 100% Subscribed Capital: 100 Million YTL Paid-in Capital : 89 Million YTL
Related Ministry Ministry of Energy and Natural Resources
Web Address http://www.etimaden.gov.tr
Etibank Company was founded in 1935 by the Law No. 2805 to supply natural resources to economy; build power plants; produce, transmit, sell and distribute electricity; and execute banking operations within this structure.
Some of the company’s production facilities transferred to other companies: Divriği Iron Mines were transferred to TDÇİ (Turkish Iron and Steel Works) by the Law No. 6559 (Year 1955); Coal Sites were transferred to TKİ by the Law 6947 (Year 1957); the electricity production and transmission foundations were transferred to Turkish Electricity Company by the Law No.1312 (Year 1970)
The company was restructured in 1998 and consequently, its title was changed to Eti Holding Inc. Furthermore, the company was restructured under new title Eti Mine Works in 2004 and made responsible for mining, processing and marketing of Turkey’s boron resources as a main activity field.
The company’s main policy is to be the leading company of the world in the boron sector. The known boron reserves of the country accounts for 72% of the world’s boron reserves.
Since the Company is a monopoly, its market share is 100% in Turkey.
Major Developments and Issues
The company has been continuously carrying out new investments in order to increase the refined boron capacity for attaining the position aimed at. Also, necessary R&D works are being carried out to develop new boron technologies and production methods.

2006 Annual Ownership Report
44
The Law No.2840 envisages that the boron sites will be operated, managed, and marketed by publicly charged company, Eti Mine Works. However, since the existing capacity is not adequate to meet the increasing demand, the company outsourced some of its activities to private companies.
Financial Analysis
SELECTED INDICATORS 2005 2006 % Increase(Million YTL) Gross sales 435 568 30,5Operating profit or loss 96 190 98,2Profit or loss 54 193 258,0Total Assets 1.110 1.241 11,8Acid – Test Ratio 4,17 5,46 30,8Average Collection Period (Days) 61 56 -9,2Cash Conversion Cycle (Days) 178 165 -7,3Return on Equity (ROE) (%) 5,0 13,5 168,9Total Employment Figure (Average) 4.047 3.850 -4,9Total Employment Cost 113 111 -1,1Value Added 211 347 64,8Investment Expenditure 26 44 73,6Payments to Budget (Dividend and Treasury L i )
66 32 -51,2Payments from Budget (Capital and Duty Loss) 0 0 -Primary Balance 68 107 57,3Source: ETİ MADEN, UT and SPO
In 2006, the Company’s sales have increased to 568 million YTL by 30% and the profit of the period increased to 193 million YTL by 258%. The domestic sales was just 38 million YTL, only 7% of the total sales revenues.
Eti Mine Works became the biggest producer and seller of boron with 613.984 tones of B203 production which is the 36,5% of world production.

2006 Annual Ownership Report
45
5.2. TELECOMMUNICATION & TRANSPORTATION SECTORS

2006 Annual Ownership Report
46

2006 Annual Ownership Report
47
5.2.1. TCDD Turkish State Railways Board of Directors
♦ Süleyman Karaman (Chairman and General Director) ♦ Veysi Kurt (Deputy General Director) ♦ İsa Apaydın (Deputy General Director) ♦ Talat Aydın (Related Ministry Representative) ♦ Şükrü Kutlu (Related Ministry Representative) ♦ Ümit Ulvi Canik (Treasury Representative)
Capital Structure Treasury Share : 100% Subscribed Capital: 8,0 Billion YTL Paid in Capital : 6,1 Billion YTL
Related Ministry Ministry of Transport
Web Address http://www.tcdd.gov.tr
The foundation of the first railways line of 130 km between Izmir and Aydin was laid by a British company in 1856 under the privilege granted to this company. 8.619 km lines were constructed between 1856 and 1922 in the territory of Ottoman Empire. 3.578 km lines were constructed at the Post-Republic period between 1923 and 1950. In those years of shortage, the construction of railways continued on high-speed. During the Second World War, the constructions slowed down. 3.208 km part of 3.578 km of the tracks that were built between 1923 and 1950, were completed before 1940.
The period following 1950 was almost the golden age of highways. Under the transportation policies that had been applied until 1950, the highways were regarded as a system to support and integrate the railroads. During the planned development periods after 1960, the goals envisaged for railroads were never achieved. Only 30 km of railroads were constructed annually between 1950 and 1980. The passenger transport share of railroads has been decreased 38% within last 50 years since the existing infrastructure and operating conditions of railroads were not rehabilitated and new corridors were not opened.
As a result of these transportation policies, the transportation system of our country has been based on one system nearly. As far as the passenger transport shares of our country are concerned, the passenger transport share of highways are 96% and the share of railroads is only 2%. When highways - railroads freight transport shares of our country's transportation system are examined, the freight transport share of highways is 94% and the passenger transport share of railroads is 4%. The freight transport share of railroads has been decreased 60% within last 50 years.
Turkish State Railways (TCDD) is an SOE (PEI at the moment) that operates the public railway system in Turkey. The organization was founded in 1927 to take over the operation of railways that were left within the borders of the Turkish Republic after the dissolution of Ottoman Empire. The Administration functioning as a supplementary budgeted institution until 29.07.1953 and it was converted to a Public Economical

2006 Annual Ownership Report
48
Enterprise under the name "Republic of Turkey General Directorate of State Railways Administration (TCDD)". And with the Decree Law No. 233, it turned into a Public Economic Institution.
There are 7 Regional Directorates countrywide. Active in the field of railway industry, there are 3 subsidiaries: TULOMSAS (Locomotive and Motor Corporation of Turkey), TUVASAS (Wagon Industry Corporation of Turkey), TUDEMSAS (Railway Machines Industry Corporation of Turkey) Also, the 7 biggest ports of our country are owned and operated.
Major Developments and Issues
High-Speed Rail Projects
Istanbul - Ankara High-Speed Track
The Turkish State Railways started building high-speed rail lines in 2003. The first line, which has a length of 533 km from Istanbul (Turkey's largest metropolis) via Eskişehir to Ankara (the capital) is under construction and will reduce the travelling time from 6–7 hours to 3 hours 10 minutes.
The first high-speed railway will connect Ankara via Eskişehir to Istanbul. With this project, a trip from Istanbul to Ankara will take only about 3 hours at a maximum speed of 250 km/h.
Ankara - Konya
The construction of the Ankara-Konya line (300km) started in 2006. A travel time of 70 minutes is projected for this track, which will also be connected with the Ankara-Eskişehir line in.
Turkish Rail Sector Restructuring & Strengthening Project
Restructuring works for the better and more effective management of TCDD is in its last phase, in the context of restructuring which made by EU funds; infrastructure and operation will be separated infrastructure works will be made by public authorities, while operation will be performed by both public and private sector.
Twinning Project – Re organisation of the Railway Sector
The project’s aim is to establish the necessary legislative basis for the rail sector in Turkey, in compliance with EU legislation. The preparation of the draft laws of TCDD, General Railway Framework, and Implementing Regulations are completed.

2006 Annual Ownership Report
49
Draft TCDD Law:
Holding Company Independent decision-making with regard to infrastructure allocation and
charging functions Separation of accounting for:
o Infrastructure o Freight o Passenger o Public Service Obligations
Draft General Railway Framework Law :
Necessary Bodies and Institutions
o Regulatory Body o Safety Authority o Accident Investigating Body o Notified Body for Interoperability
Safety Policy, Safety Rules Safety Management Systems, Safety Reports Placing into Service of Rolling Stocks Licences, Safety Authorisation and Safety Certificates Provisions for IMs and RUs Access to Railway Infrastructure Interoperability
New TCDD Organization
Re-organizing and Transforming TCDD (Turkish State Railways) into a modern and commercial railway. Establishing Business Units and Sub-sectors.Separate entities for management of infrastructure and train operations
Setting-up of an Financial Management Information System for measuring financial performance of business units and sub-sectors at TCDD.
Financial Relations with Government, Analysis of Costs and Revenues, Public Service Obligations (PSOs ).
Account separation between Infrastructure, Freight, Passenger and PSO.
Financial Analysis
Gross sales reached to 1.4 billionYTL with an increase of 14% in 2006. Operating profit decreased by 8.1% and realized as -465 Billion YTL.

2006 Annual Ownership Report
50
Despite the operational costs, the Company’s primary surplus was positive because of the capital transfers and duty loss payments from the Treasury Budget. In this context, 1.5 billion YTL was transferred to the Company in 2006.
On the other hand, the capital transfers from Treasury do not cover Company’s investment spending. Thus, TCDD finances its investments by long term foreign bank credits. The proportion of external finances to equity has increased to 0,22 in 2006 from 0,20 in 2005.
Acid test ratio, 0,49 in 2005, increased to 0,64 in 2006. The return on equity, -6,8 and -13,7 in 2005 and 2006 respectively.
SELECTED INDICATORS 2005 2006 % Increase(Million YTL) Gross sales 1.229 1.406 14,4Operating profit or loss -506 -465 -8,1Profit or loss -212 -504 137,0Total Assets 5.222 6.432 23,2Acid – Test Ratio 0,49 0,64 30,7Average Collection Period (Days) 184 234 27,4Cash Conversion Cycle (Days) 202 207 2,3Return on Equity (ROE) (%) -6,8 -13,7 102,1Total Employment Figure (Average) 32.866 31.419 -4,4Total Employment Cost 888 948 6,8Value Added 1.063 730 -31,4Investment Expenditure 432 853 97,4Payments to Budget (Dividend and Treasury L i )
0 0 -Payments from Budget (Capital and Duty Loss) 660 1.507 128,4Primary Balance 209 181 -13,6Source: TCDD, UT and SPO
2006 Annual Ownership Report
51
5.2.2. DHMİ State Airports Authority Board of Directors
♦ Mahmut Tekin (Chairman and General Director) ♦ Orhan Birdal (Deputy General Director) ♦ Ahmet Arslan (Related Ministry Representative) ♦ Representative (NA – Related Ministry Representative) ♦ Sadettin Parmaksız (Treasury Representative)
Capital Structure Treasury Share : 100% Subscribed Capital: 1.700 Million YTL Paid in Capital : 376 Million YTL
Related Ministry Ministry of Transport
Web Address http://www.dhmi.gov.tr
The management of the airports in Turkey and provision of the air traffic service and its control in Turkish Airspace is performed by the State Airports Authority (DHMİ).
Developing the infrastructure of Turkish Civil Aviation Sector by its facilities and installations, the organization has continued providing services with different names and status since 1933. In 1984, it became an SOE (PEI at the moment) by the Decree Law No. 233 and within the framework of its Articles of Association.
The goals and the activities of the Company determined by its Articles of Association are as follows:
Air transportation required with the civil aviation activities,
Management of the airports,
Supervision of the ground handling services,
Execution of the air traffic control services,
Establishment and operation of the air navigation systems and facilities,
Establishment and operation of other installations and systems related with above activities,
Improvement in aeronautical activities.
There has been a significant increase in the aircraft movement and passenger traffic in recent years within the frame of air navigation and airport management services provided by DHMİ. Major developments are realized in the international aircraft and passenger traffic of our international airports especially at İstanbul/Atatürk and Antalya airports, making them among the important airports of Europe as a consequence of the increase in the international traffic.

2006 Annual Ownership Report
52
DHMİ has 100% market share in air navigation services but there are private firms which have the right of operating airports.
Major Developments and Issues
To make the inner line flights attractive and to bring activity to regional airports there has been a reduction in GDSAA (Government Airport Service) tariffs and also the special communication tax and the education contribution fee have been abolished since November 2003. With this practice, many new private air transporter companies have entered the market and therefore real competition in the sector emerged and developed.
With the beginning of the implementation of regional transportation, the inner line passenger transportation increased by 239%, the number of outer line passenger increased by 31%, inner line cargo transportation increased by 106%, outer line cargo transportation increased by 39%, inner line air traffic increased by 119%, and outer line air traffic increased by 31% by the end of 2006.
Atatürk Airport Inner and Outer Line Service Terminal Building's, Multi-Storey Car Park and General Aviation Terminal was rented for 15.5 years and for 3 Billion $ on 16 th of June 2005.
Antalya Airport was out sourced to private operator for a total amount of 2,37 Billion Euro on 12 April 2007. The tender for Outer Line Service Terminal of Milas Bodrum Airport was cancelled.
The airports of Tokat, Uşak, Sivas, Siirt, Çanakkale, Kahramanmaraş, and Adıyaman which were closed or were not active have been opened to the air traffic again.
Financial Analysis
As a profitable Company, DHMİ pays considerable amounts of Treasury levy and dividend. The Treasury levy ratio for DHMİ was increased to 14% of the gross sale as of January 2007 which was 10% of the gross sale before. DHMİ paid 200 Million YTL dividend and 73,3 Million YTL Treasury Levy in the financial year of 2006.
The gross sale figure that consists of air navigation, terminal and management revenue reached to the level of 1.023 Million YTL in 2006 from the level of 229 Million YTL in 2000, showing a steady growth between the aforementioned years.
There has been a regular growth in the profitability of DHMİ between the years of 2000 and 2006. The profit figure rose to the level of 578 Million YTL in 2006 from 69 Million YTL in 2000. Although it is a very profitable company, primary balance of DHMİ reduced by 25% to 121 Million YTL in 2006 due to the increase in dividend and Treasury levy payments for the budget.

2006 Annual Ownership Report
53
SELECTED INDICATORS 2005 2006 % Increase(Million YTL) Gross sales 885 1.023 15,6Operating profit or loss 444 524 18,1Profit or loss 473 578 22,4Total Assets 3.189 3.140 -1,5Acid – Test Ratio 3,05 3,14 3,1Average Collection Period (Days) 43 51 19,4Cash Conversion Cycle (Days) 28 26 -5,8Return on Equity (ROE) (%) 15,2 19,0 24,9Total Employment Figure (Average) 6.780 6.928 2,2Total Employment Cost 173 188 8,8Value Added 750 884 17,9Investment Expenditure 129 183 41,6Payments to Budget (Dividend and Treasury 281 273 -2,8Payments from Budget (Capital and Duty Loss) 0 0 0Primary Balance 163 121 -25,5Source: DHMİ, UT and SPO

2006 Annual Ownership Report
54
5.2.3. KIYEM Coastal Safety Board of Directors
♦ Salih Orakçı (Chairman and General Director) ♦ Faruk Yerser (Deputy General Director) ♦ Yaşar Duran Aytaş (Deputy General Director) ♦ Barış Tozar (Related Ministry Representative) ♦ Orhan Öge (Related Ministry Representative ) ♦ Münir Karaloğlu (Treasury Representative)
Capital Structure Treasury Share : 100% Subscribed Capital: 42 Million YTL Paid in Capital : 42 Million YTL
Related Ministry Ministry of Transport
Web Address http://www.coastalsafety.gov.tr
While it was a part of another public enterprise, Turkish Maritime Operations (TDİ), the Coastal Safety (KIYEM) was transferred to the Undersecretariat for Maritime Affairs with a Decree issued by Privatization Council. Later on, it became an SOE (PEI at the moment) with a Decree of Council of Ministers.
The General Directorate of Coastal Safety is responsible for assisting and improving the safety of Navigation in Turkish Waters.
The company’s core competences are: • Search and Rescue, • Salvage and Towage, • Turkish Straits Vessel Traffic Services (TSVTS), • Aids to Navigation (Lighthouses, Buoys, GPS, RDF,), • Marine Communication, • Marine oil spill response during salvage operations or in case of emergency.
Major Developments and Issues
Turkish Straits Vessel Traffic Services (TSVTS)
Turkish Straits Vessel Traffic Services Project’s first stage was completed in June 2003 and its second stage which is composed of the training of the staff testing the system was completed in December 2003. It is expected that in 2007 with the completion of third stage including the Marmara Sea, -Turkish Straits- will be equipped with 13 observation towers having X band radar, Monocolor - Color-Infrared Camera and

2006 Annual Ownership Report
55
Network Equipment. And also, a few towers will have extra, meteorological stations and communications equipments.
Turkish Government has invested 45 million USD since 1999 and spent 7 million USD as a running cost for the TSVTS.
With all of those above mentioned investment, the services are to be realized within the framework of Vessel’s Master Responsibility as follows:
• Monitoring electronic display chart all of vessels movement on area of interest,
• Navigational assistance to captains to routing the vessels,
• Information Services to give the knowledge regarding meteorological and hydrographical situations and etc. of Turkish Straits,
• Promulgation of navigational information and general warnings,
There is also an ongoing effort to merge the two separated public enterprise The General Directorate of Coastal Safety and Turkish Maritime Operations, under one enterprise.
Financial Analysis
The major components of gross sales for KIYEM are lighthouse service, salvage and towage service and search and rescue service. In 2006, lighthouse service made up 65%, salvage and towage service made up 13% and search and rescue services made up 20% of the total sales.
Table 5.3: Breakdown of Sales 2004 2005 2006(Million YTL) Lighthouse services 64 68 90Salvage and towage 15 15 19Search and rescue service 7 20 28Source: KIYEM
Although there had been a regular decrease in the profit figure of the company between the years 2001 and 2004 from 76 Million YTL to 11 Million YTL, it increased to 18 Million YTL in 2005 and 37 Million YTL in 2006.
Because the prices of the services provided by the company were set in foreign currency, the sales of the company are very sensitive to the changes in currency rates.
Liquid asset ratio in the current assets is fairly high as sales are made in advance. In this regard, the company had negative cash conversion cycles, 4,45 current ratio, and

2006 Annual Ownership Report
56
4,13 acid-test ratio in 2006. The return on equity which was 17% in 2005 increased to 32% in 2006.
KIYEM paid 10,2 Million YTL dividend and 13,7 Million YTL Treasury levy in 2006.
Having primary deficit in 2005, the company generated primary surplus in 2006 owing to the increase in the profit figure.
SELECTED INDICATORS 2005 2006 % Increase(Million YTL) Gross sales 105 139 31,8Operating profit or loss 9 34 288,5Profit or loss 18 37 102,5Total Assets 98 117 19,4Acid – Test Ratio 1,86 4,13 122,7Average Collection Period (Days) 6 7 21,5Cash Conversion Cycle (Days) -6 -13 119,6Return on Equity (ROE) (%) 17,4 31,7 82,1Total Employment Figure (Average) 1.434 1.450 1,1Total Employment Cost 59 65 10,6Value Added 89 107 20,5Investment Expenditure 5 16 184,2Payments to Budget (Dividend and Treasury Levies) 15 24 58,2Payments from Budget (Capital and Duty Loss) 0 0 0Primary Balance -2 13 -797,6Source: KIYEM, UT and SPO

2006 Annual Ownership Report
57
5.2.4. PTT Post and Telegraph Organization Board of Directors
♦ Osman Tural (Chairman and General Director) ♦ Cabir Bilirgen (Deputy General Director) ♦ Yusuf Toprak (Deputy General Director) ♦ Ender Ethem Atay (Related Ministry Representative) ♦ Representative (NA – Related Ministry Representative) ♦ Ahmet Fethi Toptaş (Treasury Representative)
Capital Structure Treasury Share : 100% Subscribed Capital: 800 Million YTL Paid in Capital : 731 Million YTL
Related Ministry Ministry of Transport
Web Address http://www.ptt.gov.tr
As a result of the developments that have been experienced with the administrative reforms of Ottoman Empire, the first Postal Organization was established as the Ministry on October 23, 1840, for the purpose of providing the postal needs of the community. Initially it was only providing postal services, later on it started to provide telegraph services in 1855 and money order services in 1910.
In the early years of Turkish Republic, the Postal Law No. 376, Telegraph and the Telephone Law No. 406 and other legal arrangements with regard to public communication were enacted.
General Directorate of Post and Telegraph Organization (PTT) became an SOE by the Law No. 6145 dated 17.10.1954, and it turned to a PEI by the Decree Law No. 233 in 1984.
By the Law No. 4000 dated 18.06.1994, the General Directorate of PTT was restructured and divided into two as the General Directorate of Posts and Turk Telecom Coop., and the General Directorate of Posts started to give services independently in 1995.
PTT, in line with its Article of Association, is responsible for carrying postal, telegraphs and packages and providing money order services.
Because of the privilege in the postal services, PTT is a monopoly firm in this sector, but its market share decreased to 96% with the emerging of newly founded courier firms in the sector.
Major Developments and Issues
While PTT was making losses in 1990s, it has started to make profit by diversifying its field of services since 2000.

2006 Annual Ownership Report
58
The commission revenue taken from collections of telephone, GSM, electricity, water and credit card bills constitutes considerable amount of the total revenue of PTT.
Financial Analysis
The gross sales of PTT reached to 932 Million YTL with an increase of 14% and cost of sales rose to 650 Million YTL with an increase of 15% in 2006. Consequently, there is no significant change in the profit margin of the company and gross profit margin remained as 30% compared to the 2005 level of 31%.
As commission revenue, which counted among the other ordinary revenue items before, was added in the sales figures, there was an increase in the operating profit figure by 73% in 2006.
SELECTED INDICATORS 2005 2006 % Increase(Million YTL) Gross sales 817 932 14,1Operating profit or loss 37 64 73,5Profit or loss 162 203 25,2Total Assets 1.212 1.439 18,8Acid – Test Ratio 2,27 2,45 7,6Average Collection Period (Days) 4 4 11,6Cash Conversion Cycle (Days) -82 -34 -58,4Return on Equity (ROE) (%) 12,0 12,8 6,6Total Employment Figure (Average) 29.849 30.139 1,0Total Employment Cost 642 676 5,3Value Added 817 896 9,6Investment Expenditure 13 17 27,3Payments to Budget (Dividend and Treasury L i )
0 0 -Payments from Budget (Capital and Duty Loss) 0 0 -Primary Balance 79 72 -8,8Source: PTT, UT and SPO
The most important cost component is the employment cost for PTT because it is a general service company. The employment cost for PTT in 2006 reached to 676 Million YTL and made up 87% of the total cost figure of the company.
91% of the current assets of the company are cash or cash equivalent. As a general service company, PTT has almost no inventory and sales are mostly made on cash basis. Consequently, there were no considerable amounts in the commercial receviables item for the company. In this regard, acid test ratios are 2,27 and 2,45 respectively in 2005 and 2006. It is also seen in the negative cash conversion cycle that the company operates on a liquid basis.

2006 Annual Ownership Report
59
5.3. AGRICULTURE SECTOR

2006 Annual Ownership Report
60

2006 Annual Ownership Report
61
5.3.1. EBK Meat and Fish Board Board of Directors
♦ Hasan Atagün (Chairman and General Director) ♦ Muhammet Kaya (Deputy General Director) ♦ Ahmet Uçar (Deputy General Director) ♦ Atilla Metin (Related Ministry Representative) ♦ Mehmet Halis Bilden (Related Ministry Representative) ♦ Kemal Madenoğlu (Treasury Representative)
Capital Structure Treasury Share : 100% Subscribed Capital: 400 Million YTL Paid-in Capital : 332 Million YTL
Related Ministry Ministry of Agriculture and Rural Affairs (MARA)
Web Address http://www.ebk.gov.tr
Meat and Fish Board (EBK), an SOE, was established in 1952.
The first slaughterhouse of the Board was opened in Erzurum in 1953. In 1955 the second slaughterhouse was opened in Ankara. In the following years, the number of slaughterhouses became 25. 2 poultry slaughterhouses, 2 meat processing units, 1 fisheries processing unit and 1 cold storage unit were also opened until the first years of 1990’s.
EBK was taken in the scope of the privatization by the Decree No. 3088 dated 20 May, 1992. In 1992 most of the premises of the Board was privatized, closed or transferred to various institutions. Beginning from the year 2005, the functions of the Board is carried on with 8 slaughterhouses.
In year 2005, EBK was transferred to Treasury Portfolio and associated to MARA in compliance with the Decision of the Privatization High Council No. 2005/104 dated 26 August, 2005
Following the re-establishment under MARA, major changes have been made in the Articles of Association. As its aim of establishment, EBK was considered as an instrument of guidance and support in the meat sector. Although the company is expected to make profit in the sector, it has been given the responsibility of public services such as supporting the meat sector.
The market share of EBK is about 2%.
Major Developments and Issues
By the decision of the Board of Directors, slaughterhouse in Ağrı province has been taken over by EBK in year 2006. In order to reopen the slaughterhouse in line with High Planning Council Decision, 5.6 Million YTL has been transferred from budget for

2006 Annual Ownership Report
62
renovation of the slaughterhouse. The slaughterhouses in Diyarbakır, Sakarya and Sincan were also modernized in 2006.
In order to improve the livestock in sector, a new project namely TARET has been started in 28 provinces of Eastern and South-Eastern Regions. The project is co-implemented with MARA, Ziraat Bank and Turkish Agriculture Credit Union. The aim of the project is to develop and support the livestock activity, the major economical activity in the region, in order to increase the income levels and standard of living of the population in the Region. Since the Project is expected to increase the sales volume of the Board, it is important to minimize the sales costs and operation costs.
The average personnel cost of the Board in 2006 is far above the sector average, thus an important disadvantage in terms of competitiveness.
Financial Analysis
The current ratio of 2,38 and acid test ratio of 1,46 in 2005 realized as 1,14 and 0,7 in 2006 respectively.
The stock return ratio, 2,23 increased to 3,58 in 2006 because of the decrease in stocks. Decrease in stocks is a result of decrease in purchase of raw materials in 2006 instead of an increase of sales
The Board’s financial obligations were mostly met with the capital injection of 32 Million YTL from Treasury. Therefore, proportion of long term debts to equity is observed around zero.
EBK generated a primary surplus in 2005. In 2006, EBK had a primary deficit due to the increase of investment and the low stock decrease compared to 2005. SELECTED INDICATORS 2005 2006 % Increase(Million YTL) Gross sales 87,2 83,3 -4,5Operating profit or loss -26,0 -34,4 32,7Profit or loss -38,7 -38,6 -0,4Total Assets 64,9 69,6 7,2Acid – Test Ratio 1,46 0,70 -51,9Average Collection Period (Days) 23 24 5,4Cash Conversion Cycle (Days) 36 25 -30,3Return on Equity (ROE) (%) -65,1 -73,7 13,2Total Employment Figure (Average) 1.062 1.060 -0,2Total Employment Cost 25,5 27,5 7,5Value Added -10,1 -8,6 -14,1Investment Expenditure 0,6 7,0 999,4Payments to Budget (Dividend and Treasury Levies) 0 0 -Payments from Budget (Capital and Duty Loss) 0 32 8,2Primary Balance 10,7 -8,6 -180,2Source: EBK, UT and SPO
2006 Annual Ownership Report
63
5.3.2. TİGEM Agriculture Enterprise Board of Directors
♦ İsmail Hakkı Sayın (Chairman and General Director) ♦ Dr.H.İbrahim Özbayat (Deputy General Director) ♦ Ali Yıldırım (Deputy General Director) ♦ Prof. Dr. Ekrem Erdem (Related Ministry Representative) ♦ Dr. Ferhat Şelli (Related Ministry Representative) ♦ Mehmet Murat (Treasury Representative)
Capital Structure Treasury Share : 100% Subscribed Capital : 300 Million YTL Paid-in Capital : 269 Million YTL
Related Ministry MARA
Web Address http://www.tigem.gov.tr
State production farms and public owned stud farms had been combined under the name of General Directorate of Agriculture Enterprises (TIGEM) in 1983. TIGEM had been established as an SOE in order to increase and diversify crop and livestock production, to improve the quality of crop, to breed stallion, to provide inputs such as seed and sapling to producers, and to pioneer in agricultural technology.
Even in the first years of its establishment, TIGEM had been a major institution in seed and sapling production in the country and has contributed to improvement of livestock sector.
In recent years, private sector companies have made large improvements in vegetable production and poultry. Nevertheless, TIGEM is still the most important actor in the sector, especially in production and distribution of cereal seeds and stallion.
TIGEM has been authorized to join in agricultural partnerships with private companies in line with the High Planning Council Decision No. 99T-46, dated 24 December 1999. With High Planning Council Decision No. 2003/T-13, dated 4 July 2003, 22 of the agricultural enterprises of TİGEM have been leased to agricultural private companies.
The market share of TİGEM in seeds is between 95 to 100%.
Major Developments and Issues
Partnership agreements have been implemented in line with High Planning Council Decisions. Within this context, 14 agricultural enterprises were transferred to private companies. After those operations, the number of enterprises has decreased by 37%, while the arable land decreased only 4%. No major decrease has been seen in agricultural production.

2006 Annual Ownership Report
64
Atatürk Agriculture Enterprise in Yalova was divested and transferred to Ministry of Education in line with a High Planning Council Decision in 2005. But following the lawsuit of Agriculture Union, the land of the enterprises was returned back to TIGEM.
Seed production on one million da. area were 307.000 tones in 2005 and 339.000 tones in 2006. Works on certificated seed have continued successfully during the year.
Since demand to certificated seeds is very low in Turkey, guidance of TIGEM in the sector is lower than expected
Another problem facing TIGEM is that agricultural lands can be sometimes allocated to various other public institutions.
Financial Analysis
The gross sale of TIGEM in 2006 was 233 Million YTL with an increase of 22% compared to 2005. Profit has also increased to 4,5 Million YTL.
SELECTED INDICATORS 2005 2006 % Increase(Million YTL) Gross sales 192 233 21,5Operating profit or loss -9 4 -138,0Profit or loss 2 4 189,6Total Assets 330 364 10,4Acid – Test Ratio 1,96 2,62 33,9Average Collection Period (Days) 35 43 22,9Cash Conversion Cycle (Days) 346 301 -13,0Return on Equity (ROE) (%) 0,5 1,4 159,3Total Employment Figure (Average) 4.920 4.535 -7,8Total Employment Cost 124 122 -1,7Value Added 138 144 5,0Investment Expenditure 17 9 -44,1Payments to Budget (Dividend and Treasury Levies) 0 0 -Payments from Budget (Capital and Duty Loss) 26 35 35,1Primary Balance -15 43 -387,3Source: TİGEM, UT and SPO
TIGEM has been operating at breakeven. Nevertheless, capital payments are transferred through Treasury annually in order to meet the financial obligations. Due to those transfers, share of capital in total liabilities has been increasing continuously. It has been 0,9 in the last 3 years, on average.
2006 Annual Ownership Report
65
Acid test ratio, 1,96 in 2005 has been in 2,62 in 2006. Stock return ratio, 0,28 in 2005, realized as 0,32 in 2006.
Personnel number in 2006 decreased by 8% and personnel cost has decreased by 2%.
TIGEM had a primary surplus in 2006, as a result of the decrease in stocks compared to 2005

2006 Annual Ownership Report
66
5.3.3. TMO
Turkish Grain Board Board of Directors
♦ İsmail Kemaloğlu ((Chairman and General Director) ♦ Burhanettin Köroğlu (Deputy General Director) ♦ Şükrü Yıldız (Deputy General Director) ♦ Osman Karamustafa (Related Ministry Representative) ♦ Representative (NA - Related Ministry Representative) ♦ Davut HANER (Treasury Representative)
Capital Structure Treasury Share : 100% Subscribed Capital : 961 Million YTL Paid-in Capital : 961 Million YTL
Related Ministry MARA
Web Address http://www.tmo.gov.tr
After World War I, the increase in wheat stocks caused foreign competition and falls in the prices. Government found necessary to buy wheat in some areas by a fixed price; and the Agriculture Bank was assigned with this work. Along with increase in the wheat production, these works carried out by the Chief of Wheat Branch in the Agriculture Bank. But the increasing wheat production required an independent institution, and by the Law dated 24.06.1938 No: 3491, the Turkish Grain Board (TMO) was established.
TMO has been an SEE in 1984.
Since 2002, the activities of TMO in the wheat market have radically changed. Before 2002, TMO used to purchase wheat based on the prices determined by Decrees of Council of Ministers, after 2002 TMO started purchasing wheat based on the prices determined by the Board of Directors for the purpose of regulating the market.
In 2006, with another major change in its Articles of Association, TMO became responsible for regulating all agricultural products when authorized by a Decree of Council of Ministers. Within this framework, TMO has been given the responsibility of purchasing wheat based on the Decree of Council of Ministers dated 28 August 2006, No. 2006/10865
Until 2006, Decrees of Council of Ministers on wheat purchases used to be published annually. After the above mentioned Decree, TMO was authorized to purchase wheat every year without an additional legislation.
Since TMO is a regulatory body, its share in wheat markets varies annually. In 2006, total purchase of TMO is 11% of total wheat production.

2006 Annual Ownership Report
67
Major Developments and Issues
TMO started wheat purchases in 29 May, 2006. The price of Anatolian Hard Red Wheat was declared as 37,5 YKR/Kg with a 7,1% increase compared to previous year.
In 2006/07 campaign TMO purchased 1.46 Million tones of wheat, 725 thousand tones of barley and 95 thousand tones rye, oats, corn and paddy rice which totals to 2.3 million tones
In 2006, wheat harvest was approximately 20 million tones and harvest in barley has been 9,5 million tones. Thus, the share of TMO in purchases was 7,3% on wheat, and 7,7% on barley. It should also be noted that, farmers keep some of the wheat harvest for their own use and sold approximately 65% of the total production.
TMO purchased 162.000 tones of hazelnut with a cost of 585 million YTL.
Table 5.4: TMO Purchases (Selected Crops)
2004 2005 2006
Volume (1000 Tonnes) 1.880 4.320 1.457Total Cost (Million YTL) 659 1.432 509Wheat Unit Cost (YTL/Tone) 350 332 350Volume (1000 Tonnes) 218 799 725Total Cost (Million YTL) 51 200 187Barley Unit Cost (YTL/Tone) 234 250 258Volume (1000 Tonnes) 471 651 14Total Cost (Million YTL) 150 157 3Maize Unit Cost (YTL/Tone) 319 242 226Volume (1000 Tonnes) 162Total Cost (Million YTL) 585Hazelnut Unit Cost (YTL/Tone) 3.611
Source:TMO
In 2006 domestic sales of TMO was 1,5 million tones. Sales to domestic flour exporters have been 2,4 million tones and international export sales were 1,2 million tones. Within this framework, share of export sales was 71% of total sales.
There is no duty loss on domestic sales since those sales are profit-based. Duty losses occur from export sales in order to decrease excess stocks.
The average wheat cost in 2006 was 440 YTL/tone. Having said that, wheat export with a price of 200 YTL/tone causes a loss of 240 YTL per tone.
Purchasing more than programmed quantity increases financial needs of TMO, thus wheat purchases are sometimes financed with foreign loans. When purchases are over

2006 Annual Ownership Report
68
the program, excess stocks can only be decreased by exporting them which leads to duty loss.
Duties given to TMO other than wheat purchases, such as hazelnut, have also increased the financing requirement and duty loss.
Table 5.5: Sales (Selected Crops) 2004 2005 2006Volume (1000 Tonnes) 1.037 3.438 3.710Total Cost (Million YTL) 260 690 856Wheat Unit Cost (YTL/Tone) 250 201 231Volume (1000 Tonnes) 282 292 632Total Cost (Million YTL) 85 53 150Barley Unit Cost (YTL/Tone) 302 182 237Volume (1000 Tonnes) 362 398 699Total Cost (Million YTL) 152 100 178Maize Unit Cost (YTL/Tone) 419 251 255
Source: TMO
Financial Analysis
SELECTED INDICATORS 2005 2006 % Increase(Million YTL) Gross sales 1.842 2.164 17,5Operating profit or loss 148 118 -20,3Profit or loss 5 17 274,7Total Assets 3.966 4.466 12,6Acid – Test Ratio 0,49 0,50 1,7Average Collection Period (Days) 41 25 -38,0Cash Conversion Cycle (Days) 345 302 -12,5Return on Equity (ROE) (%) 0,01 0,6 7.424,0Total Employment Figure (Average) 3.727 3.675 -1,4Total Employment Cost 89 93 4,1Value Added 139 165 19,1Investment Expenditure 5 7 44,9Payments to Budget (Dividend and Treasury Levies) 0 0 -Payments from Budget (Capital and Duty Loss) 50 166 232Primary Balance -1.180 -272 -76,9Source: TMO, UT and SPO
Due to the increase in duty losses and stocks, current ratio, 3 in 2005, increased to 4,95 in 2006. Acid test ratio was 0,49 and 0,50 in 2005 and 2006 respectively.
The volume of sales in years 2005 and 2006 was above the previous years’ average, therefore, stock return ratio, 0,17 in 2004, has been 0,28 in 2005 and 0,33 in 2006. It should be noted that, most of the sales are export sales, which are below the cost of production.
2006 Annual Ownership Report
69
Wheat purchases in 2005 were more than expected, therefore primary deficit of TMO had been worse than expected. In 2006, the stock decreased compared to previous year and primary deficit has been below 2005 figure.

2006 Annual Ownership Report
70
5.3.4. ÇAYKUR Tea Enterprise Board of Directors
♦ Ekrem Yüce (Chairman and General Director) ♦ Osman Keser (Deputy General Director) ♦ Yunus Kaldırım (Deputy General Director) ♦ Erdal Celal Sumaytaoğlu(Related Ministry Representative) ♦ Representative (NA- Related Ministry Representative) ♦ Hikmet ESEN (Treasury Representative)
Capital Structure
Treasury Share :100% Subscribed Capital:469 Million YTL Paid-in Capital :465 Million YTL
Related Ministry MARA
Web Address http://www.caykur.gov.tr
Tea Enterprise (ÇAYKUR) was established as an SEE with the Tea Law, No.1497, dated 6 December 1971. Duties given to state monopoly (TEKEL) on tea leaf purchase, process and tea marketing had been transferred to CAYKUR. After the Decree No.112, dated 10 October 1983, CAYKUR has been a PEI.
With the new Tea Law dated 04 December 1984, state monopoly on tea was removed and ÇAYKUR had been transformed to the status of SEE with the Privatization Law No.4046.
The fundamental purpose of the state to establish such an enterprise is to improve the tea agriculture and the quality of tea leaf. ÇAYKUR, operating with 46 factories and 15.000 personnel, has a market share of 60%.
Approximately 2/3 of tea leaf purchases by CAYKUR is in Rize, and the remaining is in Trabzon, Artvin, Giresun and Ordu provinces.
In addition to tea production activities, CAYKUR is also responsible for tea pruning. The losses of tea producers due to pruning are financed through ÇAYKUR by MARA.
Major Developments and Issues
CAYKUR started tea leaf purchases on 11 May, 2006. Tea leaf purchase price was declared as 57 YKR/Kg with a 10,7% increase compared to previous year. Total tea leaf purchases were 620.000 tones.

2006 Annual Ownership Report
71
Graph 2: Tea Purchases
0
200
400
600
800
2001 2002 2003 2004 2005 2006
1000
Ton
e
0
10
20
30
40
50
60
YK
r/Kg
Purchase Volume Purchase Price (Right Axis)
In year 2006, approximately 112.000 tones of tea were processed and produced. Domestic sales were 114.000 tones with an increase of 3,3% compared to previous year. 3.000 tones of tea were exported.
Table 5.6: Sales and Production
Sales 2004 2005 2006Sales Volume (1000 Tonnes) 112 112 116Sales Revenue (Million YTL) 596 665 750Sales Price, Av. (YTL/Ton) 5.331 5.929 6.449 Production 2004 2005 2006Volume (1000 Tonnes) 107 112 112Production Cost (Million YTL) 480 548 615Cost Per Unit (YTL/Tone) 4.475 4.916 5.500Source: ÇAYKUR
Since tea leaf purchases intensify within a few months and sales revenue is homogenous during the year, CAYKUR can have financial problems time to time.
The tea premium payments, started in 2004, to the producers from the central government budget (MARA) decreased the production costs of CAYKUR as well as other firms in the sector.
The personnel cost of CAYKUR, the only state enterprise in tea sector, is higher than that of other companies.
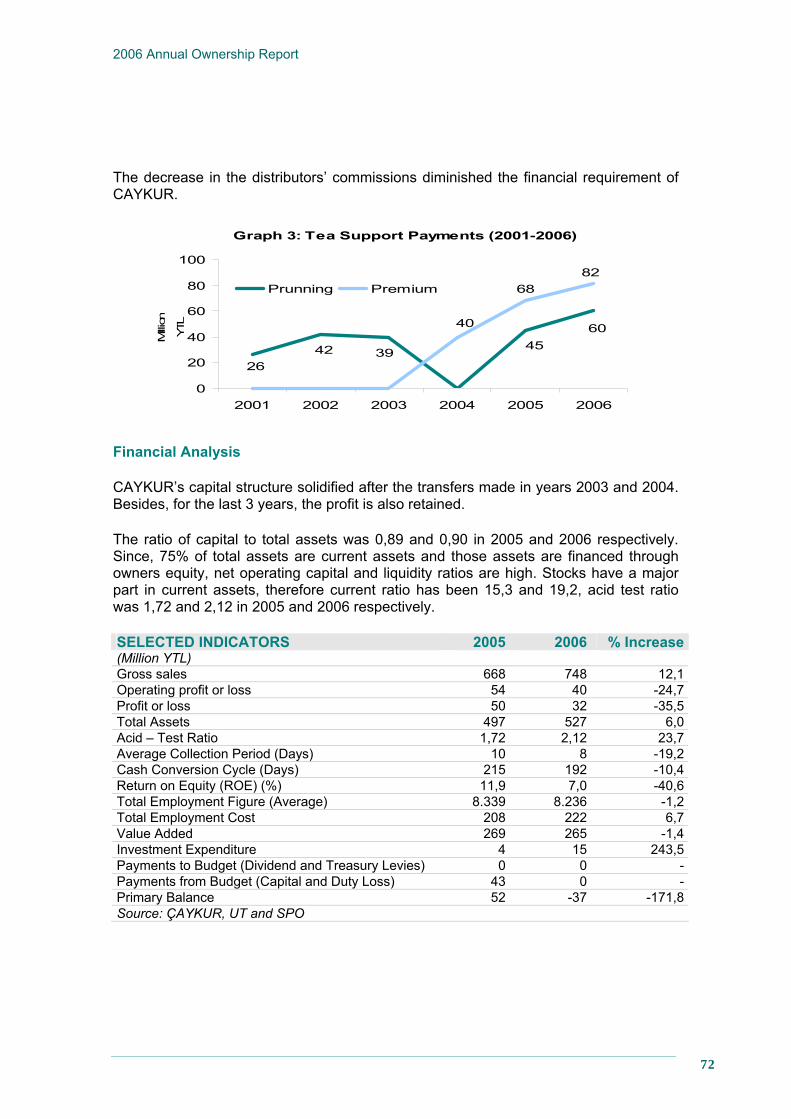
2006 Annual Ownership Report
72
The decrease in the distributors’ commissions diminished the financial requirement of CAYKUR.
Graph 3: Tea Support Payments (2001-2006)
4226
39 4560
68
40
82
0
20
40
60
80
100
2001 2002 2003 2004 2005 2006
Million
YTL
Prunning Premium
Financial Analysis
CAYKUR’s capital structure solidified after the transfers made in years 2003 and 2004. Besides, for the last 3 years, the profit is also retained.
The ratio of capital to total assets was 0,89 and 0,90 in 2005 and 2006 respectively. Since, 75% of total assets are current assets and those assets are financed through owners equity, net operating capital and liquidity ratios are high. Stocks have a major part in current assets, therefore current ratio has been 15,3 and 19,2, acid test ratio was 1,72 and 2,12 in 2005 and 2006 respectively.
SELECTED INDICATORS 2005 2006 % Increase(Million YTL) Gross sales 668 748 12,1Operating profit or loss 54 40 -24,7Profit or loss 50 32 -35,5Total Assets 497 527 6,0Acid – Test Ratio 1,72 2,12 23,7Average Collection Period (Days) 10 8 -19,2Cash Conversion Cycle (Days) 215 192 -10,4Return on Equity (ROE) (%) 11,9 7,0 -40,6Total Employment Figure (Average) 8.339 8.236 -1,2Total Employment Cost 208 222 6,7Value Added 269 265 -1,4Investment Expenditure 4 15 243,5Payments to Budget (Dividend and Treasury Levies) 0 0 -Payments from Budget (Capital and Duty Loss) 43 0 -Primary Balance 52 -37 -171,8Source: ÇAYKUR, UT and SPO

2006 Annual Ownership Report
73
Cash discounts to vendors were the key factor for the increase in receivables turnover ratio. Receivables turnover period decreased to 10 days in 2005 and 8 days in 2006. Stock return ratio was 0,47 in 2005 and 0,49 in 2006.
Due to the increase in investments from 4 million YTL in 2005 to 14 Million YTL in 2006, CAYKUR had a primary surplus in 2005 and a primary deficit in 2006.

2006 Annual Ownership Report
74
5.3.5. TŞFAŞ Turkish Sugar Factories Corporation Board Of Directors ♦ Mehmet Azmi Aksu (Chairman of Board and Director General) ♦ Hasan ALKAN (Deputy Director General) ♦ Dr. Selim Yücel (Deputy Director General) ♦ Yılmaz Çeber (Ministry Represantative) ♦ Abdullah Şener (Ministry Represantative) ♦ Hayri Baraçli (Treasury Represantative)
Capital Structure Treasury Share :99,9% Subscribed Capital:1,600 Billion YTL Paid-in Capital :1,534 Billion YTL
Related Ministry Ministry of Industry and Commerce
Web Address http://www.turkseker.gov.tr
Turkish Sugar Factories Corporation (TSFAS), was established in July 6, 1935 by Decree of Council of Ministers No 2850, as a single sugar factory, in order to produce sugar from sugar beet. In the following years many sugar factories were established under TSFAS. TSFAS has been a state economic enterprise since 1984.
TSFAS has been taken in the scope of the privatization in 2000. Its 2 joint ventures, Kutahya and Adapazari Sugar Factories were privatized in 2004 and 2005 respectively. Ilgın, Bor and Eregli Factories were taken under privatization programme by the end of 2005.
In Turkey, 22 of 32 factories producing sugar from sugar beet is the property of TSFAS. The aim and operations of TSFAS have been to produce sugar and to sell by-products of sugar according to the development plans and annual programs. TSFAS is also responsible to make policy on sugar sales, marketing, export and imports.
Since 2002, the activities of TSFAS have radically changed after Sugar Law No. 4634 which entered into force on 19 April 2001. Before 2002, TSFAS used to purchase sugar beet based on the prices determined by Decrees of Council of Ministers; after 2002 TSFAS has started purchasing sugar beet based on the prices determined by the contracts with sugar beet producers.
After the introduction of Sugar Law No. 4634, support purchase in sugar beet was abolished, sugar production started to be made according to the domestic demand, and excess sugar beet production was purchased in line with world prices so that duty loss arising from sugar exports minimized.
Following the Decree of Council of Ministers No: 2005/8705, dated 2005, all legislation related to duty loss arising from sugar sales/exports have been abolished.

2006 Annual Ownership Report
75
By the Decision of Turkish Sugar Authority dated 12 December 2006, No. 135/1, sugar sales to inward sugar processor-exporters has been taken out of inward processing regime.
Market share of TSFAS in 2006 is 36%
Major Developments and Issues
According to the contract between TSFAS and sugar beet producers, the price of sugar beet decreased by 10% compared to previous year and set as 8,9 YKR/Kg.
In sugar beet purchasing campaign of 2006/2007, TŞFAŞ purchased 6,7 million tones of sugar beet within a quote of 7.3 million tones. 6,4 million of sugar beet was processed and sugar production realized as 857.000 tones.
Table 5.7: TŞFAŞ Sales, Production and Purchases 2004 2005 2006
Sales
Domestic Volume 1000 Tonnes) 1.091 991 1.102
Domestic Sales (Million YTL) 1.627 1.553 1.627
Domestic Price (YTL/Tone) 1.491 1.566 1.476
Production
Volume (1000 Tones) 1.321 1.309 857
Production Cost (Million YTL) 1.593 1.620 1.165
Cost Per Unit (YTL/Tone) 1.206 1.238 1.359 Sugar beet Purchase
Volume (1000 Tones) 9.528 9.603 6.688
Total Cost (Million YTL) 1.023 989 602
Cost Per Unit (YTL/Tone) 107 103 90
Breakdown of Production Costs
Raw Material % 68,8 69,1 61,8
Personnel % 19,5 23,4 28,8
General Production Costs % 11,7 7,5 9,4Source: TŞFAŞ

2006 Annual Ownership Report
76
Domestic sales in 2006 were 1,2 million tones, of which 131 thousand tones were sales to inward processor- exporters. TSFAS also exported 95.000 tones of sugar.
The unit cost of sugar per tone was 1.359 YTL and sales price of sugar was 1.469 YTL in 2006. Having said that, exports with 327 YTL per tone leads to a loss of 1.142 YTL per tone.
Due to increasing competition resulting from private factories, sales volume of TSFAS has been decreasing. In order to prevent the decrease of sales, TSFAS has started sales prices and future sales.
Privatization process of Bor, Ereğli and Ilgın Sugar Factories was abolished in 2006.
In addition to high sugar beet cost, personnel cost of TSFAS is higher than those of private factories, thus overall production cost of TSFAS is higher. Besides, since temporary workers are planned to be employed as permanent workers within Law No 5620, production costs of TSFAS are expected to rise further.
TSFAS has had the problem of excess stocks due to over production. In order to decrease excess stocks, periodic export sales or inward processing regime sales have been made.
Sugar Law aims to produce sugar in line with domestic demand but the stock problem arising from previous campaigns still continue.
The sugar production capacity in Turkey meets the requirement of annual domestic demand of 2 million tones, but after the establishment of private sugar factories in recent years production capacity reached to 3,2 million tones. Thus excess capacity problem in sugar sector has been worsened.
It is also important that the privatization strategy of TSFAS be clarified.
Financial Analysis
Current ratio, 3,90 in 2005, increased to 6,99 in 2006; acid test ratio, 0,75 in 2005, increased to 2,33 in 2006. The proportion of external finances in total liabilities decreased and financial leverage has decreased to 0,11 in 2006, from 0,2 in 2005
Due to the decrease in production and increase in sales, stock return ratio increased 0,24 points and reached to 1,08.
Gross sales, increased by 9% in 2006 and reached to 2 billion YTL. Operation profit, decreased by 76% and realized as 42 Billion YTL. The ratio of gross sales profit to total sales, 0,16 and 0,17 in 2004 and 2005 respectively, has been 0,08 in 2006.

2006 Annual Ownership Report
77
Due to the deduction of 3 profitable sugar factories from balance sheet, extra ordinary cost and losses resulted in a period loss of 61 million YTL.
Although TSFAS generated a primary deficit of 125 million YTL in 2005, it has a primary surplus of 528 million YTL in 2006 mainly due to the decrease in stock level through the transfer of 3 companies out to the privatization portfolio and sales increase.
SELECTED INDICATORS 2005 2006 % Increase(Million YTL) Gross sales 1.795 1.957 9,0Operating profit or loss 172 42 -75,7Profit or loss 59 -61 -202,5Total Assets 3.256 2.892 -11,2Acid – Test Ratio 0,75 2,33 212,7Average Collection Period (Days) 89 106 19,0Cash Conversion Cycle (Days) 366 354 -3,3Return on Equity (ROE) (%) 1,8 -2,3 -233,2Total Employment Figure (Average) 16.445 13.781 -16,2Total Employment Cost 501 471 -5,9Value Added 612 450 -26,5Investment Expenditure 24 27 13,3Payments to Budget (Dividend and Treasury Levies) 0 0 -Payments from Budget (Capital and Duty Loss) 0 20 -Primary Balance -125 528 -523,4Source: TŞFAŞ, UT and SPO

2006 Annual Ownership Report
78
5.4. OTHER SECTORS

2006 Annual Ownership Report
79
2006 Annual Ownership Report
80
5.4.1. DMO State Supply Office Board of Directors
♦ Faik Ceceli (Chairman and General Director) ♦ Yüksel Göçer (Deputy General Director) ♦ Ahmet Deniz Tuncel (Deputy General Director) ♦ Erdoğan Süleymaniye (Related Ministry Representative) ♦ Mehmet Kilci (Related Ministry Representative) ♦ Jale U. Aygül (Treasury Representative)
Capital Structure Treasury Share : 100% Subscribed Capital : 26 Million YTL Paid in Capital : 26 Million YTL
Related Ministry Ministry of Finance
Web Address http://www.dmo.gov.tr
Besides the purchase of every type of material in its activity field by means of the most appropriate procurement conditions, State Supply Office (DMO) has been realizing the contract appropriateness inspection for its approximately 60.000 customers which are mostly state institutions and organizations.
In order to modenize its activities, DMO has recently started “Electronic Sale” over Internet at its web site and has been the leader of “Electronic Trading” in the state area.
DMO’s activities has recently increased since the supply and service purchase of state institutions and organizations from DMO had been held out of the scope of Public Procurement Law No. 4734.
Major Developments and Issues
DMO, one of the profitable SOE, continued to pay dividend and treasury levy in the financial year of 2006. In this regard, DMO paid 20 Million YTL dividend and 22 million Treasury levy in 2006.
Table 5.8: Breakdown of Sales of DMO (Million YTL) Selected Sale Items 2004 2005 2006Transport Vehicle 143 239 392Fixed Assets and other equipment 137 220 190Office Machinery and tools 76 132 102Stationery Goods 23 27 25Paper Products 57 56 46Source:DMO
As the enterprise is not subject to Public Procurement Law No. 4734 for its sales to government institutions, transportation vehicle sales consisted of the biggest part of the total revenue of DMO in 2006 as it was the case in 2005. The revenue mentioned

2006 Annual Ownership Report
81
above increased by 64%, while the revenue from the sales of office machinery and tools and paper products decreased by 22% and 17% respectively, compared to the previous year.
Financial Analysis
In line with the increase in the sales figures, operating profit of the company increased by 13 % compared to previous year and reached to the level of 41 Million YTL in 2006. In the same year the profit figure of the company is 79 Million YTL. There have been no major changes in the profit margin of the company since the gross sale of the company changes in line with the changes in the cost of sales. Consequently, the ratios of profit to sales in the last three years are 6%, 5%, and 7% respectively. SOME SELECTED INDICATORS 2005 2006 % Increase(Million YTL)
Gross sales 836 917 9,6Operating profit or loss 36 41 13,1Profit or loss 62 79 28,0Total Assets 529 441 -16,8Acid – Test Ratio 1,12 1,13 1,1Average Collection Period (Days) 10 2 -83,9Cash Conversion Cycle (Days) -68 -46 -32,3Return on Equity (ROE) (%) 33,9 38,8 14,3Total Employment Figure (Average) 1.100 1.023 -7,0Total Employment Cost 25 25 3,8Value Added 90 108 20,7Investment Expenditure 3 1 -67,6Payments to Budget (Dividend and Treasury Levies) 33 42 34,4Payments from Budget (Capital and Duty Loss) 0 0 -Primary Balance -18 -17 -3,4Source: DMO, UT and SPO
The assets of the company are mainly comprised of liquid ones such as cash equivalents and securities since sales are mostly made in cash basis. Current ratios were 1,32 and 1,73 acid test ratios were 1,12 and 1,13 in 2005 and 2006 respectively. Owing to growth in sales, the interest income of the company reached to 30 Million YTL increasing by 11 Million YTL compared to previous year and that is the principal reason for the difference between the growth ratios of operating profit and profit.
Since the biggest part of SSO revenues came from cash deals, a great decrease on trade receivables was seen in 2006 and this caused a decrease on the average cash collection period to ten days to two days from 2005 to 2006.
The company generated primary deficit in 2005 and 2006 as a result of the increase in dividend payments to Treasury and increase in inventory.

2006 Annual Ownership Report
82
5.4.2. MKEK Mechanical and Chemical Industry Institution Board of Directors
♦ Ünal Özsipahioğlu (Chairman and General Director) ♦ M. Sait Demirci (Deputy General Director) ♦ Representative (NA, Deputy General Director) ♦ Zafer Çamlıca (Related Ministry Representative) ♦ Nevzat Kılınç (Related Ministry Representative) ♦ Berrin Bingöl (Treasury Representative)
Capital Structure Treasury Share : 100% Subscribed Capital : 300 Million YTL Paid in Capital : 231 Million YTL
Related Ministry Ministry of National Defence
Web Address http://www.mkek.gov.tr
The General Directorate of Military Factories was established subsequent to the period of 1919-1923. It was developed and reorganized in 1950 under the name of The Mechanical and Chemical Industry Institution (MKEK), which has the legal entity, and the capital paid by the government completely, under the Law No.5591, for the purpose of producing most of equipment and tool requirement of the Turkish Armed Forces, and for fullfilling also the essential needs of the civil industry.
MKEK has reached to a size such as 10 large factories and 6.000 qualified personnel.
Major Developments and Issues
Such manufacturing services have been rendering for satisfying the important requirements of Turkish Armed Forces, such as the ammunition of light and heavy weapons, heavy weapon systems, artillery, bombs, mines, explosives, and rockets as well as the other civil purpose products such as steel, brass, electricity meters, by means of considering the actual technical and economical conditions and with a quality and price suitable to the world and NATO standards. MKEK, having a large range of products, not only serves the Turkish Armed Forces but also takes share in the International Defence Industry Market by exporting to more than 40 countries.
MKEK has been nourishing new policies to follow up the new technologies, to learn and to spread over the same to the production process, especially, on the Defense Industry, based on the principles to be used of the existing sources of investments, labor power, capital knowledge and technology productively, and to gain the capacity, to reproduce the technology earned in a sector at the upper level.

2006 Annual Ownership Report
83
Financial Analysis
Gross sales, decreasing by 12% in 2006, is 404 million YTL in 2006. Operating profit, decreasing by 38,9%, is 66 million YTL. In fiscal year 2006, 25 million YTL was transferred to the Institution as capital injection from the Treasury Budget.
SELECTED INDICATORS 2005 2006 % Increase(Million YTL) Gross sales 459 404 -12,0Operating profit or loss 107 66 -38,9Profit or loss 15 -31 -299,6Total Assets 827 815 -1,5Acid – Test Ratio 0,45 0,40 -10,8Average Collection Period (Days) 29 28 -1,3Cash Conversion Cycle (Days) 271 271 0,0Return on Equity (ROE) (%) 4,7 -9,0 -293,0Total Employment Figure (Average) 6.540 6.150 -6,0Total Employment Cost 182 179 -1,6Value Added 207 196 -5,6Investment Expenditure 18 23 28,6Payments to Budget (Dividend and Treasury Levies) 0 0 -Payments from Budget (Capital and Duty Loss) 15 25 65,4Primary Balance 70 4 -94,3Source: MKEK, UT and SPO
MKEK finances its investments by long term loans from Undersecretariat for Defense Industries.
Corporate financial leverage ratio increased by 59%. The proportion of long term external finances in total liabilities was 40% and short term external finances in total liabilities was 19% in 2006.
Employment costs decreased because of the 6% fall in the number of personnel in 2006. Acid test ratio decreased to 0,40 in 2006. The return on equity, 4,7 and -9 in 2005 and 2006 respectively.
2006 Annual Ownership Report
84
5.4.3. SÜMER HALI Sumer Carpeting and Handicrafts Joint Stock Company Board of Directors
♦ Fahrettin Kayıpmaz (Chairman and General Director) ♦ Bedii Boz (Deputy General Director) ♦ Erdal Karaca (Deputy General Director) ♦ Doç. Dr. Yüksel Birinci (Related Ministry Representative) ♦ Cevdet Yılmaz (Related Ministry Representative) ♦ Mustafa Tekmen (Related Ministry Representative) ♦ Representative (NA, Treasury Representative)
Capital Structure Treasury Share : 100% Subscribed Capital : 50 Million YTL Paid-in Capital : 37 Million YTL
Related Ministry Ministry of Industry and Trade
Web Address http://www.sumerhali.gov.tr
Sumer Carpeting And Handicrafts IJoint Stock Company (SUMER HALI). was established in 1988.
It was made an affiliated enterprise of the Ministry of Industry and the Trade as an state economic enterprise with the Decree of Council of Ministers No. 98/10720. The Articles of Association of the enterprise was published in the Official Gazette dated 16 July 1998.
The main duty of the enterprise is to keep the quality of Turkish handmade carpets and to enrich these features with the modern designs and present them to the world.
The head quarters of the company is in Ankara and it continues its activities with 2 factories, 7 manufacturing centers and 205 employees as of 2006.
Major Developments and Issues
The draft “Turkish Carpeting and Handicrafts Institute Bill” was prepared by the enterprise and submitted to the Prime Ministry in accordance with the “proposal” of the SOE commission of the Parliement to transform the enterprise into the “The Rug Business/Carpeting Institute” which is affiliated to the Ministry of Industry and Trade and serve to preserve and develop of the Turkish rug business culture since the enterprise became a loss making company.
Financial Analysis
Gross sales of the company reached to the level of 5 Million YTL decreasing by 27,5 % in 2006. The company made a loss amount of 6 Million YTL in the same year. The enterprise cannot reflect the rapid increase of its stock/inventory into its sales and is in

2006 Annual Ownership Report
85
difficulty in collecting the receivables and turning into cash. Profit capital ratio (% - 22,4) and the value added ratio (-0,5) are negative.
SELECTED INDICATORS 2005 2006 % Increase(Million YTL) Gross sales 6,9 5,0 -27,5Operating profit or loss -4,5 -3,7 -18,3Profit or loss -6,1 -6,1 -0,2Total Assets 30,3 28,3 -6,7Acid – Test Ratio 2,97 4,39 47,7Average Collection Period (Days) 204 255 24,8Cash Conversion Cycle (Days) 854 1.242 45,4Return on Equity (ROE) (%) -20,5 -22,4 9,4Total Employment Figure (Average) 218 205 -6,0Total Employment Cost 4,8 5,0 3,3Value Added -0,4 -0,5 24,2Investment Expenditure 0,0 0,0 -88,6Payments to Budget (Dividend and Treasury Levies) 0 0 0Payments from Budget (Capital and Duty Loss) 1,2 5,5 358,3Primary Balance -4,6 1,0 -121,7Source: SUMERHALI, UT and SPO

2006 Annual Ownership Report
86
CHAPTER 6: APPENDICES

2006 Annual Ownership Report
87

2006 Annual Ownership Report
88
APPENDIX 1: LIST of PUBLIC ENTERPRISES and THEIR SUBSIDIARIES

2006 Annual Ownership Report
89

2006 Annual Ownership Report
90
(As of end-.2006)
1 TREASURY PORTFOLIO BOTAŞ – Petroleum Pipeline Corporation EÜAŞ – Electricity Generation Incorporated Company TEİAŞ – Turkish Electricity Transmission Company TETAŞ – Turkish Electricity Trading and Contracting Incorporated Company TKİ – Turkish Coal Enterprise TTK – Turkish Hard Coal Enterprise TPAO – Turkish Petroleum Corporation ETİ MADEN – Eti Mine Works TCDD – Turkish State Railways DHMİ – State Airports Authority KIYEM – Coastal Safety PTT – Post and Telegraph Organization EBK – Meat and Fish Board TİGEM – Agriculture Enterprise TMO – Turkish Grain Board ÇAYKUR – Tea Enterprise TŞFAŞ – Turkish Sugar Factories Corporation DMO – State Supply Office MKEK – Mechanical and Chemical Industry Institution SÜMERHALI - Sumer Carpeting and Handicrafts Joint Stock Company TÜRKSAT – Turksat Satellite Communication Cable TV and Operation Incorporated Company TÜRK TELEKOM – Turkish Telecom. EMLAK BANK – Emlak Bank (In liquidation) ZIRAAT BANK – Ziraat Bank (Agriculture) HALKBANK – Halk Bank (Craftsmen) EXIMBANK – Export Credit Bank of Turkey KALKINMA –Development Bank of Turkey MERKEZ BANKASI – Central Bank of Republic of Turkey
2. PRIVATISATION PORTFOLIO (State’s Share in capital is more than %50) KBİ – Black Sea Copper Company SÜMER HOLDİNG – Sümer Holding Company TDÇİ – Iron and Steel Company TDİ – Turkish Maritimes PETKİM – Petkim Petrochemical Corporation TEDAŞ – Turkish Electricity Distribution Company TEKEL – Tobacco Company
3. OTHER PUBLIC ENTERPRISES İLLER BANKASI – Bank of Provinces AOÇ – Atatürk Forest and Farm Enterprise MP –-National Lottery TRT – Turkish Radio and Television
2006 Annual Ownership Report
91
VAKIFBANK – T.C. Vakıflar Bankası A.O. TOKİ – Housing and Development Administration of Turkey SPOR TOTO – Turkish Spor Toto Organisation A.A. – Anadolu Agency IMKB – İstanbul Stock Exchange IAB – İstanbul Gold Exchange
4. SUBSIDIARIES OF HOUSING DEVELOPMENT ADMINISTRATION Emlak Konut Gayrimenkul Yatırım Ortaklığı A.Ş. (Real Estate) Emlak Pazarlama, Insaat, Proje Yönetimi ve Ticaret A.S. (Marketing) Gayrimenkul Ekspertiz A.Ş. (Expertise) TOBAŞ (Real Estate) Vakıf Gayrimenkul Yatırım Ortaklığı A.Ş. (Real Estate) Vakıf İnşaat Restorasyon ve Ticaret A.Ş. (Construction) Bahçeşehir Gaz Dağıtım Pazarlama A.Ş. (Gas Distribution)
5. SOCIAL SECURITY INSTITUTIONS’ SUBSIDIARIES ES- Emek İnşaat ve İşletme A.Ş. (Construction) ES- Taksim Otelcilik A.Ş. (Hotel Business) ES- Petkim Petro-Kimya Holding A.Ş. (Petrochemicals) ES- Türkiye Petrolleri A.O. (Petroleum) ES- ES ÇİM Eskişehir Ç.F.T.A.Ş. (Cement) ES- Petlas Las. San. ve Tic. A.Ş. (Tire Production) ES- D.B. Deniz Nakliyat T.A.Ş. (Maritime Transportation) ES ve SSK- Yeditepe Beynelminel Otelcilik A.Ş. (Conrad Otel -Hotel Business) ES ve SSK- Merkez Bankası A.Ş. (Central Bank) SSK- Oyak İnşaat A.Ş. (Construction) SSK- Kansaş Kan ve Sağlık Hizmetleri A.Ş. (Health Sector) SSK- USX-RAY Röntgen A.Ş. (Troph Röntgen) (Health Sector) SSK- Ankara Anonim Türk Sigorta Şirketi (Insurance) SSK- Ticaret Sigorta Anonim Şirketi (Insurance)
6. NON-BUDGETARY FUNDS 7. ENTERPRISES WITH REVOLVING FUNDS 8. ENTERPRISES OF SDIF 9. ENTERPRISES OF MUNICIPALITIES 10 UNDERSECRETARIAT OF DEFENCE INDUSTRIES*
* The enterprises, their subsidiaries and indirect subsidiaries of Turkish Armed Forces Foundation are not included in this list though they possess the public attributes due to the special status of the foundation..
Note: The subsidiaries of the enterprises in the 1st, 2nd and 3rd category are not included in this list.
Source: Unpublished work by a working group of UT, SPO, PA and CMB.

2006 Annual Ownership Report
92
APPENDIX 2: FINANCIAL TABLES OF SOEs - TREASURY PORTFOLIO
2006 Annual Ownership Report
93

94
Aggregated Income Statement
(Current Prices - Million YTL) 2002 2003 2004 2005 2006Gross Sales 25.453 27.203 29.332 34.886 44.061
Domestic Sales 23.267 25.226 27.264 31.893 39.924 Export Sales 1.260 1.187 1.156 1.383 1.614 Duty Losses 687 542 692 1.364 1.408
Discounts From Sales 112 164 192 218 529Cost of Goods Sold 20.462 23.038 25.145 30.865 39.928Operating Expenses 1.851 1.567 1.738 1.885 2.159Operating Profit or Loss 3.028 2.434 2.258 1.917 1.445Ordinary Revenues From Other Operations 1.747 1.634 3.449 1.175 3.775Ordinary Expenses From Other Operations 331 597 2.159 552 2.271
Provisions 143 149 72 266 218Financing Expenses 1.890 846 719 428 992
Interest Expenses 603 512 405 279 437 Exchange Rate Differences 1.272 330 310 146 552
Extra Ordinary Revenues and Profit 377 405 371 1.159 642Extra Ordinary Expenses And Losses 907 1.384 1.437 1.755 1.434Profit – Loss 2.024 1.646 1.762 1.516 1.166Net Profit – Loss 1.208 1.059 1.232 1.028 799Net Profit – Loss / GDP 0,44 0,29 0,29 0,21 0,14
Source : SOEs and UT

2006 Annual Ownership Report
95
Aggregated Balance Sheet
(Current Prices - Million YTL) 2002 2003 2004 2005 2006 TOTAL ASSETS 37.401 45.038 56.072 61.834 72.784
Current Assets 16.676 19.121 24.647 29.980 38.835 Liquid assets and Securities 2.914 2.102 2.238 2.632 3.009 Trade and Other Receivables 9.828 12.117 15.495 18.839 26.866 Inventories 3.408 3.814 4.464 5.422 5.194
Fixed Assets 20.725 25.917 31.425 31.854 33.949 Trade and Other Receivables 1.413 1.716 1.478 2.035 1.845 Financial Fixed Assets 224 720 1.209 1.187 1.219 Tangible Assets 18.785 23.078 28.105 27.724 29.423 Current Liabilities 12.288 13.781 17.074 19.728 25.693 Financial Liabilities 3.035 2.656 2.654 2.267 3.776 Trade and Other Liabilities 6.709 7.593 9.700 12.187 16.046 Taxes Payable and Other Fiscal Liabilities 633 684 983 1.018 1.212 Long Term Liabilities 6.530 6.132 6.252 7.075 8.494
Financial Liabilities 6.099 5.565 5.547 5.548 6.175 Trade and Other Liabilities 134 123 61 50 556
Equity 18.583 25.125 32.746 35.030 38.596 Nominal Capital 10.644 13.286 16.603 19.175 22.952 Paid in Capital 9.444 12.114 13.862 16.830 18.825
TOTAL ASSESTS / GDP 13,5 12,5 13,0 12,7 12,6
Source : SOEs and UT

2006 Annual Ownership Report
96
Financial Ratios
2002 2003 2004 2005 2006 LIQUDITY RATIOS
Current Ratio 1,36 1,39 1,44 1,52 1,51 Acid-Test Ratio 0,85 0,84 0,84 0,95 1,01 Cash Ratio 0,17 0,12 0,10 0,13 0,11 Inventory Turnover 1,72 1,59 1,52 1,56 1,88 Average Collection Period (Days) 107 127 149 166 190 Cash Conversion Cycle (Day) 71 90 99 100 101
CAPITAL STRUCTURE AND LONG TERM FINANCING POSITIONFinancial Leverage 0,50 0,44 0,42 0,43 0,47 Long Term Liabilities / Capital 0,35 0,24 0,19 0,20 0,22 Equity / Assets 0,50 0,56 0,58 0,57 0,53 Interest Coverage Ratio 2,07 2,95 3,45 4,54 2,18
RATE OF INVESTMENT RETURNSReturn on Assets (ROA) (%) 8,26 4,00 3,43 2,25 2,22 Return on Equity (ROE) (%) 8,79 4,84 4,26 3,03 2,17
OPERATIONAL RATIOS Gross Sales Profit Ratio 0,19 0,15 0,14 0,11 0,08 Operating Profit / Sales 0,12 0,09 0,08 0,06 0,03 Profit Before Tax / Sales 0,08 0,06 0,06 0,04 0,03 Net Profit / Sales 0,05 0,04 0,04 0,03 0,02
ASSET UTILISATION RATIOS Sales / Liquid Assets 12,14 16,15 17,50 13,72 15,91 Sales / Receivables 3,36 2,84 2,42 2,16 1,90 Sales / Assets 0,68 0,60 0,52 0,56 0,60
Source :UT
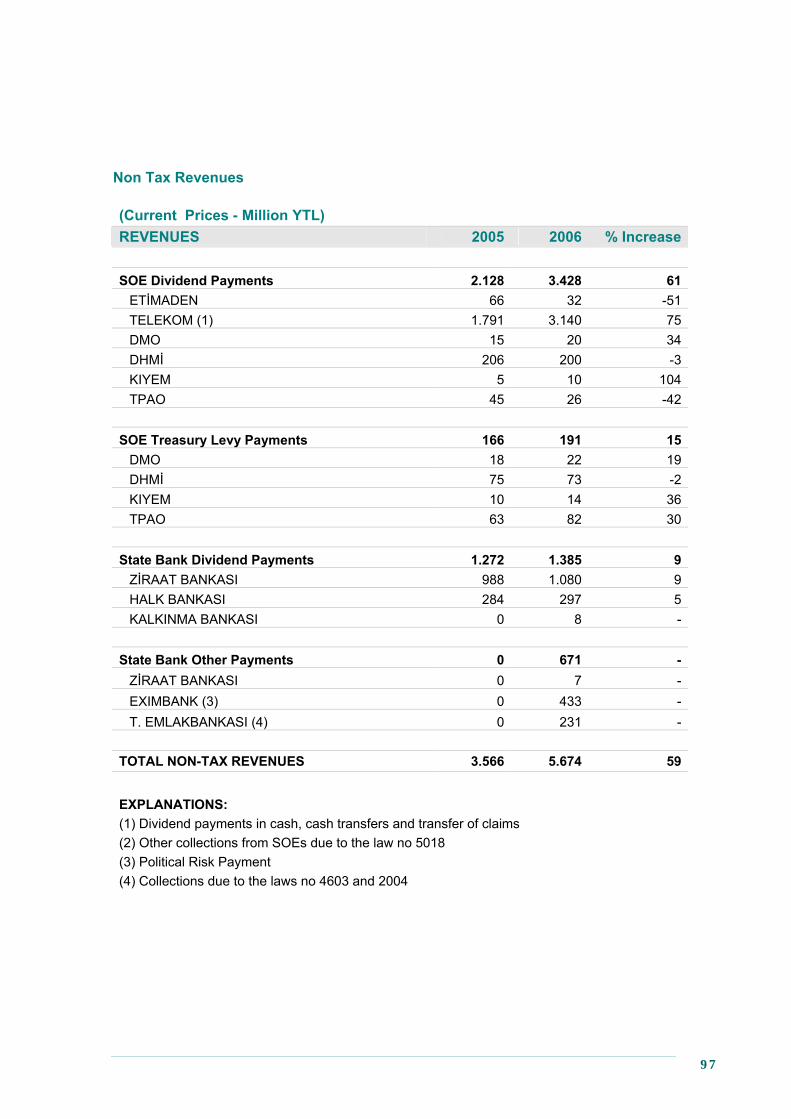
97
Non Tax Revenues
(Current Prices - Million YTL) REVENUES 2005 2006 % Increase SOE Dividend Payments 2.128 3.428 61
ETİMADEN 66 32 -51TELEKOM (1) 1.791 3.140 75DMO 15 20 34DHMİ 206 200 -3KIYEM 5 10 104TPAO 45 26 -42
SOE Treasury Levy Payments 166 191 15
DMO 18 22 19DHMİ 75 73 -2KIYEM 10 14 36TPAO 63 82 30
State Bank Dividend Payments 1.272 1.385 9
ZİRAAT BANKASI 988 1.080 9HALK BANKASI 284 297 5KALKINMA BANKASI 0 8 -
State Bank Other Payments 0 671 -
ZİRAAT BANKASI 0 7 -EXIMBANK (3) 0 433 -T. EMLAKBANKASI (4) 0 231 -
TOTAL NON-TAX REVENUES 3.566 5.674 59 EXPLANATIONS: (1) Dividend payments in cash, cash transfers and transfer of claims (2) Other collections from SOEs due to the law no 5018 (3) Political Risk Payment (4) Collections due to the laws no 4603 and 2004

2006 Annual Ownership Report
98
APPENDIX 3: EMPLOYMENT DATA of SOEs – TREASURY PORTFOLIO

2006 Annual Ownership Report
99

100
SOE Personnel Numbers and Costs
Personnel Numbers (Average) 2000 2001 2002 2003 2004 2005 2006 Civil Servant + Contracted 100.044 97.415 94.098 90.089 84.446 80.190 79.179Worker 129.023 126.383 117.146 105.728 98.898 95.987 91.847Total 229.067 223.798 211.244 195.817 183.344 176.177 171.026 Personnel Costs (Million YTL) 2000 2001 2002 2003 2004 2005 2006 Civil Servant + Contracted 580 855 1.266 1.519 1.659 1.763 1.912Worker 1.393 1.891 2.310 2.830 2.837 3.211 3.260Total 1.973 2.747 3.576 4.349 4.497 4.974 5.171 Personnel Costs (Average - YTL/Month) 2000 2001 2002 2003 2004 2005 2006 Civil Servant + Contracted 483 732 1.121 1.405 1.638 1.832 2.012Worker 900 1.247 1.644 2.231 2.391 2.788 2.957Total 718 1.023 1.411 1.851 2.044 2.353 2.520 Employment Costs/(Sales+ Operational) (%) 2000 2001 2002 2003 2004 2005 2006 Civil Servant + Contracted 10,5 7,5 5,7 6,2 6,2 5,4 4,5Worker 25,2 16,6 10,4 11,5 10,6 9,8 7,7Total 35,7 24,1 16,0 17,7 16,7 15,2 12,3
Source: SOEs and UT Explanation: Table consists of data of SOEs that are in the portfolio of Treasury as of 31.12.2006. As a result, it does not convey information about SOEs that were previously in Treasury Portfolio. For more detailed employment data please visit, http://www.hazine.gov.tr/stat/kit_ist.htm “Table 8.1:Employment Data”

101
Personnel Profile14
SOE Personnel- Years Served Time Figure Percent 0-4 Years 17.925 9,7 5-9 Years 32.498 17,7 10-14 Years 23.580 12,8 15-19 Years 35.914 19,5 20-24 Years 43.013 23,4 25 and Over 31.173 16,9 TOTAL 184.103 100,0
SOE Personnel- Age Groups Age Groups Figure Percent 0-19 31 0,0 20-29 12.430 6,8 30-39 53.578 29,1 40-49 90.117 48,9 50-59 26.750 14,5 60 and Over 1.197 0,7 TOTAL 184.103 100,0
SOE Personnel- Education Level Education Figure Percent Literate 1.638 0,9 Primary School 68.701 37,3 High School 40.628 22,1 Vocational High School 33.976 18,5 College (2 Years) 16.472 8,9 College (4 Years) 21.224 11,5 Graduate 1.350 0,7 Doctorate 114 0,1 TOTAL 184.103 100,0
14 The number of SOE personnel in the table above represents the actual number of SOE workers as of 2006 year-end. The tables in the report and the previous page consists of average personnel numbers in 2006. The reason for the difference in numbers is the existence of temporary workers. For All Personnel Proflie Tables Source: SOEs

2006 Annual Ownership Report
102
SOE Personnel- Gender Gender Figure Percent Male 170.734 92,8 Female 13.269 7,2 TOTAL 184.003 100,0
SOE Personnel Foreign Language Foreign Language Level Figure Percent One Foreign Language 1.119 0,6 More Than One Foreign Languages 86 0,0 None 182.898 99,3 TOTAL 184.103 100,0
SOE Personnel - Personnel Working Outside The Firm Agency Worked Figure Percent Grand National Assembly Of Turkey 61 18,7 Presidency Of The Republic Of Turkey 3 0,9 Prime Ministry 58 17,8 Privatization Administration 2 0,6 Ministries 193 59,2 Other SOEs 1 0,3 Other Public Agencies 8 2,5 TOTAL 326 100,0
SOE Personnel- Personnel Employed For Legal Obligations Status Figure Percent Disabled 5.474 25,1 Previously Convicted 3.168 14,5 Veteran – Martyr Relatives 499 2,3 Social Services and Child Protection Agency 848 3,9 Security Personnel 11.787 54,1 Other 21 0,1 TOTAL 21.797 100,0

2006 Annual Ownership Report
103

2006 Annual Ownership Report
104
APPENDIX 4: OTHER SELECTED INDICATORS of SOEs under TREASURY PORTFOLIO

2006 Annual Ownership Report
105

106
Other Indicators 2002 2003 2004 2005 2006 Value Added (Million YTL)
Profit/loss 2.024 1.646 1.762 1.516 1.166Interest Expense 603 512 405 279 437Provisions & Provision for exchange rate differences 1.415 478 382 412 770Current Year Depreciation Expense 1.821 1.712 2.015 1.913 1.894Personnel Expense 3.576 4.349 4.497 4.974 5.171
Total 9.439 8.697 9.061 9.095 9.439 Other Indicators (Million YTL) Investment Expenditure 2.424 1.780 1.494 2.229 2.746Primary Balance 3.146 996 1.958 546 2.270Transfers from budget* 1.953 1.570 1.303 1.423 2.627*Capital, Duty loss or aid Value Added (Percentage of GDP - %)
Profit/loss 0,7 0,5 0,4 0,3 0,2Interest Expense 0,2 0,1 0,1 0,1 0,1Provisions & Provision for exchange rate differences 0,5 0,1 0,1 0,1 0,1Current Year Depreciation Expense 0,7 0,5 0,5 0,4 0,3Personnel Expense 1,3 1,2 1,0 1,0 0,9
Total 3,4 2,4 2,1 1,9 1,6 Other Indicators (Percentage of GDP - %) Investment Expenditure 0,87 0,49 0,35 0,46 0,48Primary Balance 1,13 0,28 0,45 0,11 0,39Transfers from budget* 0,70 0,44 0,30 0,29 0,46*Capital or Duty loss

107

2006 Annual Ownership Report
108
APPENDIX 5: AGGREGATED FINANCIAL TABLES (Treasury and Privatization Administration Portfolio)15
15 The SOEs taken into account as PA Portfolio are, TEDAŞ, SÜMER HOLDİNG, TEKEL, PETKİM and TDİ.

2006 Annual Ownership Report
109

110
Aggregated Income Statement
(Current Prices - Million YTL) 2002 2003 2004 2005 2006 Gross sales 39.736 43.810 46.063 51.661 64.520 Domestic sales 36.926 41.429 43.537 48.223 59.629 Exports 1.593 1.558 1.587 1.826 2.357 Duty losses 696 542 692 1.364 1.408 Sales deductions 3.196 3.849 3.647 3.744 4.592 Cost of sales 29.967 34.105 36.638 42.456 54.843 Operating expenses 3.271 3.332 3.590 3.878 4.573 Operating profit or loss 3.302 2.524 2.189 1.583 513 Income and profit from other operations 2.387 2.275 4.364 2.626 4.336 Expenses and losses from other operations 572 895 2.658 776 2.685 Provision expenses 212 219 190 414 476 Financial expenses 1.971 904 768 456 1.029 Interest expenses 659 560 453 305 456 Exchange rate difference 1.297 340 311 149 570 Extraordinary revenues and profit 502 603 588 1.437 6.068 Extraordinary expenses and losses 1.370 1.951 2.488 2.586 5.233 Profit or loss 2.279 1.653 1.227 1.827 1.970 Net profit or loss 1.264 890 346 966 1.435 Net profit or loss/GDP 0,46 0,25 0,08 0,20 0,25
Source: SOEs, Other Enterprises and UT

2006 Annual Ownership Report
111
Aggregated Balance Sheet
(Current Prices - Million YTL) 2002 2003 2004 2005 2006 TOTAL ASSETS 48.042 58.276 73.143 82.879 109.079 Current Assets 22.725 25.389 34.558 43.499 65.328 Liquid assets and Marketable securities 3.412 2.465 2.592 3.114 3.579 Trade and Other receivables 13.711 16.404 23.365 29.935 50.319 Inventories 4.905 5.237 5.896 7.014 6.961 Long Term Assets 25.317 32.886 38.586 39.380 43.751 Trade and Other receivables 1.413 1.716 1.479 2.035 1.845 Tangible fıxed assets 236 1.354 1.856 1.853 1.665 Financial fıxed assets 23.358 29.397 34.595 34.576 36.407 Short Term Liabilities 18.050 19.170 26.351 33.593 51.399 Financial liabilities 3.066 2.923 3.015 3.465 4.102 Trade payables and other liabilities 10.004 11.648 17.650 23.276 40.186 Taxes payable and other fıscal liabilities 1.895 1.524 1.770 2.436 2.141 Long Term Liabilities 6.956 6.958 7.659 8.800 10.830 Financial liabilities 6.101 5.567 5.550 5.858 7.563 Trade payables and other liabilities 258 513 469 445 1.066 SHAREHOLDERS' EQUITY 23.036 32.147 39.133 40.486 46.851 Capital 12.955 15.782 19.751 22.423 31.479 Paid in capital 11.497 14.340 16.491 19.572 27.027 TOTAL ASSETS / GDP 17,3 16,2 17,0 17,0 18,9
Source: SOEs, Other Enterprises and UT

2006 Annual Ownership Report
112
Financial Ratios
2002 2003 2004 2005 2006 Liquidity Ratios Current Ratio 1,26 1,32 1,31 1,29 1,27 Acid-Test Ratio 0,77 0,82 0,81 0,83 0,72 Cash Ratio 0,13 0,10 0,07 0,08 0,06 Average Collection Period (Days) 104 119 160 187 200 Inventory Turnover Rate 1,75 1,68 1,65 1,64 1,96 Cash Conversion Cycle (Days) 60 70 72 73 73 Capital Composition and Long Term Financing Financial Leverage 0,52 0,45 0,46 0,51 0,57 Long-term Liabilities / Equity 0,30 0,22 0,20 0,22 0,23 Equity / Assets 0,48 0,55 0,54 0,49 0,43 Interest Coverage Ratio 2,16 2,83 2,60 5,00 2,91 Profitability Ratios Return on Assets 0,07 0,03 0,01 0,02 0,02 Return on Equity 0,07 0,03 0,01 0,02 0,03 Activity Ratios Gross Margin 0,19 0,15 0,14 0,11 0,08 Operating Profit / Sales 0,12 0,09 0,08 0,06 0,03 EBT / Sales 0,08 0,06 0,06 0,04 0,03 Net Period Profit / Sales 0,05 0,04 0,04 0,03 0,02 Assset Turnover Ratios Sales / Liquid assets 12,14 16,15 17,50 13,72 15,91 Sales / Receivables 3,36 2,84 2,42 2,16 1,90 Sales / Assets 0,68 0,60 0,52 0,56 0,60 Source: UT