2006 applebee's annual report
TRANSCRIPT

Applebee’s International, Inc. 4551 West 107th Street Overland Park, Kansas 66207
www.applebees.com
Applebee’sApplebee’s International, Inc. 2006 Annual Report & Form 10-K
Applebee’s was featured prominently in the best-selling business book,Applebee’s America: How Successful Political, Business and Religious LeadersConnect with the New American Community. Written by Ron Fournier,Matthew J. Dowd and Douglas B. Sosnik, the book was published in September 2006 and hit the New York Times best-seller list in October.

Corporate InformationCorporate Headquarters
4551 West 107th Street
Overland Park, Kansas 66207
(913) 967-4000
Fax: (913) 341-1694
Independent Registered Public Accounting Firm
Deloitte & Touche LLP
1100 Walnut Street, Suite 3300
Kansas City, Missouri 64106
Financial Community Information
Inquiries from institutional investors, financial analysts, registered represen-
tatives, portfolio managers and individual shareholders should be directed
to: Investor Relations Department at Applebee’s corporate headquarters, as
listed above, (913) 967-4000. Information may also be obtained by visiting
our website at www.applebees.com.
Registrar and Transfer Agent
Wells Fargo Bank, N.A.
Shareowner Services
161 North Concord Exchange
South St. Paul, Minnesota 55075-1139
Phone: (800) 468-9716
Annual Meeting
Shareholders are cordially invited to attend the 2007 Annual Meeting of
Stockholders which will be held at 10:00 a.m., CDT, on May 25, 2007, at
the Ritz Charles, 9000 West 137th Street, Overland Park, Kansas 66221.
Management urges all shareholders to vote their proxies and thus participate
in the decisions that will be made at this meeting.
Common Stock InformationOur common stock trades on The NASDAQ Global Select Market,®
under the symbol APPB. The table below sets forth for the fiscal quartersindicated the reported high and low sale prices of our common stock, asreported on The NASDAQ Global Select Market.
2006 2005
High Low High Low
First Quarter $26.47 $21.62 $29.19 $24.69Second Quarter $25.04 $19.43 $28.65 $24.25Third Quarter $23.07 $17.29 $26.79 $19.95Fourth Quarter $25.47 $20.77 $23.98 $19.73
Dividends
The 2006 annual dividend was $0.22 per share, paid in January 2007.
Shareholders
There were approximately 35,400 beneficial shareholders and 2,117
shareholders of record as of March 2007.
Trademarks
The following are registered trademarks of Applebee’s International, Inc.:
Applebee’s, Applebee’s Neighborhood Grill & Bar and America’s
Favorite Neighbor.
Forward-Looking Statements
Certain statements contained in this annual report are forward-looking
and based on current expectations. There are several risks and uncertainties
that could cause actual results to differ materially from those described,
including but not limited to the ability of the company and its franchisees
to open and operate additional restaurants profitably, the ability of its
franchisees to obtain financing, the continued growth of its franchisees
and its ability to attract and retain qualified franchisees, the impact of
intense competition in the casual dining segment of the restaurant indus-
try and its ability to control restaurant operating costs which are impacted
by market changes, minimum wage and other employment laws, food
costs and inflation. For additional discussion of the principal factors that
could cause actual results to be materially different, the reader is referred
to the company’s annual report on Form 10-K for the fiscal year ended
December 31, 2006. The company disclaims any obligation to update
these forward-looking statements.
(in thousands, except per share amounts) Fiscal Year Ended
December 31, December 25, December 26, December 28, December 29,2006(1) 2005 2004 2003 2002
Statement of Earnings Data:Company restaurant sales . . . . . . . . . . . . . . . . . . . . . . . . . . . . . . . . . . $ 1,196,258 $ 1,082,641 $ 976,798 $ 867,158 $ 724,616
Franchise royalties and fees . . . . . . . . . . . . . . . . . . . . . . . . . . . . . . . 139,855 128,813 121,221 109,604 102,180
Other franchise income . . . . . . . . . . . . . . . . . . . . . . . . . . . . . . . . . . . . 1,808 5,196 13,615 13,147 2,688
Total operating revenues . . . . . . . . . . . . . . . . . . . . . . . . . . . . . . . . $ 1,337,921 $ 1,216,650 $ 1,111,634 $ 989,909 $ 829,484
Operating earnings . . . . . . . . . . . . . . . . . . . . . . . . . . . . . . . . . . . . . . . . $ 130,784 $ 157,637 $ 165,280 $ 152,677 $ 126,590
Net earnings. . . . . . . . . . . . . . . . . . . . . . . . . . . . . . . . . . . . . . . . . . . . . . . . . $ 80,906 $ 101,802 $ 110,865 $ 94,349 $ 80,527
Basic net earnings per share . . . . . . . . . . . . . . . . . . . . . . . . . . . . . . . $ 1.09 $ 1.29 $ 1.36 $ 1.14 $ 0.97
Diluted net earnings per share . . . . . . . . . . . . . . . . . . . . . . . . . . . . $ 1.08 $ 1.27 $ 1.33 $ 1.10 $ 0.94
Dividends declared per share . . . . . . . . . . . . . . . . . . . . . . . . . . . . . $ 0.22 $ 0.20 $ 0.06 $ 0.05 $ 0.04
Basic weighted average shares outstanding. . . . . . . . . . . . . . . 74,001 78,650 81,528 82,944 83,407
Diluted weighted average shares outstanding. . . . . . . . . . . . 74,936 80,010 83,600 85,409 85,382
Balance Sheet Data (at end of fiscal year):
Total assets . . . . . . . . . . . . . . . . . . . . . . . . . . . . . . . . . . . . . . . . . . . . . . . . . . $ 935,456 $ 878,588 $ 754,431 $ 651,078 $ 573,647
Long-term debt, including current portion, and notes payable . . . . . . . . . . . . . . . . . . . . . . . . . . . . . . . . . . . . . . . $ 175,185 $ 188,367 $ 35,694 $ 20,862 $ 52,563
Stockholders’ equity . . . . . . . . . . . . . . . . . . . . . . . . . . . . . . . . . . . . . . . $ 486,654 $ 412,610 $ 496,727 $ 453,143 $ 385,201
Selected Financial DataThe following table sets forth our selected financial data for the periods and the dates indicated. Fiscal 2006 contained 53 weeks. Fiscal 2002 through 2005each contained 52 weeks. The following should be read in conjunction with the Consolidated Financial Statements and Notes thereto and “Management’sDiscussion and Analysis of Financial Condition and Results of Operations” appearing elsewhere in our Form 10-K.
(1) Beginning in 2006, we began recording stock-based compensation expense in accordance with Statement of Financial Accounting Standards No. 123(R),“Stock-Based Compensation.”
Company Overview Applebee’s International, Inc., headquartered in Overland Park, Kansas, develops, franchises and operates casualdining restaurants in 49 states, one U.S. territory and 16 international countries under the Applebee’s NeighborhoodGrill & Bar® brand. Each Applebee’s Neighborhood Grill & Bar is designed as an attractive, friendly, neighborhoodestablishment featuring moderately priced, high-quality food and beverage items, table service and a comfortableatmosphere that appeals to all ages. As “America’s Favorite Neighbor,®” each Applebee’s restaurant reflects its localneighborhood. The decor conveys this theme with photographs and memorabilia highlighting hometown heroes,local schools and area history. Applebee’s Neighborhood Grill & Bar is the largest casual dining concept in America,both in terms of number of restaurants and market share. As of December 31, 2006, there were 1,930 Applebee’sNeighborhood Grill & Bar restaurants, of which 1,409 were operated by franchisees and 521 were operated by the company.

2006 was a particularly challenging year for Applebee’sInternational, as it was for many casual dining restaurantcompanies. In an increasingly competitive and crowded segment,our goal is to become more relevant to more customers inmore ways than ever before ... building on our leadershipin value, convenience and our familiar, friendly atmospherewith innovative food and beverage offerings.
2006 Financial Performance For the fiscal year endedDecember 31, 2006, total system-wide sales for the Applebee’sbrand, including both company and franchise restaurants,grew 9.0 percent over the prior year, or 6.8 percent adjustedfor the extra week in 2006. Total company restaurant salesclimbed 10.5 percent for the year to $1.2 billion and totaloperating revenues increased 10.0 percent to $1.3 billion;excluding the extra week, the increases were 8.3 percent and7.7 percent, respectively.
Fiscal 2006 net earnings were $80.9 million, or $1.08 perdiluted share, compared to net earnings of $101.8 million, or$1.27 per diluted share, in fiscal 2005. Excluding stock-basedcompensation, impairment and other restaurant closure costsand legal expenses related to the pending settlement of a law-suit, 2006 diluted net earnings per share were $1.36 comparedto $1.32 the year before. The benefit of the extra week wasapproximately $0.05 per diluted share in 2006. (Please referto our Form 8-K filed on February 15, 2007 for a reconcilia-tion of non-GAAP measurements to GAAP results.)
Applebee’s system-wide domestic comparable sales, com-paring restaurants open for at least 18 months, declined 0.6percent in 2006. Domestic franchise restaurant comparablesales for the year were down 0.5 percent, and company comparable sales dropped 1.0 percent. While disappointing, particularly in light of the system’s 31 consecutive quarters
of comparable sales growth through the first quarter of 2006,our results exceeded the average for the bar and grill segment,as measured by Knapp-Track™.
We remain committed to having a highly disciplinedapproach to capital allocation and to focusing on relevantlong-term strategies to drive shareholder value, includingincreasing our free cash flow generation through a significantreduction in capital expenditures and new unit developmentin 2007.
In 2006, the company repurchased over 1.7 million sharesof common stock at an average price of $21.88 for an aggre-gate cost of $38.5 million. In November 2006, the Board ofDirectors authorized up to $150 million in additional stockrepurchases, reflecting confidence in the company’s businessmodel and commitment to enhancing shareholder value. Thisauthorization supplements the existing $175 million authoriza-tion announced in October 2005. At year-end, approximately$240 million remained available under the aggregate authori-zation. Over the last nine years, the company’s strong cash flowhas enabled it to repurchase more than $650 million of stock,including more than $330 million in the last three years.
In December 2006, the Board declared an annual dividendof 22 cents per share, marking the company’s 17th consecutiveannual dividend and representing a 10 percent increase overthe prior year.
Industry Climate In 2006, the casual dining segmentsuffered its worst slump in 15 years – with Applebee’s andother bar and grill operators especially hard hit. The casualdining sector experienced a 0.1 percent decline in comparablesales and a 2.8 percent drop in comparable guest traffic for the year, according to Knapp-Track™. A myriad of factors,including high gas prices, rising interest rates, a softer real
Dear Fellow Shareholders
David L. GoebelPresident and Chief Executive Officer
1
Applebee’s International, Inc. 2006 Annual Report & Form 10-K

Burger and a Seared Ribeye with Garlic Chili Shrimp. Goingforward, we believe this exciting affiliation will help broadenthe appeal of our brand and attract infrequent or lapsed customers who are less sensitive to economic pressures.
So what are consumers telling us about this strategy?More than 50 percent of all consumers surveyed in the fourthquarter of 2006 had improved perceptions of Applebee’s, withlapsed users showing the most improvement at 62 percent.Guest feedback from those who have tried the food has beenvery positive, with all items having much higher scores thanour norms on the rest of the menu. As a result, we feel thatthe Tyler message is meeting our objective and changing thefood perceptions among all of our users.
Our consumer panel tracker results, which were the outgrowth of our 2005 segmentation study, have now shownfour consecutive quarters of improvement in food scores – sowe believe we are starting to gain traction with our strategies,but we know we are not yet where we need to be.
Beverage and Late Night One of the bright spots in 2006 wasthe success we enjoyed with our beverage and late-night initia-tives. Applebee’s beverage sales account for approximately 20percent of restaurant sales, with alcoholic beverages accountingfor 12 percent. In 2006, we enhanced our beverage service totake advantage of growing interest in new drink flavors with atotal revamping extending from cocktails to barware. We haveadded contemporary new drinks like our popular Red AppleSangria and new martinis, as well as several smoothies andother non-alcoholic beverage options.
We also launched a late-night initiative in 2006 to stimu-late traffic during the 9 p.m. to close period, supported by foodand drink specials. The late-night day-part showed thestrongest growth last year, accounting for approximately 10percent of sales. While total comparable sales in company restau-rants were down 1.0 percent for the year, bar sales were up 2.4percent on a comparable basis as a result of these initiatives.
Marketing Applebee’s boasts considerable marketing muscle,with the largest advertising spend in casual dining.
In February 2007, George Williams joined Applebee’s as chief marketing officer and a member of our senior man-agement team, bringing a valuable mix of agency, consumergoods and multi-unit retail experience. In this role, Georgehas responsibility for the company’s marketing and advertising,as well as research and development, and the overall directionof our food and menu strategy. One of his first actions hasbeen to put our advertising account up for review, and weexpect to select a new agency by the end of the second quarter.
We continue to look for innovative ways to use our adver-tising dollars to connect with customers. In a unique productplacement initiative, Applebee’s has teamed with the critically
estate market and continued improvements in quick servicerestaurant offerings, together with a lack of differentiation aswell as supply growth outpacing demand in our category,combined to pressure comparable sales and traffic.
A significant portion of our regular customers have house-hold incomes of less than $50,000, a group that is far moresusceptible to macro economic variables that reduce discre-tionary spending. As economic factors strained family budgetslast year, many in this customer segment were forced to dineout less frequently or trade down to quick service restaurants.
Strategic Initiatives With that environment as a backdrop,we are intently focused on improving the things that we knoware within our control. Our long-term strategies are designed to make Applebee’s more relevant to all of our guests with thegoal of driving guest traffic and higher average unit volumesthrough our existing restaurants, with less emphasis on newrestaurant development. Our key strategic initiatives in 2007include continued improvement of our food, evolution of ouradvertising and a greater emphasis on communicating our valueproposition to our guests. We also may increase the amount ofcapital we allocate to remodels in the next few years so we canprovide a more differentiated total experience to the guest.
Food and Menu We continue to revamp our menu, making itmore compelling and contemporary in our ongoing effort toprovide great-tasting food to consumers. Our highest prioritycontinues to be improving both the quality and taste of our food,appealing to customers seeking value, as well as those who wantmore sophisticated offerings. We are convinced that higherquality menu items that deliver preference and cravability canexist side-by-side with our more affordably priced value items... something we have termed our high/low food strategy.
We are aggressively reinvigorating our food offerings byinfusing our menu with new great-tasting options. In 2006, weaccelerated the pace of our food innovation and introducedmore than 20 new or improved menu items featuring bolder,more diverse flavors such as a Quesadilla Burger, RoastedGarlic and Asiago Chicken and a whole new line of sandwichesserved on Ciabatta bread. We also upgraded all of our burgersto 100 percent Angus beef.
During the fourth quarter, we teamed with Food Networkstar Tyler Florence in a ground-breaking partnership to bringthe culinary creativity of a celebrity chef to our restaurantsacross America. In conjunction with the final two promotionsof the year, we introduced five new Tyler-inspired menu itemsthat reflect his passion for seeking out the most flavorful, satis-fying food from across the country and his unique cookingstyle – including Penne Rosa with Sweet Italian Sausage,Herb-Crusted Chicken Topped with Italian Country Salad,Crispy Brick Chicken with Warm Spinach Salad, a Bruschetta
2
Applebee’s International, Inc. 2006 Annual Report & Form 10-K
acclaimed NBC television show, “Friday Night Lights,” set ina fictional small Texas town with a championship high schoolfootball team. Applebee’s is integrated into the storyline andserves as the setting for some scenes, while one of the show’smain characters is a server at Applebee’s.
In 2007, we will place a greater emphasis in our advertisingon communicating our value proposition to our guests, as we know this continues to be a critical driver of visits. As anexample, to increase traffic during the lunch day-part and inresponse to increased pressure from quick service and fast-casual operators, we introduced a Pick ‘N Pair lunch programin February 2007, offering customization to our customers withover 60 different combination choices. The program is beingpromoted at a nationally advertised price point starting at $5.99to directly compete against the fast-casual dining category.
Unit Development Applebee’s continues to dominate the casualdining segment, both in number of units and system-widesales. During 2006, Applebee’s opened a total of 143 newrestaurants system-wide – the 14th consecutive year the systemhas opened 100 or more units. Included in this total were 35 company, 90 domestic franchise and 18 international franchise restaurant openings.
At year-end, 1,930 restaurants were operating throughoutour worldwide system, including 521 company and 1,409franchise units. We continue to believe the ultimate potentialof the Applebee’s system is at least 3,000 domestic and 1,000international locations.
Reflecting our focus on driving improved performance inour existing units and de-emphasizing new development inlight of the current business and economic climate, we currentlyanticipate opening between 10 and 15 new company restaurantsin 2007, a much slower pace of growth than in recent years. Inaddition, in March 2007, we announced our intention toclose 24 company restaurants that were not meeting acceptablelevels of return on investment and other key operating metrics.
Franchise Model Our franchise-dominated business model,with a year-end mix of 73 percent franchise restaurants and 27 percent company units, remains unique in the industrywith the highest franchise ownership level by far in casualdining. Unlike the fast food category, our franchisees are large,sophisticated businesses. At year-end, 44 domestic franchisegroups were operating a total of 1,320 restaurants. The averagedomestic Applebee’s franchisee operates 30 restaurants, andour largest franchisee operates 132 restaurants. Today, over 93 percent of our domestic franchise system is operated byonly 30 franchisees.
With the highest growth rate in the system, our interna-tional franchise business achieved its most successful year everin 2006, opening 18 new restaurants. At year-end, our interna-
tional franchise system included a total of 89 restaurants in one U.S. territory and 16 countries outside the United States,primarily in Canada, Mexico and the Middle East.
Leadership Changes Our leadership transition, firstannounced in January 2006, was implemented seamlessly inSeptember as I assumed the additional responsibilities of CEOfrom Lloyd Hill. Lloyd is continuing to serve as non-executiveChairman of the Board. Over the eight-plus years of Lloyd’stenure as sole-CEO, Applebee’s total return to shareholdersexceeded 300 percent, a compound annual growth rate ofmore than 17 percent. In recognition of his enormous contribution to the growth and success of our company, weare renaming the Applebee’s Leadership Institute in his honor.
In Conclusion We believe it is important to periodicallyreassess our strategies and capital structure, particularly duringtimes of challenging industry and company performance. OnFebruary 13, 2007, we announced that our Board of Directorsformed a committee of independent directors to explorestrategic alternatives for enhancing shareholder value.
This committee has a broad mandate to conduct a compre-hensive and independent evaluation of the company’s strategicalternatives. The committee is reviewing both the company’sbusiness and financial strategies.
From a business perspective, the committee is focusing on the company’s returns on capital, strategies for improvingsame-store sales, the mix of company-owned versus franchisedrestaurants, and overhead cost structure.
From a financial perspective, the committee is in theprocess of reviewing a variety of alternatives to determine its optimal capital structure, potential use of proceeds fromany additional borrowings, and the potential impact on thecompany’s long-term value as a stand-alone entity. The committee is also exploring a potential sale of the company.
At this time, it is premature to comment on the likelihoodor potential values in a recapitalization or sale relative to theother options the committee is evaluating. There can be noassurance that a transaction will be pursued or consummated.
Even in the current challenging environment, you can beassured that all of our company restaurant and support centerassociates, as well as our valuable franchise partners, are focusedon improving our performance. They are always a powerfuland constant reminder that we are in this for the long-haul.
David L. GoebelPresident and Chief Executive OfficerMarch 2007
3
Applebee’s International, Inc. 2006 Annual Report & Form 10-K
4
Applebee’s International, Inc. 2006 Annual Report & Form 10-K
OfficersDavid L. GoebelPresident and Chief Executive Officer
Steven K. LumpkinExecutive Vice President, Chief Financialand Strategy Officer
Carin L. StutzExecutive Vice President of Operations
Stanley M. SwordExecutive Vice President and Chief People Officer
George WilliamsExecutive Vice President and Chief Marketing Officer
Rohan St. GeorgePresident of International Division
Philip R. CrimminsSenior Vice President of Development
Michael CzinegeSenior Vice President and Chief Information Officer
Kurt HankinsSenior Vice President of MenuDevelopment and Innovation
David R. ParsleySenior Vice President of Supply Chain Management
Nancy E. CulbertsonVice President of National Marketing and Innovation
Carol A. DiRaimoVice President of Investor Relations
Beverly O. ElvingVice President and Controller
Thomas F. FinocchiaroVice President of Operations Excellence
Larry C. MillerVice President of Finance
Samuel M. RothschildVice President of Franchise and Beverage Operations
Rebecca R. TildenVice President, General Counsel and Secretary
Scott W. WhiteVice President of Human Resources –Design and Services
Board of DirectorsLloyd L. HillChairman of the Board
Erline Belton 2, 3
President and Founder, The Lyceum Group
Gina R. Boswell 3
Senior Vice President and Chief Operating Officer, Avon North America
Douglas R. Conant 2
President and Chief Executive Officer,Campbell Soup Company
D. Patrick Curran 1
Chairman and Chief Executive Officer,The Curran Companies
David L. GoebelPresident and Chief Executive Officer,Applebee’s International, Inc.
Eric L. Hansen 1, 3
Shareholder in Holman Hansen & Colville, P.C., a Professional Association
Jack P. Helms 1, 3
Principal and Shareholder in Goldsmith,Agio, Helms and Company
Steven K. LumpkinExecutive Vice President, Chief Financialand Strategy Officer, Applebee’sInternational, Inc.
Rogelio Rebolledo 1
Chairman, Pepsi Bottling Group Mexico
Burton M. Sack 2, 3
Retired former executive, Applebee’sInternational, Inc.
Michael A. Volkema 1, 2
Chairman of the Board, Herman Miller, Inc.Committee Memberships: 1 Audit 2 Executive Compensation 3 Corporate Governance/Nominating

Corporate InformationCorporate Headquarters
4551 West 107th Street
Overland Park, Kansas 66207
(913) 967-4000
Fax: (913) 341-1694
Independent Registered Public Accounting Firm
Deloitte & Touche LLP
1100 Walnut Street, Suite 3300
Kansas City, Missouri 64106
Financial Community Information
Inquiries from institutional investors, financial analysts, registered represen-
tatives, portfolio managers and individual shareholders should be directed
to: Investor Relations Department at Applebee’s corporate headquarters, as
listed above, (913) 967-4000. Information may also be obtained by visiting
our website at www.applebees.com.
Registrar and Transfer Agent
Wells Fargo Bank, N.A.
Shareowner Services
161 North Concord Exchange
South St. Paul, Minnesota 55075-1139
Phone: (800) 468-9716
Annual Meeting
Shareholders are cordially invited to attend the 2007 Annual Meeting of
Stockholders which will be held on May 25, 2007, at the Ritz Charles,
9000 West 137th Street, Overland Park, Kansas 66221.
Management urges all shareholders to vote their proxies and thus participate
in the decisions that will be made at this meeting.
Common Stock InformationOur common stock trades on The NASDAQ Global Select Market,®
under the symbol APPB. The table at right sets forth for the fiscal quartersindicated the reported high and low sale prices of our common stock, asreported on The NASDAQ Global Select Market.
2006 2005
High Low High Low
First Quarter $26.47 $21.62 $29.19 $24.69Second Quarter $25.04 $19.43 $28.65 $24.25Third Quarter $23.07 $17.29 $26.79 $19.95Fourth Quarter $25.47 $20.77 $23.98 $19.73
Dividends
The 2006 annual dividend was $0.22 per share, paid in January 2007.
Shareholders
There were approximately 35,400 beneficial shareholders and 2,072
shareholders of record as of March 2007.
Trademarks
The following are registered trademarks of Applebee’s International, Inc.:
Applebee’s, Applebee’s Neighborhood Grill & Bar and America’s
Favorite Neighbor.
Forward-Looking Statements
Certain statements contained in this annual report are forward-looking
and based on current expectations. There are several risks and uncertainties
that could cause actual results to differ materially from those described,
including but not limited to the ability of the company and its franchisees
to open and operate additional restaurants profitably, the ability of its
franchisees to obtain financing, the continued growth of its franchisees
and its ability to attract and retain qualified franchisees, the impact of
intense competition in the casual dining segment of the restaurant indus-
try and its ability to control restaurant operating costs which are impacted
by market changes, minimum wage and other employment laws, food
costs and inflation. For additional discussion of the principal factors that
could cause actual results to be materially different, the reader is referred
to the company’s annual report on Form 10-K for the fiscal year ended
December 31, 2006. The company disclaims any obligation to update
these forward-looking statements.

Applebee’s International, Inc. 4551 West 107th Street Overland Park, Kansas 66207
www.applebees.com
Applebee’sApplebee’s International, Inc. 2006 Annual Report & Form 10-K
Applebee’s was featured prominently in the best-selling business book,Applebee’s America: How Successful Political, Business and Religious LeadersConnect with the New American Community. Written by Ron Fournier,Matthew J. Dowd and Douglas B. Sosnik, the book was published in September 2006 and hit the New York Times best-seller list in October.

1
UNITED STATES SECURITIES AND EXCHANGE COMMISSION
Washington, D.C. 20549
FORM 10-K
(Mark One) [ X ] ANNUAL REPORT PURSUANT TO SECTION 13 OR 15(d) OF THE SECURITIES EXCHANGE
ACT OF 1934
For the fiscal year ended December 31, 2006
OR
[ ] TRANSITION REPORT PURSUANT TO SECTION 13 OR 15(d) OF THE SECURITIES EXCHANGE ACT OF 1934
For the transition period from to Commission File Number: 000-17962
Applebee’s International, Inc. (Exact name of registrant as specified in its charter)
Delaware 43-1461763 (State or other jurisdiction of incorporation or organization)
(I.R.S. Employer Identification No.)
4551 W. 107th Street, Overland Park, Kansas 66207
(Address of principal executive offices and zip code)
(913) 967-4000 (Registrant’s telephone number, including area code)
Securities registered pursuant to Section 12(b) of the Act:
Title of Each Class Name of Each Exchange on Which Registered Common Stock, par value $.01 per share The NASDAQ Stock Market LLC
Securities registered pursuant to Section 12(g) of the Act: None
Indicate by check mark if the registrant is a well-known seasoned issuer, as defined in Rule 405 of the Securities Act. Yes X No Indicate by check mark if the registrant is not required to file reports pursuant to Section 13 or Section 15(d) of the Act. Yes No X Indicate by check mark whether the registrant (1) has filed all reports required to be filed by Section 13 or 15(d) of the Securities Exchange Act of 1934 during the preceding 12 months (or for such shorter period that the registrant was required to file such reports), and (2) has been subject to such filing requirements for the past 90 days.
Yes X No Indicate by check mark if disclosure of delinquent filers pursuant to Item 405 of Regulation S-K is not contained herein, and will not be contained, to the best of registrant’s knowledge, in definitive proxy or information statements incorporated by reference in Part III of this Form 10-K or any amendment to this Form 10-K.

2
Indicate by check mark whether the registrant is a large accelerated filer, an accelerated filer, or a non-accelerated filer. See definition of “accelerated filer” in Rule 12b-2 of the Exchange Act. Large accelerated filer X Accelerated filer Non-accelerated filer
Indicate by check mark whether the registrant is a shell company (as defined in Rule 12b-2 of the Act).
Yes No X The aggregate market value of the voting and non-voting common stock equity held by non-affiliates of the registrant as of the last business day of the second fiscal quarter ended June 25, 2006 was $1,453,104,313 based on the closing sale price on June 23, 2006. The number of shares of the registrant’s common stock outstanding as of February 23, 2007 was 74,321,615.
DOCUMENTS INCORPORATED BY REFERENCE Portions of the Proxy Statement for the 2007 Annual Stockholder’s Meeting are incorporated into Part III hereof.

3
APPLEBEE’S INTERNATIONAL, INC. FORM 10-K
FISCAL YEAR ENDED DECEMBER 31, 2006 INDEX
Page PART I Item 1. Business................................................................................................................... 4
Item 1A. Risk Factors............................................................................................................. 13
Item 1B. Unresolved Staff Comments ................................................................................... 18
Item 2. Properties................................................................................................................. 18 Item 3. Legal Proceedings ................................................................................................... 20
Item 4. Submission of Matters to a Vote of Security Holders............................................. 20
PART II
Item 5. Market for Registrant’s Common Equity, Related Stockholder Matters and Issuer Purchases of Equity Securities ...................................................... 21
Item 6. Selected Financial Data........................................................................................... 23
Item 7. Management’s Discussion and Analysis of Financial Condition and Results of Operations.............................................. 24
Item 7A. Quantitative and Qualitative Disclosures about Market Risk ................................. 38
Item 8. Financial Statements and Supplementary Data ....................................................... 38
Item 9. Changes in and Disagreements with Accountants on Accounting and Financial Disclosure........................................................ 38
Item 9A. Controls and Procedures.......................................................................................... 38
Item 9B. Other Information.................................................................................................... 41
PART III
Item 10. Directors, Executive Officers and Corporate Governance ...................................... 42
Item 11. Executive Compensation......................................................................................... 42
Item 12. Security Ownership of Certain Beneficial Owners and Management and Related Stockholder Matters .......................................................................... 42
Item 13. Certain Relationships and Related Transactions, and Director Independence........ 42
Item 14. Principal Accounting Fees and Services ................................................................. 43
PART IV
Item 15. Exhibits, Financial Statement Schedules................................................................. 44 Signatures........................................................................................................................................ 45

4
PART I
Introductory Note References to “Applebee’s,” “we,” “us,” and “our” in this document are references to Applebee’s International, Inc. and its subsidiaries and any predecessor companies of Applebee’s International, Inc. On February 13, 2007, we announced that our Board of Directors has formed a committee of independent directors to explore strategic alternatives for enhancing shareholder value, including a possible recapitalization or sale of the company. There is no assurance that the process will result in any specific transaction. However, the implementation of certain strategic alternatives could affect our current plans and strategies, and any forward-looking statements in this document are qualified by reference to the committee’s ongoing analysis. Item 1. Business General We develop, franchise and operate restaurants in the bar and grill segment of the casual dining industry under the name “Applebee’s Neighborhood Grill & Bar®.” With over 1,900 system-wide restaurants as of December 31, 2006, Applebee’s Neighborhood Grill & Bar is the largest casual dining concept in the world, in terms of number of restaurants and market share(1). Applebee’s International, Inc. maintains an Internet website address at www.applebees.com. We make available free of charge through our website our annual report on Form 10-K, quarterly reports on Form 10-Q, current reports on Form 8-K, and all amendments to those reports as soon as they are reasonably available after these materials are electronically filed with or furnished to the Securities and Exchange Commission (“SEC”). We opened our first restaurant in 1986. We initially developed and operated six restaurants as a franchisee of the Applebee’s Neighborhood Grill & Bar Division, an indirect subsidiary of W.R. Grace & Co. In March 1988, we acquired substantially all the assets of our franchisor. When we acquired the Applebee’s Division, it operated 13 restaurants and had 10 franchisees, including us, operating 41 franchise restaurants. As of December 31, 2006, there were 1,930 Applebee’s restaurants. Franchisees operated 1,409 of these restaurants and 521 restaurants were company-owned. The restaurants were located in 49 states, 16 countries outside of the United States and one U.S. territory. During 2006, 143 new restaurants were opened, including 108 franchise restaurants and 35 company restaurants. We continue to expect that the Applebee’s system will ultimately encompass at least 3,000 restaurants in the United States as well as the potential for at least 1,000 restaurants internationally. Our current operating strategy is to focus on increasing comparable sales and average unit volumes in existing restaurants by improving the fundamentals of the Applebee’s concept and placing less emphasis on new restaurant development for company-owned markets than in the past. As part of this strategy, we are concentrating on leveraging our value position and broadening our appeal to guests through an improved menu and consumer messaging.
(1) Source: Nation’s Restaurant News, “Special Report: Top 100,” June 26, 2006.

5
Fiscal 2006 contained 53 weeks. Fiscal 2005 and 2004 each contained 52 weeks. The following table sets forth certain unaudited financial information and other restaurant data relating to company and franchise restaurants, as reported to us by franchisees:
Fiscal Year Ended December 31,
2006 December 25,
2005 December 26,
2004 Number of restaurants: Company: Beginning of year ............................................ 486 424 383 Restaurant openings......................................... 35 52 32 Restaurant closings.......................................... (4) (1) (1) Restaurants acquired from franchisees ............ 4 11 10 End of year ...................................................... 521 486 424 Franchise: Beginning of year ............................................ 1,318 1,247 1,202 Restaurant openings......................................... 108 92 77 Restaurant closings.......................................... (13) (10) (22) Restaurants acquired by franchisor.................. (4) (11) (10) End of year ...................................................... 1,409 1,318 1,247 Total: Beginning of year ............................................ 1,804 1,671 1,585 Restaurant openings......................................... 143 144 109 Restaurant closings.......................................... (17) (11) (23) End of year ...................................................... 1,930 1,804 1,671 Weighted average weekly sales per restaurant: Company ....................................................... $ 44,637 $ 45,552 $ 46,536 Domestic franchise ........................................ $ 49,521 $ 49,564 $ 48,143 Domestic total................................................ $ 48,134 $ 48,462 $ 47,737 Change in comparable restaurant sales(1): Company ....................................................... (1.0)% (0.9)% 3.8% Domestic franchise ........................................ (0.5)% 2.6 % 5.0% Domestic total................................................ (0.6)% 1.7 % 4.7% Total operating revenues (in thousands): Company restaurant sales(2) ........................... $ 1,196,258 $ 1,082,641 $ 976,798 Franchise royalties and fees(3) ........................ 139,855 128,813 121,221 Other franchise income(4) ............................... 1,808 5,196 13,615 Total .............................................................. $ 1,337,921 $ 1,216,650 $ 1,111,634
(1) When computing comparable restaurant sales, restaurants open for at least 18 months are compared from period to period. (2) Our 2006 fiscal year included 53 weeks while fiscal years 2005 and 2004 each included 52 weeks. The 53rd week in 2006 contributed $24,312, in thousands, to company restaurant sales. (3) Franchise royalties are generally 4% of each franchise restaurant's reported monthly gross sales. Reported unaudited franchise sales, in thousands, were $3,498,967, $3,223,505 and $3,001,287 in 2006, 2005 and 2004, respectively. The 53rd week in 2006 contributed approximately $73,500, in thousands, to reported franchise sales and approximately $2,900, in thousands, to franchise royalties. Franchise fees typically are $35,000 for each restaurant opened. (4) Other franchise income includes insurance premiums from franchisee participation in our captive insurance program in 2005 and 2004 and revenue from information technology products and services provided to certain franchisees in all periods.

6
The Applebee’s System Concept. Each Applebee’s restaurant is designed as an attractive, friendly, neighborhood establishment featuring moderately-priced food and beverage items, table service and a comfortable atmosphere. Our restaurants appeal to a wide range of customers including young adults, senior citizens and families with children. Since 2002, we have offered our customers the convenience of carry-out service featuring our Carside To Go program. This program, offered at both company-owned and franchise restaurants, focuses on convenience by allowing the customer to place their order by telephone, park in designated spots at our restaurants and have servers deliver the order to their vehicle. During 2006, Carside To Go accounted for 9.7% of company-owned restaurant sales. We have developed certain specifications for the design of our restaurants. Our restaurants are primarily located in free-standing buildings, end caps of strip shopping centers, and shopping center malls. Each of our restaurants generally has a bar and many restaurants offer patio seating. The decor, which frequently highlights local history and personalities, gives each restaurant a unique, neighborhood identity, which is an important aspect of the Applebee’s brand. In addition, we generally require that each restaurant be remodeled every six to seven years to embody the design elements of the current prototype. We are continually evaluating our restaurant design to ensure that we keep our brand fresh and appealing to our guests. Menu. Each restaurant offers a diverse menu of moderately-priced food and beverage items consisting of traditional favorites and signature dishes. The restaurants feature a broad selection of entrees, including beef, chicken, pork, seafood and pasta items prepared in a variety of cuisines, as well as appetizers, salads, sandwiches, specialty drinks and desserts. Substantially all restaurants offer beer, wine, liquor and premium specialty drinks. During 2006, alcoholic beverages accounted for 12.5% of company-owned restaurant sales. In 2006, we began implementation of new initiatives to broaden the appeal of our brand. These initiatives included advertising that targets both the frequent casual dining guest and those seeking value, beverage and late-night programs, as well as the introduction of 20 new or improved menu items, including several which were developed in partnership with celebrity chef Tyler Florence. During 2004, we entered into a five-year exclusive strategic alliance with Weight Watchers International, Inc. to offer Weight Watchers® branded menu alternatives to our guests. As part of our exclusive arrangement with Weight Watchers, we and our franchisees pay a percentage royalty on the total domestic sales of Weight Watchers menu items. Restaurant Operations. We stipulate operating standards and specifications for our company-owned and franchise restaurants. These standards pertain to the quality, preparation and selection of menu items, maintenance and handling of food, maintenance and cleanliness of premises and service procedures. Training. We have comprehensive training programs for restaurant associates and managers. Restaurant associates and managers complete a training and orientation process by certified training personnel upon hire. In addition, associates and managers receive ongoing training to further develop their job skills and knowledge. Franchise and company restaurant managers also have access to the Lloyd Hill Applebee's Leadership Institute which offers learning and development opportunities. Programs and services include training, leadership assessments and life coaching.

7
Marketing. We have historically concentrated our advertising and marketing efforts primarily on food-specific promotions, Weight Watchers®, Carside To Go and Applebee’s branded messaging. Our marketing includes national, regional and local expenditures, utilizing primarily television, radio, direct mail and print media, as well as alternative channels such as the Internet, product placement and the use of third-party retailers to market our gift cards. In 2006, approximately 4.1% of company restaurant sales was allocated for marketing purposes. This amount includes contributions to the national marketing pool, which develops and funds the specific national promotions, including Weight Watchers and Carside To Go. We focus the remainder of our marketing expenditures on local marketing in areas with company-owned restaurants. Information Technology. We believe technology can assist us in achieving our operational goals. Our restaurant systems, including point-of-sale and food, kitchen and labor management systems, are tightly integrated with our above-store data warehousing and decision support platforms. This integration provides management with a timely, accurate and comprehensive view of our business performance. Supply Chain. Maintaining high food quality, system-wide consistency and availability is the central focus of our supply chain program. We establish quality standards for products used in the restaurants, and we maintain a list of approved suppliers and distributors from which we and our franchisees must select. We periodically review the quality of the products served in our domestic restaurants in an effort to ensure compliance with these standards. We have negotiated purchasing agreements with most of our approved suppliers which result in volume discounts for us and our franchisees. Due to cultural and regulatory differences, we may have different requirements for restaurants opened outside of the United States. Food Safety and Quality Assurance. We are committed to providing our customers with products that meet or exceed regulatory and industry standards for food safety as well as our high quality standards. Our quality assurance department establishes and monitors our food safety programs in domestic restaurants, including restaurant, supplier and distributor audits, food safety and sanitation monitoring, and product testing. Company Restaurants Company Restaurant Openings. Our strategy is to cluster restaurants in targeted markets to increase consumer awareness and convenience and enabling us to take advantage of operational, distribution and advertising efficiencies. Our development experience indicates that when we open multiple restaurants within a particular market, our market share increases. We believe our effectiveness as a franchisor is enhanced by owning company restaurants. Operating company restaurants allows us to develop, implement and optimize restaurant initiatives and standards before introducing them to the entire system. We continually evaluate the mix of company restaurants to franchise restaurants and when it is consistent with our long-term strategies, we will re-franchise or acquire restaurants.

8
We opened 35 new company restaurants in 2006. The following table shows the areas where our company restaurants were located as of December 31, 2006:
Area New England (includes Maine, Massachusetts, New Hampshire, New York, Rhode Island and Vermont) .........................................
77
Minneapolis/St. Paul, Minnesota....................................................... 67 Detroit/Southern Michigan ................................................................ 67 Texas .................................................................................................. 60 Virginia .............................................................................................. 59 St. Louis, Missouri/Illinois ............................................................ 58 Kansas City, Missouri/Kansas........................................................... 34 Washington, D.C. (Maryland, Virginia). .......................................... 31 San Diego/Southern California.......................................................... 24 Las Vegas/Reno, Nevada................................................................... 16 Central Missouri/Kansas/Arkansas ................................................... 12 Albuquerque, New Mexico ............................................................... 8 Memphis, Tennessee.......................................................................... 8 521
Restaurant Operations. The staff for a typical restaurant consists of one general manager, one kitchen manager, two or three managers and approximately 60 hourly associates. Generally, managers of company-owned restaurants receive a salary and may receive a performance bonus based on financial performance, guest satisfaction and associate retention measures. As of December 31, 2006, we employed three Regional Vice Presidents of Operations, 15 Directors of Operations and 85 Area Directors. The Area Directors’ duties include regular restaurant visits and inspections which ensure the ongoing maintenance of our standards of quality, service, cleanliness, value and courtesy. We also have corporate personnel that support operations with functions such as accounting, human resources, information technology, marketing and training. The Applebee’s Franchise System Franchise Territory and Restaurant Openings. We currently have 75 franchise groups, including 31 international franchisees. We have generally selected franchisees that are experienced multi-unit restaurant operators who have operated other restaurant concepts. Our franchisees operate Applebee’s restaurants in 43 states, 16 countries outside of the United States and one U.S. territory. We have assigned development rights to the vast majority of domestic territories in all states except Hawaii or have designated them for company development. As of December 31, 2006, there were 1,409 franchise restaurants. Franchisees opened 77 restaurants in 2004, 92 restaurants in 2005, and 108 restaurants in 2006. Development of Restaurants. We make available to franchisees the design specifications for a typical restaurant, and we retain the right to prohibit or modify the use of any set of plans. Each franchisee is responsible for selecting the site for each restaurant within their territory. We may assist franchisees in selecting appropriate sites, and any selection made by a franchisee is subject to our approval. We also conduct a physical inspection, review any proposed lease or purchase agreement and make available demographic and other studies. Domestic Franchise Arrangements. Generally, franchise arrangements consist of a development agreement and separate franchise agreements. Development agreements grant the exclusive right to

9
develop a number of restaurants in a designated geographical area. The term of a domestic development agreement is generally 20 years. The development agreements contain provisions which allow for the continued development of the Applebee’s concept and support our long-term expectation of at least 3,000 restaurants in the United States. The franchisee enters into a separate franchise agreement for the operation of each restaurant. Our standard franchise agreement has a term of 20 years and permits renewal for up to an additional 20 years upon payment of an additional franchise fee. For each restaurant developed, our standard franchise arrangement requires an initial franchisee fee of $35,000 and a royalty fee equal to 4% of the restaurant’s monthly net sales. We have executed agreements with a majority of our franchisees for restaurants opened before January 1, 2000, which maintain the existing royalty rate of 4% and extend the initial term of the franchise agreements until 2020. The terms, royalties and advertising fees under a limited number of franchise agreements and the remaining franchise fees under older development agreements vary from the currently offered arrangements. Marketing. We currently require domestic franchisees to contribute 2.75% of their gross sales to the national marketing pool and to spend at least 1% of their gross sales on local marketing and promotional activities. Under our current franchise agreements, we have the ability to increase the amount of the required combined contribution to the national marketing pool and the amount required to be spent on local marketing and promotional activities to a maximum of 5% of gross sales. Training and Support. We provide ongoing advice and assistance to franchisees in connection with the operation and management of each restaurant through training sessions, meetings, seminars, on-premises visits and by written or other material. We also assist franchisees on request with business planning, restaurant development, technology and human resource efforts. Operations Quality Control. We continuously monitor franchise restaurant operations, principally through our full-time Franchise Area Directors (30 as of December 31, 2006) and our Directors of Franchise Operations (five as of December 31, 2006). Company and third-party representatives make both scheduled and unannounced inspections of restaurants to ensure that only approved products are in use and that our prescribed operations practices and procedures are being followed. During 2006, these representatives made an average of two visits to each of our franchise restaurants during which they conducted an inspection and consultation in the restaurant. We have the right to terminate a franchise agreement if a franchisee does not operate and maintain a restaurant in accordance with our requirements. Franchise Business Council. We maintain a Franchise Business Council which provides us with input about operations, marketing, product development and other aspects of restaurant operations for the purpose of improving the franchise system. As of December 31, 2006, the Franchise Business Council consisted of seven franchisee representatives and two members of our senior management team. One franchisee representative is a permanent member. Franchisees elect the franchisee representatives annually. The Franchise Business Council is also responsible for the appointment of members to advisory committees related to marketing, supply chain, information technology and food development. Franchise Financing. Although financing is the sole responsibility of the franchisee, we make available to franchisees information about financial institutions interested in financing the costs of restaurant development for qualified franchisees. None of these financial institutions is our affiliate or agent, and we have no control over the terms or conditions of any financing arrangement offered by these financial institutions. In 2004, we arranged for a third-party financing company to provide up to $250,000,000 to qualified franchisees for loans to fund development of new restaurants through October 2007, subject to our approval. We will provide a limited guarantee of 10% of certain loans advanced under this program. We

10
will be released from our guarantee if certain operating results are met after the restaurant has been open for at least two years. As of December 31, 2006, there were loans outstanding to five franchisees for approximately $65,800,000 under this program. International Development International Franchise Arrangements. We continue to pursue franchising of the Applebee’s concept as the primary method of international expansion. This strategy includes seeking qualified franchisees with the resources to open multiple restaurants in each territory and those familiar with the specific local business environment. We currently are focusing on international franchising primarily in Canada, Central and South America, the Mediterranean/Middle East and Mexico. We currently have 31 international franchisees. These franchisees operated 89 restaurants as of December 31, 2006. The success of further international expansion will depend on, among other things, local acceptance of the Applebee’s concept and our ability to attract qualified franchisees and operating personnel. Our franchisees must comply with the regulatory requirements of the local jurisdictions. We work closely with our international franchisees to develop and implement the Applebee’s system outside the United States, recognizing commercial, cultural and dietary diversity. These local issues involve the need to be flexible and pragmatic on all elements of the system, including menu, restaurant design, restaurant operations, training, marketing, purchasing and financing. Employees As of December 31, 2006, we employed approximately 32,600 full and part-time associates. Of those, approximately 680 were corporate personnel, 2,120 were restaurant managers or managers in training and 29,800 were employed in non-management full and part-time restaurant positions. Of the 680 corporate associates, approximately 240 were in management positions and 440 were general office associates, including part-time associates. We consider our associate relations to be good. Most associates, other than restaurant management and corporate personnel, are paid on an hourly basis. We strive to provide working conditions and wages that compare favorably with those of our competition. We have never experienced a work stoppage due to labor difficulty, and our associates are not covered by a collective bargaining agreement. Service Marks We own the rights to the “Applebee’s Neighborhood Grill & Bar®” service mark and certain variations thereof and to other service marks used in our system in the United States and in various foreign countries. We are aware of names and marks similar to our service marks used by third parties in certain limited geographical areas. We intend to protect our service marks by appropriate legal action when necessary.

11
Executive and Other Senior Officers of the Registrant Our executive and other senior officers as of February 23, 2007 are shown below.
Name Age Position David L. Goebel ................. 56 Chief Executive Officer and President, and Member of the
Board of Directors Steven K. Lumpkin............. 52 Executive Vice President, Chief Financial Officer and Treasurer,
and Member of the Board of Directors Carin L. Stutz ..................... 50 Executive Vice President of Operations Stanley M. Sword ............... 45 Executive Vice President and Chief People Officer George S. Williams ............ 54 Executive Vice President and Chief Marketing Officer Rohan St. George ............... 47 President of International Division Philip R. Crimmins............. 55 Senior Vice President of Development Michael Czinege................. 53 Senior Vice President and Chief Information Officer Kurt Hankins ...................... 47 Senior Vice President of Menu Development and Innovation David R. Parsley................. 60 Senior Vice President of Supply Chain Management Carol A. DiRaimo............... 45 Vice President of Investor Relations Beverly O. Elving............... 53 Vice President and Controller Rebecca R. Tilden .............. 51 Vice President, General Counsel and Secretary
David L. Goebel was employed by Applebee’s in February 2001 as Senior Vice President of Franchise Operations and was promoted to Executive Vice President of Operations in December 2002. In January 2004, Mr. Goebel was promoted to Chief Operating Officer. In January 2005, he was also named President. In January 2006, Mr. Goebel was named to the Board of Directors and he assumed additional responsibilities including serving as principal executive officer. In September 2006, Mr. Goebel was named Chief Executive Officer. Prior to joining Applebee’s, Mr. Goebel headed a management company that provided consulting and strategic planning services to various businesses from April 1998 to February 2001. Prior to 1998, he was a franchise principal with an early developer group of the Boston Market concept. Mr. Goebel’s business experience also includes positions as Vice President of Business Development for Rent-a-Center (a subsidiary of Thorn, EMI) and Vice President of Operations for Ground Round restaurants. Steven K. Lumpkin was employed by Applebee’s in May 1995 as Vice President of Administration. In January 1996, he was promoted to Senior Vice President of Administration. In November 1997, he assumed the position of Senior Vice President of Strategic Development and in January 1998 was promoted to Executive Vice President of Strategic Development. He was named Chief Development Officer in March 2001. In March 2002, Mr. Lumpkin assumed the position of Chief Financial Officer and Treasurer. In January 2004, he was appointed to the Board of Directors. Prior to joining Applebee’s, Mr. Lumpkin was a Senior Vice President of a division of the Olsten Corporation, Kimberly Quality Care, from July 1993 until January 1995. From June 1990 until July 1993, Mr. Lumpkin was an Executive Vice President and a member of the board of directors of Kimberly Quality Care. From January 1978 until June 1990, Mr. Lumpkin was employed by Price Waterhouse LLP, where he served as a management consulting partner and certified public accountant. Carin L. Stutz was employed by Applebee’s in November 1999 as Senior Vice President of Company Operations. In January 2005, she was promoted to Executive Vice President of Operations. Prior to joining Applebee’s, Ms. Stutz was Division Vice President with Wendy’s International from July 1994 to November 1999. From 1993 to 1994, she was Regional Operations Vice President for Sodexho, USA. From 1990 to 1993, Ms. Stutz was employed by Nutri/System, Inc. as Vice President of Corporate Operations. Prior to 1990, Ms. Stutz was employed for 12 years with Wendy’s International.

12
Stanley M. Sword was employed by Applebee’s in August 2005 as Executive Vice President and Chief People Officer. Prior to joining Applebee’s, Mr. Sword was employed for seven years as an executive with Cerner Corporation. He was hired in August 1998 as Senior Vice President and Chief People Officer and became President of Cerner’s Great Lakes region in August 2003. Prior to Cerner, Mr. Sword spent five years with AT&T including three years as the Vice President of Organization Development of NCR Corporation and two years as a client partner in the outsourcing practice of AT&T Solutions. Prior to joining AT&T, Mr. Sword spent 10 years with Andersen Consulting, a division of Arthur Andersen & Co., in a variety of roles within their systems integration practice. George S. Williams was employed by Applebee’s in February 2007 as Executive Vice President and Chief Marketing Officer. From 2002 until joining Applebee’s, Mr. Williams was an independent marketing consultant and founder of Williams Enterprises. From 1997 to 2002, Mr. Williams was Senior Vice President of U.S. Marketing for Blockbuster, Inc. Mr. Williams spent seven years in corporate brand marketing positions with Pearle Vision, Inc., where he was Vice President of Field Marketing and Sales, Long John Silver’s, where he was Vice President of Advertising and Promotions, and Days Inns of America Inc., where he was Vice President of Marketing. Mr. Williams also has 12 years of advertising agency experience with Marc U.S.A. Rohan M. St. George was employed by Applebee’s in November 2004 as President of the International Division. Prior to joining Applebee’s, Mr. St. George was a managing director for Yum! Restaurants International which included responsibility for Puerto Rico, the U.S. Virgin Islands and Venezuela. From 1998 to 2003, he was Vice President of Global Operations for KFC, Pizza Hut and Taco Bell. Prior to 1998, Mr. St. George had 14 years operations experience with Pizza Hut and KFC in various management positions. Philip R. Crimmins was employed by Applebee’s in August 2002 as Vice President of Operations Excellence. In September 2003, Mr. Crimmins was promoted to Senior Vice President of Development. Prior to joining Applebee’s, he was employed by Pizza Hut, Inc. for 27 years, most recently as Vice President of Service Strategies. While at Pizza Hut, Inc., Mr. Crimmins held several other positions of increasing responsibility, including senior leadership positions in research and development, concept development, customer satisfaction, field training and restaurant operations. Michael Czinege was employed by Applebee’s in April 2004 as Senior Vice President and Chief Information Officer. Prior to joining Applebee’s, Mr. Czinege was Executive Vice President of North American operations for Celerant Consulting. From 1996 to 2004, he was a partner and later Vice President of Cap Gemini Ernst & Young, one of the world’s leading providers of consulting, technology and outsourcing services. Mr. Czinege has nearly three decades of industry and consulting experience in manufacturing and supply chain management operations, business planning, sales and marketing, and information systems. Kurt Hankins was employed by Applebee’s in August 2001 as Vice President of Research and Development. In December 2003, Mr. Hankins was promoted to Senior Vice President of Menu Development and Innovation. Prior to joining Applebee’s, he served as Vice President of Food and Beverage for Darden Restaurants, Inc. from July 1999 through July 2001. From August 1994 to July 1999, he served as Director of Food Research and Development for Darden Restaurants, Inc. Prior to his employment with Darden Restaurants, Inc., he held various positions in food and beverage research and development within the restaurant industry. David R. Parsley was employed by Applebee’s in April 2000 as Senior Vice President of Purchasing and Distribution. In January 2003, Mr. Parsley was named Senior Vice President of Supply Chain Management. Prior to joining Applebee’s, Mr. Parsley held several positions with Prandium, Inc., operator of El Torito, Chi-Chi’s and Koo Koo Roo, from November 1996 to April 2000, most recently as
13
Senior Vice President of Quality and Supply Chain Management. He has also held purchasing positions with The Panda Management Company, Carl Karcher Enterprises, Proficient Food Company, Inc. and Baxter Healthcare Corporation. Carol A. DiRaimo was employed by Applebee’s in November 1993 as Associate Director of Financial Planning and Reporting and was promoted to Director in 1995. She was named Director of Treasury and Corporate Analysis in 1998 and Director of Investor Relations and Corporate Analysis in April 2000. She was promoted to Executive Director of Investor Relations in January 2003 and Vice President of Investor Relations in February 2004. Prior to joining Applebee’s, she was employed by Gilbert/Robinson, Inc. from May 1989 to November 1993. Ms. DiRaimo, a certified public accountant, was also employed by Deloitte Haskins & Sells for six years. Beverly O. Elving was employed by Applebee’s in June 1998 as Director of Corporate Accounting. In September 2002, Ms. Elving was promoted to Vice President of Accounting. In February 2005, she was named Vice President and Controller. Prior to joining Applebee’s, she was Chief Financial Officer from 1996 to 1998 for Integrated Medical Resources, a publicly-held management services company. From 1990 to 1996, Ms. Elving was employed by the Federal Deposit Insurance Corporation as Director of Financial Operations and was later promoted to Vice President of Financial Operations & Accounting. Ms. Elving, a certified public accountant, was also employed by Arthur Andersen & Co. for five years. Rebecca R. Tilden was employed by Applebee’s in November 2003 and became Vice President and General Counsel in January 2004. Prior to joining Applebee’s, Ms. Tilden was an independent consultant specializing in corporate compliance and ethics issues. From 1987 to 2000, Ms. Tilden was employed by Aventis Pharmaceuticals, Inc. in various positions of increasing responsibility and served most recently as Vice President, Assistant General Counsel and Secretary. Item 1A. Risk Factors Our business and operations are subject to a number of risks and uncertainties. Listed below are important factors that could cause actual results to differ materially from our historical results and from those projected in forward-looking statements contained in this report or in other filings with the SEC. We and our franchisees may not be successful in operating restaurants profitably, generating positive operating cash flows and generating acceptable returns on invested capital.
Our financial success depends on our ability and the ability of our franchisees to operate restaurants profitably, to generate positive cash flows and to generate acceptable returns on invested capital. The returns and profitability of our restaurants may be negatively impacted by a number of factors. The most significant are:
• Declines in comparable store sales growth rates due to: o failing to consistently provide high quality products and innovate new products to retain
the existing customer base and attract new customers; o competitive intrusion in a market; o opening new restaurants that may cannibalize the sales of existing restaurants; and o less than effective national and local marketing.
• Negative trends in operating expenses such as: o increases in food costs including rising commodity costs; o increases in labor costs including increases in minimum wage and other employment
laws, immigration reform, increases due to tight labor market conditions, health care and workers compensation costs; and

14
o increases in other operating costs including utilities, lease-related expenses and credit card processing fees.
• Our inability to open new restaurants at acceptable sales volumes. • Our inability to increase menu pricing to offset increased operating expenses. • Negative trends in other expenses such as interest rates and the cost of construction materials that
will affect our ability to maintain and refurbish existing stores. • Our ability to manage a large number of restaurants that may be impacted by unanticipated
changes in executive management, and availability of qualified restaurant management, staff and other personnel.
• Our ability to operate effectively in new and/or highly competitive geographic regions or local markets in which we have limited operating experience.
• Our ability to manage a large number of restaurants in many geographic areas with a standardized operational and marketing approach.
Our profitability could be adversely impacted by economic, demographic and other changes that impact guest traffic. Our business is affected by changes in consumer tastes and by national, regional and local economic conditions, demographic trends and traffic patterns near our restaurants. We can also be adversely affected by publicity resulting from actual or alleged food quality, illness, injury or other health concerns or operating issues related to restaurant operations or from food suppliers. Our profitability depends upon maintaining and growing the value of the Applebee’s brand. Our business is dependent upon guest perceptions of the Applebee’s brand. Management believes it must preserve and grow the value of the Applebee’s brand to be successful in the future. Brand value is based upon actual guest experiences as well as consumer perceptions regarding a variety of subjective qualities, and can be damaged by isolated business incidents that erode consumer trust, particularly if the incidents receive considerable publicity or result in litigation. Increased competition for locations, customers and staff could adversely impact our profitability. Competition in the casual dining segment of the restaurant industry is expected to remain intense with respect to price, service, location, concept and the type and quality of food. There is also intense competition for real estate sites, qualified management personnel and hourly restaurant staff. Our competitors include national, regional and local chains, as well as local owner-operated restaurants. There are a number of well-established competitors, some of which have been in existence for a longer period than us and may be better established in the markets where our restaurants are or may be located. Our future leverage could have an effect on our operations. Our Board of Directors is reviewing various strategic alternatives to enhance shareholder value. While no decision as to any particular course of action has been made, some of the alternatives under review could lead us to increase our debt. Increased leverage and debt service obligations could have the following consequences:
• We may be more vulnerable in the event of deterioration in our business, in the restaurant industry or in the economy generally. In addition, we may be limited in our flexibility in planning for, or reacting to, changes in our business and the industry in which we operate.
• We may be required to dedicate a substantial portion of our cash flow to the payment of interest or principal on our indebtedness, which could reduce the amount of funds available for operations

15
and thus place us at a competitive disadvantage as compared with competitors that are less highly leveraged.
• From time to time, we may engage in various capital markets, bank credit and other financing activities to meet our cash requirements. We may have difficulty obtaining additional financing at economically acceptable interest rates.
• Our new revolving credit facility contains, and any future debt obligations may contain, certain negative covenants including limitations on liens, consolidations and mergers, indebtedness, capital expenditures, asset dispositions, sale-leaseback transactions, dividends and stock repurchases.
We and our franchisees may not be successful in opening additional restaurants. Our continued growth depends, in part, on our ability and the ability of our franchisees to open additional restaurants. The opening of new restaurants, both by us and our franchisees, depends on a number of factors, many of which are beyond our control or the control of our franchisees. The most significant factors are:
• the cost and availability of suitable restaurant locations; • acceptable leasing or financial terms; • the availability of capital to finance growth; • cost-effective and timely construction of restaurants (construction can be delayed due to, among
other reasons, labor disputes, local zoning and licensing matters and weather conditions); and • securing required governmental permits and licenses.
Substantial increases in capital expenditure costs may adversely impact future growth. Our capital expenditures are primarily related to the development or acquisition of additional restaurants, maintenance and refurbishment of existing restaurants, and expansion of information technology systems and other corporate infrastructure. The costs related to restaurant development, maintenance and refurbishment include purchases and leases of land, buildings, equipment, and repairs and maintenance. The labor and material costs expended vary by geographical location and are subject to general price increases. There can be no assurance that future capital expenditure costs will not increase. In addition, capital expenditures will be required to maintain and refurbish restaurants as they age. There can be no assurance that we will remain profitable in these restaurants even after maintenance and refurbishment has been completed. Our continued growth is, in part, dependent upon our ability to find and retain qualified franchisees and for those franchisees to operate restaurants profitably in compliance with our standards, build new restaurants and plan for succession. Although we have established criteria to evaluate prospective franchisees, there can be no assurance that our existing or future franchisees will have the business abilities or access to financial resources necessary to open restaurants or that they will successfully develop or operate these restaurants in their franchise areas in a manner consistent with our standards. We intend to continue our efforts to franchise restaurants in certain international territories. The ability of franchisees to open and operate restaurants outside of the United States is subject to the same factors as are applicable to opening domestic restaurants described above, as well as factors related to additional legal, regulatory, cultural acceptability and building design issues involved in international locations. There can be no assurance that we will be able to attract qualified franchisees or that such franchisees will be able to open and operate restaurants successfully.

16
Further penetrating existing mature markets could impact the sales and profitability of our existing restaurants in those markets. Part of our restaurant development may occur in more mature markets. Our restaurants typically attract customers within a limited trade area. Sales and profitability of existing restaurants may be negatively impacted by the opening of a restaurant within this trade area. The impact of government regulation may cause us to incur additional costs or liabilities. Our restaurants are subject to various foreign, federal, state and local government regulations, including those related to the sale of food and alcoholic beverages and labor laws. Failure to obtain or maintain the necessary licenses, permits and approvals, including food and liquor licenses, could adversely affect our operating results or delay or result in our decision to cancel the opening of new restaurants. Local authorities may suspend or deny renewal of our food and liquor licenses if they determine that our conduct does not meet applicable standards or if there are changes in regulations in which we are unable to comply. We are subject to “dram shop” statutes in some states. These statutes generally allow a person injured by an intoxicated person to recover damages from an establishment that wrongfully served alcoholic beverages to the intoxicated person. A judgment substantially in excess of our insurance coverage could harm our financial condition. Various federal and state labor laws related to employment eligibility, minimum wage requirements, overtime pay, meal and rest breaks and other matters have an effect on our operating costs. Changes in these laws, including additional government-imposed increases in minimum wages, overtime pay, paid leaves of absence and mandated health benefits, and increased tax reporting and tax payment requirements for associates who receive tips, or a reduction in the number of states that allow tips to be credited toward minimum wage requirements could harm our operating results. The federal Americans with Disabilities Act prohibits discrimination on the basis of disability in public accommodations and employment. Although our restaurants are designed to be accessible to the disabled, we could be required to make additional modifications to our restaurants to provide service to, or make reasonable accommodations for, disabled persons. We are also subject to various federal and state environmental regulations that could delay or prevent development of new restaurants in certain locations. We are also subject to foreign, federal and state laws that regulate the offer and sale of franchises and the relationship with our franchisees. These laws and regulations, together with decisions of several state and federal courts, may limit our ability to enforce certain provisions of, or alter or terminate, our franchise agreements. A significant increase in litigation could have a material adverse effect on our results of operations, financial condition and business prospects. We are subject to complaints or litigation from guests alleging illness, injury or other food quality, health or operational concerns. Adverse publicity resulting from these allegations could harm the operation and profitability of our restaurants, regardless of whether the allegations are valid, whether we are liable or whether the claim involves our restaurants or one of our franchisees. Failure to comply with the various federal and state labor laws pertaining to minimum wage, overtime pay, meal and rest breaks, unemployment tax rates, workers’ compensation rates, citizenship or residency requirements, child labor requirements and sales taxes may have a material adverse effect on our business

17
or operations. Further, employee claims based on, among other things, discrimination, harassment or wrongful termination may divert our financial and management resources and adversely affect our operations. Our growth and profitability could be impacted by the lack of needed inventories. Our profitability depends, in part, on our strategies to control food costs. Our dependence on commodities subjects us to the risk that shortages or interruption in supply, caused by adverse weather or other conditions, could negatively affect the availability, quality or cost of ingredients. Changes in the price of commodities, particularly beef and chicken, could materially impact our profitability. We may not be able to react to increased food costs by adjusting our supply chain practices or menu pricing which would negatively impact our operating results. Our global supply chain may be subject to interruptions, dislocation or may be rendered less effective for a variety of reasons such as:
• political unrest; • animal borne disease or illness; • contamination of growing fields, water supplies or animal processing facilities; • inadequate storage facilities; and • loss of effective climate controls in storage facilities and processing plants.
Our continued growth depends on our successful adaptation and implementation of our operating systems. System-wide expansion has and will continue to require the implementation of enhanced operating systems. There can be no assurance that we will be able to anticipate, invest in and effectively manage the information technology and logistical resources necessary to support the growth of our business. Our future growth may depend, in part, on our acquisition of Applebee’s restaurants from our franchisees. We may acquire Applebee’s restaurants from our franchisees. There is no assurance that we will be able to acquire franchise restaurants at favorable prices. In addition, if we complete acquisitions in the future, the acquisitions may involve the following risks:
• increases in our debt and contingent liabilities; • entry into geographic markets in which we have little or no direct prior experience; and • unanticipated or undiscovered legal liabilities or other obligations of acquired franchise
restaurants.
Even if we are successful in acquiring franchise operations, there is no assurance that we will be able to operate the acquired restaurants profitably. The integration of acquired restaurants into our operations may involve a number of issues, any of which could materially and adversely affect our operations and financial performance. These issues include:
• burdens on our management resources; • diversion of cash flows; • acquisition integration issues, such as business process and system incompatibilities; • potential loss of key personnel of acquired franchise restaurants; and • potential loss of customer relationships and related revenues.

18
Item 1B. Unresolved Staff Comments Not applicable. Item 2. Properties As of December 31, 2006, we operated 521 company restaurants. Of these, we leased the building for 86 sites, owned the building and leased the land for 230 sites, and owned the land and building for 205 sites. In addition, as of December 31, 2006, we owned five sites for future development of restaurants and had entered into 11 lease agreements for restaurant sites we plan to open during 2007. Our leases generally have an initial term of 10 to 20 years, with renewal terms of 5 to 20 years, and provide for a fixed rental plus, in certain instances, percentage rentals based on gross sales. In addition, our leases in many instances include escalation of rent payments during the initial term and/or during the renewal terms. Our company-owned restaurants have an average of 4,940 square feet and seat an average of 168 guests. Under our franchise agreements, we have certain rights to gain control of a restaurant site in the event of default under the franchise agreement. We own an 80,000 square foot office building and lease a 23,000 square foot office building in Overland Park, Kansas, located in the Kansas City metropolitan area, in which our corporate offices are headquartered. In September 2006, we began to actively market our existing 80,000 square foot headquarters under a plan approved by management. We also lease office space in certain regions in which we operate restaurants. In January 2006, we purchased land for a new corporate headquarters in Lenexa, Kansas, located in the Kansas City metropolitan area. We anticipate relocating to our new corporate headquarters in the fourth quarter of 2007.

19
The following table sets forth the 49 states, 16 countries outside of the United States and one U.S. territory in which Applebee’s are located and the number of restaurants operating in each state or country as of December 31, 2006:
Number of Restaurants State or Country Company Franchise Total System
Domestic: Alabama ........................................ — 28 28 Alaska ........................................... — 2 2 Arizona.......................................... — 32 32 Arkansas........................................ 2 9 11 California ...................................... 25 87 112 Colorado........................................ — 31 31 Connecticut ................................... — 11 11 Delaware ....................................... 3 8 11 Florida........................................... — 106 106 Georgia.......................................... — 71 71 Idaho ............................................. — 10 10 Illinois ........................................... 13 54 67 Indiana .......................................... 7 58 65 Iowa .............................................. — 25 25 Kansas........................................... 16 19 35 Kentucky....................................... 5 31 36 Louisiana....................................... — 16 16 Maine ............................................ 11 — 11 Maryland....................................... 12 14 26 Massachusetts ............................... 38 — 38 Michigan ....................................... 67 21 88 Minnesota...................................... 63 2 65 Mississippi .................................... 3 13 16 Missouri ........................................ 61 2 63 Montana ........................................ — 7 7 Nebraska ....................................... — 19 19 Nevada .......................................... 15 — 15 New Hampshire ............................ 16 — 16 New Jersey .................................... — 50 50 New Mexico.................................. 8 10 18 New York...................................... 1 94 95 North Carolina .............................. 2 53 55 North Dakota................................. — 10 10 Ohio .............................................. — 92 92 Oklahoma...................................... — 19 19 Oregon .......................................... — 17 17 Pennsylvania ................................. 1 63 64 Rhode Island ................................. 8 — 8 South Carolina .............................. — 41 41 South Dakota................................. — 7 7 Tennessee...................................... 5 39 44 Texas............................................. 60 34 94 Utah............................................... — 15 15 Vermont ........................................ 3 — 3 Virginia ......................................... 70 2 72 Washington ................................... — 36 36 West Virginia ................................ 2 14 16 Wisconsin...................................... 4 43 47 Wyoming ...................................... — 5 5 Total Domestic............................ 521 1,320 1,841
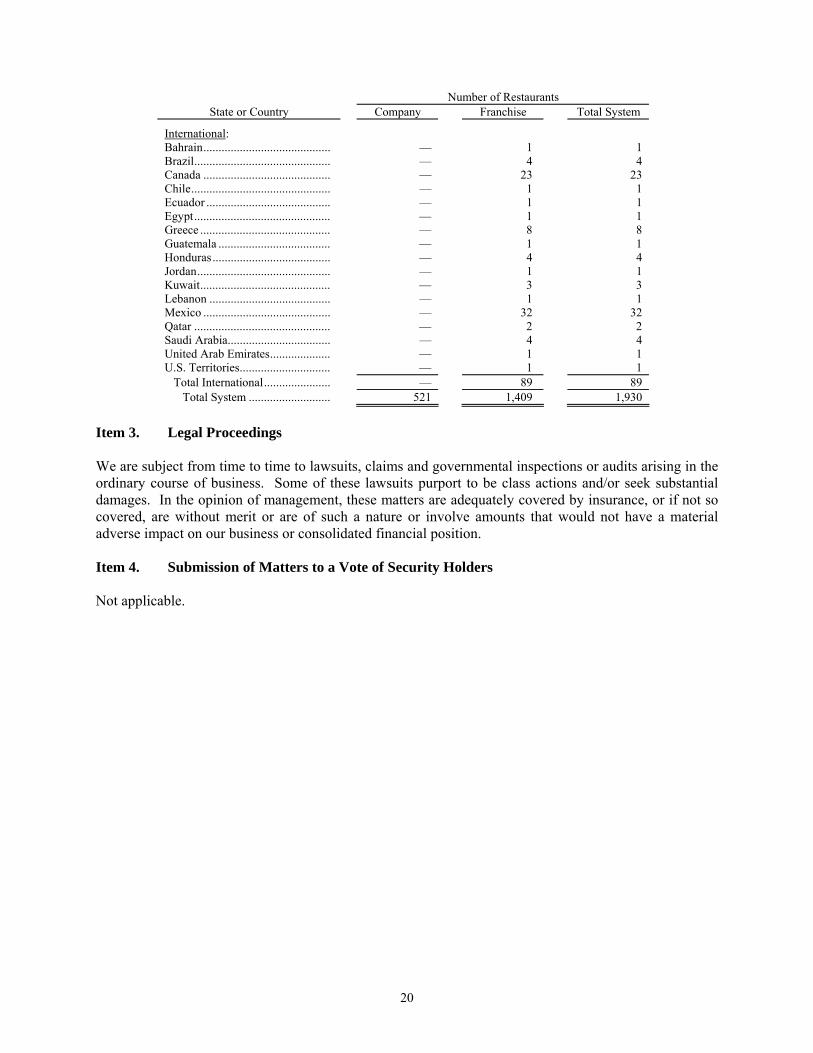
20
Number of Restaurants
State or Country Company Franchise Total System
International: Bahrain.......................................... — 1 1 Brazil............................................. — 4 4 Canada .......................................... — 23 23 Chile.............................................. — 1 1 Ecuador ......................................... — 1 1 Egypt............................................. — 1 1 Greece ........................................... — 8 8 Guatemala ..................................... — 1 1 Honduras....................................... — 4 4 Jordan............................................ — 1 1 Kuwait........................................... — 3 3 Lebanon ........................................ — 1 1 Mexico .......................................... — 32 32 Qatar ............................................. — 2 2 Saudi Arabia.................................. — 4 4 United Arab Emirates.................... — 1 1 U.S. Territories.............................. — 1 1 Total International...................... — 89 89 Total System ........................... 521 1,409 1,930
Item 3. Legal Proceedings We are subject from time to time to lawsuits, claims and governmental inspections or audits arising in the ordinary course of business. Some of these lawsuits purport to be class actions and/or seek substantial damages. In the opinion of management, these matters are adequately covered by insurance, or if not so covered, are without merit or are of such a nature or involve amounts that would not have a material adverse impact on our business or consolidated financial position. Item 4. Submission of Matters to a Vote of Security Holders Not applicable.

21
PART II
Item 5. Market for Registrant’s Common Equity, Related Stockholder Matters and Issuer Purchases of Equity Securities 1. Our common stock trades on The NASDAQ Global Select Market under the symbol APPB.
The table below sets forth for the fiscal quarters indicated the reported high and low sale prices of our common stock, as reported on The NASDAQ Global Select Market.
2006 2005 High Low High Low First Quarter $ 26.47 $ 21.62 $ 29.19 $ 24.69 Second Quarter $ 25.04 $ 19.43 $ 28.65 $ 24.25 Third Quarter $ 23.07 $ 17.29 $ 26.79 $ 19.95 Fourth Quarter $ 25.47 $ 20.77 $ 23.98 $ 19.73
2. Number of stockholders of record at February 23, 2007: 1,279
3. We declared an annual dividend of $0.22 per common share on December 7, 2006 for stockholders of record on December 22, 2006, and the dividend was paid on January 22, 2007. We declared an annual dividend of $0.20 per common share in October 2005 for stockholders of record on December 23, 2005, and the dividend was paid on January 23, 2006.
We presently anticipate continuing the payment of cash dividends which will be dependent upon future earnings and cash flows, capital requirements, our financial condition, returns to shareholders and certain other factors. There can be no assurance in 2007 or future years as to the amount that will be available for the declaration of dividends, if any.
4. For information on our equity compensation plans, refer to Item 12, “Security Ownership of Certain Beneficial Owners and Management and Related Stockholder Matters.”
5. Issuer Purchases of Equity Securities
During fiscal 2006, we repurchased 1,760,506 shares of our common stock at an average price of $21.88 for an aggregate cost of approximately $38,522,000. The table below sets forth purchases of our common stock during the fourth quarter of fiscal 2006:
Purchases of Equity Securities(1)
(a) (b) (c) (d)
Period
Total Number
of Shares Purchased
Average
Price Paid Per Share
Total Number of Shares Purchased as Part of Publicly Announced Plans or Programs
Maximum Dollar Value of Shares that May Yet Be Purchased Under
the Plans or Programs (in thousands)
September 25, 2006 through October 22, 2006
4,200
$20.96
4,200
$101,351
October 23, 2006 through November 19, 2006
20,800
$23.97
20,800
$250,852
November 20, 2006 through December 31, 2006
449,606
$23.15
449,606
$240,445
Total 474,606 474,606
(1) In October 2005, our Board of Directors authorized repurchases of our common stock of up to $175,000,000 during 2005 and 2006, subject to market conditions. In November 2006, with approximately $100,000,000 of the previous authorization remaining, our Board of Directors authorized additional repurchases of our common stock of up to $150,000,000, subject to market conditions, for a total of approximately $250,000,000 in authorized repurchases.

22
6. Performance Graph
The following graph compares the annual change in our cumulative total stockholder return for the five fiscal years ended December 31, 2006 (December 30, 2001 to December 31, 2006) based upon the market price of our common stock, compared with the cumulative total return on the NASDAQ Market Index and the Hemscott Group Index assuming $100 was invested and dividends were reinvested. The NASDAQ Market Index includes both domestic and foreign companies that trade on the NASD Capital, NASD Global and NASD Global Select Markets. The Hemscott Group Index includes approximately 80 restaurant companies.
Comparison of five-year cumulative total return among Applebee’s International, Inc.,
NASDAQ Market Index and Hemscott Group Index
$0
$25
$50
$75
$100
$125
$150
$175
$200
2001 2002 2003 2004 2005 2006
APPLEBEE'S INTERNATIONAL, INC. HEMSCOTT GROUP INDEXNASDAQ MARKET INDEX
Source: Hemscott Industry Group
Measurement Period
Company/Index/Market December 30,
2001 December 29,
2002
December 28, 2003
December 26, 2004
December 25, 2005
December 31, 2006
Applebee’s International, Inc. ........... $ 100.00 $ 103.72 $ 169.81 $ 167.92 $ 153.78 $ 166.10 Hemscott Group Index ...................... $ 100.00 $ 79.82 $ 109.90 $ 134.23 $ 142.81 $ 175.65 NASDAQ Market Index.................... $ 100.00 $ 69.75 $ 104.88 $ 113.70 $ 116.19 $ 128.12

23
Item 6. Selected Financial Data The following table sets forth our selected financial data for the periods and the dates indicated. Fiscal 2006 contained 53 weeks. Fiscal 2002 through 2005 each contained 52 weeks. The following should be read in conjunction with the Consolidated Financial Statements and Notes thereto and “Management’s Discussion and Analysis of Financial Condition and Results of Operations” appearing elsewhere in this Form 10-K.
Fiscal Year Ended December 31,
2006(1) December 25,
2005 December 26,
2004 December 28,
2003 December 29,
2002 STATEMENT OF EARNINGS DATA:
(in thousands, except per share amounts)
Company restaurant sales......................... $ 1,196,258 $ 1,082,641 $ 976,798 $ 867,158 $ 724,616 Franchise royalties and fees ..................... 139,855 128,813 121,221 109,604 102,180 Other franchise income ............................ 1,808 5,196 13,615 13,147 2,688 Total operating revenues................... $ 1,337,921 $ 1,216,650 $ 1,111,634 $ 989,909 $ 829,484
Operating earnings ................................... $ 130,784 $ 157,637 $ 165,280 $ 152,677 $ 126,590 Net earnings ............................................. $ 80,906 $ 101,802 $ 110,865 $ 94,349 $ 80,527 Basic net earnings per share..................... $ 1.09 $ 1.29 $ 1.36 $ 1.14 $ 0.97 Diluted net earnings per share.................. $ 1.08 $ 1.27 $ 1.33 $ 1.10 $ 0.94 Dividends declared per share ................... $ 0.22 $ 0.20 $ 0.06 $ 0.05 $ 0.04 Basic weighted average shares outstanding............................................
74,001
78,650
81,528
82,944
83,407
Diluted weighted average shares outstanding............................................
74,936
80,010
83,600
85,409
85,382
BALANCE SHEET DATA (AT END OF FISCAL YEAR):
Total assets............................................... $ 935,456 $ 878,588 $ 754,431 $ 651,078 $ 573,647 Long-term debt, including current portion, and notes payable ........
$ 175,185
$ 188,367
$ 35,694
$ 20,862
$ 52,563
Stockholders’ equity ................................ $ 486,654 $ 412,610 $ 496,727 $ 453,143 $ 385,201
(1) Beginning in 2006, we began recording stock-based compensation expense in accordance with Statement of Financial Accounting Standards No. 123(R), “Stock-Based Compensation”.
24
Item 7. Management’s Discussion and Analysis of Financial Condition and Results of Operations
Forward-Looking Statements The statements contained in the “Management’s Discussion and Analysis of Financial Condition and Results of Operations” section regarding restaurant development, comparable sales, revenue growth, restaurant margins, commodity costs, general and administrative expenses, capital expenditures, return on equity and financial commitments are forward-looking and based on current expectations. There are several risks and uncertainties that could cause actual results to differ materially from those described. These risks include, but are not limited to, our ability and the ability of our franchisees to open and operate additional restaurants profitably and generate positive operating cash flows and return on invested capital, the impact of economic and demographic factors on consumer spending, maintaining and growing the value of the Applebee’s brand, the impact of intense competition in the casual dining segment of the restaurant industry, the impact of future leverage on our operations, the failure to open the restaurants anticipated, the impact of increases in capital expenditure costs on future development, our ability to attract and retain qualified franchisees, and the impact of further penetration of restaurants in existing markets. For a more detailed discussion of the principal factors that could cause actual results to be materially different, you should read our risk factors in Item 1A of this Form 10-K. We disclaim any obligation to update forward-looking statements. General We operate on a 52 or 53 week fiscal year ending on the last Sunday in December. Our fiscal years are as follows:
Fiscal Year
Fiscal Year Ending
Number of Weeks
2004 December 26, 2004 52 2005 December 25, 2005 52 2006 December 31, 2006 53 2007 December 30, 2007 52
Our operating revenues are generated from three primary sources: • Company restaurant sales (food and beverage sales) • Franchise royalties and fees • Other franchise income
Beverage sales consist of sales of alcoholic beverages, while non-alcoholic beverages are included in food sales. Franchise royalties are generally 4% of each franchise restaurant’s monthly gross sales. Franchise fees typically are $35,000 for each restaurant opened. Other franchise income includes revenue from information technology products and services provided to certain franchisees. In 2005, other franchise income also included insurance premiums for the current year and premium audit adjustments for prior years from franchisee participation in our captive insurance program. In 2006, we discontinued writing insurance coverage for new or existing participants.
25
Certain expenses relate only to company-owned restaurants. These include: • Food and beverage costs • Labor costs • Direct and occupancy costs • Pre-opening expenses Cost of other franchise income includes costs related to information technology products and services provided to certain franchisees. In 2005, cost of other franchise income included the costs related to franchisee participation in our captive insurance program. In 2006, we discontinued writing insurance coverage for new or existing participants. Cost of other franchise income includes costs related to the resolution of claims arising from franchisee participation in our captive insurance program. Other expenses, such as general and administrative and amortization expenses, relate to both company-owned restaurants and franchise operations. Overview Applebee’s International, Inc. and our subsidiaries develop, franchise and operate casual dining restaurants under the name “Applebee’s Neighborhood Grill & Bar®,” which is the largest casual dining concept in the world with over 1,900 system-wide restaurants open as of December 31, 2006(1). The casual dining segment of the restaurant industry is highly competitive and there are many factors that affect our profitability. Our industry is susceptible to changes in economic conditions, trends in lifestyles, fluctuating costs, government regulation, availability of resources and consumer perceptions. When evaluating and assessing our financial performance, we believe there are five key factors: • Development – the number of new company and franchise restaurants opened during the period. Our
expansion strategy has been to cluster restaurants in targeted markets, thereby increasing consumer awareness and convenience, and enabling us to take advantage of operational, distribution and advertising efficiencies. We currently expect that the Applebee’s system will ultimately encompass at least 3,000 restaurants in the United States, as well as the potential for at least 1,000 restaurants internationally. In 2006, we and our franchisees opened 35 and 108 restaurants, respectively. Together, we have opened at least 100 restaurants system-wide each year for the past 14 fiscal years.
• Comparable restaurant sales – a year-over-year comparison of sales for restaurants open at least 18 months. Changes in comparable restaurant sales are driven by changes in the average guest check and/or changes in guest traffic. Average guest check changes result from menu price changes and/or changes in menu mix. During 2006, the impact of menu price increases on company restaurants was approximately 2.2%. Although we may have changes in our average guest check from period to period, our main focus has been increasing guest traffic as we view this component to be more indicative of the long-term health of the Applebee’s brand. We are constantly seeking to increase guest traffic by focusing on improving operations and enhancing our menu with new food and beverage offerings. In 2006, we began implementation of a plan to substantially improve the quality and flavor profile of our food and beverage offerings as a result of comprehensive consumer research we completed in 2005. In 2006, company comparable sales decreased 1.0%, while domestic franchise and domestic system-wide comparable sales decreased 0.5% and 0.6%, respectively. We believe our sales and traffic have been negatively impacted by multiple factors. Lower income households, which represent a significant portion of our guests, have been impacted by higher energy costs and interest rates. The bar and grill category of the restaurant industry has been negatively impacted by increased trade-down to quick-service restaurants. In addition, the supply growth of
(1) Source: Nation’s Restaurant News, “Special Report: Top 100,” June 26, 2006.

26
units opened in the category in 2006 and 2005 has outpaced demand contributing to weaker sales trends.
• Company restaurant margins – company restaurant sales, less food and beverage, labor, direct and occupancy restaurant costs and pre-opening expenses, expressed as a percentage of company restaurant sales. Company restaurant margins are susceptible to fluctuations in commodity costs, labor costs and other operating costs such as utilities. Company restaurant margins were 12.1%, 13.4% and 15.6% in 2006, 2005 and 2004, respectively.
• General and administrative expenses – general and administrative expenses expressed as a percentage of total operating revenues. General and administrative expenses were 10.5%, 9.0% and 9.4% in 2006, 2005 and 2004, respectively. Stock-based compensation included in general and administrative expenses was 1.5%, 0.2%, and 0.1% in 2006, 2005 and 2004, respectively.
• Return on invested capital – net earnings expressed as a percent of average invested capital. We believe this is an important indicator as it allows us to evaluate our ability to create value for our shareholders.
Application of Critical Accounting Policies Management’s Discussion and Analysis of Financial Condition and Results of Operations is based upon our consolidated financial statements, which were prepared in accordance with accounting principles generally accepted in the United States of America. These principles require us to make estimates and assumptions that affect the reported amounts in the consolidated financial statements and notes thereto. Actual results may differ from these estimates, and such differences may be material to our consolidated financial statements. We believe that the following accounting policies involve a significant degree of judgment or complexity. Inventory valuation: We state inventories at the lower of cost, using the first-in, first-out method, or market. Market is determined based upon our estimates of the net realizable value. We may periodically purchase and maintain inventories of certain specialty products to ensure sufficient supplies to the system, to ensure continuity of supply, or to control food costs. We review and make quality control inspections of our inventories to determine obsolescence on an ongoing basis. These reviews require management to make certain estimates and judgments regarding projected usage which may change in the future and may require us to record an inventory impairment. Property and equipment: We report property and equipment at historical cost less accumulated depreciation. Depreciation is provided on the straight-line method over the estimated useful lives of the assets. Leasehold improvements are amortized over the lesser of the lease term or the estimated useful life of the related asset. The useful lives of the assets are based upon management’s expectations. We periodically review the assets for changes in circumstances which may impact their useful lives. If there are changes in circumstances that revise an asset’s useful life, we will adjust the depreciation expense accordingly for that asset in future periods. Stock-based compensation: Beginning in 2006, we account for stock-based compensation in accordance with Statement of Financial Accounting Standards (“SFAS”) No. 123(R), “Share-Based Payment”. As required by SFAS No. 123(R), stock-based compensation is estimated for equity awards at fair value at the grant date. We determine the fair value of equity awards using a binomial model. The binomial model requires various highly judgmental assumptions including the expected life, stock price volatility and the forfeiture rate. If any of the assumptions used in the model change significantly, stock-based compensation expense may differ materially in the future from that recorded in the current period.
27
Impairment and other restaurant closure costs: We periodically review restaurant property and equipment for impairment on a restaurant-by-restaurant basis using certain market and restaurant operating indicators including historical cash flows as well as current estimates of future cash flows and/or appraisals. We review other long-lived assets at least annually and when events or circumstances indicate that the carrying value of the asset may not be recoverable. The recoverability is assessed in most instances by comparing the carrying value to its undiscounted cash flows. This assessment process requires the use of estimates and assumptions regarding future cash flows and estimated useful lives, which are subject to a significant degree of judgment. If these assumptions change in the future, we may be required to record impairment charges for these assets. Income taxes: We record valuation allowances against our deferred tax assets, when necessary, in accordance with SFAS No. 109, “Accounting for Income Taxes.” Realization of deferred tax assets is dependent on future taxable earnings and is therefore uncertain. We assess the likelihood that our deferred tax assets in each of the jurisdictions in which we operate will be recovered from future taxable income. Deferred tax assets do not include future tax benefits that we deem likely not to be realized. We are periodically audited by foreign and domestic tax authorities for both income and sales and use taxes. We record accruals when we determine it is probable that we have an exposure in a matter relating to an audit. The accruals may change in the future due to new developments in each matter. Legal and insurance reserves: We are periodically involved in various legal actions. We are required to assess the probability of any adverse judgments as well as the potential range of loss. We determine the required accruals after a review of the facts of each legal action. We use estimates in the determination of the appropriate liabilities for general liability, workers’ compensation and health insurance. The estimated liability is established based upon historical claims data and third-party actuarial estimates of settlement costs for incurred claims. Unanticipated changes in these factors may require us to revise our estimates. We periodically reassess our assumptions and judgments and make adjustments when significant facts and circumstances dictate. A change in any of the above estimates could impact our consolidated statements of earnings, and the related asset or liability recorded in our consolidated balance sheets would be adjusted accordingly. Historically, actual results have not been materially different than the estimates that are described above. Acquisitions All of our acquisitions discussed below have been accounted for using the purchase method of accounting and, accordingly, our consolidated financial statements reflect the results of operations for each acquisition subsequent to the date of acquisition. The assets acquired and liabilities assumed are recorded at estimates of fair value as determined by management based upon information available. We finalize the allocation of purchase price to the fair value of assets acquired and liabilities assumed when we obtain information sufficient to complete the allocation, but in each case, no longer than one year after the acquisition date. In April 2004, we completed the acquisition of the operations and assets of 10 Applebee’s restaurants located in Southern California for approximately $13,800,000 in cash. The purchase price was allocated to the fair value of property and equipment of $2,500,000, goodwill of $10,800,000, and other net assets of approximately $500,000.

28
In May 2005, we completed the acquisition of 12 Applebee’s restaurants in Missouri, Kansas and Arkansas, which included one restaurant under construction, for approximately $39,500,000 in cash. The purchase price was allocated to the fair value of property and equipment of $17,500,000, goodwill of $21,500,000, reacquired franchise rights of approximately $300,000, and other net assets of approximately $200,000. In January 2006, we completed the acquisition of four Applebee’s restaurants in the Houston market for approximately $8,100,000 in cash. The purchase price was allocated to the fair value of property and equipment of $7,400,000, goodwill of approximately $500,000, reacquired franchise rights of approximately $100,000, and other net assets of approximately $100,000. The following table is comprised of actual company restaurant sales for the three restaurant acquisitions above, which are included in our consolidated financial statements for each period presented, and pro forma company restaurant sales. The pro forma company restaurant sales for 2006 include sales related to the January 2006 acquisition discussed above as if the acquisition had occurred as of the beginning of 2006. The pro forma company restaurant sales for 2005 includes sales related to the January 2006 acquisition and the May 2005 acquisition discussed above as if the acquisitions had occurred as of the beginning of 2005. The pro forma company restaurant sales for 2004 includes sales related to the May 2005 acquisition and the April 2004 acquisition discussed above as if the acquisition had occurred as of the beginning of 2004.
2006 2005 2004 Actual company restaurant sales for acquired restaurants....................................
$ 6,400
$ 17,000
$ 17,600
Pro forma company restaurant sales for acquired restaurants....................................
$ 7,100
$ 32,800
$ 52,600
In April 2005, we completed the acquisition of eight Applebee’s restaurants in the Memphis market, which were closed in 2004 by a former franchisee, for approximately $8,800,000 payable in cash. In connection with this acquisition, we paid approximately $800,000 in 2004 and $8,000,000 in 2005. The purchase price of $8,800,000 was allocated to the fair value of property and equipment of approximately $8,200,000 and goodwill of approximately $600,000. We have remodeled and opened seven restaurants and the remaining restaurant was sold to a third-party. Captive Insurance Subsidiary In 2002, we formed Neighborhood Insurance, Inc., a Vermont corporation and a wholly-owned captive insurance subsidiary to provide Applebee’s International, Inc. and qualified franchisees with workers’ compensation and general liability insurance. In 2005, we reduced the types of insurance coverage plans offered which resulted in fewer franchisee participants in our captive insurance program. Through 2005, Applebee’s International, Inc. and covered franchisees made premium payments to the captive insurance company which pays administrative fees and insurance claims, subject to individual and aggregate maximum claim limits under the captive insurance company’s reinsurance policies. Franchisee premium amounts billed by the captive insurance company were established based upon third-party actuarial estimates of settlement costs for incurred and anticipated claims and administrative fees. Franchisee premiums were included in other franchise income ratably over the policy year and the related offsetting expenses were included in cost of other franchise income. In 2006, we discontinued writing insurance coverage for new or existing participants. Cost of other franchise income includes costs related to the resolution of claims arising from franchisee participation in our captive insurance program. We do not expect franchisee participation in the captive insurance company to have a material impact on our net

29
earnings. Our consolidated balance sheets include the following balances related to the captive insurance subsidiary:
• Franchise premium receivables of approximately $400,000 and $1,700,000 as of December 31, 2006 and December 25, 2005, respectively, included in receivables related to captive insurance subsidiary.
• Cash equivalent and other long-term investments restricted for the payment of claims of approximately $12,600,000 and $18,600,000 as of December 31, 2006 and December 25, 2005, respectively, included in restricted assets related to captive insurance subsidiary.
• Loss reserve related to captive insurance subsidiary of approximately $12,600,000 and $20,700,000 as of December 31, 2006 and December 25, 2005, respectively. Approximately $6,500,000 and $10,500,000 for December 31, 2006 and December 25, 2005, respectively, is included in other non-current liabilities.

30
Results of Operations The following table contains information derived from our consolidated statements of earnings expressed as a percentage of total operating revenues, except where otherwise noted. Percentages may not add due to rounding.
Fiscal Year Ended December 31,
2006 December 25,
2005 December 26,
2004 Operating revenues: Company restaurant sales ............................................... 89.4% 89.0% 87.9% Franchise royalties and fees............................................ 10.5 10.6 10.9
Other franchise income................................................... 0.1 0.4 1.2 Total operating revenues........................................... 100.0% 100.0% 100.0% Cost of sales (as a percentage of company restaurant sales): Food and beverage.......................................................... 26.7% 26.5% 26.5% Labor .............................................................................. 33.7 33.1 32.5 Direct and occupancy ..................................................... 27.1 26.6 25.1 Pre-opening expense....................................................... 0.4 0.4 0.3 Total cost of sales ..................................................... 87.9% 86.6% 84.4% Cost of other franchise income (as a percentage of other franchise income) ................................................................
149.3% 94.1% 105.8%
General and administrative expenses...................................... 10.5 9.0 9.4 Amortization of intangible assets ........................................... 0.1 0.1 0.1 Impairment and other restaurant closure costs........................ 0.7 0.3 — Loss on disposition of property and equipment ...................... 0.2 0.2 0.2 Operating earnings.................................................................. 9.8 13.0 14.9 Other income (expense): Investment income.......................................................... 0.2 0.1 0.1 Interest expense .............................................................. (0.9) (0.4) (0.1) Other income .................................................................. — 0.1 0.3 Total other income (expense).................................... (0.6) (0.1) 0.3 Earnings before income taxes and cumulative effect of change in accounting principle .......................................
9.1
12.9
15.2
Income taxes........................................................................... 3.1 4.5 5.2 Earnings before cumulative effect of change in accounting principle........................................................
6.0
8.4
10.0
Cumulative effect of change in accounting principle, net of tax .........................................................................
—
—
—
Net earnings............................................................................ 6.0% 8.4% 10.0%

31
Fiscal Year Ended December 31, 2006 Compared With Fiscal Year Ended December 25, 2005 Company Restaurant Sales. Total company restaurant sales increased $113,617,000 (10.5%) from $1,082,641,000 in 2005 to $1,196,258,000 in 2006. The percentage increase in total company restaurant sales was due to an increase in the number of restaurant weeks open of approximately 13%. The 53rd week contributed $24,312,000 to company restaurant sales. Excluding the 53rd week, company restaurant sales increased by 8.3%. This increase was partially offset by a decline in average weekly sales of 2.0%. Comparable restaurant sales at company restaurants decreased by 1.0% in 2006. Weighted average weekly sales at company restaurants decreased 2.0% from $45,552 in 2005 to $44,637 in 2006. Excluding the 53rd week in 2006, company average weekly sales decreased 2.3%. The decrease in average weekly sales was due to a decline in guest traffic of approximately 3.5% in 2006, as well as the underperformance of restaurants open less than 18 months. In 2006, we experienced more significant guest count declines in New England and Virginia, where approximately 25% of our company restaurants are located. These decreases were partially offset by an increase in the average guest check resulting from menu price increases of approximately 2.2% in 2006. We took a price increase of approximately 1.4% in January 2007. Franchise Royalties and Fees. Franchise royalties and fees increased $11,042,000 (8.6%) from $128,813,000 in 2005 to $139,855,000 in 2006 due primarily to the increased number of franchise restaurants operating during 2006 as compared to 2005 and the impact of the 53rd week in 2006 which contributed approximately $2,900,000 to franchise royalties. Excluding the 53rd week in 2006, franchise royalties and fees increased 6.3%. Domestic franchise weighted average weekly sales and franchise comparable restaurant sales decreased by 0.1% and 0.5%, respectively, in 2006. Excluding the 53rd week, domestic franchise weighted average weekly sales decreased 0.5% in 2006. Other Franchise Income. Other franchise income decreased $3,388,000 (65%) from $5,196,000 in 2005 to $1,808,000 in 2006 due primarily to the decision to discontinue writing new coverage in our captive insurance program. Cost of Company Restaurant Sales. Food and beverage costs increased from 26.5% in 2005 to 26.7% in 2006. Food and beverage costs were negatively impacted by improved menu offerings which had higher food costs as a percentage of sales, an enhanced bar menu, and higher alcoholic beverage costs as a percentage of sales, partially related to our late-night value strategy. These increases were partially offset by menu price increases of approximately 2.2% in 2006. We currently expect net commodity costs to increase by approximately 1% in 2007. Labor costs increased from 33.1% in 2005 to 33.7% in 2006. The increase in 2006 was due primarily to higher management and hourly wage rates including the impact of state minimum wage rate increases and payroll taxes, which were partially offset by lower health insurance and workers’ compensation expenses. We currently expect labor costs to be negatively impacted by recently enacted state hourly minimum wage increases in 2007. Direct and occupancy costs increased from 26.6% in 2005 to 27.1% in 2006 due primarily to higher utility costs and unfavorable year-over-year comparisons for depreciation, as a percentage of sales, due to its relatively fixed nature. These increases were partially offset by the favorable impact of a change in accounting convention for smallwares that was implemented in the second quarter of fiscal 2006. Cost of Other Franchise Income. Cost of other franchise income decreased $2,193,000 (45%) from $4,892,000 in 2005 to $2,699,000 in 2006. This decrease was due to the decision to discontinue writing new coverage in our captive insurance program, which was partially offset by $1,500,000 recorded in 2006 for estimated insurance losses from franchise participants.

32
General and Administrative Expenses. General and administrative expenses increased from 9.0% in 2005 to 10.5% in 2006 due primarily to the recognition of stock-based compensation related to adoption of SFAS No. 123(R), higher compensation expense due to staffing levels and expenses incurred related to the development of international markets which increased our general and administrative expenses by 0.4%, as a percentage of total revenues. Stock-based compensation included in general and administrative expenses was 1.5% and 0.2% in 2006 and 2005, respectively. Impairment and Other Restaurant Closure Costs. Impairment and other restaurant closure costs increased $4,900,000 from $3,900,000 in 2005 to $8,800,000 in 2006. In 2006, we recorded the following costs:
• $5,500,000 to decrease the carrying amounts of property, equipment and lease acquisition costs of restaurants for which the original carrying value was not deemed recoverable
• $1,500,000 to decrease the carrying amount of an investment of which the original carrying value was deemed to be greater than the fair market value
• $900,000 to record lease obligations for restaurants closed during the year • $900,000 to decrease the carrying amount of a corporate aircraft of which the original carrying
value was deemed to be greater than fair market value In 2005, we recorded the following impairment and restaurant closure costs:
• $2,600,000 to decrease the original carrying amounts of property and equipment of restaurants for which the carrying value was not deemed recoverable
• $1,300,000 to decrease the original carrying amount of a long-lived asset that was abandoned
Interest Expense. Interest expense increased $7,056,000 from $4,365,000 in 2005 to $11,421,000 in 2006 due primarily to higher interest rates and increased borrowings under our credit facility used to fund capital expenditures and repurchases of our common stock. Income Taxes. The effective income tax rate, as a percentage of earnings before income taxes, decreased from 34.9% in 2005 to 33.8% in 2006 due to higher employment tax credits and the resolution of state tax matters. Net earnings. Net earnings decreased $20,896,000 (21%) from $101,802,000 in 2005 to $80,906,000 in 2006 due primarily to the recognition of stock-based compensation related to adoption of SFAS No. 123(R) and lower restaurant margins due to a decrease in average weekly sales which resulted in an increase in labor and direct and occupancy costs, which were partially offset by the impact of the 53rd week in 2006. Fiscal Year Ended December 25, 2005 Compared With Fiscal Year Ended December 26, 2004 Company Restaurant Sales. Total company restaurant sales increased $105,843,000 (11%) from $976,798,000 in 2004 to $1,082,641,000 in 2005. The percentage increase in total company restaurant sales was due to an increase in the number of restaurant weeks open of approximately 13%, which was partially offset by a decline in average weekly sales of 2.1%. Comparable restaurant sales at company restaurants decreased by 0.9% in 2005. Weighted average weekly sales at company restaurants decreased 2.1% from $46,536 in 2004 to $45,552 in 2005. These decreases were due, in part, to a reduction in guest traffic of approximately 3.0% in 2005 as compared to 2004 due to the launch of our Weight Watchers® menu system-wide in May 2004. In addition, we experienced more significant guest count declines in Kansas City, Minnesota and New England, where approximately 40% of our company restaurants are located, which was consistent with industry trends in
33
these markets. Weighted average weekly sales declined more than comparable sales due to weaker new restaurant opening volumes in Kansas City, Minnesota, New England, St. Louis and Virginia. These decreases were partially offset by an increase in the average guest check resulting from menu price increases of approximately 2.5% in 2005 and our Carside To Go initiative. Carside To Go sales mix increased from 9.3% of company restaurant sales in 2004 to 10.0% of company restaurant sales in 2005. Franchise Royalties and Fees. Franchise royalties and fees increased $7,592,000 (6%) from $121,221,000 in 2004 to $128,813,000 in 2005 due primarily to the increased number of franchise restaurants operating during 2005 as compared to 2004 and increases in comparable franchise restaurant sales. Weighted average weekly sales and franchise comparable restaurant sales each increased by 2.7% in 2005. These increases were due primarily to the implementation of the Carside To Go program which was completed in early 2005. Other Franchise Income. Other franchise income decreased $8,419,000 (62%) from $13,615,000 in 2004 to $5,196,000 in 2005 due primarily to fewer franchisee participants in our captive insurance program resulting from the reduction of the types of insurance coverage plans offered. Franchise premiums are included in other franchise income ratably over the policy year. Cost of Company Restaurant Sales. Food and beverage costs were 26.5% in both 2004 and 2005. Food and beverage costs were favorably impacted by menu price increases of 2.5% in 2005, which were offset by higher commodity costs and lower order incidences of both alcoholic and non-alcoholic beverages, which have a lower cost of sales. In addition, 2004 was unfavorably impacted by the company portion of the June 2004 impairment of approximately $500,000 for excess riblet inventories which no longer met our quality standards. Labor costs increased from 32.5% in 2004 to 33.1% in 2005. The increase in 2005 was due primarily to higher management and hourly costs due to lower sales volumes, higher wage rates, payroll taxes and group insurance costs, which were partially offset by lower management incentive compensation and workers’ compensation expense. Direct and occupancy costs increased from 25.1% in 2004 to 26.6% in 2005. Direct and occupancy costs were unfavorably impacted due primarily to lower sales volumes at company restaurants, which resulted in unfavorable year over year comparisons for depreciation, rent and property tax expenses as a percentage of sales, due to their relatively fixed nature, as well as higher utilities and packaging costs. Cost of Other Franchise Income. Cost of other franchise income decreased $9,509,000 (66%) from $14,401,000 in 2004 to $4,892,000 in 2005. This decrease was due primarily to fewer franchisee participants in our captive insurance program resulting from the reduction of the types of insurance coverage plans offered and the franchisee portion of the June 2004 impairment of approximately $1,600,000 for excess riblet inventories which no longer met our quality standards. General and Administrative Expenses. General and administrative expenses decreased from 9.4% in 2004 to 9.0% in 2005 as a result of the absorption of general and administrative expenses over a larger revenue base, lower incentive compensation expense and a reduction in costs associated with compliance with Section 404 of the Sarbanes-Oxley Act. These decreases were partially offset by higher compensation expense due to higher management training costs and increased regional operations management staffing relating to the increased number of company restaurant openings as compared to 2004. Impairment and Other Restaurant Closure Costs. In 2005, we recorded an asset impairment charge of $3,900,000 consisting of a $2,600,000 write-down of the carrying value of the property and equipment of four restaurants and a $1,300,000 write-down of one other long-lived asset (Note 6 of the consolidated financial statements).

34
Interest Expense. Interest expense increased from $1,626,000 in 2004 to $4,365,000 in 2005 due primarily to increased borrowings under our credit facility used to acquire 12 restaurants in May 2005 and to fund capital expenditures and repurchases of our common stock. Other Income. Other income decreased $1,795,000 from $3,557,000 in 2004 to $1,762,000 in 2005. In 2004, we recorded several significant items which resulted in higher other income for that year. These items consisted of income of $1,600,000 for the resolution of certain previously disclosed long-running international franchise disputes and $600,000 of income for final consideration related to the sale of 12 restaurants in Philadelphia in 1999. Income Taxes. The effective income tax rate, as a percentage of earnings before income taxes, increased from 34.2% in 2004 to 34.9% in 2005 due to an increase in state and local income taxes. Net earnings. Net earnings decreased $9,063,000 (8%) from $110,865,000 in 2004 to $101,802,000 in 2005 due primarily to lower restaurant margins due to a decrease in average weekly sales which resulted in an increase in labor and direct and occupancy costs. Liquidity and Capital Resources Our primary sources of liquidity are cash provided by operations and borrowings under our credit facility. Our need for capital resources historically has resulted from the construction and acquisition of restaurants, refurbishment and capital replacement for existing restaurants, the repurchase of our common stock and investment in information technology systems. We obtain capital through our ongoing operations and debt financing. Cash flows from our operating activities primarily include the net cash generated from company and franchise operations and management of credit from trade suppliers. Cash flows used by investing activities include capital expenditures for restaurant construction, refurbishment, information technology, acquisitions of franchise restaurants, sale-leaseback transactions and asset sales. Cash flows used by financing activities include borrowings and repayments of debt, repurchases of our common stock, dividends to shareholders and the cash received from the exercise of employee stock options. The following table presents a summary of our cash flows for 2006, 2005 and 2004 (in thousands):
2006 2005 2004 Net cash provided by operating activities........ $ 174,594 $ 221,203 $ 190,605 Net cash used by investing activities ............... (121,672) (187,718) (134,055)Net cash used by financing activities............... (43,653) (31,087) (63,775)Net increase (decrease) in cash and cash equivalents ..................................... $ 9,269 $ 2,398 $ (7,225)
Capital expenditures, excluding franchise acquisitions, were $122,896,000 in 2006, $139,396,000 in 2005 and $104,620,000 in 2004. Excluding costs related to the construction of our new corporate headquarters, capital expenditures are expected to be between $70,000,000 and $80,000,000 in 2007 and will primarily be for the development of new restaurants, refurbishment and capital replacement for existing restaurants and the enhancement of information systems. Costs for the new corporate headquarters are expected to be approximately $30,000,000 in 2007. We intend to enter into a sale-leaseback transaction with respect to the new headquarters upon its completion or thereafter, depending upon market conditions. We currently expect

35
to open between 10 and 15 company restaurants in 2007. Because we expect to continue to purchase a portion of our restaurant sites, the amount of actual capital expenditures will be dependent upon, among other things, the proportion of leased versus owned properties. If we construct more or fewer restaurants than we currently anticipate, or acquire additional restaurants, our capital requirements will increase or decrease accordingly. In January 2006, we completed the acquisition of four Applebee’s restaurants in the Houston area for approximately $8,100,000 in cash. In May 2005, we completed the acquisition of 12 Applebee’s restaurants in Missouri, Kansas and Arkansas, which included one restaurant under construction, for approximately $39,500,000 in cash. In April 2005, we completed the acquisition of eight Applebee’s restaurants in the Memphis market, which were closed in 2004 by a former franchisee, for approximately $8,800,000 payable in cash. In connection with this acquisition, we paid approximately $800,000 in 2004 and $8,000,000 in 2005. In April 2004, we completed the acquisition of the operations and assets of 10 Applebee’s restaurants located in Southern California for approximately $13,800,000 in cash. In December 2006, we entered into a new five-year revolving credit facility. The terms of the bank credit agreement provide for $400,000,000 in unsecured revolving credit as well as an additional $200,000,000 of revolving credit upon satisfaction of the conditions set forth in the credit facility. The facility is subject to various covenants and restrictions which, among other things, require the maintenance of stipulated fixed charge and leverage ratios, as defined. There is no limit on cash dividends or repurchases of our common stock provided the declaration and payment of such dividend or repurchase of stock does not cause a default of any other covenant contained in the agreement. The facility is subject to other standard terms, conditions, covenants and fees. As of December 31, 2006, we were in compliance with the covenants contained in our credit agreement. We had borrowings of $170,000,000, standby letters of credit of approximately $15,600,000 outstanding and approximately $214,400,000 available under our revolving credit facility. In October 2005, our Board of Directors approved a $175,000,000 authorization to repurchase our common stock, subject to market conditions. In November 2006, with approximately $100,000,000 of the previous authorization remaining, our Board of Directors authorized additional repurchases of our common stock of up to $150,000,000, subject to market conditions, for a total of approximately $250,000,000 in authorized repurchases. During 2006, we repurchased 1,760,506 shares of our common stock at an average price of $21.88 for an aggregate cost of approximately $38,522,000. As of December 31, 2006, we had approximately $240,400,000 remaining under our repurchase authorizations. In October 2006, we entered into a sale-leaseback arrangement with a third-party finance company involving five restaurant properties. As a result of this transaction, we received approximately $3,100,000 in cash. In December 2006, the Board of Directors declared an annual dividend of $0.22 per share payable to shareholders of record on December 22, 2006. We paid approximately $16,300,000 in January 2007 related to this dividend. As of December 31, 2006, our liquid assets totaled $22,602,000. These assets consisted of cash and cash equivalents in the amount of $22,309,000 and short-term investments in the amount of $293,000. The working capital deficit decreased from $107,400,000 as of December 25, 2005 to $81,626,000 as of December 31, 2006. This decrease resulted primarily from a combination of factors which included decreases in accounts payable and inventories, an increase in receivables and accrued income taxes, a

36
reclassification of property and equipment to assets held for sale, and higher sales of gift cards as compared to the redemption of gift cards. We believe that our liquid assets and cash generated from operations, combined with available borrowings, will provide sufficient funds for operating activities, capital expenditures, currently approved repurchases of our common stock and the payment of dividends for at least the next 12 months and thereafter for the foreseeable future. The following table shows our debt amortization schedule, future capital lease commitments (including principal and interest payments), future operating lease commitments (operating leases in Note 12 to the consolidated financial statements) and future purchase obligations as of December 31, 2006 (in thousands): Payments due by period
Certain Contractual Obligations
Total
Less than 1 year
1-3 Years
3-5 Years
More than 5 years
Long-term Debt (excluding capital lease obligations) and Notes Payable(1) .................................................
$ 171,269
$ 77
$ 90
$ 170,108
$ 994
Capital Lease Obligations.......................... 7,522 822 1,731 1,792 3,177 Operating Leases (2).................................... 402,019 29,307 58,211 56,842 257,659 Purchase Obligations - Company(3) ........... 206,395 49,145 127,903 29,347 — Purchase Obligations - Franchise(4) ........... 475,126 52,776 342,983 79,367 — (1) The amounts for long-term debt are primarily borrowings under our revolving credit facility and exclude interest payments which are variable in nature. (2) The amounts for operating leases include option periods where failure to exercise such options would result in an economic penalty such that the renewal appears reasonably assured. (3) The amounts for company purchase obligations include commitments for food items, energy, supplies, severance and employment agreements, our new corporate headquarters, and other miscellaneous commitments. (4) The amounts for franchise purchase obligations include commitments for food items and supplies made by us for our franchisees. We contract with certain suppliers to ensure competitive pricing. These amounts will only be payable by us if our franchisees do not meet certain minimum contractual requirements. Other Contractual Obligations In connection with the sale of restaurants to franchisees and other parties, we have, in certain cases, remained contingently liable for the remaining lease payments. As of December 31, 2006, we have outstanding lease guarantees of approximately $15,300,000. In addition, we or our subsidiaries are contingently liable for various leases that we have assigned in connection with the sale of restaurants to franchisees and other parties, in the potential amount of $12,300,000. These leases expire at various times with the final lease agreement expiring in 2018. We did not record a liability related to these contingent lease liabilities as of December 31, 2006 or December 25, 2005. In 2004, we arranged for a third-party financing company to provide up to $250,000,000 to qualified franchisees for loans to fund development of new restaurants through October 2007, subject to our approval. We will provide a limited guarantee of 10% of certain loans advanced under this program. We will be released from our guarantee if certain operating results are met after the restaurant has been open for at least two years. As of December 31, 2006, there were loans outstanding to five franchisees for approximately $65,800,000 under this program. The fair value of our guarantees under this financing program is approximately $130,000 and is recorded in non-current liabilities in our consolidated balance sheet as of December 31, 2006.

37
We have severance and employment agreements with certain officers providing for severance payments to be made in the event the associate resigns or is terminated not related to a change in control, some of which require payments to be made only if we enforce certain terms in the agreements. If the severance payments had been due as of December 31, 2006, we would have been required to make payments totaling approximately $10,600,000. In addition, we have severance and employment agreements with certain officers which contain severance provisions related to a change in control. The agreements define the circumstances which will constitute a change in control. Those provisions would have required additional aggregate payments of approximately $5,300,000 if such officers had been terminated as of December 31, 2006. New Accounting Pronouncements In March 2006, the Emerging Issues Task Force (“EITF”) issued EITF Issue 06-3, “How Taxes Collected from Customers and Remitted to Governmental Authorities Should Be Presented in the Income Statement (That Is, Gross versus Net Presentation).” A consensus was reached that entities may adopt a policy of presenting sales taxes in the income statement on either a gross or net basis. If taxes are significant, an entity should disclose its policy of presenting taxes and the amounts of taxes. The guidance is effective for periods beginning after December 15, 2006. We present company sales net of sales taxes. The impact of this adoption did not change our method for recording sales taxes in our consolidated financial statements. In July 2006, the Financial Accounting Standards Board (“FASB”) issued FASB Interpretation No. (“FIN”) 48, “Accounting for Uncertainty in Income Taxes,” which clarifies the accounting for uncertainty in income taxes recognized in the financial statements in accordance with SFAS No. 109, “Accounting for Income Taxes.” FIN 48 is effective for fiscal years beginning after December 15, 2006. The impact of this adoption will not be material to our consolidated financial statements. In September 2006, the FASB issued SFAS No. 157, “Fair Value Measurements.” This statement defines fair value, establishes a framework for using fair value to measure assets and liabilities, and expands disclosures about fair value measurements. The statement applies whenever other statements require or permit assets or liabilities to be measured at fair value. SFAS No. 157 is effective for fiscal years beginning after November 15, 2007. The impact of this adoption will not be material to our consolidated financial statements. In September 2006, the FASB issued SFAS No. 158, “Employers’ Accounting for Defined Benefit Pension and Other Postretirement Plans.” This statement requires companies to recognize a net liability or asset and an offsetting adjustment to accumulated other comprehensive income to report the funded status of defined benefit pension and other postretirement benefit plans. The statement requires prospective application, and the recognition and disclosure requirements are effective for companies with fiscal years ending after December 15, 2006. Additionally, SFAS No. 158 requires companies to measure plan assets and obligations at their year-end balance sheet date. This requirement is effective for fiscal years ending after December 15, 2008. The impact of this adoption was not material to our consolidated financial statements and we are in compliance with the measurement date provisions of this statement as of December 31, 2006. In September 2006, the SEC issued Staff Accounting Bulletin (“SAB”) No. 108, “Considering the Effects of Prior Year Misstatements when Quantifying Misstatements in Current Year Financial Statements,” which provides interpretive guidance regarding the consideration given to prior year misstatements when determining materiality in current year financial statements. SAB No. 108 is effective for fiscal years ending after November 15, 2006. The impact of this adoption was not material to our consolidated financial statements.
38
In October 2006, the FASB issued FASB Staff Position (“FSP”) FAS 123 (R)-5, “Amendment to FSP FAS 123 (R)-1.” FSP FAS 123(R)-5 addresses whether a modification of an instrument in connection with an equity restructuring should be considered a modification for purposes of applying FSP FAS 123(R)-1. This FSP states that no change in the recognition or the measurement (due to a change in classification as a result of a modification solely to reflect an equity restructuring that occurs when the holders are no longer employees) of the instruments will result if two conditions are met: (1) there is no increase in fair value of the award or the antidilution provision is not added to the terms of the award in contemplation of an equity restructuring and (2) all holders of the same class of equity instruments are treated in the same manner. The effective date of FSP FAS 123(R)-5 is the first reporting period beginning after October 10, 2006. The impact of this adoption was not material to our consolidated financial statements. In February 2007, the FASB issued SFAS No. 159, “The Fair Value Option for Financial Assets and Liabilities.” This statement permits entities to choose to measure many financial instruments and certain other items at fair value. If the fair value option is elected, unrealized gains and losses will be recognized in earnings at each subsequent reporting date. SFAS No. 159 is effective for fiscal years beginning after November 15, 2007. We are currently evaluating the impact of this adoption on our consolidated financial statements. Item 7A. Quantitative and Qualitative Disclosures About Market Risk We are exposed to market risk from fluctuations in interest rates and changes in commodity prices. Our revolving credit facility currently bears interest at either the bank’s prime rate or LIBOR plus 0.50%, at our option. As of December 31, 2006, the total amount of debt subject to interest rate fluctuations was $170,000,000, which was outstanding on our revolving credit facility. A 1% change in interest rates would result in an increase or decrease in interest expense of approximately $1,700,000 per year. We may from time to time enter into interest rate swap agreements to manage the impact of interest rate changes on our earnings. A substantial portion of the food products and utilities we purchase are subject to price volatility due to factors that are outside of our control such as weather, seasonality and fuel costs. As part of our strategy to moderate this volatility, we have entered into fixed price purchase commitments. Item 8. Financial Statements and Supplementary Data See the Index to Consolidated Financial Statements on Page F-1. Item 9. Changes in and Disagreements with Accountants on Accounting and Financial
Disclosure Not applicable. Item 9A. Controls and Procedures As of December 31, 2006, we have evaluated the effectiveness of the design and operation of our disclosure controls and procedures, under the supervision and with the participation of the Chief Executive Officer (“CEO”) and Chief Financial Officer (“CFO”). Based on this evaluation, our management, including the CEO and CFO, concluded that our disclosure controls and procedures are effective. During the fourth fiscal quarter, there have been no changes in our internal control over financial reporting that occurred that have materially affected or are reasonably likely to materially affect our internal control over financial reporting.

39
Management’s Report on Internal Control over Financial Reporting The management of Applebee’s International, Inc. is responsible for establishing and maintaining adequate internal control over financial reporting, as defined in Exchange Act Rule 13a-15(f). Our internal control system was designed to provide reasonable assurance to the company’s management and board of directors regarding the preparation and fair presentation of published financial statements in accordance with generally accepted accounting principles. Management recognizes that there are inherent limitations in the effectiveness of any system of internal control, and accordingly, even effective internal control can provide only reasonable assurance with respect to financial statement preparation and fair presentation. Further, because of changes in conditions, the effectiveness of internal control may vary over time. Under the supervision and with the participation of our management, including our CEO and CFO, we assessed the effectiveness of the company’s internal control over financial reporting as of December 31, 2006. In making this assessment, we used the criteria set forth by the Committee of Sponsoring Organizations of the Treadway Commission in Internal Control—Integrated Framework. Based upon our assessment, we conclude that, as of December 31, 2006, the company’s internal control over financial reporting is effective, in all material respects, based upon those criteria.
Our independent registered public accounting firm, Deloitte & Touche LLP, issued an attestation report dated February 28, 2007 on our assessment and on the effectiveness of the company’s internal control over financial reporting, which is included herein.

40
REPORT OF INDEPENDENT REGISTERED PUBLIC ACCOUNTING FIRM To the Board of Directors and Stockholders of Applebee’s International, Inc. and Subsidiaries Overland Park, Kansas We have audited management’s assessment, included in the accompanying Management’s Report on Internal Control Over Financial Reporting, that Applebee’s International, Inc. and subsidiaries (the “Company”) maintained effective internal control over financial reporting as of December 31, 2006, based on criteria established in Internal Control—Integrated Framework issued by the Committee of Sponsoring Organizations of the Treadway Commission. The Company’s management is responsible for maintaining effective internal control over financial reporting and for its assessment of the effectiveness of internal control over financial reporting. Our responsibility is to express an opinion on management’s assessment and an opinion on the effectiveness of the Company’s internal control over financial reporting based on our audit. We conducted our audit in accordance with the standards of the Public Company Accounting Oversight Board (United States). Those standards require that we plan and perform the audit to obtain reasonable assurance about whether effective internal control over financial reporting was maintained in all material respects. Our audit included obtaining an understanding of internal control over financial reporting, evaluating management’s assessment, testing and evaluating the design and operating effectiveness of internal control, and performing such other procedures as we considered necessary in the circumstances. We believe that our audit provides a reasonable basis for our opinions. A company’s internal control over financial reporting is a process designed by, or under the supervision of, the company’s principal executive and principal financial officers, or persons performing similar functions, and effected by the company’s board of directors, management, and other personnel to provide reasonable assurance regarding the reliability of financial reporting and the preparation of financial statements for external purposes in accordance with accounting principles generally accepted in the United States of America (“generally accepted accounting principles”). A company’s internal control over financial reporting includes those policies and procedures that (1) pertain to the maintenance of records that, in reasonable detail, accurately and fairly reflect the transactions and dispositions of the assets of the company; (2) provide reasonable assurance that transactions are recorded as necessary to permit preparation of financial statements in accordance with generally accepted accounting principles, and that receipts and expenditures of the company are being made only in accordance with authorizations of management and directors of the company; and (3) provide reasonable assurance regarding prevention or timely detection of unauthorized acquisition, use, or disposition of the company’s assets that could have a material effect on the financial statements. Because of the inherent limitations of internal control over financial reporting, including the possibility of collusion or improper management override of controls, material misstatements due to error or fraud may not be prevented or detected on a timely basis. Also, projections of any evaluation of the effectiveness of the internal control over financial reporting to future periods are subject to the risk that the controls may become inadequate because of changes in conditions, or that the degree of compliance with the policies or procedures may deteriorate. In our opinion, management’s assessment that the Company maintained effective internal control over financial reporting as of December 31, 2006, is fairly stated, in all material respects, based on the criteria established in Internal Control—Integrated Framework issued by the Committee of Sponsoring

41
Organizations of the Treadway Commission. Also in our opinion, the Company maintained, in all material respects, effective internal control over financial reporting as of December 31, 2006, based on the criteria established in Internal Control—Integrated Framework issued by the Committee of Sponsoring Organizations of the Treadway Commission. We have also audited, in accordance with the standards of the Public Company Accounting Oversight Board (United States), the consolidated financial statements as of and for the year ended December 31, 2006, of the Company and our report dated February 28, 2007 expressed an unqualified opinion on those financial statements and included an explanatory paragraph regarding a change in accounting for stock-based compensation upon adoption of Statement of Financial Accounting Standards No. 123(R), “Share-Based Payment.”
DELOITTE & TOUCHE LLP
Kansas City, Missouri February 28, 2007
Item 9B. Other Information Not applicable.

42
PART III
Item 10. Directors, Executive Officers and Corporate Governance If you would like information about our executive officers, you should read the section entitled “Executive and Other Senior Officers of the Registrant” in Part I of this report. You should read the information under the caption “Information About the Board of Directors and Executive and Other Senior Officers” for information on our Board of Directors and audit committee of the Board of Directors and the caption “Section 16(a) Beneficial Ownership Reporting Compliance” for information regarding our Section 16(a) reporting compliance located in the definitive proxy statement for the 2007 Annual Meeting of Stockholders (the “Proxy Statement”). We incorporate that information in this document by reference. Our Board of Directors has adopted a Code of Conduct for all associates and directors. A copy of this document is available on our website at www.applebees.com, free of charge, under the Investors section. We will satisfy any disclosure requirements under Item 5.05 on Form 8-K regarding an amendment to, or waiver from, any provision of the Code with respect to our principal executive officer, principal financial officer, principal accounting officer and persons performing similar functions by disclosing the nature of such amendment or waiver on our website or in a report on Form 8-K. Our Board of Directors has determined that Mr. Eric L. Hansen, a member of the audit committee and an independent director, is an audit committee financial expert, as defined under 407(d)(5) of Regulation S-K. Item 11. Executive Compensation If you would like information about our director and executive compensation, you should read the information under the caption “Executive Compensation” and “Information About the Board of Directors and Executive and Other Senior Officers – Director Compensation and – Compensation Committee Interlocks and Insider Participation” in the Proxy Statement. We incorporate that information in this document by reference. Item 12. Security Ownership of Certain Beneficial Owners and Management and Related Stockholder Matters If you would like information about the stock owned by our management and certain large stockholders and information about our equity compensation plans, you should read the information under the captions “Stock Ownership of Officers and Directors” and “Stock Ownership of Major Stockholders” and “Executive Compensation – Equity Compensation Plan Information” in the Proxy Statement for the Annual Meeting of Stockholders. We incorporate that information in this document by reference. Item 13. Certain Relationships and Related Transactions, and Director Independence If you would like information about certain transactions which we have completed or certain relationships which we have entered into, you should read the information under the caption “Related Party Transactions” in the Proxy Statement. For information on director independence you should read the information under the caption “Information About the Board of Directors and Executive and Other Senior Officers – Corporate Governance” in the Proxy Statement. We incorporate that information in this document by reference.

43
Item 14. Principal Accounting Fees and Services If you would like information about fees paid to our auditors, you should read the information under the caption “Fees and Services of Deloitte & Touche LLP” in the Proxy Statement. We incorporate that information in this document by reference.

44
PART IV
Item 15. Exhibits, Financial Statement Schedules (a) List of documents filed as part of this report: 1. Financial Statements: The financial statements are listed in the accompanying “Index to Consolidated Financial
Statements” on Page F-1. 2. Financial Statement Schedules: None. 3. Exhibits: The exhibits filed with or incorporated by reference in this report are listed on the Exhibit
Index beginning on page E-1.

45
SIGNATURES Pursuant to the requirements of Section 13 or 15(d) of the Securities Exchange Act of 1934, the registrant has duly caused this report to be signed on its behalf by the undersigned, thereunto duly authorized. APPLEBEE’S INTERNATIONAL, INC. Date: February 28, 2007 By: /s/ David L. Goebel David L. Goebel Director, Chief Executive Officer and
President (principal executive officer)
POWER OF ATTORNEY KNOWN TO ALL PERSONS BY THESE PRESENTS, that each person whose signature appears below constitutes and appoints David L. Goebel and Rebecca R. Tilden, and each of them, his true and lawful attorney-in-fact and agent, with full power of substitution and resubstitution, for him and in his name, place and stead, in any and all capacities, to sign any amendments to this Form 10-K, and to file the same, with exhibits thereto and other documents in connection therewith, with the Securities and Exchange Commission, hereby ratifying and confirming all that said attorney-in-fact or his substitute or substitutes, may do or cause to be done by virtue hereof. Pursuant to the requirements of the Securities Exchange Act of 1934, this report has been signed below by the following persons on behalf of the registrant and in the capacities and on the dates indicated.
By: /s/ David L. Goebel Date: February 28, 2007 David L. Goebel Director, Chief Executive Officer and President (principal executive officer) By: /s/ Steven K. Lumpkin Date: February 28, 2007 Steven K. Lumpkin Director, Executive Vice President, Chief
Financial Officer and Treasurer (principal financial officer)
By: /s/ Beverly O. Elving Date: February 28, 2007 Beverly O. Elving
Vice President and Controller (principal accounting officer)
By: /s/ Lloyd L. Hill Date: February 28, 2007 Lloyd L. Hill Director, Chairman of the Board
46
By: /s/ Erline Belton Date: February 28, 2007 Erline Belton Director By: /s/ Gina Boswell Date: February 28, 2007 Gina Boswell Director By: /s/ Douglas R. Conant Date: February 28, 2007 Douglas R. Conant Director By: /s/ D. Patrick Curran Date: February 28, 2007 D. Patrick Curran Director By: /s/ Eric L. Hansen Date: February 28, 2007 Eric L. Hansen Director By: /s/ Jack P. Helms Date: February 28, 2007 Jack P. Helms Director By: /s/ Rogelio Rebolledo Date: February 28, 2007 Rogelio Rebolledo Director By: /s/ Burton M. Sack Date: February 28, 2007 Burton M. Sack Director By: /s/ Michael A. Volkema Date: February 28, 2007 Michael A. Volkema Director

F-1
APPLEBEE’S INTERNATIONAL, INC. AND SUBSIDIARIES INDEX TO CONSOLIDATED FINANCIAL STATEMENTS
Page Report of Independent Registered Public Accounting Firm...................................................................... F-2 Consolidated Balance Sheets as of December 31, 2006 and December 25, 2005............................................................................................................................. F-3 Consolidated Statements of Earnings for the Fiscal Years Ended December 31, 2006, December 25, 2005 and December 26, 2004...................................................................................... F-4 Consolidated Statements of Stockholders’ Equity for the Fiscal Years Ended December 31, 2006, December 25, 2005 and December 26, 2004..................................................... F-5 Consolidated Statements of Cash Flows for the Fiscal Years Ended December 31, 2006, December 25, 2005 and December 26, 2004...................................................................................... F-6 Notes to Consolidated Financial Statements ............................................................................................. F-8

F-2
REPORT OF INDEPENDENT REGISTERED PUBLIC ACCOUNTING FIRM To the Board of Directors and Stockholders of Applebee’s International, Inc. and Subsidiaries Overland Park, Kansas We have audited the accompanying consolidated balance sheets of Applebee’s International, Inc. and subsidiaries (the “Company”) as of December 31, 2006 and December 25, 2005, and the related consolidated statements of earnings, stockholders’ equity, and cash flows for each of the three years in the period ended December 31, 2006. These financial statements are the responsibility of the Company’s management. Our responsibility is to express an opinion on these financial statements based on our audits. We conducted our audits in accordance with the standards of the Public Company Accounting Oversight Board (United States). Those standards require that we plan and perform the audit to obtain reasonable assurance about whether the financial statements are free of material misstatement. An audit includes examining, on a test basis, evidence supporting the amounts and disclosures in the financial statements. An audit also includes assessing the accounting principles used and significant estimates made by management, as well as evaluating the overall financial statement presentation. We believe that our audits provide a reasonable basis for our opinion. In our opinion, such consolidated financial statements present fairly, in all material respects, the financial position of the Company as of December 31, 2006 and December 25, 2005, and the results of its operations and its cash flows for each of the three fiscal years in the period ended December 31, 2006, in conformity with accounting principles generally accepted in the United States of America. As discussed in Note 3 to the consolidated financial statements, the Company changed its method of accounting for stock-based compensation upon adoption of Statement of Financial Accounting Standards No. 123(R), “Share-Based Payment.” We have also audited, in accordance with the standards of the Public Company Accounting Oversight Board (United States), the effectiveness of the Company’s internal control over financial reporting as of December 31, 2006, based on the criteria established in Internal Control—Integrated Framework issued by the Committee of Sponsoring Organizations of the Treadway Commission and our report dated February 28, 2007, expressed an unqualified opinion on management’s assessment of the effectiveness of the Company’s internal control over financial reporting and an unqualified opinion on the effectiveness of the Company’s internal control over financial reporting. DELOITTE & TOUCHE LLP
Kansas City, Missouri February 28, 2007
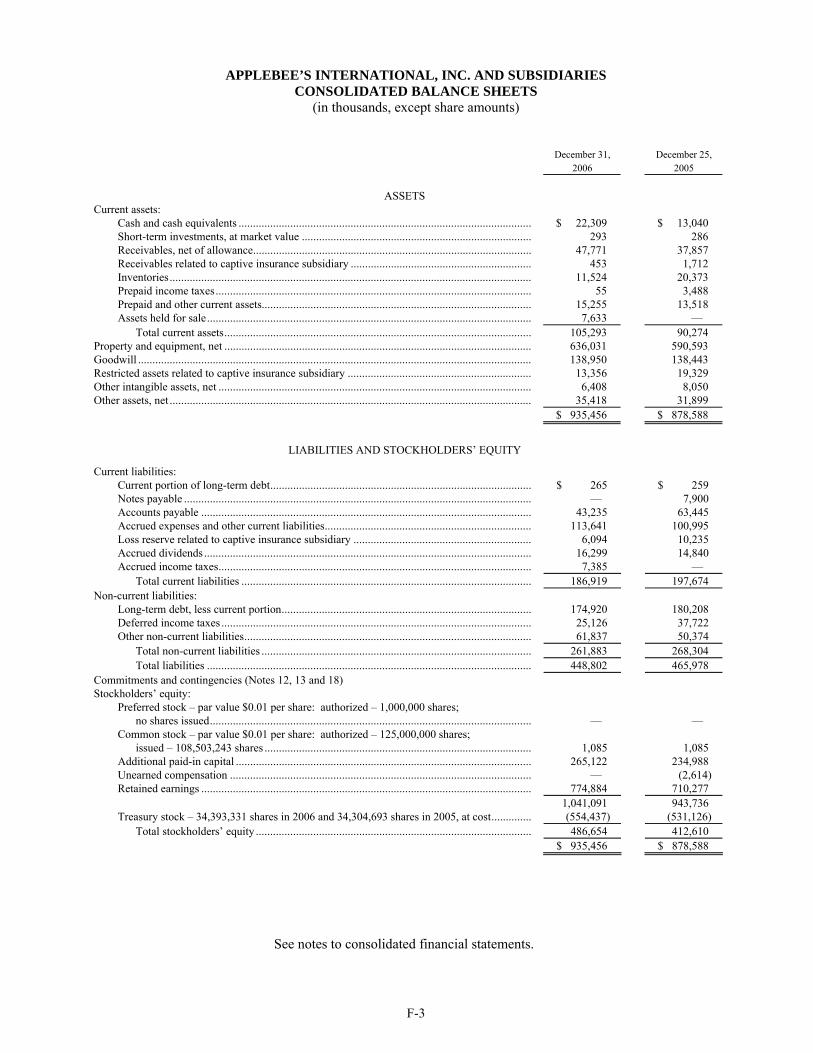
F-3
APPLEBEE’S INTERNATIONAL, INC. AND SUBSIDIARIES CONSOLIDATED BALANCE SHEETS
(in thousands, except share amounts)
December 31, 2006
December 25, 2005
ASSETS
Current assets: Cash and cash equivalents ...................................................................................................... $ 22,309 $ 13,040 Short-term investments, at market value ................................................................................ 293 286 Receivables, net of allowance................................................................................................. 47,771 37,857 Receivables related to captive insurance subsidiary ............................................................... 453 1,712 Inventories.............................................................................................................................. 11,524 20,373 Prepaid income taxes.............................................................................................................. 55 3,488 Prepaid and other current assets.............................................................................................. 15,255 13,518 Assets held for sale................................................................................................................. 7,633 — Total current assets........................................................................................................... 105,293 90,274 Property and equipment, net ........................................................................................................... 636,031 590,593 Goodwill ......................................................................................................................................... 138,950 138,443 Restricted assets related to captive insurance subsidiary ................................................................ 13,356 19,329 Other intangible assets, net ............................................................................................................. 6,408 8,050 Other assets, net .............................................................................................................................. 35,418 31,899 $ 935,456 $ 878,588
LIABILITIES AND STOCKHOLDERS’ EQUITY
Current liabilities: Current portion of long-term debt........................................................................................... $ 265 $ 259 Notes payable ......................................................................................................................... — 7,900 Accounts payable ................................................................................................................... 43,235 63,445 Accrued expenses and other current liabilities........................................................................ 113,641 100,995 Loss reserve related to captive insurance subsidiary .............................................................. 6,094 10,235 Accrued dividends .................................................................................................................. 16,299 14,840 Accrued income taxes............................................................................................................. 7,385 — Total current liabilities ..................................................................................................... 186,919 197,674 Non-current liabilities: Long-term debt, less current portion....................................................................................... 174,920 180,208 Deferred income taxes ............................................................................................................ 25,126 37,722 Other non-current liabilities.................................................................................................... 61,837 50,374 Total non-current liabilities .............................................................................................. 261,883 268,304 Total liabilities ................................................................................................................. 448,802 465,978 Commitments and contingencies (Notes 12, 13 and 18) Stockholders’ equity: Preferred stock – par value $0.01 per share: authorized – 1,000,000 shares; no shares issued................................................................................................................
—
—
Common stock – par value $0.01 per share: authorized – 125,000,000 shares; issued – 108,503,243 shares .............................................................................................
1,085
1,085
Additional paid-in capital ....................................................................................................... 265,122 234,988 Unearned compensation ......................................................................................................... — (2,614) Retained earnings ................................................................................................................... 774,884 710,277 1,041,091 943,736 Treasury stock – 34,393,331 shares in 2006 and 34,304,693 shares in 2005, at cost.............. (554,437) (531,126) Total stockholders’ equity ................................................................................................ 486,654 412,610 $ 935,456 $ 878,588
See notes to consolidated financial statements.

F-4
APPLEBEE’S INTERNATIONAL, INC. AND SUBSIDIARIES CONSOLIDATED STATEMENTS OF EARNINGS
(in thousands, except per share amounts)
Fiscal Year Ended December 31,
2006 December 25,
2005 December 26,
2004 Operating revenues: Company restaurant sales................................................................. $ 1,196,258 $ 1,082,641 $ 976,798 Franchise royalties and fees ............................................................. 139,855 128,813 121,221 Other franchise income .................................................................... 1,808 5,196 13,615 Total operating revenues............................................................ 1,337,921 1,216,650 1,111,634 Cost of company restaurant sales: Food and beverage ........................................................................... 319,813 286,522 259,134 Labor................................................................................................ 403,516 358,563 317,659 Direct and occupancy....................................................................... 323,843 287,656 244,707 Pre-opening expense ........................................................................ 4,348 4,767 3,025 Total cost of company restaurant sales ...................................... 1,051,520 937,508 824,525 Cost of other franchise income ................................................................. 2,699 4,892 14,401 General and administrative expenses........................................................ 140,824 109,768 104,810 Amortization of intangible assets ............................................................. 721 878 663 Impairment and other restaurant closure costs.......................................... 8,800 3,900 — Loss on disposition of property and equipment ........................................ 2,573 2,067 1,955 Operating earnings ................................................................................... 130,784 157,637 165,280 Other income (expense): Investment income ........................................................................... 2,768 1,695 1,284 Interest expense................................................................................ (11,421) (4,365) (1,626) Other income.................................................................................... 16 1,762 3,557 Total other income (expense)..................................................... (8,637) (908) 3,215 Earnings before income taxes and cumulative effect of change in accounting principle .........................................................................
122,147
156,729
168,495
Income taxes............................................................................................. 41,241 54,702 57,630 Earnings before cumulative effect of change in accounting principle ...... 80,906 102,027 110,865 Cumulative effect of change in accounting principle, net of tax............... — (225) — Net earnings.............................................................................................. $ 80,906 $ 101,802 $ 110,865 Basic net earnings per common share: Basic earnings before cumulative effect of change in accounting principle...................................................................
$ 1.09
$ 1.30
$ 1.36
Cumulative effect of change in accounting principle, net of tax ...... — — — Basic net earnings per common share....................................................... $ 1.09 $ 1.29 $ 1.36 Diluted net earnings per common share: Diluted earnings before cumulative effect of change in accounting principle...................................................................
$ 1.08
$ 1.28
$ 1.33
Cumulative effect of change in accounting principle, net of tax ...... — — — Diluted net earnings per common share.................................................... $ 1.08 $ 1.27 $ 1.33 Basic weighted average shares outstanding .............................................. 74,001 78,650 81,528 Diluted weighted average shares outstanding........................................... 74,936 80,010 83,600
See notes to consolidated financial statements.

F-5
APPLEBEE’S INTERNATIONAL, INC. AND SUBSIDIARIES CONSOLIDATED STATEMENTS OF STOCKHOLDERS’ EQUITY
(in thousands, except per share amounts)
Common Stock Additional
Paid-In Unearned Retained Treasury Total
Stockholders’ Shares Amount Capital Compensation Earnings Stock Equity
Balance, December 28, 2003................................... 108,503 $ 1,085 $ 201,951 $ (1,377) $ 517,365 $ (265,881) $ 453,143 Net earnings.......................................................... — — — — 110,865 — 110,865 Purchases of treasury stock................................... — — — — — (99,723) (99,723) Dividends declared on common stock, $0.06 per share ........................................................... —
—
—
—
(4,867)
—
(4,867)
Stock options exercised and related tax benefit .... — — 13,756 — — 16,200 29,956 Shares issued under employee benefit plans ......... — — 3,747 — — 2,232 5,979 Nonvested shares awarded under equity incentive plans, net of forfeitures ..................... — — 1,443
(1,969) — 526 —
Amortization of unearned compensation relating to nonvested shares........................................... —
—
—
1,422
—
—
1,422
Dividends paid for fractional shares ..................... — — — — (48) — (48) Balance, December 26, 2004................................... 108,503 1,085 220,897 (1,924) 623,315 (346,646) 496,727 Net earnings.......................................................... — — — — 101,802 — 101,802 Purchases of treasury stock................................... — — — — — (196,066) (196,066) Dividends declared on common stock, $0.20 per share ........................................................... —
—
—
—
(14,840)
—
(14,840)
Stock options exercised and related tax benefit .... — — 9,274 — — 9,080 18,354 Shares issued under employee benefit plans ......... — — 2,586 — — 1,816 4,402 Nonvested shares awarded under equity incentive plans, net of forfeitures ..................... —
—
2,231
(2,921)
—
690
—
Amortization of unearned compensation relating to nonvested shares........................................... —
—
—
2,231
—
—
2,231
Balance, December 25, 2005................................... 108,503 1,085 234,988 (2,614) 710,277 (531,126) 412,610 Net earnings.......................................................... — — — — 80,906 — 80,906 Purchases of treasury stock................................... — — — — — (38,522) (38,522) Dividends declared on common stock, $0.22 per share ........................................................... —
—
—
—
(16,299)
—
(16,299)
Reclassification of unearned compensation related to the adoption of Statement of Financial Accounting Standards No. 123(R) (Note 3)...... — —
(2,614)
2,614 —
—
— Stock options exercised and related tax benefit .... — — 10,017 — — 11,981 21,998 Shares issued under employee benefit plans ......... — — 1,935 — — 2,232 4,167 Nonvested shares awarded under equity incentive plans.................................................. —
—
(998)
—
—
998
—
Stock-based compensation expense related to employee-based equity awards ......................... —
—
21,794
—
—
—
21,794
Balance, December 31, 2006................................... 108,503 $ 1,085 $ 265,122 $ — $ 774,884 $ (554,437) $ 486,654
See notes to consolidated financial statements.

F-6
APPLEBEE’S INTERNATIONAL, INC. AND SUBSIDIARIES
CONSOLIDATED STATEMENTS OF CASH FLOWS (in thousands)
Fiscal Year Ended
December 31, 2006
December 25, 2005
December 26, 2004
CASH FLOWS FROM OPERATING ACTIVITIES: Net earnings.................................................................................................. $ 80,906 $ 101,802 $ 110,865 Adjustments to reconcile net earnings to net cash provided by operating activities:
Cumulative effect of change in accounting principle, net of tax............. — 225 — Depreciation and amortization................................................................ 64,738 54,580 46,051 Amortization of intangible assets ........................................................... 721 878 663 Stock-based compensation ..................................................................... 21,794 2,231 1,422 Other amortization.................................................................................. 366 246 309 Deferred income tax provision (benefit)................................................. (12,083) 9,871 25,313 Inventory impairment ............................................................................. — — 2,000 Impairment and other restaurant closure costs........................................ 8,800 3,900 — Loss on disposition of property and equipment ...................................... 2,573 2,067 1,955 Income tax benefit from stock-based compensation............................... 2,757 5,370 10,459
Changes in assets and liabilities, exclusive of effects of acquisitions: Receivables ............................................................................................ (9,202) 1,371 (7,218) Receivables related to captive insurance subsidiary ............................... 1,259 154 (2,116) Inventories.............................................................................................. 8,907 15,753 (16,925) Prepaid and other current assets ............................................................. (2,246) (2,583) (665) Accounts payable ................................................................................... (16,194) 18,757 5,197 Accrued expenses and other current liabilities ....................................... 13,694 11,842 (3,542)
Loss reserve and unearned premiums related to captive insurance subsidiary ................................................................ (8,143) (1,202)
6,880
Income taxes........................................................................................... 10,818 (5,941) 8,378 Other non-current liabilities.................................................................... 7,070 4,866 2,702 Other....................................................................................................... (1,941) (2,984) (1,123) NET CASH PROVIDED BY OPERATING ACTIVITIES ................... 174,594 221,203 190,605 CASH FLOWS FROM INVESTING ACTIVITIES: Purchases of property and equipment ........................................................... (122,896) (139,396) (104,620) Change in restricted assets related to captive insurance subsidiary............... 5,973 (1,943) (6,623) Acquisition of restaurants ............................................................................. (8,120) (47,616) (13,817) Lease acquisition costs.................................................................................. — — (4,875) Acquisition of other intangible asset............................................................. — — (2,809) Proceeds from sale of property and equipment ............................................. 281 1,237 66 Proceeds from sale–leaseback transaction .................................................... 3,090 — — Maturities and sales of short-term investments ............................................. — — (253) Other investing activities .............................................................................. — — (1,124) NET CASH USED BY INVESTING ACTIVITIES .............................. (121,672) (187,718) (134,055) CASH FLOWS FROM FINANCING ACTIVITIES: Purchases of treasury stock........................................................................... (38,522) (196,066) (99,723) Dividends paid.............................................................................................. (14,840) (4,867) (3,911) Issuance of common stock upon exercise of stock options ........................... 17,072 12,984 19,497 Shares issued under employee benefit plans ................................................. 4,167 4,402 5,979 Excess tax benefits from stock-based compensation..................................... 2,169 — — Net debt proceeds (payments)....................................................................... (13,182) 152,673 14,832 Deferred financing costs relating to issuance of long-term debt ................... (517) (213) (449) NET CASH USED BY FINANCING ACTIVITIES ............................. (43,653) (31,087) (63,775) NET INCREASE (DECREASE) IN CASH AND CASH EQUIVALENTS ........ 9,269 2,398 (7,225) CASH AND CASH EQUIVALENTS, beginning of period ................................. 13,040 10,642 17,867 CASH AND CASH EQUIVALENTS, end of period ........................................... $ 22,309 $ 13,040 $ 10,642
See notes to consolidated financial statements.

F-7
APPLEBEE’S INTERNATIONAL, INC. AND SUBSIDIARIES
CONSOLIDATED STATEMENTS OF CASH FLOWS - (Continued) (in thousands)
Fiscal Year Ended December 31,
2006 December 25,
2005 December 26,
2004
SUPPLEMENTAL DISCLOSURES OF CASH FLOW INFORMATION:
Cash paid during the year for: Income taxes............................................................ $ 37,580 $ 45,402 $ 12,428 Interest..................................................................... $ 11,575 $ 3,340 $ 1,056 SUPPLEMENTAL DISCLOSURES OF NONCASH INVESTING AND FINANCING ACTIVITIES: We issued nonvested shares (referred to as restricted stock prior to fiscal 2006) with grant date fair values of $4,500,000 in 2006, $2,921,000 in 2005 and $1,945,000 in 2004. In 2002, we entered into a rabbi trust agreement to protect the assets of the nonqualified deferred compensation plan for certain of our associates. The plan investments are included in other assets and the offsetting obligation is included in other non-current liabilities in our consolidated balance sheets. We had non-cash increases in these balances of $3,357,000, $3,940,000 and $3,881,000 in 2006, 2005 and 2004, respectively. We made matching contributions in shares of our common stock to a profit sharing plan and trust established in accordance with Section 401(k) of the Internal Revenue Code of $1,308,000 in 2004. In 2005, we began matching contributions in cash. We had property and equipment purchases accrued in accounts payable of approximately $10,400,000 and $11,100,000 as of December 31, 2006 and December 25, 2005, respectively. We declared cash dividends of $16,299,000, $14,840,000 and $4,867,000 in 2006, 2005 and 2004 which were subsequently paid in the following year.
See notes to consolidated financial statements.

F-8
APPLEBEE’S INTERNATIONAL, INC. AND SUBSIDIARIES NOTES TO CONSOLIDATED FINANCIAL STATEMENTS
1. Organization Applebee’s International, Inc. and our subsidiaries develop, franchise and operate casual dining restaurants under the name “Applebee’s Neighborhood Grill & Bar.” As of December 31, 2006, there were 1,930 Applebee’s restaurants. Franchisees operated 1,409 of these restaurants and 521 restaurants were company-owned. These restaurants were located in 49 states, 16 countries outside of the United States and one U.S. territory. On September 20, 2002, we formed Neighborhood Insurance, Inc., a regulated Vermont corporation and a wholly-owned subsidiary, as a captive insurance company. Neighborhood Insurance, Inc. was established to provide Applebee’s International, Inc. and qualified franchisees with workers’ compensation and general liability insurance. In 2006, we discontinued writing insurance coverage for new or existing participants (Note 14). 2. Summary of Significant Accounting Policies Principles of consolidation: The consolidated financial statements include our accounts and the accounts of our wholly-owned subsidiaries. We have eliminated all intercompany profits, transactions and balances. Fiscal year: Our fiscal year ends on the last Sunday of the calendar year. The fiscal year ended December 31, 2006 contained 53 weeks. The fiscal years ended December 25, 2005 and December 26, 2004 each contained 52 weeks. These fiscal years will be referred to hereafter as 2006, 2005 and 2004, respectively. Cash and cash equivalents: We consider all money market investment instruments to be cash and cash equivalents. Periodically, we have outstanding checks that are written in excess of the cash balances at our bank which create a book overdraft and are required to be presented as a current liability. As of December 25, 2005, we had checks written in excess of a bank balance of $13,430,000 which were included in accounts payable in the consolidated balance sheets. This balance was subsequently funded through our credit facility in 2006. Financial instruments: Our financial instruments as of December 31, 2006 and December 25, 2005 consist of cash equivalents, short-term investments, accounts receivable, notes payable and long-term debt, excluding capitalized lease obligations. The carrying amount of cash equivalents and accounts receivable (including receivables related to the captive insurance subsidiary) approximates fair value because of the short maturity of those instruments. We based the carrying amount of short-term investments on quoted market prices. We based the fair value of our long-term debt, excluding capitalized lease obligations, on quotations made on similar issues. The fair value of these financial instruments approximates the carrying amounts reported in the consolidated balance sheets. Investments: We have certificates of deposit that are included in short-term investments and auction rate securities that are included in restricted assets related to the captive insurance subsidiary in our consolidated balance sheets. We have classified all investments as available-for-sale. Due to the short time period between reset dates of the interest rates, there are no unrealized gains or losses associated with the auction rate securities. The contractual maturities of the auction rate securities range from 2030 to 2033. Inventories: We state inventories at the lower of cost, using the first-in, first-out method, or market. When necessary, we record inventory reserves for obsolescence and shrinkage based upon inventory turnover trends, historical experience and the specific identification method.

F-9
Property and equipment: We report property and equipment at historical cost less accumulated depreciation. Depreciation is recorded on a straight-line method over the estimated useful lives of the assets. Leasehold improvements are amortized over the lesser of the lease term, as defined in operating leases below, or the estimated useful life of the related asset. The general ranges of original depreciable lives are as follows:
• Buildings 20 years • Leasehold improvements 15-20 years • Furniture and equipment 2-7 years
We record capitalized interest in connection with the development of new restaurants and amortize it over the estimated useful life of the related asset. We capitalized $959,000 in interest costs during 2006, $462,000 during 2005 and $189,000 during 2004. Software costs: Costs incurred in connection with the development of internal-use software are capitalized and amortized over the expected useful life of the asset. Goodwill: Goodwill is not subject to amortization but is tested for impairment annually or more frequently if events or changes in circumstances indicate that the asset might be impaired. If an impairment is indicated, the fair value of the reporting unit’s goodwill is determined by allocating the unit’s fair value to its assets and liabilities (including any unrecognized intangible assets) as if the reporting unit had been acquired in a business combination. The amount of impairment for goodwill is measured as the excess of its carrying value over its implied fair value. Impairment of long-lived assets: We review our restaurant property and equipment for impairment quarterly on a restaurant-by-restaurant basis using historical cash flows as well as current estimates of future cash flows and/or appraisals. We review other non-amortizing long-lived assets annually and when events or circumstances indicate that the carrying value of the asset may not be recoverable. The recoverability is assessed in most instances by comparing the carrying value to its undiscounted cash flows. Use of estimates: The preparation of financial statements in conformity with accounting principles generally accepted in the United States of America requires management to make estimates and assumptions. These estimates, which are frequently made in consultation with certain third-party advisors, include, but are not limited to, estimates for legal actions and general liability, workers’ compensation and health insurance, long-term incentives and the collectibility of receivables. We are periodically involved in various legal actions arising in the normal course of business. We are required to assess the probability of any adverse judgments as well as the potential range of loss. We determine the required accruals after consideration of the probability of adverse judgment and a review of the facts of each legal action. The estimated liability for general liability, workers’ compensation and health insurance is established based upon historical claims data and third-party actuarial estimates of settlement costs for incurred claims. We recognized expense of $24,168,000 in 2006, $27,557,000 in 2005 and $25,116,000 in 2004 related to these types of insurance in our consolidated financial statements. Unanticipated changes in these factors may require us to revise our estimates. We have various long-term associate incentive compensation plans which require us to make estimates to determine our liability based upon projected performance of plan criteria. If actual performance against the criteria differs from our estimates in the future, we will be required to adjust our liability accordingly.

F-10
We continually assess the collectibility of our franchise receivables. We establish our allowance for bad debts based on several factors, including historical collection experience, the current economic environment and other specific information available to us at the time. The allowance for bad debts may change in the future due to changes in the factors above or other new developments. Estimates and assumptions used by management affect the reported amounts of assets and liabilities, the disclosure of contingent assets and liabilities at the date of the financial statements and the reported amounts of revenues and expenses during the reporting period. Actual results could differ from those estimates. Revenue Recognition: We recognize company restaurant sales when food and beverage items are sold. Company restaurant sales are reported net of sales tax collected from our guests and are remitted to the appropriate taxing authorities. We record a liability in the period in which a gift card is issued and proceeds are received. As gift cards are redeemed, this liability is reduced and revenue is recognized. We recognize gift card slippage income when the likelihood of the redemption of the card becomes remote. We recognize royalties on a franchisee’s sales in the period in which the sales are reported to have occurred. The recognition of franchise fees is deferred until we have performed substantially all of our related obligations as franchisor, typically when the restaurant opens. Franchise fees, included in franchise royalties and fees in the consolidated statements of earnings, totaled $3,957,000 for 2006, $3,358,000 for 2005 and $3,096,000 for 2004. Other franchise income includes insurance premiums from franchisee participation in our captive insurance program in 2005 and 2004 and revenue from information technology products and services provided to certain franchisees in all periods. Income from franchisee premiums and information technology services is recognized ratably over the related contract period. Income from information technology products is recognized when the products are installed at the restaurant. Advertising costs: We recognize company-owned restaurant contributions to the national marketing pool in the period the contribution accrues. We expense most local advertising costs for company-owned restaurants as we incur them, but we expense the production costs of advertising the first time the advertising takes place. Advertising expense related to company-owned restaurants was $56,731,000 for 2006, $51,969,000 for 2005 and $46,324,000 for 2004. Operating leases: We account for our restaurant and office space leases in accordance with Statement of Financial Accounting Standards (“SFAS”) No.13, “Accounting for Leases” and other authoritative guidance. We recognize rent expense for our operating leases, which have escalating rentals over the term of the lease, on a straight-line basis over the initial term and those option periods where failure to exercise such options would result in an economic penalty such that the renewal appears reasonably assured. In addition, the lease term is deemed to commence on the date we become legally obligated for rent payments. Prior to 2006, we capitalized the straight-line rent amounts during the construction period of leased properties. In 2006, we changed our policy to expense the straight-line rent during the construction period as required by FASB Staff Position (“FSP”) 13-1, “Accounting for Rental Costs Incurred during a Construction Period.” The impact of FSP 13-1 was not material to our consolidated financial statements. Straight-line rent subsequent to the construction period and prior to the restaurant opening is recognized as expense. We use a consistent lease term when calculating depreciation of leasehold improvements, determining straight-line rent expense and determining classification of our leases as either operating or capital. Contingent rents are generally amounts due as a result of sales in excess of amounts stipulated in certain restaurant leases and are included in rent expense as they accrue.

F-11
Certain of our lease agreements contain tenant improvement allowances, rent holidays, lease premiums, rent escalation clauses and/or contingent rent provisions. For purposes of recognizing incentives, premiums, rent holidays and minimum rental expenses on a straight-line basis over the terms of the leases, we use the date of initial possession to begin amortization, which is generally when we enter the property and begin to make improvements in preparation of its intended use. For tenant improvement allowances, we record a deferred rent liability in either other current liabilities or other non-current liabilities on the consolidated balance sheet and amortize the deferred rent over the term of the lease as a reduction to direct and occupancy costs in the consolidated statements of earnings. Asset Retirement Obligations: In 2005, we adopted FASB Interpretation No. 47 “Accounting for Conditional Asset Retirement Obligations” (“FIN 47”). We have entered into certain leases which may require us to return the property to the landlord in its original condition. Beginning in 2005, we recorded expenses for these leases in our consolidated financial statements in direct and occupancy costs. We recorded an expense of $350,000 ($225,000, net of income taxes) for years prior to 2005 as a cumulative effect of a change in accounting principle as required by FIN 47. Pre-opening expense: We expense direct training, food and beverage costs and other costs, including rent expense subsequent to the construction period but prior to restaurant opening, related to opening new or relocated restaurants as they are incurred, which is typically in the month of opening. Income taxes: We use the asset and liability method to determine deferred income taxes. Deferred tax assets and liabilities are computed based upon future tax consequences associated with differences between the financial statement carrying amount and the tax bases of assets and liabilities. Net earnings per share: We compute basic net earnings per common share by dividing income available to common shareholders by the weighted average number of common shares outstanding for the reporting period. Diluted net earnings per common share reflects the potential dilution that could occur if holders of options or other contracts to issue common stock exercised or converted their holdings into common stock. Outstanding stock options, stock appreciation rights and other equity-based compensation represent the only dilutive effects on weighted average shares. The chart below presents a reconciliation between basic and diluted weighted average shares outstanding and the related net earnings per share. All amounts in the chart, except per share amounts, are expressed in thousands.
2006 2005 2004 Net earnings......................................................... $ 80,906 $ 101,802 $ 110,865 Basic weighted average shares outstanding ........ 74,001 78,650 81,528Dilutive effect of stock options and equity-based compensation .............................
935
1,360
2,072
Diluted weighted average shares outstanding ..... 74,936 80,010 83,600 Basic net earnings per common share ................. $ 1.09 $ 1.29 $ 1.36Diluted net earnings per common share .............. $ 1.08 $ 1.27 $ 1.33
We excluded stock options and stock appreciation rights (“SARs”) with exercise prices greater than the average market price of our common stock for the applicable periods from the computation of diluted weighted average shares outstanding as the effect would be anti-dilutive. We excluded approximately 5,400,000, 2,800,000 and 1,500,000 of these options and SARs from our diluted weighted average share computation for 2006, 2005 and 2004, respectively.

F-12
Cash flows: For purposes of the consolidated statements of cash flows, we consider all highly liquid investments purchased with an original maturity of three months or less to be cash equivalents. New accounting pronouncements: In March 2006, the Emerging Issues Task Force (“EITF”) issued EITF Issue 06-3, “How Taxes Collected from Customers and Remitted to Governmental Authorities Should Be Presented in the Income Statement (That Is, Gross versus Net Presentation).” A consensus was reached that entities may adopt a policy of presenting sales taxes in the income statement on either a gross or net basis. If taxes are significant, an entity should disclose its policy of presenting taxes and the amounts of taxes. The guidance is effective for periods beginning after December 15, 2006. We present company sales net of sales taxes in our consolidated financial statements. The impact of this adoption did not change our method for recording sales taxes in our consolidated financial statements. In July 2006, the Financial Accounting Standards Board (“FASB”) issued FASB Interpretation No. (“FIN”) 48, “Accounting for Uncertainty in Income Taxes,” which clarifies the accounting for uncertainty in income taxes recognized in the financial statements in accordance with SFAS No. 109, “Accounting for Income Taxes.” FIN 48 is effective for fiscal years beginning after December 15, 2006. The impact of this adoption will not be material to our consolidated financial statements. In September 2006, the FASB issued SFAS No. 157, “Fair Value Measurements.” This statement defines fair value, establishes a framework for using fair value to measure assets and liabilities, and expands disclosures about fair value measurements. The statement applies whenever other statements require or permit assets or liabilities to be measured at fair value. SFAS No. 157 is effective for fiscal years beginning after November 15, 2007. The impact of this adoption will not be material to our consolidated financial statements. In September 2006, the FASB issued SFAS No. 158, “Employers’ Accounting for Defined Benefit Pension and Other Postretirement Plans.” This statement requires companies to recognize a net liability or asset and an offsetting adjustment to accumulated other comprehensive income to report the funded status of defined benefit pension and other postretirement benefit plans. The statement requires prospective application, and the recognition and disclosure requirements are effective for companies with fiscal years ending after December 15, 2006. Additionally, SFAS No. 158 requires companies to measure plan assets and obligations at their year-end balance sheet date. This requirement is effective for fiscal years ending after December 15, 2008. The impact of this adoption was not material to our consolidated financial statements and we are in compliance with the measurement date provisions of this statement as of December 31, 2006. In September 2006, the SEC issued Staff Accounting Bulletin (“SAB”) No. 108, “Considering the Effects of Prior Year Misstatements when Quantifying Misstatements in Current Year Financial Statements,” which provides interpretive guidance regarding the consideration given to prior year misstatements when determining materiality in current year financial statements. SAB No. 108 is effective for fiscal years ending after November 15, 2006. The impact of this adoption was not material to our consolidated financial statements. In October 2006, the FASB issued FASB Staff Position (“FSP”) FAS 123 (R)-5, “Amendment to FSP FAS 123 (R)-1.” FSP FAS 123(R)-5 addresses whether a modification of an instrument in connection with an equity restructuring should be considered a modification for purposes of applying FSP FAS 123(R)-1. This FSP states that no change in the recognition or the measurement (due to a change in classification as a result of a modification solely to reflect an equity restructuring that occurs when the holders are no longer employees) of the instruments will result if two conditions are met: (1) there is no increase in fair value of the award or the antidilution provision is not added to the terms of the award in contemplation of an equity restructuring and (2) all holders of the same class of equity instruments are treated in the same manner. The effective date of FSP FAS 123(R)-5 is the first reporting period beginning after October 10, 2006. The impact of this adoption was not material to our consolidated financial statements.

F-13
In February 2007, the FASB issued SFAS No. 159, “The Fair Value Option for Financial Assets and Liabilities.” This statement permits entities to choose to measure many financial instruments and certain other items at fair value. If the fair value option is elected, unrealized gains and losses will be recognized in earnings at each subsequent reporting date. SFAS No. 159 is effective for fiscal years beginning after November 15, 2007. We are currently evaluating the impact of this adoption on our consolidated financial statements. 3. Stock-Based Compensation Our Board of Directors has approved the Amended and Restated 1995 Equity Incentive Plan (“1995 Plan”) and the 1999 Employee Incentive Plan (“1999 Plan”) which allow for the granting of stock options, SARs, nonvested shares, performance units and performance shares to eligible participants. Grants of stock options may be either incentive or nonqualified. There are 19,900,000 and 2,473,875 shares authorized under the 1995 Plan and the 1999 Plan, respectively. As of December 31, 2006, we estimate there are 3,382,155 shares available for grant under the 1995 Plan. This estimate is based upon the total number of SARs that would be exercised using the market price of our stock as of December 29, 2006. We will not make additional grants under the 1999 Plan. Only shares actually issued upon exercise of a SAR are counted against the shares authorized under the 1995 Plan. We issue shares out of our treasury for stock option exercises, SAR exercises and nonvested share issuances. In 2002, our Board of Directors approved performance share plans with a three-year performance period. Performance shares represent rights to receive our common stock, cash or any combination thereof, based upon certain performance criteria. In 2004, we reversed $447,000 of compensation expense previously recognized due to the 2004 performance versus our three-year performance criteria. We recorded compensation expense of $65,000 in 2005 related to these grants. These amounts were based on the market price of our common stock at the end of each fiscal year. We no longer grant performance shares. Prior to 2006, we accounted for these stock-based compensation equity awards under the intrinsic method of Accounting Principles Board (“APB”) Opinion No. 25. APB Opinion No. 25 required compensation cost to be recognized based on the excess, if any, between the quoted market price of the stock at the date of grant and the amount an employee must pay to acquire the stock. All options awarded under both of our plans were granted with an exercise price equal to the fair market value on the date of the grant and, accordingly, no compensation expense was recognized for stock option awards. In addition, we adopted the disclosure provisions of SFAS No. 148, “Accounting for Stock-Based Compensation – Transition and Disclosure, an amendment of FASB Statement No. 123.” The statement required prominent disclosures in financial statements regarding the method of accounting for stock-based employee compensation and the effect of the method used on reported results.

F-14
Under APB Opinion No. 25, pro forma expense for stock-based compensation was calculated using a graded vesting schedule over the explicit vesting period. The following table presents the effect on our net earnings and earnings per share had we adopted the fair value method of accounting for stock-based compensation under SFAS No. 123, “Accounting for Stock-Based Compensation” for 2005 and 2004 (in thousands, except for per share amounts).
2005 2004 Net earnings, as reported...................................... $ 101,802 $ 110,865 Add: Stock-based compensation expense included in net earnings, net of related taxes ..
1,409
638
Less: Total stock-based employee compensation expense determined under fair value based methods for all equity awards, net of related taxes(1) .....................................
8,536
8,555
Pro forma net earnings ......................................... $ 94,675 $ 102,948 Basic net earnings per common share, as reported........................................................
$ 1.29
$ 1.36
Basic net earnings per common share, as adjusted........................................................
$ 1.20
$ 1.26
Diluted net earnings per common share, as reported........................................................
$ 1.27
$ 1.33
Diluted net earnings per common share, as adjusted........................................................
$ 1.18
$ 1.23
(1) SFAS No. 123 (revised 2004) requires compensation expense to be recognized over the requisite service period which is generally from the grant date to the earlier of a) the explicit vesting date or b) the date on which the employee becomes retirement eligible. If pro forma expense for 2005 and 2004 had been derived using this approach, additional stock-based compensation would have been $2,731 and $2,013, net of tax, respectively, and pro forma net income would have been $91,944 and $100,935, respectively. Additionally, basic and diluted pro forma earnings per share would have been $1.17 and $1.15, respectively, for 2005 and $1.24 and $1.21, respectively, for 2004. We adopted the fair value recognition provisions of SFAS No. 123(R), “Share-Based Payment” (“SFAS 123(R)”) at the beginning of 2006. SFAS No. 123(R) requires all stock-based compensation, including grants of employee stock options, to be recognized in the statement of earnings based on fair value. With limited exceptions, the amount of compensation cost is measured based on the fair value on the grant date of the equity or liability instruments issued. Compensation cost is recognized over the period that an employee provides service for that award. We adopted this accounting treatment using the modified prospective transition method; therefore, results for prior periods have not been restated. Beginning in 2006, we changed our method of determining the fair value of stock-based equity awards from the Black-Scholes model to a binomial model. The binomial model considers a range of assumptions relative to volatility, risk-free interest rates and employee exercise behavior, which models actual employee behaviors. We believe the binomial model provides a fair value that is more representative of actual and future experience as compared to the Black-Scholes model. Compensation costs for 2006 have been recognized for all new equity awards granted in 2006 and those equity awards granted prior to 2006 that have yet to reach the end of their service period. As required by SFAS No. 123(R), we began recognizing expense for employee stock-based compensation over the shorter of the vesting period or the period from the date of the grant until the date the employee becomes eligible for

F-15
retirement. We recognize expense for stock-based compensation over the graded vesting period. We recognized stock-based compensation in the consolidated financial statements as follows:
2006 2005 2004 Labor ...................................................................
$ 930
$ —
$ —
General and administrative expenses .................. 20,864 2,231 975 Income taxes........................................................ (7,410) (822) (337) Stock-based compensation expense included in net earnings, net of related tax ....................
$ 14,384
$ 1,409
$ 638
As of December 31, 2006, we had unrecognized compensation expense for stock options and SARs of $16,300,000 to be recognized over a weighted average period of 1.8 years. As required by SFAS No. 123(R), unearned compensation of $2,614,000, which was previously reflected as a reduction to stockholders’ equity as of December 25, 2005, was reclassified as a reduction to additional paid-in capital upon our adoption of this statement. Stock Options Prior to 2005, we granted substantially all of our equity awards through stock options once per year. These stock options generally vest over three years and expire ten years from the date of the grant. In 2005, we granted substantially all of our equity awards through quarterly stock option grants. Grants issued in the first quarter of each year vest three years from the date of the grant. Grants issued in subsequent quarters vest on the same date as the first quarterly stock option grant of that year. In 2005 and 2006, we also granted to certain employees stock options with 25% of the grant vesting four years from the grant date and the remaining 75% of the grant vesting five years from the grant date. The 2005 option grants expire six to seven years from the date of the grant. In the first quarter of 2006, we issued grants to certain employees and members of the Board of Directors which vest either one or three years from the date of the grant. As part of their compensation package, the outside members of the board of directors receive a grant of options in the first quarter of every year which expire ten years from the grant date.

F-16
Transactions for stock options relative to both plans for 2004 to 2006 were as follows:
1995 Plan
Number of Options
Weighted Average Exercise
Price
Weighted Average
Remaining Contractual
Life
Aggregate Intrinsic Value
(in thousands) Options outstanding at December 28, 2003 .............
5,487,048
$ 12.84
7.4 years
Granted........................... 1,596,944 $ 25.82 Exercised ........................ (1,445,331) $ 10.09 $ 22,138 Forfeited ......................... (570,853) $ 14.91 Options outstanding at December 26, 2004 ............. 5,067,808 $ 17.48
7.3 years
Granted........................... 3,277,725 $ 25.69 Exercised ........................ (638,163) $ 11.89 $ 9,188 Forfeited ......................... (341,437) $ 23.80 Options outstanding at December 25, 2005 .............
7,365,933
$ 21.33
6.5 years
Granted........................... 453,943 $ 22.16 Exercised ........................ (1,058,021) $ 13.45 $ 10,838 Expired ........................... (120) $ 8.30 Forfeited ......................... (586,486) $ 25.62 Options outstanding at December 31, 2006 .............
6,175,249
$ 22.33
5.8 years
$ 20,139
Options vested and expected to vest at December 31, 2006 ..
5,667,470
$ 22.07
1.1 years
$ 19,786
Options exercisable at December 31, 2006 .............
1,985,145
$ 16.02
5.4 years
$ 17,473

F-17
1999 Plan
Number of Options
Weighted Average Exercise
Price
Weighted Average
Remaining Contractual
Life
Aggregate Intrinsic Value
(in thousands) Options outstanding at December 28, 2003 .............
1,775,097
$ 12.77
7.7 years
Granted........................... — — Exercised ........................ (572,048) $ 10.46 $ 8,744 Forfeited ......................... (73,439) $ 14.81 Options outstanding at December 26, 2004 ............. 1,129,610
$ 13.80
7.0 years
Granted........................... — — Exercised ........................ (418,813) $ 13.67 $ 5,325 Forfeited ......................... (46,141) $ 16.02 Options outstanding at December 25, 2005 ............. 664,656
$ 13.73
6.0 years
Granted........................... — — Exercised ........................ (213,758) $ 13.74 $ 2,090 Expired ........................... — — Forfeited ......................... (505) $ 13.22 Options outstanding at December 31, 2006 ............. 450,393
$ 13.72
4.9 years
$ 4,933
Options vested and expected to vest at December 31, 2006 .. 450,315
$ 13.72
4.9 years
$ 4,932
Options exercisable at December 31, 2006 ............. 445,893
$ 13.69
4.9 years
$ 4,895
The aggregate intrinsic value was calculated using the difference between the current market price and the grant price for only those equity awards that have a grant price that is less than the current market price.
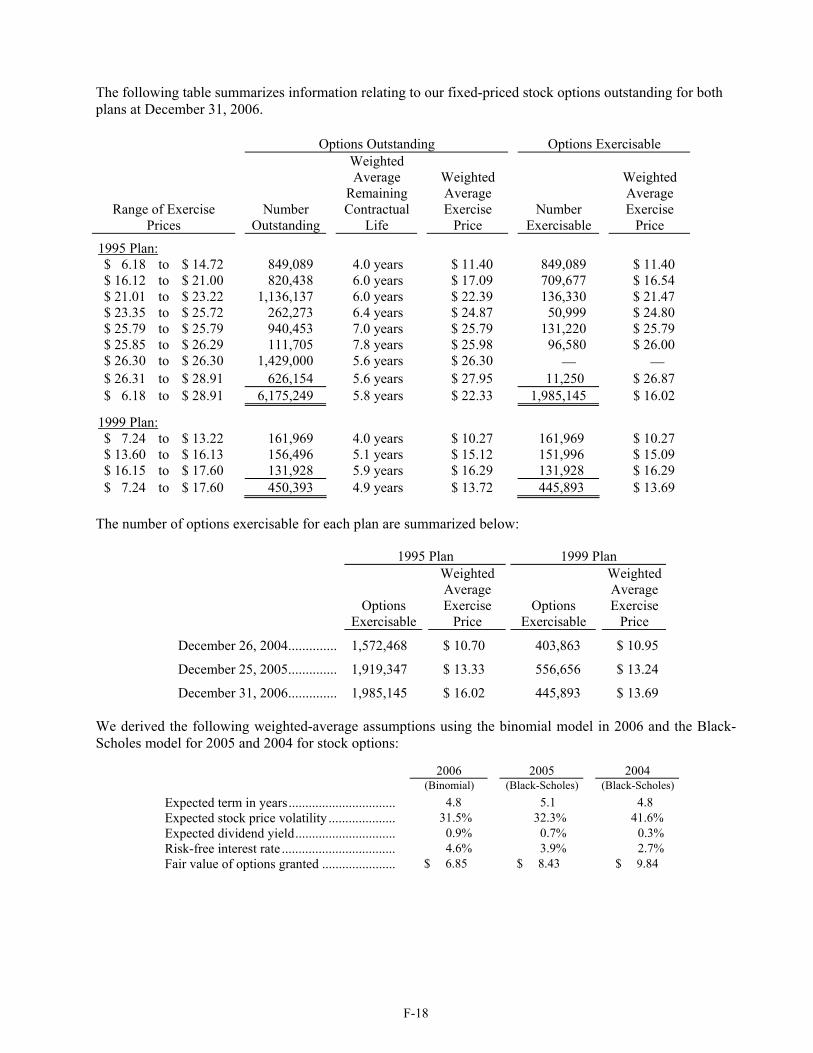
F-18
The following table summarizes information relating to our fixed-priced stock options outstanding for both plans at December 31, 2006.
Options Outstanding Options Exercisable
Range of Exercise Prices
Number Outstanding
Weighted Average
Remaining Contractual
Life
Weighted Average Exercise
Price
Number Exercisable
Weighted Average Exercise
Price
1995 Plan: $ 6.18 to $ 14.72 849,089 4.0 years $ 11.40 849,089 $ 11.40 $ 16.12 to $ 21.00 820,438 6.0 years $ 17.09 709,677 $ 16.54 $ 21.01 to $ 23.22 1,136,137 6.0 years $ 22.39 136,330 $ 21.47 $ 23.35 to $ 25.72 262,273 6.4 years $ 24.87 50,999 $ 24.80 $ 25.79 to $ 25.79 940,453 7.0 years $ 25.79 131,220 $ 25.79 $ 25.85 to $ 26.29 111,705 7.8 years $ 25.98 96,580 $ 26.00 $ 26.30 to $ 26.30 1,429,000 5.6 years $ 26.30 — — $ 26.31 to $ 28.91 626,154 5.6 years $ 27.95 11,250 $ 26.87 $ 6.18 to $ 28.91 6,175,249 5.8 years $ 22.33 1,985,145 $ 16.02
1999 Plan: $ 7.24 to $ 13.22 161,969 4.0 years $ 10.27 161,969 $ 10.27 $ 13.60 to $ 16.13 156,496 5.1 years $ 15.12 151,996 $ 15.09 $ 16.15 to $ 17.60 131,928 5.9 years $ 16.29 131,928 $ 16.29 $ 7.24 to $ 17.60 450,393 4.9 years $ 13.72 445,893 $ 13.69 The number of options exercisable for each plan are summarized below:
1995 Plan 1999 Plan
Options
Exercisable
Weighted Average Exercise
Price
Options Exercisable
Weighted Average Exercise
Price
December 26, 2004.............. 1,572,468 $ 10.70 403,863 $ 10.95
December 25, 2005.............. 1,919,347 $ 13.33 556,656 $ 13.24
December 31, 2006.............. 1,985,145 $ 16.02 445,893 $ 13.69 We derived the following weighted-average assumptions using the binomial model in 2006 and the Black-Scholes model for 2005 and 2004 for stock options:
2006 2005 2004 (Binomial) (Black-Scholes) (Black-Scholes) Expected term in years................................ 4.8 5.1 4.8 Expected stock price volatility .................... 31.5% 32.3% 41.6% Expected dividend yield.............................. 0.9% 0.7% 0.3% Risk-free interest rate .................................. 4.6% 3.9% 2.7% Fair value of options granted ...................... $ 6.85 $ 8.43 $ 9.84

F-19
Stock Appreciation Rights Beginning in 2006, we began granting substantially all of our equity awards through quarterly nonvested share and SAR grants which are exercisable in shares of our common stock. Grants issued for the first quarter of each year vest three years from the date of the grant. Grants issued in subsequent quarters vest on the same date as the first quarterly grant of that year. The SARs granted in 2006 expire six to seven years from the date of the grant. Transactions for SARs for 2006 were as follows:
1995 Plan
Number of SARs
Weighted Average Exercise
Price
Weighted Average
Remaining Contractual
Life
Aggregate Intrinsic Value
(in thousands) SARs outstanding at December 25, 2005 ............. —
—
Granted(1) ........................ 1,231,467 $ 21.81 Exercised ........................ — — Expired ........................... — — Forfeited ......................... (64,600) $ 22.17 SARs outstanding at December 31, 2006 ............. 1,166,867
$ 21.80
6.2 years
$ 3,354
SARs vested and expected to vest at December 31, 2006 .. 997,571
$ 21.80
2.2 years
$ 2,868
SARs exercisable at December 31, 2006 ............. —
(1) Upon exercise of SARs, employees will receive the number of shares of common stock equal in value to the appreciation in the fair market value based on the difference between the fair market value on the grant date and the fair market value on the date of exercise. The number of shares of common stock delivered as payment of such appreciation will reduce the shares available for issuance under the 1995 Plan. The following table summarizes information related to our SARs outstanding at December 31, 2006.
SARs Outstanding SARs Exercisable
Range of Exercise Prices
Number Outstanding
Weighted Average
Remaining Contractual
Life
Weighted Average Exercise
Price
Number Exercisable
Weighted Average Exercise
Price
1995 Plan: $ 19.92 to $ 21.00 598,164 6.2 years $ 20.66 — — $ 22.34 to $ 22.34 267,978 6.2 years $ 22.34 — — $ 23.57 to $ 23.57 300,725 6.2 years $ 23.57 — — $ 19.92 to $ 23.57 1,166,867 6.2 years $ 21.80 — —

F-20
We derived the following weighted-average assumptions for SARs using the binomial model:
2006 Expected term in years 4.2 Expected stock price volatility 31.7% Expected dividend yield 0.9% Risk-free interest rate 4.7% Fair value of SARs granted $ 6.27
Assumptions We determined our assumptions for stock options and SAR grants based on the following methodology: Expected term: We have determined the expected term based upon the assumption that all outstanding options and SARs will be exercised at the midpoint of the current holding period and the full contractual term. Expected volatility: We have determined the expected volatility based on a weighted average of Applebee’s volatility over the expected term, historical volatility of certain peer group restaurant volatilities and Applebee’s implied volatility. Expected dividend yield: We have determined the expected dividend yield based upon our expected dividends as a percentage of our current stock price. Risk-free interest rate: We have determined the risk-free interest rate using the U.S. Treasury yield curve in effect at the time of the grant for the expected term of the equity award. Nonvested Shares We grant nonvested shares under our 1995 Plan. Nonvested shares vest either one, two or three years after the date of the grant. The fair value of nonvested shares granted is equal to the market price of the stock at the date of grant. Transactions during 2004 to 2006 were as follows:
Number of
Awards
Weighted Average
Fair Value Nonvested share awards outstanding as of December 28, 2003................. 182,602 $ 16.59 Granted....................................................................................................... 84,882 25.08 Vested......................................................................................................... (73,031) 14.99 Forfeited ..................................................................................................... (7,183) 22.26 Nonvested share awards outstanding as of December 26, 2004................. 187,270 $ 20.85 Granted....................................................................................................... 117,679 27.66 Vested......................................................................................................... (33,917) 18.53 Forfeited ..................................................................................................... (13,219) 25.30 Nonvested share awards outstanding as of December 25, 2005................. 257,813 $ 24.03 Granted....................................................................................................... 204,501 21.79 Vested......................................................................................................... (105,168) 19.29 Forfeited ..................................................................................................... (37,245) 25.85 Nonvested share awards outstanding as of December 31, 2006................. 319,901 $ 23.95

F-21
As of December 31, 2006, we had unrecognized compensation expense related to nonvested share awards of approximately $2,200,000, which will be recognized over a weighted average period of 1.5 years. Employee stock purchase plan Our Board of Directors has authorized an employee stock purchase plan that allows associates to purchase shares of our common stock at a 15% discount through a payroll deduction. We record compensation for this plan using the Black-Scholes valuation model in the quarter that the purchase occurs. As of December 31, 2006, 142,480 shares of the 1,850,000 shares which were authorized under this plan were available for purchase. 4. Acquisitions All of our acquisitions discussed below have been accounted for using the purchase method of accounting and, accordingly, our consolidated financial statements reflect the results of operations for each acquisition subsequent to the date of acquisition. The assets acquired and liabilities assumed are recorded at estimates of fair value as determined by management based upon information available. We finalize the allocation of purchase price to the fair value of assets acquired and liabilities assumed when we obtain information sufficient to complete the allocation, but in each case, no longer than one year after the acquisition date. In April 2004, we completed our acquisition of the operations and assets of 10 Applebee’s restaurants located in Southern California for approximately $13,800,000 in cash. The purchase price was allocated to the fair value of property and equipment of $2,500,000, goodwill of $10,800,000, and other net assets of approximately $500,000. In May 2005, we completed the acquisition of 12 Applebee’s restaurants in Missouri, Kansas and Arkansas, which included one restaurant under construction, for approximately $39,500,000 in cash. The purchase price was allocated to the fair value of property and equipment of $17,500,000, goodwill of $21,500,000, reacquired franchise rights of approximately $300,000, and other net assets of approximately $200,000. In January 2006, we completed the acquisition of four Applebee’s restaurants in the Houston market for approximately $8,100,000 in cash. The purchase price was allocated to the fair value of property and equipment of $7,400,000, goodwill of approximately $500,000, reacquired franchise rights of approximately $100,000, and other net assets of approximately $100,000. The following table is comprised of actual company restaurant sales for the three restaurant acquisitions above, which are included in our consolidated financial statements for each period presented, and pro forma company restaurant sales. The pro forma company restaurant sales for 2006 include sales related to the January 2006 acquisition discussed above as if the acquisition had occurred as of the beginning of 2006. The pro forma company restaurant sales for 2005 includes sales related to the January 2006 acquisition and the May 2005 acquisition discussed above as if the acquisitions had occurred as of the beginning of 2005. The pro forma company restaurant sale for 2004 includes sales related to the May 2005 acquisition and the April 2004 acquisition discussed above as if the acquisition had occurred as of the beginning of 2004.
2006 2005 2004 Actual company restaurant sales for acquired restaurants ...................................
$ 6,400
$ 17,000
$ 17,600
Pro forma company restaurant sales for acquired restaurants ...................................
$ 7,100
$ 32,800
$ 52,600

F-22
In April 2005, we completed the acquisition of eight Applebee’s restaurants in the Memphis market, which were closed in 2004 by a former franchisee, for approximately $8,800,000 payable in cash. In connection with this acquisition, we paid approximately $800,000 in 2004 and $8,000,000 in 2005. The purchase price of $8,800,000 was allocated to the fair value of property and equipment of approximately $8,200,000 and goodwill of approximately $600,000. We have remodeled and opened seven restaurants and the remaining restaurant was sold to a third-party. 5. Inventory Impairment In 2004, we determined that we had excess inventories of riblets that no longer met our quality standards. Accordingly, we recorded an inventory impairment of $2,000,000 ($1,300,000, net of income taxes) in our consolidated statements of earnings for 2004. The portion of the riblet inventory impairment related to the company’s historical usage of approximately $400,000 was recorded in food and beverage cost and the portion related to the franchisee’s historical usage of approximately $1,600,000 was recorded in cost of other franchise income in the consolidated statements of earnings. 6. Impairment and Other Restaurant Closure Costs In 2006, we recorded impairment and other restaurant closure costs of $8,800,000 ($5,830,000, net of taxes) consisting of $5,500,000 of property and equipment and lease acquisition costs, $1,500,000 for a write-down of an investment, $900,000 for restaurant closure costs and $900,000 for a write-down of a corporate aircraft. This charge has been included in our consolidated statement of earnings for 2006. In 2005, we recorded an impairment of $3,900,000 ($2,500,000, net of income taxes) consisting of a $2,600,000 write-down of the carrying value of the property and equipment of three restaurants that were not performing as expected and one restaurant that was closed and relocated and a $1,300,000 write-down of one other long-lived asset. This impairment charge has been included in our consolidated statements of earnings for 2005. In assessing restaurants for impairment, we use current and historical operating results to estimate future cash flows on a restaurant by restaurant basis. The asset impairment charges for 2005 and 2006 were calculated by comparing the carrying value of the restaurants’ assets to the estimated future cash flow projections. In assessing the above non-restaurant assets for impairment, we used an estimate of their fair market value. 7. Assets Held for Sale We classify assets as held for sale when there is a plan for disposal of assets and those assets meet the held for sale criteria as defined in SFAS No. 144, “Accounting for Impairment or Disposal of Long-Lived Assets.” During 2006, we began to actively market our existing corporate headquarters under a plan approved by management. Consequently, we have classified the building and land as held for sale as of December 31, 2006. In addition, we began to actively market a corporate aircraft and other assets with immaterial carrying values. We ceased amortizing these assets when we classify the assets as held for sale. In February 2007, the corporate aircraft was sold and we recognized an immaterial gain.
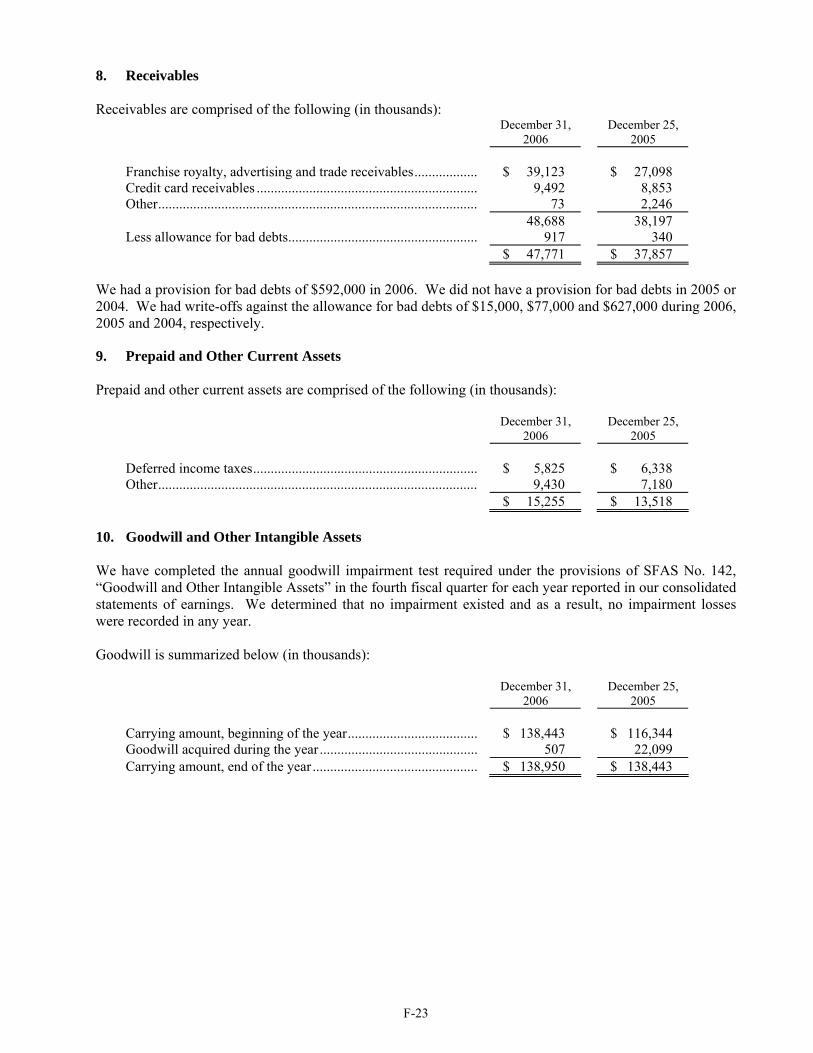
F-23
8. Receivables Receivables are comprised of the following (in thousands):
December 31, 2006
December 25, 2005
Franchise royalty, advertising and trade receivables.................. $ 39,123 $ 27,098 Credit card receivables ............................................................... 9,492 8,853 Other........................................................................................... 73 2,246 48,688 38,197 Less allowance for bad debts...................................................... 917 340 $ 47,771 $ 37,857
We had a provision for bad debts of $592,000 in 2006. We did not have a provision for bad debts in 2005 or 2004. We had write-offs against the allowance for bad debts of $15,000, $77,000 and $627,000 during 2006, 2005 and 2004, respectively. 9. Prepaid and Other Current Assets Prepaid and other current assets are comprised of the following (in thousands):
December 31, 2006
December 25, 2005
Deferred income taxes................................................................ $ 5,825 $ 6,338 Other........................................................................................... 9,430 7,180 $ 15,255 $ 13,518
10. Goodwill and Other Intangible Assets We have completed the annual goodwill impairment test required under the provisions of SFAS No. 142, “Goodwill and Other Intangible Assets” in the fourth fiscal quarter for each year reported in our consolidated statements of earnings. We determined that no impairment existed and as a result, no impairment losses were recorded in any year. Goodwill is summarized below (in thousands):
December 31, 2006
December 25, 2005
Carrying amount, beginning of the year..................................... $ 138,443 $ 116,344 Goodwill acquired during the year ............................................. 507 22,099 Carrying amount, end of the year ............................................... $ 138,950 $ 138,443
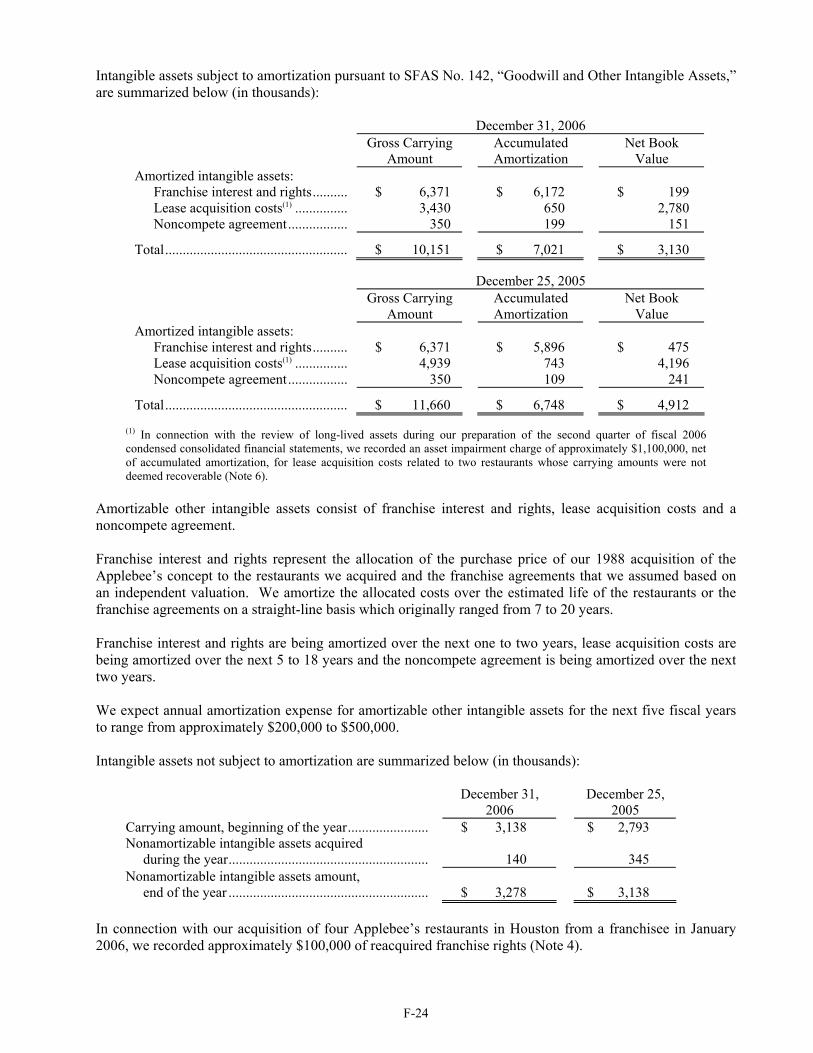
F-24
Intangible assets subject to amortization pursuant to SFAS No. 142, “Goodwill and Other Intangible Assets,” are summarized below (in thousands):
December 31, 2006 Gross Carrying
Amount Accumulated
Amortization Net Book
Value Amortized intangible assets: Franchise interest and rights.......... $ 6,371 $ 6,172 $ 199 Lease acquisition costs(1) ............... 3,430 650 2,780 Noncompete agreement................. 350 199 151
Total.................................................... $ 10,151 $ 7,021 $ 3,130
December 25, 2005 Gross Carrying
Amount Accumulated
Amortization Net Book
Value Amortized intangible assets: Franchise interest and rights.......... $ 6,371 $ 5,896 $ 475 Lease acquisition costs(1) ............... 4,939 743 4,196 Noncompete agreement................. 350 109 241
Total.................................................... $ 11,660 $ 6,748 $ 4,912
(1) In connection with the review of long-lived assets during our preparation of the second quarter of fiscal 2006 condensed consolidated financial statements, we recorded an asset impairment charge of approximately $1,100,000, net of accumulated amortization, for lease acquisition costs related to two restaurants whose carrying amounts were not deemed recoverable (Note 6).
Amortizable other intangible assets consist of franchise interest and rights, lease acquisition costs and a noncompete agreement. Franchise interest and rights represent the allocation of the purchase price of our 1988 acquisition of the Applebee’s concept to the restaurants we acquired and the franchise agreements that we assumed based on an independent valuation. We amortize the allocated costs over the estimated life of the restaurants or the franchise agreements on a straight-line basis which originally ranged from 7 to 20 years. Franchise interest and rights are being amortized over the next one to two years, lease acquisition costs are being amortized over the next 5 to 18 years and the noncompete agreement is being amortized over the next two years. We expect annual amortization expense for amortizable other intangible assets for the next five fiscal years to range from approximately $200,000 to $500,000. Intangible assets not subject to amortization are summarized below (in thousands):
December 31, 2006
December 25, 2005
Carrying amount, beginning of the year....................... $ 3,138 $ 2,793 Nonamortizable intangible assets acquired during the year......................................................... 140
345
Nonamortizable intangible assets amount, end of the year .........................................................
$ 3,278
$ 3,138
In connection with our acquisition of four Applebee’s restaurants in Houston from a franchisee in January 2006, we recorded approximately $100,000 of reacquired franchise rights (Note 4).

F-25
In connection with our acquisition of 12 Applebee’s restaurants in Missouri, Kansas and Arkansas from a franchisee in May 2005, we recorded approximately $300,000 of reacquired franchise rights (Note 4). The amount allocated to reacquired franchise rights is based upon the initial franchise fees received from these franchisees. This intangible asset has an indefinite life and, accordingly, will not be amortized but tested for impairment at least annually. 11. Other Assets Other assets are comprised of the following (in thousands):
December 31, 2006
December 25, 2005
Nonqualified deferred compensation plan investments (Note 20) .............................................................
$ 18,729
$ 14,493
Liquor licenses ........................................................................... 6,814 6,541 Notes receivable ......................................................................... 1,305 1,478 Deferred financing costs, net...................................................... 1,013 664 Minority investment in unaffiliated company, at net realizable value .........................................................................................
750
2,250
Other........................................................................................... 6,807 6,473 $ 35,418 $ 31,899
12. Property and Equipment Property and equipment, net, is comprised of the following (in thousands):
December 31, 2006
December 25, 2005
Land............................................................................................ $ 107,193 $ 97,476 Buildings and leasehold improvements...................................... 527,049 482,074 Furniture and equipment ............................................................ 291,501 263,526 Construction in progress............................................................. 28,757 25,755 954,500 868,831 Less accumulated depreciation and capitalized lease amortization.....................................................................
318,469
278,238
$ 636,031 $ 590,593 We have recorded capitalized leases of $4,055,000 at both December 31, 2006 and December 25, 2005, which are included in buildings and leasehold improvements. We had accumulated amortization of such property of $2,258,000 at December 31, 2006 and $2,025,000 at December 25, 2005. These capitalized leases relate to the buildings on certain restaurant properties. The land portion of the restaurant property leases is accounted for as an operating lease. We had depreciation and capitalized lease amortization expense relating to property and equipment of $64,738,000 for 2006, $54,580,000 for 2005 and $46,051,000 for 2004. Of these amounts, capitalized lease amortization was $233,000 during 2006, $240,000 during 2005 and $239,000 during 2004. We lease certain of our restaurants. The leases generally provide for payment of minimum annual rent, real estate taxes, insurance and maintenance and, in some cases, contingent rent (calculated as a percentage of

F-26
sales) in excess of minimum rent. Total rental expense for all operating leases is comprised of the following (in thousands):
2006 2005 2004 Minimum rent.............................................. $ 26,860 $ 23,929 $ 20,416 Contingent rent............................................ 1,453 1,389 1,254 $ 28,313 $ 25,318 $ 21,670
The present value of capitalized lease payments and the future minimum lease payments under noncancelable operating leases over the lease term as defined in Note 2 (including leases executed for sites to be developed in 2007) as of December 31, 2006 are as follows (in thousands):
Capitalized Leases
Operating Leases
2007................................................................................................... $ 822 $ 29,307 2008................................................................................................... 851 29,234 2009................................................................................................... 880 28,977 2010................................................................................................... 895 28,544 2011................................................................................................... 896 28,298 Thereafter .......................................................................................... 3,178 257,659 Total minimum lease payments......................................................... 7,522 $ 402,019 Less amounts representing interest.................................................... 3,606 Present value of minimum lease payments........................................ $ 3,916
In October 2006, we entered into a sale-leaseback arrangement with a third-party finance company involving five restaurant properties. As a result of this transaction, we recorded a deferred gain of approximately $3,100,000 which will be recognized over the 10-year remaining lease term on a straight-line basis. 13. Notes Payable and Long-Term Debt Our debt, which includes both notes payable and long-term debt, including capitalized lease obligations, is comprised of the following (in thousands):
December 31, 2006
December 25, 2005
Notes payable; interest at federal funds rate plus 0.50% at December 31, 2006, at federal funds rate plus 0.625% at December 25, 2005 ......................................................................
$ —
$ 7,900
Unsecured revolving credit facility; interest at LIBOR plus 0.5% or prime rate at December 31, 2006, due December 2011 and LIBOR plus 0.625% or prime rate at December 25, 2005 ...........................................................
170,000
175,000
Capitalized lease obligations (Note 12)............................................. 3,916 4,054Other.................................................................................................. 1,269 1,413 Total notes payable and long-term debt ............................................ 175,185 188,367 Less notes payable and current portion of long-term debt ................ 265 8,159 Long-term debt, less current portion ................................................. $ 174,920 $ 180,208
In December 2006, we entered into a new five-year revolving credit facility. The terms of the bank credit agreement provide for $400,000,000 in unsecured revolving credit and an additional $200,000,000 of revolving credit upon satisfaction of the conditions set forth in the credit facility. The facility is subject to various covenants and restrictions which, among other things, require the maintenance of stipulated fixed
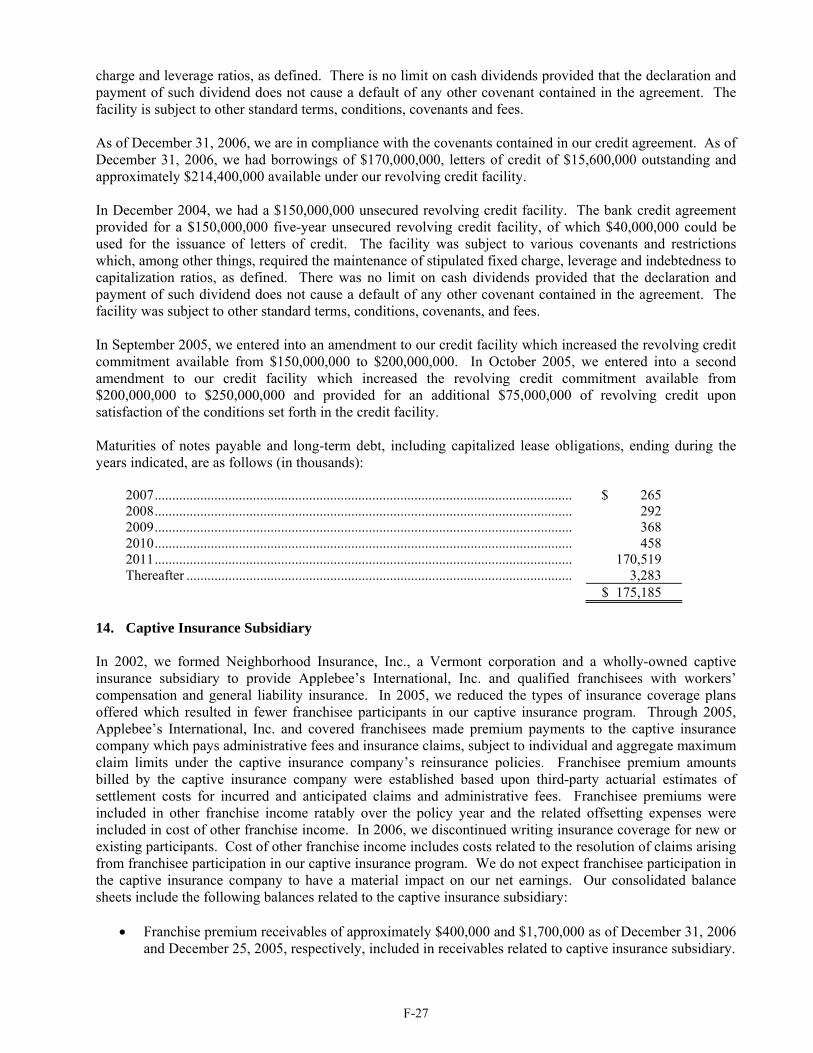
F-27
charge and leverage ratios, as defined. There is no limit on cash dividends provided that the declaration and payment of such dividend does not cause a default of any other covenant contained in the agreement. The facility is subject to other standard terms, conditions, covenants and fees. As of December 31, 2006, we are in compliance with the covenants contained in our credit agreement. As of December 31, 2006, we had borrowings of $170,000,000, letters of credit of $15,600,000 outstanding and approximately $214,400,000 available under our revolving credit facility. In December 2004, we had a $150,000,000 unsecured revolving credit facility. The bank credit agreement provided for a $150,000,000 five-year unsecured revolving credit facility, of which $40,000,000 could be used for the issuance of letters of credit. The facility was subject to various covenants and restrictions which, among other things, required the maintenance of stipulated fixed charge, leverage and indebtedness to capitalization ratios, as defined. There was no limit on cash dividends provided that the declaration and payment of such dividend does not cause a default of any other covenant contained in the agreement. The facility was subject to other standard terms, conditions, covenants, and fees. In September 2005, we entered into an amendment to our credit facility which increased the revolving credit commitment available from $150,000,000 to $200,000,000. In October 2005, we entered into a second amendment to our credit facility which increased the revolving credit commitment available from $200,000,000 to $250,000,000 and provided for an additional $75,000,000 of revolving credit upon satisfaction of the conditions set forth in the credit facility. Maturities of notes payable and long-term debt, including capitalized lease obligations, ending during the years indicated, are as follows (in thousands):
2007....................................................................................................................... $ 265 2008....................................................................................................................... 292 2009....................................................................................................................... 368 2010....................................................................................................................... 458 2011....................................................................................................................... 170,519 Thereafter .............................................................................................................. 3,283
$ 175,185 14. Captive Insurance Subsidiary In 2002, we formed Neighborhood Insurance, Inc., a Vermont corporation and a wholly-owned captive insurance subsidiary to provide Applebee’s International, Inc. and qualified franchisees with workers’ compensation and general liability insurance. In 2005, we reduced the types of insurance coverage plans offered which resulted in fewer franchisee participants in our captive insurance program. Through 2005, Applebee’s International, Inc. and covered franchisees made premium payments to the captive insurance company which pays administrative fees and insurance claims, subject to individual and aggregate maximum claim limits under the captive insurance company’s reinsurance policies. Franchisee premium amounts billed by the captive insurance company were established based upon third-party actuarial estimates of settlement costs for incurred and anticipated claims and administrative fees. Franchisee premiums were included in other franchise income ratably over the policy year and the related offsetting expenses were included in cost of other franchise income. In 2006, we discontinued writing insurance coverage for new or existing participants. Cost of other franchise income includes costs related to the resolution of claims arising from franchisee participation in our captive insurance program. We do not expect franchisee participation in the captive insurance company to have a material impact on our net earnings. Our consolidated balance sheets include the following balances related to the captive insurance subsidiary:
• Franchise premium receivables of approximately $400,000 and $1,700,000 as of December 31, 2006 and December 25, 2005, respectively, included in receivables related to captive insurance subsidiary.
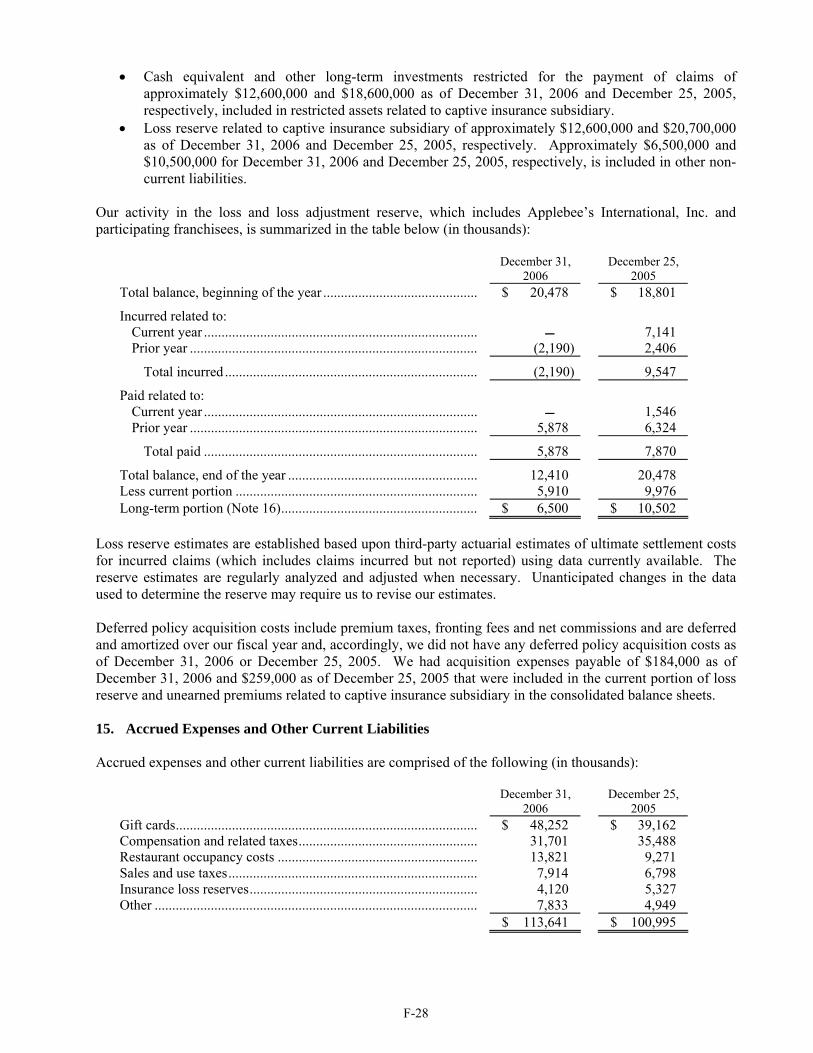
F-28
• Cash equivalent and other long-term investments restricted for the payment of claims of approximately $12,600,000 and $18,600,000 as of December 31, 2006 and December 25, 2005, respectively, included in restricted assets related to captive insurance subsidiary.
• Loss reserve related to captive insurance subsidiary of approximately $12,600,000 and $20,700,000 as of December 31, 2006 and December 25, 2005, respectively. Approximately $6,500,000 and $10,500,000 for December 31, 2006 and December 25, 2005, respectively, is included in other non-current liabilities.
Our activity in the loss and loss adjustment reserve, which includes Applebee’s International, Inc. and participating franchisees, is summarized in the table below (in thousands):
December 31, 2006
December 25, 2005
Total balance, beginning of the year ............................................ $ 20,478 $ 18,801
Incurred related to: Current year .............................................................................. 7,141 Prior year .................................................................................. (2,190) 2,406
Total incurred ........................................................................ (2,190) 9,547
Paid related to: Current year .............................................................................. 1,546 Prior year .................................................................................. 5,878 6,324
Total paid .............................................................................. 5,878 7,870
Total balance, end of the year ...................................................... 12,410 20,478 Less current portion ..................................................................... 5,910 9,976 Long-term portion (Note 16)........................................................ $ 6,500 $ 10,502
Loss reserve estimates are established based upon third-party actuarial estimates of ultimate settlement costs for incurred claims (which includes claims incurred but not reported) using data currently available. The reserve estimates are regularly analyzed and adjusted when necessary. Unanticipated changes in the data used to determine the reserve may require us to revise our estimates. Deferred policy acquisition costs include premium taxes, fronting fees and net commissions and are deferred and amortized over our fiscal year and, accordingly, we did not have any deferred policy acquisition costs as of December 31, 2006 or December 25, 2005. We had acquisition expenses payable of $184,000 as of December 31, 2006 and $259,000 as of December 25, 2005 that were included in the current portion of loss reserve and unearned premiums related to captive insurance subsidiary in the consolidated balance sheets. 15. Accrued Expenses and Other Current Liabilities Accrued expenses and other current liabilities are comprised of the following (in thousands):
December 31, 2006
December 25, 2005
Gift cards...................................................................................... $ 48,252 $ 39,162 Compensation and related taxes................................................... 31,701 35,488Restaurant occupancy costs ......................................................... 13,821 9,271 Sales and use taxes....................................................................... 7,914 6,798 Insurance loss reserves................................................................. 4,120 5,327 Other ............................................................................................ 7,833 4,949 $ 113,641 $ 100,995

F-29
16. Other Non-Current Liabilities Other non-current liabilities are comprised of the following (in thousands):
December 31, 2006
December 25, 2005
Restaurant occupancy costs.......................................................... $ 22,307 $ 19,969 Nonqualified deferred compensation plan liabilities (Note 20)....................................................................
18,729
14,493
Long-term insurance loss reserves ............................................... 7,117 — Loss and loss adjustment reserve related to captive insurance subsidiary.......................................................
6,500
10,502
Deferred gain on sale-leaseback................................................... 2,706 — Compensation............................................................................... 2,190 3,033 Other............................................................................................. 2,288 2,377 $ 61,837 $ 50,374
17. Income Taxes We, along with our subsidiaries, file a consolidated federal income tax return. The income tax provision consists of the following (in thousands):
2006 2005 2004 Current provision: Federal ................................................................... $ 42,902 $ 40,198 $ 30,171 State and local ........................................................ 10,422 4,633 2,146 Deferred provision (benefit): Federal ................................................................... (10,559) 9,248 23,625 State and local ........................................................ (1,524) 623 1,688 Income taxes before cumulative effect of change in accounting principle...........................................
41,241
54,702
57,630
Income taxes related to the cumulative effect of change in accounting principle ..............................
—
(125)
—
Total income taxes ...................................................... $ 41,241 $ 54,577 $ 57,630 The deferred income tax provision (benefit) is comprised of the following (in thousands):
2006 2005 2004 Depreciation and amortization .................................... $ 2,339 $ 13,090 $ 24,278 Stock-based compensation.......................................... (6,842) — — Impairment and other restaurant closure costs............ (3,300) (1,463) — Other ........................................................................... (4,280) (1,756) 1,035 Net change in deferred income taxes .......................... $ (12,083) $ 9,871 $ 25,313
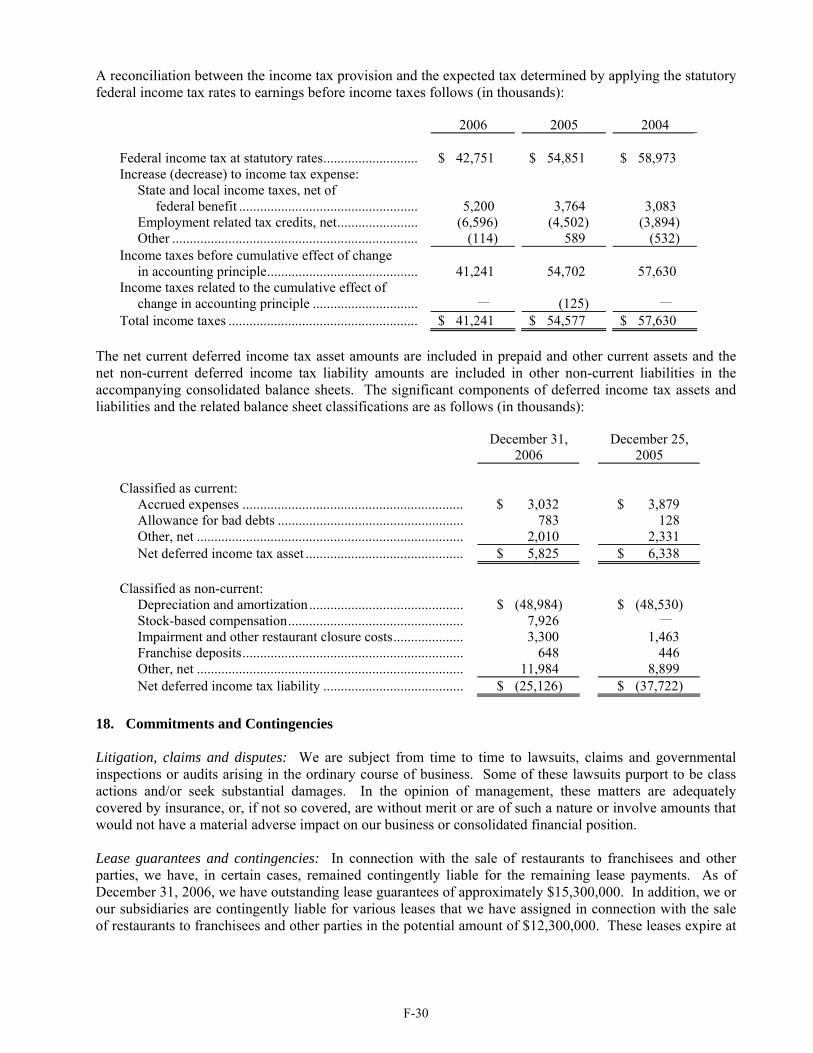
F-30
A reconciliation between the income tax provision and the expected tax determined by applying the statutory federal income tax rates to earnings before income taxes follows (in thousands):
2006 2005 2004 Federal income tax at statutory rates........................... $ 42,751 $ 54,851 $ 58,973 Increase (decrease) to income tax expense: State and local income taxes, net of federal benefit ...................................................
5,200
3,764
3,083
Employment related tax credits, net....................... (6,596) (4,502) (3,894) Other ...................................................................... (114) 589 (532) Income taxes before cumulative effect of change in accounting principle...........................................
41,241
54,702
57,630
Income taxes related to the cumulative effect of change in accounting principle ..............................
—
(125)
—
Total income taxes ...................................................... $ 41,241 $ 54,577 $ 57,630 The net current deferred income tax asset amounts are included in prepaid and other current assets and the net non-current deferred income tax liability amounts are included in other non-current liabilities in the accompanying consolidated balance sheets. The significant components of deferred income tax assets and liabilities and the related balance sheet classifications are as follows (in thousands):
December 31, 2006
December 25, 2005
Classified as current: Accrued expenses ............................................................... $ 3,032 $ 3,879 Allowance for bad debts ..................................................... 783 128 Other, net ............................................................................ 2,010 2,331 Net deferred income tax asset ............................................. $ 5,825 $ 6,338 Classified as non-current: Depreciation and amortization ............................................ $ (48,984) $ (48,530) Stock-based compensation.................................................. 7,926 — Impairment and other restaurant closure costs.................... 3,300 1,463 Franchise deposits............................................................... 648 446 Other, net ............................................................................ 11,984 8,899 Net deferred income tax liability ........................................ $ (25,126) $ (37,722)
18. Commitments and Contingencies Litigation, claims and disputes: We are subject from time to time to lawsuits, claims and governmental inspections or audits arising in the ordinary course of business. Some of these lawsuits purport to be class actions and/or seek substantial damages. In the opinion of management, these matters are adequately covered by insurance, or, if not so covered, are without merit or are of such a nature or involve amounts that would not have a material adverse impact on our business or consolidated financial position. Lease guarantees and contingencies: In connection with the sale of restaurants to franchisees and other parties, we have, in certain cases, remained contingently liable for the remaining lease payments. As of December 31, 2006, we have outstanding lease guarantees of approximately $15,300,000. In addition, we or our subsidiaries are contingently liable for various leases that we have assigned in connection with the sale of restaurants to franchisees and other parties in the potential amount of $12,300,000. These leases expire at

F-31
various times with the final lease agreement expiring in 2018. We did not record a liability related to these contingent lease liabilities as of December 31, 2006 or December 25, 2005. Franchisee guarantees: In 2004, we arranged for a third-party financing company to provide up to $250,000,000 to qualified franchisees for loans to fund development of new restaurants through October 2007, subject to our approval. We will provide a limited guarantee of 10% of certain loans advanced under this program. We will be released from our guarantee if certain operating results are met after the restaurant has been open for at least two years. As of December 31, 2006, there were loans outstanding to five franchisees for approximately $65,800,000 under this program. The fair value of our guarantees under this financing program is approximately $130,000 and is recorded in non-current liabilities in our consolidated balance sheet as of December 31, 2006. Severance agreements: We have severance and employment agreements with certain officers providing for severance payments to be made in the event the officer resigns or is terminated not related to a change in control, some of which require payments to be made only if we enforce certain terms in the agreements. If the severance payments had been due as of December 31, 2006, we would have been required to make payments totaling approximately $10,600,000. In addition, we have severance and employment agreements with certain officers which contain severance provisions related to a change in control. The agreements define the circumstances which will constitute a change in control. Those provisions would have required additional aggregate payments of approximately $5,300,000 if such officers had been terminated as of December 31, 2006. 19. Stockholders’ Equity In October 2005, our Board of Directors authorized repurchases of our common stock of up to $175,000,000 during 2005 and 2006, subject to market conditions. In November 2006 our Board of Directors authorized additional repurchases of our common stock of up to $150,000,000, subject to market conditions. During 2006, we repurchased 1,760,506 shares of our common stock at an average price of $21.88 for an aggregate cost of approximately $38,522,000. As of December 31, 2006, we had approximately $240,400,000 remaining under our 2005 and 2006 repurchase authorizations. A reconciliation of our treasury shares for the past three fiscal years is provided below (shares in thousands):
Treasury Shares
Balance as of December 28, 2003 ........................................ 25,716 Purchases of treasury stock .................................................. 3,994 Stock options exercised........................................................ (1,982) Shares issued under employee benefit plans ........................ (275) Nonvested shares awarded under equity incentive plans ..... (78) Balance as of December 26, 2004 ........................................ 27,375 Purchases of treasury stock .................................................. 8,288 Stock options exercised........................................................ (1,045) Shares issued under employee benefit plans ........................ (209) Nonvested shares awarded under equity incentive plans ..... (104) Balance as of December 25, 2005 ........................................ 34,305 Purchases of treasury stock .................................................. 1,761 Stock options exercised........................................................ (1,268) Shares issued under employee benefit plans ........................ (237) Nonvested shares awarded under equity incentive plans ..... (168) Balance as of December 31, 2006 ........................................ 34,393
F-32
20. Employee Benefit Plans Nonqualified deferred compensation plan: In 2002, we entered into a rabbi trust agreement to protect the assets of the nonqualified deferred compensation plan for certain of our associates. Each participant’s account is comprised of their contribution, our matching contribution and each participant’s share of earnings or losses in the plan. In accordance with Emerging Issues Task Force No. 97-14, “Accounting for Deferred Compensation Arrangements Where Amounts Are Held in a Rabbi Trust and Invested,” the accounts of the rabbi trust are reported in our consolidated financial statements. As of December 31, 2006 and December 25, 2005, our consolidated balance sheets include the investments in other assets and the offsetting obligation is included in other non-current liabilities. The deferred compensation plan investments are considered trading securities and are reported at fair value with the realized and unrealized holding gains and losses related to these investments recorded in other income (expense) and the offsetting amount is recorded in general and administrative expenses. Employee retirement plans: During 1992, we established a profit sharing plan and trust in accordance with Section 401(k) of the Internal Revenue Code. We make matching contributions of 50% of associate contributions not to exceed 4.0% of an associate’s compensation in any year. Through 2004, we made our contributions in shares of our common stock. Beginning in 2005, we make our contributions in cash. In 2005, our contributions vested at the rate of 20% after the associate’s second year of service, 60% after three years of service, 80% after four years of service and 100% after five years of service. In 2006, our vesting schedule changed to 100% vesting immediately. Contributions under these plans were $2,614,000 in 2006, $2,429,000 in 2005 and $2,158,000 in 2004.

F-33
21. Quarterly Results of Operations (Unaudited)
The following presents the unaudited consolidated quarterly results of operations for 2006 and 2005. The fiscal quarter ended December 31, 2006 contained 14 weeks. All other fiscal quarters contained 13 weeks. All amounts, except per share amounts, are expressed in thousands. 2006 Fiscal Quarter Ended March 26,
2006 June 25,
2006 September 24,
2006 December 31,
2006 Operating revenues: Company restaurant sales .......................................... $ 307,899 $ 296,128 $ 286,938 $ 305,293 Franchise royalties and fees ....................................... 35,935 34,306 33,340 36,274 Other franchise income.............................................. 445 539 371 453 Total operating revenues ...................................... 344,279 330,973 320,649 342,020 Cost of company restaurant sales: Food and beverage..................................................... 82,236 78,433 76,616 82,528 Labor.......................................................................... 101,031 100,296 99,105 103,084 Direct and occupancy................................................. 78,946 80,411 80,047 84,439 Pre-opening expense .................................................. 750 1,157 1,115 1,326 Total cost of company restaurant sales................. 262,963 260,297 256,883 271,377 Cost of other franchise income.......................................... 766 281 694 958 General and administrative expenses ................................ 35,606 32,320 35,601 37,297 Amortization of intangible assets ...................................... 204 204 154 159 Impairment and other restaurant closure costs .................. 1,600 3,000 1,900 2,300 Loss on disposition of property and equipment................. 577 430 685 881 Operating earnings ............................................................ 42,563 34,441 24,732 29,048 Other income (expense): Investment income..................................................... 745 (285) 885 1,423 Interest expense ......................................................... (2,554) (2,985) (2,970) (2,912) Other income ............................................................. 136 101 301 (522) Total other income (expense)............................... (1,673) (3,169) (1,784) (2,011)Earnings before income taxes............................................ 40,890 31,272 22,948 27,037 Income taxes...................................................................... 13,739 10,868 8,107 8,527 Net earnings ...................................................................... $ 27,151 $ 20,404 $ 14,841 $ 18,510 Basic net earnings per common share ............................... $ 0.37 $ 0.28 $ 0.20 $ 0.25 Diluted net earnings per common share ............................ $ 0.36 $ 0.27 $ 0.20 $ 0.25 Basic weighted average shares outstanding....................... 74,147 74,112 73,902 73,883 Diluted weighted average shares outstanding ................... 75,281 75,083 74,673 74,859

F-34
2005 Fiscal Quarter Ended March 27,
2005 June 26,
2005 September 25,
2005 December 25,
2005 Operating revenues: Company restaurant sales ............................................ $ 270,458 $ 272,703 $ 272,673 $ 266,807 Franchise royalties and fees......................................... 33,008 32,493 31,589 31,723 Other franchise income................................................ 1,065 1,424 1,064 1,643 Total operating revenues........................................ 304,531 306,620 305,326 300,173 Cost of company restaurant sales: Food and beverage....................................................... 71,635 72,565 71,555 70,767 Labor ........................................................................... 88,724 90,115 90,231 89,493 Direct and occupancy .................................................. 66,367 71,038 74,706 75,545 Pre-opening expense.................................................... 1,167 1,268 1,089 1,243 Total cost of company restaurant sales .................. 227,893 234,986 237,581 237,048 Cost of other franchise income............................................ 819 1,229 790 2,054 General and administrative expenses .................................. 26,946 27,980 26,329 28,513 Amortization of intangible assets ........................................ 228 226 204 220 Impairment and other restaurant closure costs .................... — — 3,900 — Loss on disposition of property and equipment................... 297 564 480 726 Operating earnings .............................................................. 48,348 41,635 36,042 31,612 Other income (expense): Investment income....................................................... (41) 449 568 719 Interest expense ........................................................... (337) (634) (1,232) (2,162) Other income ............................................................... 435 584 593 150 Total other income (expense)................................. 57 399 (71) (1,293) Earnings before income taxes and cumulative effect of change in accounting principle.......................................... 48,405 42,034 35,971 30,319 Income taxes ....................................................................... 16,748 14,544 13,836 9,574(1)
Earnings before cumulative effect of change in accounting principle ............................................................................ 31,657 27,490 22,135 20,745 Cumulative effect of change in accounting principle, net of tax............................................................................
—
—
—
(225)
Net earnings ........................................................................ $ 31,657 $ 27,490 $ 22,135 $ 20,520
Basic net earnings per common share: Basic earnings before cumulative effect of change in accounting principle .......................................................... $ 0.39 $ 0.34 $ 0.28 $ 0.27 Cumulative effect of change in accounting principle, net of tax............................................................................
—
—
—
—
Basic net earnings per common share ................................. $ 0.39 $ 0.34 $ 0.28 $ 0.27
Diluted net earnings per common share: Diluted earnings before cumulative effect of change in accounting principle .......................................................... $ 0.38 $ 0.34 $ 0.28 $ 0.27 Cumulative effect of change in accounting principle, net of tax............................................................................
—
—
—
—
Diluted net earnings per common share .............................. $ 0.38 $ 0.34 $ 0.28 $ 0.27
Basic weighted average shares outstanding......................... 80,705 79,897 78,485 75,525 Diluted weighted average shares outstanding ..................... 82,375 81,360 79,691 76,542
(1) Fourth quarter 2005 net earnings reflect a decrease in income tax expense of $1.1 million due to the resolution of a state income tax matter.

E-1
APPLEBEE’S INTERNATIONAL, INC. EXHIBIT INDEX
Exhibit Number
Description of Exhibit
3.1 Certificate of Incorporation, as amended, of the Registrant (incorporated by reference to Exhibit 3.1 of the Registrant’s Annual Report on Form 10-K for the fiscal year ended December 31, 1995).
3.2 Amended and Restated Bylaws of Applebee’s International, Inc. (incorporated by reference to the Registrant’s Form 8-K filed on August 30, 2006).
4.1 Certificate of the Voting Powers, Designations, Preferences and Relative Participating, Optional and Other Special Rights and Qualifications of Series A Participating Cumulative Preferred Stock of Applebee’s International, Inc. (incorporated by reference to Exhibit 4.2 of the Registrant’s Annual Report on Form 10-K for the fiscal year ended December 25, 1994).
10.1 Form of Applebee’s Development Agreement.
10.2 Form of Applebee’s Franchise Agreement.
10.3 Schedule of Applebee’s Development and Franchise Agreements as of December 31, 2006.
10.4 Revolving Credit Agreement dated as of December 18, 2006 (incorporated by reference to Exhibit 10.1 of the Registrant’s Form 8-K filed on December 20, 2006).
Management Contracts and Compensatory Plans or Arrangements
10.5 Amended and Restated 1995 Equity Incentive Plan (incorporated by reference to Exhibit 10.3 of the Registrant’s Quarterly Report on Form 10-Q for the fiscal quarter ended June 26, 2005).
10.6 Amendment to the Amended and Restated 1995 Equity Incentive Plan (incorporated by reference to Exhibit 10.3 of the Registrant’s Quarterly Report on Form 10-Q for the fiscal quarter ended June 25, 2006).
10.7 Employee Stock Purchase Plan, as amended (incorporated by reference to Exhibit 10.4 of the Registrant’s Quarterly Report on Form 10-Q for the fiscal quarter ended June 26, 2005).
10.8 1999 Management and Executive Incentive Plan (incorporated by reference to Exhibit 10.13 of the Registrant’s Annual Report on Form 10-K for the fiscal year ended December 26, 1999).
10.9 1999 Employee Incentive Plan, as amended (incorporated by reference to Exhibit 10.14 of the Registrant’s Annual Report on Form 10-K for the fiscal year ended December 26, 1999).

E-2
Exhibit Number
Description of Exhibit
10.10 2001 Senior Executive Bonus Plan (incorporated by reference to Exhibit 10.12 of the
Registrant’s Annual Report on Form 10-K for the fiscal year ended December 30, 2001).
10.12 Current Form of Change in Control and Noncompete Agreement (incorporated by reference to Exhibit 10.4 of the Registrant’s Quarterly Report on Form 10-Q for the fiscal quarter ended September 26, 2004) and schedule of parties thereto.
10.13 Form of Officer Nonqualified Stock Option Agreement (incorporated by reference to Exhibit 10.1 of the Registrant’s Form 8-K filed on December 15, 2004).
10.14 Form of Officer Incentive Stock Option Agreement (incorporated by reference to Exhibit 10.2 of the Registrant’s Form 8-K filed on December 15, 2004).
10.15 Form of Officer Restricted Stock Award Agreement (incorporated by reference to Exhibit 10.3 of the Registrant’s Form 8-K filed on December 15, 2004).
10.16 Form of Officer Restricted Stock Award Agreement for shares subject to the Company’s stock ownership guidelines (incorporated by reference to Exhibit 10.4 of the Registrant’s Form 8-K filed on December 15, 2004).
10.17 Form of Nonqualified Stock Option Agreement for Nonemployee Directors (incorporated by reference to Exhibit 10.5 of the Registrant’s Form 8-K filed on December 15, 2004).
10.18 Form of Restricted Stock Award for Nonemployee Directors (incorporated by reference to Exhibit 10.6 of the Registrant’s Form 8-K filed on December 15, 2004).
10.19 Executive Nonqualified Stock Purchase Plan (incorporated by reference to Exhibit 10.2 of the Registrant’s Quarterly Report on Form 10-Q for the fiscal quarter ended June 27, 2004).
10.20 Form of Indemnification Agreement with all Officers and Directors (incorporated by reference to Exhibit 10.3 of the Registrant’s Quarterly Report on Form 10-Q for the fiscal quarter ended June 27, 2004) and schedule of parties thereto.
10.21 Executive Retirement Plan, as amended (incorporated by reference to Exhibit 10.1 of the Registrant’s Quarterly Report on Form 10-Q for the fiscal quarter ended March 28, 2004 and Exhibit 10.5 of the Registrant’s Quarterly Report on Form 10-Q for the fiscal quarter ended June 26, 2005).
10.22 Executive Health Plan (incorporated by reference to Exhibit 10.2 of the Registrant’s Quarterly Report on Form 10-Q for the fiscal quarter ended March 28, 2004).

E-3
Exhibit Number
Description of Exhibit
10.23 Director Compensation Policy.
10.24 FlexPerx Program (incorporated by reference to Exhibit 10.1 of the Registrant’s Form 8-K filed on January 7, 2005).
10.25 Form of Stock Appreciation Rights Agreement (incorporated by reference to Form 8-K filed on February 22, 2006).
10.26 CEO Use of the Company Airplane Policy (incorporated by reference to Exhibit 10.6 of the Registrant’s Quarterly Report on Form 10-Q for the fiscal quarter ended June 26, 2005).
10.27 Personal Use of Corporate Aircraft for Senior Team (incorporated by reference to Exhibit 10.7 of the Registrant’s Quarterly Report on Form 10-Q for the fiscal quarter ended June 26, 2005).
10.28 Asset Purchase Agreement with The Ozark Apples, Inc. dated April 8, 2005 (incorporated by reference to Exhibit 10.2 of the Registrant’s Quarterly Report on Form 10-Q for the fiscal quarter ended June 26, 2005).
10.29 Memorandum of Understanding, dated October 5, 2002 and Amendment 1 dated July 1, 2005, with Louis A. Kaucic (incorporated by reference to Exhibit 10.14 of the Registrant’s Annual Report on Form 10-K for the fiscal year ended December 28, 2003 and Exhibit 10.1 to the Registrant’s Quarterly Report on Form 10-Q for the fiscal quarter ended June 26, 2005).
10.30 Employment Agreement dated as of January 9, 2006 by and between the Company and David L. Goebel (incorporated by reference to the Registrant’s Form 8-K filed on January 9, 2006).
10.31 Employment Agreement dated as of January 9, 2006 by and between the Company and Steven K. Lumpkin (incorporated by reference to the Registrant’s Form 8-K filed on January 9, 2006).
10.32 2001 Senior Executive Bonus Plan, as amended (incorporated by reference to the Registrant’s Form 8-K filed on May 16, 2006).
10.33 Separation Agreement, Release and Waiver dated May 17, 2006 by and between the Company and John C. Cywinski (incorporated by reference to the Registrant’s Form 8-K filed on May 18, 2006).
10.34 Personal Use of Corporate Aircraft by Non-Executive Chairman (incorporated by reference to the Registrant’s Form 8-K filed on August 30, 2006).
10.35 Severance Plan for Officers (incorporated by reference to the Registrant’s Form 8-K filed on August 30, 2006).

E-4
Exhibit Number
Description of Exhibit
10.36 Amended and Restated Nonqualified Deferred Compensation Plan (incorporated by reference to Exhibit 10.3 of the Registrant’s Quarterly Report on Form 10-Q for the fiscal quarter ended September 24, 2006).
10.37 New Form of Officer Restricted Stock Award Agreement for shares subject to the Company’s stock ownership guidelines (incorporated by reference to Exhibit 10.3 of the Registrant’s Quarterly Report on Form 10-Q for the fiscal quarter ended September 24, 2006).
10.38 New Form of Officer Restricted Stock Award Agreement for Participants in the Executive Retirement Plan (incorporated by reference to Exhibit 10.3 of the Registrant’s Quarterly Report on Form 10-Q for the fiscal quarter ended September 24, 2006).
10.39 Amended Executive Stock Ownership Guidelines (incorporated by reference to Exhibit 10.3 of the Registrant’s Quarterly Report on Form 10-Q for the fiscal quarter ended September 24, 2006).
21 Subsidiaries of Applebee’s International, Inc.
23.1 Consent of Deloitte & Touche LLP.
24 Power of Attorney (see page 47 of the Form 10-K).
31.1 Certification of Principal Executive Officer Pursuant to SEC Rule 13a-14(a).
31.2 Certification of Chief Financial Officer Pursuant to SEC Rule 13a-14(a).
32 Certification Pursuant to Section 906 of the Sarbanes-Oxley Act of 2002.