2006 new jersey health care almanac summaryfunding for the 2006 new jersey health care almanac was...
TRANSCRIPT

1350 Connecticut Avenue NWSuite 900Washington, DC 20036
www.avalerehealth.net
2006NeW JerSey HeAltH CAre AlmANAC SummAry
November2006
20
06
Ne
W J
er
Se
y H
eA
ltH
CA
re
Al
mA
NA
C S
um
mA
ry
Av
Al
er
e H
eA
ltH
ll
C

Funding for the 2006 New Jersey Health Care Almanac was provided by a grant from the robert Wood Johnson Foundation and by Horizon Blue Cross Blue Shield of New Jersey.
www.rwjf.orgwww.horizon-bcbsnj.com
Photography © Walter Choroszewski, All rights reserved Avalere Health llC1350 Connecticut Avenue NW, Suite 900Washington, DC 20036www.avalerehealth.net

Avalere Health LLC
John Richardson Caroline FisherKhoa NguyenJon Glaudemans
With:Ruth BrownTrudy BryceYing-Jun ChenMiryam FriederPamela GarlickTom MorenoKai PantinKristal Vardaman
2006 New Jersey HealtH Care almaNaC summary

2006 New Jersey Health Care Almanac
© Avalere Health LLC
TABLE OF CONTENTS
Acknowledgements i
Executive Summary iii
Chapter 1 Purpose, Methodology, and Overview of Key Findings 3
Chapter 2 State of New Jersey 41

Acknowledgements 2006 New Jersey Health Care Almanac
© Avalere Health LLC i
ACKNOWLEDGEMENTS
The authors gratefully acknowledge the time, thoughts, and insights offered by all of the New Jersey health care system stakeholders with whom we spoke in conducting research for the Almanac:
• Andrea Aughenbaugh, MSN, RN, Chief Executive Officer, New Jersey State Nurses Association
• J. Richard Goldstein, MD, President, New Jersey Council of Teaching Hospitals
• Katherine Grant-Davis, Executive Director, New Jersey Primary Care Association
• Paul R. Langevin, Jr., President, Health Care Association of New Jersey
• Elizabeth A. Ryan, Esq., Chief Operating Officer, New Jersey Hospital Association
• Joseph A. Trunfio, President/CEO, Atlantic Health
• Bruce Vladeck, PhD, Interim President, University of Medicine and Dentistry of New Jersey
• Approximately two dozen other New Jersey health care system stakeholders who prefer to remain anonymous
The authors also thank the following individuals for their invaluable assistance with data collection and analysis, and other background information about New Jersey’s health care system:
• Chiarina Fanara and Allen Kohn, QuadraMed
• Steve Fillebrown and Dennis Hancock, New Jersey Health Care Facilities Financing Authority
• Katherine Grant-Davis, New Jersey Primary Care Association
• John Hazel, Halina Ramberg and Vincent Yarmlak, New Jersey Department of Health and Senior Services
• Kim Jackson, American Hospital Association
• Richard Minkoff, New York Regional Office, Centers for Medicare and Medicaid Services, U.S. Department of Health and Human Services
• Elizabeth Rubin and Diego Lara, Horizon Blue Cross Blue Shield of New Jersey
• Derek Smart, American Medical Association
All of the content of the Almanac is solely the responsibility of Avalere Health LLC. Corrections and clarifications are welcome; please direct all correspondence to [email protected].

Executive Summary 2006 New Jersey Health Care Almanac
© Avalere Health LLC iii
EXECUTIVE SUMMARY
“One-word answer: Broken.” New Jersey health care system stakeholder, asked to characterize the state of the state’s health care system
The New Jersey health care system is emblematic of the U.S. health care system: widespread variations in health status and health care utilization patterns across its counties and citizens; significant pockets of over- and under-capacity, relative to national and regional norms and benchmarks; a relative absence of easily accessible and understandable measures to assess the quality and efficiency of health care services provided; and growing levels of dissatisfaction about the cost, quality, and access to care among patients, hospitals, physicians, other health care providers, health plans, employers, unions, and health policy experts. In New Jersey, these national trends are especially acute, and many New Jersey health care stakeholders and experts feel, in the words of one hospital executive, that “the system is on the verge of collapse.”
While the anonymous executive may have offered an overly pessimistic assessment, bringing the New Jersey health care system back from “the edge of collapse” requires a deep understanding of the underlying trends that formed this bleak assessment, and a careful distillation of the key policy issues that face the state at this critical juncture. The 2006 Almanac of New Jersey Health Care is intended to provide stakeholders with a reference document to help inform discussions and analysis, and to frame the key, interrelated policy questions that will require resolution in the coming months and years.
Our analysis focuses on the current capacity of New Jersey’s current health care system—itself the result of years of discrete, decentralized, and often uncoordinated policy and business decisions by thousands of stakeholders, including state officials, health care providers, employers, unions, and health insurance payers. Our analysis relies on the examination of variations in health care capacity and utilization from regional, statewide, and national averages. We draw comparisons between regions within the state, between statewide New Jersey metrics and the metrics for Connecticut, a state with a similar demographic makeup, and between New Jersey averages and national averages. While the Almanac incorporates limited financial analysis of the state’s general acute care hospitals, it does not attempt to analyze the complex financial flows of the health care system and their impact on health care supply and utilization.
Our approach identifies outliers in health care supply and utilization data, and offers policymakers a basis upon which to assess whether these variations are a result of significant and explainable differences in the underlying health care needs of a local population, or, as is often the case, bear little relationship to any underlying health care need or rationale. From this assessment of New Jersey’s current system, we have identified a set of system attributes and a series of policy considerations that should be understood and addressed in any effort to reform and re-align the state’s health care delivery system to meet the future needs of New Jersey’s citizens.

2006 New Jersey Health Care Almanac Executive Summary
iv © Avalere Heath LLC
Our review revealed the following attributes of the New Jersey health care system:
• The state’s regions vary widely in their health care system capacity and utilization. There is considerable variation in the use of hospital, physician, and other health care services among and, in many cases within, regions of the state. This degree of variation suggests opportunities for reducing over-utilization in some areas and for improving access to care (i.e., addressing under-utilization) in other regions.
• The state has higher than average hospital bed capacity and higher than average rates of hospital admissions. New Jersey hospitals have more staffed hospital beds per thousand residents than Connecticut, a state with similar social and demographic characteristics.1 New Jersey’s doctors admit more patients to the hospital than both the national average and the Connecticut average.
• Many hospitals are in poor and declining financial condition; many also have aging physical plants and equipment. Many of the state’s hospitals have had operating margins below two percent over the last four years for which data are available (2001–2004), with some experiencing negative operating margins during this time. This finding is all the more troubling when one considers that recently enacted federal reductions in hospitals’ future Medicare revenues are not yet reflected in the available data. Many of the state’s hospitals also are facing critical capital expenditure decisions to update their aging physical plant and major equipment.2 These hospitals will encounter difficulty in obtaining affordable capital financing given their current financial conditions and expected future revenue declines.
• Reimbursement-maximization strategies are becoming increasingly difficult as Medicare and commercial payers continue to alter or aggressively enforce hospital payment policies that reduce their exposure to extremely high costs. Simply charging more for insured patients seems not to be a sustainable strategy as Medicare and many private insurance companies and their employer-customers are balking at paying higher rates. On the expense side of the ledger, hospitals’ capital expenditures—once incurred—represent all-but-irreversible commitments by hospitals. Thus, the financial policy options to create a vibrant New Jersey hospital system can be stated starkly: either reimbursement levels must rise, or hospital costs must fall. If the variable portion of hospitals’ cost structures (nurses, aides, etc.) is being managed efficiently, then to effect a reduction in costs implies a reduction in hospitals’ fixed costs (i.e., fewer hospitals, fewer staffed beds, less duplication of high-cost machines and services, etc.).
1 See further discussion in Chapter 1 under “Comparing the demographic make-up of New Jersey and Connecticut.” 2 New Jersey hospitals’ average age of plant is 11.58 years, almost 20 percent higher than the national average. See Accenture, New Jersey Acute Care Hospitals—Financial Status, Appendix I, Oct. 3, 2006, and New Jersey Health Care Facilities Financing Authority, Statistical Reports, “APOLLO Statewide Medians” (http://www.njhcffa.com/reports.html).
Executive Summary 2006 New Jersey Health Care Almanac
© Avalere Health LLC v
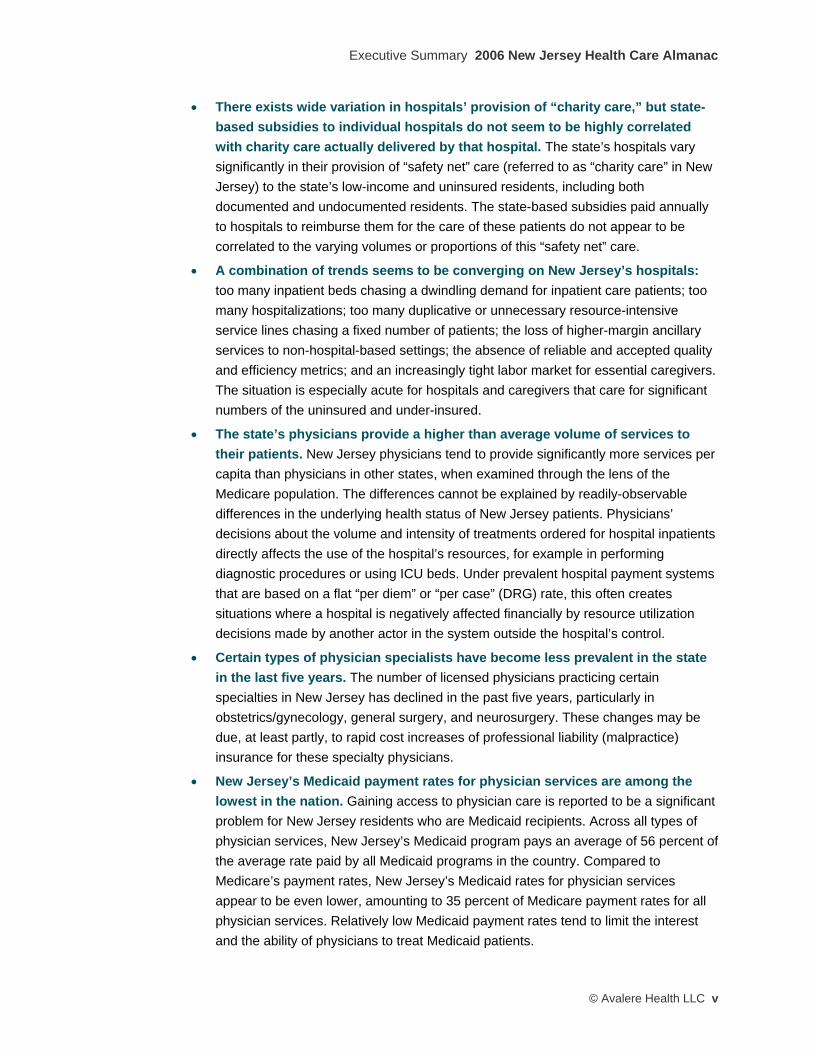
• There exists wide variation in hospitals’ provision of “charity care,” but state-based subsidies to individual hospitals do not seem to be highly correlated with charity care actually delivered by that hospital. The state’s hospitals vary significantly in their provision of “safety net” care (referred to as “charity care” in New Jersey) to the state’s low-income and uninsured residents, including both documented and undocumented residents. The state-based subsidies paid annually to hospitals to reimburse them for the care of these patients do not appear to be correlated to the varying volumes or proportions of this “safety net” care.
• A combination of trends seems to be converging on New Jersey’s hospitals: too many inpatient beds chasing a dwindling demand for inpatient care patients; too many hospitalizations; too many duplicative or unnecessary resource-intensive service lines chasing a fixed number of patients; the loss of higher-margin ancillary services to non-hospital-based settings; the absence of reliable and accepted quality and efficiency metrics; and an increasingly tight labor market for essential caregivers. The situation is especially acute for hospitals and caregivers that care for significant numbers of the uninsured and under-insured.
• The state’s physicians provide a higher than average volume of services to their patients. New Jersey physicians tend to provide significantly more services per capita than physicians in other states, when examined through the lens of the Medicare population. The differences cannot be explained by readily-observable differences in the underlying health status of New Jersey patients. Physicians’ decisions about the volume and intensity of treatments ordered for hospital inpatients directly affects the use of the hospital’s resources, for example in performing diagnostic procedures or using ICU beds. Under prevalent hospital payment systems that are based on a flat “per diem” or “per case” (DRG) rate, this often creates situations where a hospital is negatively affected financially by resource utilization decisions made by another actor in the system outside the hospital’s control.
• Certain types of physician specialists have become less prevalent in the state in the last five years. The number of licensed physicians practicing certain specialties in New Jersey has declined in the past five years, particularly in obstetrics/gynecology, general surgery, and neurosurgery. These changes may be due, at least partly, to rapid cost increases of professional liability (malpractice) insurance for these specialty physicians.
• New Jersey’s Medicaid payment rates for physician services are among the lowest in the nation. Gaining access to physician care is reported to be a significant problem for New Jersey residents who are Medicaid recipients. Across all types of physician services, New Jersey’s Medicaid program pays an average of 56 percent of the average rate paid by all Medicaid programs in the country. Compared to Medicare’s payment rates, New Jersey’s Medicaid rates for physician services appear to be even lower, amounting to 35 percent of Medicare payment rates for all physician services. Relatively low Medicaid payment rates tend to limit the interest and the ability of physicians to treat Medicaid patients.
2006 New Jersey Health Care Almanac Executive Summary
vi © Avalere Heath LLC
• The number of ambulatory surgery centers in the state has increased dramatically over the last 15 years. These facilities, along with freestanding diagnostic imaging facilities and cardiac care centers, appear to be diverting profitable service lines away from inpatient hospitals, with a corresponding negative effect on hospitals’ financial conditions. These facilities may be delivering services at lower unit costs due to lower overhead costs and greater efficiency of operations. However, the overall volume of services delivered (inpatient and freestanding) may be influenced upward by conflicting financial incentives inherent in physician ownership and/or control of ambulatory care facilities.
• The state’s long-term care infrastructure for low-income and Medicaid recipients has not changed significantly for the past five years. Nursing home construction has largely ceased, in favor of increasing the capacity of self-pay assisted living facilities. Relative to other states, New Jersey offers relatively few subsidized home and community-based long-term care alternatives to nursing homes, which can be a cost-effective way to meet increasingly large numbers of low-income residents’ long-term care needs.
• Evaluating the quality of care provided by New Jersey’s health care system is difficult. There is a growing body of academic literature suggesting that a health care system that provides patients with more and higher-intensity medical care—more hospital stays, more access to specialty physician services, more medical and surgical procedures, etc.—does not necessarily provide higher-quality care.3 It is not easy to develop systematic, easily accessible, and understandable measures to assess the quality and efficiency of health care services provided to New Jersey residents by their health care system, but the state government has begun to grapple with this challenge by enacting the Patient Safety Act (P.L. 2004, c.9), which established the Patient Safety Initiative within the Department of Health and Senior Services, and by publishing two important reports this fall on health care quality and safety in the New Jersey health care system.4 Even with this progress, our interviews with system stakeholders indicated that the state has not yet achieved critical momentum in its efforts to measure and report on quality. A key factor in the current situation is that the health care system itself has little existing infrastructure, such as large public or private health systems, large integrated physician groups, or large academic medical centers, upon which to build and then facilitate dissemination of
3 See Fisher ES, et al., “The Implications of Regional Variations in Medicare Spending, Part 1: The Content, Quality, and Accessibility of Care” and “Part 2: Health Outcomes and Satisfaction with Care.” Annals of Internal Medicine, vol. 138, no. 4, February 18, 2003; Jencks SF, et al., “Change in the Quality of Care Delivered to Medicare Beneficiaries, 1998-1999 to 2000-2001,” Journal of the American Medical Association 289, no.3 (2003): 305-312; Fisher ES, “Medical Care – Is More Always Better?”, New England Journal of Medicine 349, no. 17 (2003): 1665-1667; Baicker K and Chandra A, “Medicare Spending, The Physician Workforce, and Beneficiaries’ Quality of Care,” Health Affairs Web Exclusive (7 April 2004): W4-184-197. 4 New Jersey Department of Health and Senior Services, Health Care Quality Assessment, “Patient Safety Initiative: 2005 Summary Report,” September 2006 (http://www.state.nj.us/health/hcqo/ps/documents/ 2005_summary_report.pdf) and New Jersey Department of Health and Senior Services, “New Jersey 2006 Hospital Performance Report,” September 2006 (http://web.doh.state.nj.us/hpr/docs/2006/report.pdf).
Executive Summary 2006 New Jersey Health Care Almanac
© Avalere Health LLC vii
the types of health care quality initiatives being developed and implemented in other large states.
• New Jersey’s population will become older and more culturally diverse over the next 10 to 20 years. Demographically, New Jersey’s health care system will have no choice but to grapple with the statewide implication of the dominant national demographic trend: an aging and increasingly culturally diverse population over the next 20 years. These implications include increased demand for health care services that must be delivered in ways that are culturally and linguistically appropriate.
• Accountability for government oversight of the health care system is dispersed. The state’s current administrative structures for overseeing and managing the health care system is, like the system itself, fragmented, decentralized, and often not fully transparent to all of its public and private stakeholders. There are at least five major state agencies5 that oversee different aspects of the state’s health care system, that together must also coordinate with the federal Centers for Medicare and Medicaid Services (CMS), which administers Medicare, Medicaid, and the State Children’s Health Insurance Program (SCHIP). In addition, myriad county and municipal health departments and local elected officials also exert influence over aspects of the health care system (when the closure of a general acute care hospital in a particular community is being considered, for example).
Taken together, the Almanac’s data and analysis can inform the discussions on how best to rationalize New Jersey’s health care system, but it will take strong, decisive action on the part of all affected groups and stakeholders in order to successfully position New Jersey’s healthcare system for the 21st century.
Four sets of policy considerations for New Jersey’s health care system:
A successful effort to remake New Jersey’s health care system must take into account the following four sets of high-level policy considerations:
1. Financing: Is the aggregate level of private and public funding adequate to ensure access to high-quality health care services across the state? Are public and private financial and material health care resources distributed across the health care system (hospitals, physicians, etc.) in a way that maximizes economic efficiency and promotes equity of access to those resources?
2. Access and quality of care: How does New Jersey’s health care system compare to state and national benchmarks in terms of access to and quality of primary care and specialty care services? How does access to and the quality of these services vary across the state? What degree of regional variation is appropriate and/or acceptable to public and private stakeholders?
5 The five principal state agencies are the Department of Health and Senior Services (containing multiple sub-department components); the Department of Human Services (containing multiple sub-department components); the New Jersey Department of Banking and Insurance; the New Jersey Office of the Attorney General/Division of Consumer Affairs; and the New Jersey Health Care Facilities Financing Authority.

2006 New Jersey Health Care Almanac Executive Summary
viii © Avalere Heath LLC
3. Role of public policy and private markets: Should the state government change its role in organizing and managing the health care system? What should the role of the private market be in allocating health care resources?
4. Preparing for the state’s future health care needs: What do demographic trends indicate New Jersey’s health care system should look like ten or more years from today? What should state and private sector policy-makers do now to ensure that the health care system will be able to serve the state’s residents then? Are the state and local policy setting and oversight mechanisms appropriate for the evolving needs of New Jersey’s healthcare system?
Our analysis seeks to provide a quantitative foundation for thoughtful discussion on rationalizing New Jersey’s health care system. However, while data on access, capacity, and utilization are important, they must be viewed through the unique lens of New Jersey’s evolving and varied local, regional, and statewide health care systems. Like politics, all health care is local, and our “point-in-time” examination reveals significant variation within and across regions of the state.
We have not attempted to map out the many interrelated influences on and components of a statewide health care system, including the impact of new or closed facilities on the underlying employment market, the deep economic drivers of changes in wealth and poverty levels, and employer behaviors with respect to health insurance (to name just three). In addressing issues of resource distribution, access, the role of private markets, and long-term demographic trends, New Jersey business, health, citizen, and political leaders must incorporate these and a host of other essential health and non-health factors into their discussions. The complete 2006 Almanac of New Jersey Health Care consists of a set of comparative analytic tables, charts, and summaries of the various components of New Jersey’s health care system. It presents this information by region, with comparisons to statewide averages, national data, and data from the state of Connecticut, for comparison and benchmarking purposes. Following a statewide summary of system attributes, the Almanac examines in detail each of eleven one-, two-, or three-county regions. The appendices to the Almanac contain the detailed data supporting our summary tables and charts. In gathering the data for this Almanac, we relied on a wide variety of sources, including both public and private data. While data discrepancies are inevitable, we have sought to limit our findings to those clearly supported by the overwhelming preponderance of the available data. We welcome any corrections or clarifications to our data sets and our findings, and we dedicate the Almanac to the residents of New Jersey.

C h a p t e r 1
PuRPose, MeTHodoLoGY, ANd oVeRVieW oF
KeY FiNdiNGs
Barnegat Lighthouse, ocean County

Purpose, Methods, and Key Findings 2006 New Jersey Health Care Almanac
© Avalere Health LLC 3
PURPOSE
The 2006 New Jersey Health Care Almanac presents an empirical summary of the capacity and utilization of the New Jersey health care system, using widely-accepted analytic metrics of provider supply and health care service utilization.
In the early 1990s, the State of New Jersey dramatically changed the regulatory environment under which the state’s health care system operated, when it repealed its “all-payer” hospital rate-setting system and dismantled the “certificate-of-need” process governing general acute care hospital construction. At the same time as these policies were implemented, significant changes, including what many observers referred to as the “rise of managed care,” occurred in the private health insurance market, as employers and other health care purchasers clamped down significantly on the growth of health care costs in response to several years of experiencing double-digit annual cost increases.
Toward the end of the decade, the U.S. health care system’s largest single payer, Medicare, enacted a series of payment policy changes as part of the federal Balanced Budget Act of 1997 and subsequent laws, which further increased revenue pressures on all health care providers, including the approximately 80 general acute care hospitals operating in New Jersey. By 1998, the combination of the repeal of all-payer rate-setting for hospitals, the growth of managed care, and these Medicare budget cuts created enormous strains on New Jersey’s health care delivery and financing systems—strains that have led many stakeholders—providers, payers, and patient advocates, to acknowledge the need for a systematic review of the state’s health care system.
In some parts of the country, such as California, Michigan, and New York, these changes in state health care oversight, private insurance practices, and federal health care financing policies resulted in significant planned and unplanned changes in the organization of the respective state’s health care system. In New Jersey, it appears that these effects have been occurring more slowly, but the Governor’s executive order on October 12, 2006 creating a state “Commission on Rationalizing Health Care Resources” may well accelerate the process and provide a forum to address the many difficult issues facing the state’s health care system. The authors offer this Almanac as a tool to inform these discussions and deliberations.

2006 New Jersey Health Care Almanac Purpose, Methodology, and Key Findings
4 © Avalere Heath LLC
METHODS
The 2006 New Jersey Health Care Almanac divides the state into eleven regions to permit a systematic examination of regional similarities and variations in health care system supply, access, and utilization. These regions reflect regional divisions of the state's major health care markets, and are presented in a geographically cohesive manner intended to provide sufficient detail to capture local variations in the health care delivery system, while not being so disaggregated that one loses sight of the “big picture” of what is happening in a particular region and across the state. The adage that “all health care is local” appears to be borne out by the data presented: significant variations in access, capacity, and utilization exist that cannot be explained by demographics alone, and these variations must be understood if systemic reforms are to succeed.
This report focuses on variation in health care system capacity and utilization in New Jersey. There is a significant and growing body of health services research literature showing that regional variation in the size and composition of health care delivery systems is directly linked to variations in health care spending, and that differing amounts of health care resources do not correspond to variations in the quality of care or health outcomes.1 Given that higher health care utilization and spending do not appear to produce better health outcomes overall, many researchers conclude that it may be appropriate to use lower-use, lower-spending regions as one benchmark against which to consider overall health care capacity, utilization and spending.
Health care policymakers increasingly are examining how a particular state compares in terms of health care supply and utilization to the rest of the country and to other, similar states. They are also looking at how different regions within the state compare to one another in the treatment of similar populations. High-capacity, high-use areas may be expending significant, and possibly unnecessary, resources for the provision of health care to their residents. Such regions may be able to limit their total health care spending without negatively impacting quality. Low-capacity, low-use areas should guard against the possibility of under-utilization, even if empirical evidence suggests that even the lowest capacity/use regions generate comparable health care outcomes to higher capacity/use regions.
These findings suggest that an effective way to understand New Jersey’s health care system is to examine the variations in the capacity and utilization of the state’s health care system. Our analysis focuses on the current capacity of New Jersey’s current health care system—itself the result of years of discrete, decentralized, and often uncoordinated policy and business decisions by thousands of stakeholders, including state officials, health care providers, employers, unions, and health insurance payers. Our analysis relies on the examination of variations in health care capacity and utilization from regional, statewide, and national averages. We draw comparisons between regions 1 See page 13 for an overview of this literature.
Purpose, Methods, and Key Findings 2006 New Jersey Health Care Almanac
© Avalere Health LLC 5
within the state, between statewide New Jersey metrics and the metrics for Connecticut, a state with a similar demographic makeup, and between New Jersey averages and national averages.
The Almanac is intended to inform that examination by state policy makers, health care system leaders and service providers, patients, employers, unions, and payers. Its goal is to assist the people of New Jersey as they set out to reform their health care system to deliver the highest-quality health care services to all of the state’s citizens in the most economically efficient and equitable manner possible.
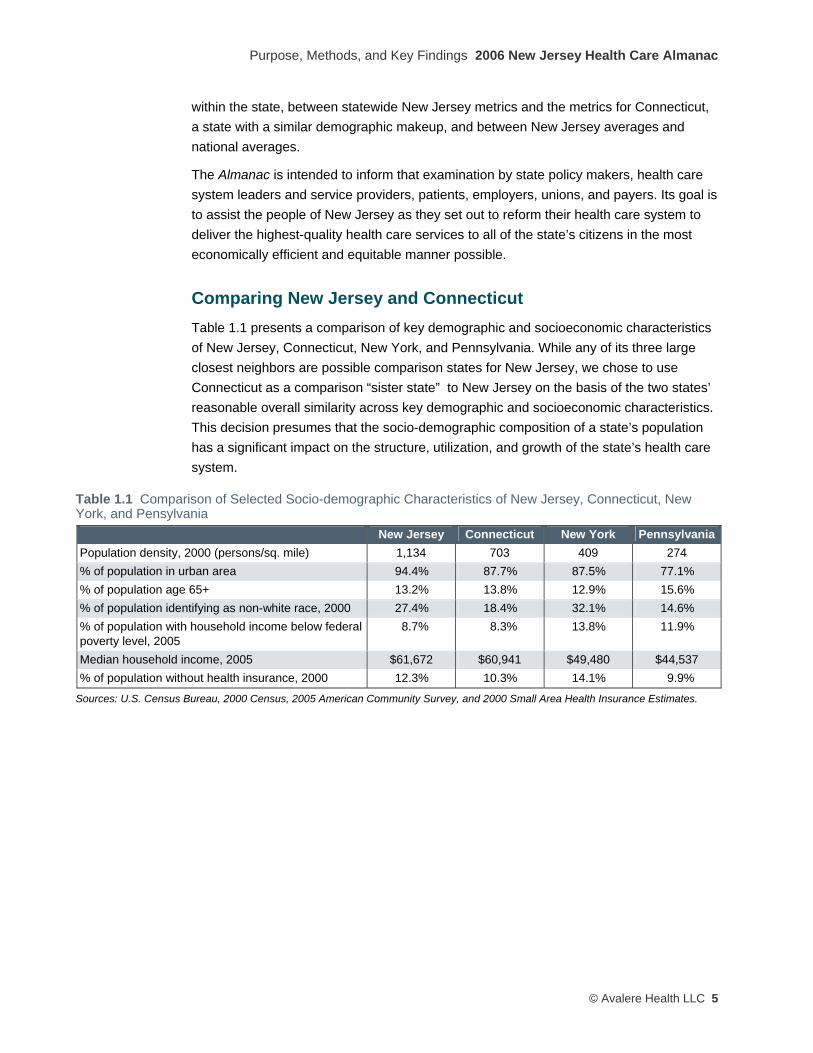
Comparing New Jersey and Connecticut Table 1.1 presents a comparison of key demographic and socioeconomic characteristics of New Jersey, Connecticut, New York, and Pennsylvania. While any of its three large closest neighbors are possible comparison states for New Jersey, we chose to use Connecticut as a comparison “sister state” to New Jersey on the basis of the two states’ reasonable overall similarity across key demographic and socioeconomic characteristics. This decision presumes that the socio-demographic composition of a state’s population has a significant impact on the structure, utilization, and growth of the state’s health care system.
Table 1.1 Comparison of Selected Socio-demographic Characteristics of New Jersey, Connecticut, New York, and Pensylvania
New Jersey Connecticut New York PennsylvaniaPopulation density, 2000 (persons/sq. mile) 1,134 703 409 274 % of population in urban area 94.4% 87.7% 87.5% 77.1% % of population age 65+ 13.2% 13.8% 12.9% 15.6% % of population identifying as non-white race, 2000 27.4% 18.4% 32.1% 14.6% % of population with household income below federal poverty level, 2005
8.7% 8.3% 13.8% 11.9%
Median household income, 2005 $61,672 $60,941 $49,480 $44,537 % of population without health insurance, 2000 12.3% 10.3% 14.1% 9.9%
Sources: U.S. Census Bureau, 2000 Census, 2005 American Community Survey, and 2000 Small Area Health Insurance Estimates.

2006 New Jersey Health Care Almanac Purpose, Methodology, and Key Findings
6 © Avalere Heath LLC
KEY FINDINGS
General Acute Care Hospitals
“New Jersey has a hospital financing system that is teetering on the edge of collapse.”
“No one is immune from financial lethargy hanging over hospitals—both North and South, teaching and community hospitals, everyone.” New Jersey health care system stakeholders, asked to characterize the state of the state’s general acute care hospitals
Technical note: The Almanac’s treatment of New Jersey’s general acute care hospital system is more complete than that of other sectors of the health care system, driven primarily by the hospital sector’s relative wealth of reliable data. After each section below, we suggest areas for further inquiry that would expand understanding about each of the provider sectors that comprise the state’s health care system.
Since January 2001, nine of the state’s general acute care hospitals have either closed, eliminated acute care inpatient services, or merged with another hospital. Despite these closures, from 2001 to 2005, statewide inpatient capacity measured on a “maintained beds” basis declined by only 1,232 beds, or about 5 percent. This slight, gradual reduction in the state’s total hospital bed capacity is shown in Figure 1.1.
Figure 1.1 Total Hospital Bed Capacity for General Acute Care Hospitals, New Jersey, 2001–2005
Source: Avalere Health analysis of the New Jersey Department of Health and Senior Services Quarterly Inpatient Utilization Report (also known as the B-2 Report).
With only a 5 percent reduction in overall hospital bed supply over the past five years, it is not surprising that several stakeholders interviewed for this report stated a variation on the theme that “there are too many acute care hospitals in New Jersey.”
Purpose, Methods, and Key Findings 2006 New Jersey Health Care Almanac
© Avalere Health LLC 7
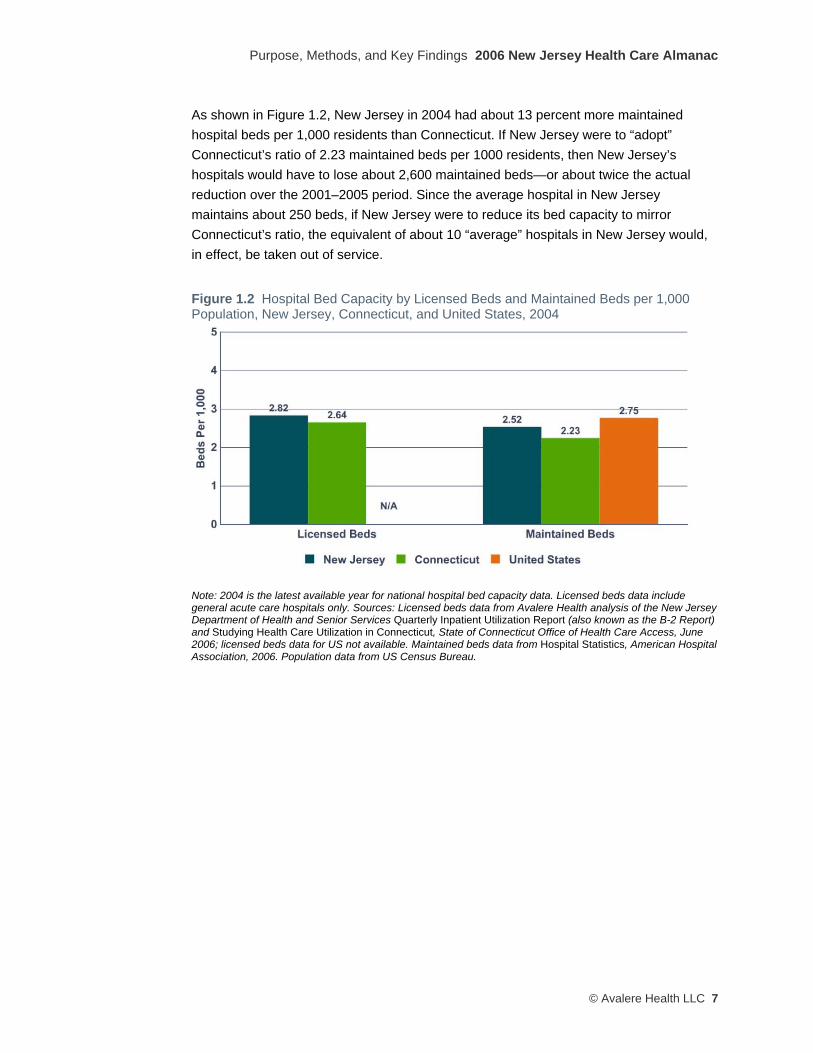
As shown in Figure 1.2, New Jersey in 2004 had about 13 percent more maintained hospital beds per 1,000 residents than Connecticut. If New Jersey were to “adopt” Connecticut’s ratio of 2.23 maintained beds per 1000 residents, then New Jersey’s hospitals would have to lose about 2,600 maintained beds—or about twice the actual reduction over the 2001–2005 period. Since the average hospital in New Jersey maintains about 250 beds, if New Jersey were to reduce its bed capacity to mirror Connecticut’s ratio, the equivalent of about 10 “average” hospitals in New Jersey would, in effect, be taken out of service.
Figure 1.2 Hospital Bed Capacity by Licensed Beds and Maintained Beds per 1,000 Population, New Jersey, Connecticut, and United States, 2004
Note: 2004 is the latest available year for national hospital bed capacity data. Licensed beds data include general acute care hospitals only. Sources: Licensed beds data from Avalere Health analysis of the New Jersey Department of Health and Senior Services Quarterly Inpatient Utilization Report (also known as the B-2 Report) and Studying Health Care Utilization in Connecticut, State of Connecticut Office of Health Care Access, June 2006; licensed beds data for US not available. Maintained beds data from Hospital Statistics, American Hospital Association, 2006. Population data from US Census Bureau.

2006 New Jersey Health Care Almanac Purpose, Methodology, and Key Findings
8 © Avalere Heath LLC
Statewide average bed capacity figures mask wide variation across New Jersey’s regions in the number of maintained beds per 1,000 residents, as shown in Figure 1.3.
Figure 1.3 Variation in Maintained Bed Capacity per 1,000 Population, General Acute Care Hospitals, by Region, New Jersey, 2005
Source: Avalere Health analysis of the New Jersey Department of Health and Senior Services Quarterly Inpatient Utilization Report (also know as the B-2 Report) and U.S. Census data.
Purpose, Methods, and Key Findings 2006 New Jersey Health Care Almanac
© Avalere Health LLC 9
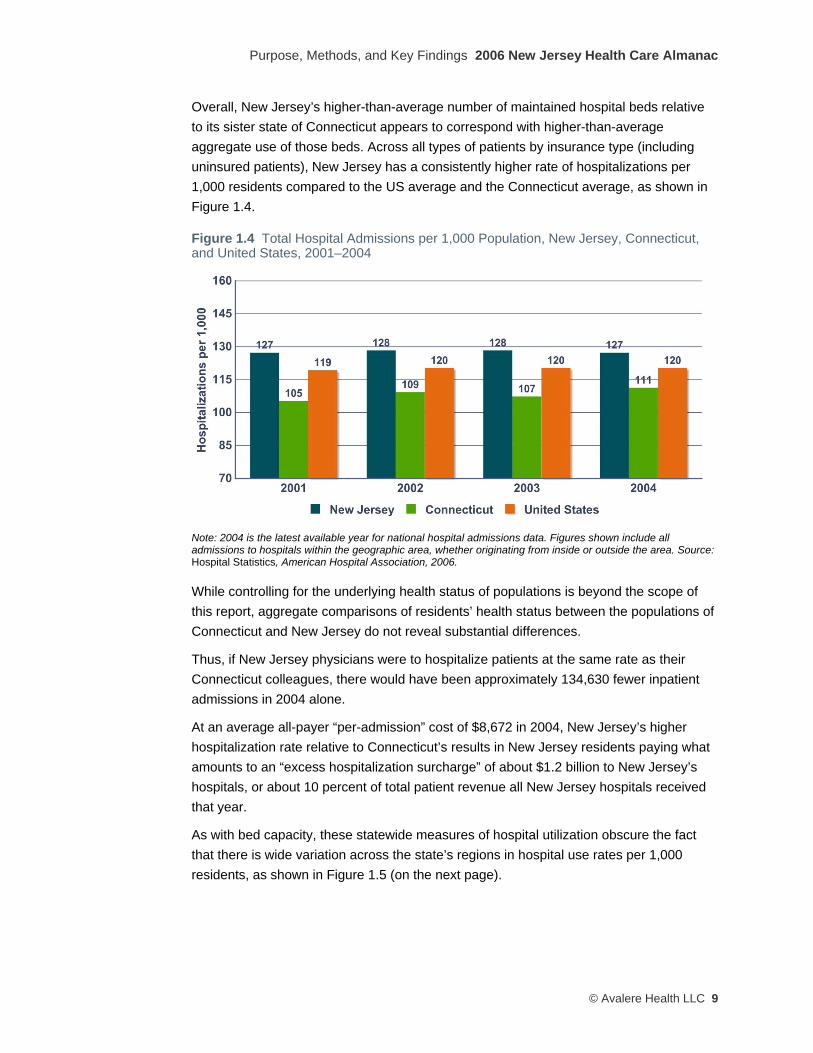
Overall, New Jersey’s higher-than-average number of maintained hospital beds relative to its sister state of Connecticut appears to correspond with higher-than-average aggregate use of those beds. Across all types of patients by insurance type (including uninsured patients), New Jersey has a consistently higher rate of hospitalizations per 1,000 residents compared to the US average and the Connecticut average, as shown in Figure 1.4.
Figure 1.4 Total Hospital Admissions per 1,000 Population, New Jersey, Connecticut, and United States, 2001–2004
Note: 2004 is the latest available year for national hospital admissions data. Figures shown include all admissions to hospitals within the geographic area, whether originating from inside or outside the area. Source: Hospital Statistics, American Hospital Association, 2006.
While controlling for the underlying health status of populations is beyond the scope of this report, aggregate comparisons of residents’ health status between the populations of Connecticut and New Jersey do not reveal substantial differences.
Thus, if New Jersey physicians were to hospitalize patients at the same rate as their Connecticut colleagues, there would have been approximately 134,630 fewer inpatient admissions in 2004 alone.
At an average all-payer “per-admission” cost of $8,672 in 2004, New Jersey’s higher hospitalization rate relative to Connecticut’s results in New Jersey residents paying what amounts to an “excess hospitalization surcharge” of about $1.2 billion to New Jersey’s hospitals, or about 10 percent of total patient revenue all New Jersey hospitals received that year.
As with bed capacity, these statewide measures of hospital utilization obscure the fact that there is wide variation across the state’s regions in hospital use rates per 1,000 residents, as shown in Figure 1.5 (on the next page).

2006 New Jersey Health Care Almanac Purpose, Methodology, and Key Findings
10 © Avalere Heath LLC
Figure 1.5 Variation in Hospitalizations per 1,000 Population, General Acute Care Hospitals by Region, New Jersey, 2005
Note: Hospitalization is defined as a hospital discharge that resulted from an inpatient admission. Source: Avalere Health analysis of the New Jersey Department of Health and Senior Services UB-92 Discharge File and U.S. Census data.

Purpose, Methods, and Key Findings 2006 New Jersey Health Care Almanac
© Avalere Health LLC 11
Treatment of Medicare Beneficiaries in New Jersey Hospitals The difference between the New Jersey and national average hospital use rates is even more marked when the comparison focuses solely on treatment of one of the most medically needy group of patients: Medicare beneficiaries with serious chronic illness nearing the end of life. In many respects, this group is homogenous for the purposes of health care utilization analytics, and thus offers an opportunity to make robust “apples-to-apples” comparisons between states, and between hospitals within states. Researchers at Dartmouth have examined these data extensively, and have made their findings public. Below, we excerpt several of the key hospital findings from the Dartmouth Atlas Project. As shown in Table 1.2, New Jersey’s Medicare-eligible residents are among the “most treated” Medicare patients in the country.
Table 1.2 Rank of New Jersey on Selected Characteristics of Hospital Care for Chronically Ill Medicare Beneficiaries, 1999–2003
Measurement New Jersey
Rate Rank Among All States**
Hospital days* per Medicare decedent during the last two years of life 23.9 days 5 of 51 Hospital days* per Medicare decedent during the last six months of life 15.2 days 4 of 51 ICU days* per Medicare decedent during the last two years of life 6.5 days 3 of 51 ICU days* per Medicare decedent during the last six months of life 4.6 days 3 of 51 Percent of Medicare decedents admitted to ICU during the hospitalization* in which they died
25.1% 1 of 51
*Paid under Medicare Part A. **Including the District of Columbia. Source: The Dartmouth Atlas Project (http://cecsweb.dartmouth.edu/release1.1/datatools/profile_s1.php).
These results from the Dartmouth Atlas Project are consistent with our findings on the hospitalization trends in the general population. Collectively, New Jersey’s hospitals are in the top decile nationally on measures of hospital resource use intensity.
Recent Financial Performance of New Jersey Hospitals Despite higher rates of utlization, New Jersey’s hospitals are, generally speaking, in poor financial operating condition. As shown in Figure 1.6, many of them have experienced very low or negative operating margins over the past several years. Importantly, extrapolating these trends forward is complicated by recent changes in Medicare’s formula for certain payments. These formula changes will likely have the net effect of reducing many hospitals’ revenues, beginning in 2005.2 Thus, the aggregate financial operating performance of the state’s hospitals over the next few years is, on average, likely to be poorer than the trend reflected in Figure 1.6.
2 For a brief discussion of the heavy reliance of some New Jersey hospitals on the type of Medicare revenue affected by recent Medicare payment policy changes, see Modern Healthcare, Vol. 33 Issue 28 (July 14, 2003).

2006 New Jersey Health Care Almanac Purpose, Methodology, and Key Findings
12 © Avalere Heath LLC
Figure 1.6 Ranges of Operating Margin Performance of General Acute Care Hospitals in New Jersey, 2001–2004
Note: In cases where multiple hospitals under a common system report aggregate results, each of the system’s member hospitals is assigned the value of the collective system’s results. Source: Avalere Health analysis of the New Jersey Department of Health and Senior Services UB-92 Discharge File and Acute Care Hospital Cost Reports.
Our stakeholder interviews suggest that most hospitals have sought to manage their variable costs (primarily labor) on a daily and weekly basis to reflect actual patient loads. Assuming this to be true, then the financial precariousness of New Jersey’s hospital system might be attributed to some combination of inadequate reimbursement rates, and excess fixed costs (mostly non-variable staffing and capital expenditures). Reimbursement-maximization strategies are already becoming increasingly difficult as Medicare and commercial payers continue to alter or aggressively enforce hospital payment policies that reduce their exposure to extremely high costs. Simply charging more to insured patients seems not to be a sustainable strategy as many private insurance companies and their employer-customers are balking at paying higher rates. On the expense side of the ledger, hospitals’ capital expenditures—once incurred—represent all-but-irreversible commitments by hospitals.
Thus, the financial policy options to create a vibrant New Jersey hospital system can be stated starkly: either reimbursement levels must rise, or hospital costs must fall. If the variable portion of hospitals’ cost structures (nurses, aides, etc.) is being managed efficiently, then to effect a reduction in costs implies a reduction in hospitals’ fixed costs (i.e., fewer hospitals, fewer staffed beds, less duplication of high-cost machines and services, etc.).
Consistent with the rest of the U.S. health care system, measures of quality and relative efficiency are just beginning to be developed and disseminated in New Jersey. The state government has begun to grapple with quality measurement for hospital care by enacting the New Jersey Patient Safety Act (P.L. 2004, c.9), which established the Patient Safety Initiative within the Department of Health and Senior Services, and by publishing two important reports this fall on health care quality and safety in the New Jersey health care

Purpose, Methods, and Key Findings 2006 New Jersey Health Care Almanac
© Avalere Health LLC 13
system.3 Unfortunately, there is little data available on whether one or another hospital is more or less efficient in managing resources and delivering high-quality care. In part, this stems from a lack of consistent efficiency and quality metrics. While researchers and policy makers continue to develop strategies to collect and disseminate reliable outcomes and quality-of-care process measures, there has been little “on-the-ground” activity nationally and locally on efficiency metrics, i.e., defining what and how many resources are used to deliver high-quality care. This lack of measures complicates efforts to rationalize the distribution of health care resources.
Although not all studies have found a link between health care supply and utilization, there is evidence that increased health care supply induces greater utilization of services (this theory is commonly known as supply-induced-demand). Numerous studies have found that areas with more hospital beds or physicians per capita also have higher rates of hospitalizations and physician visits per capita.4 These trends may be especially driven by for-profit hospitals and specialist physicians.5 Research published in the 1970s indicated that rates of hospitalization are directly linked to the supply of hospital beds. Often referred to as “Roemer’s Law,” after Milton I. Roemer, M.D., who published the seminal work in this area, this finding can be succinctly summarized as “hospital beds, once built, will be used.”6 More recent research on the Medicare population has confirmed this positive correlation.7
While beyond the scope of this analysis, the proliferation of high-cost, capital-intensive lines of service in the hospital (i.e., the growth in cardiac surgery capacity) may also have contributed to the precarious overall state of New Jersey hospital finances. In an effort to capture or preserve revenues in the face of declining patient need for routine inpatient beds, many hospitals have embarked on costly expansions of the service lines, hoping to make up in high-margin clinical services what many are losing in the lower-margin service lines.
3 New Jersey Department of Health and Senior Services, Health Care Quality Assessment, “Patient Safety Initiative: 2005 Summary Report,” September 2006 (http://www.state.nj.us/health/hcqo/ps/documents/ 2005_summary_report.pdf) and New Jersey Department of Health and Senior Services, “New Jersey 2006 Hospital Performance Report,” September 2006 (http://web.doh.state.nj.us/hpr/docs/2006/report.pdf). 4 These studies include: Cutler DM and Sheiner L, “The Geography of Medicare.” American Economic Review, vol. 89, no. 2, May 1999; Fisher ES, Wennberg DE, Stukel TA, Gottlieb DJ, Lucas FL, and Pinder EL, “The Implications of Regional Variations in Medicare Spending, Part 1: The Content, Quality, and Accessibility of Care” and “Part 2: Health Outcomes and Satisfaction with Care,” Annals of Internal Medicine, vol. 138, no. 4, February 18, 2003; Medicare Payment Advisory Commission, Report to Congress: Variation and Innovations in Medicare, Chapter 1: “Geographic Variation in Per Beneficiary Medicare Expenditures,” June 2003; Wennberg JE, Cooper MM et al., The Dartmouth Atlas of Health Care in the United States. AHA Press: Dartmouth Medical School. Center for Evaluative Clinical Sciences, 1999; Fisher ES, “Medical Care – Is More Always Better?”, New England Journal of Medicine 349, no. 17 (2003): 1665-1667; and Baicker K and Chandra A, “Medicare Spending, The Physician Workforce, and Beneficiaries’ Quality of Care,” Health Affairs Web Exclusive (7 April 2004): W4-184-197. For a more in-depth discussion of this literature, see Appendix 1 of this Almanac. 5 Cutler and Sheiner “The Geography of Medicare.” 6 As cited in “Supply-Sensitive Care: A Dartmouth Atlas Project Topic Brief,” Dartmouth Medical School Center for the Evaluative Clinical Sciences, 2005 (http://www.dartmouthatlas.org/topics/supply_sensitive.pdf). Incidentally, Dr. Roemer was born in Paterson, New Jersey. 7 See sources cited in footnotes 3 and 5.

2006 New Jersey Health Care Almanac Purpose, Methodology, and Key Findings
14 © Avalere Heath LLC
Also, as technology and clinical developments permit more and more patient care to be delivered safely and efficiently outside the walls of the traditional hospital, many hospitals are witnessing the erosion of higher-margin services. This “out-migration” of higher-margin services is driven in part by more compact technologies able to be deployed outside of the hospital, in part by patient demands for more convenient access, in part by safer surgical techniques, and in part by increasingly entrepreneurial physicians. Whatever the drivers, “out-migration” poses a current and long-term challenge to the traditional role and business model of the hospital. It also further complicates any public or private efforts to develop systematic, easily accessible, and understandable measures to assess the quality of care provided to New Jersey residents across a multiplying number of care settings.
Finally, New Jersey appears to be facing real and growing health care workforce constraints. Below, we focus on hospital-based clinical staff; issues surrounding the supply of certain physician specialties are discussed later in this chapter. For nursing professionals, New Jersey is projected to have a nursing shortfall of 43 percent by 2020, compared to a 29 percent shortfall for the United States as a whole.8 While not as large as the 55 percent shortfall expected in Connecticut by 2020, New Jersey’s projected gap between the supply and demand for licensed nursing professionals is significant.9 Anecdotal evidence from interviewees also suggests that shortages already exist for certain kinds of allied health professionals, such as radiology technicians and other clinical support staff.
While a full hospital labor market analysis is beyond the scope of this report, anecdotal reports from stakeholder interviews indicated that some hospitals, particularly those located in urban and rural low-income areas of the state, are finding it increasingly difficult to attract and retain the size of nursing and allied health professional workforce that they need to maintain quality of care standards. The loss of skilled staffing can be self-perpetuating, as more nurses and technicians leave the employ of these “safety net” providers due to low pay and high job stress, thus further increasing the burden on the staff that remains.
Taken together, these trends are coalescing into a “perfect storm” for New Jersey hospitals, relative to national norms: too many inpatient beds chasing a dwindling demand for inpatient care patients; too many hospitalizations; high levels of “end-of-life” care; too many duplicative resource-intensive service lines chasing a fixed number of patients; the loss of higher-margin ancillary services to non-hospital-based settings; the absence of reliable and accepted quality and efficiency metrics; and an increasingly tight labor market for essential caregivers. The situation is especially acute for hospitals and caregivers that care for significant numbers of the uninsured and under-insured.
8 U.S. Department of Health and Human Services, Health Resources and Services Administration, “Projected Supply, Demand, and Shortages of Registered Nurses: 2000–2020,” July 2002. 9 Ibid.

Purpose, Methods, and Key Findings 2006 New Jersey Health Care Almanac
© Avalere Health LLC 15
Condition of the Hospital “Safety Net” in New Jersey This “perfect storm” bodes ill for all of New Jersey’s residents, but the poor and uninsured (“safety net patients”) are particularly vulnerable. For the state’s hospitals that serve as safety net providers in low-income urban and rural areas, continuing to deliver appropriate levels of care to this growing population may soon become unsustainable for two reasons. First, absent a robust primary care infrastructure, the large and growing populations of uninsured residents living in and around the areas served by these “safety net” hospitals tend to rely disproportionately on the inefficient emergency department model for straightforward primary care.
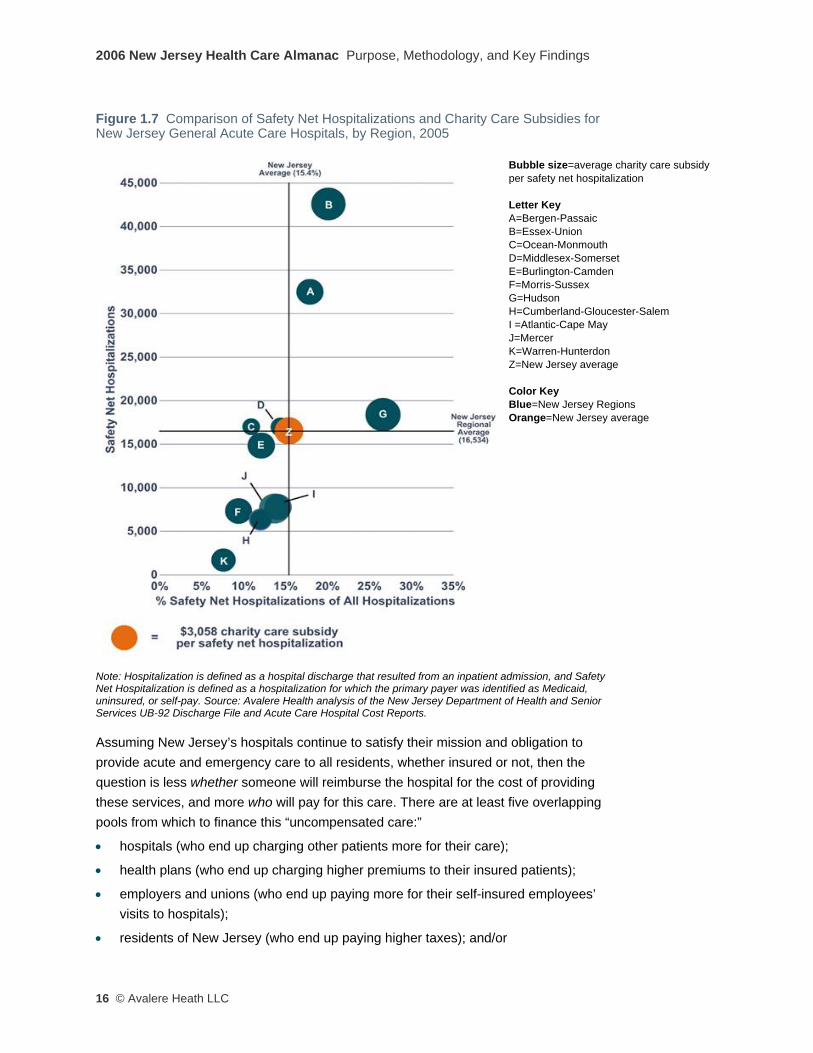
Second, as indicated in Figure 1.7 (next page), the state’s current system of funding and distributing “charity care” payments to hospitals seems not to be reflective of individual hospitals’ actual role in the “safety net” and seems not to incorporate incentives for the efficient provision of care to the uninsured. The chart arrays New Jersey regions’ experience with delivering care to safety net patients, measured both in absolute numbers of patients served, and as a fraction of overall admissions (to convey the degree of concentration of safety net patients). The chart also presents (by the size of each “bubble”) the average per case state subsidy for this care, on a regional basis, and demonstrates, for example, that Monmouth-Ocean (C) hospitals receive an average per-patient state subsidy much lower than Burlington-Camden (E) hospitals—even though both sets of hospitals care for roughly the same number and proportion of safety net patients, relative to their South Jersey counterparts.
2006 New Jersey Health Care Almanac Purpose, Methodology, and Key Findings
16 © Avalere Heath LLC
Figure 1.7 Comparison of Safety Net Hospitalizations and Charity Care Subsidies for New Jersey General Acute Care Hospitals, by Region, 2005
Bubble size=average charity care subsidy per safety net hospitalization Letter Key A=Bergen-Passaic B=Essex-Union C=Ocean-Monmouth D=Middlesex-Somerset E=Burlington-Camden F=Morris-Sussex G=Hudson H=Cumberland-Gloucester-Salem I =Atlantic-Cape May J=Mercer K=Warren-Hunterdon Z=New Jersey average Color Key Blue=New Jersey Regions Orange=New Jersey average
Note: Hospitalization is defined as a hospital discharge that resulted from an inpatient admission, and Safety Net Hospitalization is defined as a hospitalization for which the primary payer was identified as Medicaid, uninsured, or self-pay. Source: Avalere Health analysis of the New Jersey Department of Health and Senior Services UB-92 Discharge File and Acute Care Hospital Cost Reports.
Assuming New Jersey’s hospitals continue to satisfy their mission and obligation to provide acute and emergency care to all residents, whether insured or not, then the question is less whether someone will reimburse the hospital for the cost of providing these services, and more who will pay for this care. There are at least five overlapping pools from which to finance this “uncompensated care:”
• hospitals (who end up charging other patients more for their care);
• health plans (who end up charging higher premiums to their insured patients);
• employers and unions (who end up paying more for their self-insured employees’ visits to hospitals);
• residents of New Jersey (who end up paying higher taxes); and/or
Purpose, Methods, and Key Findings 2006 New Jersey Health Care Almanac
© Avalere Health LLC 17
• savings from rationalizing the number of hospital beds/admissions and other structural changes to the health care system (assuming these savings can be captured and re-distributed).
None of these alternatives in isolation may be palatable to any of the affected parties. However, it is impossible to avoid the conclusion that in the end, a mix of funding sources for charity care will be needed.
Efforts to rationalize the number and distribution of hospital beds and/or service lines inevitably invoke two competing schools of thought: a regulatory approach, similar to the state’s Certificate of Need processes of the 1970s and 1980s; or a market-based approach, where individual hospitals and systems rise or fall on their own. This neat bifurcation of approaches, however, fails to incorporate the underlying community and political realities of the hospital as a core community asset. In practice, neither the pure regulatory nor the pure market-based approach has proved itself capable of rationalizing the number and distribution of hospital beds and services, suggesting that a mixed approach may be the most promising path.
Border-Crossing by New Jersey Residents Seeking Out-of-State Hospital Care Traditional health services research uses discrete county, state, or other geographic boundaries as the unit of analysis, which may understate or overstate utilization and capacity trends due to a lack of data on the travel patterns of patients and their preferences to seek health care services across geographic lines. This phenomenon is particularly relevant to New Jersey, because of the proximity of health care resources in nearby urban centers in Pennsylvania and New York. These areas have hospitals and affiliated physicians that provide highly specialized tertiary care services, which are precisely the types of medical services for which patients will cross state lines to access.
Our findings are consistent with published research and stakeholder perceptions that New Jersey is a net exporter of health care resources, i.e., a higher percentage of New Jersey residents seek care from out-of-state providers (out-migration) compared to the number of out-of-state residents who travel to New Jersey for care (in-migration).10 Anecdotal evidence suggests that the out-migration of New Jersey residents for health care services is most prominent in Camden and Burlington counties (to Philadelphia), Essex, Union, and Hudson counties (to New York City), and Warren County (to Allentown, Pennsylvania).
While data limitations prevented us from doing a region-specific analysis, our analysis of FY 2005 Horizon Blue Cross Blue Shield claims data for hospital inpatient services reveals that approximately 13.0 percent of all inpatient visits paid for by Horizon on behalf
10 See for example Martin, A et al., “Health care spending during 1991-1998: a fifty-state review,” Health Affairs, July/August 2002; vol. 21 no. 4: 112-126, Exhibit 5.

2006 New Jersey Health Care Almanac Purpose, Methodology, and Key Findings
18 © Avalere Heath LLC
of members who were residents of New Jersey were made to non-New Jersey providers. The vast majority of these Horizon plan members traveled to New York or Pennsylvania (Philadelphia and the Lehigh Valley) for this care. In the other direction, our analysis of hospital discharge data provided by the State of New Jersey shows that 2.7 percent of all inpatient care provided by New Jersey hospitals was delivered to non-New Jersey residents. The summary results of our analysis are shown in Table 1.3.
Table 1.3 Estimated Flows of New Jersey and Other State Residents Crossing State Lines for Inpatient Hospital Care, July 2004–June 2005
Percent of Total Inpatient Utilization
In-migration (other state residents to New Jersey) 2.7% Out-migration (New Jersey residents to other states) • To New York • To Pennsylvania • To all other states
13.0% 6.1% 5.9% 1.0%
Sources: In-migration estimate is from Avalere Health analysis of the New Jersey Department of Health and Senior Services UB-92 Discharge File; out-migration estimate is from Avalere Health analysis of Horizon Blue Cross Blue Shield inpatient claims data.
Questions that policy makers may wish to consider about the state’s hospitals: • If there are “too many” hospital beds or hospitals in New Jersey, how will the excess
beds or hospitals be identified and taken out of service?
• If the hospital admitting patterns of New Jersey’s physicians are not consistent with national best practices, how could the practice patterns of New Jersey’s physicians be changed?
• If New Jersey hospitals are not managing their patients’ length-of-stay consistent with national best practices, how could the practices of those hospitals be changed?
• If hospitals are to close or be downsized, with the concomitant reduction in revenues, how will the pension and bond obligations of that facility be satisfied?
• Do systems of hospitals have a different role in rationalizing the acute care system than do single, unaffiliated hospitals? What protections should be adopted for sole providers of acute care—be they rural, suburban, or urban?
• Should the state or the market influence or determine the number and geographic distribution of hospital and/or non-hospital-based providers of complex diagnostics, advanced surgical care, and other higher-margin services?
• Is the state’s current approach to subsidizing hospitals that provide charity care appropriate? How large should the charity care funding pool be? How should the formula for calculating the size and distribution of charity care funding pool be updated?
• Across the state’s hospitals, health plans, employers, and residents, how will the state attribute and capture the cost of providing care to residents who lack either insurance or the resources to pay for care?
Purpose, Methods, and Key Findings 2006 New Jersey Health Care Almanac
© Avalere Health LLC 19
• What mechanisms exist to avoid the “tragedy of the commons11,” where all hospitals see the benefit of re-aligning the capacity and utilization of the acute care system, but no one has an incentive to be the first to offer up a reduction in beds or adoption of aggressive utilization management strategies? Are there multi-year alignment strategies where “winners” and “losers” might pool their gains and losses to mitigate the positive and negative impact on individual systems and hospitals?
• How can the state address the demographic reality of an aging nursing workforce and an increasing shortage of licensed nurses among safety net providers located in relatively low-income communities? How can the state address hospital staffing shortfalls for allied health professionals, such as clinical technicians?
• Should the state take a more active regulatory role in rationalizing hospitals’ “cost-to-charge” ratios, for example as a condition of participation in Medicaid?
• When assessing hospital capacity and safety net access, how should the state factor in New Jersey residents’ tendency to access care across the border into Philadelphia, New York City, and the Lehigh Valley?
• If there are too many beds and service lines in New Jersey, and if regional variation exists, how will New Jersey balance the regulatory and market-based approaches to rationalizing the number and distribution of beds and service lines?
Areas for further inquiry: • To what extent has the proliferation of high-cost, capital-intensive lines of service in
the hospital (i.e., the growth in cardiac surgery capacity) contributed to the precarious overall state of New Jersey hospital finances?
• To what extent can the state address the looming shortage of nursing professionals? Are there education policies that should be examined, along with consideration of expanding the scope of practice for advanced practice nurses, to increase the health care system’s capacity to deliver primary care services?
11 See: http://en.wikipedia.org/wiki/Tragedy_of_the_commons
2006 New Jersey Health Care Almanac Purpose, Methodology, and Key Findings
20 © Avalere Heath LLC
Physicians
“Physicians are increasingly taking services out of the hospital setting, leaving only the sickest and most-complicated patients in the hospital.”
“Physicians control the health care system. In New Jersey today, doctors go to whichever hospital gives them the best deal and the patients follow.”
“Malpractice insurance for physicians and hospitals is a major cost-driver. Physicians are practicing defensive medicine, ordering a high number of costly tests to demonstrate complete medical care in case of litigation.” New Jersey health care system stakeholders, asked to characterize the state of the state’s physicians
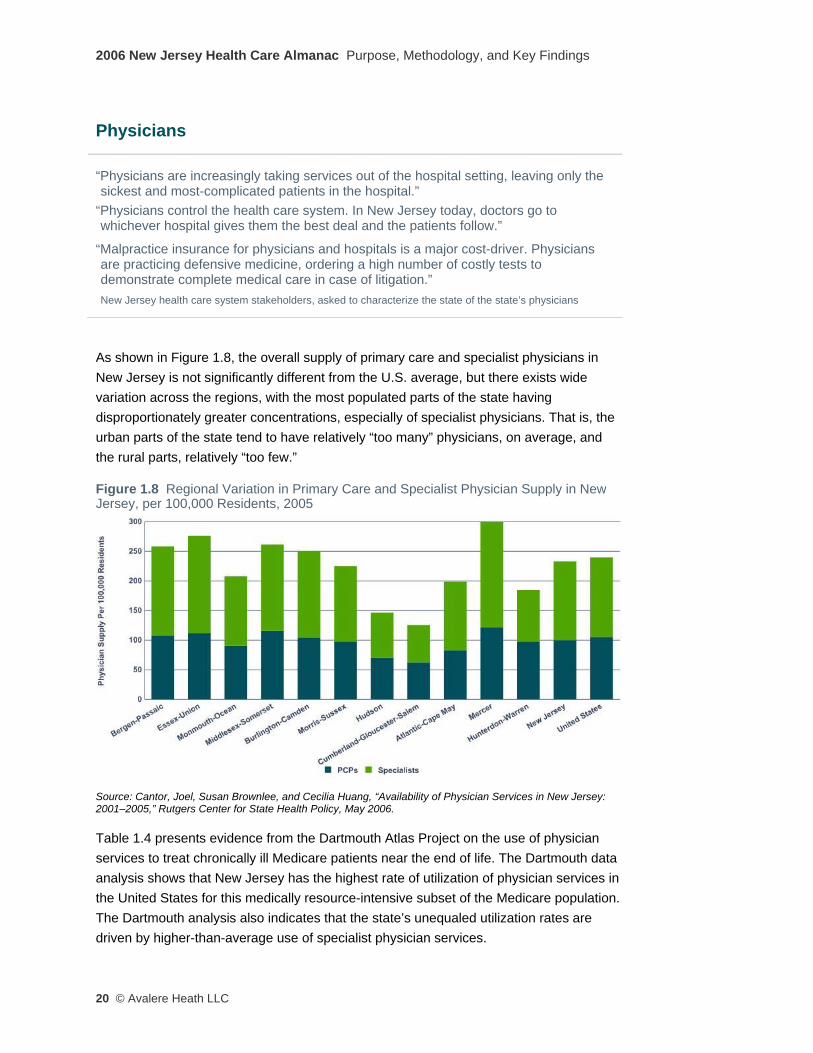
As shown in Figure 1.8, the overall supply of primary care and specialist physicians in New Jersey is not significantly different from the U.S. average, but there exists wide variation across the regions, with the most populated parts of the state having disproportionately greater concentrations, especially of specialist physicians. That is, the urban parts of the state tend to have relatively “too many” physicians, on average, and the rural parts, relatively “too few.”
Figure 1.8 Regional Variation in Primary Care and Specialist Physician Supply in New Jersey, per 100,000 Residents, 2005
Source: Cantor, Joel, Susan Brownlee, and Cecilia Huang, “Availability of Physician Services in New Jersey: 2001–2005,” Rutgers Center for State Health Policy, May 2006.
Table 1.4 presents evidence from the Dartmouth Atlas Project on the use of physician services to treat chronically ill Medicare patients near the end of life. The Dartmouth data analysis shows that New Jersey has the highest rate of utilization of physician services in the United States for this medically resource-intensive subset of the Medicare population. The Dartmouth analysis also indicates that the state’s unequaled utilization rates are driven by higher-than-average use of specialist physician services.
Purpose, Methods, and Key Findings 2006 New Jersey Health Care Almanac
© Avalere Health LLC 21
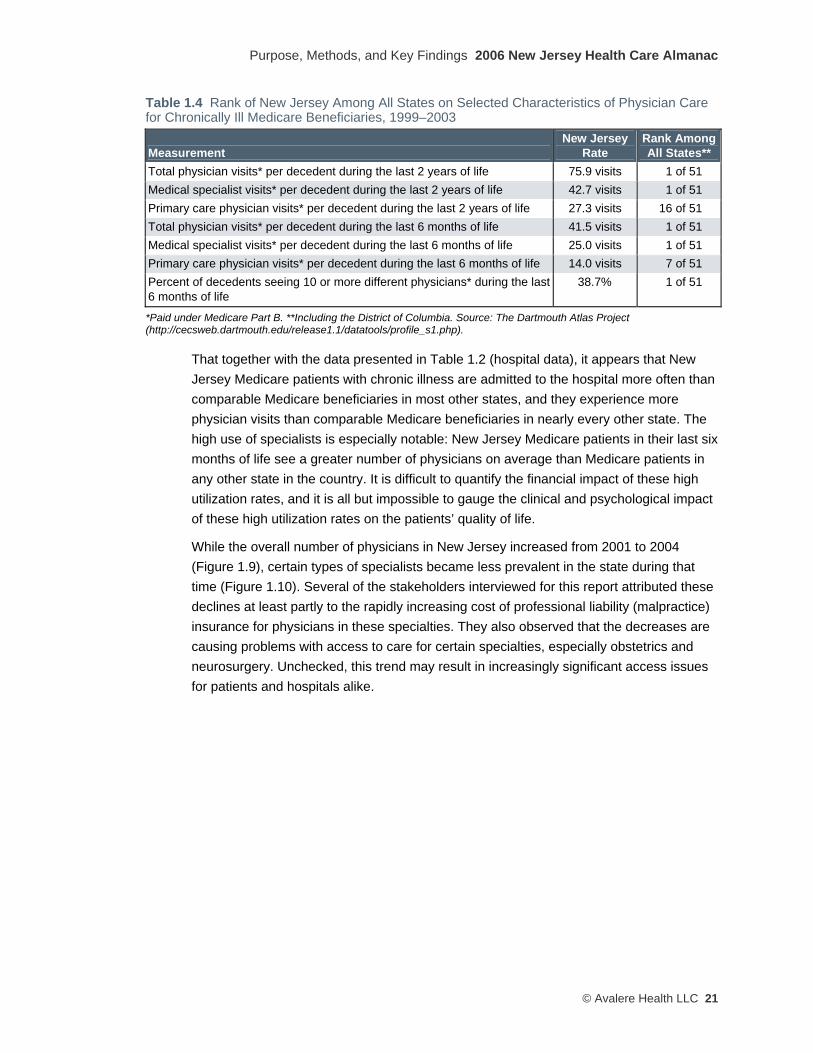
Table 1.4 Rank of New Jersey Among All States on Selected Characteristics of Physician Care for Chronically Ill Medicare Beneficiaries, 1999–2003
Measurement New Jersey
Rate Rank AmongAll States**
Total physician visits* per decedent during the last 2 years of life 75.9 visits 1 of 51 Medical specialist visits* per decedent during the last 2 years of life 42.7 visits 1 of 51 Primary care physician visits* per decedent during the last 2 years of life 27.3 visits 16 of 51 Total physician visits* per decedent during the last 6 months of life 41.5 visits 1 of 51 Medical specialist visits* per decedent during the last 6 months of life 25.0 visits 1 of 51 Primary care physician visits* per decedent during the last 6 months of life 14.0 visits 7 of 51 Percent of decedents seeing 10 or more different physicians* during the last 6 months of life
38.7% 1 of 51
*Paid under Medicare Part B. **Including the District of Columbia. Source: The Dartmouth Atlas Project (http://cecsweb.dartmouth.edu/release1.1/datatools/profile_s1.php).
That together with the data presented in Table 1.2 (hospital data), it appears that New Jersey Medicare patients with chronic illness are admitted to the hospital more often than comparable Medicare beneficiaries in most other states, and they experience more physician visits than comparable Medicare beneficiaries in nearly every other state. The high use of specialists is especially notable: New Jersey Medicare patients in their last six months of life see a greater number of physicians on average than Medicare patients in any other state in the country. It is difficult to quantify the financial impact of these high utilization rates, and it is all but impossible to gauge the clinical and psychological impact of these high utilization rates on the patients’ quality of life.
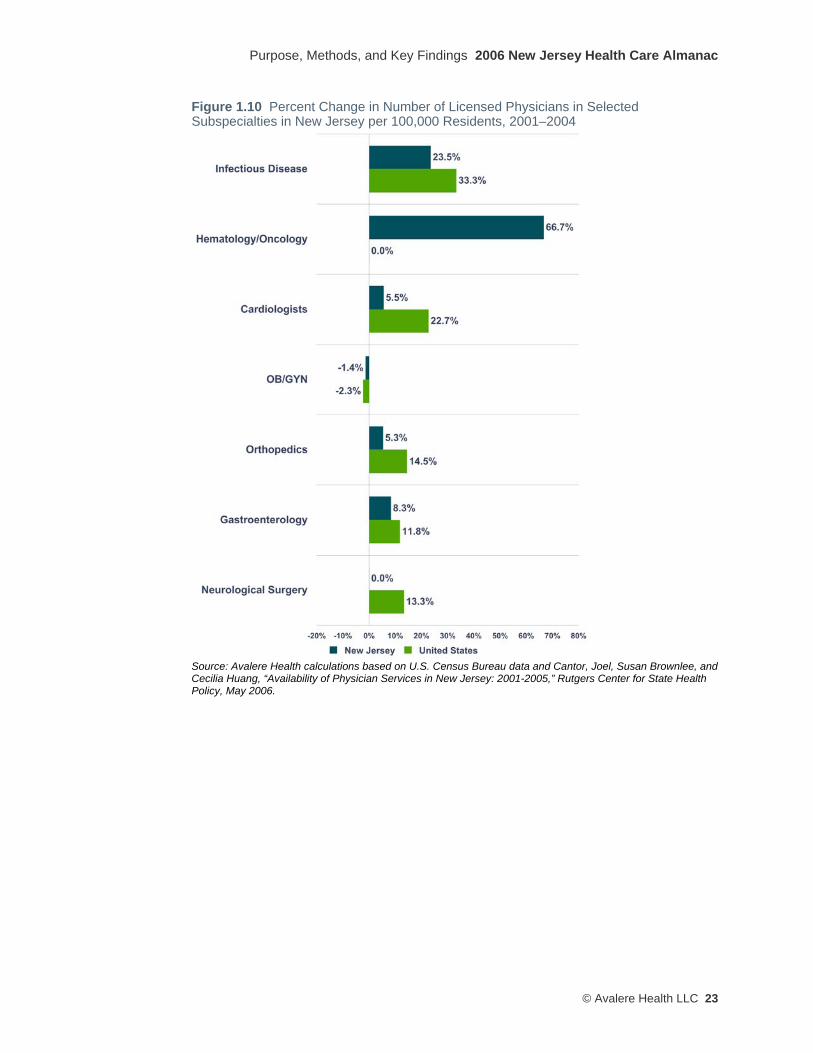
While the overall number of physicians in New Jersey increased from 2001 to 2004 (Figure 1.9), certain types of specialists became less prevalent in the state during that time (Figure 1.10). Several of the stakeholders interviewed for this report attributed these declines at least partly to the rapidly increasing cost of professional liability (malpractice) insurance for physicians in these specialties. They also observed that the decreases are causing problems with access to care for certain specialties, especially obstetrics and neurosurgery. Unchecked, this trend may result in increasingly significant access issues for patients and hospitals alike.

2006 New Jersey Health Care Almanac Purpose, Methodology, and Key Findings
22 © Avalere Heath LLC
Figure 1.9 Percent Change in Number of Licensed Physicians in New Jersey per 100,000 Residents, 2001–2004
Source: Avalere Health calculations based on U.S. Census Bureau data and Cantor, Joel, Susan Brownlee, and Cecilia Huang, “Availability of Physician Services in New Jersey: 2001–2005,” Rutgers Center for State Health Policy, May 2006.
Purpose, Methods, and Key Findings 2006 New Jersey Health Care Almanac
© Avalere Health LLC 23
Figure 1.10 Percent Change in Number of Licensed Physicians in Selected Subspecialties in New Jersey per 100,000 Residents, 2001–2004
Source: Avalere Health calculations based on U.S. Census Bureau data and Cantor, Joel, Susan Brownlee, and Cecilia Huang, “Availability of Physician Services in New Jersey: 2001-2005,” Rutgers Center for State Health Policy, May 2006.

2006 New Jersey Health Care Almanac Purpose, Methodology, and Key Findings
24 © Avalere Heath LLC
Organization of Physician Practices in New Jersey Physician practices in New Jersey tend to be organized into solo or small group practices, with little reported impact from the growth of managed care plans over the past ten years. There appear to have been limited efforts at integration into larger groups, specifically in areas of northern New Jersey, where some physicians have attempted to organize themselves in order to increase their negotiating leverage with hospitals and health plans. The existing degree of fragmentation among physician practices makes it more difficult for health plans and hospitals to partner with physicians to expand access, reduce cost, and improve quality of care.
The unconsolidated nature of medical practices also may contribute to the relatively low quality rankings assigned by Jencks et al. in their groundbreaking state-by-state study of the quality of care delivered to Medicare beneficiaries.12 This possibility was echoed in one stakeholder’s comment that “physicians in New Jersey are not gaining the administrative or quality gains of working in larger groups.”
At the same time, the growth of freestanding single-specialty surgery and diagnostic facilities has allowed certain types of physicians, such as orthopedic surgeons, gastroenterologists, and diagnostic radiologists, to move patients out of the hospital setting, thus increasing their independence from hospitals and health plans. As discussed above in the context of hospitals, this out-migration to “winning” outpatient/free-standing settings has a likely negative cascading effect on the financial and clinical viability of the “losing” hospitals.
Access to Physician Services for Medicaid Recipients in New Jersey Medicaid is a health insurance program for low-income residents, paid for under a combined state-federal financing program. For the most part, New Jersey is able to establish its own payment and eligibility criteria, subject to federal limits and guidelines. Gaining access to physician care is reported to be a significant problem for patients who are Medicaid recipients (and also for uninsured patients with low incomes). Compared to both U.S. and Connecticut average payment levels, New Jersey has relatively low payment rates for physician services in its fee-for-service Medicaid program, as shown in Table 1.5. Low Medicaid payment rates tend to limit the interest and the ability of physicians to treat Medicaid patients.
12 Jencks SF, et al., “Change in the Quality of Care Delivered to Medicare Beneficiaries, 1998-1999 to 2000-2001,” Journal of the American Medical Association 289, no.3 (2003): 305-312.

Purpose, Methods, and Key Findings 2006 New Jersey Health Care Almanac
© Avalere Health LLC 25
Table 1.5 Medicaid Relative Physician Fee Index for New Jersey, Connecticut, and U.S., 2003 All Services Primary Care Obstetric Care Other Services
New Jersey 0.56 0.61 0.41 0.65 United States 1.00 1.00 1.00 1.00 Connecticut 1.30 1.33 1.53 0.96
Source: Kaiser Family Foundation, statehealthfacts.org, http://www.statehealthfacts.org/cgi-bin/healthfacts.cgi?.
Another benchmark for assessing the adequacy of a payer’s physician payment rates is to compare its rates to what Medicare pays for the same services. New Jersey’s Medicaid rates for physician services look even lower in this comparison, as shown in Table 1.6.
Table 1.6 Medicaid-to-Medicare Fee Index for New Jersey, Connecticut, and U.S., 2003 All Services Primary Care Obstetric Care Other Services
Medicare Fee Schedule 1.00 1.00 1.00 1.00 New Jersey Medicaid 0.35 0.34 0.31 0.43 U.S. Average Medicaid 0.69 0.62 0.84 0.73 Connecticut Medicaid 0.83 0.74 1.16 0.62
Source: Kaiser Family Foundation, statehealthfacts.org, http://www.statehealthfacts.org/cgi-bin/healthfacts.cgi?.
Until recently, most specialist physicians were required by the hospitals (in exchange for admitting privileges) to provide inpatient specialty care to the uninsured, Medicaid, and emergency department patients. With the rapid growth of non-hospital-based surgery, diagnostic imaging, and interventional cardiac care services over the past ten years, our interviewees suggest that it is becoming increasingly difficult for hospitals located in low-income urban and rural areas of New Jersey to find certain types of specialists, such as orthopedic surgeons, radiologists, otolaryngologists (ear-nose-and-throat specialists), and ophthalmologists. Apparently, an increasing number of these physicians no longer need to rely solely on hospital admitting privileges in order to have financially and medically rewarding practices.
Questions that policy makers may wish to consider in examining the roles and responsibilities of physicians in the state’s health care system: • How will New Jersey address the increasing disconnect between the increasing
demand for primary care physicians and the diminishing supply, particularly in low-income inner-city and rural areas where shortages of accessible primary care services seem most acute?
• For physicians choosing to accept or embrace a role as provider of care to the un- or under-insured, how will they be compensated fairly?
• If the absence of physician group consolidation has the effect of limiting opportunities to improve the quality and efficiency of care, are there steps that could be taken by physician organizations, state policy officials, and/or private health plans and employers to encourage greater integration?
2006 New Jersey Health Care Almanac Purpose, Methodology, and Key Findings
26 © Avalere Heath LLC
• What role should any state-subsidized medical education initiatives play in re-dressing current or emerging imbalances of physician specialties within the state?
• What role should the state play in addressing the rate of increase in professional liability (malpractice) insurance premiums for physicians, particularly specialist physicians whose ability to practice in the state is affected by the level and rate of increase of those premiums?
• What role, if any, should the state play, in partnership with the federal government, payers, employers, providers, and state institutions of higher education, to build or promote a robust health information technology (HIT) infrastructure that would improve care coordination and integration within New Jersey’s organizationally fragmented health care delivery system? Or should support for the development of HIT infrastructure be left to the private sector?
Areas for further inquiry: • How much or little does the relatively decentralized organization of physician
practices in New Jersey contribute to the apparently relatively low performance of the state’s health care system in meeting several clinical benchmarks for quality health care?
• What are the critical success factors for the development of more highly integrated physician organizations in other states?
• What factors may underlie or explain the very large increase from 2001 to 2005 in the number of physicians licensed in New Jersey as hematologists/oncologists?
• What are the state’s options to use the new Medicaid waiver authorities created by the recently-enacted federal Deficit Reduction Act to increase access to primary care and specialty physician services for low-income uninsured residents and Medicaid recipients?
• What were the critical success factors in the recent Medicaid and uninsured reform effort in Massachusetts, and are those factors replicable for New Jersey?
• What were the critical success factors in the Medicaid demonstration waiver awarded by the federal government to New York in October 2006, and are those factors replicable for New Jersey?
Purpose, Methods, and Key Findings 2006 New Jersey Health Care Almanac
© Avalere Health LLC 27
Federally Qualified Health Centers (FQHCs) and Other Community Health Centers (CHCs) In some regions of New Jersey, Federally Qualified Health Centers (FQHCs) and other types of Community Health Centers (CHCs) play a significant role in delivering primary care services to uninsured and under-insured populations.13 In some of the state’s most urban areas, particularly in Newark and Camden, the development of CHCs has lagged behind the primary care needs of the local population, which in turn puts more pressure on the emergency departments of the large “safety net” hospitals in those communities.
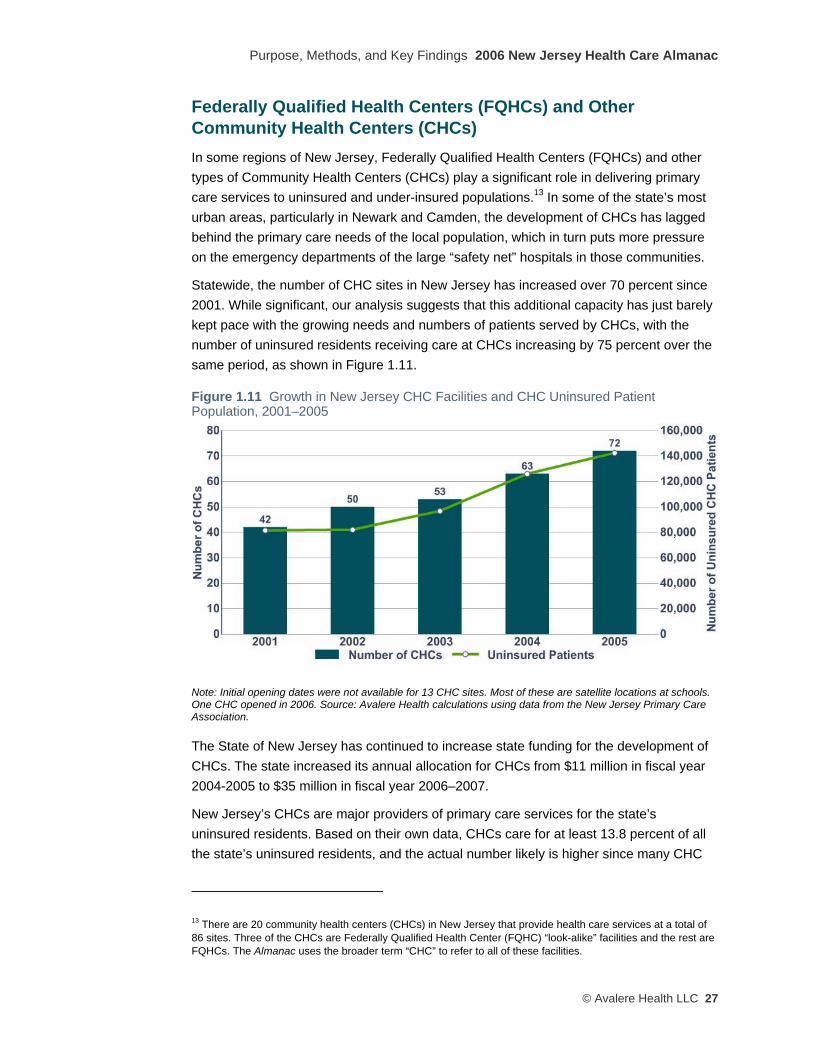
Statewide, the number of CHC sites in New Jersey has increased over 70 percent since 2001. While significant, our analysis suggests that this additional capacity has just barely kept pace with the growing needs and numbers of patients served by CHCs, with the number of uninsured residents receiving care at CHCs increasing by 75 percent over the same period, as shown in Figure 1.11.
Figure 1.11 Growth in New Jersey CHC Facilities and CHC Uninsured Patient Population, 2001–2005
Note: Initial opening dates were not available for 13 CHC sites. Most of these are satellite locations at schools. One CHC opened in 2006. Source: Avalere Health calculations using data from the New Jersey Primary Care Association.
The State of New Jersey has continued to increase state funding for the development of CHCs. The state increased its annual allocation for CHCs from $11 million in fiscal year 2004-2005 to $35 million in fiscal year 2006–2007.
New Jersey’s CHCs are major providers of primary care services for the state’s uninsured residents. Based on their own data, CHCs care for at least 13.8 percent of all the state’s uninsured residents, and the actual number likely is higher since many CHC
13 There are 20 community health centers (CHCs) in New Jersey that provide health care services at a total of 86 sites. Three of the CHCs are Federally Qualified Health Center (FQHC) “look-alike” facilities and the rest are FQHCs. The Almanac uses the broader term “CHC” to refer to all of these facilities.
2006 New Jersey Health Care Almanac Purpose, Methodology, and Key Findings
28 © Avalere Heath LLC
patients may not disclose their insurance status. The most common services delivered at CHCs include: dental exams, hypertension management, general medical exams, well baby/child visits, and normal pregnancy check-ups. Over 85 percent of all CHC patients are uninsured individuals or Medicaid beneficiaries. These patients are disproportionately Hispanic (51 percent) and African American (30 percent). They also tend to be young (58 percent under 30 years old) and female (62 percent).
Several stakeholder interviews indicated that the state’s primary care delivery system for the uninsured still has an excess of unmet demand compared to supply, partly due to an unevenly distributed infrastructure, especially for low-income patients. A large part of the concern expressed about access to primary care services at CHCs was that access varies dramatically depending on where a person lives, and that there appears to be no policy to rationalize access to primary care across the state.
Several stakeholders also reported significant access problems for specialist services for low-income Medicaid beneficiaries and uninsured individuals. Data on the number of specialist visits per 1,000 patients varies widely between health centers. Eight of the CHCs in the state (for which data were available) are successfully coordinating with specialist physicians and/or hospitals to provide specialty care to their patients. Other CHCs are not providing any specialty care.
Interaction of FQHCs and Hospital Emergency Departments in Providing Access to Primary Care Services Our analysis of the wide variations across regions in the use of hospital emergency department (ED) services (shown in Figure 1.12) suggests support for anecdotal stakeholder views that ED utilization is higher at hospitals where FQHC access is more limited, for example in Newark, Trenton, and southern New Jersey. If borne out by further focused research, this connection would likely have two underlying causes: patients without access to primary care from a FQHC or a primary care physician must seek it at their local hospital’s ED, with its corresponding negative impacts on the hospital’s ED from increased patient wait times, overcrowding, and diminished “surge capacity” to handle mass emergencies; and the patients who seek care at a hospital ED tend to be sicker because they have not been under the care of a primary care provider. In addition, inappropriate use of hospitals’ EDs imposes strains on hospitals’ finances.
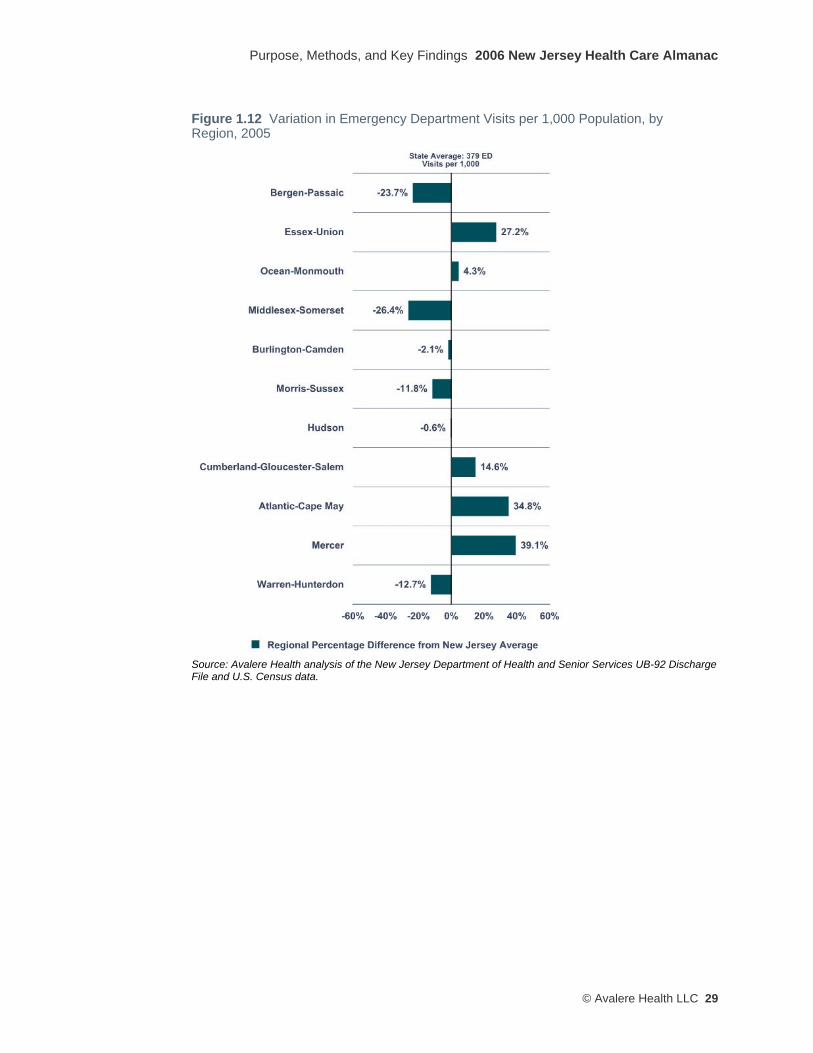
Purpose, Methods, and Key Findings 2006 New Jersey Health Care Almanac
© Avalere Health LLC 29
Figure 1.12 Variation in Emergency Department Visits per 1,000 Population, by Region, 2005
Source: Avalere Health analysis of the New Jersey Department of Health and Senior Services UB-92 Discharge File and U.S. Census data.

2006 New Jersey Health Care Almanac Purpose, Methodology, and Key Findings
30 © Avalere Heath LLC
Questions that policy makers may wish to consider in assessing the role and future of community health centers: • Are additional CHCs required to handle the needs of the state’s low-
income/uninsured residents, and if so, what role if any should the state government play in fostering their growth and assuring their sustainability?
• What role do hospital emergency departments (EDs) play in providing primary care to the state’s low-income and/or uninsured residents? What role should they play? How would the closure of a given hospital ED affect nearby residents’ access to primary care services?
Areas for further inquiry: • What types of access problems for specialist services do low-income Medicaid
beneficiaries and uninsured individuals in New Jersey actually experience? Are specialty access problems concentrated geographically or in different types of specialty physician services?
• How do the arrangements that some CHCs are using to successfully coordinate with specialist physicians and/or hospitals to provide specialty care to their patients work? Are those arrangements replicable to other CHCs in the state?
Ambulatory Surgery Centers New Jersey is no exception to the national trend of surgical and imaging procedures migrating toward outpatient settings, particularly to freestanding ambulatory surgery centers (ASCs). The number of Medicare-certified ASCs in the United States grew by 34 percent from 2001 to 2005,14 and New Jersey appears to have been one of the states contributing most to this nationwide increase. Between January 2002 and June 2003, New Jersey was among the top five states with the greatest net growth in the number of ASCs.15 As shown in Figure 1.13, the rapid increase in the number of ASCs licensed by the State of New Jersey began between 1997 and 2001, and has accelerated since 2002.
14Source: Medicare Payment Advisory Commission, A Data Book: Healthcare spending and the Medicare program, June 2006. 15The four other states were California, Florida, Georgia and Texas. Source: Medicare Payment Advisory Commission, Report to the Congress: Medicare Payment Policy, March 2004.
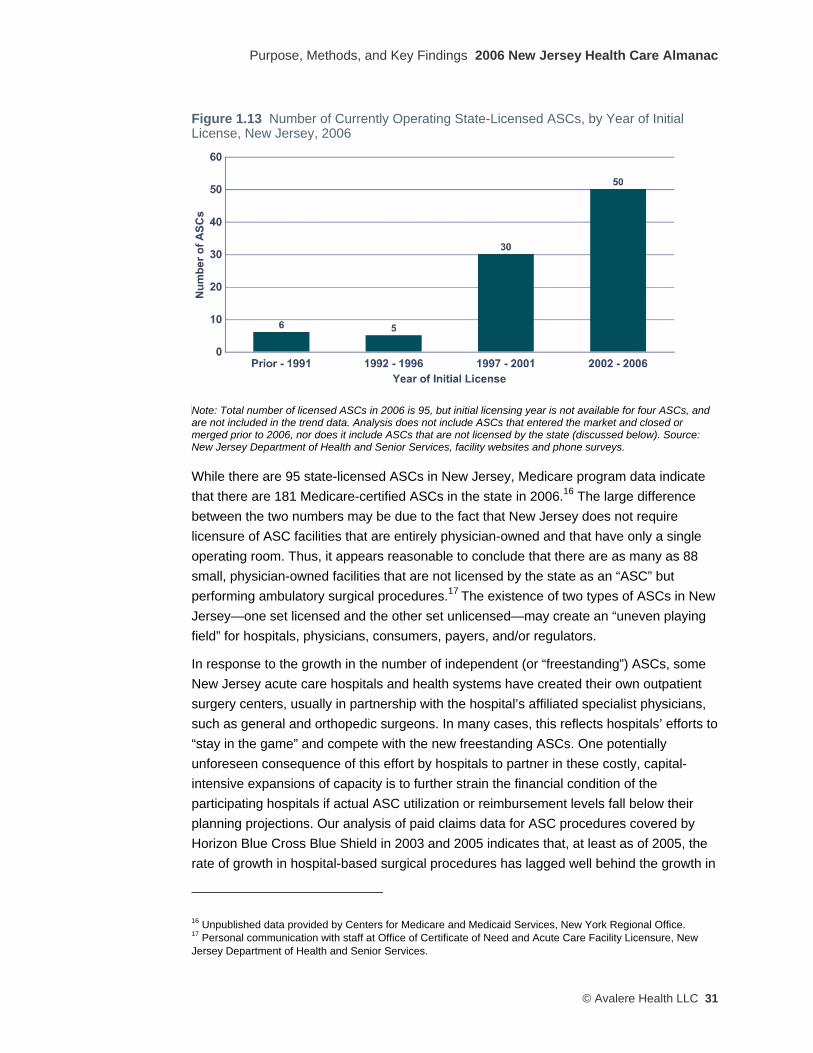
Purpose, Methods, and Key Findings 2006 New Jersey Health Care Almanac
© Avalere Health LLC 31
Figure 1.13 Number of Currently Operating State-Licensed ASCs, by Year of Initial License, New Jersey, 2006
Note: Total number of licensed ASCs in 2006 is 95, but initial licensing year is not available for four ASCs, and are not included in the trend data. Analysis does not include ASCs that entered the market and closed or merged prior to 2006, nor does it include ASCs that are not licensed by the state (discussed below). Source: New Jersey Department of Health and Senior Services, facility websites and phone surveys.
While there are 95 state-licensed ASCs in New Jersey, Medicare program data indicate that there are 181 Medicare-certified ASCs in the state in 2006.16 The large difference between the two numbers may be due to the fact that New Jersey does not require licensure of ASC facilities that are entirely physician-owned and that have only a single operating room. Thus, it appears reasonable to conclude that there are as many as 88 small, physician-owned facilities that are not licensed by the state as an “ASC” but performing ambulatory surgical procedures.17 The existence of two types of ASCs in New Jersey—one set licensed and the other set unlicensed—may create an “uneven playing field” for hospitals, physicians, consumers, payers, and/or regulators.
In response to the growth in the number of independent (or “freestanding”) ASCs, some New Jersey acute care hospitals and health systems have created their own outpatient surgery centers, usually in partnership with the hospital’s affiliated specialist physicians, such as general and orthopedic surgeons. In many cases, this reflects hospitals’ efforts to “stay in the game” and compete with the new freestanding ASCs. One potentially unforeseen consequence of this effort by hospitals to partner in these costly, capital-intensive expansions of capacity is to further strain the financial condition of the participating hospitals if actual ASC utilization or reimbursement levels fall below their planning projections. Our analysis of paid claims data for ASC procedures covered by Horizon Blue Cross Blue Shield in 2003 and 2005 indicates that, at least as of 2005, the rate of growth in hospital-based surgical procedures has lagged well behind the growth in
16 Unpublished data provided by Centers for Medicare and Medicaid Services, New York Regional Office. 17 Personal communication with staff at Office of Certificate of Need and Acute Care Facility Licensure, New Jersey Department of Health and Senior Services.
2006 New Jersey Health Care Almanac Purpose, Methodology, and Key Findings
32 © Avalere Heath LLC
the volume of those procedures performed in freestanding ASCs—suggesting a net drain on hospitals’ potential volume as a result of ASC proliferation.
Often wholly or partly physician-owned, the potentially conflicting financial incentives that drive this “out-migration” toward ASCs are attracting increasing attention from federal and state health policymakers. Some believe this out-migration is driven by the opportunity to be paid “hospital prices” in a non-hospital-setting. Other argue that regardless of the underlying financial considerations, some procedures are best delivered in the ASC, given medical and technological advances, and since patients often prefer the more convenient scheduling and locations of many ASCs.
Participants in the stakeholder interviews also emphasized that the rapid growth in ASCs in New Jersey over the past ten years has played a significant role in shaping New Jersey’s health care system. This seems to have occurred partly through weakening some inpatient hospitals’ finances by diverting commercially-insured patients to ASCs, a trend that may disproportionately affect those hospitals that have not expanded their own outpatient surgery alternatives. ASCs also have affected the overall health care system by creating new access to care problems in some low-income communities, as certain types of specialists have elected to grow their patient caseloads through ASCs instead of inpatient and outpatient hospital resources.
Questions that New Jersey policy makers may wish to consider in examining the role and future of ambulatory surgery centers in the state: • Are there appropriate safeguards with respect to ASCs’ quality of care, certification of
technology, and the medical expertise of the staff?
• Should the state play a role in reviewing, approving, licensing, and/or accrediting the growing number of ambulatory surgery and medical services that are moving from the inpatient setting to the outpatient/freestanding settings?
Diagnostic Imaging Centers As shown in Figure 1.14, the number of freestanding centers that perform diagnostic imaging services in New Jersey more than doubled between 2001 and 2005, even after adjusting for the state’s population growth during that time. In some regions, such as Mercer County, the growth has been even more dramatic, with an almost four-fold increase over the 2001–2005 period.

Purpose, Methods, and Key Findings 2006 New Jersey Health Care Almanac
© Avalere Health LLC 33
Figure 1.14 Total Percent Change in Diagnostic Imaging Facilities per 100,000 Population, by Region, New Jersey, 2001–2005
Source: New Jersey Department of Health and Senior Services, Licensing Data, 2006.
New Jersey is not unique in this experience. Across the United States, radiologists, oncologists, cardiologists, and orthopedic surgeons, financed in some cases by private investors and equipment manufacturers, have built and opened freestanding (i.e., located outside a traditional inpatient hospital) diagnostic imaging facilities at a steady rate, and the imaging technology used in these facilities has become increasingly sophisticated, more costly, and, importantly, less bulky (thus allowing their deployment in the physician office setting).
A growing body of empirical research demonstrates that physicians that own their own imaging modalities prescribe and perform significantly greater numbers of images than their non-owning counterparts.18 As such, many payers, including Medicare, are exploring mechanisms to limit the self-referral potential of imaging services.
With federal policymakers examining the costs and benefits to Medicare of this increase in the availability of high-cost imaging services, some New Jersey stakeholders are also concerned about the cost implication of this unchecked diffusion of new and expensive imaging technologies.
18 Levin, DC and Nao, VM, “The Over-Utilization of Imaging Resulting from Self-Referral,” Journal of the American College of Radiology (2004), 1:169-172.
2006 New Jersey Health Care Almanac Purpose, Methodology, and Key Findings
34 © Avalere Heath LLC
Questions that New Jersey policy makers may wish to consider in reviewing the growth of diagnostic imaging centers in the state: • Should the state play a role in reviewing, approving, licensing, and/or accrediting the
growing number of diagnostic imaging services that are moving from the inpatient setting to the outpatient/freestanding settings?
• Should the state take any action to address the cost and quality implications of the utilization differences between physician-owned and hospital-owned imaging centers?
• Are there appropriate safeguards with respect to imaging centers’ quality of care, certification of technology, and the medical expertise of the staff?
Long-Term Care The supply of nursing facilities and beds in New Jersey has remained largely unchanged since 2001. Compared to Connecticut and the U.S. overall, New Jersey has more independent and fewer chain-affiliated nursing facilities. Almost two-thirds of the patients in New Jersey nursing facilities are Medicaid beneficiaries, though that percentage has declined slightly over the last five years.
According to informed stakeholder interviews, the LTC industry has concentrated on building mostly private-pay assisted living facilities over the past five years, primarily because these tend to be more profitable. While New Jersey’s Medicaid program has allowed payments to assisted living facilities for a number of years, patient reliance on these facilities reportedly has been limited because of restrictions (required by federal Medicaid policy) on the types of patients who would meet the clinical criteria for care in an assisted living setting.
Stakeholders also indicated that New Jersey nursing facilities are slowly starting to decrease their Medicaid (low-income) patient caseloads and increase their Medicare (elderly) patient caseloads. This observation is borne out by state-level payer-mix data published by the American Health Care Association (one of two national nursing home industry trade associations), which shows the percentage of patients in New Jersey nursing homes with Medicare coverage increasing from about 11 percent in 2001 to about 16 percent in 2005. This patient-mix change likely is occurring in response to reimbursement changes in Medicare (higher payments for higher-acuity patients) and in New Jersey’s Medicaid program (stagnant payment rates over the past five years, largely due to state budget constraints).
Nationally, the trends in long-term care for the elderly favor increased use of home- and community-based services, and to limit use of institutionally-based care to the frailest and the sickest. New Jersey appears not to be part of this national trend.
Stakeholders with LTC expertise expressed the view that New Jersey lags behind other states of similar size and complexity in its availability of Medicaid-funded home health
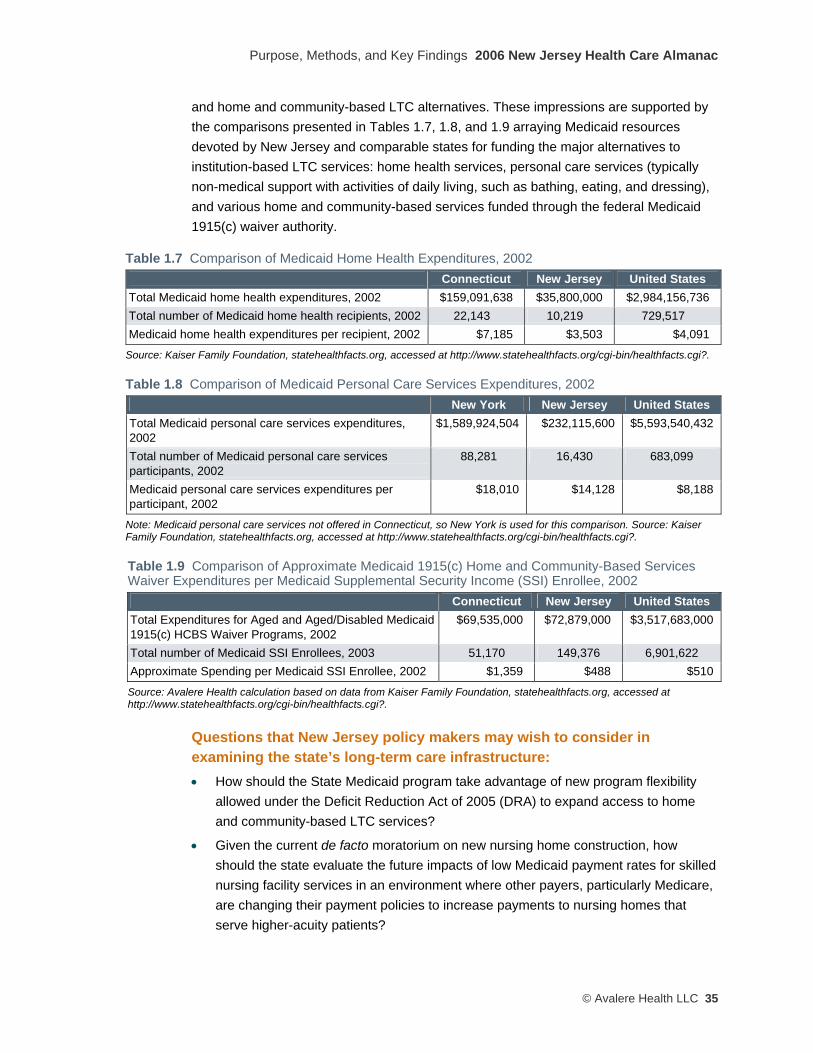
Purpose, Methods, and Key Findings 2006 New Jersey Health Care Almanac
© Avalere Health LLC 35
and home and community-based LTC alternatives. These impressions are supported by the comparisons presented in Tables 1.7, 1.8, and 1.9 arraying Medicaid resources devoted by New Jersey and comparable states for funding the major alternatives to institution-based LTC services: home health services, personal care services (typically non-medical support with activities of daily living, such as bathing, eating, and dressing), and various home and community-based services funded through the federal Medicaid 1915(c) waiver authority.
Table 1.7 Comparison of Medicaid Home Health Expenditures, 2002 Connecticut New Jersey United States
Total Medicaid home health expenditures, 2002 $159,091,638 $35,800,000 $2,984,156,736 Total number of Medicaid home health recipients, 2002 22,143 10,219 729,517 Medicaid home health expenditures per recipient, 2002 $7,185 $3,503 $4,091
Source: Kaiser Family Foundation, statehealthfacts.org, accessed at http://www.statehealthfacts.org/cgi-bin/healthfacts.cgi?.
Table 1.8 Comparison of Medicaid Personal Care Services Expenditures, 2002 New York New Jersey United States
Total Medicaid personal care services expenditures, 2002
$1,589,924,504 $232,115,600 $5,593,540,432
Total number of Medicaid personal care services participants, 2002
88,281 16,430 683,099
Medicaid personal care services expenditures per participant, 2002
$18,010 $14,128 $8,188
Note: Medicaid personal care services not offered in Connecticut, so New York is used for this comparison. Source: Kaiser Family Foundation, statehealthfacts.org, accessed at http://www.statehealthfacts.org/cgi-bin/healthfacts.cgi?.
Table 1.9 Comparison of Approximate Medicaid 1915(c) Home and Community-Based Services Waiver Expenditures per Medicaid Supplemental Security Income (SSI) Enrollee, 2002
Connecticut New Jersey United States Total Expenditures for Aged and Aged/Disabled Medicaid 1915(c) HCBS Waiver Programs, 2002
$69,535,000 $72,879,000 $3,517,683,000
Total number of Medicaid SSI Enrollees, 2003 51,170 149,376 6,901,622 Approximate Spending per Medicaid SSI Enrollee, 2002 $1,359 $488 $510
Source: Avalere Health calculation based on data from Kaiser Family Foundation, statehealthfacts.org, accessed at http://www.statehealthfacts.org/cgi-bin/healthfacts.cgi?.
Questions that New Jersey policy makers may wish to consider in examining the state’s long-term care infrastructure: • How should the State Medicaid program take advantage of new program flexibility
allowed under the Deficit Reduction Act of 2005 (DRA) to expand access to home and community-based LTC services?
• Given the current de facto moratorium on new nursing home construction, how should the state evaluate the future impacts of low Medicaid payment rates for skilled nursing facility services in an environment where other payers, particularly Medicare, are changing their payment policies to increase payments to nursing homes that serve higher-acuity patients?

2006 New Jersey Health Care Almanac Purpose, Methodology, and Key Findings
36 © Avalere Heath LLC
• How should the state evaluate and plan to deploy a continuum of public and private LTC services against the unavoidable prospect of an aging and more culturally/linguistically diverse LTC patient population in New Jersey?
Structure of the State’s Health Care Regulation and Oversight Agencies Several stakeholders remarked that the state government’s structure for regulating and overseeing the health care system is as fragmented, unorganized, and diffuse as the system over which it watches. Accountability for government oversight of the health care system appears dispersed and weak. There are at least five major state agencies19 that oversee different aspects of the state’s health care system, in addition the federal Centers for Medicare and Medicaid Services (CMS), which administers Medicare, Medicaid, the State Children’s Health Insurance Program (SCHIP), and myriad county and municipal health departments and local elected officials that may exert influence over aspects of the health care system (when the closure of a general acute care hospital in a particular community is being considered, for example).
In particular, several stakeholders conveyed their sense that there exists no single authority or agency with the authority and responsibility to create the conditions for systemic reform, or even to bring stakeholders together in a forum where constructive, solution-oriented views can be exchanged and, ultimately, enforceable decisions about systemic reforms can be made.
Other stakeholders remarked upon the relative strength of local communities in shaping health care capacity decisions, especially those related to potential hospital consolidations and closures. This “Not In My Back Yard” (NIMBY) phenomenon is not unique to New Jersey, but it seems particularly acute in the Garden State due to a combination of historical factors including strong municipal support for local hospital institutions (especially in northern New Jersey) and the state’s long tradition of local “home rule,” which hampers regional planning and coordination of health care service supply.
Questions that New Jersey policy makers may wish to consider in reviewing the state’s health care oversight structure: • Should the state consider stronger alignment of the multiple agencies and authorities
that are collectively responsible for funding and/or overseeing the health care delivery system?
19 The five principal state agencies are the Department of Health and Senior Services (containing multiple sub-department components); the Department of Human Services (containing multiple sub-department components); the New Jersey Department of Banking and Insurance; the New Jersey Office of the Attorney General/Division of Consumer Affairs; and the New Jersey Health Care Facilities Financing Authority.

Purpose, Methods, and Key Findings 2006 New Jersey Health Care Almanac
© Avalere Health LLC 37
• To what degree should authority over and responsibility for improving all New Jersey residents’ access to care, monitoring and improving the quality of that care, and managing the costs of that care be centralized? To what extent should the private market make these decisions?
• What is the most effective mechanism through which the state should engage in improving access to care, monitoring and improving quality, and managing health care costs?
State Demographic and Economic Trends Informed consideration of changes to New Jersey’s health care system must take into account the projected demographic and economic trends expected to transform New Jersey over the next 25 years.
Demographically, New Jersey’s population is projected to undergo dramatic changes in the next two decades, becoming increasingly older and even more racially and ethnically diverse than it is today. By 2030, 20 percent of New Jersey’s population be older than age 65, compared to about 13 percent today, as shown in Table 1.10.
Table 1.10 Projected Population of New Jersey by Age Group, 2000 and 2030 Age Group 2000 % of Total 2030 % of Total 0–19 2,284,107 27.1% 2,387,502 24.3% 20–44 3,104,225 36.9% 3,085,201 31.5% 45–64 1,912,882 22.7% 2,370,192 24.2% 65–84 977,137 11.6% 1,668,634 17.0% 85+ 135,999 1.6% 290,911 3.0% All 8,414,350 100.0% 9,802,440 100.0% Median Age 36.7 40.8
Source: U.S. Census Bureau, Population Division, Interim State Population Projections, 2005.
The racial and ethnic diversity of the state’s population also will increase; the U.S. Census Bureau estimates that White/Non-Hispanic residents will comprise about 55 percent of the state’s population in 2025 (the latest year for which projections are available), compared to 68 percent in 2000 (Table 1.11). This growth in the state population’s racial and ethnic diversity over the next 20 years will increasingly challenge the health care system to deliver medical care services in more culturally and linguistically competent ways.

2006 New Jersey Health Care Almanac Purpose, Methodology, and Key Findings
38 © Avalere Heath LLC
Table 1.11 Projected Composition of Population of New Jersey by Race and Hispanic Origin Group, 2000 and 2025 Race and Hispanic Origin Group 2000 2025
White, Non-Hispanic Population 68.0% 55.2% White, Hispanic Population 10.8% 16.1% Black, Non-Hispanic Population 13.5% 15.1% Black, Hispanic Population 1.7% 2.9% Asian and Pacific Islander Population 5.8% 10.4% American Indian, Eskimo, and Aleut Population 0.3% 0.3% Total 100.0% 100.0% Source: Avalere Health analysis of U.S. Census Bureau, Projected State Populations, by Sex, Race, and Hispanic Origin: 1995-2025, October 1996 (http://www.census.gov/population/projections/state/stpjrace.txt).
Economically, the state Department of Labor and Workforce Development expects that New Jersey’s economy will continue to add jobs over the next decade, but will experience employment growth that is slower than the national average. Three industry sectors are forecast to account for nearly 70 percent of the state’s employment growth from 2004 through 2014: Health and Social Assistance, Professional and Business Services, and Leisure and Hospitality. Sixty-six percent of new jobs will emerge either in the Professional and Related Occupations sector or in the Services Occupations sector.20 Production Occupations is the only group projected to lose jobs over the next ten years, due to continued projected losses in the manufacturing sector of the state’s economy.21
Overall, most of the state’s job openings will occur in occupations that tend to have lower training and education requirements, which may mean that job growth will occur disproportionately in relatively low-wage positions that increasingly tend not to offer traditional employer-based health insurance benefits. Reductions in access to health insurance coverage undoubtedly will affect the economics of the health care system.
The balance of this Almanac provides a more detailed examination of the trends and findings discussed above. Following a chapter assessing a region-to-region variations at the state level, subsequent chapters will explore variations within each of the eleven regions of the state.
20 Occupations in the Professional and Related Occupations category include registered nurses, accountants, engineers, and elementary and secondary school teachers. Service Occupations include home health aides, medical assistants, food preparation workers, and security guards. 21 Source: New Jersey Department of Labor and Workforce Development, Projections 2014: New Jersey Employment and Population in the 21st Century, September 2006.

C h a p t e r 2
sTATe oF NeW JeRseY
New Jersey state House, Trenton, Mercer County


State of New Jersey 2006 New Jersey Health Care Almanac
© Avalere Health LLC 41
KEY FINDINGS
• New Jersey hospitals have more beds per thousand residents than the average for Connecticut, a state with similar social and demographic characteristics.
• New Jersey’s doctors admit more patients to the hospital than both the national average and the Connecticut average.
• The state’s hospitals vary significantly in their provision of “safety net” care (referred to as “charity care” in New Jersey) to the state’s low-income and uninsured residents, including both documented and undocumented residents.
• The state-based subsidies paid annually to hospitals to reimburse them for the care of “safety net” patients do not appear to be correlated to the varying volumes or proportions of this “safety net” care.
• The growth in Federally-Qualified Health Centers delivering care to the uninsured, among others, has barely kept pace with the increase demand for services from these patients.
• Many of the state’s hospitals have had operating margins below two percent over the last four years for which data are available (2001–2004), with some experiencing negative operating margins during this time.
• New Jersey physicians tend to provide significantly more services per capita than physicians in other states, when examined through the lens of the Medicare population.
• The number of licensed physicians practicing certain specialties in New Jersey has declined in the past five years, particularly in obstetrics/gynecology, general surgery, and neurosurgery.
• The number of ambulatory surgery centers and freestanding imaging centers in the state has increased dramatically over the last 15 years.
• The state is projected to have a 25 percent nursing shortage by 2010, and similar shortfalls are expected in various allied health professions. Anecdotal evidence from interviewees also suggests that shortages already exist for certain kinds of allied health professionals, such as radiology technicians and other clinical support staff.
• The state’s long-term care infrastructure for low-income and Medicaid recipients has not changed significantly for the past five years.
• New Jersey’s population will become older and more culturally diverse over the next 10 to 20 years.
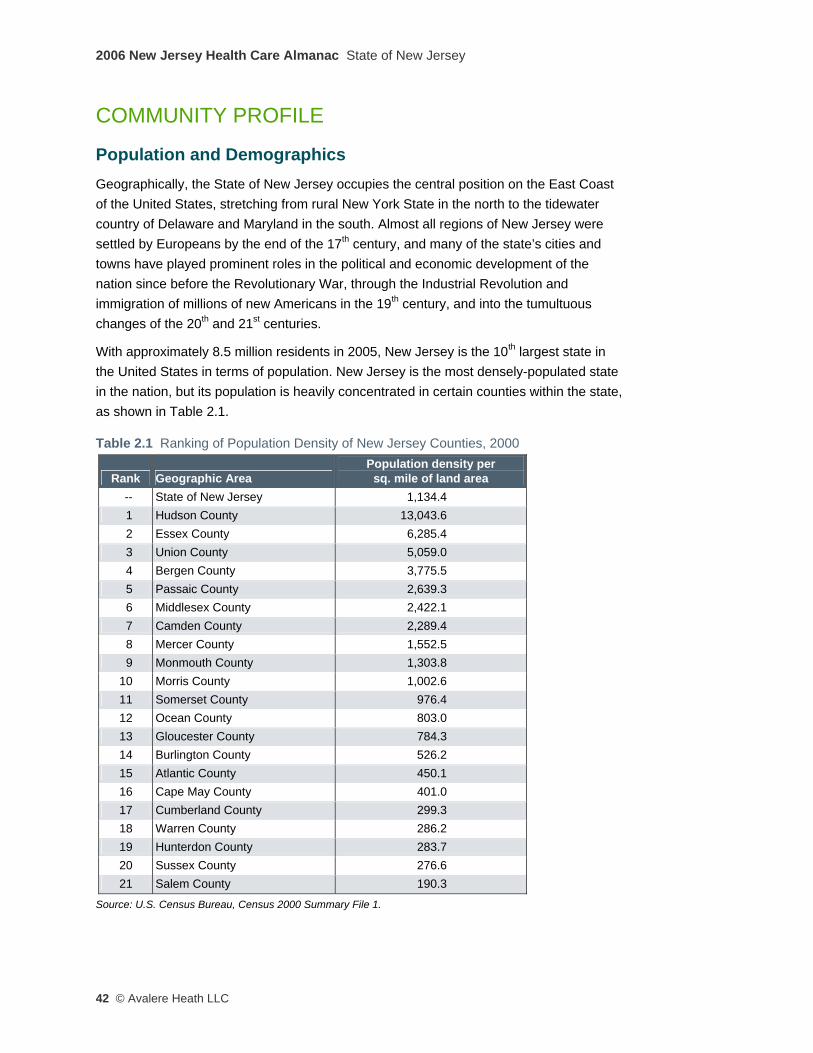
2006 New Jersey Health Care Almanac State of New Jersey
42 © Avalere Heath LLC
COMMUNITY PROFILE
Population and Demographics Geographically, the State of New Jersey occupies the central position on the East Coast of the United States, stretching from rural New York State in the north to the tidewater country of Delaware and Maryland in the south. Almost all regions of New Jersey were settled by Europeans by the end of the 17th century, and many of the state’s cities and towns have played prominent roles in the political and economic development of the nation since before the Revolutionary War, through the Industrial Revolution and immigration of millions of new Americans in the 19th century, and into the tumultuous changes of the 20th and 21st centuries.
With approximately 8.5 million residents in 2005, New Jersey is the 10th largest state in the United States in terms of population. New Jersey is the most densely-populated state in the nation, but its population is heavily concentrated in certain counties within the state, as shown in Table 2.1.
Table 2.1 Ranking of Population Density of New Jersey Counties, 2000
Rank Geographic Area Population density per
sq. mile of land area -- State of New Jersey 1,134.4 1 Hudson County 13,043.6 2 Essex County 6,285.4 3 Union County 5,059.0 4 Bergen County 3,775.5 5 Passaic County 2,639.3 6 Middlesex County 2,422.1 7 Camden County 2,289.4 8 Mercer County 1,552.5 9 Monmouth County 1,303.8
10 Morris County 1,002.6 11 Somerset County 976.4 12 Ocean County 803.0 13 Gloucester County 784.3 14 Burlington County 526.2 15 Atlantic County 450.1 16 Cape May County 401.0 17 Cumberland County 299.3 18 Warren County 286.2 19 Hunterdon County 283.7 20 Sussex County 276.6 21 Salem County 190.3
Source: U.S. Census Bureau, Census 2000 Summary File 1.
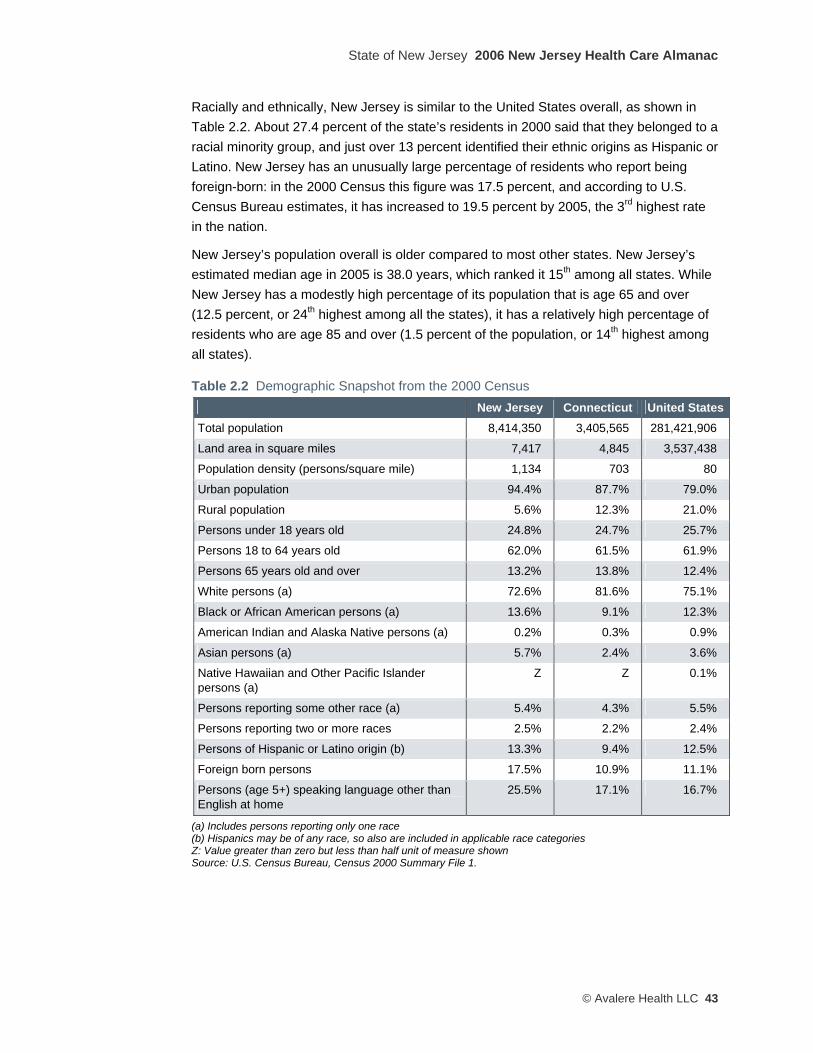
State of New Jersey 2006 New Jersey Health Care Almanac
© Avalere Health LLC 43
Racially and ethnically, New Jersey is similar to the United States overall, as shown in Table 2.2. About 27.4 percent of the state’s residents in 2000 said that they belonged to a racial minority group, and just over 13 percent identified their ethnic origins as Hispanic or Latino. New Jersey has an unusually large percentage of residents who report being foreign-born: in the 2000 Census this figure was 17.5 percent, and according to U.S. Census Bureau estimates, it has increased to 19.5 percent by 2005, the 3rd highest rate in the nation.
New Jersey’s population overall is older compared to most other states. New Jersey’s estimated median age in 2005 is 38.0 years, which ranked it 15th among all states. While New Jersey has a modestly high percentage of its population that is age 65 and over (12.5 percent, or 24th highest among all the states), it has a relatively high percentage of residents who are age 85 and over (1.5 percent of the population, or 14th highest among all states).
Table 2.2 Demographic Snapshot from the 2000 Census New Jersey Connecticut United States
Total population 8,414,350 3,405,565 281,421,906
Land area in square miles 7,417 4,845 3,537,438
Population density (persons/square mile) 1,134 703 80
Urban population 94.4% 87.7% 79.0%
Rural population 5.6% 12.3% 21.0%
Persons under 18 years old 24.8% 24.7% 25.7%
Persons 18 to 64 years old 62.0% 61.5% 61.9%
Persons 65 years old and over 13.2% 13.8% 12.4%
White persons (a) 72.6% 81.6% 75.1%
Black or African American persons (a) 13.6% 9.1% 12.3%
American Indian and Alaska Native persons (a) 0.2% 0.3% 0.9%
Asian persons (a) 5.7% 2.4% 3.6%
Native Hawaiian and Other Pacific Islander persons (a)
Z Z 0.1%
Persons reporting some other race (a) 5.4% 4.3% 5.5%
Persons reporting two or more races 2.5% 2.2% 2.4%
Persons of Hispanic or Latino origin (b) 13.3% 9.4% 12.5%
Foreign born persons 17.5% 10.9% 11.1%
Persons (age 5+) speaking language other than English at home
25.5% 17.1% 16.7%
(a) Includes persons reporting only one race (b) Hispanics may be of any race, so also are included in applicable race categories Z: Value greater than zero but less than half unit of measure shown Source: U.S. Census Bureau, Census 2000 Summary File 1.
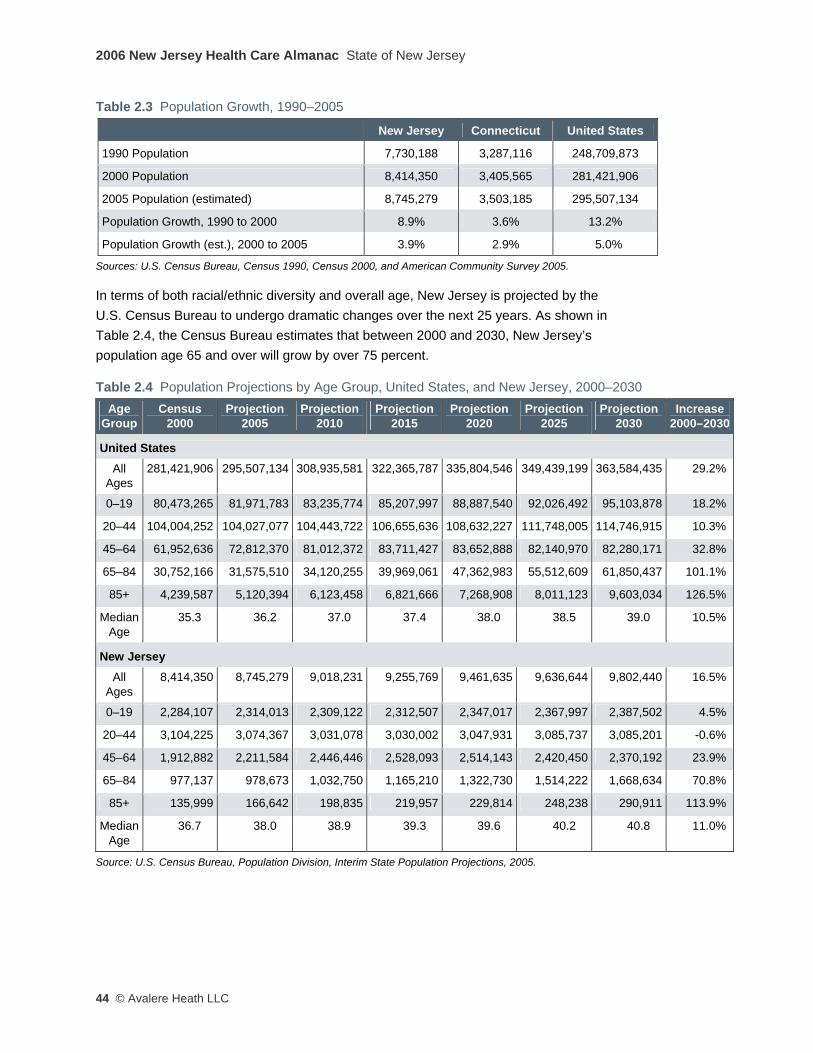
2006 New Jersey Health Care Almanac State of New Jersey
44 © Avalere Heath LLC
Table 2.3 Population Growth, 1990–2005
New Jersey Connecticut United States
1990 Population 7,730,188 3,287,116 248,709,873
2000 Population 8,414,350 3,405,565 281,421,906
2005 Population (estimated) 8,745,279 3,503,185 295,507,134
Population Growth, 1990 to 2000 8.9% 3.6% 13.2%
Population Growth (est.), 2000 to 2005 3.9% 2.9% 5.0%
Sources: U.S. Census Bureau, Census 1990, Census 2000, and American Community Survey 2005.
In terms of both racial/ethnic diversity and overall age, New Jersey is projected by the U.S. Census Bureau to undergo dramatic changes over the next 25 years. As shown in Table 2.4, the Census Bureau estimates that between 2000 and 2030, New Jersey’s population age 65 and over will grow by over 75 percent.
Table 2.4 Population Projections by Age Group, United States, and New Jersey, 2000–2030 Age
Group Census
2000 Projection
2005 Projection
2010 Projection
2015 Projection
2020 Projection
2025 Projection
2030 Increase
2000–2030
United States All
Ages 281,421,906 295,507,134 308,935,581 322,365,787 335,804,546 349,439,199 363,584,435 29.2%
0–19 80,473,265 81,971,783 83,235,774 85,207,997 88,887,540 92,026,492 95,103,878 18.2%
20–44 104,004,252 104,027,077 104,443,722 106,655,636 108,632,227 111,748,005 114,746,915 10.3%
45–64 61,952,636 72,812,370 81,012,372 83,711,427 83,652,888 82,140,970 82,280,171 32.8%
65–84 30,752,166 31,575,510 34,120,255 39,969,061 47,362,983 55,512,609 61,850,437 101.1%
85+ 4,239,587 5,120,394 6,123,458 6,821,666 7,268,908 8,011,123 9,603,034 126.5%
Median Age
35.3 36.2 37.0 37.4 38.0 38.5 39.0 10.5%
New Jersey All
Ages 8,414,350 8,745,279 9,018,231 9,255,769 9,461,635 9,636,644 9,802,440 16.5%
0–19 2,284,107 2,314,013 2,309,122 2,312,507 2,347,017 2,367,997 2,387,502 4.5%
20–44 3,104,225 3,074,367 3,031,078 3,030,002 3,047,931 3,085,737 3,085,201 -0.6%
45–64 1,912,882 2,211,584 2,446,446 2,528,093 2,514,143 2,420,450 2,370,192 23.9%
65–84 977,137 978,673 1,032,750 1,165,210 1,322,730 1,514,222 1,668,634 70.8%
85+ 135,999 166,642 198,835 219,957 229,814 248,238 290,911 113.9%
Median Age
36.7 38.0 38.9 39.3 39.6 40.2 40.8 11.0%
Source: U.S. Census Bureau, Population Division, Interim State Population Projections, 2005.

State of New Jersey 2006 New Jersey Health Care Almanac
© Avalere Health LLC 45
Not only will the average age of New Jersey residents be increasing, but the state’s population also will become increasingly racially and ethnically diverse over the next 20 years, presenting the health care system with a growing challenge to deliver medical care services in a culturally and linguistically competent manner.
Table 2.5 Projected Population of New Jersey by Race and Hispanic Origin, 1995–2025 Projected Populations
Year Total
White, Non-
Hispanic White,
Hispanic Black, Non-
Hispanic Black,
Hispanic
American Indian,
Eskimo, and Aleut
Asian and Pacific
Islander 1995 7,945,298 5,635,850 766,473 1,042,943 108,369 19,293 372,370
% of Total
100.0% 70.9% 9.6% 13.1% 1.4% 0.2% 4.7%
2000 8,177,791 5,557,637 884,490 1,104,522 135,783 20,596 474,763
% of Total
100.0% 68.0% 10.8% 13.5% 1.7% 0.3% 5.8%
2010 8,637,865 5,387,174 1,125,065 1,231,936 189,681 23,452 680,557
% of Total
100.0% 62.4% 13.0% 14.3% 2.2% 0.3% 7.9%
2015 8,924,494 5,338,023 1,255,546 1,302,962 218,251 25,068 784,644
% of Total
100.0% 59.8% 14.1% 14.6% 2.4% 0.3% 8.8%
2020 9,238,047 5,307,634 1,393,082 1,373,828 247,375 26,704 889,424
% of Total
100.0% 57.5% 15.1% 14.9% 2.7% 0.3% 9.6%
2025 9,558,495 5,278,631 1,536,234 1,444,044 276,644 28,306 994,636
% of Total
100.0% 55.2% 16.1% 15.1% 2.9% 0.3% 10.4%
Source: Avalere Health analysis of U.S. Census Bureau, Projected State Populations, by Sex, Race, and Hispanic Origin: 1995-2025, October 1996 (http://www.census.gov/population/projections/state/stpjrace.txt).
Socioeconomic Indicators Overall, New Jersey is a well-educated and high-income state. New Jersey has the highest median household income in all of the United States, more of its residents have high levels of educational achievement than the national average, and the state’s overall poverty rate is lower than the national average.
Of course, these statewide figures obscure important differences between regions and populations within the state, which this report discusses in detail in the accompanying regional chapters. But considered as a whole, the state has a high school graduation rate of over 86 percent and an undergraduate college completion rate of over 34 percent, both of which are higher than the corresponding national averages. Not surprisingly given the strong positive relationship between educational achievement and household income, New Jersey’s median household income in 2005 was over 33 percent higher than the

2006 New Jersey Health Care Almanac State of New Jersey
46 © Avalere Heath LLC
national median. Connecticut’s socioeconomic profile is quite similar to New Jersey’s, reinforcing the validity of using it as a comparison state when examining certain health care supply and utilization measures.
Table 2.6 Socioeconomic Indicators, New Jersey, Connecticut, and the United States
New Jersey Connecticut United States Persons age 25+ with high school diploma, 2005 86.3% 87.9% 84.2%
Persons age 25+ with bachelor's degree or higher, 2005 34.2% 34.9% 27.2%
Median household income, 2005 $61,672 $60,941 $46,242
Persons with incomes below federal poverty level, 2005 8.7% 8.3% 13.3%
Persons without health insurance, 2000 12.3% 10.3% 14.2%
Unemployment rate, 2005 6.3% 6.3% 6.9%
Sources: U.S. Census Bureau, 2005 American Community Survey and 2000 Small Area Health Insurance Estimates.

State of New Jersey 2006 New Jersey Health Care Almanac
© Avalere Health LLC 47
Major Occupations and Employment New Jersey’s major industries ranked by size of employment are listed in Table 2.7 (on the next page). Almost one-third of all the jobs in New Jersey are concentrated in two categories: Office and Administrative Support and Sales and Sales-related Occupations. The state also has sizeable Transportation, Food Preparation and Serving, and Production (i.e., manufacturing) sectors. In its entirety, the Health Care Services sector also is a relatively large employer within the state, including such occupations as Health Care Practitioners and Technical Occupations (such as physicians, registered nurses, and pharmacists), and Health Care Support Occupations (such as nursing aides and medical assistants), together comprising almost 8 percent of total employment.
Table 2.7 Major Occupational Categories by Employment Size, New Jersey ,2005
Major Occupational Category Total
Employment Percent of
Total All occupations 3,917,310 100.0%
Office and administrative support occupations 755,740 19.3%
Sales and related occupations 421,170 10.8%
Transportation and material moving occupations 319,170 8.1%
Food preparation and serving related occupations 259,230 6.6%
Production occupations 223,340 5.7%
Healthcare practitioners and technical occupations 197,410 5.0%
Business and financial operations occupations 193,530 4.9%
Management occupations 183,520 4.7%
Installation, maintenance, and repair occupations 144,980 3.7%
Construction and extraction occupations 142,910 3.6%
Building and grounds cleaning and maintenance occupations 132,980 3.4%
Computer and mathematical occupations 117,820 3.0%
Personal care and service occupations 114,370 2.9%
Protective service occupations 110,650 2.8%
Healthcare support occupations 104,740 2.7%
Architecture and engineering occupations 57,000 1.5%
Community and social services occupations 53660 1.4%
Arts, design, entertainment, sports, and media occupations 46,900 1.2%
Life, physical, and social science occupations 42,160 1.1%
Legal occupations 32,570 0.8%
Education, training, and library occupations ** **
Technical note: Estimates for detailed occupations do not sum to the totals because the totals include occupations not shown separately. Estimates do not include self-employed workers. **Estimates not released. Source: U.S. Bureau of Labor Statistics, Occupational Employment Statistics, May 2005 State Occupational Employment and Wage Estimates.
2006 New Jersey Health Care Almanac State of New Jersey
48 © Avalere Heath LLC
The state Department of Labor and Workforce Development expects that New Jersey’s economy will continue to add jobs over the next decade, but will experience employment growth that is slower than the national average. Three industry sectors are forecast to account for nearly 70 percent of the state’s employment growth from 2004 through 2014: Health and Social Assistance, Professional and Business Services, and Leisure and Hospitality. Sixty-six percent of new jobs will be in either Professional and Related Occupations or Services Occupations.1 Production Occupations is the only category projected to lose jobs over the next ten years, due to continued losses in the manufacturing sector of the state’s economy.2
Overall, many of the state’s new jobs are projected to occur in occupations that have relatively low training and education requirements. This may mean that job growth will occur in positions that often do not offer traditional employer-based health insurance benefits.
1 Occupations in the Professional and Related Occupations category include registered nurses, accountants, engineers, and elementary and secondary school teachers. Service Occupations include home health aides, medical assistants, food preparation workers, and security guards. 2 For details, see New Jersey Department of Labor and Workforce Development, Projections 2014: New Jersey Employment and Population in the 21st Century, September 2006.
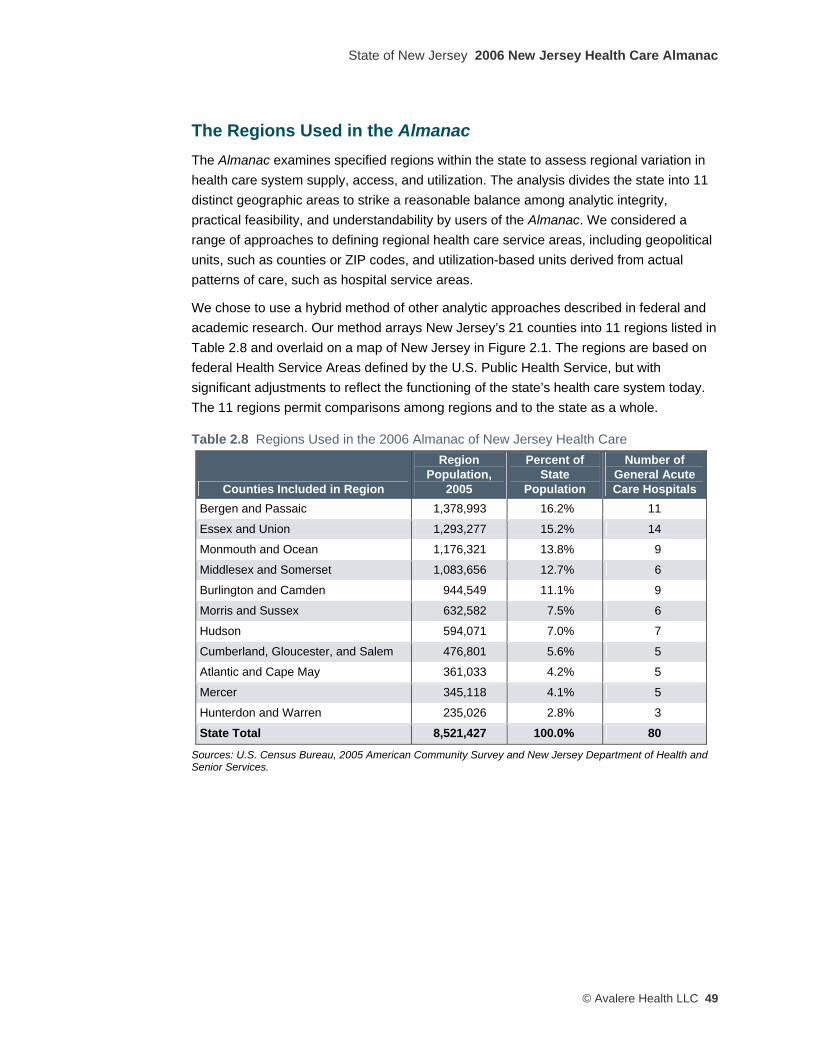
State of New Jersey 2006 New Jersey Health Care Almanac
© Avalere Health LLC 49
The Regions Used in the Almanac The Almanac examines specified regions within the state to assess regional variation in health care system supply, access, and utilization. The analysis divides the state into 11 distinct geographic areas to strike a reasonable balance among analytic integrity, practical feasibility, and understandability by users of the Almanac. We considered a range of approaches to defining regional health care service areas, including geopolitical units, such as counties or ZIP codes, and utilization-based units derived from actual patterns of care, such as hospital service areas.
We chose to use a hybrid method of other analytic approaches described in federal and academic research. Our method arrays New Jersey’s 21 counties into 11 regions listed in Table 2.8 and overlaid on a map of New Jersey in Figure 2.1. The regions are based on federal Health Service Areas defined by the U.S. Public Health Service, but with significant adjustments to reflect the functioning of the state’s health care system today. The 11 regions permit comparisons among regions and to the state as a whole.
Table 2.8 Regions Used in the 2006 Almanac of New Jersey Health Care
Counties Included in Region
Region Population,
2005
Percent of State
Population
Number of General Acute Care Hospitals
Bergen and Passaic 1,378,993 16.2% 11
Essex and Union 1,293,277 15.2% 14
Monmouth and Ocean 1,176,321 13.8% 9
Middlesex and Somerset 1,083,656 12.7% 6
Burlington and Camden 944,549 11.1% 9
Morris and Sussex 632,582 7.5% 6
Hudson 594,071 7.0% 7
Cumberland, Gloucester, and Salem 476,801 5.6% 5
Atlantic and Cape May 361,033 4.2% 5
Mercer 345,118 4.1% 5
Hunterdon and Warren 235,026 2.8% 3
State Total 8,521,427 100.0% 80
Sources: U.S. Census Bureau, 2005 American Community Survey and New Jersey Department of Health and Senior Services.
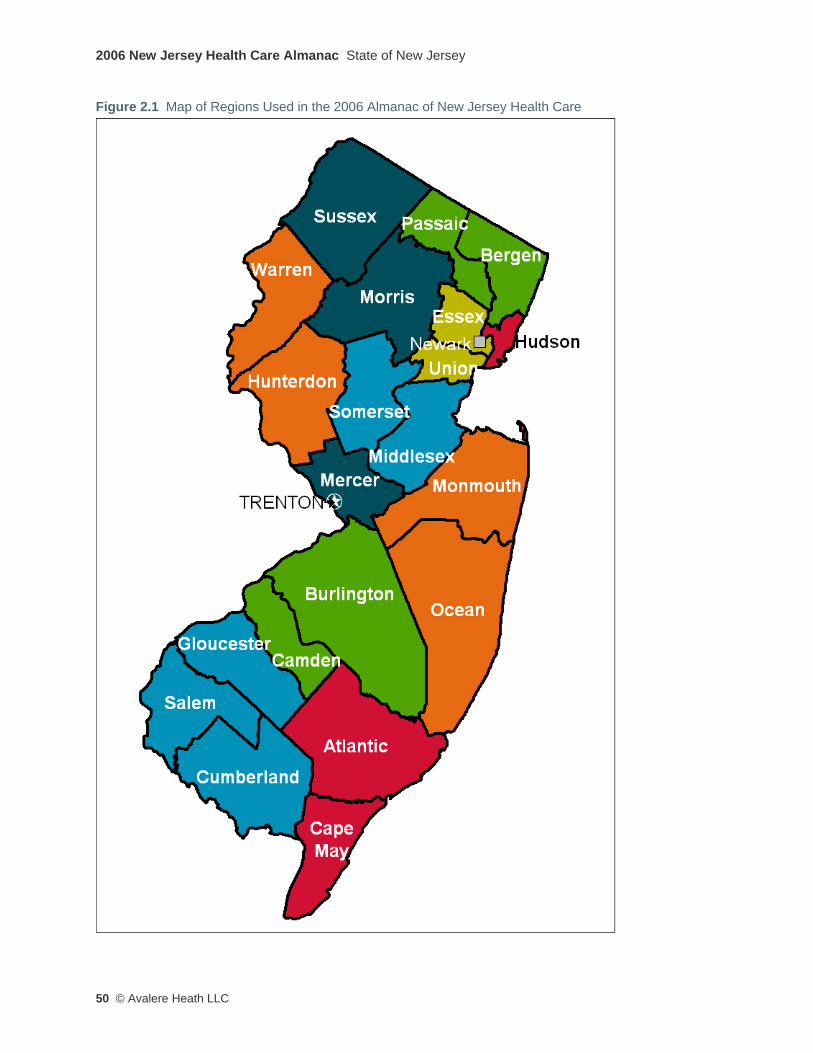
2006 New Jersey Health Care Almanac State of New Jersey
50 © Avalere Heath LLC
Figure 2.1 Map of Regions Used in the 2006 Almanac of New Jersey Health Care
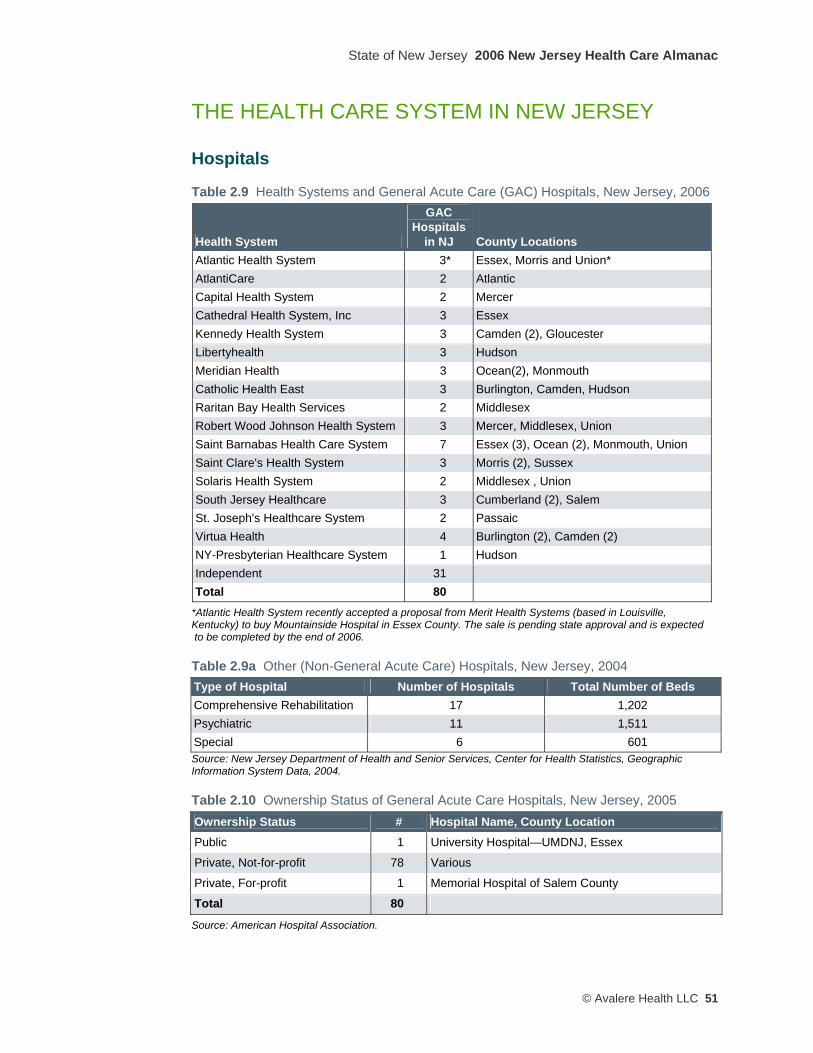
State of New Jersey 2006 New Jersey Health Care Almanac
© Avalere Health LLC 51
THE HEALTH CARE SYSTEM IN NEW JERSEY
Hospitals
Table 2.9 Health Systems and General Acute Care (GAC) Hospitals, New Jersey, 2006
Health System
GAC Hospitals
in NJ County Locations Atlantic Health System 3* Essex, Morris and Union* AtlantiCare 2 Atlantic Capital Health System 2 Mercer Cathedral Health System, Inc 3 Essex Kennedy Health System 3 Camden (2), Gloucester Libertyhealth 3 Hudson Meridian Health 3 Ocean(2), Monmouth Catholic Health East 3 Burlington, Camden, Hudson Raritan Bay Health Services 2 Middlesex Robert Wood Johnson Health System 3 Mercer, Middlesex, Union Saint Barnabas Health Care System 7 Essex (3), Ocean (2), Monmouth, Union Saint Clare's Health System 3 Morris (2), Sussex Solaris Health System 2 Middlesex , Union South Jersey Healthcare 3 Cumberland (2), Salem St. Joseph's Healthcare System 2 Passaic Virtua Health 4 Burlington (2), Camden (2) NY-Presbyterian Healthcare System 1 Hudson Independent 31 Total 80
*Atlantic Health System recently accepted a proposal from Merit Health Systems (based in Louisville, Kentucky) to buy Mountainside Hospital in Essex County. The sale is pending state approval and is expected to be completed by the end of 2006.
Table 2.9a Other (Non-General Acute Care) Hospitals, New Jersey, 2004 Type of Hospital Number of Hospitals Total Number of Beds Comprehensive Rehabilitation 17 1,202 Psychiatric 11 1,511 Special 6 601 Source: New Jersey Department of Health and Senior Services, Center for Health Statistics, Geographic Information System Data, 2004.
Table 2.10 Ownership Status of General Acute Care Hospitals, New Jersey, 2005 Ownership Status # Hospital Name, County Location Public 1 University Hospital—UMDNJ, Essex
Private, Not-for-profit 78 Various
Private, For-profit 1 Memorial Hospital of Salem County
Total 80
Source: American Hospital Association.

2006 New Jersey Health Care Almanac State of New Jersey
52 © Avalere Heath LLC
Table 2.11 Designated Trauma Centers, New Jersey, 2005 Hospital Name County Cooper University Hospital Camden
RWJ University Hospital Middlesex
University Hospital—UMDNJ Essex
AtlantiCare Regional Medical Center—City Atlantic
Capital Health System at Fuld Mercer
Hackensack University Medical Center Bergen
Jersey City Medical Center Hudson
Jersey Shore University Medical Center Monmouth
Morristown Memorial Hospital Morris
St. Joseph’s Hospital and Medical Center Passaic
Source: New Jersey Department of Health and Senior Services (http://www.state.nj.us/health/ems/trmactr.htm).
Almost all hospitals in the state operate as not-for-profit entities. Until recently, University Hospital—UMDNJ in Essex County was the only public hospital in the state. In July of 2006, St. Mary’s Hospital in Hudson County was being converted to a public facility through the creation of a city hospital authority.3
Atlantic Health System recently accepted a buy-out proposal from Merit Health Systems, a privately owned hospital management company based in Louisville, Kentucky, to acquire Mountainside Hospital in Essex County. If approved by the state, Mountainside Hospital will become the second investor-owned general acute care hospital in the state.
Ten hospitals in the state are designated as a Level I or Level II trauma center. These trauma centers play a critical role in treating seriously injured patients and responding to unexpected disasters. The trauma designation requires the hospitals to provide immediate availability of a full range of specialist, personnel and equipment capabilities 24 hours a day. The trauma centers are distributed throughout the state, with five of the ten located in the densely populated northern regions.
3 New Jersey P.L. 2006, c. 46.

State of New Jersey 2006 New Jersey Health Care Almanac
© Avalere Health LLC 53
Table 2.12 Hospital Inpatient Care Closures and Mergers, New Jersey, 2001–2006 Hospital County Date Result Saint Francis Hospital (Jersey City)
Hudson Closed 01/31/01 Re-licensed as St. Francis Rehabilitation Center
Trinitas Hospital—East Jersey St. Campus
Union Closed 12/01/2001
Virtua—West Jersey Hospital Camden
Camden Closed 01/01/2003 Emergency and outpatient services only
Passaic Beth Israel Hospital and General Hospital at Passaic
Passaic Merged 12/30/2003 PBI Regional Medical Center
West Hudson Hospital Hudson Closed 01/01/2004 Outpatient services only
Hospital Center at Orange Essex Closed 04/01/2004
South Jersey Hospital—Bridgeton
Cumberland Closed 08/01/2004 Emergency and outpatient services only
South Jersey Hospital—Millville
Cumberland Closed 08/01/2004 Ambulatory services only
Irvington General Hospital Essex Closed 01/31/2006
Source: New Jersey Department of Health and Senior Services, Division of Health Care Quality and Oversight.
Figure 2.2 Total Hospital Bed Capacity, General Acute Care Hospitals, New Jersey, 2001–2005
Source: Avalere Health analysis of the New Jersey Department of Health and Senior Services Quarterly Inpatient Utilization Report (also known as the B-2 Report).
Since January 2001, nine of the state’s general acute care hospitals have permanently closed, eliminated acute care inpatient services, or merged with another hospital. Despite these closures, from 2001 to 2005, statewide inpatient capacity measured on a “maintained beds” basis declined by only 1,232 beds, or about 5 percent. This slight, gradual reduction in the state’s total hospital bed capacity is shown in Figure 2.2.

2006 New Jersey Health Care Almanac State of New Jersey
54 © Avalere Heath LLC
Hospitals receive regulatory approval for a certain number of licensed beds. Many hospitals, facing lower demand for inpatient services, choose not to staff all of their licensed beds. Thus, most hospitals have fewer maintained beds than licensed beds.
This “excess” capacity of licensed beds can be an efficient way to keep a surge capacity in the acute care delivery system, and can serve to limit the need for regular expansions to keep pace with population growth.
With more and more services being provided outside of the acute care hospital, hospital administrators and policy officials tend to keep a close eye on both the ratio of maintained beds to licensed beds, as well as other important metrics, including occupancy rates (how many beds are actually being used), admission rates (how many people come into the hospital for an overnight stay), and lengths of stay (how long do people stay, on average, in the hospital).
As shown in Figure 2.3, New Jersey in 2004 had about 13 percent more maintained hospital beds per 1,000 residents than Connecticut, a state which has a similar demographic and socioeconomic composition. If New Jersey were to “adopt” Connecticut’s ratio of 2.23 maintained beds per 1000 residents, then New Jersey’s hospitals would have to lose about 2,600 beds—or about twice the actual reduction that occurred over the 2001–2005 period. The average hospital in New Jersey maintains about 250 beds; thus, if New Jersey were to reduce its bed capacity to mirror Connecticut’s ratios, the equivalent of about 10 “average” hospitals in New Jersey would, in effect, be taken out of service.
Figure 2.3 Hospital Bed Capacity by Licensed Beds and Maintained Beds per 1,000 Population, New Jersey, Connecticut, and United States, 2004
Note: Licensed beds data include general acute care hospitals only. Sources: Licensed beds data from Avalere Health analysis of the New Jersey Department of Health and Senior Services Quarterly Inpatient Utilization Report (also known as the B-2 Report) and Studying Health Care Utilization in Connecticut, State of Connecticut Office of Health Care Access, June 2006; licensed beds data for US not available. Maintained beds data from Hospital Statistics, American Hospital Association, 2006. Population data from US Census Bureau.
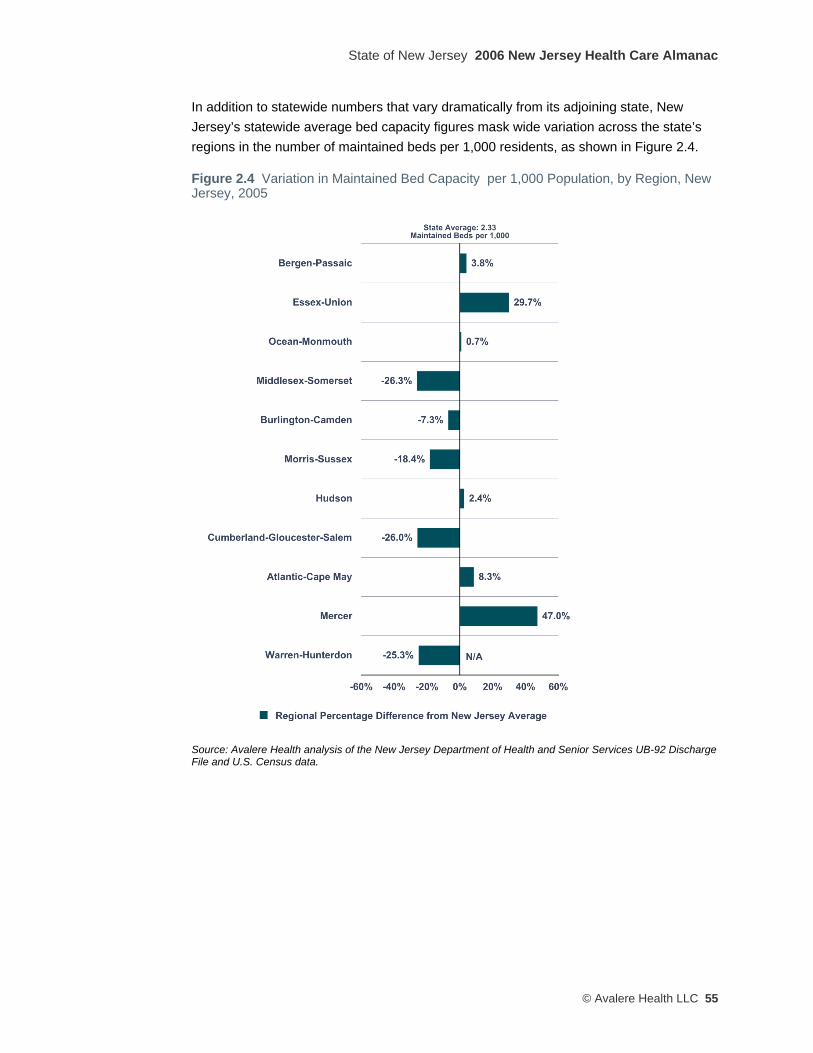
State of New Jersey 2006 New Jersey Health Care Almanac
© Avalere Health LLC 55
In addition to statewide numbers that vary dramatically from its adjoining state, New Jersey’s statewide average bed capacity figures mask wide variation across the state’s regions in the number of maintained beds per 1,000 residents, as shown in Figure 2.4.
Figure 2.4 Variation in Maintained Bed Capacity per 1,000 Population, by Region, New Jersey, 2005
Source: Avalere Health analysis of the New Jersey Department of Health and Senior Services UB-92 Discharge File and U.S. Census data.

2006 New Jersey Health Care Almanac State of New Jersey
56 © Avalere Heath LLC
Figure 2.5 Total Hospital Admissions per 1,000 Population, New Jersey, Connecticut, and United States, 2001–2004
Note: Figures shown include all admissions to hospitals within the geographic area, whether originating from inside or outside the area. Source: Hospital Statistics, American Hospital Association, 2006.
As shown in Figure 2.5, total hospital inpatient admissions in New Jersey trend at roughly 16 percent higher than the average of Connecticut hospitals, and about 6 percent higher than the average for all U.S. hospitals, with each trends holding roughly steady over the 2001–2005 period.
While controlling for the underlying health status of populations is beyond the scope of this report, aggregate comparisons of residents’ health status between the populations of Connecticut and New Jersey – which may explain the variation in rates -- do not reveal substantial differences.
If New Jersey physicians were to hospitalize patients at the same rate as their Connecticut colleagues, there would have been approximately 134,630 fewer inpatient admissions in 2004 alone.
At an average all-payer “per-admission” cost of $8,672 in 2004, New Jersey’s higher hospitalization rate relative to Connecticut’s results in New Jersey residents paying what amounts to an “excess hospitalization surcharge” of about $1.2 billion to New Jersey’s hospitals, relative to the hypothetical rate, or about 10 percent of total patient revenue all New Jersey hospitals received that year.
As with bed capacity, these statewide measures of hospital utilization obscure the fact that there is wide variation across the state’s regions in hospital use rates per 1,000 residents, as shown in Figure 2.6.
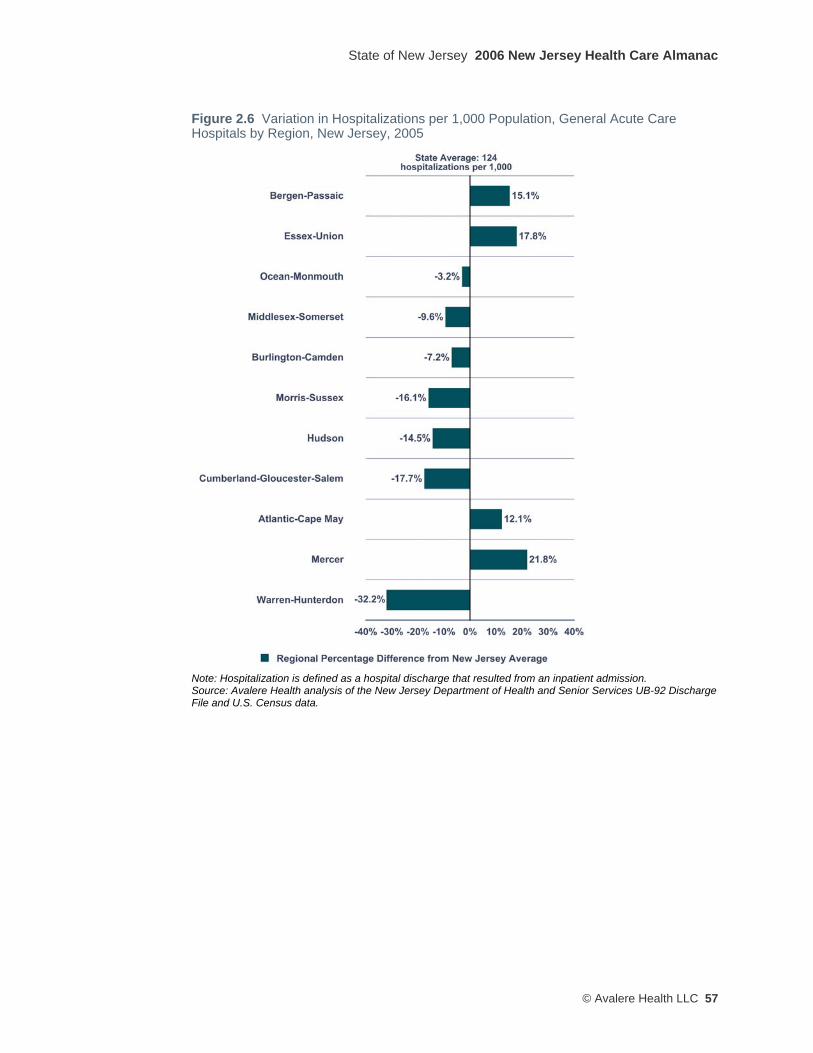
State of New Jersey 2006 New Jersey Health Care Almanac
© Avalere Health LLC 57
Figure 2.6 Variation in Hospitalizations per 1,000 Population, General Acute Care Hospitals by Region, New Jersey, 2005
Note: Hospitalization is defined as a hospital discharge that resulted from an inpatient admission. Source: Avalere Health analysis of the New Jersey Department of Health and Senior Services UB-92 Discharge File and U.S. Census data.
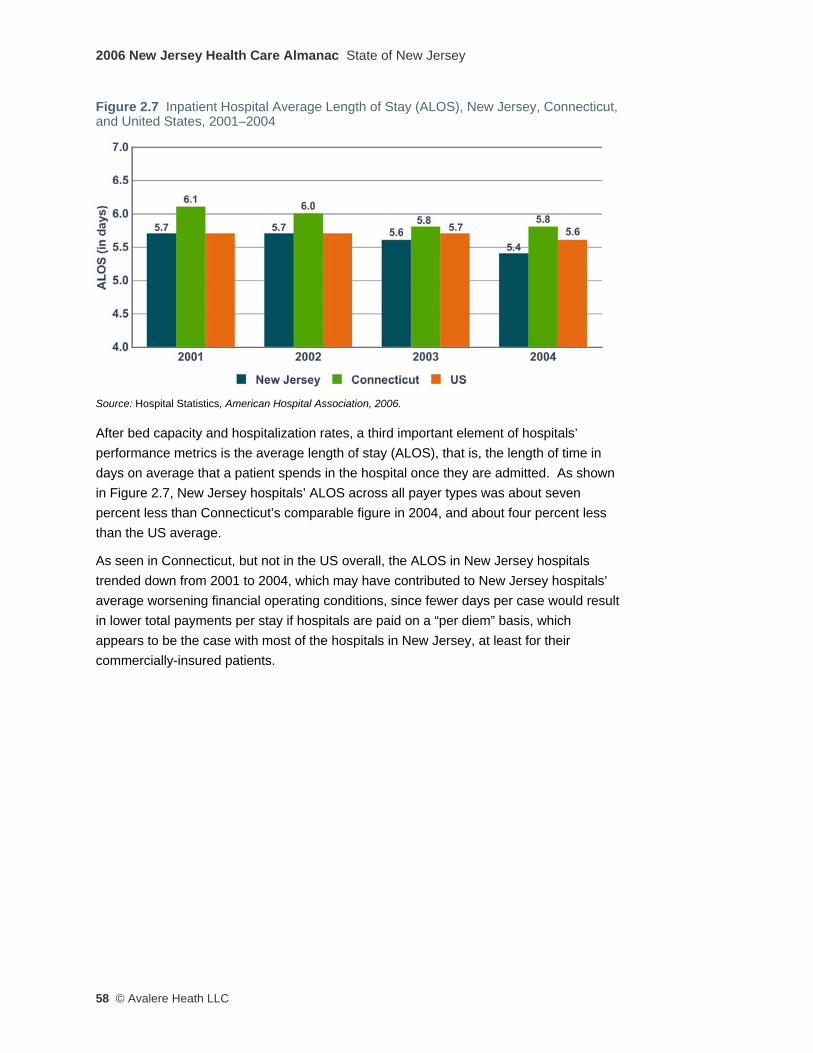
2006 New Jersey Health Care Almanac State of New Jersey
58 © Avalere Heath LLC
Figure 2.7 Inpatient Hospital Average Length of Stay (ALOS), New Jersey, Connecticut, and United States, 2001–2004
Source: Hospital Statistics, American Hospital Association, 2006.
After bed capacity and hospitalization rates, a third important element of hospitals’ performance metrics is the average length of stay (ALOS), that is, the length of time in days on average that a patient spends in the hospital once they are admitted. As shown in Figure 2.7, New Jersey hospitals’ ALOS across all payer types was about seven percent less than Connecticut’s comparable figure in 2004, and about four percent less than the US average.
As seen in Connecticut, but not in the US overall, the ALOS in New Jersey hospitals trended down from 2001 to 2004, which may have contributed to New Jersey hospitals’ average worsening financial operating conditions, since fewer days per case would result in lower total payments per stay if hospitals are paid on a “per diem” basis, which appears to be the case with most of the hospitals in New Jersey, at least for their commercially-insured patients.
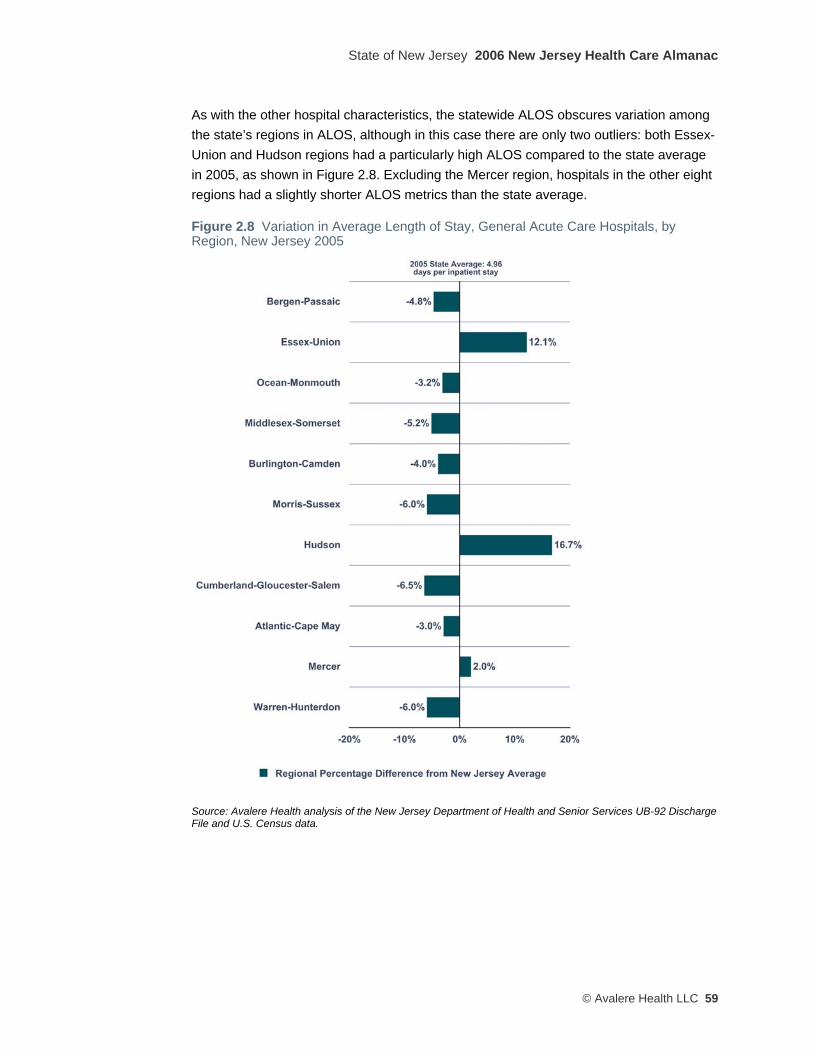
State of New Jersey 2006 New Jersey Health Care Almanac
© Avalere Health LLC 59
As with the other hospital characteristics, the statewide ALOS obscures variation among the state’s regions in ALOS, although in this case there are only two outliers: both Essex-Union and Hudson regions had a particularly high ALOS compared to the state average in 2005, as shown in Figure 2.8. Excluding the Mercer region, hospitals in the other eight regions had a slightly shorter ALOS metrics than the state average.
Figure 2.8 Variation in Average Length of Stay, General Acute Care Hospitals, by Region, New Jersey 2005
Source: Avalere Health analysis of the New Jersey Department of Health and Senior Services UB-92 Discharge File and U.S. Census data.
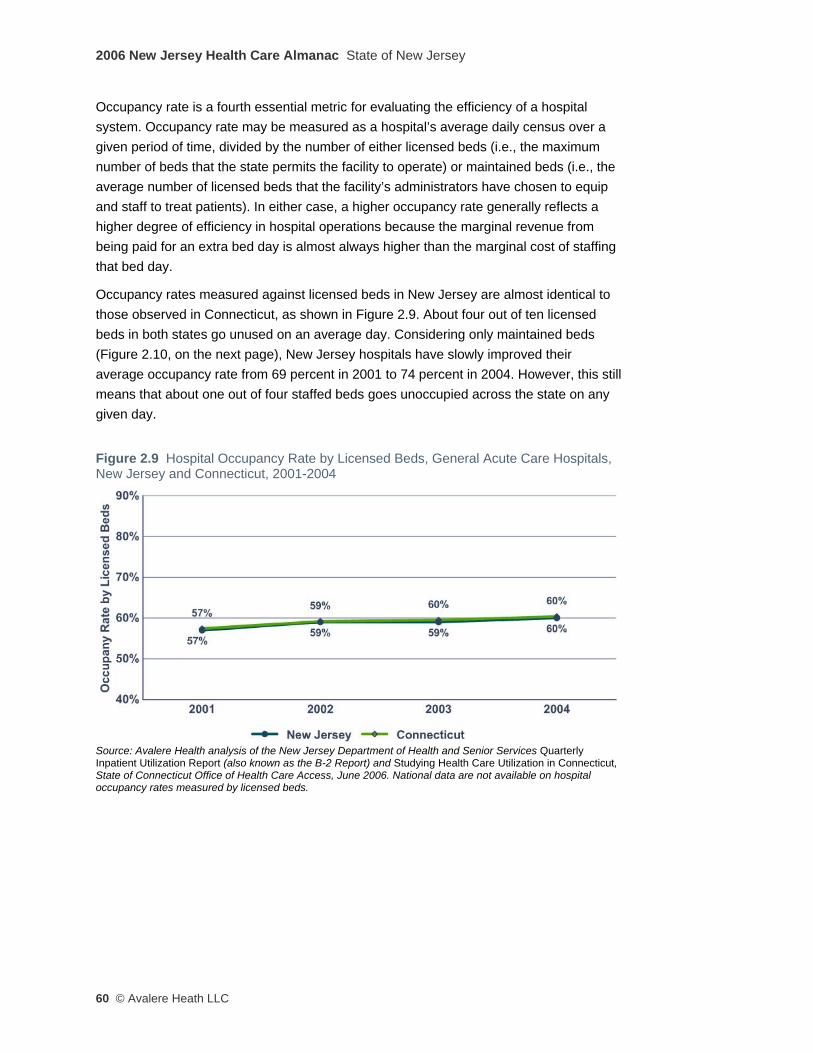
2006 New Jersey Health Care Almanac State of New Jersey
60 © Avalere Heath LLC
Occupancy rate is a fourth essential metric for evaluating the efficiency of a hospital system. Occupancy rate may be measured as a hospital’s average daily census over a given period of time, divided by the number of either licensed beds (i.e., the maximum number of beds that the state permits the facility to operate) or maintained beds (i.e., the average number of licensed beds that the facility’s administrators have chosen to equip and staff to treat patients). In either case, a higher occupancy rate generally reflects a higher degree of efficiency in hospital operations because the marginal revenue from being paid for an extra bed day is almost always higher than the marginal cost of staffing that bed day.
Occupancy rates measured against licensed beds in New Jersey are almost identical to those observed in Connecticut, as shown in Figure 2.9. About four out of ten licensed beds in both states go unused on an average day. Considering only maintained beds (Figure 2.10, on the next page), New Jersey hospitals have slowly improved their average occupancy rate from 69 percent in 2001 to 74 percent in 2004. However, this still means that about one out of four staffed beds goes unoccupied across the state on any given day.
Figure 2.9 Hospital Occupancy Rate by Licensed Beds, General Acute Care Hospitals, New Jersey and Connecticut, 2001-2004
Source: Avalere Health analysis of the New Jersey Department of Health and Senior Services Quarterly Inpatient Utilization Report (also known as the B-2 Report) and Studying Health Care Utilization in Connecticut, State of Connecticut Office of Health Care Access, June 2006. National data are not available on hospital occupancy rates measured by licensed beds.
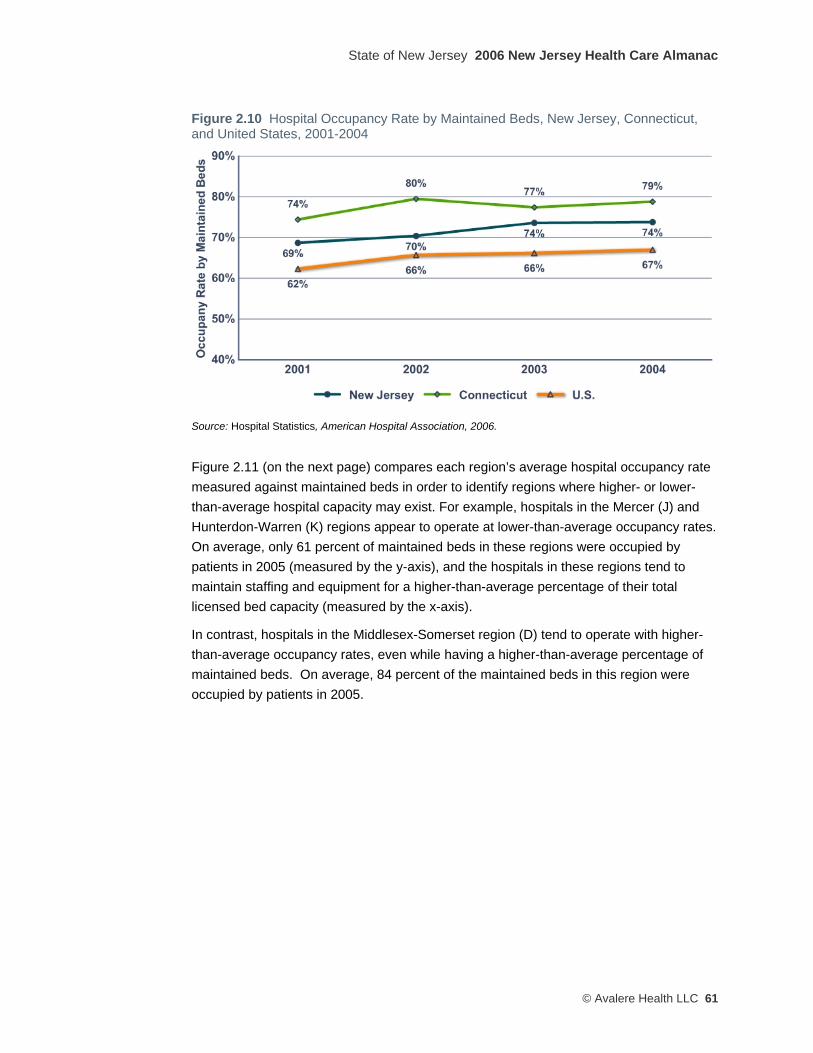
State of New Jersey 2006 New Jersey Health Care Almanac
© Avalere Health LLC 61
Figure 2.10 Hospital Occupancy Rate by Maintained Beds, New Jersey, Connecticut, and United States, 2001-2004
Source: Hospital Statistics, American Hospital Association, 2006.
Figure 2.11 (on the next page) compares each region’s average hospital occupancy rate measured against maintained beds in order to identify regions where higher- or lower-than-average hospital capacity may exist. For example, hospitals in the Mercer (J) and Hunterdon-Warren (K) regions appear to operate at lower-than-average occupancy rates. On average, only 61 percent of maintained beds in these regions were occupied by patients in 2005 (measured by the y-axis), and the hospitals in these regions tend to maintain staffing and equipment for a higher-than-average percentage of their total licensed bed capacity (measured by the x-axis).
In contrast, hospitals in the Middlesex-Somerset region (D) tend to operate with higher-than-average occupancy rates, even while having a higher-than-average percentage of maintained beds. On average, 84 percent of the maintained beds in this region were occupied by patients in 2005.

2006 New Jersey Health Care Almanac State of New Jersey
62 © Avalere Heath LLC
Figure 2.11 Comparison of Occupancy Rate and Bed Capacity by Region, General Acute Care Hospitals, New Jersey, 2005
Bubble size=Number of maintained beds in 2005 Letter Key A=Bergen-Passaic B=Essex-Union C=Ocean-Monmouth D=Middlesex-Somerset E=Burlington-Camden F=Morris-Sussex G=Hudson H=Cumberland-Gloucester- Salem I=Atlantic-Cape May J=Mercer K=Warren-Hunterdon Z=New Jersey average Color Key Blue=New Jersey regions Orange=New Jersey average
Source: Avalere Health analysis of the New Jersey Department of Health and Senior Services Quarterly Inpatient Utilization Report (also known as the B-2 Report).

State of New Jersey 2006 New Jersey Health Care Almanac
© Avalere Health LLC 63
Figure 2.12 Comparison of Safety Net Hospitalizations and Charity Care Subsidies by Region, General Acute Care Hospitals, New Jersey 2005
Bubble size=average charity care subsidy per safety net hospitalization Letter Key A=Bergen-Passaic B=Essex-Union C=Ocean-Monmouth D=Middlesex-Somerset E=Burlington-Camden F=Morris-Sussex G=Hudson H=Cumberland-Gloucester- Salem I=Atlantic-Cape May J=Mercer K=Warren-Hunterdon Z=New Jersey average Color Key Blue=New Jersey regions Orange=New Jersey average
Note: Hospitalization is defined as a hospital discharge that resulted from an inpatient admission, and Safety Net Hospitalization is defined as a hospitalization for which the primary payer was identified as Medicaid, uninsured, or self-pay. Source: Avalere Health analysis of the New Jersey Department of Health and Senior Services UB-92 Discharge File and Acute Care Hospital Cost Reports.
Figure 2.12 shows the volume and proportion of inpatient care provided to low-income and uninsured patients (collectively referred to as “safety net patients”), as well as the distribution of the state charity care payments relative to the number of “safety net” hospitalizations for each hospital.4
In terms of total volume, the largest safety net hospital providers in the state are in the Essex-Union (B) and Bergen-Passaic (A) regions. Hospitals in these two regions account for about 43 percent of all hospitalizations of safety net patients in the state.
4 The state annually distributes charity care payments to New Jersey hospitals for providing uncompensated care to the poor and uninsured. For further discussion, see pages 13-14 of Chapter 1.

2006 New Jersey Health Care Almanac State of New Jersey
64 © Avalere Heath LLC
Figure 2.12 also compares (using the relative size of the bubbles) the average amount of per-patient charity care subsidy that was received by hospitals in a given region in 2005. For example, hospitals in the Monmouth-Ocean (C) and Middlesex-Somerset (D) regions both received lower-than-average charity care subsidy per safety net hospitalization compared to hospitals in the Burlington-Camden (E) region, even though Monmouth-Ocean and Middlesex-Somerset hospitals appeared to provide a similar overall number and proportion of “safety net” hospitalizations.5
Border-Crossing by New Jersey Residents Seeking Out-of-State Hospital Care Traditional health services research uses discrete county, state or other geographic boundaries as the unit of analysis, which may understate or overstate utilization and capacity trends due to a lack of data on the travel patterns of patients and their preferences to seek health care services across geographic lines. This phenomenon is particularly relevant to New Jersey, because of the proximity of health care resources in nearby urban centers in Pennsylvania and New York. These areas have hospitals and affiliated physicians that provide highly specialized tertiary care services, which are precisely the types of medical services for which patients will cross state lines to access.
Our findings are consistent with published research and stakeholder perceptions that New Jersey is a net exporter of health care resources, i.e., a higher percentage of New Jersey residents seek care from out-of-state providers (out-migration) compared to the number of out-of-state residents who travel to New Jersey for care (in-migration).6 Anecdotal evidence suggests that the out-migration of New Jersey residents for health care services is most prominent in Camden and Burlington counties (to Philadelphia), Essex, Union, and Hudson counties (to New York City), and Warren County (to Allentown, Pennsylvania).
While data limitations prevented us from doing a region-specific analysis, our analysis of 2004-2005 Horizon Blue Cross Blue Shield claims data for hospital inpatient services reveals that approximately 13 percent of all inpatient visits paid for by Horizon on behalf of members who were residents of New Jersey were made to non-New Jersey providers. The vast majority of these Horizon plan members traveled to New York or Pennsylvania (Philadelphia and the Lehigh Valley) for this care. In the other direction, our analysis of hospital discharge data provided by the State of New Jersey shows that 2.7 percent of all inpatient care provided by New Jersey hospitals was delivered to non-New Jersey residents. The summary results of our analysis are shown in Table 2.13.
5 This analysis does not factor in patient acuity and hospital costs or charges per safety net hospitalization. 6 See for example Martin, A et al., “Health care spending during 1991-1998: a fifty-state review,” Health Affairs, July/August 2002; vol. 21 no. 4: 112-126, Exhibit 5.

State of New Jersey 2006 New Jersey Health Care Almanac
© Avalere Health LLC 65
Table 2.13 Estimated Flows of New Jersey and Other State Residents Crossing State Lines for Inpatient Hospital Care, July 2004–June 2005 Percent of Total
Inpatient Utilization In-migration (other state residents to New Jersey) 2.7%
Out-migration (New Jersey residents to other states) • To New York • To Pennsylvania • To all other states
13.0% 6.1% 5.9% 1.0%
Sources: In-migration estimate is from Avalere Health analysis of the New Jersey Department of Health and Senior Services UB-92 Discharge File; out-migration estimate is from Avalere Health analysis of Horizon Blue Cross Blue Shield inpatient claims data.

2006 New Jersey Health Care Almanac State of New Jersey
66 © Avalere Heath LLC
The Dartmouth Atlas of Health Care: Measuring Health Care Providers’ Performance Against State and National Benchmarks For several decades, health policy researchers have noted substantial geographic variation in the supply and use of health care resources and services that cannot be explained by underlying differences in the demographics or health status of the respective populations. Well-accepted axioms of quality improvement suggest that these variations imply a lack of consistent quality improvement mechanisms across geographies. These variations occur between states, between counties within states, and between small areas within counties.
Since 1993, Dr. Jack Wennberg and colleagues at the Center for Evaluative Clinical Sciences at Dartmouth Medical School have been conducting “small area analyses” using Medicare claims to measure and report on variations in health care resources and their utilization by geographic areas. This body of peer-reviewed research is known as “The Dartmouth Atlas of Health Care” or simply the “Dartmouth Atlas Project” (DAP).
Recently, the DAP has expanded its research agenda to include analyses and reports on resource intensity and utilization metrics among Medicare patients at specific hospitals within specific states and counties (Dartmouth Medical School, Center for the Evaluative Clinical Sciences, “The Care of Patients with Severe Chronic Illness,” 2006). This research has conclusively established that, nationally, within and among all states, hospitals and their affiliated admitting physicians vary widely in the way that they manage chronic illness. New Jersey is no exception.
The following tables show how New Jersey hospitals and physicians perform at the state level in comparison to their peers and colleagues in all other states (including the District of Columbia). Overall, New Jersey has DAP-reported hospital and physician service utilization rates that are among the highest in the United States. As discussed above, these high statewide averages obscure significant differences among regions and among individual hospitals and physicians in New Jersey. These intra-regional and hospital-level variations are described in additional detail in the regional chapters of this almanac.
The compilers of this Almanac are indebted to Dr. Wennberg and his colleagues at the Dartmouth Atlas Project for their work in developing and making available to the public these amplifying data.
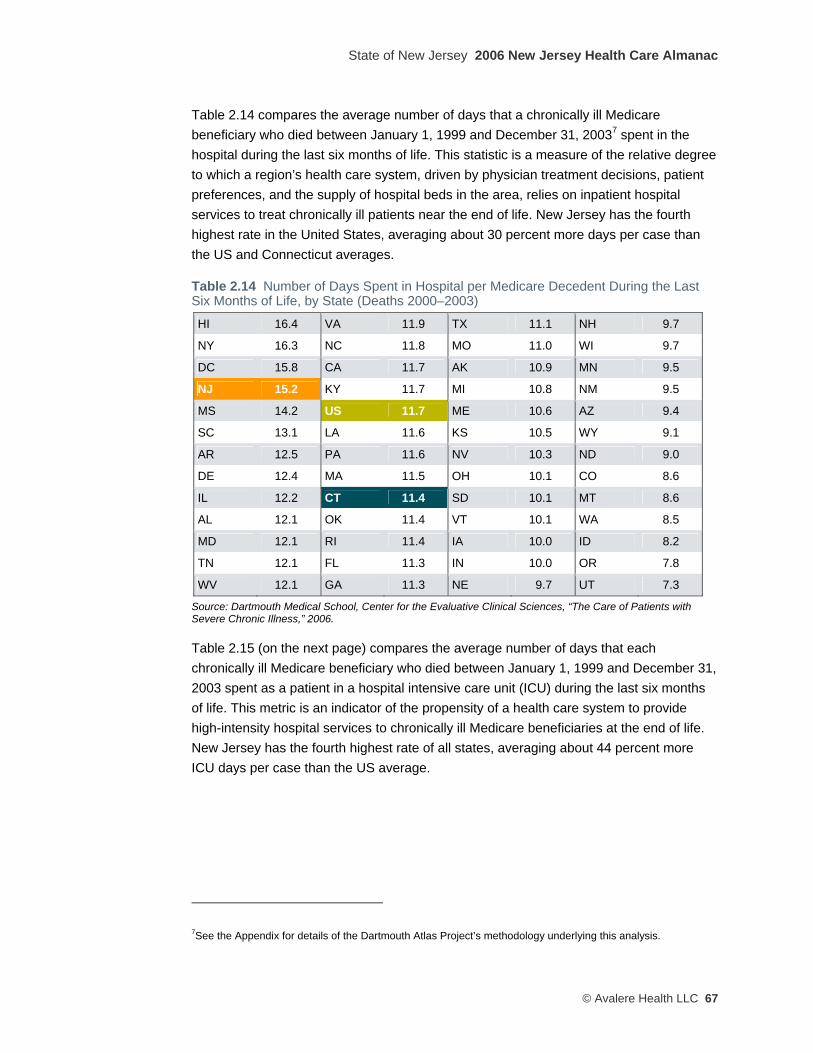
State of New Jersey 2006 New Jersey Health Care Almanac
© Avalere Health LLC 67
Table 2.14 compares the average number of days that a chronically ill Medicare beneficiary who died between January 1, 1999 and December 31, 20037 spent in the hospital during the last six months of life. This statistic is a measure of the relative degree to which a region’s health care system, driven by physician treatment decisions, patient preferences, and the supply of hospital beds in the area, relies on inpatient hospital services to treat chronically ill patients near the end of life. New Jersey has the fourth highest rate in the United States, averaging about 30 percent more days per case than the US and Connecticut averages.
Table 2.14 Number of Days Spent in Hospital per Medicare Decedent During the Last Six Months of Life, by State (Deaths 2000–2003) HI 16.4 VA 11.9 TX 11.1 NH 9.7
NY 16.3 NC 11.8 MO 11.0 WI 9.7
DC 15.8 CA 11.7 AK 10.9 MN 9.5
NJ 15.2 KY 11.7 MI 10.8 NM 9.5
MS 14.2 US 11.7 ME 10.6 AZ 9.4
SC 13.1 LA 11.6 KS 10.5 WY 9.1
AR 12.5 PA 11.6 NV 10.3 ND 9.0
DE 12.4 MA 11.5 OH 10.1 CO 8.6
IL 12.2 CT 11.4 SD 10.1 MT 8.6
AL 12.1 OK 11.4 VT 10.1 WA 8.5
MD 12.1 RI 11.4 IA 10.0 ID 8.2
TN 12.1 FL 11.3 IN 10.0 OR 7.8
WV 12.1 GA 11.3 NE 9.7 UT 7.3
Source: Dartmouth Medical School, Center for the Evaluative Clinical Sciences, “The Care of Patients with Severe Chronic Illness,” 2006.
Table 2.15 (on the next page) compares the average number of days that each chronically ill Medicare beneficiary who died between January 1, 1999 and December 31, 2003 spent as a patient in a hospital intensive care unit (ICU) during the last six months of life. This metric is an indicator of the propensity of a health care system to provide high-intensity hospital services to chronically ill Medicare beneficiaries at the end of life. New Jersey has the fourth highest rate of all states, averaging about 44 percent more ICU days per case than the US average.
7See the Appendix for details of the Dartmouth Atlas Project’s methodology underlying this analysis.
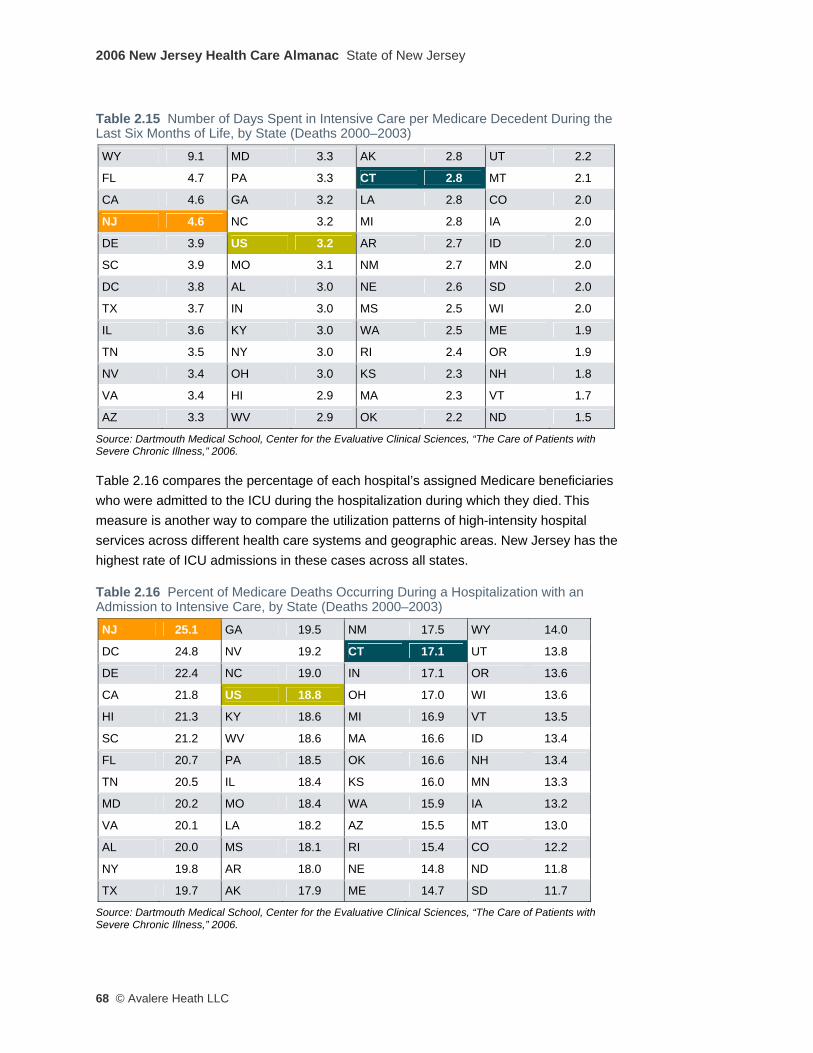
2006 New Jersey Health Care Almanac State of New Jersey
68 © Avalere Heath LLC
Table 2.15 Number of Days Spent in Intensive Care per Medicare Decedent During the Last Six Months of Life, by State (Deaths 2000–2003) WY 9.1 MD 3.3 AK 2.8 UT 2.2
FL 4.7 PA 3.3 CT 2.8 MT 2.1
CA 4.6 GA 3.2 LA 2.8 CO 2.0
NJ 4.6 NC 3.2 MI 2.8 IA 2.0
DE 3.9 US 3.2 AR 2.7 ID 2.0
SC 3.9 MO 3.1 NM 2.7 MN 2.0
DC 3.8 AL 3.0 NE 2.6 SD 2.0
TX 3.7 IN 3.0 MS 2.5 WI 2.0
IL 3.6 KY 3.0 WA 2.5 ME 1.9
TN 3.5 NY 3.0 RI 2.4 OR 1.9
NV 3.4 OH 3.0 KS 2.3 NH 1.8
VA 3.4 HI 2.9 MA 2.3 VT 1.7
AZ 3.3 WV 2.9 OK 2.2 ND 1.5
Source: Dartmouth Medical School, Center for the Evaluative Clinical Sciences, “The Care of Patients with Severe Chronic Illness,” 2006.
Table 2.16 compares the percentage of each hospital’s assigned Medicare beneficiaries who were admitted to the ICU during the hospitalization during which they died. This measure is another way to compare the utilization patterns of high-intensity hospital services across different health care systems and geographic areas. New Jersey has the highest rate of ICU admissions in these cases across all states.
Table 2.16 Percent of Medicare Deaths Occurring During a Hospitalization with an Admission to Intensive Care, by State (Deaths 2000–2003) NJ 25.1 GA 19.5 NM 17.5 WY 14.0
DC 24.8 NV 19.2 CT 17.1 UT 13.8
DE 22.4 NC 19.0 IN 17.1 OR 13.6
CA 21.8 US 18.8 OH 17.0 WI 13.6
HI 21.3 KY 18.6 MI 16.9 VT 13.5
SC 21.2 WV 18.6 MA 16.6 ID 13.4
FL 20.7 PA 18.5 OK 16.6 NH 13.4
TN 20.5 IL 18.4 KS 16.0 MN 13.3
MD 20.2 MO 18.4 WA 15.9 IA 13.2
VA 20.1 LA 18.2 AZ 15.5 MT 13.0
AL 20.0 MS 18.1 RI 15.4 CO 12.2
NY 19.8 AR 18.0 NE 14.8 ND 11.8
TX 19.7 AK 17.9 ME 14.7 SD 11.7
Source: Dartmouth Medical School, Center for the Evaluative Clinical Sciences, “The Care of Patients with Severe Chronic Illness,” 2006.

State of New Jersey 2006 New Jersey Health Care Almanac
© Avalere Health LLC 69
Hospital Emergency Departments In addition to their primary function of providing emergency medical care, hospital emergency departments (EDs) also serve patients who do not have access to primary care services through a physician or local community clinic or federally-qualified health center (FQHC). Patients seeking primary care services at an ED, many of whom are uninsured or rely on Medicaid coverage, may contribute to increased patient waiting times in the ED, overcrowding in the ED’s physical space, and diminished “surge capacity” in the ED’s ability to handle mass emergencies. The patients who seek primary care at a hospital ED also tend to be sicker because they have not been under the regular care of a local primary care provider.
Figure 2.13 Emergency Department Visits per 1,000 Population, New Jersey, Connecticut, and United States, 2001–2004
Source: Hospital Statistics, American Hospital Association, 2006.
As shown in Figure 2.13, the rate of use of ED services has remained steady across the entire state of New Jersey (1.0 percent increase over the 2001-2005 period), while increasing slightly in Connecticut and the US over the period examined. Use of ED services in the New Jersey consistently has been running 10 to 17 percent lower than the Connecticut and US utilization rates.
Our analysis of the wide variations in ED use across New Jersey regions (shown in Figure 2.14, on the next page) suggests support for anecdotal New Jersey stakeholder views that ED utilization is higher in areas of the state where access to primary care physicians and community health centers is more limited, for example in the Essex-Union (Newark), Mercer (Trenton), and Atlantic-Cape May (Atlantic City) regions.

2006 New Jersey Health Care Almanac State of New Jersey
70 © Avalere Heath LLC
Figure 2.14 Variation in Emergency Department Visits per 1,000 Population by Region, General Acute Care Hospitals, New Jersey, 2005
Source: Avalere Health analysis of the New Jersey Department of Health and Senior Services UB-92 Discharge File and U.S. Census data.
Figure 2.15 (on the next page) compares the state’s regions based on the percentage of hospital ED visits made by low-income and/or uninsured patients (“safety net patients”) and the percentage of ED visits that do not result in an actual admission to the hospital (and thus are presumed to be visits for primary care services). This analysis suggests that hospital EDs that serve a disproportionately high number of safety net patients tend to experience significant resource demands on their EDs from patients that do not end up being admitted as an inpatient, which would trigger relatively higher aggregate reimbursement for their care.
For example, the Essex-Union (B) and Middlesex-Somerset (D) regions experience a disproportionate number of “safety net” ED visits that result in an inpatient admission, compared to other regions in the state and relative to the statewide average. Hospitals in
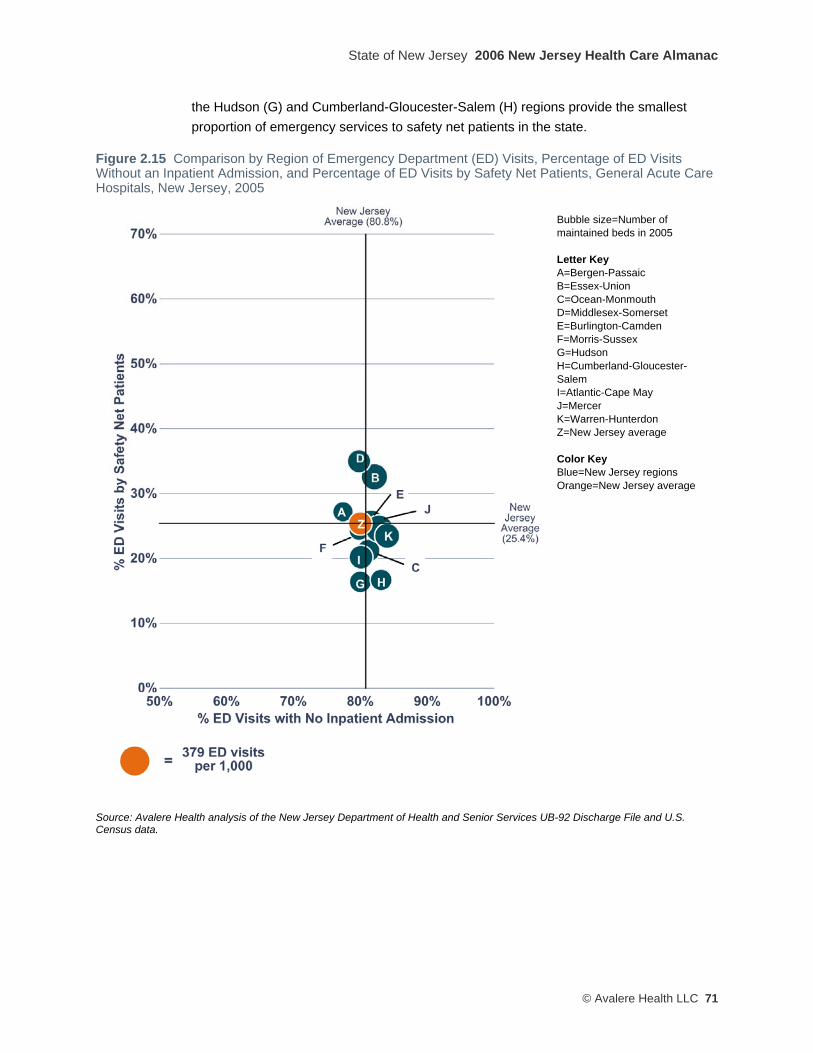
State of New Jersey 2006 New Jersey Health Care Almanac
© Avalere Health LLC 71
the Hudson (G) and Cumberland-Gloucester-Salem (H) regions provide the smallest proportion of emergency services to safety net patients in the state.
Figure 2.15 Comparison by Region of Emergency Department (ED) Visits, Percentage of ED Visits Without an Inpatient Admission, and Percentage of ED Visits by Safety Net Patients, General Acute Care Hospitals, New Jersey, 2005
Bubble size=Number of maintained beds in 2005 Letter Key A=Bergen-Passaic B=Essex-Union C=Ocean-Monmouth D=Middlesex-Somerset E=Burlington-Camden F=Morris-Sussex G=Hudson H=Cumberland-Gloucester- Salem I=Atlantic-Cape May J=Mercer K=Warren-Hunterdon Z=New Jersey average Color Key Blue=New Jersey regions Orange=New Jersey average
Source: Avalere Health analysis of the New Jersey Department of Health and Senior Services UB-92 Discharge File and U.S. Census data.
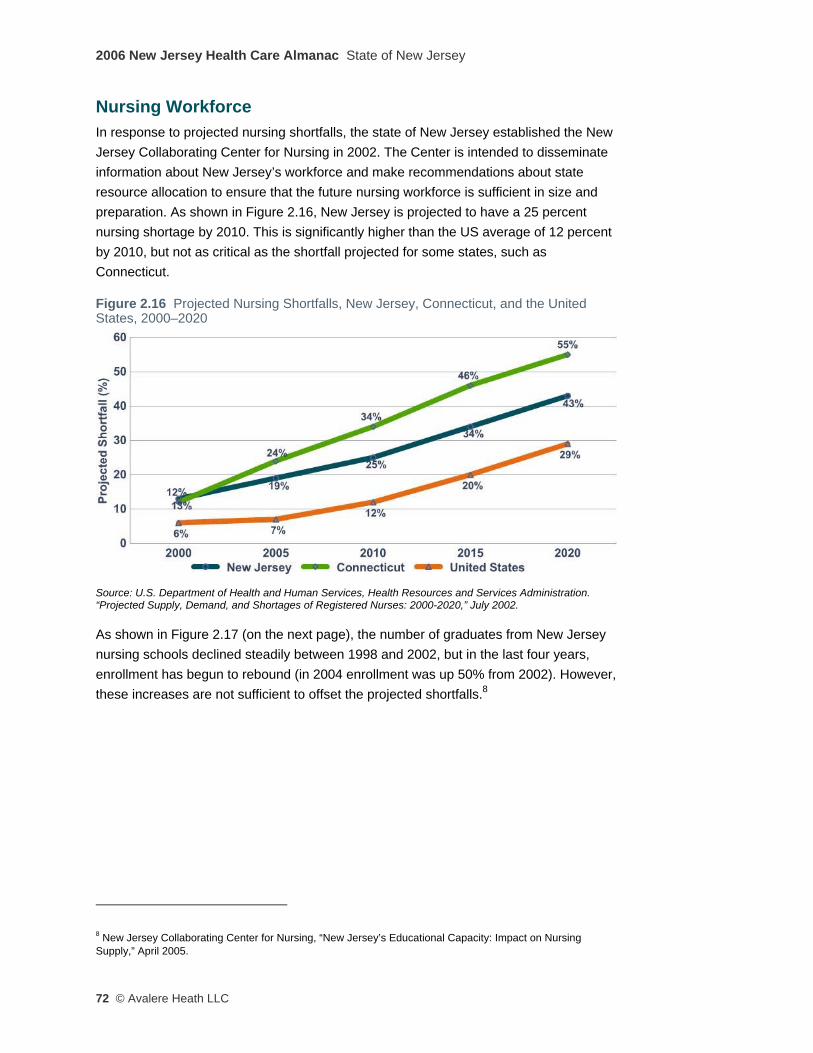
2006 New Jersey Health Care Almanac State of New Jersey
72 © Avalere Heath LLC
Nursing Workforce In response to projected nursing shortfalls, the state of New Jersey established the New Jersey Collaborating Center for Nursing in 2002. The Center is intended to disseminate information about New Jersey’s workforce and make recommendations about state resource allocation to ensure that the future nursing workforce is sufficient in size and preparation. As shown in Figure 2.16, New Jersey is projected to have a 25 percent nursing shortage by 2010. This is significantly higher than the US average of 12 percent by 2010, but not as critical as the shortfall projected for some states, such as Connecticut.
Figure 2.16 Projected Nursing Shortfalls, New Jersey, Connecticut, and the United States, 2000–2020
Source: U.S. Department of Health and Human Services, Health Resources and Services Administration. “Projected Supply, Demand, and Shortages of Registered Nurses: 2000-2020,” July 2002.
As shown in Figure 2.17 (on the next page), the number of graduates from New Jersey nursing schools declined steadily between 1998 and 2002, but in the last four years, enrollment has begun to rebound (in 2004 enrollment was up 50% from 2002). However, these increases are not sufficient to offset the projected shortfalls.8
8 New Jersey Collaborating Center for Nursing, “New Jersey’s Educational Capacity: Impact on Nursing Supply,” April 2005.
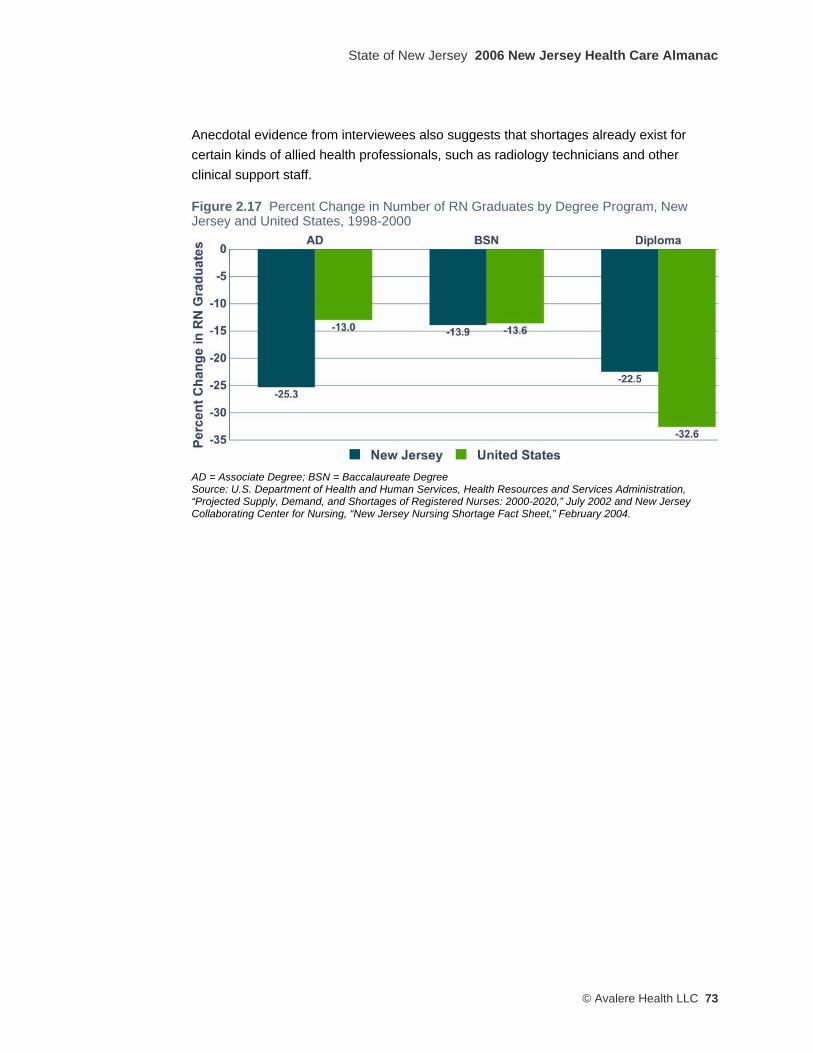
State of New Jersey 2006 New Jersey Health Care Almanac
© Avalere Health LLC 73
Anecdotal evidence from interviewees also suggests that shortages already exist for certain kinds of allied health professionals, such as radiology technicians and other clinical support staff.
Figure 2.17 Percent Change in Number of RN Graduates by Degree Program, New Jersey and United States, 1998-2000
AD = Associate Degree; BSN = Baccalaureate Degree Source: U.S. Department of Health and Human Services, Health Resources and Services Administration, “Projected Supply, Demand, and Shortages of Registered Nurses: 2000-2020,” July 2002 and New Jersey Collaborating Center for Nursing, “New Jersey Nursing Shortage Fact Sheet,” February 2004.
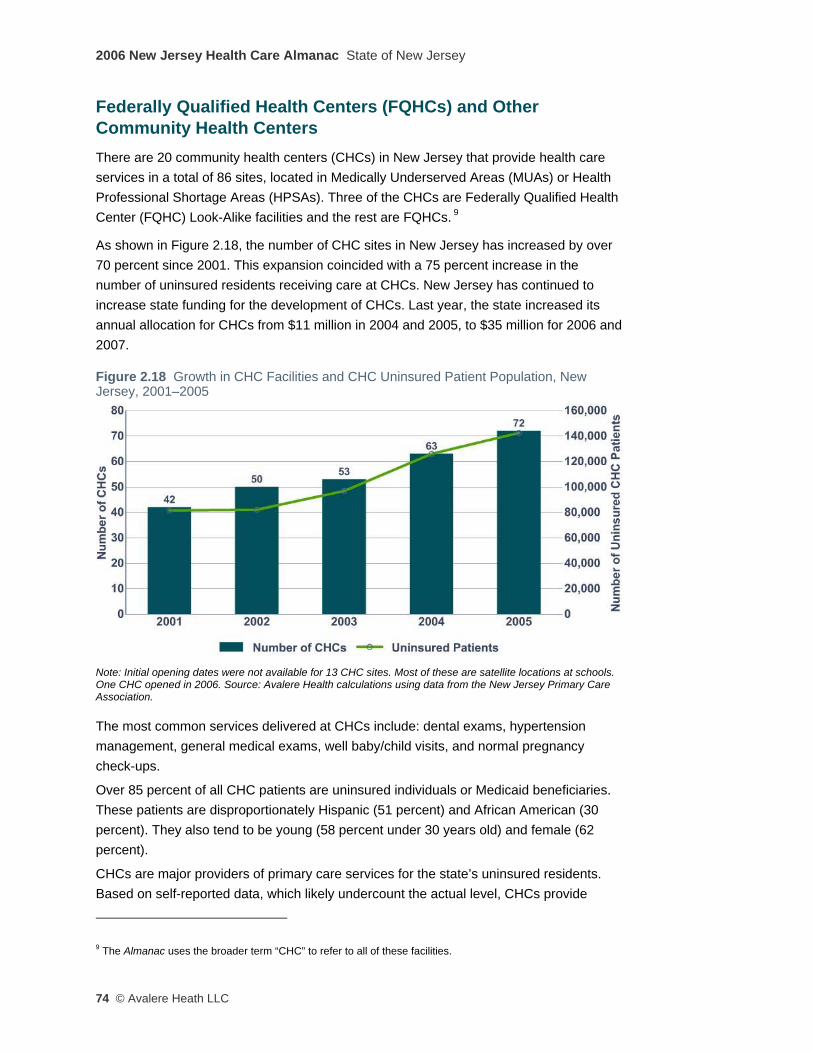
2006 New Jersey Health Care Almanac State of New Jersey
74 © Avalere Heath LLC
Federally Qualified Health Centers (FQHCs) and Other Community Health Centers There are 20 community health centers (CHCs) in New Jersey that provide health care services in a total of 86 sites, located in Medically Underserved Areas (MUAs) or Health Professional Shortage Areas (HPSAs). Three of the CHCs are Federally Qualified Health Center (FQHC) Look-Alike facilities and the rest are FQHCs. 9
As shown in Figure 2.18, the number of CHC sites in New Jersey has increased by over 70 percent since 2001. This expansion coincided with a 75 percent increase in the number of uninsured residents receiving care at CHCs. New Jersey has continued to increase state funding for the development of CHCs. Last year, the state increased its annual allocation for CHCs from $11 million in 2004 and 2005, to $35 million for 2006 and 2007.
Figure 2.18 Growth in CHC Facilities and CHC Uninsured Patient Population, New Jersey, 2001–2005
Note: Initial opening dates were not available for 13 CHC sites. Most of these are satellite locations at schools. One CHC opened in 2006. Source: Avalere Health calculations using data from the New Jersey Primary Care Association.
The most common services delivered at CHCs include: dental exams, hypertension management, general medical exams, well baby/child visits, and normal pregnancy check-ups.
Over 85 percent of all CHC patients are uninsured individuals or Medicaid beneficiaries. These patients are disproportionately Hispanic (51 percent) and African American (30 percent). They also tend to be young (58 percent under 30 years old) and female (62 percent).
CHCs are major providers of primary care services for the state’s uninsured residents. Based on self-reported data, which likely undercount the actual level, CHCs provide
9 The Almanac uses the broader term “CHC” to refer to all of these facilities.

State of New Jersey 2006 New Jersey Health Care Almanac
© Avalere Health LLC 75
primary care and some specialty care services to about 14 percent of all the state’s uninsured residents. However, as with so many other aspects of the state’s health care system, the state average masks wide variations among regions, as shown in Figure 2.19.
CHCs in the Hudson and Atlantic-Cape May regions are providing care to 38.4 and 34.8 percent of their regions’ uninsured residents, respectively. This is substantially higher than the 13.8 percent of uninsured residents reached by CHCs statewide. CHCs in the Bergen-Passaic, Monmouth-Ocean, Middlesex-Somerset, and Morris-Sussex regions are providing care to less than 10 percent of their regions’ uninsured residents. Uninsured individuals who do not receive primary care services at CHCs may be seeking care at private physician offices, hospital emergency departments, or alternate sites of care.
Figure 2.19 Percentage of Uninsured Residents Treated at CHCs, New Jersey, 2005
Source: Avalere Health calculations using data from the New Jersey Primary Care Association.
Numerous New Jersey stakeholders reported significant access problems for specialist services for low-income Medicaid beneficiaries and uninsured individuals. The quality and availability of data on the number of specialist visits per 1,000 patients varies widely between health centers, but for the eight CHCs in the state with available data, the centers are successfully coordinating with local specialist physicians and/or acute care hospitals to provide specialty care to their patients.
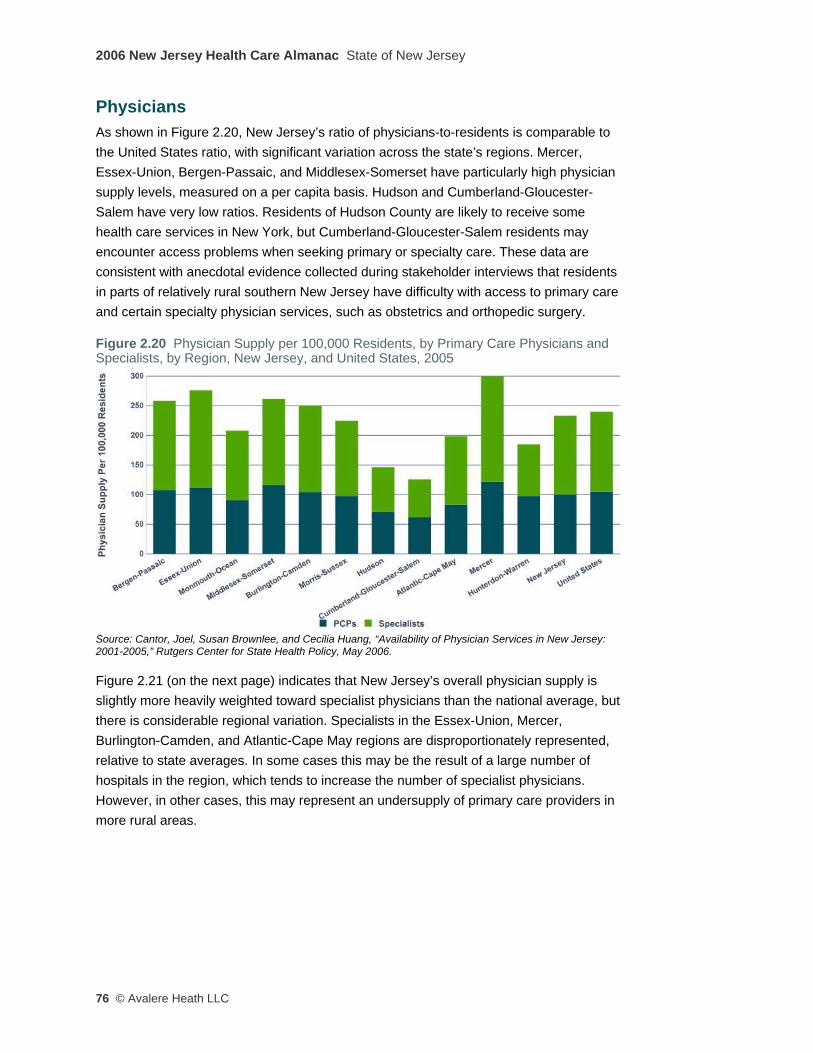
2006 New Jersey Health Care Almanac State of New Jersey
76 © Avalere Heath LLC
Physicians As shown in Figure 2.20, New Jersey’s ratio of physicians-to-residents is comparable to the United States ratio, with significant variation across the state’s regions. Mercer, Essex-Union, Bergen-Passaic, and Middlesex-Somerset have particularly high physician supply levels, measured on a per capita basis. Hudson and Cumberland-Gloucester-Salem have very low ratios. Residents of Hudson County are likely to receive some health care services in New York, but Cumberland-Gloucester-Salem residents may encounter access problems when seeking primary or specialty care. These data are consistent with anecdotal evidence collected during stakeholder interviews that residents in parts of relatively rural southern New Jersey have difficulty with access to primary care and certain specialty physician services, such as obstetrics and orthopedic surgery.
Figure 2.20 Physician Supply per 100,000 Residents, by Primary Care Physicians and Specialists, by Region, New Jersey, and United States, 2005
Source: Cantor, Joel, Susan Brownlee, and Cecilia Huang, “Availability of Physician Services in New Jersey: 2001-2005,” Rutgers Center for State Health Policy, May 2006.
Figure 2.21 (on the next page) indicates that New Jersey’s overall physician supply is slightly more heavily weighted toward specialist physicians than the national average, but there is considerable regional variation. Specialists in the Essex-Union, Mercer, Burlington-Camden, and Atlantic-Cape May regions are disproportionately represented, relative to state averages. In some cases this may be the result of a large number of hospitals in the region, which tends to increase the number of specialist physicians. However, in other cases, this may represent an undersupply of primary care providers in more rural areas.
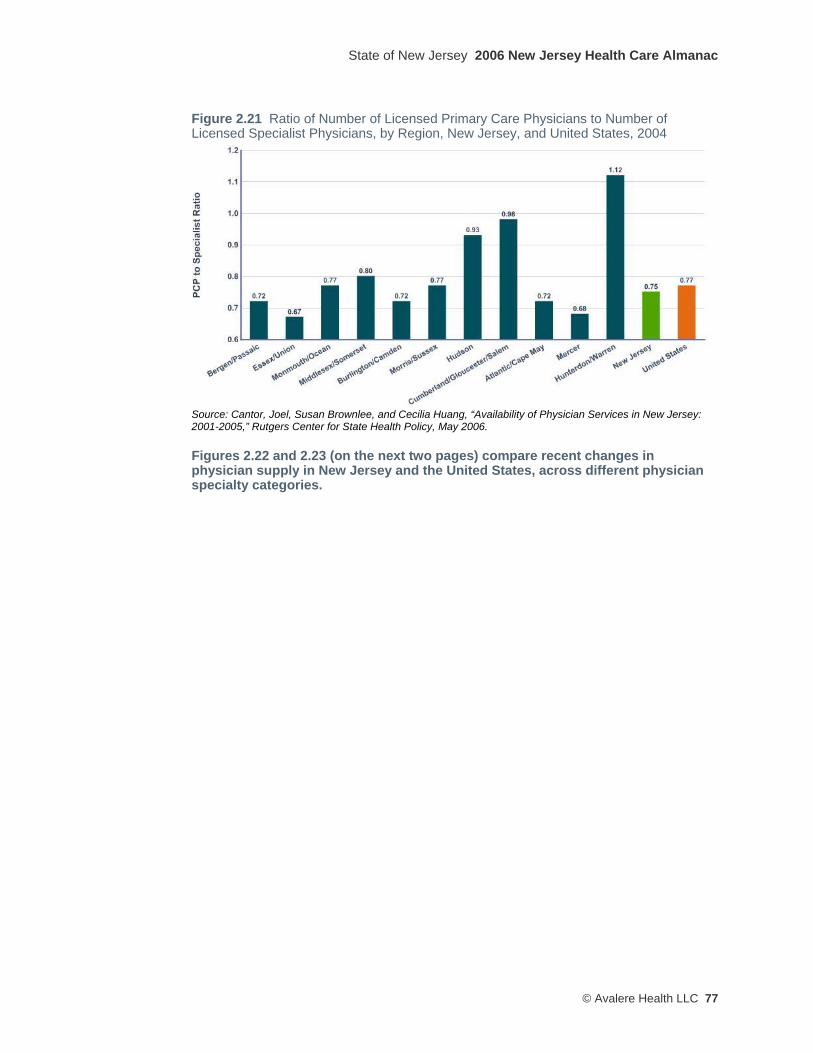
State of New Jersey 2006 New Jersey Health Care Almanac
© Avalere Health LLC 77
Figure 2.21 Ratio of Number of Licensed Primary Care Physicians to Number of Licensed Specialist Physicians, by Region, New Jersey, and United States, 2004
Source: Cantor, Joel, Susan Brownlee, and Cecilia Huang, “Availability of Physician Services in New Jersey: 2001-2005,” Rutgers Center for State Health Policy, May 2006.
Figures 2.22 and 2.23 (on the next two pages) compare recent changes in physician supply in New Jersey and the United States, across different physician specialty categories.
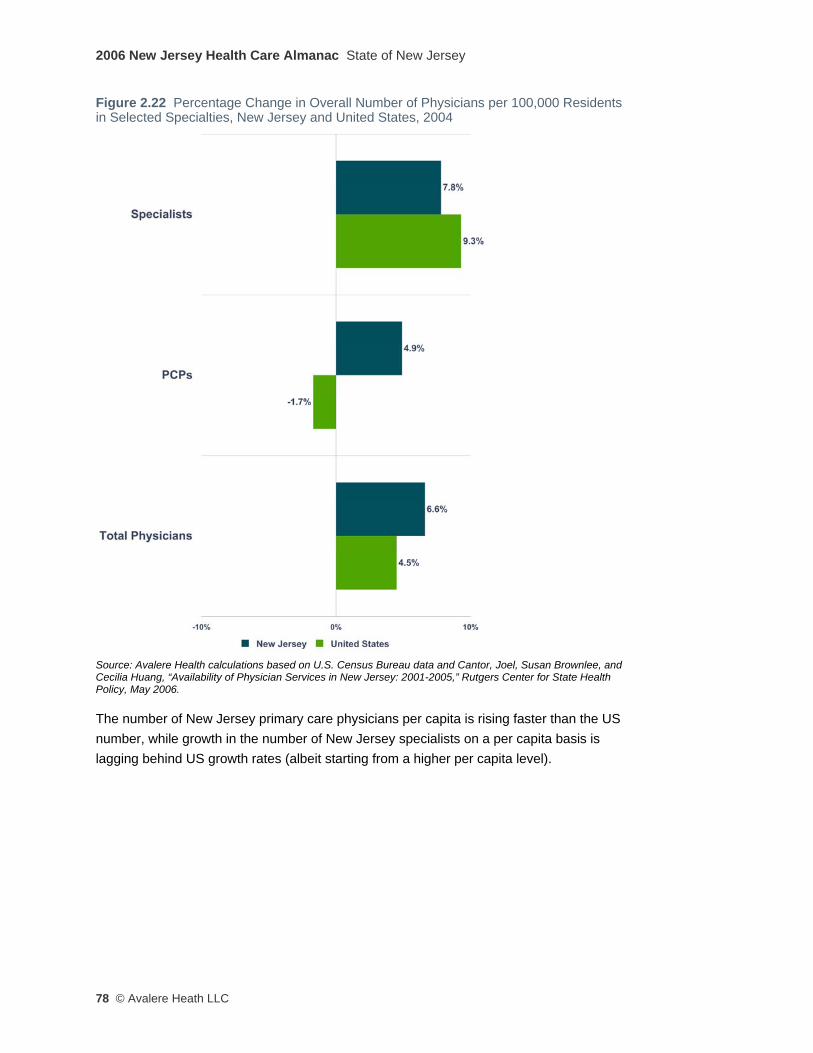
2006 New Jersey Health Care Almanac State of New Jersey
78 © Avalere Heath LLC
Figure 2.22 Percentage Change in Overall Number of Physicians per 100,000 Residents in Selected Specialties, New Jersey and United States, 2004
Source: Avalere Health calculations based on U.S. Census Bureau data and Cantor, Joel, Susan Brownlee, and Cecilia Huang, “Availability of Physician Services in New Jersey: 2001-2005,” Rutgers Center for State Health Policy, May 2006.
The number of New Jersey primary care physicians per capita is rising faster than the US number, while growth in the number of New Jersey specialists on a per capita basis is lagging behind US growth rates (albeit starting from a higher per capita level).
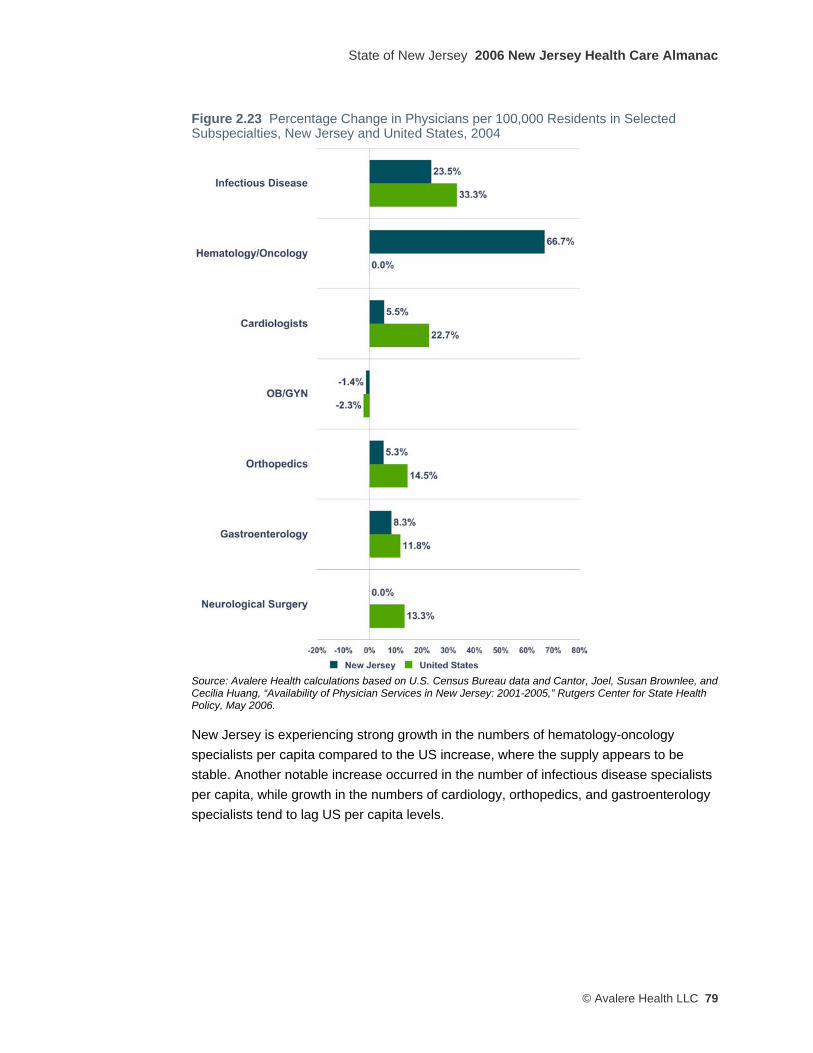
State of New Jersey 2006 New Jersey Health Care Almanac
© Avalere Health LLC 79
Figure 2.23 Percentage Change in Physicians per 100,000 Residents in Selected Subspecialties, New Jersey and United States, 2004
Source: Avalere Health calculations based on U.S. Census Bureau data and Cantor, Joel, Susan Brownlee, and Cecilia Huang, “Availability of Physician Services in New Jersey: 2001-2005,” Rutgers Center for State Health Policy, May 2006.
New Jersey is experiencing strong growth in the numbers of hematology-oncology specialists per capita compared to the US increase, where the supply appears to be stable. Another notable increase occurred in the number of infectious disease specialists per capita, while growth in the numbers of cardiology, orthopedics, and gastroenterology specialists tend to lag US per capita levels.

2006 New Jersey Health Care Almanac State of New Jersey
80 © Avalere Heath LLC
Comparing the Use of Physician Services for Medicare Beneficiaries at the End of Life in New Jersey and Other States Tables 2.17 through 2.20 present information from the Dartmouth Atlas Project and compare New Jersey’s rates to other states across four measurements of the utilization of physician services for the treatment of chronically ill Medicare beneficiaries during the last six months to two years of life.
In three of these benchmark comparisons, which examine physician services delivered to hospital-based chronically ill Medicare patients at the end of life, New Jersey has the highest average rates out of all 51 states (including the District of Columbia). These metrics capture the intensity of physician care delivered to patients.
Table 2.17 examines the total number of physician visits (not counting surgical visits) received by Medicare beneficiaries in the study population. New Jersey has an average per-beneficiary rate of physician visits that is about 43 percent higher than the national average and almost two-thirds higher than the rate in Connecticut.
Table 2.17 Number of Physician Visits per Medicare Decedent During the Last Six Months of Life, by State (Deaths 2000–2003) NJ 41.5 AR 29.0 VA 26.1 NH 21.3
CA 34.9 US 29.0 OK 25.7 NM 20.7
FL 34.9 MI 28.3 WV 25.7 MN 20.6
HI 34.5 MS 28.3 NE 25.6 ME 20.3
DC 34.2 AL 27.7 CT 25.4 WA 20.0
NV 33.1 SC 27.7 IN 24.5 ND 19.9
DE 32.3 KY 27.5 KS 24.5 WY 19.6
PA 31.9 MA 26.8 NC 24.3 VT 19.1
IL 31.1 AZ 26.6 RI 24.0 MT 19.0
LA 31.0 GA 26.5 CO 23.1 AK 18.4
TX 30.9 MO 26.3 IA 22.5 ID 18.1
TN 29.7 NY 26.3 SD 22.4 OR 17.9
MD 29.4 OH 26.3 WI 22.0 UT 17.0
Source: Dartmouth Medical School, Center for the Evaluative Clinical Sciences, “The Care of Patients with Severe Chronic Illness,” 2006.
Table 2.18 (on the next page) examines the proportion of Medicare beneficiaries in the study population who saw ten or more unique individual physicians during the last six months of life. As the number of treating physicians increases, it becomes more difficult to coordinate care and improve outcomes. A greater percentage of chronically ill Medicare beneficiaries in New Jersey were treated by ten or more individual physicians than in any other state.
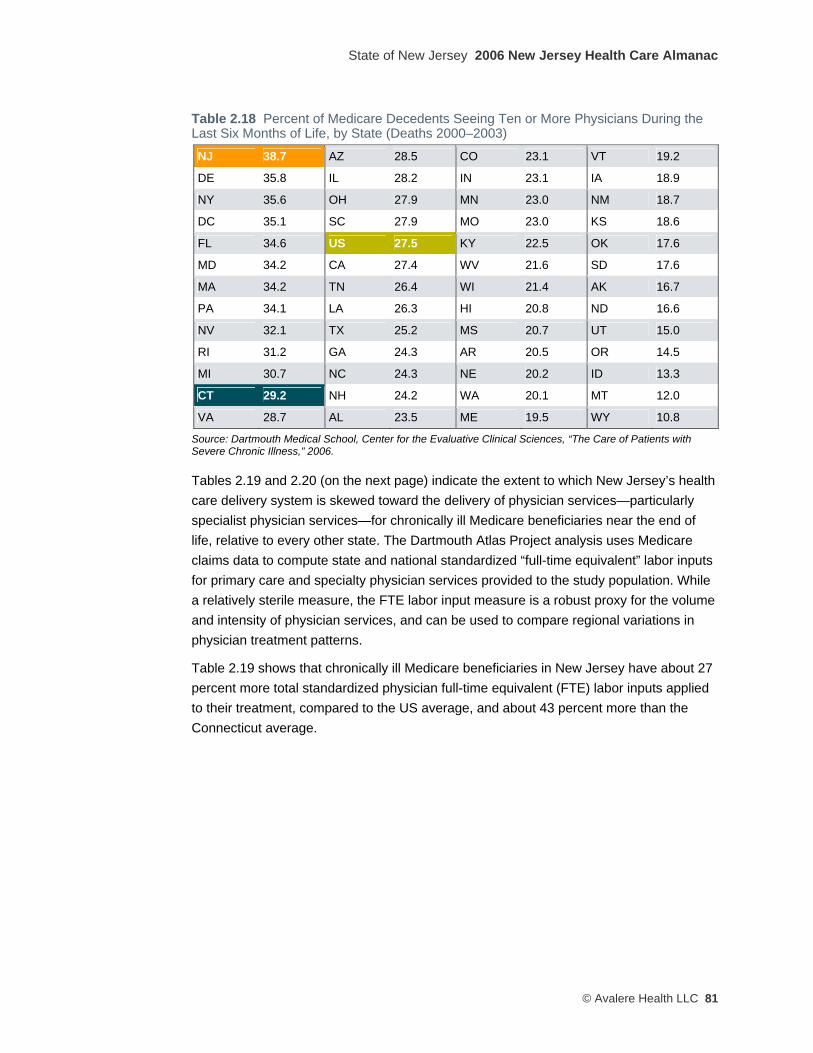
State of New Jersey 2006 New Jersey Health Care Almanac
© Avalere Health LLC 81
Table 2.18 Percent of Medicare Decedents Seeing Ten or More Physicians During the Last Six Months of Life, by State (Deaths 2000–2003)
NJ 38.7 AZ 28.5 CO 23.1 VT 19.2
DE 35.8 IL 28.2 IN 23.1 IA 18.9
NY 35.6 OH 27.9 MN 23.0 NM 18.7
DC 35.1 SC 27.9 MO 23.0 KS 18.6
FL 34.6 US 27.5 KY 22.5 OK 17.6
MD 34.2 CA 27.4 WV 21.6 SD 17.6
MA 34.2 TN 26.4 WI 21.4 AK 16.7
PA 34.1 LA 26.3 HI 20.8 ND 16.6
NV 32.1 TX 25.2 MS 20.7 UT 15.0
RI 31.2 GA 24.3 AR 20.5 OR 14.5
MI 30.7 NC 24.3 NE 20.2 ID 13.3
CT 29.2 NH 24.2 WA 20.1 MT 12.0
VA 28.7 AL 23.5 ME 19.5 WY 10.8
Source: Dartmouth Medical School, Center for the Evaluative Clinical Sciences, “The Care of Patients with Severe Chronic Illness,” 2006.
Tables 2.19 and 2.20 (on the next page) indicate the extent to which New Jersey’s health care delivery system is skewed toward the delivery of physician services—particularly specialist physician services—for chronically ill Medicare beneficiaries near the end of life, relative to every other state. The Dartmouth Atlas Project analysis uses Medicare claims data to compute state and national standardized “full-time equivalent” labor inputs for primary care and specialty physician services provided to the study population. While a relatively sterile measure, the FTE labor input measure is a robust proxy for the volume and intensity of physician services, and can be used to compare regional variations in physician treatment patterns.
Table 2.19 shows that chronically ill Medicare beneficiaries in New Jersey have about 27 percent more total standardized physician full-time equivalent (FTE) labor inputs applied to their treatment, compared to the US average, and about 43 percent more than the Connecticut average.

2006 New Jersey Health Care Almanac State of New Jersey
82 © Avalere Heath LLC
Table 2.19 Standardized FTE Physician Labor Inputs per 1,000 Medicare Decedents During the Last Two Years of Life, by State (Deaths 2000–2003) NJ 27.5 US 21.6 NE 19.6 MN 18.3
DC 26.6 AZ 21.2 VA 19.4 NH 18.3
FL 26.3 MA 21.2 CT 19.2 SD 18.3
CA 25.9 IA 20.7 GA 19.2 WI 18.2
NY 24.6 LA 20.7 MS 19.1 NM 17.9
HI 23.4 TN 20.7 NC 19.1 ME 17.6
MD 23.2 AL 20.5 RI 19.1 MT 17.5
IL 23.1 KY 19.9 IN 19.0 OR 17.5
NV 23.1 MO 19.9 KS 18.8 WY 17.4
TX 22.6 OH 19.9 OK 18.5 ID 17.3
MI 22.3 SC 19.9 WV 18.5 UT 17.2
PA 22.1 CO 19.8 VT 18.4 ND 17.1
DE 22.0 AR 19.6 WA 18.4 AK 16.1
Source: Dartmouth Medical School, Center for the Evaluative Clinical Sciences, “The Care of Patients with Severe Chronic Illness,” 2006.
Table 2.20 reveals that New Jersey Medicare beneficiaries in the study group were treated by significantly more specialist physicians relative to primary care physicians, compared to the national and Connecticut averages. In 11 states, primary care physicians were involved at a rate more than twice the rate experienced by Medicare beneficiaries in New Jersey.
Table 2.20 Ratio of Primary Care to Medical Specialist FTE Labor Inputs During the Last Two Years of Life for Medicare Beneficiaries, by State (Deaths 2000–2003) DC 0.69 IN 1.01 OK 1.19 ND 1.32
NJ 0.70 LA 1.03 KY 1.19 AR 1.35
NV 0.77 US 1.04 RI 1.20 VT 1.37
FL 0.77 OH 1.04 IA 1.20 NM 1.37
CA 0.83 VA 1.06 NC 1.21 KS 1.37
GA 0.89 CO 1.06 HI 1.22 WV 1.41
AZ 0.91 WA 1.07 NH 1.23 NE 1.41
DE 0.93 IL 1.07 MA 1.23 AK 1.44
TX 0.95 AL 1.09 MT 1.24 MO 1.45
MD 0.95 CT 1.13 MS 1.24 MN 1.47
PA 0.97 WI 1.15 OR 1.27 ME 1.47
UT 0.98 TN 1.17 ID 1.29 WY 1.49
SC 1.01 NY 1.17 MI 1.30 SD 1.67
Note: A value less than 1.00 means more specialist than primary care physician FTE labor inputs, and vice versa. Source: Dartmouth Medical School, Center for the Evaluative Clinical Sciences, “The Care of Patients with Severe Chronic Illness,” 2006.
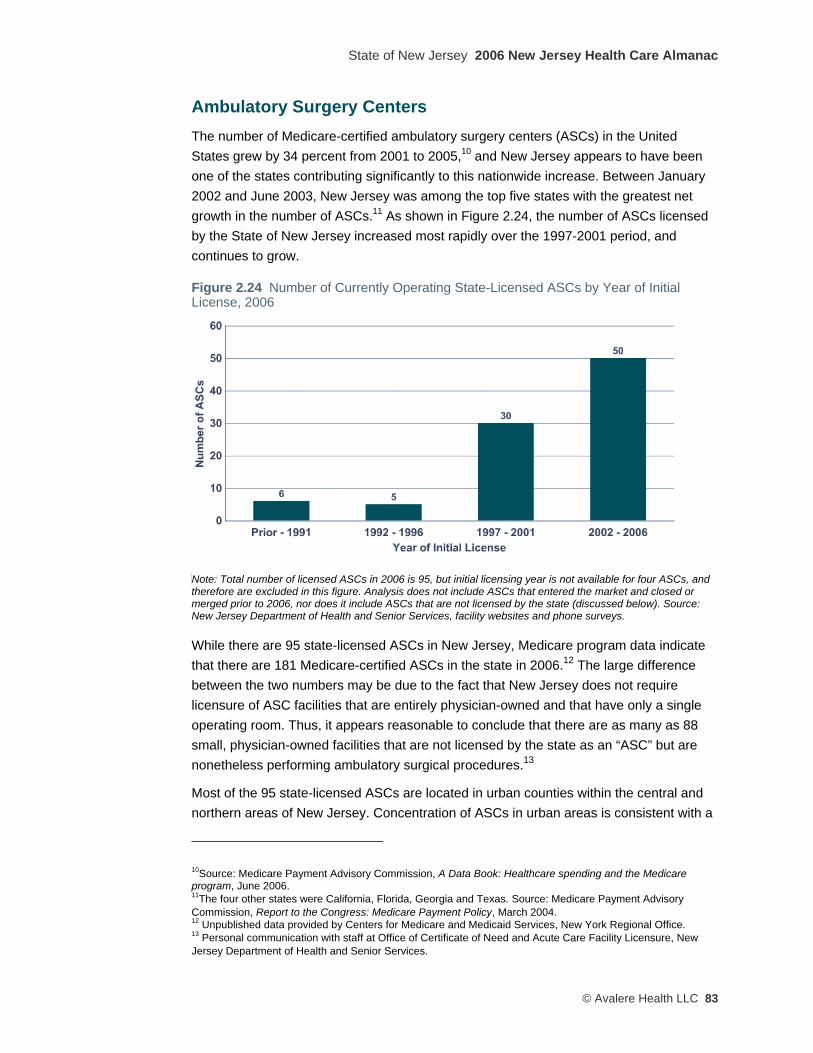
State of New Jersey 2006 New Jersey Health Care Almanac
© Avalere Health LLC 83
Ambulatory Surgery Centers The number of Medicare-certified ambulatory surgery centers (ASCs) in the United States grew by 34 percent from 2001 to 2005,10 and New Jersey appears to have been one of the states contributing significantly to this nationwide increase. Between January 2002 and June 2003, New Jersey was among the top five states with the greatest net growth in the number of ASCs.11 As shown in Figure 2.24, the number of ASCs licensed by the State of New Jersey increased most rapidly over the 1997-2001 period, and continues to grow.
Figure 2.24 Number of Currently Operating State-Licensed ASCs by Year of Initial License, 2006
Note: Total number of licensed ASCs in 2006 is 95, but initial licensing year is not available for four ASCs, and therefore are excluded in this figure. Analysis does not include ASCs that entered the market and closed or merged prior to 2006, nor does it include ASCs that are not licensed by the state (discussed below). Source: New Jersey Department of Health and Senior Services, facility websites and phone surveys.
While there are 95 state-licensed ASCs in New Jersey, Medicare program data indicate that there are 181 Medicare-certified ASCs in the state in 2006.12 The large difference between the two numbers may be due to the fact that New Jersey does not require licensure of ASC facilities that are entirely physician-owned and that have only a single operating room. Thus, it appears reasonable to conclude that there are as many as 88 small, physician-owned facilities that are not licensed by the state as an “ASC” but are nonetheless performing ambulatory surgical procedures.13
Most of the 95 state-licensed ASCs are located in urban counties within the central and northern areas of New Jersey. Concentration of ASCs in urban areas is consistent with a
10Source: Medicare Payment Advisory Commission, A Data Book: Healthcare spending and the Medicare program, June 2006. 11The four other states were California, Florida, Georgia and Texas. Source: Medicare Payment Advisory Commission, Report to the Congress: Medicare Payment Policy, March 2004. 12 Unpublished data provided by Centers for Medicare and Medicaid Services, New York Regional Office. 13 Personal communication with staff at Office of Certificate of Need and Acute Care Facility Licensure, New Jersey Department of Health and Senior Services.
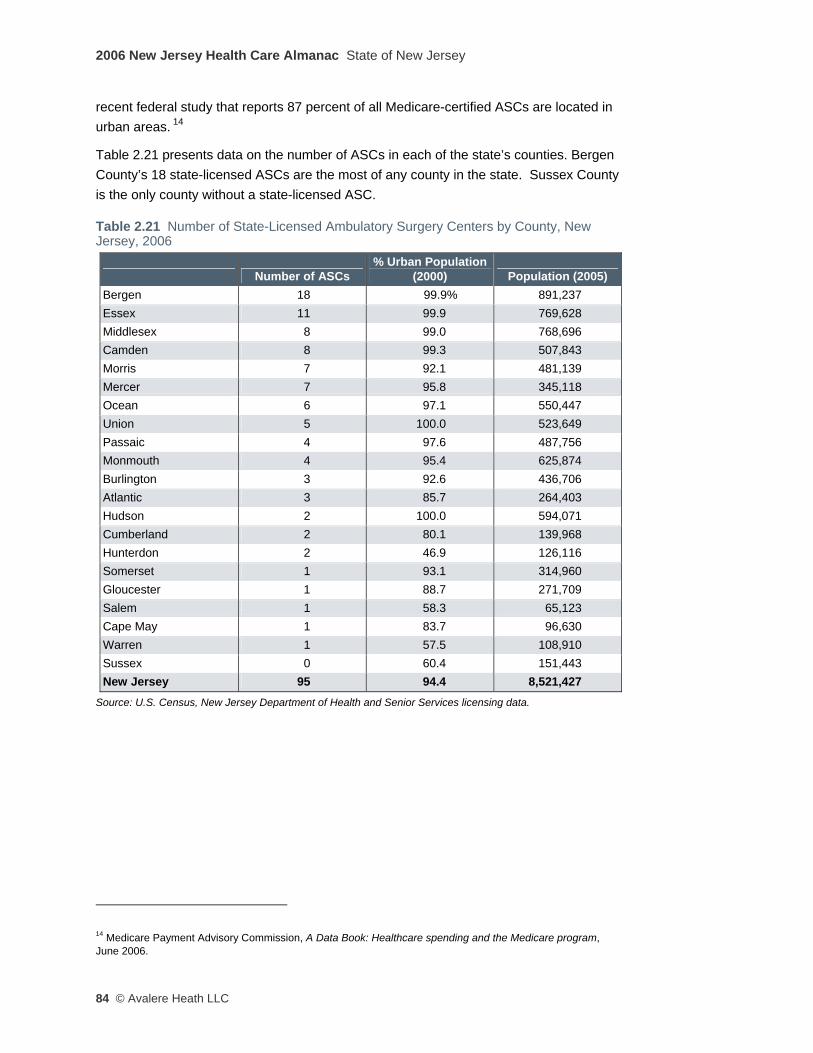
2006 New Jersey Health Care Almanac State of New Jersey
84 © Avalere Heath LLC
recent federal study that reports 87 percent of all Medicare-certified ASCs are located in urban areas. 14
Table 2.21 presents data on the number of ASCs in each of the state’s counties. Bergen County’s 18 state-licensed ASCs are the most of any county in the state. Sussex County is the only county without a state-licensed ASC.
Table 2.21 Number of State-Licensed Ambulatory Surgery Centers by County, New Jersey, 2006
Source: U.S. Census, New Jersey Department of Health and Senior Services licensing data.
14 Medicare Payment Advisory Commission, A Data Book: Healthcare spending and the Medicare program, June 2006.
Number of ASCs % Urban Population
(2000) Population (2005) Bergen 18 99.9% 891,237 Essex 11 99.9 769,628 Middlesex 8 99.0 768,696 Camden 8 99.3 507,843 Morris 7 92.1 481,139 Mercer 7 95.8 345,118 Ocean 6 97.1 550,447 Union 5 100.0 523,649 Passaic 4 97.6 487,756 Monmouth 4 95.4 625,874 Burlington 3 92.6 436,706 Atlantic 3 85.7 264,403 Hudson 2 100.0 594,071 Cumberland 2 80.1 139,968 Hunterdon 2 46.9 126,116 Somerset 1 93.1 314,960 Gloucester 1 88.7 271,709 Salem 1 58.3 65,123 Cape May 1 83.7 96,630 Warren 1 57.5 108,910 Sussex 0 60.4 151,443 New Jersey 95 94.4 8,521,427

State of New Jersey 2006 New Jersey Health Care Almanac
© Avalere Health LLC 85
Table 2.22 Percent Change in Ambulatory Same Day Surgeries from 2003–2005
Region Hospital Ambulatory Same-Day Surgeries1
Claims Paid for All Ambulatory Same-Day Surgeries2
Bergen-Passaic 5.2% 34.3%
Essex-Union 0.6% 18.2%
Monmouth-Ocean 6.1% 11.1%
Middlesex-Somerset 5.7% 27.5%
Burlington-Camden 2.6% 24.9%
Morris-Sussex -9.7% 16.1%
Hudson -10.6% 46.9%
Cumberland-Gloucester-Salem -0.6% 15.3%
Atlantic-Cape May -3.3% 17.7%
Mercer -10.3% 38.4%
Hunterdon-Warren 20.0% 0.9%
New Jersey 0.8% 22.5%
Source 1: Avalere Health analysis of the New Jersey Department of Health and Senior Services Quarterly Inpatient Utilization Report (also known as the B-2 Report). Source 2: Avalere Health analysis of Horizon Blue Cross Blue Shield of New Jersey paid claims data. Data for “same-day surgeries” include procedures performed at all facilities, including hospital outpatient departments and ambulatory surgery centers.
Table 2.22 presents an analysis of paid claims data for ASC procedures covered by Horizon Blue Cross Blue Shield in 2003 and 2005. It suggests that the rate of growth in hospital-based surgical procedures has lagged behind the growth in the volume of those procedures performed in freestanding ASCs. Stakeholder interviews support these data: more and more same day surgeries are migrating out of the hospital and into freestanding facilities.
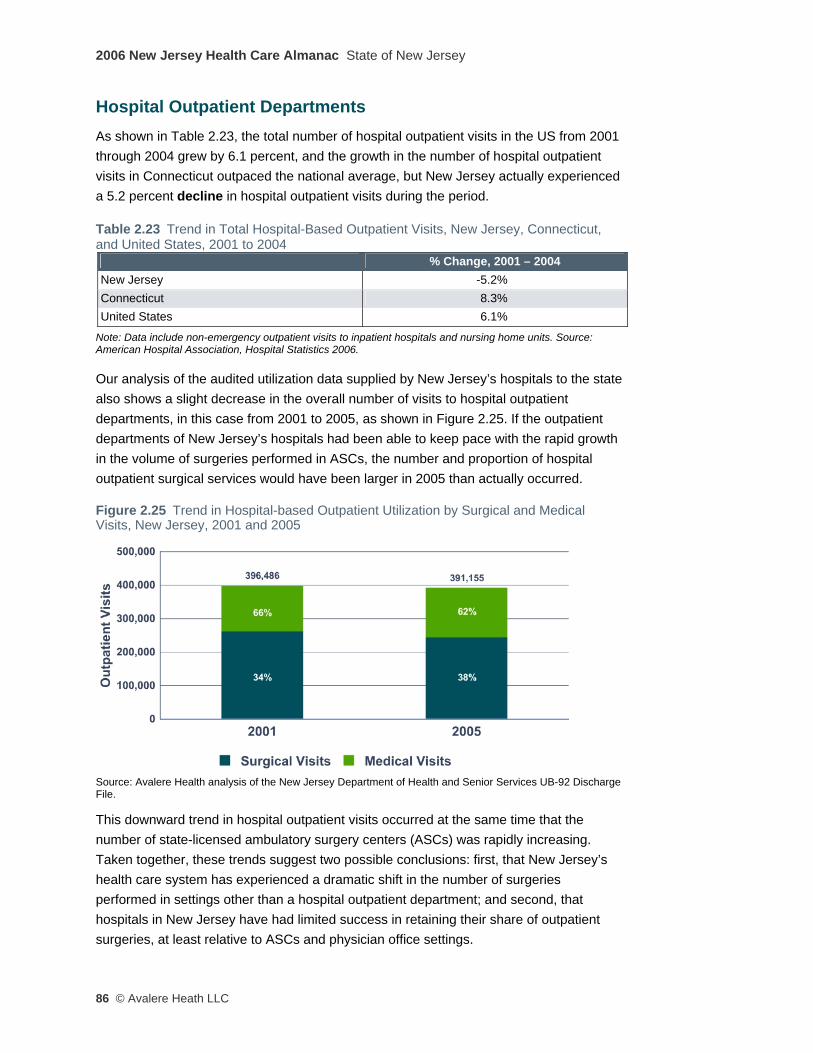
2006 New Jersey Health Care Almanac State of New Jersey
86 © Avalere Heath LLC
Hospital Outpatient Departments As shown in Table 2.23, the total number of hospital outpatient visits in the US from 2001 through 2004 grew by 6.1 percent, and the growth in the number of hospital outpatient visits in Connecticut outpaced the national average, but New Jersey actually experienced a 5.2 percent decline in hospital outpatient visits during the period. Table 2.23 Trend in Total Hospital-Based Outpatient Visits, New Jersey, Connecticut, and United States, 2001 to 2004
Note: Data include non-emergency outpatient visits to inpatient hospitals and nursing home units. Source: American Hospital Association, Hospital Statistics 2006.
Our analysis of the audited utilization data supplied by New Jersey’s hospitals to the state also shows a slight decrease in the overall number of visits to hospital outpatient departments, in this case from 2001 to 2005, as shown in Figure 2.25. If the outpatient departments of New Jersey’s hospitals had been able to keep pace with the rapid growth in the volume of surgeries performed in ASCs, the number and proportion of hospital outpatient surgical services would have been larger in 2005 than actually occurred.
Figure 2.25 Trend in Hospital-based Outpatient Utilization by Surgical and Medical Visits, New Jersey, 2001 and 2005
Source: Avalere Health analysis of the New Jersey Department of Health and Senior Services UB-92 Discharge File.
This downward trend in hospital outpatient visits occurred at the same time that the number of state-licensed ambulatory surgery centers (ASCs) was rapidly increasing. Taken together, these trends suggest two possible conclusions: first, that New Jersey’s health care system has experienced a dramatic shift in the number of surgeries performed in settings other than a hospital outpatient department; and second, that hospitals in New Jersey have had limited success in retaining their share of outpatient surgeries, at least relative to ASCs and physician office settings.
% Change, 2001 – 2004 New Jersey -5.2% Connecticut 8.3% United States 6.1%

State of New Jersey 2006 New Jersey Health Care Almanac
© Avalere Health LLC 87
There was considerable variation among regions in the change in the number of hospital-based outpatient visits from 2001 to 2005 reveals, as shown in Table 2.24 (on the next page). The Burlington-Camden region had the greatest absolute increase in hospital outpatient visits of any region, with nearly 5,000 more visits in 2005 than in 2001 (a 15.1 percent increase). The Hunterdon-Warren region experienced the largest percentage increase (51.8 percent), partly due to the relatively small total number of visits in this relatively rural, but rapidly growing, region. Table 2.24 Trend in Total Hospital-Based Outpatient Visits, by New Jersey Region, 2001 and 2005
Source: Avalere Health analysis of the New Jersey Department of Health and Senior Services UB-92 Discharge File.
Diagnostic Imaging Centers As shown in Figure 2.26, New Jersey has experienced large growth in the number of freestanding imaging centers in the state. In addition to hospitals, residents could receive diagnostic imaging services, including MRIs, CT scans, and PET scans, in 265 facilities across the state in 2006. This constitutes a 157 percent absolute increase from 2001, and a 140 percent increase when measured on a per capita basis.
2001 2005 % Change Bergen-Passaic 78,432 81,586 4.0% Essex-Union 78,723 73,799 -6.3% Ocean-Monmouth 40,612 42,722 5.2% Middlesex-Somerset 48,122 48,364 0.5% Burlington-Camden 32,256 37,142 15.1% Morris-Sussex 27,704 20,639 -25.5% Hudson 37,462 32,551 -13.1% Cumberland-Gloucester-Salem 15,689 16,078 2.5% Atlantic-Cape may 13,518 13,354 -1.2% Mercer 17,624 15,290 -13.2% Warren-Hunterdon 6,344 9,630 51.8% New Jersey 396,486 391,155 -1.3%
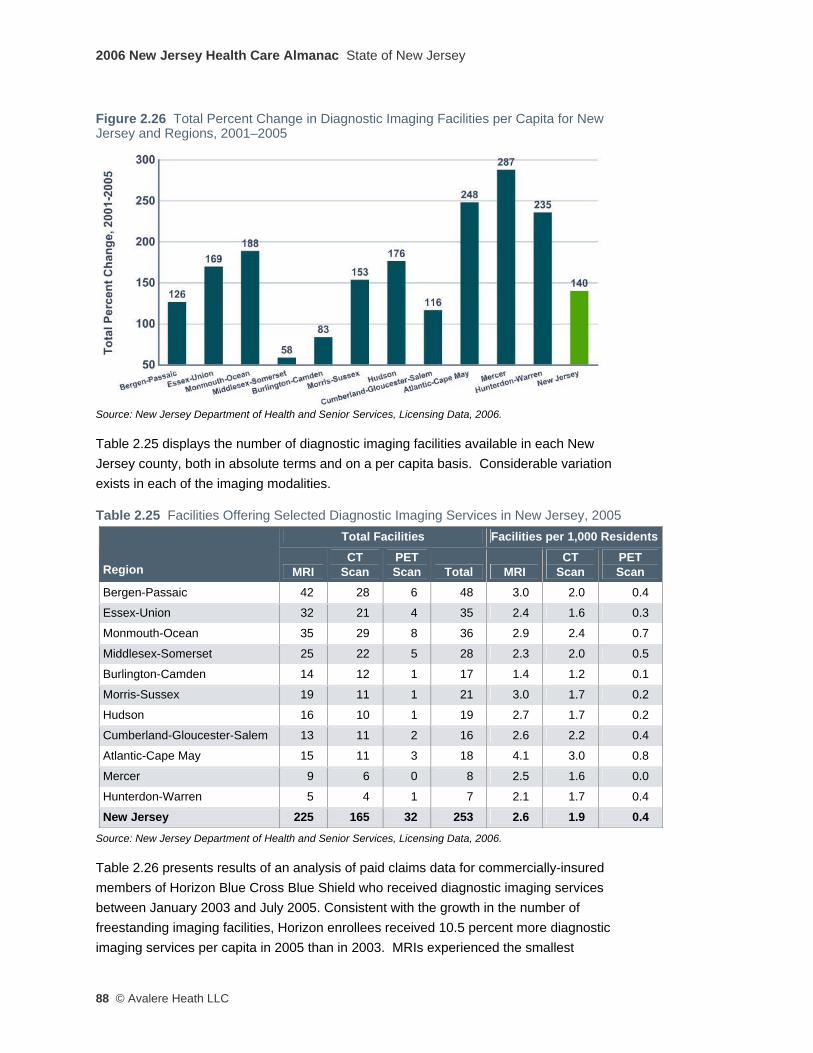
2006 New Jersey Health Care Almanac State of New Jersey
88 © Avalere Heath LLC
Figure 2.26 Total Percent Change in Diagnostic Imaging Facilities per Capita for New Jersey and Regions, 2001–2005
Source: New Jersey Department of Health and Senior Services, Licensing Data, 2006.
Table 2.25 displays the number of diagnostic imaging facilities available in each New Jersey county, both in absolute terms and on a per capita basis. Considerable variation exists in each of the imaging modalities.
Table 2.25 Facilities Offering Selected Diagnostic Imaging Services in New Jersey, 2005 Total Facilities Facilities per 1,000 Residents
Region MRI CT
Scan PET Scan Total MRI
CT Scan
PET Scan
Bergen-Passaic 42 28 6 48 3.0 2.0 0.4
Essex-Union 32 21 4 35 2.4 1.6 0.3
Monmouth-Ocean 35 29 8 36 2.9 2.4 0.7
Middlesex-Somerset 25 22 5 28 2.3 2.0 0.5
Burlington-Camden 14 12 1 17 1.4 1.2 0.1
Morris-Sussex 19 11 1 21 3.0 1.7 0.2
Hudson 16 10 1 19 2.7 1.7 0.2
Cumberland-Gloucester-Salem 13 11 2 16 2.6 2.2 0.4
Atlantic-Cape May 15 11 3 18 4.1 3.0 0.8
Mercer 9 6 0 8 2.5 1.6 0.0
Hunterdon-Warren 5 4 1 7 2.1 1.7 0.4
New Jersey 225 165 32 253 2.6 1.9 0.4
Source: New Jersey Department of Health and Senior Services, Licensing Data, 2006.
Table 2.26 presents results of an analysis of paid claims data for commercially-insured members of Horizon Blue Cross Blue Shield who received diagnostic imaging services between January 2003 and July 2005. Consistent with the growth in the number of freestanding imaging facilities, Horizon enrollees received 10.5 percent more diagnostic imaging services per capita in 2005 than in 2003. MRIs experienced the smallest
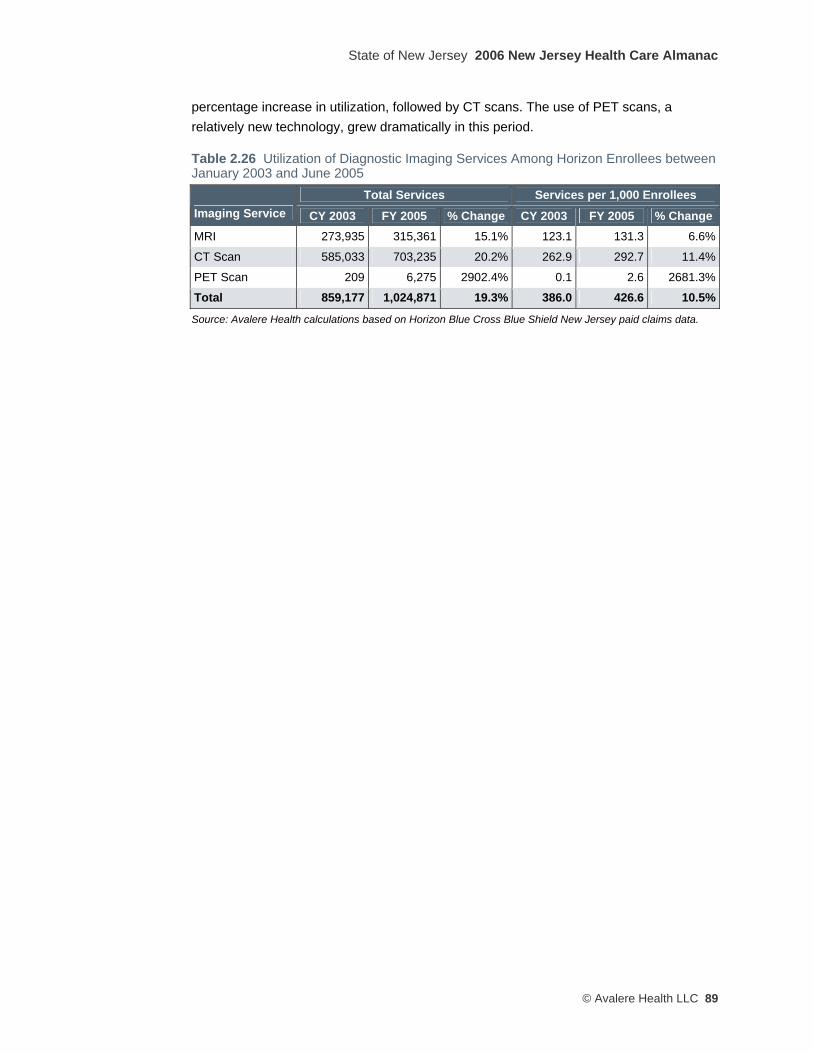
State of New Jersey 2006 New Jersey Health Care Almanac
© Avalere Health LLC 89
percentage increase in utilization, followed by CT scans. The use of PET scans, a relatively new technology, grew dramatically in this period.
Table 2.26 Utilization of Diagnostic Imaging Services Among Horizon Enrollees between January 2003 and June 2005
Total Services Services per 1,000 Enrollees Imaging Service CY 2003 FY 2005 % Change CY 2003 FY 2005 % Change MRI 273,935 315,361 15.1% 123.1 131.3 6.6%
CT Scan 585,033 703,235 20.2% 262.9 292.7 11.4%
PET Scan 209 6,275 2902.4% 0.1 2.6 2681.3%
Total 859,177 1,024,871 19.3% 386.0 426.6 10.5%
Source: Avalere Health calculations based on Horizon Blue Cross Blue Shield New Jersey paid claims data.

2006 New Jersey Health Care Almanac State of New Jersey
90 © Avalere Heath LLC
Long-Term Care As shown in Table 2.27, the supply of nursing facilities and beds in New Jersey has remained largely unchanged since 2001. Compared to Connecticut and the U.S. overall, New Jersey has more independent and fewer chain-affiliated nursing facilities. Almost two-thirds of the patients in New Jersey nursing facilities are Medicaid beneficiaries, though that percentage has declined slightly over the last five years.
Table 2.27 Nursing Facility Control and Ownership in New Jersey, Connecticut, and the US, 2001 and 2006
Nursing Facility Control Nursing Facility Ownership
# of
Facilities
% in Multifacility
Chain %
Independent
% Hospital-
Based % For-Profit
% Nonprofit
% Government
2001
New Jersey 359 41.0% 59.1% 6.4% 62.4% 32.3% 5.3%
Connecticut 254 51.2% 48.8% 2.0% 76.4% 22.8% 0.8%
US 16,605 55.9% 44.1% 11.5% 65.1% 28.6% 6.4%
2006
New Jersey 361 36.6% 63.4% 4.2% 64.5% 29.6% 5.8%
Connecticut 245 46.5% 53.5% 1.2% 76.7% 22.4% 0.8%
US 15,933 52.2% 47.8% 8.6% 66.1% 27.9% 6.0%
Source: American Health Care Association (AHCA).
According to informed stakeholder interviews, the LTC industry has concentrated on building mostly private-pay assisted living facilities over the past five years, primarily driven by the more profitable business model of these facilities. While New Jersey’s Medicaid program has allowed payments to assisted living facilities for a number of years, uptake reportedly has been limited because of restrictions (required by federal Medicaid policy) on the types of patients who would meet the clinical criteria for care in an assisted living setting.
Stakeholders also indicated that New Jersey nursing facilities are slowly starting to decrease their Medicaid (low-income) patient caseloads and increase their Medicare (elderly) patient caseloads. This observation is borne out by state-level payer-mix data presented in Table 2.28 (on the next page), which shows that the percentage of patients in New Jersey nursing homes with Medicare coverage increased from 11 percent in 2001 to 16 percent in 2005. This patient-mix change likely is occurring in response to reimbursement changes in Medicare (higher payments for higher-acuity patients) and in New Jersey’s Medicaid program (stagnant payment rates over the past five years, largely due to state budget constraints).

State of New Jersey 2006 New Jersey Health Care Almanac
© Avalere Health LLC 91
Table 2.28 Nursing Facility Occupancy Rate and Patients by Payer, 2001 and 2006
Nursing Facility State Occupancy Rate and
Median Facility Occupancy Rate for Certified Beds Nursing Facility Patients by Payer
# of
Patients
# of Certified
Beds
State Occupancy
Rate
Median Facility Occupancy
Rate Total
Patients Medicare Medicaid Other 2001
New Jersey 44,841 50,769 88.3% 91.7% 44,841 11.4% 66.5% 22.0%
Connecticut 29,042 31,001 93.7% 95.4% 29,166 12.8% 66.1% 21.1%
US 1,456,499 1,695,446 85.9% 88.2% 1,460,882 9.6% 66.9% 23.5%
2006
New Jersey 45,368 51,478 88.1% 90.9% 45,368 16.5% 64.1% 19.4%
Connecticut 27,564 29,762 92.6% 94.4% 27,564 16.6% 65.3% 18.1%
US 1,430,645 1,675,142 85.4% 88.8% 1,432,864 13.2% 65.2% 21.6%
Source: American Health Care Association (AHCA).
Growth in alternatives to nursing home-based long-term care is on the rise nationally, for both the elderly and for persons with physical disabilities. New federal Medicaid policies, enacted in the Deficit Reduction Act of 2005, increase states’ flexibility to waive federal restrictions, to increase the use of home- and community-based services in Medicaid programs, and to limit use of institutionally-based care to the frailest and the sickest.
Interviewed stakeholders with LTC expertise expressed the view that New Jersey lagged behind other states of similar size and complexity in its availability of Medicaid-funded home health and home and community-based LTC alternatives. These impressions are supported by the analyses presented in Tables 2.29, 2.30, and 2.31, which compare the amounts of Medicaid resources devoted by New Jersey and Connecticut or New York for funding the major alternatives to institution-based LTC services: home health services, personal care services (typically non-medical support with activities of daily living, such as bathing, eating, and dressing), and various home and community-based services funded through the federal Medicaid 1915(c) waiver authority.
Table 2.29 Comparison of Medicaid Home Health Expenditures, 2002 Connecticut New Jersey United States
Total Medicaid home health expenditures, 2002 $159,091,638 $35,800,000 $2,984,156,736
Total number of Medicaid home health recipients, 2002 22,143 10,219 729,517
Medicaid home health expenditures per recipient, 2002 $7,185 $3,503 $4,091
Source: Kaiser Family Foundation, statehealthfacts.org, accessed at http://www.statehealthfacts.org/cgi-bin/healthfacts.cgi?.
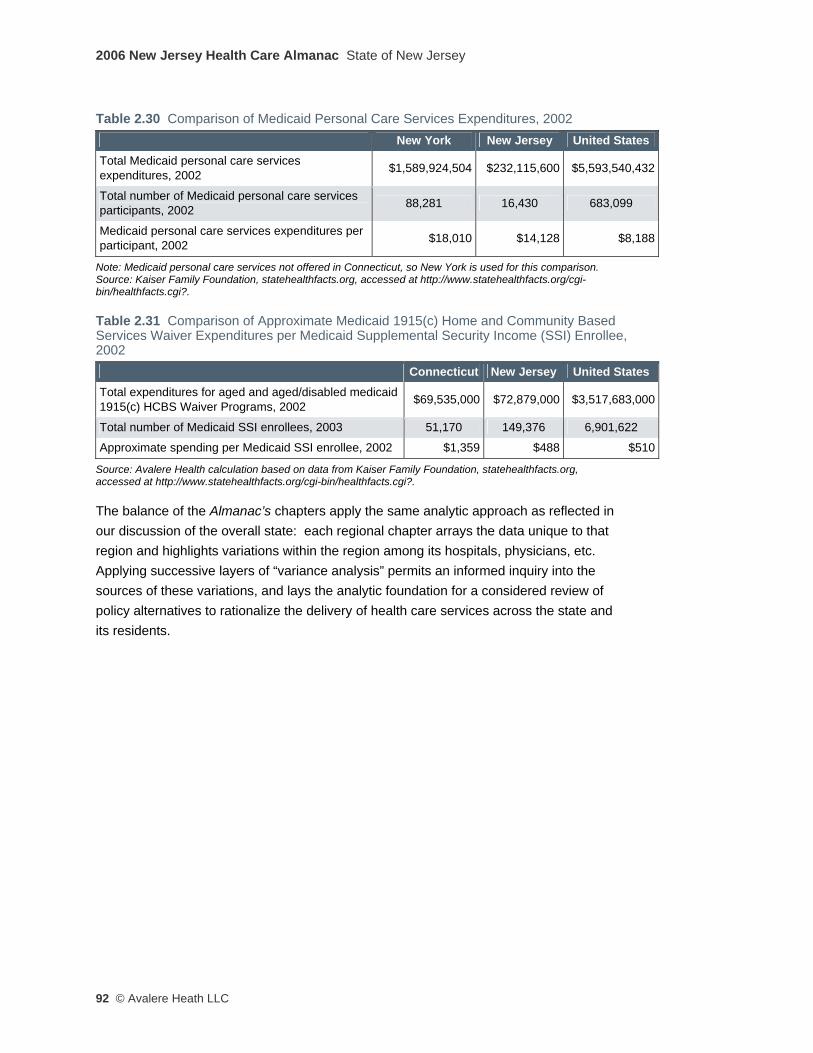
2006 New Jersey Health Care Almanac State of New Jersey
92 © Avalere Heath LLC
Table 2.30 Comparison of Medicaid Personal Care Services Expenditures, 2002 New York New Jersey United States
Total Medicaid personal care services expenditures, 2002 $1,589,924,504 $232,115,600 $5,593,540,432
Total number of Medicaid personal care services participants, 2002 88,281 16,430 683,099
Medicaid personal care services expenditures per participant, 2002 $18,010 $14,128 $8,188
Note: Medicaid personal care services not offered in Connecticut, so New York is used for this comparison. Source: Kaiser Family Foundation, statehealthfacts.org, accessed at http://www.statehealthfacts.org/cgi-bin/healthfacts.cgi?.
Table 2.31 Comparison of Approximate Medicaid 1915(c) Home and Community Based Services Waiver Expenditures per Medicaid Supplemental Security Income (SSI) Enrollee, 2002
Connecticut New Jersey United States Total expenditures for aged and aged/disabled medicaid 1915(c) HCBS Waiver Programs, 2002 $69,535,000 $72,879,000 $3,517,683,000
Total number of Medicaid SSI enrollees, 2003 51,170 149,376 6,901,622
Approximate spending per Medicaid SSI enrollee, 2002 $1,359 $488 $510
Source: Avalere Health calculation based on data from Kaiser Family Foundation, statehealthfacts.org, accessed at http://www.statehealthfacts.org/cgi-bin/healthfacts.cgi?.
The balance of the Almanac’s chapters apply the same analytic approach as reflected in our discussion of the overall state: each regional chapter arrays the data unique to that region and highlights variations within the region among its hospitals, physicians, etc. Applying successive layers of “variance analysis” permits an informed inquiry into the sources of these variations, and lays the analytic foundation for a considered review of policy alternatives to rationalize the delivery of health care services across the state and its residents.


Funding for the 2006 New Jersey Health Care Almanac was provided by a grant from the robert Wood Johnson Foundation and by Horizon Blue Cross Blue Shield of New Jersey.
www.rwjf.orgwww.horizon-bcbsnj.com
Photography © Walter Choroszewski, All rights reserved Avalere Health llC1350 Connecticut Avenue NW, Suite 900Washington, DC 20036www.avalerehealth.net

1350 Connecticut Avenue NWSuite 900Washington, DC 20036
www.avalerehealth.net
2006 NeW JerSey HeAltH CAre AlmANAC
November 2006
20
06
Ne
W J
er
Se
y H
eA
ltH
CA
re
Al
mA
NA
CA
vA
le
re
He
Alt
H l
lC