2006 q3 presentation brsa - garantibbvainvestorrelations.com€¦ · corporate strategy, business...
TRANSCRIPT

BRSA Earnings Presentation
September 30, 2006
Another record earnings quarter regardless of changes in the market conditions

Corporate Strategy, Business Development and Investor Relations2
Performance Highlights
• Total assets 47.5 billion YTL, YTD growth 30.4%
• Consistently growing IEAs now constitute 91.6% of total assets
• YTD cash loan growth 55.0%, 25.9 billion YTL
• Share of performing loans in assets increasing, 54.5% whereas share of securities* at 27.7%
• YTD deposit growth 27.4% with demand deposits share in total deposits at 22.9%
• Y-o-Y net income growth 50.4%, 790.6 million YTL. EPS: 376 YTL as of Q3 06.
• Highest quarterly earnings ever -- 9.4% growth over H106.
• Customer driven sources of revenue reached 79.5% of ordinary banking income
• Net fees and commissions y-o-y growth 41.3% contributing to 44.5% of ordinary banking
income and covering 74.0% of adj. operating expenses
• Consistently improving profitability maintained
ROAA 2.51%, ROAE 25.5%, Adj. Cost/Income 51.0%
* Excluding shareholdings
Corporate Strategy, Business Development and Investor Relations3
Profitability – Consistent Growth Performance EP
SYT
L
123134
119
Q1 06 Q2 06 Q3 06
RO
AA
2.45% 2.51%2.39%
30.09.05 30.06.06 30.09.06
RO
AE
26.0% 25.5%
20.6%
30.09.05 30.06.06 30.09.06
53.5% 51.0%54.0%
30.09.05 30.06.06 30.09.06
Adj
. Cos
t / In
com
e
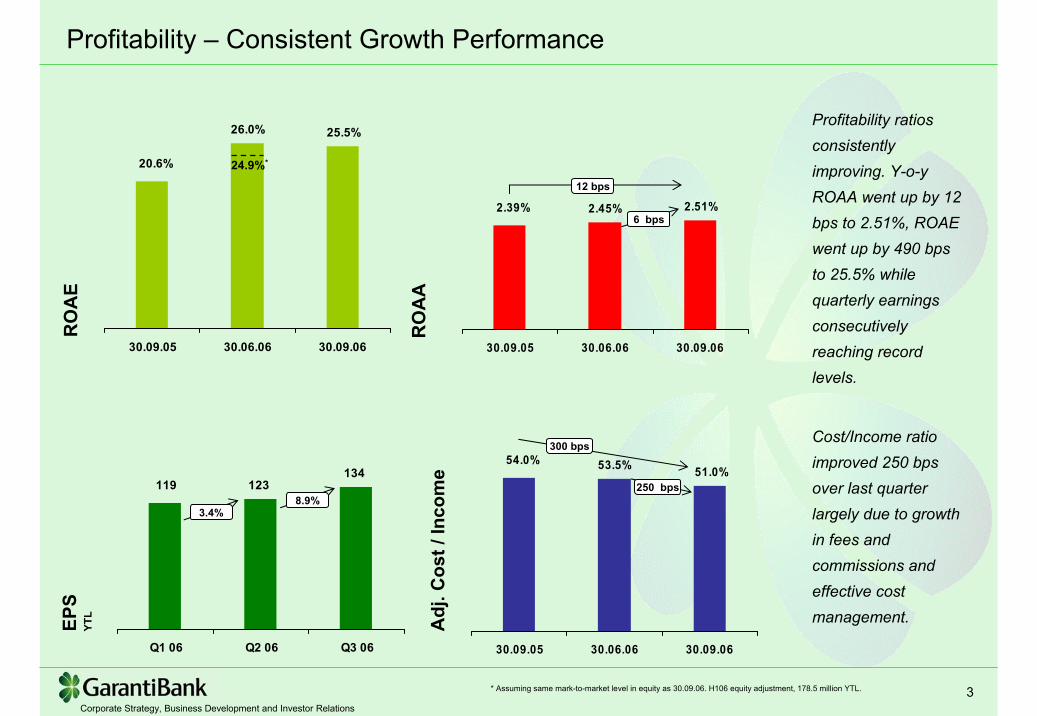
Profitability ratios consistently improving. Y-o-yROAA went up by 12 bps to 2.51%, ROAE went up by 490 bps to 25.5% while quarterly earnings consecutively reaching record levels.
Cost/Income ratio improved 250 bpsover last quarterlargely due to growth in fees and commissions and effective cost management.
12 bps
6 bps
8.9%
* Assuming same mark-to-market level in equity as 30.09.06. H106 equity adjustment, 178.5 million YTL.
24.9%*
3.4%
300 bps
250 bps

Corporate Strategy, Business Development and Investor Relations4
Balance Sheet - Summary
104.2%3,9941,956Repos
27.4%28,91822,695Deposits
12.5%2,6412,347Other
37.0%7,5515,513Borrowings
12.4%4,3823,900Shareholders’ Equity
30.4%47,48636,411Total Assets
3.9%3,8423,699Other
30.4%47,48636,411Total Liabilities & SHE
-14.4%1,7662,064Fixed Assets & Subsidiaries
55.0%25,88216,700Performing Loans
20.8%13,23610,954Securities
-7.8%2,7602,994Cash & Banks
% Change30.09.0631.12.05(YTL million)
Liab
ilitie
s an
d SH
EA
sset
s

Corporate Strategy, Business Development and Investor Relations5
47.546.7
38.836.4
32.3
30.09.05 31.12.05 31.03.06 30.06.06 30.09.06
"
Asset Growth & CompositionA
sset
Gro
wth
YTL
Bill
ion
Ass
et C
ompo
sitio
n
31.12.0530.09.05 30.09.06
1 IEAs exclude shareholdings
1.7%
Assets reached 47.5 billion YTL. YTD asset growth was 30.4%.
IEAs constitute 91.6% of total assets. The growth in TL IEA’s was faster than FC shifting the TL/FC weight to TL (51.3%)
Other IEA's 9.4%
Non IEA's 8.4%
Loans 54.5%
Securities 27.7%
Other IEA's 13.4%
Non IEA's 10.7%
Loans 45.9%
Securities 30.0%
IEA’s 87.3%1
TL: 46.9% FC: 53.1%
IEA’s 89.3%1
TL: 48.9% FC: 51.1%
IEA’s 91.6%1
TL: 51.3% FC: 48.7%
46.9%30.4%
Other IEA's 11.1% Non IEA's
12.7%
Loans 44.9%
Securities 31.3%
20.3%6.6%

Corporate Strategy, Business Development and Investor Relations6
Securities Portfolio Po
rtfo
lio –
Secu
ritie
s/A
sset
sYT
L B
illio
n
10.111.5
13.212.9
11.0
27.6%
29.6% 27.7%30.0%31.1%
30.09.05 31.12.05 31.03.06 30.06.06 30.09.06Securities Securities/Assets
Although YTD securities portfolio increased by 20.7%, its share in assets decreased by 230 bps to 27.7%.
FRNs constitute the majority of the securities portfolio.
61% of securities are TL and of that 69.2% are FRNs.
Trading2.9%
AFS 79.4%
HTM17.7%
Bre
akdo
wn
of S
ecur
ities
Trading0.3%
AFS 55.4%
HTM44.3%
TL Portfolio YTL8.0 bl.
FC Portfolio US$3.5 bl.
30.8% 69.2%Fixed: FRN:
61.8% 38.2%Fixed: FRN:
2.3%
31.0%20.7%
12.1%5.3%

Corporate Strategy, Business Development and Investor Relations7
1.8%
1.4%1.4%
0.6%
3.1%2.7%
1.9%
0.7%
Q3 05 2005 H1 06 Q3 06
Provisioned NPL Unprovisioned NPL
76.0%73.7%
66.8%67.8%
NPL Coverage
Total Loans - Growth & Improving Quality
15.3% 16.0% 16.3% 16.3%
23.0% 19.5% 17.4% 17.3%
9.9% 10.6% 11.0% 10.9%
33.6% 32.7% 33.3% 32.5%
18.2% 21.2% 22.0% 23.0%
31.12.05 31.03.06 30.06.06 30.09.06
Consumer Credit Cards SME Commercial Corporate
Loan
Gro
wth
& M
arke
t Sh
ares
, YTL
Bill
ion
Loan
s by
LO
B
NPL
Rat
io &
Cov
erag
e
25.925.0
20.4
16.714.5
13.3%
11.3% 11.5%
12.8%13.2%
30.09.05 31.12.05 31.03.06 30.06.06 30.09.06
Market Shares
4.1%
2.6%
4.5%
YTD total loan growth 55.0%. Loan volume growth dropped to low single digits in the 3rd quarter due to change in market conditions.
Garanti managed to grab another 10 bps market share reaching 13.3% share in total lending.
In this period, NPL ratio improved to 2.4%, factor of recoveries and write-offs. The increase in the coverage ratio mainly is a function of lower NPL’s.
3.4%
78.2%55.0%
2.4%
22.5%
22.3%

Corporate Strategy, Business Development and Investor Relations8
8.27.8
5.15.7
7.0
21.1%20.2%19.7%
18.0%17.2%
Q3 05 2005 Q1 06 H1 06 Q3 06
TL L
oan
Com
posi
tion
Q3
06
Other 7.7%
Project Finance
8.4%Consumer
Loans 5.5%
Export Loans 15.7%
Working Capital 62.7%
TL – FC Loan Growth, Market Share and Composition
FC L
oan
Com
posi
tion
Q3
06
General Purpose
35.1%Auto Loans 51.4%
Housing Loans 13.5%
TL L
oan
Gro
wth
YTL
Bill
ion
FC L
oan
Gro
wth
U
S$
Bill
ion
13.812.9
7.89.2
11.1
10.0%9.9%9.9%
8.8%8.8%
Q3 05 2005 Q1 06 H1 06 Q3 06
Market Shares
Credit Cards 31.5%
Commercial Overdraft
10.9%
Commercial Installment
Loans14.6%
General Purpose
11.3%
Other 5.3%
Auto Loans 8.1%Housing
Loans 18.3%
76.8%51.0%
61.2%44.1%
4.9%11.2%
23.5%
7.3%15.8%
21.5%

Corporate Strategy, Business Development and Investor Relations9
1.52.1 2.5
0.8
0.91.1
0.9
1.1
1.4
1.0
2.50.6
1.1
0.6
1.6
30.09.05 31.12.05 31.03.06 30.06.06 30.09.06
Housing Auto General Purpose
Consumer LoansM
arke
t Sha
res
Q3
06 –
Gro
wth
ove
r 20
05141.1%
Con
sum
er L
oans
YTL
Bill
ion
+48 bps11.7%Total Consumer Loans
+71 bps 8.5%General Purpose
+327 bps18.0%Auto Loans
-17 bps12.2%Housing Loans
YTD, the growth in consumer lending was 61.7% reflected as a market share gain of 48 bps reaching 11.7% share in consumer lending.
30.8%35.7%
Housing Loans
12.4%24.6%General
Purpose Loans
3.0%17.2%
Auto Loans
Gro
wth
Rat
es
Q106 Q3 06
2.8%2.4%
7.4%12.2%
-4.7%0.0%
26.2%19.0%
27.9%25.5%
8.5%19.0%
Q2 06

Corporate Strategy, Business Development and Investor Relations10
3,3324,166Per Card
Spending(Annualized)
Credit Cards – Leading Market Position (#2)
4,5935,056 5,028
5,852 6,113
5,4395,2285,0615,007
4,663
Q3 05 Q4 05 Q1 06 Q2 06 Q3 06
Issuing volume No. Of Credit Cards
31.2%16.8%Credit Card Balances
16.6%8.6%Credit Cards Number
YOYYTDGrowth in:
Garanti
Sector
YTL, Q3 06
Cre
dit C
ards
YTL
Milli
on
+40 bps8.6%ATM
+111 bps14.8%POS
+ 65 bps 17.4%Credit Cards
+113 bps21.7%Issuing
+194 bps21.9%Acquiring
Mar
ket S
hare
sQ
3 06
-G
row
th o
ver 2
005
Credit card portfolio growth was 16.8% YTD and 31.2% over the same period last year.
YTD acquiring volume market share increased by a hefty 194 bps.
The YTD increase in number of credit cards was 8.6%.

Corporate Strategy, Business Development and Investor Relations11
Deposits60.9%
SHE 9.2%
Repos 8.4%
F. Borrowed 15.9%
Other 5.6%
Demand 13.9%
Time 47.0%
Liabilities & SHE Composition – Strong Funding Capability
Main source of funding:
Solid deposit base (60.9% of liabilities and SHE)
YTD deposit growth 27.4% with a favorable deposit mix. Demanddeposits constitute 22.9% of total deposits and reducethe cost of deposits on a blended basis by 250 bps in TL and 110bps in FC deposits. YTDgrowth in demand deposits was 21.1%.
Liab
ility
& S
HE
Com
posi
tion
30.0
9.06
Dep
osit
Gro
wth
& T
L/FC
Mix
YTL
Bill
ion
52.3%55.2%51.4%51.7%
48.9%
47.7%44.8%
48.6%48.3%
51.1%
30.09.05 31.1205 31.03.06 30.06.06 30.09.06
TL FC
28.9
27.024.8
20.1
Dem
and
Dep
. Gro
wth
Cos
t of D
epos
itsC
umul
ativ
e
15.5% 16.3%
13.2% 13.8%
4.4%3.3%
17.4%
22.9%
19.3%
14.5%
4.3%4.0%2.8%
3.2%3.0%2.1%
2004 2005 H1 06 Q3 06
TL Time TL Blended FC Time FC Blended
6.7 6.6
5.95.5 5.3
12.3%11.9%11.5%10.9%11.3%
30.09.05 31.12.05 31.03.06 30.06.06 30.09.06
Market Shares
-0.9%
12.6%21.1%
44.0%27.4%
9.1%
25.9%-2.9%
22.7 9.2%7.0%

Corporate Strategy, Business Development and Investor Relations12
Total Customer Funds – Changing Composition
*Excluding bank deposits
30.09.05Repo 3.8%
AUM 6.4%TL Deposits*
20.4%FC Deposits
19.7%T-Bills Under
Custody 49.7%
Repo 4.0%
AUM 6.7%
T-Bills Under
Custody 41.8%
TL Deposits*
25.0%
FC Deposits 22.5%
AUM 5.9%TL
Deposits* 24.5%
Repo 7.3%
T-Bills Under
Custody 36.6%
FC Deposits 25.7%
31.12.05 30.09.06
Cus
tom
er F
unds
YTL
Bill
ion
54.4
49.648.348.5
30.09.05 31.12.05 30.06.06 30.09.06
9.6%
12.1%
Cus
tom
er F
und
Com
posi
tion
Customer funds YTD grew by 6.1 billion YTL with a decreasing composition of T-bills under custody and growing portion of deposits & repos.Deposits now constitute 50.2% of total customer funds – an increasing shift from 40.1% level in the same period last year.
12.6%

Corporate Strategy, Business Development and Investor Relations13
683
1,598
1,915
2,464
30.09.05 31.12.05 30.06.06 30.09.06
Increasing Free Funds Fr
ee E
quity
YT
L M
illion
Free
Fun
ds*/I
EAs
YTL
Milli
on
6,557 7,0599,079
28,22932,507
42,727 43,519
8,589
20.9%21.7%23.2% 20.1%
30.09.05 31.12.05 30.06.06 30.09.06
Free Funds IEAs Free Funds / IEAs
54.2% Free equity increased by 54.2% YTD.
YTD growth of free funds was 28.6%. Free funds / IEAs stood at 20.9% level in the third quarter.
260.9%
*Free Funds: Free Equity + Demand Deposits
28.7%

Corporate Strategy, Business Development and Investor Relations14
Capital AdequacyC
AR
& T
ier 1
Rat
io
14.05%
12.08%
15.59%15.03%
10.74%
13.37%
16.87%17.71%
30.09.05 31.12.05 30.06.06 30.09.06
CAR Tier 1
Capital adequacy ratio improved by 134 bps since the first half of 2006 mainly due to the profit and improved mark-to-market.
Due to improvement in market conditions mark-to-market improved by 179 million YTL.
28,77828,096Risk Weighted Assets
1,908
3,705
4,382
791
649
800
42
2,100
30.09.06
3,910Shareholders’ Equity
509Retained Earnings & Current Period Profit
652Total Reserves
786Other Revaluation Funds
2,078Market Risk
-137Mark-to Market
2,100Paid in Capital
3,240Capital Base
30.06.06(YTL million)
-0.52%Loan and other RWA
0.33%FX Rate Effect
-6931. FX Rate Effect
0.06%Value at Risk Effect
0.64%Mark-to Market Effect
1,2062. Increase in Assets
(Business Growth)
0.83%Profit and Other Capital Effect
1.34%CAR Variance Q3 – Q2 06
513Risk Weighted Assets Variance
Note: $/YTL value at 30.06.06: 1.5650, at 30.09.06: 1.4800

Corporate Strategy, Business Development and Investor Relations15
Income Statement – Summary and FX-Adjustments
n.m.232,933811,141n.m.1,369,350672,851Non-Interest Income
n.m.72,546(491,104)n.m.(405,648)98,145Net FX Gain / Loss
(7.4)448,534484,5077.31,356,6491,264,294Net Interest Income
9.5
94.6
(79.3)
(17.4)
9.7
(6.3)
% Change
257,752
(37,250)
(179,132)
474,135
(330,409)
804,544
Q206
282,097
(72,500)
(37,062)
391,659
(362,354)
754,013
Q306
50.4
(3.8)
(25.2)
13.8
14.3
14.0
% Change
(191,500)(199,150)Taxes
790,607525,693Net Income
(303,092)(404,965)Provisions
1,285,1991,129,808Operating Income
(1,035,152)(905,482)Operating Expenses
2,320,3512,035,290Total Revenues
30.09.0630.09.05(YTL thousand)
(405,648)98,145FX Gain / Loss
27,397Profit on Derivatives
(14,267)(53,002)Fx Loss on FX-indexed Loans
14,783Profit on Trading Securities
(47,069)52,793Adj. FX Gain / Loss
330,6667,650FX Gain on FX- Indexed Securities & Loans
1,048,753852,480Adj. Operating Expense
996,503665,201Adj. Non Interest Income
30.09.0630.09.05(YTL thousand)
FX A
djus
tmen
ts

Corporate Strategy, Business Development and Investor Relations16
42.8%44.5%
14.4%
11.1%
32.6%
39.4%
10.2%
5.0%
30.09.05 30.09.06
TL Loans FC Loans Securities Other
Interest Income vs Interest ExpenseIn
tere
st In
com
eYT
L M
illion
Inte
rest
Exp
ense
YTL
Milli
on
75.0%
77.9%
12.3%
11.6%
12.5%
10.1%
0.2%
0.4%
30.09.05 30.09.06
Deposits Interbank Funds Borrowed Other
3,568
2,530
2,211
1,266
41.0%
74.7%
1,357
27(406) 317
15
1,310
NIM
Net
FX
Loss
es
Net
FX
Gai
n/Lo
sson
FX-
inde
xed
Loan
s &
Secu
ritie
s
Prof
it on
Trad
ing
Secu
ritie
s
Pro
fit o
nD
eriv
ativ
es
NIM
Adj
. By
FX
Net
Inte
rest
Mar
gin
YTL
Milli
on
Net foreign exchange loss is 47.1 million YTLbringing the adjusted net interest income to 1.31 billion YTL .
The recorded net FX losses of 406 million YTL are netted against the foreign exchange gains and losses on the FX-indexed assets and the derivative financial instruments as indicated in detail in the financial note 3.5 of the interim financial statements.

Corporate Strategy, Business Development and Investor Relations17
Margins and Spreads on a Cumulative BasisSp
read
sM
argi
ns
9.23%
5.75%4.65%
2.41% 2.16%
6.13%
4.38%
2.01%
5.81%
1.91%
4.15%5.23%
TL FC Total B/S
31.12.05 31.03.06 30.06.06 30.09.06
5.66%
9.63%
6.42%
2.92% 2.71%
7.93%
5.43%
2.55%
7.70%
5.31%
2.48%
7.43%
TL FC Total B/S
31.12.05 31.03.06 30.06.06 30.09.06
Pressure on margins continued in the third quarter.
Although the rate increase on loans ignited by the volatile economy was significantly higher than the increase in funding costs, margins contracted due to short-term nature of time deposits.
In the third quarter,balance sheet spread contraction was 23 bps while margin contraction was 12 bps compared to first half 2006.
All figures are cumulative

Corporate Strategy, Business Development and Investor Relations18
Sustainable Banking IncomeO
rdin
ary
Ban
king
Inco
me
30.09.06Net Trading Income 0.2%
Adjusted NII (Sec.) 27.9%
Adjusted NII (Loans) 40.1%
Net Fees & Comm. 31.9%
30.09.05
Customer Driven 71.9%
Adjusted NII (Sec.) 15.6%
Net Trading Income 4.9%
Adjusted NII (Loans) 35.0%
Net Fees & Comm. 44.5%
Customer Driven 79.5%
Customer driven sources of income increased by 760 bps and now constitute 79.5% of ordinary banking income.
Net fees and commissions contribute 44.5% indicating the consistently increasing trend.
The contribution of net trading income increased substantially vs. the same period last year with 4.9%.

Corporate Strategy, Business Development and Investor Relations19
Fee & Commission Income Growth
n.m.483,389131,853Other Income
103.51,369,350672,851Total Non-Interest Income
n.m.46,3053,141Dividend Income
n.m.83,8642,811Trading Account Income, net
41.3755,792535,046Fees and Commissions, net
% change30.09.0630.09.05(YTL thousand)
187,480
535,046722,526 755,792
233,780
989,572
Fees & Com m iss ionsReceived
Fees & Com m iss ions Paid Net
30.09.05 30.09.06
Fees
and
Com
mis
sion
sYT
L Th
ousa
nds
37.0%
24.7%
41.3%
n.m.(26,730)466,746
(71.3)232,933811,141
(77.0)8,55237,150
n.m.(3,886)46,453
(2.2)254,997260,792
% changeQ3 06Q2 06
Cash Loans 7.1%
Non Cash Loans 6.5%
Insurance 2.4%
Money Transfer 3.3% Other Banking
Transactions 18.9%
Payment Systems 49.2%
Asset Mngt 12.6%
Fees
and
Com
mis
sion
s R
ecei
ved
Bre
akdo
wn
30.0
9.06
1 Includes gains on FX-indexed securities and loans. Please refer to page 15.
Corporate Strategy, Business Development and Investor Relations20
Effective Cost Management A
dj. O
pera
ting
Expe
nses
YTL
Milli
on
1,021852 19.8%
49.7% 48.1% 49.6% 47.8%
10.3% 11.3% 11.1% 11.2%4.2% 3.9% 4.0% 4.3%
35.8% 36.7% 35.3% 36.7%
30.09.05 30.09.06 Q2 06 Q3 06
Other Depreciation Rent Personnel
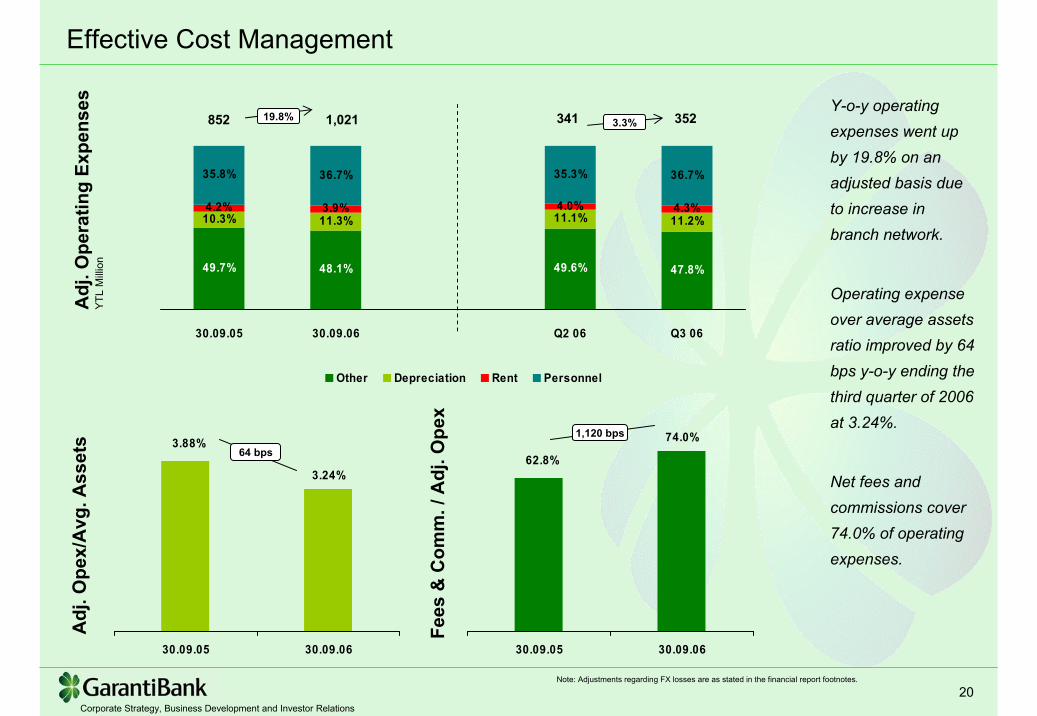
352341 3.3%Y-o-y operating expenses went up by 19.8% on an adjusted basis due to increase in branch network.
Operating expenseover average assets ratio improved by 64bps y-o-y ending the third quarter of 2006 at 3.24%.
Net fees and commissions cover 74.0% of operating expenses.
Adj
. Ope
x/A
vg. A
sset
s
3.24%
3.88%
30.09.05 30.09.06
64 bpsFe
es &
Com
m. /
Adj
. Ope
x
74.0%
62.8%
30.09.05 30.09.06
1,120 bps
Note: Adjustments regarding FX losses are as stated in the financial report footnotes.

Corporate Strategy, Business Development and Investor Relations21
For further information please contact [email protected]