2006 report card draft 1new - colorado college · pdf filenitrous oxide (ppt) 0.27 0.314....
TRANSCRIPT
“Human activities are increasingly alter-ing the Earth’s climate. These effects add to natural infl uences that have been present over Earth’s history. Scientifi c evidence strongly in-dicates that natural infl uences cannot explain the rapid increase in global near-surface tem-peratures observed during the second half of the 20th century.”–Statement by the American Geophysical Union: Human Impacts on Climate
Recently, devastating hurricanes and fl oods, melting ice caps, and species extinctions have all brought human induced climate change into the fore of the scientifi c and political discourse. And, although there has been some controversy as to the specifi cs of climate change, most leading scientists have reached a consensus that the Earth’s climate is rapidly changing as a result of human activities. Specifi cally, fossil fuel combustion is increasing atmo-spheric carbon dioxide (CO2) concentrations, trapping heat near the
Earth’s surface, and leading to higher surface temperatures. This is commonly referred to as the “greenhouse effect.”1 Although we cannot say exactly what the resulting climate patterns will be, leading scientists predict that the globe will see an increase in extreme weather events such as drought, fl ooding, and hurricanes in the relatively near future.2 In the Rockies, a re-gion known for its natural resources, outdoor recreation and robust agricultural economy,
our lifestyles and livelihoods are dictated by the type of weather we have. If overall weather patterns rapidly shift, we must be ready to adapt to those changes, regardless of the reason for the change. Gaining an understanding of what may happen will help us prepare for a future in which the climate is substantially different.3
Both future climate predictions and recent historic evidence suggest that the Rockies region is experiencing, and will continue to face, higher air temperatures and diminished amounts of precipitation
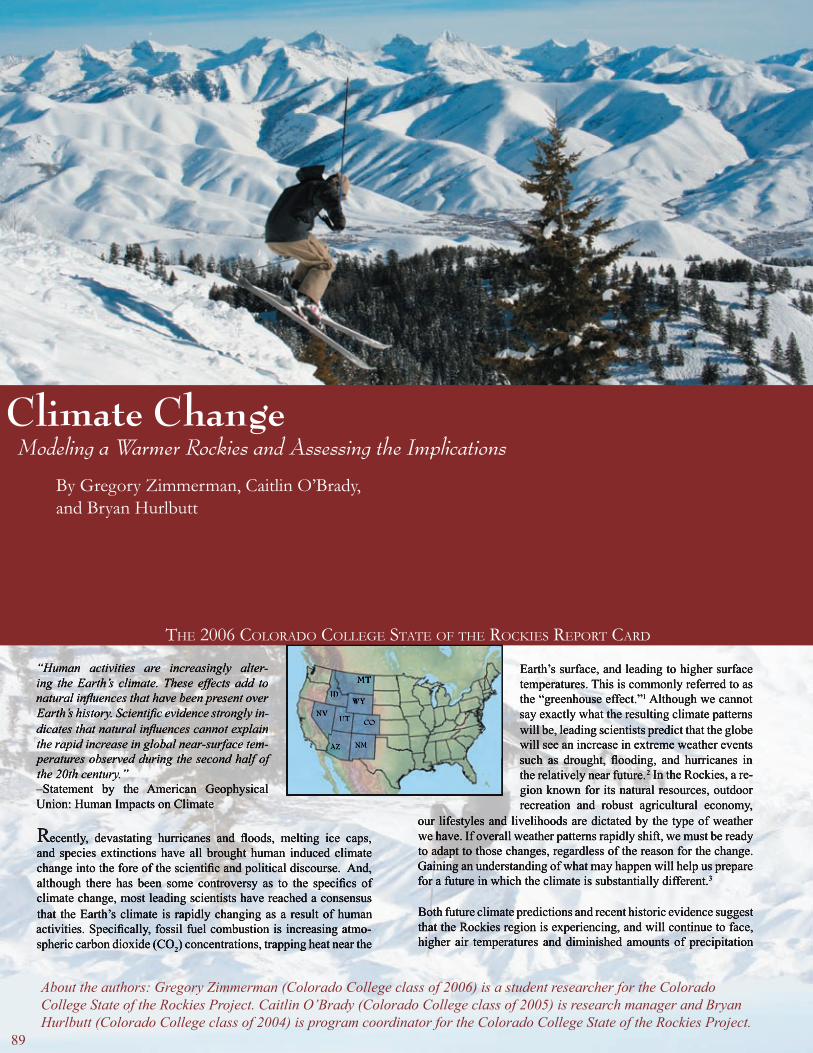
By Gregory Zimmerman, Caitlin O’Brady, and Bryan Hurlbutt
Climate ChangeModeling a Warmer Rockies and Assessing the Implications
THE 2006 COLORADO COLLEGE STATE OF THE ROCKIES REPORT CARD
89
About the authors: Gregory Zimmerman (Colorado College class of 2006) is a student researcher for the Colorado College State of the Rockies Project. Caitlin O’Brady (Colorado College class of 2005) is research manager and Bryan Hurlbutt (Colorado College class of 2004) is program coordinator for the Colorado College State of the Rockies Project.
ID
NV
AZ
UT
NM
CO
WY
MT
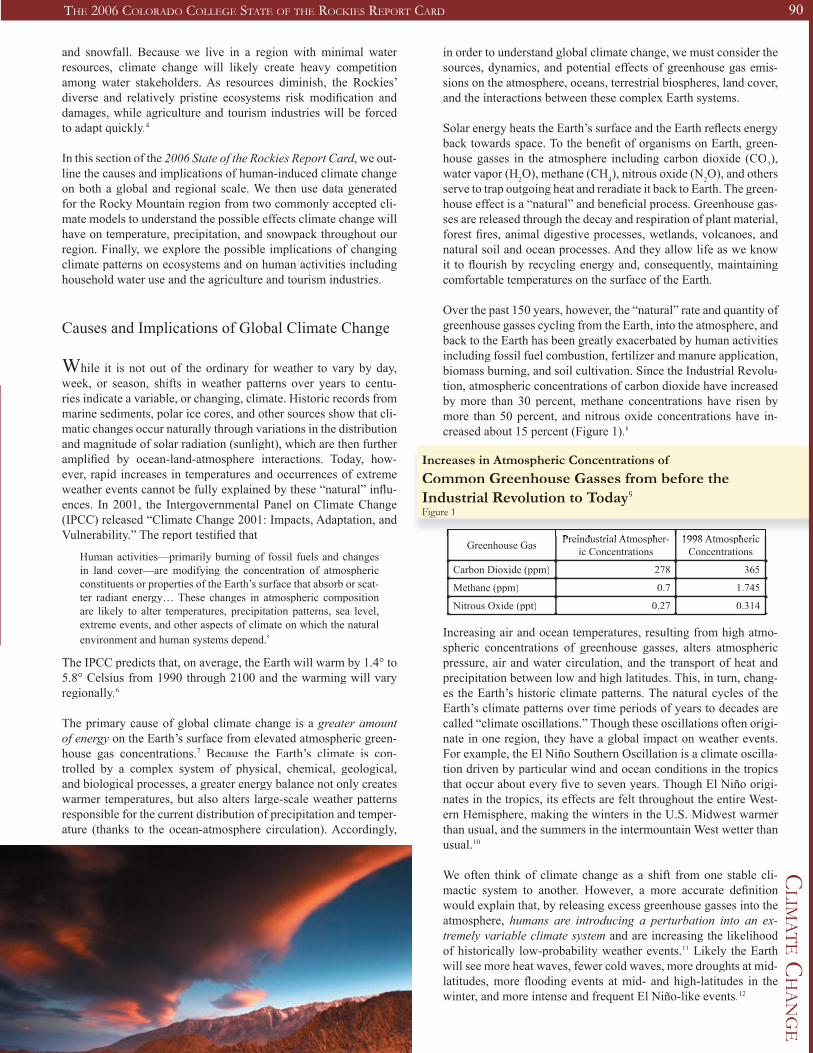
Increases in Atmospheric Concentrations ofCommon Greenhouse Gasses from before the Industrial Revolution to Today9
Figure 1
CLIM
ATE C
HA
NG
ETHE 2006 COLORADO COLLEGE STATE OF THE ROCKIES REPORT CARD 90
and snowfall. Because we live in a region with minimal water resources, climate change will likely create heavy competition among water stakeholders. As resources diminish, the Rockies’ diverse and relatively pristine ecosystems risk modifi cation and damages, while agriculture and tourism industries will be forced to adapt quickly.4
In this section of the 2006 State of the Rockies Report Card, we out-2006 State of the Rockies Report Card, we out-2006 State of the Rockies Report Cardline the causes and implications of human-induced climate change on both a global and regional scale. We then use data generated for the Rocky Mountain region from two commonly accepted cli-mate models to understand the possible effects climate change will have on temperature, precipitation, and snowpack throughout our region. Finally, we explore the possible implications of changing climate patterns on ecosystems and on human activities including household water use and the agriculture and tourism industries.
Causes and Implications of Global Climate Change
While it is not out of the ordinary for weather to vary by day, week, or season, shifts in weather patterns over years to centu-ries indicate a variable, or changing, climate. Historic records from marine sediments, polar ice cores, and other sources show that cli-matic changes occur naturally through variations in the distribution and magnitude of solar radiation (sunlight), which are then further amplifi ed by ocean-land-atmosphere interactions. Today, how-ever, rapid increases in temperatures and occurrences of extreme weather events cannot be fully explained by these “natural” infl u-ences. In 2001, the Intergovernmental Panel on Climate Change (IPCC) released “Climate Change 2001: Impacts, Adaptation, and Vulnerability.” The report testifi ed that
Human activities—primarily burning of fossil fuels and changes in land cover—are modifying the concentration of atmospheric constituents or properties of the Earth’s surface that absorb or scat-ter radiant energy… These changes in atmospheric composition are likely to alter temperatures, precipitation patterns, sea level, extreme events, and other aspects of climate on which the natural environment and human systems depend.5
The IPCC predicts that, on average, the Earth will warm by 1.4° to 5.8° Celsius from 1990 through 2100 and the warming will vary regionally.6
The primary cause of global climate change is a greater amount of energy on the Earth’s surface from elevated atmospheric green-house gas concentrations.7 Because the Earth’s climate is con-trolled by a complex system of physical, chemical, geological, and biological processes, a greater energy balance not only creates warmer temperatures, but also alters large-scale weather patterns responsible for the current distribution of precipitation and temper-ature (thanks to the ocean-atmosphere circulation). Accordingly,
in order to understand global climate change, we must consider the sources, dynamics, and potential effects of greenhouse gas emis-sions on the atmosphere, oceans, terrestrial biospheres, land cover, and the interactions between these complex Earth systems.
Solar energy heats the Earth’s surface and the Earth refl ects energy back towards space. To the benefi t of organisms on Earth, green-house gasses in the atmosphere including carbon dioxide (CO2), water vapor (H2O), methane (CH4), nitrous oxide (N2O), and others serve to trap outgoing heat and reradiate it back to Earth. The green-house effect is a “natural” and benefi cial process. Greenhouse gas-ses are released through the decay and respiration of plant material, forest fi res, animal digestive processes, wetlands, volcanoes, and natural soil and ocean processes. And they allow life as we know it to fl ourish by recycling energy and, consequently, maintaining comfortable temperatures on the surface of the Earth.
Over the past 150 years, however, the “natural” rate and quantity of greenhouse gasses cycling from the Earth, into the atmosphere, and back to the Earth has been greatly exacerbated by human activities including fossil fuel combustion, fertilizer and manure application, biomass burning, and soil cultivation. Since the Industrial Revolu-tion, atmospheric concentrations of carbon dioxide have increased by more than 30 percent, methane concentrations have risen by more than 50 percent, and nitrous oxide concentrations have in-creased about 15 percent (Figure 1).8
Climate ChangeModeling a Warmer Rockies and Assessing the Implications
THE 2006 COLORADO COLLEGE STATE OF THE ROCKIES REPORT CARD Increasing air and ocean temperatures, resulting from high atmo-spheric concentrations of greenhouse gasses, alters atmospheric pressure, air and water circulation, and the transport of heat and precipitation between low and high latitudes. This, in turn, chang-es the Earth’s historic climate patterns. The natural cycles of the Earth’s climate patterns over time periods of years to decades are called “climate oscillations.” Though these oscillations often origi-nate in one region, they have a global impact on weather events. For example, the El Niño Southern Oscillation is a climate oscilla-tion driven by particular wind and ocean conditions in the tropics that occur about every fi ve to seven years. Though El Niño origi-nates in the tropics, its effects are felt throughout the entire West-ern Hemisphere, making the winters in the U.S. Midwest warmer than usual, and the summers in the intermountain West wetter than usual.10
We often think of climate change as a shift from one stable cli-mactic system to another. However, a more accurate defi nition would explain that, by releasing excess greenhouse gasses into the atmosphere, humans are introducing a perturbation into an ex-tremely variable climate system and are increasing the likelihood of historically low-probability weather events.11 Likely the Earth will see more heat waves, fewer cold waves, more droughts at mid-latitudes, more fl ooding events at mid- and high-latitudes in the winter, and more intense and frequent El Niño-like events.12
Greenhouse Gas Preindustrial Atmospher-Preindustrial Atmospher-ic Concentrations
1998 Atmospheric 1998 Atmospheric Concentrations
Carbon Dioxide (ppm) 278 365
Methane (ppm) 0.7 1.745
Nitrous Oxide (ppt) 0.27 0.314
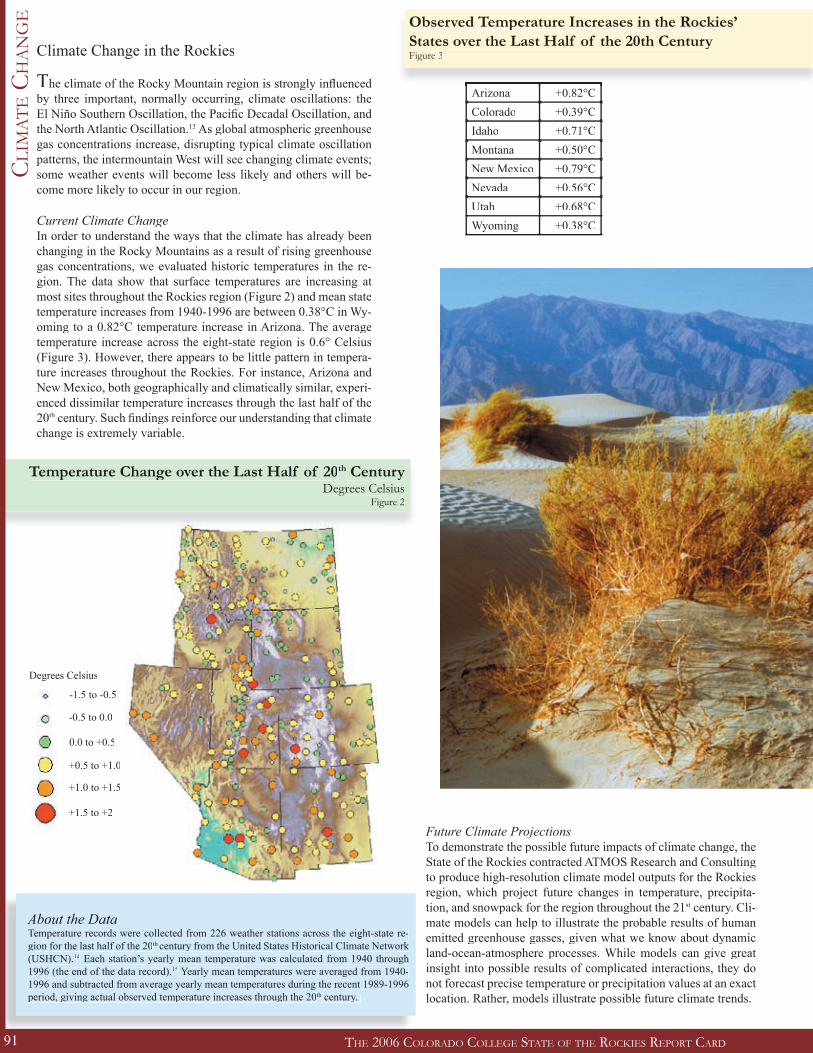
Temperature Change over the Last Half of 20th CenturyDegrees Celsius
Figure 2
Climate Change in the Rockies
The climate of the Rocky Mountain region is strongly infl uenced by three important, normally occurring, climate oscillations: the El Niño Southern Oscillation, the Pacifi c Decadal Oscillation, and the North Atlantic Oscillation.13 As global atmospheric greenhouse gas concentrations increase, disrupting typical climate oscillation patterns, the intermountain West will see changing climate events; some weather events will become less likely and others will be-come more likely to occur in our region.
Current Climate ChangeIn order to understand the ways that the climate has already been changing in the Rocky Mountains as a result of rising greenhouse gas concentrations, we evaluated historic temperatures in the re-gion. The data show that surface temperatures are increasing at most sites throughout the Rockies region (Figure 2) and mean state temperature increases from 1940-1996 are between 0.38°C in Wy-oming to a 0.82°C temperature increase in Arizona. The average temperature increase across the eight-state region is 0.6° Celsius (Figure 3). However, there appears to be little pattern in tempera-ture increases throughout the Rockies. For instance, Arizona and New Mexico, both geographically and climatically similar, experi-enced dissimilar temperature increases through the last half of the 20th century. Such fi ndings reinforce our understanding that climate change is extremely variable.
Future Climate ProjectionsTo demonstrate the possible future impacts of climate change, the State of the Rockies contracted ATMOS Research and Consulting to produce high-resolution climate model outputs for the Rockies region, which project future changes in temperature, precipita-tion, and snowpack for the region throughout the 21st century. Cli-st century. Cli-st
mate models can help to illustrate the probable results of human emitted greenhouse gasses, given what we know about dynamic land-ocean-atmosphere processes. While models can give great insight into possible results of complicated interactions, they do not forecast precise temperature or precipitation values at an exact location. Rather, models illustrate possible future climate trends.
Arizona +0.82°CColorado +0.39°CIdaho +0.71°CMontana +0.50°CNew Mexico +0.79°CNevada +0.56°CUtah +0.68°CWyoming +0.38°C
Observed Temperature Increases in the Rockies’ States over the Last Half of the 20th CenturyFigure 3
CLI
MA
TE C
HA
NG
E
THE 2006 COLORADO COLLEGE STATE OF THE ROCKIES REPORT CARD91
-1.5 to -0.5
+1.5 to +2
+1.0 to +1.5
+0.5 to +1.0
0.0 to +0.5
-0.5 to 0.0
Degrees Celsius
About the DataTemperature records were collected from 226 weather stations across the eight-state re-gion for the last half of the 20th century from the United States Historical Climate Network (USHCN).14 Each station’s yearly mean temperature was calculated from 1940 through 1996 (the end of the data record).15 Yearly mean temperatures were averaged from 1940-1996 and subtracted from average yearly mean temperatures during the recent 1989-1996 period, giving actual observed temperature increases through the 20th century.

Reduced Emissions (B1)Reduced Emissions (B1)1990 Baseline1990 Baseline
Downscaled Climate Model Outputs Generated for the Rocky Mountain RegionFigure 6
Comparison of the HadCM3 to the PCMAnnual Temperature Increase from 1976 to 2085* in Degrees Celsius
Figure 4
5.0 - 5.54.5 - 5.04.0 - 4.5
3.5 - 4.03.0 - 3.5
5.5 - 6.06.0 - 6.56.5 - 7.0
Degrees CelsiusDegrees CelsiusDegrees Celsius
Time Period
HadCM3 PCM
(Middle-of-the-Road Sensi-tivity Estimate)
(Low-Sensitivity Estimate)
Bus
ines
s-as
-U
sual
(A1F
I)
Red
uced
-Em
is-
sion
s (B
1)
Bus
ines
s-as
-U
sual
(A1F
I)
Red
uced
-Em
is-
sion
s (B
1)
Reference Period: “1976” (1961-1990) Generated Generated Generated Generated
Short-Term Future: “2035”(2020-2049) Generated Generated Generated Generated
Long-Term Future: “2085”(2070-2099)
Generated and Used in This Report
Generated and Used in This Report
Generated Generated
CO2 Emission Assumptions for Business-as-Usual and Reduced Emissions20
Figure 5
CLI
MA
TE C
HA
NG
E
THE 2006 COLORADO COLLEGE STATE OF THE ROCKIES REPORT CARD91
CLIM
ATE C
HA
NG
ETHE 2006 COLORADO COLLEGE STATE OF THE ROCKIES REPORT CARD 92
About the Climate Models
This is the fi rst time a downscaled climate model has been run on a regional scale for the eight-state Rocky Mountain region! In order to see the potential effects of future global climate change in the Rocky Mountain region, ATMOS Research and Consulting downscaled two different global climate models: the Parallel Climate Model (PCM) and Hadley Centre Climate Model (HadCM3).16
Both are general circulation models (GCMs), which predict probable future climate patterns on global, rather than regional, levels. To apply these global models to our region, original model grid sizes of several hundred square kilo-meters were reduced to 12 x 12 kilometer grid sizes.
The main difference between the two models is their different temperature sen-sitivity to atmospheric pCO2 variations. The HadCM3 is considered to be a mid-range model in its climactic response to human greenhouse gas emissions, whereas the PCM, which is less sensitive to greenhouse gas concentrations, is considered to produce conservative climate projections. As you can see, the annual temperature increases predicted across the region by the PCM are only from 3°C to 5°C, whereas the HadCM3 shows 5°C to 7°C increases (Figure 4).
Each model was run for two different greenhouse gas emission scenarios, which were included in the IPCC’s Special Report on Emissions Scenarios (Figure 5).17 The business-as-usual “A1fi ” emission scenario assumes a world of rapid economic growth, where global population peaks around 2050 and then decreases. Despite rapid introduction of new and more effi cient technologies, A1FI assumes intensive fossil fuel use.18 The reduced-emissions “B1” emis-sion scenario assumes a fairly smooth transition to alternative energy as fossil fuel resources decline. The scenario assumes extensive use of conventional and unconventional gas as the cleanest fossil fuel during the conversion towards renewable technology.19
The climate models generated the temperature, the amount of precipitation, and the depth of snowpack at each of over 15,000 data points across the Rockies evenly distributed across the region. Both models were run in the shorter term future (average from 2020-2049) and longer term future (2070-2099) for both scenarios, relative to the 1961-1990 reference period (Figure 6). Throughout the report, the reference period is referred to as “1976,” and the longer term period is refered to as “2085.” Snowpack values were generated for April 1 of each year and are in centimeters of snow-water equivalent depth. Temperature is displayed in degrees Celsius (°C). Precipitation is in centimeters per year.
Our analyses below display only the “middle of the road” HadCM3 model to track the change from our reference period to the longer term time period in temperature, precipitation, and snowpack. We fi rst display both the busi-ness-as-usual (A1FI) and reduced-emissions (B1) scenarios through a regional overview. We then present more detailed fi ndings within the context of three notable areas of concern: ecosystems, agriculture and municipal water use, and tourism hot spots.
PCM: Low-Sensitivity Climate Re-PCM: Low-Sensitivity Climate Re-sponse to Atmospheric Greenhouse Gas Concentrations
HadCM3: Moderate-Sensitivity Climate HadCM3: Moderate-Sensitivity Climate Response to Atmospheric Greenhouse Gas ConcentrationsGas Concentrations
Business as Usual (A1FI)Business as Usual (A1FI)
*1976 represents the average from 1961 to 1990, and 2085 represents the average from 2070 to 2099.*1976 represents the average from 1961 to 1990, and 2085 represents the average from 2070 to 2099.*1976 represents the average from 1961 to 1990, and 2085 represents the average from 2070 to 2099.

Overview of Findings
Assuming that the global community continues to add greenhouse gasses to the atmosphere at, or greater than, the present rate, we in the Rocky Mountain region will see changes from our histor-ic climate patterns. In general, the Rockies will likely see higher temperatures in both winter and summer, variable changes in pre-cipitation across the region, and more precipitation falling as rain rather than snow. Because temperature change is directly related to atmospheric greenhouse gas concentrations, it is the easiest cli-mactic parameter to model. More diffi cult to understand are the ef-fects of changes in greenhouse gas concentrations on precipitation and snowpack, and the results presented here are possible but less certain than the projections for temperature shifts. We explore the possible precipitation trends and discuss their implications to il-lustrate the wide-reaching impacts of altering one part of a climate system and to begin suggesting ways we may adapt to an altered climate.
TemperatureWhen we consider the implications of warmer temperatures, we likely think fi rst of our personal comfort. We remember either the coldest or warmest day of the year and imagine it being several degrees warmer. However, while a slight temperature change may seem tolerable for humans, it can have dramatic effects on other organisms and ecosystem processes. For example, higher or lower temperatures will alter water evaporation rates, the plant and ani-mal make-up of a particular habitat, or the tourism activities that are enjoyable in a location.
Under both business-as-usual and reduced-emissions scenarios, annual average temperature is projected to increase region-wide by the end of the century (Figure 7). Under the business-as-usual scenario, temperature increases by 5°C to 7°C across most of the Rockies, while under the reduced-emissions scenario, temperature increases are only around 3°C to 4°C.
Temperatures will not increase uniformly throughout the year and some seasons will have more extreme temperature changes than others. Under both scenarios, summer temperature increases are greater than winter temperature increases. Summer temperatures increase by 7°C to 10°C across the region for business-as-usual and by 3°C to 6°C for reduced-emissions (Figure 8), whereas win-ter temperatures only increase by 3°C to 7°C for business-as-usual and by 1°C to 5°C with reduced-emissions (Figure 9).
Summer Temperature Increase, 1976 to 2085* Degrees CelsiusFigure 8
Business-as-UsualBusiness-as-Usual Reduced EmissionsReduced Emissions
Annual Temperature Increase, 1976 to 2085* Degrees Celsius
Figure 7
Business-as-UsualBusiness-as-UsualBusiness-as-Usual Reduced EmissionsReduced Emissions
5.0 - 5.54.5 - 5.04.0 - 4.5
3.5 - 4.03.0 - 3.5
5.5 - 6.06.0 - 6.56.5 - 7.0
Degrees Celsius
CLI
MA
TE C
HA
NG
E
THE 2006 COLORADO COLLEGE STATE OF THE ROCKIES REPORT CARD93
Reduced EmissionsReduced EmissionsBusiness-as-UsualBusiness-as-Usual
4 - 53 - 42 - 3
1 - 20 - 1
5 - 66 - 77 - 8
Degrees CelsiusDegrees CelsiusDegrees Celsius
4 - 53 - 4
10 - 11
9 - 108 - 9
5 - 66 - 77 - 8
Degrees CelsiusDegrees Celsius
Winter Temperature Increase, 1976 to 2085* Degrees CelsiusFigure 9
*1976 represents the average from 1961 to 1990, and 2085 represents the average from 2070 to 2099.*1976 represents the average from 1961 to 1990, and 2085 represents the average from 2070 to 2099.
*1976 represents the average from 1961 to 1990, and 2085 represents the average from 2070 to 2099.
*1976 represents the average from 1961 to 1990, and 2085 represents the average from 2070 to 2099.

April 1 Snowpack Percentage Change, 1976 to 2085*Centimeters of Snow Water EquivalenceFigure 10Snowpack
Although the change in winter temperatures is not as extreme as in the summer, increasing winter temperatures may cause several melting periods during the winter, and will have a great impact on the snowpack of the Rocky Mountain region. Because our water resources in the Rocky Mountains come primarily from snowmelt, the state of the springtime snowpack indicates the viability of wa-ter resources to supply users. Research has shown that with pre-dicted climate change, snowline will recede to higher elevations, river fl ow volume will continue to decrease, and spring runoff will move earlier in the spring.21
Under both scenarios, most of the Rockies areas that had an April 1 snowpack in 1976 lose snow by 2085. Snowpack losses are greater under the business-as-usual scenario, in which most snowy areas lose more than 50 percent of their snowpack. Under the reduced-emissions scenario, most areas lose some snowpack, with only about half of the snowy areas losing over 50 percent of their snow-pack (Figure 10).
PrecipitationIt has been suggested that climate change will bring increased rain-fall which will make up for the loss of snowpack. Indeed, Regonda et al. found that in the Rockies there has been a general increase in winter precipitation, without apparent increases in spring stream-fl ows, suggesting that more precipitation has been falling as rain rather than snow in recent years.22 Most experts agree, however, that with increased atmospheric greenhouse gas concentrations, regional precipitation patterns will simply become more stochastic and variable over time and space. It will be more likely that one year we will experience a drought and the next have fl ooding.23
Our results show that annual precipitation will increase in some parts of the Rockies and decrease in others from 1976 to 2085 un-der both scenarios (Figure 11).
Climate Change and the Rockies’ Ecoregions
Ecosystem function will undoubtedly change with changes in temperature, precipitation, and snowpack, as these climate proper-ties dictate rates of important, yet often unseen, ecosystem process-es. For example, the rate of abiotic (nonliving) processes like rock weathering as well as biotic (living) processes like decomposition, nutrient cycling, reproduction, CO2 assimilation, and water uptake are all determined by temperature and precipitation conditions. Species that are used to one temperature and precipitation regime and the accompanying ecosystem processes will be stressed by a rapid change in climate properties. Among other impacts, climate change is expected to induce species stress and potentially lead to accelerated extinction. In fact, a recent study in the journal Naturedirectly linked climate change to frog extinction in the tropics.24
We must ask ourselves, is the Rocky Mountain region far behind?
Here we outline our HadCM3 business-as-usual projected future trends in seasonal temperatures, precipitation, and snowpack: cli-mate properties that are important to ecosystem change. We have divided the Rocky Mountain region into 20 ecoregions in order to compare projected changes in one area of the region to those in an-other (Figure 12). We compare these climate projections with other studies which look at current and projected ecosystem impacts of climate change.
Annual Precipitation Change, 1976 to 2085*Centimeters Per YearFigure 11
CLI
MA
TE C
HA
NG
E
THE 2006 COLORADO COLLEGE STATE OF THE ROCKIES REPORT CARD93
Business-as-UsualBusiness-as-UsualBusiness-as-Usual Reduced EmissionsReduced EmissionsReduced Emissions
+18 to +27
+9 to +18
0 to +9
-9 to 0
-9 and Fewer
+27 to +37
+37 and Greater
-100%-100%
-99% to -75%-99% to -75%
-75% to -50%-75% to -50%
-50% to -25%-50% to -25%
-25% to 0%-25% to 0%
0% to +25%0% to +25%
+25% to +50%+25% to +50%
+50% to +75%+50% to +75%
+75% to +100%+75% to +100%+75% to +100%
Business-as-UsualBusiness-as-UsualBusiness-as-Usual Reduced EmissionsReduced EmissionsReduced Emissions
CLIM
ATE C
HA
NG
ETHE 2006 COLORADO COLLEGE STATE OF THE ROCKIES REPORT CARD 94
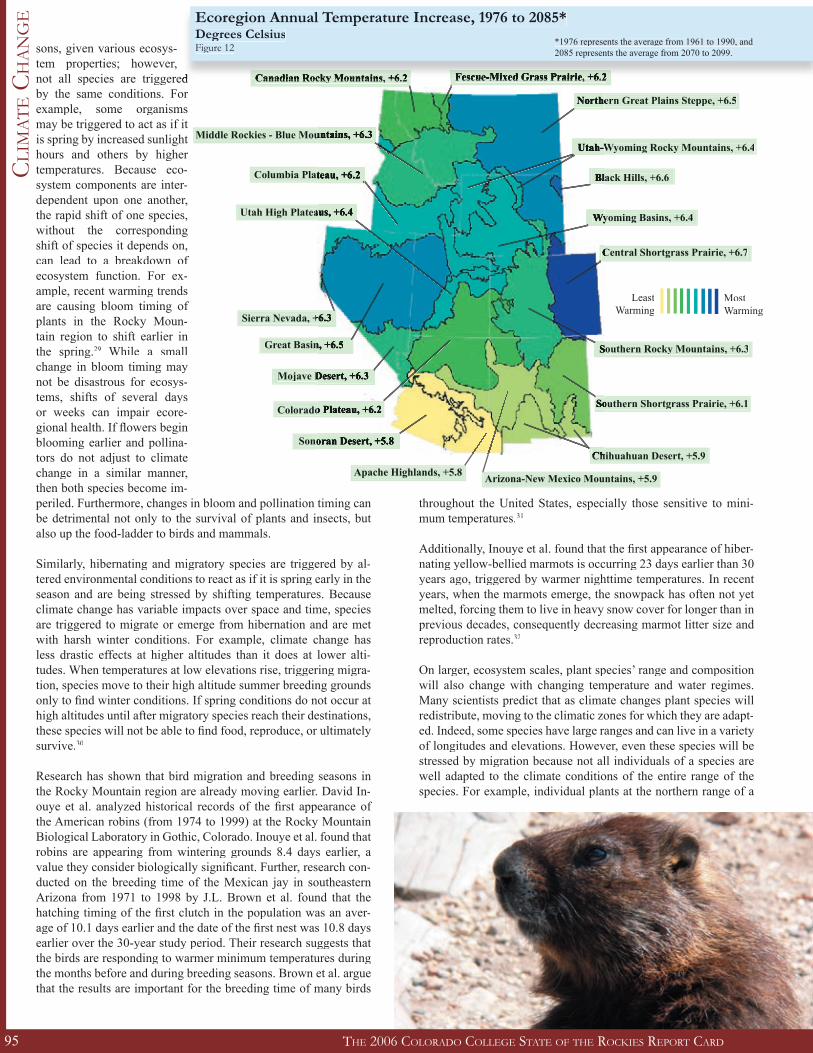
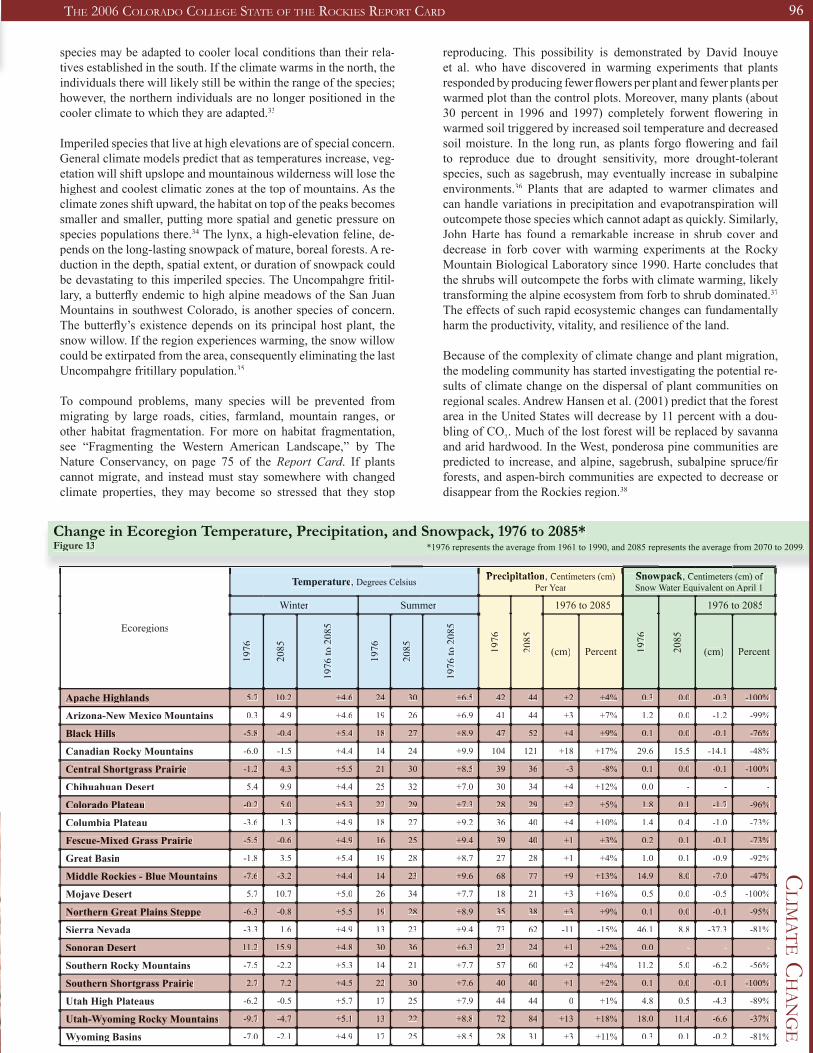
Overview of Ecoregion FindingsAnnual temperature is predicted to increase by 5.8°C to 6.7°C in every ecoregion in the Rockies from 1976 to 2085 (Figure 12). Over that period, summer temperature increases are greater, rang-ing from plus 6.3°C to 9.6°C (Figure 13). Higher summer temper-atures cause greater water loss from surface water bodies and from plant leaves (i.e., evapotranspiration), increasing plant water stress and the likelihood of fi re.25 Winter temperature is predicted to rise by 4.4°C to 5.7°C from 1976 to 2085 (Figure 13). Greater winter temperatures trigger many organisms to react as if it were spring too early in the season or they allow species that require mild win-ters to survive in previously harsh environments.26 If new, mild winter-adapted organisms move in, the native fl ora and fauna will be stressed by competition for resources.27 Furthermore, warmer winters cause snow to melt several times during the winter months, altering the water regime for the whole year.28 Indeed, in every ecoregion, springtime snowpack is predicted to decrease by at least 37 percent from 1976 to 2085, and in 14 ecoregions, snowpack will decrease by over 70 percent over the same period (Figure 13).
Effects of Climate Change on EcosystemsOn a species level, changes in seasonal temperatures and spring-time snowpack will stress organisms adapted to historic climate properties. Flora and fauna are triggered to change with the sea-
*1976 represents the average from 1961 to 1990, and 2085 represents the average from 2070 to 2099.*1976 represents the average from 1961 to 1990, and 2085 represents the average from 2070 to 2099.*1976 represents the average from 1961 to 1990, and 2085 represents the average from 2070 to 2099.
*1976 represents the average from 1961 to 1990, and 2085 represents the average from 2070 to 2099.*1976 represents the average from 1961 to 1990, and 2085 represents the average from 2070 to 2099.*1976 represents the average from 1961 to 1990, and 2085 represents the average from 2070 to 2099.
CLI
MA
TE C
HA
NG
E
THE 2006 COLORADO COLLEGE STATE OF THE ROCKIES REPORT CARD95
sons, given various ecosys-tem properties; however, not all species are triggered not all species are triggered by the same conditions. For example, some organisms may be triggered to act as if it is spring by increased sunlight hours and others by higher temperatures. Because eco-system components are inter-dependent upon one another, the rapid shift of one species, without the corresponding shift of species it depends on, can lead to a breakdown of ecosystem function. For ex-ample, recent warming trends are causing bloom timing of plants in the Rocky Moun-tain region to shift earlier in the spring.29 While a small change in bloom timing may not be disastrous for ecosys-tems, shifts of several days or weeks can impair ecore-gional health. If fl owers begin blooming earlier and pollina-tors do not adjust to climate change in a similar manner, then both species become im-periled. Furthermore, changes in bloom and pollination timing can be detrimental not only to the survival of plants and insects, but also up the food-ladder to birds and mammals.
Similarly, hibernating and migratory species are triggered by al-tered environmental conditions to react as if it is spring early in the season and are being stressed by shifting temperatures. Because climate change has variable impacts over space and time, species are triggered to migrate or emerge from hibernation and are met with harsh winter conditions. For example, climate change has less drastic effects at higher altitudes than it does at lower alti-tudes. When temperatures at low elevations rise, triggering migra-tion, species move to their high altitude summer breeding grounds only to fi nd winter conditions. If spring conditions do not occur at high altitudes until after migratory species reach their destinations, these species will not be able to fi nd food, reproduce, or ultimately survive.30
Research has shown that bird migration and breeding seasons in the Rocky Mountain region are already moving earlier. David In-ouye et al. analyzed historical records of the fi rst appearance of the American robins (from 1974 to 1999) at the Rocky Mountain Biological Laboratory in Gothic, Colorado. Inouye et al. found that robins are appearing from wintering grounds 8.4 days earlier, a value they consider biologically signifi cant. Further, research con-ducted on the breeding time of the Mexican jay in southeastern Arizona from 1971 to 1998 by J.L. Brown et al. found that the hatching timing of the fi rst clutch in the population was an aver-age of 10.1 days earlier and the date of the fi rst nest was 10.8 days earlier over the 30-year study period. Their research suggests that the birds are responding to warmer minimum temperatures during the months before and during breeding seasons. Brown et al. argue that the results are important for the breeding time of many birds
throughout the United States, especially those sensitive to mini-mum temperatures.31
Additionally, Inouye et al. found that the fi rst appearance of hiber-nating yellow-bellied marmots is occurring 23 days earlier than 30 years ago, triggered by warmer nighttime temperatures. In recent years, when the marmots emerge, the snowpack has often not yet melted, forcing them to live in heavy snow cover for longer than in previous decades, consequently decreasing marmot litter size and reproduction rates.32
On larger, ecosystem scales, plant species’ range and composition will also change with changing temperature and water regimes. Many scientists predict that as climate changes plant species will redistribute, moving to the climatic zones for which they are adapt-ed. Indeed, some species have large ranges and can live in a variety of longitudes and elevations. However, even these species will be stressed by migration because not all individuals of a species are well adapted to the climate conditions of the entire range of the species. For example, individual plants at the northern range of a
Ecoregion Annual Temperature Increase, 1976 to 2085* Degrees CelsiusFigure 12
Apache Highlands, +5.8 Arizona-New Mexico Mountains, +5.9
Black Hills, +6.6Black Hills, +6.6
Canadian Rocky Mountains, +6.2Canadian Rocky Mountains, +6.2
Central Shortgrass Prairie, +6.7Central Shortgrass Prairie, +6.7
Chihuahuan Desert, +5.9Chihuahuan Desert, +5.9
Colorado Plateau, +6.2Colorado Plateau, +6.2
Columbia Plateau, +6.2Columbia Plateau, +6.2
Fescue-Mixed Grass Prairie, +6.2Fescue-Mixed Grass Prairie, +6.2
Great Basin, +6.5Great Basin, +6.5
Middle Rockies - Blue Mountains, +6.3Middle Rockies - Blue Mountains, +6.3
Mojave Desert, +6.3Mojave Desert, +6.3
Northern Great Plains Steppe, +6.5Northern Great Plains Steppe, +6.5
Sierra Nevada, +6.3Sierra Nevada, +6.3
Sonoran Desert, +5.8Sonoran Desert, +5.8
Southern Rocky Mountains, +6.3Southern Rocky Mountains, +6.3
Southern Shortgrass Prairie, +6.1Southern Shortgrass Prairie, +6.1Southern Shortgrass Prairie, +6.1
Utah High Plateaus, +6.4Utah High Plateaus, +6.4
Utah-Wyoming Rocky Mountains, +6.4Utah-Wyoming Rocky Mountains, +6.4Utah-Wyoming Rocky Mountains, +6.4Utah-Wyoming Rocky Mountains, +6.4
Wyoming Basins, +6.4Wyoming Basins, +6.4
LeastWarming
Most Warming
*1976 represents the average from 1961 to 1990, and 2085 represents the average from 2070 to 2099.
CLIM
ATE C
HA
NG
ETHE 2006 COLORADO COLLEGE STATE OF THE ROCKIES REPORT CARD 96
CLI
MA
TE C
HA
NG
E
THE 2006 COLORADO COLLEGE STATE OF THE ROCKIES REPORT CARD95
Change in Ecoregion Temperature, Precipitation, and Snowpack, 1976 to 2085*Figure 13
Ecoregions
Temperature, Degrees Celsius PrecipitationPrecipitation, Centimeters (cm) Centimeters (cm) Per Year
SnowpackSnowpack, Centimeters (cm) of Centimeters (cm) of Snow Water Equivalent on April 1
Winter Summer
1976
2085
1976 to 2085
1976
2085
1976 to 2085
1976
2085
1976
to 2
085
1976
2085
1976
to 2
085
(cm) Percent (cm) Percent
Apache Highlands 5.7 10.2 +4.6 24 30 +6.5 42 44 +2 +4% 0.3 0.0 -0.3 -100%
Arizona-New Mexico Mountains 0.3 4.9 +4.6 19 26 +6.9 41 44 +3 +7% 1.2 0.0 -1.2 -99%
Black Hills -5.8 -0.4 +5.4 18 27 +8.9 47 52 +4 +9% 0.1 0.0 -0.1 -76%
Canadian Rocky Mountains -6.0 -1.5 +4.4 14 24 +9.9 104 121 +18 +17% 29.6 15.5 -14.1 -48%
Central Shortgrass Prairie -1.2 4.3 +5.5 21 30 +8.5 39 36 -3 -8% 0.1 0.0 -0.1 -100%
Chihuahuan Desert 5.4 9.9 +4.4 25 32 +7.0 30 34 +4 +12% 0.0 - - -
Colorado Plateau -0.2 5.0 +5.3 22 29 +7.3 28 29 +2 +5% 1.8 0.1 -1.7 -96%
Columbia Plateau -3.6 1.3 +4.9 18 27 +9.2 36 40 +4 +10% 1.4 0.4 -1.0 -73%
Fescue-Mixed Grass Prairie -5.5 -0.6 +4.9 16 25 +9.4 39 40 +1 +3% 0.2 0.1 -0.1 -73%
Great Basin -1.8 3.5 +5.4 19 28 +8.7 27 28 +1 +4% 1.0 0.1 -0.9 -92%
Middle Rockies - Blue Mountains -7.6 -3.2 +4.4 14 23 +9.6 68 77 +9 +13% 14.9 8.0 -7.0 -47%
Mojave Desert 5.7 10.7 +5.0 26 34 +7.7 18 21 +3 +16% 0.5 0.0 -0.5 -100%
Northern Great Plains Steppe -6.3 -0.8 +5.5 19 28 +8.9 35 38 +3 +9% 0.1 0.0 -0.1 -95%
Sierra Nevada -3.3 1.6 +4.9 13 23 +9.4 73 62 -11 -15% 46.1 8.8 -37.3 -81%
Sonoran Desert 11.2 15.9 +4.8 30 36 +6.3 23 24 +1 +2% 0.0 - - -
Southern Rocky Mountains -7.5 -2.2 +5.3 14 21 +7.7 57 60 +2 +4% 11.2 5.0 -6.2 -56%
Southern Shortgrass Prairie 2.7 7.2 +4.5 22 30 +7.6 40 40 +1 +2% 0.1 0.0 -0.1 -100%
Utah High Plateaus -6.2 -0.5 +5.7 17 25 +7.9 44 44 0 +1% 4.8 0.5 -4.3 -89%
Utah-Wyoming Rocky Mountains -9.7 -4.7 +5.1 13 22 +8.8 72 84 +13 +18% 18.0 11.4 -6.6 -37%
Wyoming Basins -7.0 -2.1 +4.9 17 25 +8.5 28 31 +3 +11% 0.3 0.1 -0.2 -81%
species may be adapted to cooler local conditions than their rela-tives established in the south. If the climate warms in the north, the individuals there will likely still be within the range of the species; however, the northern individuals are no longer positioned in the cooler climate to which they are adapted.33
Imperiled species that live at high elevations are of special concern.General climate models predict that as temperatures increase, veg-etation will shift upslope and mountainous wilderness will lose the highest and coolest climatic zones at the top of mountains. As the climate zones shift upward, the habitat on top of the peaks becomes smaller and smaller, putting more spatial and genetic pressure on species populations there.34 The lynx, a high-elevation feline, de-pends on the long-lasting snowpack of mature, boreal forests. A re-duction in the depth, spatial extent, or duration of snowpack could be devastating to this imperiled species. The Uncompahgre fritil-lary, a butterfl y endemic to high alpine meadows of the San Juan Mountains in southwest Colorado, is another species of concern.The butterfl y’s existence depends on its principal host plant, the snow willow. If the region experiences warming, the snow willow could be extirpated from the area, consequently eliminating the last Uncompahgre fritillary population.35
To compound problems, many species will be prevented from migrating by large roads, cities, farmland, mountain ranges, or other habitat fragmentation. For more on habitat fragmentation, see “Fragmenting the Western American Landscape,” by The Nature Conservancy, on page 75 of the Report Card. If plants Report Card. If plants Report Cardcannot migrate, and instead must stay somewhere with changed climate properties, they may become so stressed that they stop
reproducing. This possibility is demonstrated by David Inouye et al. who have discovered in warming experiments that plants responded by producing fewer fl owers per plant and fewer plants per warmed plot than the control plots. Moreover, many plants (about 30 percent in 1996 and 1997) completely forwent fl owering in warmed soil triggered by increased soil temperature and decreased soil moisture. In the long run, as plants forgo fl owering and fail to reproduce due to drought sensitivity, more drought-tolerant species, such as sagebrush, may eventually increase in subalpine environments.36 Plants that are adapted to warmer climates and can handle variations in precipitation and evapotranspiration will outcompete those species which cannot adapt as quickly. Similarly, John Harte has found a remarkable increase in shrub cover and decrease in forb cover with warming experiments at the Rocky Mountain Biological Laboratory since 1990. Harte concludes that the shrubs will outcompete the forbs with climate warming, likely transforming the alpine ecosystem from forb to shrub dominated.37
The effects of such rapid ecosystemic changes can fundamentally harm the productivity, vitality, and resilience of the land.
Because of the complexity of climate change and plant migration, the modeling community has started investigating the potential re-sults of climate change on the dispersal of plant communities on regional scales. Andrew Hansen et al. (2001) predict that the forest area in the United States will decrease by 11 percent with a dou-bling of CO2. Much of the lost forest will be replaced by savanna and arid hardwood. In the West, ponderosa pine communities are predicted to increase, and alpine, sagebrush, subalpine spruce/fi r forests, and aspen-birch communities are expected to decrease or disappear from the Rockies region.38
*1976 represents the average from 1961 to 1990, and 2085 represents the average from 2070 to 2099.
Climate Change and Agricultural and Municipal Water Use in the Rockies
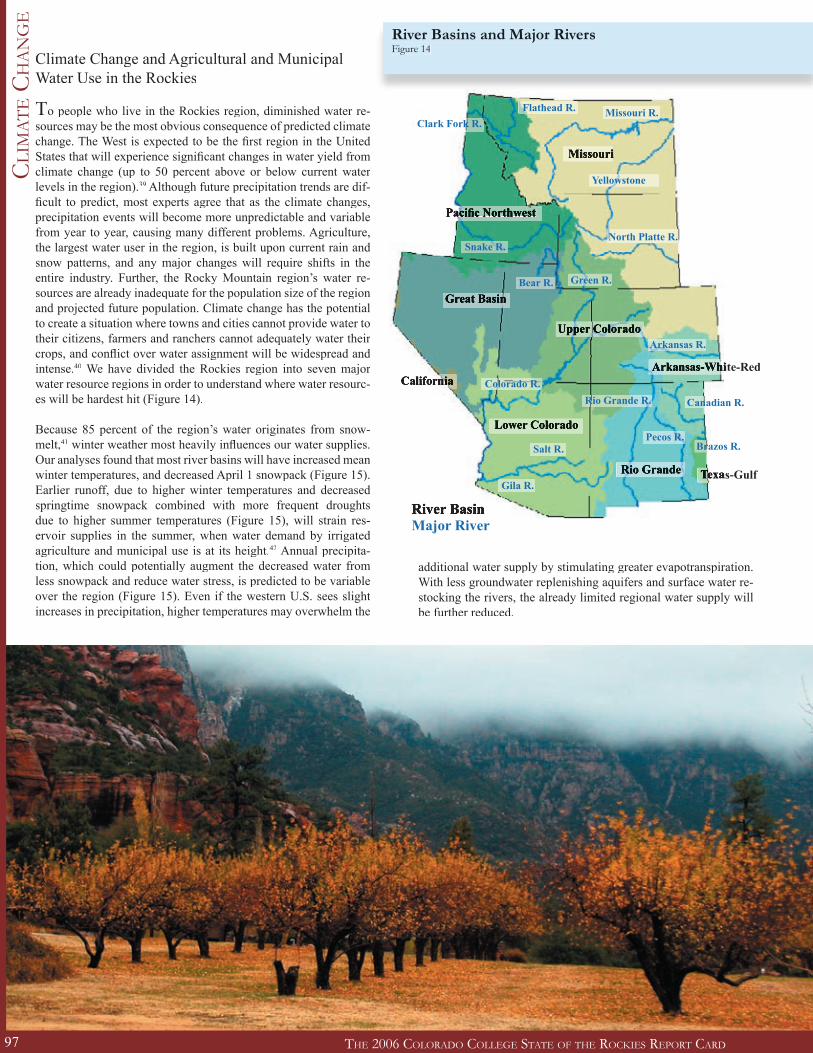
To people who live in the Rockies region, diminished water re-sources may be the most obvious consequence of predicted climate change. The West is expected to be the fi rst region in the United States that will experience signifi cant changes in water yield from climate change (up to 50 percent above or below current water levels in the region).39 Although future precipitation trends are dif-fi cult to predict, most experts agree that as the climate changes, precipitation events will become more unpredictable and variable from year to year, causing many different problems. Agriculture, the largest water user in the region, is built upon current rain and snow patterns, and any major changes will require shifts in the entire industry. Further, the Rocky Mountain region’s water re-sources are already inadequate for the population size of the region and projected future population. Climate change has the potential to create a situation where towns and cities cannot provide water to their citizens, farmers and ranchers cannot adequately water their crops, and confl ict over water assignment will be widespread and intense.40 We have divided the Rockies region into seven major water resource regions in order to understand where water resourc-es will be hardest hit (Figure 14).
Because 85 percent of the region’s water originates from snow-melt,41 winter weather most heavily infl uences our water supplies. Our analyses found that most river basins will have increased mean winter temperatures, and decreased April 1 snowpack (Figure 15). Earlier runoff, due to higher winter temperatures and decreased springtime snowpack combined with more frequent droughts due to higher summer temperatures (Figure 15), will strain res-ervoir supplies in the summer, when water demand by irrigated agriculture and municipal use is at its height.42 Annual precipita-tion, which could potentially augment the decreased water from less snowpack and reduce water stress, is predicted to be variable over the region (Figure 15). Even if the western U.S. sees slight increases in precipitation, higher temperatures may overwhelm the
additional water supply by stimulating greater evapotranspiration. With less groundwater replenishing aquifers and surface water re-stocking the rivers, the already limited regional water supply will be further reduced.
River Basins and Major RiversFigure 14
CLI
MA
TE C
HA
NG
E
THE 2006 COLORADO COLLEGE STATE OF THE ROCKIES REPORT CARD97
CLIM
ATE C
HA
NG
E
THE 2006 COLORADO COLLEGE STATE OF THE ROCKIES REPORT CARD 98
Snake R.
Colorado R.
Green R.
Gila R.
Salt R.
Rio Grande R.
Pecos R.Brazos R.
Canadian R.
Arkansas R.
Bear R.
North Platte R.
Yellowstone
Missouri R.Flathead R.Clark Fork R.
Arkansas-White-RedArkansas-White-RedCalifornia
Upper Colorado
Texas-GulfTexas-GulfRio Grande
Pacifi c Northwest
MissouriMissouri
Lower Colorado
Great Basin
River BasinMajor River

As climate changes, the productivity of farms and ranchlands will also change. Agricultural industries may improve throughout the region with a warmer, wetter, more CO2 rich climate. Higher tem-peratures and greater rainfall could allow a longer, more produc-tive growing season. However, without increases in precipitation the agricultural industry will be highly stressed by climate warm-ing.43
Because grazing in the Rockies depends upon the availability of natural forage and supplemental cultivated forage crops, the viabil-ity of the ranching industry is closely tied to the regional climate. Warmer temperatures would lengthen the growing season and per-mit cattlemen to hold stock at higher-elevation grazing areas for longer periods of the spring and fall. Furthermore, if precipitation increases in some areas, likely forage production will also increase, allowing more cattle on each plot of land. Increased forage de-creases the cost of purchasing cultivated forage, producing hay, and operating irrigated water systems. However, despite increased forage potential, some scientists worry that increased temperatures and moisture in the Rocky Mountain region will have damaging effects on range and farmland because of a shift in the distribution of noxious weeds and invasives. Warmer winters may increase the incidence of pest outbreaks and invasive exotics; such species did not survive the historically cold winters, but now can outcompete native species in the winter and summer months.44 For a further discussion of invasives, please see “The Invasion of Our Rockies: Hype or Management Priority?” by Anna Sher, on page 47 of the Report Card.Report Card.Report Card
If, however, precipitation decreases across the region or is over-whelmed by higher evapotranspiration, the presently distressed ranching industry will become unviable. Hurt (1951) found that calf weights during the drought years of the 1930s decreased by a third from historical averages. Reed et al. reported that the percent-age of cows weaning calves in those same years decreased to 73 percent compared with 87 percent in typical precipitation years.45
Agricultural water stress will be compounded by future population growth in the region. Municipalities will compete with agriculture for water rights to provide to residents. In the West, the earliest, or most senior, water rights have the ability to extract a specifi ed amount of surface water, before more recent or junior owners. Surface waters are withdrawn from earliest to latest water owners
and a junior right holder cannot withdraw water if it impedes the ability of a senior right holder to extract the entirety of the senior appropriation. Throughout the Rockies region, prior appropriation has created frequent confl ict between right holders because the water resources in the West are not suffi cient for all citizens to extract and utilize all the water they desire. Given predicted changes in temperature, precipitation, and snowpack, confl ict will likely increase as varying interests all compete for decreasing water resources.
Change in River Basin Region Temperature, Precipitation, and Snowpack, 1976 to 2085*Figure 15
CLI
MA
TE C
HA
NG
E
THE 2006 COLORADO COLLEGE STATE OF THE ROCKIES REPORT CARD97
CLIM
ATE C
HA
NG
ETHE 2006 COLORADO COLLEGE STATE OF THE ROCKIES REPORT CARD 98
Snake R.
Colorado R.
Green R.
Gila R.
Salt R.
Rio Grande R.
Pecos R.Brazos R.
Canadian R.
Arkansas R.
Bear R.
North Platte R.
Yellowstone
Missouri R.Flathead R.Clark Fork R.
Major River
*1976 represents the average from 1961 to 1990, and 2085 represents the average from 2070 to 2099.
River Basin Regions
Winter Temperature, Degrees Celsius
Precipitation, Centimeters (cm) Per Year
Snowpack, Centimeters (cm) of Snow Water Equivalence on April 1
1976
2085
Cha
nge,
197
6 to
208
5
1976
2085
Change, 1976 to 2085
1976
2085
Change, 1976 to 2085
(cm) Percent (cm) Percent
Arkansas-White-Red -0.7 4.4 +5.1 42 40 -2 -5% 4.3 2.0 -2.3 -53%
California 2.7 7.8 +5.1 23 25 +2 +7% 0.6 0.0 -0.6 -100%
Great Basin -2.4 2.9 +5.3 31 32 +1 +4% 2.8 0.5 -2.3 -83%
Lower Colorado 5.0 9.8 +4.8 32 34 +2 +5% 1.2 0.0 -1.2 -99%
Missouri -6.3 -1.0 +5.3 42 46 +4 +10% 6.7 4.6 -2.1 -31%
Pacifi c Northwest -6.2 -1.6 +4.6 71 82 +11 +15% 20.3 10.7 -9.6 -47%
Rio Grande 1.2 5.8 +4.6 37 40 +3 +7% 9.8 3.5 -6.3 -65%
Texas-Gulf 4.4 8.8 +4.5 43 44 +1 +3% - - - -
Upper Colorado -5.7 -0.3 +5.3 39 41 +2 +6% 8.8 4.1 -4.7 -53%
Blaine County, IdahoBlaine County, Idaho-Sun Valley-Sun Valley -41%
Eagle County, ColoradoEagle County, Colorado-Beaver Creek-Beaver Creek-Vail-Vail -57%
Flathead County, MontanaFlathead County, Montana-Big Mountain-Big Mountain -34%
Gallatin County, MontanaGallatin County, MontanaGallatin County, MontanaGallatin County, Montana-Big Sky-Big Sky-Big Sky-Big Sky -33%
Grand County, ColoradoGrand County, Colorado-Winter Park-Winter Park -54%
San Miguel County, ColoradoSan Miguel County, Colorado-Telluride -82%
Pitkin County, ColoradoPitkin County, Colorado-Aspen Highlands-Aspen Highlands-Aspen Mountain-Aspen Mountain-Snowmass-Snowmass -43%
Routt County, ColoradoRoutt County, Colorado-Steamboat-Steamboat -50%
Salt Lake County, UtahSalt Lake County, Utah-Alta-Snowbird-Solitude -84%
-50%Gunnison County, ColoradoGunnison County, Colorado-Crested Butte-Crested Butte
Summit County, Colorado-Breckenridge-Copper-Keystone -50%
Summit County, UtahSummit County, Utah-Deer Valley-Park City-The Canyons-The Canyons
-61%
Taos County, New Mexico-Taos -89%
Teton County, WyomingTeton County, Wyoming-Jackson Hole-Jackson Hole -26%
LeastSnowpack Loss
Most Snowpack Loss
CLI
MA
TE C
HA
NG
E
THE 2006 COLORADO COLLEGE STATE OF THE ROCKIES REPORT CARD99
Tourism
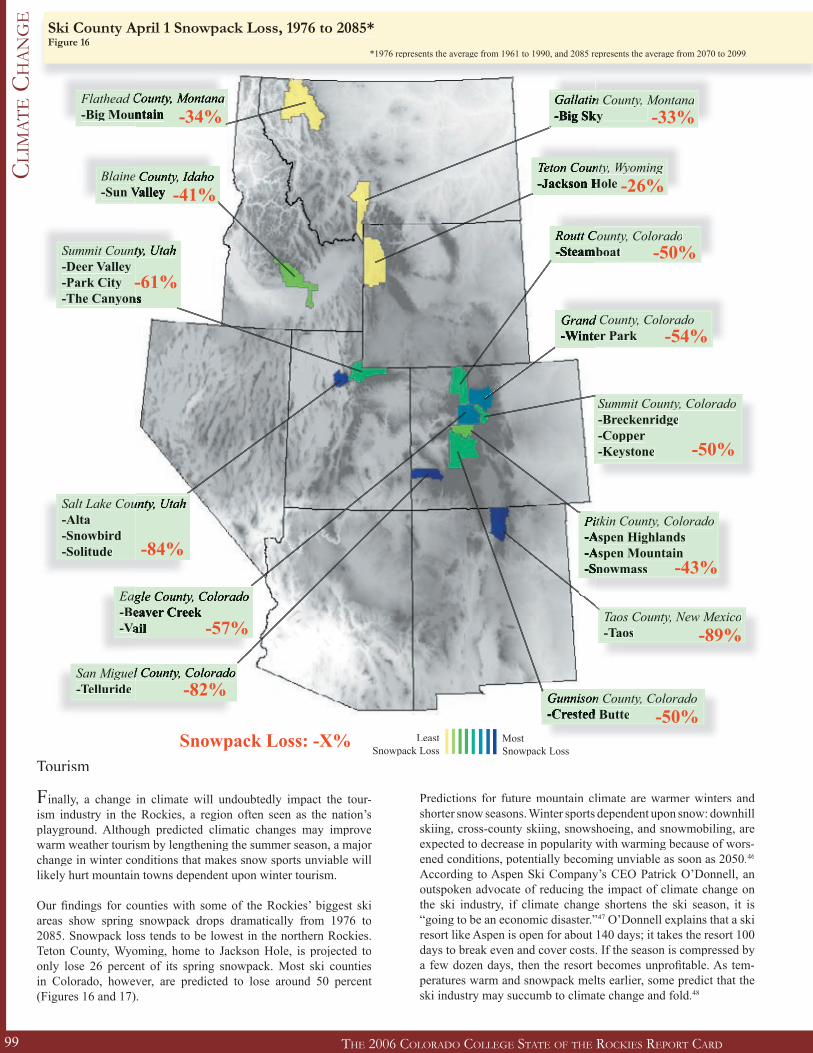
Finally, a change in climate will undoubtedly impact the tour-ism industry in the Rockies, a region often seen as the nation’s playground. Although predicted climatic changes may improve warm weather tourism by lengthening the summer season, a major change in winter conditions that makes snow sports unviable will likely hurt mountain towns dependent upon winter tourism.
Our fi ndings for counties with some of the Rockies’ biggest ski areas show spring snowpack drops dramatically from 1976 to 2085. Snowpack loss tends to be lowest in the northern Rockies. Teton County, Wyoming, home to Jackson Hole, is projected to only lose 26 percent of its spring snowpack. Most ski counties in Colorado, however, are predicted to lose around 50 percent (Figures 16 and 17).
Predictions for future mountain climate are warmer winters and shorter snow seasons. Winter sports dependent upon snow: downhill skiing, cross-county skiing, snowshoeing, and snowmobiling, are expected to decrease in popularity with warming because of wors-ened conditions, potentially becoming unviable as soon as 2050.46
According to Aspen Ski Company’s CEO Patrick O’Donnell, an outspoken advocate of reducing the impact of climate change on the ski industry, if climate change shortens the ski season, it is “going to be an economic disaster.”47 O’Donnell explains that a ski resort like Aspen is open for about 140 days; it takes the resort 100 days to break even and cover costs. If the season is compressed by a few dozen days, then the resort becomes unprofi table. As tem-peratures warm and snowpack melts earlier, some predict that the ski industry may succumb to climate change and fold.48
Ski County April 1 Snowpack Loss, 1976 to 2085*Figure 16
*1976 represents the average from 1961 to 1990, and 2085 represents the average from 2070 to 2099.
Snowpack Loss: -X%

CLI
MA
TE C
HA
NG
E
THE 2006 COLORADO COLLEGE STATE OF THE ROCKIES REPORT CARD99
Other industry experts view climate change as less of a worry for the Rockies’ ski resorts. Vail Resort’s senior vice president, Bill Jenson, argues that the Rocky Mountain region has an inherent advantage over ski resorts across the world because of its rela-tively high altitude. Ski areas at lower elevations in Europe, New England, the Pacifi c Northwest, and the Sierra Nevada will suf-fer rising snowlines and warmer winters before the Rockies.49 A study presented at the Fifth World Conference on Sport and the Environment, December 2003, corroborates Jenson’s opinion. The study found that resorts below 1,500 meters (4,800 feet) would suffer the worst effects of climate change because of a rise in the “snow-reliability” line, which is defi ned as snow cover of 30 to 50 centimeters, for at least seven out of every 10 winters. In general, the resorts in the Rocky Mountain region are well above 1,500 meters.50 It is suggested, however, that many ski resorts are simply afraid to admit the impending problems to the stability of the ski industry because customers may be reluctant to purchase housing or teach their children to ski.51 While resorts contend that snowmaking can buffer any decreased snowpack across the region, snowmaking is expensive and is not a viable option for smaller ski resorts. Because most skiers learn to ski at smaller resorts, either in the Rockies or elsewhere in the country, as these resorts go out of business, the industry’s client base will be greatly diminished. If fewer people learn to ski, large ski resorts will not be able to sell as many passes and may eventually fail.52
Our fi ndings show that the region will experience shorter winters and warmer spring and fall temperatures (Figure 17). As result, summer weather tourism across the region will most likely im-prove. Loomis et al. 1999 attempted to quantify the changes in recreation under climate change. They found that a 2.5°C increase in temperature and a seven percent increase in precipitation would decrease downhill and cross-country skiing by 52 percent and in-crease reservoir (9 percent), beach (14 percent), golf (14 percent), and stream recreation (3.5 percent) relative to 1990 use levels.53
Scott and McBoyle (2001) used a Tourism Climate Index to fi nd that the length and quality of the summer tourism season in the mountains of western Canada would improve substantially under probable climate change.54
To estimate the benefi ts of climate change to summer activities in Rocky Mountain National Park, Richardson et al. surveyed visitors to gather information on recreational experience and willingness-to-pay. This data was projected into the Hadley general circulation model (a predicted increase of 2°F) and the Canadian Climate Cen-ter general circulation model (a predicted increase of 4°F). Rich-ardson et al. concluded that the historical mean willingness-to-pay was about $314.95 per trip and $24.47 per day, per person. The model’s outcome resulted in a 4.9 to 6.7 percent increase ($330.38 to $336.05 per trip) in willingness-to-pay with the temperature and precipitation changes forecasted by the models. With increases in summer temperatures and precipitation, Richardson et al. predict increases in recreation activities like hiking, climbing, and picnics in the region that may offset the economic losses experienced by winter recreation. Given predicted climate changes, tourists will likely be willing to pay more for a summer recreational experience in the mountains, allowing for further investments into summer recreational facilities.55
Change in Ski County Snowpack and Temperature, 1976 to 2085*Figure 17
CLIM
ATE C
HA
NG
ETHE 2006 COLORADO COLLEGE STATE OF THE ROCKIES REPORT CARD 100
*1976 represents the average from 1961 to 1990, and 2085 represents the average from 2070 to 2099.*1976 represents the average from 1961 to 1990, and 2085 represents the average from 2070 to 2099.
Ski Resort Counties
Snowpack, Centimeters (cm) of Snow Water Equivalence on April 1 Temperature, Degrees Celsius
1976
2085
Change, 1976 to 2085 Winter Summer
(cm) Percent 1976
2085
Cha
nge,
197
6 to
208
5
1976
2085
Cha
nge,
197
6 to
208
5
Blaine County, Idaho 14 8 -6 -41% -8 -3 +5 15 24 +9
Eagle County, Colorado 15 6 -8 -57% -10 -5 +5 11 19 +8
Flathead County, Montana 35 24 -12 -34% -8 -3 +5 13 22 +9
Gallatin County, Montana 12 8 -4 -33% -7 -3 +5 14 24 +9
Grand County, Colorado 13 6 -7 -54% -10 -5 +5 11 19 +8
Gunnison County, Colorado 15 8 -8 -50% -12 -7 +5 11 19 +8
Pitkin County, Colorado 26 15 -11 -43% -11 -5 +5 10 18 +8
Routt County, Colorado 16 8 -8 -50% -10 -5 +5 13 21 +8
Salt Lake County, Utah 9 1 -8 -84% -3 3 +6 19 27 +8
San Miguel County, New Mexico 6 1 -5 -82% -6 -0 +5 15 22 +7
Summit County, Colorado 20 10 -10 -50% -9 -4 +5 12 20 +8
Summit County, Utah 13 5 -8 -61% -11 -5 +5 9 17 +8
Taos County, New Mexico 4 0 -4 -89% -5 -1 +5 15 23 +7
Teton County, Wyoming 45 33 -12 -26% -12 -8 +5 10 19 +9

CLI
MA
TE C
HA
NG
E
THE 2006 COLORADO COLLEGE STATE OF THE ROCKIES REPORT CARD101
Looking to the Future
The Rocky Mountain region is in for fundamental changes to the way our climate functions throughout the 21st century, given hu-st century, given hu-st
mans’ patterns of greenhouse gas emissions as projected by both the downscaled HadCM3 and PCM models. Research has show that climactic changes are currently hurting, and will likely further exacerbate threats to ecosystem health, traditional revenue sources of the region, including tourism and agriculture, and the health and comfort of Rockies residents. In order to reduce the negative ef-fects of our changing climate, we may do two things: slow the change by reducing greenhouse gas emissions, and/or adapt to the changing climate.
Mitigation programs that aim to reduce greenhouse gas emissions have been enacted on the national level to lessen the consequences of climate change. Agreements like the Kyoto Protocol, which call for reductions in human-forced greenhouse gasses through a car-bon trading market, aim to decrease the amount of carbon dioxide and other greenhouse gasses.
Although mitigation is an important part of minimizing the ef-fects of global changes, greenhouse gasses have a residence time of many decades or centuries, and emissions from the 20th century will be felt well through the 21st century. This does not excuse poli-st century. This does not excuse poli-st
ticians from creating policy to mitigate greenhouse gasses to re-duce impacts on future generations. It demonstrates the importance of adapting to probable changes in climate. Adaptation entails rec-ognizing the effects of climate change and altering management techniques to work with projected changes. The IPCC outlines a few suggestions for adapting to climate change: allow ecosystems to adapt naturally to climate change, ensure that food production is not threatened, and meet the needs of the current generations without impairing the ability of future generations to meet their own needs.56 In order for the Rockies region to successfully adapt to the outcome of an altered climate, policy makers and residents alike must recognize the probable consequences now and plan for
altered climates and resulting altered lifestyles. The national, re-gional, and local conversations must no longer be centered upon whether the climate is changing, but rather upon what we might do to slow and manage the change.
Endnotes1IPCC, “Climate Change 2001: The Scientifi c Basis” (2001), http://www.grida.no/cli-mate/ipcc_tar/wg1/index.htm.2IPCC, “Climate Change 2001: Impacts, Adaptation and Vulnerability” (2001), http://www.grida.no/climate/ipcc_tar/wg2/index.htm.3T. Barnett et al., “The Effects of Climate Change on Water Resources in the West: Intro-duction and Overview,” Climatic Change 62 (2004), 1-11. 4C. K. Baldwin, F. H. Wagner, and U. Lall, Preparing for a Changing Climate: The Po-tential Consequences of Climate Variability and Change, Rocky Mountain/Great Basin Regional Climate Change Assessment (Logan: Utah State University, 2003), IV-240. Regional Climate Change Assessment (Logan: Utah State University, 2003), IV-240. Regional Climate Change Assessment5IPCC, “Climate Change 2001: Impacts, Adaptation and Vulnerability.” 6IPCC, “Climate Change 2001: The Scientifi c Basis.” 7Ibid7Ibid7 .Ibid.Ibid8U.S. Greenhouse Gas Inventory Program, Inventory of U.S. Greenhouse Gas Emissions U.S. Greenhouse Gas Inventory Program, Inventory of U.S. Greenhouse Gas Emissions U.S. Greenhouse Gas Inventory Programand Sinks: 1990-2000. U.S. Environmental Protection Agency (2002). 9Ibid9Ibid9 .Ibid.Ibid10P. J. Webster and T. N. Palmer, “The Past and the Future of El Nino,” Nature 390 (1997), 562-564. 11IPCC, “Climate Change 2001: Impacts, Adaptation and Vulnerability.” 12D. R. Easterling et al., “Climate Extremes: Observations, Modeling, and Impacts,” Sci-ence 289 (2000), 2068-2074. 13Baldwin, Wagner, and Lall, “Preparing for a Changing Climate: The Potential Conse-quences of Climate Variability and Change, Rocky Mountain/Great Basin Regional Cli-mate Change Assessment,” IV-240. N. Schmidt, A Dry El Nino Winter (Tucson: Climate A Dry El Nino Winter (Tucson: Climate A Dry El Nino WinterAssessment for the Southwest, 2003). 14“NOAA NCDC United States Historical Climatology Network,” http://iridl.ldeo.colum-bia.edu/SOURCES/.NOAA/.NCDC/.USHCN/.15Although earlier temperature and precipitation data are available from some meteorologi-cal stations in this region, 1940 was selected as the starting year for consistency among all stations. 16K. Hayhoe et al., “Emissions Pathways, Climate Change, and Impacts on California,” PNAS 101, no. 34 (2004), 12422-12427. PNAS 101, no. 34 (2004), 12422-12427. PNAS17Ibid17Ibid17 ., IPCC, SIbid., IPCC, SIbid pecial Report on Emissions Scenarios Intergovernmental Panel on Climate ., IPCC, Special Report on Emissions Scenarios Intergovernmental Panel on Climate ., IPCC, SChange (2000). 18Ibid.Ibid.Ibid19Ibid19Ibid19 .Ibid.Ibid20IPCC, Special Report on Emissions Scenarios Final Data (Cambridge: Cambridge Uni-versity Press, 2000. 21S. Lapp et al., “Climate Warming Impacts on Snowpack Accumulation in an Alpine Watershed,” Internation Journal of Climatology 25 (2005), 521-536. S. K. Regonda and B. Rajagopalan, “Seasonal Cycle Shifts in Hydroclimatology Over the Western United States,” Journal of Climate 18 (2004), 372-384. I. T. Stewart, D. R. Cayan, and M. D. Det-

CLIM
ATE C
HA
NG
ETHE 2006 COLORADO COLLEGE STATE OF THE ROCKIES REPORT CARD 102
CLI
MA
TE C
HA
NG
E
THE 2006 COLORADO COLLEGE STATE OF THE ROCKIES REPORT CARD101
tinger, “Changes in Snowmelt Runoff Timing in Western North America Under a ‘Busi-ness as Usual’ Climate Change Scenario,” Climatic Change 62 (2004), 217-232. 22Regonda and Rajagopalan, “Seasonal Cycle Shifts in Hydroclimatology Over the West-ern United States,” 372-384. 23“Global Warming Frequently Asked Questions: Is the Climate Becoming More Variable Or Extreme?” http://www.ncdc.noaa.gov/oa/climate/globalwarming.html#Q7.24A. R. Blaustein and A. Dobson, “Extinctions: A Message from the Frogs,” Nature no. 439 (2006), 143-144. 25Baldwin, Wagner, and Lall, “Preparing for a Changing Climate: The Potential Conse-quences of Climate Variability and Change, Rocky Mountain/Great Basin Regional Cli-mate Change Assessment,” IV-240. 26J. L. Brown, S. H. Li, and N. Bhagabati, “Long-Term Trend Toward Earlier Breeding in an American Bird: A Response to Global Warming?” Ecology 96 (1999), 5565-5569. D. W. Inouye et al., “Climate Change is Affecting Altitudinal Migrants and Hibernating Spe-cies,” PNAS 97, no. 4 (2000), 1630-1633. PNAS 97, no. 4 (2000), 1630-1633. PNAS27D. R. Cayan et al., “Changes in the Onset of Spring in the Western United States,” Bul-letin of the American Meteorological Society 82, no. 2 (2001), 399-415. J. Harte and R. Shaw, “Shifting Dominance within a Montane Vegetation Community: Results of a Cli-mate-Warming Experiment,” Science 267, no. 5199 (1995), 876-880. F. Saavedra et al., “Changes in Flowering Abundance of Delphinium Nuttallianum (Ranunculaceae) in Re-sponse to a Subalpine Climate Warming Experiment,” Global Change Biology 9 (2003), 885-894. 28Lapp et al., “Climate Warming Impacts on Snowpack Accumulation in an Alpine Wa-tershed,” 521-536. 29Cayan et al., “Changes in the Onset of Spring in the Western United States,” 399-415. 30Inouye et al., “Climate Change is Affecting Altitudinal Migrants and Hibernating Spe-cies,” 1630-1633. 31Brown, Li, and Bhagabati, “Long-Term Trend Toward Earlier Breeding in an American Bird: A Response to Global Warming?” 5565-5569. 32Inouye et al., “Climate Change is Affecting Altitudinal Migrants and Hibernating Spe-cies,” 1630-1633. 33J. Harte, Discussion at the Rocky Mountain Biological Laboratory (2005).34R. L. Peters and J. D. S. Darling, “The Greenhouse Effect and Nature Reserves: Global Warming would Diminish Biological Diversity by Causing Extinctions among Reserve Species,” Bioscience 35 (1985), 707-717. 35H. B. Britten, P. F. Brussard, and D. D. Murphy, “The Pending Extinction of the Uncom-pahgre Fritillary Butterfl y,” Conservation Biology 8, no. 1 (1994), 86-94. 36Saavedra et al., “Changes in Flowering Abundance of Delphinium Nuttallianum (Ranun-
culaceae) in Response to a Subalpine Climate Warming Experiment,” 885-894. 37Harte and Shaw, “Shifting Dominance within a Montane Vegetation Community: Results of a Climate-Warming Experiment,” 876-880. 38A. Hansen and V. Dale, “Biodiversity in the US Forests Under Global Climate Change,” Ecosystems 4 (2001), 161-163. 39A. M. Thomson et al., “Climate Change Impacts for the Conterminous USA: An Inte-grated Assessment. Part 4: Water Resources.” Climatic Change 69 (2005), 67-88. 40Barnett et al., “The Effects of Climate Change on Water Resources in the West: Introduc-tion and Overview,” 1-11. 41Baldwin, Wagner, and Lall, “Preparing for a Changing Climate: The Potential Conse-quences of Climate Variability and Change, Rocky Mountain/Great Basin Regional Cli-mate Change Assessment,” IV-240. 42Ibid42Ibid42 .Ibid.Ibid43Ibid.Ibid.Ibid44D. S. Ojima, J. M. Lackett, and the Central Great Plains Steering Committee and Assess-ment Team, Preparing for a Changing Climate: The Potential Consequences of Climate Variability and Change- Central Great Plains 2002, i-94. 45Baldwin, Wagner, and Lall, “Preparing for a Changing Climate: The Potential Conse-quences of Climate Variability and Change, Rocky Mountain/Great Basin Regional Cli-mate Change Assessment,” IV-240. 46Global Environmental Change Report, “Aspen Skiing Company Not Snowed by Warm-ing Predictions,” Global Environmental Change XVI, no. 2 (2004), 9-10. 47J. Erickson, “Bleak Forecast for Ski Industry: Warmer Temps May Put Resorts in Deep Freeze,” Rocky Mountain News, 2005. 48Ibid.Ibid.Ibid49Ibid49Ibid49 .Ibid.Ibid50Global Environmental Change Report, “Ski Industry Faces Uphill Climb Against Global Warming,” Global Environmental Change XVI, no. 2 (2004), 4. 51Global Environmental Change Report, “Aspen Skiing Company Not Snowed by Warm-ing Predictions,” 9-10. 52Global Environmental Change Report, “Ski Industry Faces Uphill Climb Against Global Warming,” 4. 53R. B. Richardson and J. B. Loomis, “Adaptive Recreation Planning and Climate Change: A Contingent Visitation Approach,” Ecological Economics 50 (2004), 83-99. 54Ibid54Ibid54 .Ibid.Ibid55R. B. Richardson and J. B. Loomis, “Climate Change and Recreation Benefi ts in an Al-pine National Park,” Journal of Leisure Research 37, no. 3 (2005), 307-320. 56IPCC, “Climate Change 2001: Impacts, Adaptation and Vulnerability.”