2006.1 .4 10/26 - kansai.co.jp · paints have grown sharply at goodlass nerolac paints ltd. in...
TRANSCRIPT

ANNUAL REPORT ���� Year Ended March 31, 2006

Since its founding in 1918, Kansai Paint Co., Ltd. ("the Company") has grown steadily to take world center stage as Japan's largest and most
advanced manufacturer of paints and coatings.
The broad product assortment we supply does more than just protect and beautify things all over the world, including in Japan, Europe, and the
Americas as well as in China, India, and other Asian countries. Furnished with special functions, our products perform an important role, earning a
reputation for excellence and reliability in a variety of fields. Our automotive coatings are especially welcomed and widely used by many auto
manufacturers, resulting in our high share of the market. In other areas we continue to work to accommodate every potential object that could
benefit from paint/coatings, ranging from a variety of industrial products,
housing and office buildings, to ships, bridges, plants, and other steel structures.
Kansai Paint, therefore, does not stop at supplying customers through our joint venture and affiliated companies the world over—we take the
additional step of transforming the benefits and knowledge derived from our unceasing R&D into technology-based services beneficial to
customers.
There is more to Kansai Paint, however. We take a positive, constructive stance toward environmental issues, which have been drawing rising
interest in recent years. This is indicated by the launch of our corporate policy on the global environment in 1992 and our role as a founding
member of the Japan Responsible Care Council (JRCC) in 1995. Working to preserve the global environment and protect human safety and health,
we conduct activities to protect the environment from a comprehensive viewpoint, based on our philosophy of "sustainable development." The
progress of these activities is reported upon in our "Environmental & Social Report 2006," which provides figures based on environmental accounting.
In addition, the Kansai Paint Group is striving to earn the trust of international society, as we continue to work to protect precious resources
and preserve the natural environment.
ALESCO, our corporate brand, exemplifies the superior value and quality provided by Kansai Paint and its Group companies.
CONTENTS P r o f i l e1
2
3
6
7
99
11
12
13
14
15
17
19
20
2121
22
23
25
26
27
28
36
37
Profile
Financial Highlights
Message from the President
Topic
Research & Development
Review of OperationsAutomotive CoatingsIndustrial CoatingsDecorative CoatingsMarine and Protective CoatingsNew Businesses
Overseas Business
Environmental Conservation and Social Contributions
Board of Directors / Corporate Data
Organization Chart
FinancialFinancial ReviewFive-year Summary of Selected Financial DataConsolidated Balance SheetsConsolidated Statements of IncomeConsolidated Statements of Shareholders' EquityConsolidated Statements of Cash FlowsNotes to Consolidated Financial StatementsIndependent Auditors' Report
Directory
1 Profile 2Financial Highlights

Dear ShareholdersKansai Paint and its Group companies follow a simple but deep-rooted
business philosophy, which is to contribute to society by providing products and services that satisfy customers. We work constantly to
improve customer satisfaction by supplying high value-added products and services at low cost while keeping safety and the environment in
mind. This is the fundamental reason for the existence of the Company and its Group. By doing so, our intention is to enhance shareholder value
and strengthen business foundations with the ultimate goal of rewardingstakeholders and contributing to society in the broadest sense.
Summary of Business Results as of End-March 2006 Detailed figures for the term under review, (fiscal year ended March 31,
2006) are stated in the latter part of this annual report. To summarize, consolidated net sales increased to ¥210,965 million (approximately
US$1,796 million), a rise of about 7.2% on the year. Consolidated operating income rose to ¥18,903 million (approximately US$161 million),
up about 7.8% on the year, and consolidated net income climbed to ¥12,049 million (approximately US$103 million), likewise up about 18.2%.
With your support, we were able to surpass all targets and post favorable increases in both sales and profits for the fourth consecutive year. These
results can be attributed to the ability of the Group to utilize corporate resources to the maximum, to the enhanced strength of Group-wide
management, achievement of total cost reduction, and enhanced global
strategies, as well as to our customers, who recognize the value of ourproducts. Dividends were raised by 2 yen, from 8 yen to 10 yen per share.
Looking back over the term under review, it is clear that though the Japanese economy was negatively impacted by rising crude oil and
materials prices, clearly the economy was on a steady road to recovery due to rising corporate revenues stemming from stronger capital
investment, a higher volume of exports to expanding economies overseas, and improved employment figures, which lead to stronger consumer
spending. Japanese car manufacturers stepped up production to out-perform the previous year, and our company was able to meet the needs
of the market with high performance coatings and environment-friendly technologies. In the industrial coating sectors, sales grew for machinery
coatings and ceramic building materials. In decorative coatings, in addition to expanding upon sales of eco-friendly products, we developed heat
barrier rooftop coatings and high-performance exterior coatings.
The world economy clearly continued on a course of recovery despite the impact of steeply rising crude oil prices on individual countries economies.
Because Japanese auto manufacturers boosted production overseas, sales were robust at our subsidiaries in India, Thailand, Indonesia,
Malaysia, and so on. Further, in order to respond to increasing demand, we built new plants in Tianjin, China, and in the outskirts of Delhi, India, the launch
of which has gone smoothly. In North America and Europe, PPG Kansai Automotive Finishes (PKAF)—a joint venture company with the U.S.-based
PPG Industries, is seeing good performance. In India, sales of construction materials have grown sharply at Goodlass Nerolac Paints
Ltd. In Malaysia, we have acquired a new construction coatings facility, w h i c h w e h a v e
made into a subsidiary.
Corporate Governance
In the Company's view, strengthening corporate governance is a crucial
PPG Industries, is showing good performance. In India, sales of decorative paints have grown sharply at Goodlass Nerolac Paints Ltd. In Malaysia, we
have acquired a paint manufacturer known in the region for its decorativepaints, which we have made into a subsidiary.
Corporate GovernanceIn the Company's view, strengthening corporate governance is a crucial
management task that paves the way for the ongoing enhancement of corporate value. To implement this task, the Board of Directors meets at
least once per month, makes decisions on important matters determined by laws and ordinances, Board rules, and the Articles of Association, and
reports on the progress of management plans. After thorough discussions, the Board makes resolutions on significant business-related issues and
the decisions are implemented. I myself am the chairman of ourCorporate Governance Committee, which works to promote compliance
and ensure that it sticks; handling of crisis management strategy formulation and response; and to develop internal control of business, and
active disclosure and management of information related to corporate activity. In a related move, we are working to broaden our information
disclosure system through stepping up the issuance of press releases and upgrading our website to enhance corporate transparency.
Outlook for the Current Fiscal YearThe Japanese economy is expected to continue on a steady course of
recovery despite factors that affect the economy as a whole, such as
rising crude oil prices, exchange rate fluctuations, and interest rate trends. Domestic auto production, which is not expected to increase dramatically
in the future, remained at approximately the same levels as last year. Overseas, however, markets are growing rapidly in India, Southeast Asia,
China, etc. We are in a leading position in these markets and, as a result of providing improved technologies and services, in addition to steps to
expand production such as a joint venture with an Indian powder-coating manufacturer, a buyout of a Malaysian decorative paint manufacturer,
expanded facilities in Thailand, Indonesia, Taiwan, China, and more, we expect to see continued sales revenues and profits. In the United States,
PKAF, the result of a new alliance with PPG, is expected to see robust growth.
However, market competition is also intensifying due to the progress of globalization. Facing this situation, the Kansai Paint Group is leveraging
the resources of every Group company in accordance with the strategy described below. This means that we are cultivating the development of
profit-oriented businesses while making targeted efforts to reformoperations and strengthen business foundations.
Our goal is to be an "Excellent Global Company." As the first step in reaching that goal, our targets for the current fiscal year (the year ending
March 31, 2007) are consolidated net sales of ¥220,000 million (approximately US$1,873 million), consolidated operating income of
¥22,500 million (approximately US$192 million), and consolidated net income of ¥13,500 million (approximately US$115 million). All of these
targets are higher than those of last year.
Outlook: Issues and Business Strategy1) Boosting Competitive Strength
We believe that true competitive strengths come from constantly improving customer satisfaction by providing high value-added products
"Th e s e a r e f u s e s n o r i v e r "We offer innovative products and high value-added servicesthat meet the needs of customers in every corner of the world.
Message from the President3 4

income of ¥13,500 million (approximately US$115 million). All of thesetargets are higher than those of previous term.
Outlook: Issues and Business Strategy1) Boosting Competitive Strength
We believe that true competitive strengths come from constantly improving customer satisfaction by providing high value-added products
and services at low cost while keeping safety and the environment uppermost in mind. This is why we are putting yet more effort into R&D to
develop appealing products for our customers that meet the needs of the market and are globally competitive. On top of this we intend to boost
profitability through total cost reductions derived from increasing task efficiency.
2) Reinforcing Group BusinessKansai Paint is reviewing the total business structure of Kansai Paint and
its Group companies, concentrating our business resources, and carrying out priority investments in paints and coatings as well as peripheral areas.
Sharing common values and strategy group-wide will maximize the benefits of the ensuing synergy.
3) GlobalizationTo ensure our competitive advantage in international markets, we are
stepping up cooperation with overseas Group companies and businesspartners, especially in Europe and North America, as well as Southeast
Asia, India, and China. And our overseas businesses are contributing in growing measure to our consolidated business results.
4) Carrying Out Our Social ResponsibilitiesThe raison d’etre for a company is how it lives up to its social
responsibility, or in other words it can be said that companies that do not live up to their social responsibilities cease to develop. The original mission
of the paints and coatings industry is to preserve resources, decorate the world, protect the environment, and help build and sustain a more
enriched society.
Our efforts to protect the environment are covered in more detail in our "Environmental & Social Report 2006." Here, however, it is worth
mentioning some of our most significant contributions to protect the environment. These include several unique developments: our Waterborne
3-Wet Metallic Finish System, our water-based primer and topcoat for body shops, development and practical use of corn and other plant-based
paints, and more. By thus working to preserve and protect the environment for future generations, we are gaining the confidence of the
global community. In short, we are carrying out our corporate social responsibilities faithfully by providing thorough information disclosure on
compliance, as we indicated above.
The indispensable factor that enables a corporation to fulfill its social responsibilities is conducting business in a sound manner.
To a manufacturer such as Kansai Paint, the key conditions that ensure our continued growth as an Excellent Global Company, based in the spirit
of “The Vast Ocean Does Not Choose the Rivers that Flow Into It”, are locating new demand in the world wherever it is, and offering appropriate
products and services in a timely manner. To achieve these goals, Kansai Paint and its Group companies are working to develop technologies in line
with a global perspective on future trends. And we hope that this Annual Report will give you a grasp of what we are doing and how far we have
ConclusionThe indispensable factor that enables a corporation to fulfill its social
responsibilities is conducting business in a sound manner. To a manufacturer such as Kansai Paint, the key conditions that ensure our
continued growth as an "Excellent Global Company," based in the spirit of "The sea refuses no river," are locating new demand in the world wherever
it is, and offering appropriate products and services in a timely manner. To achieve these goals, Kansai Paint and its Group companies are working to
develop technologies in line with a global perspective on future trends. And we hope that this Annual Report will give you a grasp of what we are
doing and how far we have progressed.
The 4th PAINT SHOW 2006, a festival of the paints and coatings industry held every four years, took place at Tokyo Big Sight from April 6 through
April 8, 2006. The event is largely organized by the Japan Paint Manufacturers Association. In light of his capacity as Chairman of the
Association, Shoju Kobayashi, President of Kansai Paint, also served as Chairman of the Paint Show Executive Committee.
The PAINT SHOW 2006, under the theme of "PAINTING ON! FUTURE / Paint technology for a colorful life," displayed paint function and initiatives
alongside the latest industry technologies through entertaining programs. There were 194 exhibitors (firms and organizations) exhibiting, and the
number of visitors topped 120,000.
The Kansai Paint exhibit theme of "Painting for Human Life," showcased our cutting-edge technologies and eco-friendly products for the building
and construction market and the auto refinishes market with a European-style town display. Here we showed a great number of the latest 21st-
century technologies and other attractions.
President Shoju Kobayashi
T o p i c
Message from the President Topic 65

Based on a common global vision, Kansai Paint and its Group companies conduct wide ranging, innovative research facilitating the
development of new products to meet the needs of broad user segmentsin a timely manner.
During the consolidated term under review, the total R&D expenditures of Kansai Paint and its Group companies amounted to ¥5,274 million,
and a total of 577 personnel were engaged in R&D.
The following is an overview of the Company’s R&D by businesssegment.
CoatingsBasic Research
Our basic research in this field consists of work on basic technologies such as polymer synthesis, cross-linking, intersurface control, face
separation, etc., to generate new technologies to achieve environmental preservation, energy efficiency, process-saving, and high performance.
Meanwhile, in the area of observational and analytical research, we are
working to further improve the quality of our coatings amidst the current trend toward a dramatic increase in the use of water-based productions.
To achieve these, we are working on developing evaluative and analyticaltechnologies related to the physical, organizational, and morphological
aspects of the various phenomena occurring in the process of paint
production, application, and film forming, thus proceeding with appropriate product development. In addition, related to laws pertaining to environmental
substances, we are developing precise analytical technologies that can detect substance levels lower than those stipulated in regulations, and
we are promoting compliance to ensure that all of our products exhibit minimum stress on the environment.
Color Design ResearchIn developing colors for automobiles, we have continued to consult with
domestic users on their preferences, in addition to providing colors to users in the Southeast Asian region based on research on local trends in
color choices.
In the industrial coatings and decorative coatings segments, we have focused on design proposals for residential housing as well as color
designs for large-scale collective housing refinishes.
System & Process ResearchIn system and process development, drawing on technologies for multi-
color spray guns, we also engaged in new development of multi-pattern application systems. We then succeeded in developing new textures such
as lacquer-look and mother-of-pearl-look products. In addition, through research on picture analysis technology using computers, we developed
color control techniques for patterns as well as simulation technologies. In coatings and process development, in addition to research on
application technologies for spray paint guns, we are also engaged in new development of multi-tone film coating systems such as lacquer-look and
mother-of-pearl inlay-look products. In addition, through research on picture analysis technology using computers, we developed color control
techniques for patterns as well as simulation technologies.
In coatings resources, we have continued on the previous term with development of high-value-added materials fusing future-oriented paints
and painting systems, with the objectives of enhancing eco-friendliness, saving resources and energy, streamlining processes, and upgrading
R e s e a r c h & D e v e l o p m e n tPaint & Coating Development
In coatings resources, we have continued on the previous term with development of high-value-added materials fusing future-oriented paints
and painting systems, with the objectives of enhancing eco-friendliness, saving resources and energy, streamlining processes, and upgrading
performance.
In the area of environment-friendly technologies, we have developed and commercialized water-based products and high solid technologies in the
automotive coatings sector. We have also promoted the use of water-based products in industrial and decorative coatings, developing products
with a view to eventually rendering all of our products water-based, starting with multi-pattern water based coatings.
In addition, in the area of performance enhancement, we have continued to engage in system and product development with a view to achieving dirt-and-
stain resistance and scratch resistance, as well as superior design.
During the term under review, Kansai Paint's expenditures on research and development in the paint business amounted to ¥4,948 million.
New BusinessesHere we pushed ahead with the development of new technologies
and products in communication, electronics, and environmental biotechnology-related areas. In electronics and communications, we
developed a series of liquid photoresist materials that can accommodate a wide range of laser sources for manufacturing flat panel displays, as well
as resist ink materials for high-definition screen printing. Further, we went ahead with research with a view to developing optical waveguide
formation technology for promising electro-optical printed circuit boards. In environmental biotechnology, we looked into applications for KP Pearl,
our microorganism carrier for advanced sewage treatment of wastewater. In addition, we worked on broadening applications for the BEL System, our
immobi l i z ing sys tem of b iocata lys t microorganisms and enzymes. Lastly, we
made steady progress in research on improving the environment.
During the term under review, the Company's expenditures on R&D in New Businesses
amounted to ¥326 million.
Research & Development7 8
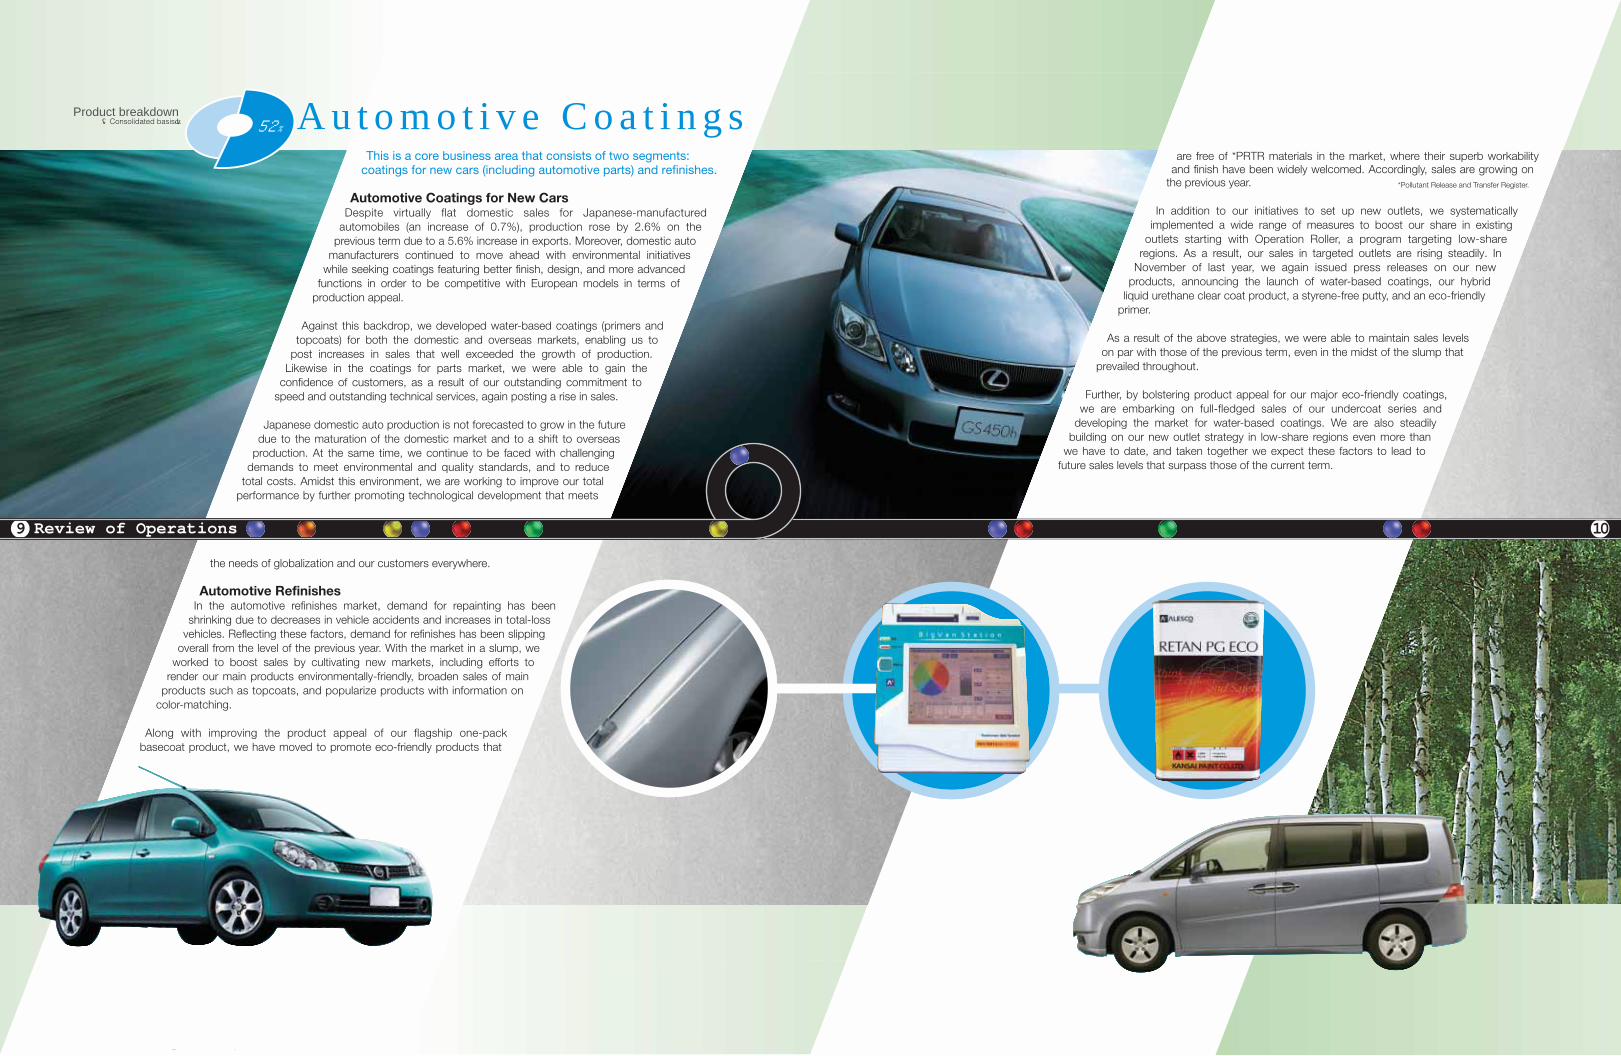
This is a core business area that consists of two segments:coatings for new cars (including automotive parts) and refinishes.
Automotive Coatings for New CarsDespite virtually flat domestic sales for Japanese-manufactured
automobiles (an increase of 0.7%), production rose by 2.6% on the previous term due to a 5.6% increase in exports. Moreover, domestic auto
manufacturers continued to move ahead with environmental initiatives while seeking coatings featuring better finish, design, and more advanced
functions in order to be competitive with European models in terms of production appeal.
Against this backdrop, we developed water-based coatings (primers and topcoats) for both the domestic and overseas markets, enabling us to
post increases in sales that well exceeded the growth of production. Likewise in the coatings for parts market, we were able to gain the
confidence of customers, as a result of our outstanding commitment to speed and outstanding technical services, again posting a rise in sales.
Japanese domestic auto production is not forecasted to grow in the future due to the maturation of the domestic market and to a shift to overseas
production. At the same time, we continue to be faced with challenging demands to meet environmental and quality standards, and to reduce
total costs. Amidst this environment, we are working to improve our total performance by further promoting technological development that meets
the needs of globalization and our customers everywhere.
Automotive RefinishesIn the automotive refinishes market, demand for repainting has been
shrinking due to decreases in vehicle accidents and increases in total-loss vehicles. Reflecting these factors, demand for refinishes has been slipping
overall from the level of the previous year. With the market in a slump, we worked to boost sales by cultivating new markets, including efforts to
render our main products environmentally-friendly, broaden sales of main products such as topcoats, and popularize products with information on
color-matching.
Along with improving the product appeal of our flagship one-pack basecoat product, we have moved to promote eco-friendly products that
coating, where its superb workability and finish have been widely welcomed. Accordingly, sales are growing on the previous year.
In addition to our initiatives to set up new outlets, we systematically implemented a wide range of measures to boost our share in existing
outlets starting with Operation Roller, a program targeting low-share regions. As a result, our sales in targeted outlets are rising steadily. In
November of last year, we again issued press releases on our new products, announcing the launch of water-based coatings, our hybrid two-
pack liquid urethane clear coat product, a styrene-free two-pack putty, and an eco-friendly primer surfacer.
As a result of the above strategies, we were able to maintain sales levels on par with those of the previous term, even in the midst of the slump that
prevailed throughout.
Further, by bolstering product appeal for our major environment-friendly coatings, we are embarking on full-fledged sales of our undercoat series
and developing the market for water-based coatings. We are also steadily building on our new outlet strategy in low-share regions even more than
we have to date, and taken together we expect these factors to lead to
are free of *PRTR materials in the market, where their superb workability and finish have been widely welcomed. Accordingly, sales are growing on
the previous year.
In addition to our initiatives to set up new outlets, we systematically implemented a wide range of measures to boost our share in existing
outlets starting with Operation Roller, a program targeting low-share regions. As a result, our sales in targeted outlets are rising steadily. In
November of last year, we again issued press releases on our new products, announcing the launch of water-based coatings, our hybrid
liquid urethane clear coat product, a styrene-free putty, and an eco-friendly primer.
As a result of the above strategies, we were able to maintain sales levels on par with those of the previous term, even in the midst of the slump that
prevailed throughout.
Further, by bolstering product appeal for our major eco-friendly coatings, we are embarking on full-fledged sales of our undercoat series and
developing the market for water-based coatings. We are also steadily building on our new outlet strategy in low-share regions even more than
we have to date, and taken together we expect these factors to lead to future sales levels that surpass those of the current term.
A u t o m o t i v e C o a t i n g sA u t o m o t i v e C o a t i n g s
*Pollutant Release and Transfer Register.
Product breakdown(Consolidated basis) 52%
9 Review of Operations 10

The Industrial Coatings area is broad, ranging from construction materials, beverage cans, and home electric appliances to
construction and industrial machinery. The construction materials category includes Pre-Coated Metal (PCM) coatings and
Electrodeposition (ED) coatings for aluminum sashes.
Sales for the industrial coatings segment as a whole rose on the previous term. We faced a declining market for coatings for beverage cans due to
the growing demand for PET bottles and film-laminated cans, which led to a decline in sales on the previous year. In contrast, sales rose for coatings
in the industrial machinery market including construction machinery and machine tools due to robust exports to North America and Oceania—a
trend that continued from the previous year. Sales also rose for coatings made for ceramic building materials due to an expanded market in this
area.
In addition, sales overseas continue to expand due to a greater volume of coatings and coating technology services supplied to Japanese
manufacturers as they further expand production in foreign countries. Particularly remarkable is the rise in sales for PCM coatings at Taiwan
Kansai Paint. Finally, in India, we acquired a 100%-owned subsidiary called Polycoat Powders Ltd., an Indian powder-coating manufacturer.
Although this area covers all buildings, including housing, commercial buildings, and public facilities, it primarily consists of two markets:
coatings for repair and maintenance and coatings for new buildings.Most recently, demand for coatings for repair and maintenance has
been growing within the structure of domestic demand. At the same time, eco-friendly paint is playing the starring role in the
category of new products.
The domestic market for decorative coatings continued to encounter trying conditions, characterized by falling numbers of public works and
declining prices for paint projects. Consequently, we aggressively developed markets for paints that comply with the April 2004 revision of
"Standard Specifications for New Construction and Repairs," issued by the Ministry of Land, Infrastructure and Transport (MLIT), concentrating on
increasing sales of coatings for repairing and maintaining family homes and condominiums.
In addition, in response to the trend toward a focus on environmental issues, we announced and worked to expand sales of eco-friendly
products, including improved heat barrier rooftop coatings, high value-added interior decorative coatings, and high-performance exterior
coatings. Despite these efforts, however, we were unable to offset shrinking demand and sales dropped slightly below
last year’s levels.
In contrast, decorative coatings sales in India grew dramatically due to the remarkable growth of the
Indian economy: total sales of decorative coatings improved approximately 4% during the consolidated
term under review. We are taking additional steps to expand sales of decorative coatings in Southeast
Asia, having acquired a decorative coatings company in Malaysia.
Review of Operations11 12
I n d u s t r i a l C o a t i n g sI n d u s t r i a l C o a t i n g sProduct breakdown(Consolidated basis)
22% Product breakdown(Consolidated basis) D e c o r a t i v e C o a t i n g sD e c o r a t i v e C o a t i n g s21%
Reflective Color
Standard Color

The Company is energetically cultivating business in promising new markets, such as the communications & electronics and
environment & biotechnology segments.
We worked on broadening applications for the BEL system, our immobilizing system for micro-organism biocatalysts. Using this
technology, we proceeded to develop KP Pearl, our micro-organism carrier for sewage treatment of waste water. Sales in our environmental
biotechnology segment fell on the previous term due to intensifying competition in the area of micro-organism carriers for waste-water
treatment in septic tanks. We also made steady progress on our electric-wave-absorption
system for Electronic Toll Collection (ETC) systems. Sales fell slightly, however, in the
communications & electronics sector despite increasing domestic production of flat panel
displays, which could not offset significantly dropping exports.
In the environmental biotechnology and electronics segments, we developed hydrogel
sponge carriers and resist ink materials for high definition screen printing respectively.
Revenues are expected to increase for the current term due to a focus on expanding sales
of etching resist materials in tandem with flat
panel display production. We can also expect sales to expand for photoresist materials for
glass etching.
N e w B u s i n e s s e sProduct breakdown(Consolidated basis) Marine and Protective CoatingsMarine and Protective Coatings
This area covers coatings for ships, marine containers, marine structures, bridges, and chemical plants. Here, our main markets
are coatings for ships and coatings for steel structures.
Although the new ship market was quite brisk, backed by the firm tone of the global economy, there was a notable tendency in the market for ship
repair to delay docking for repairs because of high demand in China and heavy freight on routes to Europe and North America as well as steep
rises of charges for freight. These factors had negative effects on sales. In addition, increases in costs due to skyrocketing rises in the price of main
materials had a negative, challenging impact on the entire marine paint industry. In China, however, the market for marine container coatings was
brisk.
The steel structures segment faced a difficult domestic market due to a significant fall-off of orders from the government agencies. In response, we
worked to reinforce our negotiating ability so that we can receive project bids for process-saving paints from both private companies and
government agencies. In efforts to penetrate the market, we ensure that our projects meet the MLIT Standard specifications on projects such as
railways and bridges, government-run oil tanks, as well as major power plant specifications, and more. This achievement, however, failed to
compensate for the significant decline in the demand for new bridges, a sector that constitutes a large share of our company’s sales. As a result,
net sales of steel structure coatings fell slightly on the previous term.
5%
Review of Operations13 14

Goodlass Nerolac Paints Ltd.P.T. Kansai Paint Indonesia
Kansai Paint (Singapore) Pte. Ltd.Kansai Paint (Asia) Pte. Ltd.
Sime Kansai Paints Sdn. Bhd.Kansai Coatings Malaysia Sdn. Bhd.
Thai Kansai Paint Co., Ltd.Kansai Resin (Thailand) Co., Ltd.
Kansai Paint Philippines, Inc.Taiwan Kansai Paint Co., Ltd.
Kansai Paint H.K. Ltd.Shenyang Kansai Paint Co., Ltd.
Tianjin Cosco Kansai Paint & Chemicals Co., Ltd.Tianjin Winfield Kansai Paint & Chemicals Co., Ltd.
Chongqing Kansai Paint Co., Ltd.Hunan Xiangjiang Kansai Paint Co., Ltd.
Shanghai Cosco Kansai Paint & Chemicals Co., Ltd.Guangzhou Kansai Paint Co., Ltd.
Suzhou Kansai Paint Co., Ltd.KDK Automotive Coatings Co., Ltd.
Kansai Paint conducts business on a global scale, with operations in Japan, Europe, the Americas, Southeast Asia, India, and China.
The main focus of the company’s activities overseas is Asia, and we work to strike an appropriate balance between the three areas of India, China,
and the ASEAN countries.
In North America and Europe, PPG Kansai Automotive Finishes—a joint venture company with the U.S.-based PPG Industries, whose main
products are automotive coatings, is witnessing good performance.
Due to the robust economy of the Asian region, Goodlass Nerolac Paints, Ltd. (GNP, India), Thailand Kansai Paint, P.T. Kansai Paint Indonesia, Sime
Kansai Paints Sdn. Bhd. (Malaysia), Taiwan Kansai Paint, and more are all performing excellently for the term under review, bringing in both increased
revenues and profits.
As for new investment, we constructed a new plant in Changsha City to accommodate dramatically increasing automobile production in China, and
Hunan Xiangjiang Kansai Paint is now operating smoothly. We have also completed construction of facilities and launched production for a new GNP
plant in Delhi, India, which targets the growth market. In addition, we upped our investment ratio in the top Indian powder-coating manufacturer, Polycoat
Powders, Ltd., from 40% to 100%.
In the decorative coatings segment, we acquired Sime Coatings, a local paint manufacturer to establish a new subsidiary company, Kansai Coatings
Malaysia Sdn. Bhd. (Capital ratios stood at 45% for Kansai Paint and 55% for GNP.)
On the whole, as a result of expanded production, particularly in the automotive coatings and industrial coatings segments, our overseas
subsidiaries posted increased sales in total.
O v e r s e a s B u s i n e s s O v e r s e a s B u s i n e s s
EuropeKansai Paint Europe Limited
PPG Kansai Automotive Finishes UK, LLP
Asia
AmericasKansai Paint (America), Inc.
PPG Kansai Automotive Finishes U.S., LLCPPG Kansai Automotive Finishes Canada, LP
PPG ALESCO Automotive Finishes Mexico, S.de. R.L. de C.V.
Goodlass Nerolac Paints Ltd. Tianjin Winfield Kansai Paint & Chemicals Co., Ltd. P.T. Kansai Paint Indonesia
Taiwan Kansai Paint Co., Ltd. Kansai Coatings Malaysia Sdn. Bhd. Kansai Resin (Thailand) Co., Ltd.
Hunan Xiangjiang Kansai Paint Co., Ltd.
Kansai Paint (Singapore) Pte. Ltd.
Overseas Business15 Europe Asia Americas 16
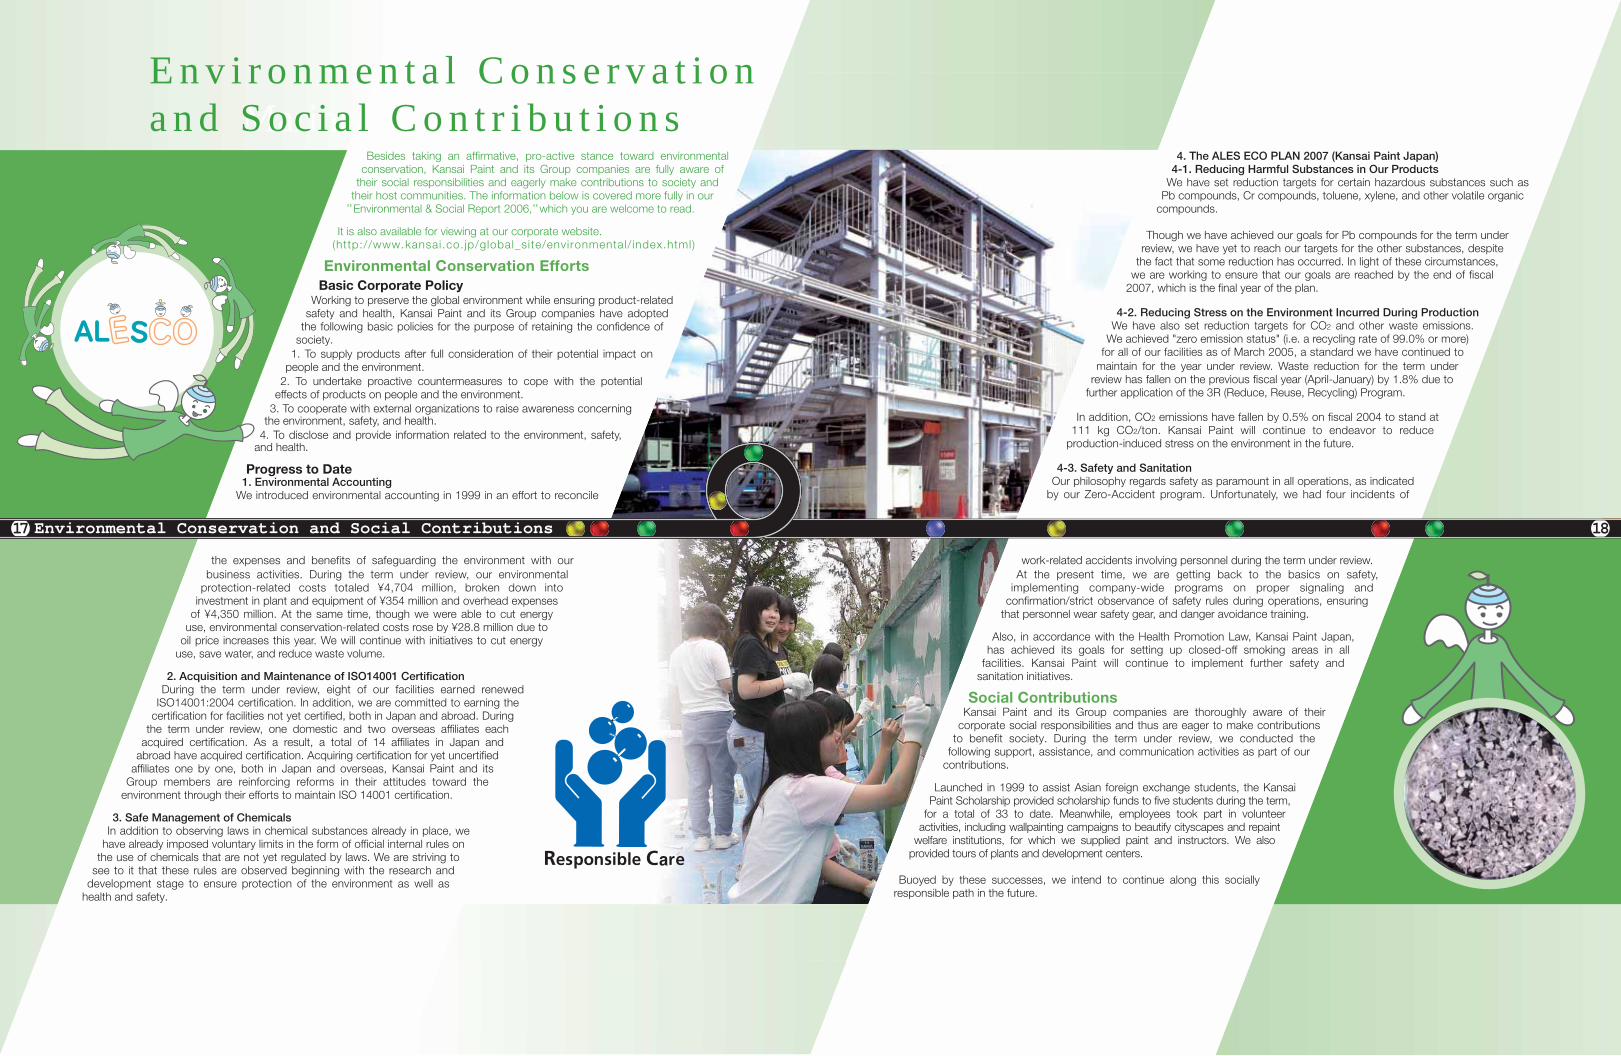
Besides taking an affirmative, pro-active stance toward environmental conservation, Kansai Paint and its Group companies are fully aware of
their social responsibilities and eagerly make contributions to society and their host communities. The information below is covered more fully in our " Environmental & Social Report 2006," which you are welcome to read.
It is also available for viewing at our corporate website.(http://www.kansai.co. jp/global_site/environmental/ index.html)
Environmental Conservation EffortsBasic Corporate Policy
Working to preserve the global environment while ensuring product-related safety and health, Kansai Paint and its Group companies have adopted
the following basic policies for the purpose of retaining the confidence of society.
1. To supply products after full consideration of their potential impact on people and the environment.
2. To undertake proactive countermeasures to cope with the potential effects of products on people and the environment.
3. To cooperate with external organizations to raise awareness concerning the environment, safety, and health.
4. To disclose and provide information related to the environment, safety, and health.
Progress to Date1. Environmental Accounting
We introduced environmental accounting in 1999 in an effort to reconcile
the expenses and benefits of safeguarding the environment with ourbusiness activities. During the term under review, our environmental
protection-related costs totaled ¥4,704 million, broken down into investment in plant and equipment of ¥354 million and overhead expenses
of ¥4,350 million. At the same time, though we were able to cut energy use, environmental conservation-related costs rose by ¥28.8 million due to
oil price increases this year. We will continue with initiatives to cut energy use, save water, and reduce waste volume.
2. Acquisition and Maintenance of ISO14001 CertificationDuring the term under review, eight of our facilities earned renewed
ISO14001:2004 certification. In addition, we are committed to earning the certification for facilities not yet certified, both in Japan and abroad. During
the term under review, one domestic and two overseas affiliates each acquired certification. As a result, a total of 14 affiliates in Japan and
abroad have acquired certification. Acquiring certification for yet uncertified affiliates one by one, both in Japan and overseas, Kansai Paint and its
Group members are reinforcing reforms in their attitudes toward the environment through their efforts to maintain ISO 14001 certification.
3. Safe Management of ChemicalsIn addition to observing laws in chemical substances already in place, we
have already imposed voluntary limits in the form of official internal rules on the use of chemicals that are not yet regulated by laws. We are striving to
see to it that these rules are observed beginning with the research anddevelopment stage to ensure protection of the environment as well as
health and safety.
4. The ALES ECO PLAN 2007 (Kansai Paint Japan)4-1. Reducing Harmful Substances in Our Products
We have set reduction targets for certain hazardous substances such as Pb compounds, Cr compounds, toluene, xylene, and other volatile organic
compounds.
Though we have achieved our goals for Pb compounds for the term under review, we have yet to reach our targets for the other substances, despite
the fact that some reduction has occurred. In light of these circumstances, we are working to ensure that our goals are reached by the end of fiscal
2007, which is the final year of the plan.
4-2. Reducing Stress on the Environment Incurred During ProductionWe have also set reduction targets for CO2 and other waste emissions.
We achieved "zero emission status" (i.e. a recycling rate of 99.0% or more) for all of our facilities as of March 2005, a standard we have continued to
maintain for the year under review. Waste reduction for the term under review has fallen on the previous fiscal year (April-January) by 1.8% due to
further application of the 3R (Reduce, Reuse, Recycling) Program.
In addition, CO2 emissions have fallen by 0.5% on fiscal 2004 to stand at111 kg CO2/ton. Kansai Paint will continue to endeavor to reduce
production-induced stress on the environment in the future.
4-3. Safety and SanitationOur philosophy regards safety as paramount in all operations, as indicated
by our Zero-Accident program. Unfortunately, we had four incidents of
work-related accidents involving personnel during the term under review.At the present time, we are getting back to the basics on safety,
implementing company-wide programs on proper signaling and confirmation/strict observance of safety rules during operations, ensuring
that personnel wear safety gear, and danger avoidance training.
Also, in accordance with the Health Promotion Law, Kansai Paint Japan, has achieved its goals for setting up closed-off smoking areas in all
facilities. Kansai Paint will continue to implement further safety and sanitation initiatives.
Social ContributionsKansai Paint and its Group companies are thoroughly aware of their
corporate social responsibilities and thus are eager to make contributions to benefit society. During the term under review, we conducted the
following support, assistance, and communication activities as part of our contributions.
Launched in 1999 to assist Asian foreign exchange students, the Kansai Paint Scholarship provided scholarship funds to five students during the term,
for a total of 33 to date. Meanwhile, employees took part in volunteer activities, including wallpainting campaigns to beautify cityscapes and repaint
welfare institutions, for which we supplied paint and instructors. We also provided tours of plants and development centers.
Buoyed by these successes, we intend to continue along this socially responsible path in the future.
Marine and Protective CoatingsE n v i r o n m e n t a l C o n s e r v a t i o n a n d S o c i a l C o n t r i b u t i o n s
17 18Environmental Conservation and Social Contributions

Board of Directors
Corporate Data
President : Shoju Kobayashi
Senior Managing Director : Toshinobu Otani
Shoju KobayashiToshinobu Otani
Managing Directors Kazuhiro FujitaShinichi HamamatsuAkifumi FujitaKoichi ImadaOsamu IsozakiYuzo Kawamori
Corporate AuditorsMikio KitagawaTeruhiko SasaiMineo ImamuraYoko Miyazaki
Directors Kouji YamamotoKozo SasakiHiroshi MiuraShigeru NakamuraMitsuhiro FukudaHiroshi Ishino
Corporate Governance Committee
Corporate Planning Office
Affiliate Administration Office
QA & Environment Division
General Affairs Dept.
Legal Dept.
Personnel Dept.
Administration Divison
Tokyo Office
Tokyo Technical & Business Office
Business Planning & Administration Division
Automotive Coatings DivisionCoatings Business
R&D Division
Technical Planning & Administration Division
Shareholders'Meeting
CorporateAuditors
Board ofDirectors
President
Production Division
Industrial Coatings Division
Automotive Refinishes, Decorative
New Business Division
International Division
Technical Planning & Administration Dept.
Intellectual Property Office
SD Center
Analysis Center
CM Laboratory
CD Laboratory
SR Laboratory
Finance & Accounting Dept.
Safety & Environment Dept.
Production Engineering Research Dept.
Engineering Dept.
Amagasaki Plant
Ono Plant
Nagoya Plant
Hiratsuka Plant
Kanuma Plant
Supply Chain Management Center
New Business Production Dept.
Procurement Division(As of March 31, 2006)
(As of June 29, 2006)
(As of March 31, 2006)
Board of Directors
Kita-Kyushu Technical & Business Office
AT Laboratory
Production Planning & Administration Dept.
19
Organization Chart
Date of Establishment :
Kansai Paint Co., Ltd.
May 1918
Paid-in Capital : ¥25,659 million
Common Stock : Authorised: 793,496,000Issued : 272,623,270
Number of Shareholders : 24,011
Stock Exchange Listings : Tokyo, Osaka
Number of Employees : 2,158
Organization Chart 20

Financial Review
Financial Review21 Five-year Summary of Selected Financial Data 22
Thousands of U.S. dollars (Note 1)Millions of yen
200620022003200420052006
¥ 180,13311,9308,6714,761
$ 1,795,905 160,918 189,699 102,571
¥ 175,6706,9247,1563,834
¥ 196,78617,52817,24910,196
¥ 185,77712,40815,2399,051
¥ 210,965 18,903 22,284 12,049
¥ 189,879101,459
$ 2,271,959 1,295,446
¥ 199,974103,089
¥ 219,739125,967
¥ 208,733116,599
¥ 266,887 152,176
¥ 17.13 $ 0.37 ¥ 14.06¥ 37.24 ¥ 33.07¥ 44.04
Years ended March 31, 2006, 2005, 2004, 2003 and 2002
Five-year Summary of Selected Financial Data
Consolidated Basis
Net income
Per share amounts(in yen and U.S. dollars):
Total assetsTotal shareholders' equity
At year-end :
Net salesOperating incomeIncome before income taxesNet income
For the year :
During the fiscal year ending March 31, 2006, the world economy continued on a course of gradual expansion, despite the negative impact of steeply rising crude oil prices on individual countries economies. At the same time, the Japanese economy showed a steady recovery backed by increased capital investment stemming from improved corporate earnings, gradually increasing exports due to economic growth overseas, and sound consumer spending resulting from an improved employment environment, amongst other factors, in spite of the rising price of crude oil and other materials. Taking maximum advantage of its business resources in this economic climate, Kansai Paint and its Group companies made a determined effort to improve its business results, as exemplified by its rallying slogans: "Strengthen Group Business," "Implement Total Cost Reductions," and "Reinforce Global Strategy." As a result of these efforts, consolidated net sales posted term-on-term growth of 7.2%, consolidated operating income surged 7.8%, and consolidated net income rose 18.2%.
Overview Cost of Sales, SG&A, and Operating Income
With respect to non-operating income and expenses, the Company reported a non-operating income (net total of profits and expenses) of ¥3,381 million for the term under review, compared with a non-operating loss (net total of profit and expenses) of ¥279 million for the previous term. This was attributed to the fact that investment returns on the equity method declined due to the consolidation of companies which had been treated under the equity method in the previous term. On the other hand, net financial cost improved, and special income and loss associated with employees’ severance and retirement benefit accounting did not rise for this term.
Non-operating Income and Expenses
Net income amounted to ¥12,049 million, up ¥1,853 million (18.2%) over the previous term. Return on sales (ROS) rose to 5.7%, up from 5.2% in the previous term, and earnings per share (EPS) rose to ¥44.04, up from ¥37.24.
Net Income
The Company's basic policy is to share profits according to business results, striving to make stable and continuing distributions of dividends to shareholders while enhancing the Company's profitability by strengthening its business foundations.
With respect to internal reserves, our policy is to use them effectively for investment in R&D, as well as the production and sales systems, both in Japan and overseas, with the objective of establishing stable, long-term business foundations. Regardless of the enactment of the Company Act on May 1st, 2006, it is the Company’s policy to continue to pay out dividends biannually, with the last days of the interim term and full fiscal term as the base dates.
Dividends for the term under review were set at ¥10 per share, up ¥2 from the previous term.
Dividends
Current assets rose to ¥131,042 million, up ¥17,806 (15.7%) over the level at the end of the previous term. This growth was largely attributable to increases in trade notes and accounts, cash and cash equivalents in keeping with rising net sales.
Property, plant and equipment, investment and other assets and intangible assets amounted to ¥135,845 million, a sharp increase of ¥29,342 (27.6%) over the previous term. The main factor for this growth was a large rise in valuation profits from investments in marketable securities.
Current liabilities amounted to ¥68,976 million, up by ¥8,650 million (14.3%) over the level at the end of the previous term. The main factors involved here were an increase in income taxes payable and trade notes and accounts.
Long-term liabilities amounted to ¥34,334 million, a sharp increase of ¥10,097 million (41.7%) from the previous term. The main factor here was a significant rise in deferred tax liabilities associated with a rise in valuation profits from investments in marketable securities.
Total shareholders’ equity amounted to ¥152,176 million, a dramatic increase of ¥26,209 million (20.8%) over the level of the previous term. The major factors behind this growth were increases in retained earnings due to excellent performance and net unrealized holding gains on securities. The shareholders’ equity ratio fell slightly from 57.3% in the previous term to 57.0%.In contrast, return on equity (ROE) increased from 8.4% to 8.7%, and return on assets (ROA) increased from 4.8% to 5.0%.
Financial Position
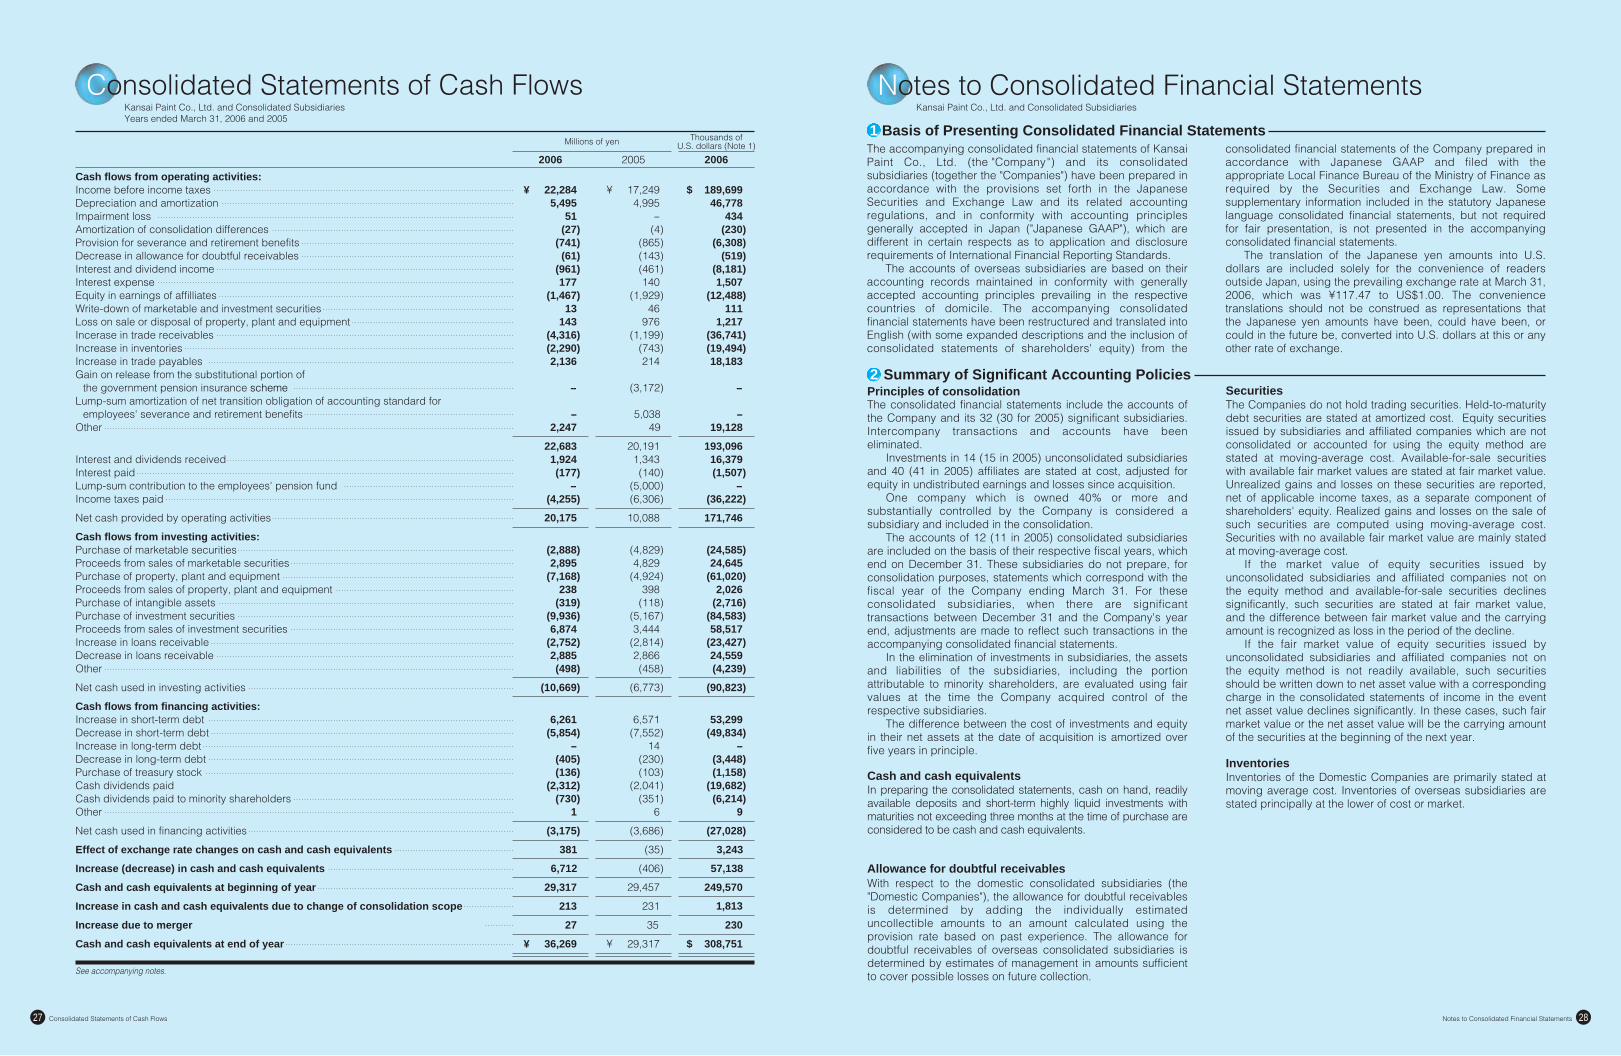
Net cash provided by operating activities was ¥20,175 million, while net cash used in investment and financing activities was ¥10,669 million and ¥3,175 million, respectively. As a result of these and lesser factors, the balance of cash and cash equivalents at term-end stood at ¥36,269 million, an increase of ¥6,952 million (23.7%) from the level at the end of the previous term.
Cash Flows
The Japanese economy shows signs of a steady underlying recovery, despite negative factors such as further increases in the price of crude oil, exchange rate fluctuations and interest rate movements.
Aware of this situation, Kansai Paint and its Group companies will move ahead with the three-year mid-term plan, launched in fiscal year 2005, which prioritizes programs expressed by key rallying slogans: "Reinforce Competitive Strengths," "Strengthen Group Business," "Carry Out Globalization," and "Carry Out the Company's Social Responsibilities." Maximizing the business resources of the Group companies, we will work to further strengthen our business foundations by developing profit-focused businesses while encouraging business reforms.
For the next term, we forecast consolidated net sales of ¥220,000 million, up 4.3% over the level of the term under review, and consolidated net income of ¥13,500 million, up 12.0%.
Outlook
During the term under review, sales of paints and coatings amounted to ¥204,732 million, up ¥14,203 million (7.5%) over the previous term.
Looking first at the area of coatings for new cars, domestic four-wheeled vehicle production topped the level of the previous term due to increased domestic sales and exports. In response to market needs for high-quality coating products, eco-friendly technology, etc., we worked to expand our business for coatings with more attractive designs, advanced function and waterborne coatings (intermediate and top coatings). In addition, in the automotive parts coatings market, we worked to quickly respond to customer demand and to enhance technology-related services. These efforts lead to healthy sales increases. Meanwhile, due to the expansion of local production on the part of Japanese automotive manufacturers, sales of our subsidiaries in India, Indonesia, Malaysia, and other countries took a turn for the better. Further, operations at new plants in Tianjin, China, and on the outskirts of Delhi, India, which were built in response to ongoing growth in demand, proceeded smoothly. In North America and Europe, PPG Kansai Automotive Finishes—a joint venture company with PPG Industries of the United States, also performed well. As a result, net sales surpassed the level of the previous term in the area of automotive coatings for new cars.
In the area of automotive refinishes, we made a shift toward eco-friendliness in our major products, including polyurethane topcoats, and strove to obtain new customers through enhancing and popularizing color-matching devices. Though there were indications that the trend toward decline in this area was ending, the demand remained slack, and sales dropped slightly below the level of the previous term. Nevertheless, net sales of automotive coatings as a whole exceeded the level of the previous term.
Looking next at industrial coatings, sales in the domestic market for can coating materials slipped below the level of the previous term due to a decline in the use of coated metal cans in the wake of the growing demand for PET bottles and film laminated metal cans. At the same time, however, sales of industrial machinery coatings rose due to robust exports to North America and Oceania, a trend that continued from the previous term. Sales also rose from the previous term in coatings for ceramic board due to the successful acquisition of new customers. On the overseas front, sales at local subsidiaries grew robustly as demand rose in tandem with economic growth in the Asian region. As a result, net sales of the entire industrial coatings segment surpassed the level of the previous term.
In response to ongoing sluggishness in the domestic decorative coatings market, we worked to boost sales and offset the decline in construction contractor prices by offering more value-added products. Further, in response to intensifying environmental issues, we worked to increase our business in heat resistance coatings, high value-added products for interior, high-performance exterior coatings, and more, as well as striving to expand sales of eco-friendly products. Overseas, sales at our subsidiary, Goodlass Nerolac Paints Limited grew significantly due to the continued growth of the Indian economy. In Malaysia, we also acquired a paint manufacturer in the field of decorative coatings, which we have made a subsidiary. As a result, sales in the decorative coatings segment as a whole exceeded the level of the previous term.
Turning to the marine and protective coatings segment, we engaged in aggressive marketing activities centered on tin-free antifouling paint in the domestic market against a backdrop of increased shipyard activity powered by strong orders. In the area of coatings for steel structures, we worked to reinforce our negotiating ability in sales for process-saving paints. Consequently our products have been adopted in the standard specifications of bridge projects by MLIT (Ministry of Land Infrastructure and Transport), government-run oil tanks and major electric power company plants. This achievement, however, failed to compensate for the significant decline in the demand for new bridges, which constitutes a majority of the demand from government agencies. As a result, net sales of marine and protective coatings dropped slightly below the previous term.
Paints and CoatingsNet Sales
Other Businesses
During the term under review, the cost of sales amounted to ¥146,123 million, up ¥12,880 million (9.7%) over the previous term. The rate of increase of cost of sales exceeded that of sales. As a result, the ratio of gross profit to sales was 30.7%, down from 32.3% in the previous term. Selling, general and administrative expenses (SG&A) amounted to ¥45,939 million, declining again from the previous term by ¥76 million (0.2%) despite the increase in sales. As a result, operating income rose to ¥18,903 million, up ¥1,375 million (7.8%) compared with the previous term, and the ratio of operating income to sales rose to 9.0%, up from 8.9%.
For convenience only U.S. dollar amounts in this report have been translated from Japanese yen at the rate of ¥117.47 to US$1, the exchange rate at March 31, 2006.Net income per share is computed based on the weighted average number of shares outstanding during the respective years.From the year ended March 31, 2003, the portion of net income unavailable to common shareholders, such as directors' bonuses, which is included in the appropriation of retained earnings, is deducted from net income for the calculation of net income per share.
Operating income Income before income taxes
Net income Total assets Total shareholders' equity
(Millions of yen) (Millions of yen)
(Millions of yen) (Millions of yen) (Millions of yen)
Net sales of other businesses slipped slightly to ¥6,232 million, down by ¥25 million (0.4%) from the previous term.
Sales fell in the area of environmental biotechnology due to a decline in public investment, which led to sluggishness in the sales of an advanced sewage treatment carrier for public waste water treatment plants.
In the area of telecommunications and electronics, domestic sales grew due to increased production of flat-screen televisions, but exports fell significantly.
Net sales(Millions of yen)
150,000
160,000
170,000
180,000
190,000
200,000
210,000
2002 2003 2004 2005 2006
175,670
180,133
185,777
196,786
210,965
(Millions of yen)
0
5,000
10,000
15,000
20,000
2002 2003 2004 2005 2006
6,924
11,93012,408
17,528
18,903
0
5,000
10,000
15,000
20,000
25,000
2002 2003 2004 2005 2006
7,156
8,671
15,239
17,249
22,284
0
2,000
4,000
6,000
8,000
10,000
12,000
2002 2003 2004 2005 2006
3,834
4,761
9,051
10,196
12,049
0
50,000
100,000
150,000
200,000
250,000
300,000
2002 2003 2004 2005 2006
199,974189,879
208,733219,739
266,887
0
25,000
50,000
75,000
100,000
125,000
150,000
2002 2003 2004 2005 2006
103,089 101,459
116,599
125,967
152,176

Consolidated Balance Sheets23 Consolidated Balance Sheets 24
Assets
See accompanying notes.
See accompanying notes.
Thousands ofU.S. dollars (Note 1)Millions of yen
200620052006
$ 308,7516,870
¥ 29,3178
¥ 36,269807
583,595
12,00310,198(9,415)
140,887429,922
62,893
1,5551,055
(1,099)
15,90345,479
68,555
1,4101,198
(1,106)
16,55050,503
84,8641,199,592
9,841
1,294,297
10,601134,941
842
146,384
9,969140,916
1,156
152,041
Accumulated depreciation (902,852)
391,445
(100,923)
45,461
(106,058)
45,983
LandBuildings, machinery and equipmentConstruction in progress
Property, plant and equipment (Note 6):
Cash and cash equivalentsMarketable securities
LoansOtherAllowance for doubtful receivables
Current assets:
Trade notes and accounts:Unconsolidated subsidiaries and affiliatesOther
Receivables:
86,72027,84553,580
168,145
9,1122,8034,615
16,530
10,1873,2716,294
19,752
Finished goodsWork in processRaw materials and supplies
Inventories (Note 6):
27,75220,422
1,115,535
3,0421,446
113,236
3,2602,399
131,042
Deferred income tax assets (Note 11)Other current assets (Note 6)
Total current assets
Long-term debt due after one year (Note 5)
Employees' severance and retirement benefits (Note 10)
Retirement benefits for directors and corporate auditors
Deferred income tax liabilities (Note 11)
Consolidation difference
Other long-term liabilities
Minority interests in consolidated subsidiaries
Income and enterprise taxes payableAccrued expensesDeferred income tax liabilities (Note 11)Other current liabilities
Total current liabilities
118,447610,037
962
9,23619,120(4,290)
756,866
8,113
$ 2,271,959
11,61345,337
116
5742,708(484)
59,864
1,178
¥ 219,739
13,91471,661
113
1,0852,246(504)
88,909
953
¥ 266,887
Investments in and loans to unconsolidated subsidiaries and affiliates
Investment securities (Notes 4 and 6)Loans receivable
Deferred income tax assets (Note 11)OtherAllowance for doubtful receivables
Investments and other assets:
Intangible assets
$ 18,217323
¥ 1,329401
¥ 2,14038
47,17861,565
15318,822
59,828
65,600
3,311
139,593
519
23,427
97,055
587,180
27,462
440,922
16,728396,732
9906,786
151,874
7,060
8,053
513
6,482
199
1,930
9,209
60,326
4,002
48,931
2,00442,925
5,5427,232
182,211
7,028
7,706
389
16,398
61
2,752
11,401
68,976
3,226
51,795
1,96546,604
Short-term borrowings (Note 5)Long-term debt due within one year (Note 5)
Other
Current liabilities:
Trade notes and accounts:Unconsolidated subsidiaries and affiliatesOther
Payables:
231,182601,550
--260,858(10,990)
1,295,446
$ 2,271,959
218,430
(5,584)
27,15761,018
34215,563(3,235)
125,967
¥ 219,739
25,659
(537)
27,15770,664
--30,643(1,291)
152,176
¥ 266,887
25,659
(656)
Capital surplusRetained earningsRevaluation surplusNet unrealized holding gains on securitiesForeign currency translation adjustments
Total shareholders' equity
Common stock:Authorized-793,496,000 shares in 2006 and 2005Issued-272,623,270 shares in 2006 and 2005
Treasury stock, at cost:1,745,147 shares in 20061,645,509 shares in 2005
Shareholders' equity (Note 9):
Contingent liabilities (Note 7)
Kansai Paint Co., Ltd. and Consolidated SubsidiariesMarch 31, 2006 and 2005
3,354--394Prepaid pension costs (Note 10)
Liabilities, Minority Interests and Shareholders' Equity
Thousands ofU.S. dollars (Note 1)Millions of yen
200620052006
Consolidated Balance Sheets

Consolidated Statements of Income25 Consolidated Statements of Shareholders' Equity 26
Millions of yen
Commonstock
Number of shares ofcommon stock
Capitalsurplus
Retainedearnings
Revaluationsurplus
Net unrealisedholding gainson securities
Foreign currencytranslation
adjustmentsTreasury
stock
Commonstock
Capitalsurplus
Retainedearnings
Revaluationsurplus
Net unrealisedholding gainson securities
Foreign currencytranslation
adjustmentsTreasury
stock
272,623,270 ¥ 25,659 ¥ 27,154 ¥ 52,943 ¥ 349 ¥ 13,951 ¥ (3,020) ¥ (437)10,196
(215)
(2,041)
(76)
(4)
3
1,612
(7)(100)
272,623,270 ¥ 25,659 ¥ 27,157
0
¥ 61,018 ¥ 342 ¥ 15,563 ¥ (3,235) ¥ (537)12,049
16
1,944
(2,312)
(102)
(342)
15,080
(5)
(119)
272,623,270 ¥ 25,659 ¥ 27,157 ¥ 70,664 ¥ -- ¥ 30,643 ¥ (1,291) ¥ (656)
Net salesCost of salesSelling, general and administrative expenses
Operating income
$ 1,795,905 1,243,917
391,070
160,918
¥ 196,786 133,243 46,015
17,528
¥ 210,965 146,123 45,939
18,903
71,831 (2,188)
120,056
3,683 1,797
11,769
8,438
14,103
Income before income taxes
CurrentDeferred
Income taxes (Note 11):
U.S. dollars (Note 1)Yen
Net income per shareCash dividends per share
$ 0.37 $ 0.09
¥ 37.24¥ 8.00
¥ 44.04 ¥ 10.00
(17,485)
$ 102,571
(1,573)
¥ 10,196
(2,054)
(257)
¥ 12,049
Thousands of U.S. dollars (Note 1)
$ 218,430 $ 231,182
0
$ 519,435 $ 2,911 $ 132,485 $ (27,539) $ (4,571)102,571
16,549
(19,682)
(868)
136
128,373
(2,911)
(42)
(1,013)
$ 218,430 $ 231,182 $ 601,550 $ -- $ 260,858 $ (10,990) $ (5,584)
See accompanying notes.
See accompanying notes.
Kansai Paint Co., Ltd. and Consolidated SubsidiariesYears ended March 31, 2006 and 2005
Kansai Paint Co., Ltd. and Consolidated SubsidiariesYears ended March 31, 2006 and 2005
Thousands ofU.S. dollars (Note 1)Millions of yen
200620052006
200620052006
8,181 (1,507)2,333 (111)
(2,333)(3,550)(1,217)2,460
12,488
--
--
189,699
28,781
12,471
461 (140)523
(297)(46)
(348)(976)(16)
(5,038)
(279)
1,929
3,172
--
17,249
497
961 (177)274 (13)
(274)(417)(143)
(51)
289 1,467
--
--
22,284
3,381
1,465 (434)
Minority interests in net incomeIncome before minority interests
Net income
of consolidated subsidiaries
Balance at March 31, 2004Net incomeAdjustments from translation of foreign
Cash dividends paid-
Bonuses to directors and
Adjustments due to change of market
Revaluation by foreign
Treasury stock
currency financial statements
¥7.50 per share
corporate auditors
values of investment securities
consolidated subsidiary
Balance at March 31, 2005Net incomeAdjustments from translation of foreign
Cash dividends paid-
Bonuses to directors and
Revaluation by foreign
Contribution under government rules to
Adjustments due to change of market
Treasury stock
Balance at March 31, 2006
currency financial statements
¥8.50 per share
corporate auditors
values of investment securities
consolidated subsidiary
welfare fund for employees ofoverseas subsidiaries
Balance at March 31, 2005Net incomeAdjustments from translation of foreign
Cash dividends paid-
Bonuses to directors and
Adjustments due to change of market
Contribution under government rules to
Revaluation by foreign
Treasury stock
Balance at March 31, 2006
currency financial statements
¥8.50 per share
corporate auditors
values of investment securities
consolidated subsidiary
welfare fund for employees ofoverseas subsidiaries
Effect of merger of and changes in equity method companies
Effect of merger of and changes in equity method companies
Contribution under government rules to welfare fund for employees of overseas subsidiaries
Interest and dividend incomeInterest expenseGain on sale of marketable and investment securities, netWrite-down of marketable and investment securitiesWrite-down of inventoriesLoss on disposal of inventoriesLoss on sale or disposal of property, plant and equipmentForeign currency exchange gains (losses)Equity in earnings of affiliatesGain on release from the substitutional portion of
Lump-sum amortization of net transition obligation of accounting standard for
Other, net
Other income (expenses):
employees' severance and retirement benefitsImpairment loss
the government pension insurance scheme
Consolidated Statements of Income Consolidated Statements of Shareholders' Equity
Consolidated Statements of Cash Flows27 Notes to Consolidated Financial Statements 28
Cash and cash equivalents at end of year
Interest and dividends receivedInterest paidLump-sum contribution to the employees' pension fundIncome taxes paid
Net cash provided by operating activities
Income before income taxesDepreciation and amortization
Amortization of consolidation differencesProvision for severance and retirement benefitsDecrease in allowance for doubtful receivablesInterest and dividend incomeInterest expenseEquity in earnings of affilliatesWrite-down of marketable and investment securitiesLoss on sale or disposal of property, plant and equipment
Gain on release from the substitutional portion of
Lump-sum amortization of net transition obligation of accounting standard foremployees' severance and retirement benefits
Incerase in trade receivablesIncrease in inventoriesIncrease in trade payables
Other
Cash flows from operating activities:
(4,829)4,829
(4,924)398
(118)(5,167)3,444
(2,814)2,866(458)
(6,773)
Purchase of marketable securitiesProceeds from sales of marketable securitiesPurchase of property, plant and equipmentProceeds from sales of property, plant and equipmentPurchase of intangible assetsPurchase of investment securitiesProceeds from sales of investment securitiesIncrease in loans receivableDecrease in loans receivableOther
Net cash used in investing activities
Cash flows from investing activities:
Effect of exchange rate changes on cash and cash equivalents
Increase (decrease) in cash and cash equivalents
Cash and cash equivalents at beginning of year
Increase in cash and cash equivalents due to change of consolidation scope
Increase due to merger
¥ 29,317
6,571(7,552)
14(230)(103)
(2,041)(351)
6
(3,686)
(35)
(406)
29,457
231
35
(2,888)2,895
(7,168)238
(319)(9,936)6,874
(2,752)2,885(498)
(10,669)
¥ 36,269
6,261(5,854)
--(405)(136)
(2,312)(730)
1
(3,175)
381
6,712
29,317
213
27
Increase in short-term debtDecrease in short-term debtIncrease in long-term debtDecrease in long-term debtPurchase of treasury stockCash dividends paidCash dividends paid to minority shareholdersOther
Net cash used in financing activities
Cash flows from financing activities:
1,343(140)
(5,000)(6,306)
10,088
1,924(177)
(4,255)
20,175
--
16,379(1,507)
--(36,222)
171,746
¥ 17,2494,995
--(4)
(865)(143)(461)140
(1,929)46
976(1,199)
(743)
(3,172)
5,038
214
49
20,191
¥ 22,2845,495
51(27)
(741)(61)
(961)177
(1,467)13
143(4,316)(2,290)2,136
--2,247
22,683
--
$ 189,69946,778
434(230)
(6,308)(519)
(8,181)1,507
(12,488)111
1,217(36,741)(19,494)18,183
--
--
19,128
193,096
(24,585)24,645
(61,020)2,026
(2,716)(84,583)58,517
(23,427)24,559(4,239)
(90,823)
$ 308,751
53,299(49,834)
--(3,448)(1,158)
(19,682)(6,214)
9
(27,028)
3,243
57,138
249,570
1,813
230
See accompanying notes.
Kansai Paint Co., Ltd. and Consolidated SubsidiariesYears ended March 31, 2006 and 2005
Kansai Paint Co., Ltd. and Consolidated Subsidiaries
Thousands ofU.S. dollars (Note 1)Millions of yen
200620052006
Impairment loss
The consolidated financial statements include the accounts of the Company and its 32 (30 for 2005) significant subsidiaries. Intercompany transactions and accounts have been eliminated.
Investments in 14 (15 in 2005) unconsolidated subsidiaries and 40 (41 in 2005) affiliates are stated at cost, adjusted for equity in undistributed earnings and losses since acquisition.
One company which is owned 40% or more and substantially controlled by the Company is considered a subsidiary and included in the consolidation.
The accounts of 12 (11 in 2005) consolidated subsidiaries are included on the basis of their respective fiscal years, which end on December 31. These subsidiaries do not prepare, for consolidation purposes, statements which correspond with the fiscal year of the Company ending March 31. For these consolidated subsidiaries, when there are significant transactions between December 31 and the Company's year end, adjustments are made to reflect such transactions in the accompanying consolidated financial statements.
In the elimination of investments in subsidiaries, the assets and liabilities of the subsidiaries, including the portion attributable to minority shareholders, are evaluated using fair values at the time the Company acquired control of the respective subsidiaries.
The difference between the cost of investments and equity in their net assets at the date of acquisition is amortized over five years in principle.
Principles of consolidation2 Summary of Significant Accounting Policies
1 Basis of Presenting Consolidated Financial Statements
In preparing the consolidated statements, cash on hand, readily available deposits and short-term highly liquid investments with maturities not exceeding three months at the time of purchase are considered to be cash and cash equivalents.
Cash and cash equivalents
Allowance for doubtful receivables
The Companies do not hold trading securities. Held-to-maturity debt securities are stated at amortized cost. Equity securities issued by subsidiaries and affiliated companies which are not consolidated or accounted for using the equity method are stated at moving-average cost. Available-for-sale securities with available fair market values are stated at fair market value. Unrealized gains and losses on these securities are reported, net of applicable income taxes, as a separate component of shareholders' equity. Realized gains and losses on the sale of such securities are computed using moving-average cost. Securities with no available fair market value are mainly stated at moving-average cost.
If the market value of equity securities issued by unconsolidated subsidiaries and affiliated companies not on the equity method and available-for-sale securities declines significantly, such securities are stated at fair market value, and the difference between fair market value and the carrying amount is recognized as loss in the period of the decline.
If the fair market value of equity securities issued by unconsolidated subsidiaries and affiliated companies not on the equity method is not readily available, such securities should be written down to net asset value with a corresponding charge in the consolidated statements of income in the event net asset value declines significantly. In these cases, such fair market value or the net asset value will be the carrying amount of the securities at the beginning of the next year.
Securities
The accompanying consolidated financial statements of Kansai Paint Co., Ltd. (the "Company ") and its consolidated subsidiaries (together the "Companies") have been prepared in accordance with the provisions set forth in the Japanese Securities and Exchange Law and its related accounting regulations, and in conformity with accounting principles generally accepted in Japan ("Japanese GAAP"), which are different in certain respects as to application and disclosure requirements of International Financial Reporting Standards.
The accounts of overseas subsidiaries are based on their accounting records maintained in conformity with generally accepted accounting principles prevailing in the respective countries of domicile. The accompanying consolidated financial statements have been restructured and translated into English (with some expanded descriptions and the inclusion of consolidated statements of shareholders' equity) from the
consolidated financial statements of the Company prepared in accordance with Japanese GAAP and filed with the appropriate Local Finance Bureau of the Ministry of Finance as required by the Securities and Exchange Law. Some supplementary information included in the statutory Japanese language consolidated financial statements, but not required for fair presentation, is not presented in the accompanying consolidated financial statements.
The translation of the Japanese yen amounts into U.S. dollars are included solely for the convenience of readers outside Japan, using the prevailing exchange rate at March 31, 2006, which was ¥117.47 to US$1.00. The convenience translations should not be construed as representations that the Japanese yen amounts have been, could have been, or could in the future be, converted into U.S. dollars at this or any other rate of exchange.
With respect to the domestic consolidated subsidiaries (the "Domestic Companies"), the allowance for doubtful receivables is determined by adding the individually estimated uncollectible amounts to an amount calculated using the provision rate based on past experience. The allowance for doubtful receivables of overseas consolidated subsidiaries is determined by estimates of management in amounts sufficient to cover possible losses on future collection.
Inventories of the Domestic Companies are primarily stated at moving average cost. Inventories of overseas subsidiaries are stated principally at the lower of cost or market.
Inventories
the government pension insurance scheme
Consolidated Statements of Cash Flows Notes to Consolidated Financial Statements

Notes to Consolidated Financial Statements29 Notes to Consolidated Financial Statements 30
Notes to Consolidated Financial StatementsKansai Paint Co., Ltd. and Consolidated Subsidiaries
Net income and dividends per share
Impairment of fixed assetsProperty, plant and equipment are carried at cost. Depreciation is computed primarily using the declining balance method for Domestic Companies and the straight-line method for overseas subsidiaries. For Domestic Companies, buildings acquired after March 31, 1998 are depreciated using the straight-line method. Depreciation of assets whose acquisition costs are between ¥100 thousand and ¥200 thousand is provided by the straight-line method over three years.
Property, plant and equipment and depreciation
Derivatives and hedge accounting
Internal use software in intangible assets is amortized using the straight-line method over the estimated useful life of five years.
Software costs
Research and development expenses are charged to income as incurred. Research and development expenses for the years ended March 31, 2006 and 2005 were ¥5,275 million ($44,905 thousand) and ¥5,534 million, respectively.
Research and development expenses
Income taxes comprise corporation tax, prefectural and municipal inhabitants' taxes and enterprise tax.
Enterprise tax is deductible from taxable income when paid. The asset and liability approach is used to recognize
deferred tax assets and liabilities for the expected future tax consequences of temporary differences between the carrying amounts of assets and liabilities for financial reporting purposes and the amounts used for income tax purposes.
(1) Employees' severance and retirement benefits Under the terms of the Domestic Companies' retirement plans,substantially all employees are entitled to a lump-sum paymentat the time of retirement. The amount of the retirement benefit is, in general, based on the length of service, basic salary at the time of retirement and cause of retirement.
Liabilities and expenses for severance and retirement benefits are determined based on the amounts actuariallycalculated using certain assumptions.
The Domestic Companies provide for employees' severance and retirement benefits based on the estimated amounts of projected benefit obligation and the fair value of theplan assets.
The excess of the projected benefit obligation over the total of the fair value of pension assets as of April 1, 2000, the date of adopting a new accounting standard, and the liabilities for severance and retirement benefits recorded as of April 1, 2000 (the "net transition obligation") amounted to ¥19,328 million, of which ¥5,259 million was recognized as an expense as a result of a contribution of investment securities worth ¥5,259 million to the employees' retirement benefit trust. The remaining net transition obligation amounting to ¥14,069 million was being recognized in expenses in equal amounts primarily over 15 years commencing with the year ended March 31, 2001. However, in the consolidated fiscal year ended March 31, 2005, the total unrecognized amount was treated as a one-time expense.
Actuarial gains and losses and prior service costs are recognized in expenses using the straight-line method mainly over 13 years which is within the average of the estimated remaining service lives of the employees.
Income taxes
Finance leases which do not transfer ownership are accounted for in the same manner as operating leases under Japanese GAAP.
Finance leases
(2) Retirement benefits for directors and corporate auditors Retirement benefits for directors and corporate auditors of the Company and certain consolidated domestic subsidiaries are provided in accordance with the companies' established rules on the accrual basis.
(Change in accounting principles) The remaining net transition obligation was being recognized in expenses in equal amounts primarily over 15 years commencing with the year ended March 31, 2001. However in the consolidated fiscal year ended March 31, 2005, the total unrecognized amount was treated as a one-time expense.
This change was made to strengthen financial foundations in consideration of the major change in status that has occurred since the application of retirement benefit accounting standards in a number of ways: by having made ongoing changes to the employees' pension fund rules before the previous consolidated fiscal year in connection with the reduction of payments, by having shifted from the former employees' pension fund to the corporate pension fund after having received authorization from the Minister of Health, Labour and Walfare to return past share with respect to the substitutional portion of employees' pension insurance scheme in the consolidated fiscal year ended March 31, 2005, and by carrying out the lump-sum contribution of 5,000 million to make up the savings shortfall in the fund.
The remaining net transition obligation of consolidated subsidiaries was treated in a similar manner in order to unify the accounting treatment between the parent company and subsidiaries. The effect of this change was a loss by ¥5,038 million in the consolidated fiscal year ended March 31, 2005.
As a result, income before income taxes decreased ¥4,842 million compared to the former method.
(Additional information) In accordance with the recent taking-effect of the defined corporate pension law, the Company decided to restructure its employees' pension fund and was authorized on November 1, 2004 by the Minister of Health, Labour and Welfare to return the past share for payments for the substitutional portion of the employees' pension insurance scheme. The Company paid minimum actuarial liability, which was transferred back to the government's scheme on March 30, 2005. The effect was to increase income before income taxes by ¥3,172 million in the consolidated fiscal year ended March 31, 2005.
Retirement benefits
3 Finance Leases
Lease payments under such leases for the years ended March 31, 2006 and 2005 were ¥364 million ($3,099 thousand) and ¥427 million, respectively.
Machinery, equipmentand vehicles Tools and fixtures Total
Information regarding non-capitalized finance leases at March 31, 2006 and 2005 is as follows:
¥ 1,041¥ 852 ¥ 1,893
¥ 176¥ 143 ¥ 319315219 534
¥ 491¥ 362 ¥ 853
Effective in April 2005, the Companies have newly adopted the accounting standard for impairment of fixed assets ("Opinion Concerning Establishment of Accounting Standard for Impairment of Fixed Assets" issued by the Business Accounting Deliberation Council on August 9, 2002) and the implementation guidance for the accounting standard for impairment of fixed assets (the Financial Accounting Standard Implementation Guidance No. 6 issued by the Accounting Standards Board of Japan on October 31, 2003).
Its adoption has resulted in a decline of ¥51 million ($434 thousand) in income before income taxes. As for the aggregate impairment loss, the Companies have directly deducted this amount from the relevant assets in accordance with post-revision consolidated financial statement regulations.
Revaluation surplusRevaluation surplus of overseas consolidated subsidiaries reported in the consolidated fiscal year ended March 31, 2005 consisted of the difference between original book value and fair value of the assets revalued in accordance with the relevant laws of the countries where the subsidiaries were located.
Millions of yen
Original lease obligations (including finance charges)
Payments due within one yearPayments remaining:
Payments due after one year
Machinery, equipmentand vehicles Tools and fixtures Total
$ 8,862$ 7,253 $ 16,115
$ 1,498$ 1,217 $ 2,7152,6821,864 4,546
$ 4,180$ 3,081 $ 7,261
Thousands of U.S. dollars (Note 1)
Original lease obligations (including finance charges)
Payments due within one yearPayments remaining:
Payments due after one year
The computation of net income per share is based on the weighted average number of shares outstanding during the period. Diluted net income per share of common stock for the years ended March 31, 2006 and 2005 is not shown since there were no outstanding convertible bonds or other common stock equivalents.
In accordance with the Commercial Code of Japan, the declaration of dividends and appropriations of retained earnings are approved at the general meeting of shareholders held after the end of the fiscal year. Therefore, cash dividends per share shown in the consolidated statements of income reflect interim dividends and the final dividends approved after the end of the relevant fiscal year.
The Companies state derivative financial instruments at fair value and recognize changes in the fair value as gains or losses unless the derivative financial instruments are used for hedging purposes.
If derivative financial instruments are used as hedges and meet certain hedging criteria, the Domestic Companies defer recognition of gains or losses resulting from changes in fair value of derivative financial instruments until the related losses or gains on the hedged items are recognized.
However, in cases where forward foreign exchange contracts are used as hedges and meet certain hedging criteria, forward foreign exchange contracts and hedged items are accounted for in the following manner: (1) If a forward foreign exchange contract is executed to hedge an existing foreign currency receivable or payable, (a) the difference, if any, between the Japanese yen amount of the hedged foreign currency receivable or payable translated using
the spot rate at the inception date of the contract and the book value of the receivable or payable is recognized in the income statement in the period which includes the inception date, and(b) the discount or premium on the contract (that is, the difference between the Japanese yen amount of the contract translated using the contracted forward rate and that translated using the spot rate at the inception date of the contract) is recognized over the term of the contract. (2) If a forward foreign exchange contract is executed to hedge a future transaction denominated in a foreign currency, the future transaction will be recorded using the contracted forward rate, and no gains or losses on the forward foreign exchange contract will be recognized.
Also, if interest rate swap contracts are used as hedges and meet certain hedging criteria, the net amount to be paid or received under the interest rate swap contract is added to or deducted from the interest on the assets or liabilities for which the swap contract was executed.
2006
2006
2005 Machinery, equipmentand vehicles Tools and fixtures Total
¥ 1,358¥ 825 ¥ 2,183
¥ 195¥ 140 ¥ 335236238 474
¥ 431¥ 378 ¥ 809
Millions of yen
Original lease obligations (including finance charges)
Payments due within one yearPayments remaining:
Payments due after one year

(c) Total sales of available-for-sale securities in the year ended March 31, 2006 amounted ¥9,769 million ($83,162 thousand) and related gains amounted to ¥274 million ($2,333 thousand).
(d) The following table summarizes carrying values of bonds and other securities by contractual maturities classified as available-for-sale and held-to-maturity as of March 31, 2006:
(d) The following table summarizes carrying values of bonds and other securities by contractual maturities classified as available-for-sale and held-to-maturity as of March 31, 2005:
(c) Total sales of available-for-sale securities in the year ended March 31, 2005 amounted ¥8,274 million and related gains amounted to ¥523 million.
(2) Information on securities of the Companies at March 31, 2005 is as follows:(a) The following table summarizes acquisition costs, book values and fair values of held-to-maturity and available-for-sale securities with available fair values as of March 31, 2005:
Notes to Consolidated Financial StatementsKansai Paint Co., Ltd. and Consolidated Subsidiaries
Notes to Consolidated Financial Statements31 Notes to Consolidated Financial Statements 32
(b) The following table summarizes book values of available-for-sale securities with no available fair values as of March 31, 2006:
(b) The following table summarizes book values of available-for-sale securities with no available fair values as of March 31, 2005:
Available-for-sale securities
¥ 1,046 $ 8,904
187 1,592¥ 5,024 $ 42,768
Millions of yen
Non-listed equity securities
OtherTotal
Thousands ofU.S. dollars (Note 1)
$ 5,959¥ 3,100 $ 26,390851100 851
$ 6,810¥ 3,200 $ 27,241
Millions of yen
BondsOtherTotal
¥ 700100
¥ 800
Thousands of U.S. dollars (Note 1)
¥ -- ¥ 3,300Bonds-- 100Other
¥ -- ¥ 3,400Total
Millions of yen
3,791 32,272Investment funds
Securities with book values exceeding acquisition costs: Book valueAcquisition cost
Within 1-5 years Within 1-5 yearsWithin 1 yearWithin 1 year
Within 1 year Within 1-5 years
Difference
¥ 35,329¥ 10,423 ¥ 24,9063,0392,999 40
¥ 38,368¥ 13,422 ¥ 24,946
Millions of yen
Equity securitiesBondsTotal
Available-for-sale securities¥ 2,047
181¥ 6,221
Millions of yen
Non-listed equity securities
OtherTotal
Securities with book values not exceeding acquisition costs:¥ 209¥ 263 ¥ (54)
141141 --¥ 350¥ 404 ¥ (54)
Equity securitiesInvestment fundsTotal
3,993Investment funds
Unsecured:
5 Short-Term Borrowings and Long-Term Debt
20052006 2006
¥ 7,436¥ 7,047 $ 59,9892519 162
7,4617,066 60,151
Millions of yen
Banks and insurance companies, 1.00%-6.10% in 2006 (0.37%-6.10% in 2005), maturing through 2009Other long-term debt
40138 323¥ 7,060¥ 7,028 $ 59,828
Less amounts due within one year
Thousands ofU.S. dollars (Note 1)
2006 2006
2006 2006
¥ 1,602
1,068
$ 13,637
9,09215 12812 102
Millions of yen
Inventories (pledged for 10.00%-11.00% short-term borrowings of ¥267 million ($2,273 thousand))Tangible fixed assets (pledged for payables other of ¥173 million ($1,473 thousand) and other long term liabilities of ¥589 million ($5,014 thousand))Other current assets (pledged for certain trade payables)Securities (pledged for certain trade payables)
¥ 2,697 $ 22,959
Thousands ofU.S. dollars (Note 1)
2005¥ 1,470
159
Millions of yen
Inventories (pledged for 10.00% short-term borrowings of ¥86 million)
2005Millions of yen
Other current assets (pledged for certain trade payables)Securities (pledged for certain trade payables)
¥ 1,494
6 Pledged AssetsPledged assets at March 31, 2006 and 2005 are as follows:
¥ 142 $ 1,2087 60
Millions of yen
As endorser of notes endorsedAs guarantor of indebtedness of unconsolidated subsidiaries and affiliates
¥ 149 $ 1,268
Thousands ofU.S. dollars (Note 1)
7 Contingent LiabilitiesInformation on contingent liabilities of the Companies at March 31, 2006 and 2005 is as follows:
Securities with fair values not exceeding book values:
Held-to-maturity
4 Securities(1) Information on securities of the Companies at March 31, 2006 is as follows:(a) The following table summarizes acquisition costs, book values and fair values of held-to-maturity and available-for-sale securities with available fair values as of March 31, 2006:
DifferenceFair valueBook value Difference
¥ (2)¥ 806 $ (17)(0)201 (0)
¥ (2)¥ 1,007 $ (17)
Millions of yen
BondsOtherTotal
¥ 808201
¥ 1,009
Thousands ofU.S. dollars (Note 1)
Securities with book values exceeding acquisition costs:
Available-for-sale
DifferenceBook valueAcquisition cost Difference
¥ 49,126¥ 63,148 $418,2002192 17
¥ 49,128¥ 63,340 $418,217
Millions of yen
Equity securitiesInvestment fundsTotal
¥ 14,022190
¥ 14,212Securities with book values not exceeding acquisition costs:
¥ (26)¥ 108 $ (222)(14)2,985 (119)
¥ (40) ¥ 3,093 $ (341)
Equity securitiesBondsTotal
¥ 1342,999
¥ 3,133
Thousands ofU.S. dollars (Note 1)
Short-term borrowings are principally represented by bank loans with interest rates ranging from 0.05% to 11.00% at March 31, 2006 and from 0.05% to 10.00% at March 31, 2005.
Long-term debt at March 31, 2006 and 2005 consists of the following:
Securities with fair values exceeding book values:
Held-to-maturity
DifferenceFair valueBook value
¥ 0¥ 3050100
¥ 0¥ 405
Millions of yen
BondsOtherTotal
¥ 305100
¥ 405Available-for-sale
¥ 143204
As endorser of notes endorsedAs guarantor of indebtedness of unconsolidated subsidiaries and affiliates
¥ 347

Included in the consolidated statements of income for the years ended March 31, 2006 and 2005 are severance and retirement benefit expenses comprised of the following:
Significant components of the Companies' deferred tax assets and liabilities as of March 31, 2006 and 2005 are as follows:
Notes to Consolidated Financial Statements33 Notes to Consolidated Financial Statements 34
Notes to Consolidated Financial StatementsKansai Paint Co., Ltd. and Consolidated Subsidiaries
The liabilities for severance and retirement benefits included in the liability section of the consolidated balance sheets as of March 31, 2006 and 2005 consist of the following:
The following table summarizes the significant differences between the statutory tax rates and the Companies' effective income tax rates for financial statement purposes for the years ended March 31, 2006 and 2005.
20052006 2006¥ 48,950¥ 48,834 $415,715
2,9462,647 22,533(14,769)(6,420) (54,652)
Millions of yen
Projected benefit obligationUnrecognized prior service costsUnrecognized actuarial differences
--394 3,354 Prepaid pension costs(29,074)(37,749) (321,350)Less fair value of pension assets
¥ 8,053¥ 7,706 $ 65,600Liability for severance and retirement benefits
Thousands ofU.S. dollars (Note 1)
20052006 2006
¥ 185¥ 145 $ 1,234602561 4,776
Millions of yen
Deferred tax assets:Valuation loss on inventoriesElimination of unrealized profit in inventories
9092 783265224 1,907
Excess allowance for doubtful receivablesExcess accrued expensesAccrued enterprise tax 95416 3,541
12,59931,00423,39379,237(1,668)77,569
Excess bonuses accrued 1,4221,480Retirement benefits 3,6463,642Other 1,9752,748Sub-total 8,2809,308Valuation allowance (123)(196)Total deferred tax assets 8,1579,112
1613 111313298 2,537
Deferred tax liabilities:Adjustments of allowance for doubtful accounts in the consolidation elimination of receivables and payablesAdjustments to fixed assets based on corporate tax law
9,95719,635 167,1497521,237 10,530
Unrealized holding gains on securitiesTax effect of foreign subsidiaries' undistributed earnings
Total deferred tax liabilities 11,03821,183 180,327Net deferred tax assets (liabilities) ¥ (2,881)¥ (12,071) $ (102,758)
Thousands ofU.S. dollars (Note 1)
20052006 2006¥ 1,460¥ 1,482 $ 12,616
1,592861 7,330(1,253)(637) (5,423)
Millions of yen
Service costs - benefits earned during the yearInterest cost on projected benefit obligationExpected return on plan assets
5,581-- --
1,9131,487 12,659
Amortization of net transition obligation
Amortization of actuarial differences(412)(300) (2,554)Amortization of prior service costs
8,8812,893 24,628
(3,172)-- --¥ 5,709¥ 2,893 $ 24,628
Gain on release from the substitutional portion of the government pension insurance schemeTotal
Severance and retirement benefit expenses
Thousands ofU.S. dollars (Note 1)
2006 200540.0% 40.0%
0.5 0.7(0.6) (0.6)
Statutory tax rateNon-deductible expensesNon-taxable dividend income
(2.6) (4.5)
36.7% 31.8%
Equity in earnings of affiliates
Effective tax rate(0.6) (3.8)Deductible taxes and other
The discount rate and the rate of expected return on plan assets used by the Companies are mainly 1.8% and 2.5%, respectively, for the year ended March 31, 2006 and mainly 1.8% and 3.5%, respectively, for the year ended March 31, 2005.The estimated amount of all retirement benefits to be paid at future retirement dates is allocated equally to each service year using the estimated number of total service years.
10 Employees' Severance and Retirement Benefits
11 Deferred Income Taxes
9 Shareholders' EquityUnder the Commercial Code of Japan, the entire amount of the issue price of shares is required to be accounted for as common stock, although a company may, by resolution of its Board of Directors, account for an amount not exceeding one-half of the issue price of the new shares as additional paid-in capital, which is included in capital surplus.
The Commercial Code of Japan provides that an amount equal to at least 10% of cash dividends and other cash appropriations shall be appropriated and set aside as a legal reserve until the total amount of legal reserve and additional paid-in capital equals 25% of common stock. The legal reserve and additional paid-in capital may be used to eliminate or reduce a deficit by resolution of the shareholders' meeting or
may be capitalized by resolution of the Board of Directors. On condition that the total amount of legal reserve and additional paid-in capital remains being equal to or exceeding 25% of common stock, they are available for dividends by the resolution of shareholders' meeting. Legal reserve is included in retained earnings in the accompanying financial statements.
The maximum amount that the Company can distribute as dividends is calculated based on the non-consolidated financial statements of the Company in accordance with the Commercial Code of Japan.
8 Derivative TransactionsThe Companies enter into forward foreign exchange contracts, and interest rate swap transactions to control risks related to foreign currencies and interest rates. Forward foreign exchange contracts are used to hedge the risk of fluctuations in foreign currency exchange rates with respect to monetary receivables and payables (including future transactions) denominated in foreign currencies resulting from import and export transactions, and the interest rate swaps are used to hedge the risk of fluctuations in interest rates. The Companies principally use derivative transactions in connection with managing their market risk and not for speculation purposes.
The Companies deal with highly rated international financial institutions as counterparts to these transactions to minimize credit risk exposure. The Finance Divisions enter into the derivative transactions and controls the transactions, including the processing of the transactions, such as settlements, in accordance with established policies approved by the Board of Directors.
Hedge accounting applies to all derivative transactions of Kansai Paint and its Group companies, consequently, these transactions are not disclosed in these notes.

To the Board of Directors of Kansai Paint Co., Ltd.:
We have audited the accompanying consolidated balance sheets of Kansai Paint Co., Ltd. and consolidated subsidiaries as of March 31, 2006 and 2005, and the related consolidated statements of income, shareholders' equity and cash flows for the years then ended, expressed in Japanese yen. These consolidated financial statements are the responsibility of the Company’s management. Our responsibility is to independently express an opinion on these consolidated financial statements based on our audits.
We conducted our audits in accordance with auditing standards generally accepted in Japan. Those standards require that we plan and perform the audit to obtain reasonable assurance about whether the financial statements are free of material misstatement. An audit includes examining, on a test basis, evidence supporting the amounts and disclosures in the financial statements. An audit also includes assessing the accounting principles used and significant estimates made by management, as well as evaluating the overall financial statement presentation. We believe that our audits provide a reasonable basis for our opinion.
In our opinion, the consolidated financial statements referred to above present fairly, in all material respects, the consolidated financial position of Kansai Paint Co., Ltd. and subsidiaries as of March 31, 2006 and 2005, and the consolidated results of their operations and their cash flows for the years then ended, in conformity with accounting principles generally accepted in Japan.
Without qualifying our opinion, we draw attention to the following.As discussed in Note 2 to the consolidated financial statements, in the prior consolidated fiscal year (the year ended March 31, 2005), Kansai Paint Co., Ltd. and consolidated subsidiaries treated the total unrecognized transition obligation of its pension plan as a one-time expense.
The U.S. dollar amounts in the accompanying consolidated financial statements with respect to the year ended March 31, 2006 are presented solely for convenience. Our audit also included the translation of yen amounts into U.S. dollar amounts and, in our opinion, such translation has been made on the basis described in Note 1 to the consolidated financial statements.
Osaka, JapanJune 29, 2006
Overseas sales include overseas subsidiaries' sales to overseas third parties as well as the Domestic Companies' export sales to third parties. The regions mainly include the following countries: (1) Asia: India, Thailand and Taiwan etc. (2) Americas: United States etc. (3) Europe: United Kingdom etc.
Receivables from unconsolidated subsidiaries and affiliates at March 31, 2006 and 2005 are as follows:
Notes to Consolidated Financial Statements35 Independent Auditors' Report 36
Notes to Consolidated Financial StatementsKansai Paint Co., Ltd. and Consolidated Subsidiaries
Overseas sales for the years ended March 31, 2006 and 2005 are as follows:
20052006 2006¥ 48,193¥ 63,406 $ 539,764
2,2702,639 22,465
Millions of yen
AsiaAmericas
1,6242,430 20,686¥ 52,087¥ 68,475 $ 582,915
EuropeOverseas sales
Thousands ofU.S. dollars (Note 1)
20052006 2006¥ 24,101¥ 24,678 $210,079
Millions of yen
Sales to unconsolidated subsidiaries and affiliates
Thousands ofU.S. dollars (Note 1)
20052006 2006¥ 10,648¥ 11,436 $ 97,353
Millions of yen
Receivables from unconsolidated subsidiaries and affiliates
Thousands ofU.S. dollars (Note 1)
13 Related Party TransactionsSales to unconsolidated subsidiaries and affiliates for the years ended March 31, 2006 and 2005 are as follows:
¥ 1,631 $ 13,884
Millions of yen
Cash dividends, ¥6 ($0.05) per shareAppropriations:
100 851Bonuses to directors
Thousands ofU.S. dollars (Note 1)
14 Subsequent EventAt the general meeting of shareholders of the Company held on June 29, 2006, appropriations of non-consolidated retained earnings for the year ended March 31, 2006 were duly approved as follows:
Net sales Operating expenses Operating income Assets
12 Segment Information
2006
¥ 12,419¥145,723 ¥232,8296,36249,985 43,081
Millions of yen
JapanAsia
1031,082 76554758 449
AmericasEuropeTotal 18,938197,548 277,124
(10,237)¥266,887
Elimination and corporate (35)(5,486)Consolidated basis ¥ 18,903¥192,062
¥ 5,283¥152,859 ¥158,14214156,206 56,347
01,185 1,18597715 812
5,521210,965 216,486(5,521)
¥210,965(5,521)--
¥ --¥210,965
Total sales toexternal customers
Intersegment salesor transfer amounts
Net sales Operating expenses Operating income Assets2006
$ 105,721$1,240,512 $1,982,03054,159425,513 366,740
Thousands of U.S. dollars (Note 1)
JapanAsia
8779,211 6,5124596,453 3,822
AmericasEuropeTotal 161,2161,681,689 2,359,104
(87,145)$2,271,959
Elimination and corporate (298)(46,702)Consolidated basis $ 160,918$1,634,987
$ 44,973$1,301,260 $1,346,2331,201478,471 479,672
--10,088 10,0888266,086 6,912
47,0001,795,905 1,842,905(47,000)
$1,795,905(47,000)--
$ --$1,795,905
Total sales toexternal customers
Intersegment salesor transfer amounts
Net sales Operating expenses Operating income Assets2005
¥ 12,775¥145,427 ¥195,6344,75636,597 31,295
Millions of yen
JapanAsia
87955 6826547 298
AmericasEuropeTotal 17,624183,526 227,909
(8,170)¥219,739
Elimination and corporate (96)(4,268)Consolidated basis ¥ 17,528¥179,258
¥ 4,048¥154,154 ¥158,20214441,209 41,35390952 1,04282471 553
4,364196,786 201,150(4,364)
¥196,786(4,364)--
¥ --¥196,786
Total sales toexternal customers
Intersegment salesor transfer amounts
As most of the Companies' activities are in the manufacture and sale of paints and coatings, industrial segment information is not disclosed.Regional segment information for the years ended March 31, 2006 and 2005 is as follows:
Independent Auditors' Report
KPMG AZSA & Co.

Directory 37
3-6, Fushimi-machi 4-chome,Chuo-ku, Osaka 541-8523, JapanTel: 81-6-6203-5531Fax: 81-6-6203-5018
Head Office
24-15, Higashi-Ohi 5-chome,Shinagawa-ku, Tokyo 140-8520, JapanTel: 81-3-3472-3131Fax: 81-3-3458-0525
Tokyo Office
12-1, Minami-Rokugo 3-chome,Ohta-ku, Tokyo 144-0045, JapanTel: 81-3-3732-8111Fax: 81-3-3735-0544
Tokyo Technical & Business Office
17-1, Higashi-Yawata 4-chome,Hiratsuka, Kanagawa 254-8562, JapanTel: 81-463-23-2100Fax: 81-463-24-0637
R&D Center
33-1, Kanzaki-cho, Amagasaki,Hyogo 661-8555, JapanTel: 81-6-6499-4861Fax: 81-6-6499-9942
Amagasaki Plant
3, Takumidai, Ono,Hyogo 675-1322, JapanTel: 81-794-63-8111Fax: 81-794-63-8100
Ono Plant
Aza Hirachi 1, Oaza, Azabu,Miyoshi-cho, Nishi-Kamo-gun,Aichi 470-0206, JapanTel: 81-561-34-3411Fax: 81-561-34-0311
Nagoya Plant
4-1, Higashi-Yawata 5-chome,Hiratsuka, Kanagawa 254-8589, JapanTel: 81-463-23-2111Fax: 81-463-23-6984
Hiratsuka Plant
7-3, Satsuki-cho, Kanuma,Tochigi 322-0014, JapanTel: 81-289-76-3011Fax: 81-289-76-3484
Kanuma Plant
5455 Corporate Drive, Suite 205Troy, MI 48098, U.S.A.Tel: 1-248-952-0533Fax: 1-248-952-0538
Kansai Paint (America), Inc.
OVERSEAS NETWORK
Troy-Automotive Technical Center5875 New King Court Troy, Michigan 48098, U.S.A.Tel: 1-248-641-2010Fax: 1-248-641-2266
PPG Kansai Automotive Finishes U.S., LLC
834 Caledonia Road Toronto,Ontario M6B 3X9, CanadaTel: 1-905-855-5667Fax: 1-905-823-4190
PPG Kansai Automotive Finishes Canada, LP
20th Floor,Wembley Point, 1 Harrow Road, Wembley,Middlesex HA9 6DE, U.K.Tel: 44-20-8900-5933Fax: 44-20-8900-5966
Kansai Paint Europe Limited
4th Floor, Quadrant West 210-222 Hagley Road West, Birmingham, B68 0NP U.K.Tel: 44-12-1423-7300Fax: 44-12-1434-5346
PPG Kansai Automotive Finishes UK, LLP
Ganpatrao Kadam Marg, Lower Parel,Mumbai 400013, IndiaTel: 91-22-2493-4001Fax: 91-22-2493-6296
Goodlass Nerolac Paints Ltd.
MM2100 Industrial Town, Blok DD-7,Jalan Irian No.9D, Cikarang Barat-Bekasi, 17520,IndonesiaTel: 62-21-8998-2370Fax: 62-21-8998-2369
P.T. Kansai Paint Indonesia
57 Penjuru Road,Singapore 609141, SingaporeTel: 65-6261-8621Fax: 65-6265-0301
Kansai Paint (Singapore) Pte. Ltd.
16 Raffles Quay #42-02 Hong Leong BuildingSingapore 048581, SingaporeTel: 65-6222-1192Fax: 65-6222-1156
Kansai Paint (Asia) Pte. Ltd.
2 Solok Waja 2, Kawasan Perindustrian Bukit Raja,Peti Surat 159, 41710 Klang, Selangor D. E., MalaysiaTel: 60-3-3343-4833Fax: 60-3-3348-7806
Sime Kansai Paints Sdn. Bhd.
Libramiento a Tequisquiapan #66 Zona Industrial, San Juan del Rio, 76800 Queretaro, MexicoTel: 52-427-2710124Fax: 52-427-2719195
PPG ALESCO Automotive Finishes Mexico,S.de. R.L. de C.V.
180 Moo 3 Taparuk Road, Amphur, Muang,Samutprakarn 10270, ThailandTel: 66-2-753-2377Fax: 66-2-753-2774
Thai Kansai Paint Co., Ltd.
34 Moo 4, Eastern Seaboard Industrial Estate (Rayong), Yudhasart Road, Tumbol Pluakdaeng,Amphur Pluakdaeng, Rayong 21140, ThailandTel: 66-38-954-747Fax: 66-38-954-751
Kansai Resin (Thailand) Co., Ltd.
A Dimaguila Warehouse, 1st Street Meridian IndustrialComplex, BO. Balibago, Sta. Rosa Laguna, PhilippinesTel: 63-2-850-5811 63-49-838-1105Fax: 63-2-699-2029 63-49-838-1104
Kansai Paint Philippines, Inc.
6, Yungkong 2nd Road, Yung-an Industrial District,Yung-an Hsiang, Kaohsiung Hsien, Taiwan, R.O.CTel: 886-7-622-3171~6Fax: 886-7-623-0155
Taiwan Kansai Paint Co., Ltd.
Suite 1018, 10th Floor, Ocetre, Harbour City, No.5,Canton Road, Kowloon, Hong KongTel: 852-2891-1280Fax: 852-2891-0890
Kansai Paint H.K. Ltd.
69, Kunshan West Road,Huang Gu District, Shenyang, 110035, ChinaTel: 86-24-8602-8669Fax: 86-24-8602-5068
Shenyang Kansai Paint Co., Ltd.
42, 5th Avenue, TEDA, Tianjin, 300457, ChinaTel: 86-22-2529-2004Fax: 86-22-2532-1821
Tianjin Cosco Kansai Paint & Chemicals Co., Ltd.
No.95 Taihua Road, TEDA, Tianjin, 300457, ChinaTel: 86-22-6623-0159Fax: 86-22-6623-0152
Tianjin Winfield Kansai Paint & Chemicals Co., Ltd.
65, Danlong Road, Nanping, Nan'an District,Chongqing, 400060, ChinaTel: 86-23-6283-4824Fax: 86-23-6283-7094
Chongqing Kansai Paint Co., Ltd.
790, De Ya Road, Chang Sha 410003, ChinaTel: 86-731-422-3747Fax: 86-731-422-0181
Hunan Xiangjiang Kansai Paint Co., Ltd.
No.5589-5689 Hutai Road, Shanghai 201907, ChinaTel: 86-21-5602-1962Fax: 86-21-5602-0852
Shanghai Cosco Kansai Paint & Chemicals Co., Ltd.
Chengtai International Business Square #410,Renming Road #93, Kunshan City, Jiangsu ProvinceTel: 86-512-5756-3372Fax: 86-512-5756-3374
Suzhou Kansai Paint Co., Ltd.
A3 Area Auto Car Fittings Zone Huangge Town,Economic And Technology Development Of Nansha,Guangzhou City, ChinaTel: 86-20-3468-4066Fax: 86-20-3468-4099
Guangzhou Kansai Paint Co., Ltd.
264-1 Dangjeong-Dong, Gunpo-Shi,Gyungi-Do 435-030, KoreaTel: 82-31-456-8314Fax: 82-31-456-8319
KDK Automotive Coatings Co., Ltd.
The ALESCO logo was designed to symbolize the three basic key
words that express Kansai Paint's image: science, growth, and
reliability. The square blue field embodies the rationality and
certainty of scientific advancement, while the A's without crossbars
represent growth in the sense of spread wings soaring into the sky.
Reliability is portrayed through the overall balance and
stability of the design.
Directory
4, Solok Waja 2, Kaw. Perindustrian Bukit Raja,P.O.Box 159, 41710 Klang,Selangor Darul Ehsan, MalaysiaTel: 60-3-3341-5333Fax: 60-3-3342-7223
Kansai Coatings Malaysia Sdn. Bhd.

3-6, Fushimi-machi 4-chome,Chuo-ku, Osaka 541-8523, JapanTel: 81-6-6203-5531Fax: 81-6-6203-5018http://www.kansai.co.jp
Printed in Japan