200617 baseline study on bioelectricity in guinea … palm oil and palm kernel oil 16 3.5.1 palm oil...
TRANSCRIPT
i
Baseline Study on the Biomass Electricity
Generation Potential in Guinea Bissau
Developed under the GEF Project „Promoting Renewable Energy
Investments in the Electricity Sector of Guinea Bissau “
ii
Jointly developed by the Ministry of Energy and Industry of Guinea Bissau,
the United Nations Industrial Development Organization (UNIDO), the
ECOWAS Centre for Renewable Energy and Energy Efficiency (ECREEE), the
SIDS Sustainable Energy and Climate Resilience Organization (SIDS DOCK)
Lead author: Mr. Bart Frederiks, Consultant Project team: Mr. Julio Antonio Raul (MEI), Mr. Martin Lugmayr (UNIDO), Mr. Gentjan Sema (UNIDO), Mr. Jansenio Delgado (ECREEE), Mr. Eder Semedo (ECREEE) Date: Bissau, June 2017
iii
TABLE OF CONTENTS
UNITS AND ABBREVIATIONS vi
1 Introduction 1
1.1 Background: the power sector in Guinea Bissau 1
1.2 GEF project 2
1.3 Objectives 2
1.4 Structure of this report 2
2 Biomass electricity production technologies 4
2.1 Biomass combustion 4
2.1.1 Steam turbine systems 4
2.1.2 Organic Rankine Cycles (ORC) 4
2.1.3 Steam engine systems 5
2.1.4 Stirling engines 6
2.2 Gasification 6
2.3 Biogas 7
2.4 Vegetable oils 8
3 Biomass resources in Guinea Bissau 9
3.1 Overview 9
3.2 Cashew 9
3.2.1 Cashew apple (pulp) 10
3.2.2 Cashew net shell 11
3.2.3 Cashew nut shell liquid 11
3.3 Rice 12
3.3.1 Rice straw 13
3.3.2 Rice husk 13
3.4 Distilleries 14
3.4.1 Sugar cane bagasse 14
3.4.2 Sugar cane thrash 15
3.4.3 Vinasse 15
3.5 Palm oil and palm kernel oil 16
3.5.1 Palm oil 17
3.5.2 Palm oil waste water 17
3.5.3 Palm kernel shell 17
iv
3.5.4 Other solid wastes 18
3.6 Groundnut 18
3.7 Forestry 18
3.8 Animal husbandry 20
3.8.1 Dung production 21
4 Potential for biomass electricty 22
4.1 Technical feasibility of biomass electricity supply options 22
4.1.1 Cashew shell combustion 22
4.1.2 Sugar cane bagasse and trash combustion 23
4.1.3 Wood chip combustion 24
4.1.4 Rice husk gasification 25
4.1.5 Cashew shell gasification 26
4.1.6 Wood chip gasification 27
4.1.7 Biogas from cattle dung 28
4.1.8 Biogas from distillery vinasse 30
4.1.9 Other 31
4.2 Technical potential 33
4.3 Economics and competitiveness of biomass electricity in Guinea Bissau 33
4.3.1 Biomass electricity production costs 33
4.3.2 Alternative production costs 34
4.3.3 Cost comparisons 35
4.4 Barriers for the introduction of biomass electricity technologies 36
4.5 Potential national and regional support models 38
4.6 Sustainability aspects 40
5 Existing biomass electricity projects in Guinea Bissau 41
5.1 SAFIM 41
5.1.1 Plant description 41
5.1.2 Plant status 42
5.1.3 Barriers to plant operation 43
5.2 SICAJU (Bissau) 44
5.2.1 Plant description 44
5.2.2 Plant status 46
5.2.3 Barriers to plant operation 46
5.3 LICAJU 47
5.3.1 Plant description 47
v
5.3.2 Plant status 48
5.3.3 Barriers to plant operation 48
5.4 Lessons learned 49
6 Project pipeline 50
6.1 BARROS distillery – bagasse combustion 50
6.2 BARROS distillery – biogas production 54
6.3 Jugudul distillery – bagasse combustion 56
6.4 Jugudul distillery – biogas from vinasse 60
6.5 Quinhamel distillery – bagasse combustion 61
6.6 Quinhamel distillery – biogas production 65
6.7 AGROGEBA Rice Factory 67
6.8 Bafata power plant 70
6.9 ARREY Cashew Processing 72
7 Conclusions and Recommendations 75
7.1 Conclusions 75
7.2 Recommendations 78
References
vi
UNITS AND ABBREVIATIONS
Abbreviations
AC Alternating Current
C:N (ratio) Carbon to Nitrogen (ratio)
CHP Combined Heat and Power
CH4 Methane
CNSL Cashew Nut Shell Liquid
CO Carbon monoxide
COD Chemical Oxygen Demand (expressed in mgO2/l or ppm)
CO2, CO2eq Carbon Dioxide (equivalent) (in Greenhouse Gas accounting)
DC Direct Current
EAGB Empresa de Eletricidade e Águas da Guiné-Bissau
ECOWAS Economic Community of West African States
ECREEE ECOWAS Centre for Renewable Energy and Energy Efficiency
EFB Empty Fruit Bunch
EUR Euro
FCFA West-African Franc
FFA Free Fatty Acids
FFB Full Fruit Bunch
GDE General Directorate for Energy
Ha Hectare (unit for surface area), 1 ha = 10,000 m2
H2 Hydrogen gas
H2S Hydrogen Sulphide
HRT Hydraulic Retention Time
K Potassium
MV Medium Voltage
N Nitrogen
N2 Nitrogen gas
NREP National Renewable Energy Policy
NREAP National Renewable Energy Action Plan
O&M Operation and Maintenance
ORC Organic Rankine Cycle
O2 Oxygen
PPO Pure Plant Oil
PVC Polyvinyl Chloride
SVO Straight Vegetable Oil
UASB Upflow Anaerobic Sludge Blanket
UEMOA Union Economique et Monétaire Ouest Africaine
USD United States Dollar
Units
a year
atm atmosphere (1.013 bar)
°C degrees centigrade
vi
cSt Centistokes (mm2/s)
d day
g, kg, mg gram, kilogram (1kg = 1000g), milligram (1mg = 0.001g)
kgf kg force (9.81 Newton)
h hour
kJ, MJ, GJ kilojoule, megajoule, gigajoule (unit for energy), 1 GJ = 1,000 MJ = 1,000,000 kJ
kV kilovolt (unit for electrical tension), 1 kV = 1,000 V
kVA, MVA kilovolt-ampere, megavolt-ampere (unit for electrical apparent power)
kW, MW kilowatt, megawatt (unit of power), 1 MW = 1,000 kW= 1,000,000 Joules/second
(NB the suffix –e (kWe, MWe) indicates electrical power)
kWh, MWh kilowatthour, megawatthour (unit for energy), 1 MWh = 1,000 kWh = 3.6 GJ
l litre
m3 cubic metre
Nm3 cubic metre gas under normalised conditions of pressure and temperature, i.e.
at 20 °C and 1 atmosphere
t ton = 1,000 kg
1
1 INTRODUCTION
1.1 Background: the power sector in Guinea Bissau1
Guinea Bissau is facing the interrelated challenges of energy access, energy security and climate
change mitigation and adaptation simultaneously. The chronic energy crisis hampers the social,
economic and industrial development of Guinea Bissau. The need for modern, reliable and
affordable energy services (electricity, motive power, modern fuels) is huge at all levels
(productive sectors, social sectors, residential). The national final energy consumption is
characterized by the predominance of traditional use of biomass with up to 87.8%, followed by
11.7% from petroleum products and only 0.5% from electricity. Fuelwood is the dominant
source of fuel (particularly for cooking purposes) with a demand that exceeds 500,000 tons per
year, followed by charcoal being the most-used fuel in the urban areas.
The unsustainable electricity generation and distribution system represents a high cost for the
entire economy of the country, adversely impacting production costs and the population’s
standard of living. In terms of electricity generation, the country relies on diesel generators and,
as long as the country continues to depend on expensive diesel-based power generation, the
situation is not expected to improve.
The years of civil and political unrest have left Guinea Bissau with a poor and declining electricity
system and service in urban, peri-urban and rural areas. There is a rapidly growing gap between
the urban electricity demand and available generation and distribution capacity. The generation
capacity has dropped more than 80% in the past years. The four (out of seven) units operated
by the national utility EAGB (7.5 MW) are, in practice, estimated to deliver 2 MW on average
due to lack of ability to purchase fuel and maintenance challenges. The (potential) demand for
power in the capital Bissau alone has been estimated at 30 MW. Due to bad maintenance and
lack of financial sources of the utility the city of Bissau is facing chronic power cuts and load
shedding. Due to the failure of the public supply system, large consumers such as embassies,
international organizations, hotels and other institutions use private diesel generators with an
overall estimated capacity of 20 MW. There is also an estimate of 800-1000 small diesel
generators in use by the residential sector.
The power transmission and distribution system of Guinea Bissau remains underdeveloped. The
country’s electrical network was once divided into several isolated grids which include the main
grid for the capital and independent secondary grids and secondary production centres in peri-
urban areas (Bafata, Gabu, Farim, Mansoa, Bissora, Canchungo and Catio). Due to the political
instability, economic decline, poor maintenance, theft of wires and high costs of diesel none of
the isolated grids and generation facilities are functional. The main grid in Bissau is outdated and
characterized by high technical and commercial losses (exceeding 30%). The grid system of
Guinea Bissau is currently not connected to its neighbouring countries.
Therefore, only a small proportion of the population has access to reliable electricity services.
The national electrification rate was estimated at 11.5% in 2010. There are huge disparities
between the capital Bissau (with 29.1% rate of electrification), the other major cities of the
country (with an average of only 4.3% electrification rate), and the rural areas with less than 1%
electrification rate. The urban and rural poor in Guinea Bissau spend more income for poor
quality energy services, than the better-off for clean and modern energy services.
1 This section is taken from UNIDO (2014)
2
The power generation costs and consumer tariffs are high due to exclusive dependence on diesel
generators. High operating costs, high commercial and technical grid losses and a small base of
19,000 clients with a low ability and willingness to pay present a heavy burden to EAGB and the
Government. Between 2010 and 2011, ECOWAS and UEMOA had to assist the Government with
a US$10 million emergency subsidy to enable EAGB to buy diesel fuel. The consumer tariffs paid
by clients to EAGB or for independent diesel generation are very high in comparison to the
average income in the country or in comparison to many countries in ECOWAS, Europe and US.
1.2 GEF project
The underlying baseline study and project pipeline have been carried out as part of the GEF
project “Promoting investments in small to medium scale renewable energy technologies in the
electricity sector“, which addresses the existing energy challenges of Guinea Bissau by
promoting renewable energy investments in the electricity sector (UNIDO, 2014). The project
aims to achieve the following results:
• Under the investment component, a set of innovative RE projects with a total capacity of
2.5 MW will be developed and implemented. In addition, the GEF project will support the
development and endorsement of a National Renewable Energy Investment Plan (NREIP).
• Under the policy component, the GEF project will support the development and
endorsement of the National Renewable Energy Policy (NREP) and National Renewable
Energy Action Plan (NREAP). In addition, the GEF project will support the development of a
feasibility study on the establishment of a regulatory agency for the energy sector.
• Under the capacity building component, a national RE capacity building program will be
developed and its implementation facilitated.
The GEF project is being implemented by the General Directorate for Energy (GDE) of the
Ministry of Energy and Industry in Guinea Bissau, with the assistance of UNIDO and the ECOWAS
Centre for Renewable Energy and Energy Efficiency (ECREEE).
1.3 Objectives
The main objectives of the baseline study and project pipeline development work include: 1. Determining the potential of bioenergy for the production of electricity in agro-industries
and for rural electrification purposes in Guinea Bissau;
2. Assessing the current status of the bioelectricity projects of SICAJU in Bissau, SAFIM in
Safim, and LICAJU in Bolama; including an analysis of technical and non-technical
problems, means and costs of revitalization or finalization of the projects, and
documentation of lessons learned;
3. Providing a pipeline of bioelectricity projects, including and provide basic technical and
financial key indicators.
1.4 Structure of this report
The structure of the report is as follows:
• Chapter 2 provides a brief overview of relevant biomass electricity production
technologies, and their technical features;
• Chapter 3 presents an assessment of the biomass resources in Guinea Bissau, on the basis
of prevailing agricultural and agro-industrial production;

3
• Chapter 4 presents the biomass electricity production potential in Guinea Bissau;
• Chapter 5 contains the results of the assessment of the three existing biomass electricity
projects that were earlier implemented in Guinea Bissau;
• Chapter 6 contains the basic technical and economical features of nine potential biomass
electricity projects in Guinea Bissau;
• Chapter 7 presents the conclusions and recommendations.
4
2 BIOMASS ELECTRICITY PRODUCTION TECHNOLOGIES
2.1 Biomass combustion
2.1.1 Steam turbine systems
Steam turbine systems are very commonly used for the production of electricity, albeit usually
at the multi-megawatt scale. Steam turbines operate in a steam cycle: 1. High-pressure, high temperature steam is produced in a boiler; the energy is provided by
the combustion of a fuel. 2. The steam is expanded through a turbine which drives an alternator; the steam exits the
turbine at low (sometimes sub-atmospheric) pressure. 3. The low-pressure steam is then either used as process steam, or condensed in a condenser. 4. The condense water is fed back to the boiler to be used again in the cycle.
The efficiency of a steam turbine system largely depends on the used steam pressures on the
high- and low pressure sides, and on the turbine efficiency (related to scale). For smaller systems
(around 1MW) that are optimised for maximum electrical output, gross efficiencies of around
15% (fuel to electricity) can be obtained.
Co-generation systems, in which power and
heat are used, generally have lower
electricity yields but much higher over-all
efficiencies.
Steam turbines systems are generally
applied from about 500 kWe upwards,
although smaller units can be found in co-
generation systems. They are mainly found
in large power plants and in industry,
mostly in co-generation systems (see box).
In developing countries, they are often
found in large agro-industries such as sugar
and palm oil mills.
Advantages of steam turbine systems are
their reliability, their low maintenance
requirements, and their (relatively) wide
availability under commercial conditions.
Disadvantages are the high capital cost and
the limited electrical efficiency - especially
of smaller systems.
2.1.2 Organic Rankine Cycles (ORC)
Organic Rankine cycles are similar to steam turbine cycles but they use organic fluids instead of
steam. The working fluids have different thermodynamic properties, allowing ORC systems to
operate at lower temperatures and pressures, and superheating of the medium to be avoided.
This makes ORC systems suitable for low-temperature heat sources, e.g. in waste heat recovery,
geothermal and solar thermal applications. When used in combination with combustion
systems, it can lead to lower boiler equipment costs, but also allows for limiting combustion
Box: co-generation
Co-generation of power and heat is a suitable way of
increasing the over-all efficiency of an energy
production system. The production of (only) power
results in the production of large amounts of residual
heat – usually at low temperatures – which is often
regarded as waste. This waste heat makes up at least
50% of the used primary energy; this share can be more
than 90% in inefficient energy systems.
In some cases, this low-temperature heat can be
utilised for heating or drying. When heat is required at
higher temperatures – e.g. process steam in industry -
it can be beneficial to produce high pressure steam, and
let it expand to the desired pressure and temperature
through a turbine – or to extract part of the steam from
the turbine before it reaches the low-pressure stage.
This is called co-generation.
Note that systems in which process steam and steam
for a steam cycle are taken from a single boiler do not
have a specific energetic advantages; nevertheless,
they can have cost advantages.
5
temperatures; this can be beneficial for certain types of biomass with low ash melting behaviour
(e.g. straw). Further advantages are the long operational life of equipment, due to the non-
eroding and non-corroding characteristics of the working fluid, and good partial load
characteristics.
ORC systems are typically found in small and medium-sized applications, up to a few MWe. Gross
efficiencies for systems in the MW-scale are typically a bit above those found with conventional
steam cycles. Especially at lower scales (<1 MWe), the efficiency advantage over conventional
steam cycle systems are remarkable.
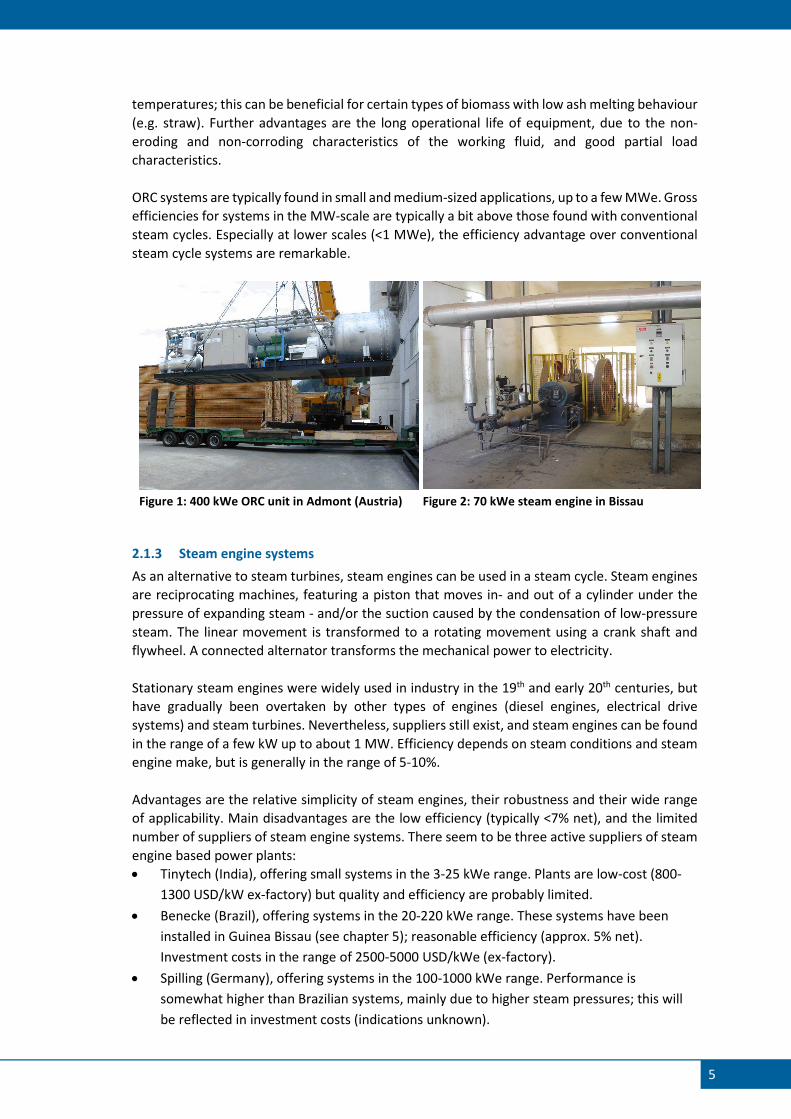
Figure 1: 400 kWe ORC unit in Admont (Austria) Figure 2: 70 kWe steam engine in Bissau
2.1.3 Steam engine systems
As an alternative to steam turbines, steam engines can be used in a steam cycle. Steam engines
are reciprocating machines, featuring a piston that moves in- and out of a cylinder under the
pressure of expanding steam - and/or the suction caused by the condensation of low-pressure
steam. The linear movement is transformed to a rotating movement using a crank shaft and
flywheel. A connected alternator transforms the mechanical power to electricity.
Stationary steam engines were widely used in industry in the 19th and early 20th centuries, but
have gradually been overtaken by other types of engines (diesel engines, electrical drive
systems) and steam turbines. Nevertheless, suppliers still exist, and steam engines can be found
in the range of a few kW up to about 1 MW. Efficiency depends on steam conditions and steam
engine make, but is generally in the range of 5-10%.
Advantages are the relative simplicity of steam engines, their robustness and their wide range
of applicability. Main disadvantages are the low efficiency (typically <7% net), and the limited
number of suppliers of steam engine systems. There seem to be three active suppliers of steam
engine based power plants:
• Tinytech (India), offering small systems in the 3-25 kWe range. Plants are low-cost (800-
1300 USD/kW ex-factory) but quality and efficiency are probably limited.
• Benecke (Brazil), offering systems in the 20-220 kWe range. These systems have been
installed in Guinea Bissau (see chapter 5); reasonable efficiency (approx. 5% net).
Investment costs in the range of 2500-5000 USD/kWe (ex-factory).
• Spilling (Germany), offering systems in the 100-1000 kWe range. Performance is
somewhat higher than Brazilian systems, mainly due to higher steam pressures; this will
be reflected in investment costs (indications unknown).
6
2.1.4 Stirling engines
Stirling engines are engines that operate on the expansion and shrinkage of a contained gaseous
medium, created by the subsequent heating and cooling of the medium (e.g. air). The engine is
closed: heat is added from an external heat source at one end of the engine, and discharged at
a lower temperature at the other.
There has been a recent renewal of interest in Stirling engine technology for micro-CHP
applications, primarily in combination with natural gas fired domestic heating systems found in
Europe. There have also been systems developed that operate in combination with biomass (e.g.
rice husk) combustor, in the range of 1-10 kWe. These systems are designed to run continuously
at rated output power, charging a battery pack, and supply electricity at 12V (DC) or 230V (AC)
through an inverter. Efficiency is in the range of 10-15%. Maintenance requirements are
supposedly very low.
Advantages are the relatively high efficiency at a small scale, and the reported low maintenance
requirements. Disadvantages are the small maximum scale, and the batteries / electronics
required for optimal operation. Also, the technology is currently not commercially available;
system costs are presently unknown.
2.2 Gasification
Biomass gasification is a thermo-chemical process that converts solid biomass and small
quantities of air into a combustible gas. This gas is called producer gas or syngas and can be used
for the production of heat, or as a fuel in gas or diesel engines for the production of mechanical
power or electricity. Among the suitable types of biomass for gasification are wood chips, corn
cobs, nut shells and rice husks.
Producer gas is a mixture of different gases. Main constituents are carbon monoxide (CO),
carbon dioxide (CO2), methane (CH4), hydrogen (H2) and nitrogen (N2). Raw gas will contain also
ash and tar, which need to be filtered out before use in engines. The gas typically has a calorific
value in the range of 4-6 MJ/Nm3.
There are many different types of gasification technologies; the most prevalent type is the fixed
bed downdraft system, available in a scale range of approx. 10-500 kWe. Over-all efficiency is
normally in the range of approx. 15-20%.
Gasification systems typically comprise of the following main elements:
• A gasifier reactor, in which the conversion of biomass to producer gas takes place. It is
normally a steel vessel where, in the case of down draft gasifiers, the fuel enters through
the top, and the gas exits near the bottom. Ash and char are removed from the bottom
part.
• A gas treatment system, which removes tars and ashes from the raw gas and reduces its
temperature. It usually includes a scrubber, cooler and gas filter.
• The engine / generator set for using the gas. Gas engines can run on gas only; diesel
engines always require at least some 20% of diesel during operation.
7
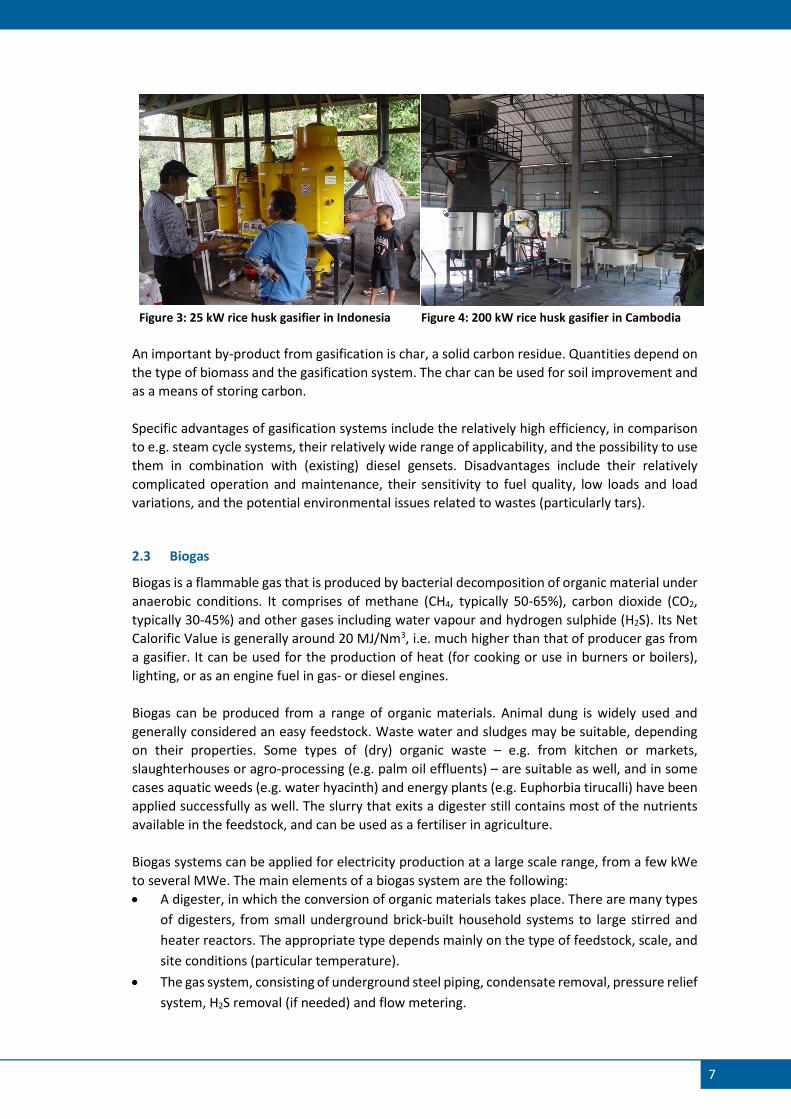
Figure 3: 25 kW rice husk gasifier in Indonesia Figure 4: 200 kW rice husk gasifier in Cambodia
An important by-product from gasification is char, a solid carbon residue. Quantities depend on
the type of biomass and the gasification system. The char can be used for soil improvement and
as a means of storing carbon.
Specific advantages of gasification systems include the relatively high efficiency, in comparison
to e.g. steam cycle systems, their relatively wide range of applicability, and the possibility to use
them in combination with (existing) diesel gensets. Disadvantages include their relatively
complicated operation and maintenance, their sensitivity to fuel quality, low loads and load
variations, and the potential environmental issues related to wastes (particularly tars).
2.3 Biogas
Biogas is a flammable gas that is produced by bacterial decomposition of organic material under
anaerobic conditions. It comprises of methane (CH4, typically 50-65%), carbon dioxide (CO2,
typically 30-45%) and other gases including water vapour and hydrogen sulphide (H2S). Its Net
Calorific Value is generally around 20 MJ/Nm3, i.e. much higher than that of producer gas from
a gasifier. It can be used for the production of heat (for cooking or use in burners or boilers),
lighting, or as an engine fuel in gas- or diesel engines.
Biogas can be produced from a range of organic materials. Animal dung is widely used and
generally considered an easy feedstock. Waste water and sludges may be suitable, depending
on their properties. Some types of (dry) organic waste – e.g. from kitchen or markets,
slaughterhouses or agro-processing (e.g. palm oil effluents) – are suitable as well, and in some
cases aquatic weeds (e.g. water hyacinth) and energy plants (e.g. Euphorbia tirucalli) have been
applied successfully as well. The slurry that exits a digester still contains most of the nutrients
available in the feedstock, and can be used as a fertiliser in agriculture.
Biogas systems can be applied for electricity production at a large scale range, from a few kWe
to several MWe. The main elements of a biogas system are the following:
• A digester, in which the conversion of organic materials takes place. There are many types
of digesters, from small underground brick-built household systems to large stirred and
heater reactors. The appropriate type depends mainly on the type of feedstock, scale, and
site conditions (particular temperature).
• The gas system, consisting of underground steel piping, condensate removal, pressure relief
system, H2S removal (if needed) and flow metering.
8
• Gas utilisation equipment; this can be burners for heat applications, or engine / generator
sets for the production of electricity or mechanical power. Like producer gas, biogas can be
used in gas engines or in diesel engines, the latter requiring some diesel during operation.
Advantages of biogas systems include i.a. their low complexity, the possibility to use wet (waste)
biomass, the versatility of biogas (including in existing diesel gensets) and the possible use of
digested slurry as fertiliser. Disadvantages include the relatively high construction costs of
biogas systems and, in some cases, the feedstock logistics.
2.4 Vegetable oils
Straight Vegetable Oil (SVO, also called Pure Plant Oil or PPO) can be used as a substitute fuel in
diesel engines, provided that measures are taken to deal with the higher viscosity of the oil and
that it meets a number of fuel quality requirements.
The higher viscosity of oil can cause problems in the fuel supply system and with fuel combustion
due to the poor atomisation. There are broadly three ways in which the higher viscosity of PPO
can be overcome:
• By heating the oil, which causes its viscosity to drop. This method is often applied with
stationary diesels, which are the modified such that the engine waste heat is used for pre-
heating the oil. Note that not every engine is equally suitable for running on PPO.
• By chemically altering the properties of the oil, usually by transesterification. The oil is then
transformed into biodiesel, which can be used in most diesel engines without further
modifications. Note that biodiesel production is a serious industrial process that needs a
certain minimum scale in order to be technically and financially viable.
• By mixing the oil with fossil diesel, such that the viscosity of the mixture is acceptable for
engine use. The maximum ratio depends on the properties of the oil, but typically some 20-
30% of oil can be mixed with 70-80% of diesel.
Apart from the oil viscosity, several other properties / constituents need to be taken into
consideration:
• The level of Free Fatty Acids (FFA) which can cause corrosion of engine parts and thus lead
to rapid engine deterioration.
• The level of phospholipids which can cause blockages in the fuel system (filters) and
deposits on engine parts.
• The presence of particular matter which can cause fuel filters to block quickly.
• The presence of water, which causes rapid oil deterioration and thus reduces storage life.
These properties can, to some extent at least, be manipulated by managing the oil production
process (oil seeds harvesting and logistics, press type and press operation). They can also be
altered fairly easily after production, by neutralisation, degumming, filtering and drying.
Other important properties include the presence of minerals, iodine number and cetane
number. These properties are related to the oil type and origin. Advantage of using PPO is that
it allows the use of (existing) diesel engines, with relatively simple modifications. Production of
oil for fuel can be an attractive economic activity in some regions. Disadvantages include the
high cost of the oil, and – in some cases – competition with the use of the oil for food.
9
3 BIOMASS RESOURCES IN GUINEA BISSAU
3.1 Overview
This chapter presents an overview of a number of agricultural and agro-industrial sectors that
are potentially relevant for the production of biomass and bioenergy. The selection has been
made on the basis of sector output (as found in FAOSTAT (2015) data) and the findings of field
work carried out in June 2015. A summary of the findings (output of the sectors and major by-
products) is presented in Table 1 below.
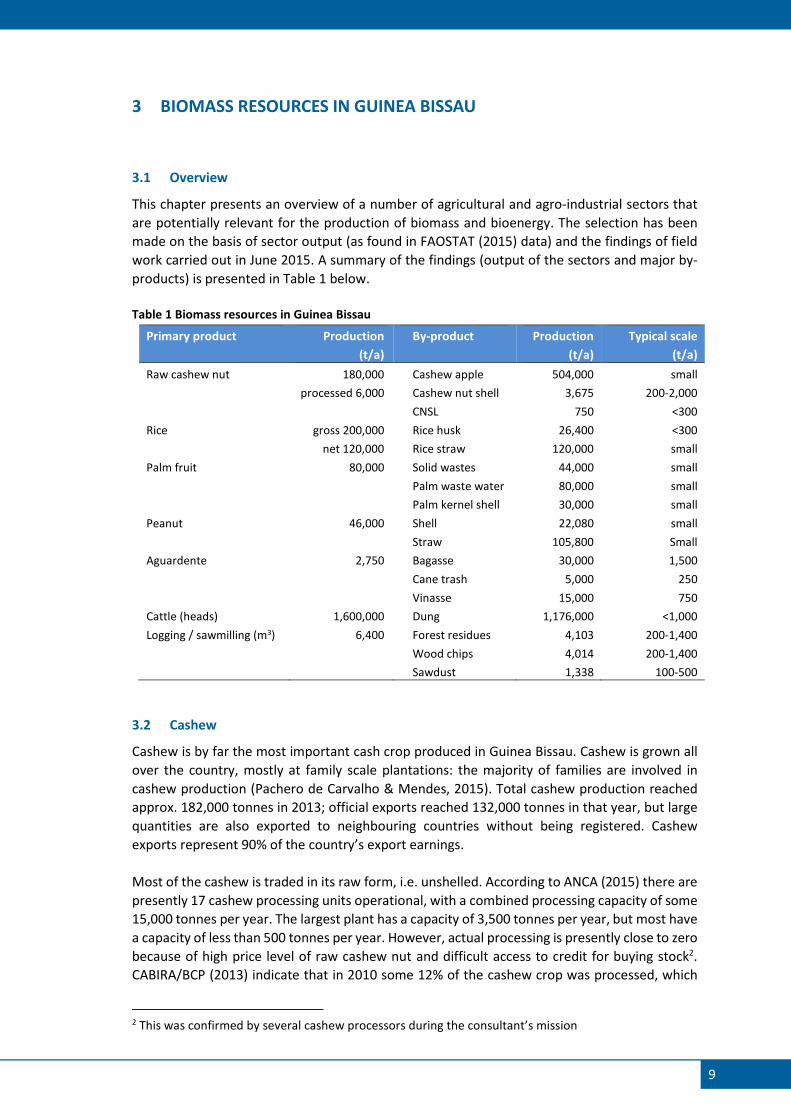
Table 1 Biomass resources in Guinea Bissau
Primary product Production
(t/a)
By-product Production
(t/a)
Typical scale
(t/a)
Raw cashew nut 180,000 Cashew apple 504,000 small
processed 6,000 Cashew nut shell 3,675 200-2,000
CNSL 750 <300
Rice gross 200,000 Rice husk 26,400 <300
net 120,000 Rice straw 120,000 small
Palm fruit 80,000 Solid wastes 44,000 small
Palm waste water 80,000 small
Palm kernel shell 30,000 small
Peanut 46,000 Shell 22,080 small
Straw 105,800 Small
Aguardente 2,750 Bagasse 30,000 1,500
Cane trash 5,000 250
Vinasse 15,000 750
Cattle (heads) 1,600,000 Dung 1,176,000 <1,000
Logging / sawmilling (m3) 6,400 Forest residues 4,103 200-1,400
Wood chips 4,014 200-1,400
Sawdust 1,338 100-500
3.2 Cashew
Cashew is by far the most important cash crop produced in Guinea Bissau. Cashew is grown all
over the country, mostly at family scale plantations: the majority of families are involved in
cashew production (Pachero de Carvalho & Mendes, 2015). Total cashew production reached
approx. 182,000 tonnes in 2013; official exports reached 132,000 tonnes in that year, but large
quantities are also exported to neighbouring countries without being registered. Cashew
exports represent 90% of the country’s export earnings.
Most of the cashew is traded in its raw form, i.e. unshelled. According to ANCA (2015) there are
presently 17 cashew processing units operational, with a combined processing capacity of some
15,000 tonnes per year. The largest plant has a capacity of 3,500 tonnes per year, but most have
a capacity of less than 500 tonnes per year. However, actual processing is presently close to zero
because of high price level of raw cashew nut and difficult access to credit for buying stock2.
CABIRA/BCP (2013) indicate that in 2010 some 12% of the cashew crop was processed, which
2 This was confirmed by several cashew processors during the consultant’s mission
10
would have been some 13,000 tonnes of raw nuts. According to Pachero de Carvalho & Mendes
(2015), only 3,000 tonnes of cashew were processed in 2013. In this study, an annual processing
of 6,000 t/a is assumed – particularly because of the large production capacity of the most recent
company (ARREY Africa in Bula).
Figure 5: Cashew drying at ARREY Africa in Bula Figure 6: Laico Industries in Quinhamel
The main by-products from cashew production are cashew apple (pulp) and cashew nut shell.
3.2.1 Cashew apple (pulp)
The cashew apple is the thick receptacle or “false fruit” to which the cashew nut is attached. The
fruits main constituents are water (85-88%), sugars (7-12%), raw fibre (1-4%) and ash (0.3-1.6%).
Per kg of raw cashew nuts, at least 4 kg of apples are produced (CABIRA/BCP, 2013;
MADER/GPSCA, 2002).
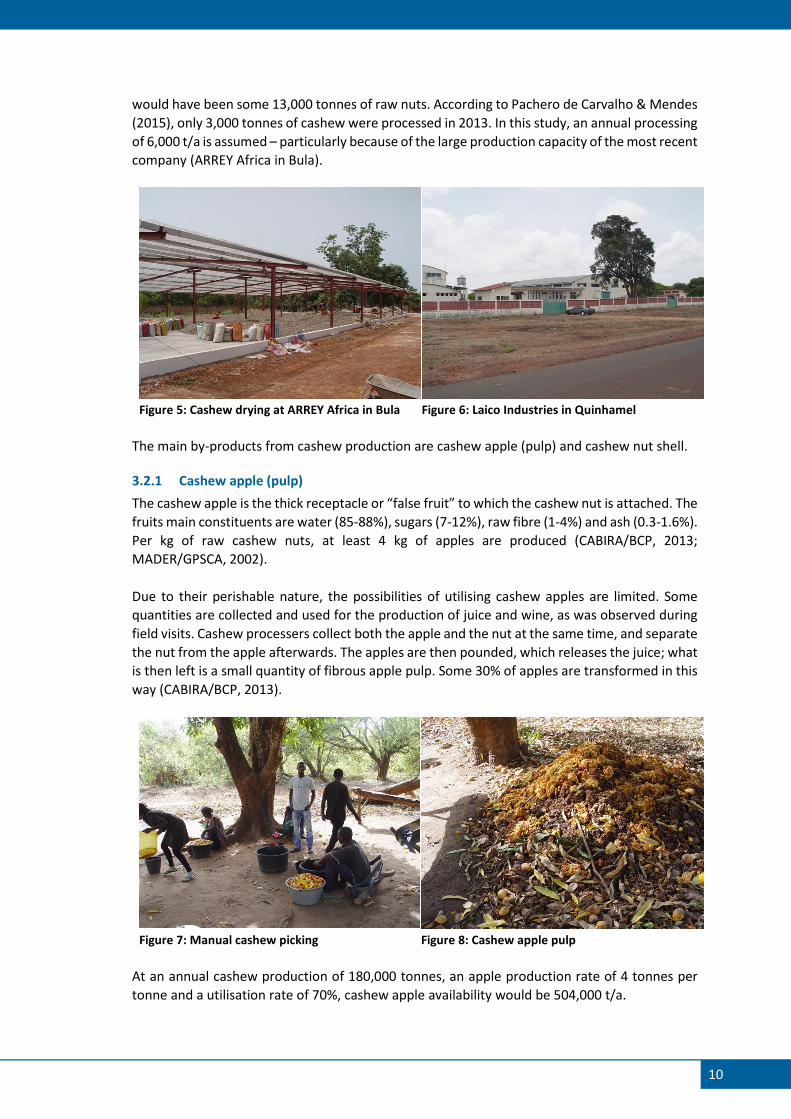
Due to their perishable nature, the possibilities of utilising cashew apples are limited. Some
quantities are collected and used for the production of juice and wine, as was observed during
field visits. Cashew processers collect both the apple and the nut at the same time, and separate
the nut from the apple afterwards. The apples are then pounded, which releases the juice; what
is then left is a small quantity of fibrous apple pulp. Some 30% of apples are transformed in this
way (CABIRA/BCP, 2013).
Figure 7: Manual cashew picking Figure 8: Cashew apple pulp
At an annual cashew production of 180,000 tonnes, an apple production rate of 4 tonnes per
tonne and a utilisation rate of 70%, cashew apple availability would be 504,000 t/a.
11
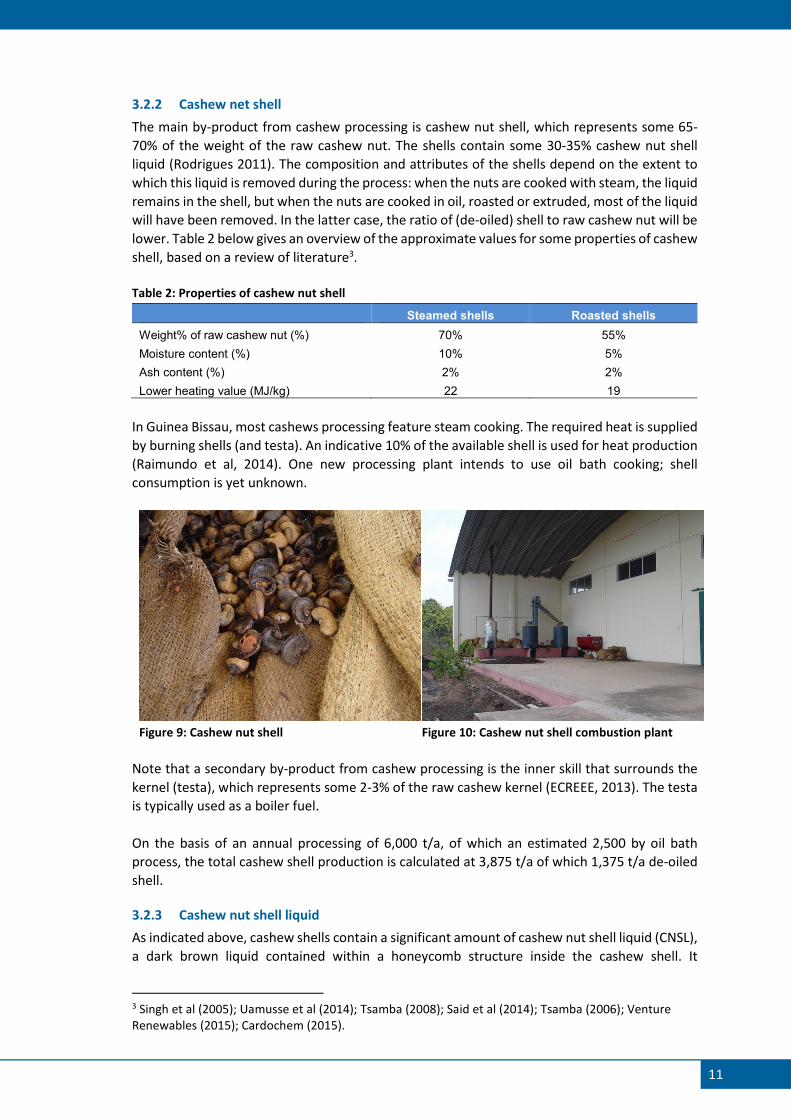
3.2.2 Cashew net shell
The main by-product from cashew processing is cashew nut shell, which represents some 65-
70% of the weight of the raw cashew nut. The shells contain some 30-35% cashew nut shell
liquid (Rodrigues 2011). The composition and attributes of the shells depend on the extent to
which this liquid is removed during the process: when the nuts are cooked with steam, the liquid
remains in the shell, but when the nuts are cooked in oil, roasted or extruded, most of the liquid
will have been removed. In the latter case, the ratio of (de-oiled) shell to raw cashew nut will be
lower. Table 2 below gives an overview of the approximate values for some properties of cashew
shell, based on a review of literature3.
Table 2: Properties of cashew nut shell
Steamed shells Roasted shells
Weight% of raw cashew nut (%) 70% 55%
Moisture content (%) 10% 5%
Ash content (%) 2% 2%
Lower heating value (MJ/kg) 22 19
In Guinea Bissau, most cashews processing feature steam cooking. The required heat is supplied
by burning shells (and testa). An indicative 10% of the available shell is used for heat production
(Raimundo et al, 2014). One new processing plant intends to use oil bath cooking; shell
consumption is yet unknown.
Figure 9: Cashew nut shell Figure 10: Cashew nut shell combustion plant
Note that a secondary by-product from cashew processing is the inner skill that surrounds the
kernel (testa), which represents some 2-3% of the raw cashew kernel (ECREEE, 2013). The testa
is typically used as a boiler fuel.
On the basis of an annual processing of 6,000 t/a, of which an estimated 2,500 by oil bath
process, the total cashew shell production is calculated at 3,875 t/a of which 1,375 t/a de-oiled
shell.
3.2.3 Cashew nut shell liquid
As indicated above, cashew shells contain a significant amount of cashew nut shell liquid (CNSL),
a dark brown liquid contained within a honeycomb structure inside the cashew shell. It
3 Singh et al (2005); Uamusse et al (2014); Tsamba (2008); Said et al (2014); Tsamba (2006); Venture Renewables (2015); Cardochem (2015).
12
represents some 30-35% of the cashew nut shell, or 20-25% of the raw cashew nut. In this study,
a recoverable amount of 15% (on raw cashew nut) is assumed.
CNSL is not a triglyceride and contains a high proportion of phenolic compounds (Akinhanmi et
al, 2014). Its distillate is used in industry as a raw material for brake lining compounds, as a water
proofing agent, a preservative and in the manufacturing of paints and plastics. It is toxic and
corrosive to the skin.
In its natural form, CNSL consists mainly of anacardic acid (approx. 70%), with smaller quantities
of cardol, cardanol and methyl-cardol (Palvannan, 2012; Radhakrrishnan et al, 2014). However,
at elevated temperatures (185-190°C), decarboxylation takes place, transforming anacardic acid
into cardanol (Velmurugan and Loganathan, 2011). Heating of CNSL (as is done when roasting
or oil bath cooking of cashew nut) then results in so-called technical CNSL which is rich in
cardanol (52%), cardol (10%) and polymeric substances (30%). Further distillation of the CNSL
increases the cardanol content (78%), and reduces the polymers (2%). Table 3 below presents
values for some CNSL properties on the basis of a literature review.
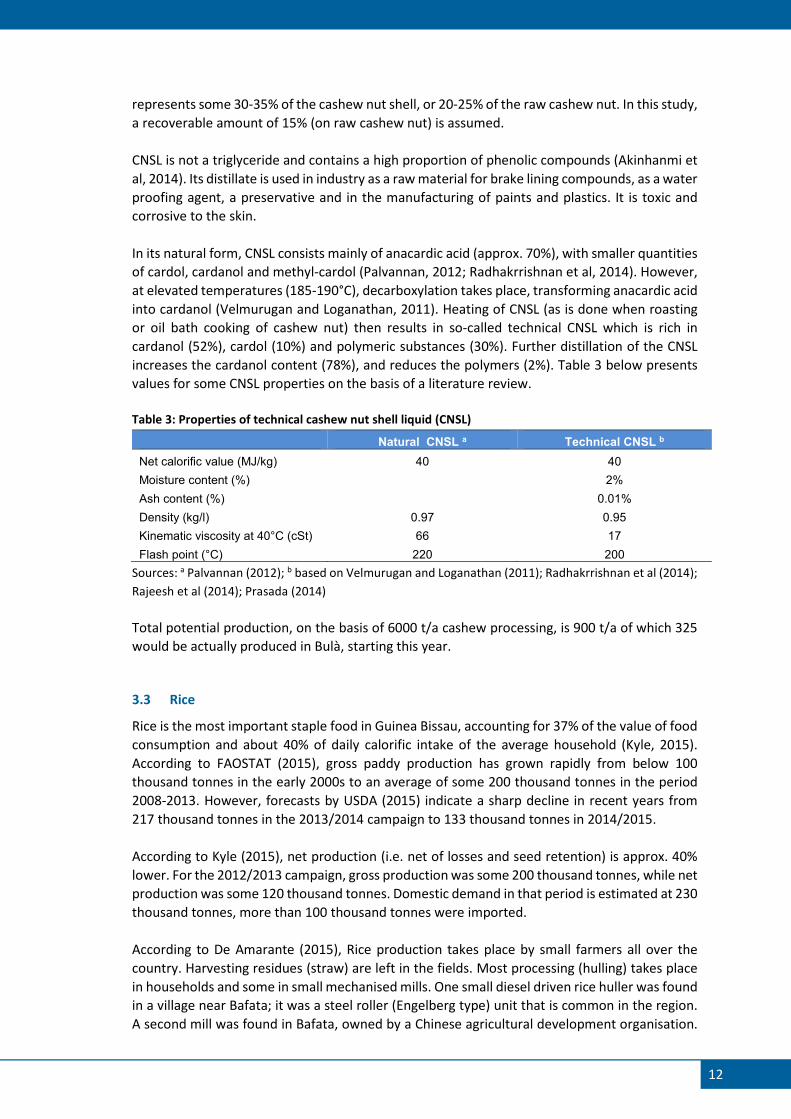
Table 3: Properties of technical cashew nut shell liquid (CNSL)
Natural CNSL a Technical CNSL b
Net calorific value (MJ/kg) 40 40
Moisture content (%) 2%
Ash content (%) 0.01%
Density (kg/l) 0.97 0.95
Kinematic viscosity at 40°C (cSt) 66 17
Flash point (°C) 220 200
Sources: a Palvannan (2012); b based on Velmurugan and Loganathan (2011); Radhakrrishnan et al (2014);
Rajeesh et al (2014); Prasada (2014)
Total potential production, on the basis of 6000 t/a cashew processing, is 900 t/a of which 325
would be actually produced in Bulà, starting this year.
3.3 Rice
Rice is the most important staple food in Guinea Bissau, accounting for 37% of the value of food
consumption and about 40% of daily calorific intake of the average household (Kyle, 2015).
According to FAOSTAT (2015), gross paddy production has grown rapidly from below 100
thousand tonnes in the early 2000s to an average of some 200 thousand tonnes in the period
2008-2013. However, forecasts by USDA (2015) indicate a sharp decline in recent years from
217 thousand tonnes in the 2013/2014 campaign to 133 thousand tonnes in 2014/2015.
According to Kyle (2015), net production (i.e. net of losses and seed retention) is approx. 40%
lower. For the 2012/2013 campaign, gross production was some 200 thousand tonnes, while net
production was some 120 thousand tonnes. Domestic demand in that period is estimated at 230
thousand tonnes, more than 100 thousand tonnes were imported.
According to De Amarante (2015), Rice production takes place by small farmers all over the
country. Harvesting residues (straw) are left in the fields. Most processing (hulling) takes place
in households and some in small mechanised mills. One small diesel driven rice huller was found
in a village near Bafata; it was a steel roller (Engelberg type) unit that is common in the region.
A second mill was found in Bafata, owned by a Chinese agricultural development organisation.
13
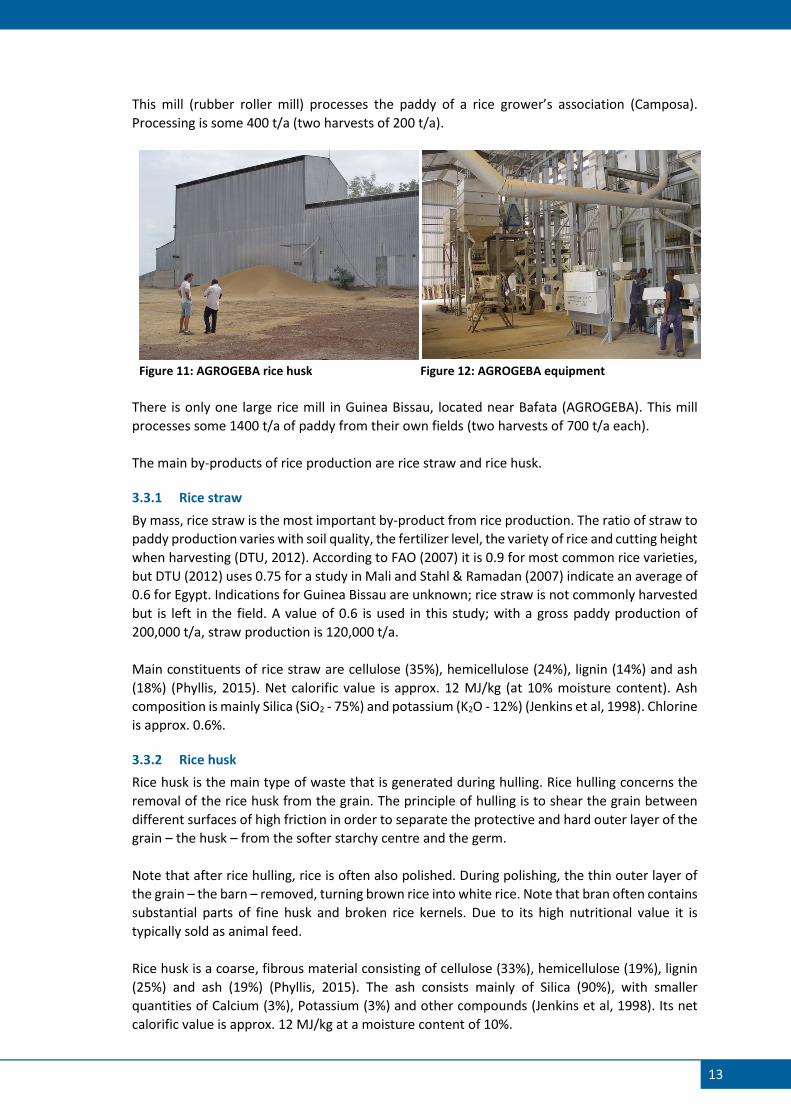
This mill (rubber roller mill) processes the paddy of a rice grower’s association (Camposa).
Processing is some 400 t/a (two harvests of 200 t/a).
Figure 11: AGROGEBA rice husk Figure 12: AGROGEBA equipment
There is only one large rice mill in Guinea Bissau, located near Bafata (AGROGEBA). This mill
processes some 1400 t/a of paddy from their own fields (two harvests of 700 t/a each).
The main by-products of rice production are rice straw and rice husk.
3.3.1 Rice straw
By mass, rice straw is the most important by-product from rice production. The ratio of straw to
paddy production varies with soil quality, the fertilizer level, the variety of rice and cutting height
when harvesting (DTU, 2012). According to FAO (2007) it is 0.9 for most common rice varieties,
but DTU (2012) uses 0.75 for a study in Mali and Stahl & Ramadan (2007) indicate an average of
0.6 for Egypt. Indications for Guinea Bissau are unknown; rice straw is not commonly harvested
but is left in the field. A value of 0.6 is used in this study; with a gross paddy production of
200,000 t/a, straw production is 120,000 t/a.
Main constituents of rice straw are cellulose (35%), hemicellulose (24%), lignin (14%) and ash
(18%) (Phyllis, 2015). Net calorific value is approx. 12 MJ/kg (at 10% moisture content). Ash
composition is mainly Silica (SiO2 - 75%) and potassium (K2O - 12%) (Jenkins et al, 1998). Chlorine
is approx. 0.6%.
3.3.2 Rice husk
Rice husk is the main type of waste that is generated during hulling. Rice hulling concerns the
removal of the rice husk from the grain. The principle of hulling is to shear the grain between
different surfaces of high friction in order to separate the protective and hard outer layer of the
grain – the husk – from the softer starchy centre and the germ.
Note that after rice hulling, rice is often also polished. During polishing, the thin outer layer of
the grain – the barn – removed, turning brown rice into white rice. Note that bran often contains
substantial parts of fine husk and broken rice kernels. Due to its high nutritional value it is
typically sold as animal feed.
Rice husk is a coarse, fibrous material consisting of cellulose (33%), hemicellulose (19%), lignin
(25%) and ash (19%) (Phyllis, 2015). The ash consists mainly of Silica (90%), with smaller
quantities of Calcium (3%), Potassium (3%) and other compounds (Jenkins et al, 1998). Its net
calorific value is approx. 12 MJ/kg at a moisture content of 10%.
14
Rice husk production is typically in the range of 20-25% of the paddy processed. In some cases,
most of the bran also ends of with the husk (e.g. in Engelberg type mills) so that husk can be as
high as 35% of paddy processed. In other cases (e.g. with rubber roller mills in Indonesia), some
of the husk is ground to dust which ends up with the bran, to be sold as animal feed; husk
production can then be less than 10% of the paddy. References in Guinea Bissau indicate
production of 23% (Agrogeba) and 15-20% (Camposa association). A value of 22% is used in this
study; with a net paddy production of 120,000 t/a, rice husk production would be 26,400 t/a.
3.4 Distilleries
Distilled alcoholic beverages (aguardente) are produced in different parts of Guinea Bissau. The
main input is sugar cane4, which is produced on a small scale by farmers and at a larger scale
(hundreds of tonnes of cane per year) by some distillery owners. The cane is transported to the
distillery, and the cane juice extracted with a mechanical roller press. The juice is then fermented
and distilled in wood-fired 1000 litre vessels.
No inventory exists of existing distilleries, their capacities or their actual input and output. Pinto
Lopes (2015) estimates the total number in Guinea Bissau at 20. Approx. 3-4 distilleries would
be larger than his, but most would have a production capacity similar to his (see Table 4 below).
This would mean that total cane processing capacity would be in the order of 100,000 tonnes of
sugar cane per year.
In contrast, annual cane production indicated by FAOSTAT (2015) was only 6,350 tonnes in 2013,
with 240 ha harvested. Also, several other distilleries visited were substantially smaller in
processing capacity and actual can intake. Nova Sabi (2015) indicated that bagasse production
at distilleries are in the order of hundreds of tonnes per year, with few exceptions to a few
thousand. On this basis, cane production and processing quantity is estimated at 25-50 thousand
tonnes per year. Corresponding annual harvested area would be some 1000-2000 ha.
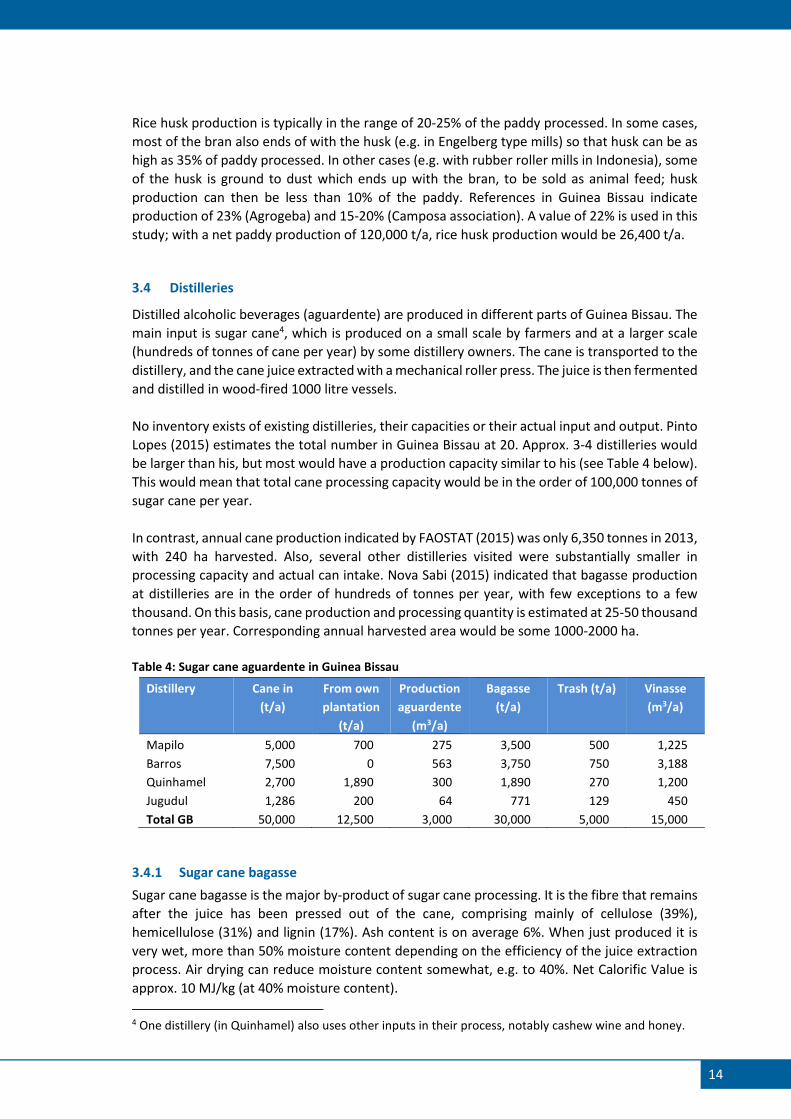
Table 4: Sugar cane aguardente in Guinea Bissau
Distillery Cane in
(t/a)
From own
plantation
(t/a)
Production
aguardente
(m3/a)
Bagasse
(t/a)
Trash (t/a) Vinasse
(m3/a)
Mapilo 5,000 700 275 3,500 500 1,225
Barros 7,500 0 563 3,750 750 3,188
Quinhamel 2,700 1,890 300 1,890 270 1,200
Jugudul 1,286 200 64 771 129 450
Total GB 50,000 12,500 3,000 30,000 5,000 15,000
3.4.1 Sugar cane bagasse
Sugar cane bagasse is the major by-product of sugar cane processing. It is the fibre that remains
after the juice has been pressed out of the cane, comprising mainly of cellulose (39%),
hemicellulose (31%) and lignin (17%). Ash content is on average 6%. When just produced it is
very wet, more than 50% moisture content depending on the efficiency of the juice extraction
process. Air drying can reduce moisture content somewhat, e.g. to 40%. Net Calorific Value is
approx. 10 MJ/kg (at 40% moisture content).
4 One distillery (in Quinhamel) also uses other inputs in their process, notably cashew wine and honey.
15
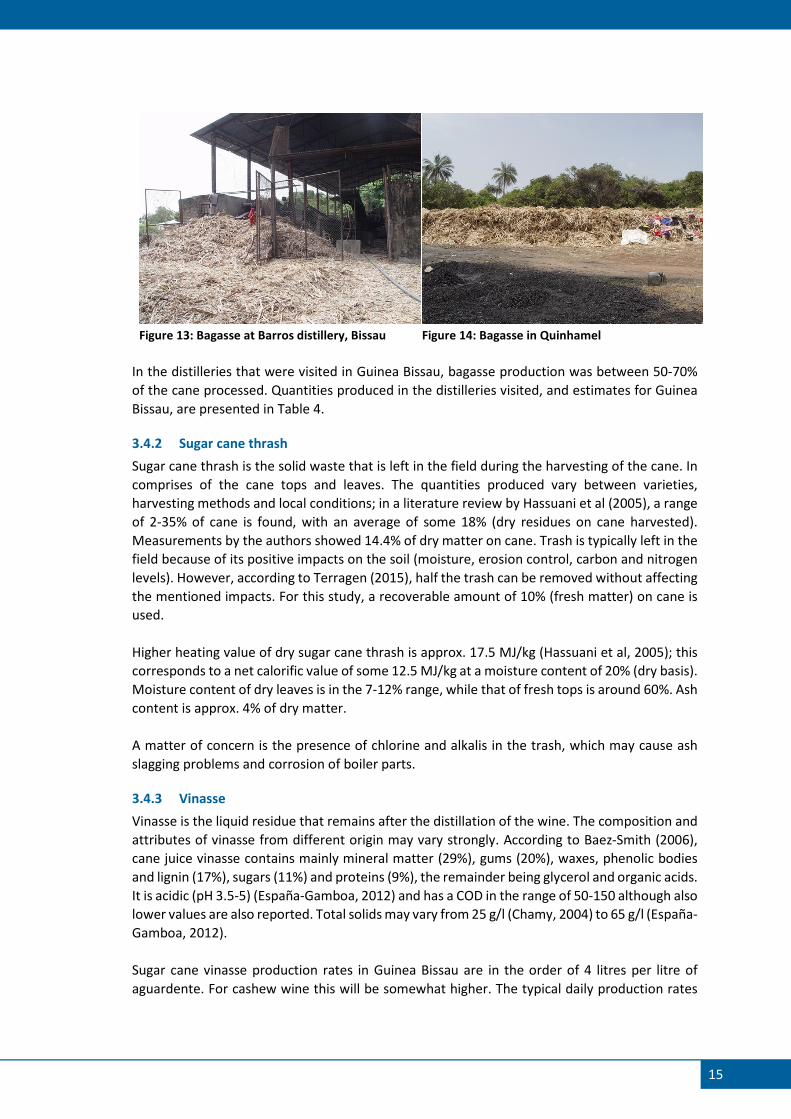
Figure 13: Bagasse at Barros distillery, Bissau Figure 14: Bagasse in Quinhamel
In the distilleries that were visited in Guinea Bissau, bagasse production was between 50-70%
of the cane processed. Quantities produced in the distilleries visited, and estimates for Guinea
Bissau, are presented in Table 4.
3.4.2 Sugar cane thrash
Sugar cane thrash is the solid waste that is left in the field during the harvesting of the cane. In
comprises of the cane tops and leaves. The quantities produced vary between varieties,
harvesting methods and local conditions; in a literature review by Hassuani et al (2005), a range
of 2-35% of cane is found, with an average of some 18% (dry residues on cane harvested).
Measurements by the authors showed 14.4% of dry matter on cane. Trash is typically left in the
field because of its positive impacts on the soil (moisture, erosion control, carbon and nitrogen
levels). However, according to Terragen (2015), half the trash can be removed without affecting
the mentioned impacts. For this study, a recoverable amount of 10% (fresh matter) on cane is
used.
Higher heating value of dry sugar cane thrash is approx. 17.5 MJ/kg (Hassuani et al, 2005); this
corresponds to a net calorific value of some 12.5 MJ/kg at a moisture content of 20% (dry basis).
Moisture content of dry leaves is in the 7-12% range, while that of fresh tops is around 60%. Ash
content is approx. 4% of dry matter.
A matter of concern is the presence of chlorine and alkalis in the trash, which may cause ash
slagging problems and corrosion of boiler parts.
3.4.3 Vinasse
Vinasse is the liquid residue that remains after the distillation of the wine. The composition and
attributes of vinasse from different origin may vary strongly. According to Baez-Smith (2006),
cane juice vinasse contains mainly mineral matter (29%), gums (20%), waxes, phenolic bodies
and lignin (17%), sugars (11%) and proteins (9%), the remainder being glycerol and organic acids.
It is acidic (pH 3.5-5) (España-Gamboa, 2012) and has a COD in the range of 50-150 although also
lower values are also reported. Total solids may vary from 25 g/l (Chamy, 2004) to 65 g/l (España-
Gamboa, 2012).
Sugar cane vinasse production rates in Guinea Bissau are in the order of 4 litres per litre of
aguardente. For cashew wine this will be somewhat higher. The typical daily production rates
16
for the distilleries visited during the field work, and the estimated total for Guinea Bissau, are
shown in Table 4.
3.5 Palm oil and palm kernel oil
Production of oil palm fruit– the basic raw material for the production of palm oil – in Guinea
Bissau has been stable at around 80 thousand tonnes per year since the late 1990s (FAOSTAT,
2015). A typical oil yield is 15-20% of oil on fruit, so palm oil production would be around 12-16
thousand tonnes per year.
According to De Amarante (2015), palm oil production takes place all over the country. It is
carried out on household scale, mainly for household consumption, using traditional (manual)
methods. This was confirmed during fieldwork, when palm oil production by a small group of
villagers was observed. Traditional methods basically involve harvesting palm fruit bunches and
removal of the fruits; sterilisation of the fruits by heating; mashing of the fruits; removing of the
oil with water; and recuperation and clearing of the oil.
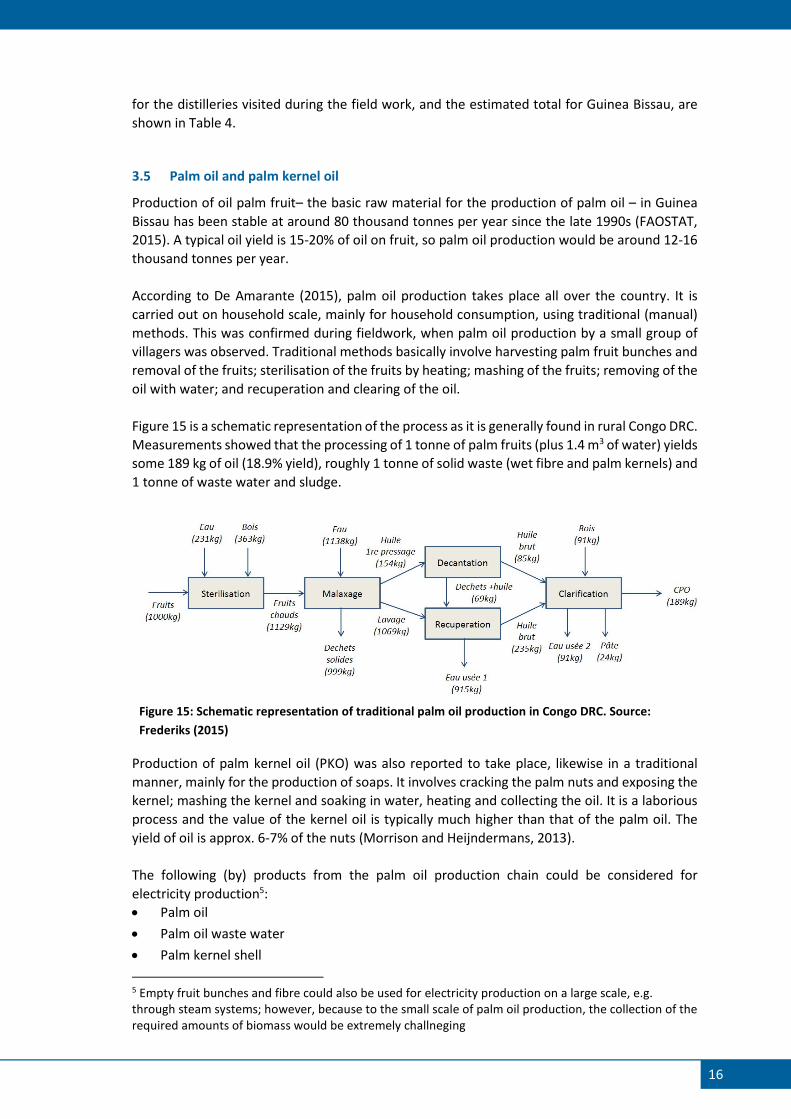
Figure 15 is a schematic representation of the process as it is generally found in rural Congo DRC.
Measurements showed that the processing of 1 tonne of palm fruits (plus 1.4 m3 of water) yields
some 189 kg of oil (18.9% yield), roughly 1 tonne of solid waste (wet fibre and palm kernels) and
1 tonne of waste water and sludge.
Figure 15: Schematic representation of traditional palm oil production in Congo DRC. Source:
Frederiks (2015)
Production of palm kernel oil (PKO) was also reported to take place, likewise in a traditional
manner, mainly for the production of soaps. It involves cracking the palm nuts and exposing the
kernel; mashing the kernel and soaking in water, heating and collecting the oil. It is a laborious
process and the value of the kernel oil is typically much higher than that of the palm oil. The
yield of oil is approx. 6-7% of the nuts (Morrison and Heijndermans, 2013).
The following (by) products from the palm oil production chain could be considered for
electricity production5:
• Palm oil
• Palm oil waste water
• Palm kernel shell
5 Empty fruit bunches and fibre could also be used for electricity production on a large scale, e.g. through steam systems; however, because to the small scale of palm oil production, the collection of the required amounts of biomass would be extremely challneging
17
• Solid wastes (empty fruit bunches, fibre)
3.5.1 Palm oil
Palm oil can be used as a fuel in conventional diesel engines. Its Net Calorific Value is similar to
that of diesel (approx. 42 MJ/kg) and its efficiency as a fuel is close to that of diesel. However,
there are several issues that need to be taken into consideration:
• Oil quality. In most cases, palm oil is too acidic, and contains elevated levels of
phosphorous, solid matter and water. Modification of the oil production process, and/or
post treatment of the oil, is usually required in order to get a fuel grade oil that can be used
without causing damage to engine parts.
• Oil viscosity. Like most vegetable oils, palm oil is much more viscous than diesel; moreover,
it solidifies at room temperature. This causes problems with injection and combustion, and
in the fuel system. Oil viscosity can be reduced by pre-heating of the oil, for example with
the heat of the engine.
• Oil price in comparison to fossil diesel. In order to make economic sense, palm oil prices
must be significantly below fossil diesel prices. This is often the case in isolated areas.
• Influence on food markets. Increased demand for palm oil could lead to price increases
when supply is falling short. This could deteriorate the food security position of vulnerable
groups.
As indicated, palm oil production in Guinea Bissau will be in the order of 12-16 thousand tonnes
per year; however, the amounts that could be made available for energy production strongly
depend on local market conditions, in terms of price level and (especially) over production /
market distortion. It is not recommended to consider its use in areas where local production and
consumption are well-balanced.
3.5.2 Palm oil waste water
Traditional palm oil production processes generate substantial quantities of waste water.
Although the amounts and composition may vary between producers, as a reference,
measurements in Congo DRC from Frederiks (2014) are used. Table 6 gives an overview of
quantities and properties.
Table 5: Results of palm oil production waste measurements (12 October 2014)
Qty (kg/t palm fruit) DM content (%) ODM content (%DM)
Waste water from washing 915 5.1% 88%
Waste water from clarification 91 17.0% 89%
Sludge from clarification 24 19.3% 88%
Total liquid wastes 1030 6.5% 88%
At a quantity of 1 tonne per tonne of palm fruit processed, total production in Guinea Bissau
would be 80,000 m3/a.
3.5.3 Palm kernel shell
Palm kernel shell is the main by-product of palm kernel oil production. The shells contain mainly
lignin (50%), cellulose and hemicellulose (each some 20%), with up to 10% ash (Ghani et al,
2009). Net Calorific value is approx. 18 MJ/kg (at 10% moisture).

18
The palm seeds make up approx. 50% of the solid wastes indicated in Figure 15, so 1 tonne of
fruits produce some 500 kg of nuts. According to Morrison & Heijndermans (2013), the shell
takes up approx. 75% of the nut, so 1 tonne of fruits could yield some 375 kg of palm kernel
shell, provided that the nuts are used for palm kernel oil production. Total potential availability
in Guinea Bissau would be 30,000 t/a.
3.5.4 Other solid wastes
Solid wastes generated from palm fruit and palm oil production include empty fruit bunches and
fibre. The empty fruit bunch is the tough fibrous rest of the bunch after the palm fruits have
been removed. When fresh, it is very wet (>50%) and thus has a limited Net Calorific Value
(approx. 7 MJ/kg at 50% moisture). Its ash content is some 5% (Phyllis, 2015). Koopmans and
Koppejan (1998) report 23% EFB on FFB; on palm fruit this would be 30%.
Fibre originates from the mesocarp of the palm fruits. Together with the palm nuts it forms the
residue that remains after the palm oil has been extracted. Tests in Congo indicated that some
15% of the wet solid residue is air dry fibre (Frederiks 2015); on palm fruit this is approx. 150 kg
per tonne. As the material is soaking wet (>50% moisture), its production is approx. 250kg/t of
palm fruit. Ash content is some 7% (Phyllis, 2015). Net Calorific Value is approx. 8 MJ/kg at 50%
moisture content.
Empty fruit bunch and fibre together would thus be produced at a rate of 55% on palm fruit.
Total annual production would thus be 44,000 t/a.
3.6 Groundnut
Groundnuts are produced all over the country, primarily for own consumption by small farmers.
FAOSTAT (2015) shows a total groundnut production of 46,000 t/a in 2013, up from a production
of around 20,000 t/a until the mid-2000s. According to CABIRA/BCP (2013), the main producing
regions are Gabu (31%), Cacheu (25%) and Oio (23%).
De Amarante (2015) indicated that there used to be factories for the processing of groundnut
(shelling, pressing) but this industry has declined. Some small quantities are exported to Senegal.
The main sources of biomass originating from groundnut production are straw and shells:
• Groundnut straw constitutes the combination of stalks and roots of the plant. Koopman
and Koppejan (1998) report an average total mass of 230% of the groundnuts in shell (at
15% moisture content) – 105,800 t/a in Guinea Bissau. Ash content is some 8% (feedipedia,
2015); NCV is approx. 15 MJ/kg (at 15% moisture content).
• Groundnut shell constitutes about half the mass of the nut in shell (48% according to
Koopman and Koppejan (1998), at a moisture content of 8%). Total annual production
would be 22,080 t/a. Average ash content is some 5%, and Net Calorific Value is approx. 16
MJ/kg at 8% moisture (Phyllis, 2015).
3.7 Forestry
Guinea Bissau has a modest forestry sector. According to FAOSTAT (2015), total industrial
roundwood production has been between approx. 132-140 thousand m3 per year in the period
2000-2013, with the volume of sawlogs varying between 1,910 and 10,537 m3/a. Data on
harvested volumes in the period 2007-2010, from the forestry department of Guinea Bissau
19
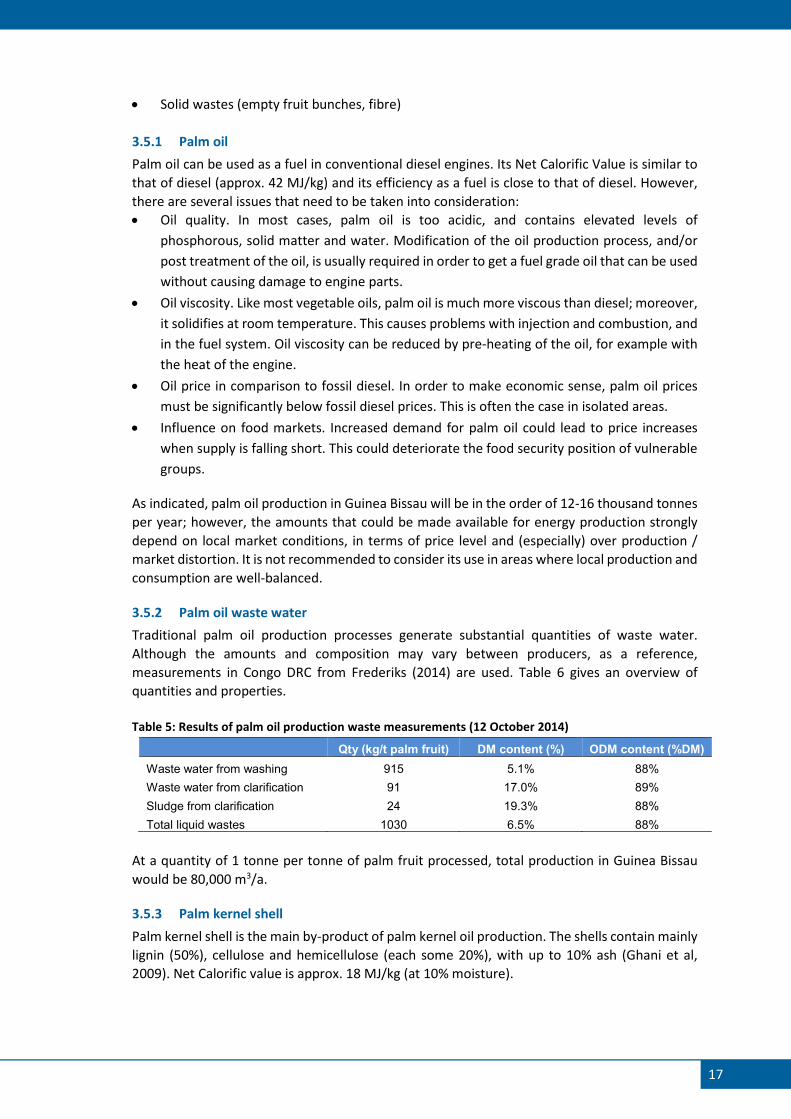
(Djata, 2015), differs considerably (see Table 6). On the basis of the latter, an annual total
production of 6,300 m3/a is assumed.
Figure 16: SGMT sawmill, Bissora Figure 17: SGMT sawmilling equipment
By law, it is not permitted to export sawlogs. However, according to Global Timber (2015),
Chinese import data show large imports of sawlogs from Guinea Bissau, peaking in 2014 (see
Table 6).
Table 6 Sawlog production in Guinea Bissau (m3/a)
2007 2008 2009 2010 2011 2012 2013 2014
Total sawlog production a 10,537 1,910 1,910 1,910 1,910 1,910 1,910
Sawlog production by local
companies b
3,250 1,751 6,019 5,139
Folbi 800 813 229
Setram 300 1,290 1,580
Benicio Silva 600 300
Oeste Africano 1,116 800
SGTM 2,100 350 380
Sano Maudo 1,150 51 2,150
SOCOTRAM 2,150
Sawlogs exported to China c 80 3,541 3,942 8,210 7,960 9,254 15,842 63,600
Sources: a FAOSTAT (2015) b Djata (2015) c Global Timber (2015)
Biomass production from the forestry industry comprises of logging residues and milling
residues:
• Logging residues concern mainly top, branches and foliage (an average 23% of the total
harvested above-ground tree – FAO, 1990), stumps (10%) and sawdust (5%).
• Sawmilling residues concern mainly slabs, edgings and off-cuts (17%), bark (5.5%) sawdust
(7.5%) and losses (4%). The remaining timber is 28% of the above-ground wood.
As sawlogs concern roundwood under bark (i.e. excluding the bark), each m3 of sawlog
represents 57% of the total harvested tree. At a production of 6,300 m3/a of sawlogs6, the
production of residues would be as follows:
• 2,565 m3/a (41%) of solid logging residues (tops, branches, foliage).
6 Illegal fellings are excluded, as it is unlikely that related logging residues could be made available for energy production
20
• 2,509 m3/a (40%) of solid sawmilling residue (slabs, edgings, off-cuts and bark).
• 836 m3/a (17%)of sawmilling sawdust.
During the field work, a brief visit was made to SGTM, one of the sawmills listed in Table 6. The
available staff indicated that logging residues are left in the forest, and are collected from there
by inhabitants of the area for fuelwood and charcoal production. The solid sawmilling residues
are used by the mill for the production of charcoal; at a charcoal value of approx. 50 FCFA/kg,
this places the price of solid wood at approx. 18 USD/t. The sawdust is not used – it is burnt in
the mill yard.
The net calorific value of wood fuels depends strongly on the moisture content. For fresh wood
this is typically some 40% (wet base), which results in a net calorific value of some 10 MJ/kg.
Average density of fresh wood is approx. 1.6 t/m3 (Global Timber, 2015).
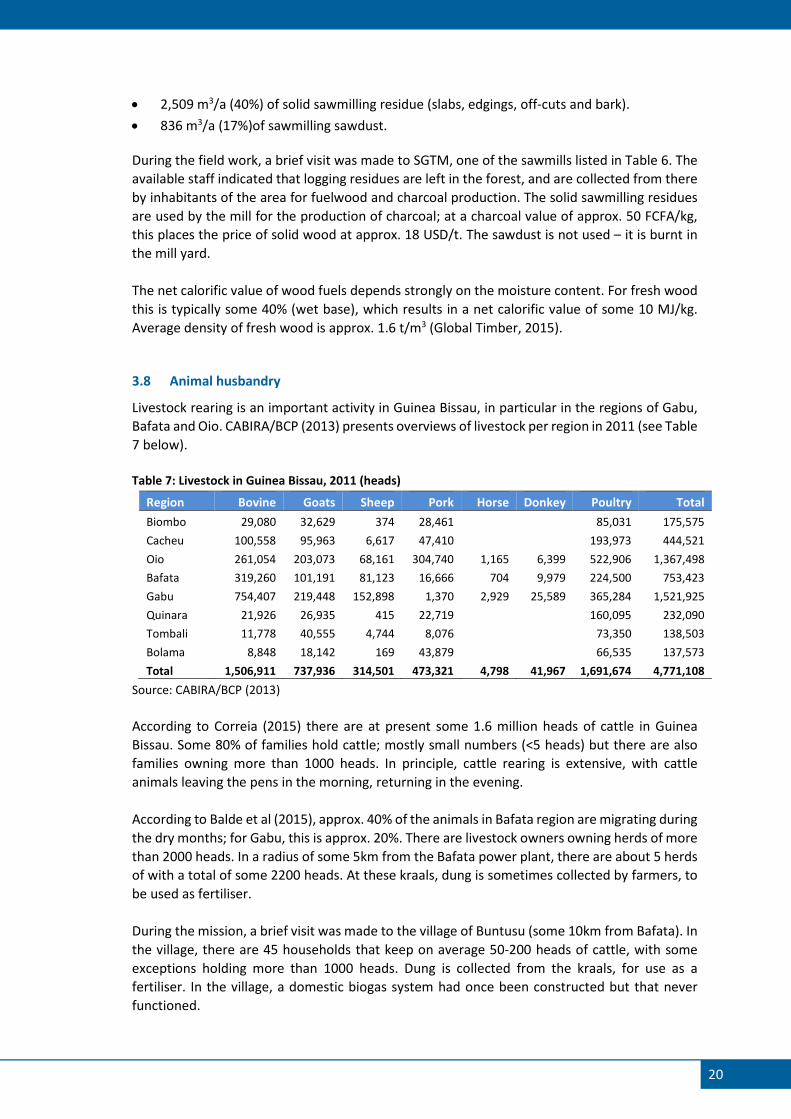
3.8 Animal husbandry
Livestock rearing is an important activity in Guinea Bissau, in particular in the regions of Gabu,
Bafata and Oio. CABIRA/BCP (2013) presents overviews of livestock per region in 2011 (see Table
7 below).
Table 7: Livestock in Guinea Bissau, 2011 (heads)
Region Bovine Goats Sheep Pork Horse Donkey Poultry Total
Biombo 29,080 32,629 374 28,461 85,031 175,575
Cacheu 100,558 95,963 6,617 47,410 193,973 444,521
Oio 261,054 203,073 68,161 304,740 1,165 6,399 522,906 1,367,498
Bafata 319,260 101,191 81,123 16,666 704 9,979 224,500 753,423
Gabu 754,407 219,448 152,898 1,370 2,929 25,589 365,284 1,521,925
Quinara 21,926 26,935 415 22,719 160,095 232,090
Tombali 11,778 40,555 4,744 8,076 73,350 138,503
Bolama 8,848 18,142 169 43,879 66,535 137,573
Total 1,506,911 737,936 314,501 473,321 4,798 41,967 1,691,674 4,771,108
Source: CABIRA/BCP (2013)
According to Correia (2015) there are at present some 1.6 million heads of cattle in Guinea
Bissau. Some 80% of families hold cattle; mostly small numbers (<5 heads) but there are also
families owning more than 1000 heads. In principle, cattle rearing is extensive, with cattle
animals leaving the pens in the morning, returning in the evening.
According to Balde et al (2015), approx. 40% of the animals in Bafata region are migrating during
the dry months; for Gabu, this is approx. 20%. There are livestock owners owning herds of more
than 2000 heads. In a radius of some 5km from the Bafata power plant, there are about 5 herds
of with a total of some 2200 heads. At these kraals, dung is sometimes collected by farmers, to
be used as fertiliser.
During the mission, a brief visit was made to the village of Buntusu (some 10km from Bafata). In
the village, there are 45 households that keep on average 50-200 heads of cattle, with some
exceptions holding more than 1000 heads. Dung is collected from the kraals, for use as a
fertiliser. In the village, a domestic biogas system had once been constructed but that never
functioned.

21
Pork, poultry, sheep and goats are typically kept in smaller numbers, by households. There are
some pork rearing farms, but these would be holding 10-20 heads. One larger farm in Nhacra
holds up to 200 heads (including piglets) but this is an exception.
3.8.1 Dung production
Focussing on cattle, dung production per animal may vary considerably, depending on type,
animal weight and diet. Typical fresh dung production from local breed cattle is in the order of
10-15 kg/head/day but recoverable fresh dung from cattle held in kraals overnight is a fraction
of this; e.g. Shrestha and Alenyorege (2008) indicate amounts in the order of 3 kg/head/day.
With these quantities, and 1.6 million heads of cattle of which 70% are non-migrating, total
available dung would be 1,176,000 t/a.
22
4 POTENTIAL FOR BIOMASS ELECTRICTY
4.1 Technical feasibility of biomass electricity supply options
4.1.1 Cashew shell combustion
Earlier projects on the production of electricity from cashew shell in Guinea Bissau were based
on combustion and steam cycle (steam turbine or steam engine). A comprehensive overview of
these projects can be found in chapter 5. The shell is combusted in a steam boiler, producing
saturated steam at medium pressure (10-20 bar) which is expanded to atmospheric pressure
through a turbine or steam engine. The steam is either condensed in a condenser or vented into
the air.
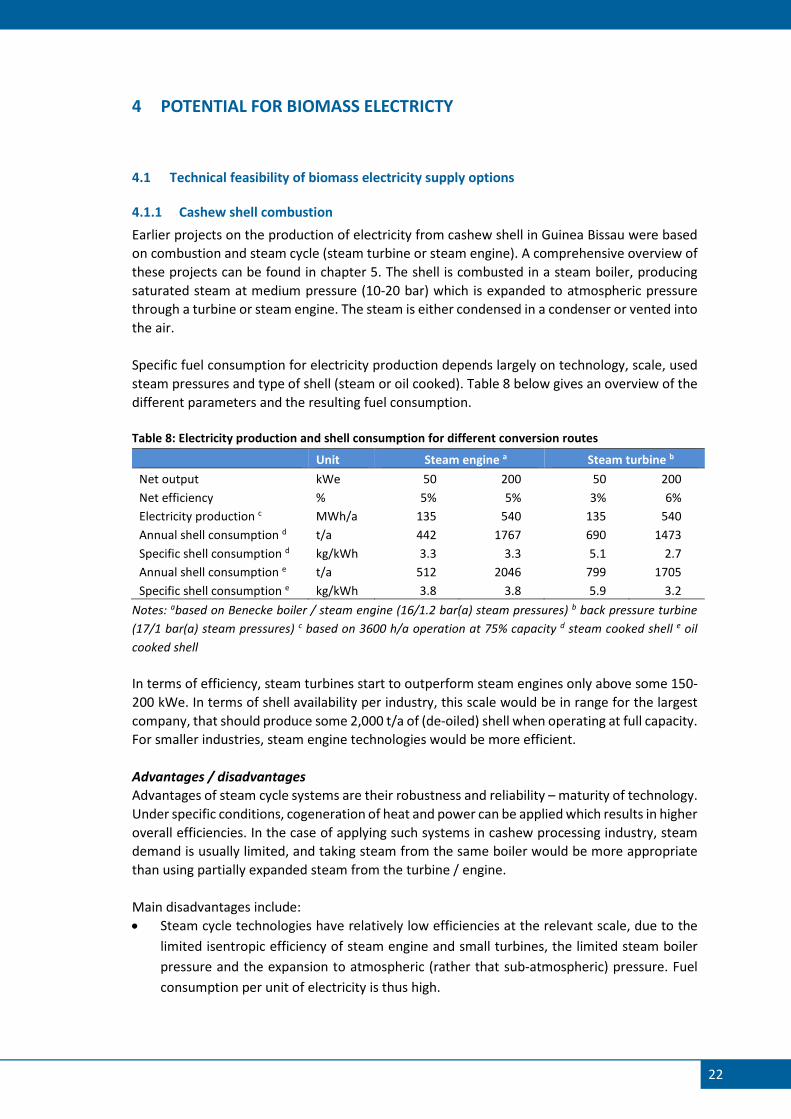
Specific fuel consumption for electricity production depends largely on technology, scale, used
steam pressures and type of shell (steam or oil cooked). Table 8 below gives an overview of the
different parameters and the resulting fuel consumption.
Table 8: Electricity production and shell consumption for different conversion routes
Unit Steam engine a Steam turbine b
Net output kWe 50 200 50 200
Net efficiency % 5% 5% 3% 6%
Electricity production c MWh/a 135 540 135 540
Annual shell consumption d t/a 442 1767 690 1473
Specific shell consumption d kg/kWh 3.3 3.3 5.1 2.7
Annual shell consumption e t/a 512 2046 799 1705
Specific shell consumption e kg/kWh 3.8 3.8 5.9 3.2
Notes: abased on Benecke boiler / steam engine (16/1.2 bar(a) steam pressures) b back pressure turbine
(17/1 bar(a) steam pressures) c based on 3600 h/a operation at 75% capacity d steam cooked shell e oil
cooked shell
In terms of efficiency, steam turbines start to outperform steam engines only above some 150-
200 kWe. In terms of shell availability per industry, this scale would be in range for the largest
company, that should produce some 2,000 t/a of (de-oiled) shell when operating at full capacity.
For smaller industries, steam engine technologies would be more efficient.
Advantages / disadvantages
Advantages of steam cycle systems are their robustness and reliability – maturity of technology.
Under specific conditions, cogeneration of heat and power can be applied which results in higher
overall efficiencies. In the case of applying such systems in cashew processing industry, steam
demand is usually limited, and taking steam from the same boiler would be more appropriate
than using partially expanded steam from the turbine / engine.
Main disadvantages include:
• Steam cycle technologies have relatively low efficiencies at the relevant scale, due to the
limited isentropic efficiency of steam engine and small turbines, the limited steam boiler
pressure and the expansion to atmospheric (rather that sub-atmospheric) pressure. Fuel
consumption per unit of electricity is thus high.
23
• The CNSL in that is still contained in the steam cooked cashew shell may cause problems in
conventional boiler systems. Inside the furnace, the liquid from the shells mixes with ash
and unburnt shell, causing grate blockages preventing combustion air to get in and ash to
get out.
• Steam cycle systems have relatively high investment costs at small scale. For steam engines
in the 50-200 kWe range this would be in the order of 3000-5000 EUR/kWe. Also, for smaller
systems, operational costs per unit of electricity can be considerable.
Potential
Looking at Brazilian steam engine technology, minimum scale is 20 kWe (gross) which would
consume some 170-200 t/a of cashew shell – depending on shell CNSL content. According to
information from ANCA (2015), 13 of the registered cashew processing companies in Guinea
Bissau could produce the required amounts. Steam engine systems in the range of 20-220 kWe
(gross) could be installed, with a total gross capacity of approx. 1.1 MWe. Total net production
(at 10% parasitic consumption) would be 2.7 GWhe/a.
However, based on an actual raw cashew nut processing of 6,000 t/a, total net electricity
production from cashew net shell would be 1.1 GWhe/a. Scaling down the production capacity
would result in 430 kWe.
Internal electricity consumption for cashew processing is unknown but is expected to be more
than 50% of the electricity generated. The amount of electricity that could be supplied to
communities would thus be limited.
4.1.2 Sugar cane bagasse and trash combustion
Sugar cane bagasse – and to a much lesser extent, sugar cane trash – is typically used for the
production of energy in large CHP units, producing electricity and process steam for sugar
industries. These are typically multi-MW systems featuring high pressure boilers and steam
turbines – either back pressure or extraction, allowing for the supply of low-pressure steam to
the sugar production process.
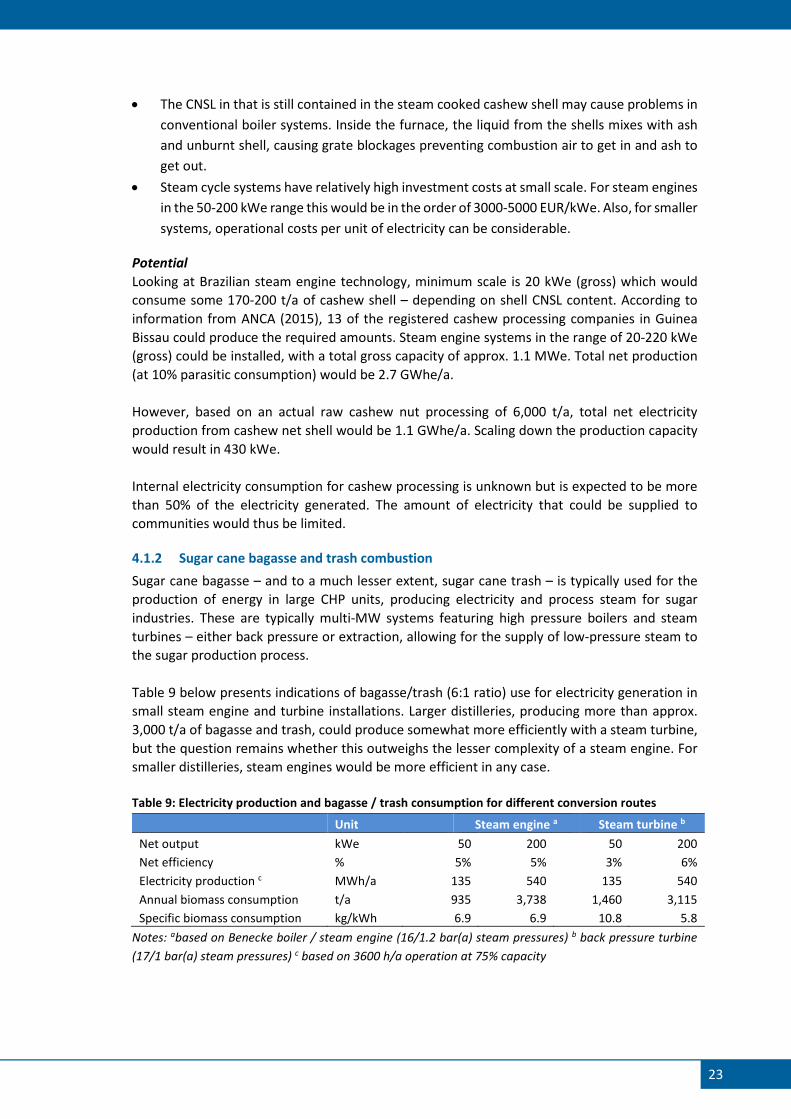
Table 9 below presents indications of bagasse/trash (6:1 ratio) use for electricity generation in
small steam engine and turbine installations. Larger distilleries, producing more than approx.
3,000 t/a of bagasse and trash, could produce somewhat more efficiently with a steam turbine,
but the question remains whether this outweighs the lesser complexity of a steam engine. For
smaller distilleries, steam engines would be more efficient in any case.
Table 9: Electricity production and bagasse / trash consumption for different conversion routes
Unit Steam engine a Steam turbine b
Net output kWe 50 200 50 200
Net efficiency % 5% 5% 3% 6%
Electricity production c MWh/a 135 540 135 540
Annual biomass consumption t/a 935 3,738 1,460 3,115
Specific biomass consumption kg/kWh 6.9 6.9 10.8 5.8
Notes: abased on Benecke boiler / steam engine (16/1.2 bar(a) steam pressures) b back pressure turbine
(17/1 bar(a) steam pressures) c based on 3600 h/a operation at 75% capacity
24
Advantages / disadvantages
Similar to the indications above, main advantages of steam cycle systems are their robustness
and reliability. Here also, process steam for the distillation process would be taken from the
boiler rather than the steam engine outlet.
Main disadvantage, apart from the low efficiency and the relatively high investment costs, are
the seasonal nature of cane production. Some distillery owners claim that cane is available
throughout the year, but others indicate that the season lasts for only 6-7 months maximum. If
a system is connected to an isolated grid, electricity production during periods of low (or no)
cane availability would require bagasse storage; technically possible but requiring large storage
volumes. Alternatively, in off-periods electricity would have to be produced using diesel
generators and/or for a reduced number of hours per day.
On a technical note, the ratio of trash to bagasse should be taken into consideration, in order to
limit possible problems with corrosion and ash slagging caused by trash combustion.
Potential
On the basis of the bagasse and trash production data presented in Table 4 (35,000 t/a), the
total net annual electricity production potential is 5.1 GWh/a. Over 3,600 h/a operation, at 75%
capacity, the installed production capacity would be some 1.9 MW in units of 50-200 kWe. At an
electricity consumption of 20 kWh/tonne of cane crushed, auto consumption would be approx.
1,000 MWh/a, i.e. 20% of the total electricity produced.
NB. A small quantity of thermal energy might be used for the distillation process; based on
indications of wood consumption, this is estimated at 2-3% of the available energy.
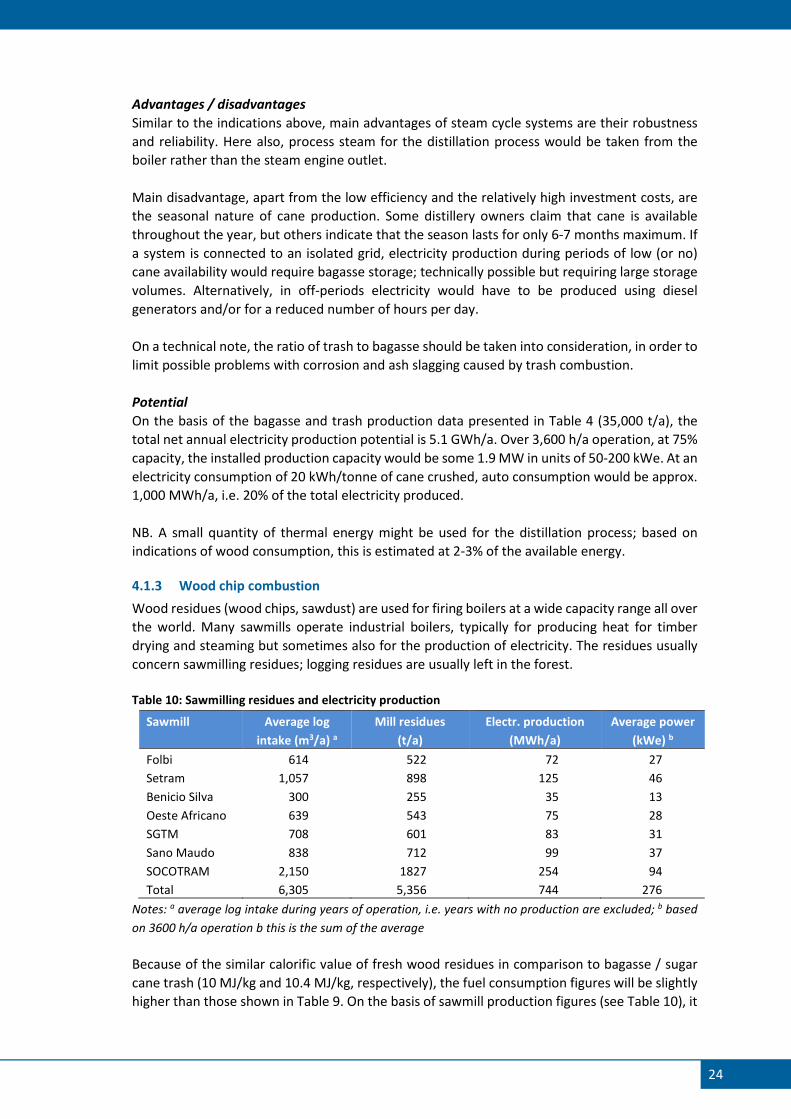
4.1.3 Wood chip combustion
Wood residues (wood chips, sawdust) are used for firing boilers at a wide capacity range all over
the world. Many sawmills operate industrial boilers, typically for producing heat for timber
drying and steaming but sometimes also for the production of electricity. The residues usually
concern sawmilling residues; logging residues are usually left in the forest.
Table 10: Sawmilling residues and electricity production
Sawmill Average log
intake (m3/a) a
Mill residues
(t/a)
Electr. production
(MWh/a)
Average power
(kWe) b
Folbi 614 522 72 27
Setram 1,057 898 125 46
Benicio Silva 300 255 35 13
Oeste Africano 639 543 75 28
SGTM 708 601 83 31
Sano Maudo 838 712 99 37
SOCOTRAM 2,150 1827 254 94
Total 6,305 5,356 744 276
Notes: a average log intake during years of operation, i.e. years with no production are excluded; b based
on 3600 h/a operation b this is the sum of the average
Because of the similar calorific value of fresh wood residues in comparison to bagasse / sugar
cane trash (10 MJ/kg and 10.4 MJ/kg, respectively), the fuel consumption figures will be slightly
higher than those shown in Table 9. On the basis of sawmill production figures (see Table 10), it
25
can be concluded that sawmill waste production of the largest mill would be sufficient to sustain
a 100 kWe unit; a steam engine would be more efficient choice.
Advantages / disadvantages
Similar to the indications above, main advantages of steam cycle systems are their robustness
and reliability.
Main disadvantages are (again) relatively low efficiency and the relatively high investment costs,
and the erratic production by the different sawmills as shown in Table 6. Furthermore, the
electricity demand at the sawmills (peak power and daily consumption) is unknown so it is
possible that the production potential does not match very well with the demand on-site.
Potential
On the basis of the figures shown in Table 10, annual electricity production potential from
sawmilling wastes would be 744 MWh/a. The electricity could be produced in units of 20-100
kWe, with a total installed of some 276 kWe. Auto consumption of the sawmills is unknown.
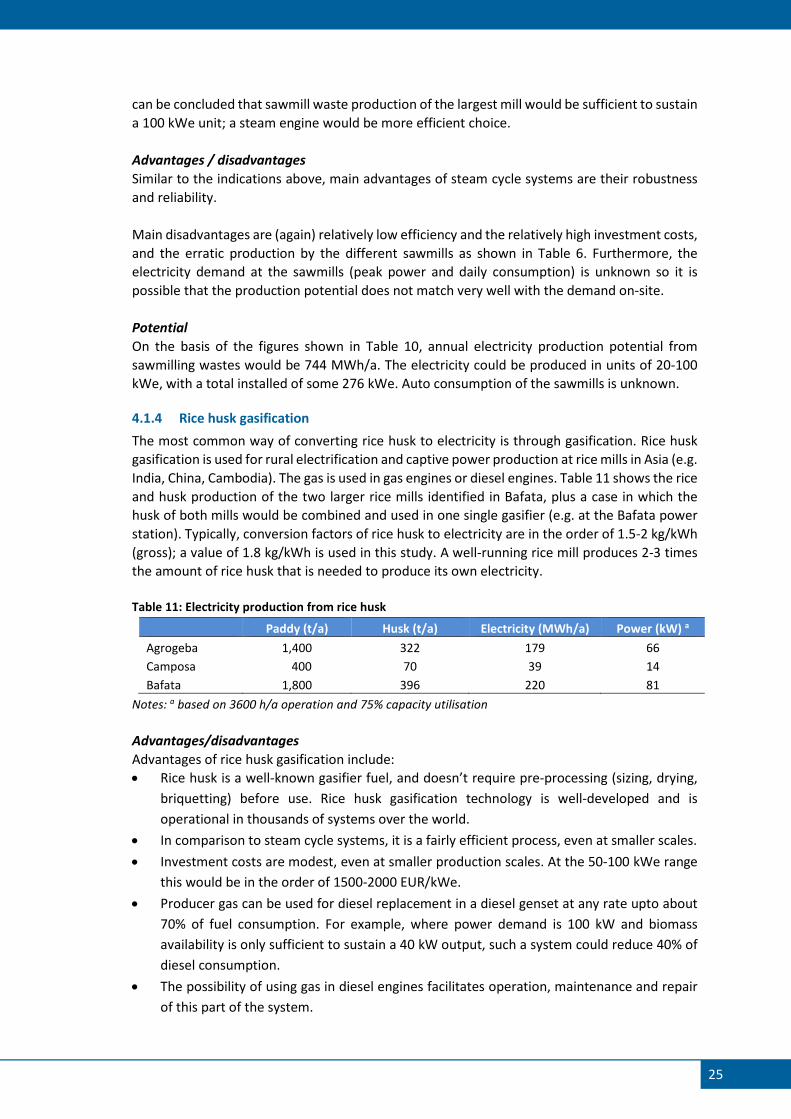
4.1.4 Rice husk gasification
The most common way of converting rice husk to electricity is through gasification. Rice husk
gasification is used for rural electrification and captive power production at rice mills in Asia (e.g.
India, China, Cambodia). The gas is used in gas engines or diesel engines. Table 11 shows the rice
and husk production of the two larger rice mills identified in Bafata, plus a case in which the
husk of both mills would be combined and used in one single gasifier (e.g. at the Bafata power
station). Typically, conversion factors of rice husk to electricity are in the order of 1.5-2 kg/kWh
(gross); a value of 1.8 kg/kWh is used in this study. A well-running rice mill produces 2-3 times
the amount of rice husk that is needed to produce its own electricity.
Table 11: Electricity production from rice husk
Paddy (t/a) Husk (t/a) Electricity (MWh/a) Power (kW) a
Agrogeba 1,400 322 179 66
Camposa 400 70 39 14
Bafata 1,800 396 220 81
Notes: a based on 3600 h/a operation and 75% capacity utilisation
Advantages/disadvantages
Advantages of rice husk gasification include:
• Rice husk is a well-known gasifier fuel, and doesn’t require pre-processing (sizing, drying,
briquetting) before use. Rice husk gasification technology is well-developed and is
operational in thousands of systems over the world.
• In comparison to steam cycle systems, it is a fairly efficient process, even at smaller scales.
• Investment costs are modest, even at smaller production scales. At the 50-100 kWe range
this would be in the order of 1500-2000 EUR/kWe.
• Producer gas can be used for diesel replacement in a diesel genset at any rate upto about
70% of fuel consumption. For example, where power demand is 100 kW and biomass
availability is only sufficient to sustain a 40 kW output, such a system could reduce 40% of
diesel consumption.
• The possibility of using gas in diesel engines facilitates operation, maintenance and repair
of this part of the system.
26
Disadvantages of rice husk gasification:
• Gasifiers are inherently little flexible with respect to biomass specification and load pattern
(loading rate; highly fluctuating loads). Gasification projects need to be well-defined and
the gasifier operating conditions need to be respected. Failure to do so easily leads to
failure of the project.
• Although operation and maintenance of gasification systems is not very complicated, the
resolution of gasifier problems often requires skilled and experienced staff which is not
widely available in most countries.
• Rice husk is a low density biomass. If it is not produced throughout the year, certain
quantities need to be stored which required a large storage volume.
• Using a diesel engine for electricity production (dual fuel mode) is far easier than using a
gas engine, but the amount of diesel fuel that is needed (typically 30-40%) adds to the
operational costs.
Potential
The practical potential is at present determined by the rice husk production at the Agrogeba and
Camposa mills. Electricity production would be some 220 MWh/a, with a production capacity of
81 kWe (based on 3500 h/a at 75% capacity utilisation). Mill own consumption will be 50% at
most.
The large rice production in Guinea Bissau results in large quantities of rice husk. At an annual
net production of 120,000 t/a (200,000 t/a gross), husk production would be 26,400 t/a with an
electricity production potential of 14.7 GWh/a. The extent to which this potential can be
exploited will mainly depend on the possibility of collecting the required amounts of rice husk.
Minimum scale installations (approx. 20 kWe) could be operated when some 100 t/a of rice husk
can be made available, more-or less year-round. In the absence of larger mills, (size Camposa,
see Table 11) this may be difficult to accomplish.
4.1.5 Cashew shell gasification
Cashew nut shell is in principle suitable for gasification, although actual experiences are in fact
limited. There are several scientific publications reporting on the experience with gasification of
cashew nut shell7, but this concerns roasted or oil cooked shell, i.e. containing little CNSL.
Because of the problems related to the CNSL during combustion, it is assumed that steam
cooked shells are not suitable for gasification. Furthermore, there is a gasifier running on shell
in Burkina Faso, but this is intended for the production of heat only (not electricity)8. Two
suppliers of gasification technology expressed their expectation that the shell should be suitable,
but this is based on the morphology of the fuel rather than actual experience.
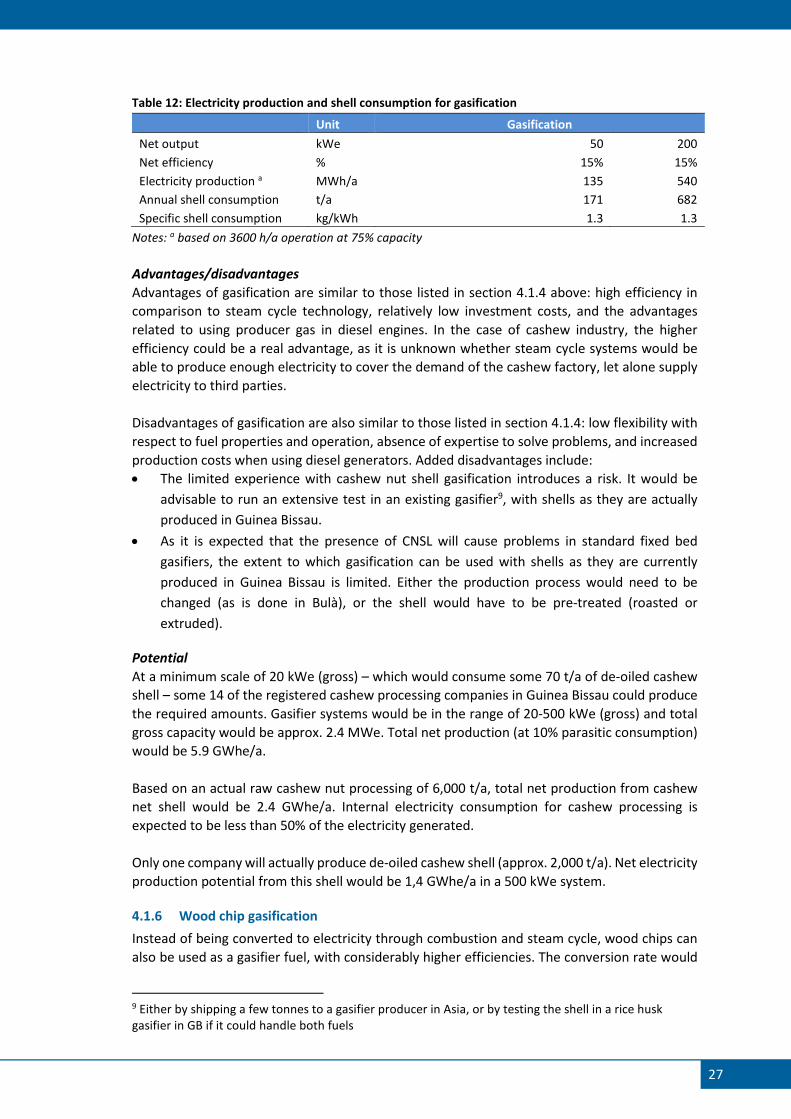
Table 12 below gives an overview of shell consumption for two scales of electricity production
using gasification. Fuel consumption is estimated at 1.3 kg of shell per kWh of electricity, which
is substantially below that of combustion and steam cycle (see Table 8).
7 e.g. Bhoi et al (2005); Singh et al (2005) 8 SNV (2014)
27
Table 12: Electricity production and shell consumption for gasification
Unit Gasification
Net output kWe 50 200
Net efficiency % 15% 15%
Electricity production a MWh/a 135 540
Annual shell consumption t/a 171 682
Specific shell consumption kg/kWh 1.3 1.3
Notes: a based on 3600 h/a operation at 75% capacity
Advantages/disadvantages
Advantages of gasification are similar to those listed in section 4.1.4 above: high efficiency in
comparison to steam cycle technology, relatively low investment costs, and the advantages
related to using producer gas in diesel engines. In the case of cashew industry, the higher
efficiency could be a real advantage, as it is unknown whether steam cycle systems would be
able to produce enough electricity to cover the demand of the cashew factory, let alone supply
electricity to third parties.
Disadvantages of gasification are also similar to those listed in section 4.1.4: low flexibility with
respect to fuel properties and operation, absence of expertise to solve problems, and increased
production costs when using diesel generators. Added disadvantages include:
• The limited experience with cashew nut shell gasification introduces a risk. It would be
advisable to run an extensive test in an existing gasifier9, with shells as they are actually
produced in Guinea Bissau.
• As it is expected that the presence of CNSL will cause problems in standard fixed bed
gasifiers, the extent to which gasification can be used with shells as they are currently
produced in Guinea Bissau is limited. Either the production process would need to be
changed (as is done in Bulà), or the shell would have to be pre-treated (roasted or
extruded).
Potential
At a minimum scale of 20 kWe (gross) – which would consume some 70 t/a of de-oiled cashew
shell – some 14 of the registered cashew processing companies in Guinea Bissau could produce
the required amounts. Gasifier systems would be in the range of 20-500 kWe (gross) and total
gross capacity would be approx. 2.4 MWe. Total net production (at 10% parasitic consumption)
would be 5.9 GWhe/a.
Based on an actual raw cashew nut processing of 6,000 t/a, total net production from cashew
net shell would be 2.4 GWhe/a. Internal electricity consumption for cashew processing is
expected to be less than 50% of the electricity generated.
Only one company will actually produce de-oiled cashew shell (approx. 2,000 t/a). Net electricity
production potential from this shell would be 1,4 GWhe/a in a 500 kWe system.
4.1.6 Wood chip gasification
Instead of being converted to electricity through combustion and steam cycle, wood chips can
also be used as a gasifier fuel, with considerably higher efficiencies. The conversion rate would
9 Either by shipping a few tonnes to a gasifier producer in Asia, or by testing the shell in a rice husk gasifier in GB if it could handle both fuels
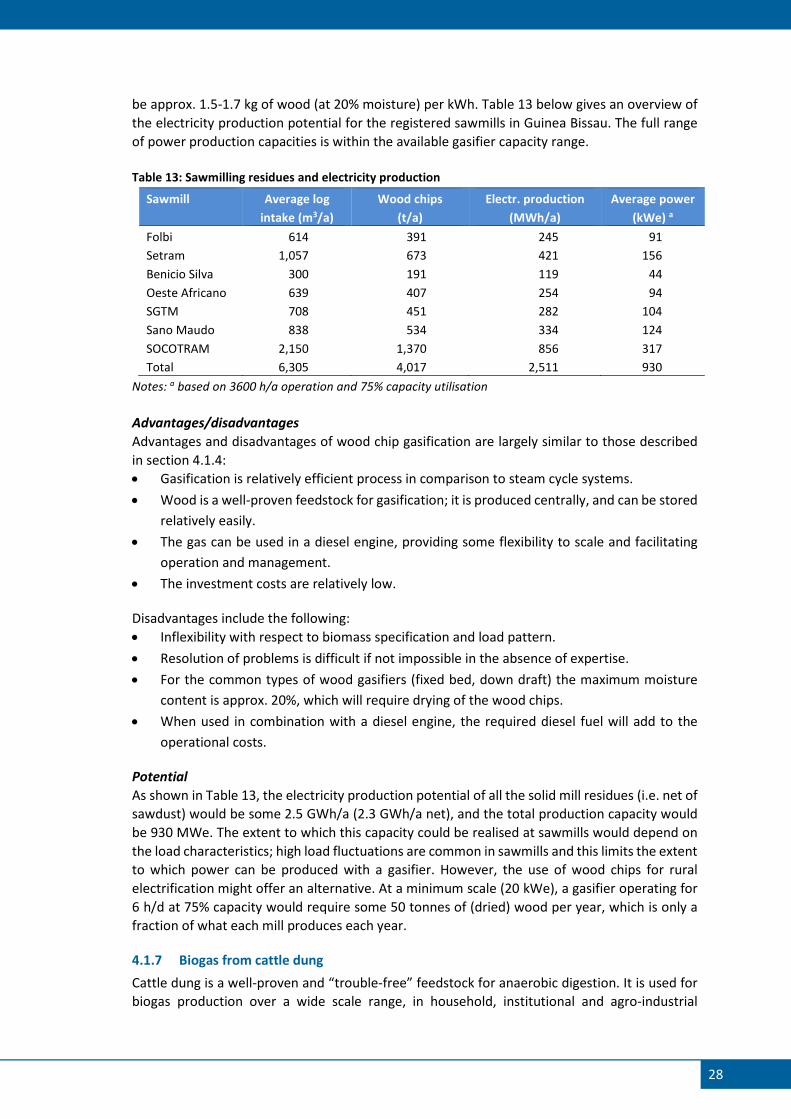
28
be approx. 1.5-1.7 kg of wood (at 20% moisture) per kWh. Table 13 below gives an overview of
the electricity production potential for the registered sawmills in Guinea Bissau. The full range
of power production capacities is within the available gasifier capacity range.
Table 13: Sawmilling residues and electricity production
Sawmill Average log
intake (m3/a)
Wood chips
(t/a)
Electr. production
(MWh/a)
Average power
(kWe) a
Folbi 614 391 245 91
Setram 1,057 673 421 156
Benicio Silva 300 191 119 44
Oeste Africano 639 407 254 94
SGTM 708 451 282 104
Sano Maudo 838 534 334 124
SOCOTRAM 2,150 1,370 856 317
Total 6,305 4,017 2,511 930
Notes: a based on 3600 h/a operation and 75% capacity utilisation
Advantages/disadvantages
Advantages and disadvantages of wood chip gasification are largely similar to those described
in section 4.1.4:
• Gasification is relatively efficient process in comparison to steam cycle systems.
• Wood is a well-proven feedstock for gasification; it is produced centrally, and can be stored
relatively easily.
• The gas can be used in a diesel engine, providing some flexibility to scale and facilitating
operation and management.
• The investment costs are relatively low.
Disadvantages include the following:
• Inflexibility with respect to biomass specification and load pattern.
• Resolution of problems is difficult if not impossible in the absence of expertise.
• For the common types of wood gasifiers (fixed bed, down draft) the maximum moisture
content is approx. 20%, which will require drying of the wood chips.
• When used in combination with a diesel engine, the required diesel fuel will add to the
operational costs.
Potential
As shown in Table 13, the electricity production potential of all the solid mill residues (i.e. net of
sawdust) would be some 2.5 GWh/a (2.3 GWh/a net), and the total production capacity would
be 930 MWe. The extent to which this capacity could be realised at sawmills would depend on
the load characteristics; high load fluctuations are common in sawmills and this limits the extent
to which power can be produced with a gasifier. However, the use of wood chips for rural
electrification might offer an alternative. At a minimum scale (20 kWe), a gasifier operating for
6 h/d at 75% capacity would require some 50 tonnes of (dried) wood per year, which is only a
fraction of what each mill produces each year.
4.1.7 Biogas from cattle dung
Cattle dung is a well-proven and “trouble-free” feedstock for anaerobic digestion. It is used for
biogas production over a wide scale range, in household, institutional and agro-industrial
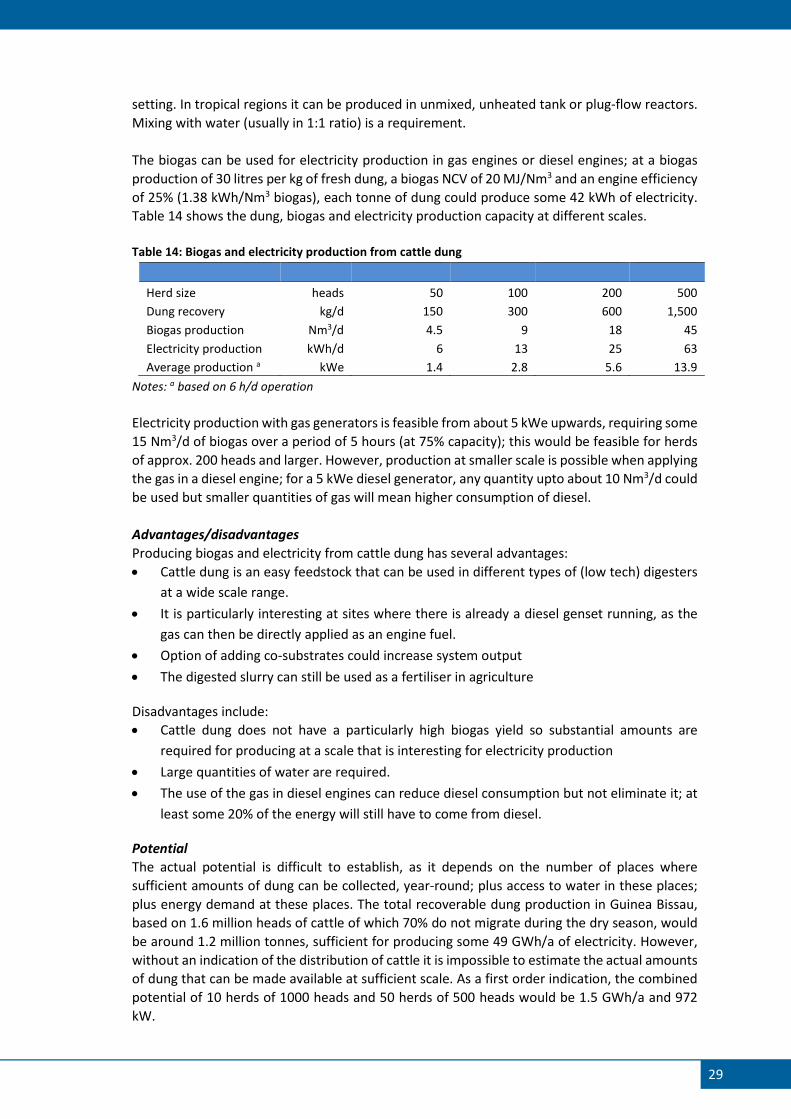
29
setting. In tropical regions it can be produced in unmixed, unheated tank or plug-flow reactors.
Mixing with water (usually in 1:1 ratio) is a requirement.
The biogas can be used for electricity production in gas engines or diesel engines; at a biogas
production of 30 litres per kg of fresh dung, a biogas NCV of 20 MJ/Nm3 and an engine efficiency
of 25% (1.38 kWh/Nm3 biogas), each tonne of dung could produce some 42 kWh of electricity.
Table 14 shows the dung, biogas and electricity production capacity at different scales.
Table 14: Biogas and electricity production from cattle dung
Herd size heads 50 100 200 500
Dung recovery kg/d 150 300 600 1,500
Biogas production Nm3/d 4.5 9 18 45
Electricity production kWh/d 6 13 25 63
Average production a kWe 1.4 2.8 5.6 13.9
Notes: a based on 6 h/d operation
Electricity production with gas generators is feasible from about 5 kWe upwards, requiring some
15 Nm3/d of biogas over a period of 5 hours (at 75% capacity); this would be feasible for herds
of approx. 200 heads and larger. However, production at smaller scale is possible when applying
the gas in a diesel engine; for a 5 kWe diesel generator, any quantity upto about 10 Nm3/d could
be used but smaller quantities of gas will mean higher consumption of diesel.
Advantages/disadvantages
Producing biogas and electricity from cattle dung has several advantages:
• Cattle dung is an easy feedstock that can be used in different types of (low tech) digesters
at a wide scale range.
• It is particularly interesting at sites where there is already a diesel genset running, as the
gas can then be directly applied as an engine fuel.
• Option of adding co-substrates could increase system output
• The digested slurry can still be used as a fertiliser in agriculture
Disadvantages include:
• Cattle dung does not have a particularly high biogas yield so substantial amounts are
required for producing at a scale that is interesting for electricity production
• Large quantities of water are required.
• The use of the gas in diesel engines can reduce diesel consumption but not eliminate it; at
least some 20% of the energy will still have to come from diesel.
Potential
The actual potential is difficult to establish, as it depends on the number of places where
sufficient amounts of dung can be collected, year-round; plus access to water in these places;
plus energy demand at these places. The total recoverable dung production in Guinea Bissau,
based on 1.6 million heads of cattle of which 70% do not migrate during the dry season, would
be around 1.2 million tonnes, sufficient for producing some 49 GWh/a of electricity. However,
without an indication of the distribution of cattle it is impossible to estimate the actual amounts
of dung that can be made available at sufficient scale. As a first order indication, the combined
potential of 10 herds of 1000 heads and 50 herds of 500 heads would be 1.5 GWh/a and 972
kW.
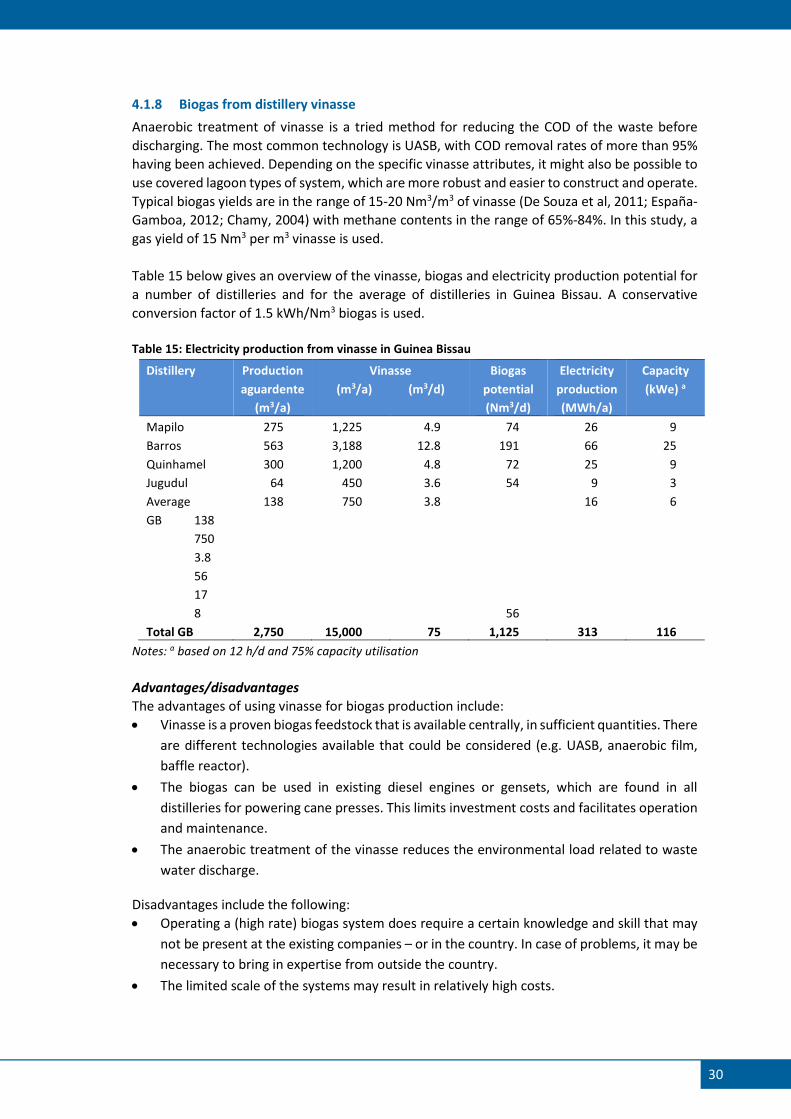
30
4.1.8 Biogas from distillery vinasse
Anaerobic treatment of vinasse is a tried method for reducing the COD of the waste before
discharging. The most common technology is UASB, with COD removal rates of more than 95%
having been achieved. Depending on the specific vinasse attributes, it might also be possible to
use covered lagoon types of system, which are more robust and easier to construct and operate.
Typical biogas yields are in the range of 15-20 Nm3/m3 of vinasse (De Souza et al, 2011; España-
Gamboa, 2012; Chamy, 2004) with methane contents in the range of 65%-84%. In this study, a
gas yield of 15 Nm3 per m3 vinasse is used.
Table 15 below gives an overview of the vinasse, biogas and electricity production potential for
a number of distilleries and for the average of distilleries in Guinea Bissau. A conservative
conversion factor of 1.5 kWh/Nm3 biogas is used.
Table 15: Electricity production from vinasse in Guinea Bissau
Distillery Production
aguardente
(m3/a)
Vinasse
(m3/a) (m3/d)
Biogas
potential
(Nm3/d)
Electricity
production
(MWh/a)
Capacity
(kWe) a
Mapilo 275 1,225 4.9 74 26 9
Barros 563 3,188 12.8 191 66 25
Quinhamel 300 1,200 4.8 72 25 9
Jugudul 64 450 3.6 54 9 3
Average
GB 138
750
3.8
56
17
8
138 750 3.8
56
16 6
Total GB 2,750 15,000 75 1,125 313 116
Notes: a based on 12 h/d and 75% capacity utilisation
Advantages/disadvantages
The advantages of using vinasse for biogas production include:
• Vinasse is a proven biogas feedstock that is available centrally, in sufficient quantities. There
are different technologies available that could be considered (e.g. UASB, anaerobic film,
baffle reactor).
• The biogas can be used in existing diesel engines or gensets, which are found in all
distilleries for powering cane presses. This limits investment costs and facilitates operation
and maintenance.
• The anaerobic treatment of the vinasse reduces the environmental load related to waste
water discharge.
Disadvantages include the following:
• Operating a (high rate) biogas system does require a certain knowledge and skill that may
not be present at the existing companies – or in the country. In case of problems, it may be
necessary to bring in expertise from outside the country.
• The limited scale of the systems may result in relatively high costs.
31
• The vinasse attributes will need to be confirmed, as they may differ considerably from
typical values found in distilleries elsewhere.
Potential
On the basis of estimates of the production of the distillery sector in Guineas Bissau, the total
annual biogas production is estimated at 225 thousand Nm3/a. Electricity production potential
would be 313 MWh/a; total installed capacity would be some 116 kWe.
On average, electricity production potential is estimated at 5-10 kWh per tonne of cane, while
electricity consumption of cane crushing is estimated at 20 kWh/tonne. The biogas could thus
cover some 25-50% of the diesel consumption of an average distillery.
4.1.9 Other
Cashew nut shell liquid
Although still in an experimental phase, both technical and natural CNSL can be used as a liquid
fuel in compression ignition (diesel) generators. Electricity production potential, on the basis of
6000 t/a of cashew nut production, would be some 2.7 GWh/a. There are several sources
reporting on experiments, typically in blends with diesel in order to reduce the viscosity.
However, most tests have been carried out in small (up to approx. 5kW) engines, and the results
are mixed10.
On the basis of these results, it is not recommended to start using CNSL in blends without further
research with representative material (i.e. CNSL from sources in Guinea Bissau). Also, the
economics of using the CNSL vis-à-vis its market value would need to be assessed.
Rice straw combustion
Electricity production with rice straw would be primarily through combustion and steam cycle
or ORC. In California, rice straw has been used to produce power through direct combustion
processes (Stahl & Ramadan, 2007). The most notable problems for using rice straw in
combustion processes are ash related, e.g. excessive slagging, formation of fine crystalline silica,
corrosion due to volatile Cl- and K- compounds. Enertime (2015) proposes the application of
ORC technology, requiring lower combustion temperatures and therefore reducing ash
problems.
Total rice straw production in Guinea Bissau would be in the order of 120,000 tonnes per year,
representing a potential for electricity production of some 48 GWh/a (at 12% net efficiency).
Appropriate scale for straw combustion would be 1 MWe upwards, requiring some 16,000 t/a
of rice straw when operated at 24 h/d at 90% capacity. At this scale, a total of some 7.4 MWe
(net) could be installed if all straw would be utilised.
Main barrier to the use of straw is its dispersed production and seasonal production, requiring
a complicated logistical system for the collection, transportation and storage of rice straw.
Added to this is the technical challenges related to straw combustion.
10 Radhakrrishnan et al (2014), Velmurugan and Loganathan (2011), Solanki & Bhatti (2012) and Rajeesh et al (2014) report reduced engine efficiency and increased emissions when blending technical CNSL with diesel. Only Palvannan (2012) found that efficiency and emissions with blends of natural CNSL upto 40% were similar to those when using 100% diesel
32
Palm kernel shell gasification
Palm kernel shell is a very suitable fuel for gasification; there are dozens of palm kernel shell
gasifiers in operation in Southeast Asia (Myanmar, Indonesia, Malaysia). Fuel consumption is
estimated at 1.3 kg/kWh. Total potential availability of kernel shell – if all palm nuts would be
cracked - is 30,000 t/a, representing an electricity production potential of 22.5 GWhe/a.
However, in reality only a small fraction of nuts will be cracked.
At a minimum scale of 20 kW, operating for 6 h/d at 75% capacity, the fuel requirements would
be some 42 t/a. Considering the small production scale of palm kernel oil, collection of such
quantities of shell would be practically impossible. Such a project would need to be combined
with a palm kernel oil production operation producing some 3.4 t/a of palm kernel oil from 56
t/a of palm kernels. The existence of such an operation is unknown and may have to be set up.
Groundnut shell gasification
Groundnut shell can be used for gasification – there is a 32 kWe unit operating in the village of
Kalom in Senegal, supplying electricity to 1200 inhabitants (NOVIS, 2015; Adigbli, 2012). The unit
(Indian technology) was commissioned in 2013, and operates at 15% of its capacity, consuming
some 3 tonnes per week of groundnut shell; this would be 3.7 kg/kWh of shell. At this rate, the
electricity production potential of all groundnut shells would be 6.2 GWh/a.
The concept might be interesting in areas with (exceptionally) high groundnut production. Even
in the three main groundnut producing regions, the average nut production per capita is around
50 kg/cap/a, which would result in an electricity production potential of some 6-7 kWh/cap/a,
which is only a fraction of what the expected electricity demand would be (approx. 25
kWh/cap/a).
Apart from the collection of sufficient biomass, the technical complexity of gasification would
make it less suitable for application in rural areas, without the availability of technical support
in the country.
Biogas from palm oil waste water
Although the specific attributes of palm oil waste water from artisanal production (e.g. C:N ratio,
pH, micro nutrients etc) are unknown, the waste water has been successfully used for the
production of biogas by SNV in Congo DRC11, in a fixed dome digester. Biogas production
estimates are 20 Nm3/t for washing water and 100 Nm3/t for clarification waste water and
sludge. The waste water from the production of one tonne of palm fruit could thus be used for
the production of 30 Nm3 of biogas. At a Net Calorific Value of 20 MJ/Nm3, and a genset
efficiency of 25%, the electricity production potential would be approx. 42 kWh per tonne of
palm fruit processed.
For the quantity of palm fruit processed in Guinea Bissau, this would result in an electricity
production potential of 3.3 GWh/a. The extent to which this potential could be utilised is
unknown but likely to be very small, as most palm fruit processing is done on a household scale,
on an irregular basis. It could be relevant for commercial palm oil producers, processing upwards
from a few hundred kg of palm fruit per day, but even then the gas might be most conveniently
used in the production process, for heating of palm oil or oil clarification.
Biogas from cashew apple
11 Similar to Palm Oil Mill Effluent of large palm oil mills, which is also suitable for anaerobic treatment
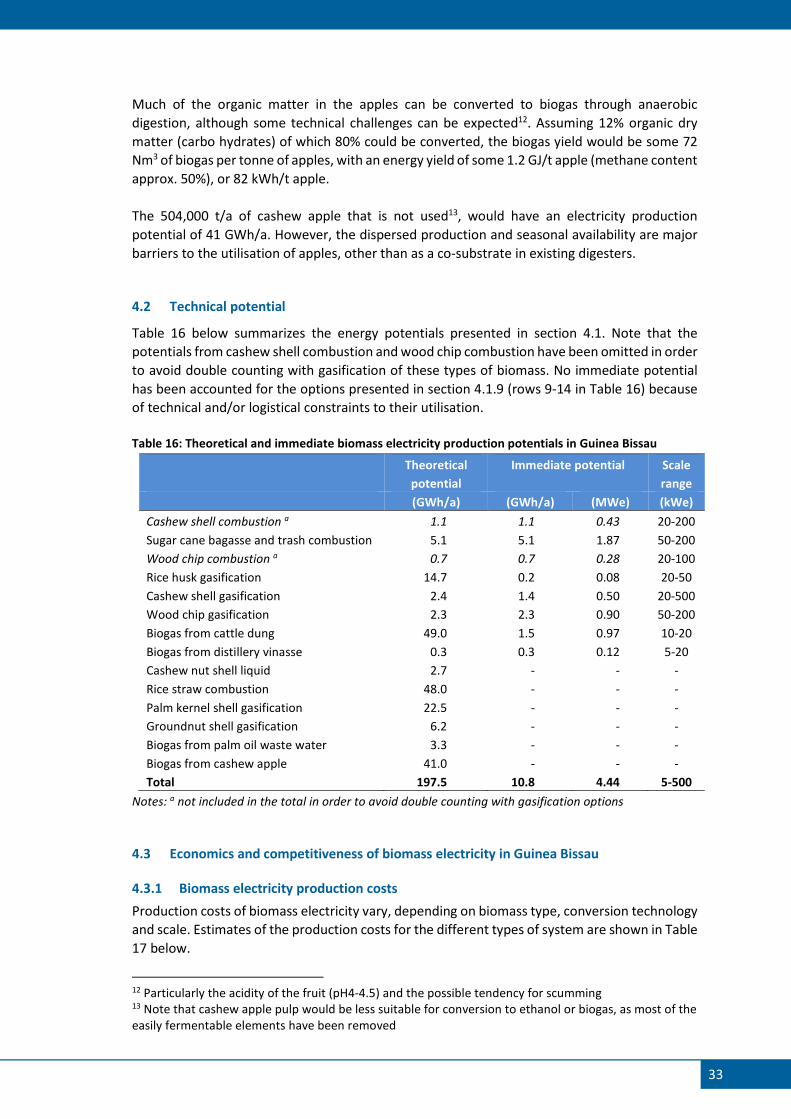
33
Much of the organic matter in the apples can be converted to biogas through anaerobic
digestion, although some technical challenges can be expected12. Assuming 12% organic dry
matter (carbo hydrates) of which 80% could be converted, the biogas yield would be some 72
Nm3 of biogas per tonne of apples, with an energy yield of some 1.2 GJ/t apple (methane content
approx. 50%), or 82 kWh/t apple.
The 504,000 t/a of cashew apple that is not used13, would have an electricity production
potential of 41 GWh/a. However, the dispersed production and seasonal availability are major
barriers to the utilisation of apples, other than as a co-substrate in existing digesters.
4.2 Technical potential
Table 16 below summarizes the energy potentials presented in section 4.1. Note that the
potentials from cashew shell combustion and wood chip combustion have been omitted in order
to avoid double counting with gasification of these types of biomass. No immediate potential
has been accounted for the options presented in section 4.1.9 (rows 9-14 in Table 16) because
of technical and/or logistical constraints to their utilisation.
Table 16: Theoretical and immediate biomass electricity production potentials in Guinea Bissau
Theoretical
potential
Immediate potential Scale
range
(GWh/a) (GWh/a) (MWe) (kWe)
Cashew shell combustion a 1.1 1.1 0.43 20-200
Sugar cane bagasse and trash combustion 5.1 5.1 1.87 50-200
Wood chip combustion a 0.7 0.7 0.28 20-100
Rice husk gasification 14.7 0.2 0.08 20-50
Cashew shell gasification 2.4 1.4 0.50 20-500
Wood chip gasification 2.3 2.3 0.90 50-200
Biogas from cattle dung 49.0 1.5 0.97 10-20
Biogas from distillery vinasse 0.3 0.3 0.12 5-20
Cashew nut shell liquid 2.7 - - -
Rice straw combustion 48.0 - - -
Palm kernel shell gasification 22.5 - - -
Groundnut shell gasification 6.2 - - -
Biogas from palm oil waste water 3.3 - - -
Biogas from cashew apple 41.0 - - -
Total 197.5 10.8 4.44 5-500
Notes: a not included in the total in order to avoid double counting with gasification options
4.3 Economics and competitiveness of biomass electricity in Guinea Bissau
4.3.1 Biomass electricity production costs
Production costs of biomass electricity vary, depending on biomass type, conversion technology
and scale. Estimates of the production costs for the different types of system are shown in Table
17 below.
12 Particularly the acidity of the fruit (pH4-4.5) and the possible tendency for scumming 13 Note that cashew apple pulp would be less suitable for conversion to ethanol or biogas, as most of the easily fermentable elements have been removed
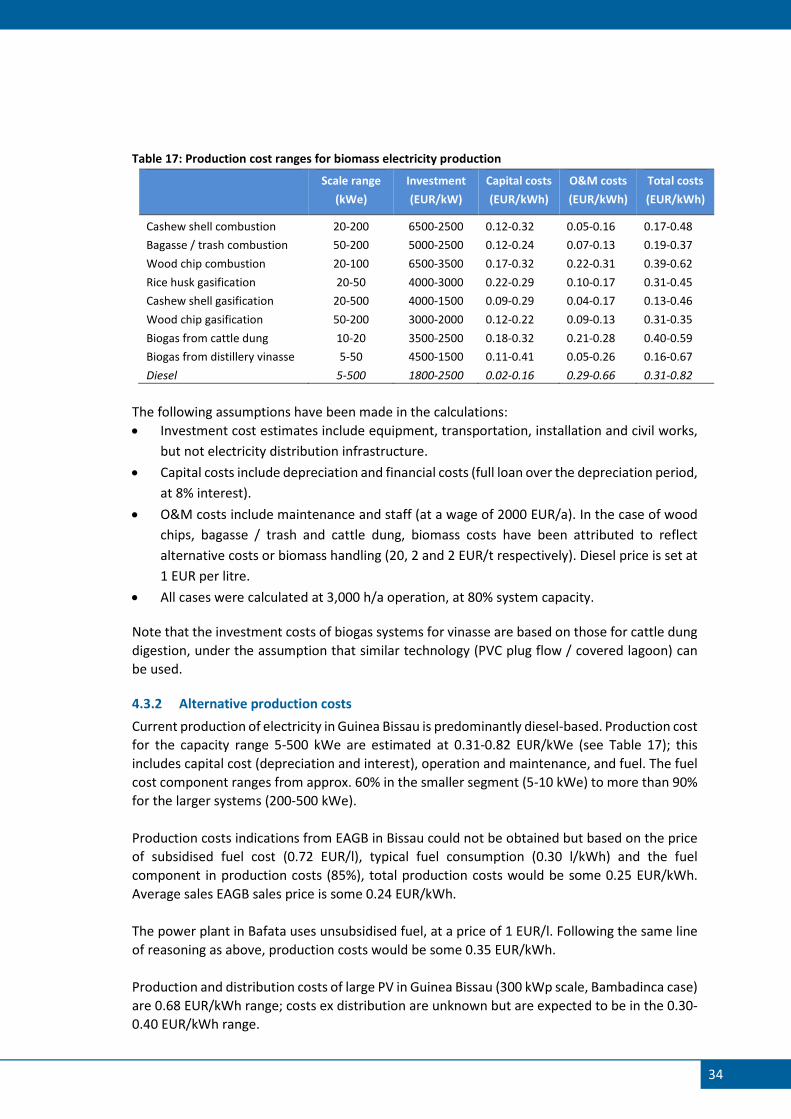
34
Table 17: Production cost ranges for biomass electricity production
Scale range
(kWe)
Investment
(EUR/kW)
Capital costs
(EUR/kWh)
O&M costs
(EUR/kWh)
Total costs
(EUR/kWh)
Cashew shell combustion 20-200 6500-2500 0.12-0.32 0.05-0.16 0.17-0.48
Bagasse / trash combustion 50-200 5000-2500 0.12-0.24 0.07-0.13 0.19-0.37
Wood chip combustion 20-100 6500-3500 0.17-0.32 0.22-0.31 0.39-0.62
Rice husk gasification 20-50 4000-3000 0.22-0.29 0.10-0.17 0.31-0.45
Cashew shell gasification 20-500 4000-1500 0.09-0.29 0.04-0.17 0.13-0.46
Wood chip gasification 50-200 3000-2000 0.12-0.22 0.09-0.13 0.31-0.35
Biogas from cattle dung 10-20 3500-2500 0.18-0.32 0.21-0.28 0.40-0.59
Biogas from distillery vinasse 5-50 4500-1500 0.11-0.41 0.05-0.26 0.16-0.67
Diesel 5-500 1800-2500 0.02-0.16 0.29-0.66 0.31-0.82
The following assumptions have been made in the calculations:
• Investment cost estimates include equipment, transportation, installation and civil works,
but not electricity distribution infrastructure.
• Capital costs include depreciation and financial costs (full loan over the depreciation period,
at 8% interest).
• O&M costs include maintenance and staff (at a wage of 2000 EUR/a). In the case of wood
chips, bagasse / trash and cattle dung, biomass costs have been attributed to reflect
alternative costs or biomass handling (20, 2 and 2 EUR/t respectively). Diesel price is set at
1 EUR per litre.
• All cases were calculated at 3,000 h/a operation, at 80% system capacity.
Note that the investment costs of biogas systems for vinasse are based on those for cattle dung
digestion, under the assumption that similar technology (PVC plug flow / covered lagoon) can
be used.
4.3.2 Alternative production costs
Current production of electricity in Guinea Bissau is predominantly diesel-based. Production cost
for the capacity range 5-500 kWe are estimated at 0.31-0.82 EUR/kWe (see Table 17); this
includes capital cost (depreciation and interest), operation and maintenance, and fuel. The fuel
cost component ranges from approx. 60% in the smaller segment (5-10 kWe) to more than 90%
for the larger systems (200-500 kWe).
Production costs indications from EAGB in Bissau could not be obtained but based on the price
of subsidised fuel cost (0.72 EUR/l), typical fuel consumption (0.30 l/kWh) and the fuel
component in production costs (85%), total production costs would be some 0.25 EUR/kWh.
Average sales EAGB sales price is some 0.24 EUR/kWh.
The power plant in Bafata uses unsubsidised fuel, at a price of 1 EUR/l. Following the same line
of reasoning as above, production costs would be some 0.35 EUR/kWh.
Production and distribution costs of large PV in Guinea Bissau (300 kWp scale, Bambadinca case)
are 0.68 EUR/kWh range; costs ex distribution are unknown but are expected to be in the 0.30-
0.40 EUR/kWh range.
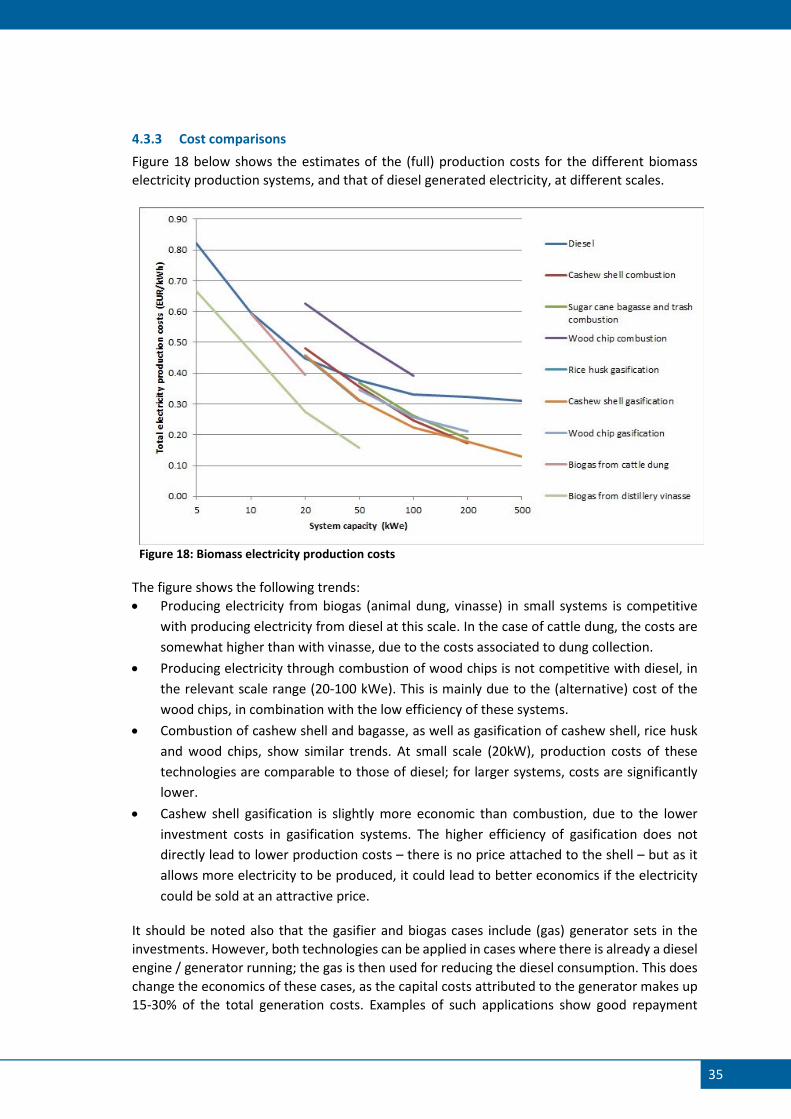
35
4.3.3 Cost comparisons
Figure 18 below shows the estimates of the (full) production costs for the different biomass
electricity production systems, and that of diesel generated electricity, at different scales.
Figure 18: Biomass electricity production costs
The figure shows the following trends:
• Producing electricity from biogas (animal dung, vinasse) in small systems is competitive
with producing electricity from diesel at this scale. In the case of cattle dung, the costs are
somewhat higher than with vinasse, due to the costs associated to dung collection.
• Producing electricity through combustion of wood chips is not competitive with diesel, in
the relevant scale range (20-100 kWe). This is mainly due to the (alternative) cost of the
wood chips, in combination with the low efficiency of these systems.
• Combustion of cashew shell and bagasse, as well as gasification of cashew shell, rice husk
and wood chips, show similar trends. At small scale (20kW), production costs of these
technologies are comparable to those of diesel; for larger systems, costs are significantly
lower.
• Cashew shell gasification is slightly more economic than combustion, due to the lower
investment costs in gasification systems. The higher efficiency of gasification does not
directly lead to lower production costs – there is no price attached to the shell – but as it
allows more electricity to be produced, it could lead to better economics if the electricity
could be sold at an attractive price.
It should be noted also that the gasifier and biogas cases include (gas) generator sets in the
investments. However, both technologies can be applied in cases where there is already a diesel
engine / generator running; the gas is then used for reducing the diesel consumption. This does
change the economics of these cases, as the capital costs attributed to the generator makes up
15-30% of the total generation costs. Examples of such applications show good repayment
36
periods, for example for rice husk gasification in the Cambodian rice industry (2-3 years) and
biogas in multifunctional platforms in Mali (3-5 years).
In addition, the financial costs for the biomass systems (interest on invested capital) are in the
order of 15-25% of the total production costs. If investment capital can be obtained against
“soft” conditions, this could reduce production costs and improve competitiveness.
4.4 Barriers for the introduction of biomass electricity technologies
Dispersed and small scale production of biomass resources
For those biomass resources with the highest theoretical potential for electricity production
(rice straw combustion, biogas from cattle dung and cashew apple, and gasification of palm
kernel shell and rice husk – see Table 16 above), the main barrier is the dispersed and small scale
of production of the biomass. This is directly related to the small size of production units (family
level) in the corresponding sectors. In the case of rice straw combustion, the required
production scale (MW-range) would lead to complicated and costly logistical systems.
Irregularity of biomass supply
Biomass electricity systems require a constant and reliable supply of biomass. Most types of
biomass that were identified as having immediate potential for energy production are produced
in agro or wood processing industries. However, in most of these sectors, production seems to
be irregular:
• The cashew processing sector is at present not working due high prices for raw cashew nuts
and lack of access to funds for purchasing nuts.
• Most companies in the distillery sector are at least partially dependent on supply of sugar
cane by third parties. During field work, processing interruptions due to lack of cane were
observed in several cases, despite indications of management that processing takes place
practically every day.
• Data on log processing by wood processing companies (see Table 6) shows that in some
years, sawmills may not be in operation.
Part of the problem is due to the bad shape of infrastructure (roads); for example for the
transportation of cane to the distilleries. Also, biomass supply problems can to some extent be
overcome by storage of biomass, or by (diesel) backup systems although these solutions add to
electricity generation costs.
Note that for systems producing electricity for the agro-industry itself, biomass supply
interruptions typically coincide with a shutdown of the industry itself. As there is then little or
no energy demand, the consequences of energy generation interruptions are limited. For
electricity generation projects that are dependent on biomass supply from third parties (e.g. the
biomass power plant in Safim, see section 5.1), the consequences of a shutdown due to supply
interruptions are more severe.
Limited access to technology and servicing
As in most countries in the region, access to technology other than “traditional” fossil fuel
generation equipment is difficult. All equipment must be imported on a project-by-project basis,
and installation must be carried out by foreign supplier staff. Examples in Guinea Bissau include
the Safim boiler / steam turbine plant (Indian supplier) and the steam engine plants of SICAJU
37
and LICAJU (Brazilian supplier), but also biogas plants have, in the past, been constructed by
foreign (Chinese) experts.
Related to the absence of suppliers is the absence of a technology servicing mechanism. At least
one plant (SICAJU) has fallen into disrepair, and the owner has not been able to find local
expertise that could solve the problem. Hiring the required foreign expertise is prohibitively
expensive. The plant has not operated since. A similar situation has occurred in the two biogas
plants that were encountered: both had operated for a short period of time, but were
abandoned after breaking down.
A closely related problem is the limited number of persons with relevant technical knowledge
and experience with biomass electricity production equipment, which is rather specialist.
Knowledge transfer in a project is usually limited to general operation and maintenance
instructions, which is typically insufficient for trouble shooting once there is a breakdown.
Deteriorated electricity transmission and distribution systems
In most places in the country, the infrastructure for the transmission and distribution of
electricity has deteriorated beyond repair. This means that any electricity production project
that would supply electricity to third parties would need to set up the infrastructural part as
well. This adds to the complexity and costs of such projects.
Low awareness
During the field mission, it was observed that the awareness of the existence of biomass
electricity production options was generally low. Management of rice mills and cashew
processing industries did not know gasification technology. Owners of distilleries were unaware
of the possibilities of producing biogas with their vinasse.
Related to low awareness is high perception of risks. In the absence of knowledge of the
technology, and of concrete project examples – or examples of failed projects – it is difficult for
potential users of technology to judge the risks related to an investment.
Limited project development skills
Project development requires specific (technical) skills. In at least one previous case it appears
that a biomass electricity project was not properly designed: the plant in Safim seems to have
been placed in the wrong area (no local biomass production, no electricity supply concession, in
a residential area) and use improper technology (low efficient steam turbine, improper
combustion system). In a second case (LICAJU), project implementation was stopped halfway,
before the hardware was installed. In a third case (SICAJU), there was no sufficient technical
capacity for resolving technical problems, nor provisions for arranging technical assistance to do
this.
High investment costs / difficult access to funding
As a rule, investments in bioenergy systems are relatively high; in any case a multiple of those
in fossil fuel based systems. The required funding often exceeds the investment capacity of
potential beneficiaries.
At the same time, banks are notoriously reluctant to provide funding to small entrepreneurs or
they charge high interest rates that cannot be borne by a project. This has been confirmed
during interviews as part of field work. The generally low knowledge of and experience of
38
financing institutions with bioenergy systems will add to the reluctance to provide loan capital,
and/or drive up interest rates in response to high risk perception.
Absence of effective institutional frameworks
The presence of conductive legal and regulatory frameworks is an important boundary condition
for the development of the bioenergy energy sector; its absence can be seen as an important
barrier. As bioenergy is multi-sectorial, its development is affected by regulatory frameworks in
the energy, agriculture, agro-industry and environmental sectors:
• A weak agricultural and agro-processing policy may affect the production in these sectors,
leading to low and/or fluctuating outputs. This directly affects resource availability and
energy demand. A recent example is the poor state of the cashew processing sector in
Guinea Bissau in mid-2015 which, according to sector stakeholders, was partially due to
the absence of conductive policy.
• An effective renewable energy policy (i.e. with supporting policy measures) provides
direct support to projects, e.g. in the form of project development support, investment
support, tax breaks, grid access etc.
• Environmental regulations on waste management could put a premium on the use of
organic wastes and waste waters for energy, by prohibiting uncontrolled disposal and
thus introducing an alternative disposal cost.
4.5 Potential national and regional support models
Project development support
In order to support potential project owners, and improve the quality of project development,
a project development support facility could be considered. Such a facility could offer a range of
services, including e.g.
• Support with project identification and pre-feasibility studies, e.g. by arranging remote
support to project owners in judging the basic potential of a project prior to further
development;
• Support with the execution of feasibility studies, potential studies etc, e.g. by identifying
experienced staff for carrying out such studies and/or covering (part of) the costs involved;
• Supporting project owners in dealing with government institutions, and assisting with the
identification of professional project developers, investors, funds etc.
Such project development support could be coordinated by a regional body, with support from
national institutions.
Supporting short and medium term project follow-up
Monitoring of the performance of projects over an extended period of time (e.g. 3 years) can
yield a host of information that can be used for developing similar projects in the country or the
region. Also, it can signal problems in an early stage, help with the resolution so that production
interruptions can be kept to a minimum. A support mechanism for resolving technical problems
could be considered, thus reducing the risk of system underperformance or cease of operation
(see below).
39
At the same time, dissemination of the results to a wider public can increase awareness and
confidence and thus lead to the development of / investment in new projects; or avoid the
development of unfeasible project concepts.
Technical facilities for monitoring the performance of systems (e.g. inputs, outputs, downtime,
operating and maintenance costs) should be made available to projects, and data should be
gathered, analysed and published on a regular (e.g. monthly) basis. In return for their
cooperation, project owners could be offered technical support in case of problems with their
installations. A regional body could be charged with ensuring such follow-up of projects.
Fair return on grid-supplied electricity
From exchanges with stakeholders (e.g. TESE (2015), Gomes y Amta (2015), EAGB (2015)) it
appears that electricity tariffs are not necessarily established in a rational way. Existing tariffs in
the national utility have not been updated for since the previous decade. Indications of average
electricity sales price in Bissau raise the question whether the used tariff systems allow recovery
of the costs (fuel, plant and infrastructure operation and maintenance, replacement of assets,
administration). Electricity suppliers are constantly pressured to reduce their tariffs, below cost
recovery levels, for political reasons.
In order to improve the conditions for renewable energy projects, fair and realistic rates should
be established (and maintained) for the electricity supplied. These rates should reflect on the
one hand the actual renewable energy production costs; and on the other hand the actual
energy production costs of alternative (fossil) energy sources rather than subsidised tariffs.
Political and institutional support should be provided in the process of setting such rates.
Access to investment capital
Knowledge of renewable energy systems in the country (and the region) is limited, and there
are few successful project examples in the region. At the same time, renewable energy systems
have higher investment costs than traditional fossil energy systems, and repayment periods may
be longer. This typically results in a high risk perception and low readiness to invest in projects
by equity investors, and to provide loan capital by banks.
In order to get projects financed, support in the form of (soft) loans and/or subsidies should be
considered. Both contribute to bridging financing gaps, and improve the attractiveness of
renewable energy projects for private sector investments. Investment subsidies could be
provided from a fund; loan capital could be provided through local banks, who then
simultaneously build up experience with renewable energy projects. This could be a bank with
existing links with the sector in which the projects are implemented (e.g. the cashew sector,
distilleries, forestry sector).
Risk reduction
As an alternative to subsidies, projects that are in principle technically and economically feasible
could be supported by providing guarantees during a limited period of time. This would reduce
the risks and thus increase the willingness of private sector to engage in RE projects. Such
guarantees could be provided on e.g.:
• Technology performance, e.g. through additional supplier warrantee or covering deficits
originating from low system performance (e.g. increased fuel costs or maintenance costs),
or supporting technical assistance required for resolving technical problems.
40
• Financial support in case payments for produced and delivered energy fall below the costs
incurred for operation and maintenance.
4.6 Sustainability aspects
With respect to sustainability, the following aspects can be considered.
On Social aspects, particularly projects that supply excess electricity to neighbouring
communities score highly. Access to modern energy sources is widely recognised as a key
condition for development; it improves living conditions in countless ways, and facilitates the
creation of income generating activities.
In terms of Economic sustainability, biomass energy projects add in several ways:
• With some exceptions, biomass energy typically makes use of wastes or unused residues.
It thus adds value to by-products from existing production systems and thus strengthens
these systems by adding potential sources of income.
• Particularly biogas projects are very suitable for recovering nutrients from waste streams,
and make them available for agriculture.
• Renewable energy projects add to the (regional and national) electricity generating
capacity, and thus add to the boundary conditions for economic development.
• Renewable energy projects reduce the dependence on (fossil) fuel imports.
Some drawbacks of biomass energy projects include the dependence on sufficient biomass
resources, which makes them vulnerable to the performance of the agricultural and agro-
industrial sectors where the biomass comes from; and the limited access to technology and
servicing as explained in section 4.4.
In terms of Environmental sustainability, biomass energy projects have no net greenhouse gas
emission. Moreover, in cases when organic wastes utilisation avoids methane emissions from
uncontrolled decomposition, greenhouse gas emission reduction potential may be a multiple of
the energy component alone. Some types of projects lead to strong local environmental
improvements, e.g. by preventing the environmental load of biomass waste dumping (e.g.
vinasse from distilleries).
Note that biomass energy projects may introduce their own environmental emissions if not
properly designed. These may include e.g. excessive smoke from improper biomass combustion
(ref Safim power plant, see section 5.1) or wastewater problems from biomass gasification
plants.
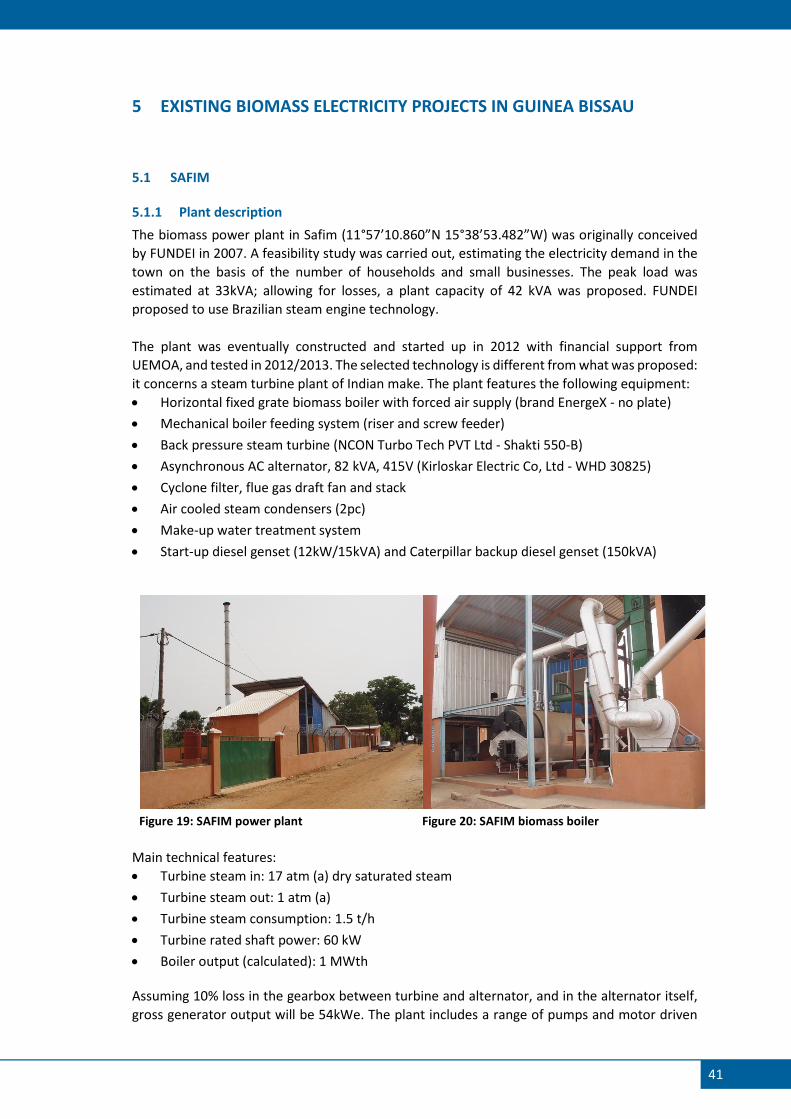
41
5 EXISTING BIOMASS ELECTRICITY PROJECTS IN GUINEA BISSAU
5.1 SAFIM
5.1.1 Plant description
The biomass power plant in Safim (11°57’10.860”N 15°38’53.482”W) was originally conceived
by FUNDEI in 2007. A feasibility study was carried out, estimating the electricity demand in the
town on the basis of the number of households and small businesses. The peak load was
estimated at 33kVA; allowing for losses, a plant capacity of 42 kVA was proposed. FUNDEI
proposed to use Brazilian steam engine technology.
The plant was eventually constructed and started up in 2012 with financial support from
UEMOA, and tested in 2012/2013. The selected technology is different from what was proposed:
it concerns a steam turbine plant of Indian make. The plant features the following equipment:
• Horizontal fixed grate biomass boiler with forced air supply (brand EnergeX - no plate)
• Mechanical boiler feeding system (riser and screw feeder)
• Back pressure steam turbine (NCON Turbo Tech PVT Ltd - Shakti 550-B)
• Asynchronous AC alternator, 82 kVA, 415V (Kirloskar Electric Co, Ltd - WHD 30825)
• Cyclone filter, flue gas draft fan and stack
• Air cooled steam condensers (2pc)
• Make-up water treatment system
• Start-up diesel genset (12kW/15kVA) and Caterpillar backup diesel genset (150kVA)
Figure 19: SAFIM power plant Figure 20: SAFIM biomass boiler
Main technical features:
• Turbine steam in: 17 atm (a) dry saturated steam
• Turbine steam out: 1 atm (a)
• Turbine steam consumption: 1.5 t/h
• Turbine rated shaft power: 60 kW
• Boiler output (calculated): 1 MWth
Assuming 10% loss in the gearbox between turbine and alternator, and in the alternator itself,
gross generator output will be 54kWe. The plant includes a range of pumps and motor driven
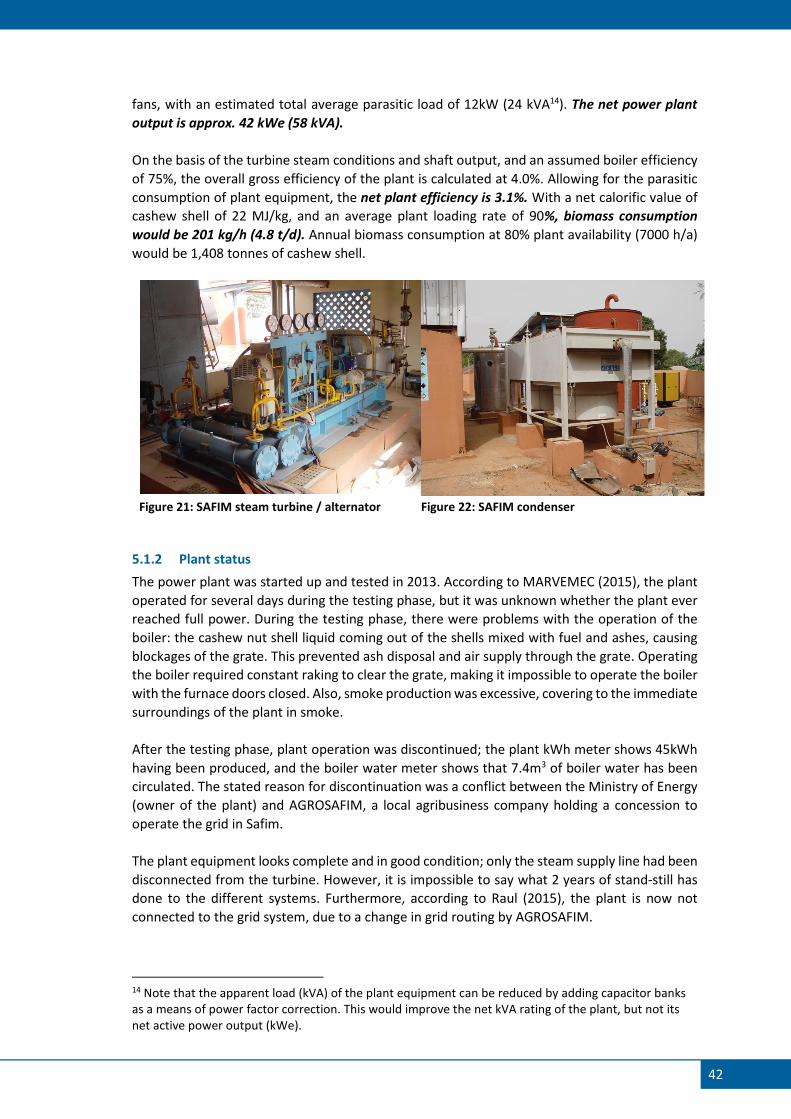
42
fans, with an estimated total average parasitic load of 12kW (24 kVA14). The net power plant
output is approx. 42 kWe (58 kVA).
On the basis of the turbine steam conditions and shaft output, and an assumed boiler efficiency
of 75%, the overall gross efficiency of the plant is calculated at 4.0%. Allowing for the parasitic
consumption of plant equipment, the net plant efficiency is 3.1%. With a net calorific value of
cashew shell of 22 MJ/kg, and an average plant loading rate of 90%, biomass consumption
would be 201 kg/h (4.8 t/d). Annual biomass consumption at 80% plant availability (7000 h/a)
would be 1,408 tonnes of cashew shell.
Figure 21: SAFIM steam turbine / alternator Figure 22: SAFIM condenser
5.1.2 Plant status
The power plant was started up and tested in 2013. According to MARVEMEC (2015), the plant
operated for several days during the testing phase, but it was unknown whether the plant ever
reached full power. During the testing phase, there were problems with the operation of the
boiler: the cashew nut shell liquid coming out of the shells mixed with fuel and ashes, causing
blockages of the grate. This prevented ash disposal and air supply through the grate. Operating
the boiler required constant raking to clear the grate, making it impossible to operate the boiler
with the furnace doors closed. Also, smoke production was excessive, covering to the immediate
surroundings of the plant in smoke.
After the testing phase, plant operation was discontinued; the plant kWh meter shows 45kWh
having been produced, and the boiler water meter shows that 7.4m3 of boiler water has been
circulated. The stated reason for discontinuation was a conflict between the Ministry of Energy
(owner of the plant) and AGROSAFIM, a local agribusiness company holding a concession to
operate the grid in Safim.
The plant equipment looks complete and in good condition; only the steam supply line had been
disconnected from the turbine. However, it is impossible to say what 2 years of stand-still has
done to the different systems. Furthermore, according to Raul (2015), the plant is now not
connected to the grid system, due to a change in grid routing by AGROSAFIM.
14 Note that the apparent load (kVA) of the plant equipment can be reduced by adding capacitor banks as a means of power factor correction. This would improve the net kVA rating of the plant, but not its net active power output (kWe).
43
5.1.3 Barriers to plant operation
1. Technical barriers
It seems that the main technical problem of the plant relates to the operation of the boiler on
cashew shell, as reported by MARVEMEC (2015). This could be a result of the furnace not being
suited for being fuelled with cashew shell – at least cashew shell still containing their liquid.
Apart from the excessive smoke production, it will most likely result in reduced boiler output –
and thus reduced plant electrical output – and reduced plant efficiency.
Alternatively, it is possible that the furnace was not operated correctly (e.g. at the right
temperature, fuel supply rate and/or air supply rate). As the plant was tested extensively by the
supplier, this seems less likely. At the same time, the kWh meter reading and the boiler water
meter reading do suggest that the plant was hardly or not operated at a high power output level.
Solutions for the problem may be sought in the following (combination of) directions:
• More extensive testing of the boiler / power plant, trying to find an appropriate operating
point where the shell liquid does not cause problems.
• Modification of the furnace. This will require a boiler expert to assess the current system
and propose a solution.
• Modification of the fuel properties. This could include using cashew shell from which the
liquid has been extracted (e.g. those from Bula), or different fuels altogether (e.g. sugar
cane bagasse). Note that in the latter case, fuel supply system and/or furnace adjustments
may be needed as well.
2. Organisational barriers
There are two main organisational barriers: 1. Grid access. AGROSAFIM holds the concession to supplying electricity in Safim, and they
will have to be party to any arrangement in which the power plant supplied power to the
community. So far they have been opposed to the plant, on the basis of its poor
performance (smoke production), and as time went by relations with the Ministry of Energy
and Industry have deteriorated. The company has indicated to be prepared, however, to
open discussions with all stakeholders.
2. Fuel supply. Continuous operation of the power plant requires continuous supply of fuel,
as there is little storage capacity at the plant. According to Raul (2015) there is no cashew
processing industry in Safim so shells will need to be brought in from Bissau (10km), Bula
(30km), Nhacra (20km) and Quinhamel (40km). Some of these industries will be using their
shells for their own energy production; others may be temporarily shut down for periods
of time. Collecting the required shells will be an effort, and supply interruptions are likely
to occur.
3. Financial barriers
Because of the small scale of the power plant, its operating costs are considerable. Firstly, steam
power systems (particularly steam turbines) are inefficient at a small scale, while parasitic
consumption is relatively high. This leads to high fuel consumption (some 6.5 kg of cashew shell
per kWh) and, in combination with the distance to the fuel producing industries, to high fuel
costs. Secondly, cost for operating (staff) and maintaining a plant are relatively high for a small
scale plant.
44
Total production costs for the biomass plant are estimated as follows:
• Plant production: 7000 hours per year at 90% capacity - 264,600 kWh/a. Biomass (cashew
nut shell) consumption: 1,408 t/a.
• Fuel costs (cashew shell) are estimated at some 12 EUR/t on the basis of transportation
costs over 25km (7 EUR/t) and a purchasing price of 5 EUR/t. This translated to 0.07
EUR/kWh.
• Staff cost are estimated at 0.20 EUR/kWh, based on 10 staff (3 shifts for 3 staff for fuel
logistics, boiler/ turbine operation, supervision; plus one administrator) at an average cost
of 15 EUR/person/day.
• Maintenance costs: 15,000 EUR/a (5% of equipment costs) or 0.06 EUR/kWh.
Total production costs (excluding amortization) are estimated at 0.32 EUR/kWh. If amortization
of the power plant were to be included, production costs would be approx. 0.43 EUR/kWh.
Exact sales price for electricity in Safim could not be established15, but alternative costs of
electricity production, using diesel generators, are estimated at 0.32 EUR/kWh including fuel,
O&M and amortization.
5.2 SICAJU (Bissau)
5.2.1 Plant description
The biomass power plant at the SICAJU cashew processing plant in Bissau (11°52'16.836"N
15°38'27.487"W) was constructed in 2007, under a World Bank credit scheme (PRDSP project).
The plant produced electricity and process steam for the cashew plant, using waste cashew
shells. The equipment functioned satisfactorily until 2009; the cashew processing plant was
closed temporarily, and when it was started up again, the boiler still worked but the steam
engine malfunctioned.
The system was manufactured by the company Benecke from Brazil. It features the following
equipment:
• Biomass boiler (Benecke, rated at 1.5 t/h at 12.4 kgf/cm2), manually feeding
• Steam engine (Benecke, type MVB-070) with AC alternator (WEG, no name plate)
• Flue gas draft fan and stack
• Water supply system
According to the manufacturer website, the power output of this plant type is rated at 70 kWe
/ 85 kVA but the rated boiler steam pressure is below the typical steam pressure of 16 kgf/cm2
(a) which will result in a lower plant capacity. Steam consumption would be approx. 1.1 t/h.
15 Clients pay flat rates. One industrial client pays approx 1,800 EUR per month for a 3-phase 40A connection (27kVA) which is up 18 h/d.
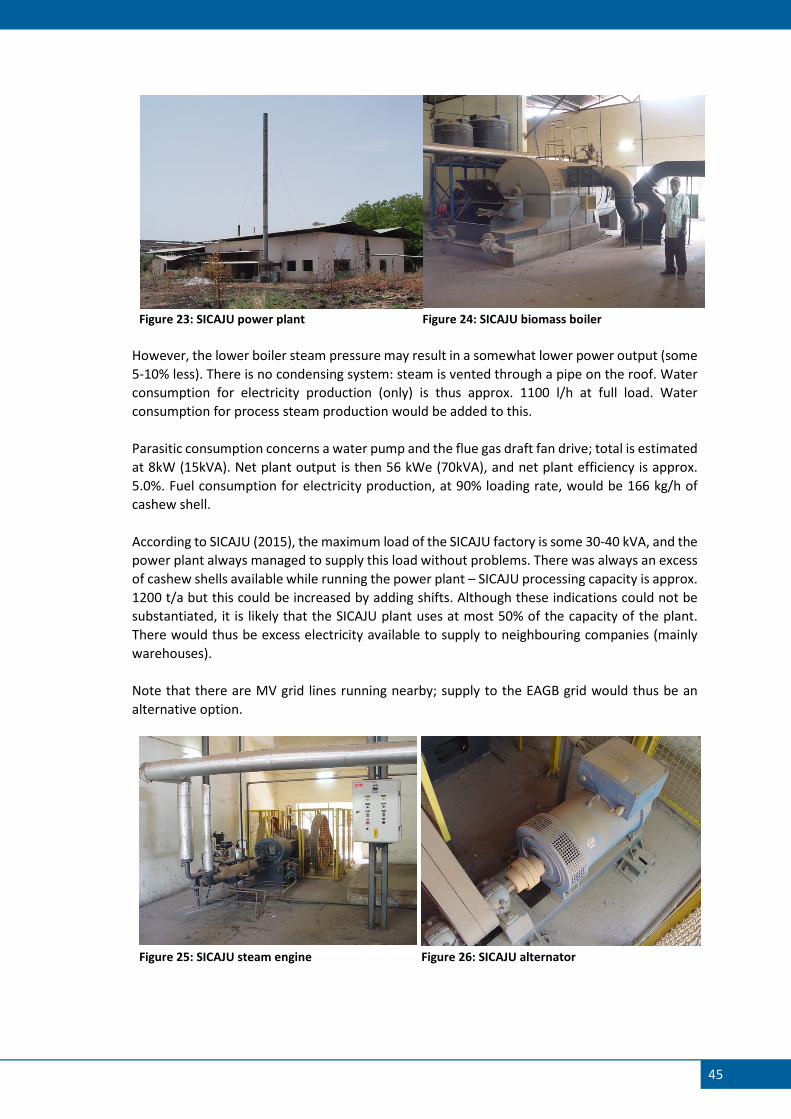
45
Figure 23: SICAJU power plant Figure 24: SICAJU biomass boiler
However, the lower boiler steam pressure may result in a somewhat lower power output (some
5-10% less). There is no condensing system: steam is vented through a pipe on the roof. Water
consumption for electricity production (only) is thus approx. 1100 l/h at full load. Water
consumption for process steam production would be added to this.
Parasitic consumption concerns a water pump and the flue gas draft fan drive; total is estimated
at 8kW (15kVA). Net plant output is then 56 kWe (70kVA), and net plant efficiency is approx.
5.0%. Fuel consumption for electricity production, at 90% loading rate, would be 166 kg/h of
cashew shell.
According to SICAJU (2015), the maximum load of the SICAJU factory is some 30-40 kVA, and the
power plant always managed to supply this load without problems. There was always an excess
of cashew shells available while running the power plant – SICAJU processing capacity is approx.
1200 t/a but this could be increased by adding shifts. Although these indications could not be
substantiated, it is likely that the SICAJU plant uses at most 50% of the capacity of the plant.
There would thus be excess electricity available to supply to neighbouring companies (mainly
warehouses).
Note that there are MV grid lines running nearby; supply to the EAGB grid would thus be an
alternative option.
Figure 25: SICAJU steam engine Figure 26: SICAJU alternator
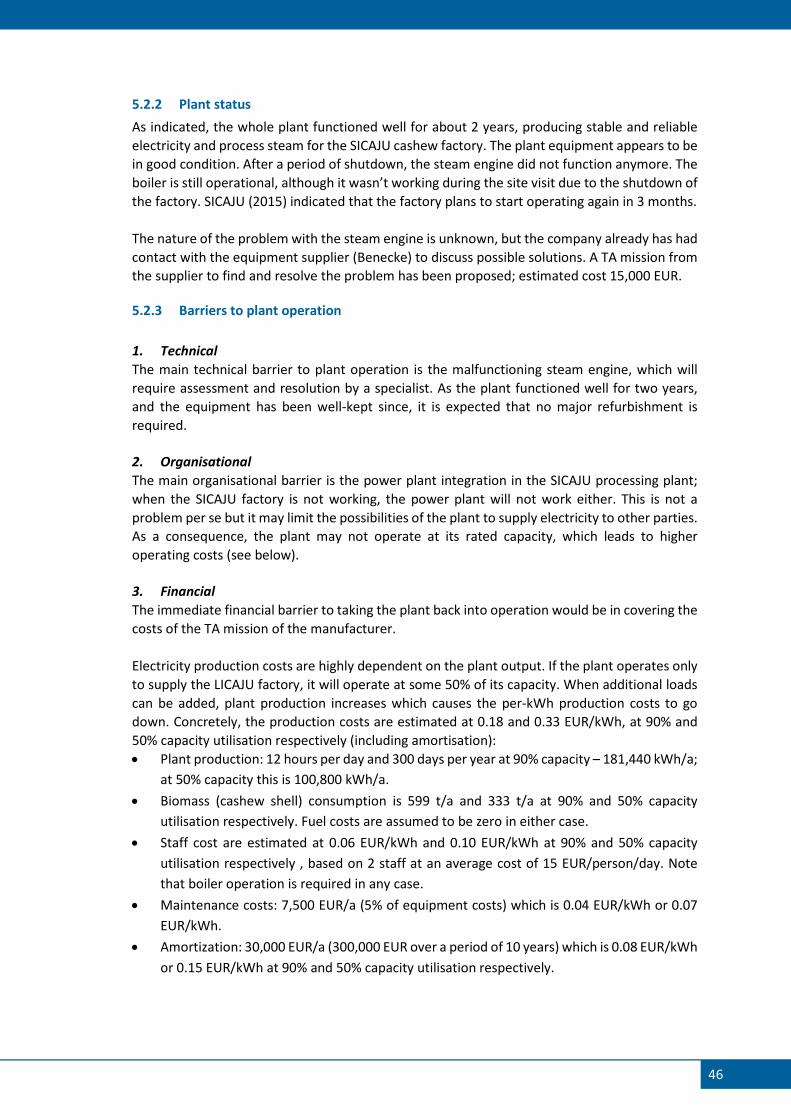
46
5.2.2 Plant status
As indicated, the whole plant functioned well for about 2 years, producing stable and reliable
electricity and process steam for the SICAJU cashew factory. The plant equipment appears to be
in good condition. After a period of shutdown, the steam engine did not function anymore. The
boiler is still operational, although it wasn’t working during the site visit due to the shutdown of
the factory. SICAJU (2015) indicated that the factory plans to start operating again in 3 months.
The nature of the problem with the steam engine is unknown, but the company already has had
contact with the equipment supplier (Benecke) to discuss possible solutions. A TA mission from
the supplier to find and resolve the problem has been proposed; estimated cost 15,000 EUR.
5.2.3 Barriers to plant operation
1. Technical
The main technical barrier to plant operation is the malfunctioning steam engine, which will
require assessment and resolution by a specialist. As the plant functioned well for two years,
and the equipment has been well-kept since, it is expected that no major refurbishment is
required.
2. Organisational
The main organisational barrier is the power plant integration in the SICAJU processing plant;
when the SICAJU factory is not working, the power plant will not work either. This is not a
problem per se but it may limit the possibilities of the plant to supply electricity to other parties.
As a consequence, the plant may not operate at its rated capacity, which leads to higher
operating costs (see below).
3. Financial
The immediate financial barrier to taking the plant back into operation would be in covering the
costs of the TA mission of the manufacturer.
Electricity production costs are highly dependent on the plant output. If the plant operates only
to supply the LICAJU factory, it will operate at some 50% of its capacity. When additional loads
can be added, plant production increases which causes the per-kWh production costs to go
down. Concretely, the production costs are estimated at 0.18 and 0.33 EUR/kWh, at 90% and
50% capacity utilisation respectively (including amortisation):
• Plant production: 12 hours per day and 300 days per year at 90% capacity – 181,440 kWh/a;
at 50% capacity this is 100,800 kWh/a.
• Biomass (cashew shell) consumption is 599 t/a and 333 t/a at 90% and 50% capacity
utilisation respectively. Fuel costs are assumed to be zero in either case.
• Staff cost are estimated at 0.06 EUR/kWh and 0.10 EUR/kWh at 90% and 50% capacity
utilisation respectively , based on 2 staff at an average cost of 15 EUR/person/day. Note
that boiler operation is required in any case.
• Maintenance costs: 7,500 EUR/a (5% of equipment costs) which is 0.04 EUR/kWh or 0.07
EUR/kWh.
• Amortization: 30,000 EUR/a (300,000 EUR over a period of 10 years) which is 0.08 EUR/kWh
or 0.15 EUR/kWh at 90% and 50% capacity utilisation respectively.
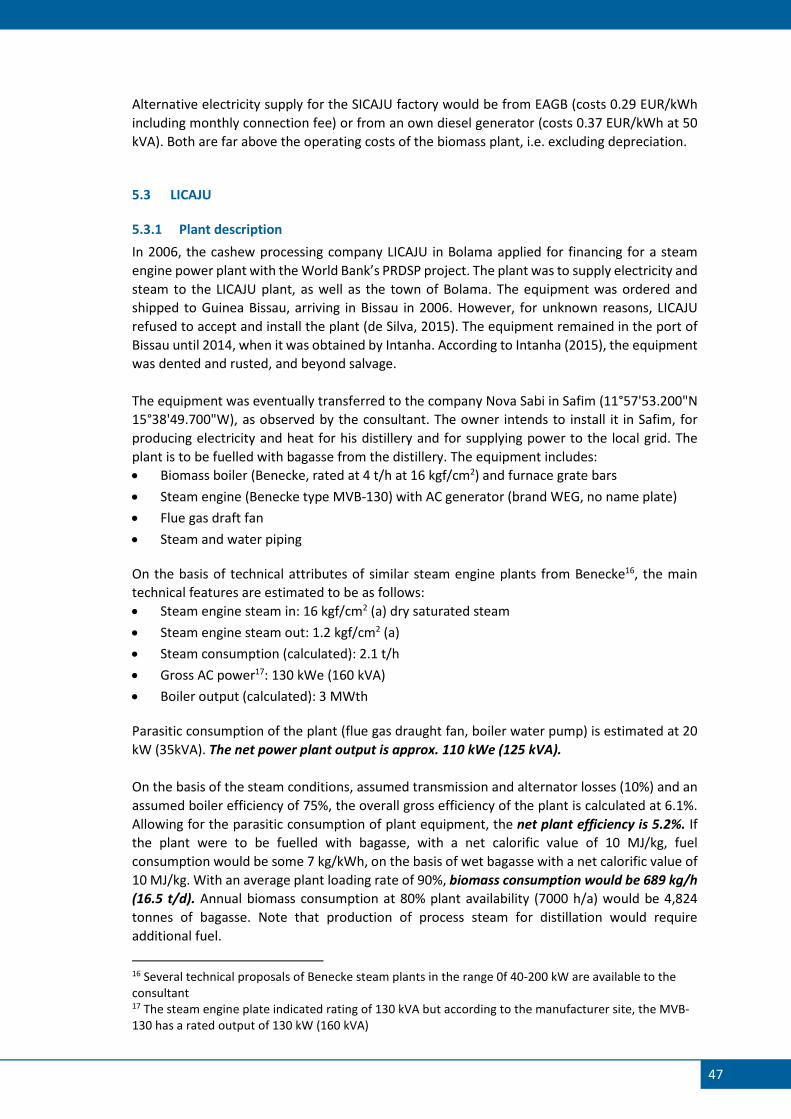
47
Alternative electricity supply for the SICAJU factory would be from EAGB (costs 0.29 EUR/kWh
including monthly connection fee) or from an own diesel generator (costs 0.37 EUR/kWh at 50
kVA). Both are far above the operating costs of the biomass plant, i.e. excluding depreciation.
5.3 LICAJU
5.3.1 Plant description
In 2006, the cashew processing company LICAJU in Bolama applied for financing for a steam
engine power plant with the World Bank’s PRDSP project. The plant was to supply electricity and
steam to the LICAJU plant, as well as the town of Bolama. The equipment was ordered and
shipped to Guinea Bissau, arriving in Bissau in 2006. However, for unknown reasons, LICAJU
refused to accept and install the plant (de Silva, 2015). The equipment remained in the port of
Bissau until 2014, when it was obtained by Intanha. According to Intanha (2015), the equipment
was dented and rusted, and beyond salvage.
The equipment was eventually transferred to the company Nova Sabi in Safim (11°57'53.200"N
15°38'49.700"W), as observed by the consultant. The owner intends to install it in Safim, for
producing electricity and heat for his distillery and for supplying power to the local grid. The
plant is to be fuelled with bagasse from the distillery. The equipment includes:
• Biomass boiler (Benecke, rated at 4 t/h at 16 kgf/cm2) and furnace grate bars
• Steam engine (Benecke type MVB-130) with AC generator (brand WEG, no name plate)
• Flue gas draft fan
• Steam and water piping
On the basis of technical attributes of similar steam engine plants from Benecke16, the main
technical features are estimated to be as follows:
• Steam engine steam in: 16 kgf/cm2 (a) dry saturated steam
• Steam engine steam out: 1.2 kgf/cm2 (a)
• Steam consumption (calculated): 2.1 t/h
• Gross AC power17: 130 kWe (160 kVA)
• Boiler output (calculated): 3 MWth
Parasitic consumption of the plant (flue gas draught fan, boiler water pump) is estimated at 20
kW (35kVA). The net power plant output is approx. 110 kWe (125 kVA).
On the basis of the steam conditions, assumed transmission and alternator losses (10%) and an
assumed boiler efficiency of 75%, the overall gross efficiency of the plant is calculated at 6.1%.
Allowing for the parasitic consumption of plant equipment, the net plant efficiency is 5.2%. If
the plant were to be fuelled with bagasse, with a net calorific value of 10 MJ/kg, fuel
consumption would be some 7 kg/kWh, on the basis of wet bagasse with a net calorific value of
10 MJ/kg. With an average plant loading rate of 90%, biomass consumption would be 689 kg/h
(16.5 t/d). Annual biomass consumption at 80% plant availability (7000 h/a) would be 4,824
tonnes of bagasse. Note that production of process steam for distillation would require
additional fuel.
16 Several technical proposals of Benecke steam plants in the range 0f 40-200 kW are available to the consultant 17 The steam engine plate indicated rating of 130 kVA but according to the manufacturer site, the MVB-130 has a rated output of 130 kW (160 kVA)
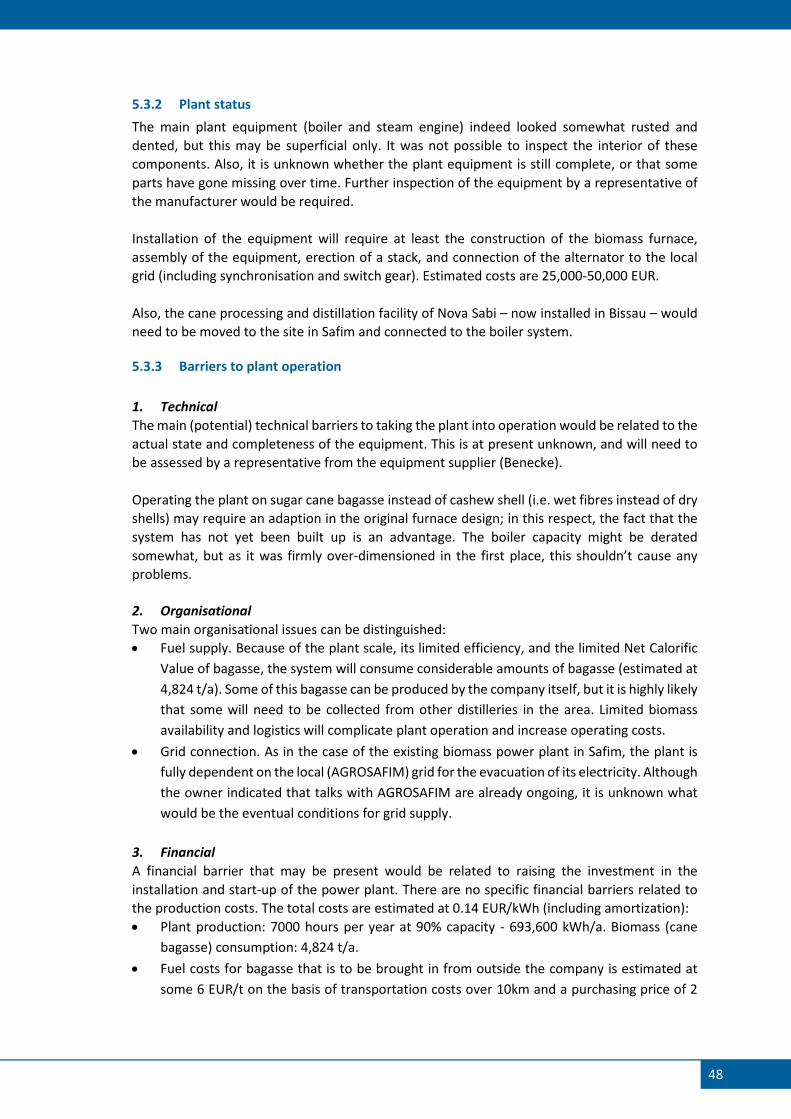
48
5.3.2 Plant status
The main plant equipment (boiler and steam engine) indeed looked somewhat rusted and
dented, but this may be superficial only. It was not possible to inspect the interior of these
components. Also, it is unknown whether the plant equipment is still complete, or that some
parts have gone missing over time. Further inspection of the equipment by a representative of
the manufacturer would be required.
Installation of the equipment will require at least the construction of the biomass furnace,
assembly of the equipment, erection of a stack, and connection of the alternator to the local
grid (including synchronisation and switch gear). Estimated costs are 25,000-50,000 EUR.
Also, the cane processing and distillation facility of Nova Sabi – now installed in Bissau – would
need to be moved to the site in Safim and connected to the boiler system.
5.3.3 Barriers to plant operation
1. Technical
The main (potential) technical barriers to taking the plant into operation would be related to the
actual state and completeness of the equipment. This is at present unknown, and will need to
be assessed by a representative from the equipment supplier (Benecke).
Operating the plant on sugar cane bagasse instead of cashew shell (i.e. wet fibres instead of dry
shells) may require an adaption in the original furnace design; in this respect, the fact that the
system has not yet been built up is an advantage. The boiler capacity might be derated
somewhat, but as it was firmly over-dimensioned in the first place, this shouldn’t cause any
problems.
2. Organisational
Two main organisational issues can be distinguished:
• Fuel supply. Because of the plant scale, its limited efficiency, and the limited Net Calorific
Value of bagasse, the system will consume considerable amounts of bagasse (estimated at
4,824 t/a). Some of this bagasse can be produced by the company itself, but it is highly likely
that some will need to be collected from other distilleries in the area. Limited biomass
availability and logistics will complicate plant operation and increase operating costs.
• Grid connection. As in the case of the existing biomass power plant in Safim, the plant is
fully dependent on the local (AGROSAFIM) grid for the evacuation of its electricity. Although
the owner indicated that talks with AGROSAFIM are already ongoing, it is unknown what
would be the eventual conditions for grid supply.
3. Financial
A financial barrier that may be present would be related to raising the investment in the
installation and start-up of the power plant. There are no specific financial barriers related to
the production costs. The total costs are estimated at 0.14 EUR/kWh (including amortization):
• Plant production: 7000 hours per year at 90% capacity - 693,600 kWh/a. Biomass (cane
bagasse) consumption: 4,824 t/a.
• Fuel costs for bagasse that is to be brought in from outside the company is estimated at
some 6 EUR/t on the basis of transportation costs over 10km and a purchasing price of 2
49
EUR/t. However, it is assumed that half the fuel will be provided by the company itself at
zero costs. On average, this translates to fuel costs of 0.02 EUR/kWh.
• Staff cost are estimated at 0.05 EUR/kWh, based on 7 staff (3 shifts for boiler operator,
steam engine operator; plus one administrator) at an average cost of 15 EUR/person/day.
• Maintenance costs: 15,000 EUR/a (5% of equipment costs) or 0.02 EUR/a.
• Amortization: 30,000 EUR/a (300,000 EUR over a period of 10 years) or 0.04 EUR/kWh.
With estimated diesel electricity production costs of 0.32 EUR/kWh (see section 5.1.3), there
would be ample margin for negotiation for grid feed-in. Also, the own production would replace
the electricity that is currently purchased from AGROSAFIM, saving some 22,000 EUR/a.
5.4 Lessons learned
From the different biomass electricity projects that were carried out in Guinea Bissau, the
following lessons can be learned.
1. Project development. There seems to be limited knowledge and experience with the
development of projects. From interviews with stakeholders, and from available
documentation forming the basis for projects, it can be concluded that there is in-depth
technical knowledge on biomass properties, appropriate technologies, efficiencies and
biomass-to-energy conversion rates, plant scaling etc. In the case of the Safim power plant
this has led to poor technology selection, underestimation of fuel consumption, selection
of a site at a distance from potential biomass suppliers, and disregard for existing electricity
supply concession. For future developments, it would be recommendable to have project
designs reviewed by at least one independent specialist.
2. Proper plant scaling and technology selection. Plant scale and technology can have large
consequences for energetic efficiency, investment costs and operational costs. If fuel
availability is limited, or fuel needs to be obtained from third parties and transported to the
power plant, cost and continuity of the fuel supply can become potential barriers to plant
operation. Small plants typically have higher staff costs. A realistic assessment of proper
plant scale and production costs
3. Selection of plant location. As part of the project design, a proper plant location must be
identified, taking into account a range of issues including existing and future energy
demand, fuel logistics, energy supply infrastructure, possible nuisances for the immediate
surroundings and legal/institutional setting related to energy supply.
4. Plant servicing. One plant that made it to operation eventually fell into disuse because of
technical problem that no-one could resolve. Such situations should be covered in supplier
warranty – which will add to the costs – or financial provisions should be made for such
eventualities. In addition, more extensive training (including trouble shooting and problem
resolving) could be given to plant operators and/or existing steam plant experts in the
country.
5. Owner commitment. In two cases, there seemed to have been limited commitment of the
plant owner. In the case of the LICAJU plant, the prospective owner could just refuse the
plant after it had been bought and paid for by third parties. In the case of the Safim plant,
there seems to have been little incentive to find solutions for the grid connection /
concession issue, or for the resolution of technical problem with the boiler. For future
projects, a clear personal stake of the project owner should be secured.
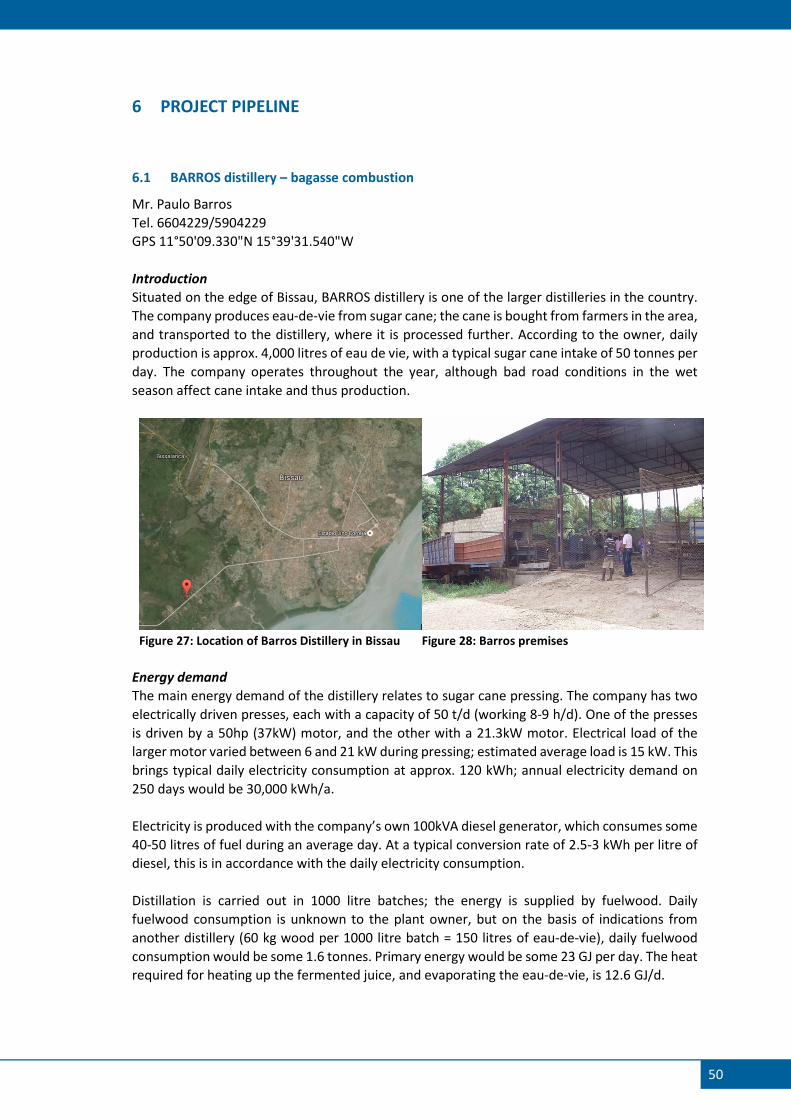
50
6 PROJECT PIPELINE
6.1 BARROS distillery – bagasse combustion
Mr. Paulo Barros
Tel. 6604229/5904229
GPS 11°50'09.330"N 15°39'31.540"W
Introduction
Situated on the edge of Bissau, BARROS distillery is one of the larger distilleries in the country.
The company produces eau-de-vie from sugar cane; the cane is bought from farmers in the area,
and transported to the distillery, where it is processed further. According to the owner, daily
production is approx. 4,000 litres of eau de vie, with a typical sugar cane intake of 50 tonnes per
day. The company operates throughout the year, although bad road conditions in the wet
season affect cane intake and thus production.
Figure 27: Location of Barros Distillery in Bissau Figure 28: Barros premises
Energy demand
The main energy demand of the distillery relates to sugar cane pressing. The company has two
electrically driven presses, each with a capacity of 50 t/d (working 8-9 h/d). One of the presses
is driven by a 50hp (37kW) motor, and the other with a 21.3kW motor. Electrical load of the
larger motor varied between 6 and 21 kW during pressing; estimated average load is 15 kW. This
brings typical daily electricity consumption at approx. 120 kWh; annual electricity demand on
250 days would be 30,000 kWh/a.
Electricity is produced with the company’s own 100kVA diesel generator, which consumes some
40-50 litres of fuel during an average day. At a typical conversion rate of 2.5-3 kWh per litre of
diesel, this is in accordance with the daily electricity consumption.
Distillation is carried out in 1000 litre batches; the energy is supplied by fuelwood. Daily
fuelwood consumption is unknown to the plant owner, but on the basis of indications from
another distillery (60 kg wood per 1000 litre batch = 150 litres of eau-de-vie), daily fuelwood
consumption would be some 1.6 tonnes. Primary energy would be some 23 GJ per day. The heat
required for heating up the fermented juice, and evaporating the eau-de-vie, is 12.6 GJ/d.
51
Bagasse production
Juice extraction efficiency is some 500 litres per tonne of cane, so bagasse production will be
some 0.5 tonnes per tonne of cane. Typical daily bagasse production would thus be some 25
tonnes; assuming 250 days of typical production, annual bagasse production would be 6,250
tonnes.
At production, bagasse will be very wet (approx. 60% moisture); solar drying could bring down
moisture content, e.g. to some 40%. The mass reduction will be 33% so bagasse availability will
be 4,166 t/a at 40% moisture. The net calorific value will be approx. 10 MJ/kg.
Note that it might be possible to transport bagasse from other distilleries in the area. For
example, bagasse production at MAPILO distillery (8km from Barros Distillery) is estimated at
some 3,500 t/a (at 70% moisture); it should be possible to make an additional 1,500 t/a (at 40%
moisture) available. It is assumed that purchase, handling and transportation will cost 10 EUR/t.
As no sugar cane is produced by the company itself, sugar cane trash utilisation is not taken into
consideration.
Energy production potential
The 4,166 t/a of bagasse produced at the Barros distillery represents a primary energy quantity
of 41,666 GJ/a. The primary energy needed for distillation is 4,200 GJ/a (13 GJ/d in 250 d/a, at a
boiler efficiency of 75%) so left for electricity production is 37,461GJ/a. At a conversion efficiency
of 5% (net), this would be 520,300 kWh/a.
Adding the 1,500 t/a of bagasse from external sources would add 208,333 kWh/a of additional
electricity production potential, bringing the total to 728,634 kWh/a.
If only the bagasse from the own site would be used, and the electricity production unit would
be run for 16 h/d, during 300 d/a (4,800 h/a), the average net power output would be 108kWe.
In order to supply parasitic power, a 130 kW system would be recommended.
If also the bagasse from the external site would be used, and the electricity production unit
would be run for 4,800 h/a, the average net power output would be 152kWe. In order to supply
parasitic power, a 175 kW system would be recommended.
In both cases, process steam (16 bar, 0.4 t/h) will be available for the distillation process. The
steam will be taken directly from the boiler.
Economics

52
Table 18 shows the economics for both options. The comparison shows that scale advantages
do not weigh up to the added costs of the additional bagasse; production costs are equal.
Including an external supply of bagasse does add to the risk of the project; in this sense a 130
kW system would be preferable.
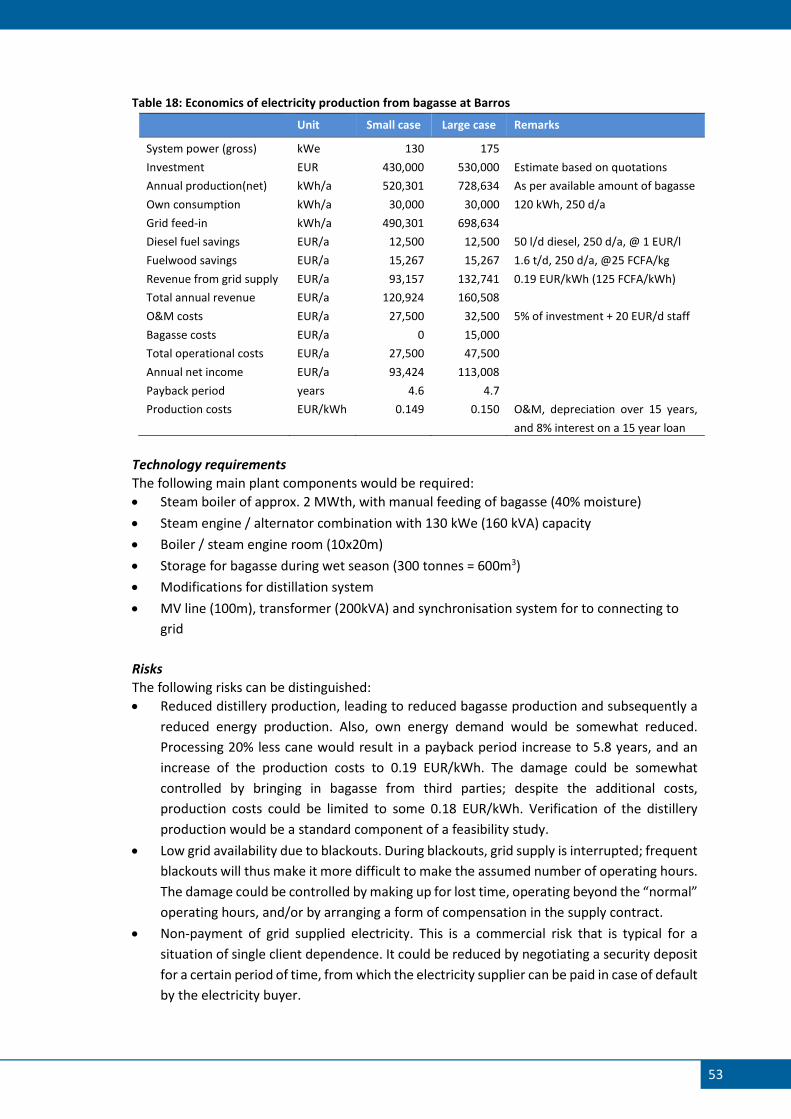
53
Table 18: Economics of electricity production from bagasse at Barros
Unit Small case Large case Remarks
System power (gross) kWe 130 175
Investment EUR 430,000 530,000 Estimate based on quotations
Annual production(net) kWh/a 520,301 728,634 As per available amount of bagasse
Own consumption kWh/a 30,000 30,000 120 kWh, 250 d/a
Grid feed-in kWh/a 490,301 698,634
Diesel fuel savings EUR/a 12,500 12,500 50 l/d diesel, 250 d/a, @ 1 EUR/l
Fuelwood savings EUR/a 15,267 15,267 1.6 t/d, 250 d/a, @25 FCFA/kg
Revenue from grid supply EUR/a 93,157 132,741 0.19 EUR/kWh (125 FCFA/kWh)
Total annual revenue EUR/a 120,924 160,508
O&M costs EUR/a 27,500 32,500 5% of investment + 20 EUR/d staff
Bagasse costs EUR/a 0 15,000
Total operational costs EUR/a 27,500 47,500
Annual net income EUR/a 93,424 113,008
Payback period years 4.6 4.7
Production costs EUR/kWh 0.149 0.150 O&M, depreciation over 15 years,
and 8% interest on a 15 year loan
Technology requirements
The following main plant components would be required:
• Steam boiler of approx. 2 MWth, with manual feeding of bagasse (40% moisture)
• Steam engine / alternator combination with 130 kWe (160 kVA) capacity
• Boiler / steam engine room (10x20m)
• Storage for bagasse during wet season (300 tonnes = 600m3)
• Modifications for distillation system
• MV line (100m), transformer (200kVA) and synchronisation system for to connecting to
grid
Risks
The following risks can be distinguished:
• Reduced distillery production, leading to reduced bagasse production and subsequently a
reduced energy production. Also, own energy demand would be somewhat reduced.
Processing 20% less cane would result in a payback period increase to 5.8 years, and an
increase of the production costs to 0.19 EUR/kWh. The damage could be somewhat
controlled by bringing in bagasse from third parties; despite the additional costs,
production costs could be limited to some 0.18 EUR/kWh. Verification of the distillery
production would be a standard component of a feasibility study.
• Low grid availability due to blackouts. During blackouts, grid supply is interrupted; frequent
blackouts will thus make it more difficult to make the assumed number of operating hours.
The damage could be controlled by making up for lost time, operating beyond the “normal”
operating hours, and/or by arranging a form of compensation in the supply contract.
• Non-payment of grid supplied electricity. This is a commercial risk that is typical for a
situation of single client dependence. It could be reduced by negotiating a security deposit
for a certain period of time, from which the electricity supplier can be paid in case of default
by the electricity buyer.
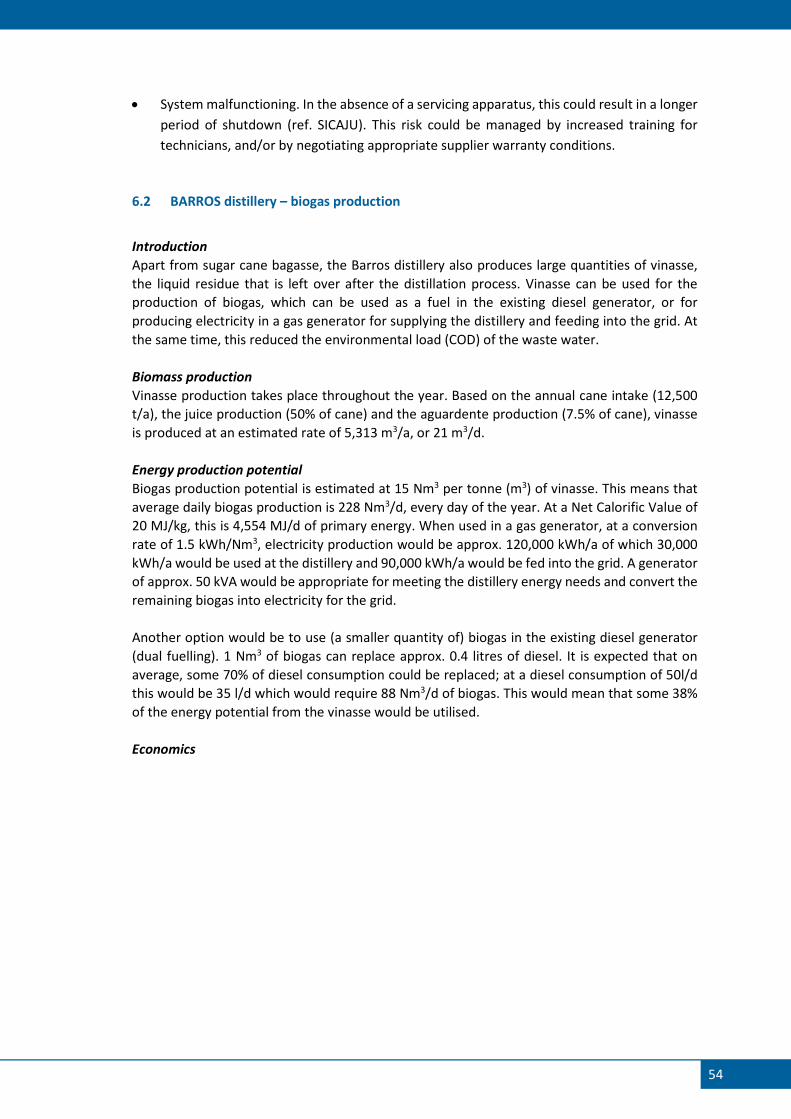
54
• System malfunctioning. In the absence of a servicing apparatus, this could result in a longer
period of shutdown (ref. SICAJU). This risk could be managed by increased training for
technicians, and/or by negotiating appropriate supplier warranty conditions.
6.2 BARROS distillery – biogas production
Introduction
Apart from sugar cane bagasse, the Barros distillery also produces large quantities of vinasse,
the liquid residue that is left over after the distillation process. Vinasse can be used for the
production of biogas, which can be used as a fuel in the existing diesel generator, or for
producing electricity in a gas generator for supplying the distillery and feeding into the grid. At
the same time, this reduced the environmental load (COD) of the waste water.
Biomass production
Vinasse production takes place throughout the year. Based on the annual cane intake (12,500
t/a), the juice production (50% of cane) and the aguardente production (7.5% of cane), vinasse
is produced at an estimated rate of 5,313 m3/a, or 21 m3/d.
Energy production potential
Biogas production potential is estimated at 15 Nm3 per tonne (m3) of vinasse. This means that
average daily biogas production is 228 Nm3/d, every day of the year. At a Net Calorific Value of
20 MJ/kg, this is 4,554 MJ/d of primary energy. When used in a gas generator, at a conversion
rate of 1.5 kWh/Nm3, electricity production would be approx. 120,000 kWh/a of which 30,000
kWh/a would be used at the distillery and 90,000 kWh/a would be fed into the grid. A generator
of approx. 50 kVA would be appropriate for meeting the distillery energy needs and convert the
remaining biogas into electricity for the grid.
Another option would be to use (a smaller quantity of) biogas in the existing diesel generator
(dual fuelling). 1 Nm3 of biogas can replace approx. 0.4 litres of diesel. It is expected that on
average, some 70% of diesel consumption could be replaced; at a diesel consumption of 50l/d
this would be 35 l/d which would require 88 Nm3/d of biogas. This would mean that some 38%
of the energy potential from the vinasse would be utilised.
Economics
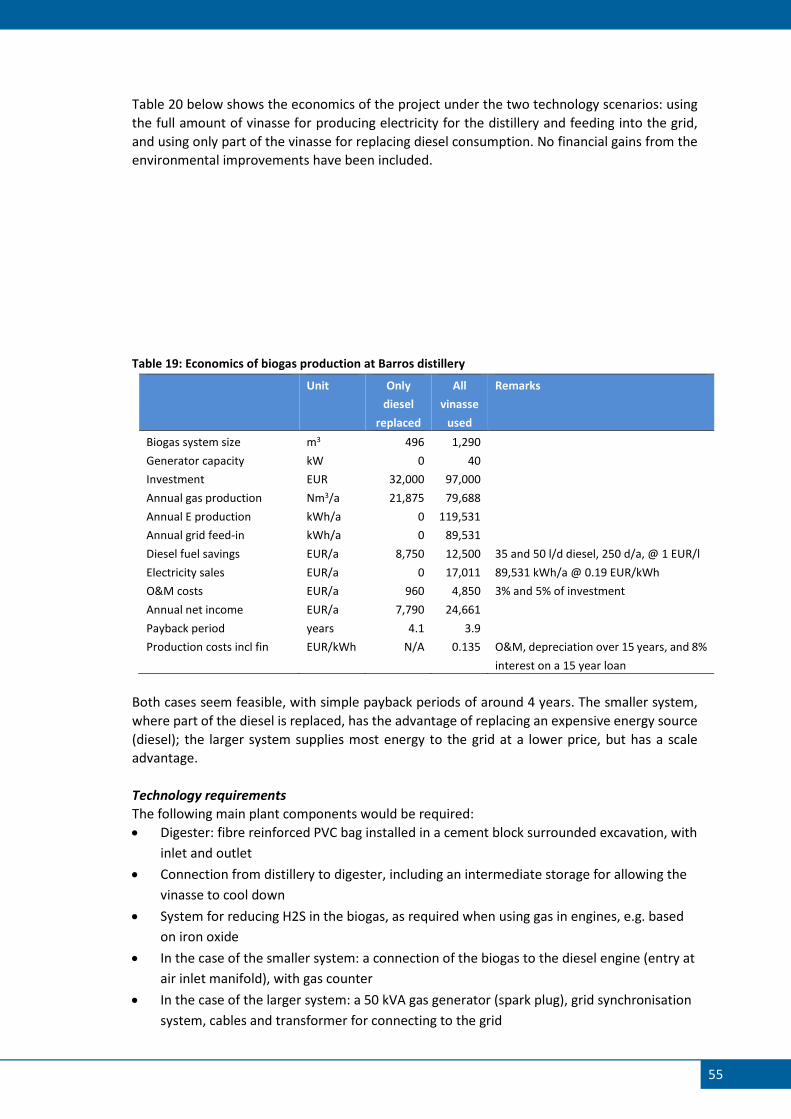
55
Table 20 below shows the economics of the project under the two technology scenarios: using
the full amount of vinasse for producing electricity for the distillery and feeding into the grid,
and using only part of the vinasse for replacing diesel consumption. No financial gains from the
environmental improvements have been included.
Table 19: Economics of biogas production at Barros distillery
Unit Only
diesel
replaced
All
vinasse
used
Remarks
Biogas system size m3 496 1,290
Generator capacity kW 0 40
Investment EUR 32,000 97,000
Annual gas production Nm3/a 21,875 79,688
Annual E production kWh/a 0 119,531
Annual grid feed-in kWh/a 0 89,531
Diesel fuel savings EUR/a 8,750 12,500 35 and 50 l/d diesel, 250 d/a, @ 1 EUR/l
Electricity sales EUR/a 0 17,011 89,531 kWh/a @ 0.19 EUR/kWh
O&M costs EUR/a 960 4,850 3% and 5% of investment
Annual net income EUR/a 7,790 24,661
Payback period years 4.1 3.9
Production costs incl fin EUR/kWh N/A 0.135 O&M, depreciation over 15 years, and 8%
interest on a 15 year loan
Both cases seem feasible, with simple payback periods of around 4 years. The smaller system,
where part of the diesel is replaced, has the advantage of replacing an expensive energy source
(diesel); the larger system supplies most energy to the grid at a lower price, but has a scale
advantage.
Technology requirements
The following main plant components would be required:
• Digester: fibre reinforced PVC bag installed in a cement block surrounded excavation, with
inlet and outlet
• Connection from distillery to digester, including an intermediate storage for allowing the
vinasse to cool down
• System for reducing H2S in the biogas, as required when using gas in engines, e.g. based
on iron oxide
• In the case of the smaller system: a connection of the biogas to the diesel engine (entry at
air inlet manifold), with gas counter
• In the case of the larger system: a 50 kVA gas generator (spark plug), grid synchronisation
system, cables and transformer for connecting to the grid
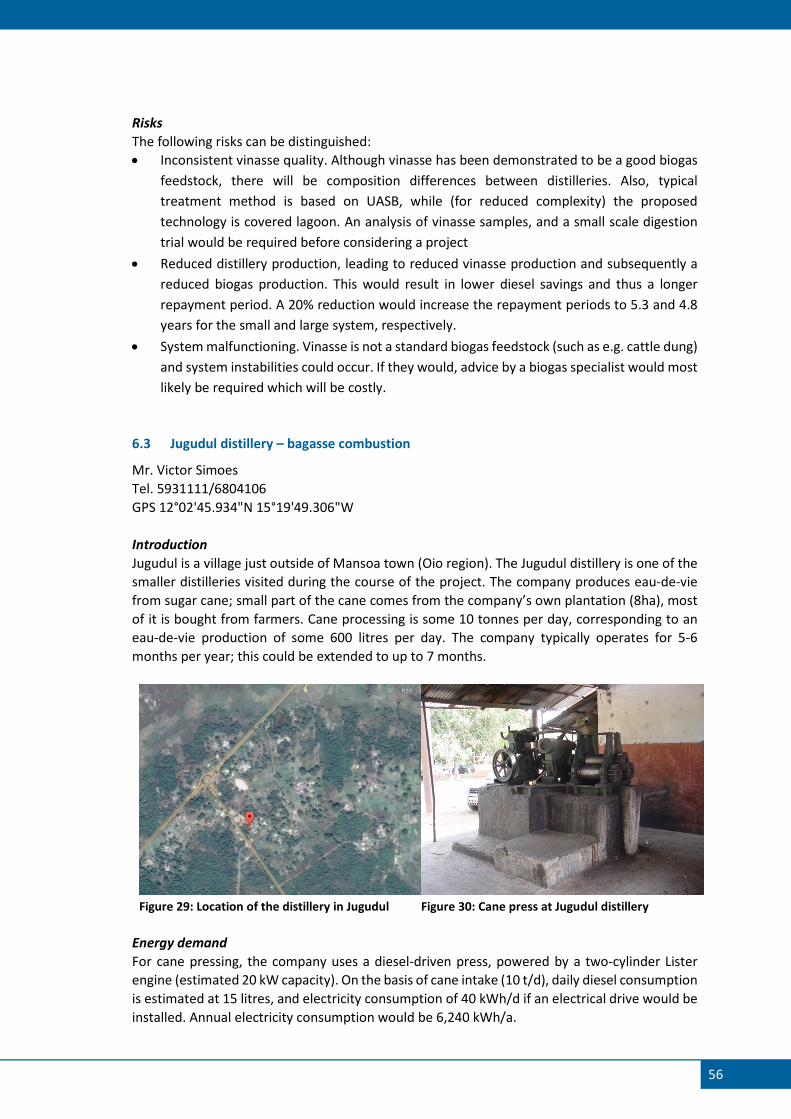
56
Risks
The following risks can be distinguished:
• Inconsistent vinasse quality. Although vinasse has been demonstrated to be a good biogas
feedstock, there will be composition differences between distilleries. Also, typical
treatment method is based on UASB, while (for reduced complexity) the proposed
technology is covered lagoon. An analysis of vinasse samples, and a small scale digestion
trial would be required before considering a project
• Reduced distillery production, leading to reduced vinasse production and subsequently a
reduced biogas production. This would result in lower diesel savings and thus a longer
repayment period. A 20% reduction would increase the repayment periods to 5.3 and 4.8
years for the small and large system, respectively.
• System malfunctioning. Vinasse is not a standard biogas feedstock (such as e.g. cattle dung)
and system instabilities could occur. If they would, advice by a biogas specialist would most
likely be required which will be costly.
6.3 Jugudul distillery – bagasse combustion
Mr. Victor Simoes
Tel. 5931111/6804106
GPS 12°02'45.934"N 15°19'49.306"W
Introduction
Jugudul is a village just outside of Mansoa town (Oio region). The Jugudul distillery is one of the
smaller distilleries visited during the course of the project. The company produces eau-de-vie
from sugar cane; small part of the cane comes from the company’s own plantation (8ha), most
of it is bought from farmers. Cane processing is some 10 tonnes per day, corresponding to an
eau-de-vie production of some 600 litres per day. The company typically operates for 5-6
months per year; this could be extended to up to 7 months.
Figure 29: Location of the distillery in Jugudul Figure 30: Cane press at Jugudul distillery
Energy demand
For cane pressing, the company uses a diesel-driven press, powered by a two-cylinder Lister
engine (estimated 20 kW capacity). On the basis of cane intake (10 t/d), daily diesel consumption
is estimated at 15 litres, and electricity consumption of 40 kWh/d if an electrical drive would be
installed. Annual electricity consumption would be 6,240 kWh/a.
57
Distillation is fuelled with fuelwood; on the basis of daily liquor production, daily fuelwood
consumption is estimated at 0.3 tonnes.
The village of Jugudul has some 900 inhabitants in 170 households; judging from the location of
the distillery, some 50-100 households could be connected in a radius of approx. 1000 metres.
Assuming a potential daily demand of 0.5 kWh/d/family (evening hours only), annual electricity
demand would be some 8,750 – 17,500 kWh/a with a peak demand in the order of 10-15 kW.
NB The potential electricity demand in the town of Mansao will be a multiple of that in Jugudul.
However, it is some 3 km removed from the distillery and seen the capacity of the system
(approx. 20 kW, see below), installation of the infrastructure is not likely to be feasible.
Total electricity demand is thus estimated at 14,990 – 23,740 kWh/a.
Biomass production
On the basis of 6 months operation, on 6 days per week, a cane intake of with 10 t/d and bagasse
production of 600kg per tonne of cane crushed, the annual bagasse production will be in the
order of 924 tonnes. This bagasse will be very wet (>60% moisture); when dried down to 40%,
there will be some 540 t/a left. Adding some quantity of thrash from the company’s own field
(10% on own cane = 20 t/a), total biomass will be 560 t/a.
Energy production potential
Total primary energy value of the available biomass will be some 5,600 GJ/a. An estimated 540
GJ/a would be required for process steam in the distillation process, leaving 5,060 GJ/a for
electricity production.
At the required production scale (20 kW / 25 kVA), there would be essentially two technology
options: 1. A Brazilian system of 25 kVA (Benecke) - the smallest plant in the company’s supply range
- with a net efficiency of some 5% on the basis of which some 73,000 kWh/a could be
produced.
2. An Indian system of 25 kVA (Tinytech) - the largest plant in the company’s supply range,
with a net efficiency of some 3%18 on the basis of which some 44,000 kWh/a could be
produced.
Both plants could thus easily supply the total electricity demand in the high range of the
estimated electricity demand.
Economics
18 Unfortunately the supplier of Tinytech systems could not provide any details on the performance of their system. The efficiency is estimated, based on the given steam pressure and assumed efficiencies for steam engine and boiler efficiency (both somewhat lower than those of Brazilian systems)

58
Table 20 below shows the economics of the project under the two technology scenarios.
Note that the electricity tariff has been set at 0.60 EUR/kWh, which is in-between the production
costs with and without financial costs. To this, some 0.10-0.20 EUR/kWh should be added for
electricity distribution (investment costs not included in the above table) and administration.
Whether this rate is sufficient, or too high, will depend on the way that the project is financed,
and the ability and willingness to pay of the potential customers.
There is a remarkable difference between the payback period and the production costs of the
Brazilian and the Indian systems. This is due to the difference in investment costs, which is
related to depreciation, financial costs, and also maintenance (this is a fixed percentage of
investment costs). The lower efficiency of the Indian system does not directly influence the
economics, as the bagasse is available at no costs.
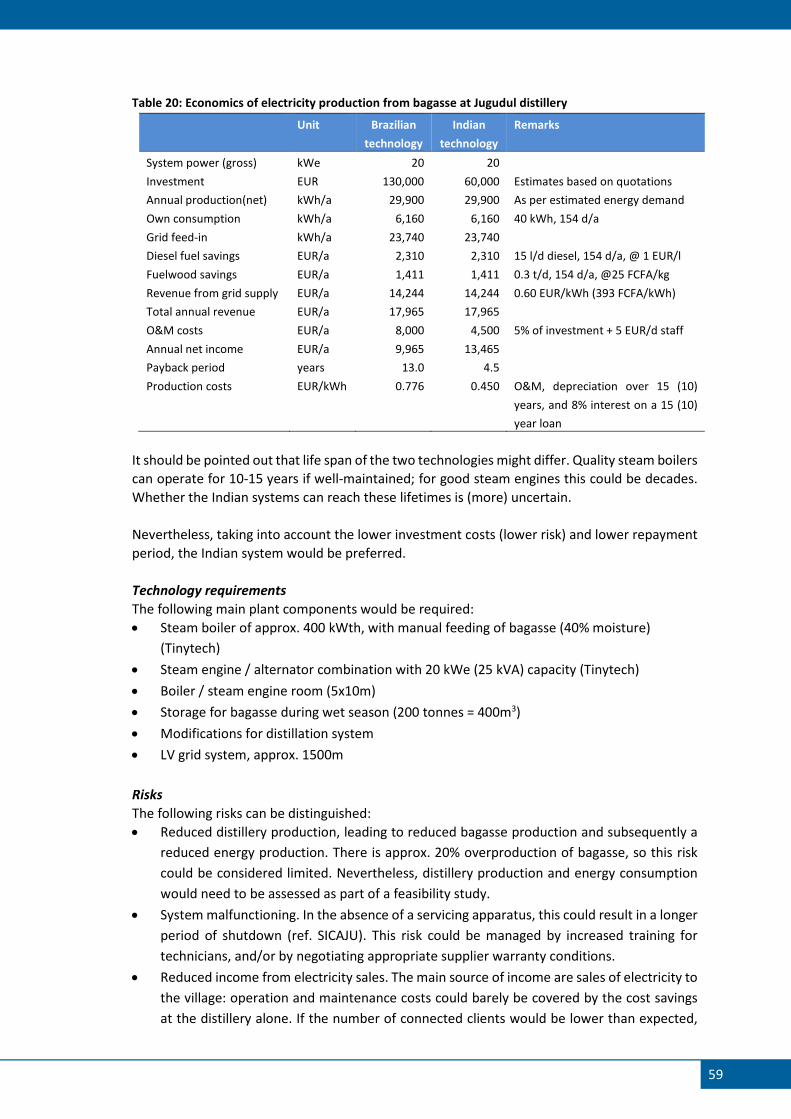
59
Table 20: Economics of electricity production from bagasse at Jugudul distillery
Unit Brazilian
technology
Indian
technology
Remarks
System power (gross) kWe 20 20
Investment EUR 130,000 60,000 Estimates based on quotations
Annual production(net) kWh/a 29,900 29,900 As per estimated energy demand
Own consumption kWh/a 6,160 6,160 40 kWh, 154 d/a
Grid feed-in kWh/a 23,740 23,740
Diesel fuel savings EUR/a 2,310 2,310 15 l/d diesel, 154 d/a, @ 1 EUR/l
Fuelwood savings EUR/a 1,411 1,411 0.3 t/d, 154 d/a, @25 FCFA/kg
Revenue from grid supply EUR/a 14,244 14,244 0.60 EUR/kWh (393 FCFA/kWh)
Total annual revenue EUR/a 17,965 17,965
O&M costs EUR/a 8,000 4,500 5% of investment + 5 EUR/d staff
Annual net income EUR/a 9,965 13,465
Payback period years 13.0 4.5
Production costs EUR/kWh 0.776 0.450 O&M, depreciation over 15 (10)
years, and 8% interest on a 15 (10)
year loan
It should be pointed out that life span of the two technologies might differ. Quality steam boilers
can operate for 10-15 years if well-maintained; for good steam engines this could be decades.
Whether the Indian systems can reach these lifetimes is (more) uncertain.
Nevertheless, taking into account the lower investment costs (lower risk) and lower repayment
period, the Indian system would be preferred.
Technology requirements
The following main plant components would be required:
• Steam boiler of approx. 400 kWth, with manual feeding of bagasse (40% moisture)
(Tinytech)
• Steam engine / alternator combination with 20 kWe (25 kVA) capacity (Tinytech)
• Boiler / steam engine room (5x10m)
• Storage for bagasse during wet season (200 tonnes = 400m3)
• Modifications for distillation system
• LV grid system, approx. 1500m
Risks
The following risks can be distinguished:
• Reduced distillery production, leading to reduced bagasse production and subsequently a
reduced energy production. There is approx. 20% overproduction of bagasse, so this risk
could be considered limited. Nevertheless, distillery production and energy consumption
would need to be assessed as part of a feasibility study.
• System malfunctioning. In the absence of a servicing apparatus, this could result in a longer
period of shutdown (ref. SICAJU). This risk could be managed by increased training for
technicians, and/or by negotiating appropriate supplier warranty conditions.
• Reduced income from electricity sales. The main source of income are sales of electricity to
the village: operation and maintenance costs could barely be covered by the cost savings
at the distillery alone. If the number of connected clients would be lower than expected,
60
clients would not be able to pay their bills, or their average consumption would be lower,
income would be reduced. This risk could be somewhat reduced by assessing the potential
number of clients, and their ability and willingness to pay.
6.4 Jugudul distillery – biogas from vinasse
Introduction
Similar to the Barros distillery described in section 6.2, the vinasse produced in the distillation
process can be used for the production of biogas. In this case, it could be used as an engine fuel
for the sugar cane press or in the distillation process. Likewise, the environmental load (COD) of
the waste water is reduced.
Biomass production
Vinasse production takes place during 6 months per year, 6 days per week. Based on the annual
cane intake (1543 t/a), the juice production (40% of cane) and the aguardente production (5%
of cane) at an estimated rate of 450 m3/a, or 3.5 m3/d.
Energy production potential
Biogas production potential is estimated at 15 Nm3 per tonne (m3) of vinasse. This means that
average daily biogas production during the 6 months of distillery operation is 45 Nm3/d (on 7
days/week). At a Net Calorific Value of 20 MJ/kg, this is 900 MJ/d of primary energy.
When used in a diesel engine (dual fuelling), 1 Nm3 of biogas can replace approx. 0.4 litres of
diesel. It is expected that on average, some 70% of diesel for cane crushing could be replaced;
at a diesel consumption of 15l/d this would be 10.5 l/d which would require 26 Nm3/d of biogas.
The remainder of the gas could be used for replacing fuelwood in the distillery, at a rate of 0.72
kg/Nm3; daily wood replacement would be some 26 kg of wood (11%).
Note that instead, a smaller quantity of vinasse could be used for producing only the biogas for
the diesel engine, as the wood fuel replacement will yield little financial benefit.
Economics
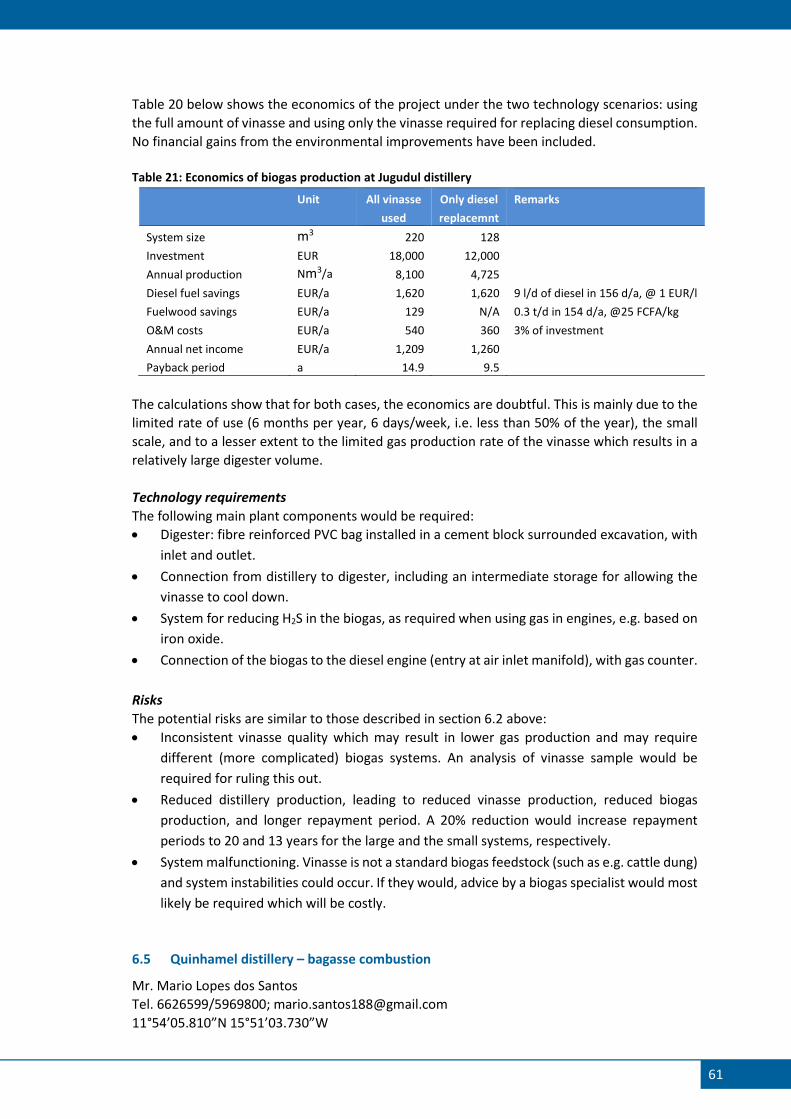
61
Table 20 below shows the economics of the project under the two technology scenarios: using
the full amount of vinasse and using only the vinasse required for replacing diesel consumption.
No financial gains from the environmental improvements have been included.
Table 21: Economics of biogas production at Jugudul distillery
Unit All vinasse
used
Only diesel
replacemnt
Remarks
System size m3 220 128
Investment EUR 18,000 12,000
Annual production Nm3/a 8,100 4,725
Diesel fuel savings EUR/a 1,620 1,620 9 l/d of diesel in 156 d/a, @ 1 EUR/l
Fuelwood savings EUR/a 129 N/A 0.3 t/d in 154 d/a, @25 FCFA/kg
O&M costs EUR/a 540 360 3% of investment
Annual net income EUR/a 1,209 1,260
Payback period a 14.9 9.5
The calculations show that for both cases, the economics are doubtful. This is mainly due to the
limited rate of use (6 months per year, 6 days/week, i.e. less than 50% of the year), the small
scale, and to a lesser extent to the limited gas production rate of the vinasse which results in a
relatively large digester volume.
Technology requirements
The following main plant components would be required:
• Digester: fibre reinforced PVC bag installed in a cement block surrounded excavation, with
inlet and outlet.
• Connection from distillery to digester, including an intermediate storage for allowing the
vinasse to cool down.
• System for reducing H2S in the biogas, as required when using gas in engines, e.g. based on
iron oxide.
• Connection of the biogas to the diesel engine (entry at air inlet manifold), with gas counter.
Risks
The potential risks are similar to those described in section 6.2 above:
• Inconsistent vinasse quality which may result in lower gas production and may require
different (more complicated) biogas systems. An analysis of vinasse sample would be
required for ruling this out.
• Reduced distillery production, leading to reduced vinasse production, reduced biogas
production, and longer repayment period. A 20% reduction would increase repayment
periods to 20 and 13 years for the large and the small systems, respectively.
• System malfunctioning. Vinasse is not a standard biogas feedstock (such as e.g. cattle dung)
and system instabilities could occur. If they would, advice by a biogas specialist would most
likely be required which will be costly.
6.5 Quinhamel distillery – bagasse combustion
Mr. Mario Lopes dos Santos
Tel. 6626599/5969800; [email protected]
11°54’05.810”N 15°51’03.730”W
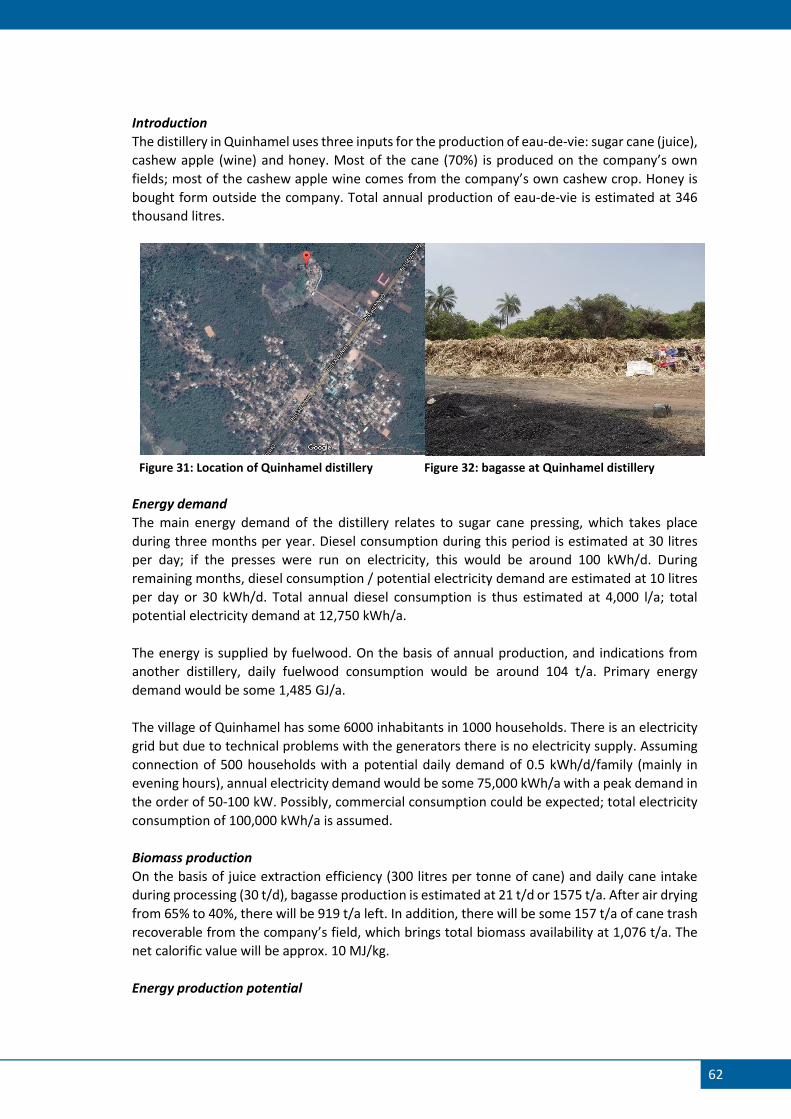
62
Introduction
The distillery in Quinhamel uses three inputs for the production of eau-de-vie: sugar cane (juice),
cashew apple (wine) and honey. Most of the cane (70%) is produced on the company’s own
fields; most of the cashew apple wine comes from the company’s own cashew crop. Honey is
bought form outside the company. Total annual production of eau-de-vie is estimated at 346
thousand litres.
Figure 31: Location of Quinhamel distillery Figure 32: bagasse at Quinhamel distillery
Energy demand
The main energy demand of the distillery relates to sugar cane pressing, which takes place
during three months per year. Diesel consumption during this period is estimated at 30 litres
per day; if the presses were run on electricity, this would be around 100 kWh/d. During
remaining months, diesel consumption / potential electricity demand are estimated at 10 litres
per day or 30 kWh/d. Total annual diesel consumption is thus estimated at 4,000 l/a; total
potential electricity demand at 12,750 kWh/a.
The energy is supplied by fuelwood. On the basis of annual production, and indications from
another distillery, daily fuelwood consumption would be around 104 t/a. Primary energy
demand would be some 1,485 GJ/a.
The village of Quinhamel has some 6000 inhabitants in 1000 households. There is an electricity
grid but due to technical problems with the generators there is no electricity supply. Assuming
connection of 500 households with a potential daily demand of 0.5 kWh/d/family (mainly in
evening hours), annual electricity demand would be some 75,000 kWh/a with a peak demand in
the order of 50-100 kW. Possibly, commercial consumption could be expected; total electricity
consumption of 100,000 kWh/a is assumed.
Biomass production
On the basis of juice extraction efficiency (300 litres per tonne of cane) and daily cane intake
during processing (30 t/d), bagasse production is estimated at 21 t/d or 1575 t/a. After air drying
from 65% to 40%, there will be 919 t/a left. In addition, there will be some 157 t/a of cane trash
recoverable from the company’s field, which brings total biomass availability at 1,076 t/a. The
net calorific value will be approx. 10 MJ/kg.
Energy production potential

63
The 1,076 t/a of bagasse and trash produced represents a primary energy quantity of 10,760
GJ/a. The primary energy needed for distillation is approx. 990 GJ/a so left for electricity
production is 9,772 GJ/a. At a conversion efficiency of 5% (net), this would be 135,725 kWh/a.
There would thus be sufficient biomass available to supply the distillery and the town.
On the basis of 12 h/a of production on 300 d/a, average power output would be 38 kWe.
Because of peak loads, both in the factory and in the town evening hours, a system of at least
70 kWe would be recommended. Possibly, for supplying the full load in the town, a 100 kWe
system would be required.
Economics
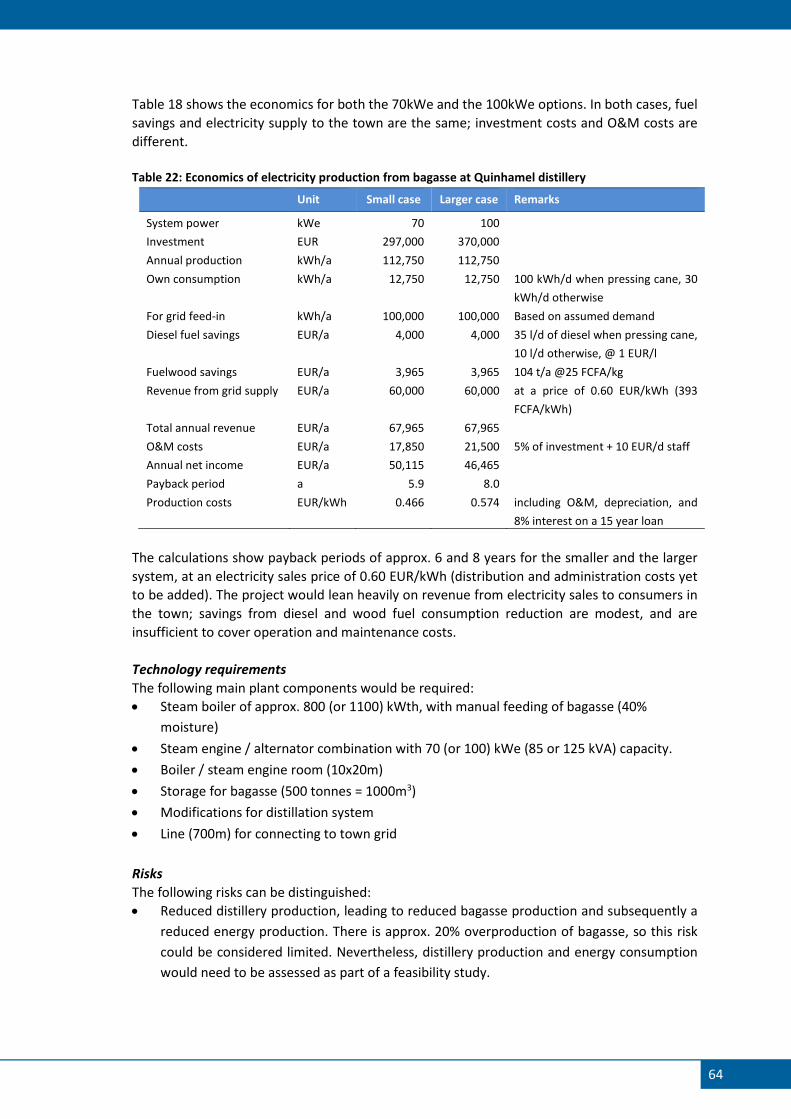
64
Table 18 shows the economics for both the 70kWe and the 100kWe options. In both cases, fuel
savings and electricity supply to the town are the same; investment costs and O&M costs are
different.
Table 22: Economics of electricity production from bagasse at Quinhamel distillery
Unit Small case Larger case Remarks
System power kWe 70 100
Investment EUR 297,000 370,000
Annual production kWh/a 112,750 112,750
Own consumption kWh/a 12,750 12,750 100 kWh/d when pressing cane, 30
kWh/d otherwise
For grid feed-in kWh/a 100,000 100,000 Based on assumed demand
Diesel fuel savings EUR/a 4,000 4,000 35 l/d of diesel when pressing cane,
10 l/d otherwise, @ 1 EUR/l
Fuelwood savings EUR/a 3,965 3,965 104 t/a @25 FCFA/kg
Revenue from grid supply EUR/a 60,000 60,000 at a price of 0.60 EUR/kWh (393
FCFA/kWh)
Total annual revenue EUR/a 67,965 67,965
O&M costs EUR/a 17,850 21,500 5% of investment + 10 EUR/d staff
Annual net income EUR/a 50,115 46,465
Payback period a 5.9 8.0
Production costs EUR/kWh 0.466 0.574 including O&M, depreciation, and
8% interest on a 15 year loan
The calculations show payback periods of approx. 6 and 8 years for the smaller and the larger
system, at an electricity sales price of 0.60 EUR/kWh (distribution and administration costs yet
to be added). The project would lean heavily on revenue from electricity sales to consumers in
the town; savings from diesel and wood fuel consumption reduction are modest, and are
insufficient to cover operation and maintenance costs.
Technology requirements
The following main plant components would be required:
• Steam boiler of approx. 800 (or 1100) kWth, with manual feeding of bagasse (40%
moisture)
• Steam engine / alternator combination with 70 (or 100) kWe (85 or 125 kVA) capacity.
• Boiler / steam engine room (10x20m)
• Storage for bagasse (500 tonnes = 1000m3)
• Modifications for distillation system
• Line (700m) for connecting to town grid
Risks
The following risks can be distinguished:
• Reduced distillery production, leading to reduced bagasse production and subsequently a
reduced energy production. There is approx. 20% overproduction of bagasse, so this risk
could be considered limited. Nevertheless, distillery production and energy consumption
would need to be assessed as part of a feasibility study.
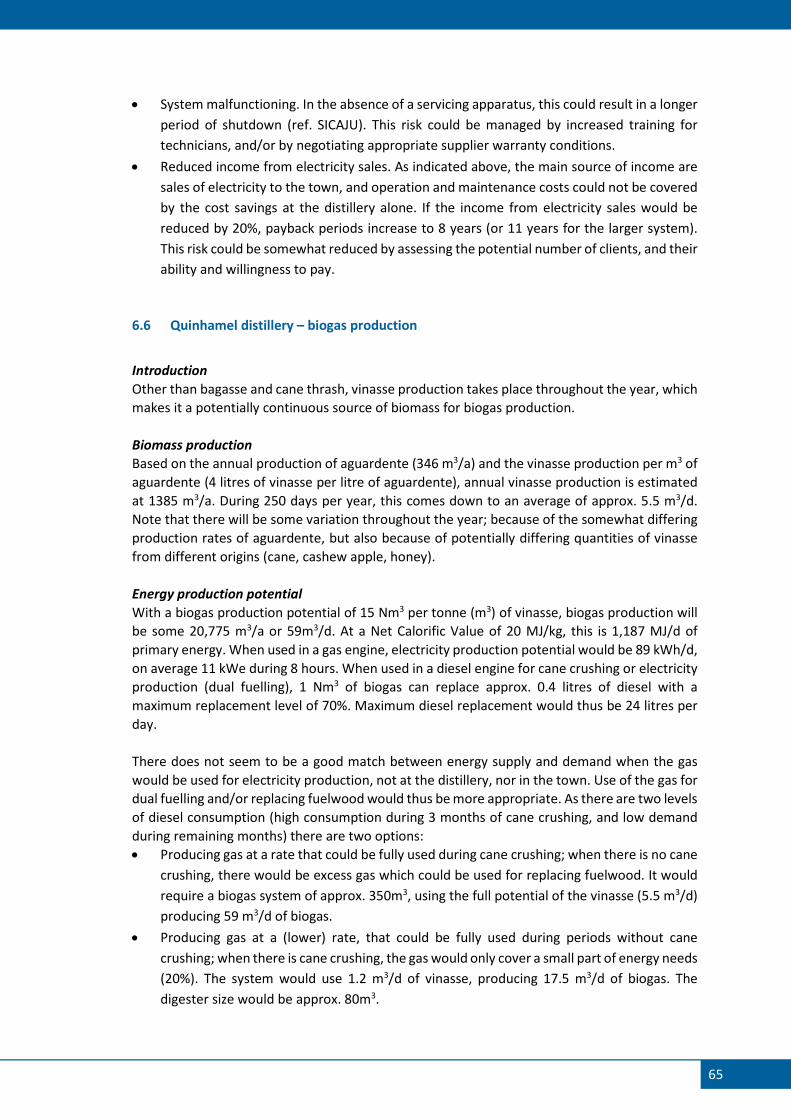
65
• System malfunctioning. In the absence of a servicing apparatus, this could result in a longer
period of shutdown (ref. SICAJU). This risk could be managed by increased training for
technicians, and/or by negotiating appropriate supplier warranty conditions.
• Reduced income from electricity sales. As indicated above, the main source of income are
sales of electricity to the town, and operation and maintenance costs could not be covered
by the cost savings at the distillery alone. If the income from electricity sales would be
reduced by 20%, payback periods increase to 8 years (or 11 years for the larger system).
This risk could be somewhat reduced by assessing the potential number of clients, and their
ability and willingness to pay.
6.6 Quinhamel distillery – biogas production
Introduction
Other than bagasse and cane thrash, vinasse production takes place throughout the year, which
makes it a potentially continuous source of biomass for biogas production.
Biomass production
Based on the annual production of aguardente (346 m3/a) and the vinasse production per m3 of
aguardente (4 litres of vinasse per litre of aguardente), annual vinasse production is estimated
at 1385 m3/a. During 250 days per year, this comes down to an average of approx. 5.5 m3/d.
Note that there will be some variation throughout the year; because of the somewhat differing
production rates of aguardente, but also because of potentially differing quantities of vinasse
from different origins (cane, cashew apple, honey).
Energy production potential
With a biogas production potential of 15 Nm3 per tonne (m3) of vinasse, biogas production will
be some 20,775 m3/a or 59m3/d. At a Net Calorific Value of 20 MJ/kg, this is 1,187 MJ/d of
primary energy. When used in a gas engine, electricity production potential would be 89 kWh/d,
on average 11 kWe during 8 hours. When used in a diesel engine for cane crushing or electricity
production (dual fuelling), 1 Nm3 of biogas can replace approx. 0.4 litres of diesel with a
maximum replacement level of 70%. Maximum diesel replacement would thus be 24 litres per
day.
There does not seem to be a good match between energy supply and demand when the gas
would be used for electricity production, not at the distillery, nor in the town. Use of the gas for
dual fuelling and/or replacing fuelwood would thus be more appropriate. As there are two levels
of diesel consumption (high consumption during 3 months of cane crushing, and low demand
during remaining months) there are two options:
• Producing gas at a rate that could be fully used during cane crushing; when there is no cane
crushing, there would be excess gas which could be used for replacing fuelwood. It would
require a biogas system of approx. 350m3, using the full potential of the vinasse (5.5 m3/d)
producing 59 m3/d of biogas.
• Producing gas at a (lower) rate, that could be fully used during periods without cane
crushing; when there is cane crushing, the gas would only cover a small part of energy needs
(20%). The system would use 1.2 m3/d of vinasse, producing 17.5 m3/d of biogas. The
digester size would be approx. 80m3.

66
Economics
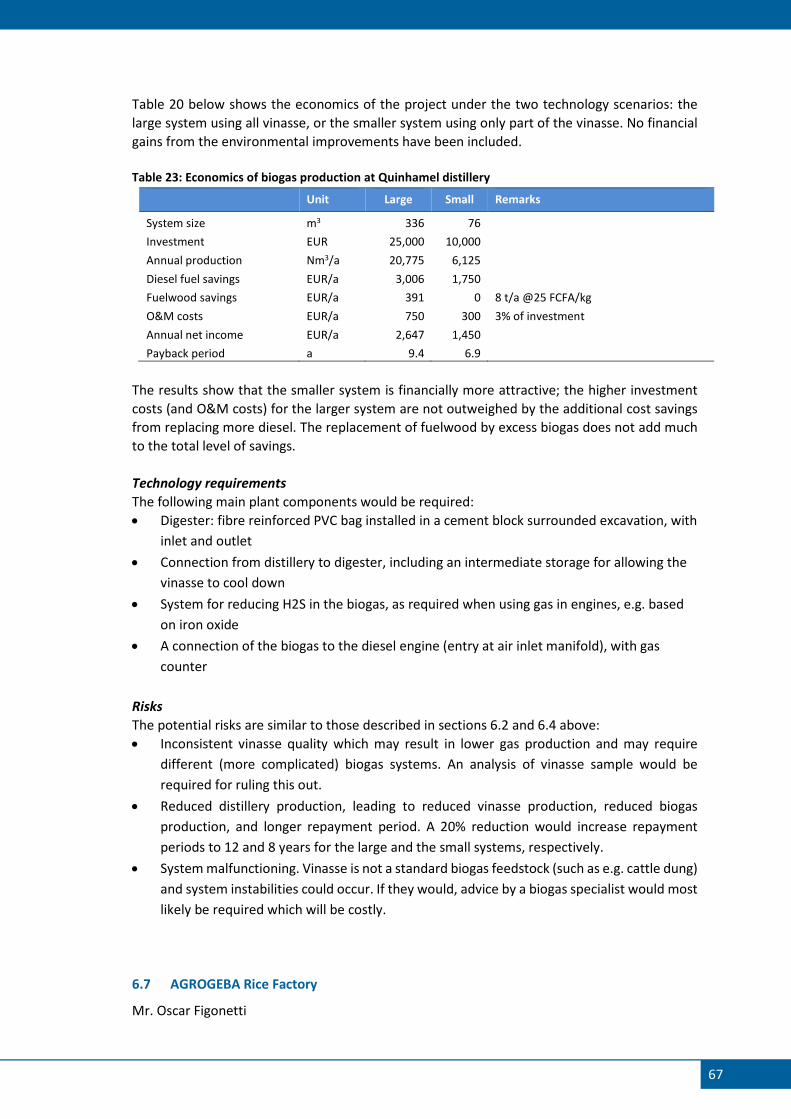
67
Table 20 below shows the economics of the project under the two technology scenarios: the
large system using all vinasse, or the smaller system using only part of the vinasse. No financial
gains from the environmental improvements have been included.
Table 23: Economics of biogas production at Quinhamel distillery
Unit Large Small Remarks
System size m3 336 76
Investment EUR 25,000 10,000
Annual production Nm3/a 20,775 6,125
Diesel fuel savings EUR/a 3,006 1,750
Fuelwood savings EUR/a 391 0 8 t/a @25 FCFA/kg
O&M costs EUR/a 750 300 3% of investment
Annual net income EUR/a 2,647 1,450
Payback period a 9.4 6.9
The results show that the smaller system is financially more attractive; the higher investment
costs (and O&M costs) for the larger system are not outweighed by the additional cost savings
from replacing more diesel. The replacement of fuelwood by excess biogas does not add much
to the total level of savings.
Technology requirements
The following main plant components would be required:
• Digester: fibre reinforced PVC bag installed in a cement block surrounded excavation, with
inlet and outlet
• Connection from distillery to digester, including an intermediate storage for allowing the
vinasse to cool down
• System for reducing H2S in the biogas, as required when using gas in engines, e.g. based
on iron oxide
• A connection of the biogas to the diesel engine (entry at air inlet manifold), with gas
counter
Risks
The potential risks are similar to those described in sections 6.2 and 6.4 above:
• Inconsistent vinasse quality which may result in lower gas production and may require
different (more complicated) biogas systems. An analysis of vinasse sample would be
required for ruling this out.
• Reduced distillery production, leading to reduced vinasse production, reduced biogas
production, and longer repayment period. A 20% reduction would increase repayment
periods to 12 and 8 years for the large and the small systems, respectively.
• System malfunctioning. Vinasse is not a standard biogas feedstock (such as e.g. cattle dung)
and system instabilities could occur. If they would, advice by a biogas specialist would most
likely be required which will be costly.
6.7 AGROGEBA Rice Factory
Mr. Oscar Figonetti
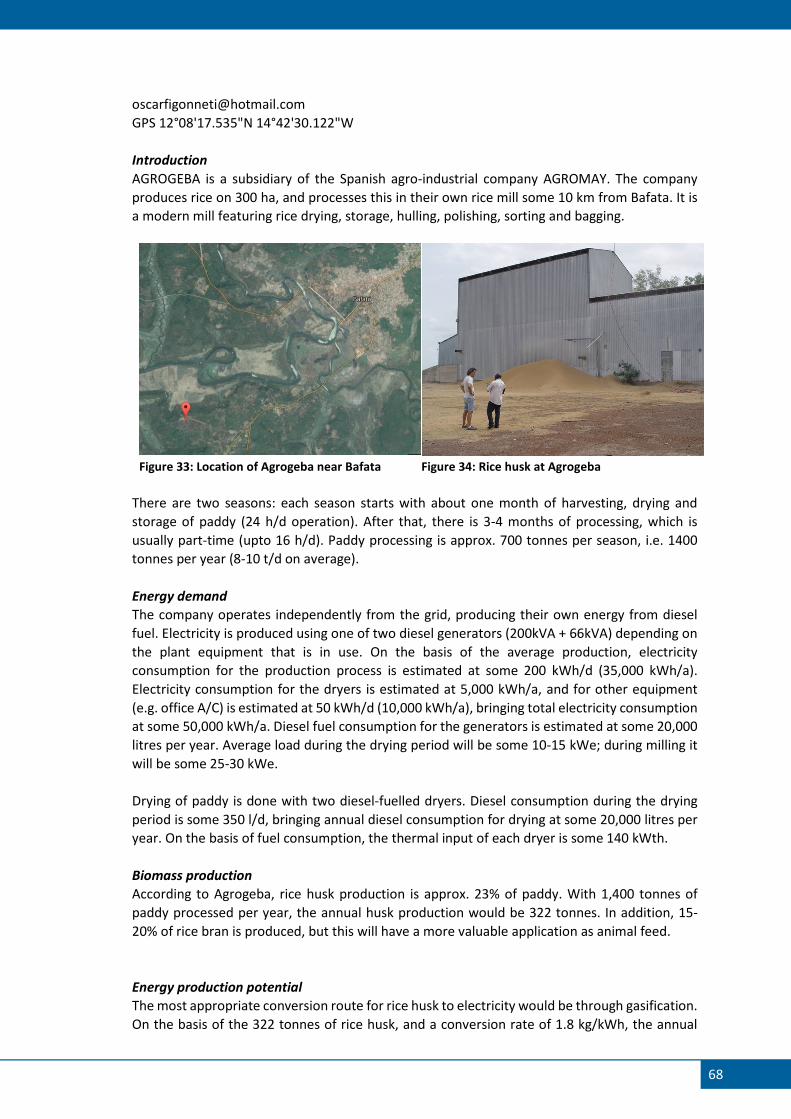
68
GPS 12°08'17.535"N 14°42'30.122"W
Introduction
AGROGEBA is a subsidiary of the Spanish agro-industrial company AGROMAY. The company
produces rice on 300 ha, and processes this in their own rice mill some 10 km from Bafata. It is
a modern mill featuring rice drying, storage, hulling, polishing, sorting and bagging.
Figure 33: Location of Agrogeba near Bafata Figure 34: Rice husk at Agrogeba
There are two seasons: each season starts with about one month of harvesting, drying and
storage of paddy (24 h/d operation). After that, there is 3-4 months of processing, which is
usually part-time (upto 16 h/d). Paddy processing is approx. 700 tonnes per season, i.e. 1400
tonnes per year (8-10 t/d on average).
Energy demand
The company operates independently from the grid, producing their own energy from diesel
fuel. Electricity is produced using one of two diesel generators (200kVA + 66kVA) depending on
the plant equipment that is in use. On the basis of the average production, electricity
consumption for the production process is estimated at some 200 kWh/d (35,000 kWh/a).
Electricity consumption for the dryers is estimated at 5,000 kWh/a, and for other equipment
(e.g. office A/C) is estimated at 50 kWh/d (10,000 kWh/a), bringing total electricity consumption
at some 50,000 kWh/a. Diesel fuel consumption for the generators is estimated at some 20,000
litres per year. Average load during the drying period will be some 10-15 kWe; during milling it
will be some 25-30 kWe.
Drying of paddy is done with two diesel-fuelled dryers. Diesel consumption during the drying
period is some 350 l/d, bringing annual diesel consumption for drying at some 20,000 litres per
year. On the basis of fuel consumption, the thermal input of each dryer is some 140 kWth.
Biomass production
According to Agrogeba, rice husk production is approx. 23% of paddy. With 1,400 tonnes of
paddy processed per year, the annual husk production would be 322 tonnes. In addition, 15-
20% of rice bran is produced, but this will have a more valuable application as animal feed.
Energy production potential
The most appropriate conversion route for rice husk to electricity would be through gasification.
On the basis of the 322 tonnes of rice husk, and a conversion rate of 1.8 kg/kWh, the annual
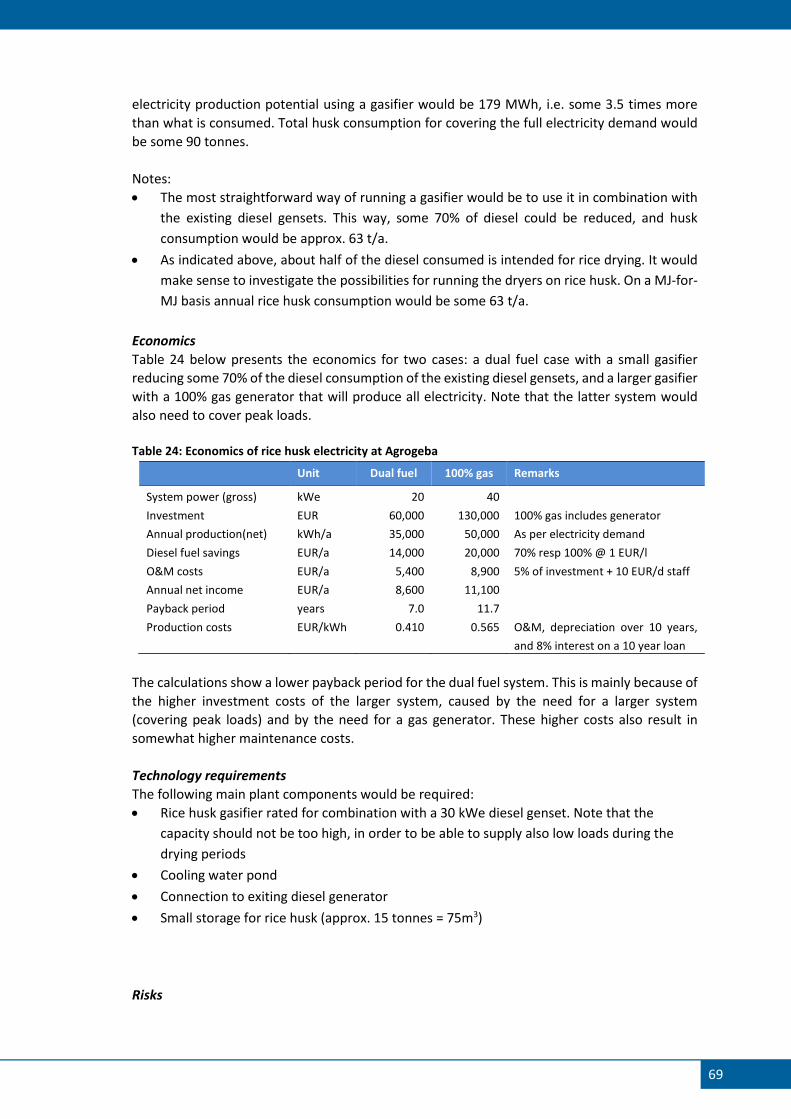
69
electricity production potential using a gasifier would be 179 MWh, i.e. some 3.5 times more
than what is consumed. Total husk consumption for covering the full electricity demand would
be some 90 tonnes.
Notes:
• The most straightforward way of running a gasifier would be to use it in combination with
the existing diesel gensets. This way, some 70% of diesel could be reduced, and husk
consumption would be approx. 63 t/a.
• As indicated above, about half of the diesel consumed is intended for rice drying. It would
make sense to investigate the possibilities for running the dryers on rice husk. On a MJ-for-
MJ basis annual rice husk consumption would be some 63 t/a.
Economics
Table 24 below presents the economics for two cases: a dual fuel case with a small gasifier
reducing some 70% of the diesel consumption of the existing diesel gensets, and a larger gasifier
with a 100% gas generator that will produce all electricity. Note that the latter system would
also need to cover peak loads.
Table 24: Economics of rice husk electricity at Agrogeba
Unit Dual fuel 100% gas Remarks
System power (gross) kWe 20 40
Investment EUR 60,000 130,000 100% gas includes generator
Annual production(net) kWh/a 35,000 50,000 As per electricity demand
Diesel fuel savings EUR/a 14,000 20,000 70% resp 100% @ 1 EUR/l
O&M costs EUR/a 5,400 8,900 5% of investment + 10 EUR/d staff
Annual net income EUR/a 8,600 11,100
Payback period years 7.0 11.7
Production costs EUR/kWh 0.410 0.565 O&M, depreciation over 10 years,
and 8% interest on a 10 year loan
The calculations show a lower payback period for the dual fuel system. This is mainly because of
the higher investment costs of the larger system, caused by the need for a larger system
(covering peak loads) and by the need for a gas generator. These higher costs also result in
somewhat higher maintenance costs.
Technology requirements
The following main plant components would be required:
• Rice husk gasifier rated for combination with a 30 kWe diesel genset. Note that the
capacity should not be too high, in order to be able to supply also low loads during the
drying periods
• Cooling water pond
• Connection to exiting diesel generator
• Small storage for rice husk (approx. 15 tonnes = 75m3)
Risks
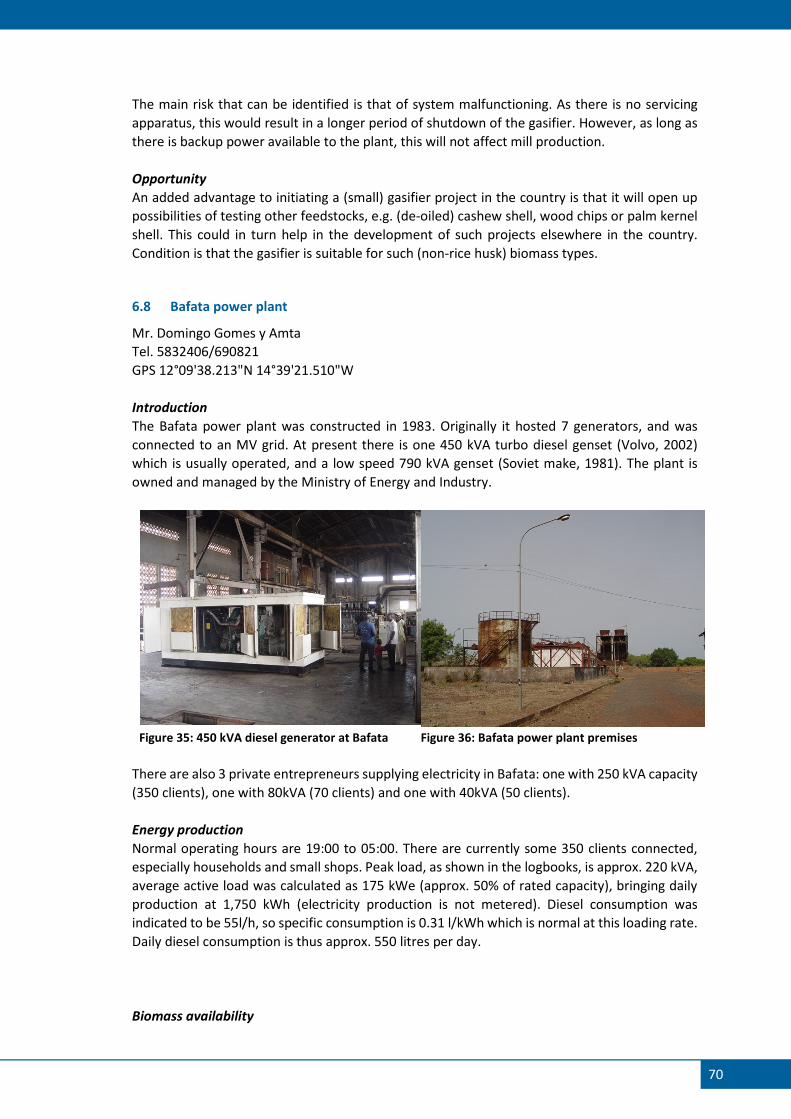
70
The main risk that can be identified is that of system malfunctioning. As there is no servicing
apparatus, this would result in a longer period of shutdown of the gasifier. However, as long as
there is backup power available to the plant, this will not affect mill production.
Opportunity
An added advantage to initiating a (small) gasifier project in the country is that it will open up
possibilities of testing other feedstocks, e.g. (de-oiled) cashew shell, wood chips or palm kernel
shell. This could in turn help in the development of such projects elsewhere in the country.
Condition is that the gasifier is suitable for such (non-rice husk) biomass types.
6.8 Bafata power plant
Mr. Domingo Gomes y Amta
Tel. 5832406/690821
GPS 12°09'38.213"N 14°39'21.510"W
Introduction
The Bafata power plant was constructed in 1983. Originally it hosted 7 generators, and was
connected to an MV grid. At present there is one 450 kVA turbo diesel genset (Volvo, 2002)
which is usually operated, and a low speed 790 kVA genset (Soviet make, 1981). The plant is
owned and managed by the Ministry of Energy and Industry.
Figure 35: 450 kVA diesel generator at Bafata Figure 36: Bafata power plant premises
There are also 3 private entrepreneurs supplying electricity in Bafata: one with 250 kVA capacity
(350 clients), one with 80kVA (70 clients) and one with 40kVA (50 clients).
Energy production
Normal operating hours are 19:00 to 05:00. There are currently some 350 clients connected,
especially households and small shops. Peak load, as shown in the logbooks, is approx. 220 kVA,
average active load was calculated as 175 kWe (approx. 50% of rated capacity), bringing daily
production at 1,750 kWh (electricity production is not metered). Diesel consumption was
indicated to be 55l/h, so specific consumption is 0.31 l/kWh which is normal at this loading rate.
Daily diesel consumption is thus approx. 550 litres per day.
Biomass availability
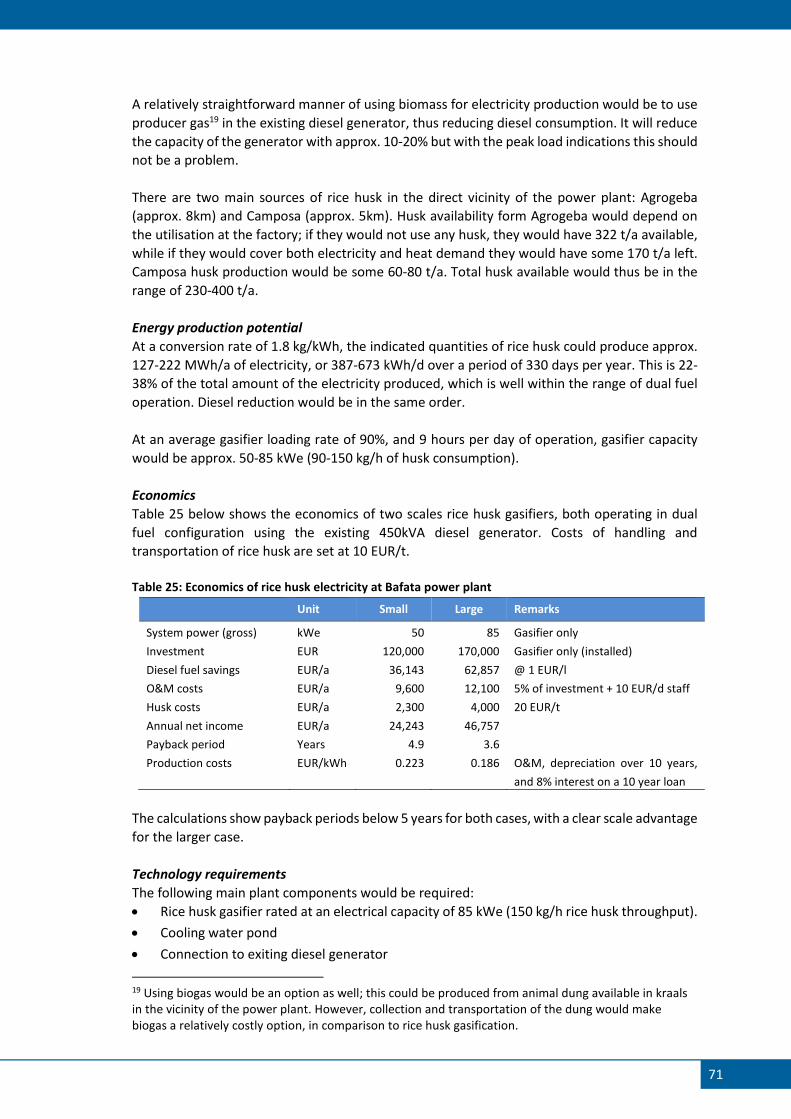
71
A relatively straightforward manner of using biomass for electricity production would be to use
producer gas19 in the existing diesel generator, thus reducing diesel consumption. It will reduce
the capacity of the generator with approx. 10-20% but with the peak load indications this should
not be a problem.
There are two main sources of rice husk in the direct vicinity of the power plant: Agrogeba
(approx. 8km) and Camposa (approx. 5km). Husk availability form Agrogeba would depend on
the utilisation at the factory; if they would not use any husk, they would have 322 t/a available,
while if they would cover both electricity and heat demand they would have some 170 t/a left.
Camposa husk production would be some 60-80 t/a. Total husk available would thus be in the
range of 230-400 t/a.
Energy production potential
At a conversion rate of 1.8 kg/kWh, the indicated quantities of rice husk could produce approx.
127-222 MWh/a of electricity, or 387-673 kWh/d over a period of 330 days per year. This is 22-
38% of the total amount of the electricity produced, which is well within the range of dual fuel
operation. Diesel reduction would be in the same order.
At an average gasifier loading rate of 90%, and 9 hours per day of operation, gasifier capacity
would be approx. 50-85 kWe (90-150 kg/h of husk consumption).
Economics
Table 25 below shows the economics of two scales rice husk gasifiers, both operating in dual
fuel configuration using the existing 450kVA diesel generator. Costs of handling and
transportation of rice husk are set at 10 EUR/t.
Table 25: Economics of rice husk electricity at Bafata power plant
Unit Small Large Remarks
System power (gross) kWe 50 85 Gasifier only
Investment EUR 120,000 170,000 Gasifier only (installed)
Diesel fuel savings EUR/a 36,143 62,857 @ 1 EUR/l
O&M costs EUR/a 9,600 12,100 5% of investment + 10 EUR/d staff
Husk costs EUR/a 2,300 4,000 20 EUR/t
Annual net income EUR/a 24,243 46,757
Payback period Years 4.9 3.6
Production costs EUR/kWh 0.223 0.186 O&M, depreciation over 10 years,
and 8% interest on a 10 year loan
The calculations show payback periods below 5 years for both cases, with a clear scale advantage
for the larger case.
Technology requirements
The following main plant components would be required:
• Rice husk gasifier rated at an electrical capacity of 85 kWe (150 kg/h rice husk throughput).
• Cooling water pond
• Connection to exiting diesel generator
19 Using biogas would be an option as well; this could be produced from animal dung available in kraals in the vicinity of the power plant. However, collection and transportation of the dung would make biogas a relatively costly option, in comparison to rice husk gasification.
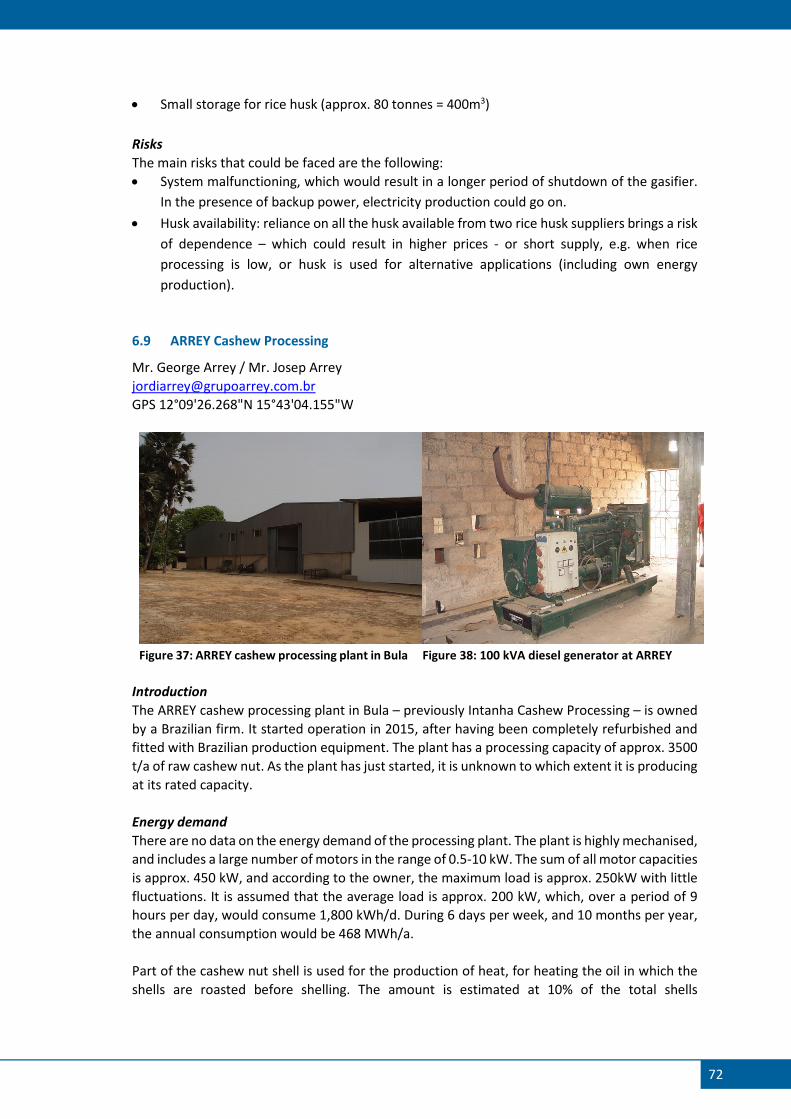
72
• Small storage for rice husk (approx. 80 tonnes = 400m3)
Risks
The main risks that could be faced are the following:
• System malfunctioning, which would result in a longer period of shutdown of the gasifier.
In the presence of backup power, electricity production could go on.
• Husk availability: reliance on all the husk available from two rice husk suppliers brings a risk
of dependence – which could result in higher prices - or short supply, e.g. when rice
processing is low, or husk is used for alternative applications (including own energy
production).
6.9 ARREY Cashew Processing
Mr. George Arrey / Mr. Josep Arrey
GPS 12°09'26.268"N 15°43'04.155"W
Figure 37: ARREY cashew processing plant in Bula Figure 38: 100 kVA diesel generator at ARREY
Introduction
The ARREY cashew processing plant in Bula – previously Intanha Cashew Processing – is owned
by a Brazilian firm. It started operation in 2015, after having been completely refurbished and
fitted with Brazilian production equipment. The plant has a processing capacity of approx. 3500
t/a of raw cashew nut. As the plant has just started, it is unknown to which extent it is producing
at its rated capacity.
Energy demand
There are no data on the energy demand of the processing plant. The plant is highly mechanised,
and includes a large number of motors in the range of 0.5-10 kW. The sum of all motor capacities
is approx. 450 kW, and according to the owner, the maximum load is approx. 250kW with little
fluctuations. It is assumed that the average load is approx. 200 kW, which, over a period of 9
hours per day, would consume 1,800 kWh/d. During 6 days per week, and 10 months per year,
the annual consumption would be 468 MWh/a.
Part of the cashew nut shell is used for the production of heat, for heating the oil in which the
shells are roasted before shelling. The amount is estimated at 10% of the total shells
73
generated20, which comes down to 3,800 GJ/a of primary energy. The average power of the
heating system would be approx. 300 kWth.
Electricity demand in the area is mainly in the town of Bula, some 7km from the factory; there
are several smaller communities nearer by but the demand will typically be a few kW. Bula has
some 1000 households; with half of them connected, consuming 1 kWh/d during evening hours,
daily consumption would be some 500 kWh/d or 166 MWh/a; average load would be approx.
80kWe.
Biomass availability
Arrey company indicated cashew shell production rates of approx. 200 tonnes per month.
Assuming production during 10 months per year, total annual shell production would be 2,000
t/a. With 10% used for heat production, the amount available for electricity production is 1,800
t/a.
Energy production potential
The net calorific value of de-oiled cashew net shell was estimated at 19 MJ/kg. The available
primary energy is 34,200 GJ/a.
The electricity production potential greatly depends on the chosen technology:
• With steam engine technology, with a net efficiency of 5%, the available shell could produce
475 MWh/a. This would be just enough for covering the full electricity demand of the
cashew processing plant. The average net power during operating hours would be 203kWe.
Required gross power would be 250-300kWe.
• With gasification technology, with a net efficiency of 15%, the available shell could produce
1,425 MWh/a, some three times more than plant consumption and still more than twice
the demand at the plant and the town of Bula.
Gasification could be done in different scales and configurations. It would be possible to cover
the full electricity demand of the plant with a 250-300 kWe system including a gas generator
set. Drawback is that such a system would not operate very well at lower loads, i.e. at the 80kW
required in Bula. In order to produce electricity for the town, a second gasifier plant would most
likely be a better option; it would also omit the need for a 7km MV line between the factory and
the town.
It is also possible to operate a gasifier in combination with an existing diesel generator, in dual
fuel mode. This could then be a gasifier with 150 kWe capacity, or a smaller one (e.g. a 50kWe
set reducing diesel consumption with 25%.
Note that there is not much experience with gasification of cashew shell, which makes the
project experimental / innovative / risky.
Economics
Table 26 below presents the economics of different options for electricity production with
cashew shell at the Bula factory:
• Steam engine technology
20 Based on the shell consumtption at Intanha processing plant.
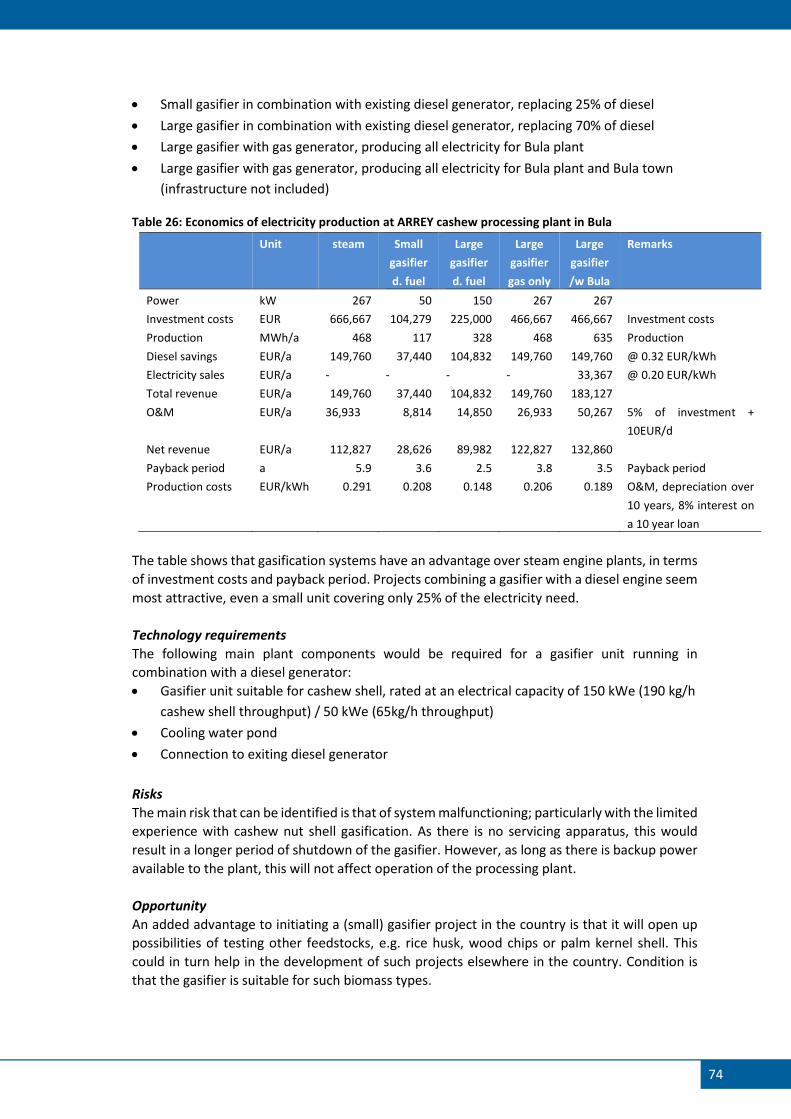
74
• Small gasifier in combination with existing diesel generator, replacing 25% of diesel
• Large gasifier in combination with existing diesel generator, replacing 70% of diesel
• Large gasifier with gas generator, producing all electricity for Bula plant
• Large gasifier with gas generator, producing all electricity for Bula plant and Bula town
(infrastructure not included)
Table 26: Economics of electricity production at ARREY cashew processing plant in Bula
Unit steam Small
gasifier
d. fuel
Large
gasifier
d. fuel
Large
gasifier
gas only
Large
gasifier
/w Bula
Remarks
Power kW 267 50 150 267 267
Investment costs EUR 666,667 104,279 225,000 466,667 466,667 Investment costs
Production MWh/a 468 117 328 468 635 Production
Diesel savings EUR/a 149,760 37,440 104,832 149,760 149,760 @ 0.32 EUR/kWh
Electricity sales EUR/a - - - - 33,367 @ 0.20 EUR/kWh
Total revenue EUR/a 149,760 37,440 104,832 149,760 183,127
O&M EUR/a 36,933 8,814 14,850 26,933 50,267 5% of investment +
10EUR/d
Net revenue EUR/a 112,827 28,626 89,982 122,827 132,860
Payback period a 5.9 3.6 2.5 3.8 3.5 Payback period
Production costs EUR/kWh 0.291 0.208 0.148 0.206 0.189 O&M, depreciation over
10 years, 8% interest on
a 10 year loan
The table shows that gasification systems have an advantage over steam engine plants, in terms
of investment costs and payback period. Projects combining a gasifier with a diesel engine seem
most attractive, even a small unit covering only 25% of the electricity need.
Technology requirements
The following main plant components would be required for a gasifier unit running in
combination with a diesel generator:
• Gasifier unit suitable for cashew shell, rated at an electrical capacity of 150 kWe (190 kg/h
cashew shell throughput) / 50 kWe (65kg/h throughput)
• Cooling water pond
• Connection to exiting diesel generator
Risks
The main risk that can be identified is that of system malfunctioning; particularly with the limited
experience with cashew nut shell gasification. As there is no servicing apparatus, this would
result in a longer period of shutdown of the gasifier. However, as long as there is backup power
available to the plant, this will not affect operation of the processing plant.
Opportunity
An added advantage to initiating a (small) gasifier project in the country is that it will open up
possibilities of testing other feedstocks, e.g. rice husk, wood chips or palm kernel shell. This
could in turn help in the development of such projects elsewhere in the country. Condition is
that the gasifier is suitable for such biomass types.
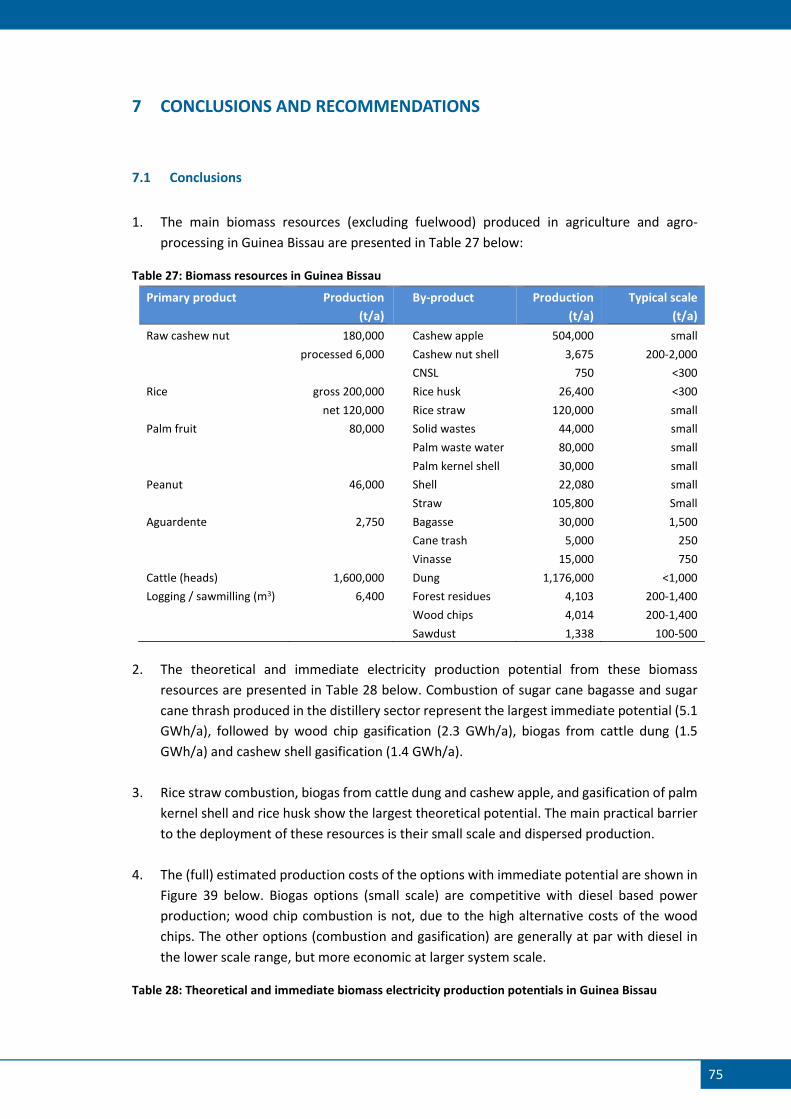
75
7 CONCLUSIONS AND RECOMMENDATIONS
7.1 Conclusions
1. The main biomass resources (excluding fuelwood) produced in agriculture and agro-
processing in Guinea Bissau are presented in Table 27 below:
Table 27: Biomass resources in Guinea Bissau
Primary product Production
(t/a)
By-product Production
(t/a)
Typical scale
(t/a)
Raw cashew nut 180,000 Cashew apple 504,000 small
processed 6,000 Cashew nut shell 3,675 200-2,000
CNSL 750 <300
Rice gross 200,000 Rice husk 26,400 <300
net 120,000 Rice straw 120,000 small
Palm fruit 80,000 Solid wastes 44,000 small
Palm waste water 80,000 small
Palm kernel shell 30,000 small
Peanut 46,000 Shell 22,080 small
Straw 105,800 Small
Aguardente 2,750 Bagasse 30,000 1,500
Cane trash 5,000 250
Vinasse 15,000 750
Cattle (heads) 1,600,000 Dung 1,176,000 <1,000
Logging / sawmilling (m3) 6,400 Forest residues 4,103 200-1,400
Wood chips 4,014 200-1,400
Sawdust 1,338 100-500
2. The theoretical and immediate electricity production potential from these biomass
resources are presented in Table 28 below. Combustion of sugar cane bagasse and sugar
cane thrash produced in the distillery sector represent the largest immediate potential (5.1
GWh/a), followed by wood chip gasification (2.3 GWh/a), biogas from cattle dung (1.5
GWh/a) and cashew shell gasification (1.4 GWh/a).
3. Rice straw combustion, biogas from cattle dung and cashew apple, and gasification of palm
kernel shell and rice husk show the largest theoretical potential. The main practical barrier
to the deployment of these resources is their small scale and dispersed production.
4. The (full) estimated production costs of the options with immediate potential are shown in
Figure 39 below. Biogas options (small scale) are competitive with diesel based power
production; wood chip combustion is not, due to the high alternative costs of the wood
chips. The other options (combustion and gasification) are generally at par with diesel in
the lower scale range, but more economic at larger system scale.
Table 28: Theoretical and immediate biomass electricity production potentials in Guinea Bissau
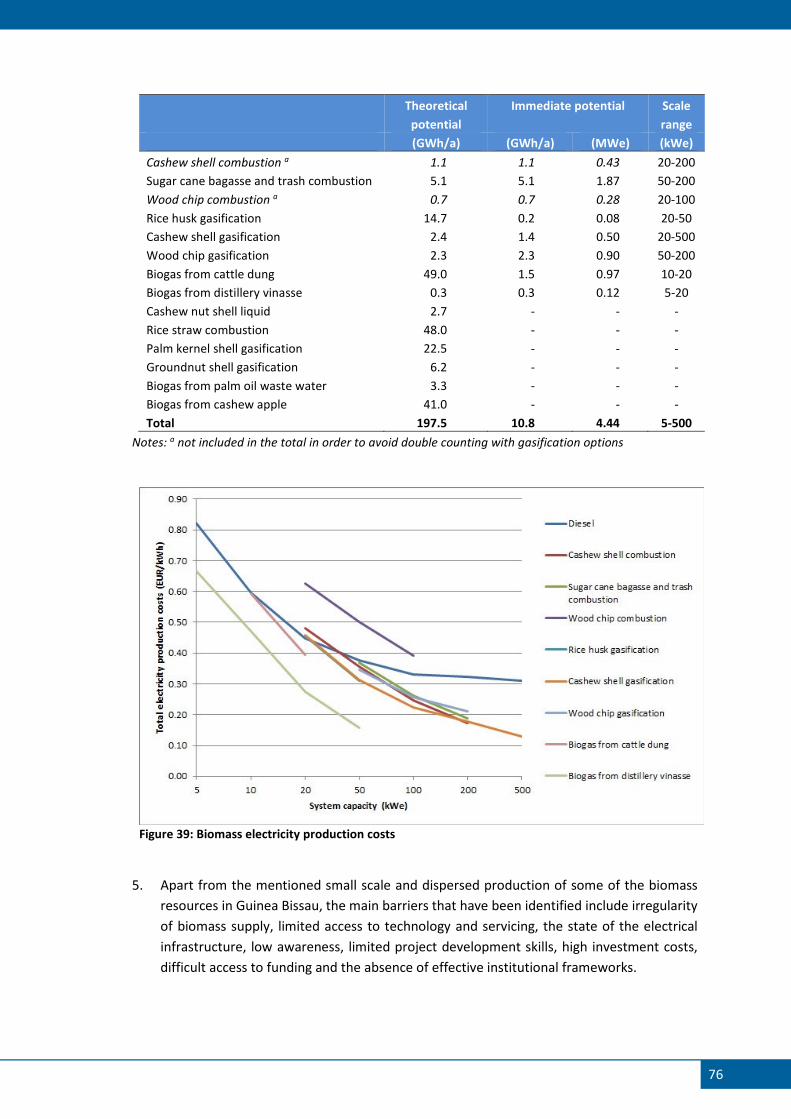
76
Theoretical
potential
Immediate potential Scale
range
(GWh/a) (GWh/a) (MWe) (kWe)
Cashew shell combustion a 1.1 1.1 0.43 20-200
Sugar cane bagasse and trash combustion 5.1 5.1 1.87 50-200
Wood chip combustion a 0.7 0.7 0.28 20-100
Rice husk gasification 14.7 0.2 0.08 20-50
Cashew shell gasification 2.4 1.4 0.50 20-500
Wood chip gasification 2.3 2.3 0.90 50-200
Biogas from cattle dung 49.0 1.5 0.97 10-20
Biogas from distillery vinasse 0.3 0.3 0.12 5-20
Cashew nut shell liquid 2.7 - - -
Rice straw combustion 48.0 - - -
Palm kernel shell gasification 22.5 - - -
Groundnut shell gasification 6.2 - - -
Biogas from palm oil waste water 3.3 - - -
Biogas from cashew apple 41.0 - - -
Total 197.5 10.8 4.44 5-500
Notes: a not included in the total in order to avoid double counting with gasification options
Figure 39: Biomass electricity production costs
5. Apart from the mentioned small scale and dispersed production of some of the biomass
resources in Guinea Bissau, the main barriers that have been identified include irregularity
of biomass supply, limited access to technology and servicing, the state of the electrical
infrastructure, low awareness, limited project development skills, high investment costs,
difficult access to funding and the absence of effective institutional frameworks.
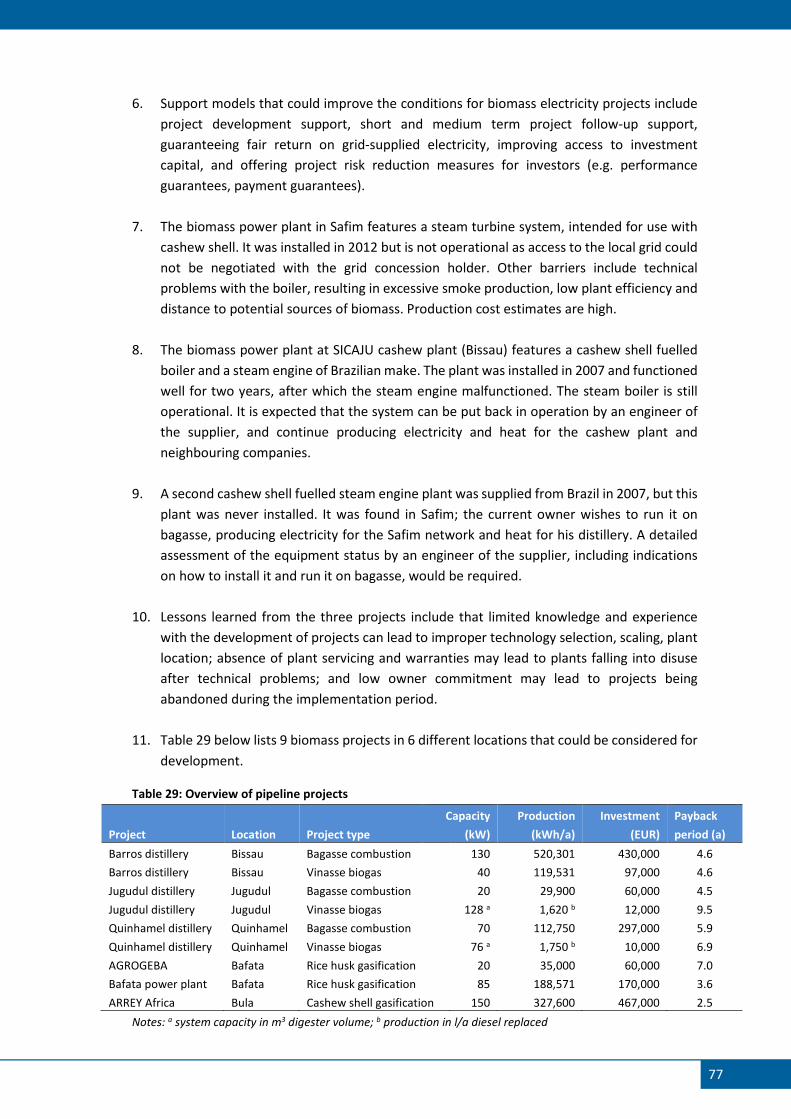
77
6. Support models that could improve the conditions for biomass electricity projects include
project development support, short and medium term project follow-up support,
guaranteeing fair return on grid-supplied electricity, improving access to investment
capital, and offering project risk reduction measures for investors (e.g. performance
guarantees, payment guarantees).
7. The biomass power plant in Safim features a steam turbine system, intended for use with
cashew shell. It was installed in 2012 but is not operational as access to the local grid could
not be negotiated with the grid concession holder. Other barriers include technical
problems with the boiler, resulting in excessive smoke production, low plant efficiency and
distance to potential sources of biomass. Production cost estimates are high.
8. The biomass power plant at SICAJU cashew plant (Bissau) features a cashew shell fuelled
boiler and a steam engine of Brazilian make. The plant was installed in 2007 and functioned
well for two years, after which the steam engine malfunctioned. The steam boiler is still
operational. It is expected that the system can be put back in operation by an engineer of
the supplier, and continue producing electricity and heat for the cashew plant and
neighbouring companies.
9. A second cashew shell fuelled steam engine plant was supplied from Brazil in 2007, but this
plant was never installed. It was found in Safim; the current owner wishes to run it on
bagasse, producing electricity for the Safim network and heat for his distillery. A detailed
assessment of the equipment status by an engineer of the supplier, including indications
on how to install it and run it on bagasse, would be required.
10. Lessons learned from the three projects include that limited knowledge and experience
with the development of projects can lead to improper technology selection, scaling, plant
location; absence of plant servicing and warranties may lead to plants falling into disuse
after technical problems; and low owner commitment may lead to projects being
abandoned during the implementation period.
11. Table 29 below lists 9 biomass projects in 6 different locations that could be considered for
development.
Table 29: Overview of pipeline projects
Project Location Project type
Capacity
(kW)
Production
(kWh/a)
Investment
(EUR)
Payback
period (a)
Barros distillery Bissau Bagasse combustion 130 520,301 430,000 4.6
Barros distillery Bissau Vinasse biogas 40 119,531 97,000 4.6
Jugudul distillery Jugudul Bagasse combustion 20 29,900 60,000 4.5
Jugudul distillery Jugudul Vinasse biogas 128 a 1,620 b 12,000 9.5
Quinhamel distillery Quinhamel Bagasse combustion 70 112,750 297,000 5.9
Quinhamel distillery Quinhamel Vinasse biogas 76 a 1,750 b 10,000 6.9
AGROGEBA Bafata Rice husk gasification 20 35,000 60,000 7.0
Bafata power plant Bafata Rice husk gasification 85 188,571 170,000 3.6
ARREY Africa Bula Cashew shell gasification 150 327,600 467,000 2.5
Notes: a system capacity in m3 digester volume; b production in l/a diesel replaced
78
7.2 Recommendations
1. On the immediate term, the existing steam engine power plants in Guinea Bissau could
benefit from a TA mission of Benecke engineer; the SICAJU installation could be put back in
operation, and the installation plant at Nova Sabi in Safim could be planned. It is however
advisable to ensure that the SICAJU processing plant is operating before the mission is
planned. Also, first negotiations between Nova Sabi and Agrosafim (grid concession holders
in Safim) on grid supply should be started.
2. In connection to the TA mission, a training program for operators and other specialists in
the country should be considered in order to help create the technical expertise required
for future problem solving.
3. Further, it is recommended to proceed with the further development of pipeline projects,
particularly feasibility studies on electricity production from cashew shell at the Arrey
cashew processing plant and rice husk gasification at AGROGEBA in Bafata.
4. The distillery sector shows serious opportunities for biomass electricity development, from
vinasse and (especially) from bagasse and cane trash. Further assessments in this sector are
recommended, including verification of the annual production, the energy use, and the
properties of vinasse (at least COD, solids, carbon and nitrogen contents).
5. Identification of biogas projects in Bafata or Gabu regions. In these regions there are large
quantities of livestock, including owners with large herds (>100 heads); there should be
ample locations where energy demand (for households and productive uses, e.g. rice
milling) can be met with biogas from cattle dung. Appropriate scale would be 10-20kW
(~50-100 households), to be fed with the dung from approx. 500 heads of cattle.
6. For projects that make it to implementation, it is recommended to include a longer period
of project monitoring, developing monitoring protocols and assuring regular collection,
analysis and dissemination of the project results. These activities could be carried out by
e.g. ECREEE and the Ministry of Energy and Industry.
79
References
Adigbli K.E. (2012) Sénégal: Le village de Kalom se dote d'une centrale électrique à base de
résidus végétaux. http://www.nextafrique.com/innovation/agriculture-bioenergie/2052-
senegal-le-village-de-kalom-se-dote-d-une-centrale-electrique-a-base-de-residus-vegetaux, last
accessed 21 July 2015.
Akinhanmi T.F., Atasie V.N. and Akintokun P.O. (2008) Chemical Composition and
Physicochemical Properties Of Cashew nut (Anacardium occidentale) Oil and Cashewnut Shell
Liquid.
Alberto Tsamba, A., Yang W. and Blasiak W. (2006) Pyrolysis characteristics and global kinetics
of coconut and cashew nut shells.
ANCA (2015) Personal communication with Dr. Mario Pereira Batista Djop and Mr Adoulai So of
ANCA, 10 June 2015.
Baez-Smith C. (2006) Anaerobic Digestion of Vinasse for Production of Methane in the Sugar
Cane Distillery.
Balde D., Embalo A., Embalo A.I., Roberto F. and Balde A. (2015) Personal communications with
Messrs. Dadina Balde (president), Aliu Embalo (vice-president), Aledje Iaia Embalo (secretaire),
Filomeno Roberto (Contibuel branch) and Aliu Balde (vet), Association des Eleveurs de Bafata,
11-12 June 2015.
Bhoi P.R., Singh R.N., Sharma A.M. and Patel S.R. (2005) Performance evaluation of open core
gasifier on multi-fuels.
Bioenergyconsult (2015) Rice Straw As Bioenergy Resource. Last accessed 01 July 2015.
http://www.bioenergyconsult.com/rice-straw-as-bioenergy-resource/
CABIRA/BCP (2013) Etude du plan Directeur Energie et d'un plan de développement des
infrastructures pour la production et distribution d'électricité: rapport définitif du potentiel
énergétique.
Cardochem (2015) Cashew Shell Cake. Overview of cashew shell cake properties.
http://www.cardochem.com/cscake.html accessed on 26 June 2015.
Cerqueira L., Edye L.A., Wegener M.K., Scarpare F. and Renouf M.A. (2013) Optimising Sugarcane
Trash Management for Biofuels Production in Australia and Brazil.
Chamy, R. (2004) Project for the electrical cogeneration in a distillery industry: Capel case
http://www.bioenergy-lamnet.org/publications/source/chile/WG1-6-LAMNET-Chile-1104-
Chamy.pdf.
Correia, F. (2015) Personal communication with Mr. Florentine Correia, DG Elevage, 08 June
2015.
De Amarante, T. (2015) Personal communication with Mr. Travares de Amarante, DG
Agriculture, 4 June 2015.

80
De Silva, J.A. (2015) Personal communication with Mr. Joao Antonio de Silva, coordinator of
PURSEA/PUASSE/PATSIE projects (World Bank), 3 June 2015.
Djata, H. (2015) Personal communication with Dr Hipolito Djata, DG Forets et Chasse, 2 June
2015.
EAGB (2015) Personal communication with EAGB Bissau technical management, 9 June 2015.
ECREEE (2013) Study report on novel bioenergy crop potential in the ECOWAS region.
España-Gamboa E.I., Mijangos-Cortés J.O., Hernández-Zárate G., Domínguez Maldonado J.A.
and Alzate-Gaviria L.M. (2012) Methane production by treating vinasses from hydrous ethanol
using a modified UASB reactor.
FAOSTAT (2015) FAOSTAT database, last accessed 30 June 2015. http://faostat.fao.org
FAO (1990) Energy conservation in the mechanical forest industries.
http://www.fao.org/docrep/t0269e/t0269e00.htm#Contents.
FAO (2007) Factsheet: rice & climate change.
http://www.fao.org/fileadmin/templates/agphome/documents/Rice/rice_fact_sheet.pdf.
Franco H.C.J., Pimenta M.T.B., Carvalho J.L.N., Magalhães P.S.G., Rossell C.E.V., Braunbeck O.A.,
Vitti A.C., Kölln O.T. and Neto J.S. (2013) Assessment of sugarcane trash for agronomic and
energy purposes in Brazil.
Frederiks B. (2015) Support to Renewable Energy Sector of SNV DRC (unpublished).
Ghani W.A.W.A.K., Moghadam R.A., Salleh M.A.M. and Alias, A.B. (2009) Air Gasification of
Agricultural Waste in a Fluidized Bed Gasifier: Hydrogen Production Performance.
Global Timber (2015) Imports of logs from Guinea-Bissau declared by China. Last accessed 07
July 2015. http://www.globaltimber.org.uk/guineabissau.htm.
Gomes y Amta, D. (2015) Personal communication with Mr. Domingo Gomes y Amta, Bafata
power plant manager, 12 June 2015.
Hassuani S.J., Lima Verde Leal M.R. and de Carvalho Macedo I. (2005) Biomass power generation
- Sugar cane bagasse and trash.
Intanha (2015) Personal communication with Mr. Martinho Arrogeiro, owner of Intanha cashew
processing company, 8 June 2015.
Jackson H.L. & E.J. Mtengeti (2005) Assessment of animal manure production, management and
utilization in Southern Highlands of Tanzania.
Jenkins B.M., Baxter L.L. , Miles jr T.R. and Miles T.R. (1998) Combustion properties of biomass.
81
Kyle, S. (2015) Rice Sector Policy Options in Guinea Bissau - Working Paper. Cornell University,
Ithaca, New York USA.
Liu Z., Xu A. and Zhao T. (2011) Energy from Combustion of Rice Straw: Status and Challenges to
China.
MADER/GPSCA (2002) Cashew Apple Brandy: preliminary business plan. Downloaded from
http://www.anacardium.info/IMG/pdf/cashewapple.pdf.
Morrison A.K. and Heijndermans E. (2013) Palm Kernel Oil Production Process Characterization.
MARVEMEC (2015) Personal communication with Mr. Pedro Batista, owner of MARVEMEC, 1
June 2015.
Nova Sabi (2015) Personal communication with representatives from Nova Sabi in Safim, 9 June
2015.
NOVIS (2015) Inauguration of the project "Stadtwerke schaffen Dorfwerke" in Kalom, Senegal.
http://www.novis.de, last accessed 21 July 2015.
Pachero de Carvalho, B.R. and Mendes, H.M. (2015) Cashew Chain Value in Guiné-Bissau:
Challenges and Contributions for Food Security (A Case Study for Guiné-Bissau). Downloaded
from http://centmapress.ilb.uni-bonn.de/ojs/index.php/proceedings/article/viewFile/456/451.
Palvannan V. (2012) Experimental investigation of cashew hut shell liquid as alternative fuel in
DI and IDI compression ignition engines.
Phyllis (2015) ECN Database for biomass and waste. Last accessed 01 July 2015.
https://www.ecn.nl/phyllis2/
Prasada S.A.R. (2014) A Review on CNSL Biodiesel as an Alternative fuel for Diesel Engine.
Radhakrrishnan S., Thamodharan C. and Senthilnathan N. (2014) Evaluating performance and
emission characteristics of C.I. engine run by cashew nut shell liquid (CNSL) as a Fuel.
Raimundo C., Raul J.A., Clavin M.F. (2014) Creation of an enabling environment for small to
medium scale renewable energy investments in the electricity sector. Pre-Feasibility Study:
GCAII, Bula Cashew Processing Plant.
Rajeesh S., Prakash S.V., and Kulkarni, G.V. (2014) Performance Analysis of Diesel Engine Using
Cashew Nut Shell Liquid (CNSL) Biodiesel and Cashew Nut Shell Liquid (CNSL) blended with
ethanol as a alternative fuel.
Ramanan M.V. (2008) Some studies on cashew nut char and dual fuelling of cashew shell char
based producer gas.
Raul, J.A. (2015) Personal communications with Mr. Julio Antonia Raul, Director of Renewable
Energy at the Ministry of Energy and Industry, 1-13 June 2015.
82
Rodrigues F.H.A., Franca F.C.F., Souza J.R.R., Ricardo N.M.P.S. and Feitosa, J.P.A. (2011)
Comparison between physico-chemical properties of the technical Cashew Nut Shell Liquid
(CNSL) and those natural extracted from solvent and pressing. Polímeros [online]. 2011, vol.21,
n.2, pp. 156-160. Epub May 13, 2011. ISSN 0104-1428.
http://www.scielo.br/pdf/po/v21n2/AOP_0737.pdf.
Said M.M., John G.R., Mhilu C.F. and Manyele S.V. (2014) Analysis of Pyrolysis Kinetic and Energy
Content of Agricultural and Forest Waste.
Shrestha, R.B. and Alenyorege B. (2008) Physical Feasibility of Domestic Biogas in the Upper East
Region of Ghana: A report prepared for SNV Ghana, Northern Portfolio.
SICAJU (2015) Personal communication with Mr. José Rodrigues Santy, manager of the SICAJU
cashew processing company, 10 June 2015.
Singh R.N., Jena U., Patel J.B., Sharma A.M. (2005) Feasibility study of cashew nut shells as an
open core gasifier feedstock.
Sivakumar S., Venkatachalam R., Nedunchezhian N., Sivakumar P. and Rajendran P. (2014)
Processing of cashew nut shell and feasibility of its oil as bio fuel in compression ignition engine.
SNV (2014) Personal communication with Mr. Erik Boonstoppel and Mr. Fernandez Adikpeto of
SNV Burkina Faso, 29 August 2014 and 02 September 2014.
Solanki & Bhatti (2012) Observing performance of Cashew Nut Shell Liquid as fuel and study of
its emission characteristics.
Stahl R. and Ramadan A.B. (2007) Fuels and Chemicals from Rice Straw in Egypt.
TESE (2015) Personal communication with Ms. S. Dourado of TESE (Bafata), 12 June 2015.
Tsamba A.J. (2008) Fundamental study of two selected tropical biomass for energy: coconut and
cashew nut shells. http://www.diva-portal.org/smash/get/diva2:25243/FULLTEXT01.pdf.
Uamusse M.M., Persson K.M., Tsamba A.J. (2014) Gasification of Cashew Nut Shell Using Gasifier
Stove in Mozambique.
UNIDO (2014) Promoting investments in small to medium scale renewable energy technologies
in the electricity sector: Request for GEF CEO Endorsement (unpublished).
USDA (2015) Rice production data for Guinea Bissau, last accessed on 01 July 2015.
http://www.agrochart.com/en/usda/section/14/rice/country/113/guinea-
bissau/attribute/180/rough-production/.
Velmurugan A. and Loganathan M. (2011) Performance and Emission Characteristics of a DI
Diesel Engine Fuelled with Cashew Nut Shell Liquid (CNSL)-Diesel Blends.
Venture Renewables (2015) cashew nut. Description of cashew nut shell attributes.
http://www.venturerenewable.com/our-products/cashew-nut.html accessed on 26 June 2015.

83
http://www.gbissau.org/wp2013/en/blog/2013/08/02/producao-oleo-de-palma/
http://issuu.com/imvf/docs/manual_oleo_palma