2006wind tunnel hotwire measurements
TRANSCRIPT
Wind tunnel hotwire measurements, flow visualization
and thrust measurement of a VAWT in skew
Carlos Ferreira ∗
Delft University of Technology, Delft, 2629 HS, The Netherlands
Gijs van Kuik †and Gerard van Bussel ‡
Delft University of Technology, Delft, 2629 HS, The Netherlands
The results of experimental research on the wake and induced incoming flow on a verticalaxis wind turbine (VAWT) in skew are presented. The previous research on VAWTs inskew is limited since this operation mode has only been found too be significant until nowin the operation of VAWTs in the built environment. The published results contain hotwiremeasurements in the incoming flow and the wake of the VAWT for non-skewed and skewedflow. Due to the high sampling rate, the data allows the effects of blade passing to beidentified. Flow visualization of the tip vortices is also presented. Thrust measurements ofthe rotor were performed in order to understand the effect of skew in thrust variation andto compare with analytical predictions.
Nomenclature
D Rotor diameter, mH Rotor height, mx, y, zCartesian coordinate system, reference frame of the wind tunnel ,mx′, z′ Cartesian coordinate system, reference frame of the wind tunnel,
corresponding to x,y,z rotated about y by the skew angle , mT Period of rotation of the turbine, sU Wind speed, m/sλ Tip speed ratioCT Thrust coefficientCq Torque coefficient
I. Introduction
The development of wind energy in the built environment is today a growing industry with severalsmall companies developing different designs of wind energy conversion systems (WECSs) and an increasingnumber of architects wanting to implement them in the building concepts. Previous work has been donein the research and development of using vertical axis wind turbines (VAWT) in the built environment forelectricity generation, but the analysis of the complex aerodynamics of WECSs in the built environment isstill far from mature. The VAWT concept presented several advantages in the built environment, mainlyits insensitivity to yaw. On the roof of a building, a WECS must operate in flow in both yaw and skewconditions. For an horizontal wind turbine (HAWT) skew and yaw angles have similar effects;this is nottrue for a VAWT, due to its tri-dimensionality and the fact that the axis of rotation is perpendicular to theflow direction. The previous research on VAWTs was always performed under the assumption that the flowdirection would be perpendicular to the rotation axis of the VAWT. This is true for VAWTs placed in open
∗PhD Student, Faculty of Aerospace Engineering, Kluyverweg 1, 2629 HS, Delft, The Netherlands, No Member.†Professor, Faculty of Aerospace Engineering, Kluyverweg 1, 2629 HS, Delft, The Netherlands, No member.‡Associate Professor, Faculty of Aerospace Engineering, Kluyverweg 1, 2629 HS, Delft, The Netherlands, No member.
1 of 21
American Institute of Aeronautics and Astronautics
44th AIAA Aerospace Sciences Meeting and Exhibit9-12 January 2006, Reno, Nevada
AIAA 2006-1368
Copyright © 2006 by the author(s). Published by the American Institute of Aeronautics and Astronautics, Inc., with permission.
fields; it is not generally true however, for turbines placed on the top of buildings. To start understandingthe physics of the VAWT in skew, experimental work proves to be invaluable. In order to develop modelsthat will in the future bring a deeper understanding of the physics of the VAWT in skew, it is necessary toobtain experimental data that will allow the validation of those models. Mertens1 showed that a VAWT inthe built environment will operate in conditions of skewed flow and that, in a certain range of skew angles,the power output of the turbine is higher than in the non-skewed flow case. These conditions pose a newfield of research in the aerodynamics of the VAWTs and prove to be particulary important for the design ofwind turbines for the built environment.
The experimental work now developed has two main objectives:
• to qualitatively describe the dynamics of the flow and some of the main effects of skew on the flowbehavior
• to develop a database of measurements that can be used for the validation of numerical models,especially free vortex models.
Three different techniques were used to observe/measure the flow and performance variation with skew:
• smoke visualization of the tip vortex expansion
• hotwire measurements of the flow upwind the rotor, in the rotor and downwind the rotor
• thrust force measurement of the VAWT to determine its variation with skew angle
The tip vortex visualizations are important to help understand the interaction of the wakes of the twoblades, especially the interaction between tip vortices generated upwind of the axis of rotation and the bladesas they pass downwind of the axis of rotation. The expansion of the tip vortices is particulary importantto validate free wake vortex models, since one of the regions most susceptible to numerical error is the tipvortex.
The measurements with the hotwires allow, due to its sample rate, an instant by instant visualizationof the generation of the wake and its development, for the non-skewed and skewed flow case. In the highlyskewed flow case (skew angle of 30◦) it is particulary interesting to see the downwind wake subdivided intoregions as a result of the flow being crossed in some areas by one blade passage and in others by three bladepassages.
In the work of Mertens1 experimental results for the variation of power, tip speed ratio and torque withskew angle for a H-Darrieus were presented. However, the variation of thrust with skew angle was notdetermined. It was reasonable to assume that the variation in thrust would follow the same tendency as thevariation in torque. In this experimental work that assumption is confirmed.
II. Experimental Setup
A. The Wind Tunnel
The experimental work was performed in the Open Jet Facility of the Delft University of Technology. Theopen jet wind tunnel has a diameter of 2.24m. The maximum wind speed is 14.5m/s and the turbulencelevel is in the 1.2-1.7% range, at the 7m/s wind speed used during the experimental work.
B. The Turbine Model
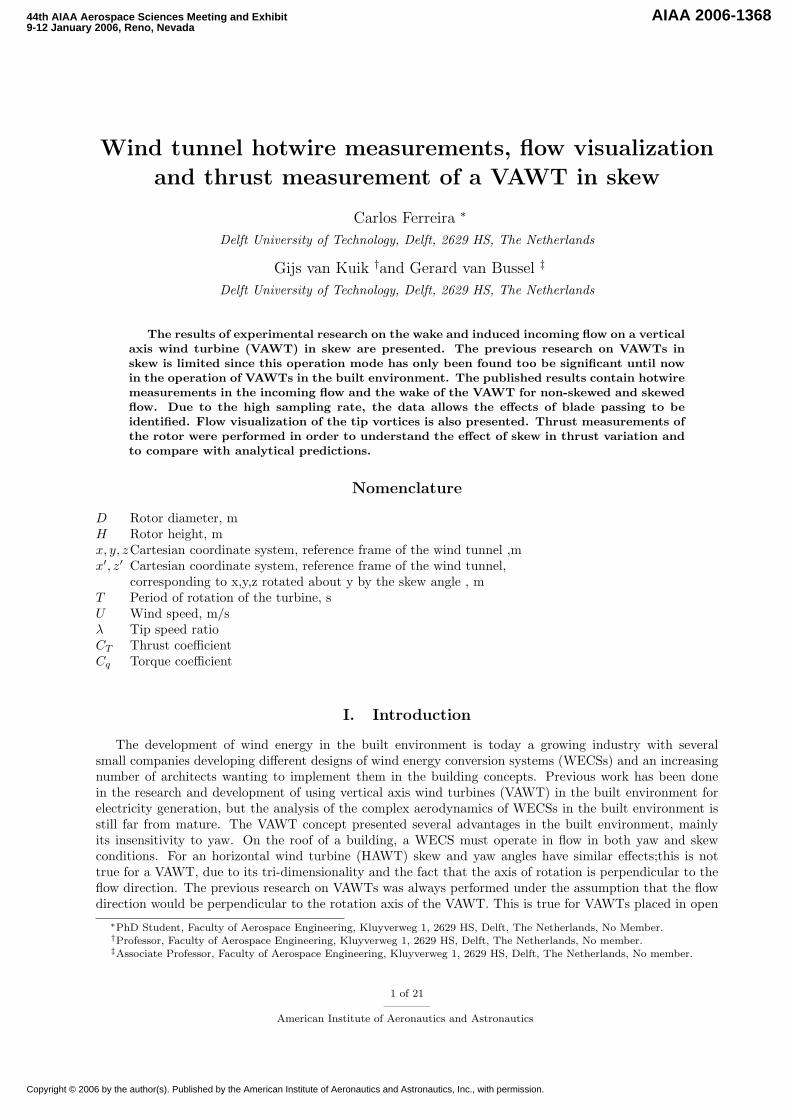
The turbine model used is the model previously used and referred to in the work of Mertens.1 The VAWT isa two bladed H-Darrieus with a diameter of 0.75m and a height of 0.5m. The blades are straight, NACA0018profiled with zero pitch, each connected to the rotation axis by two profiled cross bars. Figure 1 shows aschematic of the H-Darrieus. The frequency of rotation of the turbine is regulated by increasing friction onthe rotating shaft. The tip speed ratio (λ ) is 3.07 for the non-skewed flow case, 3.11 for the 15◦ skewed flowcase and 3.27 for the 30◦ skewed flow case.
2 of 21
American Institute of Aeronautics and Astronautics
y
z x
y
z x
UU
(0,0,0)
25.00
50.0
12.5
50.0
12.590.0°
Ø70.0
8.0
90.0°
90.0°
Axis of
rotation
Blade
Support spar
Direction of rotation
45°
90°
135° 45°
90°
135°
Figure 1. Schematic of the layout of the rotor of the H-Darrieus (2 views)
III. Flow visualization of the tip vortices
The visualization of the tip vortices using smoke visualization techniques was performed injecting smokeupwind of the rotor. Several visualizations using stroboscopic light were performed to understand thedynamics of the wake and, in particular, of the tip vortices. In this work, some of these visualizations arepresented and discussed.
A. Tip vortices in the cylinder in non-skewed flow
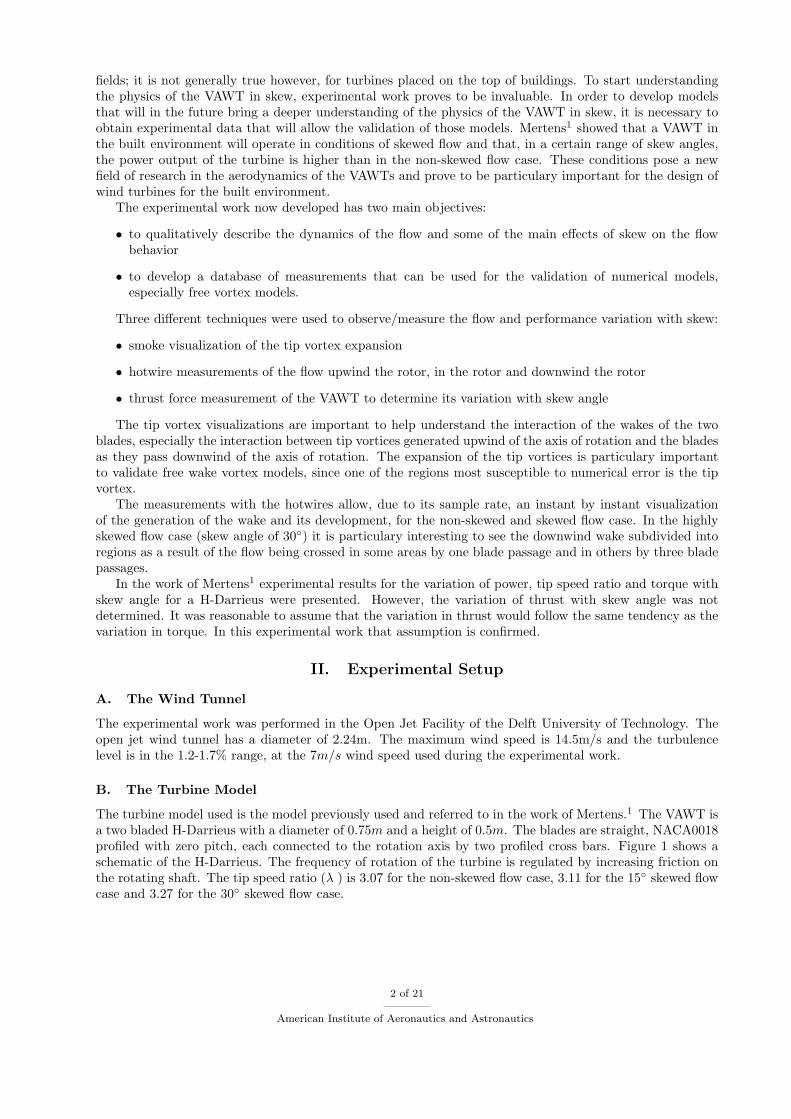
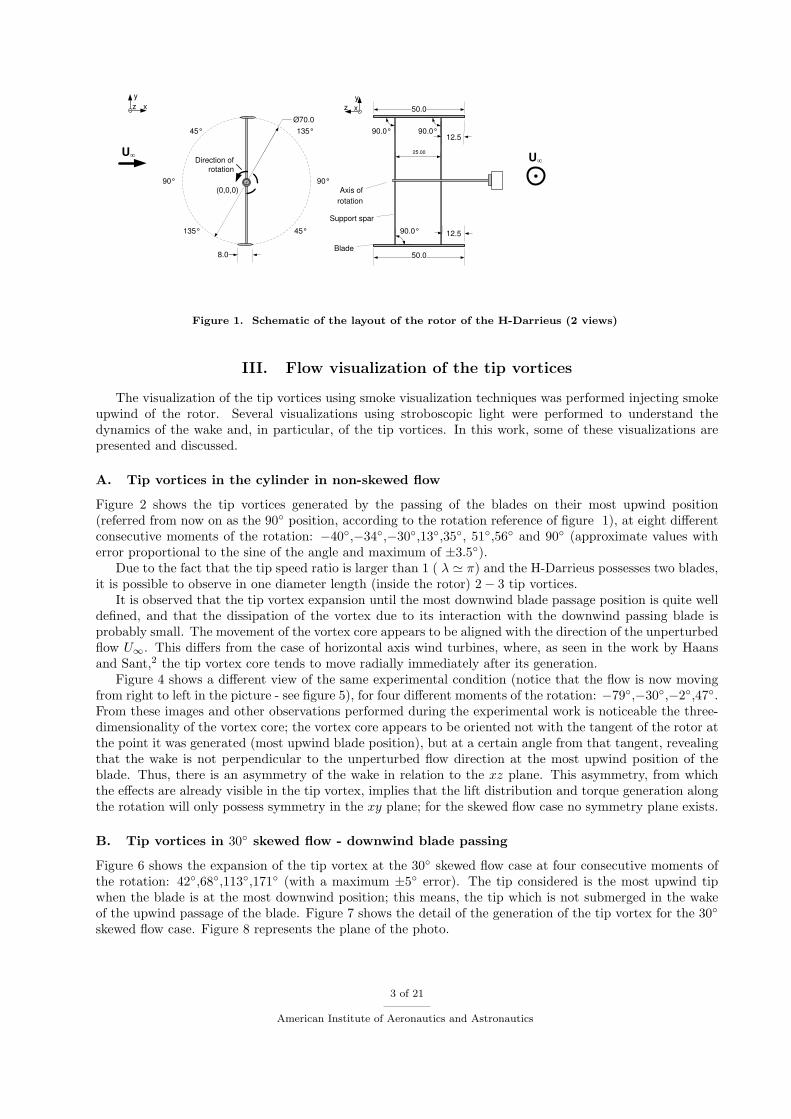
Figure 2 shows the tip vortices generated by the passing of the blades on their most upwind position(referred from now on as the 90◦ position, according to the rotation reference of figure 1), at eight differentconsecutive moments of the rotation: −40◦,−34◦,−30◦,13◦,35◦, 51◦,56◦ and 90◦ (approximate values witherror proportional to the sine of the angle and maximum of ±3.5◦).
Due to the fact that the tip speed ratio is larger than 1 ( λ ' π) and the H-Darrieus possesses two blades,it is possible to observe in one diameter length (inside the rotor) 2− 3 tip vortices.
It is observed that the tip vortex expansion until the most downwind blade passage position is quite welldefined, and that the dissipation of the vortex due to its interaction with the downwind passing blade isprobably small. The movement of the vortex core appears to be aligned with the direction of the unperturbedflow U∞. This differs from the case of horizontal axis wind turbines, where, as seen in the work by Haansand Sant,2 the tip vortex core tends to move radially immediately after its generation.
Figure 4 shows a different view of the same experimental condition (notice that the flow is now movingfrom right to left in the picture - see figure 5), for four different moments of the rotation: −79◦,−30◦,−2◦,47◦.From these images and other observations performed during the experimental work is noticeable the three-dimensionality of the vortex core; the vortex core appears to be oriented not with the tangent of the rotor atthe point it was generated (most upwind blade position), but at a certain angle from that tangent, revealingthat the wake is not perpendicular to the unperturbed flow direction at the most upwind position of theblade. Thus, there is an asymmetry of the wake in relation to the xz plane. This asymmetry, from whichthe effects are already visible in the tip vortex, implies that the lift distribution and torque generation alongthe rotation will only possess symmetry in the xy plane; for the skewed flow case no symmetry plane exists.
B. Tip vortices in 30◦ skewed flow - downwind blade passing
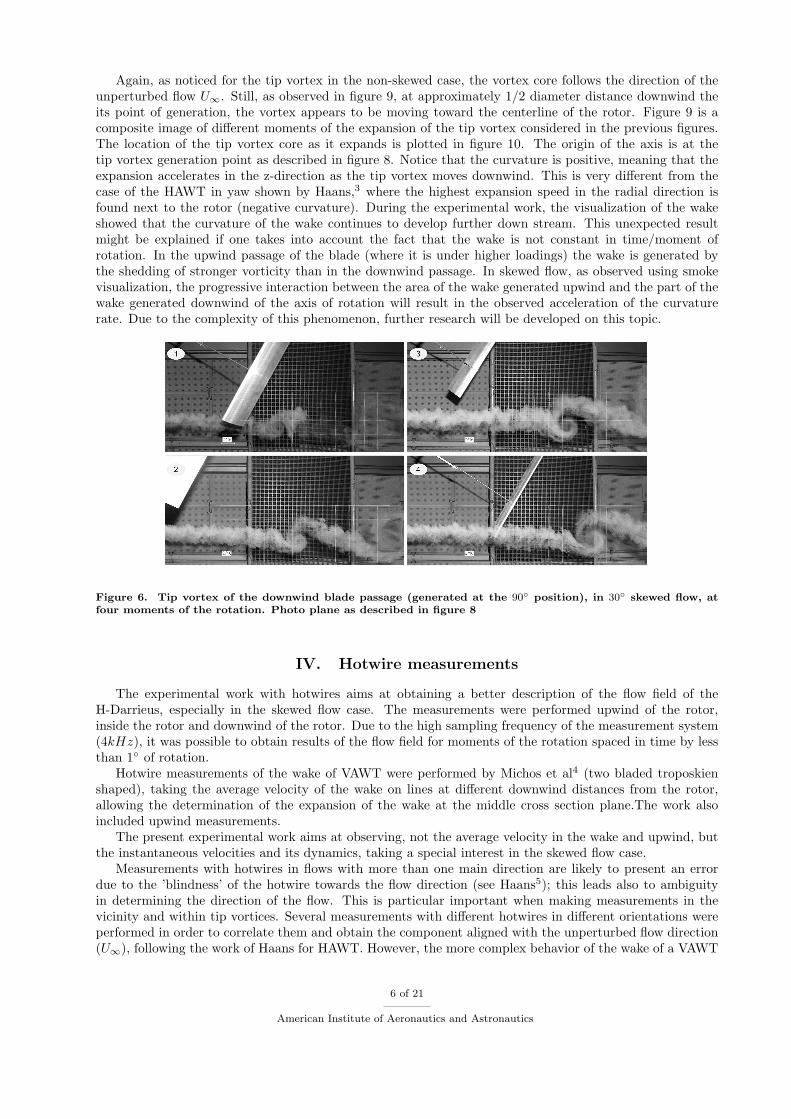
Figure 6 shows the expansion of the tip vortex at the 30◦ skewed flow case at four consecutive moments ofthe rotation: 42◦,68◦,113◦,171◦ (with a maximum ±5◦ error). The tip considered is the most upwind tipwhen the blade is at the most downwind position; this means, the tip which is not submerged in the wakeof the upwind passage of the blade. Figure 7 shows the detail of the generation of the tip vortex for the 30◦
skewed flow case. Figure 8 represents the plane of the photo.
3 of 21
American Institute of Aeronautics and Astronautics
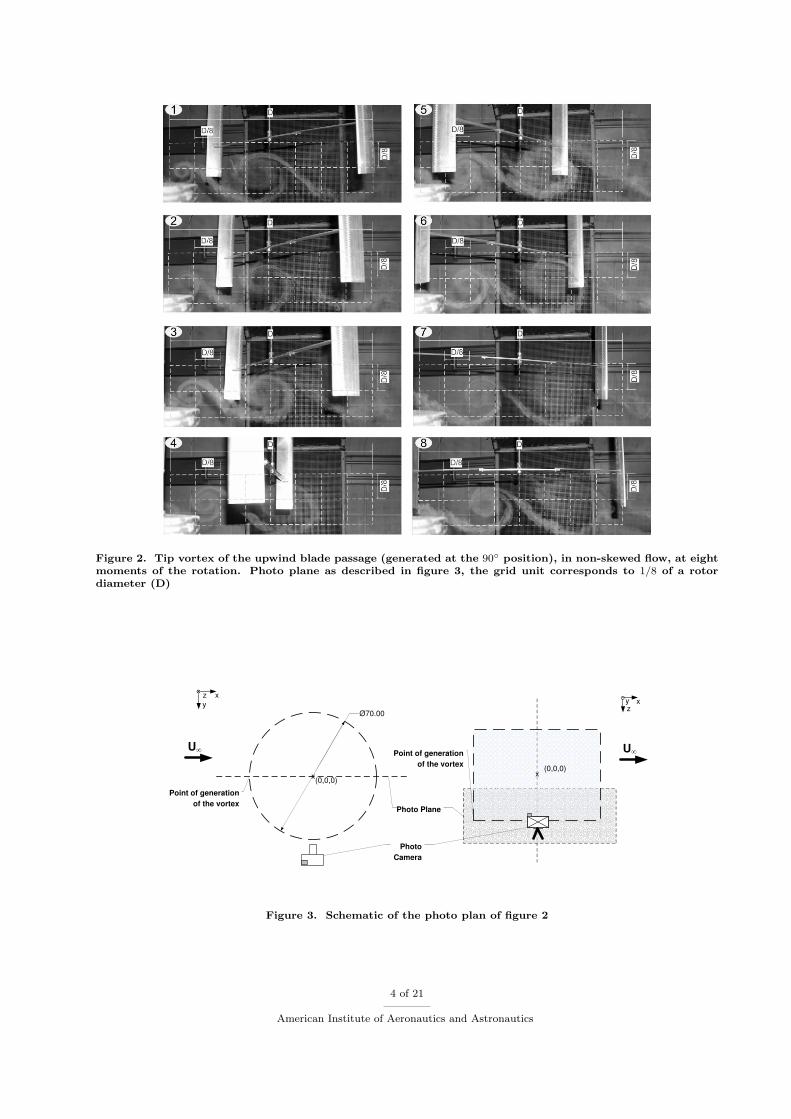
Figure 2. Tip vortex of the upwind blade passage (generated at the 90◦ position), in non-skewed flow, at eightmoments of the rotation. Photo plane as described in figure 3, the grid unit corresponds to 1/8 of a rotordiameter (D)
zxy
Ø70.00
U
(0,0,0)
(0,0,0)x x
U
xyz
Photo PlanPhoto Plane
Photo
Camera
Photo
Camera
Point of generation
of the vortex
Point of generation
of the vortex
Figure 3. Schematic of the photo plan of figure 2
4 of 21
American Institute of Aeronautics and Astronautics
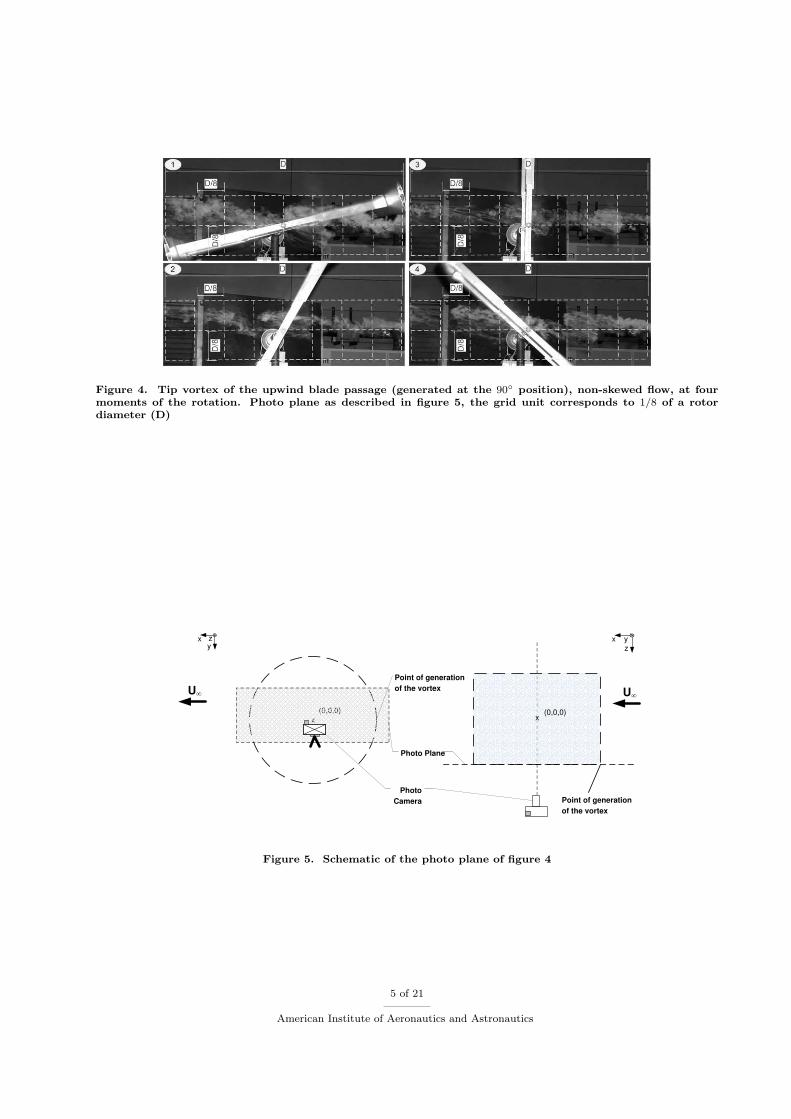
Figure 4. Tip vortex of the upwind blade passage (generated at the 90◦ position), non-skewed flow, at fourmoments of the rotation. Photo plane as described in figure 5, the grid unit corresponds to 1/8 of a rotordiameter (D)
U
(0,0,0) (0,0,0)x x
U
x
z
y
Photo
Plane
Photo
Camera
Photo
Camera
yx z
Point of generation
of the vortex
Point of generation
of the vortex
Photo Plane
Figure 5. Schematic of the photo plane of figure 4
5 of 21
American Institute of Aeronautics and Astronautics
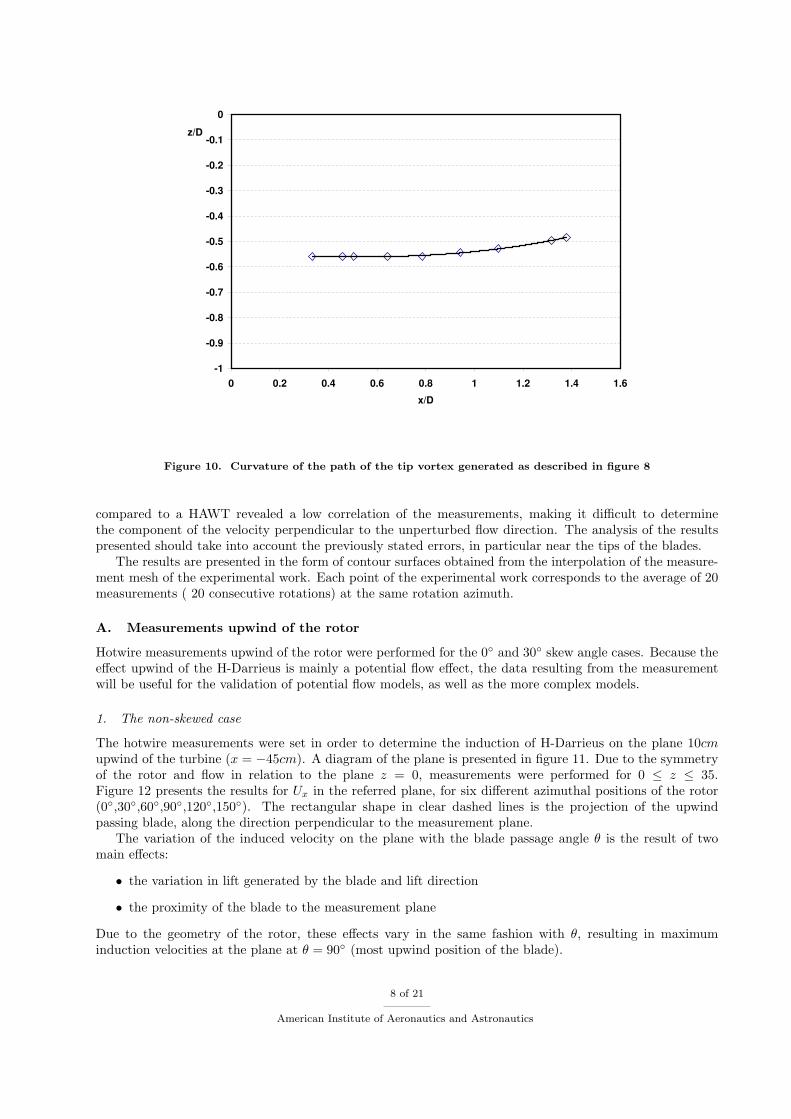
Again, as noticed for the tip vortex in the non-skewed case, the vortex core follows the direction of theunperturbed flow U∞. Still, as observed in figure 9, at approximately 1/2 diameter distance downwind theits point of generation, the vortex appears to be moving toward the centerline of the rotor. Figure 9 is acomposite image of different moments of the expansion of the tip vortex considered in the previous figures.The location of the tip vortex core as it expands is plotted in figure 10. The origin of the axis is at thetip vortex generation point as described in figure 8. Notice that the curvature is positive, meaning that theexpansion accelerates in the z-direction as the tip vortex moves downwind. This is very different from thecase of the HAWT in yaw shown by Haans,3 where the highest expansion speed in the radial direction isfound next to the rotor (negative curvature). During the experimental work, the visualization of the wakeshowed that the curvature of the wake continues to develop further down stream. This unexpected resultmight be explained if one takes into account the fact that the wake is not constant in time/moment ofrotation. In the upwind passage of the blade (where it is under higher loadings) the wake is generated bythe shedding of stronger vorticity than in the downwind passage. In skewed flow, as observed using smokevisualization, the progressive interaction between the area of the wake generated upwind and the part of thewake generated downwind of the axis of rotation will result in the observed acceleration of the curvaturerate. Due to the complexity of this phenomenon, further research will be developed on this topic.
Figure 6. Tip vortex of the downwind blade passage (generated at the 90◦ position), in 30◦ skewed flow, atfour moments of the rotation. Photo plane as described in figure 8
IV. Hotwire measurements
The experimental work with hotwires aims at obtaining a better description of the flow field of theH-Darrieus, especially in the skewed flow case. The measurements were performed upwind of the rotor,inside the rotor and downwind of the rotor. Due to the high sampling frequency of the measurement system(4kHz), it was possible to obtain results of the flow field for moments of the rotation spaced in time by lessthan 1◦ of rotation.
Hotwire measurements of the wake of VAWT were performed by Michos et al4 (two bladed troposkienshaped), taking the average velocity of the wake on lines at different downwind distances from the rotor,allowing the determination of the expansion of the wake at the middle cross section plane.The work alsoincluded upwind measurements.
The present experimental work aims at observing, not the average velocity in the wake and upwind, butthe instantaneous velocities and its dynamics, taking a special interest in the skewed flow case.
Measurements with hotwires in flows with more than one main direction are likely to present an errordue to the ’blindness’ of the hotwire towards the flow direction (see Haans5); this leads also to ambiguityin determining the direction of the flow. This is particular important when making measurements in thevicinity and within tip vortices. Several measurements with different hotwires in different orientations wereperformed in order to correlate them and obtain the component aligned with the unperturbed flow direction(U∞), following the work of Haans for HAWT. However, the more complex behavior of the wake of a VAWT
6 of 21
American Institute of Aeronautics and Astronautics
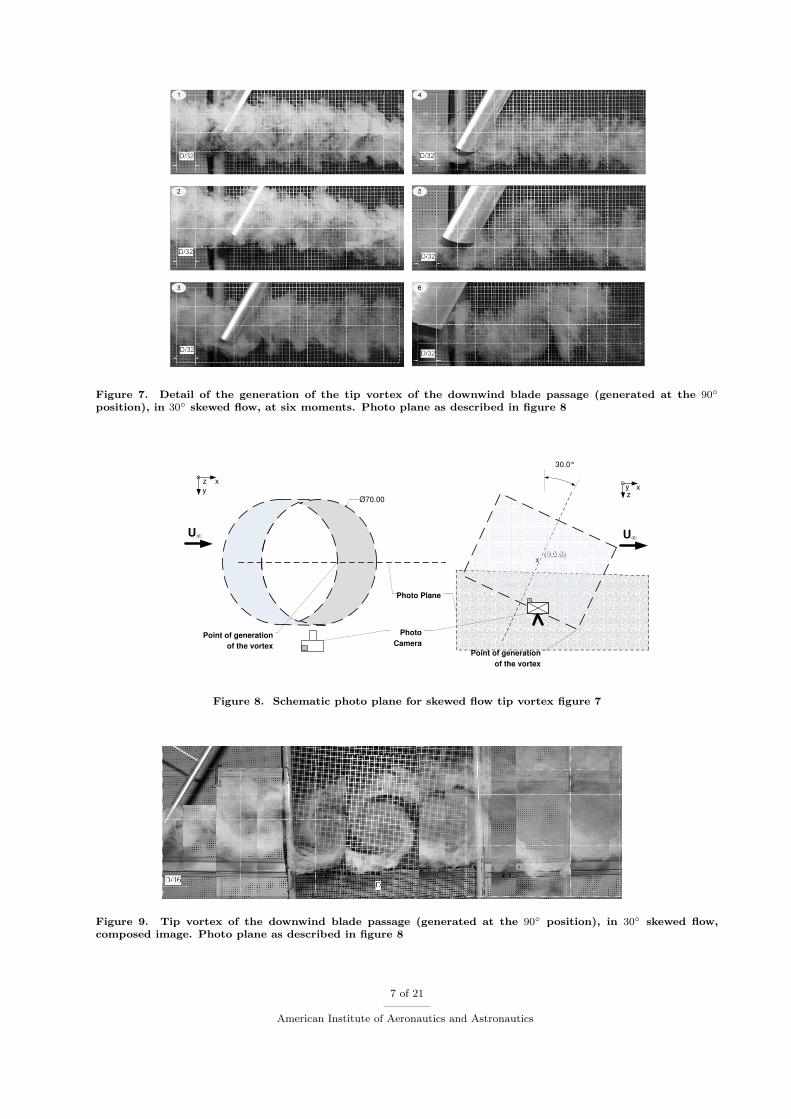
Figure 7. Detail of the generation of the tip vortex of the downwind blade passage (generated at the 90◦position), in 30◦ skewed flow, at six moments. Photo plane as described in figure 8
zxy
Ø70.00
U
(0,0,0)
(0,0,0)x x
U
xyz
Photo PlanPhoto Plane
Photo
Camera
Photo
Camera
30.0°
Point of generation
of the vortex
Point of generation
of the vortex
Figure 8. Schematic photo plane for skewed flow tip vortex figure 7
Figure 9. Tip vortex of the downwind blade passage (generated at the 90◦ position), in 30◦ skewed flow,composed image. Photo plane as described in figure 8
7 of 21
American Institute of Aeronautics and Astronautics
-1
-0.9
-0.8
-0.7
-0.6
-0.5
-0.4
-0.3
-0.2
-0.1
0
0 0.2 0.4 0.6 0.8 1 1.2 1.4 1.6
x/D
z/D
Figure 10. Curvature of the path of the tip vortex generated as described in figure 8
compared to a HAWT revealed a low correlation of the measurements, making it difficult to determinethe component of the velocity perpendicular to the unperturbed flow direction. The analysis of the resultspresented should take into account the previously stated errors, in particular near the tips of the blades.
The results are presented in the form of contour surfaces obtained from the interpolation of the measure-ment mesh of the experimental work. Each point of the experimental work corresponds to the average of 20measurements ( 20 consecutive rotations) at the same rotation azimuth.
A. Measurements upwind of the rotor
Hotwire measurements upwind of the rotor were performed for the 0◦ and 30◦ skew angle cases. Because theeffect upwind of the H-Darrieus is mainly a potential flow effect, the data resulting from the measurementwill be useful for the validation of potential flow models, as well as the more complex models.
1. The non-skewed case
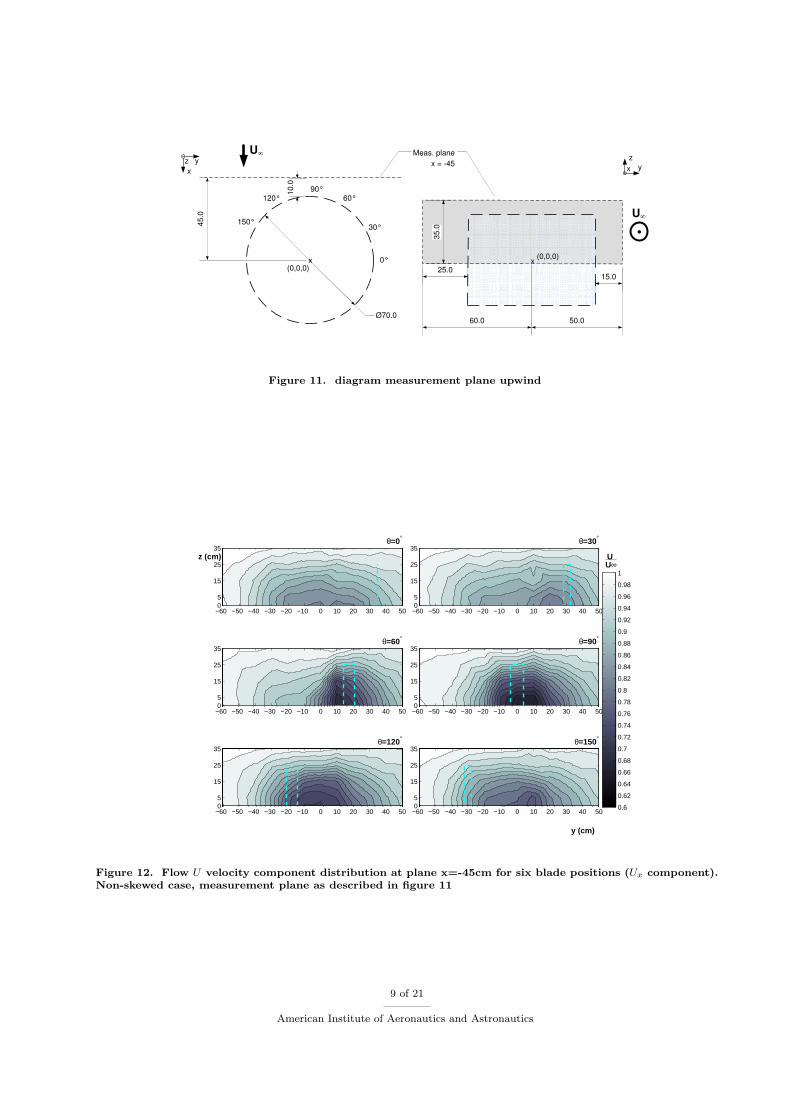
The hotwire measurements were set in order to determine the induction of H-Darrieus on the plane 10cmupwind of the turbine (x = −45cm). A diagram of the plane is presented in figure 11. Due to the symmetryof the rotor and flow in relation to the plane z = 0, measurements were performed for 0 ≤ z ≤ 35.Figure 12 presents the results for Ux in the referred plane, for six different azimuthal positions of the rotor(0◦,30◦,60◦,90◦,120◦,150◦). The rectangular shape in clear dashed lines is the projection of the upwindpassing blade, along the direction perpendicular to the measurement plane.
The variation of the induced velocity on the plane with the blade passage angle θ is the result of twomain effects:
• the variation in lift generated by the blade and lift direction
• the proximity of the blade to the measurement plane
Due to the geometry of the rotor, these effects vary in the same fashion with θ, resulting in maximuminduction velocities at the plane at θ = 90◦ (most upwind position of the blade).
8 of 21
American Institute of Aeronautics and Astronautics
y
z
x
Ø70.0
yz
x
U
U
(0,0,0)
(0,0,0)x x
15.025.0
10
.0
Meas. plane
x = -45
60.0 50.0
35
.030°
60°90°
120°
150°45
.0
0°
Figure 11. diagram measurement plane upwind
θ=0°
z (cm)
05
15
25
35
−60 −50 −40 −30 −20 −10 0 10 20 30 40 50
θ=30°
05
15
25
35
−60 −50 −40 −30 −20 −10 0 10 20 30 40 50
θ=60°
05
15
25
35
−60 −50 −40 −30 −20 −10 0 10 20 30 40 50
θ=90°
05
15
25
35
−60 −50 −40 −30 −20 −10 0 10 20 30 40 50
θ=120°
05
15
25
35
−60 −50 −40 −30 −20 −10 0 10 20 30 40 50
θ=150°
y (cm)
UU∞___
05
15
25
35
−60 −50 −40 −30 −20 −10 0 10 20 30 40 500.6
0.62
0.64
0.66
0.68
0.7
0.72
0.74
0.76
0.78
0.8
0.82
0.84
0.86
0.88
0.9
0.92
0.94
0.96
0.98
1
Figure 12. Flow U velocity component distribution at plane x=-45cm for six blade positions (Ux component).Non-skewed case, measurement plane as described in figure 11
9 of 21
American Institute of Aeronautics and Astronautics
The asymmetry of the induced velocities (the only symmetry is in relation to the xy plane) results fromthe asymmetry of the wind speed perceived by the blades in the upwind and downwind sections of therotation and the position/time dynamics of the wake generation. The measurements show the expectedupflow (a induced velocity by the blade in the downwind direction/direction of lift) in front of the blade (in front of the leading edge, in the circular movement reference; in the left side of the blade, in the figure’sperspective) and a downflow (a induced velocity by the blade in the upwind direction/direction opposite tolift) in the back of the blade (behind the trailing edge, in the circular movement reference; in the right sideof the blade, in the figure’s perspective). The asymmetry of the induced velocities is also then an effect ofthe asymmetry of the shed vorticity of the wake in relation to the xz − plane.
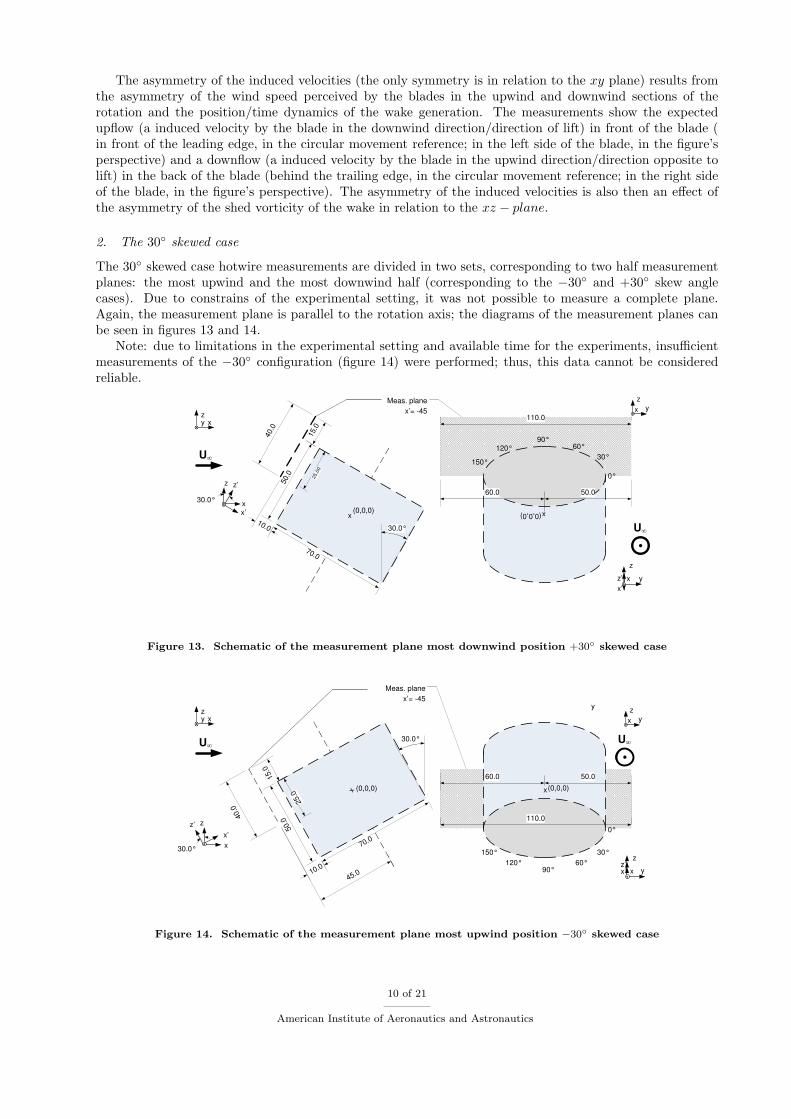
2. The 30◦ skewed case
The 30◦ skewed case hotwire measurements are divided in two sets, corresponding to two half measurementplanes: the most upwind and the most downwind half (corresponding to the −30◦ and +30◦ skew anglecases). Due to constrains of the experimental setting, it was not possible to measure a complete plane.Again, the measurement plane is parallel to the rotation axis; the diagrams of the measurement planes canbe seen in figures 13 and 14.
Note: due to limitations in the experimental setting and available time for the experiments, insufficientmeasurements of the −30◦ configuration (figure 14) were performed; thus, this data cannot be consideredreliable.
Meas. plane
x = -10
Meas. plane
x = -10
U
Meas. plane
x’= -45
U
30.0°
40.0
50.0 25.0
0
70.0
15.0
z z’
30.0°
x(0,0,0) x(0,0,0)
10.0
xyz 110.0
60.0 50.0
30°
60°120°
150°
0°
90°
y
z
x
x
x’
z
x
x’
z’ y
Figure 13. Schematic of the measurement plane most downwind position +30◦ skewed case
Meas. plane
x = -10
Meas. plane
x = -10
Meas. plane
x’= -45
U30.0°
40.0
50.0
25.0
70.0
15.0
zz’
30.0°
x (0,0,0) x(0,0,0)
10.0
xyz
110.0
60.0 50.0
45.0
U
y
z
x
30°
60°120°
150°
0°
90°
x’
x
y
z
xx’z’
y
Figure 14. Schematic of the measurement plane most upwind position −30◦ skewed case
10 of 21
American Institute of Aeronautics and Astronautics
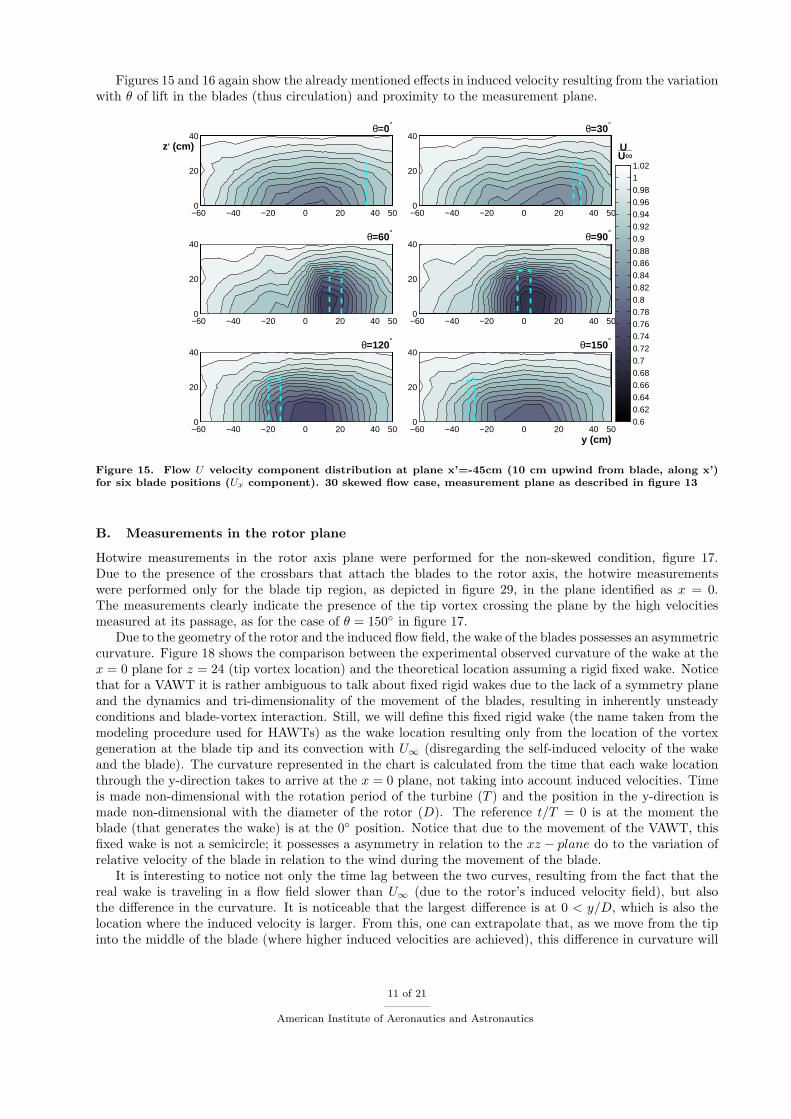
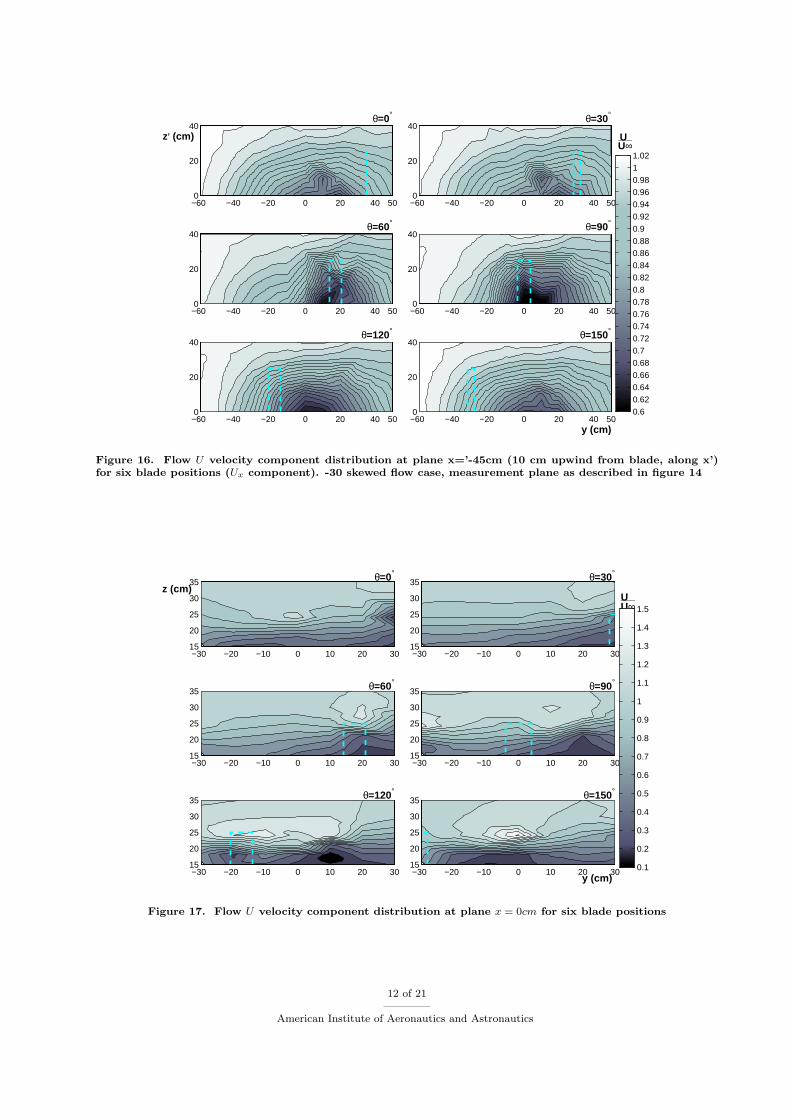
Figures 15 and 16 again show the already mentioned effects in induced velocity resulting from the variationwith θ of lift in the blades (thus circulation) and proximity to the measurement plane.
0
20
40
−60 −40 −20 0 20 40 50
θ=0°
z, (cm)
0
20
40
−60 −40 −20 0 20 40 50
θ=30°
0
20
40
−60 −40 −20 0 20 40 50
θ=60°
0
20
40
−60 −40 −20 0 20 40 50
θ=90°
0
20
40
−60 −40 −20 0 20 40 50
θ=120°
0
20
40
−60 −40 −20 0 20 40 50
θ=150°
y (cm)
UU∞___
0.60.620.640.660.680.70.720.740.760.780.80.820.840.860.880.90.920.940.960.9811.02
Figure 15. Flow U velocity component distribution at plane x’=-45cm (10 cm upwind from blade, along x’)for six blade positions (Ux component). 30 skewed flow case, measurement plane as described in figure 13
B. Measurements in the rotor plane
Hotwire measurements in the rotor axis plane were performed for the non-skewed condition, figure 17.Due to the presence of the crossbars that attach the blades to the rotor axis, the hotwire measurementswere performed only for the blade tip region, as depicted in figure 29, in the plane identified as x = 0.The measurements clearly indicate the presence of the tip vortex crossing the plane by the high velocitiesmeasured at its passage, as for the case of θ = 150◦ in figure 17.
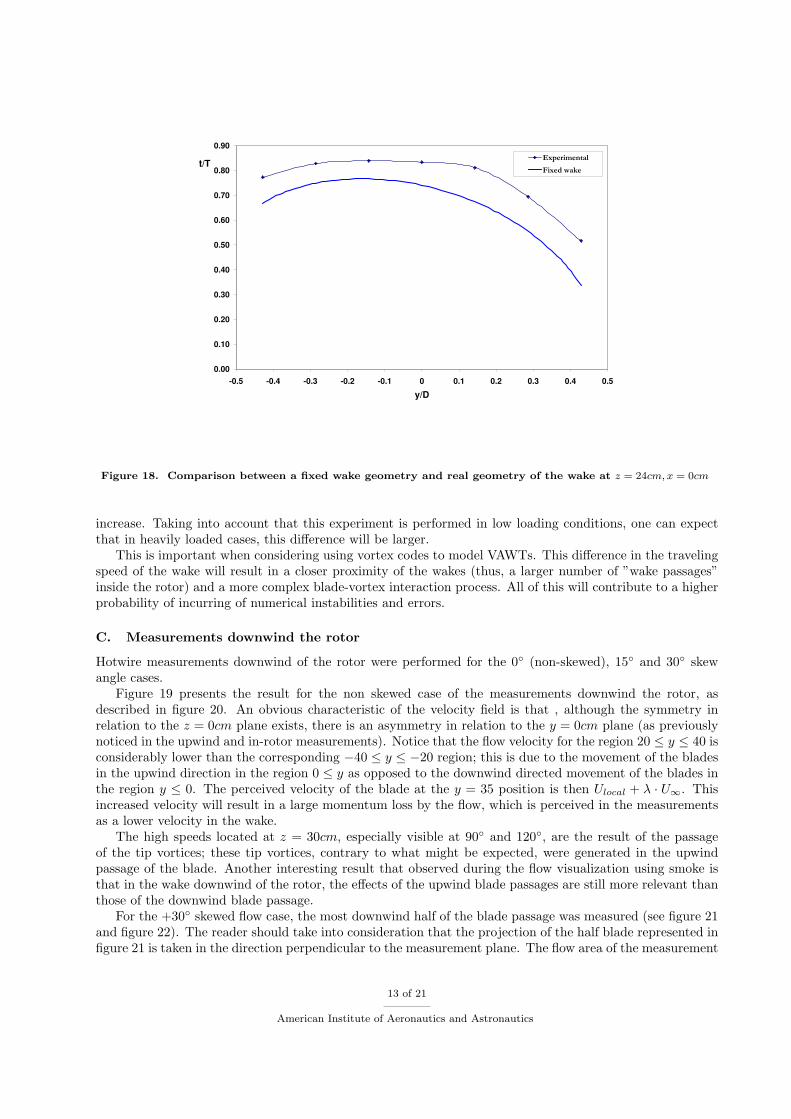
Due to the geometry of the rotor and the induced flow field, the wake of the blades possesses an asymmetriccurvature. Figure 18 shows the comparison between the experimental observed curvature of the wake at thex = 0 plane for z = 24 (tip vortex location) and the theoretical location assuming a rigid fixed wake. Noticethat for a VAWT it is rather ambiguous to talk about fixed rigid wakes due to the lack of a symmetry planeand the dynamics and tri-dimensionality of the movement of the blades, resulting in inherently unsteadyconditions and blade-vortex interaction. Still, we will define this fixed rigid wake (the name taken from themodeling procedure used for HAWTs) as the wake location resulting only from the location of the vortexgeneration at the blade tip and its convection with U∞ (disregarding the self-induced velocity of the wakeand the blade). The curvature represented in the chart is calculated from the time that each wake locationthrough the y-direction takes to arrive at the x = 0 plane, not taking into account induced velocities. Timeis made non-dimensional with the rotation period of the turbine (T ) and the position in the y-direction ismade non-dimensional with the diameter of the rotor (D). The reference t/T = 0 is at the moment theblade (that generates the wake) is at the 0◦ position. Notice that due to the movement of the VAWT, thisfixed wake is not a semicircle; it possesses a asymmetry in relation to the xz − plane do to the variation ofrelative velocity of the blade in relation to the wind during the movement of the blade.
It is interesting to notice not only the time lag between the two curves, resulting from the fact that thereal wake is traveling in a flow field slower than U∞ (due to the rotor’s induced velocity field), but alsothe difference in the curvature. It is noticeable that the largest difference is at 0 < y/D, which is also thelocation where the induced velocity is larger. From this, one can extrapolate that, as we move from the tipinto the middle of the blade (where higher induced velocities are achieved), this difference in curvature will
11 of 21
American Institute of Aeronautics and Astronautics
0
20
40
−60 −40 −20 0 20 40 50
θ=0°
z, (cm)
0
20
40
−60 −40 −20 0 20 40 50
θ=30°
0
20
40
−60 −40 −20 0 20 40 50
θ=60°
0
20
40
−60 −40 −20 0 20 40 50
θ=90°
0
20
40
−60 −40 −20 0 20 40 50
θ=120°
0
20
40
−60 −40 −20 0 20 40 50
θ=150°
y (cm)
UU∞___
0.60.620.640.660.680.70.720.740.760.780.80.820.840.860.880.90.920.940.960.9811.02
Figure 16. Flow U velocity component distribution at plane x=’-45cm (10 cm upwind from blade, along x’)for six blade positions (Ux component). -30 skewed flow case, measurement plane as described in figure 14
15
20
25
30
35
−30 −20 −10 0 10 20 30
θ=0°
z (cm)
15
20
25
30
35
−30 −20 −10 0 10 20 30
θ=30°
15
20
25
30
35
−30 −20 −10 0 10 20 30
θ=60°
15
20
25
30
35
−30 −20 −10 0 10 20 30
θ=90°
15
20
25
30
35
−30 −20 −10 0 10 20 30
θ=120°
15
20
25
30
35
−30 −20 −10 0 10 20 30
θ=150°
y (cm)
UU∞___
0.1
0.2
0.3
0.4
0.5
0.6
0.7
0.8
0.9
1
1.1
1.2
1.3
1.4
1.5
Figure 17. Flow U velocity component distribution at plane x = 0cm for six blade positions
12 of 21
American Institute of Aeronautics and Astronautics
0.00
0.10
0.20
0.30
0.40
0.50
0.60
0.70
0.80
0.90
-0.5 -0.4 -0.3 -0.2 -0.1 0 0.1 0.2 0.3 0.4 0.5
y/D
t/TExperimental
Fixed wake
Figure 18. Comparison between a fixed wake geometry and real geometry of the wake at z = 24cm, x = 0cm
increase. Taking into account that this experiment is performed in low loading conditions, one can expectthat in heavily loaded cases, this difference will be larger.
This is important when considering using vortex codes to model VAWTs. This difference in the travelingspeed of the wake will result in a closer proximity of the wakes (thus, a larger number of ”wake passages”inside the rotor) and a more complex blade-vortex interaction process. All of this will contribute to a higherprobability of incurring of numerical instabilities and errors.
C. Measurements downwind the rotor
Hotwire measurements downwind of the rotor were performed for the 0◦ (non-skewed), 15◦ and 30◦ skewangle cases.
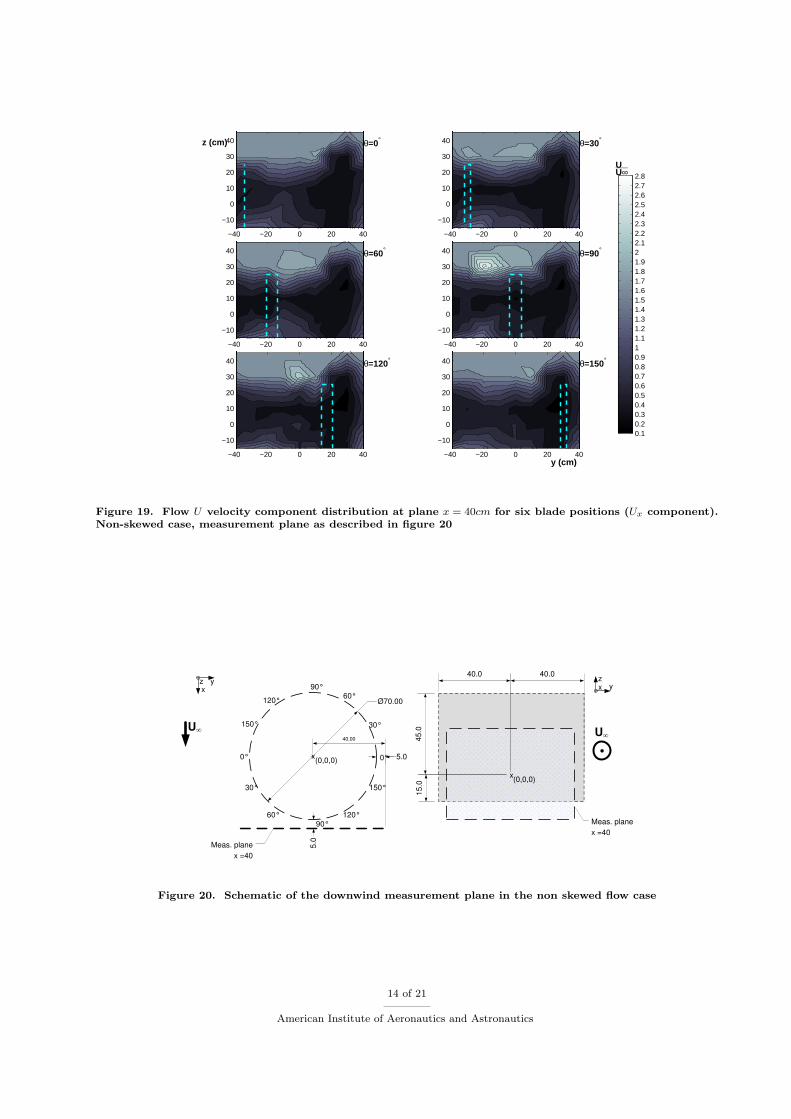
Figure 19 presents the result for the non skewed case of the measurements downwind the rotor, asdescribed in figure 20. An obvious characteristic of the velocity field is that , although the symmetry inrelation to the z = 0cm plane exists, there is an asymmetry in relation to the y = 0cm plane (as previouslynoticed in the upwind and in-rotor measurements). Notice that the flow velocity for the region 20 ≤ y ≤ 40 isconsiderably lower than the corresponding −40 ≤ y ≤ −20 region; this is due to the movement of the bladesin the upwind direction in the region 0 ≤ y as opposed to the downwind directed movement of the blades inthe region y ≤ 0. The perceived velocity of the blade at the y = 35 position is then Ulocal + λ · U∞. Thisincreased velocity will result in a large momentum loss by the flow, which is perceived in the measurementsas a lower velocity in the wake.
The high speeds located at z = 30cm, especially visible at 90◦ and 120◦, are the result of the passageof the tip vortices; these tip vortices, contrary to what might be expected, were generated in the upwindpassage of the blade. Another interesting result that observed during the flow visualization using smoke isthat in the wake downwind of the rotor, the effects of the upwind blade passages are still more relevant thanthose of the downwind blade passage.
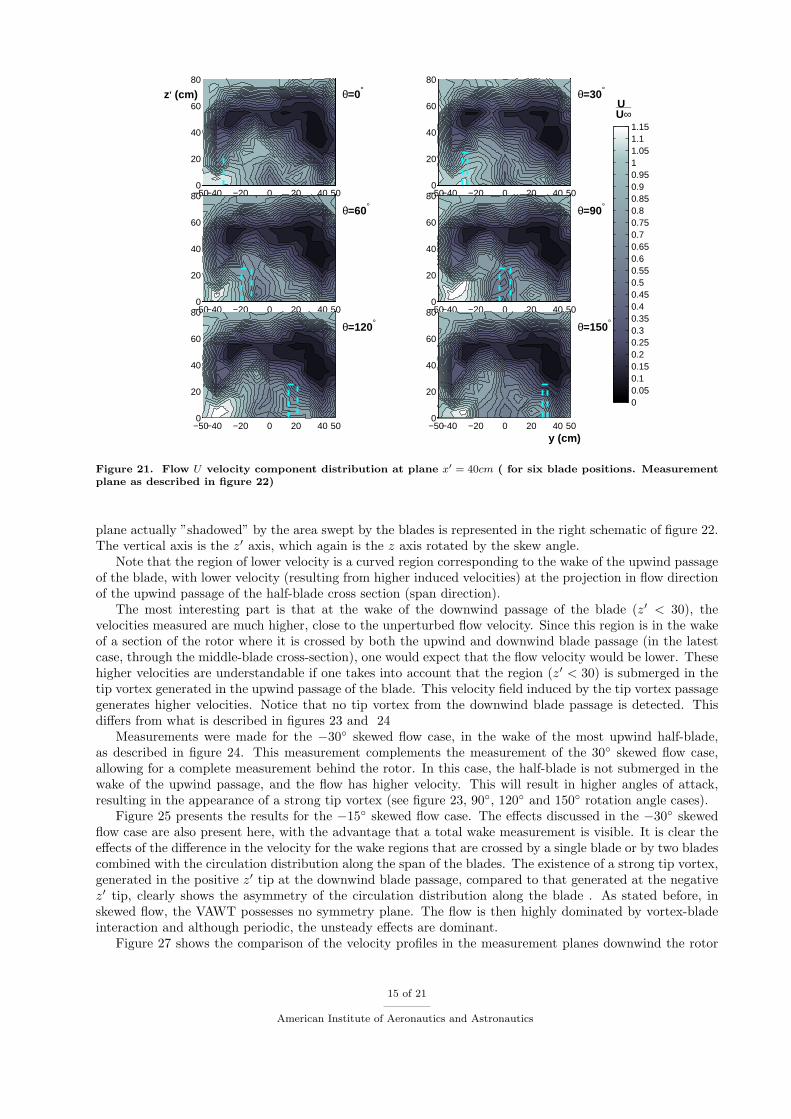
For the +30◦ skewed flow case, the most downwind half of the blade passage was measured (see figure 21and figure 22). The reader should take into consideration that the projection of the half blade represented infigure 21 is taken in the direction perpendicular to the measurement plane. The flow area of the measurement
13 of 21
American Institute of Aeronautics and Astronautics
θ=0°z (cm)
−10
0
10
20
30
40
−40 −20 0 20 40
θ=30°
−10
0
10
20
30
40
−40 −20 0 20 40
θ=60°
−10
0
10
20
30
40
−40 −20 0 20 40
θ=90°
−10
0
10
20
30
40
−40 −20 0 20 40
θ=120°
−10
0
10
20
30
40
−40 −20 0 20 40
θ=150°
y (cm)
UU∞___
−10
0
10
20
30
40
−40 −20 0 20 40
0.10.20.30.40.50.60.70.80.911.11.21.31.41.51.61.71.81.922.12.22.32.42.52.62.72.8
Figure 19. Flow U velocity component distribution at plane x = 40cm for six blade positions (Ux component).Non-skewed case, measurement plane as described in figure 20
yzx
Ø70.00
yzx
UU
(0,0,0)
(0,0,0)
Meas. plane
x =40
Meas. plane
x =40
x
x
5.0
15
.04
5.0
40.0 40.0
30°
60°90°
120°
150°
0°0°
150°
60°90°
120°
30°
40.00
5.0
Figure 20. Schematic of the downwind measurement plane in the non skewed flow case
14 of 21
American Institute of Aeronautics and Astronautics
0
20
40
60
80
−50−40 −20 0 20 40 50
θ=0°z, (cm)
0
20
40
60
80
−50−40 −20 0 20 40 50
θ=30°
0
20
40
60
80
−50−40 −20 0 20 40 50
θ=60°
0
20
40
60
80
−50−40 −20 0 20 40 50
θ=90°
0
20
40
60
80
−50−40 −20 0 20 40 50
θ=120°
0
20
40
60
80
−50−40 −20 0 20 40 50
θ=150°
y (cm)
UU∞___
00.050.10.150.20.250.30.350.40.450.50.550.60.650.70.750.80.850.90.9511.051.11.15
Figure 21. Flow U velocity component distribution at plane x′ = 40cm ( for six blade positions. Measurementplane as described in figure 22)
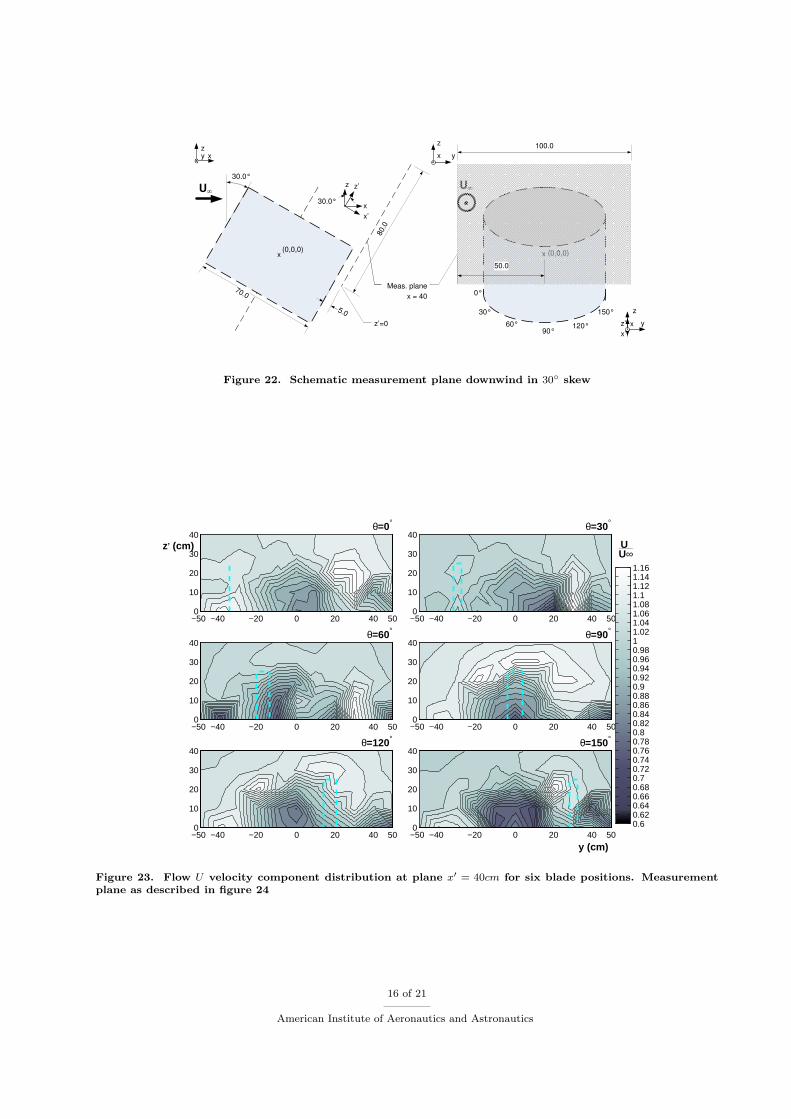
plane actually ”shadowed” by the area swept by the blades is represented in the right schematic of figure 22.The vertical axis is the z′ axis, which again is the z axis rotated by the skew angle.
Note that the region of lower velocity is a curved region corresponding to the wake of the upwind passageof the blade, with lower velocity (resulting from higher induced velocities) at the projection in flow directionof the upwind passage of the half-blade cross section (span direction).
The most interesting part is that at the wake of the downwind passage of the blade (z′ < 30), thevelocities measured are much higher, close to the unperturbed flow velocity. Since this region is in the wakeof a section of the rotor where it is crossed by both the upwind and downwind blade passage (in the latestcase, through the middle-blade cross-section), one would expect that the flow velocity would be lower. Thesehigher velocities are understandable if one takes into account that the region (z′ < 30) is submerged in thetip vortex generated in the upwind passage of the blade. This velocity field induced by the tip vortex passagegenerates higher velocities. Notice that no tip vortex from the downwind blade passage is detected. Thisdiffers from what is described in figures 23 and 24
Measurements were made for the −30◦ skewed flow case, in the wake of the most upwind half-blade,as described in figure 24. This measurement complements the measurement of the 30◦ skewed flow case,allowing for a complete measurement behind the rotor. In this case, the half-blade is not submerged in thewake of the upwind passage, and the flow has higher velocity. This will result in higher angles of attack,resulting in the appearance of a strong tip vortex (see figure 23, 90◦, 120◦ and 150◦ rotation angle cases).
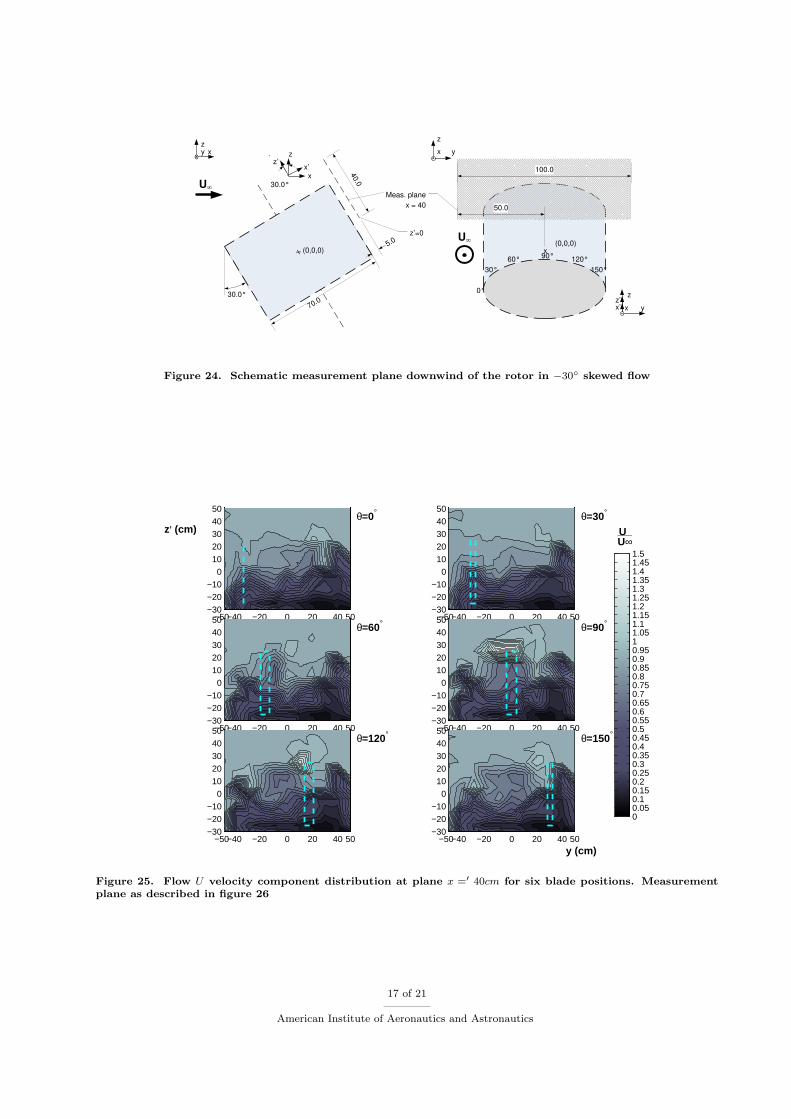
Figure 25 presents the results for the −15◦ skewed flow case. The effects discussed in the −30◦ skewedflow case are also present here, with the advantage that a total wake measurement is visible. It is clear theeffects of the difference in the velocity for the wake regions that are crossed by a single blade or by two bladescombined with the circulation distribution along the span of the blades. The existence of a strong tip vortex,generated in the positive z′ tip at the downwind blade passage, compared to that generated at the negativez′ tip, clearly shows the asymmetry of the circulation distribution along the blade . As stated before, inskewed flow, the VAWT possesses no symmetry plane. The flow is then highly dominated by vortex-bladeinteraction and although periodic, the unsteady effects are dominant.
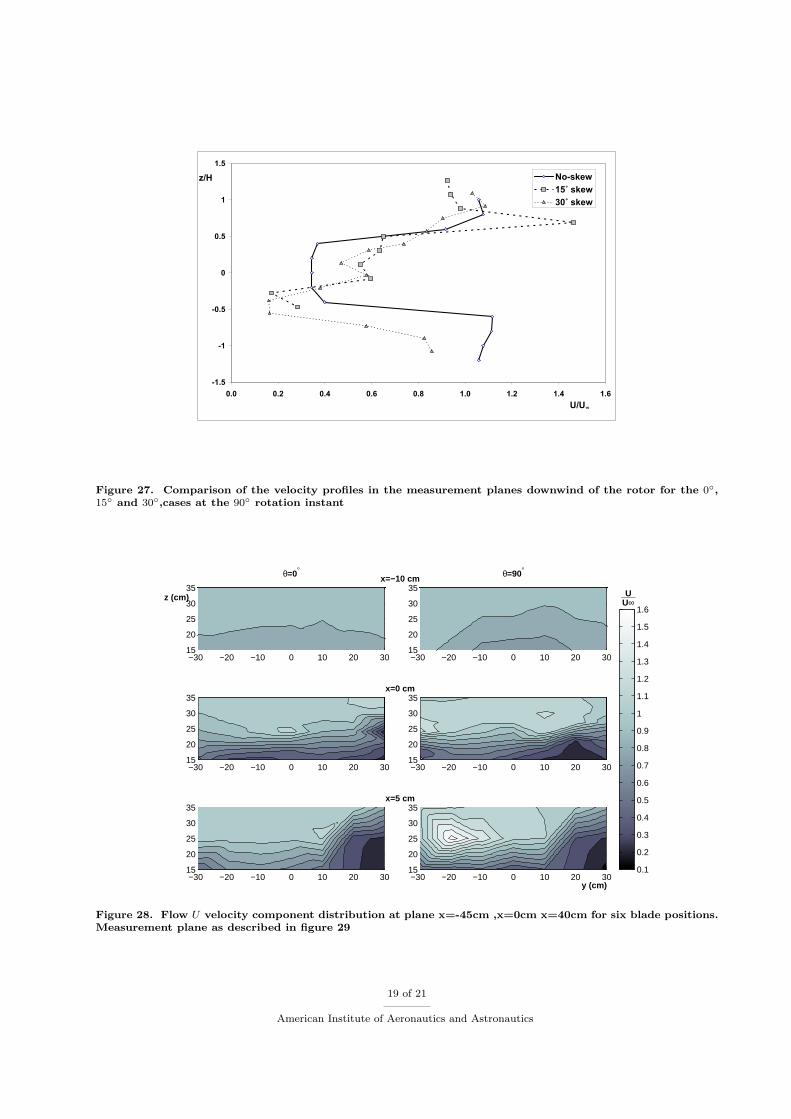
Figure 27 shows the comparison of the velocity profiles in the measurement planes downwind the rotor
15 of 21
American Institute of Aeronautics and Astronautics
Meas. plane
x = -10
Meas. plane
x = -10
U
Meas. plane
x = 40
U
30.0°
80.0
70.0
z z’
30.0°
x(0,0,0) x(0,0,0)
xyz
5.0
100.0
y
z
x
z’=0
0°
150°
60°90°
120°
30°
50.0
x
x’
z
x
x’
z’ y
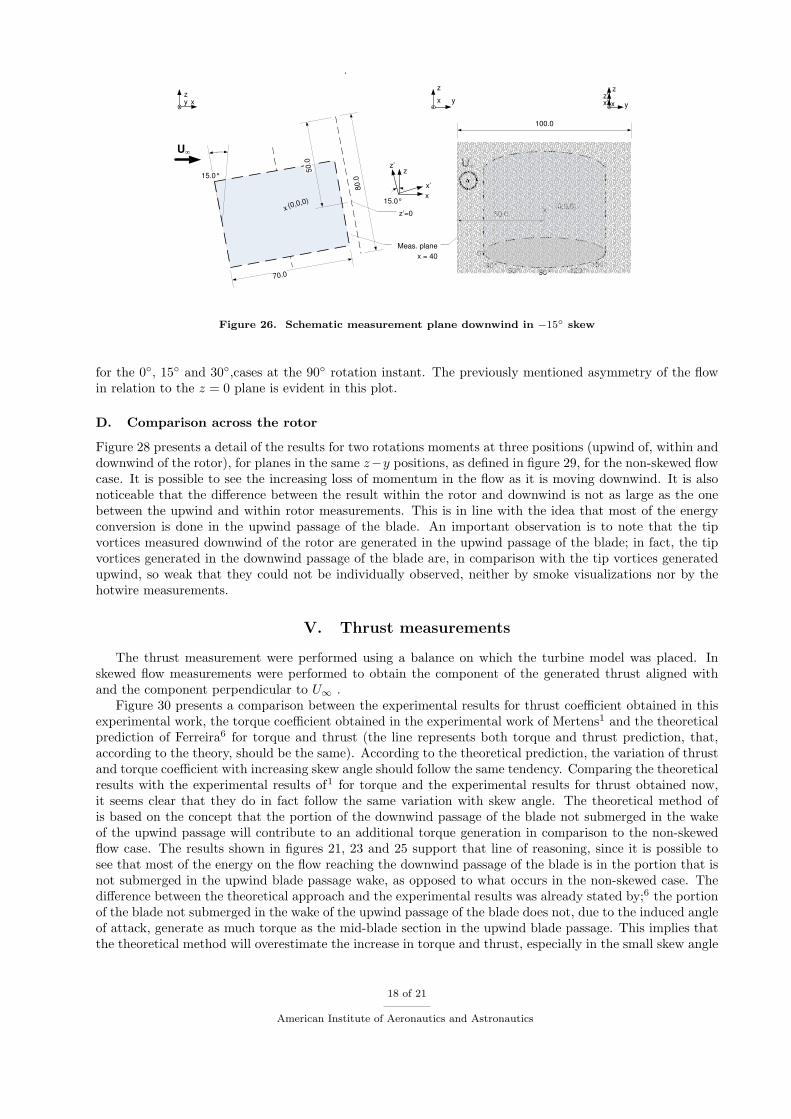
Figure 22. Schematic measurement plane downwind in 30◦ skew
0
10
20
30
40
−50 −40 −20 0 20 40 50
θ=0°
z, (cm)
0
10
20
30
40
−50 −40 −20 0 20 40 50
θ=30°
0
10
20
30
40
−50 −40 −20 0 20 40 50
θ=60°
0
10
20
30
40
−50 −40 −20 0 20 40 50
θ=90°
0
10
20
30
40
−50 −40 −20 0 20 40 50
θ=120°
0
10
20
30
40
−50 −40 −20 0 20 40 50
θ=150°
y (cm)
UU∞___
0.60.620.640.660.680.70.720.740.760.780.80.820.840.860.880.90.920.940.960.9811.021.041.061.081.11.121.141.16
Figure 23. Flow U velocity component distribution at plane x′ = 40cm for six blade positions. Measurementplane as described in figure 24
16 of 21
American Institute of Aeronautics and Astronautics
Meas. plane
x = -10
U
Meas. plane
x = 40
U
zz’
30.0°
xyz
y
z
x
z’=0
30.0°
70.0x (0,0,0)
5.0
40.0
x(0,0,0)
50.0
100.0
0°
150°
60° 90° 120°
30°
x’
x
z
xx’z’
y
Figure 24. Schematic measurement plane downwind of the rotor in −30◦ skewed flow
−30
−20
−10
0
10
20
30
40
50
−50−40 −20 0 20 40 50
θ=0°
z, (cm)
−30
−20
−10
0
10
20
30
40
50
−50−40 −20 0 20 40 50
θ=30°
−30
−20
−10
0
10
20
30
40
50
−50−40 −20 0 20 40 50
θ=60°
−30
−20
−10
0
10
20
30
40
50
−50−40 −20 0 20 40 50
θ=90°
−30
−20
−10
0
10
20
30
40
50
−50−40 −20 0 20 40 50
θ=120°
−30
−20
−10
0
10
20
30
40
50
−50−40 −20 0 20 40 50
___
θ=150°
y (cm)
UU∞
00.050.10.150.20.250.30.350.40.450.50.550.60.650.70.750.80.850.90.9511.051.11.151.21.251.31.351.41.451.5
Figure 25. Flow U velocity component distribution at plane x =′ 40cm for six blade positions. Measurementplane as described in figure 26
17 of 21
American Institute of Aeronautics and Astronautics
U
U
15.0°
70.0
zz’
x(0,0,0)
x(0,0,0)
xyz
100.0
50.0
y
z
x
z’=0
80.0
Meas. plane
x = -10
Meas. plane
x = 40
15.0°
50.0
0°
150°60° 90° 120°
30°
x
x’
z
xx’z’
y
Figure 26. Schematic measurement plane downwind in −15◦ skew
for the 0◦, 15◦ and 30◦,cases at the 90◦ rotation instant. The previously mentioned asymmetry of the flowin relation to the z = 0 plane is evident in this plot.
D. Comparison across the rotor
Figure 28 presents a detail of the results for two rotations moments at three positions (upwind of, within anddownwind of the rotor), for planes in the same z−y positions, as defined in figure 29, for the non-skewed flowcase. It is possible to see the increasing loss of momentum in the flow as it is moving downwind. It is alsonoticeable that the difference between the result within the rotor and downwind is not as large as the onebetween the upwind and within rotor measurements. This is in line with the idea that most of the energyconversion is done in the upwind passage of the blade. An important observation is to note that the tipvortices measured downwind of the rotor are generated in the upwind passage of the blade; in fact, the tipvortices generated in the downwind passage of the blade are, in comparison with the tip vortices generatedupwind, so weak that they could not be individually observed, neither by smoke visualizations nor by thehotwire measurements.
V. Thrust measurements
The thrust measurement were performed using a balance on which the turbine model was placed. Inskewed flow measurements were performed to obtain the component of the generated thrust aligned withand the component perpendicular to U∞ .
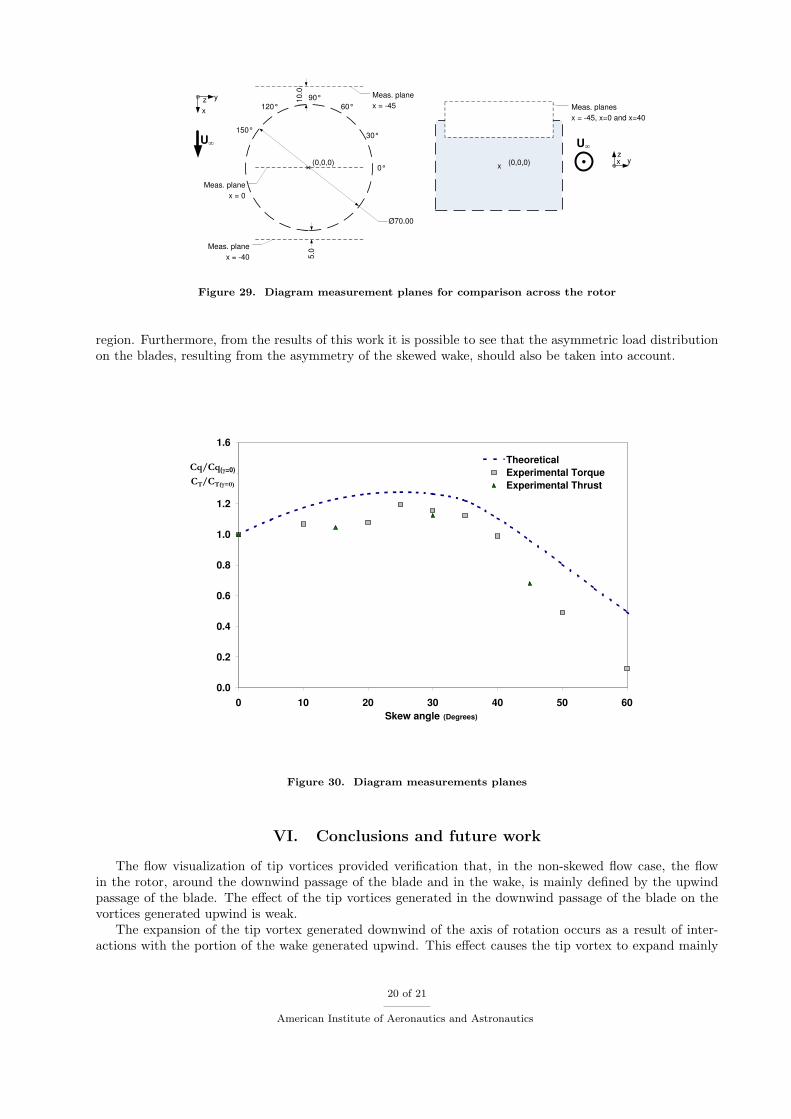
Figure 30 presents a comparison between the experimental results for thrust coefficient obtained in thisexperimental work, the torque coefficient obtained in the experimental work of Mertens1 and the theoreticalprediction of Ferreira6 for torque and thrust (the line represents both torque and thrust prediction, that,according to the theory, should be the same). According to the theoretical prediction, the variation of thrustand torque coefficient with increasing skew angle should follow the same tendency. Comparing the theoreticalresults with the experimental results of1 for torque and the experimental results for thrust obtained now,it seems clear that they do in fact follow the same variation with skew angle. The theoretical method ofis based on the concept that the portion of the downwind passage of the blade not submerged in the wakeof the upwind passage will contribute to an additional torque generation in comparison to the non-skewedflow case. The results shown in figures 21, 23 and 25 support that line of reasoning, since it is possible tosee that most of the energy on the flow reaching the downwind passage of the blade is in the portion that isnot submerged in the upwind blade passage wake, as opposed to what occurs in the non-skewed case. Thedifference between the theoretical approach and the experimental results was already stated by;6 the portionof the blade not submerged in the wake of the upwind passage of the blade does not, due to the induced angleof attack, generate as much torque as the mid-blade section in the upwind blade passage. This implies thatthe theoretical method will overestimate the increase in torque and thrust, especially in the small skew angle
18 of 21
American Institute of Aeronautics and Astronautics
-1.5
-1
-0.5
0
0.5
1
1.5
0.0 0.2 0.4 0.6 0.8 1.0 1.2 1.4 1.6
z/H No-skew
15˚ skew
30˚ skew
U/U
Figure 27. Comparison of the velocity profiles in the measurement planes downwind of the rotor for the 0◦,15◦ and 30◦,cases at the 90◦ rotation instant
15
20
25
30
35
−30 −20 −10 0 10 20 30
z (cm)
x=−10 cmθ=0°
15
20
25
30
35
−30 −20 −10 0 10 20 30
θ=90°
15
20
25
30
35
−30 −20 −10 0 10 20 30
x=0 cm
15
20
25
30
35
−30 −20 −10 0 10 20 30
15
20
25
30
35
−30 −20 −10 0 10 20 30
x=5 cm
15
20
25
30
35
−30 −20 −10 0 10 20 30y (cm)
UU∞___
0.1
0.2
0.3
0.4
0.5
0.6
0.7
0.8
0.9
1
1.1
1.2
1.3
1.4
1.5
1.6
Figure 28. Flow U velocity component distribution at plane x=-45cm ,x=0cm x=40cm for six blade positions.Measurement plane as described in figure 29
19 of 21
American Institute of Aeronautics and Astronautics
yzx
Ø70.00
yz
x
UU
(0,0,0) (0,0,0)
Meas. plane
x = -45
Meas. plane
x = 0
Meas. plane
x = -40
Meas. planes
x = -45, x=0 and x=40
x x
5.0
10.0
30°
60°90°
120°
150°
0°
Figure 29. Diagram measurement planes for comparison across the rotor
region. Furthermore, from the results of this work it is possible to see that the asymmetric load distributionon the blades, resulting from the asymmetry of the skewed wake, should also be taken into account.
0.0
0.2
0.4
0.6
0.8
1.0
1.2
1.4
1.6
0 10 20 30 40 50 60
Skew angle (Degrees)
Cq/Cq( =0)
CT/CT( =0)
Theoretical
Experimental Torque
Experimental Thrust
Figure 30. Diagram measurements planes
VI. Conclusions and future work
The flow visualization of tip vortices provided verification that, in the non-skewed flow case, the flowin the rotor, around the downwind passage of the blade and in the wake, is mainly defined by the upwindpassage of the blade. The effect of the tip vortices generated in the downwind passage of the blade on thevortices generated upwind is weak.
The expansion of the tip vortex generated downwind of the axis of rotation occurs as a result of inter-actions with the portion of the wake generated upwind. This effect causes the tip vortex to expand mainly
20 of 21
American Institute of Aeronautics and Astronautics

after 1 rotor diameter downwind from its generation point.In the 30◦ skew case, the interaction of the tip vortex generated in the most upwind blade position in
the flow on the most downwind blade is highly significant and could partly explain the difference betweenthe theoretical expected thrust variation with skew and the experimental results observed.
The experimental results for thrust are in line with those obtained for torque, showing the increase ofthrust with skew until the 30◦−40◦ region and subsequent decrease with increasing skew angle, as predictedby the theoretical method.
The hotwire measurements allow for a better understanding of the flow around the downwind passage ofthe blade. This is important since the gain in power obtained in skew flow occurs in the downwind passageof the blade.
The asymmetry of the flow at the downwind passage, which implies a asymmetric circulation and loaddistribution, reinforces the idea that the extra power generated in comparison to the non-skewed case isgenerated in the part of the blade that in the downwind passage is not ”shadowed” by the wake of theupwind passage.
The use of hotwires, although allowing interesting and important results, presents serious limitationswhile analyzing the H-Darrieus, since it does not, due to the physical constraints imposed by the supportspars of the blades, allow measurements inside the complete volume of the rotor. Future measurements ofthe H-Darrieus in skewed and non-skewed conditions using Particle Imaging Velocimetry (PIV) are thereforeplanned. PIV will allow velocity measurements to be obtained in regions where a hotwire cannot be placed.
The occurrence of dynamic stall was not analyzed in this work. Its influence and variation with skew willbe the object of future research.
The analysis of other configurations of vertical-axis machines in skewed conditions (V-shaped and Tro-poskien) is also planned to be performed in the new open-jet facility of DUWIND.
VII. Acknowledgements
The authors would like to thank:
• Wouter Haans for his help on all of the stages of the experimental work (including the definition,realization and processing of the data). His work on horizontal machines inspired a large part of thework now developed
• Simon Toet, who made all the experimental work possible, for his always intelligent and ’to the point’remarks and suggestions
• Sander Mertens, who made the data of his own work and is valuable suggestions available
References
1Mertens S., Kuik G. van, Bussel G. v., “Performance of a H-Darrieus in the Skewed Flow on a Roof,” Journal of SolarEnergy Engineering, Vol. 125, 2003, pp. 433–440.
2Haans W., Sant T., Kuik. G. v., Bussel G. v., “Measurement and modelling of tip vortex paths in the wake of a HAWTunder yawed flow conditions,” AIAA-2005-0590 , 2005.
3Haans W., Sant T., Kuik. G. v., Bussel G. v., “Measurement of tip vortex paths in the wake of a HAWT under yawedflow conditions,” Journal of Solar Energy Engineering, November 2005 (accepted).
4Michos A., Bergeles G., Athanassiadis N., “Hot-wire measurements in the wake of a Darrieus rotor,” Proceedings EuropeanWind Energy onference 1984 , 1984.
5Haans W., Sant T., Kuik. G. v., Bussel G. v., “Velocity measurements in the near wake of a horizontal axis wind turbine,”Proceedings of the 31st European Rotorcraft Forum, Florence, Italy, September 2005.
6Ferreira C., Kuik G. van, Bussel G. v., “An analytical method to predict the variation in performance of an H-Darrieusin skewed flow and its experimental validation,” Accepted in the European Wind Energy Conference 2006 , 2006.
21 of 21
American Institute of Aeronautics and Astronautics