2007 namm global report music usa
TRANSCRIPT
�
2007 NAMM GLOBAL REPORTMUSIC USAA STATISTICAL REVIEW
OF THE MUSIC PRODUCTS INDUSTRY
�
2007 NAMM GLOBAL REPORTMUSIC USAA STATISTICAL REVIEW
OF THE MUSIC PRODUCTS INDUSTRY

�
A MessAge froM the ChAirMAn & President/Ceo
The state of the music products industry continues to change rapidly, and making good business decisions in today’s turbulent environment depends on having the latest information. The 2007 NAMM Global Report, Featuring Music USA provides N�MM Members with the most current statistics of various market segments and countries, as well as commentary from leaders of the global music products market.
This edition presents a stronger focus on our global portion of the report than in previous years, as our international section has grown. We now feature 1� countries, adding Norway and Switzerland to the fold.
This year we see industry trends changing: the continued emergence of China and India, slowing sales in the United States and mixed results in most categories across all countries. Electric and acoustic guitars, which have been one of the main driving forces globally in recent years, only showed increased sales in about half of the regions surveyed. Piano purchases were slow in almost all markets, whereas digital piano sales showed upward movement in several countries. One successful segment is the stringed instrument category, which enjoyed increased sales in nearly every market. �ll in all, �006 was a year of changing times and varied markets across most regions.
N�MM has compiled this information from many sources in an effort to support you in your business. So whether you’re using this report to shed light on your local market or to plan a multinational product launch, we hope that this information will help you identify trends and directions that can assist you in making good decisions for your business.
We hope you will take advantage of this valuable information to help position your business for success, overcome today’s challenges and seek out the opportunities offered by change.
Sincerely,
dennis houlihan, Chairman Joe Lamond, President/CEO

�
MANAGING EDITORKen Wilson
INTERNATIONAL AFFAIRSBetty Heywood
RESEARCH ANALYSTErin Block
LAYOUT/DESIGNMegan Nelson
COPY EDITORLaurie Gibson
Contents
2 Message from the Chairman & President/CEO 4 Understanding the U.S. Data 5 U.S. Industry Revenue at a Glance 7 Introduction the U.s. segment data
9 The Fretted Instrument Market 12 The Organ Market 13 The Piano Market 15 The School Music Market 17 The �udio Products Market 20 The Signal Processing Market 22 The Percussion Market 25 The DJ Market 27 The Electronic Music Market 31 The Printed Music Market 31 The Portable Keyboard Market 33 The Karaoke Market 34 The �ccessory Market
Music and sound U.s. industry summary & imports and exports
36 U.S. Industry Summary 42 U.S. Imports and Exports of Music and Sound Products
the nAMM global report
50 Understanding the International Data 51 �ustralia 58 �ustria 64 Canada 70 China 80 Germany 88 Italy 94 Japan102 Norway107 Spain112 Switzerland117 United Kingdom
People’s Attitudes toward Music
123 United States Gallup Poll136 �ustralian Nexus Survey146 United Kingdom Nexus Survey159 Combined Survey Comparison
Music retailing
169 Music Retailing Cost of Doing �usiness181 N�MM Executive Committee & �oard of Directors182 �cknowledgments
�
MethodoLogy
The NAMM Global Report is a collection of information gathered from many sources, agencies and associations around the world. N�MM does not verify any of the information and cannot and does not guarantee the accuracy of the data.
The statistics N�MM receives are summaries; N�MM personnel do not see or manipulate any individual company information. Sources for each piece of data are listed at the beginning of each section and can be summarized as follows:
U.S. sales information and commentary is provided by The Music Trades magazine; import and export numbers are collected by the U.S. Census �ureau. The Cost of Doing �usiness Survey is a program funded by N�MM in which N�MM Members contribute business information to Industry Insights (a third party research company), which aggregates the information and provides N�MM with the summary and commentary published in this edition. N�MM personnel do not see any individual company information.
Sales information and commentaries in the International section are provided by associations in each country. International economic, demographic and trade data are gathered from the CIA World Fact Book, and the International music industry numbers are provided by The Music Trades magazine.
The U.S. data in the People’s �ttitude Toward Music section is from a survey funded by N�MM and conducted every three years by the Gallup Organization. Information from the U.K. and �ustralia reflect the results of surveys conducted by Nexus Research Pty Ltd.
UnderstAnding the U.s. dAtA
The unit sales and retail values in this report were compiled by the staff of The Music Trades magazine, which provides the following overview of the methodology used:
Dollar and unit figures represent the quantity of product shipped to retailers in the United States, not actual sell-through volumes. Unit and dollar volumes are derived from a combination of import and export data gleaned from government agencies in the United States, China, Japan, Korea, Indonesia and the European Union; European, Japanese and U.S. trade association reports; financial filings of publicly traded companies in the United States and abroad; sales data provided by a cross-section of U.S. retailers, and informed estimates. Initially, the wholesale value of product shipped to retailers is computed. Then retail values are computed by adding an average margin, which varies among product categories.
Please note that data on the following pages does not include any figures on the used instrument market, which is extremely substantial, but difficult to measure with any accuracy.

�
U.s. indUstry revenUe At A gLAnCe
Product Sales Totals(Retail 2005–2006)
0 300 600 900 1200 1500
Drum Machines
Sound Modules
Multi Track Recorders
Institutional Organs
Home Organs
Stringed Instruments
Karaoke Products
Other Electronic Products
Keyboard Synthesizers
DJ Gear
Electronic Player Pianos
Digital Pianos
Cables
Signal Processing
Portable Keyboards
Instrument Amplifiers
Computer Music Products
General Accessories
Acoustic Pianos
Microphones
Wind Instruments
Percussion
Printed Music
Sound Reinforcement
Fretted Products
$123.14
$111.83$115.32
$111.91$89.19
$77.85$68.01
$68.43$77.73
$66.14$63.14
$53.97$48.75
$6.04$5.81
$5.92$6.26
$124.60
$147.90
$132.65
$172.80$143.75
$147.68$151.37
$120.47$108.86
$221.65$218.54
$232.03$218.78
$397.09$360.36
$365.62
$420.34
$416.58$427.83
$550.57$449.28
$446.73$458.65
$470.37$485.59
$571.99$581.71
$572.68$580.86
$919.30$865.43
$1,322.62
$1,279.41
2005 2006
(in millions of dollars)

6
U.s. indUstry revenUe At A gLAnCe
-25 -20 -15 -10 -5 0 5 10 15
Karaoke Products
Acoustic Pianos
Digital Pianos
Home Organs
Electronic Player Pianos
Multi Track Recorders
Other Electronic Products
Instrument Amplifiers
Sound Reinforcement
Portable Keyboards
Institutional Organs
Drum Machines
Fretted Products
Signal Processing
DJ Gear
Percussion
Printed Music
Cables
Microphones
General Accessories
Keyboard Synthesizers
Wind Instruments
Sound Modules
Stringed Instruments
Computer Music Products
2006 Industry Sales Gains and Declines
14.97%
13.59%
5.74%
3.12%
3.24%
2.70%
2.67%
2.50%
1.70%
1.43%
1.19%
-1.40%
-3.27%
-3.81%
-4.54%
-5.71%
-5.86%
-9.25%
-9.64%
-9.67%
-10.31%
-12.64%
-16.81%
-18.40%
-20.30%

�
introdUCtion
�006 Industry �nalysis Since 199�, there have been only two years where sales actually declined from the previous year. Last year was one of them, as the aggregate sales of instruments, audio gear, accessories and printed music dipped �.� percent to $�.� billion from the record level of $�.8 billion, set in �00�. In �000, the industry’s other
“down” year, causality was easily identified: that year the stock market tanked, wiping out an estimated $� trillion of the nation’s net worth. The source of the industry’s woes in �006, however, is not so clear-cut.
Current macro economic data makes for confusing and downright contradictory headlines. In March �00�, the Department of Commerce noted that new housing starts had dropped �� percent and that median housing prices were off � percent. In the same month, though, the Federal Reserve issued a study indicating that household net worth was at record levels. The respected Conference �oard study has recently placed the often-cited “Consumer Confidence Index” at a five-year high, yet voters in the recent mid-term elections expressed obvious displeasure with the current state of affairs. While unemployment levels hover near �0-year lows, opinion polls show high levels of consumer uncertainty. What to make of a situation where information gatherers seem to be working in different universes?
In a large, dynamic and diverse place like the United States, broad generalities are to be taken with a liberal grain of salt. If predicting the outlook, attitudes and behavior of a single teenager strains the ability of even the most concerned parent, is it possible for anyone to neatly sum up how �00 million people are going to behave from one day to the next? Sweeping generalities are also not too helpful in assessing what we call the music products industry. This is a highly fragmented business made up of diverse product categories that serve very different consumers, face different challenges and operate in different competitive environments. For example, the difficulties facing the church organ market have very little to do with the difficulties facing guitar makers. �ut for all the diversity, there do appear to be a few larger issues that have applied downward pressure on industry sales.
Unlike the stock market crash of �000, the magnitude and impact of the drop in housing prices has been much harder to measure. That doesn’t mean it hasn’t had an impact, however. With appraised values off anywhere between � percent and
�� percent (depending on the region), many homeowners no doubt feel less flush, and less in the mood to spring for big-ticket discretionary items. �s noted elsewhere in this report, the sale of home keyboards has closely followed the trajectory of new housing starts.
Over the past 1� months, the price of commodities, from copper to petroleum, has risen at a fast clip. Shipping costs have also moved up, particularly on freight from �sia to the United States. It would stand to reason that these rising costs would translate into price increases on most music products. In reality, however, prices on most Chinese goods either remained flat or fell slightly. We interpret this as a sign of major over-capacity issues in China that have prompted factories to sharpen prices in an effort to hang on to business.
Methodology also helps explain some of the slowdown in industry sales last year. The dollar and unit figures in this report represent the quantity of product shipped to retailers in the United States, not actual sell-through volumes. �ssessments from the largest to the smallest retailers in the country indicate that the entire distribution channel spent the better part of �006 struggling to work down excess inventory. The over-inventorying was particularly acute in the fretted instrument category. From this we conclude that the decline in consumer activity was not as acute as our sales data indicates.
Over the years, we have continually looked (with little success) for economic indicators that can be used to forecast music product sales. The problem is, unlike mass consumer goods (e.g., autos or home appliances) the specialized music business is somewhat insulated from the larger economy. The industry has prospered in some economically challenging times and floundered in boom times. That said, the best forecasting tool we have encountered, and it’s far from perfect, is the U.S. Census.
Much has been made about baby boomers and their interest in music making, and the industry’s broadening demographic appeal. In reality however, the 1�-to-��-year-old age group buys about �� percent of everything we sell. That’s where the Census provides some good news. If Census projections are to be believed, this vital age window is set to expand by 1.� to � percent a year until �0�0, after which they stop making
U.S. Segment Data

8
0
1
2
3
4
5
6
7
8
'06'05'04'03'02'01'00'99'98'97'96'95
Industry Total
Ret
ail V
alue
in $
bill
ions
2005–06 4.19% 10-Year 21.63%
Introduction, continued
predictions. If past economic progress is any guide, a larger potential market with more money to spend is grounds for optimism and reason to think that it will be at least another 1� years before industry sales turn down again.
� few words about the methodology underlying the sales numbers in this report. Unit and dollar volumes are derived from a combination of import and export data gleaned from government agencies in the United States, China, Japan, Korea, Indonesia and the European Union; European, Japanese and U.S. trade association reports; financial filings of publicly traded companies in the United States and abroad; sales data provided by a cross-section of U.S. retailers; and informed estimates. We initially compute a wholesale value of product shipped to retailers. Retail values are computed by adding an average margin, which varies among product categories.

9
U.s. segMent dAtA
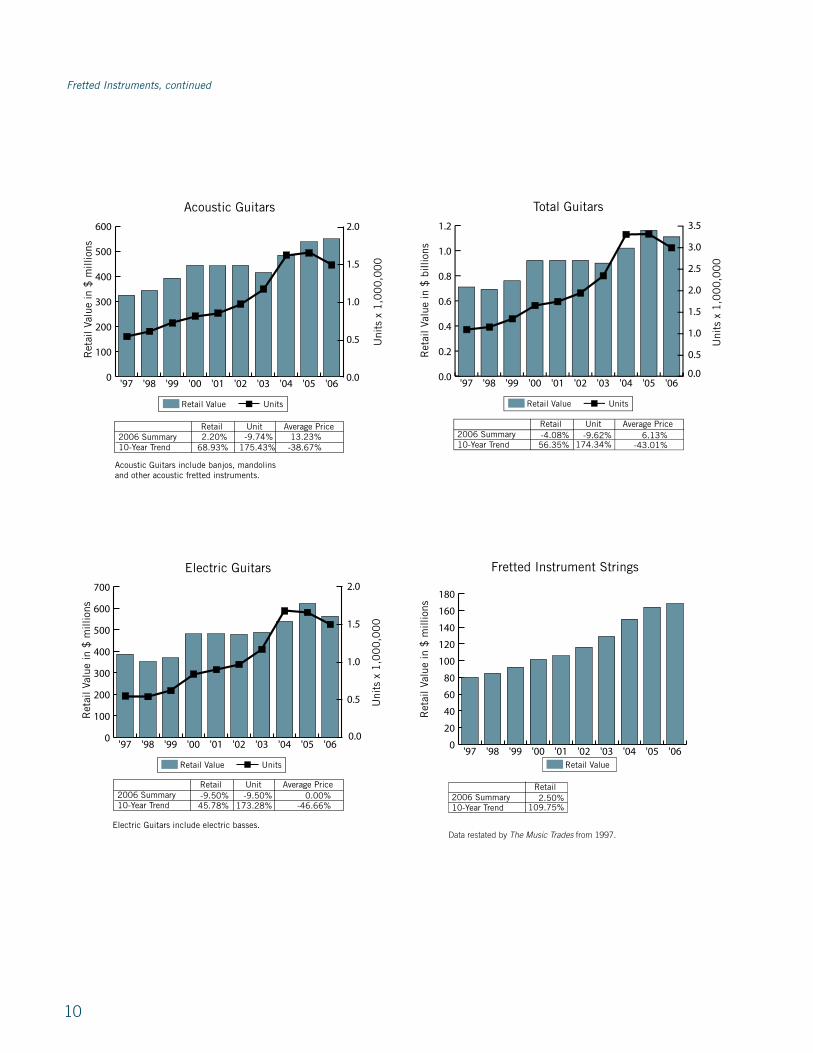
Fretted InstrumentsThe guitar industry’s growth streak came abruptly to a halt in �006 as sales of both electric and acoustics trended down. In both electrics and acoustics, the sales declines were concentrated exclusively in the entry-level price points. In price points over $�00, unit sales either held their own or advanced. �s previously mentioned, �006 saw major increases in all commodity prices, including wood, metal and energy. However, Chinese factories, scrambling to hold on to volume, actually cut prices during the year. The average landed unit value of guitars entering the United States from China dropped �.� percent during the year, suggesting a highly competitive manufacturing environment.
In dollars and units, the guitar is the single largest product category in the industry by a fairly wide margin. �ut the sales numbers don’t tell the entire story. In addition to spending on instruments, amplifiers, strings and stomp boxes, guitarists purchase a disproportionate amount of sound and recording gear, not to mention accessories, generating close to �0 percent of total industry revenue. Consequently, any slippage in guitar sales is cause for serious concern.
�ssessing a sales trend is not exactly like conducting a science experiment where cause and effect can be easily isolated and quantified. �s a result, it’s impossible to determine with precision exactly why guitar sales headed south after 10 years of brisk growth. Certainly, macro social and economic conditions weren’t particularly helpful. Higher gas prices for much of �006 took a bite out of discretionary income, falling hardest on the critical 1�-to-��-year-old demographic. This provides a plausible explanation for the disproportionate decline in entry-level price points. Unit sales of acoustic guitars retailing for under $��0 fell by 1� percent (dollar volume held steady, due to an increase in slightly higher-priced instruments with onboard pickups) while electrics in the under-$��0 price point were off by 11 percent. Popular music didn’t help things much, either. In �006, hip-hop music, which makes little use of the guitar, dominated the �illboard charts. (�ut after the first of the year, rap and hip-hop sales unexpectedly cratered, while sales from guitar-centric country acts increased.)
The numbers in this report reflect the instruments sold through the channel of specialized music retailers, and do not include sales figures from mass merchants. Extensive anecdotal evidence, ranging from comments by Guitar Center management to surveys by The Music Trades of the other �,000 MI retailers indicate that expanded distribution of guitars and related products through the mass market channel adversely impacted entry-level sales in the MI channel. However, total imports of acoustic guitars with a retail price
of under $�99 dropped by �0 percent in �006 and imports of electrics were off by 1�.6 percent, suggesting that mass merchants didn’t have a stellar year with guitars in �006, either. Obviously, the decline is not just a case of one distribution channel gaining market share at the expense of another.
The best-case scenario is that the decline in guitar sales was the result of temporary economic conditions and will reverse as consumers gain confidence. The worst-case suggests that the industry may be approaching something of a saturation point. If manufacturers’ warranty cards are any guide, about �0 percent of all guitars are purchased by males in the 1� to �6 year-old age range, a group that numbered approximately �� million at the end of �00�. Over the past decade the industry has sold well over �0 million guitars. Is it possible that most of the potential guitar prospects already have an instrument? �s noted earlier, given that we can’t test any of these hypotheses with a controlled experiment, they are just speculation.
U.S. Segment Data
Retail Value Market Share
Fretted Instrument
Strings10.3%
Instrument Amplifiers
22.0%
Electric Guitars34.3%
Acoustic Guitars33.4%
10
0
100
200
300
400
500
600
700
'06'05'04'03'02'01'00'99'98'97
Electric Guitars
Ret
ail V
alue
in $
mill
ions
Uni
ts x
1,0
00
,00
0
Retail Value Units
0.0
0.5
1.0
1.5
2.0
0605'04'03'02'01'00'99'98'97
0
200
400
600
800
1000
1200
1400
1600
1800
'04 '03 '02 '01 '00 '99 '98 '97 '96
2006 Summary10-Year Trend
Retail Unit Average Price-9.50%45.78%
-9.50%173.28%
0.00%-46.66%
Electric Guitars include electric basses.
0.0
0.2
0.4
0.6
0.8
1.0
1.2
'06'05'04'03'02'01'00'99'98'97
Total Guitars
Ret
ail V
alue
in $
bill
ions
Retail Value Units
0.0
0.5
1.0
1.5
2.0
2.5
3.0
3.5
0605'04'03'02'01'00'99'98'97
Uni
ts x
1,0
00
Import Value Units
Uni
ts x
1,0
00
,00
0
2006 Summary10-Year Trend
Retail Unit Average Price-4.08%56.35%
-9.62%174.34%
6.13%-43.01%
0
100
200
300
400
500
600
'06'05'04'03'02'01'00'99'98'97
Acoustic Guitars
0.0
0.5
1.0
1.5
2.0
0605'04'03'02'01'00'99'98'97
Ret
ail V
alue
in $
mill
ions
Uni
ts x
1,0
00
,00
0
Retail Value Units
-9.74%2.20% 13.23% 175.43%68.93% -38.67%
2006 Summary10-Year Trend
Retail Unit Average Price
Acoustic Guitars include banjos, mandolins and other acoustic fretted instruments.
0
20
40
60
80
100
120
140
160
180
'06'05'04'03'02'01'00'99'98'97
Fretted Instrument Strings
'04'03'02'01'00'99'98'97'96
Ret
ail V
alue
in $
mill
ions
Retail Value
2006 Summary10-Year Trend
Retail 2.50%
109.75%
Data restated by The Music Trades from 1997.
Fretted Instruments, continued

11
0
50
100
150
200
250
300
350
400
450
'06'05'04'03'02'01'00'99'98'97
Instrument Amplifiers
Ret
ail V
alue
in $
mill
ions
0.0
0.2
0.4
0.6
0.8
1.0
1.2
1.4
0605'04'03'02'01'00'99'98'97
Uni
ts x
1,0
00
,00
0
-12.00% -9.25% 3.13%90.16%-0.45% -47.65%
2006 Summary10-Year Trend
Retail Unit Average Price
Instrument Amplifiers include tube, digital and solid-state amplifier heads, speaker enclosures and other self-contained amplifiers for guitars, basses and other musical instruments.
Retail Value Units
0.0
0.2
0.4
0.6
0.8
1.0
1.2
1.4
1.6
1.8
'06'05'04'03'02'01'00'99'98'97
Total Fretted Instruments
'04 '03 '02 '01 '00 '99 '98 '97 '96
Ret
ail V
alue
in $
bill
ions
Retail Value
2006 Summary10-Year Trend
Retail-4.65%42.23%
Total Fretted Instruments include acoustic guitars, electricguitars, fretted instrument strings and instrument amplifiers.
U.S. Segment Data
0.0
0.2
0.4
0.6
0.8
1.0
1.2
1.4
'06'05'04'03'02'01'00'99'98'97
Fretted Instrument Market
'04'03'02'01'00'99'98'97'96
Ret
ail V
alue
in $
bill
ions
Retail Value
2006 Summary10-Year Trend
Retail-3.27%61.76%
Fretted Instrument Market includes acoustic guitars, electricguitars and fretted instrument strings.

1�
Home and Church Organs�oth segments of the organ market recorded disappointing results in �006. �s retailers have long noted, there never has been a true “market” for home organs. Demand has been generated almost exclusively by the industry’s creative efforts, which have long centered on lesson programs offered by retailers. Last year’s decline in unit sales appears to be the result of fewer retailers doing the necessary work in the field to cultivate the demand for home organs.
The church market has been adversely affected by an ongoing shift from a traditional style of worship service utilizing an organ and choir toward a more contemporary service that uses guitars, keyboards and other instruments.
-12.64%
0
10
20
30
40
50
60
70
80
90
'06'05'04'03'02'01'00'99'98'97
Home Organs
0
2
4
6
8
10
12
14
16
'04 '03 '02 '01 '00 '99 '98 '97 '96
Ret
ail V
alue
in $
mill
ions
Uni
ts x
1,0
00
Retail Value
Retail Value Units
Retail Value Units
0
2
4
6
8
10
12
14
16
0605'04'03'02'01'00'99'98'97
-19.77% 8.89%-49.18%-17.68% 61.98%
2006 Summary10-Year Trend
Retail Unit Average Price
0
10
20
30
40
50
60
70
80
90
'06'05'04'03'02'01'00'99'98'97
Institutional Organs
0.0
0.5
1.0
1.5
2.0
2.5
3.0
3.5
4.0
4.5
'04'03'02'01'00'99'98'97'96
Ret
ail V
alue
in $
mill
ions
Uni
ts x
1,0
00
Retail Value
Retail Value Units
Retail Value Units
0.0
0.5
1.0
1.5
2.0
2.5
3.0
3.5
4.0
4.5
0605'04'03'02'01'00'99'98'97
-8.01%-4.54% 3.77%-7.42%16.39% 25.71%
2006 Summary10-Year Trend
Retail Unit Average Price
Retail Value Market Share
Institutional Organs48.1%
Home Organs51.9%
0
20
40
60
80
100
120
140
160
'06'05'04'03'02'01'00'99'98'97
Total Organs
0
2
4
6
8
10
12
14
16
18
'06'05'04'03'02'01'00'99'98'97
Ret
ail V
alue
in $
mill
ions
Uni
ts x
1,0
00
Retail Value
Retail Value Units
Retail Value Units
0
2
4
6
8
10
12
14
16
18
0605'04'03'02'01'00'99'98'97
-16.65%-8.92% 9.28%-41.45%-4.17% 63.67%
2006 Summary10-Year Trend
Retail Unit Average Price

1�
Retail Value Market Share
ElectricPlayer Pianos
18.3%
Digital Pianos19.8%
Grand Pianos44.1%
Vertical Pianos17.8%
0
50
100
150
200
250
300
350
400
450
500
'06'05'04'03'02'01'00'99'98'97
Grand Pianos
0
5
10
15
20
25
30
35
40
'05'04'03'02'01'00'99'98'97'96
Ret
ail V
alue
in $
mill
ions
Uni
ts x
1,0
00
Retail Value
Retail Value Units
Retail Value Units
0
5
10
15
20
25
30
35
40
'06'05'04'03'02'01'00'99'98'97
2006 Summary10-Year Trend
Retail Unit Average Price-23.50%-19.98% 4.61%
-5.01%-22.12% -18.01%
U.S. Segment Data
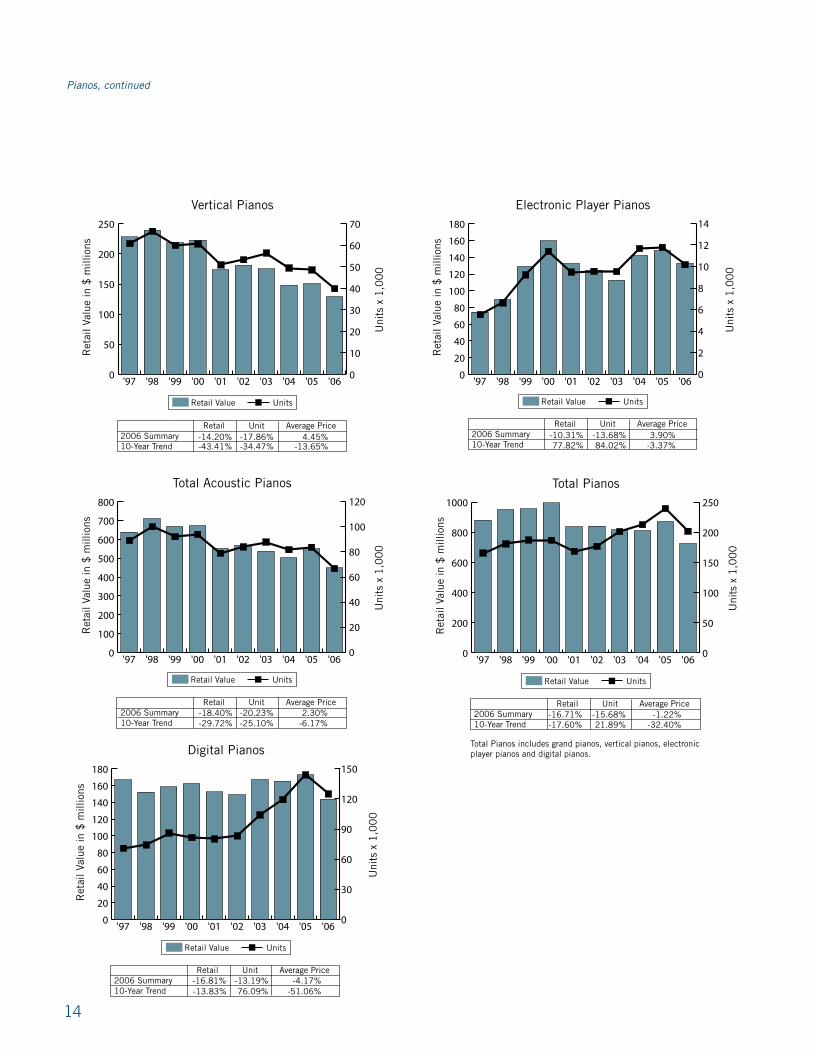
The Piano MarketSales of existing homes dropped 9 percent to 6.� million units in �006, versus sales of �.1 million in �00�. The drop in the sale of new homes was even greater, sinking �1 percent to just over 1 million units, compared with 1.�8 million in �00�. These numbers help explain the significant sales decline in all piano categories. Grand unit sales dropped ��.� percent; verticals were off 1�.9 percent; player-equipped units fell 19.� percent; and even digitals dropped 1�.� percent. Fewer people buying new homes or moving apparently translated into fewer piano sales. �lthough it provides little comfort to piano makers and retailers, it’s worth noting that manufacturers of furniture and home appliances blamed their disappointing sales results on the housing slowdown.
�ssessing the sales data by country of origin, size and price point, it’s clear that the slowdown affected every segment of the market. Lower price points generally suffered a steeper decline, but every category showed double-digit declines.
�lthough the slowdown in the housing market, whether in crimping consumers’ sense of wealth or reducing their need for a new piano, had a huge, negative effect on the market, retailers cite other factors as well. � common lament is that an over-reliance on out-of-store promotional events has conditioned consumers to avoid stores and wait for “blowout” sales before considering a purchase. �nother complaint is that excessive price focus in promotions has “commoditized” pianos in the eyes of buyers to the point that they assess only price without examining the underlying value.
1�
0
50
100
150
200
250
'06'05'04'03'02'01'00'99'98'97
Vertical Pianos
0
10
20
30
40
50
60
70
'04 '03 '02 '01 '00 '99 '98 '97 '96
Ret
ail V
alue
in $
mill
ions
Uni
ts x
1,0
00
Retail Value
Retail Value Units
Retail Value Units
0
10
20
30
40
50
60
70
'06'05'04'03'02'01'00'99'98'97
-17.86%-14.20% 4.45%-34.47%-43.41% -13.65%
2006 Summary10-Year Trend
Retail Unit Average Price
0
100
200
300
400
500
600
700
800
'06'05'04'03'02'01'00'99'98'97
Total Acoustic Pianos
0
20
40
60
80
100
120
'04 '03 '02 '01 '00 '99 '98 '97 '96
Ret
ail V
alue
in $
mill
ions
Uni
ts x
1,0
00
Retail Value
Retail Value Units
Retail Value Units
0
20
40
60
80
100
120
'06'05'04'03'02'01'00'99'98'97
-20.23%-18.40% 2.30%-25.10%-29.72% -6.17%
2006 Summary10-Year Trend
Retail Unit Average Price
0
200
400
600
800
1000
'06'05'04'03'02'01'00'99'98'97
Total Pianos
0
50
100
150
200
250
'06'05'04'03'02'01'00'99'98'97
Ret
ail V
alue
in $
mill
ions
Uni
ts x
1,0
00
Retail Value
Retail Value Units
Retail Value Units
0
50
100
150
200
250
'06'05'04'03'02'01'00'99'98'97
Total Pianos includes grand pianos, vertical pianos, electronic player pianos and digital pianos.
-15.68%-16.71% -1.22%21.89%-17.60% -32.40%
2006 Summary10-Year Trend
Retail Unit Average Price
0
20
40
60
80
100
120
140
160
180
'06'05'04'03'02'01'00'99'98'97
Digital Pianos
0
30
60
90
120
150
'04'03'02'01'00'99'98'97'96
Ret
ail V
alue
in $
mill
ions
Uni
ts x
1,0
00
Retail Value
Retail Value Units
Retail Value Units
0
30
60
90
120
150
'06'05'04'03'02'01'00'99'98'97
-13.19%-16.81% -4.17%76.09% -13.83% -51.06%
2006 Summary10-Year Trend
Retail Unit Average Price
Pianos, continued
0
20
40
60
80
100
120
140
160
180
'06'05'04'03'02'01'00'99'98'97
Electronic Player Pianos
0
2
4
6
8
10
12
14
'04 '03 '02 '01 '00 '99 '98 '97 '96
Ret
ail V
alue
in $
mill
ions
Uni
ts x
1,0
00
Retail Value
Retail Value Units
Retail Value Units
0
2
4
6
8
10
12
14
'06'05'04'03'02'01'00'99'98'97
2006 Summary10-Year Trend
Retail Unit Average Price-13.68%-10.31% 3.90%84.02%77.82% -3.37%

1�
School Music
Retail Value Market Share
WoodwindInstruments
48.9%
Stringed Instruments
13.8%
Brass Instruments
37.3%
U.S. Segment Data
0
200
400
600
800
1000
'06'05'04'03'02'01'00'99'98'97
Total Pianos
0
50
100
150
200
250
'06'05'04'03'02'01'00'99'98'97
Ret
ail V
alue
in $
mill
ions
Uni
ts x
1,0
00
Retail Value
Retail Value Units
Retail Value Units
0
50
100
150
200
250
'06'05'04'03'02'01'00'99'98'97
Total Pianos includes grand pianos, vertical pianos, electronic player pianos and digital pianos.
-15.68%-16.71% -1.22%21.89%-17.60% -32.40%
2006 Summary10-Year Trend
Retail Unit Average Price
Unit sales of band and orchestral instruments edged up �.6 percent in �006, driven by the beneficial combination of increased school enrollments and flush state coffers. Dollar volume advanced at a similar pace, reflecting a stable pricing climate. �006 saw a 1.9 percent increase in the number of children enrolled in grades � through 1�, which created an increased market for all types of rental instruments. The fact that all but two of the �0 states enjoyed record tax receipts and budget surpluses was reflected in the increased sale of background brass instruments and educational percussion, products that are typically purchased directly by school systems.
Despite budgetary pressures in schools and an increased emphasis on basic curricula—often at the expense of arts education—music programs are surprisingly durable. This durability is reflected by the fact that unit sales of brass and woodwind instruments over the past five decades have closely tracked enrollment levels. If demographics are any indication, this facet of the industry has another five years (at least) of potential sales growth. � bulge in the number of �- to 10-year-olds will increase school enrollments through �0�0.
Public school music programs have represented the primary market for brass and woodwind instruments since school music programs became popular in the ’�0s. They are somewhat less significant for stringed instruments, due to the fact that recently there has been considerable growth in the number of string programs outside public school systems, whether in private music schools or various community centers. This increase in “private” stringed music programs provides one explanation for why growth in stringed instrument sales has outpaced wind instruments. Lower price points, largely due to imports from China, have also contributed to the sales growth, as students are now more likely to purchase, rather than rent, an instrument.
�lthough computer software and recording systems are considered in this report as two distinct product categories, they in fact are simply two different ways of addressing the same issue: capturing and editing music. Over the past five years, spending on recording has expanded significantly. However, growth in software-based products has come at the expense of self-contained hardware systems.
Virtually no one in the United States under the age of �0 has experienced life without a computer. Unlike preceding generations that modified behaviors and practices to take advantage of readily accessible computing power, this younger demographic has viewed the computer as an indispensable appendage since birth. This generational difference helps the trend.
� shift in the way consumers make use of self-contained recording systems has led to a significant decline in the category. Where the multi-track units were once viewed as a central component of a project studio, they have since been downgraded to the status of a “musical sketch pad”: devices used for capturing musical ideas on the fly, but not for recording and editing a full-range project. �s a result, the most popular units are now low-cost portable units, many of which are only slightly larger than an iPod.
However, declines in the sale of self-contained units have been more than offset by increases in recording software and components designed for use with a personal computer. Sales of recording and sequencing software advanced 11 percent in the past year, despite the continued prevalence of piracy. (Some manufacturers estimate that for every program sold, at least eight are illegally copied.) Sound cards, input/output boxes and various control surfaces enjoyed even more robust growth, advancing 19 percent for the year.

16
0
10
20
30
40
50
60
70
80
90
'06'05'04'03'02'01
Stringed Instruments
0
50
100
150
200
250
300
350
400
450
'04'03'02'01'00
Ret
ail V
alue
in $
mill
ions
Uni
ts x
1,0
00
Retail Value
Retail Value Units
Retail Value Units
0
50
100
150
200
250
300
350
400
450
'06'05'04'03'02'01
Data restated by The Music Trades from 2001.
6-Year Trend13.60% 7.01%
6.32% 17.51%6.16%
-9.52%2006 Summary
Retail Unit Average Price
0
100
200
300
400
500
600
700
'06'05'04'03'02'01
Total School Music
0
200
400
600
800
1000
1200
'04'03'02'01'00
Ret
ail V
alue
in $
mill
ions
Uni
ts x
1,0
00
Retail Value
Retail Value Units
Retail Value Units
0
200
400
600
800
1000
1200
'06'05'04'03'02'01
2006 Summary6-Year Trend
Retail Unit Average Price4.55% 4.58%
-11.53% 5.13%-0.02%
-15.85%
School Music, continued
0
50
100
150
200
250
300
350
400
'06'05'04'03'02'01'00'99'98'97
Woodwind Instruments
0
50
100
150
200
250
300
350
400
450
'04 '03 '02 '01 '00 '99 '98 '97 '96 '95
Ret
ail V
alue
in $
mill
ions
Uni
ts x
1,0
00
Retail Value
Retail Value Units
Retail Value Units
0
50
100
150
200
250
300
350
400
450
'06'05'04'03'02'01'00'99'98'97
10-Year Trend1.48% 2.03%
-13.47% 3.72%-0.53%
-16.57%2006 Summary
Retail Unit Average Price
0
50
100
150
200
250
300
'06'05'04'03'02'01'00'99'98'97
Brass Instruments
0
50
100
150
200
250
300
'04'03'02'01'00'99'98'97'96'95
Ret
ail V
alue
in $
mill
ions
Uni
ts x
1,0
00
Retail Value
Retail Value Units
0
50
100
150
200
250
300
'06'05'04'03'02'01'00'99'98'97
2006 Summary10-Year Trend
Retail Unit Average Price5.63% 4.52%
-17.06% -9.38%1.06%
-8.48%
Retail Value Units

1�
0
50
100
150
200
250
'06'05'04'03'02'01'00'99'98'97
Power Amplifiers
0
100
200
300
400
500
600
'04 '03 '02 '01 '00 '99 '98 '97 '96
Ret
ail V
alue
in $
mill
ions
Uni
ts x
1,0
00
Retail Value
Retail Value Units
Retail Value Units
0
100
200
300
400
500
600
'06'05'04'03'02'01'00'99'98'97
2006 Summary10-Year Trend
Retail Unit Average Price-6.83% -11.32%5.32% 15.98%
5.06%-9.20%
Retail Value Market Share
Non-Powered Mixers9.8%
Powered Mixers5.8%
Speaker Enclosures
28.3% Cables10.3%
Cabled Microphones
22.6%
Wireless Microphones
8.5%
Power Amplifiers
14.8%
Audio Products�006 was a challenging year in the sound reinforcement market. Slowing economic conditions took a toll on unit sales as the general public tightened its spending. Rising costs of raw materials and �sian labor brought the eight-year deflationary trend to a halt. However, in a market where copper prices surged by 80 percent, sheet steel advanced by �0 percent and hourly labor in China was up 1� percent, the average selling prices of most sound gear was up in the mid-single digits at best. This suggests significant over-capacity in �sia and brutal price competition. �t some point in the near term, expect prices to advance at a somewhat faster pace.
The type of audio products that are the staple of the MI distribution channel revolve around what can best be described as “mature technology.” The electro-magnetic paper-coned speaker has been with us for almost a century; analog mixers are based on technology that is nearly as venerable; and the digital switching technology that has made power amps more efficient is approaching its �0th anniversary. Despite the comparative lack of core innovation, improved packaging of these basic technologies has resulted in ongoing shifts in the product mix. The increasing popularity of powered speakers, which are easier to configure and less likely to malfunction, have come at the expense of power amp and powered mixer sales. Unit volumes in both amps and powered mixers trended down last year.
From powering a U� stadium concert to making political pronouncements audible, line-array speakers have long been used for their combination of sound clarity and efficiency. Once employed only in high-end installations and top tour sound systems, line-array technology is now more affordable and is being embraced by the broader market. These products have contributed to the modest increase in enclosure sales.
The bright spot in the sound business has been the continued upward trend in microphone sales, both wired and cable. Two factors seem to be at work here. Top recording engineers have long recognized that individual microphones have special characteristics that color tonal qualities. Musicians who have set up project studios at home have made the same discovery, which has prompted them to add to their collection of microphones. Increasing availability of affordable, high-quality mics from China has also helped spur demand. Secondly, from church sanctuaries to health clubs, to school auditoriums to corporate meeting rooms, the use of microphones is simply on the rise.
U.S. Segment Data
With fewer venues for live music, churches play an increasingly important role in the total sound market. End-user data is sketchy at best, but several manufacturer surveys indicate that houses of worship represent approximately �0 percent of sound reinforcement sales. Given that there are more than �00,000 churches in the United States alone, this should not be a surprise.

18
0
50
100
150
200
250
300
350
400
450
'06'05'04'03'02'01'00'99'98'97
Speaker Enclosures
0
50
100
150
200
250
300
350
'04 '03 '02 '01 '00 '99 '98 '97 '96
Ret
ail V
alue
in $
mill
ions
Uni
ts x
1,0
00
Retail Value
Retail Value Units
Retail Value Units
2006 Summary10-Year Trend
Retail-0.80%40.98%
0
20
40
60
80
100
120
140
160
180
200
'06'05'04'03'02'01'00'99'98'97
Non-Powered Mixers
0
50
100
150
200
250
300
350
'04 '03 '02 '01 '00 '99 '98 '97 '96
Ret
ail V
alue
in $
mill
ions
Uni
ts x
1,0
00
Retail Value
Retail Value Units
Retail Value Units
0
50
100
150
200
250
300
350
'06'05'04'03'02'01'00'99'98'97
2006 Summary10-Year Trend
Retail Unit Average Price-14.90% -6.40%
8.54% 203.77%-9.09%
-64.27%
0
20
40
60
80
100
120
140
160
'06'05'04'03'02'01'00'99'98'97
The Cable Market
0
50
100
150
200
250
300
350
'04 '03 '02 '01 '00 '99 '98 '97 '96
Ret
ail V
alue
in $
mill
ions
Uni
ts x
1,0
00
Retail Value
Retail Value Units
Retail Value Units
2006 Summary10-Year Trend
Retail2.50%
48.76%
Audio Products, continued
0
20
40
60
80
100
120
140
160
'06'05'04'03'02'01'00'99'98'97
Powered Mixers
0
50
100
150
200
250
'04 '03 '02 '01 '00 '99 '98 '97 '96
Ret
ail V
alue
in $
mill
ions
Uni
ts x
1,0
00
Retail Value
Retail Value Units
Retail Value Units
0
50
100
150
200
250
'06'05'04'03'02'01'00'99'98'97
2006 Summary10-Year Trend
Retail Unit Average Price-9.69% -10.58%
-29.63% -3.15%1.00%
-27.34%

19
0
50
100
150
200
250
300
350
'06'05'04'03'02'01'00'99
Cabled Microphones
0
50
100
150
200
250
300
350
'04 '03 '02 '01 '00 '99 '98 '97 '96
Ret
ail V
alue
in $
mill
ions
Uni
ts x
1,0
00
Retail Value
Retail Value Units
Retail Value Units
2006 Summary8-Year Trend
Retail2.00%
29.69%
0
20
40
60
80
100
120
140
'06'05'04'03'02'01'00'99
Wireless Microphones
0
50
100
150
200
250
300
350
'04 '03 '02 '01 '00 '99 '98 '97 '96
Ret
ail V
alue
in $
mill
ions
Uni
ts x
1,0
00
Retail Value
Retail Value Units
Retail Value Units
Data represents estimates of only those microphones sold by the approximately 7,000 MI retailers in the United States, and excludes products aimed at broadcast markets.
2006 Summary8-Year Trend
Retail4.50%
30.89%
U.S. Segment Data
0.0
0.2
0.4
0.6
0.8
1.0
1.2
1.4
1.6
'06'05'04'03'02'01'00'99
Total Sound Reinforcement
0
50
100
150
200
250
300
350
'04 '03 '02 '01 '00 '99 '98 '97 '96
Ret
ail V
alue
in $
bill
ions
Uni
ts x
1,0
00
Retail Value
Retail Value Units
Retail Value Units
2006 Summary8-Year Trend
Retail-2.53%9.19%
All data represents an estimate of sound reinforcement products sold by the approximately 7,000 MI retailers in the United States. Excluded from data are sound products for the cinema, tour sound, broadcast and large fixed-installation markets. Data includes non-powered mixers, power amplifiers, powered mixers, speaker enclosures, cable, cable microphones and wireless microphones.

�0
The Signal Processing MarketComputer-based recording systems have continued to adversely impact the sale of rack-mounted signal processing. Rather than buy a metal box, with compression, delay, reverb or EQ functions, consumers are now just as likely to buy a software
“plug-in” to use with their recording software. �s a result, actual hardware is more and more limited to live performance applications.
Multi-effect floor units and stomp boxes, by contrast, are almost exclusively the province of the guitar market. Despite a down year in guitars, both of these categories advanced, reflecting a continued stream of new products and a larger user base.
Retail Value Market Share
Rack-Mounted Processors
43.7%
Stomp Boxes25.1%
Multi-Effect Floor Processors
31.2%
0
10
20
30
40
50
60
70
'06'05'04'03'02'01'00'99'98'97
Multi-Effect Floor Processors
0
50
100
150
200
250
300
350
'04 '03 '02 '01 '00 '99 '98 '97
Ret
ail V
alue
in $
mill
ions
Uni
ts x
1,0
00
Retail Value
Retail Value Units
Retail Value Units
0
50
100
150
200
250
300
350
'06'05'04'03'02'01'00'99'98'97
2006 Summary10-Year Trend
Retail Unit Average Price3.30% -1.50%
79.73% 150.81%4.88%
-28.34%
0
20
40
60
80
100
120
140
160
'05'05'04'03'02'01'00'99'98'97
Rack-Mounted Processors
0
100
200
300
400
500
600
'04 '03 '02 '01 '00 '99 '98 '97
Ret
ail V
alue
in $
mill
ions
Uni
ts x
1,0
00
Retail Value
Retail Value Units
Retail Value Units
0
100
200
300
400
500
600
'06'05'04'03'02'01'00'99'98'97
2006 Summary10-Year Trend
Retail Unit Average Price-6.44% -8.00%
-26.83% 11.79%1.69%
-34.55%

�1
0
10
20
30
40
50
60
'06'05'04'03'02'01'00'99'98'97
Stomp Boxes
0.0
0.2
0.4
0.6
0.8
1.0
1.2
'06'05'04'03'02'01'00'99'98'97
Ret
ail V
alue
in $
mill
ions
Uni
ts x
1,0
00
,00
0
Retail Value
Retail Value Units
Retail Value Units
0.0
0.2
0.4
0.6
0.8
1.0
1.2
'06'05'04'03'02'01'00'99'98'97
2006 Summary10-Year Trend
Retail Unit Average Price2.41% -3.50%
12.91% 95.51%6.12%
-42.25%
0
40
80
120
160
200
240
'06'05'04'03'02'01'00'99'98'97
Total Signal Processing
0.0
0.5
1.0
1.5
2.0
2.5
'06'05'04'03'02'01'00'99'98'97
Ret
ail V
alue
in $
mill
ions
Uni
ts x
1,0
00
,00
0
Retail Value
Retail Value Units
Retail Value Units
0.0
0.5
1.0
1.5
2.0
2.5
'06'05'04'03'02'01'00'99'98'97
2006 Summary10-Year Trend
Retail Unit Average Price-1.40% -4.48%0.68% 66.78%
3.22%-39.63%
U.S. Segment Data

��
0
20
40
60
80
100
120
140
160
180
'06'05'04'03'02'01'00'99'98'97
Drum Kits
0
50
100
150
200
250
300
'04 '03 '02 '01 '00 '99 '98 '97 '96
Ret
ail V
alue
in $
mill
ions
Uni
ts x
1,0
00
Retail Value
Retail Value Units
0
50
100
150
200
250
300
'06'05'04'03'02'01'00'99'98'97
Retail Value Units
2006 Summary10-Year Trend
Retail Unit Average Price-3.33% -3.80%96.84% 178.69%
0.49%-29.37%
0
10
20
30
40
50
60
'06'05'04'03'02'01'00'99'98'97
Educational Percussion
0
50
100
150
200
250
300
'04 '03 '02 '01 '00 '99 '98 '97 '96
Ret
ail V
alue
in $
mill
ions
Uni
ts x
1,0
00
Retail Value
Retail Value Units
Retail Value Units
Educational Percussion includes timpani, marching percussion, mallet instruments, snare drum kits and orchestral percussion instruments.
2006 Summary10-Year Trend
Retail5.20%
31.98%
Retail Value Market Share
Educational Percussion
10.1%
Sticks & Mallets15.0%
Individual Drums, Hardware
13.2%
Drumheads11.6%
Cymbals14.0%
Hand Percussion
7.3%
Drum Kits28.8%
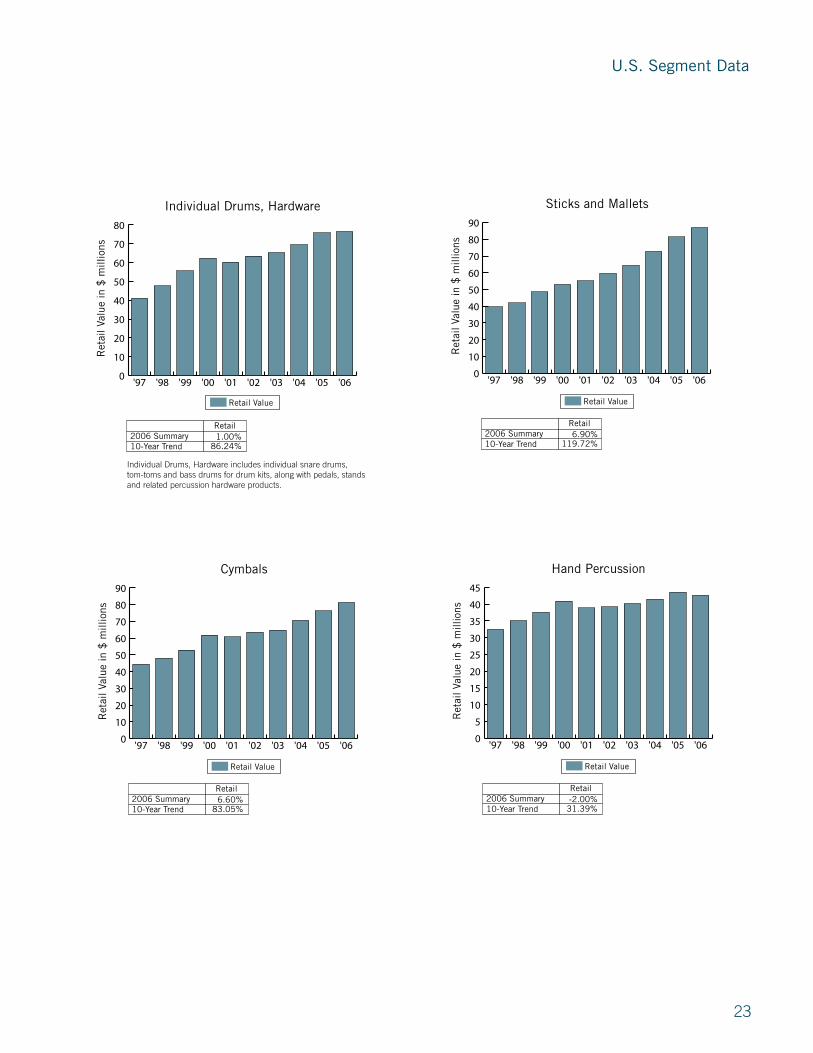
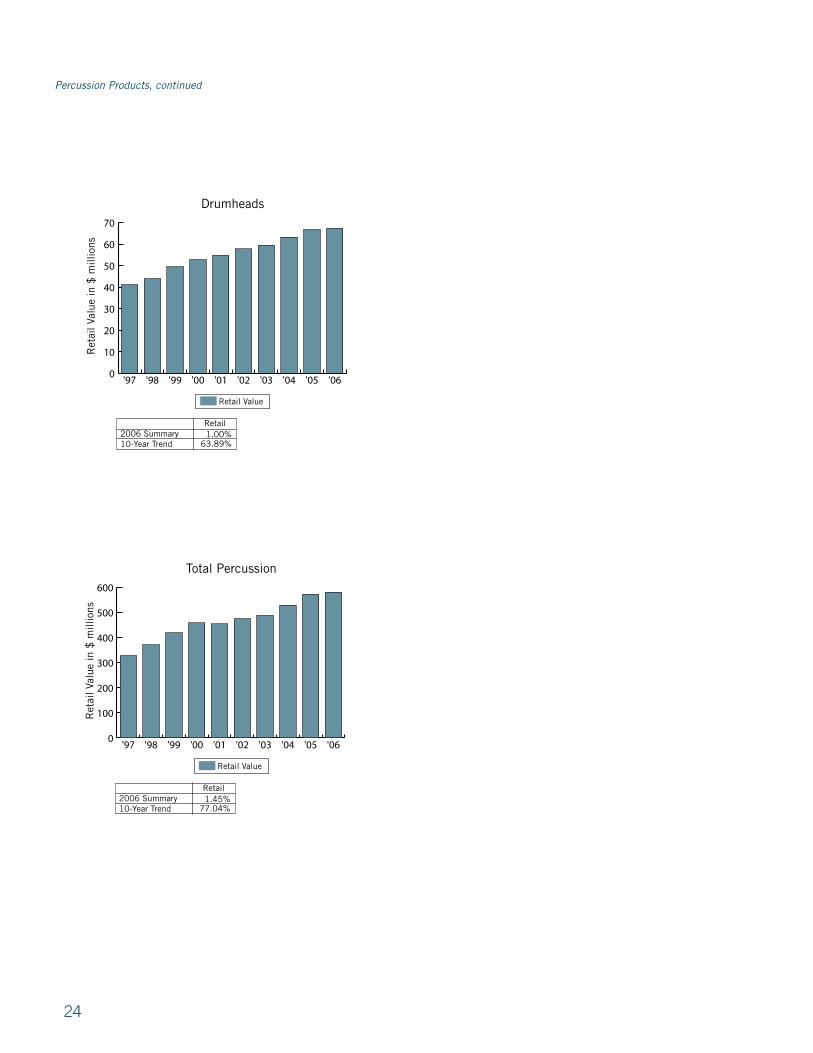
Percussion ProductsSales of percussion products moved in two directions in �006. �ccessory products including sticks, cymbals and hardware trended up, while sales of drums decreased slightly. To explain the drop-off in sales of drum kits and hand percussion, retailers cite a number of factors, including unease among the buying public and competition from non-musical items like the top-selling Nintendo and Microsoft gaming consoles and widescreen televisions. The user base of percussionists continues to expand however, which helps account for the increase in the sale of “consumable” items like drumsticks, heads and cymbals.
One surprising bright spot has been the increase in the sale of educational percussion—bass drums, marching percussion, timpani and mallet instruments—which are typically purchased by schools. Despite widely publicized fears of budget cuts, states are apparently in the process of outfitting their music rooms with new percussion instruments. It doesn’t hurt that nationwide surging tax collections pushed state revenues up 10 percent last year. State spending advanced at an even faster pace, up 11.� percent.
��
0
10
20
30
40
50
60
70
80
90
'06'05'04'03'02'01'00'99'98'97
Cymbals
0
50
100
150
200
250
300
'04 '03 '02 '01 '00 '99 '98 '97 '96
Ret
ail V
alue
in $
mill
ions
Uni
ts x
1,0
00
Retail Value
Retail Value Units
Retail Value Units 2006 Summary10-Year Trend
Retail6.60%
83.05%
0
10
20
30
40
50
60
70
80
'06'05'04'03'02'01'00'99'98'97
Individual Drums, Hardware
0
50
100
150
200
250
300
'04 '03 '02 '01 '00 '99 '98 '97 '96
Ret
ail V
alue
in $
mill
ions
Uni
ts x
1,0
00
Retail Value
Retail Value Units
Retail Value Units
Individual Drums, Hardware includes individual snare drums, tom-toms and bass drums for drum kits, along with pedals, stands and related percussion hardware products.
2006 Summary10-Year Trend
Retail1.00%
86.24%
0
5
10
15
20
25
30
35
40
45
'06'05'04'03'02'01'00'99'98'97
Hand Percussion
0
50
100
150
200
250
300
'04 '03 '02 '01 '00 '99 '98 '97 '96
Ret
ail V
alue
in $
mill
ions
Uni
ts x
1,0
00
Retail Value
Retail Value Units
Retail Value Units 2006 Summary10-Year Trend
Retail-2.00%31.39%
0
10
20
30
40
50
60
70
80
90
'06'05'04'03'02'01'00'99'98'97
Sticks and Mallets
0
50
100
150
200
250
300
'04 '03 '02 '01 '00 '99 '98 '97 '96
Ret
ail V
alue
in $
mill
ions
Uni
ts x
1,0
00
Retail Value
Retail Value Units
Retail Value Units 2006 Summary10-Year Trend
Retail6.90%
119.72%
U.S. Segment Data
��
0
10
20
30
40
50
60
70
'06'05'04'03'02'01'00'99'98'97
Drumheads
0
50
100
150
200
250
300
'04 '03 '02 '01 '00 '99 '98 '97 '96
Ret
ail V
alue
in $
mill
ions
Uni
ts x
1,0
00
Retail Value
Retail Value Units
Retail Value Units 2006 Summary10-Year Trend
Retail1.00%
63.89%
0
100
200
300
400
500
600
'06'05'04'03'02'01'00'99'98'97
Total Percussion
0
50
100
150
200
250
300
'04 '03 '02 '01 '00 '99 '98 '97 '96
Ret
ail V
alue
in $
mill
ions
Uni
ts x
1,0
00
Retail Value
Retail Value Units
Retail Value Units 2006 Summary10-Year Trend
Retail1.45%
77.04%
Percussion Products, continued
��
DJ Products
0
5
10
15
20
25
30
35
'06'05'04'03'02'01'00'99'98'97
CD Players
0
10
20
30
40
50
60
70
'04 '03 '02 '01 '00 '99 '98 '97
Ret
ail V
alue
in $
mill
ions
Uni
ts x
1,0
00
Retail Value
Retail Value Units
Uni
ts x
1,0
00
Retail Value Units
0
10
20
30
40
50
60
70
'06'05'04'03'02'01'00'99'98'97
2006 Summary10-Year Trend
Retail Unit Average Price16.39% 2.06%
132.17% 191.53%14.05%
-20.36%
Special Effects Lighting29.1%
DJ Mixers35.4%
Turntables10.7%
CD Players24.8%
Retail Value Market Share
0
5
10
15
20
25
'06'05'04'03'02'01'00'99'98'97
Turntables
0
20
40
60
80
100
120
'04 '03 '02 '01 '00 '99 '98 '97
Ret
ail V
alue
in $
mill
ions
Uni
ts x
1,0
00
Retail Value
Retail Value Units
Uni
ts x
1,0
00
Retail Value Units
0
20
40
60
80
100
120
'06'05'04'03'02'01'00'99'98'97
2006 Summary10-Year Trend
Retail Unit Average Price2.67% 0.11%
-29.44% -25.28%2.56%
-5.57%
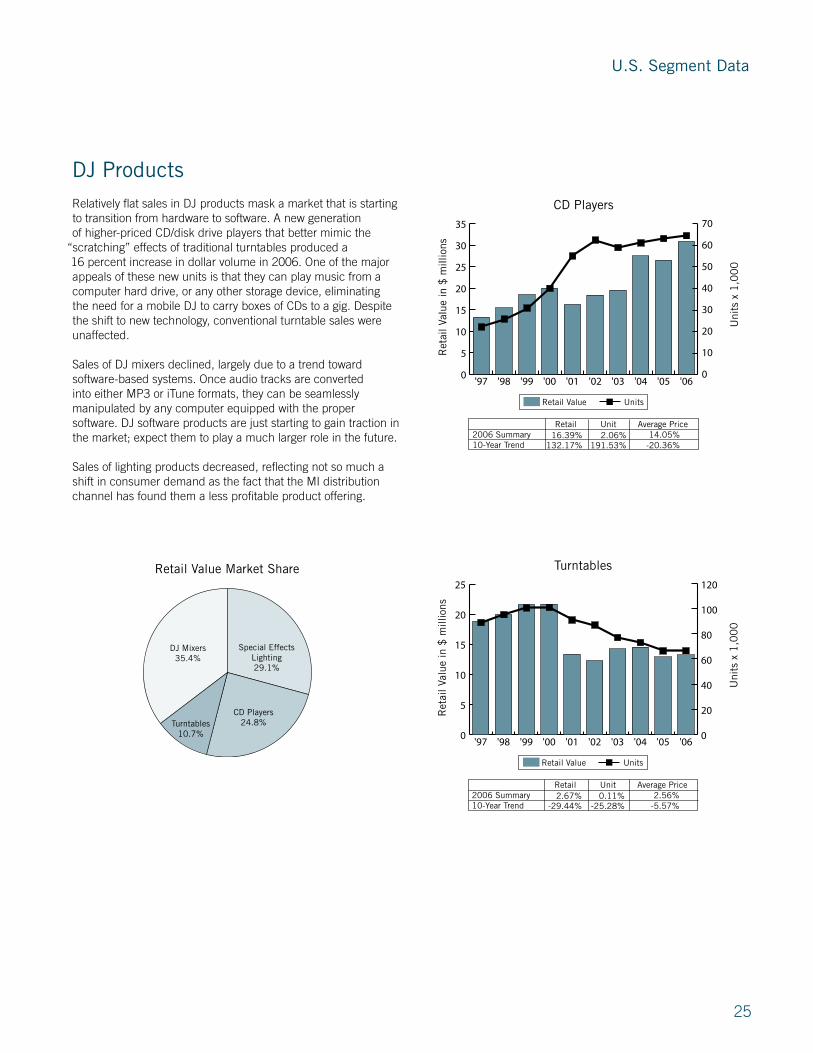
Relatively flat sales in DJ products mask a market that is starting to transition from hardware to software. � new generation of higher-priced CD/disk drive players that better mimic the
“scratching” effects of traditional turntables produced a 16 percent increase in dollar volume in �006. One of the major appeals of these new units is that they can play music from a computer hard drive, or any other storage device, eliminating the need for a mobile DJ to carry boxes of CDs to a gig. Despite the shift to new technology, conventional turntable sales were unaffected.
Sales of DJ mixers declined, largely due to a trend toward software-based systems. Once audio tracks are converted into either MP� or iTune formats, they can be seamlessly manipulated by any computer equipped with the proper software. DJ software products are just starting to gain traction in the market; expect them to play a much larger role in the future.
Sales of lighting products decreased, reflecting not so much a shift in consumer demand as the fact that the MI distribution channel has found them a less profitable product offering.
U.S. Segment Data

�6
0
5
10
15
20
25
30
35
40
45
50
'06'05'04'03'02'01'00'99'98'97
Special Effects Lighting Units
0
50
100
150
200
250
300
'04 '03 '02 '01 '00 '99 '98 '97
Ret
ail V
alue
in $
mill
ions
Uni
ts x
1,0
00
Retail Value
Retail Value Units
2006 Summary10-Year Trend
Retail-7.16%-0.10%
0
20
40
60
80
100
120
140
'05'05'04'03'02'01'00'99'98'97
Total DJ Sales
0
50
100
150
200
250
300
'04 '03 '02 '01 '00 '99 '98 '97
Ret
ail V
alue
in $
mill
ions
Uni
ts x
1,0
00
Retail Value
Retail Value Units
2006 Summary10-Year Trend
Retail1.18%
17.49%
0
10
20
30
40
50
'06'05'04'03'02'01'00'99'98'97
DJ Mixers
0
50
100
150
200
250
300
'04 '03 '02 '01 '00 '99 '98 '97
Ret
ail V
alue
in $
mill
ions
Uni
ts x
1,0
00
Retail Value
Retail Value Units
Uni
ts x
1,0
00
Retail Value Units
0
50
100
150
200
250
300
'06'05'04'03'02'01'00'99'98'97
2006 Summary10-Year Trend
Retail Unit Average Price-.99% -6.49%
17.44% 29.06%5.88%
-2.69%
DJ Products, continued
��
0
10
20
30
40
50
60
70
80
90
100
'06'05'04'03'02'01'00'99'98'97
Total Multi-Track Sales
0
20
40
60
80
100
120
140
160
180
'04 '03 '02 '01 '00 '99 '98 '97 '96
Ret
ail V
alue
in $
mill
ions
Uni
ts x
1,0
00
Retail Value
Retail Value Units
Uni
ts x
1,0
00
Retail Value Units
0
20
40
60
80
100
120
140
160
180
'06'05'04'03'02'01'00'99'98'97
Uni
ts x
1,0
00
2006 Summary10-Year Trend
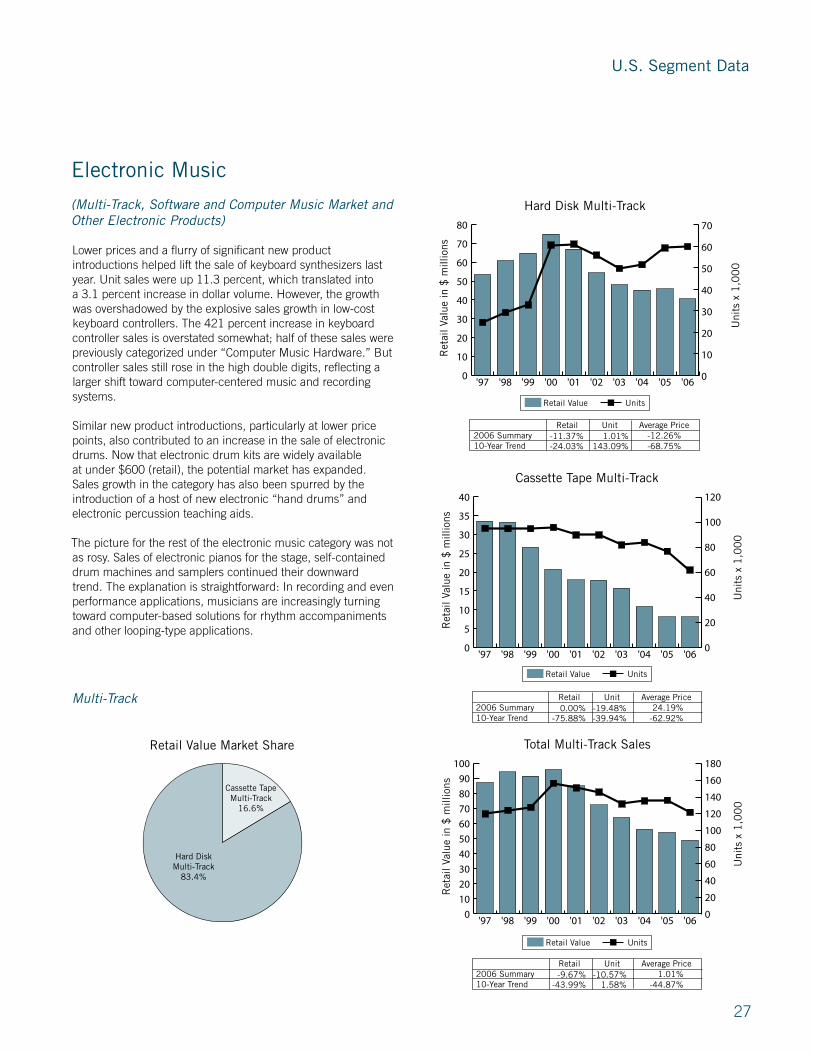
Retail Unit Average Price-9.67% -10.57%
-43.99% 1.58%1.01%
-44.87%
Multi-Track
0
5
10
15
20
25
30
35
40
'06'05'04'03'02'01'00'99'98'97
Cassette Tape Multi-Track
0
20
40
60
80
100
120
'04 '03 '02 '01 '00 '99 '98 '97 '96
Ret
ail V
alue
in $
mill
ions
Uni
ts x
1,0
00
Retail Value
Retail Value Units
Uni
ts x
1,0
00
Retail Value Units
0
20
40
60
80
100
120
'06'05'04'03'02'01'00'99'98'97
2006 Summary10-Year Trend
Retail Unit Average Price0.00% -19.48%
-75.88% -39.94%24.19%
-62.92%
0
10
20
30
40
50
60
70
80
'06'05'04'03'02'01'00'99'98'97
Hard Disk Multi-Track
0
10
20
30
40
50
60
70
'04'03'02'01'00'99'98'97'96
Ret
ail V
alue
in $
mill
ions
Uni
ts x
1,0
00
Retail Value
Retail Value Units
0
10
20
30
40
50
60
70
'06'05'04'03'02'01'00'99'98'97
Uni
ts x
1,0
00
Retail Value Units
2006 Summary10-Year Trend
Retail Unit Average Price-11.37% 1.01%-24.03% 143.09%
-12.26%-68.75%
Retail Value Market Share
Cassette Tape Multi-Track
16.6%
Hard Disk Multi-Track
83.4%
Electronic Music
(Multi-Track, Software and Computer Music Market and Other Electronic Products)
Lower prices and a flurry of significant new product introductions helped lift the sale of keyboard synthesizers last year. Unit sales were up 11.� percent, which translated into a �.1 percent increase in dollar volume. However, the growth was overshadowed by the explosive sales growth in low-cost keyboard controllers. The ��1 percent increase in keyboard controller sales is overstated somewhat; half of these sales were previously categorized under “Computer Music Hardware.” �ut controller sales still rose in the high double digits, reflecting a larger shift toward computer-centered music and recording systems.
Similar new product introductions, particularly at lower price points, also contributed to an increase in the sale of electronic drums. Now that electronic drum kits are widely available at under $600 (retail), the potential market has expanded. Sales growth in the category has also been spurred by the introduction of a host of new electronic “hand drums” and electronic percussion teaching aids.
The picture for the rest of the electronic music category was not as rosy. Sales of electronic pianos for the stage, self-contained drum machines and samplers continued their downward trend. The explanation is straightforward: In recording and even performance applications, musicians are increasingly turning toward computer-based solutions for rhythm accompaniments and other looping-type applications.
U.S. Segment Data

�8
Sound Cards & Related Hardware
44.4%
Software55.6%
Retail Value Market Share
0
40
80
120
160
200
240
'06'05'04'03'02'01'00'99'98'97
Software
0
10
20
30
40
50
60
70
'04 '03 '02 '01 '00 '99 '98 '97 '96
Ret
ail V
alue
in $
mill
ions
Uni
ts x
1,0
00
Retail Value
Retail Value Units
Retail Value Units
2006 Summary10-Year Trend
Retail11.94%
168.54%
Software includes recording software packages, plug-in modules, loops, sampling software, notation software and educational software.
0
20
40
60
80
100
120
140
160
180
200
'06'05'04'03'02'01'00'99'98'97
Sound Cards and Related Hardware
0
10
20
30
40
50
60
70
'04 '03 '02 '01 '00 '99 '98 '97 '96
Ret
ail V
alue
in $
mill
ions
Uni
ts x
1,0
00
Retail Value
Retail Value Units
Retail Value Units
2006 Summary10-Year Trend
Retail19.00%
1,144.74%
Sound Cards and Related Hardware includes sound cards and related input/output devices, digital audio work surfaces (DAWS) and keyboard controllers designed expressly for use with computers.
0
50
100
150
200
250
300
350
400
450
'06'05'04'03'02'01'00'99'98'97
Total Computer Music Market
0
10
20
30
40
50
60
70
'04 '03 '02 '01 '00 '99 '98 '97 '96
Ret
ail V
alue
in $
mill
ions
Uni
ts x
1,0
00
Retail Value
Retail Value Units
Retail Value Units
2006 Summary10-Year Trend
Retail14.97%
312.10%
Electronic Music, continued

�9
0
5
10
15
20
25
30
'06'05'04'03'02'01'00'99'98'97
Drum Machines
0
10
20
30
40
50
60
70
'04 '03 '02 '01 '00 '99 '98 '97 '96
Ret
ail V
alue
in $
mill
ions
Uni
ts x
1,0
00
Retail Value
Retail Value Units
Uni
ts x
1,0
00
Retail Value Units
0
10
20
30
40
50
60
70
'06'05'04'03'02'01'00'99'98'97
2006 Summary10-Year Trend
Retail Unit Average Price-3.77% -14.00%
-73.30% -42.05%11.89%
-53.93%
0
20
40
60
80
100
120
'06'05'04'03'02'01'00'99'98'97
Keyboard Synthesizers
0
10
20
30
40
50
60
70
80
90
'04'03'02'01'00'99'98'97'96
Ret
ail V
alue
in $
mill
ions
Uni
ts x
1,0
00
Retail Value
Retail Value Units
0
10
20
30
40
50
60
70
80
90
'06'05'04'03'02'01'00'99'98'97
Uni
ts x
1,0
00
Retail Value Units
2006 Summary10-Year Trend
Retail Unit Average Price3.11% 11.29%4.93% 16.87%
-7.35%-10.22%
Keyboard Synthesizers48.8%
Electronic Drums22.0%
Electronic Pianos/Professional Organs
18.8%
Sound Modules2.6%
Controller Keyboards5.3%Drum Machines
2.5%
Retail Value Market Share
0
5
10
15
20
25
30
35
40
45
50
'06'05'04'03'02'01'00'99'98'97
Sound Modules
0
10
20
30
40
50
60
70
'04'03'02'01'00'99'98'97'96
Ret
ail V
alue
in $
mill
ions
Uni
ts x
1,0
00
Retail Value
Retail Value UnitsU
nits
x 1
,00
0
Retail Value Units
0
10
20
30
40
50
60
70
'06'05'04'03'02'01'00'99'98'97
2006 Summary10-Year Trend
Retail Unit Average Price5.77% -34.28%
-85.90% -83.45%60.95%
-14.79%
Other Electronic Products
U.S. Segment Data

�0
0
5
10
15
20
25
30
'06'05'04'03'02'01'00'99'98'97
Controller Keyboards
0
10
20
30
40
50
60
70
80
'04'03'02'01'00'99'98'97'96
Ret
ail V
alue
in $
mill
ions
Uni
ts x
1,0
00
Retail Value
Retail Value Units
Uni
ts x
1,0
00
Retail Value Units
0.000000
8.888889
17.777778
26.666667
35.555556
44.444444
53.333333
62.222222
71.111111
80.000000
'06'05'04'03'02'01'00'99'98'97
2006 Summary10-Year Trend
Retail Unit Average Price21.60% 421.13%
-55.22% 439.75%-76.67%-91.70%
0
10
20
30
40
50
60
70
80
90
'06'05'04'03'02'01'00'99'98'97
Electronic Pianos / Professional Organs
0
5
10
15
20
25
30
35
40
'04 '03 '02 '01 '00 '99 '98 '97 '96
Ret
ail V
alue
in $
mill
ions
Uni
ts x
1,0
00
Retail Value
Retail Value Units
Uni
ts x
1,0
00
Retail Value Units
0
5
10
15
20
25
30
35
40
'06'05'04'03'02'01'00'99'98'97
2006 Summary10-Year Trend
Retail Unit Average Price-27.08% -19.70%169.56% 236.94%
-9.19%-20.00%
0
10
20
30
40
50
60
'06'05'04'03'02'01'00'99'98'97
Electronic Drums
0
10
20
30
40
50
60
70
'04 '03 '02 '01 '00 '99 '98 '97 '96
Ret
ail V
alue
in $
mill
ions
Uni
ts x
1,0
00
Retail Value
Retail Value Units
Retail Value Units
2006 Summary10-Year Trend
Retail5.50%
434.56%
0
50
100
150
200
250
300
'06'05'04'03'02'01'00'99'98'97
Total Electronic Music Sales
0
10
20
30
40
50
60
70
'04 '03 '02 '01 '00 '99 '98 '97 '96
Ret
ail V
alue
in $
mill
ions
Uni
ts x
1,0
00
Retail Value
Retail Value Units
Retail Value Units
2006 Summary10-Year Trend
Retail-3.28%2.69%
Electronic Music, continued

�1
U.S. Segment Data
0
50
100
150
200
250
300
'06'05'04'03'02'01'00'99'98'97
Total Electronic Music Sales
0
10
20
30
40
50
60
70
'04 '03 '02 '01 '00 '99 '98 '97 '96
Ret
ail V
alue
in $
mill
ions
Uni
ts x
1,0
00
Retail Value
Retail Value Units
Retail Value Units
2006 Summary10-Year Trend
Retail-3.28%2.69%
Printed MusicPrinted music sales advanced modestly in �006, due to a host of factors. � decline in the sale of entry-level guitars and pianos slowed the sales of method books. These issues were exacerbated by the problem of unauthorized online music sales, particularly in the guitar “tab” category. Web sites such as fret�fret.com and Ultimateguitar.com, which offer free tabulatures online, report traffic of over ��0,000 unique visitors per week. In a year where the �illboard charts were dominated by hip-hop and R&� songs, publishers also suffered from a dearth of high-selling hit songs.
Offsetting these negatives, school programs apparently increased their purchases of printed music.
0
100
200
300
400
500
600
'06'05'04'03'02'01'00'99'98'97
Printed Music
0
200
400
600
800
1000
1200
1400
1600
'04 '03 '02 '01 '00 '99 '98
Ret
ail V
alue
in $
mill
ions
Uni
ts x
1,0
00
Retail Value
Retail Value Units
2006 Summary10-Year Trend
Retail1.70%
34.35%
Retail Value Market Share
Keyboards Under $199
44.7%
Keyboards Over $199
55.3%
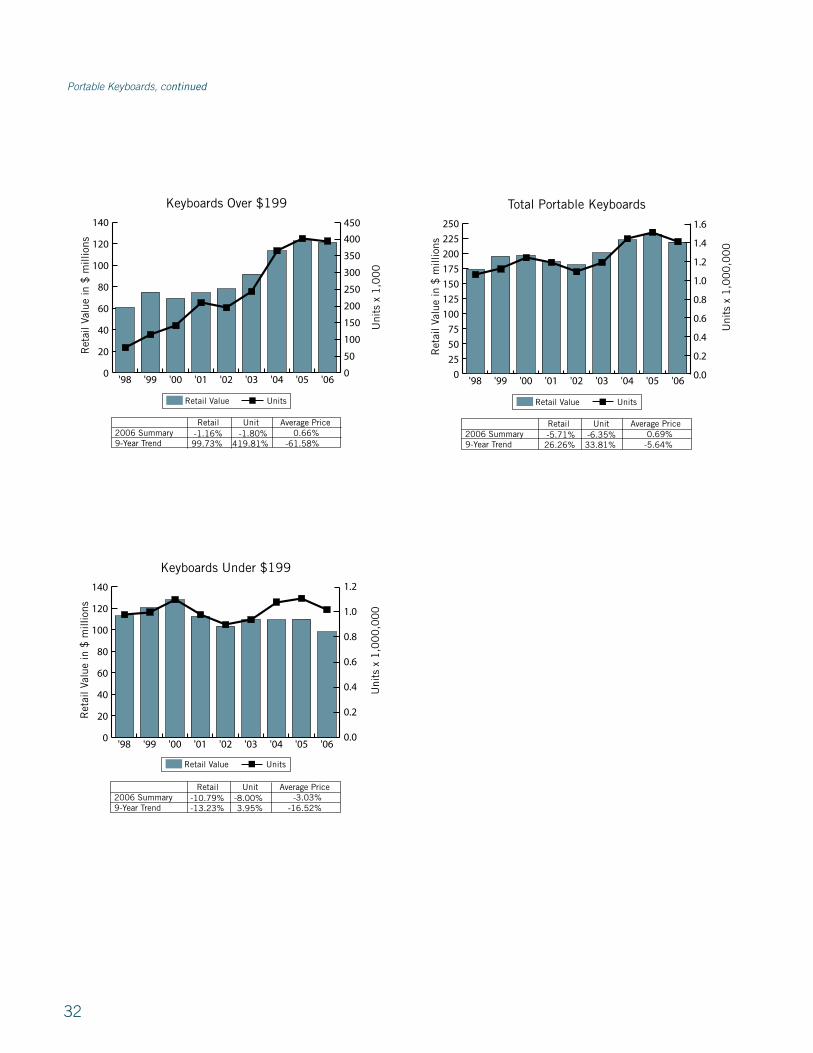
Portable KeyboardsSales of portable keyboards, both those sold by mass merchants and those by specialized MI retailers, declined, but for different reasons. Now in their �6th season, portable keyboards in the mass merchant channel face stiff competition from newer and more novel forms of electronic entertainment, ranging from electronic games to slick new cell phones. Manufacturers of keyboards now face the challenge of fighting for shelf space at mega retailers ranging from �est �uy to Wal-Mart.
The higher-end keyboards, which are the province of specialized MI retailers, suffered declines primarily because of competition from keyboard controllers. Given that teen access to computers in the United States nears 90 percent, the growing inclination is to buy a keyboard that works in conjunction with a computer, rather than a self-contained unit.
��
0
20
40
60
80
100
120
140
'06'05'04'03'02'01'00'99'98
Keyboards Under $199
0.0
0.2
0.4
0.6
0.8
1.0
1.2
'06'05'04'03'02'01'00'99'98
Ret
ail V
alue
in $
mill
ions
Uni
ts x
1,0
00
Retail Value
Retail Value Units
Uni
ts x
1,0
00
,00
0
0.0
0.2
0.4
0.6
0.8
1.0
1.2
'06'05'04'03'02'01'00'99'98
Uni
ts x
1,0
00
2006 Summary9-Year Trend
Retail Unit Average Price-10.79% -8.00%-13.23% 3.95%
-3.03%-16.52%
0
25
50
75
100
125
150
175
200
225
250
'06'05'04'03'02'01'00'99'98
Total Portable Keyboards
0.0
0.2
0.4
0.6
0.8
1.0
1.2
1.4
1.6
'04'03'02'01'00'99'98
Ret
ail V
alue
in $
mill
ions
Uni
ts x
1,0
00
Retail Value
Retail Value Units
Uni
ts x
1,0
00
,00
0
0.0
0.2
0.4
0.6
0.8
1.0
1.2
1.4
1.6
'06'05'04'03'02'01'00'99'98
Uni
ts x
1,0
00
2006 Summary9-Year Trend
Retail Unit Average Price-5.71% -6.35%26.26% 33.81%
0.69%-5.64%
0
20
40
60
80
100
120
140
'06'05'04'03'02'01'00'99'98
Keyboards Over $199
0
50
100
150
200
250
300
350
400
'04 '03 '02 '01 '00 '99 '98
Ret
ail V
alue
in $
mill
ions
Uni
ts x
1,0
00
Retail Value
Retail Value Units
0
50
100
150
200
250
300
350
400
450
'06'05'04'03'02'01'00'99'98
Uni
ts x
1,0
00
2006 Summary9-Year Trend
Retail Unit Average Price-1.16% -1.80%99.73% 419.81%
0.66%-61.58%
Portable Keyboards, continued

��
U.S. Segment Data
KaraokeThe ongoing sales decline in the karaoke market reflects both shifting consumer tastes, and the dynamic of the mass merchant distribution channel. Three years ago, when fourth-quarter sales of karaoke machines and software failed to meet the expectations of large retailers (including Wal-Mart, Target, �est �uy and Costco), their immediate response was to reduce the number of units they stocked and to move the karaoke inventory to a less prominent position in the store. Not surprisingly, sales the following year were also disappointing, which triggered yet another inventory reduction and banishment to an even more remote piece of retail real estate. �arring some abrupt resurgence in the popularity of karaoke products, this downward spiral is destined to continue for the near term.
There is however, a core karaoke software market, roughly �0 percent, that is sold to serious singers, largely through the specialized MI distribution channel. This market remains largely stable.
0
20
40
60
80
100
120
140
160
180
'06'05'04'03'02'01'00'99'98'97
Karaoke Machines
0.0
0.2
0.4
0.6
0.8
1.0
1.2
1.4
1.6
'06'05'04'03'02'01'00'99'98'97
Ret
ail V
alue
in $
mill
ions
Uni
ts x
1,0
00
Retail Value Units
0.0
0.2
0.4
0.6
0.8
1.0
1.2
1.4
1.6
'06'05'04'03'02'01'00'99'98'97
Uni
ts x
1,0
00
,00
0
Import Value Units
2006 Summary10-Year Trend
Retail Unit Average Price-24.81% -54.37%-11.74% -26.96%
64.77%20.83%
0
5
10
15
20
25
30
35
40
45
'06'05'04'03'02'01'00'99'98'97
Karaoke Software
0
200
400
600
800
1000
1200
1400
1600
'04 '03 '02 '01 '00 '99 '98 '97 '96
Ret
ail V
alue
in $
mill
ions
Uni
ts x
1,0
00
Retail Value
Import Value Units
2006 Summary10-Year Trend
Retail-8.50%7.47%
Retail Value Market Share
Karaoke Software31.7%
Karaoke Machines68.3%
0
25
50
75
100
125
150
175
200
225
'06'05'04'03'02'01'00'99'98'97
Total Karaoke Market
0
200
400
600
800
1000
1200
1400
1600
'04 '03 '02 '01 '00 '99 '98 '97 '96
Ret
ail V
alue
in $
mill
ions
Uni
ts x
1,0
00
Retail Value
Import Value Units
2006 Summary10-Year Trend
Retail-20.31%
-6.44%
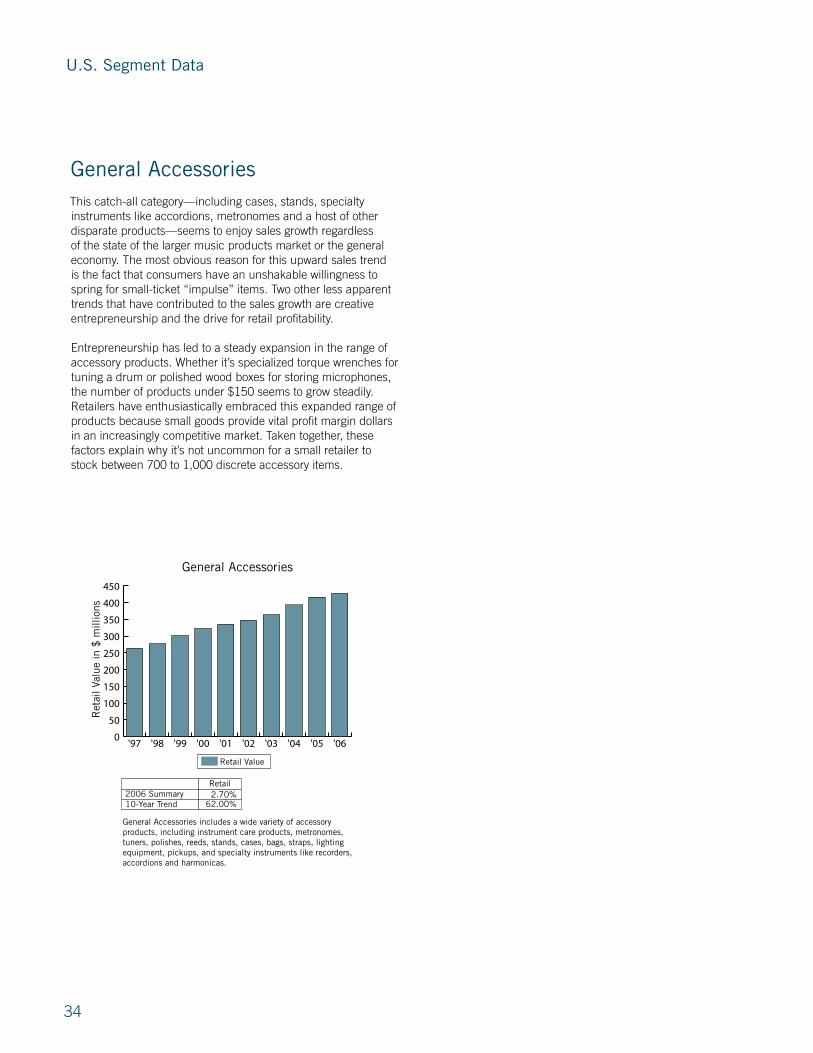
��
0
50
100
150
200
250
300
350
400
450
'06'05'04'03'02'01'00'99'98'97
General Accessories
Ret
ail V
alue
in $
mill
ions
Retail Value
General Accessories includes a wide variety of accessory products, including instrument care products, metronomes, tuners, polishes, reeds, stands, cases, bags, straps, lighting equipment, pickups, and specialty instruments like recorders, accordions and harmonicas.
2006 Summary10-Year Trend
Retail2.70%
62.00%
U.S. Segment Data
General AccessoriesThis catch-all category—including cases, stands, specialty instruments like accordions, metronomes and a host of other disparate products—seems to enjoy sales growth regardless of the state of the larger music products market or the general economy. The most obvious reason for this upward sales trend is the fact that consumers have an unshakable willingness to spring for small-ticket “impulse” items. Two other less apparent trends that have contributed to the sales growth are creative entrepreneurship and the drive for retail profitability.
Entrepreneurship has led to a steady expansion in the range of accessory products. Whether it’s specialized torque wrenches for tuning a drum or polished wood boxes for storing microphones, the number of products under $1�0 seems to grow steadily. Retailers have enthusiastically embraced this expanded range of products because small goods provide vital profit margin dollars in an increasingly competitive market. Taken together, these factors explain why it’s not uncommon for a small retailer to stock between �00 to 1,000 discrete accessory items.
MUsiC And soUnd U.s. indUstry sUMMAry & iMPorts And exPorts
Music and Sound U.S. Industry SummaryThe purpose of the following data is to provide a review of the 10-year-trend of music product activities in the music industry. The data comes from information gathered by The Music Trades magazine over the past decade.
Imports and ExportsThe import and export statistics are provided by the U.S. Census �ureau and offer a snapshot of the U.S. music products import and export activities. This section also provides an overview of the countries where U.S. music products were exported, and from which countries the United States imported music products in �006.
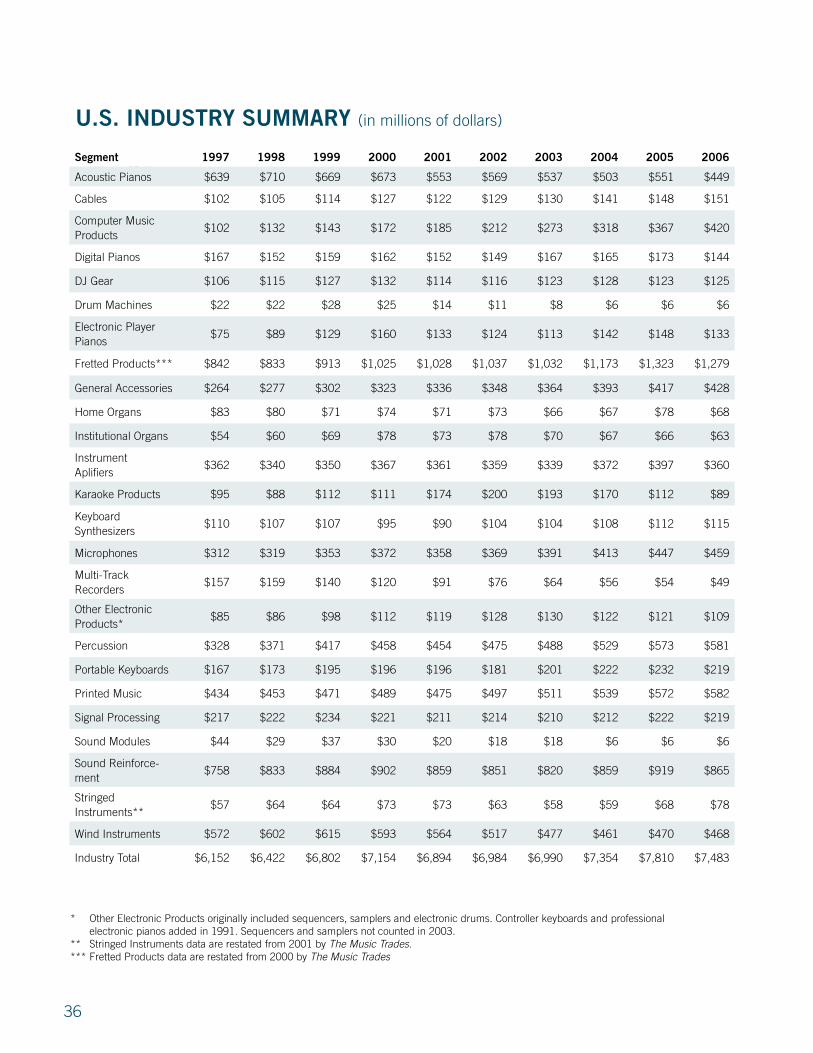
�6
U.s. indUstry sUMMAry (in millions of dollars)
In millions of Dollars
* Other Electronic Products originally included sequencers, samplers and electronic drums. Controller keyboards and professional electronic pianos added in 1991. Sequencers and samplers not counted in �00�.** Stringed Instruments data are restated from �001 by The Music Trades.*** Fretted Products data are restated from �000 by The Music Trades
segment 1997 1998 1999 2000 2001 2002 2003 2004 2005 2006
�coustic Pianos $6�9 $�10 $669 $6�� $��� $�69 $��� $�0� $��1 $��9
Cables $10� $10� $11� $1�� $1�� $1�9 $1�0 $1�1 $1�8 $1�1
Computer Music Products
$10� $1�� $1�� $1�� $18� $�1� $��� $�18 $�6� $��0
Digital Pianos $16� $1�� $1�9 $16� $1�� $1�9 $16� $16� $1�� $1��
DJ Gear $106 $11� $1�� $1�� $11� $116 $1�� $1�8 $1�� $1��
Drum Machines $�� $�� $�8 $�� $1� $11 $8 $6 $6 $6
Electronic Player Pianos
$�� $89 $1�9 $160 $1�� $1�� $11� $1�� $1�8 $1��
Fretted Products*** $8�� $8�� $91� $1,0�� $1,0�8 $1,0�� $1,0�� $1,1�� $1,��� $1,��9
General �ccessories $�6� $��� $�0� $��� $��6 $��8 $�6� $�9� $�1� $��8
Home Organs $8� $80 $�1 $�� $�1 $�� $66 $6� $�8 $68
Institutional Organs $�� $60 $69 $�8 $�� $�8 $�0 $6� $66 $6�
Instrument�plifiers
$�6� $��0 $��0 $�6� $�61 $��9 $��9 $��� $�9� $�60
Karaoke Products $9� $88 $11� $111 $1�� $�00 $19� $1�0 $11� $89
Keyboard Synthesizers
$110 $10� $10� $9� $90 $10� $10� $108 $11� $11�
Microphones $�1� $�19 $��� $��� $��8 $�69 $�91 $�1� $��� $��9
Multi-Track Recorders
$1�� $1�9 $1�0 $1�0 $91 $�6 $6� $�6 $�� $�9
Other Electronic Products*
$8� $86 $98 $11� $119 $1�8 $1�0 $1�� $1�1 $109
Percussion $��8 $��1 $�1� $��8 $��� $��� $�88 $��9 $��� $�81
Portable Keyboards $16� $1�� $19� $196 $196 $181 $�01 $��� $��� $�19
Printed Music $��� $��� $��1 $�89 $��� $�9� $�11 $��9 $��� $�8�
Signal Processing $�1� $��� $��� $��1 $�11 $�1� $�10 $�1� $��� $�19
Sound Modules $�� $�9 $�� $�0 $�0 $18 $18 $6 $6 $6
Sound Reinforce-ment
$��8 $8�� $88� $90� $8�9 $8�1 $8�0 $8�9 $919 $86�
Stringed Instruments**
$�� $6� $6� $�� $�� $6� $�8 $�9 $68 $�8
Wind Instruments $��� $60� $61� $�9� $�6� $�1� $��� $�61 $��0 $�68
Industry Total $6,1�� $6,��� $6,80� $�,1�� $6,89� $6,98� $6,990 $�,��� $�,810 $�,�8�

��
0
5
10
15
20
25
30
35
40
45
'06'05'04'03'02'01'00'99'98'970
5
10
15
20
25
30
35
40
45
04030201009998979695'94
GD
P P
er C
apit
a (i
n th
ousa
nds
of $
)
Uni
ts x
1,0
00
0
5
10
15
20
25
30
35
40
45
06'050403020100999897
Music Sales Per CapitaGDP Per Capita
GDP Per Capita and Music Sales Per Capita
Mus
ic S
ales
Per
Cap
ita
(in
Dol
lars
)
0
1
2
3
4
5
6
7
8
'06'05'04'03'02'01'00'99'98'97
Industry Total
Ret
ail V
alue
in $
bill
ions
2005–06 4.19% 10-Year 21.63%
Source: The Music Trades
0
10
20
30
40
50
'06'05'04'03'02'01'00'99'98'97
GDP Per Capita(in thousands of Dollars)
10
15
20
04 03 02 01 00 99 98 97 96 95
Uni
ts x
1,0
00
Import Value Units
2005–06 5.37% 10-Year 43.47%
Source: U.S. Bureau of Economic Analysis
0
5
10
15
20
25
30
'06'05'04'03'02'01'00'99'98'97
Music Sales Per Capita(in Dollars)
10
15
20
04 03 02 01 00 99 98 97 96 95
Uni
ts x
1,0
00
Import Value Units
2005–06 2.37% 10-Year 14.70%
Source: The Music Trades
U.S. Industry Summary

�8
0
100
200
300
400
500
600
700
800
'06'05'04'03'02'01'00'99'98'97
Acoustic Pianos
Ret
ail V
alue
in $
mill
ions
0
20
40
60
80
100
120
140
160
'06'05'04'03'02'01'00'99'98'97
Cables
Ret
ail V
alue
in $
mill
ions
0
50
100
150
200
250
300
350
400
450
'06'05'04'03'02'01'00'99'98'97
Computer Music Products
Ret
ail V
alue
in $
mill
ions
0
20
40
60
80
100
120
140
160
180
'06'05'04'03'02'01'00'99'98'97
Digital Pianos
Ret
ail V
alue
in $
mill
ions
0
20
40
60
80
100
120
140
'06'05'04'03'02'01'00'99'98'97
DJ Gear
Ret
ail V
alue
in $
mill
ions
0
5
10
15
20
25
30
'06'05'04'03'02'01'00'99'98'97
Drum Machines
Ret
ail V
alue
in $
mill
ions
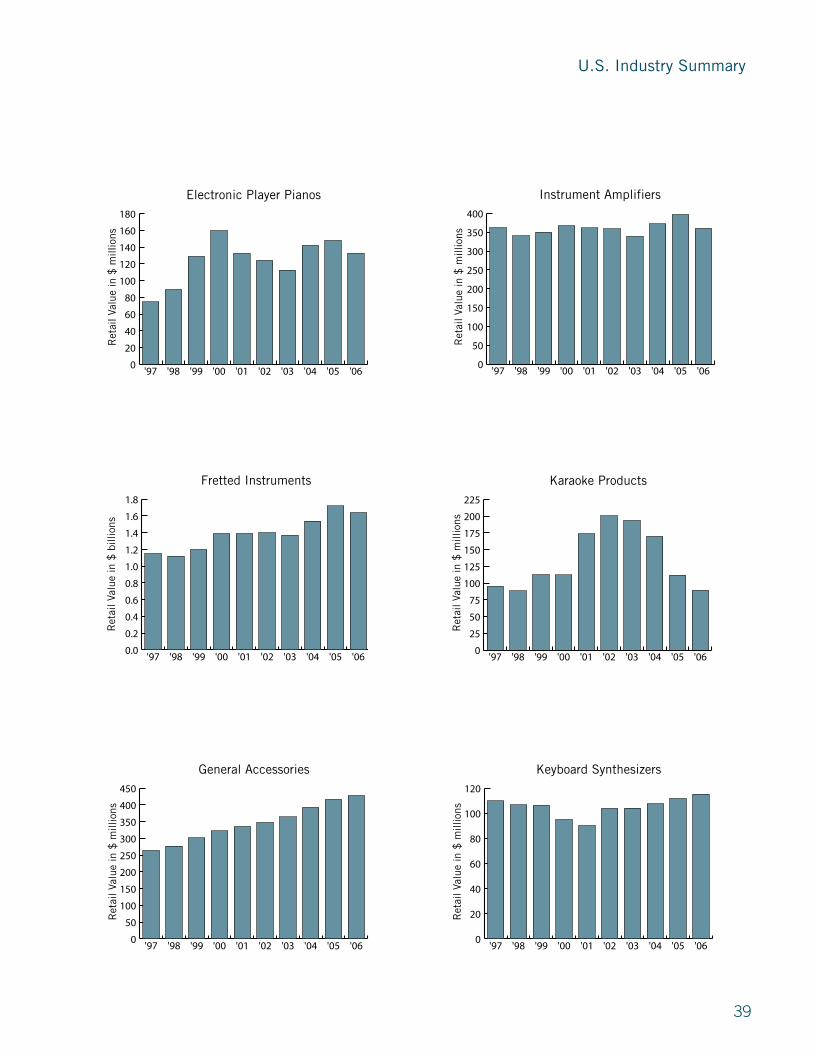
�9
U.S. Industry Summary
0
20
40
60
80
100
120
140
160
180
'06'05'04'03'02'01'00'99'98'97
Electronic Player Pianos
Ret
ail V
alue
in $
mill
ions
0.0
0.2
0.4
0.6
0.8
1.0
1.2
1.4
1.6
1.8
'06'05'04'03'02'01'00'99'98'97
Fretted Instruments
Ret
ail V
alue
in $
bill
ions
0
50
100
150
200
250
300
350
400
450
'06'05'04'03'02'01'00'99'98'97
General Accessories
Ret
ail V
alue
in $
mill
ions
Retail Value
General Accessories includes a wide variety of accessory products, including instrument care products, metronomes, tuners, polishes, reeds, stands, cases, bags, straps, lighting equipment, pickups, and specialty instruments like recorders, accordions and harmonicas.
2006 Summary10-Year Trend
Retail2.70%
62.00%
0
25
50
75
100
125
150
175
200
225
'06'05'04'03'02'01'00'99'98'97
Karaoke Products
Ret
ail V
alue
in $
mill
ions
0
20
40
60
80
100
120
'06'05'04'03'02'01'00'99'98'97
Keyboard Synthesizers
Ret
ail V
alue
in $
mill
ions
0
50
100
150
200
250
300
350
400
'06'05'04'03'02'01'00'99'98'97
Instrument Amplifiers
Ret
ail V
alue
in $
mill
ions
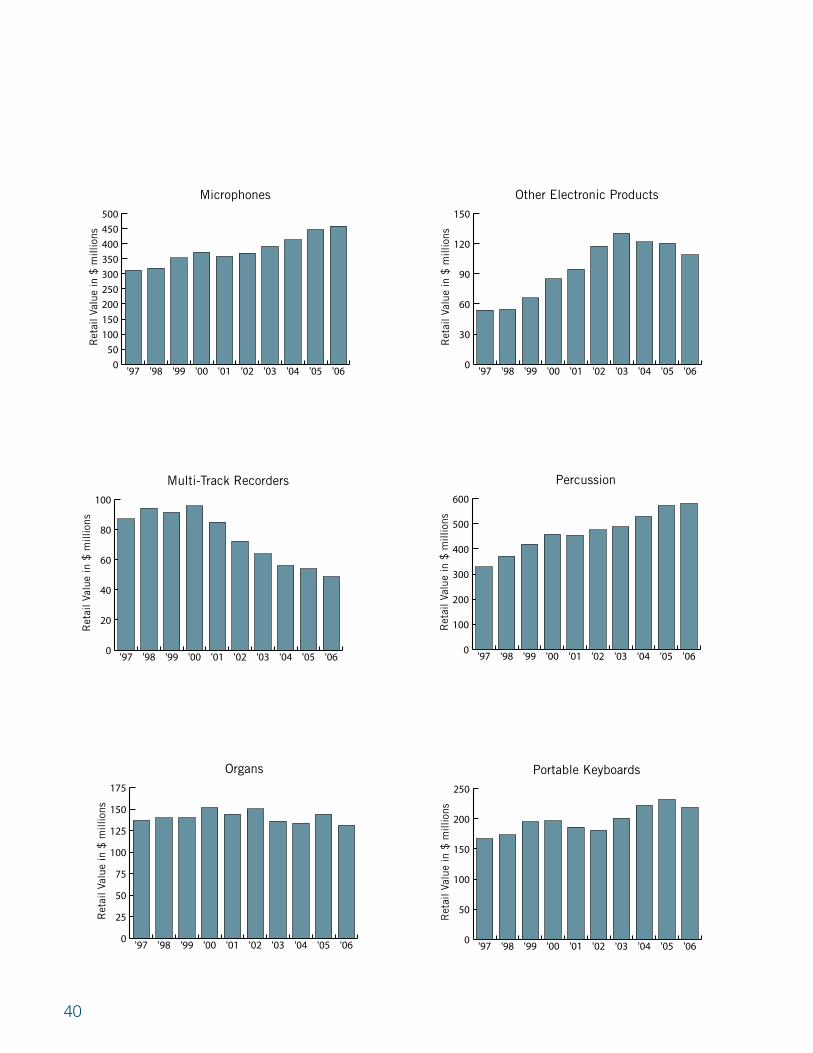
�0
0
25
50
75
100
125
150
175
'06'05'04'03'02'01'00'99'98'97
Organs
10
15
20
04 03 02 01 00 99 98 97 96 95
Ret
ail V
alue
in $
mill
ions
Uni
ts x
1,0
00
Import Value Units
0
50
100
150
200
250
300
350
400
450
500
'06'05'04'03'02'01'00'99'98'97
Microphones
Ret
ail V
alue
in $
mill
ions
0
20
40
60
80
100
'06'05'04'03'02'01'00'99'98'97
Multi-Track Recorders
Ret
ail V
alue
in $
mill
ions
0
30
60
90
120
150
'06'05'04'03'02'01'00'99'98'97
Other Electronic Products
Ret
ail V
alue
in $
mill
ions
0
100
200
300
400
500
600
'06'05'04'03'02'01'00'99'98'97
Percussion
Ret
ail V
alue
in $
mill
ions
0
50
100
150
200
250
'06'05'04'03'02'01'00'99'98'97
Portable Keyboards
Ret
ail V
alue
in $
mill
ions

�1
U.S. Industry Summary
0
40
80
120
160
200
240
'06'05'04'03'02'01'00'99'98'97
Signal Processing
Ret
ail V
alue
in $
mill
ions
0
5
10
15
20
25
30
35
40
45
50
'06'05'04'03'02'01'00'99'98'97
Sound Modules
Ret
ail V
alue
in $
mill
ions
0.0
0.2
0.4
0.6
0.8
1.0
1.2
1.4
1.6
'06'05'04'03'02'01'00'99
Sound Reinforcement
Ret
ail V
alue
in $
bill
ions
0
10
20
30
40
50
60
70
80
90
'06'05'04'03'02'01
Stringed Instruments
Ret
ail V
alue
in $
mill
ions
* Stringed Instruments data are restated from 2001 by The Music Trades.
0
100
200
300
400
500
600
700
'06'05'04'03'02'01'00'99'98'97
Wind Instruments
Ret
ail V
alue
in $
mill
ions
0
100
200
300
400
500
600
'06'05'04'03'02'01'00'99'98'97
Printed Music
0
200
400
600
800
1000
1200
1400
1600
'04 '03 '02 '01 '00 '99 '98
Ret
ail V
alue
in $
mill
ions
Uni
ts x
1,0
00
Retail Value
Retail Value Units
2006 Summary10-Year Trend
Retail1.70%
34.35%

��
2006 data U.s. iMPorts of MUsiC And soUnd ProdUCts
description Commodity Code Quantity value
Single Loudspeakers, Mounted in Their Enclosures 8518210000 49,792,921 $573,892,126
Multiple Loudspeakers, Mounted in the Same Enclosures 8518220000 16,003,039 $348,119,671
Headphones, Earphones, Microphone/Speaker, Nesoi* 8518302000 234,408,562 $694,333,56
Audio Frequency Electric Amplifiers, Nesoi* 8518402000 9,609,239 $426,483,526
Upright Pianos 9201100011 6,823 $7,009,912
Grand Pianos 9201200011 16,036 $54,528,085
String Musical Instruments Played with a Bow 9202100000 409,131 $33,110,827
Guitars Under $100, Excluding the Value of the Case 9202902000 2,102,332 $69,151,803
Guitars, Nesoi* 9202904000 249,673 $50,182,828
String Musical Instruments, Nesoi* 9202906000 521,707 $19,143,423
Keyboard Pipe Organs 9203004000 103 $6,238,577
Piano Accordions 9204104000 32,368 $3,735,848
Mouth Organs 9204200000 322,747 $8,769,401
Brasswind Instruments Valued Not Over $10 Each 9205100040 33,727 $101,946
Brasswind Instruments Valued Over $10 Each 9205100080 153,069 $49,415,612
Bagpipes 9205902000 2,838 $426,654
Clarinets 9205904020 88,528 $17,986,248
Saxophones 9205904040 100,300 $42,169,831
Flutes and Piccolos (Except Bamboo) 9205904060 174,589 $13,123,224
Drums 9206002000 1,756,433 $89,433,005
Cymbals 9206004000 677,177 $21,416,292
Sets of Tuned Bells, as Chimes, Peals or Carillons 9206006000 649,450 $8,505,445
Percussion Musical Instruments, Nesoi* 9206008000 3,655,562 $22,520,793
Musical Synthesizers (Under $100 Each) 9207100005 131,538 $3,386,238
Musical Synthesizers ($100 or Over Each) 9207100010 91,533 $51,346,755
Keyboard Instrument (More Than 1 Keyboard Under $200) 9207100045 6,471 $337,110
Keyboard Instrument (More Than 1 Keyboard $200 or Over) 9207100055 1,361 $2,974,385
Keyboard Instrument (More Than 1 Keyboard Handheld) 9207100060 69,463 $2,421,490
Keyboard Instrument Except Accordions (1 Keyboard Under $100) 9207100065 1,114,394 $45,033,844
Keyboard Instrument Except Accordions (1 Keyboard $100 or Over) 9207100075 359,621 $118,321,023
Fretted Stringed Instruments 9207900040 2,252,681 $200,301,358
2006 data
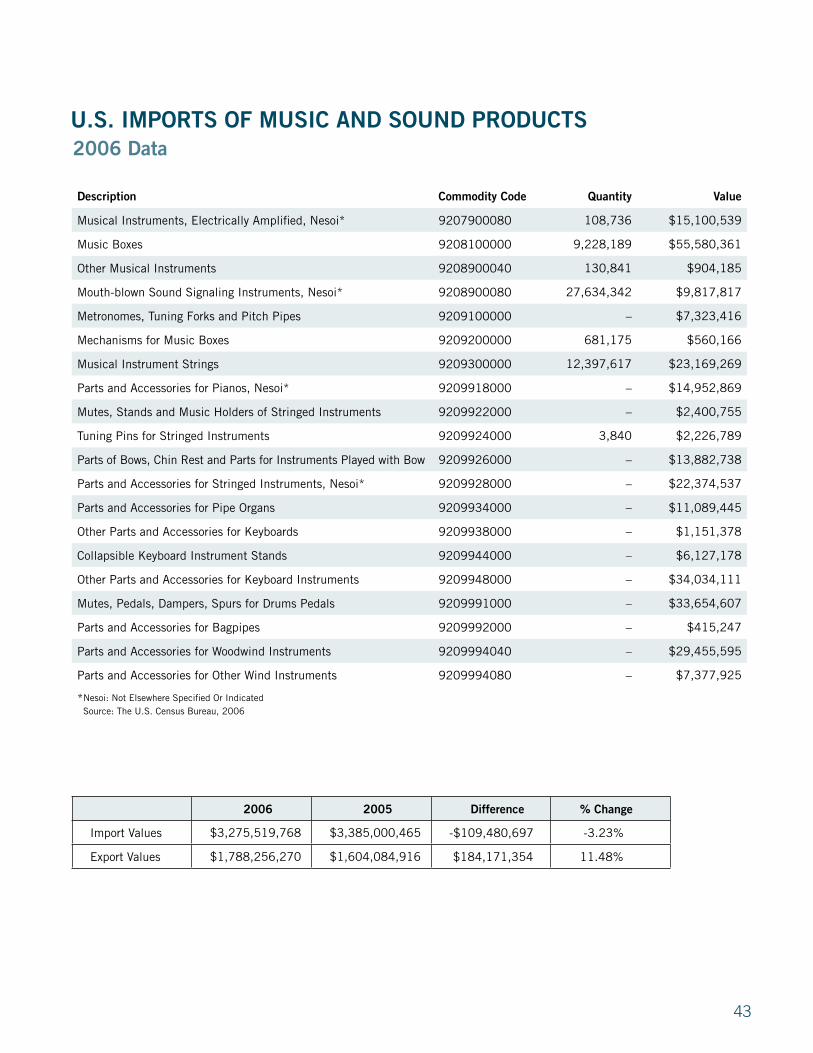
��
2006 data U.s. iMPorts of MUsiC And soUnd ProdUCts
description Commodity Code Quantity value
Musical Instruments, Electrically Amplified, Nesoi* 9207900080 108,736 $15,100,539
Music Boxes 9208100000 9,228,189 $55,580,361
Other Musical Instruments 9208900040 130,841 $904,185
Mouth-blown Sound Signaling Instruments, Nesoi* 9208900080 27,634,342 $9,817,817
Metronomes, Tuning Forks and Pitch Pipes 9209100000 – $7,323,416
Mechanisms for Music Boxes 9209200000 681,175 $560,166
Musical Instrument Strings 9209300000 12,397,617 $23,169,269
Parts and Accessories for Pianos, Nesoi* 9209918000 – $14,952,869
Mutes, Stands and Music Holders of Stringed Instruments 9209922000 – $2,400,755
Tuning Pins for Stringed Instruments 9209924000 3,840 $2,226,789
Parts of Bows, Chin Rest and Parts for Instruments Played with Bow 9209926000 – $13,882,738
Parts and Accessories for Stringed Instruments, Nesoi* 9209928000 – $22,374,537
Parts and Accessories for Pipe Organs 9209934000 – $11,089,445
Other Parts and Accessories for Keyboards 9209938000 – $1,151,378
Collapsible Keyboard Instrument Stands 9209944000 – $6,127,178
Other Parts and Accessories for Keyboard Instruments 9209948000 – $34,034,111
Mutes, Pedals, Dampers, Spurs for Drums Pedals 9209991000 – $33,654,607
Parts and Accessories for Bagpipes 9209992000 – $415,247
Parts and Accessories for Woodwind Instruments 9209994040 – $29,455,595
Parts and Accessories for Other Wind Instruments 9209994080 – $7,377,925
* Nesoi: Not Elsewhere Specified Or Indicated Source: The U.S. Census Bureau, 2006
2006 2005 difference % Change
Import Values $3,275,519,768 $3,385,000,465 -$109,480,697 -3.23%
Export Values $1,788,256,270 $1,604,084,916 $184,171,354 11.48%
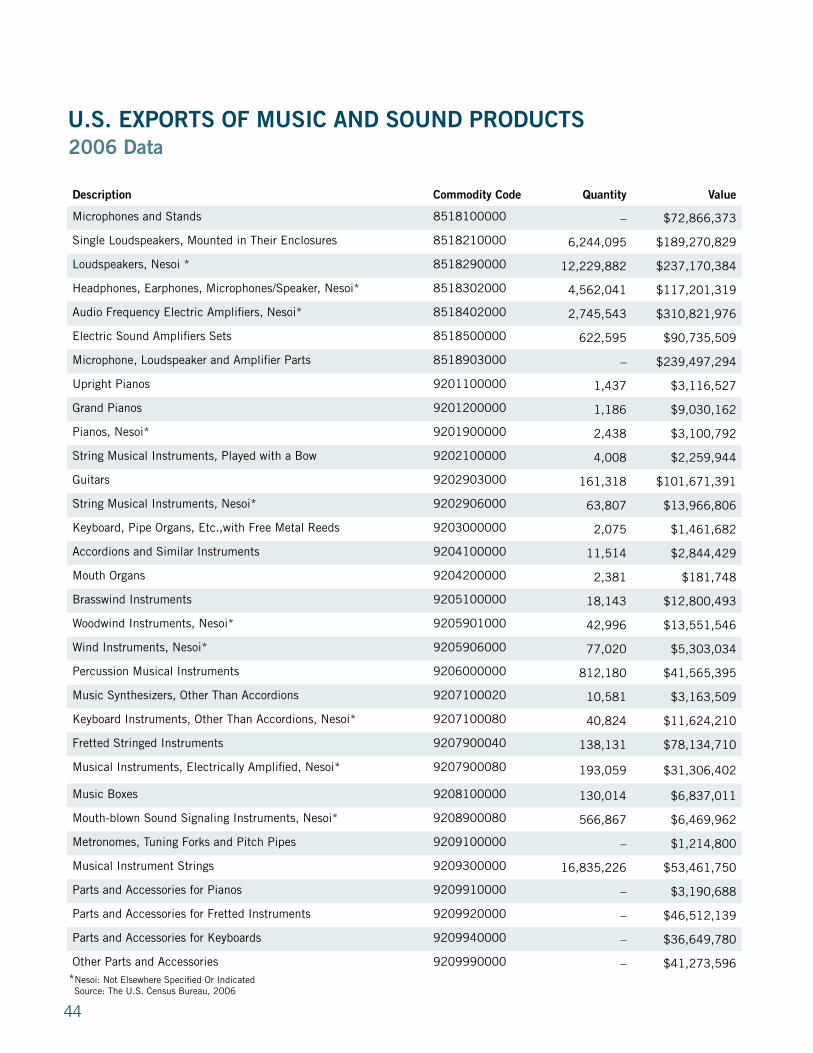
��
* Nesoi: Not Elsewhere Specified Or Indicated Source: The U.S. Census Bureau, 2006
2006 data U.s. exPorts of MUsiC And soUnd ProdUCts
description Commodity Code Quantity value
Microphones and Stands 8518100000 – $72,866,373
Single Loudspeakers, Mounted in Their Enclosures 8518210000 6,244,095 $189,270,829
Loudspeakers, Nesoi * 8518290000 12,229,882 $237,170,384
Headphones, Earphones, Microphones/Speaker, Nesoi* 8518302000 4,562,041 $117,201,319
Audio Frequency Electric Amplifiers, Nesoi* 8518402000 2,745,543 $310,821,976
Electric Sound Amplifiers Sets 8518500000 622,595 $90,735,509
Microphone, Loudspeaker and Amplifier Parts 8518903000 – $239,497,294
Upright Pianos 9201100000 1,437 $3,116,527
Grand Pianos 9201200000 1,186 $9,030,162
Pianos, Nesoi* 9201900000 2,438 $3,100,792
String Musical Instruments, Played with a Bow 9202100000 4,008 $2,259,944
Guitars 9202903000 161,318 $101,671,391
String Musical Instruments, Nesoi* 9202906000 63,807 $13,966,806
Keyboard, Pipe Organs, Etc.,with Free Metal Reeds 9203000000 2,075 $1,461,682
Accordions and Similar Instruments 9204100000 11,514 $2,844,429
Mouth Organs 9204200000 2,381 $181,748
Brasswind Instruments 9205100000 18,143 $12,800,493
Woodwind Instruments, Nesoi* 9205901000 42,996 $13,551,546
Wind Instruments, Nesoi* 9205906000 77,020 $5,303,034
Percussion Musical Instruments 9206000000 812,180 $41,565,395
Music Synthesizers, Other Than Accordions 9207100020 10,581 $3,163,509
Keyboard Instruments, Other Than Accordions, Nesoi* 9207100080 40,824 $11,624,210
Fretted Stringed Instruments 9207900040 138,131 $78,134,710
Musical Instruments, Electrically Amplified, Nesoi* 9207900080 193,059 $31,306,402
Music Boxes 9208100000 130,014 $6,837,011
Mouth-blown Sound Signaling Instruments, Nesoi* 9208900080 566,867 $6,469,962
Metronomes, Tuning Forks and Pitch Pipes 9209100000 – $1,214,800
Musical Instrument Strings 9209300000 16,835,226 $53,461,750
Parts and Accessories for Pianos 9209910000 – $3,190,688
Parts and Accessories for Fretted Instruments 9209920000 – $46,512,139
Parts and Accessories for Keyboards 9209940000 – $36,649,780
Other Parts and Accessories 9209990000 – $41,273,596
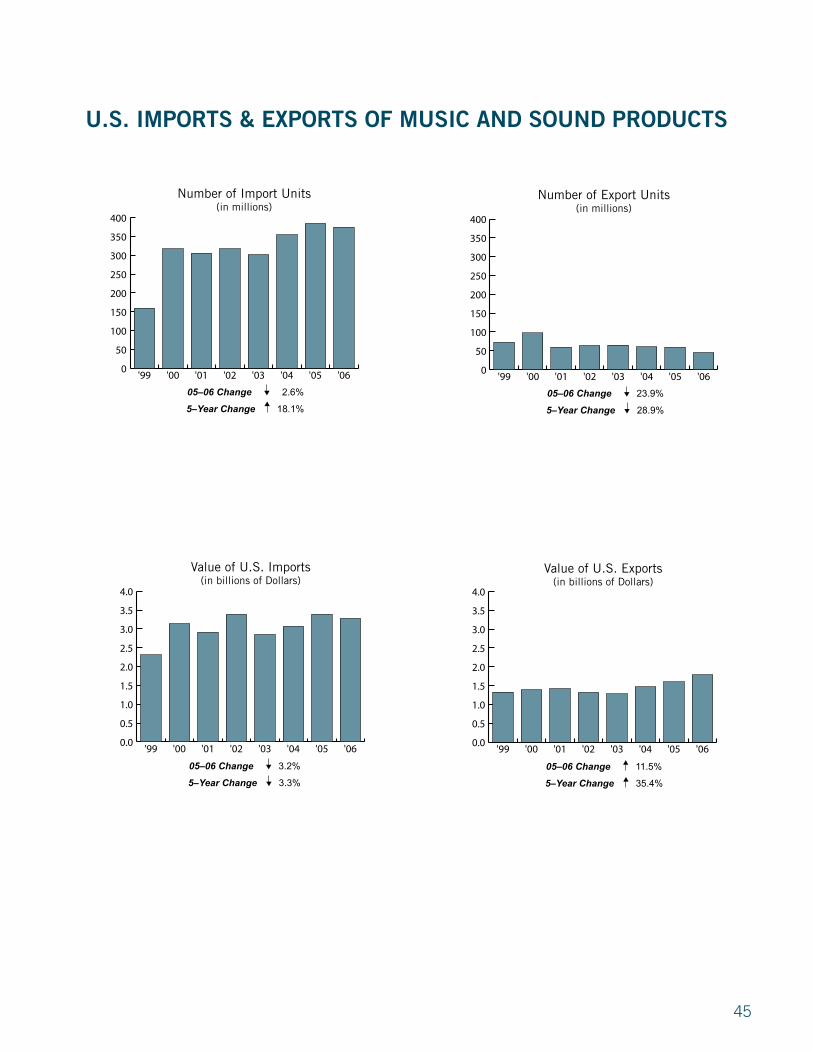
��
0
50
100
150
200
250
300
350
400
'06'05'04'03'02'01'00'99
Number of Import Units(in millions)
10
15
20
04 03 02 01 00 99 98 97 96 95
Uni
ts x
1,0
00
Import Value Units
5–Year Change
05–06 Change
18.1%
2.6%
0
50
100
150
200
250
300
350
400
'06'05'04'03'02'01'00'99
Number of Export Units(in millions)
10
15
20
04 03 02 01 00 99 98 97 96 95
Uni
ts x
1,0
00
Import Value Units
5–Year Change
05–06 Change
28.9%
23.9%
0.0
0.5
1.0
1.5
2.0
2.5
3.0
3.5
4.0
'06'05'04'03'02'01'00'99
Value of U.S. Exports(in billions of Dollars)
10
15
20
04 03 02 01 00 99 98 97 96 95
Uni
ts x
1,0
00
Import Value Units
5–Year Change
05–06 Change
35.4%
11.5%
0.0
0.5
1.0
1.5
2.0
2.5
3.0
3.5
4.0
'06'05'04'03'02'01'00'99
Value of U.S. Imports(in billions of Dollars)
10
15
20
04 03 02 01 00 99 98 97 96 95
Uni
ts x
1,0
00
Import Value Units
5–Year Change
05–06 Change
3.3%
3.2%
U.s. iMPorts & exPorts of MUsiC And soUnd ProdUCts

�6
Top 15 U.S. Music Product Export Destinations (in millions of Dollars)
Hong Kong
France
Italy
Denmark
Singapore
S. Korea
Germany
Canada
U.K.
Ireland
Netherlands
Australia
Mexico
Japan
China
$0 $100 $200 $300 $400
Export Value
The United States exported music products to a total of 178 countries in 2006.
Canada18%
Japan15%
Mexico10%
Germany7%
Others50%
Import Value
Top 15 Sources of Music Product Imports to the United States
(in millions of Dollars)
Vietnam
Thailand
France
Italy
U.K.
Hong Kong
Malaysia
Germany
Canada
Tawain
Indonesia
S. Korea
Mexico
Japan
China
$0 $500 $1000 $1500 $2000
Import Value
The United States imported music products from a total of 103 countries in 2006.
Others21%
Taiwan5%
S. Korea4%
Mexico5%
Japan6%
China59%

��
0
20
40
60
80
100
120
140
160
'06'05'04'03'02'01'00'99
Number of Brasswind Exports(in thousands)
10
15
20
04 03 02 01 00 99 98 97 96 95
Uni
ts x
1,0
00
Import Value Units
0
20
40
60
80
100
120
140
160
'06'05'04'03'02'01'00'99
Number of Brasswind Imports(in thousands)
10
15
20
04 03 02 01 00 99 98 97 96 95
Uni
ts x
1,0
00
Import Value Units
0
50
100
150
200
250
'06'05'04'03'02'01'00'99
Number of Guitar Exports(in thousands)
10
15
20
04 03 02 01 00 99 98 97 96 95
Uni
ts x
1,0
00
Import Value Units
0
50
100
150
200
250
'06'05'04'03'02'01'00'99
Number of Guitar Imports(in thousands)
10
15
20
04 03 02 01 00 99 98 97 96 95
Uni
ts x
1,0
00
Import Value Units
0
20
40
60
80
100
120
'06'05'04'03'02'01'00'99
Value of Guitar Exports(in millions of Dollars)
10
15
20
04 03 02 01 00 99 98 97 96 95
Uni
ts x
1,0
00
Import Value Units
0
20
40
60
80
100
120
'06'05'04'03'02'01'00'99
Value of Guitar Imports(in millions of Dollars)
10
15
20
04 03 02 01 00 99 98 97 96 95
Uni
ts x
1,0
00
Import Value Units
U.S. Imports and Exports

�8
0
10
20
30
40
50
'06'05'04'03'02'01'00'99
Value of Brasswind Exports(in millions of Dollars)
10
15
20
04 03 02 01 00 99 98 97 96 95
Uni
ts x
1,0
00
Import Value Units
0
10
20
30
40
50
'06'05'04'03'02'01'00'99
Value of Brasswind Imports(in millions of Dollars)
10
15
20
04 03 02 01 00 99 98 97 96 95
Uni
ts x
1,0
00
Import Value Units
0.0
0.5
1.0
1.5
2.0
2.5
'06'05'04'03'02'01'00'99
Number of Drum & Percussion Exports(in millions)
10
15
20
04 03 02 01 00 99 98 97 96 95
Uni
ts x
1,0
00
Import Value Units
0.0
0.5
1.0
1.5
2.0
2.5
'06'05'04'03'02'01'00'99
Number of Drum & Percussion Imports(in millions)
10
15
20
04 03 02 01 00 99 98 97 96 95
Uni
ts x
1,0
00
Import Value Units
0
20
40
60
80
100
'06'05'04'03'02'01'00'99
Value of Drum & Percussion Exports(in millions of Dollars)
10
15
20
04 03 02 01 00 99 98 97 96 95
Uni
ts x
1,0
00
Import Value Units
0
20
40
60
80
100
'06'05'04'03'02'01'00'99
Value of Drum & Percussion Imports(in millions of Dollars)
10
15
20
04 03 02 01 00 99 98 97 96 95
Uni
ts x
1,0
00
Import Value Units
U.S. Imports and Exports

the nAMM gLobAL rePortinternAtionAL dAtA
51 �ustralia
58 �ustria
64 Canada
70 China
80 Germany
88 Italy
94 Japan
102 Norway
107 Spain
112 Switzerland
117 United Kingdom
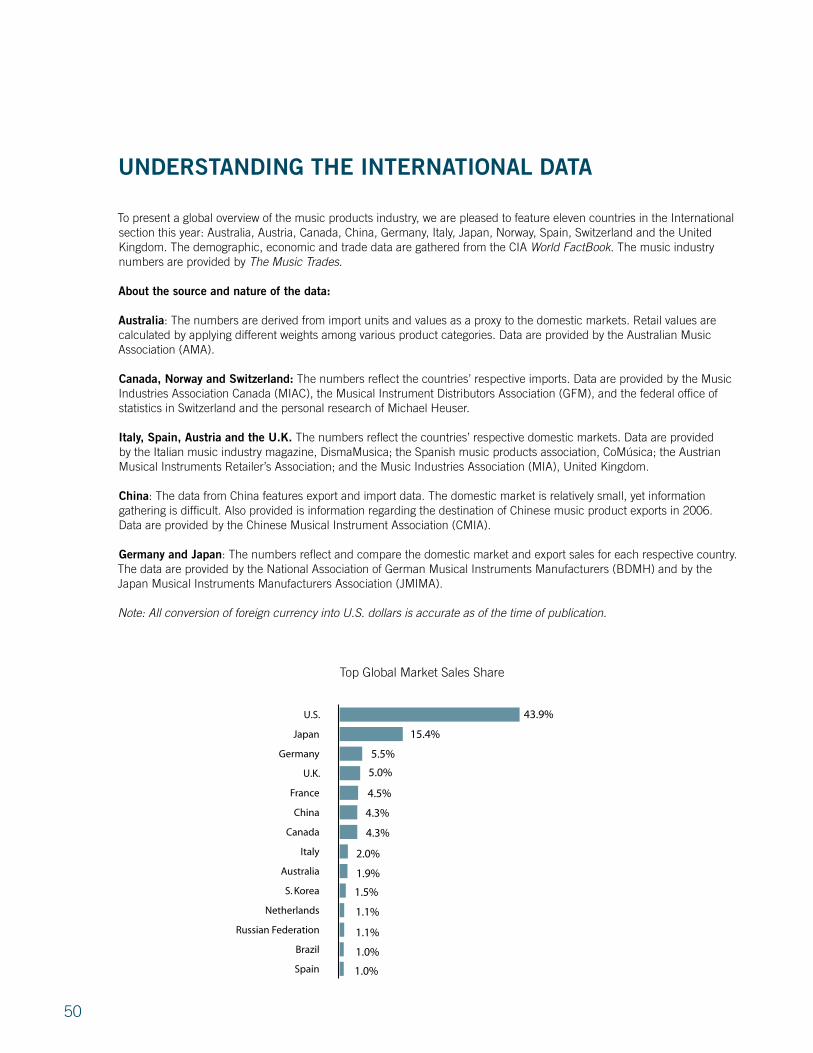
�0
To present a global overview of the music products industry, we are pleased to feature eleven countries in the International section this year: �ustralia, �ustria, Canada, China, Germany, Italy, Japan, Norway, Spain, Switzerland and the United Kingdom. The demographic, economic and trade data are gathered from the CI� World FactBook. The music industry numbers are provided by The Music Trades.
About the source and nature of the data:
Australia: The numbers are derived from import units and values as a proxy to the domestic markets. Retail values are calculated by applying different weights among various product categories. Data are provided by the �ustralian Music �ssociation (�M�).
Canada, norway and switzerland: The numbers reflect the countries’ respective imports. Data are provided by the Music Industries �ssociation Canada (MI�C), the Musical Instrument Distributors �ssociation (GFM), and the federal office of statistics in Switzerland and the personal research of Michael Heuser.
italy, spain, Austria and the U.K. The numbers reflect the countries’ respective domestic markets. Data are provided by the Italian music industry magazine, DismaMusica; the Spanish music products association, CoMúsica; the �ustrian Musical Instruments Retailer’s �ssociation; and the Music Industries �ssociation (MI�), United Kingdom.
China: The data from China features export and import data. The domestic market is relatively small, yet information gathering is difficult. �lso provided is information regarding the destination of Chinese music product exports in �006. Data are provided by the Chinese Musical Instrument �ssociation (CMI�).
germany and Japan: The numbers reflect and compare the domestic market and export sales for each respective country. The data are provided by the National �ssociation of German Musical Instruments Manufacturers (�DMH) and by the Japan Musical Instruments Manufacturers �ssociation (JMIM�).
Note: All conversion of foreign currency into U.S. dollars is accurate as of the time of publication.
Top Global Market Sales Share
0
10
20 30 40 50
Spain
Brazil
Russian Federation
Netherlands
S. Korea
Australia
Italy
Canada
China
France
U.K.
Germany
Japan
U.S. 43.9%
15.4%
5.0%
4.5%
4.3%
5.5%
4.3%
2.0%
1.9%
1.5%
1.1%
1.1%
1.0%
1.0%
UnderstAnding the internAtionAL dAtA

�1
AUstrALiA
Music product imports into �ustralia achieved record levels in financial year �006 with unit imports rising by 9 percent and import value by nearly � percent. This result saw unit imports exceed � million items (excluding items such as guitar strings, print music, etc.) for the first time and import value rise by some 1� million �ustralian dollars or by approximately $�� million when looking at retail. These results show that the industry has grown at around three times that of the �ustralian GDP during �006, a generally satisfying result. The summary therefore for this past year could not be anything other than good.
Underpinning the results in �006 and in the recent past are a number of favourable factors, including:
• � robust economy, with high levels of consumer confidence and record low levels of unemployment
• Positive music role models with the return of guitar-based music to the forefront of popular music
• Increased government spending on music education (an additional $1� million in �006)
• Increasingly affordable (low-cost) entry-level instruments from many of the major manufacturers due to the combination of a strong �ustralian dollar and the increased availability (and quality) from low-cost producers, primarily from China
• Increased exposure and recognition for music making in mainstream media, through programs and activities such as Weekend Warriors, Music. Play for Life and music education reviews. �dditionally, there is a strong positive presence for music making through major television advertising campaigns by the �NZ and Commonwealth �anks, Microsoft and others
� review of the data presented on the following pages will show that guitars and guitar amplifiers were the driving force behind the �006 numbers. This was supported by strong growth in digital pianos, drum products, synthesizers, orchestral strings and most professional audio product segments. Segments going into reverse include upright pianos, electronic keyboards and DJ products.
On balance, the �ustralian market is currently trending toward the positive. That is not to say there are not some serious challenges confronting the industry here in �ustralia.
� significant external threat to the industry comes via the gray importing of products into this market. These products are most often sourced from China or Southeast �sia and are passed off as quality instruments, when in fact they often are not. In some cases they are counterfeit reproductions of brand name products or “no name” products that are priced very aggressively but simply are not fit for their original purpose. Trumpets with fixed values, violins that refuse to be set up, or guitars with unplayable actions are typical of these products. The availability of these products undermine the industry in dollar terms and in several other telling ways, including the public perception of our retailers, who sell only fully functioning, legitimate but correspondingly high-value instruments. It also undermines the affected consumers and their relationship with music making. This is especially the case for the many first-time buyers of music products, who generally do not know any better. Our consumer protection laws need to be upgraded if consumers are to be protected from such unscrupulous practices by online sellers.
��
(�ustralia, Continued)
Finally, the continued decline in average unit values continues to shadow the industry. �lthough with strong unit growth this is not such a pressing issue, but there must be a ceiling (even if only a temporary one) to consumption. There is some evidence of a slowing in import numbers in the first half of the �00� financial year, however at this stage it would seem to be a flattening of growth rather than a reversal of the recent upward trend. To highlight the situation, since 1996 the average price of:
• Electric guitar imports has fallen by 1� percent
• Digital piano imports has fallen by �� percent
• Drum kit and electronic keyboard imports has fallen by 1� percent
• Orchestral stringed instruments has fallen by 60 percent
During that same period the consumer price index, the national measure of price movements, has risen by nearly �0 percent. Put simply, a trip to the supermarket in �006 cost around �0 percent more than in 1996, but a visit to a music store to purchase an electric guitar cost around 1� percent less, and that’s before factoring in a decade’s worth of inflation.
The final potential downside to this strong market is an internal one. The comparative ease in which consumers walk into our retail stores in this environment can produce some complacency. While not universal, the lack of effective customer relationship management mechanisms by many industry participants may have longer term negative consequences. We are selling record numbers of guitars and near-record numbers of keyboards, but the industry—broadly speaking—does not have the mechanisms in place to nurture that first-time $�00 purchaser into a $�0,000 customer over time. The ��0,000 guitar buyers and the 80,000 electronic keyboard buyers amongst others in �006 need to be managed and supported now so that as many of them as possible will still be our customers in �01� or �0�� and beyond. There are opportunities to help
“future-proof” the industry now in anticipation of times that are not so good and the stars are not so well aligned as they are today.
The following charts are based on import data as a proxy to the domestic markets collected by the Australian Bureau of Statistics (ABS) in association with the Australian Music Association (AMA). Commentary by Ian Harvey, Executive Officer of AMA.

��
Demographics
65+13.1%
0–1419.6%
15–6467.3%
Economy
GDP-Industry26.2%
GDP-Agriculture3.8%
GDP-Service70.0%
AUstrALiA snAPshot
Population in millions 20.3
Median Age 36.9Population Growth 0.85%
0
100
200
300
400
500
600
700
'06'05'04'03'02'01'00'99'98'97'96'95
Australia GDP (PPP)(U.S. $ in billions)
Import Value Units
0
5
10
15
20
25
04 03 02 01 00 99 98 97 96
0
1
2
3
4
5
6
7
8
9
'06'05'04'03'02'01'00'99'98'97'96'95
Unemployment Rate (Percent)
Import Value Units
0
5
10
15
20
25
04 03 02 01 00 99 98 97 96
0
1
2
3
4
5
'06'05'04'03'02'01'00'99'98'97'96'95
Inflation (Annual Percent Rate)
Import Value Units
0
5
10
15
20
25
04 03 02 01 00 99 98 97 96
Demographics
Economy
Data Source: Demographics, Economy and Trade from CIA, Music Industry from The Music Trades. GDP (PPP): Gross Domestic Product based on purchasing-power-parity (PPP) valuation of country GDP in U.S. dollars.`
Age Male female
0–1� �.0� 1.9�
1�–6� 6.88 6.�6
6� & Over 1.1� 1.�8
GDP (PPP) $666.� billion
GDP Per Capita $��,900
GDP-Real Growth Rate �.80%
Unemployment Rate �.90%
Inflation �.80%

International Data
��
0
5
10
15
20
25
IndiaNew Zealand
U.S.S. KoreaChinaJapan
Export Partners (2006)
10
15
20
04 03 02 01 00 99 98 97 96 95
Ann
ual P
erce
ntag
e
Uni
ts x
1,0
00
Import Value Units
0
3
6
9
12
15
GermanySingaporeJapanChinaU.S.
Import Partners (2006)
10
15
20
04 03 02 01 00 99 98 97 96 95
Ann
ual P
erce
ntag
e
Uni
ts x
1,0
00
Import Value Units
Total Export $117.0 billion
Total Import $127.7 billion
Export as % of GDP 17.56%
Import as % of GDP 19.17%
Trade
Music Industry
Music Market $343.6 million
Sales Per Capita $17.44
Global Share 1.92%
Music Sales Per Capita(U.S. $)
0
4
8
12
16
20
'06'05'04'03'02'01'00'99
Share of Global Music Market(Percent)
0.0
0.5
1.0
1.5
2.0
2.5
'06'05'04'03'02'01'00'99
Australia Music Market(U.S. $ in millions)
0
50
100
150
200
250
300
350
400
'06'05'04'03'02'01'00'99
Note: The value of the �ustralian dollar has been rising steadily against the U.S. dollar in the past years; this may affect the trends indicated by the above charts.
Australia Snapshot

International Data
��
0
5
10
15
20
25
30
35
'06'05'04'03'02'01'00'99'98'97
Acoustic & Acoustic-Electric Guitars
Valu
e in
Aus
tral
ian
$ m
illio
ns
Uni
ts x
1,0
00
Import Value Units
Uni
ts x
1,0
00
Retail Value Units
0
20
40
60
80
100
120
040302010099989796
0
20
40
60
80
100
120
06050403020100999897
0
2
4
6
8
10
12
'06'05'04'03'02'01'00'99'98'97
Bass Guitars
Valu
e in
Aus
tral
ian
$ m
illio
ns
Uni
ts x
1,0
00
Import Value Units
Uni
ts x
1,0
00
Retail Value Units
0
5
10
15
20
25
040302010099989796
0
5
10
15
20
25
06050403020100999897
0
10
20
30
40
50
60
'06'05'04'03'02'01'00'99'98'97
Electric Guitars
Uni
ts x
1,0
00
Import Value Units
Uni
ts x
1,0
00
0
20
40
60
80
100
0403020100999897960
20
40
60
80
100
06050403020100999897
Valu
e in
Aus
tral
ian
$ m
illio
ns
Retail Value Units
0
10
20
30
40
50
60
70
80
90
100
'06'05'04'03'02'01'00'99'98'97
Total Guitars
Valu
e in
Aus
tral
ian
$ m
illio
ns
Uni
ts x
1,0
00
Import Value Units
Uni
ts x
1,0
00
Retail Value Units
0
25
50
75
100
125
150
175
200
225
040302010099989796
Uni
ts x
1,0
00
0
25
50
75
100
125
150
175
200
225
06050403020100999897
0
5
10
15
20
25
30
'06'05'04'03'02'01'00'99'98'97
Grand Pianos
0.0
0.2
0.4
0.6
0.8
1.0
1.2
1.4
05040302010099989796
Valu
e in
Aus
tral
ian
$ m
illio
ns
Uni
ts x
1,0
00
Uni
ts x
1,0
00
Import Value Units
Retail Value Units
0.0
0.2
0.4
0.6
0.8
1.0
1.2
06050403020100999897
0
5
10
15
20
25
30
35
40
'06'05'04'03'02'01'00'99'98'97
Upright Pianos
0
1
2
3
4
5
6
7
040302010099989796
Valu
e in
Aus
tral
ian
$ m
illio
ns
Uni
ts x
1,0
00
Import Value Units
Uni
ts x
1,0
00
Retail Value Units
0
1
2
3
4
5
6
7
06050403020100999897
Australia Domestic Sales
Australia

�6
0
5
10
15
20
25
30
35
'06'05'04'03'02'01'00'99'98'97
Woodwind
Valu
e in
Aus
tral
ian
$ m
illio
ns
Uni
ts x
1,0
00
Import Value Units
Uni
ts x
1,0
00
Retail Value Units
0
5
10
15
20
25
04 03 02 01 00 99 98 97 96
Uni
ts x
1,0
00
Import Value Units
0
50
100
150
200
250
300
06050403020100999897
0
1
2
3
4
5
6
7
8
9
'06'05'04'03'02'01'00'99'98'97
Orchestral Stringed Instruments
Valu
e in
Aus
tral
ian
$ m
illio
ns
Uni
ts x
1,0
00
Import Value Units
Uni
ts x
1,0
00
Retail Value Units
0
5
10
15
20
25
30
040302010099989796
0
5
10
15
20
25
30
06050403020100999897
0
2
4
6
8
10
12
14
'06'05'04'03'02'01'00'99'98'97
Brasswind
Valu
e in
Aus
tral
ian
$ m
illio
ns
Uni
ts x
1,0
00
Import Value UnitsU
nits
x 1
,00
0
Retail Value Units
0
2
4
6
8
10
04 03 02 01 00 99 98 97 96
Uni
ts x
1,0
00
Import Value Units
0
2
4
6
8
10
06050403020100999897
0
4
8
12
16
20
'06'05'04'03'02'01'00'99'98'97
Digital Pianos
Valu
e in
Aus
tral
ian
$ m
illio
ns
Uni
ts x
1,0
00
Import Value Units
Uni
ts x
1,0
00
Retail Value Units
0
1
2
3
4
5
6
7
8
04 03 02 01 00 99 98 97 96
0
1
2
3
4
5
6
7
8
06050403020100999897
0
4
8
12
16
20
'06'05'04'03'02'01'00'99'98'97
Drums
Valu
e in
Aus
tral
ian
$ m
illio
ns
Uni
ts x
1,0
00
Import Value Units
Uni
ts x
1,0
00
Retail Value Units
0
10
20
30
40
50
60
040302010099989796
Uni
ts x
1,0
00
Import Value Units
0
10
20
30
40
50
60
06050403020100999897
0
5
10
15
20
25
30
35
'06'05'04'03'02'01'00'99'98'97
Portable Keyboards
Valu
e in
Aus
tral
ian
$ m
illio
ns
Uni
ts x
1,0
00
Import Value Units
Uni
ts x
1,0
00
Retail Value Units
0
10
20
30
40
50
60
70
80
90
040302010099989796
0
10
20
30
40
50
60
70
80
90
06050403020100999897
Australia Domestic Sales
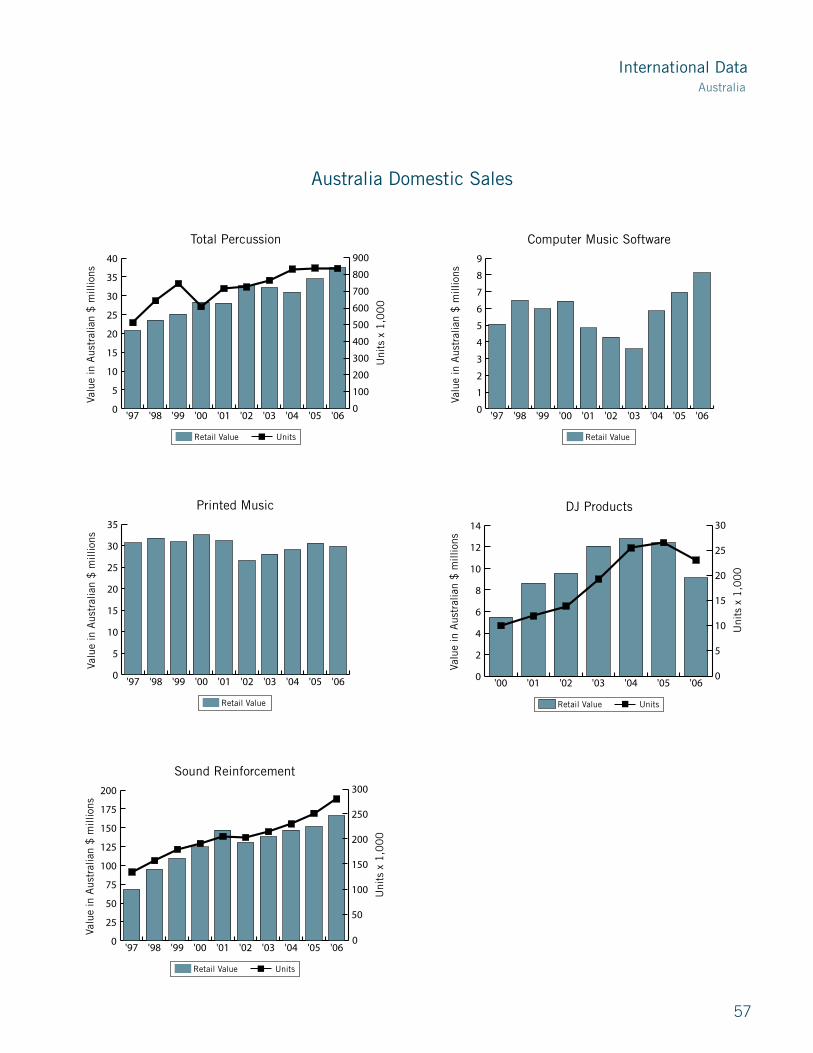
International Data
��
Australia
Uni
ts x
1,0
00
Import Value Units
Uni
ts x
1,0
00
Import Value Units
0
25
50
75
100
125
150
175
200
'06'05'04'03'02'01'00'99'98'97
Sound Reinforcement
Valu
e in
Aus
tral
ian
$ m
illio
ns
Uni
ts x
1,0
00
Retail Value Units
0
50
100
150
200
250
300
040302010099989796
0
50
100
150
200
250
300
06050403020100999897
0
5
10
15
20
25
30
35
'06'05'04'03'02'01'00'99'98'97
Printed Music
Valu
e in
Aus
tral
ian
$ m
illio
ns
Uni
ts x
1,0
00
Import Value Units
Retail Value
0
35
70
105
140
175
210
245
280
315
350
04 03 02 01 00 99 98 97 96
Uni
ts x
1,0
00
Import Value Units
0
5
10
15
20
25
30
35
40
'06'05'04'03'02'01'00'99'98'97
Total Percussion
Valu
e in
Aus
tral
ian
$ m
illio
ns
Uni
ts x
1,0
00
Import Value Units
Uni
ts x
1,0
00
Retail Value Units
0
100
200
300
400
500
600
700
800
900
040302010099989796
Uni
ts x
1,0
00
Import Value Units
0
100
200
300
400
500
600
700
800
900
06050403020100999897
0
1
2
3
4
5
6
7
8
9
'06'05'04'03'02'01'00'99'98'97
Computer Music Software
Valu
e in
Aus
tral
ian
$ m
illio
ns
Uni
ts x
1,0
00
Import Value Units
Retail Value
0
35
70
105
140
175
210
245
280
315
350
04 03 02 01 00 99 98 97 96
Uni
ts x
1,0
00
Import Value Units
Australia Domestic Sales
0
2
4
6
8
10
12
14
'06'05'04'03'02'01'00
DJ Products
Valu
e in
Aus
tral
ian
$ m
illio
ns
Uni
ts x
1,0
00
Import Value Units
Uni
ts x
1,0
00
Retail Value Units
0
5
10
15
20
25
30
040302010099989796
0
5
10
15
20
25
30
06050403020100
�8
AUstriA
While the number of musical instrument retail stores in �ustria increased in �00�, �ustrian consumers, however, spent �.6 percent less in the music products market compared to �00�. This decrease may have been the cause for store owners to downsize their employee payroll.
The number of employees decreased by � percent, from �9� in �00� to ��8 employees in �00�. The number of stores, however, increased by � percent, from �0� stores in �00� to �1� stores in �00�. Thus, the average number of employees per store decreased slightly, from �.9 to �.� employees.
�ustrian musical instrument stores are separated into three categories. The Category � stores, or those with an annual sales volume of more than 1.1 million euros (U.S. $1,�8�,000), represent 16 percent of the market. The Category � stores, or stores with an annual sales volume between �60,000 and 1.1 million euros (U.S. $�86,000 to U.S. $1,�8�,000), represent 1� percent of the market, and the Category C stores, or stores with an annual sales volume of less than �60,000 euros (U.S. $�86,000), represent �0 percent of the �ustrian market. �dditionally, full-line stores represent �� percent of the music products retail stores (down from �� percent in �00�), while specialty stores represent �8 percent (up from �� percent in �00�). The average �ustrian music store produces an annual sales volume of �6�,000 euros (U.S. $6�6,000).
The �ustrian music market is segmented into the following product categories:
Wind Instruments ��.�% Guitars & Stringed Instruments 16.8% �coustic Pianos 1�.�% Sound Reinforcement 9.0% Drums & Percussion 8.�% Digital Pianos �.�% Keyboards & Synthesizers 6.8% Printed Music & Software 6.�% �ccordions �.�% Miscellaneous Instruments �.6% The accordion and brasswind segments experienced the most growth in �00�, with an increase in sales volume of more than 100 percent each. Woodwind instruments, stringed instruments, keyboards and digital pianos all saw an increase in sales volume as well. Sales were weaker for all other product categories, however. Synthesizers and sound modules saw the sharpest decrease—�� percent—and sound reinforcement products were a close second with a �0 percent decrease.
The following charts are based on retail sales data provided by the Austrian Musical Instruments Retailer’s Association. The Music Industry summary data was supplied by The Music Trades. Commentary paraphrased from summary by Otmar Hammerschmidt, chairman of the Austrian Musical Instruments Retailer’s Association.
AUstriA snAPshot

�9
Demographics
65+17.1%
0–1415.4%
15–6467.5%
Economy
GDP-Industry30.4%
GDP-Agriculture1.8%
GDP-Service67.8%
AUstriA snAPshot
Population in millions 8.2
Median Age 40.9Population Growth 0.09%
0
50
100
150
200
250
300
350
400
'06'05'04'03'02'01'00'99'98'97'96'95
Austria GDP (PPP)(U.S. $ in billions)
Import Value Units
0
5
10
15
20
25
04 03 02 01 00 99 98 97 96 0
1
2
3
4
5
6
'06'05'04'03'02'01'00'99'98'97'96'95
Unemployment Rate (Percent)
Import Value Units
0
5
10
15
20
25
04 03 02 01 00 99 98 97 96
0.0
0.5
1.0
1.5
2.0
2.5
3.0
'06'05'04'03'02'01'00'99'98'97'96'95
Inflation (Annual Percent Rate)
Import Value Units
0
5
10
15
20
25
040302010099989796
Demographics
Economy
Age Male female
0–1� 0.6� 0.61
1�–6� �.�8 �.��
6� & Over 0.�� 0.8�
GDP (PPP) $��9.� billion
GDP Per Capita $��,�00
GDP-Real Growth Rate �.�0%
Unemployment Rate �.90%
Inflation 1.60%
Data Source: Demographics, Economy and Trade from CIA, Music Industry from The Music Trades. GDP (PPP): Gross Domestic Product based on purchasing-power-parity (PPP) valuation of country GDP in U.S. dollars.

International Data
60
0
5
10
15
20
25
30
35
FranceSwitzerlandU.S.ItalyGermany
Export Partners (2006)
10
15
20
04 03 02 01 00 99 98 97 96 95
Ann
ual P
erce
ntag
e
Uni
ts x
1,0
00
Import Value Units
0
10
20
30
40
50
SwitzerlandItalyGermany
Import Partners (2006)
10
15
20
04 03 02 01 00 99 98 97 96 95
Ann
ual P
erce
ntag
e
Uni
ts x
1,0
00
Import Value Units
Total Export $133.3 billion
Total Import $134.3 billion
Export as % of GDP 47.69%
Import as % of GDP 48.05%
Trade
Music Industry
Music Market $96.2 million
Sales Per Capita $11.87
Global Share 0.54%
Music Sales Per Capita(U.S. $)
0
2
4
6
8
10
12
14
16
18
'06'05'04'0302'0100
Share of Global Music Market(Percent)
0.0
0.2
0.4
0.6
0.8
1.0
1.2
'06'05'04'03'02'01'00
Austria Music Market(U.S. $ in millions)
0
25
50
75
100
125
150
'06'0504'03'02'01'00
Austria Snapshot
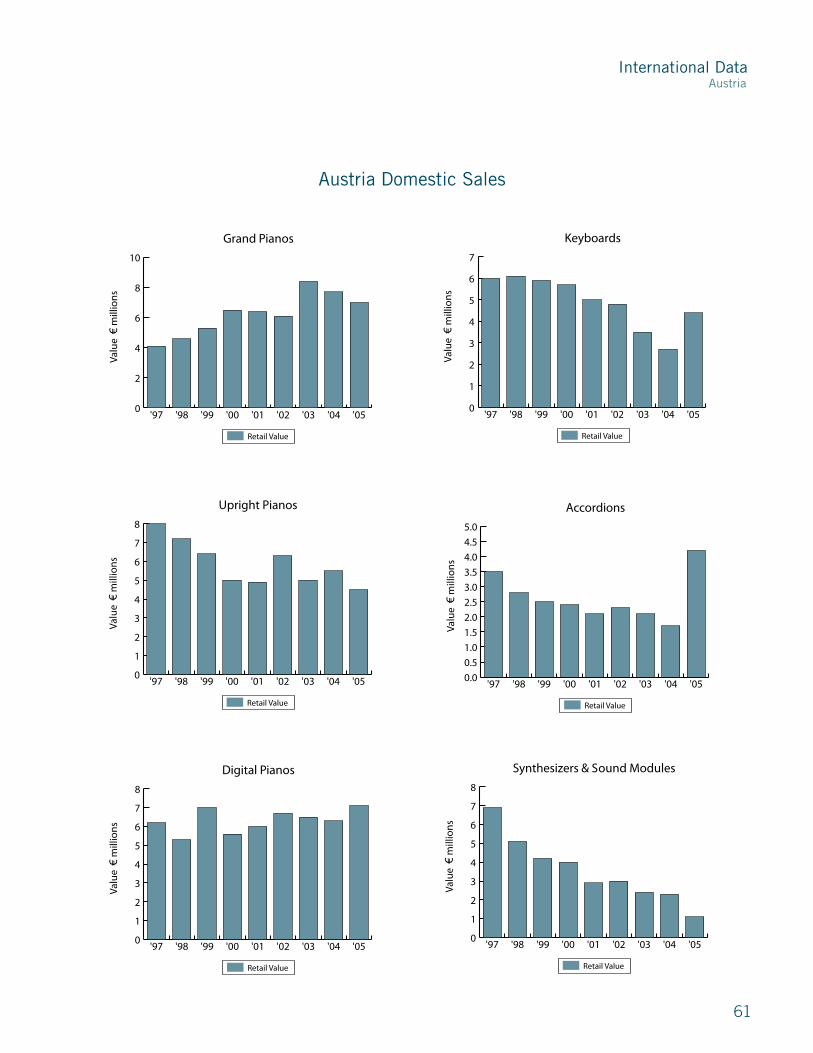
International Data
61
0
2
4
6
8
10
'05'04'03'02'01'00'99'98'97
Grand Pianos
Valu
e €
mill
ions
Uni
ts x
1,0
00
Import Value Units
Retail Value
0
20
40
60
80
100
0403020100999897960
1
2
3
4
5
6
7
8
'05'04'03'02'01'00'99'98'97
Upright Pianos
Valu
e €
mill
ions
Uni
ts x
1,0
00
Import Value Units
Retail Value
0
20
40
60
80
100
0403020100999897960
1
2
3
4
5
6
7
8
'05'04'03'02'01'00'99'98'97
Digital Pianos
Valu
e €
mill
ions
Uni
ts x
1,0
00
Import Value Units
Retail Value
0
20
40
60
80
100
040302010099989796
0.0
0.5
1.0
1.5
2.0
2.5
3.0
3.5
4.0
4.5
5.0
'05'04'03'02'01'00'99'98'97
Accordions
Valu
e €
mill
ions
Uni
ts x
1,0
00
Import Value Units
Retail Value
0
20
40
60
80
100
0403020100999897960
1
2
3
4
5
6
7
8
'05'04'03'02'01'00'99'98'97
Synthesizers & Sound Modules
Valu
e €
mill
ions
Uni
ts x
1,0
00
Import Value Units
Retail Value
0
20
40
60
80
100
040302010099989796
Austria Domestic Sales
0
1
2
3
4
5
6
7
'05'04'03'02'01'00'99'98'97
Keyboards
Valu
e €
mill
ions
Uni
ts x
1,0
00
Import Value Units
Retail Value
0
20
40
60
80
100
040302010099989796
Austria
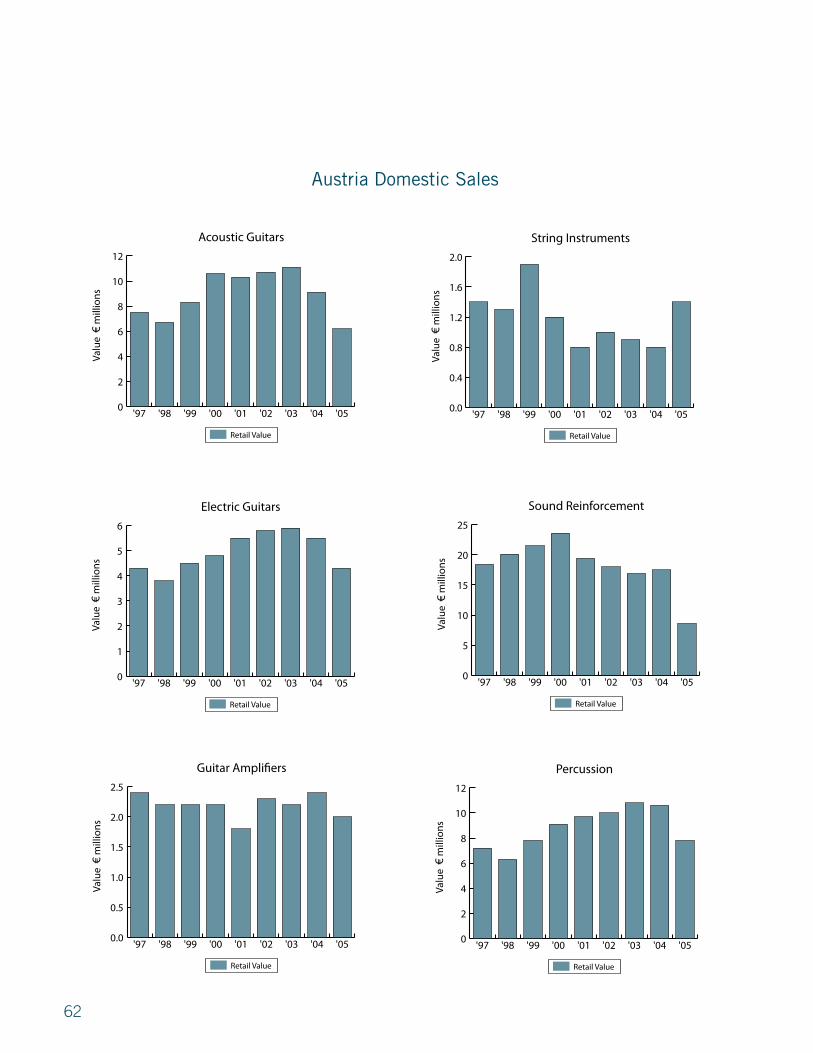
6�
0
1
2
3
4
5
6
'05'04'03'02'01'00'99'98'97
Electric Guitars
Valu
e €
mill
ions
Uni
ts x
1,0
00
Import Value Units
Retail Value
0
20
40
60
80
100
0403020100999897960.0
0.5
1.0
1.5
2.0
2.5
'05'04'03'02'01'00'99'98'97
Guitar Amplifiers
Valu
e €
mill
ions
Uni
ts x
1,0
00
Import Value Units
Retail Value
0
20
40
60
80
100
040302010099989796
0.0
0.4
0.8
1.2
1.6
2.0
'05'04'03'02'01'00'99'98'97
String Instruments
Valu
e €
mill
ions
Uni
ts x
1,0
00Import Value Units
Retail Value
0
20
40
60
80
100
0403020100999897960
5
10
15
20
25
'05'04'03'02'01'00'99'98'97
Sound Reinforcement
Valu
e €
mill
ions
Uni
ts x
1,0
00
Import Value Units
Retail Value
0
20
40
60
80
100
0403020100999897960
2
4
6
8
10
12
'05'04'03'02'01'00'99'98'97
Percussion
Valu
e €
mill
ions
Uni
ts x
1,0
00
Import Value Units
Retail Value
0
20
40
60
80
100
040302010099989796
Austria Domestic Sales
0
2
4
6
8
10
12
'05'04'03'02'01'00'99'98'97
Acoustic Guitars
Valu
e €
mill
ions
Uni
ts x
1,0
00
Import Value Units
Retail Value
0
20
40
60
80
100
040302010099989796
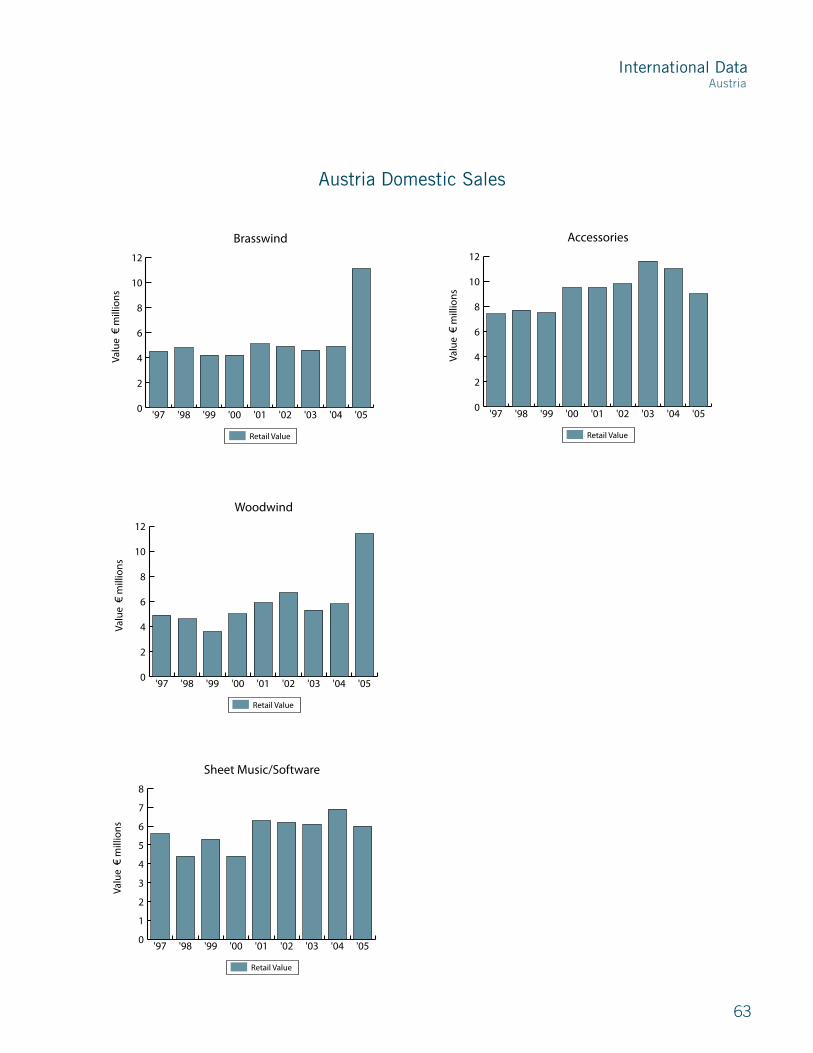
International Data
6�
0
5
10
15
20
25
'05'04'03'02'01'00'99'98'97
Sound Reinforcement
Valu
e €
mill
ions
Uni
ts x
1,0
00
Import Value Units
Retail Value
0
20
40
60
80
100
040302010099989796
0
2
4
6
8
10
12
'05'04'03'02'01'00'99'98'97
Woodwind
Valu
e €
mill
ions
Uni
ts x
1,0
00
Import Value Units
Retail Value
0
20
40
60
80
100
0403020100999897960
1
2
3
4
5
6
7
8
'05'04'03'02'01'00'99'98'97
Sheet Music/Software
Valu
e €
mill
ions
Uni
ts x
1,0
00
Import Value Units
Retail Value
0
20
40
60
80
100
040302010099989796
0
2
4
6
8
10
12
'05'04'03'02'01'00'99'98'97
Accessories
Valu
e €
mill
ions
Uni
ts x
1,0
00
Import Value Units
Retail Value
0
20
40
60
80
100
040302010099989796
Austria Domestic Sales
0
2
4
6
8
10
12
'05'04'03'02'01'00'99'98'97
Brasswind
Valu
e €
mill
ions
Uni
ts x
1,0
00
Import Value Units
Retail Value
0
20
40
60
80
100
040302010099989796
Austria

6�
CAnAdA
Canada continued with its established ranking as the seventh largest global market for music and sound products during �00�–�006, lining up behind the top six markets: the United States, Japan, Germany, the United Kingdom, France and China.
Published rankings in the December �006 issue of The Music Trades (U.S.) magazine indicated that for �00� (latest available), Canada’s annual sales in music and sound products was estimated at $�6� million (U.S.). This was an important adjustment over the previous year, when the magazine under-estimated totals for the Canadian market at $��6 million.
Canada’s survey ranking “per capita” was further adjusted upward to the No. � position globally at $��.�1 (U.S.) per person based on a population estimate of �1.� million. Only the United States ($�6.��) had a higher per capita total; Japan ($�1.�0) and �ustralia ($1�.��) followed Canada in the rankings.
The overall growth pattern for Canada in �00�–�006 was essentially level, according to the trend information provided by the MI�C “Select 1�” industry reports. Projections for �00� are conservatively estimated in the �–� percent growth range.
Six Canadian companies continue to be among the world’s top ��� suppliers according to The Music Trades rankings: J�M Industries ($1�0 million US), Yorkville Sound ($�9 million), Godin Guitar Company ($�� million), SF Marketing ($�� million), S��I�N Ltd. ($�� million) and Jean Larrivee Guitars ($1� million).
Recent trend information provided by Statistics Canada for �006 in various value categories compared to �00� is as follows:
�coustic Guitars -1% Electric Guitars -9% Upright Pianos +�% Grand Pianos -1�% Digital Pianos -�% Stringed Instruments with �ow +��% Total Woodwind 0% (average) Total �rass -1�% (average) Portable Keyboards +8% Percussion -1�% (average) Printed Music -�%
The following charts are based on import data provided by the Music Industries Association of Canada (MIAC) and verified by Statistics Canada reports. Commentary by Al Kowalenko, MIAC Executive Director, Toronto.
CAnAdA snAPshot

6�
Demographics
65+13.3%
0–1417.6%
15–64 69.1%
Economy
GDP-Industry29.2%
GDP-Agriculture2.3%
GDP-Service68.5%
Population in millions 33.1
Median Age 38.9Population Growth 0.88%
0.0
0.2
0.4
0.6
0.8
1.0
1.2
'06'05'04'03'02'01'00'99'98'97'96'95
Canada GDP (PPP)(U.S. $ in trillions)
Import Value Units
0
5
10
15
20
25
0403020100999897960
2
4
6
8
10
12
'06'05'04'03'02'01'00'99'98'97'96'95
Unemployment Rate(Percent)
Import Value Units
0
5
10
15
20
25
04 03 02 01 00 99 98 97 96
0.0
0.5
1.0
1.5
2.0
2.5
3.0
'06'05'04'03'02'01'00'99'98'97'96'95
Inflation (Annual Percent Rate)
Import Value Units
0
5
10
15
20
25
04 03 02 01 00 99 98 97 96
CAnAdA snAPshot
Demographics
Economy
Data Source: Demographics, Economy and Trade from CIA, Music Industry from The Music Trades. GDP (PPP): Gross Domestic Product based on purchasing-power-parity (PPP) valuation of country GDP in U.S. dollars.
Age Male female
0–1� �.99 �.8�
1�–6� 11.�8 11.��
6� & Over 1.88 �.��
GDP (PPP) $1.16 trillion
GDP Per Capita $��,�00
GDP-Real Growth Rate �.80%
Unemployment Rate 6.�0%
Inflation �.00%

International Data
66
0
20
40
60
80
100
U.K.JapanU.S.
Export Partners (2006)
10
15
20
04 03 02 01 00 99 98 97 96 95
Ann
ual P
erce
ntag
e
Uni
ts x
1,0
00
Import Value Units
0
10
20
30
40
50
60
MexicoChinaU.S.
Import Partners (2006)
10
15
20
04 03 02 01 00 99 98 97 96 95
Ann
ual P
erce
ntag
e
Uni
ts x
1,0
00
Import Value Units
Total Export $405.0 billion
Total Import $353.2 billion
Export as % of GDP 34.76%
Import as % of GDP 30.31%
Music Industry
Music Market $762.7 million
Sales Per Capita $24.21
Global Share 4.27%
Music Sales Per Capita(U.S. $)
0
5
10
15
20
25
'06'05'04'03'02'01'00'99
Share of Global Music Market(Percent)
0
1
2
3
4
5
'06'05'04'03'02'01'00'99
Canada Music Market(U.S. $ in millions)
0
100
200
300
400
500
600
700
800
'06'05'04'03'02'01'00'99
Trade
Canada Snapshot

International Data
6�
0
5
10
15
20
25
30
'06'05'04'03'02'01'00'99'98'97
Acoustic Guitars
0
50
100
150
200
250
300
04 03 02 01 00 99 98 97
Valu
e in
Can
adia
n $
mill
ions
Uni
ts x
1,0
00
Import Value Units
0
50
100
150
200
250
300
06050403020100999897
Uni
ts x
1,0
00
Import Value Units
0
10
20
30
40
50
60
'06'05'04'03'02'01'00'99'98'97
Electric Guitars
0
50
100
150
200
250
300
0403020100999897
Valu
e in
Can
adia
n $
mill
ions
Uni
ts x
1,0
00
Import Value Units
Uni
ts x
1,0
00
Import Value Units
0
50
100
150
200
250
300
06050403020100999897
300
0
5
10
15
20
25
'06'05'04'03'02'01'00'99'98'97
Grand Pianos
0
500
1000
1500
2000
2500
3000
3500
0403020100999897
Valu
e in
Can
adia
n $
mill
ions
Uni
ts x
1,0
00
Import Value Units
Uni
ts x
1,0
00
Import Value Units
0
1
2
3
4
5
06050403020100999897
0
10
20
30
40
50
60
70
80
'06'05'04'03'02'01'00'99'98'97
Total Guitars
0
100
200
300
400
500
600
0403020100999897
Valu
e in
Can
adia
n $
mill
ions
Uni
ts x
1,0
00
Import Value Units
Uni
ts x
1,0
00
Import Value Units
0
100
200
300
400
500
600
05050403020100999897
0
2
4
6
8
10
12
14
16
'06'05'04'03'02'01'00'99'98'97
Upright Pianos
0
1
2
3
4
5
6
7
0403020100999897
Valu
e in
Can
adia
n $
mill
ions
Uni
ts x
1,0
00
Import Value Units
Uni
ts x
1,0
00
Import Value Units
0
1
2
3
4
5
6
7
06050403020100999897
0
5
10
15
20
25
30
35
'06'05'04'03'02'01'00'99'98'97
Total Pianos
0
2
4
6
8
10
12
0403020100999897
Valu
e in
Can
adia
n $
mill
ions
Uni
ts x
1,0
00
Import Value Units
Uni
ts x
1,0
00
Import Value Units
0
2
4
6
8
10
12
06050403020100999897
Uni
ts x
1,0
00
Canada Imports
Canada

68
0
2
4
6
8
10
12
14
16
18
20
'06'05'04'03'02'01'00'99'98'97
Woodwind
0
50
100
150
200
250
300
350
400
450
500
0403020100999897
Valu
e in
Can
adia
n $
mill
ions
Uni
ts x
1,0
00
Import Value Units
Uni
ts x
1,0
00
Import Value Units
0
50
100
150
200
250
300
350
400
450
500
06050403020100999897
0
1
2
3
4
5
6
'06'05'04'03'02'01'00'99'98'97
Stringed Instruments Played with a Bow
0
10
20
30
40
50
60
0403020100999897
Valu
e in
Can
adia
n $
mill
ions
Uni
ts x
1,0
00
Import Value Units
Uni
ts x
1,0
00
Import Value Units
0
10
20
30
40
50
60
06050403020100999897
0
1
2
3
4
5
6
7
8
9
'06'05'04'03'02'01'00'99'98'97
Brasswind
0
2
4
6
8
10
12
14
16
18
04 03 02 01 00 99 98 97
Valu
e in
Can
adia
n $
mill
ions
Uni
ts x
1,0
00
Import Value Units
Uni
ts x
1,0
00
Import Value Units
Uni
ts x
1,0
00
0
2
4
6
8
10
12
14
16
18
06050403020100999897
0
5
10
15
20
25
'06'05'04'03'02'01'00'99'98'97
Drums & Percussion
0
100
200
300
400
500
600
700
800
04 03 02 01 00 99 98 97
Valu
e in
Can
adia
n $
mill
ions
Uni
ts x
1,0
00
Import Value Units
Uni
ts x
1,0
00
Import Value Units
0
100
200
300
400
500
600
700
800
06050403020100999897
0
2
4
6
8
10
12
14
'06'05'04'03'02'01'00'99'98'97
Portable Keyboards
0
20
40
60
80
100
120
04 03 02 01 00 99 98 97
Valu
e in
Can
adia
n $
mill
ions
Uni
ts x
1,0
00
Import Value Units
Uni
ts x
1,0
00
Import Value Units
0
20
40
60
80
100
120
060504030201009998970
5
10
15
20
25
30
35
40
'06'05'04'03'02'01'00'99'98'97
Total Electronic Keyboards
0
20
40
60
80
100
120
140
04 03 02 01 00 99 98 97
Valu
e in
Can
adia
n $
mill
ions
Uni
ts x
1,0
00
Import Value Units
Uni
ts x
1,0
00
Import Value Units
0
20
40
60
80
100
120
140
06050403020100999897
Canada Imports
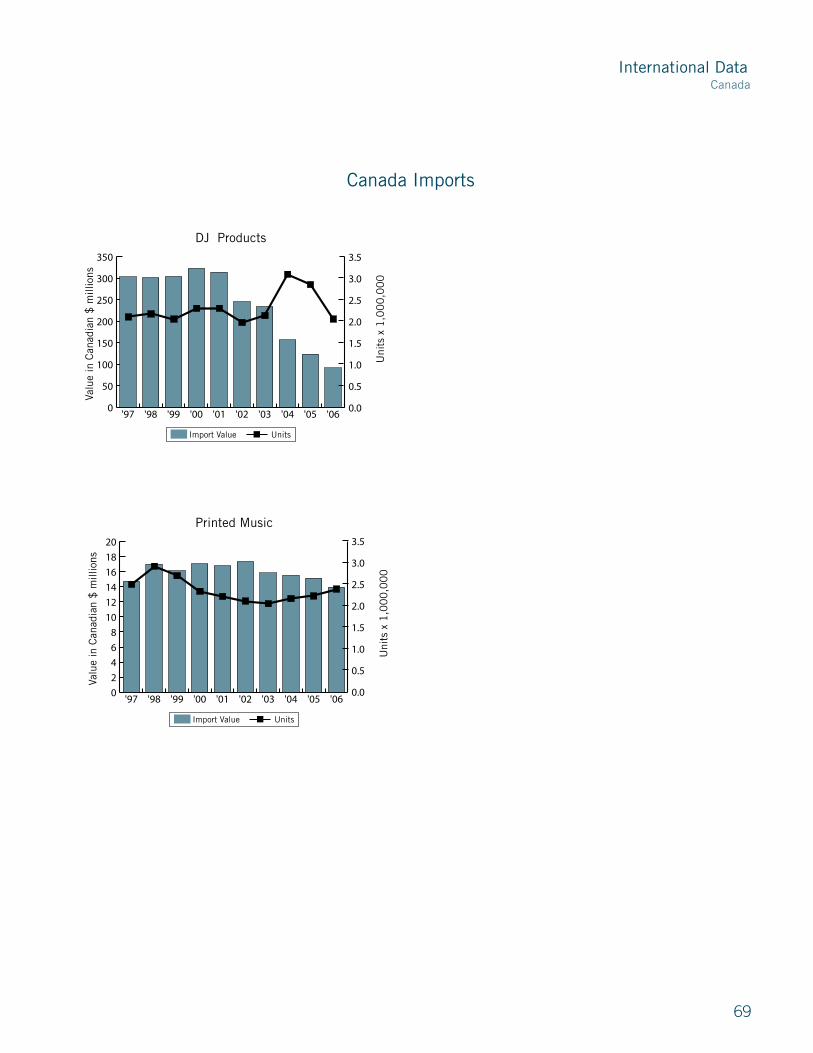
International Data
69
0
2
4
6
8
10
12
14
16
18
20
'06'05'04'03'02'01'00'99'98'97
Printed Music
0.0
0.5
1.0
1.5
2.0
2.5
3.0
3.5
0403020100999897
Valu
e in
Can
adia
n $
mill
ions
Uni
ts x
1,0
00
Import Value Units
Uni
ts x
1,0
00
,00
0
Import Value Units
0.0
0.5
1.0
1.5
2.0
2.5
3.0
3.5
06050403020100999897
0
50
100
150
200
250
300
350
'06'05'04'03'02'01'00'99'98'97
DJ Products
0.0
0.5
1.0
1.5
2.0
2.5
3.0
3.5
0403020100999897
Valu
e in
Can
adia
n $
mill
ions
Uni
ts x
1,0
00
,00
0
Import Value Units
Uni
ts x
1,0
00
,00
0
Import Value Units
0.0
0.5
1.0
1.5
2.0
2.5
3.0
3.5
06050403020100999897
Canada Imports
Canada

�0
ChinA
The Chinese GDP exceeded �0.9� trillion yuan in �006, with an increase of 10.� percent over the previous year. China’s economy has been developing at a rate of 10 percent or a bit higher for four consecutive years. �oth Chinese economic growth and the government’s culture policy fostered the Chinese musical instrument industry this year.
Highlights of the �006 Chinese musical instrument industry are as follows: 1. Chinese MI “scale enterprises” (referring to those MI companies whose annual sales revenues exceed $6�0,000 U.S.) kept a tendency of stable growth in �006; development is generally similar to that of �00�. However, the growth rate decreased slightly. � number of enterprises encountered difficulties in production due to the RM� currency appreciation, rising raw materials and labor costs, a gloomy international MI market and fiercer market competition. �ccording to the National �ureau of Statistics of China, annual sales revenues of ��6 MI scale enterprises across China amounted to $1.�1 billion (U.S.), an increase of 1�.�0 percent over last year.
�. �ccording to the General �dministration of Customs, �006 Chinese musical instruments export and import trade revenues reached $1.1� billion (U.S.). Imports increased �.�� percent to $1�� million (U.S.). Chinese musical instruments were exported to nearly 1�0 countries, with export revenue amounting to $1.0� billion (U.S.), an increase of 10.11 percent. However, due to the RM� currency appreciation, this is the smallest increase in margins for exports in three years. The influence from the U.S. MI market contributed to the previous three years’ decrease of Chinese MI exports to North �merica. Chinese exports saw a negative growth of –�.18 percent with exports decreasing from $���.1� million (U.S.) in �00� to $���.�� million (U.S.) in �006.
�. Enormous multinational manufacturers increased their investments in China due to the rapid development of the Chinese MI market. Until �006, there were a total of 11� foreign invested companies (joint ventures and sole ventures), which accounted for ��.� percent in numbers, ��.�9 percent in total assets, ��.�� percent in sales revenues and ��.06 percent in exports (retained before Customs, not for foreign reserves and calculated in RM� currency) in the Chinese MI industry sector.
�. In �006, Chinese music products made further breakthroughs and improvements in quality. �pproved by China’s products quality administrative organization, the General �dministration of Quality Supervision, Inspection and Quarantine of the People’s Republic of China (�QSIQ), Guangzhou “Pearl River,” �eijing “Xinghai,” Dongbei “Nordiska,” Guangdong “Xingchen,” Guangzhou “Jisheng” and Taixing “Fengling”were honored as �006 China Top �rand Products. In addition, pianos, guitars and violins by these six Chinese MI manufacturers were granted the status of Products Quality-Inspection Free also by �QSIQ.
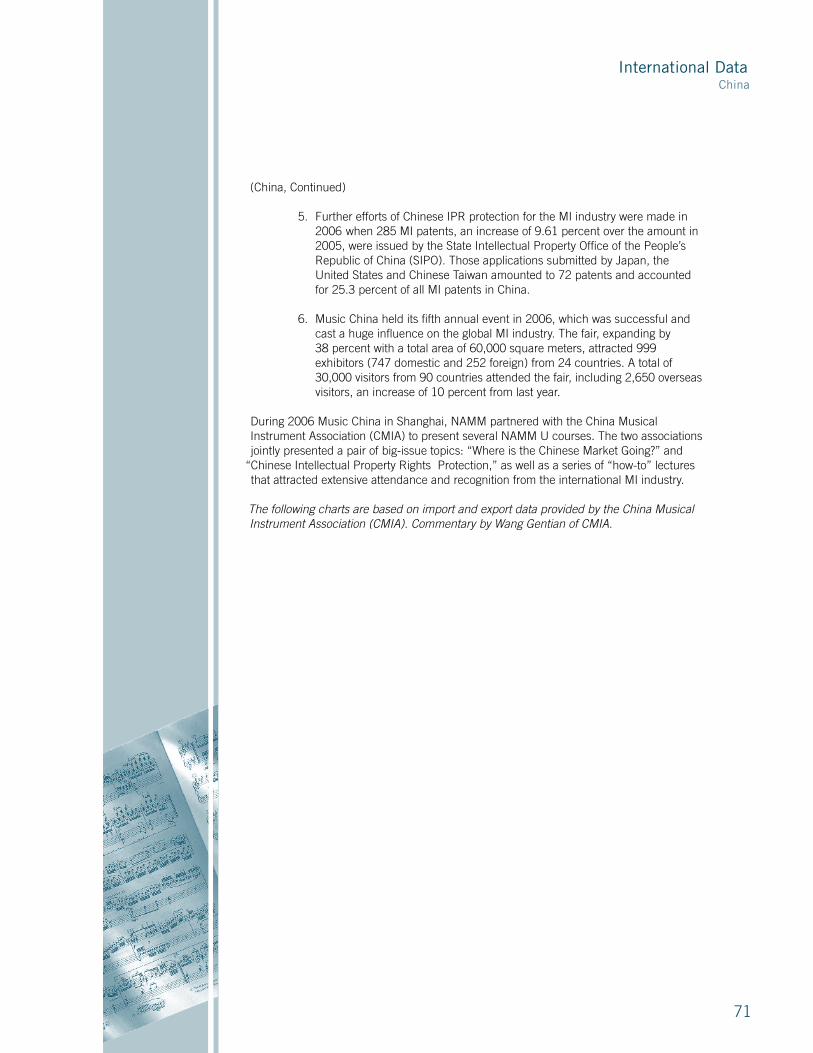
International Data
�1
(China, Continued)
�. Further efforts of Chinese IPR protection for the MI industry were made in �006 when �8� MI patents, an increase of 9.61 percent over the amount in �00�, were issued by the State Intellectual Property Office of the People’s Republic of China (SIPO). Those applications submitted by Japan, the United States and Chinese Taiwan amounted to �� patents and accounted for ��.� percent of all MI patents in China.
6. Music China held its fifth annual event in �006, which was successful and cast a huge influence on the global MI industry. The fair, expanding by �8 percent with a total area of 60,000 square meters, attracted 999 exhibitors (��� domestic and ��� foreign) from �� countries. � total of �0,000 visitors from 90 countries attended the fair, including �,6�0 overseas visitors, an increase of 10 percent from last year.
During �006 Music China in Shanghai, N�MM partnered with the China Musical Instrument �ssociation (CMI�) to present several N�MM U courses. The two associations jointly presented a pair of big-issue topics: “Where is the Chinese Market Going?” and
“Chinese Intellectual Property Rights Protection,” as well as a series of “how-to” lectures that attracted extensive attendance and recognition from the international MI industry.
The following charts are based on import and export data provided by the China Musical Instrument Association (CMIA). Commentary by Wang Gentian of CMIA.
China
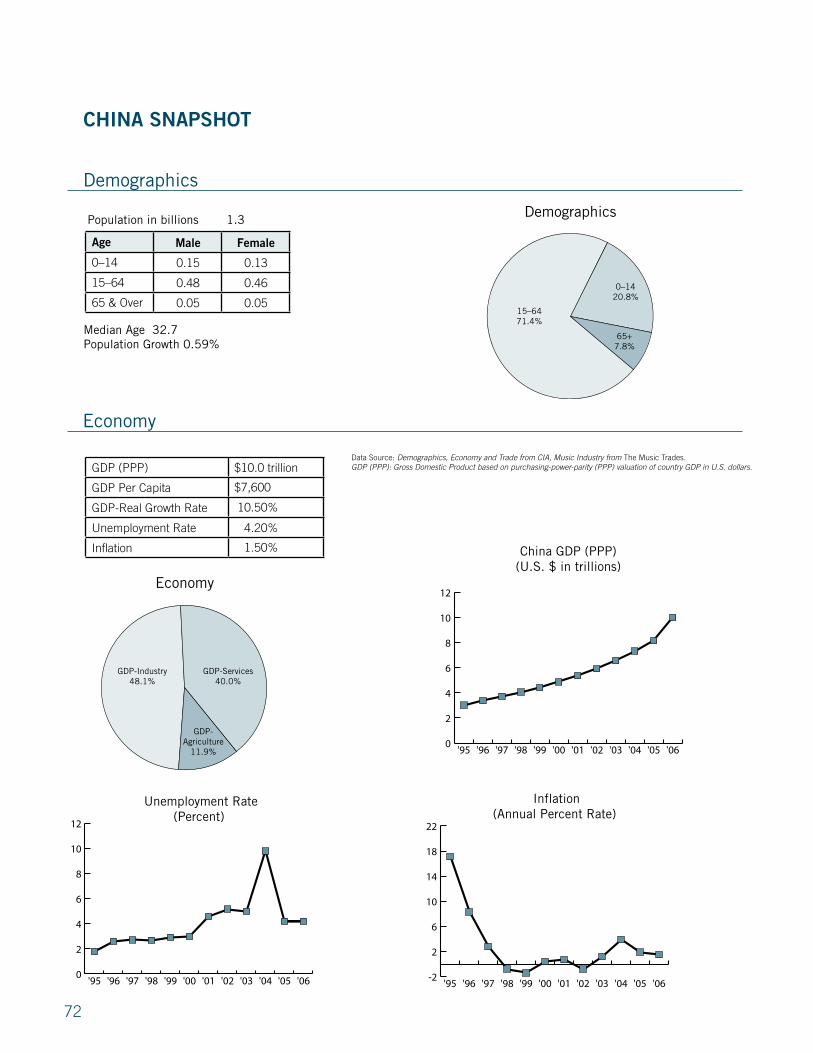
��
Demographics
65+7.8%
0–1420.8%
15–6471.4%
Economy
GDP-Services40.0%
GDP-Agriculture
11.9%
GDP-Industry48.1%
Population in billions 1.3
Median Age 32.7Population Growth 0.59%
0
2
4
6
8
10
12
'06'05'04'03'02'01'00'99'98'97'96'95
China GDP (PPP) (U.S. $ in trillions)
0
2
4
6
8
10
12
'06'05'04'03'02'01'00'99'98'97'96'95
Unemployment Rate (Percent)
-2
2
6
10
14
18
22
'06'05'04'03'02'01'00'99'98'97'96'95
Inflation (Annual Percent Rate)
ChinA snAPshot
Demographics
Economy
Age Male female
0–1� 0.1� 0.1�
1�–6� 0.�8 0.�6
6� & Over 0.0� 0.0�
GDP (PPP) $10.0 trillion
GDP Per Capita $�,600
GDP-Real Growth Rate 10.�0%
Unemployment Rate �.�0%
Inflation 1.�0%
Data Source: Demographics, Economy and Trade from CIA, Music Industry from The Music Trades. GDP (PPP): Gross Domestic Product based on purchasing-power-parity (PPP) valuation of country GDP in U.S. dollars.

International Data
��
Data Source: Demographics, Economy and Trade from CIA, Music Industry from The Music Trades. GDP (PPP): Gross Domestic Product based on purchasing-power-parity (PPP) valuation of country GDP in U.S. dollars. 0
5
10
15
20
25
GermanyS. KoreaJapanHong KongU.S.
Export Partners 2006(Percent)
0
2
4
6
8
10
12
14
16
GermanyU.S.TaiwanS. KoreaJapan
Import Partners 2006 (Percent)
Total Export $974.0 billion
Total Import $779.9 billion
Export as % of GDP 9.74%
Import as % of GDP 7.80%
Music Market $768.6 million
Sales Per Capita $0.59
Global Share 4.30%
0.0
0.1
0.2
0.3
0.4
0.5
0.6
0.7
'06'05'04'03'02'01'00
Music Sales Per Capita (U.S. $)
0.0
0.5
1.0
1.5
2.0
2.5
3.0
3.5
4.0
4.5
'06'05'04'03'02'01'00
Share of Global Music Market(Percent)
0
100
200
300
400
500
600
700
800
'06'05'04'03'02'01'00
China Music Market (U.S. $ in millions)
Music Industry
Trade
China Snapshot

��
0
20
40
60
80
100
120
'06'05'04'03'02'01'00'99'98'05
Total Pianos–Exports
0
20
40
60
80
100
04 03 02 01 00 99 98 97
Valu
e in
U.S
. $
mill
ions
Import Value Units
Uni
ts x
1,0
00
Value Units
0
20
40
60
80
100
06050403020100999897
0
5
10
15
20
25
'06'05'04'03'02'01'00'99'98'05
Total Pianos–Imports
0
20
40
60
80
100
04 03 02 01 00 99 98 97
Valu
e in
U.S
. $
mill
ions
Import Value Units
Uni
ts x
1,0
00
Value Units
0
5
10
15
20
25
06050403020100999897
China Imports and Exports
0
2
4
6
8
10
12
'06'05'04'03'02'01'00'99'98'97
Upright Pianos–Imports
0
10
20
30
40
50
60
70
04 03 02 01 00 99 98 97
Valu
e in
U.S
. $
mill
ions
Uni
ts x
1,0
00
Import Value Units
Uni
ts x
1,0
00
Value Units
0
4
8
12
16
20
06050403020100999897
0
10
20
30
40
50
60
70
'06'05'04'03'02'01'00'99'98'97
Upright Pianos–Exports
0
10
20
30
40
50
60
70
04 03 02 01 00 99 98 97
Valu
e in
U.S
. $
mill
ions
Uni
ts x
1,0
00
Import Value Units
Uni
ts x
1,0
00
Value Units
0
10
20
30
40
50
60
70
060504030201009998970
2
4
6
8
10
12
14
'06'05'04'03'02'01'00'99'98'97
Grand Pianos–Imports
0
100
200
300
400
500
600
700
04 03 02 01 00 99 98 97
Valu
e in
U.S
. $
mill
ions
Import Value Units
Uni
ts x
1,0
00
Value Units
0.0
0.5
1.0
1.5
2.0
2.5
3.0
3.5
06050403020100999897
0
10
20
30
40
50
60
'06'05'04'03'02'01'00'99'98'97
Grand Pianos–Exports
0
2
4
6
8
10
12
14
16
18
04 03 02 01 00 99 98 97
Valu
e in
U.S
. $
mill
ions
Uni
ts x
1,0
00
Import Value Units
Uni
ts x
1,0
00
Value Units
0
5
10
15
20
25
06050403020100999897
15
0
(The data received by N�MM was calculated in U.S. Dollars.)

International Data
��
China
0
100
200
300
400
500
600
700
'06'05'04'03'02'01'00'99'98'97
Guitar Instruments–Imports
0
2
4
6
8
10
12
14
04 03 02 01 00 99 98 97
Valu
e in
U.S
. $
tho
usan
ds
Import Value Units
Uni
ts x
1,0
00
Value Units
0
2
4
6
8
10
12
14
06050403020100999897
0
20
40
60
80
100
120
140
'06'05'04'03'02'01'00'99'98'97
Guitar Instruments–Exports
0
100
200
300
400
500
600
700
0403020100999897
Valu
e in
U.S
. $
mill
ions
Import Value UnitsU
nits
x 1
,00
0,0
00
Value Units
0
1
2
3
4
5
6
7
8
9
10
06050403020100999897
0
5
10
15
20
25
30
35
40
45
'06'05'04'03'02'01'00'99'98'97
Stringed Instruments with Bow–Exports
0
200
400
600
800
1000
1200
04 03 02 01 00 99 98 97
Valu
e in
U.S
. $
mill
ions
Import Value Units
Uni
ts x
1,0
00
,00
0
Value Units
0.0
0.2
0.4
0.6
0.8
1.0
1.2
06050403020100999897
0
100
200
300
400
500
600
700
800
900
'06'05'04'03'02'01'00'99'98'97
Stringed Instruments with Bow–Imports
0
2
4
6
8
10
12
14
04 03 02 01 00 99 98 97
Valu
e in
U.S
. $
tho
usan
ds
Import Value Units
Uni
ts x
1,0
00
Value Units
0
2
4
6
8
10
12
14
06050403020100999897
China Imports and Exports
0
200
400
600
800
1000
1200
1400
'06'05'04'03'02'01'00'99'98'97
Total Stringed Instruments–Imports
0
2
4
6
8
10
12
14
16
18
04 03 02 01 00 99 98 97
Valu
e in
U.S
. $
tho
usan
ds
Import Value Units
Uni
ts x
1,0
00
Value Units
0
2
4
6
8
10
12
14
16
18
06050403020100999897
0
20
40
60
80
100
120
140
160
180
'06'05'04'03'02'01'00'99'98'97
Total Stringed Instruments–Exports
0
1000
2000
3000
4000
5000
6000
7000
8000
9000
04 03 02 01 00 99 98 97
Valu
e in
U.S
. $
mill
ions
Import Value Units
Uni
ts x
1,0
00
,00
0
Value Units
0
2
4
6
8
10
12
06050403020100999897

�6
0
20
40
60
80
100
120
'06'05'04'03'02'01'00'99'98'97
Percussion–Exports
0
1000
2000
3000
4000
5000
6000
7000
04 03 02 01 00 99 98 97
Valu
e in
U.S
. $
mill
ions
Import Value Units
Uni
ts x
1,0
00
,00
0
Value Units
0
2
4
6
8
10
12
06050403020100999897
0.0
0.5
1.0
1.5
2.0
2.5
3.0
3.5
4.0
'06'05'04'03'02'01'00'99'98'97
Percussion–Imports
0
20
40
60
80
100
120
140
160
180
04 03 02 01 00 99 98 97
Valu
e in
U.S
. $
mill
ions
Import Value Units
Uni
ts x
1,0
00
Value Units
0
50
100
150
200
250
300
06050403020100999897
0
5
10
15
20
25
30
35
40
45
'06'05'04'03'02'01'00'99'98'97
Brasswind–Exports
0
100
200
300
400
500
600
700
04 03 02 01 00 99 98 97
Valu
e in
U.S
. $
mill
ions
Import Value Units
Uni
ts x
1,0
00
Value Units
0
100
200
300
400
500
600
700
06050403020100999897
0.0
0.5
1.0
1.5
2.0
2.5
'06'05'04'03'02'01'00'99'98'97
Brasswind–Imports
0
2
4
6
8
10
12
14
04 03 02 01 00 99 98 97
Valu
e in
U.S
. $
m
illio
ns
Import Value Units
Uni
ts x
1,0
00
Value Units
0
2
4
6
8
10
12
14
06050403020100999897
China Imports and Exports
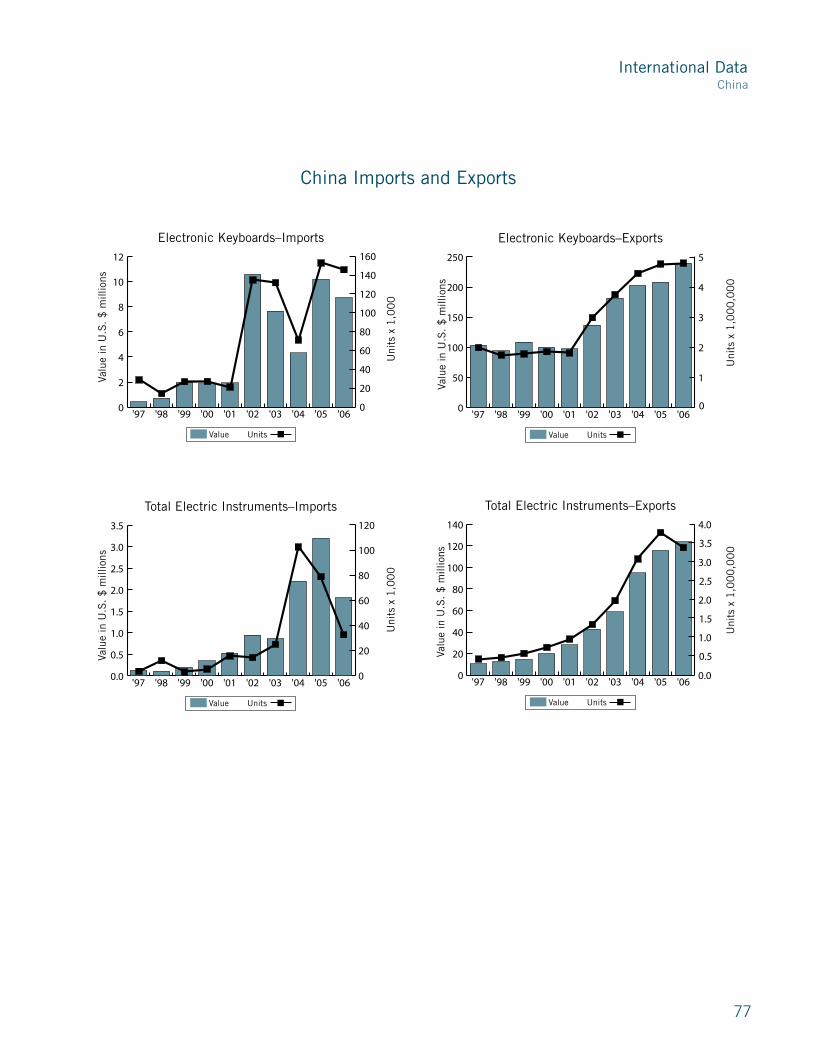
International Data
��
China
China Imports and Exports
0.0
0.5
1.0
1.5
2.0
2.5
3.0
3.5
'06'05'04'03'02'01'00'99'98'97
Total Electric Instruments–Imports
0
20
40
60
80
100
120
04 03 02 01 00 99 98 97
Valu
e in
U.S
. $
mill
ions
Import Value Units
Uni
ts x
1,0
00
Value Units
0
20
40
60
80
100
120
06050403020100999897
0
20
40
60
80
100
120
140
'06'05'04'03'02'01'00'99'98'97
Total Electric Instruments–Exports
0
500
1000
1500
2000
2500
3000
3500
04 03 02 01 00 99 98 97
Valu
e in
U.S
. $
mill
ions
Import Value Units
Uni
ts x
1,0
00
,00
0
Value Units
0.0
0.5
1.0
1.5
2.0
2.5
3.0
3.5
4.0
06050403020100999897
0
2
4
6
8
10
12
'06'05'04'03'02'01'00'99'98'97
Electronic Keyboards–Imports
0
20
40
60
80
100
120
140
160
04 03 02 01 00 99 98 97
Valu
e in
U.S
. $
mill
ions
Import Value Units
Uni
ts x
1,0
00
Value Units
0
20
40
60
80
100
120
140
160
06050403020100999897
0
50
100
150
200
250
'06'05'04'03'02'01'00'99'98'97
Electronic Keyboards–Exports
0
500
1000
1500
2000
2500
3000
3500
4000
4500
5000
0403020100999897
Valu
e in
U.S
. $
mill
ions
Import Value Units
Uni
ts x
1,0
00
,00
0
Value Units
0
1
2
3
4
5
06050403020100999897

�8
0
2
4
6
8
10
12
14
16
18
KoreaJapanGermanyU.K.U.S.
2006 Top Five Stringed Instrument with Bow Export Destinations
0
100
200
300
400
01 00 99 98 97
Valu
e in
U.S
. $
mill
ions
Import Value Units
Uni
ts x
1,0
00
Value Units
0
50
100
150
200
250
300
350
400
KoreaJapanGermanyU.K.U.S.
0
10
20
30
40
50
60
70
U.K.BelgiumJapanHong KongU.S.
2006 Top Five Electronic Keyboard Export Destinations
0
150
300
450
600
750
900
1050
1200
1350
1500
01 00 99 98 97
Valu
e in
U.S
. $
mill
ions
Import Value UnitsU
nits
x 1
,00
0,0
00
Value Units
0.0
0.2
0.4
0.6
0.8
1.0
1.2
U.K.BelgiumJapanHong KongU.S.
0.0
Top Five Chinese Export Destinations
0
10
20
30
40
50
HongKong
GermanyU.K.JapanU.S.
2006 Top Five Electric Instrument Export Destinations
0
200
400
600
800
1000
1200
1400
1600
1800
01 00 99 98 97
Valu
e in
U.S
. $
mill
ions
Import Value Units
Uni
ts x
1,0
00
,00
0
Value Units
0.0
0.2
0.4
0.6
0.8
1.0
1.2
1.4
Hong KongGermanyU.K.JapanU.S.
0
5
10
15
20
25
30
Hong KongCanadaGermanyKoreaU.S.
2006 Top Five Grand Piano Export Destinations
0
1500
3000
4500
6000
7500
9000
10500
12000
13500
15000
01 00 99 98 97
Valu
e in
U.S
. $
mill
ions
Import Value Units
Uni
ts X
1,0
00
Value Units
0
2
4
6
8
10
12
Hong KongCanadaGermanyKoreaU.S.
0
10
20
30
40
50
BrazilJapanU.K.GermanyU.S.
2006 Top Five Guitar Instrument Export Destinations
0
1000
2000
3000
4000
01 00 99 98 97
Valu
e in
U.S
. $
mill
ions
Import Value Units
Uni
ts x
1,0
00
,00
0
Value Units
0.0
0.5
1.0
1.5
2.0
2.5
3.0
3.5
4.0
BrazilJapanU.K.GermanyU.S.
Where Do Chinese Music Products Go?
0
2
4
6
8
10
12
14
16
HollandHong KongGermanyKoreaU.S.
2006 Top Five Upright Piano Export Destinations
0
2000
4000
6000
8000
10000
12000
14000
16000
18000
20000
01 00 99 98 97
Valu
e in
U.S
. $
mill
ions
Import Value Units
Uni
ts x
1,0
00
Value Units
0
3
6
9
12
15
HollandHong KongGermanyKoreaU.S.

International Data
�9
0
2
4
6
8
10
12
BrazilU.K.JapanGermanyU.S.
2006 Top Five Brasswind Instrument Export Destinations
0
50
100
150
200
250
300
01 00 99 98 97
Valu
e in
U.S
. $
mill
ions
Import Value Units
Uni
ts x
1,0
00
Value Units
0
50
100
150
200
250
BrazilU.K.JapanGermanyU.S.
0
5
10
15
20
25
30
35
40
AustraliaJapanU.K.GermanyU.S.
2006 Top Five PercussionExport Destinations
0
200
400
600
800
1000
1200
1400
1600
1800
2000
01 00 99 98 97
Valu
e in
U.S
. $
mill
ions
Import Value Units
Uni
ts x
1,0
00
,00
0
Value Units
0.0
0.5
1.0
1.5
2.0
2.5
3.0
AustraliaJapanU.K.GermanyU.S.
Top Five Chinese Export Destinations Where Do Chinese Music Products Go?
China

80
gerMAny
In �006, 6� major companies (employing more than �0 employees) with �.� employees (-�.8 percent) achieved sales of �10.� million euros (+1.� percent). Per company the turnover was 6.� million euros (+�.� percent), employee turnover was 96.0 (+�.� percent).
export Quota stays high
The �006 export quota was unchanged compared to �00� at 6�.6 percent. �oth domestic and foreign development rose 1.� percent. The structure of the foreign development was also unchanged. �s in �00�, �� percent of the foreign countries’ development is with EU (European Union) states, �6 percent with non-EU states.
foreign trade development 2006
�ccording to the figures, exports in �006 rose �.1 percent to ���.9 million euros (provisional numbers). However, imports rose � percent to �1�.� million euros, resulting in a foreign trade surplus of �8.61 million euros.
In �006, exports showed a distinct growth increase in accordions, stringed or chord instruments (guitars), percussion instruments as well as in grand pianos, while bow instruments, wind instruments and pianos decreased. Parts and accessories did not change.
foreign trade to other Countries
Influenced by the strength of the euro in the last few years, exports to the United States (as the most important export country) were �.9 percent below the �00� level.
Meanwhile, France rose to become the second most important export country, with an increase of �.9 percent. Japan, with a growth increase of 8.� percent, equalized its loss from �00�. The country ranked third with �6.� million euros, followed by �ustria, Switzerland, The Netherlands and the United Kingdom. Russia, after years of distinct growth, lost some ground in �006, while China continued to grow. Exports to China increased �.� percent, 11.� percent from the United States and �.1 percent out of Indonesia. These four countries doubled within the last few years and are at 1�.6 million euros, ranking them in the top 10 export countries.
On the import side, China is on top with an increased growth of �� percent to 99.� million euros, more than doubling its imports since �00�. Meanwhile, almost one-third of all imports come from China.
Imports from Japan accumulated two-thirds of all imports into Germany.
The following charts are based on data provided by the National Association of German Musical Instruments Manufacturers (BDMH). Commentary by Winfried Baumbach of BDMH.
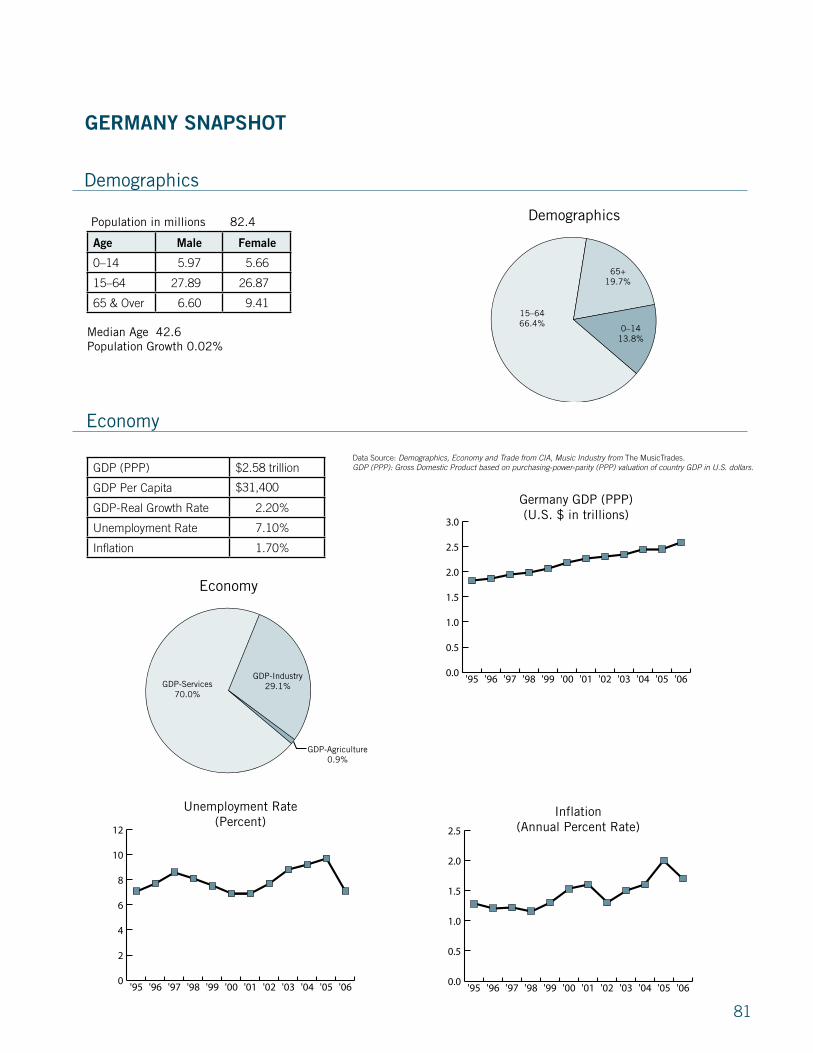
81
Demographics
65+19.7%
0–1413.8%
15–6466.4%
Economy
GDP-Services70.0%
GDP-Agriculture0.9%
GDP-Industry29.1%
Population in millions 82.4
Median Age 42.6Population Growth 0.02%
0.0
0.5
1.0
1.5
2.0
2.5
3.0
'06'05'04'03'02'01'00'99'98'97'96'95
Germany GDP (PPP)(U.S. $ in trillions)
0
2
4
6
8
10
12
'06'05'04'03'02'01'00'99'98'97'96'95
Unemployment Rate(Percent)
0.0
0.5
1.0
1.5
2.0
2.5
'06'05'04'03'02'01'00'99'98'97'96'95
Inflation (Annual Percent Rate)
gerMAny snAPshot
Demographics
Economy
GDP (PPP) $�.�8 trillion
GDP Per Capita $�1,�00
GDP-Real Growth Rate �.�0%
Unemployment Rate �.10%
Inflation 1.�0%
Age Male female
0–1� �.9� �.66
1�–6� ��.89 �6.8�
6� & Over 6.60 9.�1
Data Source: Demographics, Economy and Trade from CIA, Music Industry from The MusicTrades. GDP (PPP): Gross Domestic Product based on purchasing-power-parity (PPP) valuation of country GDP in U.S. dollars.

International Data
8�
0
2
4
6
8
10
12
BelgiumNetherlands
ItalyU.K.
U.S.France
Export Partners 2006 (Percent)
0
2
4
6
8
10
ItalyU.K.
ChinaU.S.
NetherlandsFrance
Import Partners 2006 (Percent)
Total Export $1.1 trillion
Total Import $916.4 billion
Export as % of GDP 42.64%
Import as % of GDP 35.52%
Music Market $981.8 million
Sales Per Capita $11.90
Global Share 5.50%
0
4
8
12
16
20
'06'05'04'03'02'01'00'99
Music Sales Per Capita(U.S. $)
0
2
4
6
8
10
12
14
'06'05'04'03'02'01'00'99
Share of Global Music Market(Percent)
0
300
600
900
1200
1500
1800
'06'05'04'03'02'01'00'99
Germany Music Market(U.S. $ in millions)
Germany Snapshot
Trade
Music Industry
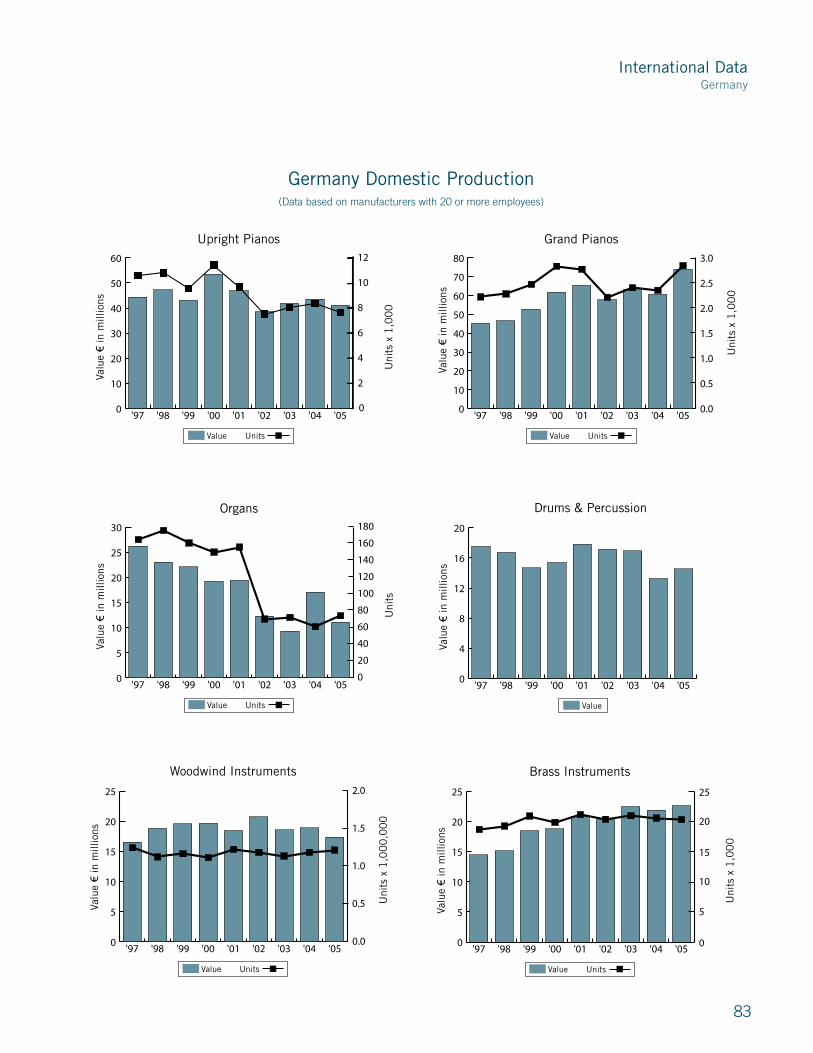
International Data
8�
0
10
20
30
40
50
60
'05'04'03'02'01'00'99'98'97
Upright Pianos
0
30
60
90
120
150
04 03 02 01
Valu
e €
in m
illio
ns
Import Value Units
Uni
ts x
1,0
00
Value Units
0
2
4
6
8
10
12
050403020100999897
Import Value Units
0
5
10
15
20
25
30
'05'04'03'02'01'00'99'98'97
Organs
0
20
40
60
80
100
120
140
160
180
04030201
Valu
e €
in m
illio
ns
Uni
ts
Value Units
0
20
40
60
80
100
120
140
160
180
050403020100999897
0
10
20
30
40
50
60
70
80
'05'04'03'02'01'00'99'98'97
Grand Pianos
0.0
0.5
1.0
1.5
2.0
2.5
3.0
04030201
Valu
e €
in m
illio
ns
Import Value Units
Uni
ts x
1,0
00
Value Units
0.0
0.5
1.0
1.5
2.0
2.5
3.0
050403020100999897
0
5
10
15
20
25
'05'04'03'02'01'00'99'98'97
Woodwind Instruments
0
40
80
120
160
200
04 03 02 01
Valu
e €
in m
illio
ns
Import Value Units
Uni
ts x
1,0
00
,00
0
Value Units
0.0
0.5
1.0
1.5
2.0
050403020100999897
0
4
8
12
16
20
'05'04'03'02'01'00'99'98'97
Drums & Percussion
0
1
2
3
4
5
04 03 02 01
Valu
e €
in m
illio
ns
Import Value Units
Uni
ts x
1,0
00
Value
0
200
400
600
800
1000
'050403020100999897
0
5
10
15
20
25
'05'04'03'02'01'00'99'98'97
Brass Instruments
0
5
10
15
20
25
04030201
Valu
e €
in m
illio
ns
Import Value Units
Uni
ts x
1,0
00
Value Units
0
5
10
15
20
25
050403020100999897
Germany Domestic Production (Data based on manufacturers with �0 or more employees)
Germany

8�
Germany Exports
0
1
2
3
4
5
6
7
8
9
'06'05'04'03'02'01'00'99'98
Acoustic Guitars
Valu
e €
in m
illio
ns
Export Value
0
10
20
30
40
50
60
70
80
'06'05'04'03'02'01'00'99'98
Grand Pianos
Valu
e €
in m
illio
ns
Export Value
0
4
8
12
16
20
'06'05'04'03'02'01'00'99'98
Stringed InstrumentsPlayed with a Bow
Valu
e €
in m
illio
ns
Export Value
0
1
2
3
4
5
6
7
8
9
10
'06'05'04'03'02'01'00'99'98
Total Stringed Instruments
Valu
e €
in m
illio
ns
Export Value
0
2
4
6
8
10
12
14
'06'05'04'03'02'01'00'99'98
Electric Guitars
Valu
e €
in m
illio
ns
Export Value
0
20
40
60
80
100
120
'06'05'04'03'02'01'00'99'98
Total Acoustic Pianos
Valu
e €
in m
illio
ns Export Value

International Data
8�
Germany
Germany Exports
0
1
2
3
4
5
6
7
8
9
10
'06'05'04'03'02'01'00'99'98
Digital Pianos
Valu
e €
in m
illio
ns
Export Value
0
10
20
30
40
'06'05'04'03'02'01'00'99'98
Total Electric Instruments
Valu
e €
in m
illio
ns
Export Value
0
1
2
3
4
'06'05'04'03'02'01'00'99'98
Synthesizers
Valu
e €
in m
illio
ns Export Value
0
20
40
60
80
'04'03'02'01'00'99'98
Brass Instruments
Valu
e €
in m
illio
ns
Export Value
0
5
10
15
20
25
'06'05'04'03'02'01'00'99'98
Drums & Percussion
Valu
e €
in m
illio
ns
Export Value
0
1
2
3
4
5
6
7
8
9
'06'05'04'03'02'01'00'99'98
Violins
Valu
e €
in m
illio
ns
Export Value
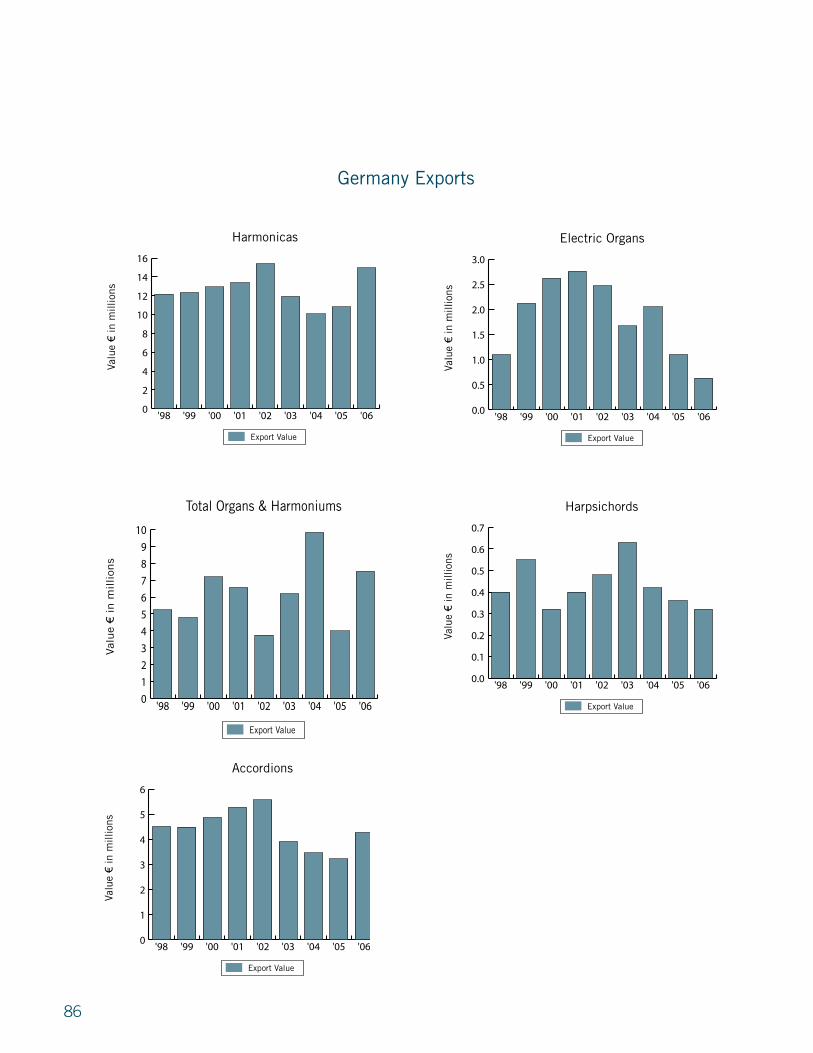
86
0
2
4
6
8
10
12
14
16
'06'05'04'03'02'01'00'99'98
Harmonicas
Valu
e €
in m
illio
ns
Export Value
0
1
2
3
4
5
6
'06'05'04'03'02'01'00'99'98
Accordions
Valu
e €
in m
illio
ns
Export Value
0.0
0.5
1.0
1.5
2.0
2.5
3.0
'06'05'04'03'02'01'00'99'98
Electric Organs
Valu
e €
in m
illio
ns Export Value
0.0
0.1
0.2
0.3
0.4
0.5
0.6
0.7
'06'05'04'03'02'01'00'99'98
Harpsichords
Valu
e €
in m
illio
ns
Export Value 0
1
2
3
4
5
6
7
8
9
10
'06'05'04'03'02'01'00'99'98
Total Organs & Harmoniums
Valu
e € in m
illion
s
Export Value
Germany Exports

International Data
8�
0
20
40
60
80
100
AustriaSwitzerlandJapanFranceU.S.
Export Destinations (2006)
Valu
e €
in m
illio
ns
Export Value
0
20
40
60
80
100
ItalyIndonesiaU.S.JapanChina
Import Sources (2006)
Valu
e €
in m
illio
ns Import Value
Germany MI Destinations and Sources
Germany

88
itALy
The analysis of the data regarding the Italian market for musical instruments and music editions in �006 gives positive results.
“The �006 report,” states DismaMusica President �ntonio Monzino Jr., “confirms the positive market evolution emerged in the two years before: the trend is moderately positive, especially considering the quantity of pieces sold on the Italian market, although we are still far from the values of the OECD (Organization for Economic Cooperation and Development) countries.”
That is, more musical instruments have been sold compared with the past; more than a million pieces have been bought by Italian consumers (both amateur and professional), but the turnover increase is only 1–� percent because of the general price shrinkage.
�ccording to available forecasts, which were based on an important sample equaling about 6� percent of the reference panel, a turnover of approximately ��1 million euros was reached in �006, which means a 1 percent increase over the �00� turnover.
If we consider only the genuine musical instruments area, which reached approximately 18� million euros turnover last year, the effective increase is � percent compared with �00�.
The following charts are based on data provided by the Italian Music Industry Association, DismaMusica. Commentary by Gian Secondo Borgogno of DismaMusica.
itALy snAPshot

89
Demographics
0–1413.8%
65+19.7%
15–6466.5%
Economy
GDP-Services69.0.%
GDP-Agriculture2.0%
GDP-Industry29.0%
Population in millions 58.1
Median Age 42.2Population Growth 0.04%
0.0
0.2
0.4
0.6
0.8
1.0
1.2
1.4
1.6
1.8
'06'05'04'03'02'01'00'99'9897'96'95
Italy GDP(U.S. $ in trillions)
2.0
0
2
4
6
8
10
12
14
'06'05'04'03'02'01'00'99'98'97'96'95
Unemployment Rate(Percent)
0
1
2
3
4
5
6
'06'05'04'03'02'01'00'99'98'97'96'95
Inflation (Annual Percent Rate)
itALy snAPshot
Demographics
Economy
GDP (PPP) $1.�� trillion
GDP Per Capita $�9,�00
GDP-Real Growth Rate 1.60%
Unemployment Rate �.00%
Inflation �.�0%
Age Male female
0–1� �.1� �.90
1�–6� 19.�� 19.10
6� & Over �.�� 6.68
Data Source: Demographics, Economy and Trade from CIA, Music Industry from The Music Trades. GDP (PPP): Gross Domestic Product based on purchasing-power-parity (PPP) valuation of country GDP in U.S. dollars.
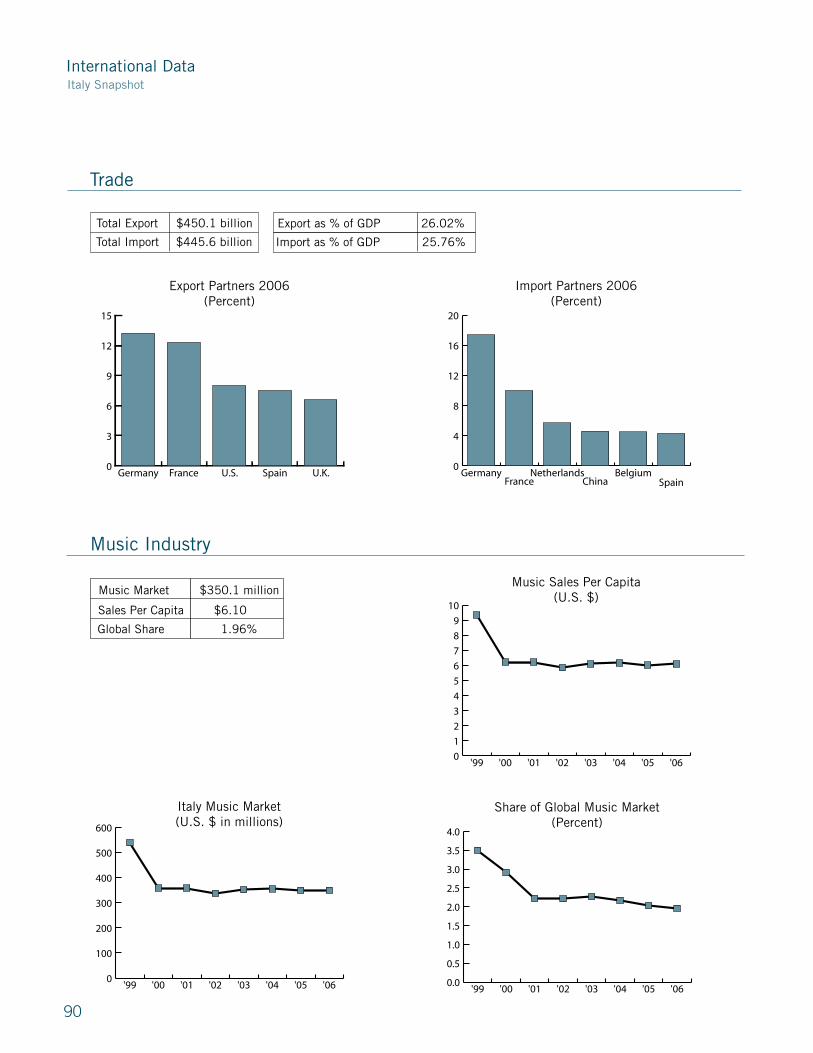
International Data
90
0
3
6
9
12
15
U.K.SpainU.S.FranceGermany
Export Partners 2006 (Percent)
0
4
8
12
16
20
SpainBelgium
ChinaNetherlands
FranceGermany
Import Partners 2006 (Percent)
Total Export $450.1 billion
Total Import $445.6 billion
Export as % of GDP 26.02%
Import as % of GDP 25.76%
Music Market $350.1 million
Sales Per Capita $6.10
Global Share 1.96%
0
1
2
3
4
5
6
7
8
9
10
'06'05'04'03'02'01'00'99
Music Sales Per Capita(U.S. $)
0.0
0.5
1.0
1.5
2.0
2.5
3.0
3.5
4.0
'06'05'04'03'02'01'00'99
Share of Global Music Market(Percent)
0
100
200
300
400
500
600
'06'05'04'03'02'01'00'99
Italy Music Market(U.S. $ in millions)
Trade
Music Industry
Italy Snapshot

International Data
91
Italy
0
4
8
12
16
20
'06'05'04'03'02'01
Acoustic Guitars
0
30
60
90
120
150
04 03 02 01
Valu
e €
in m
illio
ns
Import Value Units
Uni
ts x
1,0
00
0
30
60
90
120
150
060504030201
Retail Value Units
0
5
10
15
20
25
30
35
40
'06'05'04'03'02'01
Electric Guitars
0
10
20
30
40
50
60
70
04030201
Valu
e €
in m
illio
ns
Import Value Units
Uni
ts x
1,0
00
0
10
20
30
40
50
60
70
060504030201
Retail Value Units
0
3
6
9
12
15
'06'05'04'03'02'01
Grand Pianos
0
100
200
300
400
500
600
700
800
900
04030201
Valu
e €
in m
illio
ns
Import Value Units
Uni
ts
0
100
200
300
400
500
600
700
800
900
060504030201
Retail Value Units
0
10
20
30
40
50
60
'06'05'04'03'02'01
Total Guitars
0
50
100
150
200
250
04030201
Valu
e €
in m
illio
ns
Import Value Units
Uni
ts x
1,0
00
0
50
100
150
200
250
060504030201
Retail Value Units
0
2
4
6
8
10
12
14
'06'05'04'03'02'01
Upright Pianos
0
1
2
3
4
5
04 03 02 01
Valu
e €
in m
illio
ns
Import Value Units
Uni
ts x
1,0
00
0
1
2
3
4
5
060504030201
Retail Value Units
0
5
10
15
20
25
30
'06'05'04'03'02'01
Total Acoustic Pianos
0
1
2
3
4
5
6
04 03 02 01
Valu
e €
in m
illio
ns
Import Value Units
Uni
ts x
1,0
00
0
1
2
3
4
5
6
060504030201
Retail Value Units
Italy Domestic Sales

9�
0
5
10
15
20
25
30
'06'05'04'03'02'01
Percussion
0
50
100
150
04 03 02 01
Valu
e €
in m
illio
ns
Import Value Units
Uni
ts x
1,0
00
Retail Value
0
50
100
150
04030201
0
5
10
15
20
25
30
35
'06'05'04'03'02'01
Portable Keyboards
0
25
50
75
100
125
150
04030201
Valu
e €
in m
illio
ns
Import Value Units
Uni
ts x
1,0
00
0
25
50
75
100
125
150
060504030201
Retail Value Units
0
5
10
15
20
25
'06'05'04'03'02'01
Print Music
Valu
e €
in m
illio
ns
Retail Value
0.0
0.5
1.0
1.5
2.0
'06'05'04'03'02'01
Stringed Instruments with a Bow
0
3
6
9
12
15
04030201
Valu
e €
in m
illio
ns
Import Value Units
Uni
ts x
1,0
00
0
3
6
9
12
15
060504030201
Retail Value Units
0
4
8
12
16
20
'06'05'04'03'02'01
Digital Pianos
0
5
10
15
20
25
04030201
Valu
e €
in m
illio
ns
Import Value Units
Uni
ts x
1,0
00
0
5
10
15
20
25
060504030201
Retail Value Units
0
5
10
15
20
25
30
'06'05'04'03'02'01
Wind Instruments
0
20
40
60
80
100
120
04030201
Valu
e €
in m
illio
ns
Import Value UnitsU
nits
x 1
,00
0
0
20
40
60
80
100
120
060504030201
Harmonicas were added to this category in 2005.
Retail Value Units
Italy Domestic Sales

International Data
9�
Italy
0
3
6
9
12
15
'06'05'04'03'02'01
Signal Processing
0
20
40
60
80
100
04 03 02 01
Valu
e €
in m
illio
ns
Import Value Units
Uni
ts x
1,0
00
0
20
40
60
80
100
060504030201
Retail Value Units
0
4
8
12
16
20
'06'05'04'03'02'01
Amplifiers for Instruments
0
10
20
30
40
50
60
70
04030201
Valu
e €
in m
illio
ns
Import Value Units
Uni
ts x
1,0
00
0
10
20
30
40
50
60
70
060504030201
Retail Value Units
0
1
2
3
4
5
6
7
8
9
'06'05'04'03'02'01
Computer Music
Valu
e €
in m
illio
ns
Retail Value
0
10
20
30
40
50
60
70
'06'05'04'03'02'01
Amplifiers for Voice
0
50
100
150
200
250
300
04030201
Valu
e €
in m
illio
ns
Import Value Units
Uni
ts x
1,0
00
0
50
100
150
200
250
300
050504030201
Retail Value Units
Italy Domestic Sales

9�
JAPAn
�ccording to the report of Japanese Production and Sales of Musical Instruments 199�–�006, compiled by the Japan Musical Instruments Manufacturers’ �ssociation (JMIM�; Hirotaka Kawai, president), the units and sales of the items for export increased. Sales amount increased 6.� percent to 1�9.� billion yen (approximately $1 billion U.S.). Domestic sales decreased � percent to 6�.� billion yen (approximately $��0 million U.S.). However, the gross sales amount increased � percent, to 191.9 billion yen (approximately $1.6 billion U.S.). The trend of this year seemed somewhat favorable.
With regard to the categories of “Fretted Instruments,” “Flutes,” “Saxophones,” “�rass Instruments,” “Keyboard Synthesizers,” “Other Electric Musical Instruments” and “�mplifiers,” both units and sales increased from �00�. Flute and saxophone lessons are very popular with adults, and help raise demand for musical instruments. �ttractive keyboard synthesizer models released by major makers (Yamaha, Roland and Korg) kept up the market, as was the case the year before.
With regard to exports, both units and sales of “Vertical Pianos,” “Flutes,” “Clarinets,” “Saxophones,” “Trombones,” “Marching Drums,” “Jazz Drums,” “Xylophones with legs,” “Table-top Xylophones,” “Recorders,” “Digital Pianos” and “Other Electric Music Instruments” exceeded units sold in �00�. The best performer in the export category was “Electric Guitars,” which increased by �0,000, up to �81,��� units. There was remarkable increase in the number of imports from China and the United States. Sales in the “Guitars” category increased by ��,000 units to �6�,6�� units.
Imports grew �.� billion yen (approximately $61.� million U.S.) (1� percent) to a total of �6.1 billion yen (approximately $�6�.� million U.S.). Units and sales of most items except for parts and accessories were up. However, the number of units sold in many categories was down, but sales recorded up. The exchange rate appears to have affected prices; it seems that the average unit price is up. This tendency was demonstrated by healthy sales of expensive products.
Increases were seen in additional categories, such as “Other Wind Instruments” (up ��,000 units to 1,69�,��� units), “Other String Instruments” (up ��,000 units to 1�8,�6� units), “�rass Instruments” (up 1�,000 units to �8,��� units). “Upright Pianos” and “Grand Pianos” were both up as well.
Many music shops reported good or improved results in the “JMT �nnual Retail Market Survey” in February. �006 was not bad for music retailers, although there were some ups and downs that seem to be affected by divided income classes.
*Please note, as you view these statistics, the figures listed for “Guitars” and “Stringed Instruments Total” may include some inaccuracy.
The data from two categories show extraordinary results, despite its figures of units or the �00� data. These statistics are based on each manufacturer’s declaration. Even if JMIM�, who totaled the statistics, had some doubt about the figures, they cannot question the declared figures, which may concern with the company’s crucial results of the year. JMIM� agrees to shred documents after the totaling of the data is complete.
Thus, to determine the actual state of the guitar market, it is best to refer to the unit of “Stringed Instruments Total,” as well as ”Musical Instrument �mplifiers,” which has grown since �00�.
The following charts are based on data provided by the Japan Musical Instruments Manufacturers’ Association (JMIMA) and published by Japan Music Trades. Commentary is paraphrased from the May 2007 issure of Japan Music Trades and used with permission.
JAPAn snAPshot

9�
-1.5
-1.0
-0.5
0.0
0.5
1.0
1.5
2.0
'06'05'04'03'02'01'00'99'98'97'96'95
Inflation(Annual Percent Rate)
Demographics
65+20.1%
0–1414.2%
15–6465.7%
Economy
GDP-Services73.1%
GDP-Agriculture1.6%
GDP-Industry25.3%
Population in millions 127.5
Median Age 42.9Population Growth 0.02%
0
1
2
3
4
5
'06'05'04'03'02'01'00'99'98'97'96'95
Japan GDP (PPP)(U.S. $ in trillions)
0
1
2
3
4
5
6
'06'05'04'03'02'01'00'99'98'97'96'95
Unemployment Rate(Percent)
JAPAn snAPshot
Age Male female
0–1� 9.�1 8.8�
1�–6� ��.16 �1.61
6� & Over 10.�6 1�.��
GDP (PPP) $�.�� trillion
GDP Per Capita $��,100
GDP-Real Growth Rate �.80%
Unemployment Rate �.10%
Inflation 0.�0%
Data Source: Demographics, Economy and Trade from CIA, Music Industry from The Music Trades. GDP (PPP): Gross Domestic, Product based on purchasing-power-parity (PPP) valuation of country GDP in U.S. dollars.
Demographics
Economy

International Data
96
0
5
10
15
20
25
Hong KongTaiwanS. KoreaChinaU.S.
Export Partners (2006)
0
5
10
15
20
25
S. KoreaAustralia
UAESaudi Arabia
U.S.China
Import Partners (2006)
0
5
10
15
20
25
30
'06'05'04'03'02'01'00'99
Music Sales Per Capita(U.S. $)
0.0
0.5
1.0
1.5
2.0
2.5
3.0
3.5
'06'05'04'03'02'01'00'99
Japan Music Market(U.S. $ in billions)
0
5
10
15
20
25
'06'05'04'03'02'01'00'99
Share of Global Music Market(Percent)
Japan Snapshot
Total Export $�90.� billion
Total Import $���.1 billion
Export as % of GDP 1�.99%
Import as % of GDP 1�.��%
Music Market $�.� billion
Sales Per Capita $�1.�0
Global Share 1�.�8%
Trade
Music Industry

International Data
9�
0
1
2
3
4
5
'06'05'04'03'02'01'00'99'98'97
Acoustic GuitarsDomestic Sales*
0
100
200
300
400
500
600
'04'03'02'01'00'99'98'97'96
Valu
e in
bill
ions
of
Yen
Import Value Units
Uni
ts x
1,0
00
Value Units
0
100
200
300
400
500
600
'06'05'04'03'02'01'00'99'98'97
*Please see commentary for clarification.
0
2
4
6
8
10
'06'05'04'03'02'01'00'99'98'97
Electric GuitarsDomestic Sales
0
50
100
150
200
250
300
'04'03'02'01'00'99'98'97'96
Valu
e in
bill
ions
of
Yen
Import Value Units
Uni
ts x
1,0
00
Value Units
0
50
100
150
200
250
300
'06'05'04'03'02'01'00'99'98'97
Japan Domestic Sales and Exports
0
2
4
6
8
10
12
14
'06'05'04'03'02'01'00'99'98'97
Total GuitarsDomestic Sales
0
100
200
300
400
500
600
700
800
900
'04'03'02'01'00'99'98'97'96
Valu
e in
bill
ions
of
Yen
Import Value Units
Uni
ts X
1,0
00
Value Units
0
100
200
300
400
500
600
700
800
900
'06'05'04'03'02'01'00'99'98'97
0
2
4
6
8
10
12
14
'06'05'04'03'0201'00'99'98'97
Total GuitarsExports
0
100
200
300
400
500
600
700
800
900
'04 '03 '02 '01 '00 '99 '98 '97 '96
Valu
e in
bill
ions
of
Yen
Import Value Units
Uni
ts x
1,0
00
Value Units
0
100
200
300
400
500
600
700
800
900
'06'05'04'03'02'01'00'99'98'97
0
1
2
3
4
5
'06'05'04'03'02'01'00'99'98'97
Acoustic GuitarsExports
0
100
200
300
400
500
600
'04 '03 '02 '01 '00 '99 '98 '97 '96
Valu
e in
bill
ions
of
Yen
Import Value Units
Uni
ts x
1,0
00
Value Units
0
100
200
300
400
500
600
'06'05'04'03'02'01'00'99'98'97
0
2
4
6
8
10
'06'05'04'03'02'01'00'99'98'97
Electric GuitarsExports
0
50
100
150
200
250
300
'04 '03 '02 '01 '00 '99 '98 '97 '96
Valu
e in
bill
ions
of
Yen
Import Value Units
Uni
ts x
1,0
00
Value Units
0
50
100
150
200
250
300
'06'05'04'03'02'01'00'99'98'97
Japan
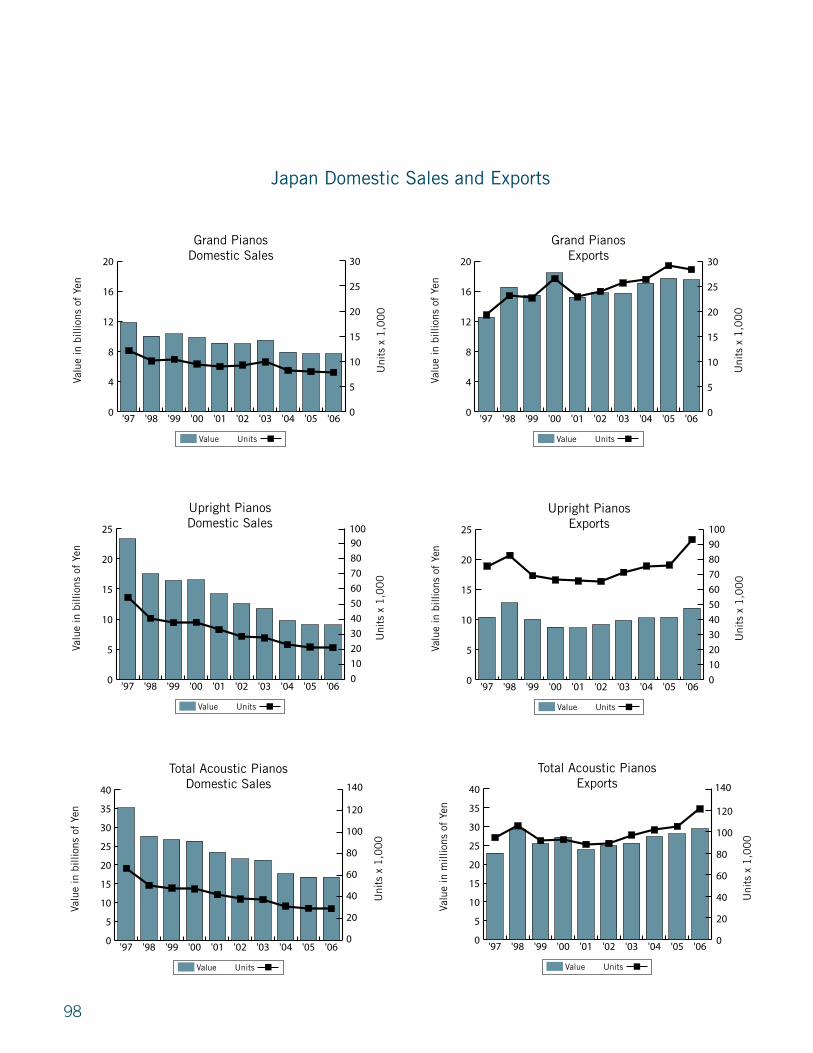
98
0
5
10
15
20
25
30
35
40
'06'05'04'03'02'01'00'99'98'97
Total Acoustic PianosDomestic Sales
0
20
40
60
80
100
120
'04 '03 '02 '01 '00 '99 '98 '97 '96
Valu
e in
bill
ions
of
Yen
Import Value Units
Uni
ts x
1,0
00
Value Units
0
20
40
60
80
100
120
140
0605'04'03'02'01'00'99'98'97
0
5
10
15
20
25
30
35
40
'06'05'04'03'02'01'00'99'98'97
Total Acoustic PianosExports
0
20
40
60
80
100
120
'04 '03 '02 '01 '00 '99 '98 '97 '96
Valu
e in
mill
ions
of
Yen
Import Value Units
Uni
ts x
1,0
00
Value Units
0
20
40
60
80
100
120
140
0605'04'03'02'01'00'99'98'97
Japan Domestic Sales and Exports
0
4
8
12
16
20
'06'05'04'03'02'01'00'99'98'97
Grand PianosDomestic Sales
0
5
10
15
20
25
30
'04 '03 '02 '01 '00 '99 '98 '97 '96
Valu
e in
bill
ions
of
Yen
Import Value Units
Uni
ts x
1,0
00
Value Units
0
5
10
15
20
25
30
'06'05'04'03'02'01'00'99'98'97
0
5
10
15
20
25
'06'05'04'03'02'01'00'99'98'97
Upright PianosDomestic Sales
0
10
20
30
40
50
60
70
80
90
'04 '03 '02 '01 '00 '99 '98 '97 '96
Valu
e in
bill
ions
of
Yen
Import Value Units
Uni
ts x
1,0
00
Value Units
0
10
20
30
40
50
60
70
80
90100
'06'05'04'03'02'01'00'99'98'97
0
5
10
15
20
25
'06'05'04'03'02'01'00'99'98'97
Upright PianosExports
0
10
20
30
40
50
60
70
80
90
'04 '03 '02 '01 '00 '99 '98 '97 '96
Valu
e in
bill
ions
of
Yen
Import Value Units
Uni
ts x
1,0
00
Value Units
0
10
20
30
40
50
60
70
80
90
100
'06'05'04'03'02'01'00'99'98'97
0
4
8
12
16
20
'06'05'04'03'02'01'00'99'98'97
Grand PianosExports
0
5
10
15
20
25
30
'04 '03 '02 '01 '00 '99 '98 '97 '96
Valu
e in
bill
ions
of
Yen
Import Value Units
Uni
ts x
1,0
00
Value Units
0
5
10
15
20
25
30
'06'05'04'03'02'01'00'99'98'97
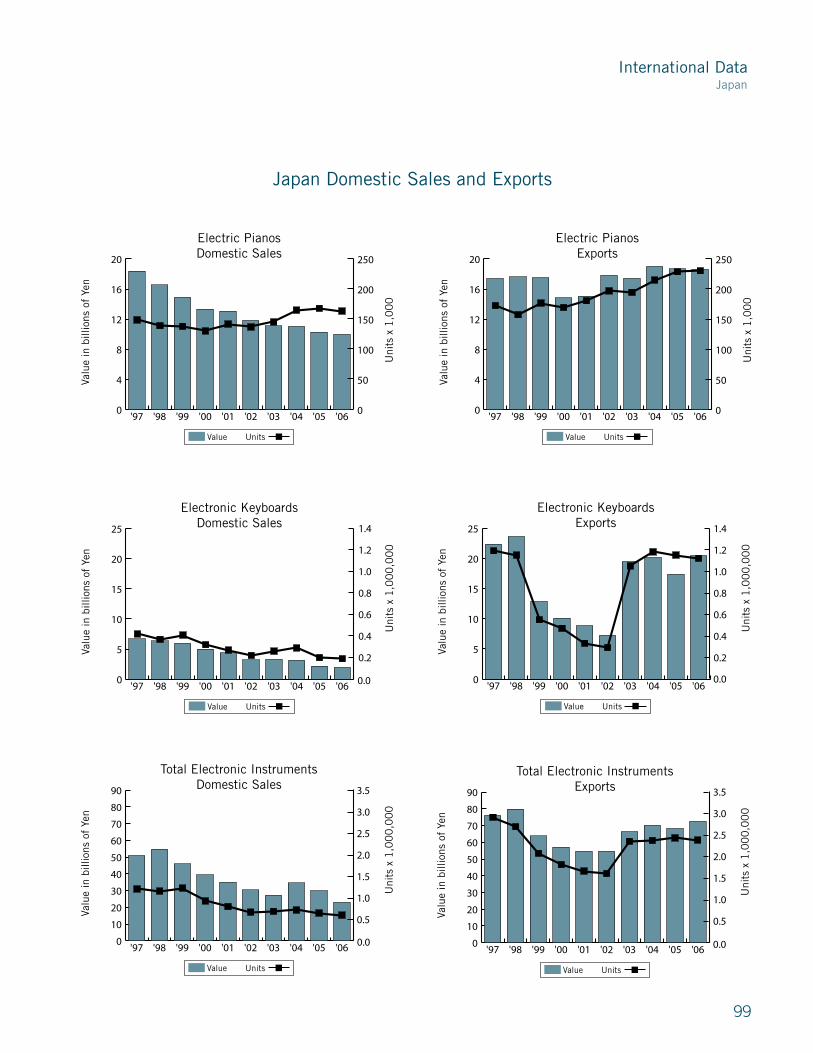
International Data
99
0
5
10
15
20
25
30
35
40
'06'05'04'03'02'01'00'99'98'97
Total Acoustic PianosExports
0
20
40
60
80
100
120
'04 '03 '02 '01 '00 '99 '98 '97 '96
Valu
e in
mill
ions
of
Yen
Import Value Units
Uni
ts x
1,0
00
Value Units
0
20
40
60
80
100
120
140
0605'04'03'02'01'00'99'98'97
Japan
Japan Domestic Sales and Exports
0
5
10
15
20
25
'06'05'04'03'02'01'00'99'98'97
Electronic KeyboardsDomestic Sales
0
200
400
600
800
1000
1200
1400
'04 '03 '02 '01 '00 '99 '98 '97 '96
Valu
e in
bill
ions
of
Yen
Import Value Units
Uni
ts x
1,0
00
,00
0
Value Units
0.0
0.2
0.4
0.6
0.8
1.0
1.2
1.4
0605'04'03'02'01'00'99'98'97
0
5
10
15
20
25
'06'05'04'03'02'01'00'99'98'97
Electronic KeyboardsExports
0
200
400
600
800
1000
1200
1400
'04 '03 '02 '01 '00 '99 '98 '97 '96
Valu
e in
bill
ions
of
Yen
Import Value Units
Uni
ts x
1,0
00
,00
0
Value Units
0.0
0.2
0.4
0.6
0.8
1.0
1.2
1.4
'06'05'04'03'02'01'00'99'98'97 0
10
20
30
40
50
60
70
80
90
'06'05'04'03'02'01'00'99'98'97
Total Electronic InstrumentsExports
0
500
1000
1500
2000
2500
3000
3500
'04 '03 '02 '01 '00 '99 '98 '97 '96
Valu
e in
bill
ions
of
Yen
Import Value Units
Uni
ts x
1,0
00
,00
0
Value Units
0.0
0.5
1.0
1.5
2.0
2.5
3.0
3.5
0605'04'03'02'01'00'99'98'97
0
10
20
30
40
50
60
70
80
90
'06'05'04'03'02'01'00'99'98'97
Total Electronic InstrumentsDomestic Sales
0
500
1000
1500
2000
2500
3000
3500
'04 '03 '02 '01 '00 '99 '98 '97 '96
Valu
e in
bill
ions
of
Yen
Import Value Units
Uni
ts x
1,0
00
,00
0
Value Units
0.0
0.5
1.0
1.5
2.0
2.5
3.0
3.5
0605'04'03'02'01'00'99'98'97
0
4
8
12
16
20
'06'05'04'03'02'01'00'99'98'97
Electric PianosDomestic Sales
0
50
100
150
200
250
'04 '03 '02 '01 '00 '99 '98 '97 '96
Valu
e in
bill
ions
of
Yen
Import Value Units
Uni
ts x
1,0
00
Value Units
0
50
100
150
200
250
'06'05'04'03'02'01'00'99'98'97
0
4
8
12
16
20
'06'05'04'03'02'01'00'99'98'97
Electric PianosExports
0
50
100
150
200
250
'04 '03 '02 '01 '00 '99 '98 '97 '96
Valu
e in
bill
ions
of
Yen
Import Value Units
Uni
ts x
1,0
00
Value Units
0
50
100
150
200
250
'06'05'04'03'02'01'00'99'98'97
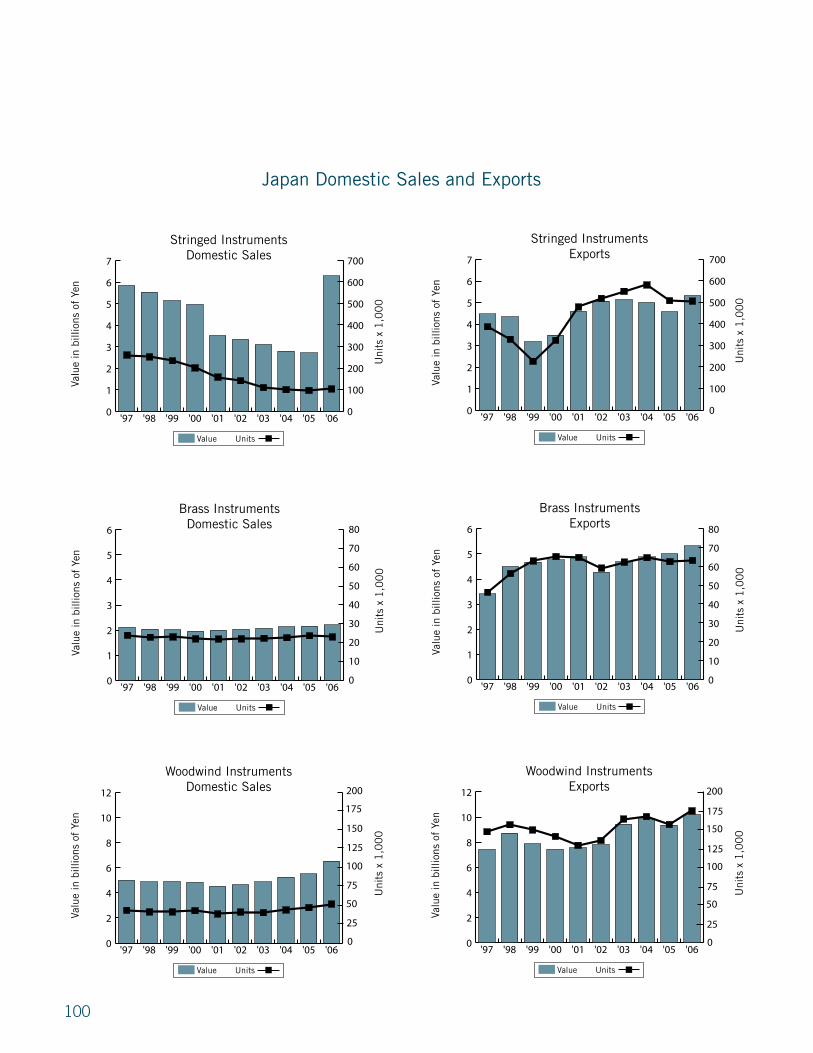
100
Japan Domestic Sales and Exports
0
1
2
3
4
5
6
'06'05'04'03'02'01'00'99'98'97
Brass InstrumentsExports
0
10
20
30
40
50
60
70
80
'04 '03 '02 '01 '00 '99 '98 '97 '96
Valu
e in
bill
ions
of
Yen
Import Value Units
Uni
ts x
1,0
00
Value Units
0
10
20
30
40
50
60
70
80
'06'05'04'03'02'01'00'99'98'970
2
4
6
8
10
12
'06'05'04'03'02'01'00'99'98'97
Woodwind InstrumentsDomestic Sales
0
50
100
150
200
'04 '03 '02 '01 '00 '99 '98 '97 '96
Valu
e in
bill
ions
of
Yen
Import Value Units
Uni
ts x
1,0
00
Value Units
0
25
50
75
100
125
150
175
200
'05'05'04'03'02'01'00'99'98'97
0
1
2
3
4
5
6
'06'05'04'03'02'01'00'99'98'97
Brass InstrumentsDomestic Sales
0
10
20
30
40
50
60
70
80
'04'03'02'01'00'99'98'97'96
Valu
e in
bill
ions
of
Yen
Import Value Units
Uni
ts x
1,0
00
Value Units
0
10
20
30
40
50
60
70
80
'06'05'04'03'02'01'00'99'98'97
0
1
2
3
4
5
6
7
'06'05'04'03'02'01'00'99'98'97
Stringed InstrumentsDomestic Sales
0
100
200
300
400
500
600
700
'04 '03 '02 '01 '00 '99 '98 '97 '96
Valu
e in
bill
ions
of
Yen
Import Value Units
Uni
ts x
1,0
00
Value Units
0
100
200
300
400
500
600
700
0605'04'03'02'01'00'99'98'97
0
1
2
3
4
5
6
7
'06'05'04'03'02'01'00'99'98'97
Stringed InstrumentsExports
0
100
200
300
400
500
600
700
'04 '03 '02 '01 '00 '99 '98 '97 '96
Valu
e in
bill
ions
of
Yen
Import Value Units
Uni
ts x
1,0
00
Value Units
0
100
200
300
400
500
600
700
0605'04'03'02'01'00'99'98'97
0
2
4
6
8
10
12
'06'05'04'03'02'01'00'99'98'97
Woodwind InstrumentsExports
0
50
100
150
200
'04 '03 '02 '01 '00 '99 '98 '97 '96
Valu
e in
bill
ions
of
Yen
Import Value Units
Uni
ts x
1,0
00
Value Units
0
25
50
75
100
125
150
175
200
'06'05'04'03'02'01'00'99'98'97
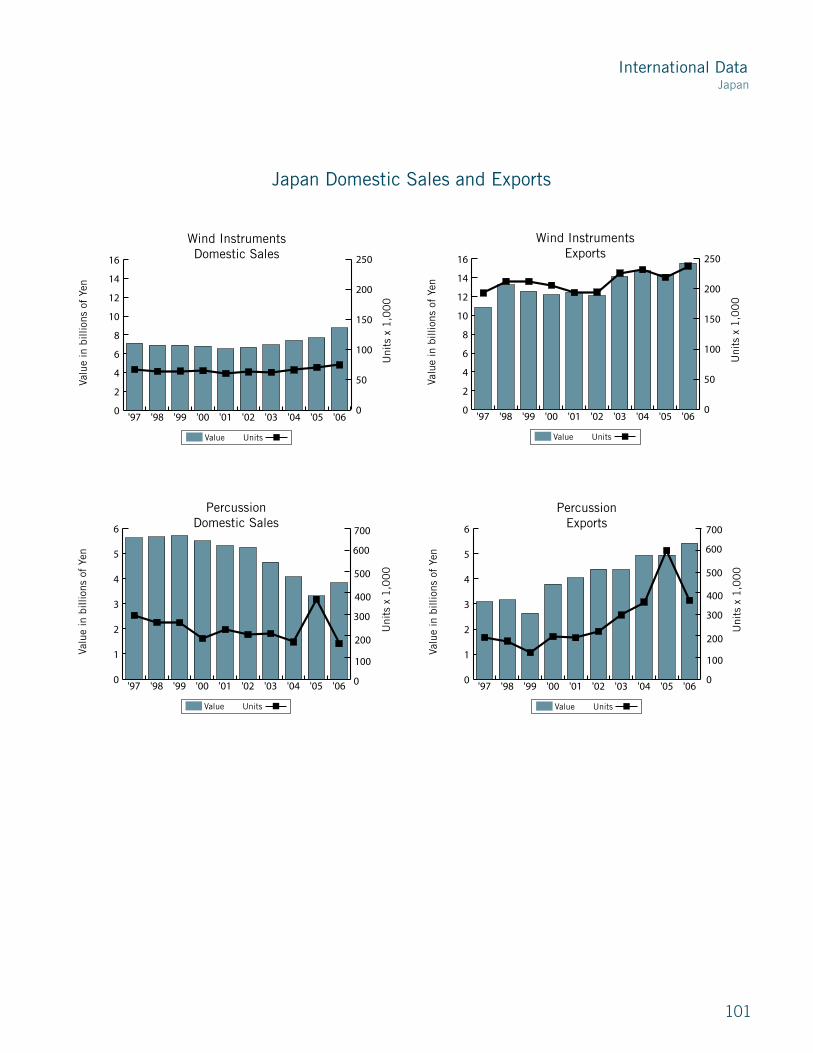
International Data
101
0
1
2
3
4
5
6
'06'05'04'03'02'01'00'99'98'97
PercussionExports
0
50
100
150
200
250
300
350
400
'04 '03 '02 '01 '00 '99 '98 '97 '96
Valu
e in
bill
ions
of
Yen
Import Value Units
Uni
ts x
1,0
00
Value Units
0
100
200
300
400
500
600
700
0605'04'03'02'01'00'99'98'97
Japan Domestic Sales and Exports
0
2
4
6
8
10
12
14
16
'06'05'04'03'02'01'00'99'98'97
Wind InstrumentsDomestic Sales
0
50
100
150
200
250
'04 '03 '02 '01 '00 '99 '98 '97 '96
Valu
e in
bill
ions
of
Yen
Import Value Units
Uni
ts x
1,0
00
Value Units
0
50
100
150
200
250
0605'04'03'02'01'00'99'98'97
0
2
4
6
8
10
12
14
16
'06'05'04'03'02'01'00'99'98'97
Wind InstrumentsExports
0
50
100
150
200
250
'04 '03 '02 '01 '00 '99 '98 '97 '96
Valu
e in
bill
ions
of
Yen
Import Value Units
Uni
ts x
1,0
00
Value Units
0
50
100
150
200
250
0605'04'03'02'01'00'99'98'97
0
1
2
3
4
5
6
'06'05'04'03'02'01'00'99'98'97
PercussionDomestic Sales
0
50
100
150
200
250
300
350
400
'04 '03 '02 '01 '00 '99 '98 '97 '96
Valu
e in
bill
ions
of
Yen
Import Value Units
Uni
ts x
1,0
00
Value Units
0
100
200
300
400
500
600
700
0605'04'03'02'01'00'99'98'97
Japan

10�
norWAy
�ased on the total number of imported musical instruments (figures shown in the import statistics do not include all musical instruments, i.e., digital drums, digital accordions, mixers, software, accessories, etc.), the total import value in �006 was approximately NOK ��0.000.000 or $��,690,000 U.S. (1 U.S.$ = NOK 6).
�elow are the changes in import values from �00� amounts:
Wind instruments: -�% Stringed instruments with bow: +��% �coustic guitars: +6% Electric guitars: +�% Upright pianos: +�1% Grand pianos: +��% Digital pianos: +�% Keyboards: -18% �coustic percussion: +�0% The following charts are based on import data provided by the GfM (Musical Instrument Distributors Association). The Music Industry Summary Data is from The Music Trades. Commentary by Mr. Jo Bergerskogen, Managing Director for the Norwegian Affiliate of Roland Scandinavia AS, and board member of both the GfM and of NAMI (Norwegian Association for Musical Instruments).

10�
Demographics
65+14.8%
0–1419.3%
15–64 65.9%
Economy
GDP-Industry41.4%
GDP-Agriculture2.3%
GDP-Service56.3%
Population in millions 4.6
Median Age 38.4Population Growth 38.00%
0
50
100
150
200
250
'06'05'04'03'02'01'00'99'98'97'96'95
Norway GDP (PPP)(U.S. $ in billions)
Import Value Units
0
5
10
15
20
25
040302010099989796
0
2
4
6
8
10
'06'05'04'03'02'01'00'99'98'97'96'95
Unemployment Rate(Percent)
Import Value Units
0
5
10
15
20
25
04 03 02 01 00 99 98 97 96
0.0
0.5
1.0
1.5
2.0
2.5
3.0
3.5
'06'05'04'03'02'01'00'99'98'97'96'95
Inflation (Annual Percent Rate)
Import Value Units
0
5
10
15
20
25
04 03 02 01 00 99 98 97 96
norWAy snAPshot
Demographics
Economy
Age Male female
0–1� 0.�� 0.��
1�–6� 1.�0 1.�0
6� & Over 0.�9 0.�9
GDP (PPP) $�0�.� billion
GDP Per Capita $��,800
GDP-Real Growth Rate �.00%
Unemployment Rate �.�0%
Inflation �.�0%
Data Source: Demographics, Economy and Trade from CIA, Music Industry from The Music Trades. GDP (PPP): Gross Domestic Product based on purchasing-power-parity (PPP) valuation of country GDP in U.S. dollars.
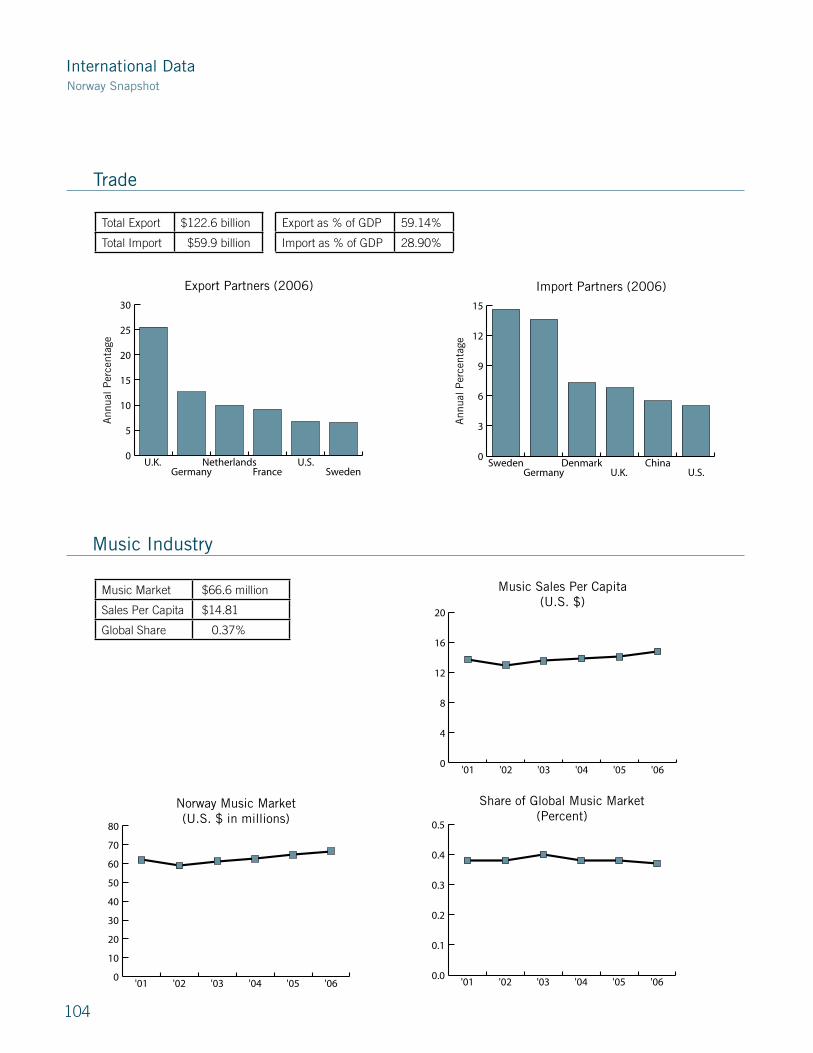
International Data
10�
0
5
10
15
20
25
30
SwedenU.S.
FranceNetherlands
GermanyU.K.
Export Partners (2006)
10
15
20
04 03 02 01 00 99 98 97 96 95
Ann
ual P
erce
ntag
e
Uni
ts x
1,0
00
Import Value Units
0
3
6
9
12
15
U.S.China
U.K. Denmark
GermanySweden
Import Partners (2006)
10
15
20
04 03 02 01 00 99 98 97 96 95
Ann
ual P
erce
ntag
e
Uni
ts x
1,0
00
Import Value Units
Music Sales Per Capita(U.S. $)
0
4
8
12
16
20
'06'05'04'03'02'01
Norway Music Market(U.S. $ in millions)
0
10
20
30
40
50
60
70
80
'06'05'04'03'02'01
Trade
Music Industry
Norway Snapshot
Total Export $1��.6 billion
Total Import $�9.9 billion
Export as % of GDP �9.1�%
Import as % of GDP �8.90%
Music Market $66.6 million
Sales Per Capita $1�.81
Global Share 0.��%
Share of Global Music Market(Percent)
0.0
0.1
0.2
0.3
0.4
0.5
'06'05'04'03'02'01
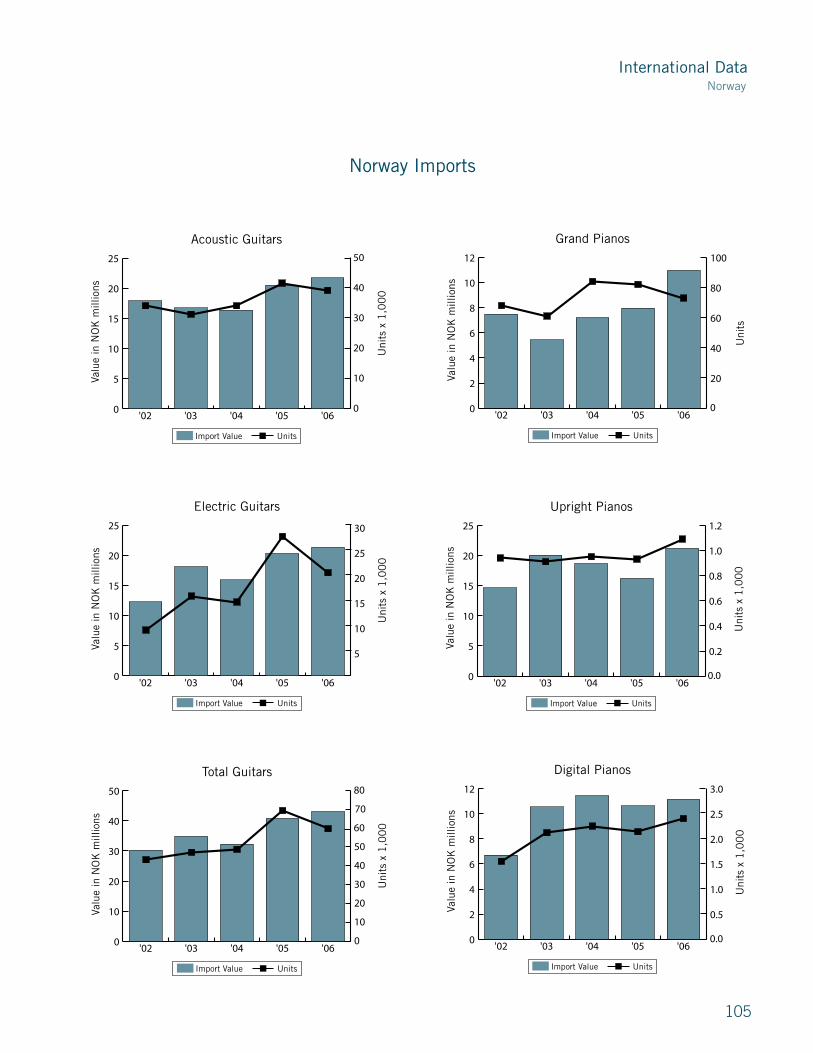
International Data
10�
Norway Imports
Uni
ts x
1,0
00
Import Value Units
0
5
10
15
20
25
'06'05'04'03'02
Acoustic Guitars
0
10
20
30
40
50
0403020100999897
Valu
e in
NO
K m
illio
ns
Uni
ts x
1,0
00
Import Value Units
0
10
20
30
40
50
0605040302
300
0
2
4
6
8
10
12
'06'05'04'03'02
Digital Pianos
0
500
1000
1500
2000
2500
3000
3500
0403020100999897
Valu
e in
NO
K m
illio
ns
Uni
ts x
1,0
00
Import Value Units
Uni
ts x
1,0
00
Import Value Units
0.0
0.5
1.0
1.5
2.0
2.5
3.0
0605040302
0
5
10
15
20
25
'06'05'04'03'02
Electric Guitars
0
50
100
150
200
250
300
0403020100999897
Valu
e in
NO
K m
illio
ns
Uni
ts x
1,0
00
Import Value Units
Uni
ts x
1,0
00
Import Value Units
0
5
10
15
20
25
30
0605040302
300
0
2
4
6
8
10
12
'06'05'04'03'02
Grand Pianos
0
500
1000
1500
2000
2500
3000
3500
0403020100999897
Valu
e in
NO
K m
illio
ns
Uni
ts x
1,0
00
Import Value Units
Uni
ts
Import Value Units
0
20
40
60
80
100
0605040302
Uni
ts x
1,0
00
Import Value Units
0
10
20
30
40
50
'06'05'04'03'02
Total Guitars
0
10
20
30
40
50
60
70
80
0403020100999897
Valu
e in
NO
K m
illio
ns
Uni
ts x
1,0
00
Import Value Units
0
10
20
30
40
50
60
70
80
0605040302
300
0
5
10
15
20
25
'06'05'04'03'02
Upright Pianos
0
500
1000
1500
2000
2500
3000
3500
0403020100999897
Valu
e in
NO
K m
illio
ns
Uni
ts x
1,0
00
Import Value Units
Uni
ts x
1,0
00
Import Value Units
0.0
0.2
0.4
0.6
0.8
1.0
1.2
0605040302
Norway

International Data
106
0
20
40
60
80
100
'06'05'04'03'02
Professional Audio
0
500
1000
1500
2000
2500
3000
3500
0403020100999897
Valu
e in
NO
K m
illio
ns
Uni
ts x
1,0
00
Import Value Units
Uni
ts x
1,0
00
Import Value Units
0
20
40
60
80
100
120
0605040302
0
4
8
12
16
20
'06'05'04'03'02
Woodwind Instruments
0
500
1000
1500
2000
2500
3000
3500
0403020100999897
Valu
e in
NO
K m
illio
ns
Uni
ts x
1,0
00
Import Value Units
Uni
ts x
1,0
00
Import Value Units
0
2
4
6
8
10
0605040302
0
1
2
3
4
5
'06'05'04'03'02
Stringed Instruments
0
500
1000
1500
2000
2500
3000
3500
0403020100999897
Valu
e in
NO
K m
illio
ns
Uni
ts x
1,0
00
Import Value Units
Uni
ts x
1,0
00
Import Value Units
0.0
0.5
1.0
1.5
2.0
2.5
0605040302
Norway Imports
0
5
10
15
20
25
'06'05'04'03'02
Percussion
0
500
1000
1500
2000
2500
3000
3500
0403020100999897
Valu
e in
NO
K m
illio
ns
Uni
ts x
1,0
00
Import Value Units
Uni
ts x
1,0
00
Import Value Units
0
10
20
30
40
50
60
70
80
0605040302
0
1
2
3
4
5
6
7
'06'05'04'03'02
Instrument Strings
Valu
e in
NO
K m
illio
ns
Uni
ts x
1,0
00
Import Value Units
Import Value
0
35
70
105
140
175
210
245
280
315
350
04 03 02 01 00 99 98 97 96
Uni
ts x
1,0
00
Import Value Units
0
4
8
12
16
20
'06'05'04'03'02
Brass Instruments
0
500
1000
1500
2000
2500
3000
3500
0403020100999897
Valu
e in
NO
K m
illio
ns
Uni
ts x
1,0
00
Import Value Units
Uni
ts x
1,0
00
Import Value Units
0
1
2
3
4
5
0605040302
Norway

10�
sPAin
The sale of musical instruments in Spain has been stable with little change from �00�.
However, certain areas illustrate the changes that have taken place in some sectors of the music industry over the past year. Keyboard synthesizers, for example, showed an increase of �1 percent in units sold and �6 percent in the total invoiced amount. The reverse is true for module synthesizers, which have experienced decreases in both number of units sold and invoiced volume of sales.
The category of electronic keyboards showed an increase, with the most significant variations between the different prices and the most important increases occurring in products that cost between 900 and 1,800 euros.
Similarly, digital pianos with rhythm increased slightly, about � percent, both in unit sales and the total invoiced amount.
Digital pianos without rhythm showed one of the most significant increases: a �� percent rise in units sold in the full range of prices.
�lthough sales of digital organs decreased in the number of units sold, the total invoiced amount decreased less clearly, showing a great improvement in the quality of the sale price.
The fact that some increases were counterbalanced by slight decreases has created a sense of stability and optimism about the market for the future months.
The Second CoMúsica Fair was very positive, well-attended and the variety of instruments exhibited contributed to greater confidence in the future of the Spanish music industry.
The following charts are based on data provided by CoMúsica, the Spanish Music Products Association. Commentary by Juan Grecos, of Caprice, S.L.

108
Demographics
65+17.8%
0–14 14.4%
15–64 67.8%
Economy
GDP-Services64.6%
GDP-Industry30.1%
GDP-Agriculture5.3%
Population in millions 40.4
Median Age 39.5Population Growth 0.13%
0.0
0.2
0.4
0.6
0.8
1.0
1.2
'06'05'04'03'02'01'00'99'98'97'96'95
Spain GDP (PPP)(U.S. $ in trillions)
0
5
10
15
20
25
30
'06'05'04'03'02'01'00'99'98'97'96'95
Unemployment Rate(Percent)
0
1
2
3
4
5
'06'05'04'03'02'01'00'99'98'97'96'95
Inflation (Annual Percent Rate)
Spain SnapShot
Demographics
Economy
Age Male female
0–1� �.00 �.8�
1�–6� 1�.�� 1�.6�
6� & Over �.99 �.18
GDP (PPP) $1.0� trillion
GDP Per Capita $��,000
GDP-Real Growth Rate �.60%
Unemployment Rate 8.10%
Inflation �.�0%
Data Source: Demographics, Economy and Trade from CIA, Music Industry from The Music Trades. GDP (PPP): Gross Domestic Product based on purchasing-power-parity (PPP) valuation of country GDP in U.S. dollars.

International Data
109
Data Source: Demographics, Economy and Trade from CIA, Music Industry from The Music Trades. GDP (PPP): Gross Domestic Product based on purchasing-power-parity (PPP) valuation of country GDP in U.S. dollars.
Spain Snapshot
0
4
8
12
16
20
U.S.Italy
U.K.Portugal
GermanyFrance
Export Partners 2006 (Percent)
0
2
4
6
8
10
12
14
16
NetherlandsU.K.ItalyFranceGermany
Import Partners 2006 (Percent)
0
1
2
3
4
5
6
'06'05'04'03'02'01'00
Music Sales Per Capita(U.S. $)
0
25
50
75
100
125
150
175
200
225
'06'05'04'03'02'01'00
Spain Music Market(U.S. $ in millions)
Trade
Music Industry
Total Export $���.1 billion
Total Import $���.� billion
Export as % of GDP �0.�6%
Import as % of GDP �0.��%
Music Market $1�1.0 million
Sales Per Capita $�.16
Global Share 0.96%
Share of Global Music Market(Percent)
0.0
0.2
0.4
0.6
0.8
1.0
1.2
1.4
'06'05'04'03'02'01'00

110
Spain Domestic Sales
0.0
0.2
0.4
0.6
0.8
1.0
1.2
1.4
1.6
1.8
'06'05'04'03'02'01'00'99'98'97
Acoustic Guitars
0
1
2
3
4
5
6
7
8
9
04030201'00
Valu
e €
in m
illio
ns
Import Value Units
Uni
ts x
1,0
00
Retail Value Units
0
1
2
3
4
5
6
7
8
9
'06'05'04'03'02'01'00'99'98'97
0
100
200
300
400
500
'06'05'04'03'02
Digital Organs
0.0
0.2
0.4
0.6
0.8
1.0
1.2
1.4
1.6
04030201
Valu
e €
in th
ousa
nds
Import Value Units
Uni
ts
0
50
100
150
200
250
'06'05040302
Retail Value Units
0.0
0.5
1.0
1.5
2.0
2.5
3.0
3.5
4.0
4.5
'06'05'04'03'02'01'00'99'98'97
Electric Basses
0
1
2
3
4
5
6
7
04030201'00
Valu
e €
in m
illio
ns
Import Value Units
Uni
ts x
1,0
00
0
1
2
3
4
5
6
7
8
9
'06'05'04'03'02'01'00'99'98'97
Retail Value Units
0
2
4
6
8
10
12
14
16
'06'05'04'03'02'01'00'99'98'97
Electric Guitars
0
5
10
15
20
25
30
35
04030201'00
Valu
e €
in m
illio
ns
Import Value Units
Uni
ts x
1,0
00
0
5
10
15
20
25
30
35
'06'0504030201'009998'97
Retail Value Units
0.0
0.5
1.0
1.5
2.0
2.5
3.0
3.5
4.0
'06'05'04'03'02'01'00'99'98'97
Acoustic-Electric Guitars
0
2
4
6
8
10
12
04030201'00
Valu
e €
in m
illio
ns
Import Value Units
Uni
ts x
1,0
00
0
2
4
6
8
10
12
'06'05'04'03'02'01'00'99'98'97
Retail Value Units
0
2
4
6
8
10
12
'06'05'04'03'02'01
Electronic Keyboards
0.0
0.2
0.4
0.6
0.8
1.0
1.2
1.4
1.6
04030201
Valu
e €
in m
illio
ns
Import Value Units
Uni
ts x
1,0
00
0
5
10
15
20
25
30
35
40
'06'0504030201
Retail Value Units

International Data
111
Spain
0.0
0.5
1.0
1.5
2.0
2.5
3.0
3.5
4.0
'06'05'04'03'02'01
Digital Pianos With Rhythm
0.0
0.2
0.4
0.6
0.8
1.0
1.2
1.4
1.6
04030201
Valu
e €
in m
illio
ns
Import Value Units
Uni
ts x
1,0
00
0.0
0.5
1.0
1.5
2.0
2.5
3.0
3.5
'06'0504030201
Retail Value Units
0.0
0.5
1.0
1.5
2.0
2.5
3.0
'06'05'04'03'02'01
Keyboard Synthesizers
0.0
0.2
0.4
0.6
0.8
1.0
1.2
1.4
1.6
04 03 02 01
Valu
e €
in m
illio
ns
Import Value Units
Uni
ts x
1,0
00
0.0
0.5
1.0
1.5
2.0
2.5
'06'0504030201
Retail Value Units
0.0
0.5
1.0
1.5
2.0
2.5
3.0
3.5
'06'05'04'03'02'01
Digital Drums
0.0
0.2
0.4
0.6
0.8
1.0
1.2
1.4
1.6
04030201
Valu
e €
in m
illio
ns
Import Value Units
Uni
ts x
1,0
00
0.0
0.5
1.0
1.5
2.0
2.5
3.0
'06'0504030201
Retail Value Units
0
100
200
300
400
500
600
700
'06'05'04'03'02
Module Synthesizers
0.0
0.2
0.4
0.6
0.8
1.0
1.2
1.4
1.6
04030201
Valu
e €
in th
ousa
nds
Import Value Units
Uni
ts
0
100
200
300
400
500
600
'06'05040302
Retail Value Units
0
2
4
6
8
10
'06'05'04'03'02'01'00
Instrument Amplifiers
0
5
10
15
20
25
30
35
04030201'00
Valu
e €
in m
illio
ns
Import Value Units
Uni
ts x
1,0
00
0
5
10
15
20
25
30
35
40
'06'05'04'03'02'01'00
Retail Value Units
Spain Domestic Sales
0
2
4
6
8
10
12
'06'05'04'03'02'01
Digital Pianos Without Rhythm
0.0
0.2
0.4
0.6
0.8
1.0
1.2
1.4
1.6
04030201
Valu
e €
in m
illio
ns
Import Value Units
Uni
ts x
1,0
00
0
2
4
6
8
10
'06'0504030201
Retail Value Units
11�
sWitzerLAnd
Switzerland, which is geographically located in Central Europe and surrounded by Germany, France, Italy, �ustria and Liechtenstein, is not a member of the European Union (EU). �ll of the surrounding countries are members of the EU. Liechtenstein is a small and political country with an open border to Switzerland and which uses the Swiss currency system (CHF).
Switzerland is a member of the European Free Trade �ssociation (EFT�). Its free trade agreements with third countries are of considerable importance to the Swiss economy. The capital city of Switzerland is �erne, the biggest city is Zurich with about 1.� million inhabitants (suburbs included). There are four official national languages spoken in Switzerland: German (official language) 6� percent of the population (spoken language: different Swiss German regional dialects), French �0.� percent, Italian 6.� percent and Rhaeto-Romanic 0.� percent (a group of Romance languages that are spoken in eastern Switzerland and northeastern Italy). The remaining 9.� percent are different languages spoken by inhabitants of Switzerland with other than Swiss nationality.
Music Market
In Switzerland, there are about �00 music shops (any category). Switzerland is also well-known for recording studios. Many famous artists live in Switzerland. Swiss consumers are very quality-oriented and many companies use Switzerland as a test market for their products.
Switzerland imports raw materials, semi-manufactured goods, consumer goods, capital/industrial goods and sources of energy every year. The Swiss market volume (in retail prices) totals approximately CHF (Swiss francs) ��0 millions, or $�69 million (U.S.). The amount of music education (i.e., public music schools) is approximately CHF ��0 million, or $�8� million (U.S.), not including dealer music schools, private teaching and academies.
The following charts are based on data provided by The Federal Office ofStatistics in Switzerland and the personal research of Michael Heuser, President of Roland Switzerland and Delegate of Suissemusic for International Relations and for CAFIM. Commentary by Michael Heuser.
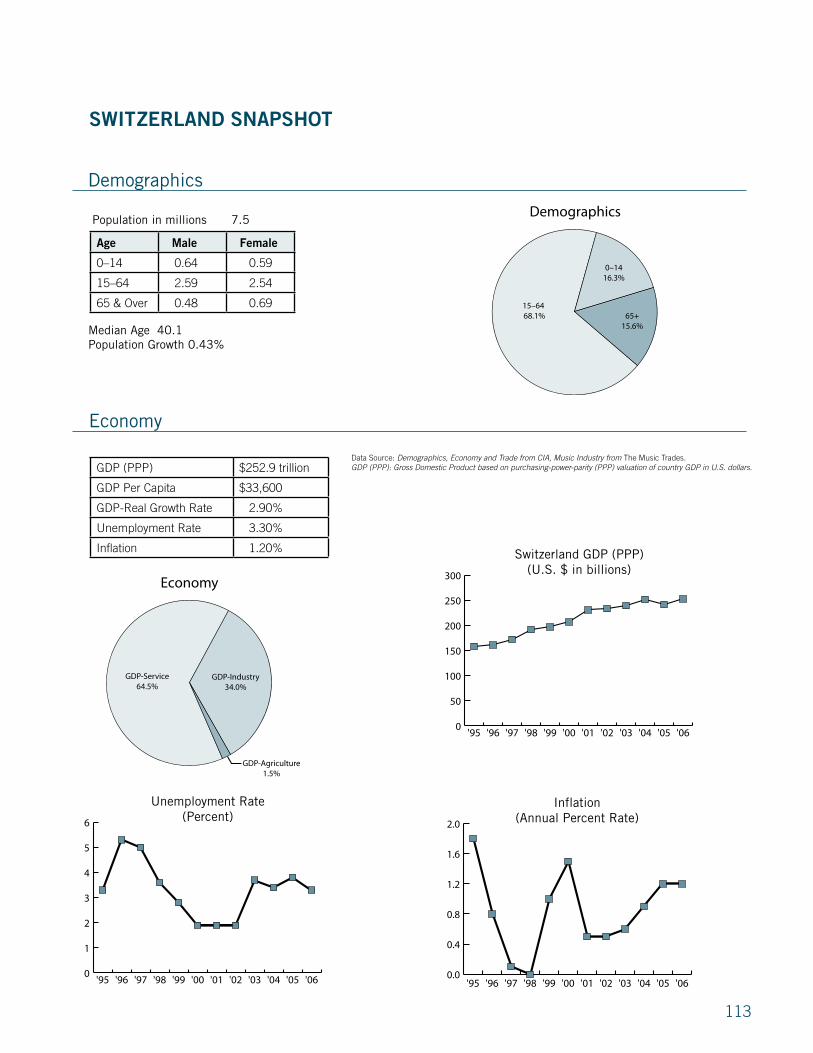
11�
Demographics
65+15.6%
0–1416.3%
15–64 68.1%
Economy
GDP-Industry34.0%
GDP-Service64.5%
GDP-Agriculture1.5%
Population in millions 7.5
Median Age 40.1Population Growth 0.43%
0
50
100
150
200
250
300
'06'05'04'03'02'01'00'99'98'97'96'95
Switzerland GDP (PPP)(U.S. $ in billions)
Import Value Units
0
5
10
15
20
25
040302010099989796
0
1
2
3
4
5
6
'06'05'04'03'02'01'00'99'98'97'96'95
Unemployment Rate(Percent)
Import Value Units
0
5
10
15
20
25
04 03 02 01 00 99 98 97 96
0.0
0.4
0.8
1.2
1.6
2.0
'06'05'04'03'02'01'00'99'98'97'96'95
Inflation (Annual Percent Rate)
sWitzerLAnd snAPshot
Demographics
Economy
Age Male female
0–1� 0.6� 0.�9
1�–6� �.�9 �.��
6� & Over 0.�8 0.69
GDP (PPP) $���.9 trillion
GDP Per Capita $��,600
GDP-Real Growth Rate �.90%
Unemployment Rate �.�0%
Inflation 1.�0%
Data Source: Demographics, Economy and Trade from CIA, Music Industry from The Music Trades. GDP (PPP): Gross Domestic Product based on purchasing-power-parity (PPP) valuation of country GDP in U.S. dollars.
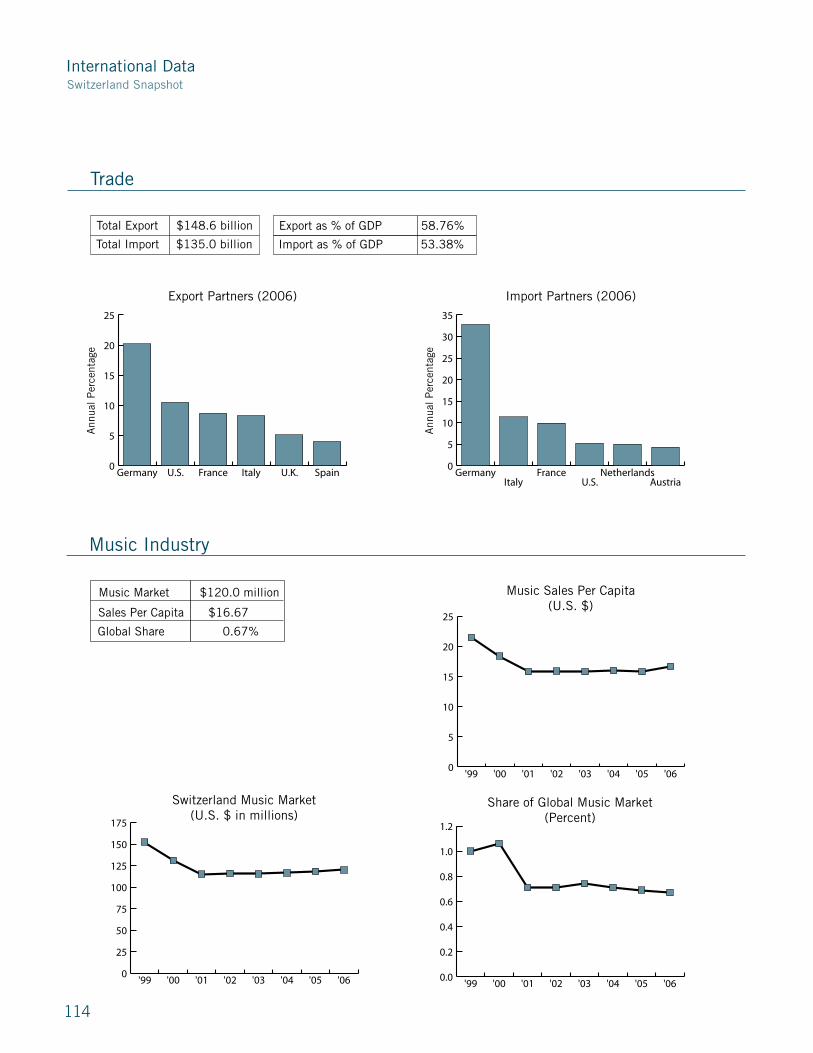
International Data
11�
0
5
10
15
20
25
SpainU.K.ItalyFranceU.S.Germany
Export Partners (2006)
10
15
20
04 03 02 01 00 99 98 97 96 95
Ann
ual P
erce
ntag
e
Uni
ts x
1,0
00
Import Value Units
0
5
10
15
20
25
30
35
AustriaNetherlands
U.S.France
ItalyGermany
Import Partners (2006)
10
15
20
04 03 02 01 00 99 98 97 96 95
Ann
ual P
erce
ntag
e
Uni
ts x
1,0
00
Import Value Units
Total Export $148.6 billion
Total Import $135.0 billion
Export as % of GDP 58.76%
Import as % of GDP 53.38%
Music Market $120.0 million
Sales Per Capita $16.67
Global Share 0.67%
Music Sales Per Capita(U.S. $)
0
5
10
15
20
25
'06'05'04'03'02'01'00'99
Share of Global Music Market(Percent)
0.0
0.2
0.4
0.6
0.8
1.0
1.2
'06'05'04'03'02'01'00'99
Switzerland Music Market(U.S. $ in millions)
0
25
50
75
100
125
150
175
'06'05'04'03'02'01'00'99
Switzerland Snapshot
Music Industry
Trade

International Data
11�
0
2
4
6
8
10
12
'06'05'04'03'02'01'00'99'98'97
Grand Pianos
Valu
e in
Sw
iss
fran
cs m
illio
ns
Uni
ts x
1,0
00
Import Value Units
Import Value
0
35
70
105
140
175
210
245
280
315
350
04 03 02 01 00 99 98 97 96
Uni
ts x
1,0
00
Import Value Units0
1
2
3
4
5
6
7
8
'06'05'04'03'02'01'00'99'98'97
Guitars
Valu
e in
Sw
iss
fran
cs m
illio
ns
Uni
ts x
1,0
00
Import Value Units
Import Value
0
35
70
105
140
175
210
245
280
315
350
04 03 02 01 00 99 98 97 96
Uni
ts x
1,0
00
Import Value Units
0
2
4
6
8
10
12
'06'05'04'03'02'01'00'99'98'97
Fretted Instruments
Valu
e in
Sw
iss
fran
cs m
illio
ns
Uni
ts x
1,0
00
Import Value Units
Import Value
0
35
70
105
140
175
210
245
280
315
350
04 03 02 01 00 99 98 97 96
Uni
ts x
1,0
00
Import Value Units
Switzerland Imports
0
3
6
9
12
15
'06'05'04'03'02'01'00'99'98'97
Upright Pianos
Valu
e in
Sw
iss
fran
cs m
illio
ns
Uni
ts x
1,0
00
Import Value Units
Import Value
0
35
70
105
140
175
210
245
280
315
350
04 03 02 01 00 99 98 97 96
Uni
ts x
1,0
00
Import Value Units0.0
0.5
1.0
1.5
2.0
2.5
3.0
'06'05'04'03'02'01'00'99'98'97
Stringed Instruments with a Bow
Valu
e in
Sw
iss
fran
cs m
illio
ns
Uni
ts x
1,0
00
Import Value Units
Import Value
0
35
70
105
140
175
210
245
280
315
350
04 03 02 01 00 99 98 97 96
Uni
ts x
1,0
00
Import Value Units
0.0
0.5
1.0
1.5
2.0
2.5
'06'05'04'03'02'01'00'99'98'97
Musical Instrument Strings
Valu
e in
Sw
iss
fran
cs m
illio
ns
Uni
ts x
1,0
00
Import Value Units
Import Value
0
35
70
105
140
175
210
245
280
315
350
04 03 02 01 00 99 98 97 96
Uni
ts x
1,0
00
Import Value Units
Switzerland

International Data
116
0
4
8
12
16
20
'06'05'04'03'02'01'00'99'98'97
Keyboards
Valu
e in
Sw
iss
fran
cs m
illio
ns
Uni
ts x
1,0
00
Import Value Units
Import Value
0
35
70
105
140
175
210
245
280
315
350
04 03 02 01 00 99 98 97 96
Uni
ts x
1,0
00
Import Value Units
0
2
4
6
8
10
'06'05'04'03'02'01'00'99'98'97
Percussion
Valu
e in
Sw
iss
fran
cs m
illio
ns
Uni
ts x
1,0
00
Import Value Units
Import Value
0
35
70
105
140
175
210
245
280
315
350
04 03 02 01 00 99 98 97 96
Uni
ts x
1,0
00
Import Value Units
0
2
4
6
8
10
12
14
'06'05'04'03'02'01'00'99'98'97
Wind Instruments
Valu
e in
Sw
iss
fran
cs m
illio
ns
Uni
ts x
1,0
00
Import Value Units
Import Value
0
35
70
105
140
175
210
245
280
315
350
04 03 02 01 00 99 98 97 96
Uni
ts x
1,0
00
Import Value Units
0.0
0.5
1.0
1.5
2.0
2.5
3.0
3.5
4.0
'06'05'04'03'02'01'00'99'98'97
Accordions
Valu
e in
Sw
iss
fran
cs m
illio
ns
Uni
ts x
1,0
00
Import Value Units
Import Value
0
35
70
105
140
175
210
245
280
315
350
04 03 02 01 00 99 98 97 96
Uni
ts x
1,0
00
Import Value Units
0
1
2
3
4
5
6
7
8
9
'06'05'04'03'02'01'00'99'98'97
Brass Instruments
Valu
e in
Sw
iss
fran
cs m
illio
ns
Uni
ts x
1,0
00
Import Value Units
Import Value
0
35
70
105
140
175
210
245
280
315
350
04 03 02 01 00 99 98 97 96
Uni
ts x
1,0
00
Import Value Units
0.0
0.5
1.0
1.5
2.0
2.5
3.0
3.5
'06'05'04'03'02'01'00'99'98'97
Pipe Organs & Harmonium
Valu
e in
Sw
iss
fran
cs m
illio
ns
Uni
ts x
1,0
00
Import Value Units
Import Value
0
35
70
105
140
175
210
245
280
315
350
04 03 02 01 00 99 98 97 96
Uni
ts x
1,0
00
Import Value Units
Switzerland
Switzerland Imports
11�
United KingdoM
�ccording to U.K. government statistics, the overall retail market continued to show no significant growth in �006. During the final quarter of that year, several product areas experienced a decrease in growth—in particular, household goods and services. Durable goods, however, were one area where a small growth of 1.� percent did appear.
Last year’s forecasts that the U.K. was unlikely to return to the levels of �00� have turned out to be correct. The U.K. MI retail sector has seen increased margin pressure during an overall zero- growth period. One key element to the deflationary pressure has been the continuing weakening of the dollar. �t nearly � U.S. dollars to the 1 �ritish pound, products from both the United States and China have seen a 10 percent cost savings since �00�. Manufactures have, as predicted, tried to use this extra margin to buffer the deflationary market tendencies rather than to further decrease prices.
The weak dollar has also reinforced the continuing pattern of direct importation from China for many of the major stores. Single independent stores were increasingly under pressure in �006 and have seen this pressure increase going into �00�. The market feedback is that �00� is one of the toughest years since the early ’90s. One of the U.K.’s largest chain stores also collapsed in the early part of �00�, indicating that market pressure and route-to-market strategies still have not solidified.
The guitar market continues to be the bedrock of the U.K. MI industry’s sales, but with electric guitar numbers falling by 1� percent in �006, it’s obvious we are no longer on a sustained growth pattern. �coustic guitars continued to grow, driven by increasing numbers at low value from China. Sustainability of wood supply will be a key element for high-end manufactures over the next 10 years. It will be interesting to see how this will affect the drive for volume sales from China.
Some of our more traditional instrument categories, such as acoustic pianos, have seen growth in both units and value. The grand piano is a major part of this growth, driven it seems by our increased perceived affluence and a better value-for-money proposition from Chinese production.
Last year we predicted that growth in non-MI retailers would play a major role in the U.K. industry. This has continued, with some of our major supermarkets (and even, controversially, high street charity shops) now stocking musical instruments. This non-traditional route to market has created a distortion in the traditionally low-end beginners market.
�nother trend of note within the U.K. market is the emergence of the Pan-European retailer. German retailers are now actively targeting the U.K. market, not just via the Web but also with on-the-page adverts in the U.K. press. There is also an increasing use of e�ay U.K., not only by U.K. retailers of the traditional bricks-and-mortar type, but also the Internet-only variety. German retailers have also entered this e�ay arena, which again creates a further distortion of the market, as there is no statistical method of measuring this Pan-European trade.
The following charts are based on data from the Music Industries Association (MIA). Commentary by Alan Greensall, Chairman MIA Market Trends Committee.

118
United KingdoM snAPshot
Demographics
65+15.8%
0–1417.2%
15–64 67.0%
Economy
GDP-Services73.4%
GDP-Industry25.6%
GDP-Agriculture1.0%
Population in millions 60.6
Median Age 39.3Population Growth 0.28%
0.0
0.4
0.8
1.2
1.6
2.0
'06'05'04'03'02'01'00'99'98'97'96'95
United Kingdom GDP (PPP)(U.S. $ in trillions)
0
2
4
6
8
10
12
'06'05'04'03'02'01'00'99'98'97'96'95
Unemployment Rate(Percent)
0.0
0.5
1.0
1.5
2.0
2.5
3.0
3.5
'06'05'04'03'02'01'00'99'98'97'96'95
Inflation (Annual Percent Rate)
Demographics
Economy
Age Male female
0–1� �.�� �.16
1�–6� �0.�8 19.99
6� & Over �.06 �.�8
GDP (PPP) $1.90 trillion
GDP Per Capita $�1,�00
GDP-Real Growth Rate �.�0%
Unemployment Rate �.90%
Inflation �.00%
Data Source: Demographics, Economy, and Trade from CIA, Economy from IMF, Music Industry from The Music Trades. GDP (PPP): Gross Domestic product based on purchasing-power-parity (PPP) valuation of country GDP in U.S. dollars.

International Data
119
Data Source: Demographics, Economy, and Trade from CIA, Economy from IMF, Music Industry from The Music Trades. GDP (PPP): Gross Domestic product based on purchasing-power-parity (PPP) valuation of country GDP in U.S. dollars. 0
2
4
6
8
10
12
14
16
BelgiumNetherlands
IrelandFrance
GermanyU.S.
Export Partners (2006)
0
2
4
6
8
10
12
14
NorwayChina
NetherlandsFrance
U.S.Germany
Import Partners (2006)
0
4
8
12
16
20
'06'05'04'03'02'01'00'99
Music Sales Per Capita(U.S. $)
0
200
400
600
800
1000
1200
'06'05'04'03'02'01'00'99
United Kingdom Music Market(U.S. $ in millions)
0
1
2
3
4
5
6
7
8
'06'05'04'03'02'01'00'99
Share of Global Music Market(Percent)
Total Export $�68.8 billion
Total Import $60�.0 billion
Export as % of GDP ��.6�%
Import as % of GDP �1.��%
Music Market $899 billion
Sales Per Capita $1�.16
Global Share �.0�%
* U.K. music data re-stated by The Music Trades in �00� and explains the significant growth from �00�.
Trade
Music Industry
United Kingdom Snapshot

1�0
0
5
10
15
20
25
30
35
40
45
'06'05'04'03'02'01'00'99'98'97
Acoustic Guitars
0
50
100
150
200
250
300
350
400
450
500
'04'03'02'01'00'99'98'97'96
Valu
e £
in m
illio
ns
Import Value Units
Uni
ts x
1,0
00
0
100
200
300
400
500
600
0605'04'03'02'01'00'99'98'97
Retail Value Units
0
5
10
15
20
25
'06'05'04'03'02'01'00'99'98'97
Acoustic Pianos
0
1
2
3
4
5
6
7
8
9
'04'03'02'01'00'99'98'97'96
Valu
e £
in m
illio
ns
Import Value UnitsU
nits
x 1
,00
0
0
1
2
3
4
5
6
7
8
9
0605'04'03'02'01'00'99'98'97
Retail Value Units
0
5
10
15
20
25
30
35
40
45
'06'05'04'03'02'01'00'99'98'97
Digital Pianos
0
5
10
15
20
25
30
35
40
'04'03'02'01'00'99'98'97'96
Valu
e £
in m
illio
ns
Import Value Units
Uni
ts x
1,0
00
0
5
10
15
20
25
30
35
40
45
0605'04'03'02'01'00'99'98'97
Retail Value Units
0
10
20
30
40
50
60
70
80
90
'06'05'04'03'02'01'00'99'98'97
Electric Guitars & Basses
0
50
100
150
200
250
300
350
400
450
'04'03'02'01'00'99'98'97'96
Valu
e £
in m
illio
ns
Import Value Units
Uni
ts x
1,0
00
0
50
100
150
200
250
300
350
400
450500
0605'04'03'02'01'00'99'98'97
Retail Value Units
0
20
40
60
80
100
120
'06'05'04'03'02'01'00'99'98'97
Total Guitars
0
100
200
300
400
500
600
700
800
900
'04'03'02'01'00'99'98'97'96
Valu
e £
in m
illio
ns
Import Value Units
Uni
ts x
1,0
00,0
00
0.0
0.2
0.4
0.6
0.8
1.0
1.2
0605'04'03'02'01'00'99'98'97
Retail Value Units
0
2
4
6
8
10
12
'06'05'04'03'02'01'00'99'98'97
Bowed Instruments
0
10
20
30
40
50
60
70
80
'04'03'02'01'00'99'98'97'96
Valu
e £
in m
illio
ns
Import Value Units
Uni
ts x
1,0
00
0
10
20
30
40
50
60
70
80
90
0605'04'03'02'01'00'99'98'97
Retail Value Units
United Kingdom Domestic Sales
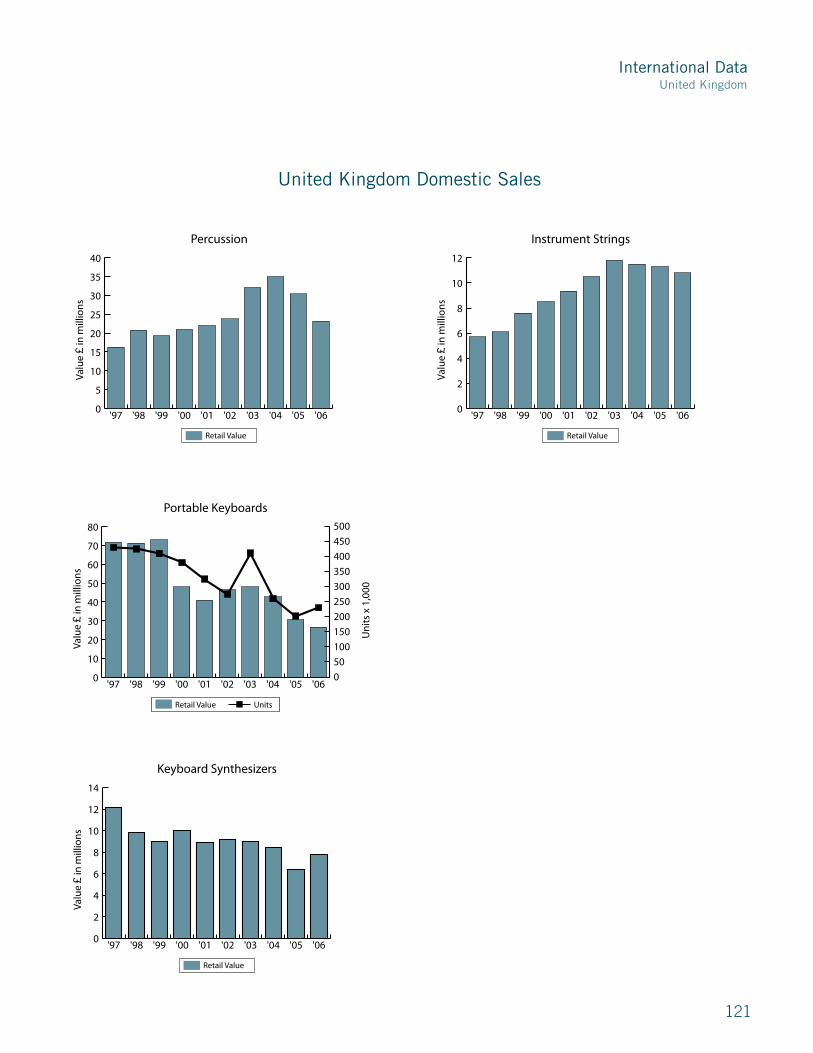
International Data
1�1
0
10
20
30
40
50
60
70
80
'06'05'04'03'02'01'00'99'98'97
Portable Keyboards
0
50
100
150
200
250
300
350
400
450
500
'04'03'02'01'00'99'98'97'96
Valu
e £
in m
illio
ns
Import Value Units
Uni
ts x
1,0
00
0
50
100
150
200
250
300
350
400
450
500
0605'04'03'02'01'00'99'98'97
Retail Value Units
0
2
4
6
8
10
12
'06'05'04'03'02'01'00'99'98'97
Instrument Strings
0
100
200
300
400
500
600
700
800
900
'04'03'02'01'00'99'98'97'96
Valu
e £
in m
illio
ns
Import Value Units
Retail Value
0
2
4
6
8
10
12
14
'06'05'04'03'02'01'00'99'98'97
Keyboard Synthesizers
0
100
200
300
400
500
600
700
800
900
'04'03'02'01'00'99'98'97'96
Valu
e £
in m
illio
ns
Import Value Units
Retail Value
0
5
10
15
20
25
30
35
40
'06'05'04'03'02'01'00'99'98'97
Percussion
0
100
200
300
400
500
600
700
800
900
'04'03'02'01'00'99'98'97'96
Valu
e £
in m
illio
ns
Import Value Units
Retail Value
United Kingdom
United Kingdom Domestic Sales

PeoPLe’s AttitUdes toWArd MUsiC
U.s. gALLUP PoLL
AUstrALiAn & United KingdoM nexUs sUrveys
CoMbined sUrvey CoMPArison
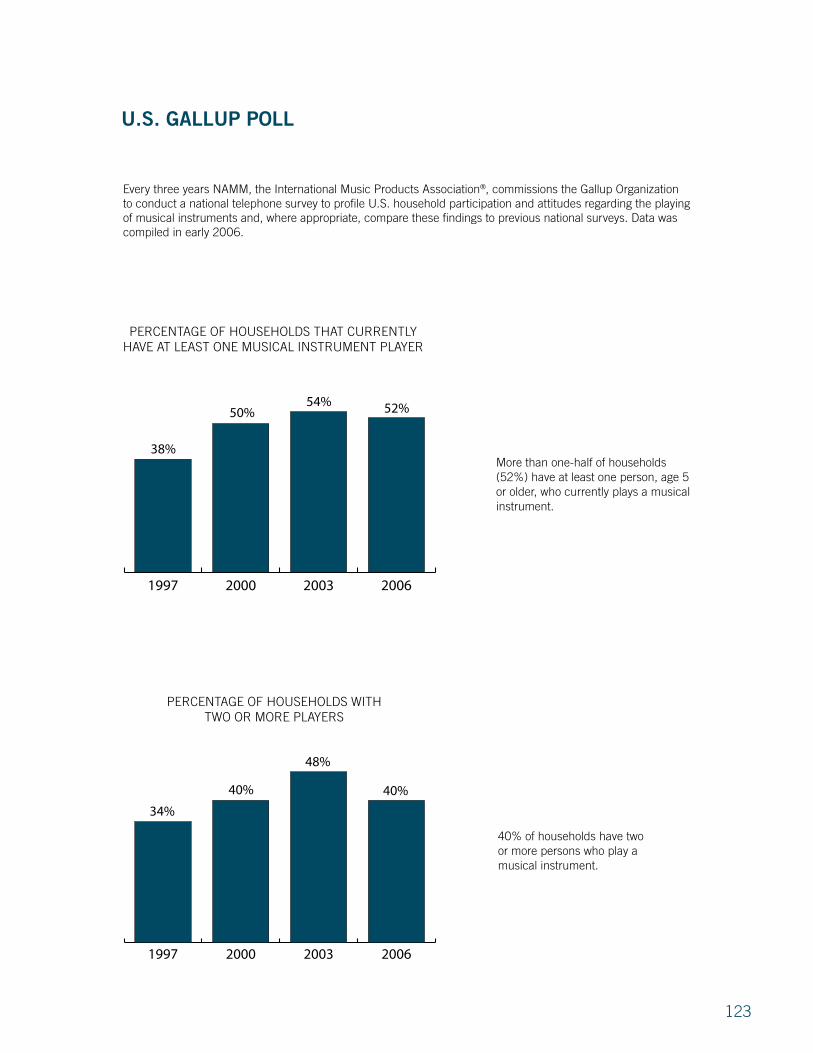
1��
Every three years N�MM, the International Music Products �ssociation®, commissions the Gallup Organization to conduct a national telephone survey to profile U.S. household participation and attitudes regarding the playing of musical instruments and, where appropriate, compare these findings to previous national surveys. Data was compiled in early �006.
More than one-half of households (��%) have at least one person, age � or older, who currently plays a musical instrument.
�0% of households have two or more persons who play a musical instrument.
2006200320001997
PERCENTAGE OF HOUSEHOLDS WITHTWO OR MORE PLAYERS
34%
40%
48%
40%
U.s. gALLUP PoLL
2006200320001997
PERCENTAGE OF HOUSEHOLDS THAT CURRENTLYHAVE AT LEAST ONE MUSICAL INSTRUMENT PLAYER
38%
50%54% 52%

1��
The gender breakdown among those who play musical instruments is �9% male and �1% female.
While there is a slight decrease in the number of players under the age of 18, there is an increase in the number of players between 18 and ��.
Most players continue to decide for themselves what instrument they will play. For the first time since �000, more females than males decide for themselves.
FemaleMale
GENDER OF PERSONS AMONG HOUSEHOLDSWITH AT LEAST ONE MEMBER WHO PLAYS
50% 50% 50% 50% 51%51%49%49%
20031997 2000 2006
AGE OF PERSONS AMONG HOUSEHOLDS WITHAT LEAST ONE MEMBER WHO PLAYS
33%
29%31% 30%
24% 24% 23%22% 23%
19%21%
20%
15%
27% 27%
32%
Under 18(5–17)
50 or older(50+)
35 or older(35–49)
Under 35(18–34)
20031997 2000 2006
FemaleMaleAll PlayersFemaleMaleAll Players
WHO DECIDES WHAT INSTRUMENT SHOULD BE PLAYED
78%
25%
75%
27%
73%
80%
Player decides Someone else decides/joint decision
77%
68%
80%
22% 20%
73%
20032000 2006
74%
23%26%
32%27%
20%
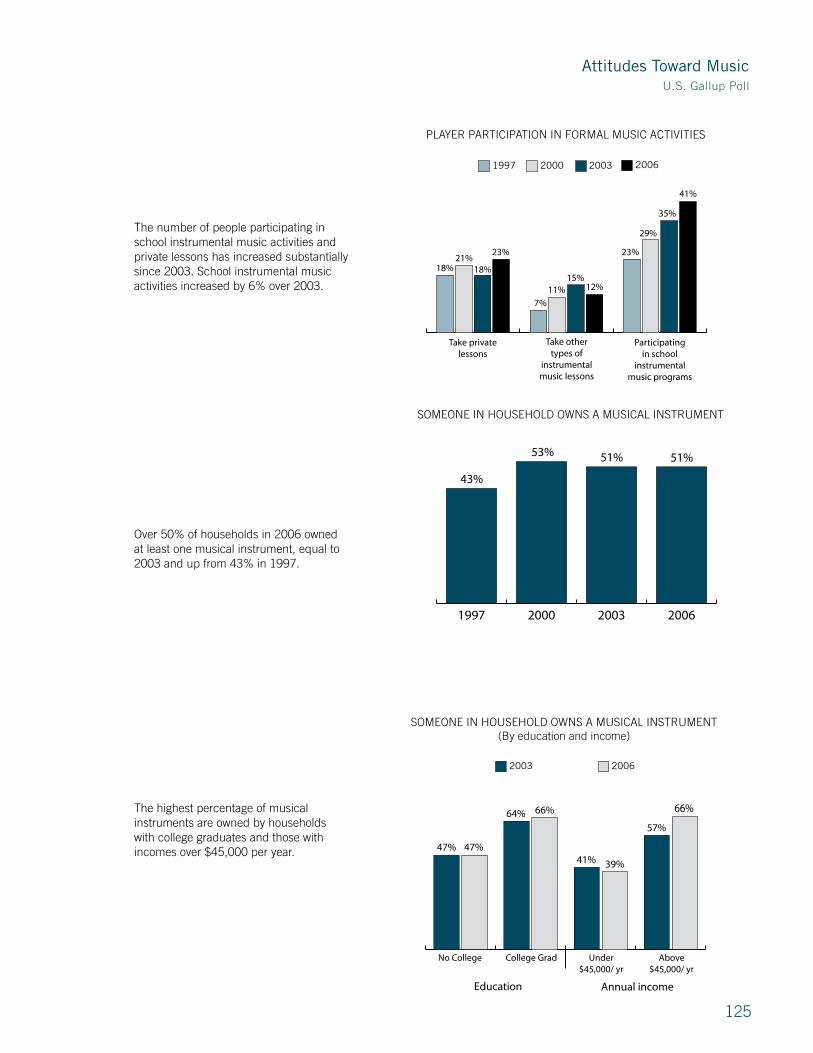
Attitudes Toward MusicU.S. Gallup Poll
1��
PLAYER PARTICIPATION IN FORMAL MUSIC ACTIVITIES
18% 18%
7%
15%12%11%
23%21%
20031997 2000 2006
Participatingin school
instrumentalmusic programs
Take othertypes of
instrumentalmusic lessons
Take private lessons
29%
41%
35%
23%
2006200320001997
SOMEONE IN HOUSEHOLD OWNS A MUSICAL INSTRUMENT
43%
53% 51% 51%
20062003
SOMEONE IN HOUSEHOLD OWNS A MUSICAL INSTRUMENT (By education and income)
47%47%
64%
Education Annual income
66%
41% 39%
66%
57%
Above$45,000/ yr
Under$45,000/ yr
College GradNo College
The number of people participating in school instrumental music activities and private lessons has increased substantially since �00�. School instrumental music activities increased by 6% over �00�.
Over �0% of households in �006 owned at least one musical instrument, equal to �00� and up from ��% in 199�.
The highest percentage of musical instruments are owned by households with college graduates and those with incomes over $��,000 per year.
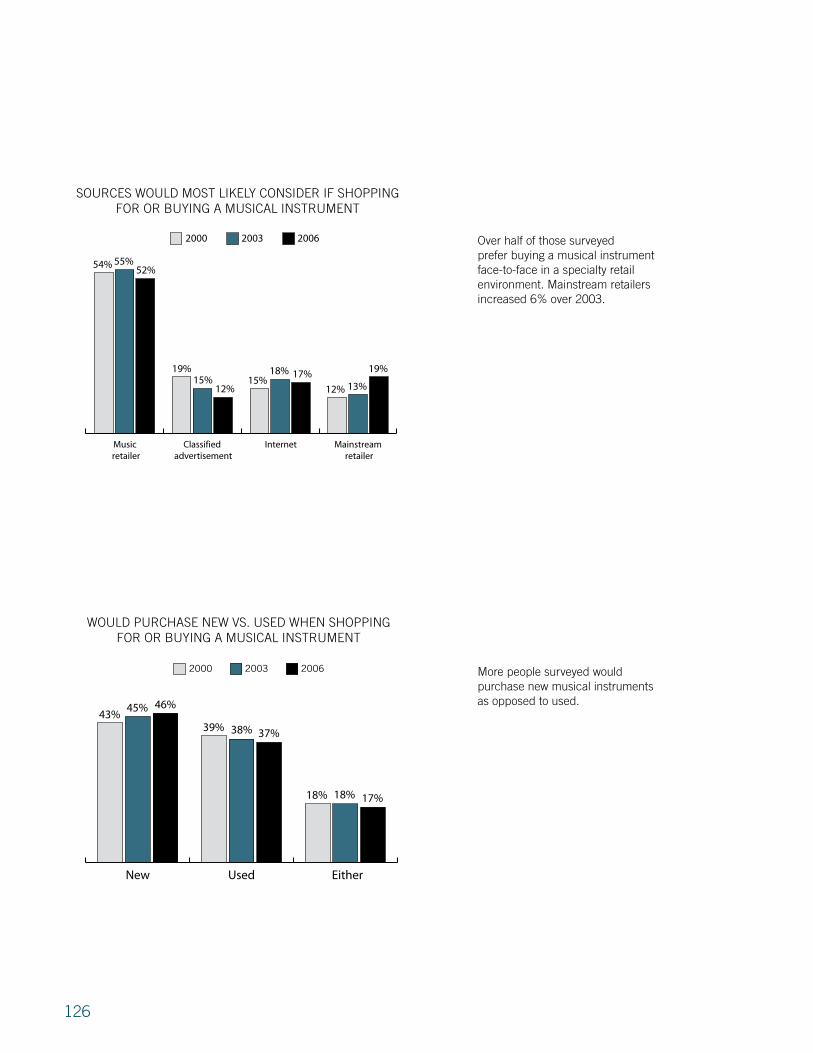
1�6
Over half of those surveyed prefer buying a musical instrument face-to-face in a specialty retail environment. Mainstream retailers increased 6% over �00�.
More people surveyed would purchase new musical instruments as opposed to used.
SOURCES WOULD MOST LIKELY CONSIDER IF SHOPPINGFOR OR BUYING A MUSICAL INSTRUMENT
200620032000
Internet Mainstream retailer
Classified advertisement
Music retailer
54%
19%
13%12%
17%18%15%
12%15%
19%
52%55%
EitherUsedNew
WOULD PURCHASE NEW VS. USED WHEN SHOPPINGFOR OR BUYING A MUSICAL INSTRUMENT
200620032000
43%
17%18%18%
37%38%39%
46%45%
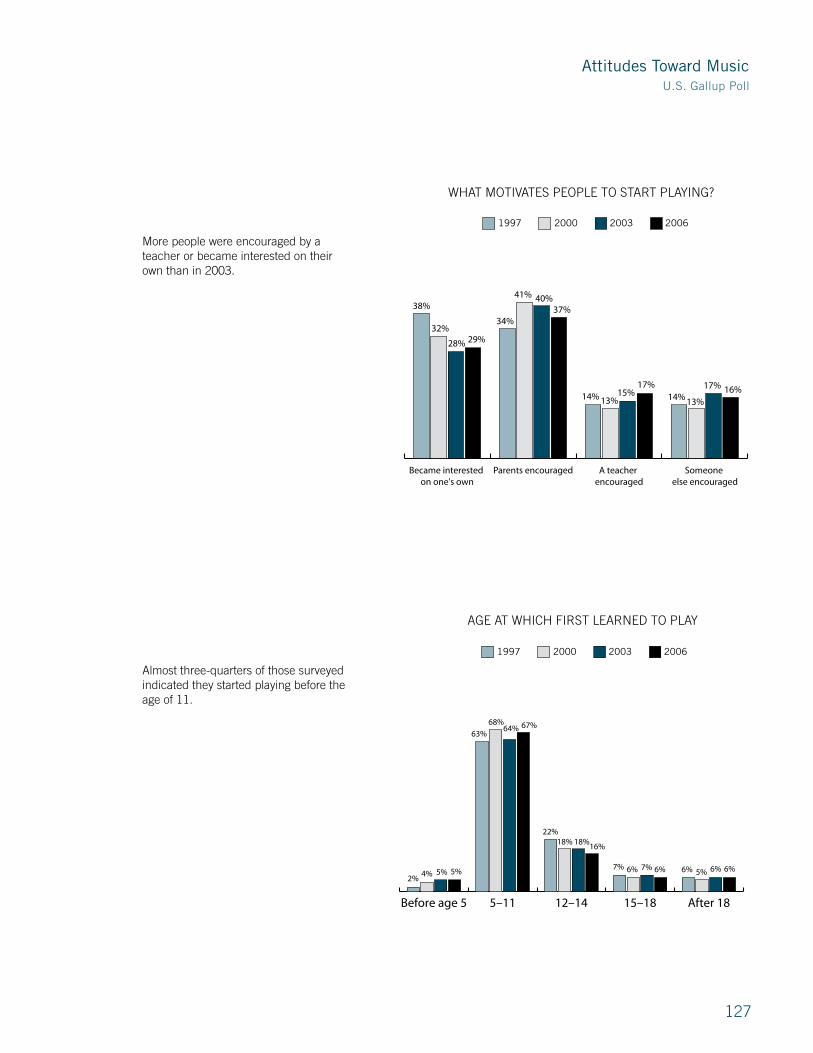
Attitudes Toward MusicU.S. Gallup Poll
1��
More people were encouraged by a teacher or became interested on their own than in �00�.
WHAT MOTIVATES PEOPLE TO START PLAYING?
2006200320001997
Someone else encouraged
A teacher encouraged
Parents encouragedBecame interested on one's own
38%
34%
41% 40%37%
14% 13%15%
17%14%
17%
13%16%
32%
28% 29%
AGE AT WHICH FIRST LEARNED TO PLAY
2006200320001997
After 1815–1812–145–11Before age 5
2%4% 5% 5%
63%64% 67%
22%18% 18%
16%
7% 6% 7% 6% 6% 5% 6% 6%
68%
�lmost three-quarters of those surveyed indicated they started playing before the age of 11.

1�8
HOW DID YOU FIRST LEARN TO PLAY AN INSTRUMENT?(All current or former players)
2006200320001997
Friend taught
Parent/family member
taught
Took band/orchestra
at school
Taught self
Took private lessons
Took lessons at school
25%
30%
16%
36%37%
26%27%
16%14%
22%
26%
17%
14% 15%
9%
6% 5%
8%
13%
4% 4% 5%3%
28%
In �006 most people said they first learned to play a musical instrument either through private lessons or by teaching themselves.
School lessons dropped 1�%, while taking �and/Orchestra at school increased 6%.
�lso interesting is that the number of people taught by a parent or family member increased significantly.
In 199�, �000, �00� and �006 the typical ages for first learning to play a musical instrument were between � and 11. In all years, females were significantly more likely than males to first learn to play during these pre-teenage years. Females are less likely than males to learn if they wait until their teens or older.
After 1815–1812–145–11Before age 5
AGE AT WHICH FIRST LEARNED TO PLAY(By gender)
4% 2%
10%7%5%
14%18%
73%
60%
6%
FemaleMale

Attitudes Toward MusicU.S. Gallup Poll
1�9
Mostly AgreeCompletely Agree
AGREEMENT WITH ATTITUDES ABOUT LEARNING TO PLAY MUSICAL INSTRUMENTS
(All current/former players)
34%
56%
37%
62%
41%
45%
37%51%
TOTAL PERCENTAGE: 96% 92% 82%93%
Playing a musical
instrument is relaxing
Playing a musical
instrument is fun
Playing a musical
instrument is a good means of expression
Makingmusic
makes yousmarter
Females were significantly more likely to take private lessons than were males, while males were significantly more likely to teach themselves.
HOW DID YOU FIRST LEARN TO PLAY AN INSTRUMENT?(All current and former players by gender)
Friend taught
Parent/family
membertaught
Tookband/
orchestraat school
Taughtself
Tookprivatelessons
Took lessons
at school
FemaleMale
15%
2%5%
15%
11%
16%14%
18%
33%32%
22%
17%

1�0
PERCENTAGE OF RESPONDENTS WHO AGREE
20062003200019971994
Music is a very importantpart of my lIfe
I’m too old to learn toplay a musical instrument
81%
23%20%17%22%23%
85%88%87%84%
PERCENTAGE OF RESPONDENTS WHO AGREE
200620032000
Wish had learnedto play a musical instrument
Would like to learnto play a musical instrument
85%
67%67%67%
82%85%

Attitudes Toward MusicU.S. Gallup Poll
1�1
NoYesNoYes
KNOWLEDGE AND OPINION ABOUT SENIORCITIZENS BEING INVOLVED IN MUSIC
200620032000
Knowledge of senior citizens
involved inmusic
Believeexperienceis positive
among thosewho know
17%
0%
100%
84%79%
83%
16%21%
AGREEMENT WITH ATTITUDES ABOUT MUSICEDUCATION IN SCHOOLS
(Percentages who “completely or mostly agree” among all respondents)
20062003200019971994
9696979596 94 94
8582
95 93
8579
95 93
8178
90 88
69 70
93
86
70 71
School bandis a good way
for young people to developteamwork
Music is partof well-rounded
education
Participating in school music
corresponds withbetter grades/
test scoresSchools shouldoffer instrument MusicInstruction as part of
regular curriculum
States shouldmandate musiceducation so allstudents have opportunity to study in school
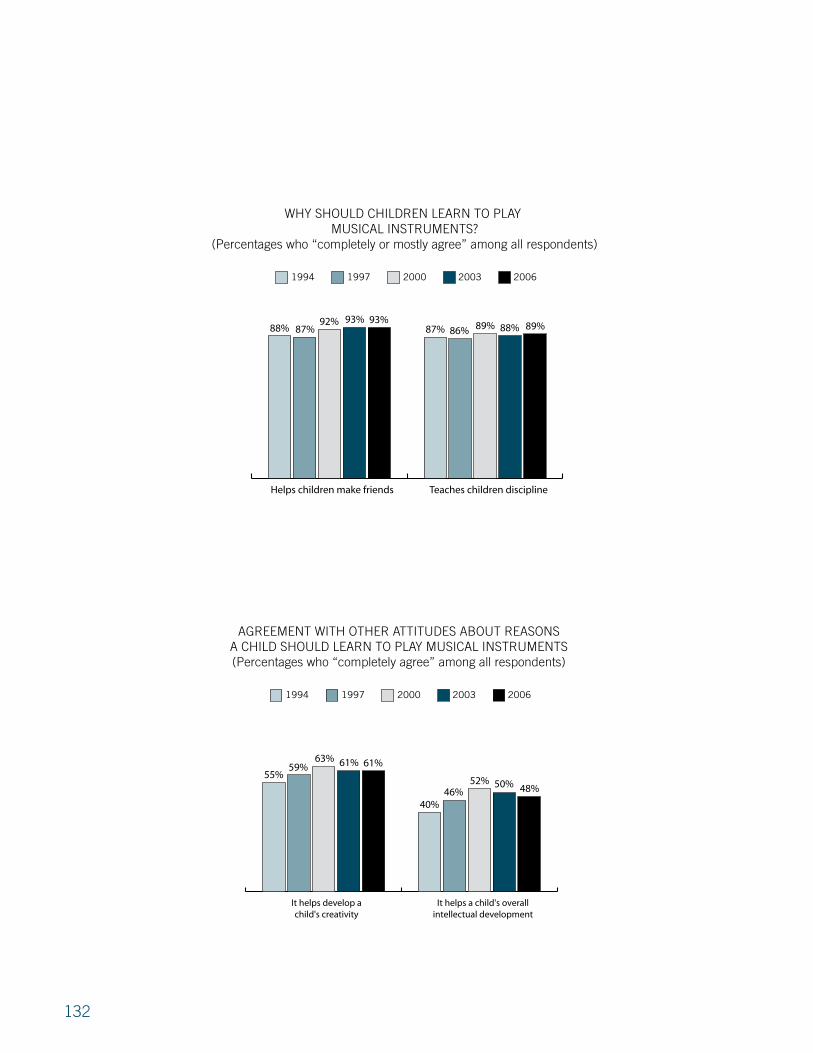
1��
AGREEMENT WITH OTHER ATTITUDES ABOUT REASONSA CHILD SHOULD LEARN TO PLAY MUSICAL INSTRUMENTS(Percentages who “completely agree” among all respondents)
20062003200019971994
It helps develop a child's creativity
It helps a child's overall intellectual development
55%48%50%52%
46%40%
61%61%63%59%
WHY SHOULD CHILDREN LEARN TO PLAY MUSICAL INSTRUMENTS?
(Percentages who “completely or mostly agree” among all respondents)
20062003200019971994
Helps children make friends Teaches children discipline
88% 89%88%89%86%87%93%93%92%
87%

Attitudes Toward MusicU.S. Gallup Poll
1��
PERCENTAGE OF RESPONDENTS WHO AGREE
200620032000
Learning a musical instrumenthelps you do better in other
subjects, like math and science
Teenagers who play aninstrument are less likely to
have disclipine problems
75% 73%71%73%80%78%
AGREEMENT WITH ATTITUDES ABOUT MUSICAT THE PRESCHOOL LEVEL
200620032000
Music plays a significant role in
preschool development
It's important for children to engage in musical activities in daycare/preschool
58%66%64%67%64%
50%

1��
12+5–111–4Before age 1
AGE BELIEVE CHILDREN SHOULD BE EXPOSED TO MUSIC
5%
25%
3%
25%20%19%
49%54%
20062003
� vast opportunity exists for tapping into the preschool-age market, since almost �0 percent of respondents believe children should be exposed to music by the age of �.
1 Least likely
2345 Very likely
HOW LIKELY WOULD YOU BE TO WANT TO LEARN A MUSICAL INSTRUMENT IF MUSICAL INSTRUMENTS
COST LESS TO OWN OR RENT?
31%
14%
10%
25%
20%
�lmost one-third of people surveyed indicated that they are more likely to want to learn a musical instrument if the cost to own or rent were less.

Attitudes Toward MusicU.S. Gallup Poll
1��
“Orchestral �rass” includes saxophones, clarinets, trumpets, flutes, horns, cellos and violins.
“Other Instrument” includes DJ turntables, computer music products, drum machines, organs, etc.
WHAT MUSICAL INSTRUMENTS DO YOU PLAY?
Keyboard–Electric
Other Instrument
Drums or Percussion
Orchestral Brass
Guitar or Bass
Piano
1%
4%
13%
27%
28%
31%
5%

1�6
FemaleMale
20072001
GENDER OF PERSONS AMONG HOUSEHOLDSWITH AT LEAST ONE MEMBER WHO PLAYS
53%47%49%51%
200720011996
PERCENTAGE OF HOUSEHOLDS THAT CURRENTLYHAVE AT LEAST ONE MUSICAL INSTRUMENT PLAYER
28%
36% 35%��% of households are found to contain at least one person who plays a musical instrument. This compares with a figure of ��% in the United States in �006.
The Nexus Survey commissioned by the �ustralian Music �ssociation (�M�) and conducted in �00� presents results from a study of �ustralian households in order to provide a platform for an advocacy program promoting the value of music. The results are based on 1,000 interviews with households randomly selected across �ustralia.
AUstrALiAn nexUs sUrvey
The gender breakdown among those who play musical instruments is ��% male and��% female. The gap between male and female players has increased since �001.

Attitudes Toward MusicAustralian Nexus Survey
1��
50+ yrs.35–49 yrs.18–34 yrs.5–17 yrs.
20072001
AGE OF PERSONS AMONG HOUSEHOLDS WITHAT LEAST ONE MEMBER WHO PLAYS
37%
24%
29%
36%
19%18%20%
17%
It can be seen that the �–1� years age group accounts for over one-third of all people playing a musical instrument. Whilethere is a slight decrease in players between18 and �� years, all other age groups saw an increase.
20072001
WHO DECIDES WHAT INSTRUMENT SHOULD BE PLAYED?
28%
71% 71%
Player decides Someone else decides/joint decision
27%
Most musical instrument players decide for themselves what instrument to play.
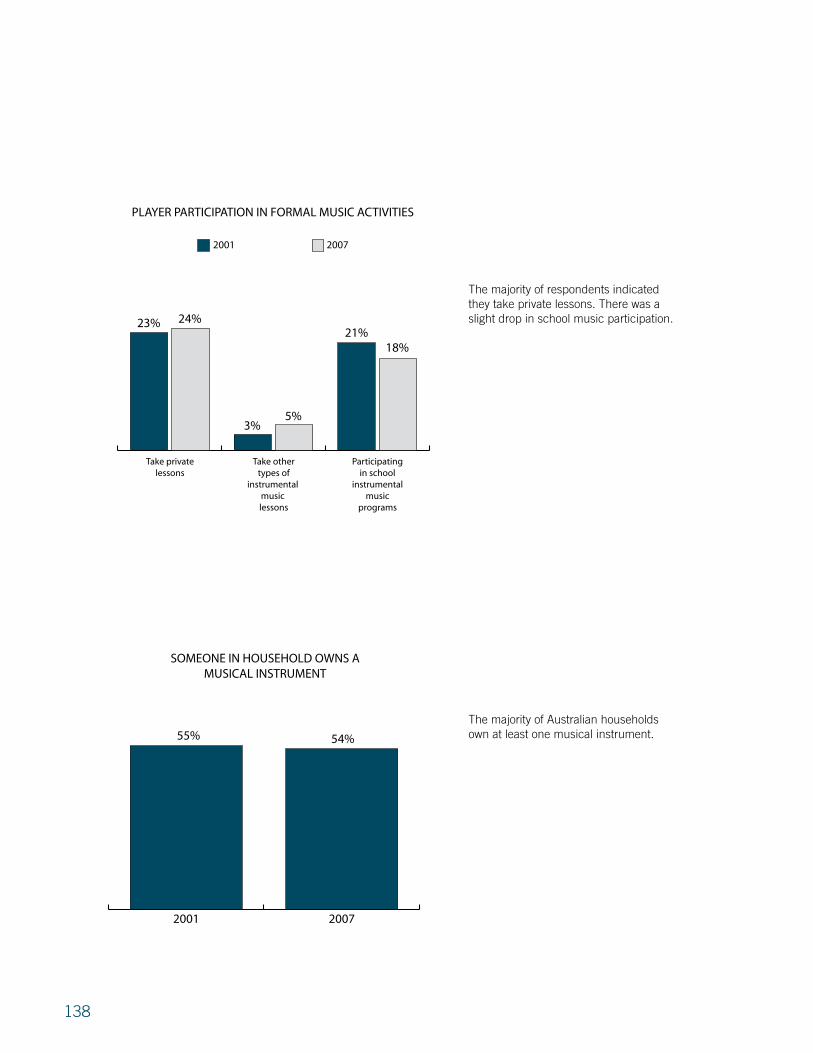
1�8
20072001
SOMEONE IN HOUSEHOLD OWNS AMUSICAL INSTRUMENT
55% 54%
The majority of respondents indicated they take private lessons. There was a slight drop in school music participation.
20072001
PLAYER PARTICIPATION IN FORMAL MUSIC ACTIVITIES
24%
5%3%
23%21%
Participatingin school
instrumentalmusic
programs
Take othertypes of
instrumental music lessons
Take privatelessons
18%
The majority of �ustralian householdsown at least one musical instrument.
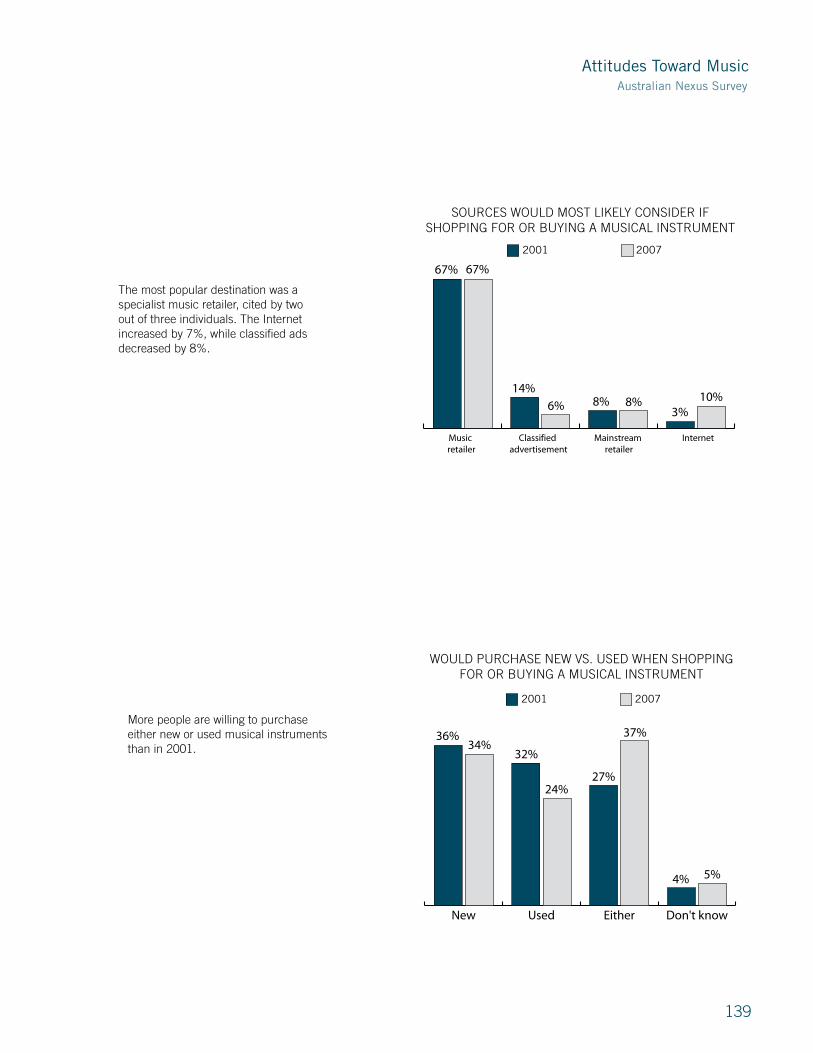
Attitudes Toward MusicAustralian Nexus Survey
1�9
SOURCES WOULD MOST LIKELY CONSIDER IF SHOPPING FOR OR BUYING A MUSICAL INSTRUMENT
67%
3%
14%
67%
8%
InternetMainstream retailer
Classified advertisement
Music retailer
6% 8% 10%
20072001
The most popular destination was a specialist music retailer, cited by two out of three individuals. The Internet increased by �%, while classified ads decreased by 8%.
Don't knowEitherUsedNew
WOULD PURCHASE NEW VS. USED WHEN SHOPPINGFOR OR BUYING A MUSICAL INSTRUMENT
24%
37%
5%
34%
20072001
32%
27%
4%
36%More people are willing to purchase either new or used musical instruments than in �001.
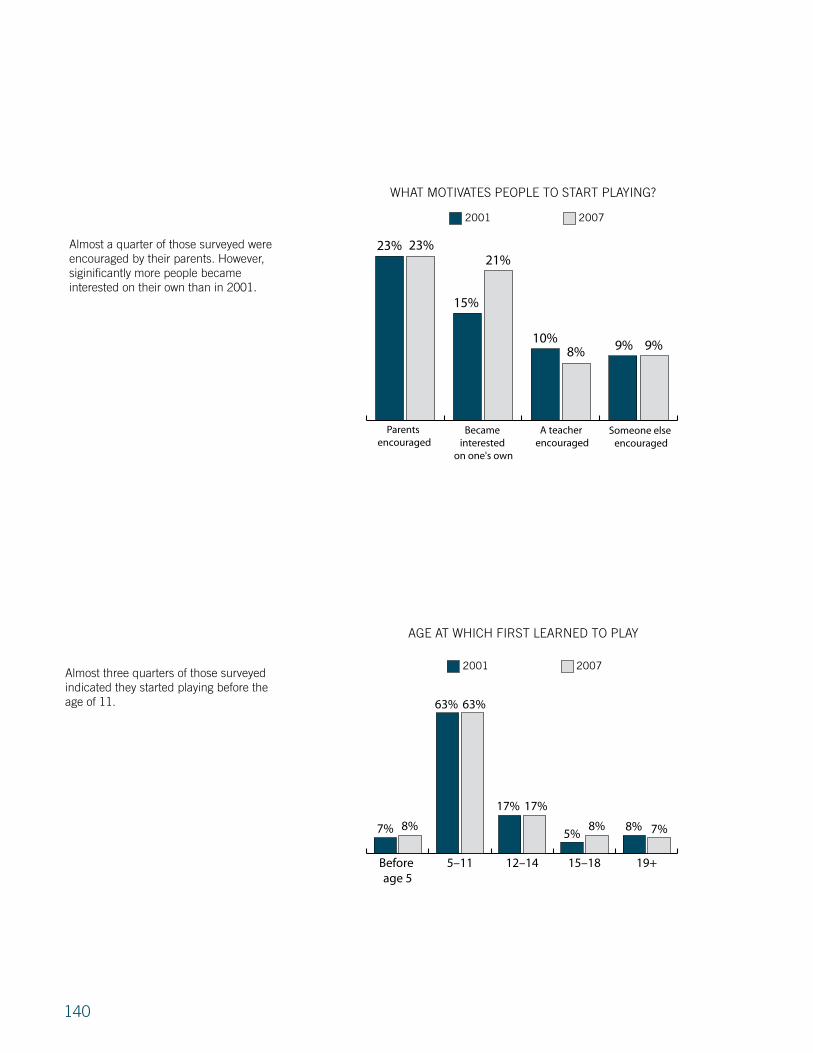
1�0
19+15–1812–145–11Before age 5
AGE AT WHICH FIRST LEARNED TO PLAY
7%
63%
17%
5%8% 7%8%
20072001
63%
8%
17%
�lmost three quarters of those surveyed indicated they started playing before the age of 11.
WHAT MOTIVATES PEOPLE TO START PLAYING?
10% 9%
23%
15%
Someone else encouraged
A teacher encouraged
Became interested
on one's own
Parents encouraged
20072001
9%8%
21%23%�lmost a quarter of those surveyed were
encouraged by their parents. However,siginificantly more people became interested on their own than in �001.

Attitudes Toward MusicAustralian Nexus Survey
1�1
AGREEMENT WITH ATTITUDES ABOUT LEARNINGTO PLAY (All current and former players)
Percentage who “completely or mostly agree”
93%86% 83%
76%
20072001
90%82%
Playing a musical
instrument is relaxing
Playing a musical
instrument is fun
Playing a musical
instrument is a good means of expression
PERCENT OF RESPONDENTS WHO AGREEPercentage who “completely or mostly agree”
83%75%
49%
26% 25%
20072001
68%
79%
58%
Too old to learn to play a
musical instrument
Would like to learn to play a
musical instrument
Wish had learned to
play a musical instrument
Music is a very important part of life
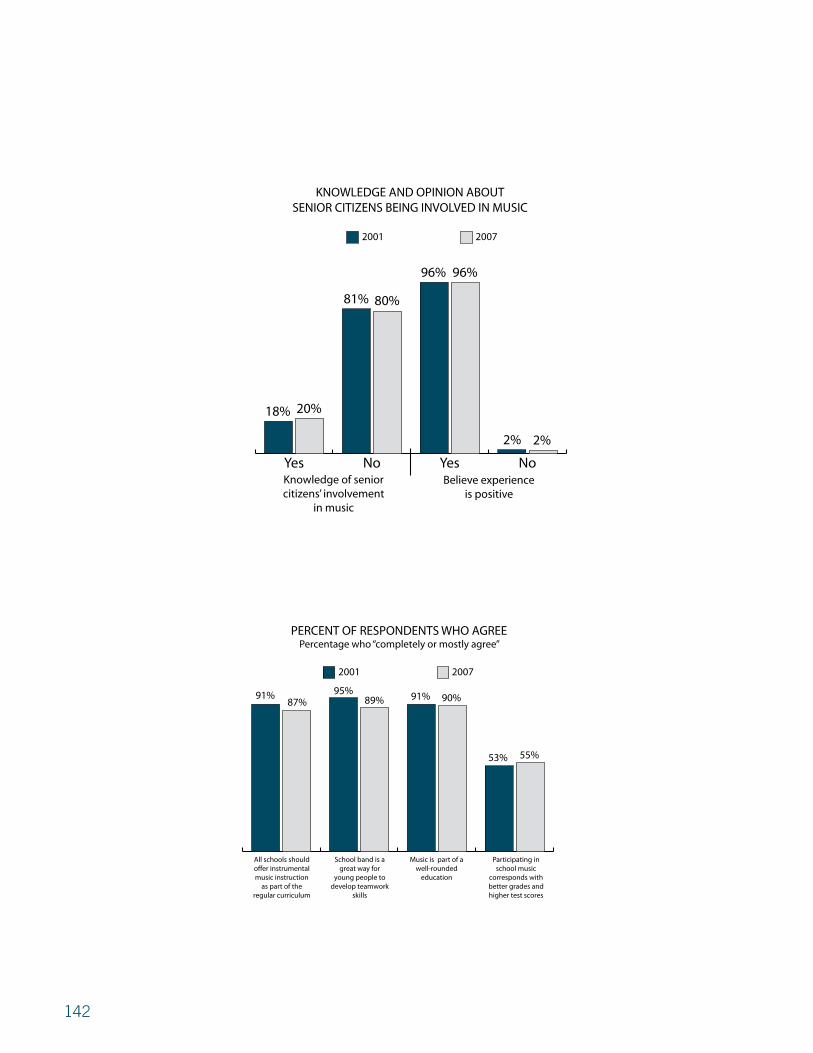
1��
PERCENT OF RESPONDENTS WHO AGREEPercentage who “completely or mostly agree”
91% 95% 91%
20072001
89%87% 90%
All schools should offer instrumental music instruction
as part of the regular curriculum
School band is a great way for
young people to develop teamwork
skills
Music is part of a well-rounded
education
Participating in school music
corresponds with better grades and higher test scores
55%53%
NoYesNoYes
20072001
KNOWLEDGE AND OPINION ABOUTSENIOR CITIZENS BEING INVOLVED IN MUSIC
2%
18%
96%
81%
Knowledge of senior citizens’ involvement
in music
Believe experience is positive
20%
80%
96%
2%

Attitudes Toward MusicAustralian Nexus Survey
1��
WHY SHOULD CHILDREN LEARNTO PLAY MUSICAL INSTRUMENTS?
Percentage who “completely or mostly agree”
86%
20072001
92%
82% 83%
It helps chidren make friends
It teaches children
discipline
AGREEMENT WITH OTHER ATTITUDES ABOUT REASONSA CHILD SHOULD LEARN TO PLAY MUSICAL INSTRUMENTS
Percentage who “completely or mostly agree”
95%
20072001
82%86%91%
It helps develop a child's creativity
It helps develop a child's overall
intellectual development

1��
AGREEMENT WITH ATTITUDESABOUT MUSIC AT THE PRESCHOOL LEVEL
Percentage who “completely or mostly agree”
79% 79%84%
20072001
77%
Music plays a significant role in preschool
development
It's important for children to engage in musical activities in daycare/preschool
PERCENT OF RESPONDENTS WHO AGREEPercentage who “completely or mostly agree”
54% 54% 54%
20072001
53%
Learning a musical instrument helps you
do better in other subjects, like math
and science
Teenagers who play an instrument are less
likely to have discipline problems

Attitudes Toward MusicAustralian Nexus Survey
1��
Don't Know
12+5–111–4Before Age 1
AGE BELIEVE CHILDRENSHOULD BE EXPOSED TO MUSIC
43%
33%
19%
4%1%
The most common view was that children should be exposed to music by the age of 1 (��%). More than three-quarters (�6%) believe children should be exposed to music by age �.
WHAT MUSICAL INSTRUMENTS DO YOU PLAY?
Electric Keyboard
Drums
Piano
Other Instrument
Guitar or Bass
10%
14%
32%
33%
39%
Guitars or basses are the most popular instruments, used by more than a third of players.
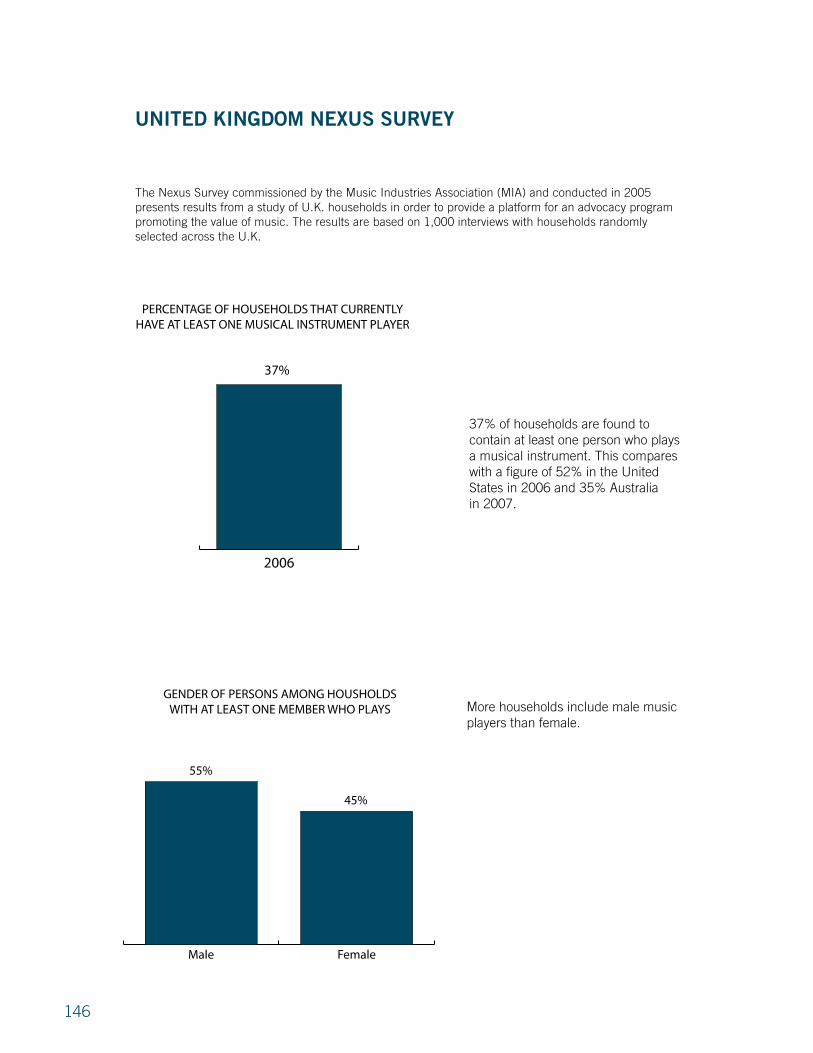
1�6
2006
PERCENTAGE OF HOUSEHOLDS THAT CURRENTLYHAVE AT LEAST ONE MUSICAL INSTRUMENT PLAYER
37%
��% of households are found to contain at least one person who plays a musical instrument. This compares with a figure of ��% in the United States in �006 and ��% �ustralia in �00�.
The Nexus Survey commissioned by the Music Industries �ssociation (MI�) and conducted in �00� presents results from a study of U.K. households in order to provide a platform for an advocacy program promoting the value of music. The results are based on 1,000 interviews with households randomly selected across the U.K.
United KingdoM nexUs sUrvey
FemaleMale
GENDER OF PERSONS AMONG HOUSHOLDSWITH AT LEAST ONE MEMBER WHO PLAYS
55%
45%
More households include male music players than female.

Attitudes Toward MusicU.K. Nexus Survey
1��
50+ yrs.35–49 yrs.18–34 yrs.5–17 yrs.
AGE OF PERSONS AMONG HOUSEHOLDS WITHAT LEAST ONE MEMBER WHO PLAYS
24%21%
24%
31%
FemaleMaleAll Players
WHO DECIDES WHAT INSTRUMENT SHOULD BE PLAYED?
20%
73%78%
82%
Player decides Someone else decides/ joint decision
24%17%
More males than females decide for themselves what type of instrument they play.
The largest number of U.K. music players are between the ages of �� and �9 years.
Numbers do not total 100% due to some participants answering they did not know who decided.
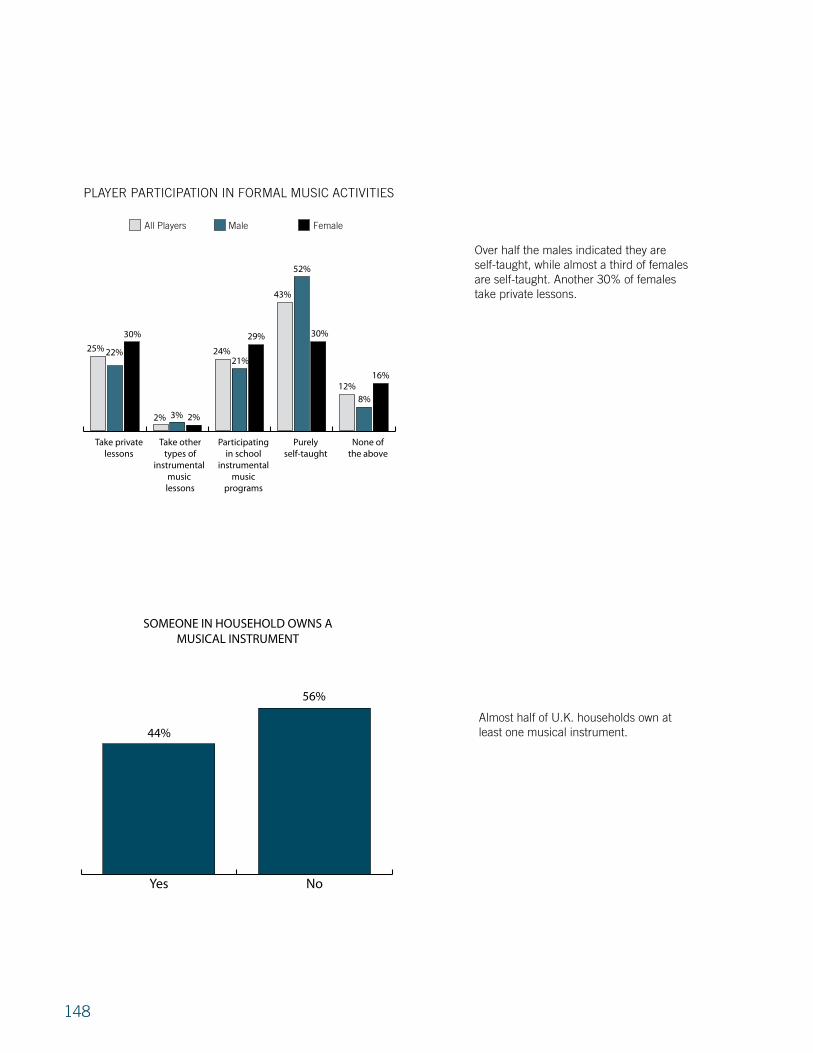
1�8
PLAYER PARTICIPATION IN FORMAL MUSIC ACTIVITIES
None ofthe above
Purelyself-taught
Participatingin school
instrumentalmusic
programs
Take othertypes of
instrumental music lessons
Take privatelessons
All Players Male Female
25%
30%
22%21%
24%
2% 2%3%
29%
16%
8%12%
30%
52%
43%
NoYes
SOMEONE IN HOUSEHOLD OWNS A MUSICAL INSTRUMENT
44%
56%
�lmost half of U.K. households own at least one musical instrument.
Over half the males indicated they are self-taught, while almost a third of females are self-taught. �nother �0% of females take private lessons.

Attitudes Toward MusicU.K. Nexus Survey
1�9
Annual IncomeEducation
38%
19% 19%
33%
24%
SOMEONE IN HOUSEHOLD OWNS A MUSICAL INSTRUMENT (By education and income)
All individual respondents 18+ years
Secondary School
Tech/ Trade College
University
Under £20,000 pa*
£ 20,000–£ 40,000 pa*
*pa: per annum (annually)
Over £40,000 pa*
23%
The highest percentage of musical instruments are owned by households with university degrees and those with incomes over £�0,000 per year.
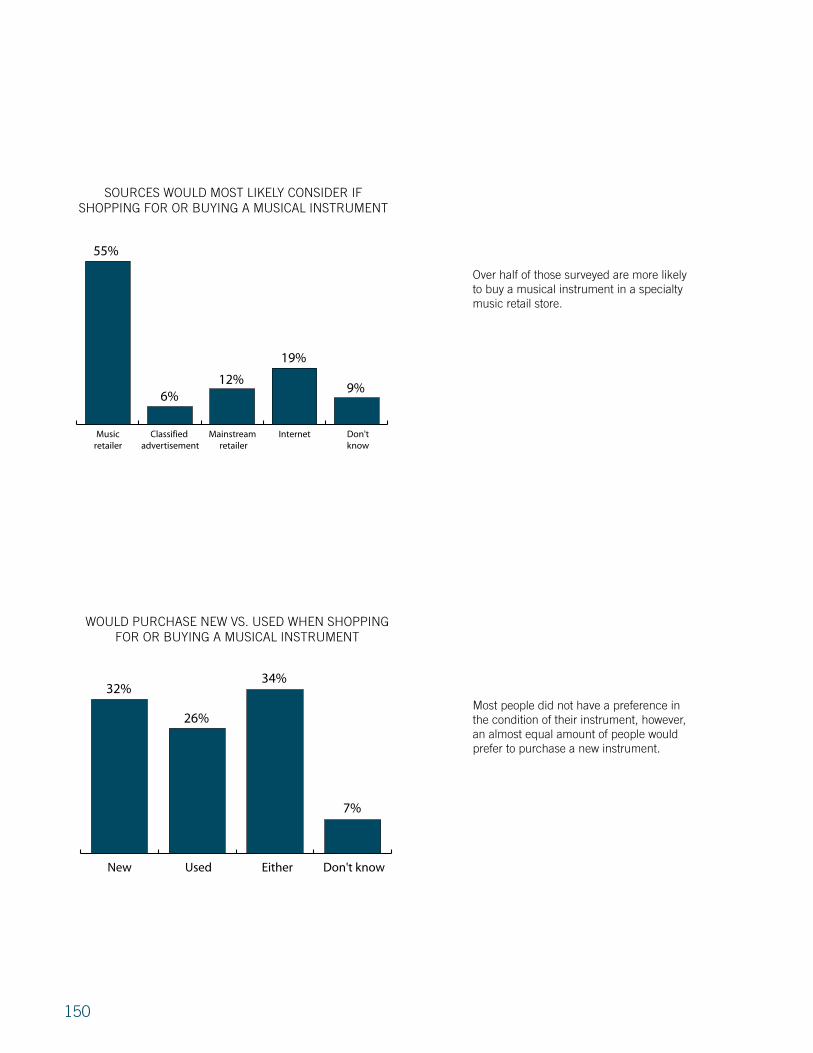
1�0
SOURCES WOULD MOST LIKELY CONSIDER IF SHOPPING FOR OR BUYING A MUSICAL INSTRUMENT
6%
19%
55%
12%9%
Don'tknow
InternetMainstream retailer
Classified advertisement
Musicretailer
WOULD PURCHASE NEW VS. USED WHEN SHOPPINGFOR OR BUYING A MUSICAL INSTRUMENT
26%
7%
32%34%
Don't knowEitherUsedNew
Over half of those surveyed are more likely to buy a musical instrument in a specialty music retail store.
Most people did not have a preference in the condition of their instrument, however, an almost equal amount of people would prefer to purchase a new instrument.

Attitudes Toward MusicU.K. Nexus Survey
1�1
AGE AT WHICH FIRST LEARNED TO PLAY
17%
4%
57%
5%
50+30–4919–2915–1812–145–11Before Age 5
10%6%
0%
WHAT MOTIVATES PEOPLE TO START PLAYING?
41%
6%
27%
9%
Someone else encouraged
A teacher encouraged
Became interested
on one's own
Parents encouraged
Most music makers decided to start playing an instrument on their own.
Over half of the respondents started playing between the ages of � and 11.

1��
AGE AT WHICH FIRST LEARNED TO PLAY (By gender)
21%
5%
55%
9%
50+30–4919–2915–1812–145–11Before age 5
10%3% 0%
Male Female
3%
80%
1% 1% 1%4% 0%
HOW YOU FIRST LEARNED TO PLAY
32%
3%
34%
6%
16%
6%3%
Now Play Used to Play
8%
22%
3% 2%
Private lessons
with a paid teacher,
one-to-one
Self-taught
Lessons at school as
part of the curriculum
Parent (or relation) taught
you
Private lessons
with a paid teacher, in a group/
class
Private lessons,
other
Another way of learning
Friend taught
you
4%8%
10%
50%
25%
� third of all current players (��%) first learned to play through private lessons from a paid teacher one-to-one. On the other hand, those who had lessons as part of their school curriculum are more likely to be lapsed players.
Females are more likely to learn to play at an earlier age than males, with 8�% learning by age 11. Only �8% of males learned by age 11.
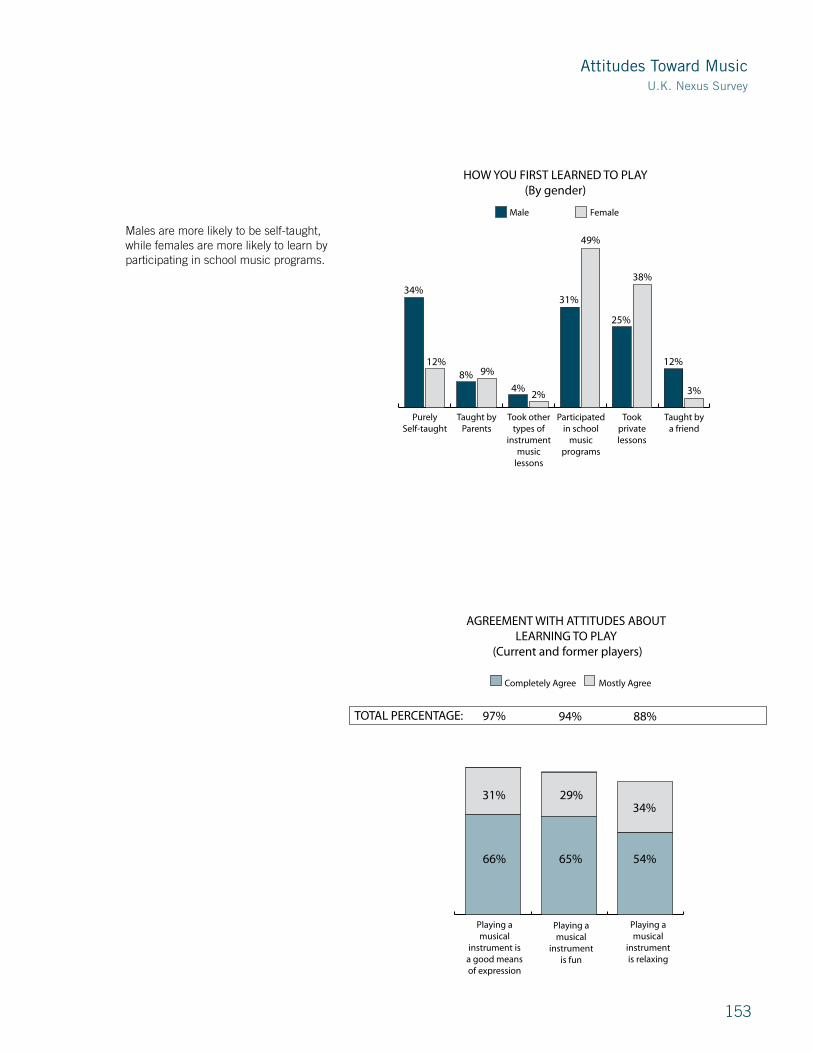
Attitudes Toward MusicU.K. Nexus Survey
1��
AGREEMENT WITH ATTITUDES ABOUT LEARNING TO PLAY
(Current and former players)
Completely Agree Mostly Agree
Playing a musical
instrument is relaxing
Playing a musical
instrument is fun
Playing a musical
instrument is a good means of expression
TOTAL PERCENTAGE: 94% 88%97%
31% 29%34%
66% 65% 54%
HOW YOU FIRST LEARNED TO PLAY(By gender)
31%34%
8%12%
3%
Male Female
12%
2%4%
9%
PurelySelf-taught
Taught by Parents
Took other types of
instrument music
lessons
Participated in school
music programs
Tookprivate lessons
Taught by a friend
49%
38%
25%
Males are more likely to be self-taught, while females are more likely to learn by participating in school music programs.

1��
PERCENTAGE OF RESPONDENTS WHO AGREE
Completely Agree Mostly Agree
Too old to learn to play
a musical instrument
Playing a musical
instrument is something always glad you learned
Music brings the family together
Music is a very important part of life
TOTAL PERCENTAGE: 82% 70% 92% 41%
30%
39%
21%
52%
31%
71% 17%
24%
PERCENTAGE OF RESPONDENTS WHO AGREE
(All those who never started playing)
Completely Agree Mostly Agree
Wish had learned to play a musical instrument
Would like to learn to play a musical instrument
TOTAL PERCENTAGE: 71% 47%
28%
43%
20%
27%

Attitudes Toward MusicU.K. Nexus Survey
1��
AGREEMENT WITH ATTITUDES ABOUT MUSIC EDUCATION IN SCHOOLS
Completely Agree Mostly Agree
Music should be taught as a core subject
School band is a
great way for young people
to develop teamwork
skills
Schools should provide
opportunities for music
makers to use facilities
outside of traditional
school hours
Would be proud to be in a school band or orchestra
Participating in school
music corresponds with better grades and higher test
scores
TOTAL PERCENTAGE: 73% 97% 95% 60% 56%
26%
27% 29%
27%31%
47%
70% 66%
33%25%
KNOWLEDGE AND OPINION ABOUT SENIOR CITIZENS BEING INVOLVED IN MUSIC
Knowledge of senior citizens involvement
in music
98%
Believe experience is positive
Yes No
13%2%
84%

1�6
WHY SHOULD CHILDREN LEARN TO PLAY MUSICAL INSTRUMENTS?
Completely Agree Mostly Agree
It's an activity a child can
enjoy all his or her life
It helps children
make friends
It teaches children
discipline
It helps instill appreciation of arts and
culture
88% 82% 91%TOTAL PERCENTAGE: 96%
72%
24%
50%
38%
41%
41%
55%
36%
AGREEMENT WITH OTHER ATTITUDES ABOUT REASONS A CHILD SHOULD LEARN TO PLAY MUSICAL INSTRUMENTS
Completely Agree Mostly Agree
68%
30%
71%
25%
61%
33%
44%
40%
It provides a sense of
accomplish-ment
Performing in front of
others helps develop
poise andconfidence
It helps develop a
child's creativity
It helps develop a
child's overall intellectual
development
TOTAL PERCENTAGE: 98% 96% 94% 88%
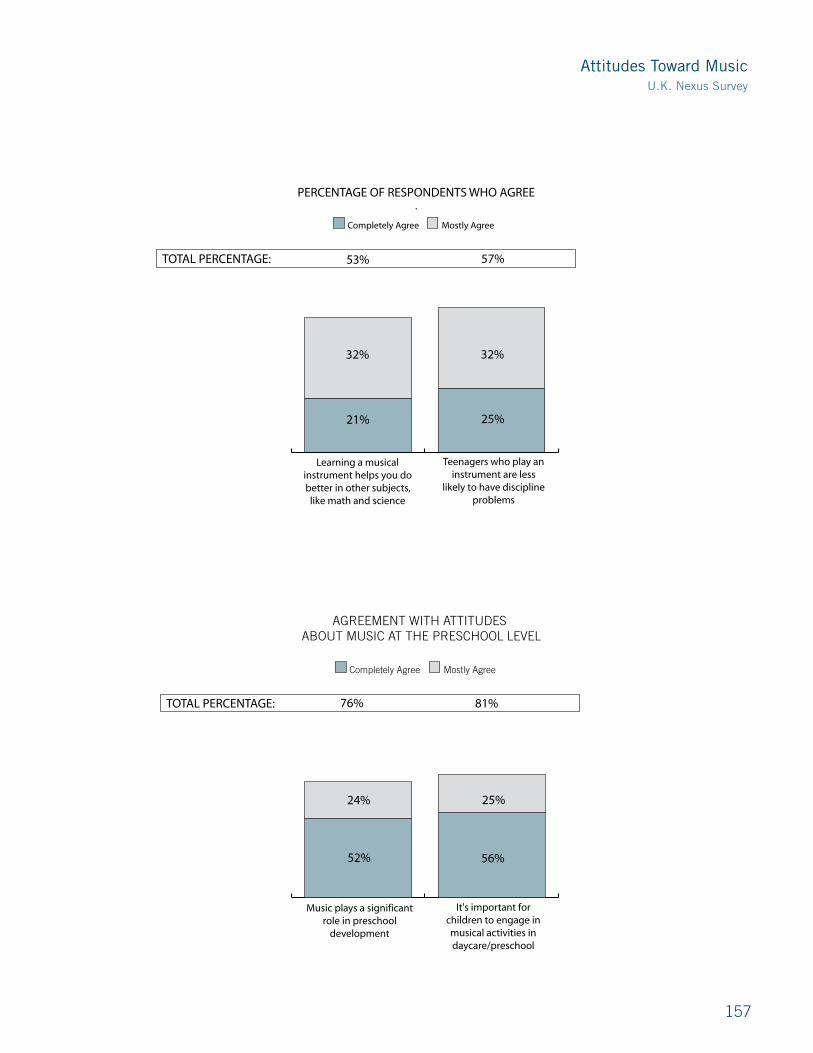
Attitudes Toward MusicU.K. Nexus Survey
1��
PERCENTAGE OF RESPONDENTS WHO AGREE.
Completely Agree Mostly Agree
Learning a musical instrument helps you do better in other subjects,
like math and science
Teenagers who play an instrument are less
likely to have discipline problems
53% 57%TOTAL PERCENTAGE:
32%
21%
32%
25%
AGREEMENT WITH ATTITUDES ABOUT MUSIC AT THE PRESCHOOL LEVEL
Completely Agree Mostly Agree
Music plays a significant role in preschool
development
It's important for children to engage in musical activities in daycare/preschool
76% 81%TOTAL PERCENTAGE:
24%
52%
25%
56%

1�8
AGE BELIEVE CHILDREN SHOULD LEARN MUSIC
11+10987654321
3% 4%
12%15%
36%
9% 10%6%
1% 2% 1%
WHAT MUSICAL INSTRUMENTS DO YOU PLAY? (Top 11 kinds)
Guitar–AcousticPiano–UprightGuitar–Electric
DrumsKeyboard–Electric
Recorder
FluteClarinet
Guitar–BassPiano–Grand
Violin
22%
21%
9%
6%6%6%
4%3%3%3%
3%
More than a third of the respondents (�6%) believe children should learn to play music by the age of �.
�coustic guitars are the most popular instrument, followed closely by the upright piano.

1�9
U.s. gALLUP PoLL, United KingdoM nexUs And AUstrALiAn nexUs dAtA CoMPArison
AustraliaU.K.U.S.
PERCENTAGE OF HOUSEHOLDS THAT CURRENTLYHAVE AT LEAST ONE MUSICAL INSTRUMENT PLAYER
AustraliaU.K.U.S.
52%
35%37%
FemaleMale
AustraliaU.K.U.S.
GENDER OF PERSONS AMONG HOUSEHOLDS WITH AT LEAST ONE MEMBER WHO PLAYS
49%
55% 53% 51%
45% 47%
While more than a third of the U.K. and �ustralia’s populations are music makers, slightly more than half of the U.S. population plays musical instruments.
More females than males play musical instruments in the U.S., while more males than females play in the U.K. and �ustralia.
The following section compares the U.S. Gallup Poll (�006), the U.K. Nexus Survey (�00�) and the �ustralian Nexus Survey (�00�).

160
50+35–4918–345–17
AustraliaU.K.U.S.
AGE OF PERSONS AMONG HOUSEHOLDS WITH AT LEAST ONE MEMBER WHO PLAYS
30%
15%
20%
31%
23%24%24%
32%
37%
24%
19%21%
Someone else decided/joint decisionPlayer decided
AustraliaU.K.U.S.
WHO DECIDED WHAT INSTRUMENT SHOULD BE PLAYED?
71%
28%
78%
20%
78%
22%
Fewer people in �ustralia decide for themselves what instrument to play.
The largest age group in the U.S. is 18–�� years. The largest groups for the U.K. and �ustralia are the ��–�9 and the �–1� age groups, respectively.

161
Attitudes Toward MusicU.S., U.K. and Australia Data Comparison
Participating in school instrumental
music programs
Take other types of intrumental music lessons
Take private lessons
AustraliaU.K.U.S.
PLAYER PARTICIPATION IN FORMAL MUSIC ACTIVITIES
24%
5%
18%
25%
2%
24%23%
12%
41%
AustraliaU.K.U.S.
AustraliaU.K.U.S.
SOMEONE IN HOUSEHOLD OWNS AMUSICAL INSTRUMENT
51%
44%
54%
In the U.S., more people participate in school programs, while slightly more people take private lessons than particpate in school music programs in the U.K. and �ustralia.
More households in �ustralia own musicalinstruments than in the U.S. and U.K.

16�
InternetMainstream Retailer
Classified Advertisement
Music Retailer
AustraliaU.K.U.S.
SOURCES WOULD MOST LIKELY CONSIDER IF SHOPPING FOR OR BUYING A MUSICAL INSTRUMENT
67%
6%8% 10%
55%
6%12%
9%
52%
12%
19% 17%
Don't KnowEitherNewUsed
AustraliaU.K.U.S.
WOULD PURCHASE NEW VS. USED WHEN SHOPPINGFOR OR BUYING A MUSICAL INSTRUMENT
24%
34%37%
5%
32%
26%
34%
7%
37%
46%
17%
0%
People from all three regions are significantly more likely to go to specialty music retail stores from all three regions.
People in the U.S. are more likely to buy new, while those in the U.K. and �ustralia will buy either new or used.
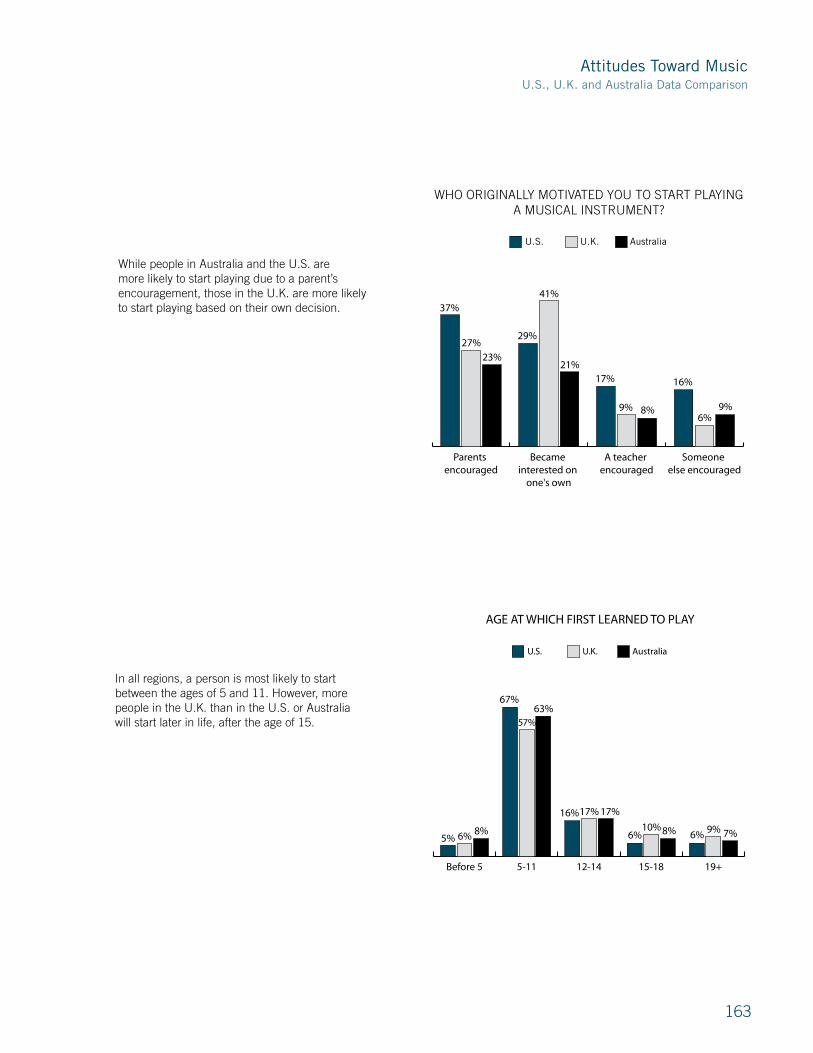
16�
Attitudes Toward MusicU.S., U.K. and Australia Data Comparison
Someone else encouraged
A teacher encouraged
Became interested on
one's own
Parents encouraged
AustraliaU.K.U.S.
WHO ORIGINALLY MOTIVATED YOU TO START PLAYING A MUSICAL INSTRUMENT?
23%21%
8% 9%
27%
41%
9%6%
37%
29%
17% 16%
While people in �ustralia and the U.S. are more likely to start playing due to a parent’s encouragement, those in the U.K. are more likely to start playing based on their own decision.
19+15-1812-145-11Before 5
AustraliaU.K.U.S.
AGE AT WHICH FIRST LEARNED TO PLAY
8%
63%
17%
8% 7%6%
57%
17%
10% 9%5%
67%
16%
6% 6%
In all regions, a person is most likely to start between the ages of � and 11. However, more people in the U.K. than in the U.S. or �ustralia will start later in life, after the age of 1�.

16�
Playing a musical instrument is relaxing
Playing a musical instrument is fun
Playing a musical instrument is a good means of expression
AustraliaU.K.U.S.
AGREEMENT WITH ATTITUDES ABOUT LEARNING TO PLAY MUSICAL INSTRUMENTS (All current and former players)
Answers were combined to include Completely Agree and Mostly Agree
90%
82%76%
97% 94%88%
96% 93% 92%
Too old to learn to play a musical instrument
Music is a very important part of my life
AustraliaU.K.U.S.
AGREEMENT WITH ATTITUDES ABOUT LEARNING TO PLAY MUSICAL INSTRUMENTS (All current and former players)
Answers were combined to include Completely Agree and Mostly Agree
79%
29%
82%
41%
85%
23%
Significantly more people in the U.K. than in the U.S. or �ustralia said they are too old to learn to play.

16�
Attitudes Toward MusicU.S., U.K. and Australia Data Comparison
Would like to learn to play a musical instrument
Wish had learned to play a musical instrument
AustraliaU.K.U.S.
AGREEMENT WITH ATTITUDES ABOUT LEARNING TO PLAY MUSICAL INSTRUMENTS (All those who never started playing)
Answers were combined to include “Completely Agree” and “Mostly Agree”
68%
58%
71%
47%
82%
67%
More people in the U.S. said they wished they learned to play and would like to play a musical instrument.
Believe experience is positiveKnowledge and opinion about senior citizens being
involved in music
AustraliaU.K.U.S.
KNOWLEDGE AND OPINION ABOUT SENIOR CITIZENS BEING INVOLVED IN MUSIC
20%
96%
13%
98%
16%
100%
�ustralians have the highest amount of knowledge regarding senior citizens’ involvement in music.
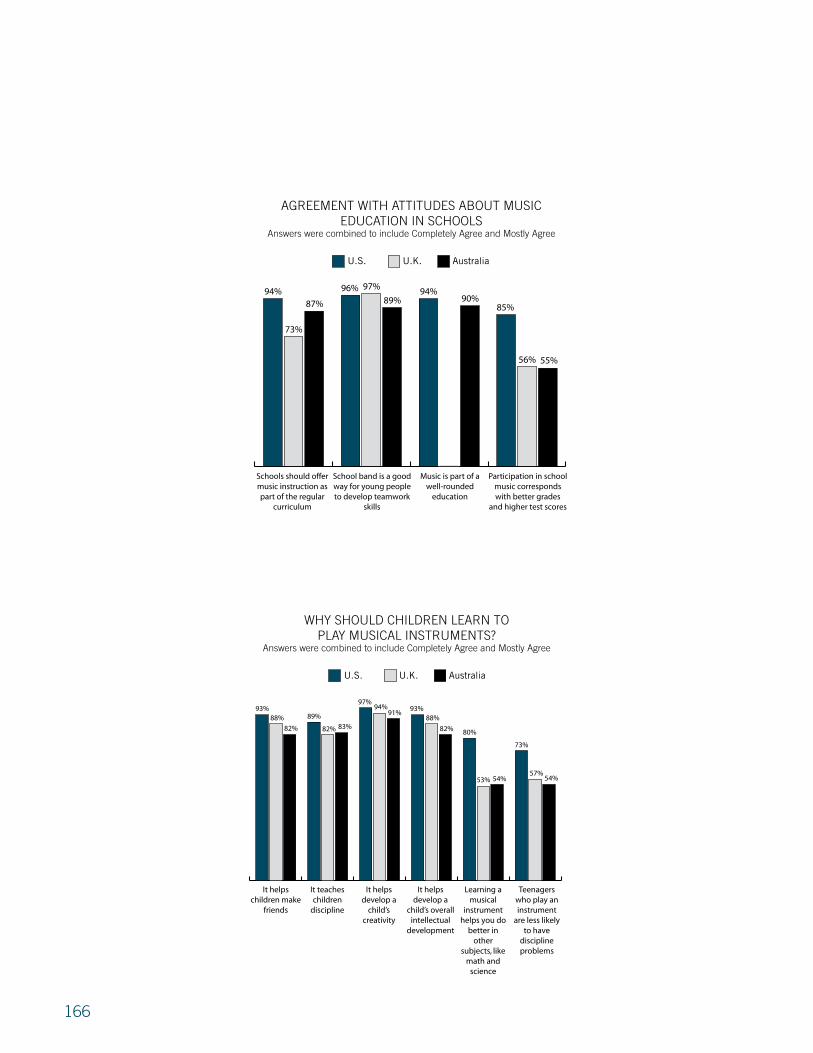
166
AustraliaU.K.U.S.
AGREEMENT WITH ATTITUDES ABOUT MUSIC EDUCATION IN SCHOOLS
Answers were combined to include Completely Agree and Mostly Agree
Schools should offer music instruction as part of the regular
curriculum
School band is a good way for young people to develop teamwork
skills
Music is part of a well-rounded
education
Participation in school music corresponds with better grades
and higher test scores
87% 89% 90%
55%
73%
97%
56%
94% 96% 94%
85%
AustraliaU.K.U.S.
WHY SHOULD CHILDREN LEARN TO PLAY MUSICAL INSTRUMENTS?
Answers were combined to include Completely Agree and Mostly Agree
It helps children make
friends
It teaches children
discipline
It helps develop a
child’s creativity
It helps develop a
child’s overall intellectual
development
Learning a musical
instrument helps you do
better in other
subjects, like math and
science
Teenagers who play an instrument
are less likely to have
discipline problems
82% 83%
91%
82%
54% 54%
88%
82%
94%
88%
53%57%
93%89%
97%93%
80%
73%
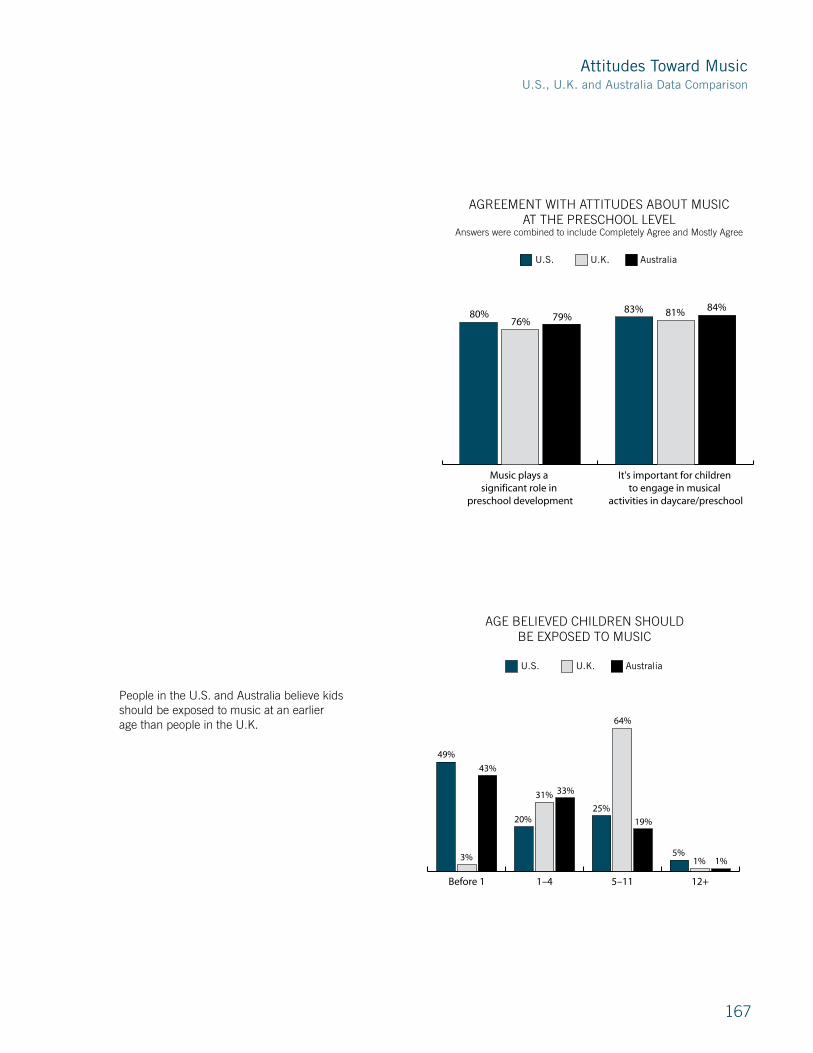
16�
Attitudes Toward MusicU.S., U.K. and Australia Data Comparison
It's important for children to engage in musical
activities in daycare/preschool
Music plays a significant role in
preschool development
AustraliaU.K.U.S.
AGREEMENT WITH ATTITUDES ABOUT MUSIC AT THE PRESCHOOL LEVEL
Answers were combined to include Completely Agree and Mostly Agree
79%84%
76%81%80% 83%
12+5–111–4Before 1
AustraliaU.K.U.S.
AGE BELIEVED CHILDREN SHOULD BE EXPOSED TO MUSIC
43%
33%
19%
1%3%
31%
64%
1%
49%
20%25%
5%
People in the U.S. and �ustralia believe kids should be exposed to music at an earlier age than people in the U.K.

168
Attitudes Toward Music
Other Instrument
Keyboard-Electric
Drums/Percussion
Guitar or Bass
Piano
AustraliaU.K.U.S.
WHICH MUSICAL INSTRUMENTS DO YOU PLAY?
32%
39%
14%
10%
5%
24%
34%
6% 6%
30%31%28%
13%
1%
27%
Guitar and bass are the most popular instruments in the U.K. and �ustralia, while piano is the most popular instrument in the U.S.

MUsiC retAiLingCost of doing business
The Cost of Doing Business section profiles the key trends and compares some of the components that contribute to the profitability of each type of retail operation.
The Cost of Doing �usiness Survey is a program funded by N�MM in which N�MM Members contribute business information to Industry Insights (a third party research company), which aggregates the information and provides N�MM with the summary and commentary published in this edition. N�MM personnel do not see any individual company information.
This is a very small excerpt from the annual Industry Performance Report, which provides the most comprehensive overview of the financial status of retailing in the music products industry in the United States today. The full report provides an in-depth analysis of each segment—Full Line, Keyboard, School Music, Combo/Pro �udio and Print Music—not only by sales volume and store type but also by geographic market breakdown.
Each segment examines the gross margin and inventory turnover you can expect from a wide range of music products, from pianos to guitars and sound reinforcement to print music and accessories. It shows how much you should pay for retail space and the amount of revenue that you should be able to generate per square foot. It also examines owner’s compensation levels, how much salaries should be as a percentage of total expenses, the cost of personnel and how much revenue each employee should be able to generate. In addition, the report explains how to calculate key performance ratios, how to record rental transactions, how to diagnose your company’s financial health and calculate how much your dead inventory is costing you.
This is the report that successful retailers use to increase their profitability and outperform their competitors. It is also the document your bank manager needs to see if you plan to expand your product lines, remodel your stores, or open a new store. The Industry Performance Report is the essential guide to profitability in today’s music retail industry.
The latest Industry Performance Report is now available for purchase by calling N�MM at 800-�6�-6�66. N�MM Retail Members can receive a free copy of next year’s edition by completing the confidential “Cost of Doing �usiness” survey. For more information, contact the Membership department at [email protected].

1�0
0
2
4
6
8
10
12
Combo/Pro Audio
School Music Store
Keyboard Store
Full-Line Store
2005 at a Glance(Percentage)
0
2
4
6
8
10
12
14
16
18
20
'05'04'03'02'01'00'99'98'97'96'95
Combo / Pro Audio(Percentage)
10
15
20
04 03 02 01 00 99 98 97 96 95
Uni
ts x
1,0
00
Import Value Units
0
2
4
6
8
10
12
14
16
18
20
'05'04'03'02'01'00'99'98'97'96'95
Full-Line Store(Percentage)
10
15
20
04 03 02 01 00 99 98 97 96 95
Uni
ts x
1,0
00
Import Value Units
0
2
4
6
8
10
12
14
16
18
20
'05'04'03'02'01'00'99'98'97'96'95
Keyboard Store(Percentage)
10
15
20
04 03 02 01 00 99 98 97 96 95
Uni
ts x
1,0
00
Import Value Units
0
2
4
6
8
10
12
14
16
18
20
'05'04'03'02'01'00'99'98'97'96'95
School Music Store(Percentage)
10
15
20
04 03 02 01 00 99 98 97 96 95
Uni
ts x
1,0
00
Import Value Units
Profitability—EBIT to Total Assets
ProfitabilityEBIT to Total Assets
E�IT, Earnings Before deduction of interest payments and income taxes, represents the amount of cash that a company will be able to use to pay off creditors (also called operating profit). E�IT to Total �ssets is the return on total assets, which measures the efficiency with which the long-term capital has been employed. Calculation: E�IT divided by Total �ssets.
EBIT: Earnings Before deduction of Interest payments and income Taxes
Profitability – EBIT to Total Assets
Profitability (earnings before interest and taxes as a percentage of total assets) improved for most music retailers in �00�. Keyboard and School Music retailers showed the most improvement compared to �00�. Full Line stores were the only store type to report declining profitability, hitting a 10-year low.
Profitability—Gross Margin
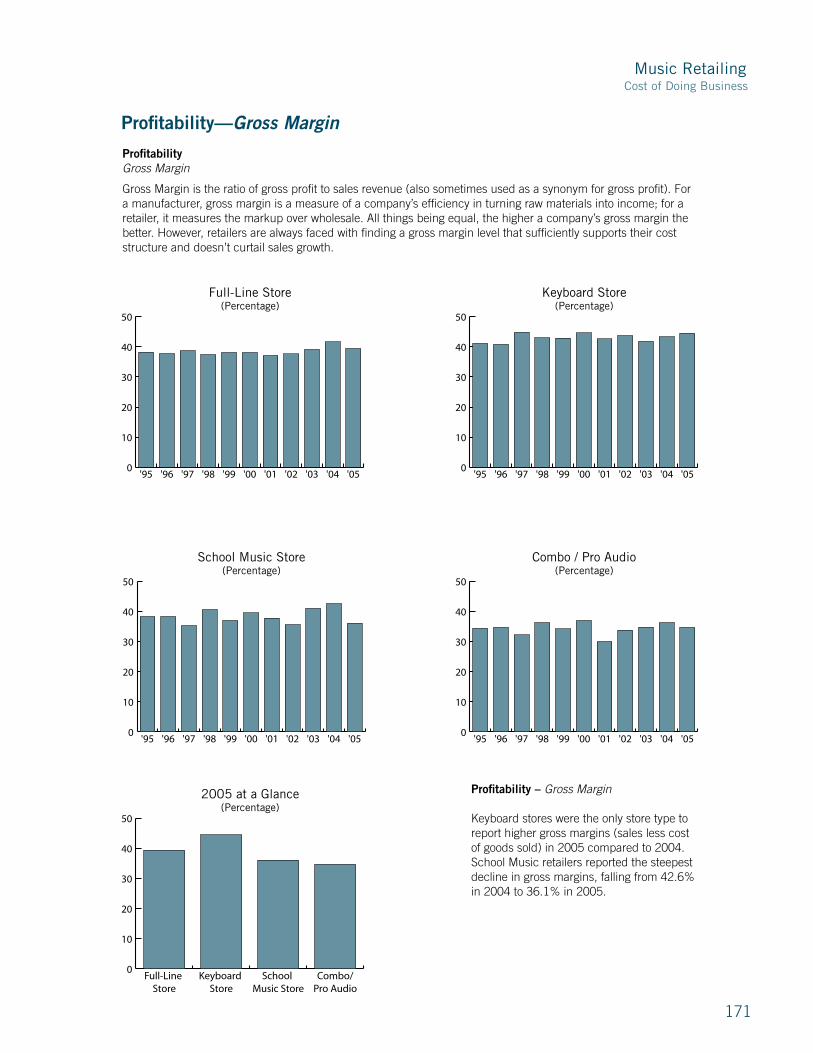
Music Retailing
1�1
Cost of Doing Business
0
10
20
30
40
50
Combo/Pro Audio
School Music Store
Keyboard Store
Full-Line Store
2005 at a Glance(Percentage)
0
10
20
30
40
50
'05'04'03'02'01'00'99'98'97'96'95
Combo / Pro Audio(Percentage)
10
15
20
04 03 02 01 00 99 98 97 96 95
Uni
ts x
1,0
00
Import Value Units
0
10
20
30
40
50
'05'04'03'02'01'00'99'98'97'96'95
Full-Line Store(Percentage)
10
15
20
04 03 02 01 00 99 98 97 96 95
Uni
ts x
1,0
00
Import Value Units
0
10
20
30
40
50
'05'04'03'02'01'00'99'98'97'96'95
Keyboard Store(Percentage)
10
15
20
04 03 02 01 00 99 98 97 96 95
Uni
ts x
1,0
00
Import Value Units
0
10
20
30
40
50
'05'04'03'02'01'00'99'98'97'96'95
School Music Store(Percentage)
10
15
20
04 03 02 01 00 99 98 97 96 95
Uni
ts x
1,0
00
Import Value Units
Profitability – Gross Margin
Keyboard stores were the only store type to report higher gross margins (sales less cost of goods sold) in �00� compared to �00�. School Music retailers reported the steepest decline in gross margins, falling from ��.6% in �00� to �6.1% in �00�.
ProfitabilityGross Margin
Gross Margin is the ratio of gross profit to sales revenue (also sometimes used as a synonym for gross profit). For a manufacturer, gross margin is a measure of a company’s efficiency in turning raw materials into income; for a retailer, it measures the markup over wholesale. �ll things being equal, the higher a company’s gross margin the better. However, retailers are always faced with finding a gross margin level that sufficiently supports their cost structure and doesn’t curtail sales growth.
Profitability—Gross Margin

1��
0.0
0.5
1.0
1.5
2.0
2.5
Combo/ Pro Audio
School Music Store
Keyboard Store
Full-Line Store
2005 at a Glance(Ratio)
0.0
0.5
1.0
1.5
2.0
2.5
'05'04'03'02'01'00'99'98'97'96'95
Combo / Pro Audio(Ratio)
10
15
20
04 03 02 01 00 99 98 97 96 95
Uni
ts x
1,0
00
Import Value Units
0.0
0.5
1.0
1.5
2.0
2.5
'05'04'03'02'01'00'99'98'97'96'95
Full-Line Store(Ratio)
10
15
20
04 03 02 01 00 99 98 97 96 95
Uni
ts x
1,0
00
Import Value Units
0.0
0.5
1.0
1.5
2.0
2.5
'05'04'03'02'01'00'99'98'97'96'95
Keyboard Store(Ratio)
10
15
20
04 03 02 01 00 99 98 97 96 95
Uni
ts x
1,0
00
Import Value Units
0.0
0.5
1.0
1.5
2.0
2.5
'05'04'03'02'01'00'99'98'97'96'95
School Music Store(Ratio)
10
15
20
04 03 02 01 00 99 98 97 96 95
Uni
ts x
1,0
00
Import Value Units
inventory Productivity – Inventory Turnover
Inventory turnover (cost of goods sold divided by average inventory) rates in �00� showed little change for most music retailers compared to �00�. The exception was School Music retailers, who reported an increase in their inventory turnover ratefrom 1.�x in �00� to 1.�x in �00�.
inventory Productivity Inventory Turnover
Inventory Turnover is effectively measured by computing the cost of goods sold compared to the average inventory. It gives the number of times that the stock has been turned over in the period, which indicates how fast stock is moving. It is also useful for comparing your firm to the industry average over time, as well as comparing the relative profit contributions from various product categories. When the turnover is too low, it could indicate either lack of volume or an overstocked condition. Excessively high inventory productivity generally means too little inventory is in stock and may be suppressing sales. Promotions, dropped product lines, etc., can help improve product categories with low inventory productivity.
inventory Productivity—Inventory Turnover inventory Profitability—Gross Margin Return on Inventory

Music Retailing
1��
Cost of Doing Business
0.0
0.2
0.4
0.6
0.8
1.0
1.2
1.4
1.6
Combo/ Pro Audio
School Music Store
Keyboard Store
Full-Line Store
2005 at a Glance(Value in Dollars)
0.0
0.2
0.4
0.6
0.8
1.0
1.2
1.4
1.6
'05'04'03'02'01'00'99'98'97'96'95
Combo / Pro Audio(Value in Dollars)
10
15
20
04030201009998979695
Uni
ts x
1,0
00
Import Value Units
0.0
0.2
0.4
0.6
0.8
1.0
1.2
1.4
1.6
'05'04'03'02'01'00'99'98'97'96'95
Full-Line Store(Value in Dollars)
10
15
20
04030201009998979695
Uni
ts x
1,0
00
Import Value Units
0.0
0.2
0.4
0.6
0.8
1.0
1.2
1.4
1.6
'05'04'03'02'01'00'99'98'97'96'95
Keyboard Store(Value in Dollars)
10
15
20
04030201009998979695
Uni
ts x
1,0
00
Import Value Units
0.0
0.2
0.4
0.6
0.8
1.0
1.2
1.4
1.6
'05'04'03'02'01'00'99'98'97'96'95
School Music Store(Value in Dollars)
10
15
20
04030201009998979695
Uni
ts x
1,0
00
Import Value Units
inventory Profitability – Gross Margin Return on Inventory
Gross margin return on inventory (which is the combination of gross margin and inventory turnover) improved for most music retailers. Combo/Pro �udio retailers, however, reported a drop due to declining gross margins.
inventory Profitability Gross Margin Return on Inventory
Gross Margin Return on Inventory is an overall inventory profitability measure that essentially combines both gross margin percentage and inventory turnover into one indicator. It is calculated by dividing gross margin, in dollars, by average inventory. GMROI will indicate whether an adequate gross margin is being earned compared to the investment in inventory required to generate those margin dollars. This measure is particularly useful for analyzing the profitability of various individual product categories.
inventory Profitability—Gross Margin Return on Inventory

1��
0.0
0.5
1.0
1.5
2.0
2.5
3.0
Combo/Pro Audio
School Music Store
Keyboard Store
Full-Line Store
2005 at a Glance(Ratio)
0.0
0.5
1.0
1.5
2.0
2.5
3.0
'05'04'03'02'01'00'99'98'97'96'95
Combo / Pro Audio(Ratio)
10
15
20
04 03 02 01 00 99 98 97 96 95
Uni
ts x
1,0
00
Import Value Units
0.0
0.5
1.0
1.5
2.0
2.5
3.0
'05'04'03'02'01'00'99'98'97'96'95
Full-Line Store(Ratio)
10
15
20
04 03 02 01 00 99 98 97 96 95
Uni
ts x
1,0
00
Import Value Units
0.0
0.5
1.0
1.5
2.0
2.5
3.0
'05'04'03'02'01'00'99'98'97'96'95
Keyboard Store(Ratio)
10
15
20
04 03 02 01 00 99 98 97 96 95
Uni
ts x
1,0
00
Import Value Units
0.0
0.5
1.0
1.5
2.0
2.5
3.0
'05'04'03'02'01'00'99'98'97'96'95
School Music Store(Ratio)
10
15
20
04 03 02 01 00 99 98 97 96 95
Uni
ts x
1,0
00
Import Value Units
total Assets–Asset Turnover
�sset Turnover (total revenue divided by total assets) presents a good overall indicator of total company productivity. Keyboard and School Music retailers reported improved asset turnover rates in �00�. Full Line and Combo/Sound retailers reported asset turnover rates that were unchanged from �00�.
total AssetsAsset Turnover
Total asset turnover presents a good overall indicator of total company productivity. It is the ratio of total revenue to total assets. The ratio tells us how many dollars in revenues are being generated by each dollar of assets employed in running the business. Low asset turnover can signal a need for more attention to the productivity (space, inventory, personnel). However, if you own rather than rent the majority of your stores or have an extensive in-house credit program, this could explain the deviation from typical ratios presented below.
total Assets—Asset Turnover

Music Retailing
1��
Cost of Doing Business
0
10
20
30
40
50
60
70
80
90
100
Combo/Pro Audio
School Music Store
Keyboard Store
Full-Line Store
2005 at a Glance(Percentage)
0
10
20
30
40
50
60
70
80
90
100
'05'04'03'02'01'00'99'98'97'96'95
Combo / Pro Audio(Percentage)
10
15
20
04030201009998979695
Uni
ts x
1,0
00
Import Value Units
0
10
20
30
40
50
60
70
80
90
100
'05'04'03'02'01'00'99'98'97'96'95
Full-Line Store(Percentage)
10
15
20
04 03 02 01 00 99 98 97 96 95
Uni
ts x
1,0
00
Import Value Units
0
10
20
30
40
50
60
70
80
90
100
'05'04'03'02'01'00'99'98'97'96'95
Keyboard Store(Percentage)
10
15
20
04 03 02 01 00 99 98 97 96 95
Uni
ts x
1,0
00
Import Value Units
0
10
20
30
40
50
60
70
80
90
100
'05'04'03'02'01'00'99'98'97'96'95
School Music Store(Percentage)
10
15
20
04 03 02 01 00 99 98 97 96 95
Uni
ts x
1,0
00
Import Value Units
financial Management Leverage– Total Debt to Total Assets
�ll store types reported lower debt levels in �00�. Keyboard retailers were the most leveraged, with total debt to assets at ��%.
financial Management Leverage Total Debt to Total Assets
Leverage is the extent to which a company is financed by debt as opposed to the owner’s funds. It is the amount of liabilities in relation to the amount of net worth on the right-hand side of the balance sheet. The most significant ratio of overall company leverage is Total Debt to Total �ssets, which measures the asset coverage for all outstanding indebtedness. The higher this ratio is, the higher the proportion of debt compared to net worth is. When the leverage is too high, it will severely curtail your ability to attract new borrowed funds. If it is too low, you have excess capacity for debt should it become necessary to borrow.
financial Management Leverage—Total Debt to Total Assets
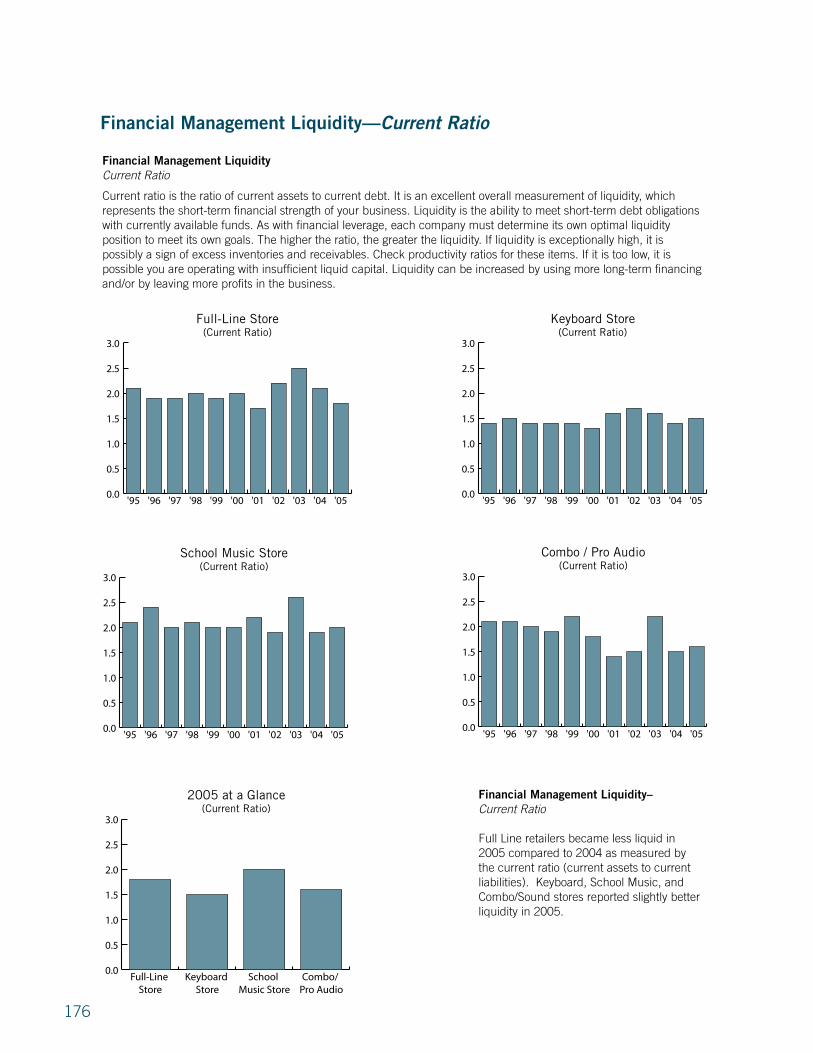
1�6
0.0
0.5
1.0
1.5
2.0
2.5
3.0
Combo/ Pro Audio
School Music Store
Keyboard Store
Full-Line Store
2005 at a Glance(Current Ratio)
0.0
0.5
1.0
1.5
2.0
2.5
3.0
'05'04'03'02'01'00'99'98'97'96'95
Combo / Pro Audio (Current Ratio)
10
15
20
04 03 02 01 00 99 98 97 96 95
Uni
ts x
1,0
00
Import Value Units
0.0
0.5
1.0
1.5
2.0
2.5
3.0
'05'04'03'02'01'00'99'98'97'96'95
Full-Line Store(Current Ratio)
10
15
20
04 03 02 01 00 99 98 97 96 95
Uni
ts x
1,0
00
Import Value Units
0.0
0.5
1.0
1.5
2.0
2.5
3.0
'05'04'03'02'01'00'99'98'97'96'95
Keyboard Store(Current Ratio)
10
15
20
04 03 02 01 00 99 98 97 96 95
Uni
ts x
1,0
00
Import Value Units
0.0
0.5
1.0
1.5
2.0
2.5
3.0
'05'04'03'02'01'00'99'98'97'96'95
School Music Store(Current Ratio)
10
15
20
04 03 02 01 00 99 98 97 96 95
Uni
ts x
1,0
00
Import Value Units
0.0
0.5
1.0
1.5
'05'04'03'02'01'00'99'98'97'96'95
School Music Store(Value in Dollars)
financial Management Liquidity– Current Ratio
Full Line retailers became less liquid in �00� compared to �00� as measured by the current ratio (current assets to current liabilities). Keyboard, School Music, and Combo/Sound stores reported slightly better liquidity in �00�.
financial Management Liquidity Current Ratio
Current ratio is the ratio of current assets to current debt. It is an excellent overall measurement of liquidity, which represents the short-term financial strength of your business. Liquidity is the ability to meet short-term debt obligations with currently available funds. �s with financial leverage, each company must determine its own optimal liquidity position to meet its own goals. The higher the ratio, the greater the liquidity. If liquidity is exceptionally high, it is possibly a sign of excess inventories and receivables. Check productivity ratios for these items. If it is too low, it is possible you are operating with insufficient liquid capital. Liquidity can be increased by using more long-term financing and/or by leaving more profits in the business.
financial Management Liquidity—Current Ratio
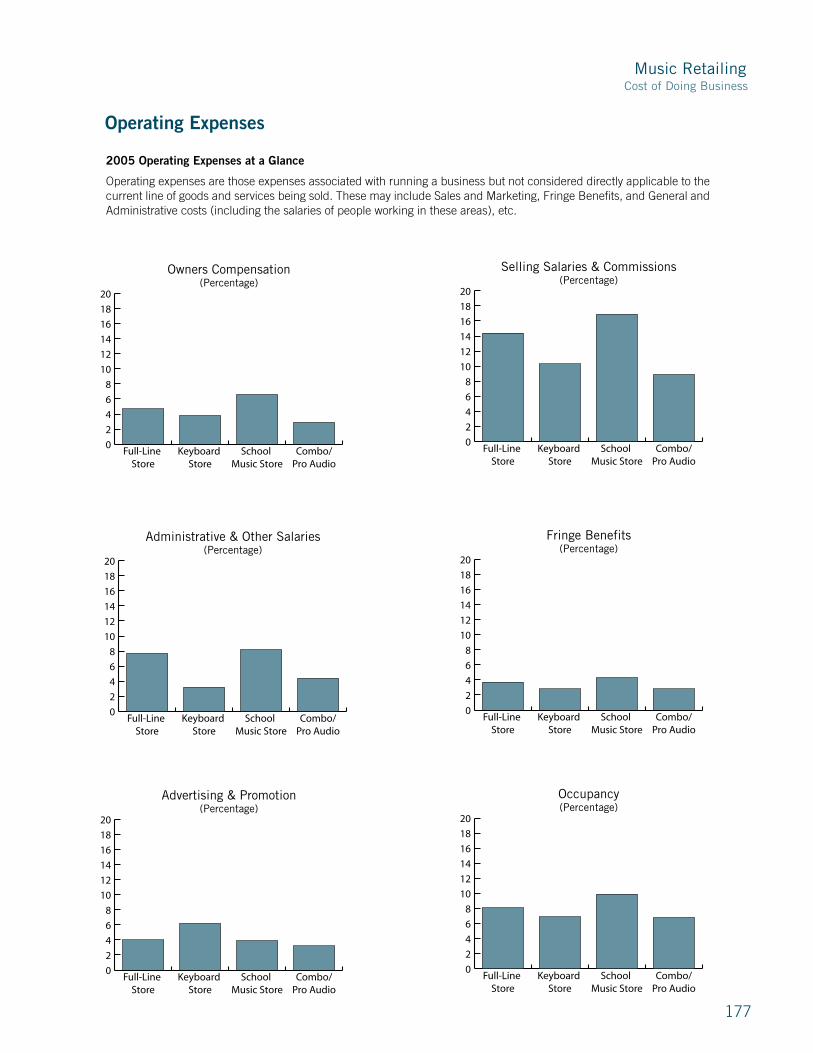
Music Retailing
1��
Cost of Doing Business
0
2
4
6
8
10
12
14
16
18
20
Combo/Pro Audio
School Music Store
Keyboard Store
Full-Line Store
Owners Compensation(Percentage)
0
2
4
6
8
10
12
14
16
18
20
Combo/Pro Audio
School Music Store
Keyboard Store
Full-Line Store
Selling Salaries & Commissions(Percentage)
0
2
4
6
8
10
12
14
16
18
20
Combo/Pro Audio
School Music Store
Keyboard Store
Full-Line Store
Advertising & Promotion(Percentage)
0
2
4
6
8
10
12
14
16
18
20
Combo/Pro Audio
School Music Store
Keyboard Store
Full-Line Store
Administrative & Other Salaries(Percentage)
0
2
4
6
8
10
12
14
16
18
20
Combo/Pro Audio
School Music Store
Keyboard Store
Full-Line Store
Fringe Benefits(Percentage)
0
2
4
6
8
10
12
14
16
18
20
Combo/Pro Audio
School Music Store
Keyboard Store
Full-Line Store
Occupancy(Percentage)
2005 operating expenses at a glance Operating expenses are those expenses associated with running a business but not considered directly applicable to the current line of goods and services being sold. These may include Sales and Marketing, Fringe �enefits, and General and �dministrative costs (including the salaries of people working in these areas), etc.
operating expenses

1�8
0
2
4
6
8
10
12
Combo/Pro Audio
School Music Store
Keyboard Store
Full-Line Store
Retail Music Store Sales Growth2005 vs. 2004(Percentage)
0.0
0.2
0.4
0.6
0.8
1.0
1.2
1.4
1.6
1.8
2.0
Combo/Pro Audio
School Music Store
Keyboard Store
Full-Line Store
Computer, Technology & E-Commerce(Percentage)
0
2
4
6
8
10
12
14
16
18
20
Combo/Pro Audio
School Music Store
Keyboard Store
Full-Line Store
Other Operating Expenses(Percentage)
operating expensesOperating Expenses Results from the N�MM Cost of Doing �usiness Survey have consistently shown that expense management is a critical component to profitability in the music retailing industry. Store owners and managers should diligently compare their expense structures to other similar music retailers.
operating expenses

Music Retailing
1�9
Cost of Doing Business
0
2
4
6
8
10
12
14
16
18
20
Combo/Pro Audio
School Music Store
Keyboard Store
Full-Line Store
2005 at a Glance(Percentage)
0
2
4
6
8
10
12
14
16
18
20
'05'04'03'02'01'00'99'98'97'96'95
Combo / Pro Audio(Percentage)
10
15
20
04 03 02 01 00 99 98 97 96 95
Uni
ts x
1,0
00
Import Value Units
0
2
4
6
8
10
12
14
16
18
20
'05'04'03'02'01'00'99'98'97'96'95
Full-Line Store(Percentage)
10
15
20
04 03 02 01 00 99 98 97 96 95
Uni
ts x
1,0
00
Import Value Units
0
2
4
6
8
10
12
14
16
18
20
'05'04'03'02'01'00'99'98'97'96'95
Keyboard Store(Percentage)
10
15
20
04 03 02 01 00 99 98 97 96 95 U
nits
x 1
,00
0Import Value Units
0
2
4
6
8
10
12
14
16
18
20
'05'04'03'02'01'00'99'98'97'96'95
School Music Store(Percentage)
10
15
20
04 03 02 01 00 99 98 97 96 95
Uni
ts x
1,0
00
Import Value Units
Personnel Productivity–Selling Payroll as a Percentage of Merchandise Revenue
Compensation paid to sales staff as a percentage of merchandise revenues fell for most music retailers in �00�. However, selling salaries as a percentage of merchandise revenues remain above the 10-year average.
Personnel ProductivitySelling Payroll as a Percentage of Merchandise Revenue
Selling salaries and commissions as a percentage of merchandise revenue (which adds the dimension of compensation levels instead of just the number of salespeople) measures employee efficiency by determining the proportion of sales paid out in employee costs. This indicator is not distorted by inflation.
Personnel Productivity—Selling Payroll as a Percentage of Merchandise Revenue
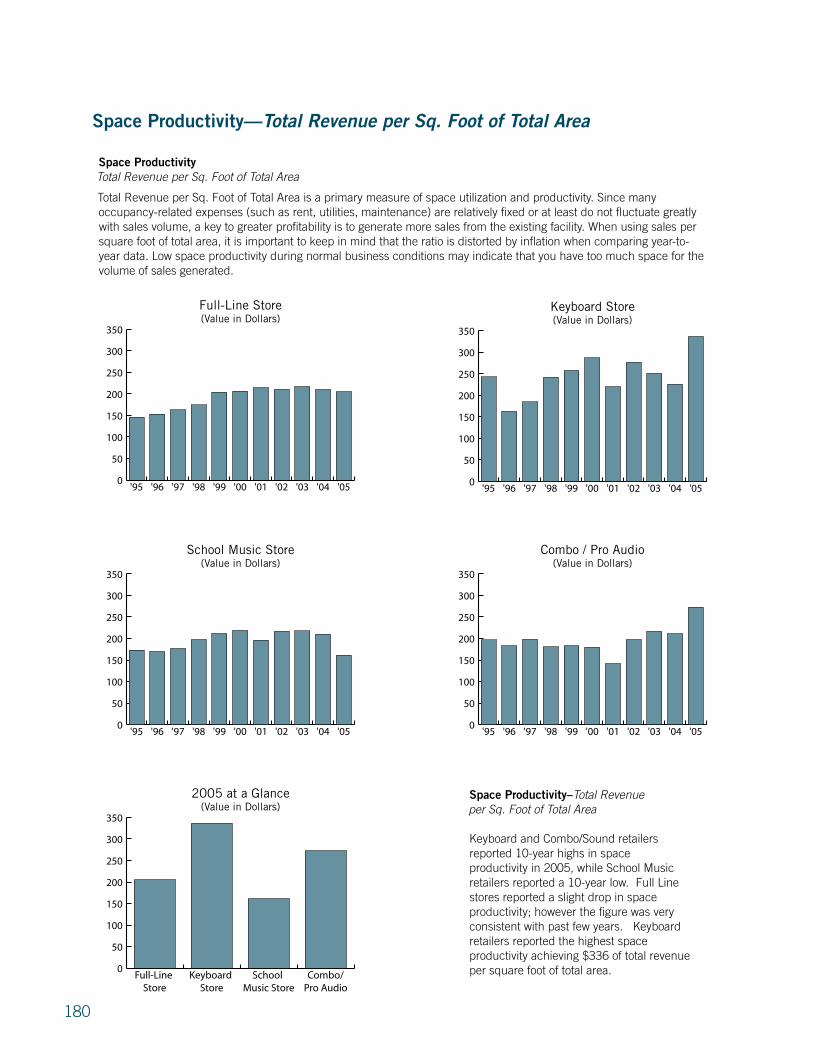
180
0
50
100
150
200
250
300
350
Combo/Pro Audio
School Music Store
Keyboard Store
Full-Line Store
2005 at a Glance(Value in Dollars)
0
50
100
150
200
250
300
350
'05'04'03'02'01'00'99'98'97'96'95
Full-Line Store(Value in Dollars)
10
15
20
04 03 02 01 00 99 98 97 96 95
Uni
ts x
1,0
00
Import Value Units
0
50
100
150
200
250
300
350
'05'04'03'02'01'00'99'98'97'96'95
Keyboard Store(Value in Dollars)
10
15
20
04 03 02 01 00 99 98 97 96 95
Uni
ts x
1,0
00
Import Value Units
0
50
100
150
200
250
300
350
'05'04'03'02'01'00'99'98'97'96'95
School Music Store(Value in Dollars)
10
15
20
04 03 02 01 00 99 98 97 96 95
Uni
ts x
1,0
00
Import Value Units
space Productivity–Total Revenueper Sq. Foot of Total Area
Keyboard and Combo/Sound retailers reported 10-year highs in space productivity in �00�, while School Music retailers reported a 10-year low. Full Line stores reported a slight drop in space productivity; however the figure was very consistent with past few years. Keyboard retailers reported the highest space productivity achieving $��6 of total revenue per square foot of total area.
space ProductivityTotal Revenue per Sq. Foot of Total Area
Total Revenue per Sq. Foot of Total �rea is a primary measure of space utilization and productivity. Since many occupancy-related expenses (such as rent, utilities, maintenance) are relatively fixed or at least do not fluctuate greatly with sales volume, a key to greater profitability is to generate more sales from the existing facility. When using sales per square foot of total area, it is important to keep in mind that the ratio is distorted by inflation when comparing year-to-year data. Low space productivity during normal business conditions may indicate that you have too much space for the volume of sales generated.
space Productivity—Total Revenue per Sq. Foot of Total Area
0
50
100
150
200
250
300
350
'05'04'03'02'01'00'99'98'97'96'95
Combo / Pro Audio(Value in Dollars)
10
15
20
04 03 02 01 00 99 98 97 96 95
Uni
ts x
1,0
00
Import Value Units

181
nAMM exeCUtive CoMMittee & boArd of direCtors
nAMM executive Committee
ChairmanDennis M. HoulihanRoland Corporation U.S.Los �ngeles, Calif.
vice ChairmanR.F. “Chip” �verwater, Jr.�mro Music Stores, Inc.Memphis, Tenn.
treasurerTom SchmittSchmitt Music CompanyMinneapolis, Minn.
secretaryKevin CranleyWillis Music CompanyFlorence, Ky.
President/CeoJoe LamondN�MMCarlsbad, Calif.
nAMM board of directors
thomas AustinSherman, Clay & Co.San �runo, Calif.
rick drummJ. D’�ddario & Co., Inc.Farmington, N.J.
robert eastmanMusician’s FriendMedford, Ore.
gary hanserHHI (Hanser Holdings, Inc.)Cincinnati, Ohio
rosi K. JohnsonMississippi Music, Inc.Hattiesburg, Miss.
brock KaericherRemo, Inc.Valencia, Calif.
harvey g. LevyLevy’s Leathers LimitedWinnipeg, Manitoba, Canada
brian McCannInstrumental Music Co.Ventura, Calif.
Joel MencheyMenchey Music Service, Inc.Hanover, Pa.
William MendelloFender Musical InstrumentsScottsdale, �riz.
dale MillerDJ Miller Music Distributors, Inc.Nederland, Colo.
Jerome Murphy iiiM. Steinert and Sons Co., Inc.�oston, Mass.
Qian niEastman Strings, Inc.Clarksburg, Md.
barbara b. PaulsenSpoiled �y Technology, Inc.Naperville, Ill.
John PaulsonMakeMusic, Inc.Eden Prairie, Minn.
george Quinlan, Jr.Quinlan & Fabish Music Co.�urr Ridge, Ill.
bill reimHoshino US��ensalem, Pa.
richard rejino�rook Mays Print MusicDallas, Texas
Alan rosen�ananas �t LargeSan Rafael, Calif.
Jim ruppColumbus Pro Percussion, Inc.Columbus, Ohio
dean samuelSamuel Music Co.Effingham, Ill.
denny senseney Senseney Music, Inc.Wichita, Kan.
david r. teeplePort Huron Music CenterPort Huron, Mich.
Mathias von heydekampfTelex Communications�urnsville, Minn.
nAyMM President
Alysha sides greevyRobert M. Sides Family Music CentersWilliamsport, Pa.

ACKnoWLedgMentsN�MM wishes to express our sincere appreciation to everyone who helped make the 2007 NAMM Global Report / Music USA possible, including Paul and �rian Majeski of The Music Trades magazine for the U.S. music products industry sales statistics and unit information and analysis; Josie Hollingsworth of the U.s. Census bureau for the U.S. import and export statistics, and Shawn Six of industry insights, inc. for the Cost of Doing �usiness final report. We also want to acknowledge the contributions of those organizations and individuals who helped us assemble the International statistics: Otmar Hammerschmidt of the Austrian Musical instruments retailer’s Association; Ian Harvey of the Australian Music Association (AMA); �l Kowalenko of Music industries Association Canada (MiAC); Wang Gentian of The China Musical instrument Association (CMiA); Winfried �aumbach of the national Association of german Musical instruments Manufacturers (bdMh); �ntonio Monzino and Gian Secondo �orgogno of dismaMusica, Italy; Mayumi Kobayashi of Japan Music trades; Jo �ergerskogen of roland scandinavia, As, Norway; Juan Grecos of Caprice, s.L., Spain; Michael Heuser of roland switzerland; and �ob Thomas, �lan Greensall and Paul McManus of Music industries Association (MiA), United Kingdom. Your assistance was crucial, and is greatly appreciated. thank you.

2007 NAMM GLOBAL REPORTMUSIC USAA STATISTICAL REVIEW
OF THE MUSIC PRODUCTS INDUSTRY
N�MM, the International Music Products �ssociation
��90 �rmada Drive Carlsbad, C� 9�008
US� 800.�6�. N�MM (6�66)
�60.��8.8001 www.namm.org