2007 ths school improvement plan
TRANSCRIPT

Southern Association of Colleges and Schools School Improvement Plan Tennessee High School
Bristol Tennessee City Schools Accredited Since 1972
� �
�
������������
1112 Edgemont Avenue Bristol, Tennessee 37620
(423) 652-9494 Website: ths.btcs.org
Mr. Jim N. Butcher
Principal
Mr. Blair Henley Mr. Paul Pendleton Mr. Steve Sochalski Dr. Annette Tudor
Assistant Principals
Mrs. Doris Peters Mr. Seymour Ray Program Assistants

�������������� ������������������������������� ���� Introduction Bristol Tennessee High School is a four-year comprehensive high school that has been accredited by the Southern Association of Colleges and Schools since 1942. For the past several decades, Tennessee High School has been using the evaluation tools and planning process associated with the Southern Association of Colleges and Secondary Schools (SACS) to serve as the improvement plan. During the 2003 school year, a full on-site evaluation was conducted. Co-chairpersons Mary Brown and Nancy Dickerson led the preliminary study. Dr. Doris VanHuss, who was serving as Assistant Principal at South High School in Kingsport, Tennessee, led the five-person visiting team. Many of the recommendations from the visiting team have been completed or are in progress. The current school improvement plan addresses the goals and objectives reflected in the latest SACS evaluation plan, including other goals that were developed from current school data with input from business partnerships. The Parent/Community Advisory Team, the Principal’s Student Advisory Team, curriculum departments, professional study groups (A+ Teams), and Staff Development Leadership Teams are aligned with state and school board goals. Stakeholder teams meet regularly to address the critical components of the plan. The following document is a guide that provides the educational leadership of Tennessee High School with a positive direction to meet the diverse needs of the school population. We realize that the attached document is not the end but a means of reaching our mission of providing each student with an innovative and superior education to meet the challenges of an ever-changing society. As we move into the new millennium, modifications and improvements will be an ongoing process. A systematic process for data collection is in place to guide decision making at the school and classroom level. Team Collaboration Leadership Team Composition
The direction of Tennessee High School is determined through a process by which stakeholders in our school work cooperatively to improve student achievement and the general success of all students. The consensus-building process relies on staff, parents, students, and community members participating in collaborative decision making to formulate a plan for growth and improvement. The stakeholders involved in the current draft of the school improvement plan included members of the Principal’s Student Advisory Team (PSAT), members of the Parent/Community Advisory Team (PCAT), all certificated faculty members, non-certificated staff members, and administrators.

The process used for this revision of the School Improvement Plan included many work sessions to draft each component, to disseminate draft information for review, and to revise information for the final draft. Monthly meetings were held for the PSAT, PCAT, faculty leadership team, and administrative team. During these monthly meetings each component was reviewed and revised. Consensus among all stakeholders, which included parents, community representatives, support personnel, students, administrators, and teachers, was reached during in-service sessions for each component of this plan.
LEADERSHIP TEAM Linda Bearfield Anna Booher Subcommittee Co-chair of Subcommittee Co-chair of • the Mathematics Data Team • the Beliefs Team • the Vision Team • the Social Studies/ Attend./ Grad. Rate Data
Team • the Mathematics Action Plan Team • the Social Studies Action Plan Team Janet Combs Roger DePriest Subcommittee Co-chair of Subcommittee Co-chair of • the Mission Team the Mission Team • the Language Arts Data Team • the Language Arts Data Team • the Language Arts Action Plan Team • the Language Action Plan Team Phil Gentry Julie Halstead Subcommittee Chair of Subcommittee Co-chair of • the Science Action Plan Team • the Component I Team Shirley Ogle • the Science Data Team Subcommittee Co-chair of Deidre Pendley • the Beliefs Team Subcommittee Co-chair of • the Social Studies/ Attend./ Grad. Data Team • the Vision Team Janice Seigart • the Mathematics Data Team Subcommittee Co-chair of • the Mathematics Action Plan Team • the Mathematics Action Plan Team Sonya McMakin Roby Witcher Subcommittee Chair of Subcommittee Co-chair of � Career Technical Education • the Science Data Team • the Component I Team
Sub-Committees Vision Team Co-Chairs: Linda Bearfield and Deidre Pendley Administrative
Team Jim Butcher, Doris Peters, Annette Tudor
Teachers Matt Chandler, Tom Coates, Marsha Collier, Dave Collins, Derek Dowdell, Phil Gentry, Silvia Harris, Chris Huber, Mimi Kind, Virginia McRee, Garry Milhorn, Tony Mitchell, Jeff Mustard, Phil Price, Wally Proffitt, Kelly Vance, Kimberly

Toby Parent/
Community Advisory Team
(PCAT)
Alice Blanton, Lisa Cirotta, Steve Darnell, Selena Jackson, A. D. Jones, Teresa Kaylor, Kathy Keen, Cicely Strang, Gordon Turnbull, Debbie Wagner, Amy Williams
Principal’s Student
Advisory Team (PSAT)
Rachel Bush, Alexa Cassell, Ellis Davis, Nidhi Desai, Bryce Fitzgerald, Evan Flatt, Will Ford, Pearce Galliher, Carson Kelly, Josh Lambert, Matt Layton, Andrea Lyons, Corey Miles, Dani Montgomery, Liz Morgan, Tara Munt, Matt Pendleton, Craig Rockett, Megan Rowell, Kimberly Smith, Andy Snyder, Heather Starling, McKinnley Thomas, Tre Webb
Non-Certified Staff
Donna Shelton
Beliefs Team Co-Chairs Anna Booher and Shirley Ogle Administrative
Team Jim Butcher, Doris Peters, Steve Sochalski, Annette Tudor
Teachers Robin Blair, Beth Brown, Peggy Dempsey, Mark Grindstaff, Dave Halstead, Jeanne Henson, Shelah Higgins, Randy Irvin, Carl Jenkins, Scott Jenkinson, Ellan Kitzmiller, Lyn Love, Dave Mason, Sonya McMakin, Patty Privette, Glen Van Dyke, Michael Wampler, Vail Williams
Parent/ Community
Advisory Team (PCAT)
Alice Blanton, Lisa Cirotta, Steve Darnell, Selena Jackson, A. D. Jones, Teresa Kaylor, Kathy Keen, Cicely Strang, Gordon Turnbull, Debbie Wagner, Amy Williams
Principal’s Student
Advisory Team (PSAT)
Rachel Bush, Alexa Cassell, Ellis Davis, Nidhi Desai, Bryce Fitzgerald, Evan Flatt, Will Ford, Pearce Galliher, Carson Kelly, Josh Lambert, Matt Layton, Andrea Lyons, Corey Miles, Dani Montgomery, Liz Morgan, Tara Munt, Matt Pendleton, Craig Rockett, Megan Rowell, Kimberly Smith, Andy Snyder, Heather Starling, McKinnley Thomas, Tre Webb
Non-Certified Staff
Bev Nye
Mission Team Co-chairs Janet Combs and Roger DePriest Administrative
Team Jim Butcher, Doris Peters, Seymour Ray, Annette Tudor
Teachers Susan Beth, Bandy Brownlee, Tim Davis, Tammy English, Chris Estep, Chase Hicks, Joy Jarrett, Terry Kennedy, Patsy Lloyd, Kristen Moody, Bobbie Pinkston, Christa Ratliff, Janice Seigart, Daryl Shanks, Leslie Skeens, Candy Sutherland, Dave Turpin, Anita Vickers
Parent/ Community
Advisory Team (PCAT)
Alice Blanton, Lisa Cirotta, Steve Darnell, Selena Jackson, A. D. Jones, Teresa Kaylor, Kathy Keen, Cicely Strang, Gordon Turnbull, Debbie Wagner, Amy Williams
Principal’s Rachel Bush, Alexa Cassell, Ellis Davis, Nidhi Desai, Bryce Fitzgerald, Evan

Student Advisory Team
(PSAT)
Flatt, Will Ford, Pearce Galliher, Carson Kelly, Josh Lambert, Matt Layton, Andrea Lyons, Corey Miles, Dani Montgomery, Liz Morgan, Tara Munt, Matt Pendleton, Craig Rockett, Megan Rowell, Kimberly Smith, Andy Snyder, Heather Starling, McKinnley Thomas, Tre Webb
Non-Certified Staff
Jason Moore
Component I Team Co-chairs Julie Halstead and Roby Witcher Administrative
Team Jim Butcher, Steve Sochalski
Teachers Andrew Beck, Kim Bright, Melissa Davis, Richard Ensor, Mary Johnson, Carla Lilly, Ed Lockett, Mike Mays, Kevin Mooney, Neal Phillips, Toby Richmond, Jerry Russell, Greg Stubbs, David Sturgill, Charlie Tiller, Evandro Valente, Jamie Wilson, Bob Zeiger
Parent/ Community
Advisory Team (PCAT)
Alice Blanton, Lisa Cirotta, Steve Darnell, Selena Jackson, A. D. Jones, Teresa Kaylor, Kathy Keen, Cicely Strang, Gordon Turnbull, Debbie Wagner, Amy Williams
Non-Certified Staff
Jennifer Crews
Language Arts Data Team Co-chairs Janet Combs and Roger DePriest Administrative
Team Jim Butcher, Doris Peters, Seymour Ray, Annette Tudor
Teachers Susan Beth, Bandy Brownlee, Tim Davis, Tammy English, Chris Estep, Chase Hicks, Joy Jarrett, Terry Kennedy, Patsy Lloyd, Kristen Moody, Bobbie Pinkston, Christa Ratliff, Janice Seigart, Daryl Shanks, Leslie Skeens, Candy Sutherland, Dave Turpin, Anita Vickers
Principal’s Student
Advisory Team (PSAT)
Wayne Oliver
Parent/ Community
Advisory Team (PCAT)
Steve Darnell
Non-Certified Staff
Jason Moore
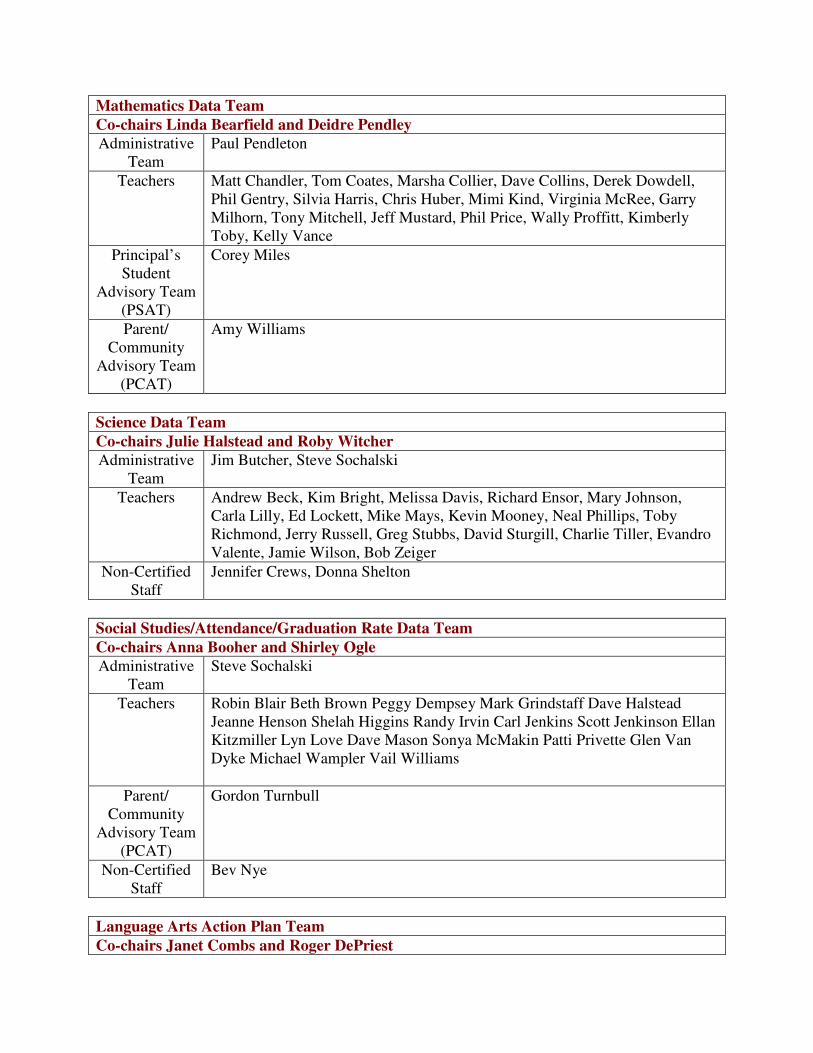
Mathematics Data Team Co-chairs Linda Bearfield and Deidre Pendley Administrative
Team Paul Pendleton
Teachers Matt Chandler, Tom Coates, Marsha Collier, Dave Collins, Derek Dowdell, Phil Gentry, Silvia Harris, Chris Huber, Mimi Kind, Virginia McRee, Garry Milhorn, Tony Mitchell, Jeff Mustard, Phil Price, Wally Proffitt, Kimberly Toby, Kelly Vance
Principal’s Student
Advisory Team (PSAT)
Corey Miles
Parent/ Community
Advisory Team (PCAT)
Amy Williams
Science Data Team Co-chairs Julie Halstead and Roby Witcher Administrative
Team Jim Butcher, Steve Sochalski
Teachers Andrew Beck, Kim Bright, Melissa Davis, Richard Ensor, Mary Johnson, Carla Lilly, Ed Lockett, Mike Mays, Kevin Mooney, Neal Phillips, Toby Richmond, Jerry Russell, Greg Stubbs, David Sturgill, Charlie Tiller, Evandro Valente, Jamie Wilson, Bob Zeiger
Non-Certified Staff
Jennifer Crews, Donna Shelton
Social Studies/Attendance/Graduation Rate Data Team Co-chairs Anna Booher and Shirley Ogle Administrative
Team Steve Sochalski
Teachers Robin Blair Beth Brown Peggy Dempsey Mark Grindstaff Dave Halstead Jeanne Henson Shelah Higgins Randy Irvin Carl Jenkins Scott Jenkinson Ellan Kitzmiller Lyn Love Dave Mason Sonya McMakin Patti Privette Glen Van Dyke Michael Wampler Vail Williams
Parent/ Community
Advisory Team (PCAT)
Gordon Turnbull
Non-Certified Staff
Bev Nye
Language Arts Action Plan Team Co-chairs Janet Combs and Roger DePriest

Administrative Team
Seymour Ray
Teachers Linda Bearfield, Susan Beth, Bandy Brownlee, Tim Davis, Derek Dowdell, Tammy English, Chase Hicks, Joy Jarrett, Scott Jenkinson, Terry Kennedy, Patsy Lloyd, Bobbie Pinkston, Leslie Skeens, Dave Turpin, Kelly Vance, Anita Vickers, Roby Witcher
Principal’s Student
Advisory Team (PSAT)
Alexa Cassell, Nidhi Desai, Liz Morgan, Andrea Lyons, Matt Pendleton, Craig Rockett, Megan Rowell, Wei Sun
Parent/ Community
Advisory Team (PCAT)
Alice Blanton, Will Ford, Selena Jackson, Cecily Strang
Non-Certified Staff
Rosemary Alley, Jason Moore
Social Studies Action Plan Team Chair Anna Booher Administrative
Team Steve Sochalski
Teachers Robin Blair, Beth Brown, Matt Chandler, Peggy Dempsey, Mark Grindstaff, Dave Halstead, Jeanne Henson, Shelah Higgins, Randy Irvin, Lyn Love, Dave Mason, Sonya McMakin, Jeff Mustard, Patty Privette, Daryl Shanks, Charlie Tiller, Glen Van Dyke, Vail Williams
Principal’s Student
Advisory Team (PSAT)
Bryce Fitzgerald, Evan Flatt, Josh Lambert, Melissa McSharry, Tara Munt, Kimberly Smith, Amber Tunnell
Parent/ Community
Advisory Team (PCAT)
Bryan Boyd, A.D. Jones, Gordon Turnbull, Tre Webb
Non-Certified Staff
Bev Nye
Math Action Plan Team Co-chairs Administrative
Team Paul Pendleton
Teachers Tom Coates, Marsha Collier, Dave Collins, Silvia Harris, Chris Huber, Mimi Kind, Ellan Kitzmiller, Carla Lilly, Virginia McRee, Garry Milhorn, Tony Mitchell, Kevin Mooney, Phil Price, Wally Proffitt, Kimberly Toby, Evandro Valente
Principal’s Student
Teresa Kaylor, Carlson Keller, Anna Ketron, Matt Layton, Dani Montgomery, Wayne Oliver, Andy Snyder

Advisory Team (PSAT) Parent/
Community Advisory Team
(PCAT)
Lisa Cirotta, Ellis Davis, McKinnley Thomas , Debbie Wagner
Non-Certified Staff
Doris Stickley
History From its beginning in the hearts and minds of Bristolians in 1888, Tennessee High School has developed into one of the finest high schools in the state. Since the very beginning of the Bristol Tennessee Public School System, Tennessee High School has made great strides and upheld a strong tradition in its many academic, athletic, and cultural arts programs. The Bristol Tennessee Public School System was organized in April 1888. The Baptist Academy on Anderson Street was rented for the girls’ school, and the boys attended school in an old building on the corner of Anderson and Tenth Streets that was commonly referred to as “Cornfield Academy”. In 1893, the first new public school building was built on Fifth Street next to King College. Grades four through ten were taught in the school, which employed seven teachers and one principal. The younger children continued to attend school at the “Cornfield Academy” on Anderson Street. In 1916, a new building on Alabama Street became the first official Tennessee High School, then a four-year high school. In 1939, the initial portion of the present-day Tennessee High School, including the Stone Castle, was built on Edgemont Avenue. The Stone Castle has been designated by the state of Tennessee as an official historical site. Since that time, additions were added at roughly ten-year intervals until 1981-82 when the school under went an extensive renovation including Viking Hall, an eight-thousand-seat arena, added to the facility in 1977. Through the passing years, the school has assumed a significant role in shaping the character and direction of Bristol, Tennessee. Tennessee High School has become both a reflection of the philosophy of the community and a means of developing the strength and maturity that are characteristic of this city. Community Characteristics With a population of 43,000, Bristol, famous for its “world’s fastest half mile” race track and its designation as the “birthplace of country music”, is located on the border of Northeast Tennessee and Southwest Virginia. There are two colleges in Bristol; five other colleges, a state university, and an extension of another state university are within 30 miles of Bristol. A center of retail trade, Bristol is the home of many manufactured products: Batteries, electronics, mining equipment, fiberglass, aluminum products, clothing, food products, air compressors and others. In addition, the development of Exit 7 has brought many jobs and increased revenue to the area. The Volunteer Parkway is also seeing increased retail development as a result of the opening of the Super Wal-Mart store. Small business is a vital part of the city; fine arts are enthusiastically
supported; numerous recreational opportunities are available, including the Bristol Motor Speedway, two lakes, natural forests, and parks with walking trails.
Various community programs and facilities encourage, and support the programs at Tennessee High School. Some of these resources include the public library, college libraries, Bristol Tennessee Leisure Services, YMCA, YWCA, Bristol Ballet, Paramount Theatre, Viking Boosters, PTSA, various art groups and scouting associations. Other organizations, the Lions Club, Rotary, Downtown Optimist, Civitan, Pilot Club, Chamber of Commerce, and Bristol Youth Leadership, sponsor school clubs and programs. These clubs take advantage of volunteers concerned with meeting the leisure, recreational, and social interests of all students. Parent/ Guardian Demographics
The families in our community are facing the same problems as families in other parts of the nation. Family structures have changed greatly over the last ten years. A smaller percentage of students come from traditional families, while a larger percentage of students live in households which are non-traditional: Single parents, step-parents, foster parents, and children living with relatives other than their parents.
The community of Bristol, Tennessee-Virginia, is feeling the effects of flight in families
because of industrial downsizing and reassignment of highly technical positions to other locations, creating a lack of growth within the community with 30.3% being economically disadvantaged. With the recent promotion of Bristol as one of the top 20 Retirement Communities in the United States and the Tri-Cities Region being designated an All-American City, future growth in the service sector is expected.
Student Characteristics The September 2006 enrollment was 1344, encompassing grades 9-12. This is an increase of approximately three hundred students in the last three years. The school population includes 93.8% Caucasian. The remaining 6 % are African Americans (4.0 %), Hispanics (1.0 %), Asians (.5 %), and Native Americans (.04%). Most students attend Tennessee High School for four years and graduate with their class. Over 74% of the graduating classes in the last five years have continued their post-secondary educational program. A follow-up of the 2005-6 graduating class revealed that 60% attended four-year colleges; 18% attended two-year colleges; 4% entered the military; 16% were employed; and 2% were unemployed. The Bristol Tennessee Board of Education has adopted a mission statement that serves as a guide for our entire school system. The mission of education is to prepare students for life; an educational institution is reflective of the community it serves. The Bristol Tennessee Board of Education believes that the quality of life and effectiveness of government in the community, state, nation, and world are dependent upon the education of the people. Therefore, the purpose of education is to provide opportunities for all

students to become competent and confident in functioning and making decisions in the personal, economic, social, and political spheres. To this end, the Bristol Tennessee School System’s mission is to provide an environment in which students will have an opportunity to achieve their potential in order that they may become the best that they are capable of becoming - for themselves, their families, and their community. This philosophy reflects the overall climate of our school. Staff Characteristics
The Tennessee High School administrative team includes one principal, four assistant principals, and two program assistants. One holds a Doctorate of Education, one holds an Educational Specialist degree, one has a Master’s Degree plus thirty hours and four have a Master’s Degree.
The faculty at Tennessee High School includes eighty-eight full-time teachers and one
part-time classroom teacher, two librarians, and three counselors. The faculty/ student ratio is 1:13. Three teachers hold an Educational Specialist degree. Seven teachers hold a Master’s Degree plus thirty hours; thirty-nine hold a Master’s Degree; thirty-four hold a Bachelor of Arts or Science degree. Four teachers in Career and Technical Education have industry certification in their program area.
The remaining staff includes nine secretaries and sixteen educational assistants, two
Licensed Practical Nurses, two grant-funded Student Assistance Program (SAP) counselors in conjunction with Frontier Health, three Community Resource Specialists, and an SRO officer. All nine secretaries have post high school education and/ or training. Five educational assistants hold a Bachelor’s Degree, three have two years of college, six hold a Paraprofessional Certification, and one has no certification (because of no direct student contact).
The faculty at The Learning Center, an alternative educational program funded by the Safe Schools/ Healthy Students federal grant, includes a lead teacher, six full-time teachers, one SAP counselor, one career counselor, one behavior modification counselor, one licensed clinical social worker, and an educational assistant. Three teachers hold a Bachelor of Arts/ Science Degree, five teachers hold a Master’s Degree and one teacher holds a Master’s Degree plus thirty hours.
All teachers at the secondary level are fully endorsed in their current teaching position.
Furthermore, all core academic subjects are taught by highly qualified teachers. In addition, the 2004 Tennessee High School Principal was named Tennessee Principal of the Year, and one teacher was chosen Eastern Grand Division Tennessee Teacher of the Year. One staff member was one of forty teachers from the Southeast chosen in 2006 to participate in the Toyota International Teacher Program in Japan. Two art teachers have been recognized as Tennessee Art Educators of the Year, one in 2003 and one in 2006. Tennessee High School’s band director has been named one of the 50 Most Outstanding Band Directors in the Nation.
As a result of Tennessee High School’s Strategic Plan, all teachers participate in school-wide Professional Learning Communities, called A+ teams, led by fellow teachers who are staff development leaders (SDL Team). Among topics that have been studied are Classroom Management, Cooperative Learning, Project-Based Learning, and “A Framework for Understanding Poverty”, by Ruby Payne.
Curriculum
Tennessee High School’s curriculum includes more than 150 different courses taught at
various levels. A block schedule allows students to take four subjects per semester, two semesters per year. Students are offered two choices to complete their educational goals: University Path or Technical Path.
Curriculum choices include the following:
• Advanced Placement courses are offered in English 12, U.S. History, Biology II, Chemistry II, Calculus, Music, Physics, Psychology, and Art.
• Honors level and college preparation courses are offered in English 9, 10, 11, and 12, Biology I, Chemistry I, Physical Science, Geometry, and Algebra II.
• Additional college preparation courses include elective options such as an SAT/ACT preparation class, Psychology, JROTC, Leadership Challenge, Life Science, and Mythology and Etymology, and four foreign languages.
• Sixteen virtual classes are provided by the East Tennessee e-Learning Center, the first virtual learning program in the state of Tennessee (developed by Bristol City Schools).
• Dual enrollment opportunities are available for high school and college credit at area colleges and universities.
• Career and Technical Education -Thirty four different courses are offered in the following areas: Health Science, Consumer Sciences, Office Technology and Business Technology Education, and Trade and Industry.
In addition, student achievement is enhanced by opportunities for students to participate
in a variety of service-oriented clubs, organizations such as band and chorus, and a variety of sports.
New programs have been utilized to maximize the success of students, in addition to the
successful programs already in place. Tennessee High School was awarded $4,000 Performance Incentive Grant in 2004 by the state of Tennessee; in 2005, Tennessee High was named a semifinalist for the Intel and Scholastic Schools of Distinction award. Also in 2005, Bristol City Schools received an $8.8 million Safe Schools/ Healthy Students grant that funded The Learning Center. Community partnerships with Frontier Health, the Bristol Tennessee Juvenile Court, the Bristol Tennessee Police Department, and Boys and Girls Club have been fostered through the Safe Schools grant. The grant has also funded additional staff, technology, and security cameras. Renaissance incentive programs such as Quest for Success are changing the culture of the

school. Students have had the opportunity to win cars, laptops, and other prizes for improving attendance, attitude, and achievement. Tennessee High School has been a Renaissance school since 1998. �

��������������� ���� ��������� ���� ������� ���� Tennessee High School’s School Improvement Plan was developed through a cooperative process by which stakeholders gave input and reached a consensus for the final plan. The stakeholders utilized a variety of data as the basis for the school improvement plan. 1b.1: Academic and Non-Academic Assessment Measures Data Sources: Academic Assessments Gateway Assessments:
• English 2 • Algebra 1 • Biology
End of Course Assessments: • English 1 • Foundations 2 • US History • Physical Science 11th Grade Writing Assessment
ACT Scores: • English • Reading • Math • Science • Composite
Advanced Placement Scores: • English • Calculus AB • Chemistry • Biology • US History • Psychology • Art
SAT Scores: • Verbal • Math • Combined
ASVAB
For Special Needs Students- Woodcock Johnson Kuder WISC III Non-academic Assessments: Career and Technical Education Competency Reports Graduation Rate Cohort Dropout Rate Attendance Promotion/Retention Student Report Cards/Mid-term reports Student Four Year Plans and Credit Checks NSSE Surveys:
• Students • Parents • Teachers

1b.2 Data Collection & Analysis Data Collection Each school year, multiple sources of data are reviewed and analyzed regarding academic and non-academic measures. As data are collected, the faculty, administration, parents, and students analyze the documents to determine areas of strength and areas to strengthen. Data collected over time provide a comprehensive picture of student progress or deficiencies. A minimum of three years of collected data (when available) regarding academic and non-academic issues drives the decision making process and changes in the school improvement planning process. Multiple sources (demographics, stakeholder perceptions, student achievement in learning, and school process and procedures) establish the plan for allocation of resources including personnel, professional development, technology, and instructional materials and media. Component 3 data were collected, examined, and analyzed through a collaborative effort between staff and faculty representatives, administration, parent and community volunteers, and student volunteers. The following data were used in this process: Advanced Placement scores, SAT scores, 2006 School Report Card data including student demographics, attendance, graduation rate, dropout rate, Gateway scores, End of Course scores, Writing Assessment scores, TVAAS, ACT scores, and NSSE survey results from students, parents, and teachers. The data were disaggregated by gender, race, and economically disadvantaged. Assessment Methods
• Advanced Placement tests: AP tests are administered in the spring of each year. Students enrolled in an AP course have the option to take the test as an option to earn college credit for the course.
• SAT: SAT tests are offered several times each school year and through the summer. Tennessee High School is a local testing location for students in the region. Students are encouraged to take the SAT after completing particular courses and after their sophomore year.
• Tennessee State Report Card: o Student demographics: managed on Mac School/Chancery SMS o Attendance: Calculated from an average of each 20-day attendance
reporting period; managed on Mac School/Chancery SMS o Formula for calculating the graduation rate: Graduation = (Regular on-time graduates)
Rate (Regular on time graduates + Regular late Graduates + Special Education diplomas + Certificates of Attendance + GED’s + Cohort dropouts) 12th grade ‘05-’06; 11th grade ‘04-’05; 10 grade ‘03-’04; 9th grade ‘02-’03
o Dropout data: The percentage of those students entering the 9th grade who has dropped out by the end of 12th grade.
o Gateway Tests: offered 3 times per year (at the end of each semester and one time in the summer)
o End of Course Tests: offered 2 times per year (at the end of each semester)
o Writing Assessment: Administered in February of each year to all 11th Grade students
o ACT: ACT tests are offered several times each school year and through the summer. Tennessee High School is a local testing location for students in the region. Students are encouraged to take the ACT after completing particular courses and after their sophomore year.
o NSSE Surveys: Distributed annually by Tennessee High School to parents, students, and teachers
[Strengths and needs are identified in the analysis that follows in Section 3.3.]

1b.3 Report Card Data Disaggregation
1b.3.1 Report Card: General Information & Demographics
General: Information is for 2005-2006 school year
Grades Served: 9-12 Safe School Status: Safe Students: 1,342 Economically Disadvantaged 37.7% NCLB Status: Good Standing In 2005-2006 Tennessee High School served an average daily membership of 1,342 students in grades 9-12. Tennessee High School is a safe school with a 37.7% economically disadvantaged population. Demographics: Information is for 2005-2006 school year Student Body (Based on Net Enrollment) Students # % White 1,258 93.7% African American 51 3.8% Hispanic 16 1.2% Asian 10 0.7% Native American 6 0.4% Pacific Islander 1 0.1%
Tennessee High School had a homogeneous (net) enrollment of 1,342 students with 6.2% of the student body having an ethnic background other than White. The racial makeup of the 2005-2006 student population was 93.7% White, 3.8% African American, 1.2% Hispanic, 0.7% Asian, 0.4% Native American, and 0.1% Pacific Islander. 1b.3.2 Report Card: Suspensions, Attendance Suspensions & Expulsions Suspensions Expulsions # % # % White 126 10.0% 0 0.0% African American 5 9.8% 0 0.0% Hispanic 0 0.0% 0 0.0% Asian 0 0.0% 0 0.0% Native American 2 33.3% 0 0.0% Pacific Islander 0 0.0% 0 0.0% Male 86 13.3% 0 0.0% Female 47 6.8%
0 0.0%
State of Tennessee
Bristol Report Card 2006 Director: Steve Dixon
Tennessee High School Principal: Mr. Jim Butcher

During the 2005-2006 school year, there were 133 out-of-school suspensions. Of these incidents, 86 (65%) were male and 47 (35%) were female. Of those suspended, 94.7% were White, 3.8%% were African American, and 1.5% were Native American. No expulsions occurred during the 2005-2006 school year. Grades 9-12: Non-Academic Indicators
2005 2006 State Goals
Attendance 91.9% 91.1% 93%
Three Year Annual Attendance Comparison
91.8 91.991.1
9090.5
9191.5
9292.5
93
2003-2004 2004-2005 2005-2006
School Year
Atte
ndan
ce %
The 2006 attendance rate (91.1%) decreased by almost one full percent from the 2005 attendance rate (91.9%) and falls short of the state goal of 93%.
Attendance Comparison by 20-day Reporting Period
94.4
93.5
92.7
91.2
91.7
90 89.6
89.1
90.4
91.4
92 91.3
90.8
89.9
89.7
88 90.1
80
85
90
95
Aug-Sept
Sept-Oct
Oct-Nov
Nov-Dec
Dec-Jan
Jan-Feb
Feb-Mar
Mar-Apr
Apr-May
Total
20-day Reporting Period
Per
cent
age
2006
2007
Further data from Tennessee High School’s management system, Mac School, indicates a decline in attendance percentages for each 20-day reporting period when the 2006 school year is compared to reporting periods so far for the 2007 school year.

1b.3.3 Report Card: Cohort Dropout, Graduation
Cohort Dropout Three Year Comparison
8.8% 3.5% 6.7%0.00%
2.00%
4.00%
6.00%
8.00%
10.00%
SY 2004 SY 2005 SY 2006
Cohort Dropout Rate Three Year Comparison by Gender and Ethnicity
12 5 4 0 0 1 0 8 911 8 6 0 0 0 0 14 1410 0 0 0 0 0 0 0 00
5
10
15
2005-06
2004-05
2003-04
2005-06 12 5 4 0 0 1 0 8 9
2004-05 11 8 6 0 0 0 0 14 14
2003-04 10 0 0 0 0 0 0 0 0
Grade Males Females AM AS BL HI WH Total
The cohort dropout rate decreased from 2004 to 2005 by 5.3% but subsequently increased by 3.2% from 2005 to 2006 (3.5% to 6.7%). However, Tennessee High School’s dropout rate still falls below the state benchmark of 10%. Data trends for the past 3 years indicate inconsistent results as the cohort dropout has fluctuated each year. Data indicates that Tennessee High School has a need to focus on reducing the number of students who drop out of school. There is no significant difference between male and female dropouts, however, there were 3 more male dropouts than female dropouts. The majority of the students who dropped out were white, which coincides with the proportion of white students in our general population. Grades 9-12: Non-Academic Indicators
2005 2006 State Goals
Graduation Percent 85.4% * 90%

* Under Revision
Graduation Rate Improvement Track Using 2003-04 as the baseline year, the tables below reflect the target graduation rate Tennessee High School must meet or exceed each year to meet the additional indicator for AYP to be on track to reach a 90% graduation rate by 2013-14.
Graduation Percent Three Year Comparison
82.2
85.4
80
81
82
83
84
85
86
SY 2004 SY 2005 SY 2006
Tennessee High School’s 2006 graduation rate is currently under revision and is not posted on the 2006 Report Card. The 2005 graduation rate was 85.4%, an increase of 3.2% from 2004. Tennessee High School was expected to achieve a graduation rate of at least 83.7% by 2006, according to state benchmarks. According to local calculations and a pending appeal, we hope to exceed this target rate; however, Tennessee High School may not exceed last year’s graduation rate of 85.4%.
School Name 2003-04 2004-05 2005-06 2006-07 2007-08
Tennessee High School 82.2% 82.9% 83.7% 84.4% 85.1%

1b.3.4 Report Card: Standardized Assessment Disaggregation GATEWAYS
High School Academic Achievement 2004
2004 2004 State
Gateway % Below Proficient
% Proficient
% Advanced
% Below Proficient
% Proficient
% Advanced
Algebra I 5.1 41.1 53.8 23.7 32.9 43.4 Biology I n/a 24.5 75.5 4.3 33.9 61.8 English II 5.3 32.7 62.0 13.1 33.5 53.4
2005 2005 2005 State
Gateway % Below Proficient
% Proficient
% Advanced
% Below Proficient
% Proficient
% Advanced
Algebra I 9.9 38.7 51.4 24.1 33.2 42.7 Biology I n/a 21.7 78.3 5.0 30.7 64.3 English II 6.9 27.7 65.4 9.7 30.1 60.2
2006 2006 2006 State
Gateway % Below Proficient
% Proficient
% Advanced
% Below Proficient
% Proficient
% Advanced
Algebra I 16.5 27.9 55.6 24.2 31.3 44.5 Biology I n/a 21.9 76.9 5.7 30.6 63.7 English II n/a 17.8 79.6 6.3 24.4 69.3
Gateway Data Three Year Comparison
94.9 100
94.7
90.1 10
0
93.1
83.5 98
.8
97.4
60
80
100
% P
rofic
ient
and
A
dvan
ced
Sco
res
2003-2004
2004-2005
2005-2006
2003-2004 94.9 100 94.7
2004-2005 90.1 100 93.1
2005-2006 83.5 98.8 97.4
ALGEBRA I BIOLOGY ENGLISH II
An analysis of the 3-year data provides the following information: • Although we exceeded the state average each year in Algebra I, Tennessee High
School students scoring proficient or advanced have steadily decreased over the past 3 years, dropping from 94.9% in 2004 to 83.5% in 2006. This is a decrease of 11.4% over the past 3 years.

• We have exceeded the state average each year in English II. Furthermore, Tennessee High School students scored 97.4% in 2006, an increase of 4.3% from 2005.
• Tennessee High School students have consistently scored well in Biology. In 2004 and 2005 every student tested scored either proficient or advanced. Although we still exceeded the state average in 2006, there was a decrease in Tennessee High School’s scores. We dropped from 100% to 98.8% in 2006.
GATEWAY ALGEBRA
Gateway Algebra I Three Year Comparison w/ State
94.9
90.1
83.5
76.3
75.9
75.8
020406080
100
2003-2004 2004-2005 2005-2006
School Year
% P
rofic
ient
and
A
dvan
ced
THS
STATE
The 2006 Report Card provided data for the following analysis for Gateway Math (Algebra I):
• In 2006, 83.5% of Tennessee High School’s Algebra I students scored advanced or proficient while the state average was 75.8%. This is a difference of 7.7%.
• In 2005, 90.1% of Tennessee High School’s Algebra I students scored advanced or proficient as compared to the state average of 75.9%, a difference of 14.2%.
• In 2004, 94.9% of Tennessee High School’s Algebra I students scored advanced or proficient as compared to the state average of 76.3%, a difference of 18.6%.
Algebra I Analysis by Proficiency Level
5.1
9.9
16.541
.1
38.7
27.9
53.8
51.4
55.6
0102030405060
SY 2004 SY 2005 SY 2006
School Year
Per
cent
age Below Proficient
Proficient
Advanced
Although the number of students scoring advanced on the Algebra I assessment are

improving, there has been a significant increase in students scoring below proficient, increasing from 5.1% in 2004 to 16.5% in 2006. There has also been a decline in the number of students who score proficient each year for the past three years.
Gateway Algebra I Three Year Comparison by Race/Ethnicity
96.2
9691.7
89 8092 92 84020406080
100
All
Stu
dent
s
Whi
te
His
pani
c
Afri
can
Am
eric
an
Nat
ive
Am
eric
an
Asi
an/P
acifi
c
Isla
nder
% P
rofic
ient
and
Adv
ance
d
SY 2004
SY 2005
SY 2006
Gateway Algebra I scores were further analyzed according to particular subgroups which included race/ethnicity. According to this data, Tennessee High School’s White students performed better than the African American students each year. In 2005, White students scored 91.7% proficient and advanced while African American students scored 89%. In 2006, White students scored 92% compared to 84% for African American students. There were not enough African American students tested in 2004 to disaggregate the data. Furthermore, there were not enough Hispanic, Native American, or Asian/Pacific Islander students tested in any of the years listed to disaggregate the data.
Gateway Algebra I Two Year Comparison by Gender
91.789 9192 92 91
80859095
100
All Students Males Females
Gender
% P
rofic
ient
and
A
dvan
ced
SY 2005
SY 2006
According to data from the 2005 and 2006 school years, there is no significant difference between male and female scores on the Gateway Algebra I assessment. Male proficient and advanced scores ranged from 89% to 92% while female scores remained constant at 91%.

Gateway Algebra I Three Year Comparison by Special Subgroup
96.2
96 8991.7
86 5592 89 62
020406080
100
All
Stu
dent
s
Eco
nom
ical
lyD
isad
vant
aged
Stu
dent
s w
/D
isab
ilitie
s
LEP
(ES
L)
Special Subgroup
% P
rofic
ient
and
A
dvan
ced
SY 2004SY 2005SY 2006
Further analysis indicates that students with disabilities score lower than students who are identified as economically disadvantaged. In particular, the 2005 and 2006 school year data indicate that scores are decreasing for students with disabilities declining from 89% in 2004 to 55% and 62% in 2005 and 2006 respectively, while students identified as economically disadvantaged have scores ranging from 96% in 2004 to 89% in 2006. There is no significant difference between all students tested and students who are identified as economically disadvantaged. During this 3-year period, not enough students with Limited English Proficiency (LEP/ESL) were tested to disaggregate the data. GATEWAY ENGLISH II
Gateway English II Three Year Comparison w/ State
94.7
93.1
97.4
86.9
90.3
93.7
020406080
100
2003-2004 2004-2005 2005-2006
School Year
% P
rofic
ient
and
A
dvan
ced
THS
STATE
The 2006 Report Card provided data for the following analysis for Gateway English (English II):
• In 2006, 97.4% of Tennessee High School’s English II students scored advanced or proficient while the state average was 93.7%. This is a difference of 3.7%.

• In 2005, 93.1% of Tennessee High School’s English II students scored advanced or proficient compared to the state average of 90.3%; a difference of 2.8%.
• In 2004, 94.7% of Tennessee High School’s English II students scored advanced or proficient compared to the state average of 86.9%, a difference of 7.8%.
English II Analysis by Proficiency Level5.
3
6.9
2.6
32.7
27.7
17.862 65
.4 79.6
0
20
4060
80
100
SY 2004 SY 2005 SY 2006
School Year
Per
cent Below Proficient
Proficient
Advanced
Students scoring advanced on the English II assessment increased each year during this three-year period, increasing from 62% in 2004 to 79.6% in 2006. There has also been a decline in the number of students who scored proficient each year, as well as an overall decline in below proficient scores from 2004 to 2006.
Gateway English II Three Year Comparison by Race/Ethnicity
95 9693 94 8995 95020406080
100
All
Stu
dent
s
Whi
te
His
pani
c
Afri
can
Am
eric
an
Nat
ive
Am
eric
an
Asi
an/P
acifi
c
Isla
nder
% P
rofic
ient
and
Adv
ance
d
SY 2004
SY 2005
SY 2006
Gateway English II scores were further analyzed according to particular subgroups which included race/ethnicity. According to this data, Tennessee High School’s White students performed slightly better than the African American students. In 2005, White students scored 94% proficient and advanced while African American students scored 89%. In 2004 and 2006 there were not enough African American, Hispanic, Native American, or Asian/Pacific Islander students tested to disaggregate the data.

Gateway English II Two Year Comparison by Gender
93 92 9595 92 96
020406080
100
All Students Males Females
Gender
% P
rofic
ient
and
A
dvan
ced
SY 2005
SY 2006
According to data from the 2005 and 2006 school years, there is no significant difference between male and female scores on the English II assessment. Male proficient and advanced scores were 92% both years while female scores ranged from 95% to 96%. The female students scored slightly better than the male students.
Gateway English II Three Year Comparison by Special Subgroup
95 96 8993 90 6895 92 72
020406080
100
All
Stu
dent
s
Eco
nom
ical
lyD
isad
vant
aged
Stu
dent
s w
/D
isab
ilitie
s
LEP
(ES
L)
Special Subgroup
% P
rofic
ient
and
A
dvan
ced
SY 2004SY 2005SY 2006
Further analysis indicates that students with disabilities score lower than students who are identified as economically disadvantaged. In particular, the 2005 and 2006 school year data indicates that scores are decreasing for students with disabilities, declining from 89% in 2004 to 68% and 72% in 2005 and 2006, respectively, while students identified as economically disadvantaged have scores ranging from 96% in 2004 to 92% in 2006. There is no significant difference between all students tested and students who are identified as economically disadvantaged. During this 3-year period, not enough students with Limited English Proficiency (LEP/ESL) were tested to disaggregate the data.

GATEWAY BIOLOGY
Gateway Biology Three Year Comparison w/ State
100
100
98.8
95.7
95.0
94.3
020406080
100
2003-2004 2004-2005 2005-2006
School Year
% P
rofic
ient
and
A
dvan
ced
THS
STATE
The 2006 Report Card provided data for the following analysis for Gateway Science (Biology):
• In 2006, 98.8% of Tennessee High School’s Biology students scored advanced or proficient while the state average was 94.3%. This is a difference of 4.5%.
• In 2005, 100% of Tennessee High School’s Biology students scored advanced or proficient compared to the state average of 95%; a difference of 5%.
• In 2004, 100% of Tennessee High School’s Biology students scored advanced or proficient compared to the state average of 95.7%; a difference of 4.3%.
Biology I Analysis by Proficiency Levels
1.2
24.5
21.7
21.9
75.5
78.3
76.9
0
20
4060
80
100
SY 2004 SY 2005 SY 2006
School Year
Per
cent Below Proficient
Proficient
Advanced
Students scoring advanced on the Biology I assessment declined from 2005 to 2006. Data also indicates an increase in the number of students scoring below proficient from 2005 to 2006 as well as a slight increase in the number of students scoring proficient. **Gateway Biology scores are not disaggregated on the State Report Card according to gender, race/ethnicity, limited English proficiency, economically disadvantaged, or students with disabilities.

End of Course
2004 2004 2004 State
End of Course % Below Proficient
% Proficient
% Advanced
% Below Proficient
% Proficient
% Advanced
Math Foundations 5.8 44.6 49.6 23.7 45.0 31.3
English I 7.5 51.3 41.2 16.8 51.6 31.6
2005 2005 2005 State
End of Course % Below Proficient
% Proficient % Advanced % Below
Proficient %
Proficient %
Advanced
Math Foundations 6.0 42.1 51.9 15.2 36.5 48.3 English I 5.2 35.7 59.1 12.2 45.0 42.8 Physical Science 9.3 49.5 41.2 16.6 45.1 38.3 US History 5.7 33.7 60.6 10.2 53.3 36.5
2006 2006 2006 State
End of Course % Below Proficient
% Proficient % Advanced % Below
Proficient %
Proficient %
Advanced
Math Foundations 16.4 68.0 15.6 20.4 48.5 31.1 English I n/a 45.2 53.9 6.4 50.6 43.0 Physical Science 7.5 48.2 44.3 11.7 45.6 42.7 US History n/a 31.3 67.6 7.6 54.0 38.4
200
End of Course DataThree Year Comparison
94.2
92.5
94 94.8
90.7
94.3
83.6
99.1
92.5
98.9
60
80
100
% P
rofic
ient
and
A
dvan
ced
Sco
res
2003-2004
2004-2005
2005-2006
2003-2004 94.2 92.5
2004-2005 94 94.8 90.7 94.3
2005-2006 83.6 99.1 92.5 98.9
MATH ENGLISH I PHYSICAL US HISTORY
An analysis of the three year data provides the following information:
• Although we exceeded the state average each year in Math Foundations, the number of Tennessee High School students scoring proficient or advanced have steadily decreased over the past three years, dropping from 94.2% in 2004 to 83.6% in 2006. This is a decrease of 10.6% over the past three years.
• We have also exceeded the state average each year in English I. Furthermore, Tennessee High School students scored 99.1% in 2006, an increase of 6.6% from 2005.
• The End of Course assessments for Physical Science and US History began in
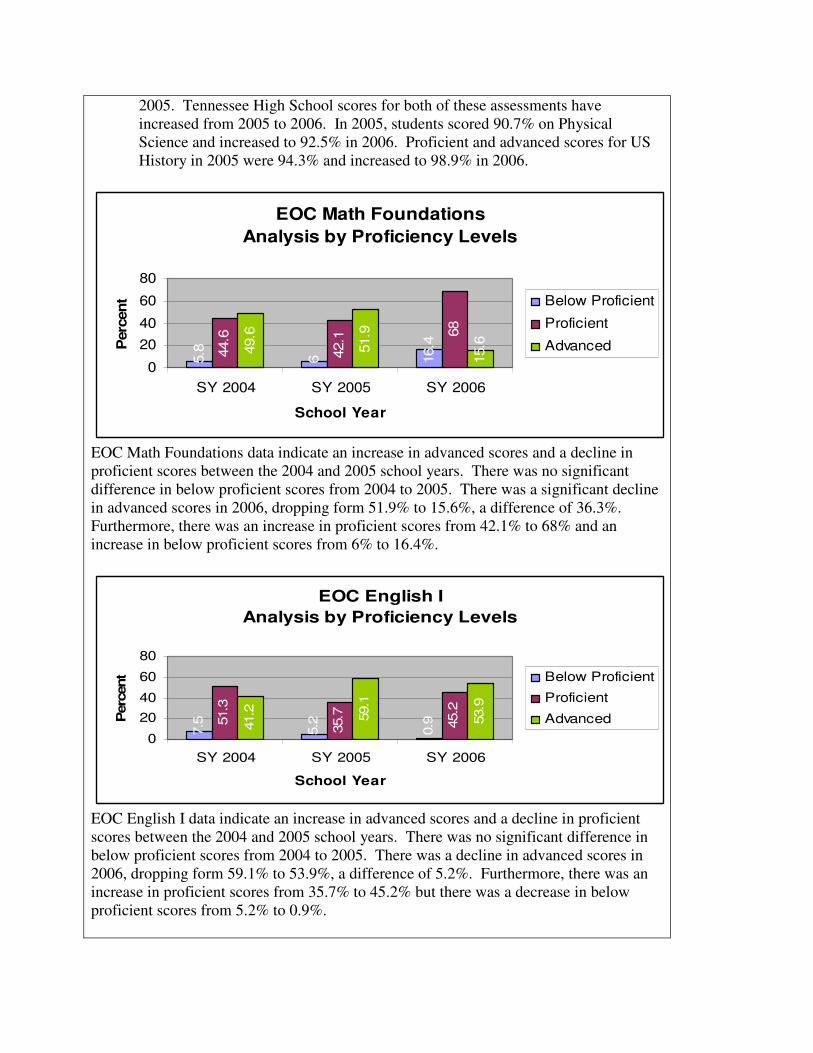
2005. Tennessee High School scores for both of these assessments have increased from 2005 to 2006. In 2005, students scored 90.7% on Physical Science and increased to 92.5% in 2006. Proficient and advanced scores for US History in 2005 were 94.3% and increased to 98.9% in 2006.
EOC Math FoundationsAnalysis by Proficiency Levels
5.8
6 16.444.6
42.1 68
49.6
51.9
15.6
0
2040
60
80
SY 2004 SY 2005 SY 2006
School Year
Per
cent Below Proficient
Proficient
Advanced
EOC Math Foundations data indicate an increase in advanced scores and a decline in proficient scores between the 2004 and 2005 school years. There was no significant difference in below proficient scores from 2004 to 2005. There was a significant decline in advanced scores in 2006, dropping form 51.9% to 15.6%, a difference of 36.3%. Furthermore, there was an increase in proficient scores from 42.1% to 68% and an increase in below proficient scores from 6% to 16.4%.
EOC English IAnalysis by Proficiency Levels
7.5
5.2
0.951
.3
35.7
45.2
41.2 59
.1
53.9
0
2040
60
80
SY 2004 SY 2005 SY 2006
School Year
Per
cent Below Proficient
Proficient
Advanced
EOC English I data indicate an increase in advanced scores and a decline in proficient scores between the 2004 and 2005 school years. There was no significant difference in below proficient scores from 2004 to 2005. There was a decline in advanced scores in 2006, dropping form 59.1% to 53.9%, a difference of 5.2%. Furthermore, there was an increase in proficient scores from 35.7% to 45.2% but there was a decrease in below proficient scores from 5.2% to 0.9%.

EOC Physical Science Analysis by Proficiency Levels
9.3
7.549
.5
48.2
41.2
44.3
0
2040
60
80
SY 2005 SY 2006
School Year
Per
cent Below Proficient
Proficient
Advanced
EOC Physical Science data indicate an increase in advanced scores and a decline in proficient scores between the 2005 and 2006 school years. There was no significant difference in below proficient scores from 2005 to 2006. The increase in advanced scores in 2006 was 3.1% while the difference in the decline in proficient scores was 1.3%. Furthermore, there was a decrease in below proficient scores from 9.3% to 7.5%.
EOC US History Analysis by Proficiency Levels
5.7
1.1
33.7
31.360
.6
67.6
0
2040
60
80
SY 2005 SY 2006
School Year
Per
cent Below Proficient
Proficient
Advanced
EOC US History data indicate an increase in advanced scores and a decline in proficient scores between the 2005 and 2006 school years. There was also a decline in below proficient scores from 2005 to 2006. The increase in advanced scores in 2006 was 7% while the difference in the decline in proficient scores was 2.4%. Furthermore, there was a decrease in below proficient scores from 5.7% to 1.1%.

11TH Grade Writing Gr Grades 9-12: Writing (3 year average) 2004 2005 2006 State 2006
Writing Score Grade Trend Score Grade Trend Score Grade Trend
Writing 11th 4.2 A NC 4.2 A NC 4.2 A NC 4.0 (Note: Based on 3-year averages.) Writing
11th Grade Writing Three Year Comparison w/ State
4.2
4.2
4.2
3.8
4 43.6
3.84
4.2
4.4
SY 2004 SY 2005 SY 2006
School Year
Sco
re THS
State
Tennessee High School 11th graders have consistently scored better than the state average on the Writing Assessment, maintaining an “A” average. For the past three years our scores have remained constant at 4.2, at least .2 above the state average.

ACT Grades 9-12: ACT
Grades 9-12: ACT
(3 year average) 2005 2006
Composite 21.5 21.4 English 21.4 21.4 Math 20.5 20.5 Reading 22.0 22.1 Science/Reasoning 21.6 21.3 (Note: Based on 3-year averages.)
ACT Three Year Score Comparison
21.3
20.4
22 21.5
21.4
21.7
20.9
22.3
21.5
21.7
21.1
20.1
22 20.9
21.2
18
20
22
24
2003-2004
2004-2005
2005-2006
2003-2004 21.3 20.4 22 21.5 21.4
2004-2005 21.7 20.9 22.3 21.5 21.7
2005-2006 21.1 20.1 22 20.9 21.2
ENGLISH MATH READING SCIENCE COMPOSITE
ACT data indicate consistency with little fluctuation in scores. English scores remain consistently in the range of 21.1 to 21.7; Math scores range from 20.1 to 20.9; Reading scores range from 22 to 22.3; Science scores range from 20.9 to 21.5; and the Composite scores range from 21.2 to 21.7.
2006 Average ACT Scores by Gender
21.1
21 23 21.9
21.9
21 19.3
21.3
20.2
20.6
1718192021222324
English Math Reading Science Composite
Males
Females

ACT data were further analyzed to evaluate progress of particular subgroups. Among these subgroups are males and females. 2006 ACT scores indicate that males score better than females in all areas tested. Furthermore, the data indicates that males significantly scored higher in the areas of Reading and Science.
2006 Percent of Students Meeting College Readiness Benchmark Scores by Gender
74 40 63 40 2877 30 53 21 140
20
40
60
80
100
English Math Reading Science Composite
Males
Females
College readiness benchmark scores are defined by ACT as a predictor for student success in college. Minimum scores in each defined area indicate a 50% chance of achieving a B or higher or a 75% chance of achieving a C or higher in the college subject area. The following minimum scores are defined by ACT as benchmark scores on each subtest for students to earn a B or better or a C or better, for each college subject listed: English Composition: 18 on ACT English Test; Algebra: 22 on ACT Math Test; Social Science: 21 on ACT Reading Test; Biology: 24 on ACT Science Test. According to 2006 ACT data, only 28% of male and 14% of female Tennessee High School students who took the ACT are prepared to make a C or better in college. Furthermore, Math and Science scores indicate that less than 40% of our students will be prepared for college Algebra and college Biology. English indicates our strongest area with 74% of males and 77% of females ready for college English Composition.

2006 Percent of Students Meeting ACT College Readiness Benchmark Scores by Race/Ethnicity
76 50 77 5034 17 37 058 42 60 029 25 30 020 17 20 00
10
20
30
40
50
60
70
80
90
English
Math
Reading
Science
Composite
English 76 50 77 50
Math 34 17 37 0
Reading 58 42 60 0
Science 29 25 30 0
Composite 20 17 20 0
All StudentsAfrican
American
Am. Indian-Alaskan Native
White HispanicAsian Am.-
Pacific Islander
Additional ACT data indicate college readiness by race/ethnicity. According to this data, 77% of Tennessee High School’s white students are ready for college English Composition while only 50% of our African Americans and Hispanics who tested are ready. Scores for Math show that only 37% of White students, 17% of African American students and 0% of Hispanic students are ready for College Algebra. Similar scores are apparent for Science with 30% of White students, 25% of African American students and 0% of Hispanic students ready for College Biology. Overall, only 20% of all Tennessee High School students are predicted to earn a C or better in college, based on the 2006 ACT data.

1b.3.6 Report Card: TVAAS (Value Added) TVAAS (Value Added)
High School: Grades 9-12 Value Added
Gateway / End of Course
Observed Score
Predicted Score
Status Observed 3 Yr Avg
Predicted 3 Yr Avg
Status 3 Yr Avg
Math (Alg I) 538.6 545.7 Below 541.9 549.0 Below Science (Bio I) 553.2 557.1 NDD 554.0 558.0 Below English (Eng II) 539.2 543.9 Below 532.3 538.3 Below Math Foundations 519.2 529.8 Below 540.5 540.0 NDD
English I 527.9 526.9 NDD 523.0 523.6 NDD
An analysis of TVAAS data revealed the following information for Gateway (Algebra I, Biology, English II) and End-of-Course areas (Math Foundations, English I):
• 2006 Value Added data show less than expected gains (Below) in Algebra I, English II, and Math Foundations.
� The observed score for Algebra (538.6) was less than the predicted score (545.7).
� The observed score for English II (539.2) was less than the predicted score (543.9).
� The observed score for Math Foundations (519.2) was less than the predicted score (529.8).
• 2006 Value Added data show NDD (no detectable difference) in gains for Biology and English I.
� The observed score (553.2) in Biology was slightly less than the predicted score (557.1).
� The observed score (527.9) in Biology was slightly higher than the predicted score (526.9).
• 2006 Value Added data show that no Gateway or End-of-Course area achieved more than expected gains.
• The three year average of TVAAS gains show NDD (no detectable difference) for Math Foundations and English I while the Gateway areas, Algebra I, Biology, and English II, were less than the predicted average.
Value Added
ACT Observed Score
Predicted Score
Status Observed 3 Yr Avg
Predicted 3 Yr Avg
Status 3 Yr Avg
Composite 21.3 21.5 NDD 21.5 21.5 NDD English 21.2 21.9 Below 21.5 21.8 NDD Math 20.1 20.7 Below 20.5 20.6 NDD Reading 22.2 22.0 NDD 22.2 22.0 NDD Science/ Reasoning 21.1 21.1 NDD 21.4 21.1 NDD
• 2006 Value Added data show less than expected gains for ACT English. The
observed score (21.2) was below the predicted score (21.9).

• 2006 Value Added data show less than expected gains for ACT Math. The observed score (20.1) was below the predicted score (20.7).
• 2006 Value Added data show NDD (no detectable difference) in gains for the Composite, Reading, and Science/Reasoning. � The observed ACT Composite score (21.3) was slightly less than the
predicted score (21.5). � The observed ACT Reading score (22.2) was slightly less than the
predicted score (22.0). � The observed ACT Science/Reasoning score (21.1) was equal to the
predicted score (21.1). • 2006 Value Added data show that no ACT area achieved more than expected
gains. • The three-year average of TVAAS gains indicated NDD (no detectable
difference) for all ACT subtests and the Composite score. Value Added
Writing Assessment
Observed Score
Predicted Score
Status Observed 3 Yr Avg
Predicted 3 Yr Avg
Status 3 Yr Avg
Grade 11 4.3 4.2 NDD 4.3 4.2 Above
• 2006 Value Added data show NDD (no detectable difference) in 11th Grade
Writing. The observed score (4.3) is slightly higher than the predicted score (4.2).
• The 3-year average observed score (4.3) of TVAAS gains is above the predicted average (4.2).

1b .3.7 Report Card: Annual Yearly Progress (AYP) Adequate Yearly Progress (AYP)
+Met Federal Benchmark x Did not meet Federal Benchmark <45 Fewer than 45 members does not have to report
High School
All White Hispanic African American
Native American
Asian/ Pacific
Islander
Econ Disadv
Students w/ Disabilities
Limited English
Proficient
Displaced Students
Math
% Tested + + <45 <45 <45 <45 + <45 <45 <45
% Proficient/Adv + + <45 <45 <45 <45 + <45 <45 <45
Reading, Language Arts, Writing
% Tested + + <45 <45 <45 <45 + <45 <45 <45
% Proficient/Adv + + <45 <45 <45 <45 + <45 <45 <45
Graduation Rate +
Met AYP? +
In 2006 Tennessee High School met the federal benchmarks for Adequate Yearly Progress (AYP) in all areas. AYP was met for percent proficient /advanced in Math, Reading, Language Arts, and Writing. In addition, THS exceeded the 95% participation rate for number tested.

1b.3 Other Assessment Data (Not included on Report Card) Advanced Placement Data Three-Year Score Comparison
AP Three Year Score Comparisons
4.08
3
3
2.5
1.33
3
3.62
5
3.75
2.33
3
3.30
8
3.11
8
2
4.66
7
2.83
3
4.08
3
3.26
7
5
1.5
4.6
2.83
3
0
1
2
3
4
5
6
2003-2004
2004-2005
2005-2006
2003-2004 3.75 3.625 1.333 2.5 3 4.083
2004-2005 2.833 4.667 2 3.118 3.308 2.333
2005-2006 2.833 4.6 1.5 5 3.267 4.083
ENGLISH CALCULUS AB CHEMISTRY BIOLOGY US HISTORY PSYCHOLOGY ART
Advanced Placement courses are offered at Tennessee High School in English, Calculus AB, Chemistry, Biology, US History, Psychology, and Art. The data above indicate that our AP English scores declined from 2004 to 2005, from 3.75 to 2.833 but remained constant from 2005 to 2006, at 2.833. We have shown an increase in Calculus AB as well as US History for this three-year period. Chemistry and Psychology show inconsistent results as scores fluctuate each year. Biology shows the most improvement increasing from 2.5 in 2004 to 5.0 in 2006 (no data for Biology is available for 2005). (It is important to note that AP data is not always a valid indicator of student success as there are occasions when only one student may take the assessment.)

SAT Data
SAT Three Year Score Comparison
511
568
1019
1023
533
525
1058
531
509
514
0
500
1000
15002003-20042004-20052005-2006
2003-2004 511 568 1019
2004-2005 514 509 1023
2005-2006 533 525 1058 531
VERBAL MATH COMBINED WRITING
SAT data for the past three-years indicate consistency in score trends. An increase is noted in Verbal Scores from 511 in 2004 to 533 in 2006. A decrease is apparent in Math scores from 568 in 2004 to 525 in 2006. The Combined score, however, has steadily increased over the past three-years.
2006 SAT Mean Score Comparison w/ Gender & State Average
533
550
518
573
525
539
511
569
531
531
532
572
480
490
500
510
520
530
540
550
560
570
580
Critical Reading
Math
Writing
Critical Reading 533 550 518 573
Math 525 539 511 569
Writing 531 531 532 572
THS Total Students
Male Female State Average

SAT data was further analyzed to evaluate progress of particular subgroups. Among these subgroups are males and females. 2006 SAT scores indicate that males scored better than females in Critical Reading, 550 v 518, and Math 539 v 511. The Writing subtest was new to the SAT for 2006 score reports. Writing scores indicate male and female students relatively equal in performance. When compared to the state average of 573 for Critical Reading, 569 for Math, and 572 for Writing, Tennessee High School falls short in each area, scoring at least 40 points below the state for each subtest.
2006 SAT Total Mean Score by Ethnicity
1 3 94 530
525
532
0100200300400500600
% Test-Takers
CriticalReading
Math Writing
American Indian-Alaskan Native
African American
White
Additional SAT data show that 94% of the students who took the test in 2006 were White, 3% were African American, and 1% were American Indian-Alaskan Native (1% did not respond). No score data were presented for the African American and American Indian-Alaskan Native subgroups. The average scores for White students were 530 for Critical Reading, 525 for Math, and 532 for Writing.
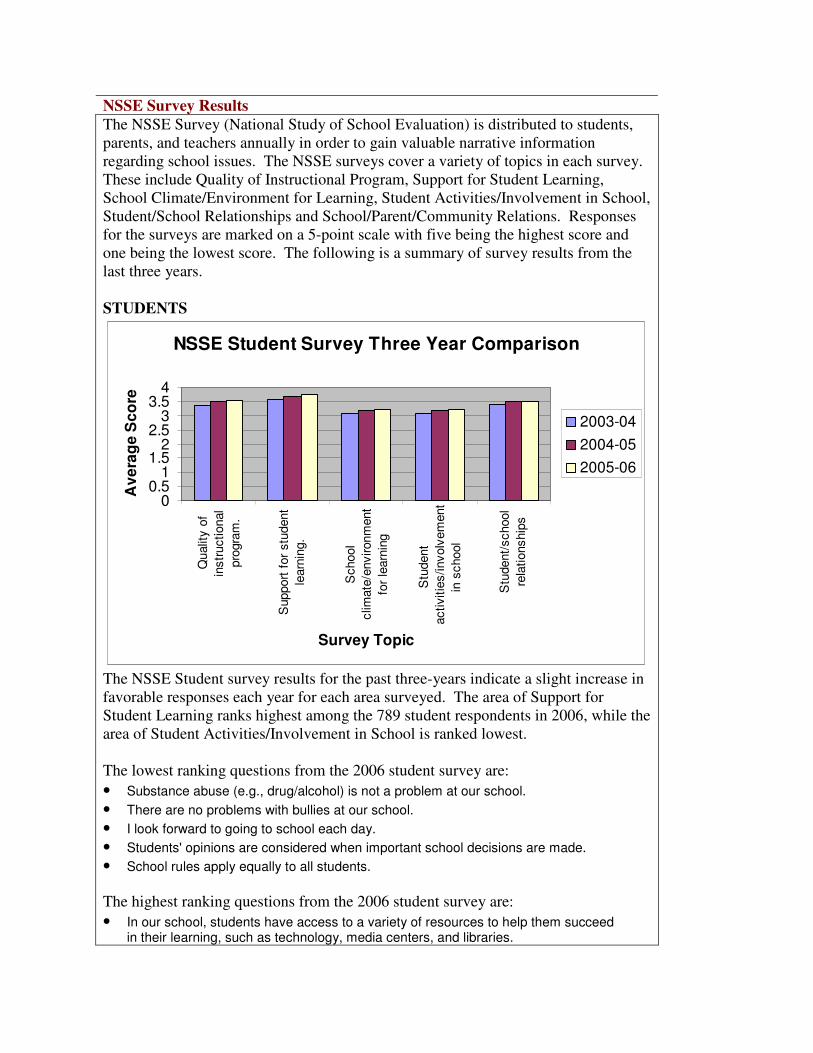
NSSE Survey Results The NSSE Survey (National Study of School Evaluation) is distributed to students, parents, and teachers annually in order to gain valuable narrative information regarding school issues. The NSSE surveys cover a variety of topics in each survey. These include Quality of Instructional Program, Support for Student Learning, School Climate/Environment for Learning, Student Activities/Involvement in School, Student/School Relationships and School/Parent/Community Relations. Responses for the surveys are marked on a 5-point scale with five being the highest score and one being the lowest score. The following is a summary of survey results from the last three years. STUDENTS
NSSE Student Survey Three Year Comparison
00.5
11.5
22.5
33.5
4
Qua
lity
ofin
stru
ctio
nal
prog
ram
.
Sup
port
for
stud
ent
lear
ning
.
Sch
ool
clim
ate/
envi
ronm
ent
for
lear
ning
Stu
dent
activ
ities
/invo
lvem
ent
in s
choo
l
Stu
dent
/sch
ool
rela
tions
hips
Survey Topic
Ave
rag
e S
core
2003-042004-052005-06
The NSSE Student survey results for the past three-years indicate a slight increase in favorable responses each year for each area surveyed. The area of Support for Student Learning ranks highest among the 789 student respondents in 2006, while the area of Student Activities/Involvement in School is ranked lowest. The lowest ranking questions from the 2006 student survey are: • Substance abuse (e.g., drug/alcohol) is not a problem at our school. • There are no problems with bullies at our school. • I look forward to going to school each day. • Students' opinions are considered when important school decisions are made. • School rules apply equally to all students. The highest ranking questions from the 2006 student survey are: • In our school, students have access to a variety of resources to help them succeed
in their learning, such as technology, media centers, and libraries.

• A counselor/advisor is available to help me select classes and provide guidance in planning for the future.
• Up-to-date computers and other technologies are used in our school to help students learn.
• Students are provided with opportunities to learn important knowledge and skills in each subject.
• I have an opportunity to participate in the activities that interest me (e.g., clubs, sports, music).
PARENTS
NSSE Parent Survey Three Year Comparison
3.3
3.4
3.5
3.6
3.7
3.8
3.9
School/Parent/CommunityRelations
Quality of instructionalprogram.
Support for studentlearning.
School climate/environmentfor learning
Survey Topic
Ave
rag
e S
core
2004-052005-06
The NSSE Parent survey results for the past two years indicate a decline in favorable responses each year for each area surveyed. For 2006, the area of School/Parent/ Community Relations ranks highest among the 356 parent respondents, while the area of Quality of Instructional Program is ranked lowest. The lowest ranking questions from the 2006 Parent survey are: • Substance abuse (e.g. drug/alcohol) is NOT a problem at our school. • There are no problems with bullies at our school. • Our school is preparing students to deal with issues and problems they will face in the
future. • Parent opinions are considered when important school decisions are made. • Students see a relationship between what they are studying and their everyday lives. The highest ranking questions from the 2006 parent survey are: • Our school provides textbooks and supplies that are current and in good condition. • The education offered to students at our school is of high quality. • Reports on my child's progress are clear and easy to understand. • In our school, students have access to a variety of learning resources to help them • Up-to-date computers and other technologies are used in our school to help students
learn.

TEACHERS
NSSE Teacher Survey Three Year Comparison
0
1
2
3
4
5
Quality of Instructional Programs Support For Student Learning School Climate/Environment ForLearning
School Organization/Administration
Survey Topics
Ave
rag
e S
core
2003-042004-052005-06
The NSSE Teacher survey results for the past three years indicate a slight decline in favorable responses each year for each area surveyed. For 2006, the area of Support for Student Learning ranks highest among the 75 teacher respondents, while the area of School Climate/Environment for Learning is ranked lowest. The lowest ranking questions from the 2006 Teacher survey are: • Substance abuse is NOT a problem at our school. • There are no problems with bullies at our school. • Students are respectful of school and community property. • School rules apply equally to all students. • School discipline is appropriately maintained at our school. The highest ranking questions from the 2006 Teacher survey are: • The curriculum at our school is based on clearly defined learning standards. • The education offered to students at our school is of high quality. • In our school, students have access to a variety of resources to help them succeed in
their learning, such as technology, media centers and libraries. • Our school is doing a good job at teaching language arts (reading, writing). • Our school is doing a good job at teaching science.

1b.4 Narrative Synthesis of All Data Several groups of stakeholders analyzed the data included in this component at various meetings throughout the school year. Among those involved in the analysis were faculty members through department meetings, A+ Team meetings, faculty meetings, and faculty inservice days; students through the Principal’s Student Advisory Team meetings and inservice days; parents and community members through the Principal’s Parent/Community Advisory Team meetings and inservice days; and administrators at weekly Administrative Team meetings. Areas of strength and areas to strengthen were identified, based on aggregate and disaggregate data. The following narrative provides a summary of data that was derived from the data presented in Component 3 with identified critical areas of strength and need identified.
1b.4.1 Critical Areas of Strength English II
• We have exceeded the state average each year in English II. Furthermore, Tennessee High School students scored 97.4% in 2006, an increase of 4.3% from 2005.
• Students scoring advanced on the English II assessment increased each year during the three year data period, increasing from 62% in 2004, to 79.6% in 2006.
• There has been a decline in the number of students who scored proficient each year, as well as an overall decline in below proficient scores from 2004 to 2006.
• In 2006, 97.4% of Tennessee High School’s English II students scored advanced or proficient while the state average was 93.7%. This is a difference of 3.7%.
• In 2005, 93.1% of Tennessee High School’s English II students scored advanced or proficient compared to the state average of 90.3%, a difference of 2.8%.
• In 2004,94.7% of Tennessee High School’s English II students scored advanced or proficient compared to the state average of 86.9%, a difference of 7.8%.
Biology
• Tennessee High School students have consistently scored well in Biology. According to report card data in 2004 and 2005, every student tested scored either proficient or advanced. Although we still exceeded the state average in 2006, there was a decrease in Tennessee High School’s scores. We dropped from 100% to 98.8% in 2006.
• In 2006, 98.8% of Tennessee High School’s Biology students scored advanced or proficient while the state average was 94.3%. This is a difference of 4.5%.

• In 2005, 100% of Tennessee High School’s Biology students scored advanced or proficient compared to the state average of 95%, a difference of 5%.
• In 2004, 100% of Tennessee High School’s Biology students scored advanced or proficient compared to the state average of 95.7%, a difference of 4.3%.
• Data indicates an increase in the number of students scoring below proficient from 2005 to 2006, as well as a slight increase in the number of students scoring proficient.
English I
• We have also exceeded the state average each year in English I. Furthermore, Tennessee High School students scored 99.1% in 2006, an increase of 6.6% from 2005.
Physical Science & US History
• The End of Course assessments for Physical Science and US History began in 2005. Tennessee High School scores for both of these assessments have increased from 2005 to 2006. In 2005, students scored 90.7% on Physical Science and increased to 92.5% in 2006. Proficient and advanced scores for US History in 2005 were 94.3% and increased to 98.9% in 2006.
Writing Assessment
• Tennessee High School 11th Graders have consistently scored better than the state average on the Writing Assessment, maintaining an “A” average. For the past three years our scores have remained constant at 4.2, at least .2 above the state average.
• 2006 Value Added data show NDD (no detectable difference) in 11th Grade Writing. The observed score (4.3) is slightly higher than the predicted score (4.2).
• The 3-year average observed score (4.3) of TVAAS gains is above the predicted average (4.2).
Annual Yearly Progress
• In 2006 Tennessee High School met the federal benchmarks for Adequate Yearly Progress (AYP) in all areas. AYP was met for percent proficient /advanced in Math, Reading, Language Arts, and Writing. In addition, THS exceeded the 95% participation rate for number tested.
NSSE Survey
The highest ranking questions from the 2006 Student survey are: • In our school, students have access to a variety of resources to help them succeed
in their learning, such as technology, media centers, and libraries. • A counselor/advisor is available to help me select classes and provide guidance in
planning for the future. • Up-to-date computers and other technologies are used in our school to help students
learn. • Students are provided with opportunities to learn important knowledge and skills in each

subject. • I have an opportunity to participate in the activities that interest me (e.g., clubs,
sports, music). The highest ranking questions from the 2006 Parent survey are: • Our school provides textbooks and supplies that are current and in good condition. • The education offered to students at our school is of high quality. • Reports on my child's progress are clear and easy to understand. • In our school, students have access to a variety of learning resources to help them • Up-to-date computers and other technologies are used in our school to help students
learn. The highest ranking questions from the 2006 Teacher survey are: • The curriculum at our school is based on clearly defined learning standards. • The education offered to students at our school is of high quality. • In our school, students have access to a variety of resources to help them succeed in
their learning, such as technology, media centers and libraries. • Our school is doing a good job at teaching language arts (reading, writing). • Our school is doing a good job at teaching science.
1b.4.2 Critical Areas of Need 2006 Algebra I
• The number of students scoring proficient or advanced have steadily decreased over the past three years, dropping from 94.9% in 2004 to 83.5% in 2006.
• There has been a significant increase in students’ scoring below proficient, increasing from 5.1% in 2004 to 16.5% in 2006.
• There has been a decline in the number of students who score proficient each year for the past three years.
• The 2005 and 2006 school year data indicate that scores are decreasing for students with disabilities declining from 89% in 2004 to 55% and 62% in 2005 and 2006 respectively.
• Sixty-two percent of students with disabilities scored proficient or advanced; 38% scored below proficient.
2006 English II • In 2005, White students scored 94% proficient and advanced while African
American students scored 89%. • The 2005 and 2006 school year data indicate that scores are decreasing for
students with disabilities, declining from 89% in 2004, to 68% and 72% in 2005 and 2006 respectively.
• Seventy-two percent of students with disabilities scored proficient or advanced; 28% scored below proficient.
Biology • In 2004 and 2005 data reflects that every student tested scored either
proficient or advanced.

• In 2006, there was a decrease in scores from 100% to 98.8%. • The number of students scoring advanced on the Biology I assessment
declined from 2005 to 2006. • Gateway Biology scores are not disaggregated on the State Report Card
according to gender, race/ethnicity, limited English proficiency, economically disadvantaged, or students with disabilities.
• Advanced Placement scores are not valid due to the number of students taking assessment tests.
End of Course Assessments:
• Foundations 2 o The number of students scoring proficient or advanced have steadily
decreased over the past three-years, dropping from 94.2% in 2004 to 83.6% in 2006, a decrease of 10.6% over the past three years.
ACT
• 2006 males scored better than females in all areas tested. • Males significantly scored higher in the areas of Reading and Science. • In 2006, only 28% of male and 14% of female students who took the ACT
were prepared to make a C or better in college. • Math and Science scores indicate that less than 40% of our students will be
prepared for college Algebra and college Biology. • Seventy-seven percent of white students were ready for college English
Composition while only 50% of our African Americans and Hispanics who tested were ready.
• Scores for Math show that only 37% of White students, 17% of African American students and 0% of Hispanic students are ready for College Algebra.
• Thirty percent of White students, 25% of African American students and 0% of Hispanic students ready for College Biology.
• Overall, only 20% of all Tennessee High School students are predicted to earn a C or better in college based on the 2006 ACT data.
SAT
• A decrease is apparent in Math scores from 568 in 2004 to 525 in 2006. • When compared to the state average of 573 for Critical Reading, 569 for
Math, and 572 for Writing, Tennessee High School falls short in each area, scoring at least 40 points below the state for each subtest
TVAAS
• 2006 Value Added data show less than expected gains (Below) in Algebra I, English II, and Math Foundations, ACT English, ACT Math.
• 2006 Value Added data show NDD (no detectable difference) in gains for 11th Grade Writing, Biology and English I, Composite, Reading, and Science/Reasoning.
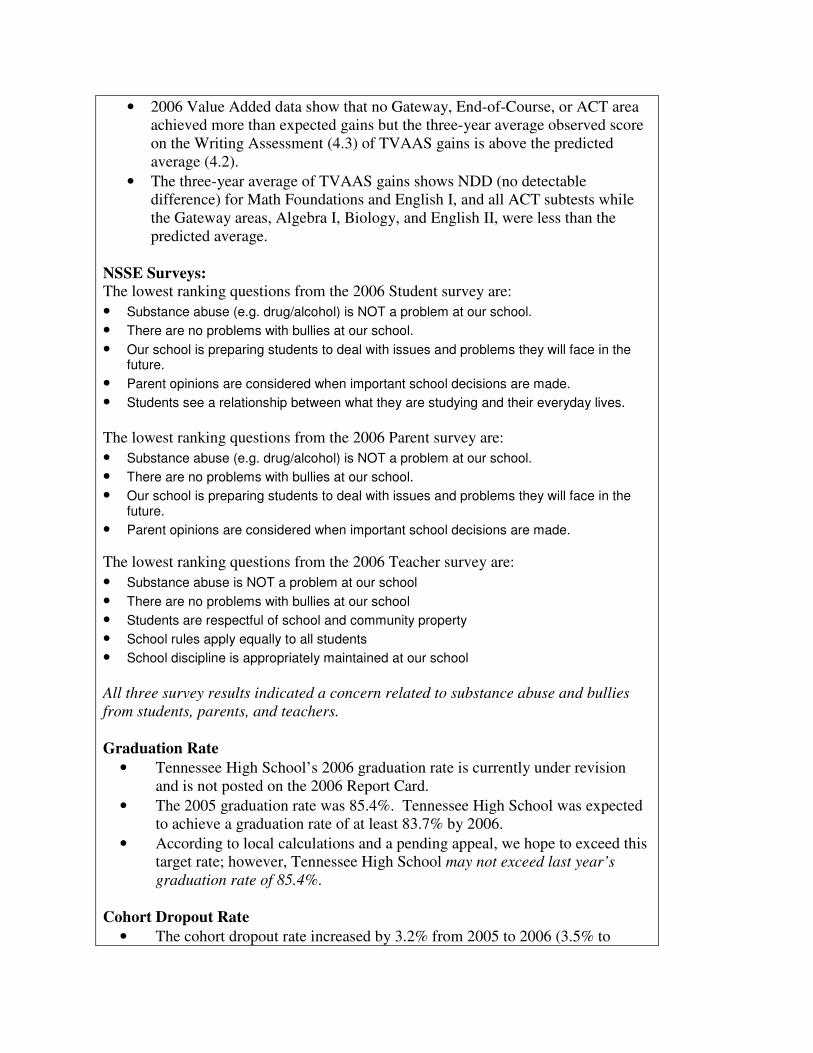
• 2006 Value Added data show that no Gateway, End-of-Course, or ACT area achieved more than expected gains but the three-year average observed score on the Writing Assessment (4.3) of TVAAS gains is above the predicted average (4.2).
• The three-year average of TVAAS gains shows NDD (no detectable difference) for Math Foundations and English I, and all ACT subtests while the Gateway areas, Algebra I, Biology, and English II, were less than the predicted average.
NSSE Surveys: The lowest ranking questions from the 2006 Student survey are: • Substance abuse (e.g. drug/alcohol) is NOT a problem at our school. • There are no problems with bullies at our school. • Our school is preparing students to deal with issues and problems they will face in the
future. • Parent opinions are considered when important school decisions are made. • Students see a relationship between what they are studying and their everyday lives. The lowest ranking questions from the 2006 Parent survey are: • Substance abuse (e.g. drug/alcohol) is NOT a problem at our school. • There are no problems with bullies at our school. • Our school is preparing students to deal with issues and problems they will face in the
future. • Parent opinions are considered when important school decisions are made. The lowest ranking questions from the 2006 Teacher survey are: • Substance abuse is NOT a problem at our school • There are no problems with bullies at our school • Students are respectful of school and community property • School rules apply equally to all students • School discipline is appropriately maintained at our school All three survey results indicated a concern related to substance abuse and bullies from students, parents, and teachers. Graduation Rate
• Tennessee High School’s 2006 graduation rate is currently under revision and is not posted on the 2006 Report Card.
• The 2005 graduation rate was 85.4%. Tennessee High School was expected to achieve a graduation rate of at least 83.7% by 2006.
• According to local calculations and a pending appeal, we hope to exceed this target rate; however, Tennessee High School may not exceed last year’s graduation rate of 85.4%.
Cohort Dropout Rate
• The cohort dropout rate increased by 3.2% from 2005 to 2006 (3.5% to
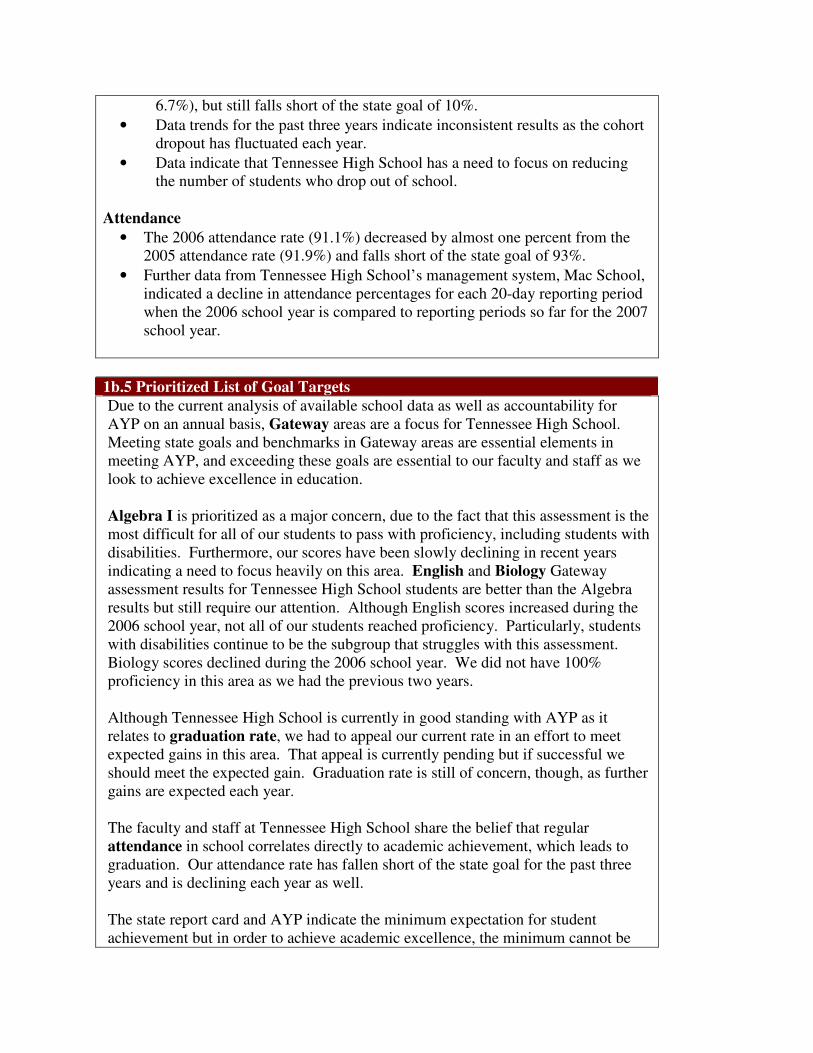
6.7%), but still falls short of the state goal of 10%. • Data trends for the past three years indicate inconsistent results as the cohort
dropout has fluctuated each year. • Data indicate that Tennessee High School has a need to focus on reducing
the number of students who drop out of school. Attendance
• The 2006 attendance rate (91.1%) decreased by almost one percent from the 2005 attendance rate (91.9%) and falls short of the state goal of 93%.
• Further data from Tennessee High School’s management system, Mac School, indicated a decline in attendance percentages for each 20-day reporting period when the 2006 school year is compared to reporting periods so far for the 2007 school year.
1b.5 Prioritized List of Goal Targets Due to the current analysis of available school data as well as accountability for AYP on an annual basis, Gateway areas are a focus for Tennessee High School. Meeting state goals and benchmarks in Gateway areas are essential elements in meeting AYP, and exceeding these goals are essential to our faculty and staff as we look to achieve excellence in education. Algebra I is prioritized as a major concern, due to the fact that this assessment is the most difficult for all of our students to pass with proficiency, including students with disabilities. Furthermore, our scores have been slowly declining in recent years indicating a need to focus heavily on this area. English and Biology Gateway assessment results for Tennessee High School students are better than the Algebra results but still require our attention. Although English scores increased during the 2006 school year, not all of our students reached proficiency. Particularly, students with disabilities continue to be the subgroup that struggles with this assessment. Biology scores declined during the 2006 school year. We did not have 100% proficiency in this area as we had the previous two years. Although Tennessee High School is currently in good standing with AYP as it relates to graduation rate, we had to appeal our current rate in an effort to meet expected gains in this area. That appeal is currently pending but if successful we should meet the expected gain. Graduation rate is still of concern, though, as further gains are expected each year. The faculty and staff at Tennessee High School share the belief that regular attendance in school correlates directly to academic achievement, which leads to graduation. Our attendance rate has fallen short of the state goal for the past three years and is declining each year as well. The state report card and AYP indicate the minimum expectation for student achievement but in order to achieve academic excellence, the minimum cannot be

acceptable. We must exceed these minimum expectations to compete with students across the state and achieve academic excellence. One assessment used to measure post-secondary success is the ACT. An in-depth analysis of ACT scores indicates that our students at Tennessee High School are not academically ready to be successful at the college level. An in-depth analysis of the data led to the development of the following goals by the stakeholders of Tennessee High School:
������������������������������������ ����� ����������� ���������������� ������
������ ����������
������������������������������������ ����� ����������� ������ �����������
���������� ����������
������������������������������ ���� � ��� ������� ������� � ��� �����
��� � ��������������������������
• �!� ��������� ������"�#���$ �� ���
• �%� ��������� ������"�&������'����
• �((� � ������"��� ��
������������������������������������ ���� � ��� ������� ������� � ��� ��� ��
��$ �� ����������������� ���������')���
These goals were revised to reflect the benchmarks expected on the state report card and to address the weaknesses identified by the stakeholders during the school improvement planning process.

����������!�����������"�#�����"����$����������������
�� The mission, vision, and belief statements were developed by students, parents, community members, and staff members for the school improvement plan through a collaborative process. The revision was initiated in September 2006 when the previous mission and belief statements were shared with staff at a faculty meeting, students at a Principal’s Student Advisory meeting, and mailed to parents and community members prior to a Principal’s Community Advisory Team meeting. At each meeting members were given a copy of the previous mission and belief statements, as well as handouts defining mission, vision, and belief statements. Since Tennessee High School’s previous School Improvement Plan did not include a vision statement, a handout describing how to develop a vision statement was also shared. On September 11, 2006, the handouts were given to the staff and they prepared to share input regarding each area at their next A+ Team meeting to be held during the week of September 25, 2006. A+ Teams met, collected input, and assimilated the information into draft statements. The students met on September 14, 2006, to develop draft mission, vision, and belief statements, and the parents and community members met on September 19, 2006, to do the same. An in-service day was scheduled for October 11, 2006. During the morning session faculty A+ Teams with support staff, parent and student representatives were divided into four groups to develop final drafts of the mission, vision, and belief statements, as well as to revise content for Component 1. Group members used the parent, student, and faculty drafts of each statement as a basis of discussion for the final draft. After each assimilated all of the draft statements into a final version, the groups gathered together to reach consensus on the mission, vision, and belief statements. At the October Administrative Team, Principal’s Student Advisory Team, and Parent Community Advisory Team meetings the final version was shared with administrators, students, parents and community members. The final version that was accepted by a consensus of these stakeholders is as follows:
MISSION STATEMENT The mission of Bristol Tennessee High School is to provide each student with an innovative and superior education to meet the challenges of an ever-changing society.
VISION STATEMENT
The vision of Tennessee High School is:
• To Perpetuate academic excellence through a compassionate and rigorous learning environment;
• To Promote an active partnership of service with the community; • To Produce students who exemplify VIKING PRIDE:

Students with Vision, Integrity, Knowledge, and Independence for the Next Generation, and who demonstrate
Personal Responsibility In Daily Effort.
BELIEF STATEMENTS
We believe that: � A secure and disciplined school is imperative. (Learning, Instruction) � A safe, clean, and physically comfortable environment enhances learning. (Learning, Policy) � Each student is a unique and valued person who can learn, achieve, and succeed.
(Assessment, Learning) � There should be mutual respect among all members of the learning community.
(Policy) � The entire community shares responsibility for the school’s mission. (Decision Making) � Higher expectations foster greater success.
(Assessment, Learning, Instruction) � Diverse educational practices and assessments promote learning and achievement.
(Policy, Learning, Instruction) � Excellence is worth the commitment. (Learning, Instruction)
������

����������%������ ��������&��� &��"�'����& �����"�����������"������(��)���������� ���������
3.1 Collaboration
The faculty and staff of Tennessee High School engage in ongoing collaboration for the purpose of increasing student achievement and teacher effectiveness. This collaboration is conducted among administrative team members, the Staff Development Leadership Team (SDL team), A+ Teams (Staff Development teams), the Principal’s Student Advisory Team, the Principal’s Parent/ Community Advisory Team, department chairs and departmental teams. This collaboration exists in all grade levels and across the curriculum, among high school and feeder school teachers and between school and system level personnel. Research is conducted and shared concerning Best Practices, and the administration and faculty examine student achievement to determine changes that are needed to benefit students and the school community. Specific focus areas are chosen and targeted for improvement. Data are collected and organized for analysis and interpretation. Steps are selected and action taken by the staff and administration. The principal shares school data and goals and seeks input in monthly advisory meetings with students, parents, and community members. Shared decision making provides additional opportunities for collaboration. Time is provided for collaboration. The administrative team meets weekly; the A+ teams meet twice a month during planning time; the department chairs meet monthly; the SDL team meet monthly; and the principal’s advisory team meets monthly. The teachers in A+ teams have common planning periods in which to meet. This year’s staff development focus is poverty, using “Understanding Poverty”, by Ruby Payne, as a resource. Two PTSA scheduled open houses are held per year, and two parent conference evenings are scheduled for the convenience of parents and guardians. Individual parent-teacher conferences are held as needed throughout the school year, before and after school, by phone, by email, and during teacher planning periods. Discussion of student progress and strategies for improvement are common topics for these meetings. Teachers are also required to make a minimum of two parent contacts per week. Faculty meetings are held monthly. Issues include school improvement, student achievement and data, reports, professional development activities, curriculum and instructional issues and school announcements. Department chairs meet monthly with the principal and departmental meetings are also held. Each School Improvement Planning team is represented by administrators, teachers, students, and parents/ community. A review and analysis of current data is shared and discussed. School Improvement Plan data are continually updated and compiled. Suggestions for implementation are derived from research-based strategies and practices, NSSE opinion surveys,

and collaboration. Athletic and Band Boosters meet monthly and the Center for Technical Education Planning Committee meets twice a year with industry representatives.
Communication among all members of the school community has been a major goal with the following improvements: School announcements and other pertinent information are posted on the school website; there is flexible scheduling of parent conferences with evening hours available; all teachers make weekly contact with parents; a school newsletter is mailed home to parents; and scholarships and other information are posted on the counseling website.
Other forms of communication include � Letters and phone calls to parents � Phone Master telephone communication system � Phones and intercom system in classrooms and offices � Cellular phones for administrators � Walkie-talkies for administrators, office staff, and safety officer � Freshman orientation � Mentoring of new teachers � Daily announcements posted on website � School calendars � Memos from principal and other members of administrative team � Newsletters, school and system web pages, and Vision (school system newsletter) � Interim student progress reports (to parents and students) � Six-week report cards � School Report Card (available online) � Academic Fair � System-wide email system in place � Local public access channel
Areas of Strength in the Collaborative Process
� The administration has vision. � The school is free from nepotism/ in-fighting. � There are strong community support and active parent involvement, including
band boosters, PTSA, and athletic boosters. � There are numerous opportunities for teachers to collaborate in A+ staff
development teams. � Many opportunities exist for collaboration among the administration, faculty,
students, and community. � A variety of communication tools are utilized. � System wide e-mail is provided for all employees. � Reports on student progress are clear and easy to understand. (NSSE Parent
Survey 2006)
Areas to Strengthen in the Collaborative Process � Classroom web pages for posting of assignments and other classroom information
should be developed by all teachers. � Teacher email addresses should be available on the school web page.
� The administration will continue to seek input from students and parents in school decision making (NSSE Student and Parent Survey results, 2006).
� There needs to be greater involvement by parents and guardians in their children’s educational program, especially in curriculum and instruction.
3.2 Evaluation of the Decision Making Process
The Tennessee High School decision-making process is guided by No Child Left Behind, The Tennessee Board of Education, Tennessee Code Annotated, and the Bristol City School Board Policy Manual. Continuous improvement is the goal of decision making and the planning process. Shared decision making at the high school focuses on student achievement and instructional strategies. Many decisions are based upon mutual agreement and consensus.
Staff members have opportunities for input through staff meetings, staff development meetings, and departmental meetings. A common planning time provides ample opportunities for cross-curricular A+ team meetings where teachers and administrators share and discuss instructional ideas and strategies. All departments meet monthly to make instructional decisions regarding student achievement. In addition, department chairs meet monthly with the administrative team and share in the decision-making process.
Parents, community, teachers, and students also participate in annual NSSE surveys where they offer their opinions, concerns, and ideas. Parent, student, and community representatives also serve on the Principal’s Advisory Teams. Parents, students, and staff participate in PTSA meetings, and two administrators serve on the PTSA board and attend monthly meetings.
The Component Three team analyzes data from multiple sources, and the analysis provides valuable data and focus for school improvement, curriculum planning, scheduling, and organization.
Areas of Strength in the Decision-Making Process
� Tennessee High School is a flagship for education in our region, with innovative programs, an aligned curriculum, technology, and community support.
� The staff is highly qualified, open-minded, committed, and caring, with a commitment to technology.
� Good relationships exist between the staff and the school board. � Decisions are made in accordance with school board policies. � The decision-making process is data driven. � There are numerous opportunities for input from staff, students, parents, and
community.

Areas to Strengthen in the Decision-Making Process � School rules should apply equally to all students (NSSE Student Survey 2006). � Students’ opinions are considered when important school decisions are made
(NSSE Student Survey 2006). � Parent opinions should be considered when important school decisions are made
(NSSE Parent Survey 2006). � School discipline is appropriately administered at our school. (NSSE Teacher
Survey 2006).
3.3 Resource Allocation The following allocations were distributed as part of the 2006-07 operating budget:
� Instructional Supplies � Career and Technical Education � Band � Chorus � JROTC � Leadership Challenge � Staff Development � Capital Outlay � Administrative � Materials and Supplies, Library � General Fund BOE
$25,200 $44,000
$6,600 $3,000 $1,500 $1,000 $8,000
$15,950 $32,142 $18,464 $11,393
Total Allocations $167,249.00 Resource Allocation: Equipment and Instructional Materials
Current Resources Utilization of Resources Connection to School Improvement
39 laptop computers, 3 mobile stations, wireless network $50,574
� Runs PLATO program for daily instruction and practice
� Credit Recovery � Gateway and EOC
preparation � Gateway
intervention � Special Services
instruction � Research � Email
communication � ACT Preparation
Supports the achievement of AYP and School Improvement Goals 1-4. Provides additional support for student achievement in the classroom and on state-mandated testing.

PLATO Software $60,000 PLATO Service Fee $2,000 (annual fee) Plato math upgrade 05/06 $5,250 Plato math upgrade 06/07 $5,250
Grades 9-12 (THS and The Learning Center) � Credit Recovery � Gateway and EOC
preparation � Special Services
instruction � ACT preparation
Supports the achievement of AYP and School Improvement Goals 1-4. Provides additional support for student achievement in the classroom and on state-mandated testing.
Howe 2 Software/ Math Lab $2,500 Upgrades 04/05 - $90.00 03/04 - $90.00 02/03 - $155.00
Grades 9-12 � Gateway and EOC
preparation � Special Services
instruction
Supports the achievement of AYP and School Improvement Goals 1-4. Provides additional support for student achievement in the classroom and on state-mandated testing.
Math Calculators 24 simple calculators @ $1= $24; 88 Explorer Plus @ $10 = $880; 78 Ti34 @ $15.50= $1,209; 264 graphing calculators (including library) @$99 = $26,136 4 graphing calculator view screens for overhead projectors @ $300 = $1,200
� Credit Recovery � Gateway and EOC
preparation � Special Services
instruction � ACT preparation
Supports the achievement of AYP and School Improvement Goals 1-4.
Library Research Lab, 30 computers, $30,000; printer,$1,000; wiring expenses (system funded), remodeling of room (system funded)
� Credit Recovery � Gateway and EOC
preparation � Special Services
instruction � ACT preparation � Research
Supports the achievement of AYP and School Improvement Goals 1-4. Provides additional support for student achievement in the classroom and on state-mandated testing.
Plato Lab, 30 computers, $30,000; printer, $500
� Credit Recovery � Gateway and EOC
preparation � Special Services
instruction � ACT preparation � Research
Supports the achievement of AYP and School Improvement Goals 1-4. Provides additional support for student achievement in the classroom and on state-mandated testing.
Math Lab, 30 computers, $30,000; printer, $500; remodeling of room (system funded)
� Credit Recovery � Gateway and EOC
preparation � Special Services
Supports the achievement of AYP and School Improvement Goals 1-4. Provides additional support for

instruction � ACT preparation � Research
student achievement in the classroom and on state-mandated testing.
4 Classroom computer labs for information technology, $120,000
� Keyboarding � Word Processing � Writing
Supports the achievement of AYP and School Improvement Goals 1-4.
80 classroom computers, $80,000
� Credit Recovery � Gateway and EOC
preparation � Special Services
instruction � ACT preparation � Research
Supports the achievement of AYP and School Improvement Goals 1-4. Provides additional support for student achievement in the classroom and on state-mandated testing.
East Tennessee Virtual School (funded by $75,000 Niswonger grant)
� Credit Recovery � New credit
Supports the achievement of AYP and School Improvement Goals 1-4.
5 interactive school pads, $3,500
Provides resources to improve student achievement in the classroom
Provides teacher resources to improve student achievement in the classroom
3 SmartBoards $3,000 8 projectors (Social Studies)
� Class notes � Student
presentations
Supports the achievement of AYP and School Improvement Goals 1-4.
Accelerated Reader Books, tests, and software $2,000
� Reading reinforcement
� Recreational reading � Special Services
Supports the achievement of AYP and School Improvement Goals 1-4.
Reading Counts Books, tests, and software $1,500
� Reading reinforcement � Recreational reading � Special Services
Supports the achievement of AYP and School Improvement Goals 1-4.
Purchase of ACT and career resources, both print and non-print, $1,200
� ACT preparation � Research
Supports the achievement of AYP and School Improvement Goals 1-4. Provides additional support for student achievement in the classroom and on state-mandated testing.
2 classroom sets of Newsweek magazine (Honors Government and Contemporary Issues classes ) $100
� Reading reinforcement � Recreational reading � Research
Supports the achievement of AYP and School Improvement Goals 1-4.
Gateway Coach Books and CD roms Mathematics (including
� Credit Recovery � Gateway and EOC
preparation
Supports the achievement of AYP and School Improvement Goals 1-4.
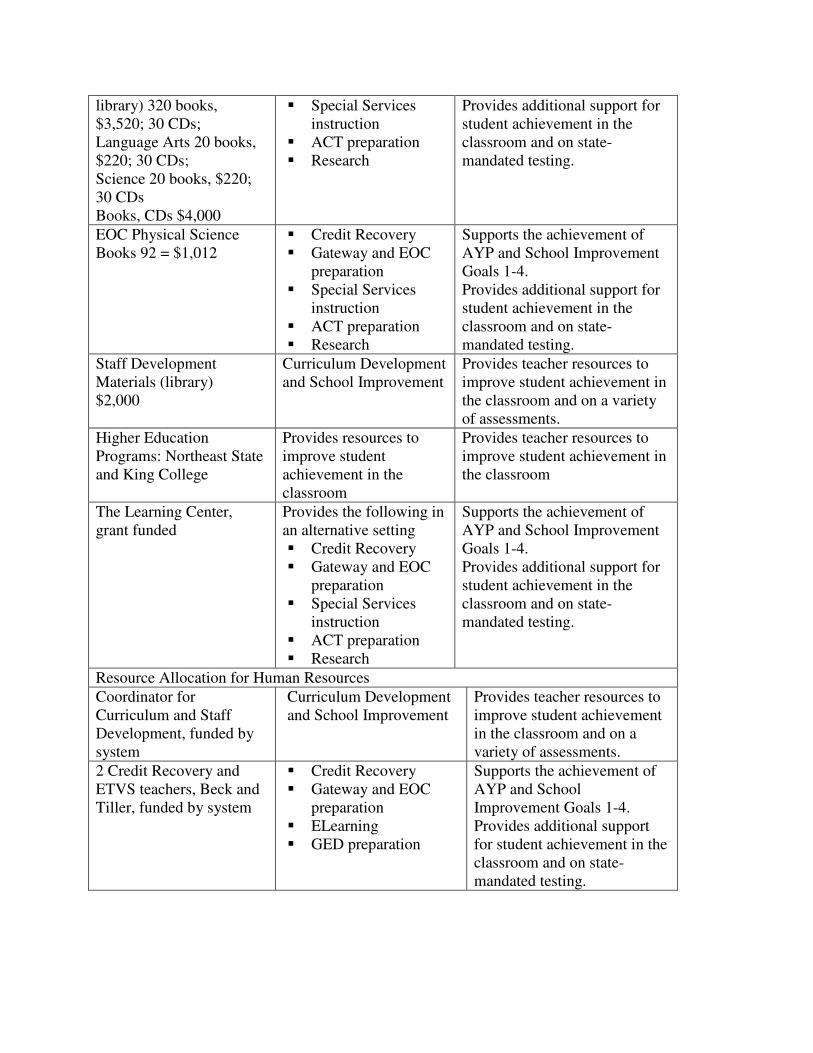
library) 320 books, $3,520; 30 CDs; Language Arts 20 books, $220; 30 CDs; Science 20 books, $220; 30 CDs Books, CDs $4,000
� Special Services instruction
� ACT preparation � Research
Provides additional support for student achievement in the classroom and on state-mandated testing.
EOC Physical Science Books 92 = $1,012
� Credit Recovery � Gateway and EOC
preparation � Special Services
instruction � ACT preparation � Research
Supports the achievement of AYP and School Improvement Goals 1-4. Provides additional support for student achievement in the classroom and on state-mandated testing.
Staff Development Materials (library) $2,000
Curriculum Development and School Improvement
Provides teacher resources to improve student achievement in the classroom and on a variety of assessments.
Higher Education Programs: Northeast State and King College
Provides resources to improve student achievement in the classroom
Provides teacher resources to improve student achievement in the classroom
The Learning Center, grant funded
Provides the following in an alternative setting � Credit Recovery � Gateway and EOC
preparation � Special Services
instruction � ACT preparation � Research
Supports the achievement of AYP and School Improvement Goals 1-4. Provides additional support for student achievement in the classroom and on state-mandated testing.
Resource Allocation for Human Resources Coordinator for Curriculum and Staff Development, funded by system
Curriculum Development and School Improvement
Provides teacher resources to improve student achievement in the classroom and on a variety of assessments.
2 Credit Recovery and ETVS teachers, Beck and Tiller, funded by system
� Credit Recovery � Gateway and EOC
preparation � ELearning � GED preparation
Supports the achievement of AYP and School Improvement Goals 1-4. Provides additional support for student achievement in the classroom and on state-mandated testing.

SRO Officer (funded by system and city)
� Provides support for student learning
Supports the achievement of AYP and School Improvement Goals 1-4. Provides additional support for student achievement in the classroom
Peer Tutors, no cost
� Credit Recovery � Gateway and EOC
preparation � Special Services
instruction � ACT Preparation � Research
Supports the achievement of AYP and School Improvement Goals 1-4. Provides additional support for student achievement in the classroom and on state-mandated testing.
Peer Tutor Coordinator, funded by system
� Credit Recovery � Gateway and EOC
preparation � Special Services
instruction � ACT preparation � Research
Supports the achievement of AYP and School Improvement Goals 1-4. Provides additional support for student achievement in the classroom and on state-mandated testing.
Counselors, Frontier Health (grant funded)
� Provide support for student learning.
Provide additional support for student achievement in the classroom and on state-mandated testing.
Extended Contract Hours, $39,000 funded by system
� Credit Recovery � Gateway and EOC
preparation � Special Services
instruction � ACT preparation �
Supports the achievement of AYP and School Improvement Goals 1-4. Provides additional support for student achievement in the classroom and on state-mandated testing.
SST Committee (Student Services Team) no cost
� Provide support for student learning.
Provide additional support for student achievement in the classroom and on state-mandated testing.
Resource Allocation for Special Programs Quest for Success and Renaissance Programs $4,000 talent show, $10,000 donations from business partners annually
Student incentives for attitude, achievement, attendance
Supports the achievement of AYP and School Improvement Goals 1-4.
Staff Development Stipends for SDL team, $1,600; membership in NSDC ($99) and ASCD
Provides support for classroom instruction and student learning.
Supports the achievement of AYP and School Improvement Goals 1-4. Provides additional support

($39); 80 books (A Framework for Understanding Poverty) for A+ teams ($1,760)
for student achievement in the classroom and on state-mandated testing.
Technology Conference $719.00 Other conferences $3,773 2005-2006 Library - $552.00 Adv. Place. - $1,762.76 Kaplan - $788.26 For. Lang. - $520.00 Gateway - $150.00 3.4 Curriculum Analysis and Support
In conjunction with best instructional practices, we have aligned our curriculum system-
wide and have established specific benchmarks for mastery in all subject areas. With the articulation and communication among staff, teachers have also developed pacing guides for each course, and Applied Technology teachers are implementing Vocational Skills Profiles.
In addition to our curriculum alignment, much preparation has been made for Gateway and other End-of-Course tests. Staff development opportunities have been provided for teachers to develop a plan for administering and monitoring End-of-Course tests, and teachers have attended Gateway Institutes.
All teachers correlate their planning and instruction to the curriculum frameworks, standards, performance indicators, and benchmarks. The Tennessee Blueprint guides curriculum planning for state testing. Bell ringer activities are a school goal to maximize use of classroom instruction and learning. Next year ACT bell ringers will be implemented across all curricular areas and in all grade levels. Classroom teachers analyze student data, including tests and practice tests, projects, and other student work to determine academic attainment and to improve achievement and instruction. Formative and summative assessments provide crucial information in monitoring and adjusting the curriculum. Student work is assessed using a grading scale or rubric. Interim reports and six weeks grade reports reflect students’ achievement. Teachers meet in A+ teams (cross-curricular staff development teams) and in departments to discuss student achievement and share instructional ideas. Standardized test scores, student report card grades, NSSE surveys, as well as other surveys, and state report card data are analyzed to ensure curriculum alignment, effective use of Best Practices, and school improvement. Gateway and End-of-Course results are reviewed in May and shared with the staff during fall in-service. Eleventh Grade Writing Assessment information is also shared with the staff in May. Assessment results are disaggregated by gender, special education, and socioeconomic status. Because Tennessee High School has less than five

percent of students from ethic subgroups, minimal data is obtained from this disaggregation. Gateway, End-of-Course teachers, department chairs, special education teachers, counselors, and administrators review assessment data and summaries to better plan instruction and staff development activities. Standardized testing information is shared with students and parents, and the state report card is also available on the system web page. A thorough data analysis is included in Component Three of this plan. Curricular offerings are published in the Course Offerings catalog and shared at Freshman Orientation, PTSA meetings, and principal’s advisory meetings. Curricular communication is also promoted through newsletters, announcements, and Vision, the school system newspaper.
Only textbooks that support the aligned curriculum are purchased. The purchase of new instructional materials is guided by school improvement plan goals and state standards. A grant was received in the fall of 2001 that provided seven computers in each of four Gateway classes. Four computer labs have been installed: A library research lab, a math Lab, a science lab, and a Plato lab. Plato software for Gateway remediation and intervention has been purchased, and parents and staff have been trained in its use. Howe II software is another tool for Algebra I and Foundations II End-of-Course remediation and intervention, and the software is available in all math classrooms and in all computer labs, with math teachers trained in its use. The Tennessee High staff shares information about curriculum in staff meetings, departmental meetings, and SDL and A+ staff development meetings. The following topics have been studied by A+ teams: Best Practices, Cooperative Learning, Project-Based Learning, and poverty (A Framework for Understanding Poverty, by Ruby Payne).
Collaboration between the high school and middle school occur both formally and informally. System level administrators support curricular changes and promote student achievement. Instructional needs are continually assessed by the administration and staff of Tennessee High School. Student achievement guides the staff development program. The administration used the Tennessee Framework for Evaluation to evaluate the teaching of certified employees. Teachers are evaluated formally each year until tenure is attained. Teachers are evaluated a minimum of two times in ten years after reaching tenure status. Teachers are evaluated by one of two models, comprehensive or focused assessment. Planning, reflection, and classroom observations are part of the evaluation process. New teachers are assigned a mentor to guide their development as novice teachers.
The curriculum is reviewed and modified to meet the changing needs of students. Using the results of the 2006 NSSE surveys, students and parents feel that students have access to a variety of resources to help them succeed. Students also indicated that they have opportunities to learn important knowledge and skills in each subject. One of the top five items in the Parent Survey indicated that the education offered to students at Tennessee High School is of high quality.
Curriculum improvements include: � The Learning Lab, which is available for students who need more individualized
attention � Tutoring before and after school and in the evening � Peer Tutoring program � Leadership Challenge class � Work-Based Learning program with hands-on education in the job environment � ACT/ SAT classes � Career Management Success � Credit Recovery classes � Numerous clubs which, as an extension of the curriculum, provide students with leadership
and community service opportunities. � Career and Technical articulation agreements with postsecondary institutions.
Areas of Strength in Curriculum Analysis and Support � Students have access to online courses through Bristol’s own East Tennessee Virtual
School. � A business partnership with the Niswonger Foundation supports this eLearning initiative. � eLearning partnerships with other Tennessee school systems, which allows students in
other districts to take Tennessee High School’s classes online. � There is documentation of curriculum planning and instruction. � The curriculum is based on clearly defined learning standards (2006 NSSE Teacher
Survey) Instruction meets national, state, and local standards. � Ongoing collaboration exists among department members, cross-curricular staff
development teams, and middle school teachers. � A counselor is available to help students select classes and provide guidance in planning
for the future (2006 NSSE Student Survey). � Up-to-date computers and other technologies are used to help students learn (2006 NSSE
Student and Parent Surveys). � Students have access to a variety of resources to help them succeed (2006 NSSE Parent
and Teacher Surveys). � The education offered to students is of high quality (2006 NSSE Teacher Survey). � There is community pride in the school. � Funding and facilities are adequate. � Strong extracurricular activities exist for all students. � There is an emphasis on school security and safety.
Areas to Strengthen in Curriculum Analysis and Support
� A data team will be developed to analyze and communicate student data to the school community.
� Class size is too large for lower academic, foundational-type classes. � There are students who don’t want to come to school because they don’t fit in. � Student work ethic needs improvement. � Some students are disruptive/ non-attentive. � There is a lack of student respect for higher authority.

� The emphasis on an innovative curriculum and teaching methodology to engage all students should be continued.
� A continued integration of academics with other curricular areas is needed. � The Parent, Student, and Teacher NSSE Surveys indicate a problem with substance abuse
and bullying (2006).
3.5 Instructional Analysis and Support Instructional practices are continually reviewed and modified to maximize student achievement. A variety of resources is used to determine effectiveness of instruction and learning including teacher evaluations, both formal and informal, classroom observations, examination of student work, student and teacher interviews, surveys, review of lesson plans, assessment data, and Best Practice research. These best practices are described in the book Best Practice, New Standards for Teaching and Learning in America’s Schools. A brief description of Best Practice follows:
Student-Centered. The best starting point for schooling is young people’s real interests; all across the curriculum, investigating students’ own questions should always take precedence over studying arbitrarily and distantly selected “content”.
Experiential. Active, hands-on, concrete experience is the most powerful and natural form of learning. Students should be immersed in the most direct possible experience of the content of every subject.
Holistic. Children learn best when they encounter whole ideas, events, and materials in purposeful contexts, not by studying sub-parts isolated from actual use.
Authentic. Real, rich, complex ideas and materials are at the heart of the curriculum. Lessons or textbooks that water-down, control, or oversimplify content ultimately disempower students.
Expressive. To fully engage ideas, construct meaning, and remember information, students must regularly employ the whole range of communicative media—speech, writing, drawing, poetry, dance, drama, music, movement, and visual arts.
Reflective. Balancing the immersion in experience and expression must be opportunities for learners to reflect, debrief, abstract from their experiences what they have felt and thought and learned.
Social. Learning is always socially constructed and often interactional; teachers need to create classroom interactions that “scaffold” learning.
Collaborative. Cooperative learning activities tap the social power of learning better than competitive and individualistic approaches.
Democratic. The classroom is a model community; students learn what they live as citizens of the school.
Cognitive. The most powerful learning comes when children develop true understanding of concepts through higher-order thinking associated with various fields of inquiry and through self-monitoring of their thinking.
Developmental. Children grow through a series of definable but not rigid stages, and schooling should fit its activities to the developmental level of students.

Constructivist. Children do not just receive content; in a very real sense, they recreate and reinvent every cognitive system they encounter, including language, literacy, and mathematics.
Challenging. Students learn best when faced with genuine challenges, choices, and responsibility in their own learning.
Research based strategies such as PLATO have been implemented to improve student
performance on state-mandated assessments. This software supports the Credit Recovery tutoring programs. Bristol’s East Tennessee Virtual School provides multiple and varied opportunities for not only Tennessee High School students but also students in area high schools to earn credit.
Special education accommodations are well documented and supported in multiple ways,
with the Learning Lab, peer tutoring program, and modified instruction and assessment. Technology continues to support instruction with a student/ computer ratio of less than
4:1. Every classroom has at least one computer with Internet access. Other technology improvements include three mobile laptop labs, teacher workstations with email, and state of the art equipment in Career and Technical Education classes, including a plasma cutter, and a CAD model generating machine. In addition, Career and Technical Education competency profiles are online, and teachers have access to an online forum by which staff can share ideas and discuss issues and concerns.
Facility improvements include Doc’s Courtyard (in honor of former science teacher,
Frank (Doc) Maples) and the Renaissance Hard Work Café, where teachers can take their classes as a reward for hard work on a test or class project. In addition, Project FINE has funded The Learning Center, located off campus in the former Wal-Mart shopping center, and security cameras, computers, and other equipment, as well as the re-keying of Tennessee High School.
An extensive school safety plan has been developed by Tennessee High School staff and
community stakeholders that will be used as a model for other schools in our district. We have a safety officer on campus, and we also utilize other sources, including dogs trained for detection of drugs, drug testing of athletes, and counselors from the community to help ensure that our school is safe and drug-free.
Areas of Strength in Instructional Analysis and Support � Multiple data sources support student achievement. � Intervention and student support systems are in place to facilitate learning. � Instruction is aligned to state standards. � Instruction reflects the mission and beliefs of the school community.
Areas to Strengthen in Instructional Analysis and Support � Examine use of student time and the block schedule to determine whether some courses
should be taught year long in a modified block format (Example: Gateway Mathematics).

Using our curriculum alignment, best instructional practices, and other resources, we will be able to provide our graduates with the skills that will be required for a successful post-secondary experience. These skills are reflected in the following expectations for Tennessee High School students that were developed by our stakeholders. We expect Tennessee High School students to:
1. Maintain a 94% attendance rate. 2. Complete 95% of all course assignments. 3. Pass the Eleventh Grade Writing Assessment with a score of 4.3 or above. 4. Have SAT or ACT scores greater than the national average. 5. Have a 91% graduation rate. 6. Pass Gateway tests with scores greater than the state average. 7. Participate in five or more extracurricular activities during the high school career.

����������*���� ����������������������
GOAL 1 (4.1) Goal THS students will have a graduation rate of 91% or above.
Which Need(s) does this goal address?
Graduation Rate • Tennessee High School’s 2006 graduation rate is currently under revision and is not
posted on the 2006 report card. • The 2005 graduation rate was 85.4%. Tennessee High School was expected to
achieve a graduation rate of at least 83.7% by 2006. • According to local calculations and a pending appeal we hope to exceed this target
rate, however Tennessee High School may not exceed last year’s graduation rate of 85.4%.
Cohort Dropout Rate • The cohort dropout rate increased by 3.2% from 2005 to 2006 (3.5% to 6.7%), but
still falls short of the state goal of 10%. • Data trends for the past 3 years indicate inconsistent results as the cohort dropout has
fluctuated each year. Data indicates that Tennessee High School has a need to focus on reducing the number of students who drop out of school.
How is this goal linked to the system’s Five-Year Plan?
Graduation Rate (Grades 9-12). Using graduation rate calculations mandated by NCLB, Tennessee High School will maintain an annual graduation rate that is equal to or exceeds the rate established by the state to avoid program improvement status.
4.1 Action Steps
(Goal 1) 4.1 Implementation Plan
Goal 1: Action Steps (Strategies, Interventions, or Scientific Based Research)
Timeline Person(s) Responsible
Projected Cost Monitoring Strategy
Incorporate 30 minutes into current school day for tutoring, homework,
Study 2007-8 Implement 2008-9
Administration: J. Butcher, B. Henley,
$500 for communication
EOC scores Graduation rate

makeup work, Credit Recovery, announcements, and club meetings.
D. Peters, A. Tudor; Teacher Committee; All Teachers
Train parents to better help their students academically and share school information with parents through video.
2007-8 Administration: J. Butcher, A. Tudor; Counselors: B. Brown, L. Skeens, D. Sturgill; Department Chairs: A. Booher, J. Combs, P. Gentry, J. Seigart; Media Teacher: S. McMakin
$500 (Cost of DVDs or VHS tapes)
Parent feedback, documentation of parent loan of materials
Teach students classroom survival skills: How to participate appropriately, stay in seat, study for tests, etc.
2007-8 Administration: J. Butcher, A. Tudor; Counselors: B. Brown, L. Skeens, D. Sturgill; Department Chairs: A. Booher, J. Combs, P. Gentry, J. Seigart; all teachers
Aha Process training (scheduled for August 6, 2007, funded by school system)
Graduation rate, documentation of skills taught
Daily instruction in goal setting and procedural self-talk, including social survival skills.
2007-8 Administration: J. Butcher, A. Tudor; Counselors: B. Brown, L. Skeens, D. Sturgill; Department Chairs: A. Booher, J. Combs, P. Gentry, J. Seigart; all teachers
Aha Process training (scheduled for August 6, 2007, funded by school system)
Teacher documentation reviewed by administrative team.
Team interventions for at-risk students. Parents meet with all teachers to set up a plan to benefit the students.
2007-8 Administration: J. Butcher, A. Tudor; Counselors: B.
Aha Process training (scheduled for August 6, 2007,
Documentation of team intervention meetings, reviewed
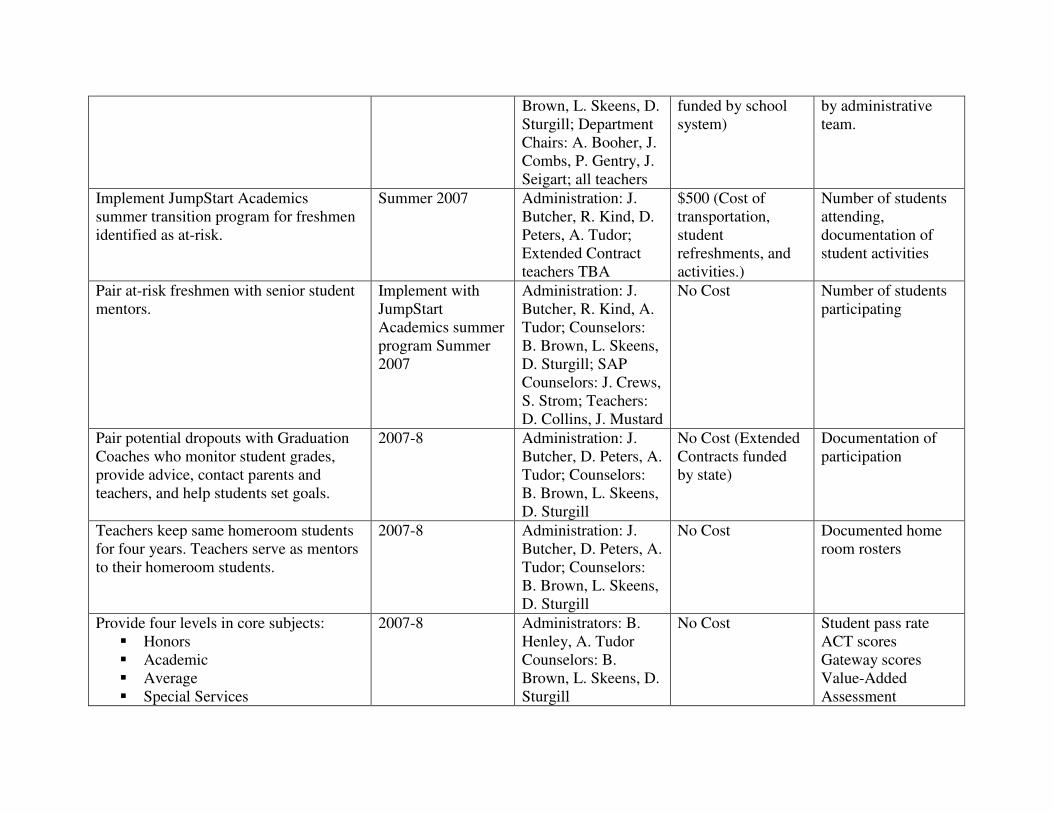
Brown, L. Skeens, D. Sturgill; Department Chairs: A. Booher, J. Combs, P. Gentry, J. Seigart; all teachers
funded by school system)
by administrative team.
Implement JumpStart Academics summer transition program for freshmen identified as at-risk.
Summer 2007 Administration: J. Butcher, R. Kind, D. Peters, A. Tudor; Extended Contract teachers TBA
$500 (Cost of transportation, student refreshments, and activities.)
Number of students attending, documentation of student activities
Pair at-risk freshmen with senior student mentors.
Implement with JumpStart Academics summer program Summer 2007
Administration: J. Butcher, R. Kind, A. Tudor; Counselors: B. Brown, L. Skeens, D. Sturgill; SAP Counselors: J. Crews, S. Strom; Teachers: D. Collins, J. Mustard
No Cost Number of students participating
Pair potential dropouts with Graduation Coaches who monitor student grades, provide advice, contact parents and teachers, and help students set goals.
2007-8 Administration: J. Butcher, D. Peters, A. Tudor; Counselors: B. Brown, L. Skeens, D. Sturgill
No Cost (Extended Contracts funded by state)
Documentation of participation
Teachers keep same homeroom students for four years. Teachers serve as mentors to their homeroom students.
2007-8 Administration: J. Butcher, D. Peters, A. Tudor; Counselors: B. Brown, L. Skeens, D. Sturgill
No Cost Documented home room rosters
Provide four levels in core subjects: � Honors � Academic � Average � Special Services
2007-8 Administrators: B. Henley, A. Tudor Counselors: B. Brown, L. Skeens, D. Sturgill
No Cost Student pass rate ACT scores Gateway scores Value-Added Assessment

Reduce student-teacher ratio in Gateway and End-of-Course classes;
� Math Foundations, Algebra IA and IB
� English I, II, and III � Science lab classes � US History
2007-8 Administrators: B. Henley, A. Tudor; Counselors: B. Brown, L. Skeens, D. Sturgill
No Cost Student grades, scores on Gateway and EOC tests, graduation rate
Place college students seeking field experience in Gateway and EOC classes to provide individual and small group assistance.
2007-8 Administrator: A. Tudor; Department Chairs: A. Booher, J. Combs, J. Seigart
No Cost Number of college students placed in GW and EOC classes
Implement modified block scheduling for Gateway English and Math classes.
2007-8 research 2008-9 implement
Administrators: J. Butcher, B. Henley, A. Tudor
$1,000 (Travel costs to visit other schools)
Student grades, GW and EOC scores
Incorporate Technical Geometry and Technical English classes
2007-8 research 2008-9 implement
Administrators: J. Butcher, B. Henley, A. Tudor; Department Chairs: J. Combs, J. Seigart
$500 travel to other schools
Student ACT scores
Professional Development Plan (Steps or Strategies) to Support Action Plan (as applicable).
Poverty Training by Aha Process (Ruby Payne), funded by school system (August 6, 2007)
Goa
l 1
Parent and Community Involvement (Steps or Strategies) to Support Action Plan (as applicable).
Parents will view school training videos. Parents will participate in team intervention meetings.

GOAL 2 (4.2) Goal THS students will have an attendance rate of 94% or above.
Which Need(s) does this goal address?
Attendance • 2006 attendance rate (91.1%) decreased by almost one percent from the 2005
attendance rate (91.9%) and falls short of the state goal of 93%. • Further data from Tennessee High School’s management system, Mac School, indicates
a decline in attendance percentages for each 20-day reporting period when the 2006 school year is compared to reporting periods so far for the 2007 school year.
How is this goal linked to the system’s Five-Year Plan?
Attendance (Grades 9-12). Students in grades 9-12 will maintain a mean attendance rate of 93 percent or higher.
4.2 Action Steps
(Goal 2) 4.2 Implementation Plan
Goal 2: Action Steps (Strategies, Interventions, or Scientific Based Research)
Timeline Person(s) Responsible
Projected Cost Monitoring Strategy
Increase collaboration with middle school teachers to identify students with attendance problems and share strategies for improving attendance.
2007-8 Administrators: J. Butcher, R. Kind, S. Ray; Counselors: B. Brown, L. Skeens, D. Sturgill
No Cost Attendance records, meeting notes and agendas, student schedules
During counseling with middle school students, incorporate attendance requirements as part of their four-year plan.
2007-8 Administrators: J. Butcher, R. Kind, S. Ray; Counselors: B. Brown, L. Skeens, D. Sturgill
No Cost Attendance records, meeting notes and agendas, student four-year plans
Teach students coping strategies. Address issues as a student needs assistance. Meet in small groups to discuss issues.
2007-8 Administration: J. Butcher, S. Ray, Counselors: B. Brown, L. Skeens, D. Sturgill
No Cost Number of students who meet, documentation of meeting dates, topics discussed
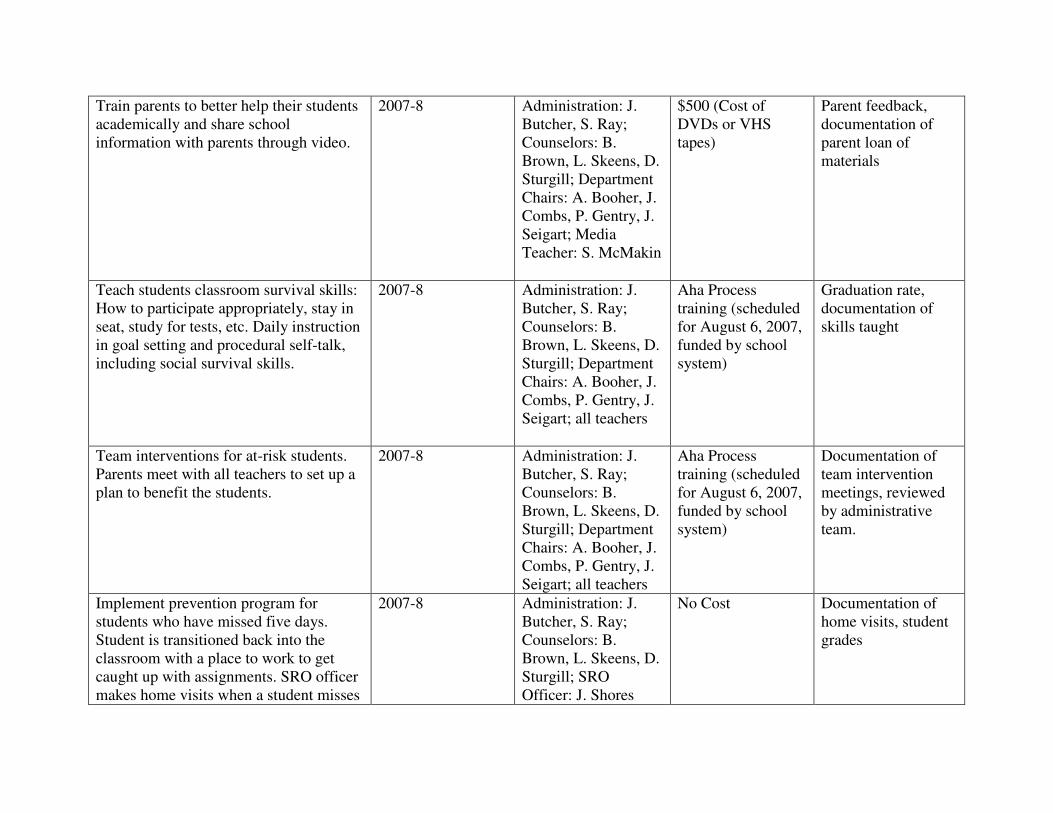
Train parents to better help their students academically and share school information with parents through video.
2007-8 Administration: J. Butcher, S. Ray; Counselors: B. Brown, L. Skeens, D. Sturgill; Department Chairs: A. Booher, J. Combs, P. Gentry, J. Seigart; Media Teacher: S. McMakin
$500 (Cost of DVDs or VHS tapes)
Parent feedback, documentation of parent loan of materials
Teach students classroom survival skills: How to participate appropriately, stay in seat, study for tests, etc. Daily instruction in goal setting and procedural self-talk, including social survival skills.
2007-8 Administration: J. Butcher, S. Ray; Counselors: B. Brown, L. Skeens, D. Sturgill; Department Chairs: A. Booher, J. Combs, P. Gentry, J. Seigart; all teachers
Aha Process training (scheduled for August 6, 2007, funded by school system)
Graduation rate, documentation of skills taught
Team interventions for at-risk students. Parents meet with all teachers to set up a plan to benefit the students.
2007-8 Administration: J. Butcher, S. Ray; Counselors: B. Brown, L. Skeens, D. Sturgill; Department Chairs: A. Booher, J. Combs, P. Gentry, J. Seigart; all teachers
Aha Process training (scheduled for August 6, 2007, funded by school system)
Documentation of team intervention meetings, reviewed by administrative team.
Implement prevention program for students who have missed five days. Student is transitioned back into the classroom with a place to work to get caught up with assignments. SRO officer makes home visits when a student misses
2007-8 Administration: J. Butcher, S. Ray; Counselors: B. Brown, L. Skeens, D. Sturgill; SRO Officer: J. Shores
No Cost Documentation of home visits, student grades

five days. Implement attendance committee which meets bimonthly to discuss students with attendance problems, make recommendations, and possibly refer students to ARC (Attendance Review Committee). Committee will study feasibility of making course credit dependent upon successful attendance.
2007-8 Butcher, S. Ray; Teachers TBA
No Cost Documentation of meetings, agendas.
Improve parent communication with staff email address posted on school website and individual teacher web pages. Continue Phone Master communication program.
2007-8 Administration: J. Butcher, B. Henley, S. Ray; all teachers, including webmaster T. English
No Cost Website with email addresses and web page links available to parents and community
Implement class meetings with specific requirements for different grade levels to share information, arrange motivational speakers, etc. Meetings will be held first and third Tuesdays during Activity 1 period.
2007-8 Administration: J. Butcher, S. Ray, S. Sochalski; Counselors: B. Brown, L. Skeens, D. Sturgill; Class officers and class sponsors: G. Stubbs, R. Witcher, L. Bearfield, K. Vance
No Cost Documentation of class meetings, meeting agendas
Continue to develop online courses (ETVS).
2007-8 Administration: J. Butcher, B. Henley, A. Tudor
Funded by Niswonger grant
Documentation of courses developed and student enrollment.
Expand Quest for Success program with the community to provide incentives for attendance.
2007-8 Administration: J. Butcher, S. Ray; Teachers: L. Bearfield, S. Jenkinson
No Cost. Incentives donated by business partners
Documentation of students recognized for having good attendance.

Professional Development Plan (Steps or Strategies) to Support Action Plan (as applicable).
Poverty Training by Aha Process (Ruby Payne), funded by school system (August 6, 2007) Staff training in setting up web pages.
Goa
l 2
Parent and Community Involvement (Steps or Strategies) to Support Action Plan (as applicable).
Parents will view school training videos. Parents will participate in team intervention meetings.

GOAL 3 (4.3) Goal THS students will score proficient and advanced at the rate of:
� 96% or above in Gateway Mathematics � 98% or above in Gateway Language Arts � 100% in Gateway Science
Which Need(s) does this goal address?
2006 Algebra I • All students scoring proficient or advanced has steadily decreased over the past 3
years, dropping from 94.9% in 2004 to 83.5% in 2006 • The 2005 and 2006 school year data indicates scores are decreasing for students with
disabilities declining from 89% in 2004 to 55% and 62% in 2005 and 2006 respectively
• 62% of students with disabilities scored proficient or advanced; 38% scored below proficient
2006 English II • In 2005 White students scored 94% proficient and advanced while African American
students scored 89%. • The 2005 and 2006 school year data indicates scores are decreasing for students with
disabilities declining from 89% in 2004 to 68% and 72% in 2005 and 2006 respectively
• 72% of students with disabilities scored proficient or advanced; 28% scored below proficient
Biology • In 2004 and 2005 every student tested scored either proficient or advanced. • In 2006 there was a decrease in scores from 100% to 98.8%. • Gateway Biology scores are not disaggregated on the State Report Card according to
gender, race/ethnicity, limited English proficiency, economically disadvantaged, or students with disabilities.
End of Course Assessments: • Foundations 2
o Students scoring proficient or advanced has steadily decreased over the past 3 years, dropping from 94.2% in 2004 to 83.6% in 2006; a decrease of 10.6% over the past 3 years
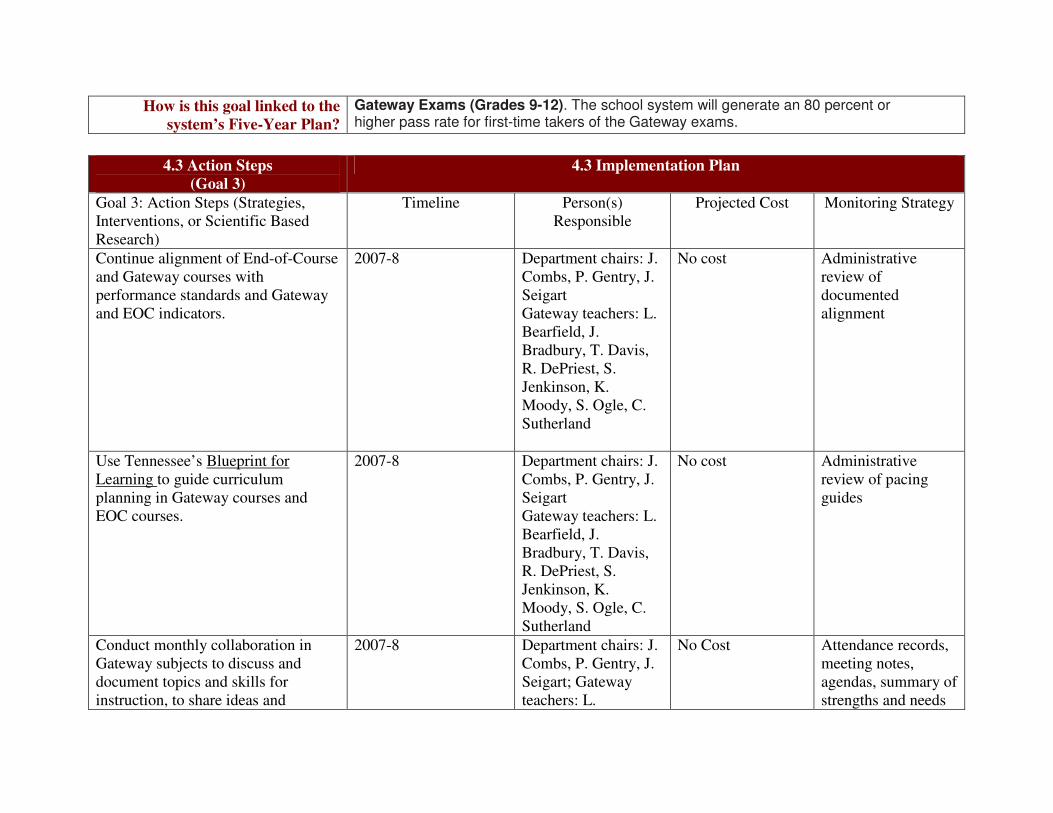
How is this goal linked to the system’s Five-Year Plan?
Gateway Exams (Grades 9-12). The school system will generate an 80 percent or higher pass rate for first-time takers of the Gateway exams.
4.3 Action Steps
(Goal 3) 4.3 Implementation Plan
Goal 3: Action Steps (Strategies, Interventions, or Scientific Based Research)
Timeline Person(s) Responsible
Projected Cost Monitoring Strategy
Continue alignment of End-of-Course and Gateway courses with performance standards and Gateway and EOC indicators.
2007-8 Department chairs: J. Combs, P. Gentry, J. Seigart Gateway teachers: L. Bearfield, J. Bradbury, T. Davis, R. DePriest, S. Jenkinson, K. Moody, S. Ogle, C. Sutherland
No cost Administrative review of documented alignment
Use Tennessee’s Blueprint for Learning to guide curriculum planning in Gateway courses and EOC courses.
2007-8 Department chairs: J. Combs, P. Gentry, J. Seigart Gateway teachers: L. Bearfield, J. Bradbury, T. Davis, R. DePriest, S. Jenkinson, K. Moody, S. Ogle, C. Sutherland
No cost Administrative review of pacing guides
Conduct monthly collaboration in Gateway subjects to discuss and document topics and skills for instruction, to share ideas and
2007-8 Department chairs: J. Combs, P. Gentry, J. Seigart; Gateway teachers: L.
No Cost Attendance records, meeting notes, agendas, summary of strengths and needs
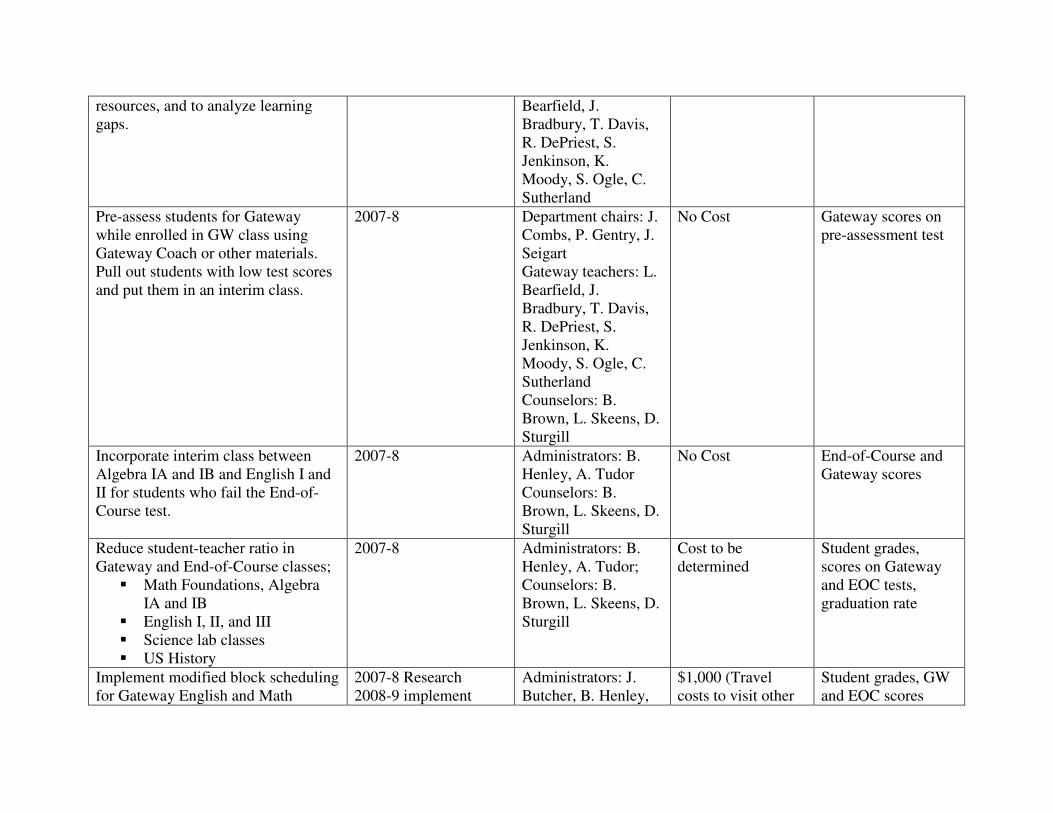
resources, and to analyze learning gaps.
Bearfield, J. Bradbury, T. Davis, R. DePriest, S. Jenkinson, K. Moody, S. Ogle, C. Sutherland
Pre-assess students for Gateway while enrolled in GW class using Gateway Coach or other materials. Pull out students with low test scores and put them in an interim class.
2007-8 Department chairs: J. Combs, P. Gentry, J. Seigart Gateway teachers: L. Bearfield, J. Bradbury, T. Davis, R. DePriest, S. Jenkinson, K. Moody, S. Ogle, C. Sutherland Counselors: B. Brown, L. Skeens, D. Sturgill
No Cost Gateway scores on pre-assessment test
Incorporate interim class between Algebra IA and IB and English I and II for students who fail the End-of-Course test.
2007-8 Administrators: B. Henley, A. Tudor Counselors: B. Brown, L. Skeens, D. Sturgill
No Cost End-of-Course and Gateway scores
Reduce student-teacher ratio in Gateway and End-of-Course classes;
� Math Foundations, Algebra IA and IB
� English I, II, and III � Science lab classes � US History
2007-8 Administrators: B. Henley, A. Tudor; Counselors: B. Brown, L. Skeens, D. Sturgill
Cost to be determined
Student grades, scores on Gateway and EOC tests, graduation rate
Implement modified block scheduling for Gateway English and Math
2007-8 Research 2008-9 implement
Administrators: J. Butcher, B. Henley,
$1,000 (Travel costs to visit other
Student grades, GW and EOC scores

classes so that these classes meet both terms.
A. Tudor; schools)
Provide four levels in core subjects: � Honors � Accelerated � Academic � Special Services
2007-8 Administrators: B. Henley, A. Tudor Counselors: B. Brown, L. Skeens, D. Sturgill
No Cost Student pass rate, ACT scores, Gateway scores, Value-Added Assessment
Limit Credit Recovery in Gateway subjects to only those students who have passed the Gateway test.
2007-8 Administrators: B. Henley, A. Tudor Counselors: B. Brown, L. Skeens, D. Sturgill
No Cost Student pass rate, ACT scores, Gateway scores, Value-Added Assessment
Increase collaboration with middle school teachers to identify at-risk students and share strategies for placement of students in high school classes.
2007-8 Administrators: J. Butcher, A. Tudor; Department chairs: J. Combs, P. Gentry, J. Seigart Gateway teachers: L. Bearfield, J. Bradbury, T. Davis, R. DePriest, S. Jenkinson, K. Moody, S. Ogle, C. Sutherland Counselors: B. Brown, L. Skeens, D. Sturgill
No Cost Attendance records, meeting notes and agendas, student schedules
Establish curriculum collaboration with other high schools.
2007-8 Administration: J. Butcher, D. Peters, A. Tudor; Department Chairs: A. Booher, J. Combs, P. Gentry, J. Seigart
Transportation ($1,000) and substitute costs (paid by system)
Documented collaboration, Gateway and EOC scores

Incorporate 30 minutes into current school day for tutoring, homework, makeup work, Credit Recovery, announcements, and club meetings.
Study 2007-8 Implement 2008-9
Administration: J. Butcher, D. Peters, A. Tudor; Teacher Committee; All Teachers
$500 for communication
EOC scores Graduation rate
Review, analyze, and distribute EOC and GW student performance data to target areas of need, including Special Services.
2007-8 Data Team: TBA Administration: J. Butcher, D. Peters, A. Tudor
$500 for printing costs
Documented review, analysis, and distribution of data. Summary of strengths and areas of need.
Continue to provide before school, after school, and evening tutoring. Study feasibility of students earning points for attending sessions.
Study 2007-8 Implement 2008-9
Administration: J. Butcher, D. Peters Department Chairs: J. Combs, P. Gentry, J. Seigart; Extended Contract Teachers: T. Coates, R. DePriest, J. Henson, S. Higgins, E. Lockett, T. Mitchell, T. Kennedy,
No Cost Number of students participating, test scores, final grades, failure rate
Professional Development Plan (Steps or Strategies) to Support Action Plan (as applicable).
Summer school system in-service to train data team. Provide opportunities for all new Gateway teachers attend the Gateway Institute. Provide opportunities for teachers to visit other schools to observe Gateway programs.
Goa
l 3
Parent and Community Involvement (Steps or Strategies) to Support Action Plan (as applicable).
Current Involvement Parents receive interim and six weeks reports to assess individual student progress. Parents receive results of state-mandated testing. Parents participate in IEP meetings for students with special needs. Parents attend parent/teacher conferences.

Parents and community participate in Principal’s Parent/ Community Advisory Team. Parents and community serve on School Improvement Planning Teams. Future Involvement Parents serve on Data Team. Members will continue to serve on School Improvement Planning teams.
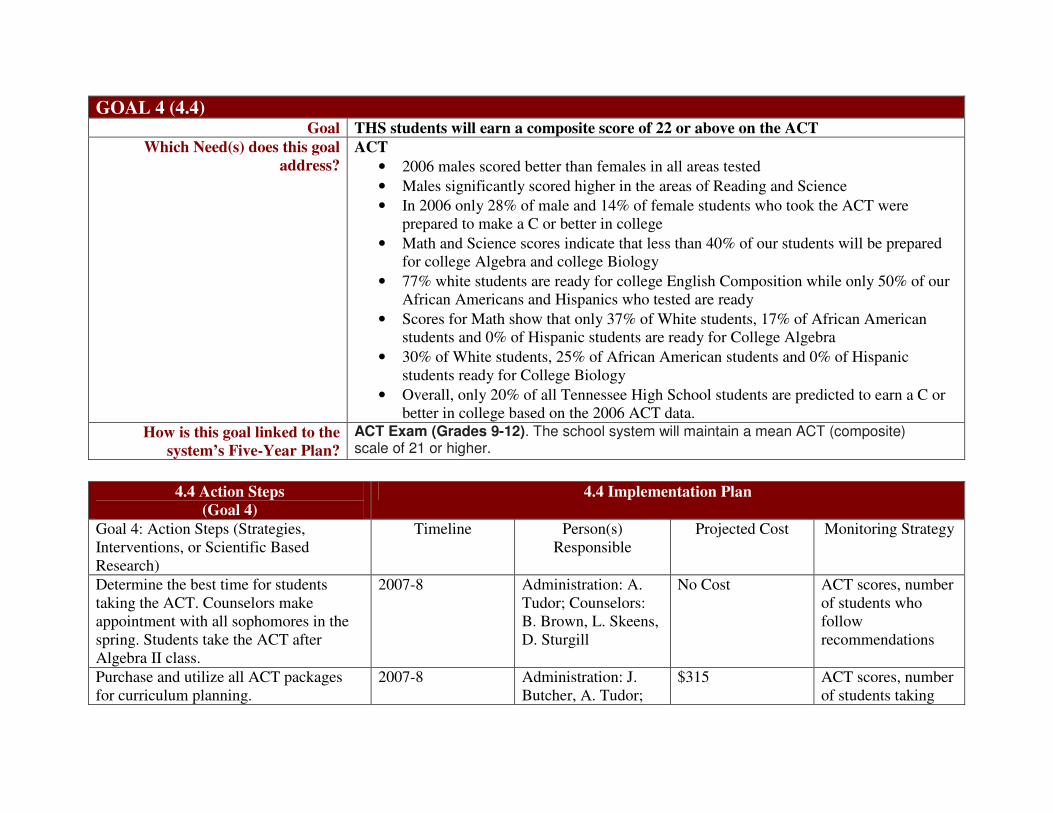
GOAL 4 (4.4) Goal THS students will earn a composite score of 22 or above on the ACT
Which Need(s) does this goal address?
ACT • 2006 males scored better than females in all areas tested • Males significantly scored higher in the areas of Reading and Science • In 2006 only 28% of male and 14% of female students who took the ACT were
prepared to make a C or better in college • Math and Science scores indicate that less than 40% of our students will be prepared
for college Algebra and college Biology • 77% white students are ready for college English Composition while only 50% of our
African Americans and Hispanics who tested are ready • Scores for Math show that only 37% of White students, 17% of African American
students and 0% of Hispanic students are ready for College Algebra • 30% of White students, 25% of African American students and 0% of Hispanic
students ready for College Biology • Overall, only 20% of all Tennessee High School students are predicted to earn a C or
better in college based on the 2006 ACT data. How is this goal linked to the
system’s Five-Year Plan? ACT Exam (Grades 9-12). The school system will maintain a mean ACT (composite) scale of 21 or higher.
4.4 Action Steps
(Goal 4) 4.4 Implementation Plan
Goal 4: Action Steps (Strategies, Interventions, or Scientific Based Research)
Timeline Person(s) Responsible
Projected Cost Monitoring Strategy
Determine the best time for students taking the ACT. Counselors make appointment with all sophomores in the spring. Students take the ACT after Algebra II class.
2007-8 Administration: A. Tudor; Counselors: B. Brown, L. Skeens, D. Sturgill
No Cost ACT scores, number of students who follow recommendations
Purchase and utilize all ACT packages for curriculum planning.
2007-8 Administration: J. Butcher, A. Tudor;
$315 ACT scores, number of students taking
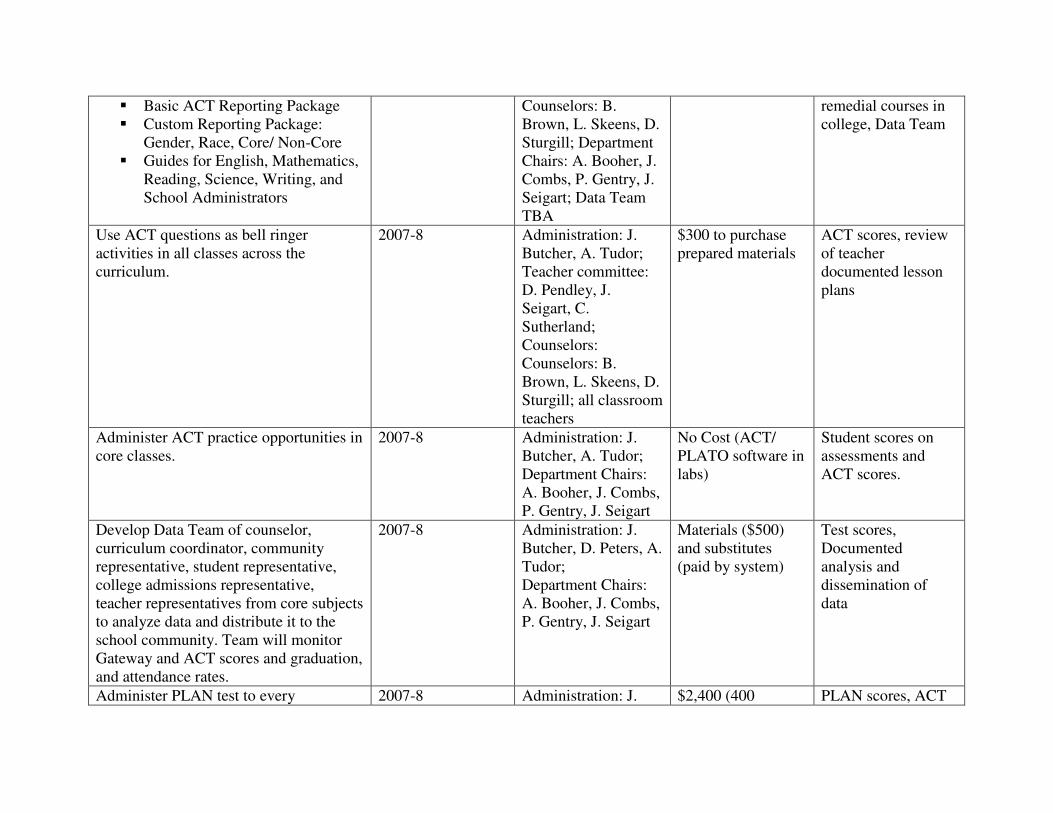
� Basic ACT Reporting Package � Custom Reporting Package:
Gender, Race, Core/ Non-Core � Guides for English, Mathematics,
Reading, Science, Writing, and School Administrators
Counselors: B. Brown, L. Skeens, D. Sturgill; Department Chairs: A. Booher, J. Combs, P. Gentry, J. Seigart; Data Team TBA
remedial courses in college, Data Team
Use ACT questions as bell ringer activities in all classes across the curriculum.
2007-8 Administration: J. Butcher, A. Tudor; Teacher committee: D. Pendley, J. Seigart, C. Sutherland; Counselors: Counselors: B. Brown, L. Skeens, D. Sturgill; all classroom teachers
$300 to purchase prepared materials
ACT scores, review of teacher documented lesson plans
Administer ACT practice opportunities in core classes.
2007-8 Administration: J. Butcher, A. Tudor; Department Chairs: A. Booher, J. Combs, P. Gentry, J. Seigart
No Cost (ACT/ PLATO software in labs)
Student scores on assessments and ACT scores.
Develop Data Team of counselor, curriculum coordinator, community representative, student representative, college admissions representative, teacher representatives from core subjects to analyze data and distribute it to the school community. Team will monitor Gateway and ACT scores and graduation, and attendance rates.
2007-8 Administration: J. Butcher, D. Peters, A. Tudor; Department Chairs: A. Booher, J. Combs, P. Gentry, J. Seigart
Materials ($500) and substitutes (paid by system)
Test scores, Documented analysis and dissemination of data
Administer PLAN test to every 2007-8 Administration: J. $2,400 (400 PLAN scores, ACT

sophomore. Butcher; Counselors: B. Brown, L. Skeens, D. Sturgill
students x $8.40) scores, and documented ACT intervention
Classroom teachers teach ACT section that is included in current textbooks.
2007-8 Administration: J. Butcher; all teachers
No Cost Pacing guide documentation, ACT scores
Establish collaboration with other schools to investigate, discuss, and implement strategies and interventions that have promoted/ increased ACT scores.
2007-8 Administration: J. Butcher, D. Peters, A. Tudor; Department Chairs: A. Booher, J. Combs, P. Gentry, J. Seigart
Transportation ($1,000) and substitute costs (paid by system)
Documented collaboration, ACT scores
Provide a more comprehensive career counseling program that assists students in selecting and pursuing a seamless program connecting career clusters with post-secondary education and the workplace.
2008-9 Administration: B. Henley, A. Tudor; Counselors: B. Brown, L. Skeens, D. Sturgill
No cost Development of career counseling program, graduation rate, ACT scores, enrollment in postsecondary institutions
Centrally house state-mandated assessment results in guidance conference room for easier accessibility by administration, teachers, and data team.
2007-8 Administration: D. Peters, A. Tudor; Counselors: B. Brown, L. Skeens, D. Sturgill
No Cost Documented use of materials
Professional Development Plan (Steps or Strategies) to Support Action Plan (as applicable).
ACT teachers will develop bell ringer activities and train all staff in their use for bell ringer activities. Summer school system in-service to train data team. Opportunities for teachers to visit other schools where proven programs have been implemented to increase ACT scores. G
oal 4
Parent and Community Involvement (Steps or Strategies) to Support Action Plan (as
Current Involvement Parents receive results of ACT testing. Parents participate in IEP meetings for students with special needs.

applicable).
Parents attend parent/teacher conferences. Parents and community participate in Principal’s Parent/ Community Advisory Team. Parents and community serve on School Improvement Planning Teams. Future Involvement Parents serve on Data Team. Members will continue to serve on School Improvement Planning teams.

����������+�������� �����'��������������������� �������&����� 5.1 Formative Assessment Tennessee High School has procedures for analyzing and evaluating students’ learning processes throughout the year. Various assessments are given and procedures are in place for teachers to analyze assessment data. The needs revealed by the data are utilized for planning, instruction, re-teaching, and enrichment. Formative assessment is designed to answer the question, “How are we doing?” Various assessment data are used to make curricular, organizational, and instructional changes. The school improvement planning process requires ongoing assessment of progress, evaluation of success, and adjustments. If formative assessment strategies and resources prove to be deficient in the achievement of the goals, alternative, research-based strategies will be considered for implementation. Departmental teams and A+ teams meet at least once a month to discuss results of common formative assessments. Teachers share strategies that work and identify intervention skills for students with academic needs. Formative Assessments
Data Analysis Procedures Formative Assessment Timeline
Homework Teachers will track student completion of homework and use of this tool to practice skills; teacher gradebook
Daily use; evaluated each grading period by teachers
Quizzes Chapter Tests Unit Tests Six Weeks Tests Final Exams
Spreadsheet analysis of student grades; graphical representation to illustrate student progress on quiz, chapter, unit, and term information
Evaluated each grading period by teachers; Evaluated after each chapter test, unit test, and six weeks test by teachers
Teachers will track student completion of projects and use rubrics to identify mastery of skills/concepts; teacher gradebook
Individual Projects Group Projects
Evaluated as frequently as projects occur in the semester

Individual Education Plan (IEP) Assessment Plans
Interim and Six Weeks IEP Progress Reports; Annual IEP Meeting
Every 3 weeks for progress reports; annually for IEP update
Interim Grading Reports
Mid-way through each grading period
Student Report Cards End of each six weeks grading period
Value Added (TVAAS) Assessment
November
Tennessee Report Card Data
November
Attendance Rate Each 20-day reporting period
Cohort Dropout Rate November Graduation Rate November NCLB Reports November NSSE Surveys May
Formative Assessment Resources for School Improvement and Decision Making: � Tennessee School Report Cards � Value Added (TVAAS) Data � Graduation Rate � Attendance Rate � Cohort Dropout Rate � NCLB Report � Interim Progress Reports � Six Weeks Report Cards � PLATO Progress Reports � NSSE Surveys: Students, Parents, Teachers
Additional Data Analysis Procedures: � Teachers will use formative assessment results to evaluate and adjust teaching
strategies. � Administrators and the Data Team will analyze PLATO reports, Interim Progress
Reports, and Six Weeks Report Cards to monitor the success of applied teaching strategies.
� Guidance counselors will monitor Interim Progress Reports and Six Weeks Report Cards to identify students with unsatisfactory progress, collaborate with teachers, schedule student/parent/teacher conferences, and evaluate student Four-year plans and credit checks.
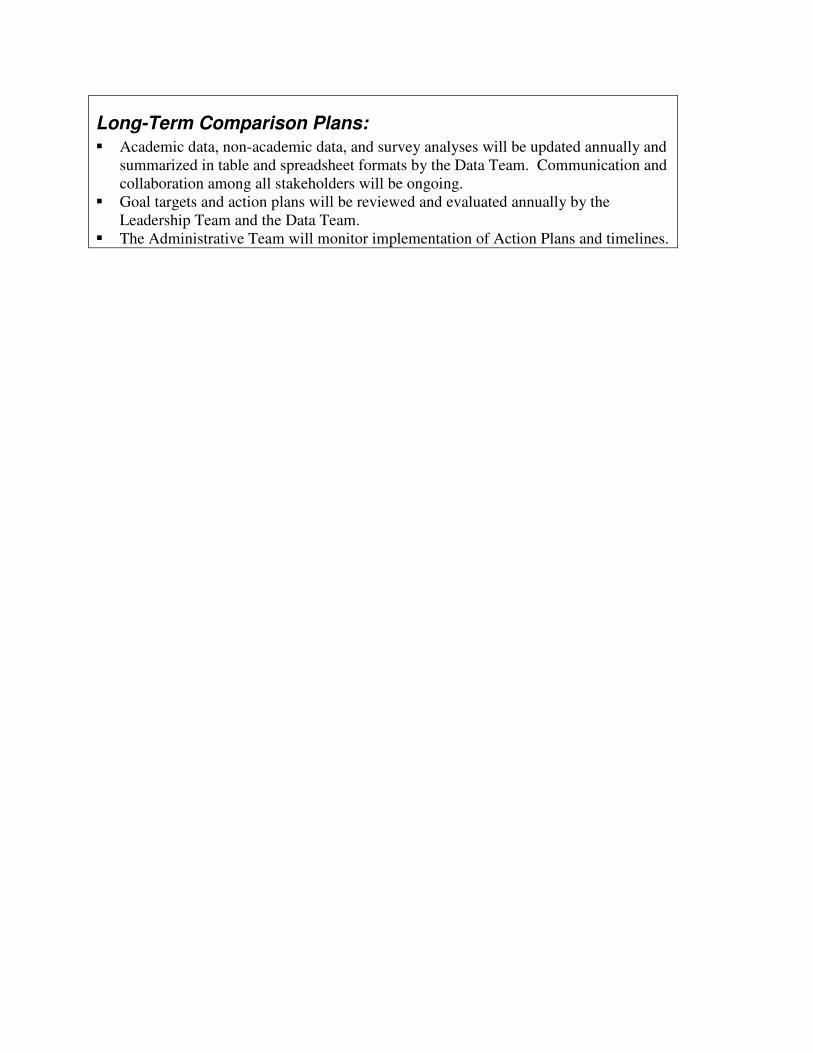
Long-Term Comparison Plans: � Academic data, non-academic data, and survey analyses will be updated annually and
summarized in table and spreadsheet formats by the Data Team. Communication and collaboration among all stakeholders will be ongoing.
� Goal targets and action plans will be reviewed and evaluated annually by the Leadership Team and the Data Team.
� The Administrative Team will monitor implementation of Action Plans and timelines.

5.2 Summative Assessment The Tennessee Comprehensive Program (TCAP) is the state standardized testing system. All currently enrolled students are required to pass state-mandated Gateway exams before they are eligible to earn a high school diploma. High school students are also required to take End-of-Course exams in Math Foundations II, English I, US History, and Physical Science. Upon the completion of each of the related academic courses, students will be tested for understanding and mastery of content standards in these subjects. Students are accountable for these exams which are a portion of their final grade in the course. The TCAP Writing Assessment is administered to all Eleventh grade students in February of each school year. Summative Assessment Resources: � Tennessee Report Card: Tennessee High School, Bristol City School System,
Tennessee State � NCLB Report � Value Added (TVAAS) Profiles � TCAP Writing Assessment � Gateway Exams: Algebra I, Biology, English II � End-of-Course Exams: Math Foundations II, English I, US History, Physical Science � Attendance Rate � Cohort Dropout Rate � Graduation Rate � Career and Technical Education Competency Profiles Data Analysis Procedures: � Cumulative spreadsheets and tables will be updated annually by the Data Team for
comparative analysis of standardized test results, TVAAS data, Report Card data, and non-academic data.
� The Administrative Team and the Leadership Team and/or Data Team will use assessment results, data tables, Report Card profiles, and NCLB reports to analyze the success of the school improvement action plans and to analyze the instructional and organizational program.
Long-Term Comparisons (Conducted Annually) � Analyze the implementation of the school improvement action plans. � Analyze the success of the action plans in attaining goal targets. � Re-evaluate goal targets. � Analyze data from various surveys and opinion inventories. � Re-evaluate areas of strength and areas to strengthen. � Analyze effectiveness of applied strategies for improvement. � Update data tables, spreadsheets, and graphs. � Update school and community profile.

5.3 Evaluation of the SIP Process The administrative team met in the summer 2006 to prepare for the revision of the current school improvement plan. The administrative team designated Doris Peters and Annette Tudor as facilitators for the school improvement plan revision process. At frequent intervals of time on specific in-service and meeting days, the faculty, parent group, and student group met to discuss each component and offer feedback for revisions. As the year progressed, a draft plan was compiled and revised again as new data became available. The plan was fully completed and adopted by all stakeholders in April 2007. The plan will be shared with school system administration for review and approval before being submitted for SACS approval. Upon SACS approval, copies will be distributed to faculty members and school system administration. A full version of the plan will be available for community viewing on our school website. The newly adopted school improvement plan will be analyzed and discussed by the faculty during the August 2007 in-service. Results of progress toward achieving school goals will be presented to the faculty at predetermined intervals during the 2007-2008 school year. Departmental meetings and A+ team meetings will be held to identify and discuss action steps/interventions that are successfully employed in meeting or exceeding goals. During the school year, the faculty and administration will collect, review, and evaluate data regarding each goal identified in the school improvement plan. An in-depth analysis will be provided from the following sources: • Gateway assessments • End-of-Course assessments • TCAP Writing Assessments • ACT exams • TVAAS profile • School Report Card • Enrollment data • Economically disadvantaged status • Special needs students • Attendance rate • Graduation rate • Cohort Dropout rate • Disciplinary infractions/actions • Faculty and staff qualifications • Needs assessments • Opinion inventories • Professional development activities As data are examined, the following aspects will be specifically analyzed: • Subgroup disaggregation

• Skills that indicate improvement • Skills that indicate lack of improvement • A minimum three-year data trend in all assessed areas The Tennessee Report Card is issued annually in November to each school system and school. After the Report Cards and NCLB Report are analyzed, a summary of progress and evidence of attainment of target areas and related goals will be prepared for distribution to the faculty. Teachers and administrators are given results for the state-mandated assessments in a timely manner upon arrival at the school. The following is the normal annual distribution time for assessment results to administrators and teachers and related analysis: • Gateway and End-of-Course Assessment results – at the end of each term; in depth
reports distributed in the summer • TCAP 11th Grade Writing Assessment Results – May • ACT Results – Fall The Data Team will conduct an analysis of all standardized exam results to share with stakeholder groups. The school improvement plan will be monitored and revised, based on this analysis as necessary. School improvement progress will be posted on the school’s website. Celebrations for success will be held in May after Gateway and End-of-Course assessments have been administered.