20070619 inbevfinancialanalysis report · financial statement analysis 1 1. executive summary in...
TRANSCRIPT

Financial Statements Analysis
Team members:
Ancion Audrey
Geortay Thérèse
Suarez Fabian
Trappeniers Christina
Zouboff Elisabeth
June 2007

Financial Statement Analysis
2
Table of Contents 1. Executive summary ................................................................................ 1
2. Industry analysis .................................................................................... 2
2.1 General observations ...................................................................................... 2
2.2 SABMiller ........................................................................................................ 4
2.3 Heineken ........................................................................................................ 5
3. Company presentation: InBev ............................................................... 6
3.1 History ............................................................................................................ 6
3.2 Current situation ............................................................................................. 7
3.3 Market share & brands ................................................................................... 7
3.4 Key figures ..................................................................................................... 8
3.5 Business Strategy ........................................................................................... 9 3.5.1 InBev’s key focus points ........................................................................................ 9 3.5.2 Cost leadership .................................................................................................... 10 3.5.3 Growth ................................................................................................................. 11 3.5.4 Sales of non core assets ..................................................................................... 12 3.5.5 From biggest to best : EBITDA margin ................................................................ 12
3.6 Differences and similarities among InBev, Heineken and SABMiller ............. 13 3.6.1 Similarities among player .................................................................................... 13 3.6.2 Differences among players .................................................................................. 13
4. Accounting analysis ............................................................................. 16
4.1 Statement of Compliance .............................................................................. 16
4.2 Goodwill ........................................................................................................ 16 4.2.1 IFRS Requirements ............................................................................................. 16 4.2.2 Local GAAP vs. IFRS .......................................................................................... 16
4.3 InBev Significant Accounting Policies ........................................................... 17 4.3.1 Principles of Consolidation .................................................................................. 17 4.3.2 Foreign Currencies .............................................................................................. 18 4.3.3 Intangibles Assets ............................................................................................... 19 4.3.4 Property, Plant and Equipment ........................................................................... 20 4.3.5 Inventories ........................................................................................................... 21 4.3.6 Impairment ........................................................................................................... 22
5. Ratio analysis ....................................................................................... 23
5.1 Profitability analysis ...................................................................................... 23 5.1.1 Return on Equity (ROE)....................................................................................... 23 5.1.2 Return on assets (ROA) ...................................................................................... 26
5.2 Financial leverage......................................................................................... 27
5.3 Operation Management analysis .................................................................. 28 5.3.1 Net profit margin .................................................................................................. 28 5.3.2 Asset turnover ..................................................................................................... 28 5.3.3 Return on invested capital (ROIC) ...................................................................... 29
5.4 Financial management analysis .................................................................... 30 5.4.1 Liquidity ratios ...................................................................................................... 30 5.4.2 Debt ratios ........................................................................................................... 31
5.5 Sustainable growth rate ................................................................................ 33
5.6 Cash flow analysis ........................................................................................ 35

Financial Statement Analysis
1
1. Executive summary
In this paper we analyze the worldwide known brewer InBev, and compare its financial
statements with two other giants of the beer sector i.e. SABMiller, number one and
Heineken, number two in terms of sales.
The group InBev was created in 2004 through the merger of Belgian Interbrew and
Brazilian Ambev. This merger is illustrative of the industry trends in general. North
American and European brewers have, in recent years, gone through active merger
and acquisition programs to increase volume, expand markets geographically and
leverage higher than average growth in emerging countries. Another trend in the beer
industry is the search for higher organic growth and efficiency through the
implementation of cost cutting and operational excellence programs.
InBev, SABMiller and Heineken have all gone through mergers and acquisitions in
recent year. In 2004 each of them partnered or acquired a market leader in an
emerging country: Interbrew merged with Brazilian Ambev in 2004, SABMiller acquired
Columbian Bavaria, and Heineken acquired Russia’s Central European Brewing.
All three have, in some way or another adopted, initiatives to increase operational
excellence and cut costs; Interbrew has launched ZZB (zero based budgeting) and
Voyager Plant Optimization (VPO), Heineken has adopted a Total productive
management program called Fight 2 and SABMiller is recognized in the industry for
being the operational leader.
Despite these similarities, the financial statements of those three brewers differ
significantly.
The ratio analysis shows a relative stability of InBev’s financial results in comparison to
Heineken and SABMiller. This can be explained by a combination of balanced portfolio
of brands, balanced geographical presence, cost-cutting policies and best practice
sharing initiative.
SABMiller shows a high peak in most of its ratios in 2004. This peak is a result of
several years of acquisition started in 1999 and capitalized over the years thanks to
operational excellence programs.
Heineken for its part shows systematically higher ratios than the other two. This is
mainly due to differences in accounting practices. Indeed under Dutch GAAP Heineken
was able to substract the value of its acquisitions from the equity whereas companies
that are under IFRS system, the acquisition value is put under “goodwill” in the assets.

Financial Statement Analysis
2
The brewers have different geographical presence; InBev and SABMiller are more
present in emerging markets than Heineken. Another difference lies the portfolio and in
the value of brands.
2. Industry analysis
2.1 General observations
With the top 40 breweries in the world now accounting for over 85% of global beer
output and with the top 10 alone accounting some 926 million hectolitres or 58 %1 of
world beer production, the beer sector appears as a relatively consolidated sector.
The table below shows that the three brewers we have decided to focus on (InBev,
SABMiller and Heineken) account for 34,5% of worldwide production.
1 The top ten accounted for 55, 7 % in 2004.

Financial Statement Analysis
3
In the beer sector, volume grows at 2% on average. In 2004, world beer consumption
reached 1.552 billions hectolitres. It further rose to 1.598 billion in 20052.
Price increases on average at 1 and 2 % per year.
Average growth of the sector is between 3- 4% and 7 % in a normal context.
Currently, emerging markets such as Russia, India and China, which have high
population levels and which have rising PIB/habitant present higher growth prospects
than established markets such as North American and Europe for brewers. As a result
we have observed that multinational brewers such as InBev, SABMiller, Heineken,
Anheuser-Busch and Carlsberg have all gone through several acquisitions in recent
years.
While looking for external growth, multinational breweries are also actively looking for
organic growth. Through cost cutting programmes and initiatives, international
brewers are steadily improving their operational margins.
These costs cuttings are especially important as we have seen the prices of raw
material such as barley rising over the years. Prices of barley have increased at an
annual rate of 13% in the last two decades3. Another threat to the beer industry lies in
the substitute products like wines, spirits but also non-alcoholic beverages which have
significantly increased their market share in Europe and the United States due to
customer behaviour changes and a higher health consciousness.
The top three players in terms of sales in the beer industry are SABMiller, InBev and
Heineken.
Sales Market Cap Net Income
USD m USD m USD m
1 SABMiller plc 18,620.00 53,772 36,902.40 1,649.00 10.11%
2 InBev NV 17,995.70 38,224 48,215.56 1,908.02 15.97%
3 Heineken N.V. 16,401.99 65,648 28,116.60 1,627.03 11.01%
4 Heineken Holding N.V.15,721.27 65,648 12,062.99 805.40 11.37%
5 Diageo plc 14,367.99 21,972 55,952.02 3,776.05 27.06%
6 Doosan Co., Ltd 14,068.43 4,472 2,449.68 12.70 1.14%
7 Kirin Brewery Company, Limited13,912.45 23,332 14,752.38 446.92 3.64%
8 Asahi Breweries, Ltd.12,103.13 15,28 7,567.87 374.71 3.17%
9 Companhia de Bebidas das Americas-Ambev8,732.60 28,567 43,311.04 1,487.70 16.98%
10 Scottish & Newcastle plc6,572.92 13,652 11,485.07 598.44 5.70%
Net Profit
Margin
Company
Name Employees
In the section below we shortly describe SABMiller and Heineken. A separate section
is dedicated to the description of InBev.
2 http://www.barthhaasgroup.com/cmsdk/content/bhg/news/report2/keydata.pdf
3 Factiva , InBev company report 2006.

Financial Statement Analysis
4
SABMiller - Geographic segmentation of
Total Revenue in % 31/12/2006 31/12/2005 31/12/2004 31/12/2003
Latin America 23% 14%
Europe 22% 21% 20% 19%
North America 26% 32% 34% 38%
Africa and Asia 8% 8% 13% 12%
South Africa 21% 25% 29% 26%
Central America 4% 4%
Rest of Africa Eastern Europe and Asia
SABMiller - Geographic segmentation of
Operating margin in % 31/12/2006 31/12/2005 31/12/2004 31/12/2003
Latin America 17% 17% -- --
Europe 17% 17% 15% 10%
North America 7% 9% 12% 4%
Africa and Asia 19% 21% 18% 19%
South Africa 27% 27% 21% 23%
Central America -- -- 17% 6%
Rest of Africa Eastern Europe and Asia -- -- -- --
2.2 SABMiller
SABMiller originated in South Africa. SAB is an acronym for South Africa brewery. In
2002 SAB acquired Miller, America’s second largest brewer. SABMiller owns 134
breweries over 5 continents. It is recognized in the industry for generating strong
operating cash flows; these rose from $638 million in 2002 to $2,101 million in 2006. As
it can be seen from the table below, SABMiller’ most important market is North
America; it accounted for 32 % of the total revenues in 2005 and for 26% in 2006. In
2005, the company acquired the Columbian brewer Bavaria. This gave SABMiller a
strong foothold in South America as Bavaria is the second largest brewery in South
America. Bavaria's market leadership in the Andean region has been of significant
importance for SABMiller as the brewer’s US home market has been faced with
sluggish growth. The impact of the slower demand in the US on SABMiller can be seen
in the second table where operating margin in the US has been steadily decreasing in
2005 and 2006 and represented less than 50% of the other geographic segments’
operating income. South Africa, Africa and Asia, on the other hand, have shown very
high operating margins.
SABMiller is more focused on emerging markets than InBev: Russia, central Europe,
South Africa. As such SABMiller is more dependent on world economic situation.
Table SABMiller 1. (Source: Reuters)
Table SABMiller 2. (Source: Reuters)

Financial Statement Analysis
5
Heineken - Geographic segmentation
of Total Revenue in % 31/12/2006 31/12/2005 31/12/2004 31/12/2003
Western Europe 43% 46% 50% 62%
Netherlands
Central/Eastern Europe 27% 25% 23% 11%
Rest Of Europe
Americas 16% 15% 14% 15%
Africa/Middle East 10% 9% 8% 8%
Asia/Pacific 5% 4% 4% 4%
Heineken - Geographic segmentation of
Operating margin in % 31/12/2006 31/12/2005 31/12/2004 31/12/2003
Western Europe 17% 10% 11% 9%
Netherlands -- -- -- --
Central/Eastern Europe 10% 11% 10% 7%
Rest Of Europe -- -- -- --
Americas 13% 14% 19% 24%
Africa/Middle East 20% 19% 21% 18%
Asia/Pacific 15% 13% 13% 10%
2.3 Heineken
Heineken is a Dutch brewer whose beer portfolio comprises of 120 brands. The group’s
most famous brands ‘Heineken’ and ‘Amstel’ account for 30% of the company’s total
volume. Heineken owns 115 breweries and distributors in 65 countries.
As presented in table 1, Heineken’s home market, i.e. Western Europe, represented
46% of total revenues in 2005 and 43% in 2006. Like North America, Europe has
presented brewers such as Heineken with sluggish growth. In 2005, Heineken’s
revenues in Western Europe grew at only 0,7%. Like SABMiller the relatively weak
performance of the company in its home market has encouraged the group to look for
growth in emerging markets. In 2004, Heineken acquired Central European Brewing to
become Russia’s third largest brewer. Through a joint venture, Heineken has also
acquired brewers in India where it enjoys an annual growth rate of 7%.
Table 2 shows the relatively weak operating margins of Heineken in Europe from 2003
and 2005. The poor operating margins generated by central and Eastern Europe
highlight the failure of Heineken to integrate its Russian acquisitions. For Western
Europe, a significant improvement is shown in 2006. The latter can partly be explained
by the implementation in 2005 of a ‘Total productive management’ (TPM) to reduce
production errors and losses and thereby increase operating margin.
Table Heineken 1. (Source: Reuters)
Table Heineken 2. (Source: Reuters)

Financial Statement Analysis
6
3. Company presentation: InBev
3.1 History
InBev’s roots can be traced back to Den Horen in Leuven, which began making beer in
1366. In 1987 the two largest breweries in Belgium merged: Artois, located in Leuven,
and Piedboeuf, located in Jupille signalling the formation of the single company which
was to become InBev.
After the merger in 1987, InBev acquired a number of local breweries in Belgium. By
1991, a second phase of targeted external growth began outside of Belgium’s borders.
The first transaction in this phase took place in Hungary, followed in 1995 by the
acquisition of Labatt, in Canada, and then in 1999 by a joint venture with Sun in
Russia.
In 2000, InBev acquired Bass and Whitbread in the U.K., and in 2001 the company
established itself in Germany, with the acquisition of Diebels. This was followed by the
acquisition of Beck’s & Co., the Gilde Group and Spaten. InBev operated as a family-
owned business and 100% Belgian until December 2000.
Until then shareholders had chosen between the two options sell or grow the business
the second one. Decision was taken to grow the business by acquisition. By 1999 had
acquired too many businesses and at this point it organized an Initial Public Offering in
2000, becoming a publicly owned company trading on the Euronext stock exchange
(Brussels, Belgium).
In 2002, InBev strengthened its position in China, by acquiring stakes in the K.K.
Brewery and the Zhujiang Brewery.
2004 marked the most significant event in the company’s recent history: the
combination of Interbrew and AmBev to create InBev.
There was much interest for both companies to combine their destinies as they are on
complementary markets, have both strong global brands and a big number of local
brands as a result of previous
takeovers.
We can observe on figure 2 that
the P/E ration of InBev
excluding Ambev is much lower
than Ambev’s. This can be
Sou
rce
: Deuts
che
bank
Financial Statement Analysis
7
explained by the fact that InBev business excluding Ambev is concentrated on Western
Europe where growth is merely existent. 0.7% revenue growth in 2005, 2.4% in 2006
that is far below the 7.9% revenue growth for the group. This graph illustrates the
combination of both saturated and emerging markets.
Also in 2004, InBev acquired the China brewery activities of the Lion Group and added
Fujian Sedrin in 2006, making InBev the No. 2 brewer in China - the world's largest
beer market. Most recently, InBev increased its shareholding in Quinsa, strengthening
the company’s foothold in Argentina, Bolivia, Chile, Paraguay and Uruguay.
3.2 Current situation
InBev is today the world's leading brewer, realizing 13.3 billion Euro in 2006. The
company has a strong, balanced portfolio, holding the number one or number two
position in over 20 key markets – more than any other brewer.
It has a key presence in both developed and developing markets, active in seven out of
the ten fastest growing markets worldwide.
Headquartered in Leuven, Belgium, InBev employs more than 86,000 people
worldwide. With sales in over 130 countries, the company works through six
operational zones: North America, Western Europe, Central and Eastern Europe, Asia
Pacific, Latin America North, and Latin America South.
With operations and license agreements around the globe, InBev is a true global
brewer.
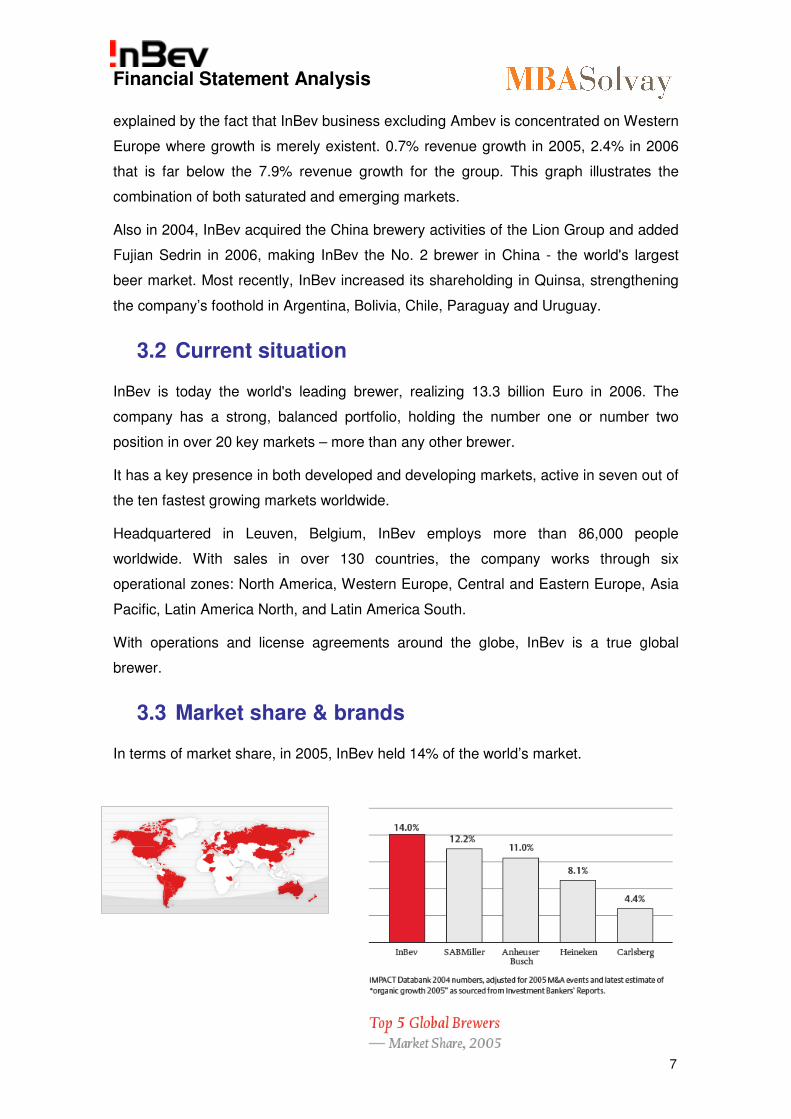
3.3 Market share & brands
In terms of market share, in 2005, InBev held 14% of the world’s market.

Financial Statement Analysis
8
InBev has four global brands, Stella Artois®, Beck’s®, Leffe® and Brahma®, and as a
top-tier performer in the global brewing industry,
InBev has the potential to generate one of the
highest organic EBITDA growths of any major
brewer.
In addition, InBev has a portfolio of more than 200
local brands including in Latin America: Skol®, the
third largest beer brand in the world. In Western Europe: Jupiler®, the number 1 selling
beer in Belgium. In Central and Eastern Europe: Siberian Crown,® a leading premium
brand sold throughout Russia. In Asia Pacific: Cass® from South Korea, and Sedrin®,
a 10 million hectolitre brand in China.
3.4 Key figures
InBev’s shares have been the strongest performers amongst the European beer
companies since the start of the year, and are now trading at a premium to peers on
P/E and EV/EBITDA metrics. InBev’s run has been mirrored by the performance of
AmBev. Although a large part of InBev’s re-rating over the last year has been driven by
an implied expansion of the multiple applied to InBev’s operations excluding AmBev,
since the start of this year the P/E on AmBev’s shares has also picked-up, and the
stock is back to trading at a moderate premium to its parent. Deutsche Bank’s
forecasts suggest that for 2007 AmBev will account for 44% of InBev’s earnings, and
that it currently comprises 49% of InBev’s market capitalisation.
InBev has made a strong start to 2007, generating Q1 organic volume, revenue and
EBITDA growth of 6.7%, 8.9% and 17.8%, respectively. The major revenue drivers
were Latin America and Central & Eastern Europe, and the ZBB cost savings plan also
made a significant contribution to EBITDA growth.
Figures according to regions
As the table below demonstrates it, Western Europe has accounted for about 32% of
InBev’s revenues in 2005 and 28 % in 2006. Revenues in Central and South America
have risen through the Interbrew –Ambev merger. In 2005, Latin America accounted
for 77% of InBev’s organic EBITDA growth and 59% in 2006.
Table INBEV 1
Source : Deutsche bank

Financial Statement Analysis
9
Inbev - Geographic segmentation of
Total revenue in % 31/12/2006 31/12/2005 31/12/2004 31/12/2003
North America 14% 15% 22% 27%
Western Europe 28% 32% 41% 51%
Central and Eastern Europe 14% 13% 15% 15%
Asia/Pacific 7% 6% 8% 7%
Central and South America 38% 34% 14%
As we have seen it for Heineken, InBev has suffered from poor demand for beer in
Western Europe. Although they are slightly rising, operating margins in Western
Europe are at least three times lower than in South America.
Table INBEV 2
Inbev - Geographic segmentation of
Operating margin in % 31/12/2006 31/12/2005 31/12/2004 31/12/2003
North America 25% 20% 34% 15%
Western Europe 10% 8% 7% 9%
Central and Eastern Europe 11% 9% 7% 11%
Asia/Pacific 16% 16% 7% 15%
Central and South America 38% 33% 31% --
3.5 Business Strategy
InBev’s key focus points
Over the last couple of years there have been three major drivers of InBev’s earnings
growth:
1) Organic growth in the Latin American division (chiefly from Brazil)
2) Strength in the Brazilian real
3) Cost savings, in particular driven by the zero-based budgeting (‘ZBB’) programme
Further, the large incremental benefits of ZBB are likely to finish in 2008.
Today, InBev’s key focus points are : cost leadership (ZBB, VPO), growth, sale of
non-core assets and move from biggest to best (EBITDA
margin).
� They have a vision to move 'from Biggest to Best'.
Their goal is to achieve an organic volume growth of two times
the industry growth, and an organic revenue growth of 1%
above the organic volume growth.

Financial Statement Analysis
10
Cost leadership
3.5.1.1 Zero based budgeting (ZBB)
This vast cost saving plan has enabled InBev to have 118 million euros in annual
savings in Western Europe. The kick off of Zero-Based Budgeting was done in the key
North American zone in mid 2005, in Western European Zones in 2006 and Russia is
next in 2007.
InBev says that the introduction of zero-based budgeting typically cuts fixed costs
(mostly SG&A rather than COGS) by around 15% in its first year and by a further 10%
in the second and around 5% in the third. Thereafter the process is used to keep
growth in volume-adjusted fixed costs at a rate below that of inflation.
The Canadian operations have now experienced two years of ZBB, so major
incremental cost savings from this market should be at an end. ZBB is in its second
year of implementation in Western Europe, having produced €118m of benefits in
2006 (larger than 100% of the region’s organic EBITDA growth of €100m last year).
And in 2007 ZBB is being rolled-out for the first time to Central & Eastern Europe and
the Korean business – though the combined cost base in these countries are lower
than that of Western Europe, so the opportunities will be smaller.
That means that the large incremental benefits of ZBB are likely to finish in 2008, but
just because the momentum of this project will slow doesn’t mean that InBev won’t
remain very cost-focused. We get the impression that there is still work to do on the
procurement side, and the Voyager Plant Optimisation programme is also helping to
keep COGS under control.
Nonetheless, it seems clear that ZBB will not be the driver of EBITDA growth beyond
2008 that it should have been in the three prior years.
3.5.1.2 VPO
The objective of Voyager Plant Optimization (VPO)—a long-term, evolutionary program
that encourages crosspollination between cultures and countries—is to establish a
Financial Statement Analysis
11
standard ‘InBev Way’ to operate breweries, continuously improving performance and
rapidly sharing best practices.4
Growth
InBev’s strategy is to continue to strengthen its significant positions in the world's major
beer markets through organic growth, world-class efficiency, targeted acquisitions, and
by increasing or reinforcing consumption (branding)5.
In the past InBev could rely on the currency effect to grow. The fact that the average
real / euro rate improved 16% in 2005, and a further 10% in 2006 has had a positive
impact on the company’s growth.6 Without support from currency, and with cost
savings benefits slowing, InBev’s future growth is going to be more dependent on its
organic growth performance – or on acquisitions.
Over the last couple of years InBev’s organic EBITDA growth outside its Latin America
and North America regions has been steady, but not spectacular, once the impact of
ZBB is taken into account. We think the mid-term EBITDA growth rate of InBev ex
AmBev is likely to be in the region of 5-6%, with slower growth in mature Western
European markets offset by faster growth in Central & Eastern Europe and Asia.
Up to now Latin America and ZBB seem to have grabbed most of the headlines as far
as InBev’s performance is concerned, and we’re now entering a
phase when the group’s efforts to generate top-line growth in its
other businesses are likely to get more attention.
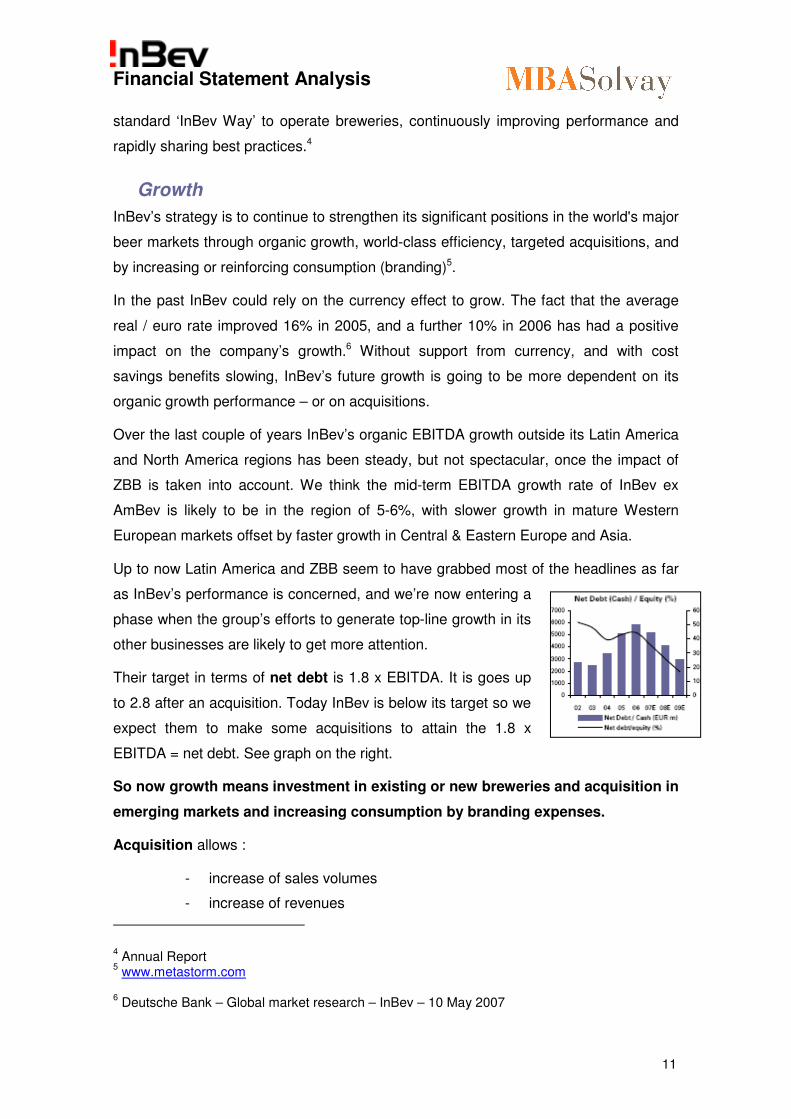
Their target in terms of net debt is 1.8 x EBITDA. It is goes up
to 2.8 after an acquisition. Today InBev is below its target so we
expect them to make some acquisitions to attain the 1.8 x
EBITDA = net debt. See graph on the right.
So now growth means investment in existing or new breweries and acquisition in
emerging markets and increasing consumption by branding expenses.
Acquisition allows :
- increase of sales volumes
- increase of revenues
4 Annual Report
5 www.metastorm.com
6 Deutsche Bank – Global market research – InBev – 10 May 2007

Financial Statement Analysis
12
- cost reduction
- efficiency increase and exchange of best practises
- cash usage
Branding is an efficient way of encouraging consumption. Whatever they achieve to
gain through administration and distribution diminishing of costs is reinvested into
branding. For example, if we divide sales by volume = average selling price per
hectolitre it improves over time. This is observed in all the regions.
We have compared it with Heineken and SABMiller in the section 3.6.
New brand-tracking tools and methodologies, occasion based insights across the entire
spectrum of the beverage industry, and the roll-out of the World Class Commercial
Program (WCCP) all combined to drive per capita consumption. The WCCP uses a
sales diagnostic tool that uncovers existing capabilities, focusing on specific top
markets. To create this home grown program, they reached out for best practices from
all of their markets, and also developed new ones.
Sales of non core assets
InBev frees up cash by selling non-core assets. A first example is the sale in
September 2005 of its 62.4% interest in Bremer Erfrischungsgetränke GmbH to Coca-
Cola Erfrischungsgetränke AG, based on an enterprise value of 137 million euro (for
100%). This divestiture is consistent with InBev’s commitment to free-up capital
invested from a non-core asset.
The sale of InBev’s minority stake in Damm is another example of their increased
discipline in capital allocation, and is in line with InBev’s objective of freeing up capital
to focus resources on critical strategic initiatives.
From biggest to best : EBITDA margin
There are many ways, of course, for a company to measure ‘best’. In terms of
profitability, reaching our goal of a 30 % EBITDA margin by the end of 2007 is a simple
and straightforward way of tracking it.
The objective was set to 30% EBITDA margin in 2008. This is pretty high considering
that in 2002, average EBITDA in Europe among players like Heineken and Interbrew
was around 20%. However, before the acquisition Ambev’s EBITDA margin was at
higher levels of 40%.
In 2006, InBev has already reached the target as it has an EBITDA margin of 31.9%.

Financial Statement Analysis
13
In terms of normalized EBITDA, it grew 15 % organically and the normalized EBITDA
margin grew from 26.1 % to 28.6 %.
Much more important in the long run is what is really behind InBev’s vision : the best
brands, the best practices, the best people and the best execution when it comes to
connecting with consumers.
3.6 Differences and similarities among InBev,
Heineken and SABMiller
Similarities among player
InBev, SABMiller and Heineken have all gone through mergers and acquisitions in
recent year. In 2004 each of them partnered or acquired a market leader in an
emerging country: Interbrew merged with Brazilian Ambev in 2004, SABMiller acquired
Columbian Bavaria, and Heineken acquired Russia’s Central European Brewing.
All three have, in some way or another adopted, initiatives to increase operational
excellence and cut costs; Interbrew has launched ZZB (zero based budgeting) and
Voyager Plant Optimization (VPO), Heineken has adopted a Total productive
management program called Fight 2 and SABMiller is recognized in the industry for
being the operational leader.
Differences among players
Despite these similarities, the financial statements of those three brewers differ
significantly for a variety of reasons.
The brewers have different geographical presence; InBev and SABMiller are more
present in emerging markets than Heineken.
SABMiller
InBev

Financial Statement Analysis
14
Heineken
InBev has more than 200 brands, SABMiller counts 150 brand and Heineken 120.
Brand consulting practice Millward Brown has developed a ranking of the world’s most
powerful brands. Within the beer category, Heineken shows a competitive advantage
over InBev and SABMiller. Its brands ‘Heineken’ and ‘Amstel’ are rated top 3 and 9 and
valued together at 4,5 millions USD. InBev, thanks to its brands ‘ Stella Artois’ and
‘Skol’ comes in second with a value 3,2 millions USD. Unlike InBev and Heineken who
both have 2 of their brands recognized in the top 10 most powerful brands, SABMiller
only has I internationally recognized beer brand, i.e. ‘Miller lie’ valued at 1,9 millions
USD. This difference can be explained by the fact that SABMiller has focused on
developing brand that meet local consumer needs on a range of different occasions
and which appeal to their specific tastes while Heineken has focused on promoting
international brands like ‘Heineken’ across the globe. InBev presents a mix of
international and local brands.

Financial Statement Analysis
15
Ranking Brand Value ($m)
1 Budweiser Anheuser-Busch Companies, Inc. 6.767,00
2 Bud Light Anheuser-Busch Companies, Inc. 4.957,00
3 Heineken Heineken N.V. 3.372,00
4 Guinness Diageo plc 294,00
5 Corona Grupo Modelo S.A. de C.V. 2.565,00
6 Stella Artois InBev 2.235,00
7 Miller Lite SABMiller plc 1.951,00
8 Skol InBev 1.059,00
9 Amstel Heineken N.V. 978,00
10 Kronenbourg 1664 Scottish and Newcastle plc 920,00
Brand value - total Heineken 4.350,00
Inbev 3.294,00
SABMiller 1.951,00
TOP 10 Beer brands - Ranking elaborated by Millward Brown, Brand consulting practice
InBev’s organic volume growth reached 5,9 % in 2006. SABMiller reached 5 % in 2006
and Heineken presented a 6% organic growth rate of its volume in 2006. All three
players are thus able to generate similar levels of organic volume increase. The
difference in the performance between those 3 players could then be better explained
through external growth opportunities. The mergers the company went through and he
level of synergy they were able to create is thus of primary importance to explain
differences among the top players.
In 2005 Ambev and Interbrew achieved merger synergy benefits of €13 million, and
reduced costs by over €25 million.
Branding : we have compared the yearly average price change of the three industry
leaders in the graph below. What we have done is divide sales revenue by the volume
and this per region for the three
competitors. Then we weighted
it for each competitor.
We can see that InBev is doing better that its competitors. In other words, it is relying
on its branding expenses and efforts to increase its price and therefore increase its
revenues.
Avg Price change 2005 to 2006 2004 to 2005
InBev 1% 2%
SABMiller 1% -2%
Heineken 0% 2%

Financial Statement Analysis
16
4. Accounting analysis
4.1 Statement of Compliance
The consolidated financial statements of InBev have been prepared in accordance with
International Financial Reporting Standards (IFRS) issued by the International
Accounting Standards Board (IASB), as adopted by the European Union up to 31
December 2006. InBev did not apply any European carve-outs from IFRS meaning that
InBev financials fully comply with IFRS. With the exception of IFRS 7 and the
complementary amendment to IAS 1, InBev has not applied early any new IFRS
requirements that are not yet effective in 2006. Certain 2005 amounts have been
reclassified to conform to the 2006 presentation.
4.2 Goodwill
Goodwill arises as the difference between the cost of the acquisition and the fair value
of identifiable assets, liabilities and contingent liabilities acquired. Purchased goodwill is
capitalised as an intangible asset under IFRS rules.
IFRS Requirements
Under IFRS, the amortisation of goodwill and intangible assets with indefinite useful
lives is prohibited. Instead they must be tested for impairment annually or more
frequently if events or changes in circumstances indicate a possible impairment. As a
result, income statements would not be charged, unless goodwill is determined to be
impaired.
Local GAAP vs. IFRS
The main objective of the IASB was to eliminate remaining differences between
International and national standards on business combinations.
Prior to the IFRS application, the rules related to goodwill were different in Belgium and
in the Netherlands.
In Belgium, goodwill had to be capitalised and amortised while, in the Netherland, it
was charged to shareholder equity in some case. As for the first-time adoption of IFRS
as the primary accounting basis does not require full retrospective application of all
IFRS’s effective at the reporting date for an entity’s first IFRS financial statements for
the items related to business combinations, the picture given by the balance sheets of

Financial Statement Analysis
17
some brewers is quite different. This can be easily demonstrated with a comparison of
the InBev and Heineken balance sheets:
Assets 2006 Assets 2006Net Working Capital 1.752,00- Net Working Capital 242,00- Long Term Assets 9.177,00 Long Term Assets 6.565,00
Goodwill 12.305,00 Goodwill 2.195,00 Total 19.730,00 Total 8.518,00
Liabilities LiabilitiesLong Term Liabilities 6.588,00 Long Term Liabilities 2.998,00
Shareholders Equity + Minority interest 13.142,00 Shareholders Equity + Minority interest 5.520,00 Total 19.730,00 Total 8.518,00
INBEV HEINEKEN
The fact that the goodwill was always capitalised by InBev but not by Heineken will
have an impact on the financial ratios we will derive from their financial statements.
4.3 InBev Significant Accounting Policies
Principles of Consolidation
Subsidiaries are those companies in which InBev, directly or indirectly, has an interest
of more than half of the voting rights or otherwise has control, directly or indirectly, over
the operations so as to obtain benefits from the companies’ activities. In assessing
control, potential voting rights that presently are exercisable are taken into account.
The financial statements of subsidiaries are included in the consolidated financial
statements from the date that control commences until the date that control ceases.
Jointly controlled entities are consolidated using the proportionate method of
consolidation.
Associates are undertakings in which InBev has significant influence over the financial
and operating policies, but which it does not control. This is generally evidenced by
ownership of between 20 % and 50 % of the voting rights. Associates are accounted
for by the equity method of accounting, from the date that significant influence
commences until the date that significant influence ceases. When InBev’s share of
losses exceeds the carrying amount of the associate, the carrying amount is reduced to
nil and recognition of further losses is discontinued except to the extent that InBev has
incurred obligations in respect of the associate.
The financial statements of InBev subsidiaries, jointly controlled entities and associates
are prepared for the same reporting year as the parent company, using consistent
accounting policies. All intercompany transactions, balances and unrealized gains and
losses on transactions between group companies have been eliminated.

Financial Statement Analysis
18
Unrealised gains arising from transactions with associates and jointly controlled entities
are eliminated to the extent of InBev’s interest in the entity. Unrealized losses are
eliminated in the same way as unrealized gains, but only to the extent that there is no
evidence of impairment.
Foreign Currencies
Foreign currency transactions are accounted for at exchange rates prevailing at the
date of the transactions. Monetary assets and liabilities denominated in foreign
currencies are translated at the balance sheet date rate. Gains and losses resulting
from the settlement of foreign currency transactions and from the translation of
monetary assets and liabilities denominated in foreign currencies are recognized in the
income statement. Non-monetary assets and liabilities denominated in foreign
currencies are translated at the foreign exchange rate prevailing at the date of the
transaction. Non-monetary assets and liabilities denominated in foreign currencies that
are stated at fair value are translated to Euro at foreign exchange rates ruling at the
dates the fair value was determined.
Assets and liabilities of foreign operations are translated to Euro at foreign exchange
rates prevailing at the balance sheet date. Income statements of foreign operations,
excluding foreign entities in hyperinflationary economies, are translated to Euro at
exchange rates for the year approximating the foreign exchange rates prevailing at the
dates of the transactions. The components of shareholders’ equity are translated at
historical rates. Exchange differences arising from the translation of shareholders’
equity to Euro at year-end exchange rates are taken to Equity (translation reserves).
In hyperinflationary economies, re-measurement of the local currency denominated
non-monetary assets, liabilities, income statement accounts as well as equity accounts
is made by applying a general price index. These re-measured accounts are used for
conversion into Euro at the closing exchange rate. For subsidiaries and associated
companies in countries with hyperinflation where a general price index method is not
yet stabilized and does not provide reliable results, the balance sheet and income
statement are re-measured into Euro as if it was the operation’s functional currency. In
2006 and 2005, InBev had no operations in hyperinflationary economies. The following
exchange rates have been used in preparing the financial statements:
1 Euro equals Closing rate Average rate
2006 2005 2006 2005
Argentinean peso 4,042527 3,571543 3,842754 3,656615

Financial Statement Analysis
19
Brazilian real 2,815751 2,761317 2,736308 3,027725
Bulgarian lev 1,955799 1,956300 1,955818 1,955833
Canadian dollar 1,528101 1,372501 1,415953 1,516470
Chinese yuan 10,279288 9,520455 10,058035 10,249997
Croatian kuna 7,345056 7,375610 7,301935 7,416637
Hungarian forint 251,762336 252,844501 265,463233 247,954376
Pound sterling 0,671500 0,685300 0,682320 0,684589
Russian ruble 34,696922 34,184528 34,094783 35,410765
Serbian dinar 79,001422 85,499316 84,530854 82,583203
South Korean won 1 225,490196 1 184,834123 1 199,040767 1 282,051282
Ukrainian hryvnia 6,650838 5,971611 6,328954 6,415027
US dollar 1,317001 1,179700 1,254287 1,250607
Intangibles Assets
4.3.1.1 Research and development
Expenditure on research activities, undertaken with the prospect of gaining new
scientific or technical knowledge and understanding, is recognized in the income
statement as an expense as incurred.
Expenditure on development activities, whereby research findings are applied to a plan
or design for the production of new or substantially improved products and processes,
is capitalized if the product or process is technically and commercially feasible, future
economic benefits are probable and the company has sufficient resources to complete
development. The expenditure capitalized includes the cost of materials, direct labour
and an appropriate proportion of overheads. Other development expenditure is
recognized in the income statement as an expense as incurred. Capitalized
development expenditure is stated at cost less accumulated amortisation and
impairment losses.
4.3.1.2 Supply and distribution rights
A supply right is the right for InBev to supply a customer and the commitment by the
customer to purchase from InBev. A distribution right is the right to sell specified
products in a certain territory.
Acquired customer relationships in a business combination are initially recognized at
fair value as supply rights to the extent that they arise from contractual rights. If the
IFRS recognition criteria are not met, these relationships are subsumed under goodwill.

Financial Statement Analysis
20
Acquired distribution rights are measured initially at cost or fair value when obtained
through a business combination.
4.3.1.3 Brands
If part of the consideration paid in a business combination relates to trademarks, trade
names, formulas, recipes or technological expertise these intangible assets are
considered as a group of complementary assets that is referred to as a brand for which
one fair value is determined. Expenditure on internally generated brands is expensed
as incurred.
4.3.1.4 Other intangible assets
Other intangible assets, acquired by the company, are stated at cost less accumulated
amortisation and impairment losses
4.3.1.5 Subsequent expenditure
Subsequent expenditure on capitalized intangible assets is capitalized only when it
increases the future economic benefits embodied in the specific asset to which it
relates. All other expenditure is expensed as incurred.
4.3.1.6 Amortisation
Intangible assets with a finite life are amortised using the straight-line method over their
estimated useful lives. Licenses, brewing, supply and distribution rights are amortised
over the period in which the rights exist. Brands are considered to have an indefinite
life unless plans exist to discontinue the brand. Discontinuance of a brand can be either
through sale or termination of marketing support. When InBev buys back distribution
rights for its own products the life of these rights is considered indefinite, unless the
company has a plan to discontinue the related brand or distribution.
Property, Plant and Equipment
Property, plant and equipment are measured at cost less accumulated depreciation
and impairment losses. Cost includes the purchase price and any costs directly
attributable to bringing the asset to the location and condition necessary for it to be
capable of operating in the manner intended by management (e.g. non refundable tax,
transport and the costs of dismantling and removing the items and restoring the site on
witch they are located, if applicable). The cost of a self-constructed asset is determined
using the same principles as for an acquired asset.

Financial Statement Analysis
21
4.3.1.7 Subsequent expenditure
The company recognises in the carrying amount of an item of property, plant and
equipment the cost of replacing part of such an item when that cost is incurred if it is
probable that the future economic benefits embodied with the item will flow to the
company and the cost of the item can be measured reliably. All other costs are
expensed as incurred.
4.3.1.8 Depreciation
The depreciable amount is the cost of an asset less its residual value. Residual values,
if not insignificant, are reassessed annually. Depreciation is calculated from the date
the asset is available for use, using the straight-line method over the estimated useful
lives of the assets.
The estimated useful lives are as follows:
Estimated useful lives
Industrial buildings 20 years
Other real estate properties 33 years
Production plant and equipment:
Production equipment 15 years
Storage and packaging equipment 7 years
Duo tanks 7 years
Handling and other equipment 5 years
Returnable packaging:
Kegs 10 years
Crates 10 years
Bottles 5 years
Point of sale furniture and equipment 5 years
Vehicles 5 years
Information processing equipment 3 or 5 years
Where parts of an item of property, plant and equipment have different useful lives,
they are accounted for as separate items of property, plant and equipment. Land is not
depreciated as it is deemed to have an infinite life.
Inventories
Inventories are valued at the lower of cost and net realisable value. Cost includes
expenditure incurred in acquiring the inventories and bringing them to their existing

Financial Statement Analysis
22
location and condition. The weighted average method is used in assigning the cost of
inventories.
The cost of finished products and work in progress comprises raw materials, other
production materials, direct labour, other direct cost and an allocation of fixed and
variable overhead based on normal operating capacity. Net realisable value is the
estimated selling price in the ordinary course of business, less the estimated
completion and selling costs.
Impairment
The carrying amounts of financial assets, property, plant and equipment, goodwill and
intangible assets are reviewed at each balance sheet date to determine whether there
is any indication of impairment. If any such indication exists, the asset’s recoverable
amount is estimated. In addition, goodwill, intangible assets that are not yet available
for use and intangibles with an indefinite life are tested for impairment annually. An
impairment loss is recognised whenever the carrying amount of an asset or the related
cash-generating unit exceeds its recoverable amount. Impairment losses are
recognised in the income statement.
4.3.1.9 Calculation of recoverable amount
The recoverable amount of the company’s investments in unquoted debt securities is
calculated as the present value of expected future cash flows, discounted at the debt
securities’ original effective interest rate. For equity and quoted debt securities the
recoverable amount is their fair value.
The recoverable amount of other assets is determined as the higher of their fair value
less costs to sell and value in use. For an asset that does not generate largely
independent cash inflows, the recoverable amount is determined for the cash-
generating unit to which the asset belongs. In assessing value in use, the estimated
future cash flows are discounted to their present value using a pre-tax discount rate
that reflects current market assessments of the time value of money and the risks
specific to the asset. Impairment losses recognised in respect of cash-generating units
are allocated first to reduce the carrying amount of any goodwill allocated to the units
and then to reduce the carrying amount of the other assets in the unit on a pro rata
basis.
Impairment testing of intangible assets with an indefinite useful life is primarily based
on a fair value approach applying multiples that reflect current market transactions to
indicators that drive the profitability of the asset or the royalty stream that could be

Financial Statement Analysis
23
obtained from licensing the intangible asset to another party in an arm’s length
transaction.
For goodwill, the recoverable amount of the cash generating units to which the goodwill
belongs is based on a fair value approach. More specifically, a discounted free cash
flow approach, based on current acquisition valuation models, is used. These
calculations are corroborated by valuation multiples, quoted share prices for publicly
traded subsidiaries or other available fair value indicators. As regards the level of
goodwill impairment testing, InBev’s overall approach is to test goodwill for impairment
at the business unit level (i.e. one level below the segments).
4.3.1.10 Reversal of impairment losses
An impairment loss in respect of goodwill or investments in equity securities is not
reversed. Impairment losses on other assets are reversed if the subsequent increase in
recoverable amount can be related objectively to an event occurring after the
impairment loss was recognised. An impairment loss is reversed only to the extent that
the asset’s carrying amount does not exceed the carrying amount that would have
been determined, net of depreciation or amortisation, if no impairment loss had been
recognised.
5. Ratio analysis
As we have already mentioned it earlier, in Belgium, goodwill had to be capitalised and
amortised while, in the Netherlands, it was charged to shareholder equity in some
case. The fact that the goodwill was always capitalised by InBev but not by Heineken
will have an impact on the financial ratios we will derive from their financial statements.
5.1 Profitability analysis
Return on Equity (ROE)
ROE= Net profit/ Shareholder’s equity
ROE offers a useful signal of financial success since it might indicate whether the
company is growing profits without pouring new equity capital into the business. A
steadily increase in ROE is a hint that management is giving shareholders more for
their money, which is represented by shareholders’ equity. Simply put, ROE indicates
how well management is employing the investor’s capital investment in the Company.

Financial Statement Analysis
24
InBev, over the past 5 years has seen a steady increase in the ROE from 2002 to
2005: 9.75% to 11.83% and a stronger increase over the last financial year from
11.83% to 16.18%, as seen in figure 1 below.
2006 2005 2004 2003 2002
ROE INBEV 16.18% 11.83% 10.33% 10.88% 9.75%
SABMiller 12.55% 12.32% 19.75% 11.63% 6.63%
Heineken 24.37% 19.25% 19.64% 22.16% 28.28%
ROE
0.00%
5.00%
10.00%
15.00%
20.00%
25.00%
30.00%
2006 2005 2004 2003 2002
INBEV
SABMiller
Heineken
SABMiller had a strong ROE increase over the years 2002 until 2004 from 6.63% to
19.65% and its ROE decreased afterwards from 2004 to 2005, to stabilize in 2006.
SABMiller reaped the benefits of its acquisitions during 1999-2002 (acquisition of
Pilsner Urquell, acquisition in India 2000, acquisition in Miller in 2002 and more
general, acquisitions in all continents). Moreover, the excellent operating performance
combined with favourable currency rates resulted in adjusted earnings increase, which
translates into adjusted earnings per share of 33% in 2005. The effect of the favourable
currency rates is of particular importance taken into account that the operating income
generated by South Africa amounted 38% to of SABMiller’s total operating income in
2004.
Heineken had a steady ROE decline until 2005, to increase in 2006.
In order to analyze this further we will decompose ROE.
ROE = Net income/total revenue x total revenue/assets x assets/shareholders’ equity (financial leverage)

Financial Statement Analysis
25
Ratios
InBev
2006 2005 2004 2003 2002
Net profit
margin 15.98% 12.03% 10.48% 7.92% 7.19%
Gross profit
margin 23.51% 18.86% 15.34% 11.91% 10.41%
Asset
turnover 67.45% 64.40% 68.25% 89.50% 96.90%
ROA 10.78% 7.75% 7.15% 7.09% 6.97%
Financial
leverage 150.13% 152.73% 144.42% 153.41% 139.93%
ROE 16.18% 11.83% 10.33% 10.88% 9.75%
Ratios
SABMiller
2006 2005 2004 2003 2002
Net profit
margin 10.11% 10.94% 13.40% 7.14% 5.10%
Gross profit
margin 16.26% 16.82% 19.74% 11.64% 9.72%
Asset
turnover 84.00% 73.55% 105.23% 104.76% 102.25%
ROA 8.49% 8.04% 14.10% 7.48% 5.21%
Financial
leverage 147.77% 153.21% 140.03% 155.36% 127.24%
ROE 12.55% 12.32% 19.75% 11.63% 6.63%
InBev’s business excluding AmBev, which for most of the last couple of years has
traded at a discount to Heineken (Buy, EUR 39.76), has now moved to virtual P/E
parity on Deutsche Bank’s numbers (see Figure 3).

Financial Statement Analysis
26
Return on assets (ROA)
ROA gives an indication of what earnings were generated from invested capital
(assets) (“sweat the assets”). ROA for listed companies can vary substantially
depending on the industry they are in. In this case, InBev’s asset turnover decreased
until 2005, to increase in 2006. On the other hand, the ROA experienced a steady
increase over the years 2002 until 2005, to increase in an important way in 2006. This
proves that InBev’s cost saving strategy is efficient. Next, their sale of non core assets
Ratios
Heineken
2006 2005 2004 2003 2002
Net profit
margin 11.37% 8.05% 7.28% 9.34% 10.10%
Gross profit
margin 15.26% 11.62% 13.40% 13.20% 15.11%
Asset
turnover 138.87% 140.50% 136.92% 115.88% 162.30%
ROA 15.79% 11.31% 9.97% 10.82% 16.40%
Financial
leverage 154.31% 170.23% 196.87% 204.85% 172.48%
ROE 24.37% 19.25% 19.64% 22.16% 28.28%
Financial Statement Analysis
27
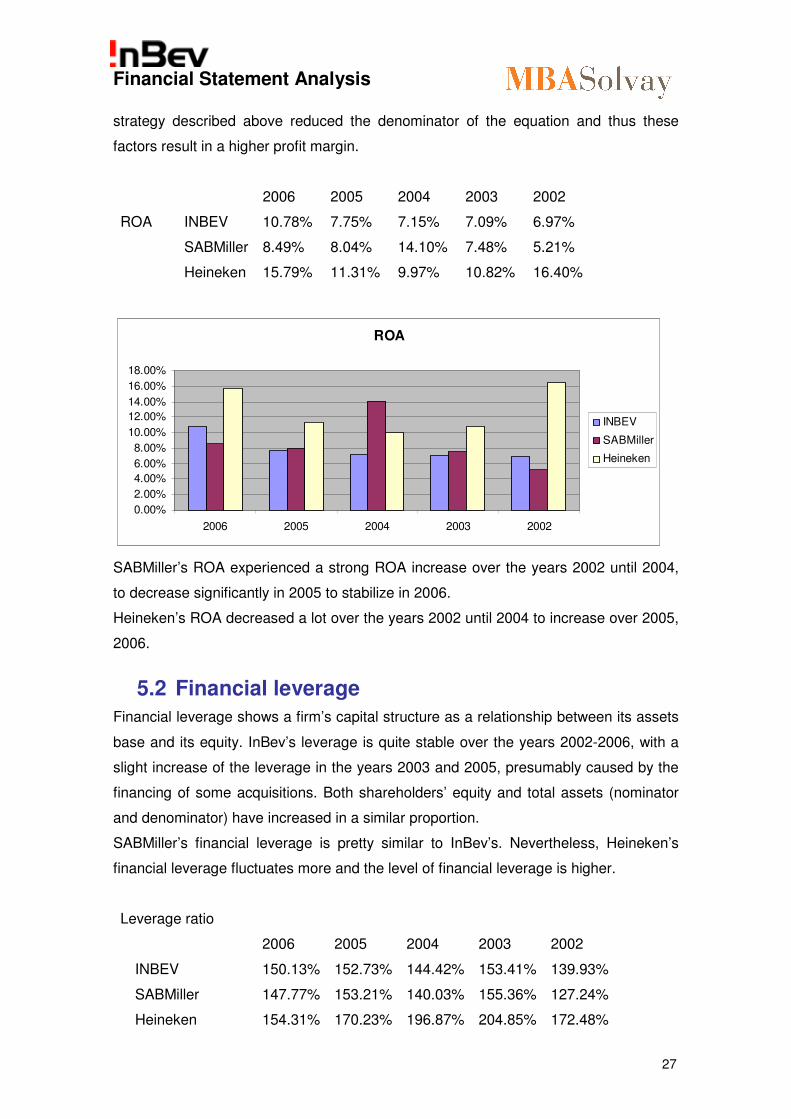
strategy described above reduced the denominator of the equation and thus these
factors result in a higher profit margin.
2006 2005 2004 2003 2002
ROA INBEV 10.78% 7.75% 7.15% 7.09% 6.97%
SABMiller 8.49% 8.04% 14.10% 7.48% 5.21%
Heineken 15.79% 11.31% 9.97% 10.82% 16.40%
ROA
0.00%
2.00%
4.00%
6.00%
8.00%
10.00%
12.00%
14.00%
16.00%
18.00%
2006 2005 2004 2003 2002
INBEV
SABMiller
Heineken
SABMiller’s ROA experienced a strong ROA increase over the years 2002 until 2004,
to decrease significantly in 2005 to stabilize in 2006.
Heineken’s ROA decreased a lot over the years 2002 until 2004 to increase over 2005,
2006.
5.2 Financial leverage
Financial leverage shows a firm’s capital structure as a relationship between its assets
base and its equity. InBev’s leverage is quite stable over the years 2002-2006, with a
slight increase of the leverage in the years 2003 and 2005, presumably caused by the
financing of some acquisitions. Both shareholders’ equity and total assets (nominator
and denominator) have increased in a similar proportion.
SABMiller’s financial leverage is pretty similar to InBev’s. Nevertheless, Heineken’s
financial leverage fluctuates more and the level of financial leverage is higher.
Leverage ratio
2006 2005 2004 2003 2002
INBEV 150.13% 152.73% 144.42% 153.41% 139.93%
SABMiller 147.77% 153.21% 140.03% 155.36% 127.24%
Heineken 154.31% 170.23% 196.87% 204.85% 172.48%

Financial Statement Analysis
28
Leverage Ratio
0.00%
50.00%
100.00%
150.00%
200.00%
250.00%
2006 2005 2004 2003 2002
INBEV
SABMiller
Heineken
5.3 Operation Management analysis
Net profit margin
In general, profit margins reflect the firm’s ability to produce a product at a low cost or
at a high price. InBev focuses clearly on cost saving, through its zero-based budgeting
strategy. Petercam’s financial analysis report states: “the main take away from the
results is the excellent progress achieved in the implementation of ZBB (zero based
budgeting) in Western Europe, sending EBITDA margin to 31.9% vs 28.6% in 05.”.
Even though the commodity price increased, InBev’s cost saving policy was still
effective.
Asset turnover
Asset turnover is the amount of sales generated for every euro worth of assets. It is
calculated by dividing sales by assets. This measures the firm’s efficiency at using
assets. Companies with low profit margins tend to have high asset turnover, those with
high margins tend to have low asset turnover. Indeed, InBev’s asset turnover is
relatively low compared to its competitors. We assume that the relatively low asset
turnover is caused by InBev’s acquisition strategy. Through the acquisitions, the
number of production centers and thus the number of assets increased. Moreover,
InBev’s profit margins are increasing (see above).
InBev has a large number of breweries, in order to be close to their final consumers.
This increases of course the number of fixed assets. Heineken, on the contrary, works
through a large distribution network, instead of having local breweries. Consequently,
the number of assets is lower. Also, the goodwill in the Dutch GAAP is not capitalized.

Financial Statement Analysis
29
Consequently, the amount of assets is much lower and it impacted on the Asset
Turnover.
2005 SABMiller got rid of its non-core activities such as the sale of its participation in
Edgars. 2005 was for SABMiller not a year of headline grabbing acquisitions - more a
case of incrementally building the business and reinforcing our position as one o the
world leading breweries.
Asset turnover 2006 2005 2004 2003 2002
InBev 67.45% 64.40% 68.25% 89.50% 96.90%
SABMiller 84.00% 73.55% 105.23% 104.76% 102.25%
Heineken 138.87% 140.50% 136.92% 115.88% 162.30%
0.00%
20.00%
40.00%
60.00%
80.00%
100.00%
120.00%
140.00%
160.00%
180.00%
2006 2005 2004 2003 2002
INBEV
SABMiller
Heineken
Return on invested capital (ROIC)
The ROIC is a financial measure that quantifies how well a company generates cash
flow relative to the capital it has invested in its business. InBev’s ROIC increased
steadily over the years 2002 -2006.
ROIC = operating income (EBIT) x (1- tax rate)/ total assets
Taking into account that InBev’s total assets and its earnings increased and that its tax
rate decreased because of the lower tax rate in emerging countries, the ROIC
increases.
SABMiller’s and Heineken’s ROIC are quite unstable. Heineken’s ROIC is however a
lot higher than the one of SABMiller and InBev. This is to be explained by the total
assets of Heineken which is lower because the goodwill has not be capitalized.

Financial Statement Analysis
30
Furthermore, Heineken works with distribution network and have fewer breweries
across the world.
ROIC
2006 2005 2004 2003 2002
INBEV 12.69% 9.50% 8.07% 8.01% 7.63%
SABMiller 9.17% 8.44% 14.08% 7.12% 5.43%
Heineken 16.67% 12.13% 12.94% 11.17% 17.22%
ROIC
0.00%
5.00%
10.00%
15.00%
20.00%
2006 2005 2004 2003 2002
INBEV
SABMiller
Heineken
5.4 Financial management analysis
Liquidity ratios
2006 2005 2004 2003 2002
Current ratio 73.11% 78.03% 64.55% 78.57% 59.92%
Quick ratio 57.50% 61.03% 50.65% 63.80% 48.63%
Operating cash flow ratio 50.45% 44.02% 22.72% 36.97% 26.59%
These ratios give an indication on a company’s ability to repay its current liabilities. The
current ratio looks at current assets over current liabilities. If the value is more than one
it is believed that the firm will be able to meet its obligations. However, in some
circumstances it could be useful to also evaluate its ability to repay current liabilities by
taking only liquid assets into consideration (quick ratio) or even only consider cash flow
from operations as the means for repayment. All these ratios together give us a useful
tool to evaluate the financial management of the company.
According to us, InBev’s bargaining power towards suppliers and clients is high.
Consequently, the accounts payables are high, compared to the accounts receivables,
which are low. In other words, InBev requires quick payment from its clients, while it will

Financial Statement Analysis
31
demand for long payment terms from its suppliers. Consequently is partly financed by
its suppliers.
Debt ratios
5.4.1.1 Debt/Equity ratio (D/E)
The ideal capital structure for a firm depends on its business risk. The business risk is
measured by the predictability of the future cash flows. Highly predictable cash flows
represent low risk and thus such firms can have more debt financing. Debt financing is
interesting for companies because it is normally cheaper than equity financing. The
interest payments are tax deductible (this advantage is however decreased thanks to
the mechanism of notional interest deduction), but it increases fixed costs and
therefore forces discipline onto management. Lastly, it is often easier to raise debt than
equity because communication efforts only need to go towards a select number of
private lenders rather than to public capital markets.
As far as the D/E ratio is concerned, we can see that InBev has a one to two ratio,
which means that the company holds on average twice as much equity than debt. As
mentioned above, this reflects its inherent industry and company risk.
InBev’s D/E ratio is pretty similar to SABMiller’s D/E ratio. However, the D/E ratio for
Heineken is much higher and thus its indebtedness is higher than the one for InBev
and SABMiller.
The equity of Heineken is much lower than the two others. This can be explained by
the fact that until they adopted the IFRS accounting system, they subtracted the
amount of the acquisitions made from the equity. This means that the denominator was
relatively lower than the competitors resulting in a higher D/E ratio.
Debt/ Equity ratio
2006 2005 2004 2003 2002
InBev 50.13% 52.73% 44.42% 53.41% 39.93%
SABMiller 47.77% 53.21% 40.03% 55.36% 27.24%
Heineken 54.31% 70.23% 96.87% 104.85% 72.48%

Financial Statement Analysis
32
Structural leverage
0.00%
20.00%
40.00%
60.00%
80.00%
100.00%
120.00%
2006 2005 2004 2003 2002
INBEV
SABMiller
Heineken
5.4.1.2 Interest ratio
Interest coverage ratios measure how easily a company is able to pay its interest
obligations and indicates the degree of risk related to its choice of capital structure and
debt policy. The lower the ratio, the easier it is for the company to meet its interest
obligations.
InBev’s interest rate coverage decreases in a more significant way in 2005 probably
due to the financing of the merger with Ambev, which bears interests. The interest rate
coverage then slightly increases in 2006.
Compared to the other 2 companies, InBev’s interest coverage ratio is rather low.
Interest rate Coverage
2006 2005 2004 2003 2002
InBev 15.08% 18.43% 11.34% 11.44% 8.65%
SABMiller 7.37% 4.74% -0.20% -5.14% 4.11%
Heineken 5.26% 6.78% 22.92% 3.19% 4.76%

Financial Statement Analysis
33
Interest rate coverage
-10.00%
-5.00%
0.00%
5.00%
10.00%
15.00%
20.00%
25.00%
2006 2005 2004 2003 2002
INBEV
SABMiller
Heineken
5.5 Sustainable growth rate
Sustainable growth rate = Net margin x (1- payout ratio) x (1+D/E)
Total assets/sales – (net margin x (1-payout ratio) x (1+D/E))
The sustainable growth rate defines the growth rate that the company could have
without having to change its profitability and financial policies. Sustainable growth is
often used by banks and other analyst to assess a company’s credit worthiness. If
actual growth consistently exceeds sustainable growth management’s problem will be
where to get the cash to finance growth. Conversely if sustainable growth consistently
exceeds actual growth, the banker had best be prepared to talk about investment
products because management’s problem will be what to do with all the cash that
keeps piling up in the till.
Taken into account that growth in this sector is mainly achieved through mergers and
acquisitions and through cost saving policies, achieving a sustainable growth rate of
12.97% over the last financial year is quite good, certainly taken into account that in
2002 the sustainable growth reached only 7.53%.
Interest rate coverage
-600,00
-500,00
-400,00
-300,00
-200,00
-100,00
0,00
100,00
2006 2005 2004 2003 2002
INBEV
SABMiller
Heineken

Financial Statement Analysis
34
The actual growth rate amounts to 14% in 2006 compared to a sustainable growth rate
of 12.97%. It means that InBev will need moderate external financing to sustain its
growth.
Heineken’s sustainable growth rate is very high (23.52%) compared to its actual growth
rate which is 9.6%. Consequently, Heineken has the financial means to develop an
investment strategy.

Financial Statement Analysis
35
Sustainable growth of InBev
Total assets to sale ratio (T) 148.26% 155.27% 146.52% 111.73% 103.20%
Net profit margin on sales (p) 15.98% 12.03% 10.48% 7.92% 7.19%
Payout Ratio (d) 29.02% 40.51% 25.50% 30.11% 28.23%
Retention Ratio 70.98% 59.49% 74.50% 69.89% 71.77%
Debt-equity Ratio (L) 50.13% 52.73% 44.42% 53.41% 39.93%
Sustainable growth 12.97% 7.57% 8.34% 8.23% 7.53%
Sustainable growth of
SABMiller
Total assets to sale ratio (T) 119.05% 135.97% 95.03% 95.46% 97.80%
Net profit margin on sales (p) 10.11% 10.94% 13.40% 7.14% 5.10%
Payout Ratio (d) 44.72% 41.04% 33.78% 38.05% 48.22%
Retention Ratio 55.28% 68.96% 66.22% 61.95% 51.88%
Debt-equity Ratio (L) 47.77% 53.21% 40.03% 55.36% 27.24%
Sustainable growth 7.46% 7.83% 15.05% 7.76% 3.56%
Sustainable growth of
Heineken
Total assets to sale ratio (T) 72.01% 71.17% 73.04% 86.30% 61.61%
Net profit margin on sales (p) 11.37% 8.05% 7.28% 9.34% 10.10%
Payout Ratio (d) 21.86% 31.19% 33.15% 28.13% 28.35%
Retention Ratio 78.14% 68.81% 66.85% 71.87% 71.65%
Debt-equity Ratio (L) 54.31% 70.23% 96.87% 104.85% 72.48%
Sustainable growth 23.52% 15.27% 15.11% 18.94% 25.41%
5.6 Cash flow analysis
The cash flow analysis presented in figure XX below shows InBev had an operating
cash flow of EUR 3,287,000,000 in 2006, a substantial improvement from EUR
2,405,000,000 in 2005.

Financial Statement Analysis
36
This is the result of their strategy; being a combination of the following elements:
- ZBB and VOP (cost saving strategy)
- Sale of non core assets
- Increase in prices in mature markets
- Increase in sales volumes in emerging markets
- InBev has a large number of breweries, in order to be close to their final
consumers. This increases of course the number of fixed assets, but on the
other hand, reduces staff, transportation and other costs.
InBev generates a very high operating cash flow, as from 2002 until 2006, its cash flow
has more than tripled.
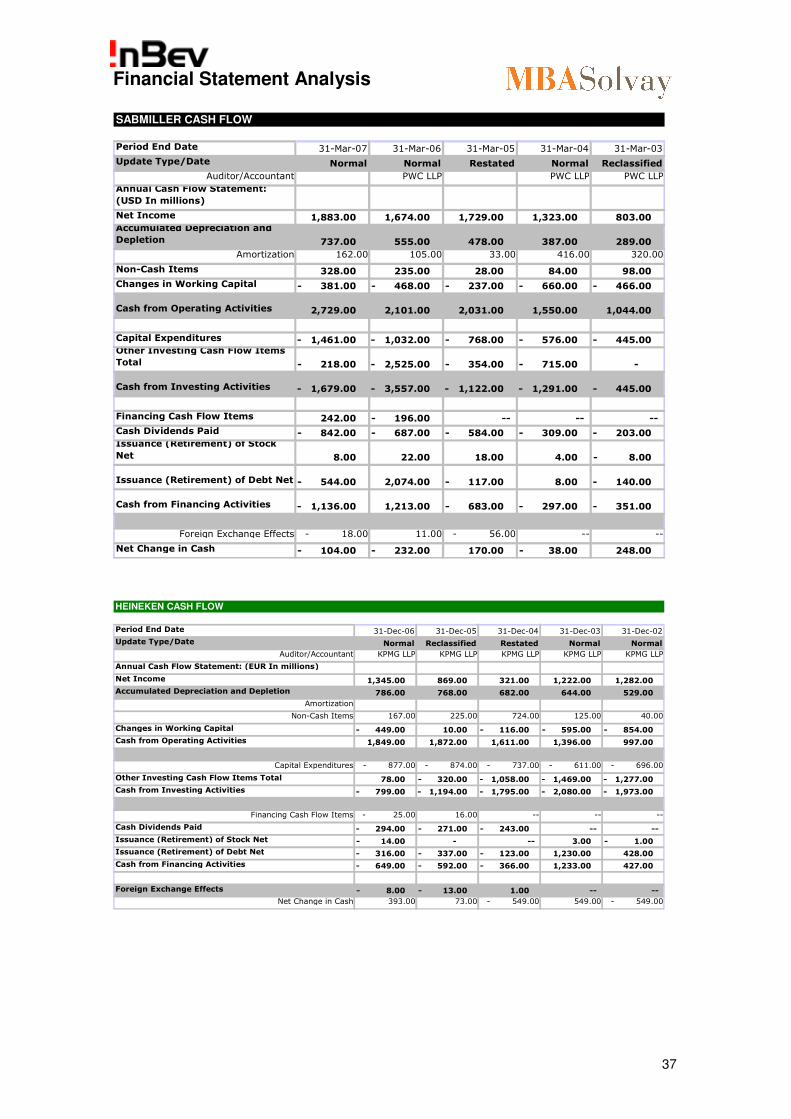
SABMiller’s operating cash flow merely tripled, while Heineken’s operating cash flow
almost doubled.
INBEV CASH FLOW STATEMENT
Period End Date 31-Dec-06 31-Dec-05 31-Dec-04 31-Dec-03 31-Dec-02
Update Type/Date Normal Reclassified Reclassified Normal Normal
Auditor/Accountant KPMG LLP KPMG LLP KPMG LLP KPMG LLP KPMG LLP
Annual Cash Flow Statement: (EUR In millions)
Net Income 2,126.00 1,402.00 898.00 505.00 467.00
Accumulated Depreciation and Depletion 934.00 829.00 621.00 504.00 504.00
Amortization 78.00 59.00 265.00 157.00 137.00
Non-Cash Items 562.00 586.00 416.00- 312.00 269.00
Changes in Working Capital 413.00- 471.00- 16.00 327.00- 332.00-
Cash from Operating Activities 3,287.00 2,405.00 1,384.00 1,151.00 1,045.00
Capital Expenditures 1,380.00- 1,181.00- 860.00- 681.00- 607.00-
Other Investing Cash Flow Items Total 2,101.00- 1,403.00- 283.00 258.00- 359.00-
Cash from Investing Activities 3,481.00- 2,584.00- 577.00- 939.00- 966.00-
Financing Cash Flow Items 75.00- 81.00- 6.00- -- --
Cash Dividends Paid 617.00- 568.00- 229.00- 168.00- 142.00-
Issuance (Retirement) of Stock Net 23.00 53.00- 29.00 7.00 3.00
Issuance (Retirement) of Debt Net 877.00 518.00 81.00- 234.00 191.00-
Cash from Financing Activities 208.00 184.00- 287.00- 73.00 330.00-
Foreign Exchange Effects - 30.00 39.00 - 4.00 - 18.00 - 5.00
Net Change in Cash 16.00- 324.00- 516.00 267.00 256.00-
Operating cash flow ratio: cash flow from operations/ current liabilities
Cash from Operating Activities 3,287.00 2,405.00 1,384.00 1,151.00 1,045.00
current 6,516.00 5,463.00 6,091.00 3,113.00 3,930.00
50.45% 44.02% 22.72% 36.97% 26.59%
Financial Statement Analysis
37
SABMILLER CASH FLOW
Period End Date 31-Mar-07 31-Mar-06 31-Mar-05 31-Mar-04 31-Mar-03
Update Type/Date Normal Normal Restated Normal Reclassified
Auditor/Accountant PWC LLP PWC LLP PWC LLP
Annual Cash Flow Statement:
(USD In millions)
Net Income 1,883.00 1,674.00 1,729.00 1,323.00 803.00 Accumulated Depreciation and
Depletion 737.00 555.00 478.00 387.00 289.00
Amortization 162.00 105.00 33.00 416.00 320.00
Non-Cash Items 328.00 235.00 28.00 84.00 98.00
Changes in Working Capital 381.00- 468.00- 237.00- 660.00- 466.00-
Cash from Operating Activities 2,729.00 2,101.00 2,031.00 1,550.00 1,044.00
Capital Expenditures 1,461.00- 1,032.00- 768.00- 576.00- 445.00- Other Investing Cash Flow Items
Total 218.00- 2,525.00- 354.00- 715.00- -
Cash from Investing Activities 1,679.00- 3,557.00- 1,122.00- 1,291.00- 445.00-
Financing Cash Flow Items 242.00 196.00- -- -- --
Cash Dividends Paid 842.00- 687.00- 584.00- 309.00- 203.00- Issuance (Retirement) of Stock
Net 8.00 22.00 18.00 4.00 8.00-
Issuance (Retirement) of Debt Net 544.00- 2,074.00 117.00- 8.00 140.00-
Cash from Financing Activities 1,136.00- 1,213.00 683.00- 297.00- 351.00-
Foreign Exchange Effects - 18.00 11.00 - 56.00 -- --
Net Change in Cash 104.00- 232.00- 170.00 38.00- 248.00
HEINEKEN CASH FLOW
Period End Date 31-Dec-06 31-Dec-05 31-Dec-04 31-Dec-03 31-Dec-02
Update Type/Date Normal Reclassified Restated Normal Normal
Auditor/Accountant KPMG LLP KPMG LLP KPMG LLP KPMG LLP KPMG LLP
Annual Cash Flow Statement: (EUR In millions)
Net Income 1,345.00 869.00 321.00 1,222.00 1,282.00
Accumulated Depreciation and Depletion 786.00 768.00 682.00 644.00 529.00
Amortization
Non-Cash Items 167.00 225.00 724.00 125.00 40.00
Changes in Working Capital 449.00- 10.00 116.00- 595.00- 854.00-
Cash from Operating Activities 1,849.00 1,872.00 1,611.00 1,396.00 997.00
Capital Expenditures - 877.00 - 874.00 - 737.00 - 611.00 - 696.00
Other Investing Cash Flow Items Total 78.00 320.00- 1,058.00- 1,469.00- 1,277.00-
Cash from Investing Activities 799.00- 1,194.00- 1,795.00- 2,080.00- 1,973.00-
Financing Cash Flow Items - 25.00 16.00 -- -- --
Cash Dividends Paid 294.00- 271.00- 243.00- -- --
Issuance (Retirement) of Stock Net 14.00- - -- 3.00 1.00-
Issuance (Retirement) of Debt Net 316.00- 337.00- 123.00- 1,230.00 428.00
Cash from Financing Activities 649.00- 592.00- 366.00- 1,233.00 427.00
Foreign Exchange Effects 8.00- 13.00- 1.00 -- --
Net Change in Cash 393.00 73.00 - 549.00 549.00 - 549.00

Financial Statement Analysis
38
Annex
Overview of Accounting Requirements under IFRS
Conceptual Framework
Financial information must possess certain characteristics for it to be useful. The IFRS
Framework requires that financial information must be understandable, relevant,
reliable and comparable.
The IFRS Framework presents five reporting elements: assets, liabilities, equity,
income (includes revenues and gains) and expenses (includes losses).
� Assets are resources controlled from a past event. Liabilities are present
obligations arising from a past event. Assets and liabilities are recognised on the
balance sheet when it is ‘probable’ that economic benefits will flow in to or out from
the entity, and those benefits must be able to be measured reliably.
� Equity is the residual interest in the assets after deducting the entity’s liabilities.
� Income is increases in economic benefits that result in increases in equity other
than those relating to contributions from equity participants. Expenses are
decreases in economic benefits that result in decreases in equity other than those
relating to distributions to equity participants.
Historical cost is the main accounting convention. However, IFRS permits the
revaluation of intangible assets, property, plant and equipment (PPE) and investment
property. IFRS also requires fair valuation of certain categories of financial instruments
and certain biological assets.
Entities may depart from a standard in extremely rare circumstances in which
management concludes that compliance with a requirement in an IFRS or an
Interpretation of a Standard would be so misleading that it would conflict with the
objective of financial statements set out in the Framework for the Preparation and
Presentation of Financial Statements. IFRS requires disclosure of the nature of and the
reason for the departure and the financial impact of the departure. The override does
not apply where there is a conflict between local company law and IFRS; in such a
situation, the IFRS requirements must be applied.
First-time adoption of IFRS as the primary accounting basis requires full retrospective
application of all IFRS’s effective at the reporting date for an entity’s first IFRS financial
statements, with optional exemptions primarily for PPE and other assets, business
combinations and pension plan accounting and limited mandatory exceptions.
Comparative information must be prepared and presented on the basis of IFRS. Almost
all adjustments arising from the first-time application of IFRS must be adjusted against
opening retained earnings of the first period presented on an IFRS basis. Some
adjustments are made against goodwill or against other classes of equity.

Financial Statement Analysis
39
General Requirements
Entities must disclose that financial statements comply with IFRS. Compliance with
IFRS should not be disclosed unless the financial statements comply with all the
requirements of each applicable standard and each applicable interpretation.
A set of financial statements under IFRS comprises the following components:
� balance sheet;
� income statement;
� statement of recognised gains and losses;
� statement of changes in shareholders’ equity;
� cash flow statement;
� accounting policies; and
� notes to financial statements.
IFRS requires one year of comparatives for all numerical information in the financial
statements, with small exceptions.
Balance Sheet
IFRS does not prescribe a particular balance sheet format, except that IFRS requires
separate presentation of total assets and total liabilities. Management may use
judgement regarding the form of presentation in many areas. Entities present current
and non-current assets, and current and non-current liabilities, as separate
classifications on the face of their balance sheet except when a liquidity presentation
provides more relevant and reliable information. In such cases, all assets and liabilities
should be presented broadly in order of liquidity. However, as a minimum, IFRS
requires presentation of the following items on the face of the balance sheet:
� Assets: PPE, investment property, intangible assets, financial assets, investments
accounted for using the equity method, biological assets, inventories, trade and
other receivables, tax assets and cash and cash equivalents; and
� Equity and liabilities: issued share capital and other components of parent
shareholders’ equity, financial liabilities, provisions, tax liabilities and trade and
other payables, and minority interests (presented within equity).
The current/non-current distinction is not optional (except when a liquidity presentation
is used). Where the distinction is made, assets must be classified as current assets
where they are held for sale or consumption in the normal course of the operating
cycle. Both assets and liabilities are classified as current where they are held for
trading or expected to be realised within 12 months of the balance sheet date. Interest-
bearing liabilities are classified as current when they are due to be settled within 12
months of the balance sheet date, even if the original term was for a period of more
than 12 months; and when an agreement to refinance, or to reschedule payments, on a
long-term basis is completed after the balance sheet date and before the financial
statements are authorised for issue.

Financial Statement Analysis
40
Assets and liabilities must not be offset, except where specifically permitted by a
standard. Financial assets and financial liabilities may be offset where an entity has a
legally enforceable right to offset the recognised amounts and intends to settle
transactions on a net basis.
Income Statement
IFRS does not prescribe a standard format for the income statement. The entity must
analyse its expenditure by function or nature. As a minimum, IFRS requires
presentation of the following items on the face of the income statement:
� revenue;
� finance costs;
� share of after-tax results of associates and joint ventures accounted for using the equity method;
� tax expense;
� post-tax gain or loss attributable to the results and re-measurement of discontinued operations; and
� net profit or loss for the period.
The portion of the net income attributable to the minority interest should be disclosed
separately in the income statement.
IFRS does not use the term exceptional items but requires the separate disclosure of
items of income and expense that are of such size, nature or incidence that their
separate disclosure is necessary to explain the performance of the entity for the period.
Disclosure may be on the face of the income statement or in the notes. Extraordinary
items are prohibited under IFRS.
Statement of Recognised Gains and Losses
The total of gains and losses recognised in the period comprises net income and the
following gains and losses recognised directly in equity:
� fair value gains/(losses) on land and buildings, intangible assets, available-for-sale investments and certain financial instruments;
� foreign exchange translation differences;
� the cumulative effect of changes in accounting policy; and
� changes in fair values on certain financial instruments if designated as cash flow hedges, net of tax, and cash flow hedges reclassified to income and/or the relevant hedged asset/liability.
Statement of Changes in Equity
The statement must be presented as a primary statement. It should show capital
transactions with owners, the movement in accumulated profit and a reconciliation of all
other components of equity.

Financial Statement Analysis
41
Cash Flow Statement
IFRS requires the cash flow statement to report inflows and outflows of ‘cash and cash
equivalents’. The cash flow statement may be prepared using either the direct method
(cash flows derived from aggregating cash receipts and payments associated with
operating activities) or the indirect method (cash flows derived from adjusting net
income for transactions of a non-cash nature such as depreciation). The latter is more
common in practice.
Cash includes overdrafts repayable on demand but not short-term bank borrowings,
which are considered to be financing flows. Cash equivalents are short-term, highly
liquid investments that are readily convertible to known amounts of cash and that are
subject to an insignificant risk of changes in value. An investment normally qualifies as
a cash equivalent only when it has a maturity of three months or less from its
acquisition date.
Changes in Accounting Policy and other changes
Changes in accounting policy should be accounted for retrospectively, with
comparative information restated and the amount of the adjustment relating to prior
periods adjusted against the opening balance of retained earnings of the earliest year
presented. An exemption applies when it is impracticable to change comparative
information.
Policy changes made on the adoption of a new standard must be accounted for in
accordance with that standard’s transition provisions. If transition provisions are not
specified, the method described above must be used.
For correction of errors, IFRS requires the same method as for policy changes. An
entity must restate comparatives.
Changes in accounting estimates are accounted for in the income statement when
identified. Changes in depreciation method and revised asset life are treated as a
change in accounting estimate.
Business Combination
A business combination involves the bringing together of separate entities or
businesses into one reporting entity. Three types of business combination occur in
practice. An acquisition is where one of the combining entities obtains control over the
other, enabling an acquirer to be identified; this is the most common type of
combination. A uniting of interests (pooling) occurs where the shareholders of the
combining entities join in substantially equal arrangements to share control. A group
reorganisation can arise from transactions among entities that operate under common
control. Business combinations are always accounted for as acquisitions. IFRS
requires the purchase method of accounting to be used to portray the financial effect of
an acquisition. The specific IFRS guidance about business combinations excludes from
its scope transactions among entities under common control.

Financial Statement Analysis
42
Goodwill
This section is entirely dedicated to goodwill as this balance sheet item is very
important in the brewery industry.
Practitioners and IASB led many discussions around the concept of goodwill
amortisation. The following arguments are often put forward in support of amortising
goodwill:
� Amortisation is a method of allocating the cost of goodwill over the periods it is
consumed, and is consistent with the approach taken to other intangible and
tangible fixed assets that do not have indefinite useful lives.
� Acquired goodwill is an asset that is consumed over time and replaced with
internally generated goodwill. Amortisation therefore ensures that the acquired
goodwill is written off and no internally generated goodwill is recognised in its place.
This is consistent with the general prohibition on recognising goodwill generated
internally by an entity.
� The useful life of acquired goodwill cannot be predicted with a satisfactory level of
reliability, nor can the pattern in which that goodwill is consumed be known.
Therefore, amortisation over an arbitrary period of time is the only practical solution
to an intractable problem.
However, the useful life of acquired goodwill and the pattern in which it diminishes
generally are not possible to predict, yet its amortisation depends on such predictions.
As a result, the amount amortised in any given period can at best be described as an
arbitrary estimate of the consumption of acquired goodwill during that period. In
addition, both anecdotal and research evidence supports the view that the amortisation
charge for goodwill has little, if any, information value for most users of financial
statements, and that an impairment-only model provides users with more useful
information.
Analysts frequently face the problem of how to consider goodwill amortisation in their
financial analysis. For many years, financial statement preparers and users have
criticised the accounting requirements to amortise purchased goodwill against
revenues over a period not to exceed 40 years. Critics have argued that goodwill may
not decline in value and that, even if it does, the arbitrary amounts recorded
periodically as goodwill amortisation are unlikely to reflect that decline. In this view,
goodwill amortisation simply adds noise to earnings, thereby reducing their usefulness
to investors. Accounting standard setters, in contrast, have until recently maintained
that goodwill is likely to be a wasting asset in most circumstances and that recording
goodwill amortisation makes reported earnings more useful to investors by reflecting its
decline in value. We provide empirical evidence as to which of these views is more
consistent with the way in which investors price securities.
Taking into account all these considerations, the IASB came to the following
conclusions:
Financial Statement Analysis
43
(a) to require goodwill to be tested for impairment annually, or more frequently if
events or changes in circumstances indicate a possible impairment;
(b) to prohibit reversals of impairment losses for goodwill;
(c) to require an intangible asset to be treated as having an indefinite useful life
when, based on an analysis of all relevant factors, there is no foreseeable limit
on the period over which the asset is expected to generate net cash inflows for
the entity. An intangible asset with an indefinite useful life must not be
amortised, but must instead be tested for impairment annually, or more
frequently if events or changes in circumstances indicate a possible impairment;
(d) to require disclosure of a range of information for each cash generating unit that
includes within its carrying amount a significant amount of goodwill or intangible
assets with indefinite useful lives. That information is concerned primarily with
the key assumptions used to measure the recoverable amounts of the units.
The non-amortisation of goodwill and intangible assets with indefinite useful
lives increases the reliance that must be placed on their impairment tests.
However, the nature of impairment tests means that the carrying amount of a
non-amortised asset, and the related assertion that the asset is not impaired,
would often be supported only by managements’ projections. The IASB has
therefore included these disclosure requirements to improve the transparency
and reliability of impairment tests for goodwill and intangible assets with
indefinite useful lives.