2008 behavioral risk - som - state of michigan€¦ · · 2016-02-26this project was financed in...
TRANSCRIPT


2008 Behavioral Risk Factor Survey
Health Risk Behaviors in the State of Michigan
www.michigan.gov/brfs

Permission is granted for the reproduction of this publication provided that the reproductions contain appropriate reference to the source. Suggested citation: C Fussman and AP Rafferty. 2010. Health Risk Behaviors in the State of Michigan: 2008 Behavioral Risk Factor Survey. Lansing, MI: Michigan Department of Community Health, Bureau of Epidemiology, Chronic Disease Epidemiology Section. This project was financed in part through cooperative agreements (U58/CCU522826 and U58/DPO01973) from the U.S. Department of Health and Human Services, Public Health Service, Centers for Disease Control and Prevention. The opinions, findings, and conclusions expressed in this publication do not necessarily reflect the opinions or policies of the federal Centers for Disease Control and Prevention.
Printed January 2010
C
M
Y
CM
MY
CY
CMY
K
85093 BRD BRFS Annual Report 12.18.09.pdf 1 01/08/2010 12:42:11 PM

JENNIFER M. GRANHOLM Governor, State of Michigan
JANET D. OLSZEWSKI
Director, Michigan Department of Community Health
JEAN C. CHABUT Deputy Director
Public Health Administration Michigan Department of Community Health
CORINNE E. MILLER, PHD Director, Bureau of Epidemiology
Michigan Department of Community Health
VIOLANDA GRIGORESCU, MD, MSPH Director, Division of Genomics, Perinatal Health, and Chronic Disease Epidemiology
Michigan Department of Community Health
CHRIS FUSSMAN, MS ANN P. RAFFERTY, PHD
Authors, Chronic Disease Epidemiology Section Michigan Department of Community Health
Jennifer M. Granholm, Governor Janet Olszewski, Director

2008 MiBRFS
Acknowledgements
Data were collected for the 2008 Michigan Behavioral Risk Factor Survey (MiBRFS) by the Institute for Public Policy and Social Research, Office of Survey Research, at Michigan State University. The authors are grateful to Larry Hembroff, Ph.D., and his staff for conducting the survey. We also appreciate the assistance provided by the Behavioral Surveillance Branch at the Centers for Disease Control and Prevention in Atlanta, Georgia. We are especially grateful to the residents of Michigan who agreed to participate in this survey.
iv

2008 MiBRFS
Table of Contents
Acknowledgements ................................................................................................. iv Summary ................................................................................................................. vi Health Status Indicators General Health Status........................................................................................ 1 Quality of Life ..................................................................................................... 2 Disability............................................................................................................. 3 Weight Status..................................................................................................... 4 No Health Care Coverage.................................................................................. 5 Limited Health Care Coverage........................................................................... 6
Risk Behavior Indicators No Leisure-Time Physical Activity...................................................................... 7 Inadequate Fruit and Vegetable Consumption .................................................. 8 Cigarette Smoking.............................................................................................. 9 Alcohol Consumption.......................................................................................... 10 Motor Vehicle Safety .......................................................................................... 11
Clinical Preventive Practices Routine Checkup in Past Year .......................................................................... 12 Breast Cancer Screening .................................................................................. 13 Cervical Cancer Screening ............................................................................... 14 Prostate Cancer Screening ............................................................................... 15 Colorectal Cancer Screening ............................................................................. 16 Oral Health ......................................................................................................... 17 Adult Immunizations........................................................................................... 18 HIV Testing ........................................................................................................ 19
Chronic Conditions Asthma in Adults ................................................................................................ 20 Asthma in Children............................................................................................. 21 Cardiovascular Disease ..................................................................................... 22 Diabetes ............................................................................................................. 23 BRFSS Methods ..................................................................................................... 24 Bibliography ............................................................................................................ 26
v

2008 MiBRFS
Summary
This report presents estimates from the 2008 MiBRFS, a statewide telephone survey of Michigan residents aged 18 years and older. It is the only source of state-specific, population-based estimates of the prevalence of various behav-iors, medical conditions, and preventive health care practices among Michigan adults. The survey findings are used by public health agencies, academic institutions, non-profit organizations, and others to develop programs to promote the health of Michigan citizens. All the results from the 2008 MiBRFS presented in this report have been weighted as described in the methods section and can be interpreted as estimates of prevalence rates among the general adult population of Michigan.
vi
* The median value of the prevalence estimates compiled from 50 U.S. states, three territories, and Washington, D.C. that participated in the 2008 CDC BRFSS.
Selected Risk Factors - 2008 CDC BRFSS U.S.* vs. Michigan
0 10 20 30 40 50 60 70 80
Ever Told Diabetes
No Dental Visit in Past Year
Current Asthma
Flu Shot in Past Year (65+Years Old)
Binge Drinking
Current Smoking
No Leisure-Time PhysicalActivity
No Health Care Coverage(18-64 Years Old)
Overw eight (BMI 25.0-29.9)
Obese (BMI ≥ 30)
Any Activity Limitation
U.S. median Michigan
C
M
Y
CM
MY
CY
CMY
K
85093 BRD BRFS Annual Report 12.18.09.pdf 1 01/08/2010 12:45:48 PM
C
M
Y
CM
MY
CY
CMY
K
85093 BRD BRFS Annual Report 12.18.09.pdf 1 01/08/2010 12:56:59 PM
C
M
Y
CM
MY
CY
CMY
K
85093 BRD BRFS Annual Report 12.18.09.pdf 1 01/08/2010 1:10:07 PM
2008 MiBRFS
Acknowledgements
Data were collected for the 2008 Michigan Behavioral Risk Factor Survey (MiBRFS) by the Institute for Public Policy and Social Research, Office of Survey Research, at Michigan State University. The authors are grateful to Larry Hembroff, Ph.D., and his staff for conducting the survey. We also appreciate the assistance provided by the Behavioral Surveillance Branch at the Centers for Disease Control and Prevention in Atlanta, Georgia. We are especially grateful to the residents of Michigan who agreed to participate in this survey.
iv

2008 MiBRFS
Summary, continued
Public Health Implications of Findings A number of themes emerge from the findings of the 2008 MiBRFS that have implications for public health.
Increase in the prevalence of adverse health behaviors related to diabetes. The results of the 2008 MiBRFS indicate that the prevalence of diabetes among Michigan adults has increased signifi-cantly since 2001 (7.2% [6.3-8.1] vs. 9.1% [8.5-9.8]). This increase in prevalence may be associated with increases in several of the known diabetes risk factors over this same interval. For example, the prevalence of obesity in Michigan has increased significantly since 2001 (24.7% [23.2-26.2] vs. 30.1% [28.8-31.4]). In addition, both the percentage of Michigan adults who consume fruits and vegetables five or more times per day (2002: 22.6% vs. 2008: 21.7%) and the percentage of adults who normally participated in some form leisure-time physical activity (2001: 76.5% vs. 2008: 74.9%) have not improved. MDCH has a number of programs designed to decrease obesity, increase physical activity and pro-mote healthy eating. Sustaining these programs is key to decreasing the prevalence of diabetes among Michigan adults and children.
Access to health care continues to be an increasing problem. In 2008, an estimated 13.7% of Michigan adults aged 18-64 had no health care coverage, which represents an increase from 9.5% in 1999 and is an indicator of the continuing economic hardship in Michigan. Furthermore, the percentage of adults who have not had a routine checkup in the past year (1999: 27.9% vs. 2008: 32.2%) and the percentage of adults who have not been able to receive proper health care due to cost (1999: 7.8% vs. 2008: 12.3%) have also increased between 1999 and 2008. Given that adults without coverage are less likely to access health care services and more likely to delay getting needed attention, this increasing lack of coverage heightens the need for public health services for primary and secondary prevention. Public health programs that provide services to the uninsured, such as the Smokers Quit Kit and Quit Line, Breast and Cervical Cancer Programs, and the Obesity Prevention Program, are crucial to par-tially fill this gap.
Lifetime asthma increasing while smoking among adults with asthma remains a problem. Between 2001 and 2008, the prevalence of lifetime asthma among Michigan adults increased significantly over time (p<0.001). Comparing the 2001 and 2008 prevalence estimates for lifetime adult asthma, the percent increase was 24.2% (2001: 12.4% vs. 2008: 15.4%). Tobacco smoke is especially harmful for people with asthma, causing asthma symptoms and triggering asthma attacks. Smoking among adults with asthma continues to be a problem in Michigan; 22.6% of Michigan adults with asthma reported that they were current smokers in 2008. The Asthma Initiative of Michi-gan, a statewide collaborative committed to reducing the burden of asthma in Michigan, works with the MDCH Tobacco program to promote smoke free policies and the availability of smoking cessation resources. These activities are aimed at protecting people with asthma from secondhand smoke and encouraging people with asthma who smoke to quit.
vii
2008 MiBRFS
Summary, continued
Use of the Michigan Behavioral Risk Factor Survey MiBRFS data continue to be used in planning and evaluating programs, establishing program priorities, developing spe-cific interventions and policies, assessing trends, shaping legislation, addressing emerging public health issues, and tar-geting relevant populations. Notable examples include: • MiBRFS estimates are used in 11 of 42 indicators for the Health Policy, Regulation and Professions Administration’s
Michigan Critical Health Indicators Report,1 which supports policy making and program planning by stressing the use of outcome indicators to measure improvement.
• A wide variety of MiBRFS data (screening rates for breast, cervical, colorectal, and prostate cancers, and adult smoking rates) are used to benchmark progress towards the 10 Michigan Cancer Consortium priority objectives.2 MiBRFS data are used by the Cancer program to assess time trends in cancer screening and adult smoking rates back to the 1990s in order to evaluate cancer programs.
• The MiBRFS provides opportunity to add questions on emerging issues. For example, aspects of early stage kidney disease were assessed for the first time in Michigan using MiBRFS data. In addition, MiBRFS questions on ovarian cancer risk assessment and hereditary pre-disposition to this cancer were included in 2008 in order to aid in further program planning.
• MiBRFS data were used extensively within the Cardiovascular Health program’s Impact of Heart Disease and Stroke in Michigan: 2008 Surveillance Report. This burden document is used when establishing program priorities.
• Child and adult asthma prevalence data by demographic, socioeconomic, and geographic strata were incorporated into a comprehensive surveillance report and used in prioritizing activities and targeting populations for the statewide asthma program.
• MiBRFS data documenting the disparities in health and health risk factors between people with and without disabili-ties were incorporated into the first strategic plan for the Health Promotion for People with Disabilities Program. These data were also used to highlight the high prevalence of chronic disease comorbidity among persons with dis-abilities and to encourage outreach by chronic disease self-management programs to persons with disabilities.
• MiBRFS data was used to measure public opinion on the use of newborn screening dried blood spots for different types of research, and will be used to shape community engagement activities as part of developing a statewide blood spot repository. This information will be shared with key state and federal policymakers, many of whom have expressed great interest in the results on this controversial topic. Michigan is the first state to include such questions as part of their BRFS questionnaire.
In addition, MiBRFS data are used extensively for external presentations and publications. For example, in the last few years numerous posters have been presented at state and national conferences on subjects such as Major Depression, Tobacco, Fast Food Consumption, Knowledge of Stroke and Heart Attack Risk Factors and Warning Signs, Sudden Car-diac Death, Disabilities, and the Michigan Asthma Call-Back Survey. In addition, MiBRFS data have been used in over 20 articles by Michigan staff and researchers, including publications on work-related asthma prevalence, chronic dis-ease-related behaviors and health among African Americans and Hispanics, the prevalence of hearing loss and work-related noise-induced hearing loss, revised physical activity recommendations, knowledge of stroke risk factors and warning signs by race, and public awareness and use of direct-to-consumer genetic tests. Future of the Michigan Behavioral Risk Factor Survey The 2009 MiBRFS is expected to maintain the number of completed interviews (9,000 total) from the 2008 survey, with an African-American over sample as well. The 2009 questionnaire will include over 120 state-added questions on 16 topics, such as binge drinking, caregiving, newborn screening, childhood asthma, and various tobacco-related issues. The BRFSS continues to adapt to challenges and expand its utility. For example, the random-digit dialing methodology of the MiBRFS is becoming increasingly problematic because of declining participation rates and the increased use of cell phones and other communication modalities, rather than a traditional land line telephone.3 The MiBRFS will need to adapt in order to continue providing representative estimates for adults. In 2008, Michigan participated in the BRFSS cell phone pilot project which was put in place to increase the capacity of the survey by including cell-phone-only households which in turn should reach more of the younger, urban respondents that tend to be underrepresented in the current land line survey. A cell phone stratum will become a permanent component of the BRFSS starting in 2009.
viii

Efforts have been made to expand the range of subpopulations covered by the MiBRFS data: • The 2008 survey methodology over samples geographic areas with a high density of African-American residents in
order to provide more precise estimates for this population. • The larger sample size in 2008 (N = 9,000) will allow for somewhat more precise estimates for Hispanics, especially
when multiple years of data are combined. • Since 2005, questions have been included that randomly select one child in each household and obtain demo-
graphic characteristics of that child. This information allows us to ask health-related questions about this child and then to calculate estimates for childhood conditions, such as asthma.
• An Asthma Call-Back survey that follows up on children and adults who were identified as having asthma during the BRFS interview has been conducted since 2005, allowing for collection of more detailed information on asthma man-agement, clinical care, and impact of the disease on people’s lives. It is anticipated that this methodology could be useful for other diseases and conditions in the future. The CDC has provided funding to some states to conduct in- person, follow-back surveys on specific diseases of interest.
In conclusion, the MiBRFS continues to serve the needs of public health officials, health care providers, researchers and local and state level policy makers, while presenting a number of opportunities for expanding our understanding of the risk factors and preventive behaviors for the major causes of disease and disability in Michigan.
2008 MiBRFS
Summary, continued
ix

1
General health status is a reliable self-rated assessment of one’s perceived health, which may be influenced by all aspects of life, including behaviors, environmental factors, and community.4 Self-rated general health status is useful in determining unmet health needs, identifying disparities among subpopulations, and characterizing the burden of chronic diseases within a popula-tion.5 The prevalence of self-rated fair or poor health status has been found to be statistically higher within older age groups, fe-males, and minorities, and has also been associated with lower socioeconomic status in the presence or absence of disease.5 In 2008, an estimated 14.5% of Michigan adults perceived that their general health was either fair or poor. This proportion in-creased with age from 7.2% of those aged 18-24 years to 29.4% of those aged 75 years and older. The proportion who reported fair or poor health decreased with increasing education and in-come levels. Blacks in Michigan have consistently had a higher prevalence of fair or poor general health than Whites.
Over the past 10 years, the proportion of Michigan adults who reported fair or poor health has been relatively con-stant and similar to the U.S. median.
In addition, the prevalence of fair or poor health was higher among adults who were not currently married compared with those who were married (age-adjusted estimates: 19.2% [17.6-20.8] vs. 12.7% [10.9-14.8]).
Demographic Characteristics
General Health Fair or Poor a
% 95% Confidence Interval
Total 14.5 (13.6-15.4) Age
18 - 24 7.2 (4.7-10.9) 25 - 34 8.6 (6.5-11.3) 35 - 44 10.7 (8.9-12.8) 45 - 54 14.7 (13.0-16.6) 55 - 64 18.6 (16.8-20.6) 65 - 74 21.4 (19.2-23.8) 75 + 29.4 (26.7-32.3)
Gender Male 14.2 (12.9-15.7) Female 14.7 (13.7-15.8)
Race/Ethnicity White non-Hispanic 12.8 (11.9-13.7) Black non-Hispanic 20.2 (17.4-23.3) Other non-Hispanic 23.6 (18.3-29.9)
Education < High school 33.0 (28.5-37.9) High school grad 17.9 (16.3-19.7) Some college 14.4 (12.8-16.1) College grad 7.2 (6.2-8.3)
Household Income < $20,000 32.7 (29.2-36.5) $20,000 - $34,999 20.7 (18.5-23.1) $35,000 - $49,999 13.5 (11.4-15.9) $50,000 - $74,999 7.2 (5.8-8.8) ≥ $75,000 5.0 (4.0-6.2)
a The proportion who reported that their health, in general, was either fair or poor.
Hispanic 14.1 (8.9-21.6)
2008 MiBRFS
General Health Status
0
5
10
15
20
25
1999 2000 2001 2002 2003 2004 2005 2006 2007 2008
%
White Black
General Health, Fair or Poor by RaceMichigan 1999-2008
General Health, Fair or Poor U.S. vs. Michigan, 1999-2008
0
5
10
15
20
1999 2000 2001 2002 2003 2004 2005 2006 2007 2008
%
U.S. median Michigan
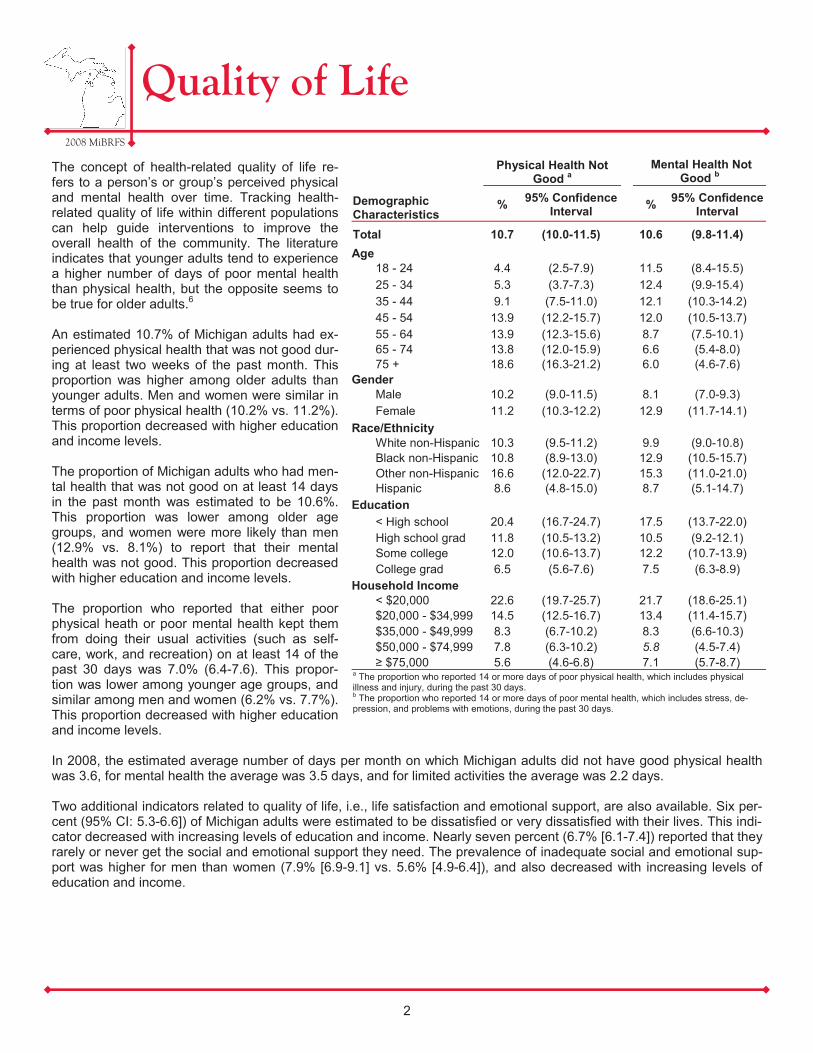
The concept of health-related quality of life re-fers to a person’s or group’s perceived physical and mental health over time. Tracking health-related quality of life within different populations can help guide interventions to improve the overall health of the community. The literature indicates that younger adults tend to experience a higher number of days of poor mental health than physical health, but the opposite seems to be true for older adults.6 An estimated 10.7% of Michigan adults had ex-perienced physical health that was not good dur-ing at least two weeks of the past month. This proportion was higher among older adults than younger adults. Men and women were similar in terms of poor physical health (10.2% vs. 11.2%). This proportion decreased with higher education and income levels. The proportion of Michigan adults who had men-tal health that was not good on at least 14 days in the past month was estimated to be 10.6%. This proportion was lower among older age groups, and women were more likely than men (12.9% vs. 8.1%) to report that their mental health was not good. This proportion decreased with higher education and income levels. The proportion who reported that either poor physical heath or poor mental health kept them from doing their usual activities (such as self-care, work, and recreation) on at least 14 of the past 30 days was 7.0% (6.4-7.6). This propor-tion was lower among younger age groups, and similar among men and women (6.2% vs. 7.7%). This proportion decreased with higher education and income levels. In 2008, the estimated average number of days per month on which Michigan adults did not have good physical health was 3.6, for mental health the average was 3.5 days, and for limited activities the average was 2.2 days. Two additional indicators related to quality of life, i.e., life satisfaction and emotional support, are also available. Six per-cent (95% CI: 5.3-6.6]) of Michigan adults were estimated to be dissatisfied or very dissatisfied with their lives. This indi-cator decreased with increasing levels of education and income. Nearly seven percent (6.7% [6.1-7.4]) reported that they rarely or never get the social and emotional support they need. The prevalence of inadequate social and emotional sup-port was higher for men than women (7.9% [6.9-9.1] vs. 5.6% [4.9-6.4]), and also decreased with increasing levels of education and income.
Demographic Characteristics
Physical Health Not Good a Mental Health Not
Good b
% 95% Confidence Interval % 95% Confidence
Interval
Total 10.7 (10.0-11.5) 10.6 (9.8-11.4) Age
18 - 24 4.4 (2.5-7.9) 11.5 (8.4-15.5) 25 - 34 5.3 (3.7-7.3) 12.4 (9.9-15.4) 35 - 44 9.1 (7.5-11.0) 12.1 (10.3-14.2) 45 - 54 13.9 (12.2-15.7) 12.0 (10.5-13.7) 55 - 64 13.9 (12.3-15.6) 8.7 (7.5-10.1) 65 - 74 13.8 (12.0-15.9) 6.6 (5.4-8.0) 75 + 18.6 (16.3-21.2) 6.0 (4.6-7.6)
Gender Male 10.2 (9.0-11.5) 8.1 (7.0-9.3) Female 11.2 (10.3-12.2) 12.9 (11.7-14.1)
Race/Ethnicity White non-Hispanic 10.3 (9.5-11.2) 9.9 (9.0-10.8) Black non-Hispanic 10.8 (8.9-13.0) 12.9 (10.5-15.7) Other non-Hispanic 16.6 (12.0-22.7) 15.3 (11.0-21.0)
Education < High school 20.4 (16.7-24.7) 17.5 (13.7-22.0) High school grad 11.8 (10.5-13.2) 10.5 (9.2-12.1) Some college 12.0 (10.6-13.7) 12.2 (10.7-13.9) College grad 6.5 (5.6-7.6) 7.5 (6.3-8.9)
Household Income < $20,000 22.6 (19.7-25.7) 21.7 (18.6-25.1) $20,000 - $34,999 14.5 (12.5-16.7) 13.4 (11.4-15.7) $35,000 - $49,999 8.3 (6.7-10.2) 8.3 (6.6-10.3) $50,000 - $74,999 7.8 (6.3-10.2) 5.8 (4.5-7.4) ≥ $75,000 5.6 (4.6-6.8) 7.1 (5.7-8.7)
a The proportion who reported 14 or more days of poor physical health, which includes physical illness and injury, during the past 30 days. b The proportion who reported 14 or more days of poor mental health, which includes stress, de-pression, and problems with emotions, during the past 30 days.
Hispanic 8.6 (4.8-15.0) 8.7 (5.1-14.7)
2008 MiBRFS
Quality of Life
2

One Healthy People 2010 goal is to “promote the health of people with disabilities, prevent secondary conditions, and eliminate disparities between people with and without disabili-ties in the U.S. population.”7 There are many ways in which disability can be defined, ranging from experiencing difficulty in participating in certain activities (such as lifting and carrying objects, seeing, hearing, talking, walking or climbing stairs) to having more severe disabilities that require assistance in per-sonal care needs (i.e., bathing) or routine care needs (i.e. housework).8 Disability in the MiBRFS is defined as either being limited in any activities because of physical, mental, or emotional prob-lems, or having any health problems that require the use of special equipment (such as a cane, a wheelchair, a special bed, or a special telephone). The estimated proportion of Michigan adults who were limited in any activities was 22.7% (21.6-23.8) and the proportion who used special equipment due to a health problem was 7.8% (7.2-8.4). Combining responses to the two questions, an estimated 24.5% of Michigan adults were living with a disability in 2008, compared with 19.5% (18.1-20.9) in 2001. In 2008, the propor-tion who had a disability increased with age from 12.8% of those aged 18-24 years to 45.2% of those aged 75 years or older. The proportion of adults who had a disability declined with higher education and income levels.
When investigating disability by age group and severity, individuals aged 75 years and older reported more se-vere disability (i.e. activities limited and use of special equipment) when compared to all other age groups. In 2008, Michigan adults with a disability were nearly 9 times as likely to have reported 14 or more days of physical health that was not good (32.5% [30.3-34.8] vs. 3.8% [3.3-4.4]), over 3 times as likely to have re-ported that their mental health was not good (22.7% [20.7-24.9] vs. 6.6% [5.8-7.4]), and over 12 times as likely to have reported activity limitations (23.2% [21.3-25.3] vs. 1.8% [1.4-2.3]) when compared to individuals without disabilities.
2008 MiBRFS
Disability
Demographic Characteristics
Total Disability a
% 95% Confidence Interval
Total 24.5 (23.4-25.6) Age
18 - 24 12.8 (9.3-17.4) 25 - 34 13.3 (10.8-16.2) 35 - 44 18.7 (16.3-21.3) 45 - 54 26.2 (24.1-28.5) 55 - 64 34.4 (32.1-36.8) 65 - 74 34.2 (31.5-36.9) 75 + 45.2 (42.2-48.2)
Gender Male 23.0 (21.4-24.7) Female 25.9 (24.6-27.3)
Race/Ethnicity White non-Hispanic 24.2 (23.1-25.4) Black non-Hispanic 25.3 (22.0-28.9) Other non-Hispanic 29.7 (24.0-36.2)
Education < High school 38.1 (33.0-43.5) High school grad 24.9 (23.1-26.8) Some college 25.9 (23.8-28.1) College grad 19.8 (18.2-21.6)
Household Income < $20,000 40.9 (37.1-44.8) $20,000 - $34,999 30.1 (27.4-33.0) $35,000 - $49,999 22.3 (19.8-25.0) $50,000 - $74,999 18.4 (16.1-20.9) ≥ $75,000 16.8 (15.0-18.8)
a The proportion who reported being limited in any activities because of physi-cal, mental, or emotional problems, or reported that they required use of spe-cial equipment (such as a cane, a wheelchair, a special bed, or a special tele-phone) due to a health problem.
Hispanic 17.3 (11.9-24.5)
3
Disability by Age Group and SeverityMichigan, 2008
0
25
50
75
100
18-44 yrs. 45-54 yrs. 55-64 yrs. 65-74 yrs. 75+ yrs.
%
Not disabledNot limited, use equip. Limited and use equip.
C
M
Y
CM
MY
CY
CMY
K
85093 BRD BRFS Annual Report 12.18.09.pdf 1 01/08/2010 1:06:27 PM
C
M
Y
CM
MY
CY
CMY
K
85093 BRD BRFS Annual Report 12.18.09.pdf 1 01/08/2010 1:08:12 PM
C
M
Y
CM
MY
CY
CMY
K
85093 BRD BRFS Annual Report 12.18.09.pdf 1 01/08/2010 1:12:32 PM
2008 MiBRFS
Acknowledgements
Data were collected for the 2008 Michigan Behavioral Risk Factor Survey (MiBRFS) by the Institute for Public Policy and Social Research, Office of Survey Research, at Michigan State University. The authors are grateful to Larry Hembroff, Ph.D., and his staff for conducting the survey. We also appreciate the assistance provided by the Behavioral Surveillance Branch at the Centers for Disease Control and Prevention in Atlanta, Georgia. We are especially grateful to the residents of Michigan who agreed to participate in this survey.
iv

2008 MiBRFS
Weight Status
Obesity increases the risk of many diseases and health condi-tions, such as high blood pressure, diabetes, coronary heart disease, stroke, gallbladder disease, high cholesterol, and some forms of cancer.9 Obesity-related medical expenditures in Michigan were estimated to be $2.9 billion based on 2003 dollars.10 Overweight is defined as having a body mass index (BMI) between 25.0 and 29.9, and obesity is a BMI greater than or equal to 30.0. BMI is defined as weight in kilograms divided by height in meters squared (w/h2) and was calculated from the self-reported height and weight measurements of Michigan residents participating in the 2008 BRFS. An estimated 30.1% of Michigan adults were obese in 2008, compared with 25.5% (24.0-26.9) in 2004. The proportion of adults who were obese in 2008 increased with age from 21.1% of those aged 18-24 years to 35.5% of those aged 55-64 years, and then decreased back to 21.1% of those aged 75 years and older. Blacks were more likely than Whites (39.8% vs. 28.8%) to be obese. In 2008, an estimated 35.2% (33.9-36.5) of Michigan adults were overweight, having a BMI between 25.0 and 29.9. This proportion increased with age from 22.0% (17.5-27.3) of those
aged 18-24 years to 37.8% (34.8-40.8) of those aged 75 years and older. Men were more likely than women (40.9% [38.8-43.0] vs. 29.5% [28.0-31.1]) to be over-weight. The cumulative proportion of obese and over-weight Michigan adults was 65.3% (63.9-66.7). Michigan has consistently had higher obesity preva-lence rates than the U.S. median. In 2008, the State of Michigan was tied for the eighth highest obesity level among all participating states and territories.
Demographic Characteristics
Obese a
% 95% Confidence Interval
Total 30.1 (28.8-31.4) Age
18 - 24 21.1 (16.6-26.3) 25 - 34 28.0 (24.1-32.1) 35 - 44 34.6 (31.5-37.8) 45 - 54 31.9 (29.5-34.4) 55 - 64 35.5 (33.1-38.0) 65 - 74 33.8 (31.0-36.6) 75 + 21.1 (18.6-23.8)
Gender Male 31.5 (29.5-33.5) Female 28.7 (27.2-30.4)
Race/Ethnicity White non-Hispanic 28.8 (27.5-30.2) Black non-Hispanic 39.8 (35.6-44.3) Other non-Hispanic 28.6 (22.6-35.4)
Education < High school 33.4 (28.4-38.8) High school grad 31.2 (28.9-33.5) Some college 33.4 (31.0-35.9) College grad 25.2 (23.2-27.4)
Household Income < $20,000 37.5 (33.6-41.5) $20,000 - $34,999 32.1 (29.1-35.3) $35,000 - $49,999 32.4 (29.1-36.0) $50,000 - $74,999 31.9 (28.8-35.1) ≥ $75,000 25.2 (22.9-27.6)
Note: BMI, body mass index, is defined as weight (in kilograms) divided by height (in meters) squared [weight in kg/(height in meters)2]. Weight and height were self-reported. Pregnant women were excluded. a The proportion of respondents whose BMI was greater than or equal to 30.0.
Hispanic 23.7 (16.5-32.9)
4
ObesityU.S. vs. Michigan, 1999-2008
0
10
20
30
40
50
1999 2000 2001 2002 2003 2004 2005 2006 2007 2008
%
U.S. median Michigan
Obesity by Race Michigan, 1999-2008
0
10
2030
40
50
1999 2000 2001 2002 2003 2004 2005 2006 2007 2008
%
White Black
C
M
Y
CM
MY
CY
CMY
K
85093 BRD BRFS Annual Report 12.18.09.pdf 1 01/08/2010 1:19:46 PM
2008 MiBRFS
Acknowledgements
Data were collected for the 2008 Michigan Behavioral Risk Factor Survey (MiBRFS) by the Institute for Public Policy and Social Research, Office of Survey Research, at Michigan State University. The authors are grateful to Larry Hembroff, Ph.D., and his staff for conducting the survey. We also appreciate the assistance provided by the Behavioral Surveillance Branch at the Centers for Disease Control and Prevention in Atlanta, Georgia. We are especially grateful to the residents of Michigan who agreed to participate in this survey.
iv
2008 MiBRFS
No Health Care Coverage
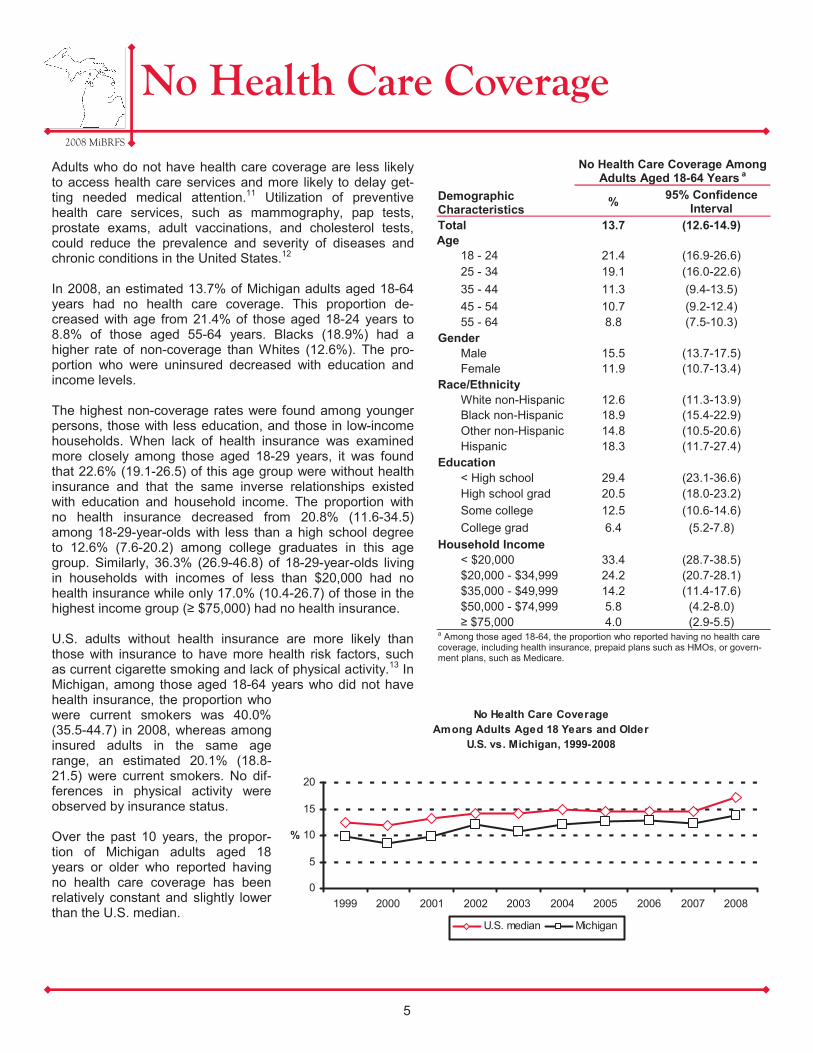
Adults who do not have health care coverage are less likely to access health care services and more likely to delay get-ting needed medical attention.11 Utilization of preventive health care services, such as mammography, pap tests, prostate exams, adult vaccinations, and cholesterol tests, could reduce the prevalence and severity of diseases and chronic conditions in the United States.12 In 2008, an estimated 13.7% of Michigan adults aged 18-64 years had no health care coverage. This proportion de-creased with age from 21.4% of those aged 18-24 years to 8.8% of those aged 55-64 years. Blacks (18.9%) had a higher rate of non-coverage than Whites (12.6%). The pro-portion who were uninsured decreased with education and income levels. The highest non-coverage rates were found among younger persons, those with less education, and those in low-income households. When lack of health insurance was examined more closely among those aged 18-29 years, it was found that 22.6% (19.1-26.5) of this age group were without health insurance and that the same inverse relationships existed with education and household income. The proportion with no health insurance decreased from 20.8% (11.6-34.5) among 18-29-year-olds with less than a high school degree to 12.6% (7.6-20.2) among college graduates in this age group. Similarly, 36.3% (26.9-46.8) of 18-29-year-olds living in households with incomes of less than $20,000 had no health insurance while only 17.0% (10.4-26.7) of those in the highest income group (≥ $75,000) had no health insurance. U.S. adults without health insurance are more likely than those with insurance to have more health risk factors, such as current cigarette smoking and lack of physical activity.13 In Michigan, among those aged 18-64 years who did not have health insurance, the proportion who were current smokers was 40.0% (35.5-44.7) in 2008, whereas among insured adults in the same age range, an estimated 20.1% (18.8-21.5) were current smokers. No dif-ferences in physical activity were observed by insurance status. Over the past 10 years, the propor-tion of Michigan adults aged 18 years or older who reported having no health care coverage has been relatively constant and slightly lower than the U.S. median.
Demographic Characteristics
No Health Care Coverage Among Adults Aged 18-64 Years a
% 95% Confidence Interval
Total 13.7 (12.6-14.9) Age
18 - 24 21.4 (16.9-26.6) 25 - 34 19.1 (16.0-22.6) 35 - 44 11.3 (9.4-13.5) 45 - 54 10.7 (9.2-12.4) 55 - 64 8.8 (7.5-10.3)
Gender Male 15.5 (13.7-17.5) Female 11.9 (10.7-13.4)
Race/Ethnicity White non-Hispanic 12.6 (11.3-13.9) Black non-Hispanic 18.9 (15.4-22.9) Other non-Hispanic 14.8 (10.5-20.6) Hispanic 18.3 (11.7-27.4)
Education < High school 29.4 (23.1-36.6) High school grad 20.5 (18.0-23.2) Some college 12.5 (10.6-14.6) College grad 6.4 (5.2-7.8)
Household Income < $20,000 33.4 (28.7-38.5) $20,000 - $34,999 24.2 (20.7-28.1) $35,000 - $49,999 14.2 (11.4-17.6) $50,000 - $74,999 5.8 (4.2-8.0) ≥ $75,000 4.0 (2.9-5.5)
a Among those aged 18-64, the proportion who reported having no health care coverage, including health insurance, prepaid plans such as HMOs, or govern-ment plans, such as Medicare.
5
No Health Care CoverageAmong Adults Aged 18 Years and Older
U.S. vs. Michigan, 1999-2008
0
5
10
15
20
1999 2000 2001 2002 2003 2004 2005 2006 2007 2008
%
U.S. median Michigan
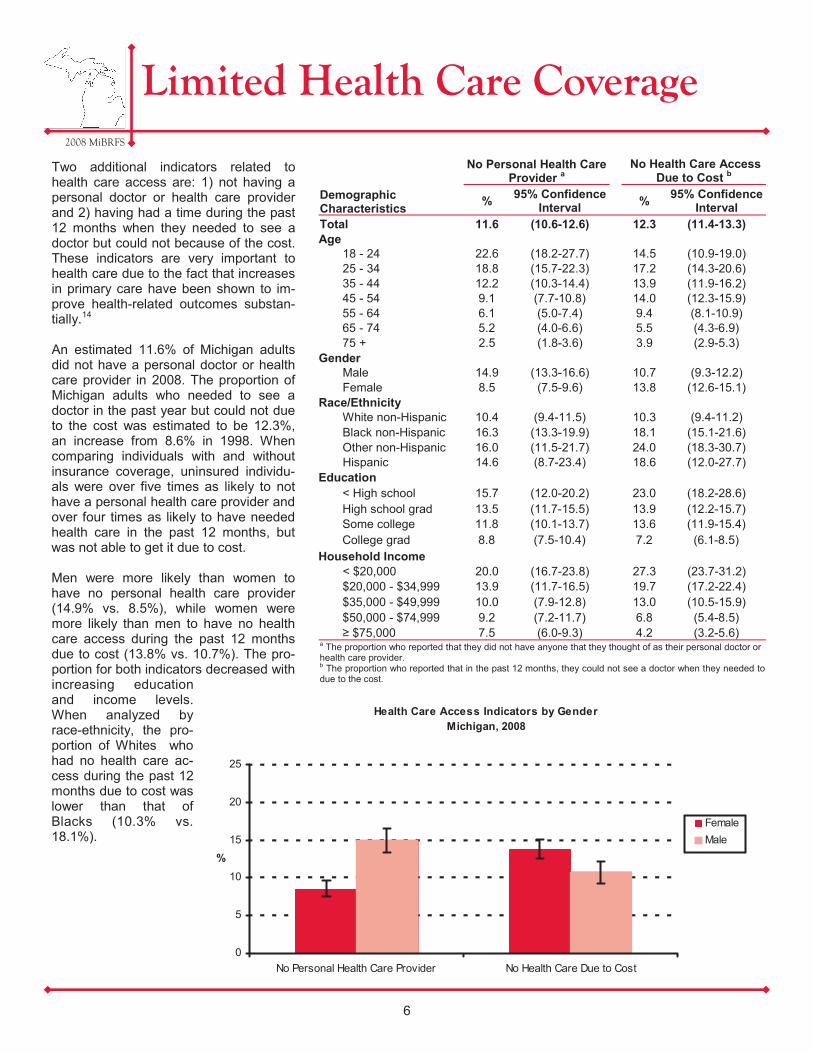
Two additional indicators related to health care access are: 1) not having a personal doctor or health care provider and 2) having had a time during the past 12 months when they needed to see a doctor but could not because of the cost. These indicators are very important to health care due to the fact that increases in primary care have been shown to im-prove health-related outcomes substan-tially.14 An estimated 11.6% of Michigan adults did not have a personal doctor or health care provider in 2008. The proportion of Michigan adults who needed to see a doctor in the past year but could not due to the cost was estimated to be 12.3%, an increase from 8.6% in 1998. When comparing individuals with and without insurance coverage, uninsured individu-als were over five times as likely to not have a personal health care provider and over four times as likely to have needed health care in the past 12 months, but was not able to get it due to cost. Men were more likely than women to have no personal health care provider (14.9% vs. 8.5%), while women were more likely than men to have no health care access during the past 12 months due to cost (13.8% vs. 10.7%). The pro-portion for both indicators decreased with increasing education and income levels. When analyzed by race-ethnicity, the pro-portion of Whites who had no health care ac-cess during the past 12 months due to cost was lower than that of Blacks (10.3% vs. 18.1%).
2008 MiBRFS
Limited Health Care Coverage
Demographic Characteristics
No Personal Health Care Provider a No Health Care Access
Due to Cost b
% 95% Confidence Interval % 95% Confidence
Interval Total 11.6 (10.6-12.6) 12.3 (11.4-13.3) Age
18 - 24 22.6 (18.2-27.7) 14.5 (10.9-19.0) 25 - 34 18.8 (15.7-22.3) 17.2 (14.3-20.6) 35 - 44 12.2 (10.3-14.4) 13.9 (11.9-16.2) 45 - 54 9.1 (7.7-10.8) 14.0 (12.3-15.9) 55 - 64 6.1 (5.0-7.4) 9.4 (8.1-10.9) 65 - 74 5.2 (4.0-6.6) 5.5 (4.3-6.9) 75 + 2.5 (1.8-3.6) 3.9 (2.9-5.3)
Gender Male 14.9 (13.3-16.6) 10.7 (9.3-12.2) Female 8.5 (7.5-9.6) 13.8 (12.6-15.1)
Race/Ethnicity White non-Hispanic 10.4 (9.4-11.5) 10.3 (9.4-11.2) Black non-Hispanic 16.3 (13.3-19.9) 18.1 (15.1-21.6) Other non-Hispanic 16.0 (11.5-21.7) 24.0 (18.3-30.7)
Education < High school 15.7 (12.0-20.2) 23.0 (18.2-28.6) High school grad 13.5 (11.7-15.5) 13.9 (12.2-15.7) Some college 11.8 (10.1-13.7) 13.6 (11.9-15.4) College grad 8.8 (7.5-10.4) 7.2 (6.1-8.5)
Household Income < $20,000 20.0 (16.7-23.8) 27.3 (23.7-31.2) $20,000 - $34,999 13.9 (11.7-16.5) 19.7 (17.2-22.4) $35,000 - $49,999 10.0 (7.9-12.8) 13.0 (10.5-15.9) $50,000 - $74,999 9.2 (7.2-11.7) 6.8 (5.4-8.5) ≥ $75,000 7.5 (6.0-9.3) 4.2 (3.2-5.6)
a The proportion who reported that they did not have anyone that they thought of as their personal doctor or health care provider. b The proportion who reported that in the past 12 months, they could not see a doctor when they needed to due to the cost.
Hispanic 14.6 (8.7-23.4) 18.6 (12.0-27.7)
6
Health Care Access Indicators by GenderMichigan, 2008
0
5
10
15
20
25
No Personal Health Care Provider No Health Care Due to Cost
%
FemaleMale
C
M
Y
CM
MY
CY
CMY
K
85093 BRD BRFS Annual Report 12.18.09.pdf 1 01/08/2010 1:23:24 PM
2008 MiBRFS
Acknowledgements
Data were collected for the 2008 Michigan Behavioral Risk Factor Survey (MiBRFS) by the Institute for Public Policy and Social Research, Office of Survey Research, at Michigan State University. The authors are grateful to Larry Hembroff, Ph.D., and his staff for conducting the survey. We also appreciate the assistance provided by the Behavioral Surveillance Branch at the Centers for Disease Control and Prevention in Atlanta, Georgia. We are especially grateful to the residents of Michigan who agreed to participate in this survey.
iv

Regular physical activity has been shown to reduce the risk of many diseases including cardiovascular disease, diabetes, colon and breast cancers, and osteoporosis. Keeping physically active also helps to control weight, maintain healthy bones, mus-cles, and joints, and can relieve symptoms of depression.15
In 2008, an estimated 25.1% of Michigan adults did not participate in any leisure-time physical activity (physical activities or exercises such as running, calisthenics, golf, gar-dening, or walking for exercise in the past month). This proportion was higher among older adults than younger adults. Women were more likely than men (27.5% vs. 22.5%), and Blacks were more likely than Whites to not participate in leisure-time physical activity. Inactivity dur-ing leisure time decreased with higher education and income levels. Nearly half (49.4%) of Michigan adults reported inadequate physical activity in 2008 (i.e. no moderate physical activities for a total of at least 30 minutes on 5 or more days per week and no vigorous physical activities for a total of at least 20 min-utes on 3 or more days per week while not at work). Inadequate physi-cal activity increased with age of the population, and decreased with in-creasing income levels. In addition, Blacks (53.7%) and Whites (48.1%) reported similar levels of inadequate physical activity. Since 2001, the median prevalence of inadequate physical activity for the United States has decreased from 54.0% to 50.8% in 2007. In addition, the prevalence of inadequate physi-cal activity within Michigan also de-creased significantly over the same time period (2001: 55.2% vs. 2007: 49.4%) and has leveled off at 49.4% in 2008.
2008 MiBRFS
No Leisure-Time Physical Activity
7
Demographic Characteristics
No Leisure-Time Physical Activitya
% 95% Confidence Interval % 95% Confidence
Interval Total 25.1 (24.0-26.3) 49.4 (47.5-51.2) Age
18 - 24 18.1 (14.0-23.1) 40.8 (33.6-48.3) 25 - 34 21.7 (18.3-25.6) 49.0 (43.8-54.3) 35 - 44 24.4 (21.8-27.3) 46.7 (42.7-50.7) 45 - 54 24.5 (22.4-26.7) 47.6 (44.3-50.9) 55 - 64 25.2 (23.2-27.4) 52.3 (49.1-55.5) 65 - 74 29.5 (27.0-32.2) 57.9 (54.2-61.5) 75 + 40.1 (37.1-43.1) 64.0 (60.1-67.7)
Gender Male 22.5 (20.8-24.3) 47.8 (45.1-50.6) Female 27.5 (26.1-29.0) 50.7 (48.2-53.1)
Race/Ethnicity White non-Hispanic 23.6 (22.4-24.9) 48.1 (46.1-50.1) Black non-Hispanic 30.3 (26.7-34.2) 53.7 (48.1-59.1) Other non-Hispanic 30.9 (24.5-38.1) 52.1 (43.1-61.0) Hispanic 29.2 (21.1-38.9) 63.0 (49.7-74.6)
Education < High school 39.8 (34.7-45.2) 52.4 (44.6-60.1) High school grad 31.9 (29.8-34.2) 50.3 (46.9-53.7) Some college 23.5 (21.5-25.7) 50.6 (47.2-54.0) College grad 16.7 (15.0-18.6) 46.6 (43.7-49.6)
Household Income < $20,000 37.3 (33.6-41.1) 56.9 (51.4-62.2) $20,000 - $34,999 35.0 (31.9-38.1) 53.4 (48.9-57.9) $35,000 - $49,999 24.4 (21.5-27.5) 49.6 (45.0-54.2) $50,000 - $74,999 20.2 (17.7-22.9) 43.6 (39.4-47.8) ≥ $75,000 14.7 (12.9-16.7) 44.2 (40.7-47.8)
a The proportion who reported not participating in any leisure-time physical activities or exercises, such as running, calisthenics, golf, gardening, or walking, during the past month. b The proportion who reported that they do not usually do moderate physical activities for a total of at least 30 minutes on five or more days per week or vigorous physical activities for a total of at least 20 minutes on three or more days per week while not at work.
Inadequate Physical Activityb
Inadequate Physical Activity U.S. vs. Michigan, 2001-2008
40.0
45.0
50.0
55.0
60.0
2001 2003 2005 2007 2008
%
U.S. median Michigan

Research shows that fruits and vegetables are important pro-moters of good health. When compared with people whose di-ets are low in fruits and vegetables, those who eat more gener-ous amounts of fruits and vegetables have a reduced risk of some chronic diseases, such as stroke and certain forms of cancer.16 An estimated 78.3% of Michigan adults in 2008 did not con-sume fruits (including juice) and vegetables five or more times per day. Men were more likely than women to not consume fruits and vegetables the recommended number of times per day (84.0% vs. 73.4%). This proportion was lower among col-lege graduates (73.5%) compared with other educational lev-els, and was lower among those aged 75 years and older (68.1%) compared with younger age groups. The median number of times per day Michigan adults con-sumed fruits and vegetables was 3.3 in 2008; the median num-ber for fruits and juice was 1.1 times per day and for vegetables was 2.0 times per day. The median prevalence of inadequate fruit and vegetable con-sumption among participating states and U.S. territories has remained relatively consistent over time, but the proportion of Michigan adults who consumed fruits and vegetables less than five times per day has increased significantly from 73.7% (71.7-75.5) in 1998 to 78.3% (76.9-79.7) in 2008.
2008 MiBRFS
Inadequate Fruit and Vegetable Consumption
8
Demographic Characteristics
Inadequate Fruit and Vegetable Consumptiona
% 95% Confidence Interval
Total 78.3 (76.9-79.7) Age
18 - 24 85.2 (79.3-89.7) 25 - 34 79.7 (75.4-83.4) 35 - 44 81.0 (77.8-83.8) 45 - 54 78.5 (75.8-81.0) 55 - 64 74.5 (71.7-77.1) 65 - 74 73.8 (70.5-76.8) 75 + 68.1 (64.5-71.4)
Gender Male 84.0 (82.1-85.8) Female 73.4 (71.3-75.3)
Race/Ethnicity White non-Hispanic 78.9 (77.3-80.3) Black non-Hispanic 76.9 (72.5-80.7)
Education < High school 80.5 (74.2-85.6) High school grad 83.8 (81.4-85.9) Some college 77.3 (74.5-79.8) College grad 73.5 (71.0-75.8)
Household Income < $20,000 75.2 (70.6-79.3) $20,000 - $34,999 79.2 (75.4-82.6) $35,000 - $49,999 78.3 (74.5-81.7) $50,000 - $74,999 77.8 (74.4-80.9) ≥ $75,000 77.3 (74.4-80.0)
a The proportion whose total reported frequency of consumption of fruits (including juice) and vegetables was less than five times per day.
Other non-Hispanic 74.2 (66.5-80.7) Hispanic 76.2 (63.6-85.5)
Inadequate Fruit and Vegetable Consumption U.S. vs. Michigan, 2000-2008
50
60
70
80
90
2000 2002 2003 2005 2007 2008
%
U.S. median Michigan

Smoking contributes to the development of many kinds of chronic conditions, including cancers, respiratory dis-eases, and cardiovascular diseases, and “remains the leading preventable cause of premature death in the United States.”17 It has been estimated that smoking costs the United States $193 billion in annual health-related eco-nomic losses and 5.1 million years of potential life lost each year.18 Current smoking status was defined as ever having smoked 100 cigarettes (five packs) in their life and smok-ing cigarettes now, either every day or on some days, whereas former smoking status was defined as having smoked at least 100 cigarettes but not currently smoking. In 2008, an estimated 20.2% of Michigan adults were cur-rent smokers, and 25.5% (24.5-26.6) were estimated to be former smokers. Men were more likely than women to be current smokers (22.3% vs. 18.2%), and former smokers (28.6% [26.8-30.4] vs. 22.7% [21.5-24.1]), while women were more likely to have never smoked (59.1% [57.4-60.7] vs. 49.1% [46.9-51.3]). Current smoking prevalence was similar in Blacks and Whites, and declined with increasing levels of education and income. The proportion of Michigan adults who were current smok-ers has remained above the U.S. median during the past ten years. To achieve the Healthy People goal of a ciga-rette smoking prevalence of 12% by 201019, the proportion of current smokers in Michigan will need to drop by over four percentage points each year. An estimated 58.0% (54.8-61.1) of current smokers in Michigan tried to quit smoking for one day or longer in the past year. Research has shown a potential relationship between self-rated health status and current smoking status.20 In Michigan, those who re-ported fair to poor general health were more likely to be current smokers than those who reported good to excellent general health (29.4% [26.4-32.6] vs. 18.6% [17.4-19.3]).
2008 MiBRFS
Cigarette Smoking
Demographic Characteristics
Current Smoking a
% 95% Confidence Interval
Total 20.2 (19.1-21.4) Age
18 - 24 23.2 (18.8-28.4) 25 - 34 28.0 (24.5-31.9) 35 - 44 23.0 (20.4-25.8) 45 - 54 22.9 (20.7-25.1) 55 - 64 16.3 (14.5-18.1) 65 - 74 9.4 (7.9-11.2) 75 + 5.4 (4.1-6.9)
Gender Male 22.3 (20.5-24.3) Female 18.2 (16.9-19.6)
Race/Ethnicity White non-Hispanic 19.0 (17.8-20.3) Black non-Hispanic 21.1 (18.0-24.6) Other non-Hispanic 30.0 (23.9-37.0)
Education < High school 41.1 (35.7-46.7) High school grad 26.5 (24.3-28.9) Some college 19.4 (17.5-21.6) College grad 10.3 (8.9-11.8)
Household Income < $20,000 31.1 (27.5-35.0) $20,000 - $34,999 25.0 (22.3-27.9) $35,000 - $49,999 21.4 (18.5-24.7) $50,000 - $74,999 17.3 (14.8-20.1) ≥ $75,000 13.8 (11.9-15.9)
a The proportion who reported that they had ever smoked at least 100 ciga-rettes (5 packs) in their life and that they smoke cigarettes now, either every day or on some days.
Hispanic 29.3 (21.2-38.9)
9
Current Cigarette SmokingU.S. vs. Michigan, 1999-2008
0
10
20
30
40
1999 2000 2001 2002 2003 2004 2005 2006 2007 2008
%
U.S. median Michigan
2008 MiBRFS
Alcohol Consumption
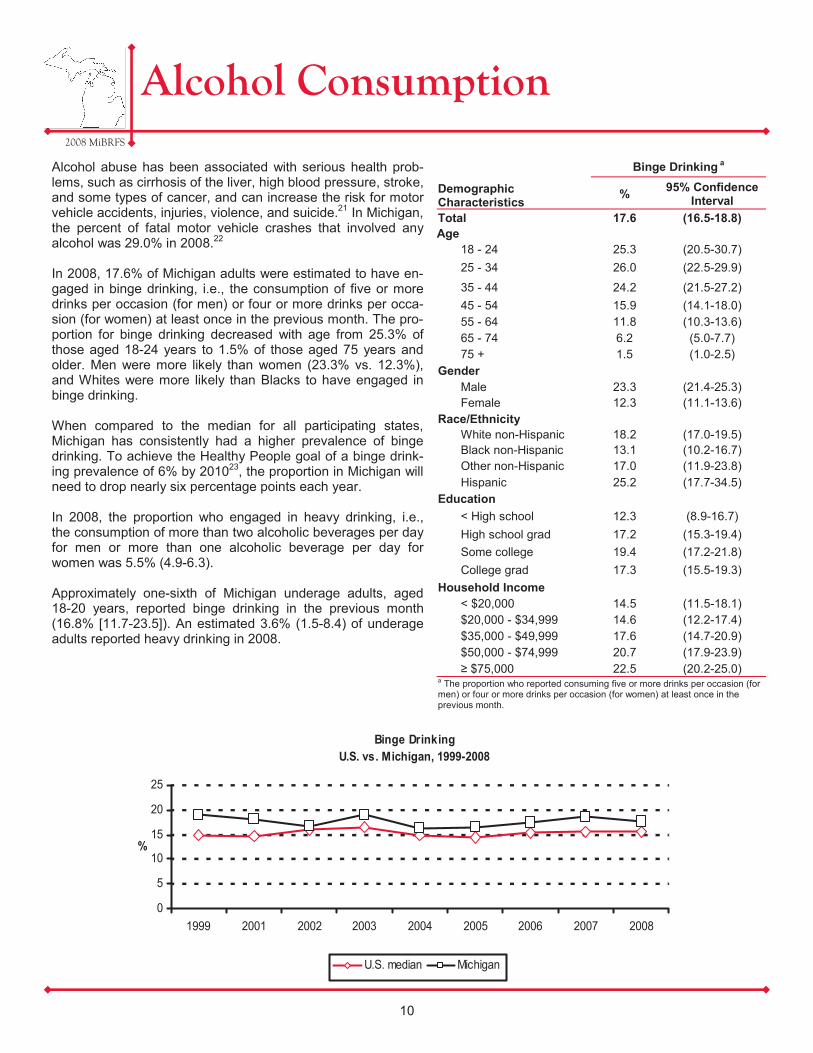
Alcohol abuse has been associated with serious health prob-lems, such as cirrhosis of the liver, high blood pressure, stroke, and some types of cancer, and can increase the risk for motor vehicle accidents, injuries, violence, and suicide.21 In Michigan, the percent of fatal motor vehicle crashes that involved any alcohol was 29.0% in 2008.22 In 2008, 17.6% of Michigan adults were estimated to have en-gaged in binge drinking, i.e., the consumption of five or more drinks per occasion (for men) or four or more drinks per occa-sion (for women) at least once in the previous month. The pro-portion for binge drinking decreased with age from 25.3% of those aged 18-24 years to 1.5% of those aged 75 years and older. Men were more likely than women (23.3% vs. 12.3%), and Whites were more likely than Blacks to have engaged in binge drinking. When compared to the median for all participating states, Michigan has consistently had a higher prevalence of binge drinking. To achieve the Healthy People goal of a binge drink-ing prevalence of 6% by 201023, the proportion in Michigan will need to drop nearly six percentage points each year. In 2008, the proportion who engaged in heavy drinking, i.e., the consumption of more than two alcoholic beverages per day for men or more than one alcoholic beverage per day for women was 5.5% (4.9-6.3). Approximately one-sixth of Michigan underage adults, aged 18-20 years, reported binge drinking in the previous month (16.8% [11.7-23.5]). An estimated 3.6% (1.5-8.4) of underage adults reported heavy drinking in 2008.
Demographic Characteristics
Binge Drinking a
% 95% Confidence Interval
Total 17.6 (16.5-18.8) Age
18 - 24 25.3 (20.5-30.7) 25 - 34 26.0 (22.5-29.9)
35 - 44 24.2 (21.5-27.2) 45 - 54 15.9 (14.1-18.0) 55 - 64 11.8 (10.3-13.6) 65 - 74 6.2 (5.0-7.7) 75 + 1.5 (1.0-2.5)
Gender Male 23.3 (21.4-25.3) Female 12.3 (11.1-13.6)
Race/Ethnicity White non-Hispanic 18.2 (17.0-19.5) Black non-Hispanic 13.1 (10.2-16.7) Other non-Hispanic 17.0 (11.9-23.8)
Education < High school 12.3 (8.9-16.7) High school grad 17.2 (15.3-19.4) Some college 19.4 (17.2-21.8) College grad 17.3 (15.5-19.3)
Household Income < $20,000 14.5 (11.5-18.1) $20,000 - $34,999 14.6 (12.2-17.4) $35,000 - $49,999 17.6 (14.7-20.9) $50,000 - $74,999 20.7 (17.9-23.9) ≥ $75,000 22.5 (20.2-25.0)
a The proportion who reported consuming five or more drinks per occasion (for men) or four or more drinks per occasion (for women) at least once in the previous month.
Hispanic 25.2 (17.7-34.5)
10
Binge Drinking U.S. vs. Michigan, 1999-2008
0
5
10
15
20
25
1999 2001 2002 2003 2004 2005 2006 2007 2008
%
U.S. median Michigan

2008 MiBRFS
Motor Vehicle Safety
11
An estimated 37,260 died on the nation’s high-ways in 2008 with an additional 2.35 million in-jured.24 Seatbelt use has been proven to save lives and prevent injuries. Fifty-five percent of these passenger vehicle occupants who died were unrestrained.24 It has been estimated that seatbelt use saves over $50 billion in medical care, productivity, and other injury-related costs.25 In addition to seatbelt use, driving after drinking is another risk indicator for motor vehicle safety. In Michigan, 3.5% of all crashes were reported to involve drinking in 2008. During this same time period, three out of every ten fatal motor vehicle crashes involved drinking. Consumption of alcohol is a major factor in the more serious types of motor vehicle crashes.26 In 2008, an estimated 88.6% of Michigan adults always used a seatbelt. This prevalence was higher for women than men (92.9% vs. 84.0%) and increased with increasing levels of educa-tion. The proportion of Michigan adults who reported that they had driven when they had had too much to drink at least once in the previous month was 2.4% in 2008. Men were over four times as likely to drive after drinking compared with women (4.1% vs. 0.9%) and Whites were more likely than Blacks to drive after drinking (2.6% vs. 1.8%).
Demographic Characteristics
Always Uses a Seatbelta Drove Motor Vehicle
After Drinkingb
% 95% Confidence Interval % 95% Confidence
Interval Total 88.6 (87.6-89.6) 2.4 (2.0-2.9) Age
18 - 24 81.5 (76.4-85.6) 2.3 (1.1-4.5) 25 - 34 86.6 (83.4-89.3) 3.9 (2.4-6.2) 35 - 44 88.1 (85.8-90.1) 3.0 (2.1-4.2) 45 - 54 90.3 (88.5-91.8) 2.9 (2.1-4.0) 55 - 64 92.2 (90.7-93.5) 1.4 (0.9-2.2) 65 - 74 91.7 (90.0-93.2) 1.2 (0.7-2.0) 75 + 90.9 (88.9-92.6) 0.3 (0.1-0.8)
Gender Male 84.0 (82.3-85.6) 4.1 (3.3-5.0) Female 92.9 (91.9-93.8) 0.9 (0.6-1.3)
Race/Ethnicity White non-Hispanic 89.2 (88.1-90.2) 2.6 (2.1-3.2) Black non-Hispanic 86.0 (82.5-88.9) 1.8 (1.0-3.2) Other non-Hispanic 89.1 (83.6-92.9) 1.6 (0.7-3.8)
Education < High school 83.8 (78.8-87.8) 0.6 (0.2-2.0) High school grad 88.6 (86.7-90.3) 2.2 (1.5-3.1) Some college 86.5 (84.5-88.4) 2.5 (1.8-3.5) College grad 91.7 (90.3-92.9) 2.9 (2.0-4.0)
Household Income < $20,000 85.4 (81.8-88.4) 0.5 (0.2-1.1) $20,000 - $34,999 88.8 (86.3-90.8) 1.8 (1.0-3.2) $35,000 - $49,999 91.0 (88.7-92.8) 2.3 (1.4-3.7) $50,000 - $74,999 88.7 (86.2-90.8) 3.1 (2.0-5.0) ≥ $75,000 88.6 (86.4-90.4) 4.0 (3.0-5.3)
a The proportion who reported always using a seatbelt when driving or riding in a car. b Proportion who reported that they had driven when they had too much to drink at least once in the previous month.
Hispanic 83.5 (73.9-90.1) 2.0 (0.8-5.4)
75
80
85
90
95
Female Male
%
Seatbelt Use By GenderMichigan, 2008
0
2
4
6
Female Male
%
Drove Motor Vehicle After Drinking By GenderMichigan, 2008
C
M
Y
CM
MY
CY
CMY
K
85093 BRD BRFS Annual Report 12.18.09.pdf 1 01/08/2010 1:29:05 PM
C
M
Y
CM
MY
CY
CMY
K
85093 BRD BRFS Annual Report 12.18.09.pdf 1 01/08/2010 2:30:51 PM
C
M
Y
CM
MY
CY
CMY
K
85093 BRD BRFS Annual Report 12.18.09.pdf 1 01/08/2010 2:43:08 PM
2008 MiBRFS
Acknowledgements
Data were collected for the 2008 Michigan Behavioral Risk Factor Survey (MiBRFS) by the Institute for Public Policy and Social Research, Office of Survey Research, at Michigan State University. The authors are grateful to Larry Hembroff, Ph.D., and his staff for conducting the survey. We also appreciate the assistance provided by the Behavioral Surveillance Branch at the Centers for Disease Control and Prevention in Atlanta, Georgia. We are especially grateful to the residents of Michigan who agreed to participate in this survey.
iv

2008 MiBRFS
Routine Checkup in Past Year
A yearly routine checkup with a health care professional provides an opportunity to raise awareness regarding adult preventive services, conduct individual risk assess-ments, promote informed decision-making, and poten-tially benefit from early detection of disease.27-28 In 2008, an estimated 67.8% of Michigan adults had a routine checkup in the past year, a decrease from 73.8% in 1998. This proportion was lowest among those less than 45 years old (54.0-61.8%), and then increased to 87.6% of those aged 75 and older. Women were more likely to have had routine checkup in past year com-pared with men (73.1% vs. 62.2%), as were Blacks com-pared with Whites (74.4% vs. 67.3%). During the routine checkup, the health care professional can suggest appropriate screenings and immunizations. The figure shows the proportion who received appropri-ate clinical preventive services by routine checkup status. Those who received a routine checkup in the past year were more likely to have been checked for diabetes in the past three years (59.4% vs. 36.0%), and among those aged 65 years and older to have had a flu vaccine in the past year (73.8% vs. 50.4%), and ever had a pneumonia vaccination (69.1% vs. 51.6%). In ad-dition, individuals who received a routine checkup in the past year were more likely to have a regular health care provider (95.4% vs. 73.6%). Among those who had a routine checkup in the past year, the majority (92.3%) did currently have health care coverage.
Demographic Characteristics
Had Routine Checkup in Past Yeara
% 95% Confidence Interval Total 67.8 (66.5-69.2) Age
18 - 24 60.6 (54.7-66.1) 25 - 34 54.0 (49.8-58.2) 35 - 44 61.8 (58.7-64.9) 45 - 54 65.4 (62.9-67.9) 55 - 64 79.0 (76.9-80.9) 65 - 74 83.7 (81.5-85.8) 75 + 87.6 (85.3-89.5)
Gender Male 62.2 (60.0-64.3) Female 73.1 (71.5-74.7)
Race/Ethnicity White non-Hispanic 67.3 (65.9-68.8) Black non-Hispanic 74.4 (70.2-78.2) Other non-Hispanic 59.9 (52.5-66.8)
Education < High school 73.7 (68.4-78.4) High school grad 65.9 (63.4-68.4) Some college 67.1 (64.5-69.5) College grad 69.3 (67.0-71.5)
Household Income < $20,000 65.0 (60.8-69.0) $20,000 - $34,999 64.9 (61.6-68.1) $35,000 - $49,999 67.0 (63.3-70.4) $50,000 - $74,999 68.3 (65.0-71.4) ≥ $75,000 68.8 (66.1-71.3)
a The proportion who reported that they had a routine checkup in the past year.
Hispanic 65.0 (55.0-73.8)
12
C
M
Y
CM
MY
CY
CMY
K
85093 BRD BRFS Annual Report 12.18.09.pdf 1 01/08/2010 2:27:54 PM
C
M
Y
CM
MY
CY
CMY
K
85093 BRD BRFS Annual Report 12.18.09.pdf 1 01/08/2010 2:31:47 PM
H lth S i d I i tiHealth Screenings and Immunizations by Routine Checkup Status
Health Screenings and Immunizations by Routine Checkup Status
Michigan, 2008100
Health Screenings and Immunizations by Routine Checkup Status
Michigan, 2008100
Health Screenings and Immunizations by Routine Checkup Status
Michigan, 2008100
Health Screenings and Immunizations by Routine Checkup Status
Michigan, 2008100
Health Screenings and Immunizations by Routine Checkup Status
Michigan, 2008
75
100
Health Screenings and Immunizations by Routine Checkup Status
Michigan, 2008
75
100
Health Screenings and Immunizations by Routine Checkup Status
Michigan, 2008
75
100
Health Screenings and Immunizations by Routine Checkup Status
Michigan, 2008
75
100
Health Screenings and Immunizations by Routine Checkup Status
Michigan, 2008
50
75
100
%
Health Screenings and Immunizations by Routine Checkup Status
Michigan, 2008
50
75
100
%
Health Screenings and Immunizations by Routine Checkup Status
Michigan, 2008
50
75
100
%
Health Screenings and Immunizations by Routine Checkup Status
Michigan, 2008
50
75
100
%
Health Screenings and Immunizations by Routine Checkup Status
Michigan, 2008
25
50
75
100
%
Health Screenings and Immunizations by Routine Checkup Status
Michigan, 2008
25
50
75
100
%
Health Screenings and Immunizations by Routine Checkup Status
Michigan, 2008
25
50
75
100
%
Health Screenings and Immunizations by Routine Checkup Status
Michigan, 2008
25
50
75
100
%
Health Screenings and Immunizations by Routine Checkup Status
Michigan, 2008
25
50
75
100
%
Health Screenings and Immunizations by Routine Checkup Status
Michigan, 2008
0
25
50
75
100
%
Health Screenings and Immunizations by Routine Checkup Status
Michigan, 2008
0
25
50
75
100
Checked for Diabetes in Past 3 Years Had Flu Vaccine in Past Year: 65+ Ever Had Pneumonia Shot: 65+
%
H d R ti Ch k i P t Y N R ti Ch k i P t Y
Health Screenings and Immunizations by Routine Checkup Status
Michigan, 2008
0
25
50
75
100
Checked for Diabetes in Past 3 Years Had Flu Vaccine in Past Year: 65+ Ever Had Pneumonia Shot: 65+
%
Had Routine Checkup in Past Year No Routine Checkup in Past Year
Health Screenings and Immunizations by Routine Checkup Status
Michigan, 2008
0
25
50
75
100
Checked for Diabetes in Past 3 Years Had Flu Vaccine in Past Year: 65+ Ever Had Pneumonia Shot: 65+
%
Had Routine Checkup in Past Year No Routine Checkup in Past Year
Health Screenings and Immunizations by Routine Checkup Status
Michigan, 2008
0
25
50
75
100
Checked for Diabetes in Past 3 Years Had Flu Vaccine in Past Year: 65+ Ever Had Pneumonia Shot: 65+
%
Had Routine Checkup in Past Year No Routine Checkup in Past Year
Health Screenings and Immunizations by Routine Checkup Status
Michigan, 2008
C
M
Y
CM
MY
CY
CMY
K
85093 BRD BRFS Annual Report 12.18.09.pdf 1 01/08/2010 2:40:09 PM
C
M
Y
CM
MY
CY
CMY
K
85093 BRD BRFS Annual Report 12.18.09.pdf 1 01/08/2010 2:43:57 PM
2008 MiBRFS
Acknowledgements
Data were collected for the 2008 Michigan Behavioral Risk Factor Survey (MiBRFS) by the Institute for Public Policy and Social Research, Office of Survey Research, at Michigan State University. The authors are grateful to Larry Hembroff, Ph.D., and his staff for conducting the survey. We also appreciate the assistance provided by the Behavioral Surveillance Branch at the Centers for Disease Control and Prevention in Atlanta, Georgia. We are especially grateful to the residents of Michigan who agreed to participate in this survey.
iv

2008 MiBRFS
Breast Cancer Screening
13
Breast cancer is the second leading cause of cancer deaths among United States women.29-30 In 2007, there were 1,456 deaths among Michigan women due to breast cancer, second only to that of lung cancer.31 Early detection of breast cancer can occur through the use of screening tools such as mam-mography and clinical breast exams. Current recommenda-tions from the American Cancer Society include that women aged 20-39 years should have a clinical or physical breast exam by a health professional every three years, and women aged 40 years and older should have both a clinical breast exam (CBE) and mammogram annually.29-30, 32 In 2008, an estimated 56.0% of Michigan women aged 40 years and older had both a clinical breast exam and mammo-gram in the past year. This proportion increased with age from 51.1% of those aged 40-49 years to 64.5% of those aged 60-69 years, then decreased to 50.2% for those aged 70 and older. This prevalence estimate increased with educa-tion and income levels. Three-quarters (73.2% [71.7-74.6]) of Michigan women had an appropriately timed CBE, i.e., within the past 3 years for women aged 18-39 years and within the past year for those 40 and older. This proportion increased with education level from 57.2% (49.9-64.3) of those who did not have a high school diploma to 80.1% (77.8-82.3) of college graduates. An estimated 63.5% (61.8-65.1) of women aged 40 years and older had a mammogram in the past year. This proportion increased with age from 55.3% (51.8-58.8) of those aged 40-49 years to 71.9% (68.9-74.8) of those aged 60-69 years and then declined to 63.8% (60.8-66.7) of those aged 70 years and older. This proportion also increased with education and income levels. The figure uses the Healthy People 2010 indicator concerning the proportion of women aged 40 years and older who have received a mammogram within the preceding two years.33 The proportion of Michi-gan women aged 40 years and older who have re-ceived a mammogram in the past two years has re-mained slightly above the U.S. median for the past ten years.
Demographic Characteristics
Had Clinical Breast Exam and Mammogram in Past Year Among
Women Aged 40 and Older a
% 95% Confidence Interval
Total 56.0 (54.3-57.7) Age
40 - 49 51.1 (47.5-54.6) 50 - 59 60.1 (57.0-63.2) 60 - 69 64.5 (61.4-67.5) 70 + 50.2 (47.1-53.2)
Race/Ethnicity
White non-Hispanic 57.3 (55.5-59.1) Black non-Hispanic 52.7 (47.5-57.8) Other non-Hispanic 45.7 (36.6-55.1) Hispanic 57.0 (42.4-70.4)
Education
< High school 37.6 (31.6-44.1) High school grad 52.8 (50.0-55.7) Some college 57.5 (54.4-60.6) College grad 61.8 (58.7-64.8)
Household Income
< $20,000 42.6 (38.5-46.8) $20,000 - $34,999 53.2 (49.4-56.9) $35,000 - $49,999 55.3 (50.6-59.9) $50,000 - $74,999 63.7 (59.2-68.0) ≥ $75,000 63.2 (59.4-66.9)
Note: Data included diagnostic tests. a Among women aged 40 years and older, the proportion who had both a clinical breast exam and mammogram in the previous year. b The denominator in this subgroup was less than 50.
Had a Mammogram in the Past Two Years Among Women Aged 40 Years and Older
U.S. vs. Michigan, 1998-2008
50
60
70
80
90
1998 1999 2000 2002 2004 2006 2008
%
U.S. median Michigan
2008 MiBRFS
Cervical Cancer Screening
14
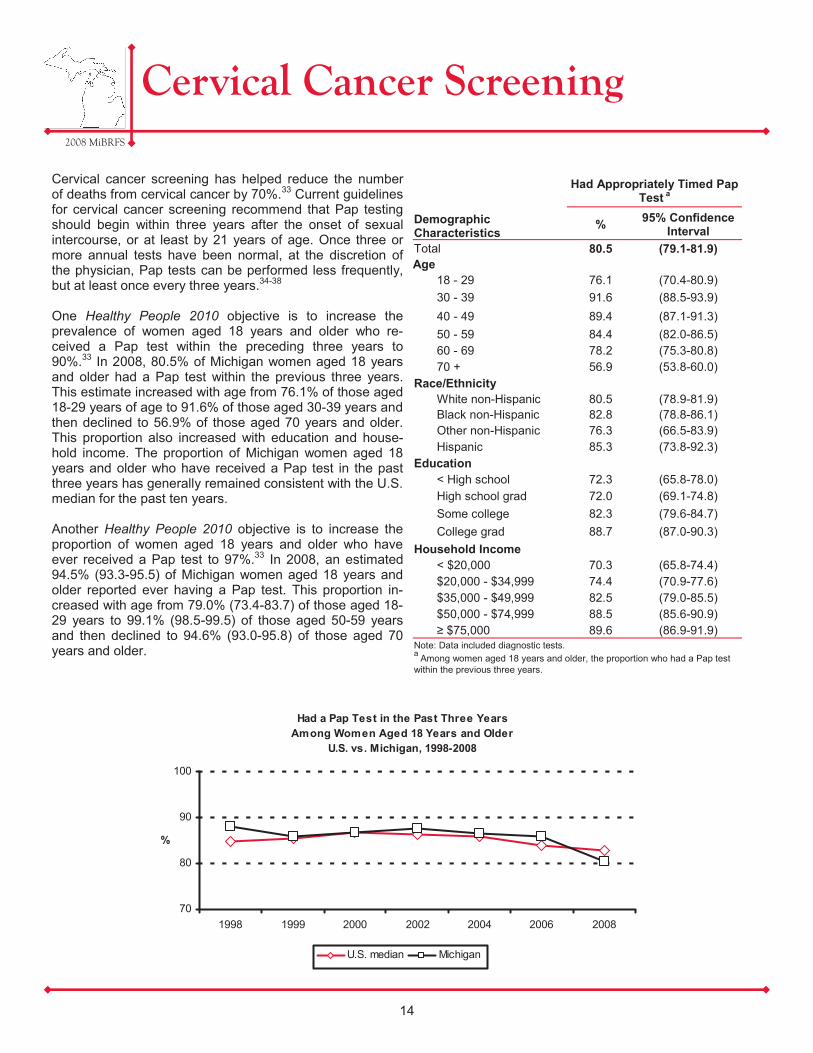
Cervical cancer screening has helped reduce the number of deaths from cervical cancer by 70%.33 Current guidelines for cervical cancer screening recommend that Pap testing should begin within three years after the onset of sexual intercourse, or at least by 21 years of age. Once three or more annual tests have been normal, at the discretion of the physician, Pap tests can be performed less frequently, but at least once every three years.34-38 One Healthy People 2010 objective is to increase the prevalence of women aged 18 years and older who re-ceived a Pap test within the preceding three years to 90%.33 In 2008, 80.5% of Michigan women aged 18 years and older had a Pap test within the previous three years. This estimate increased with age from 76.1% of those aged 18-29 years of age to 91.6% of those aged 30-39 years and then declined to 56.9% of those aged 70 years and older. This proportion also increased with education and house-hold income. The proportion of Michigan women aged 18 years and older who have received a Pap test in the past three years has generally remained consistent with the U.S. median for the past ten years. Another Healthy People 2010 objective is to increase the proportion of women aged 18 years and older who have ever received a Pap test to 97%.33 In 2008, an estimated 94.5% (93.3-95.5) of Michigan women aged 18 years and older reported ever having a Pap test. This proportion in-creased with age from 79.0% (73.4-83.7) of those aged 18-29 years to 99.1% (98.5-99.5) of those aged 50-59 years and then declined to 94.6% (93.0-95.8) of those aged 70 years and older.
Demographic Characteristics
Had Appropriately Timed Pap Test a
% 95% Confidence Interval
Total 80.5 (79.1-81.9) Age
18 - 29 76.1 (70.4-80.9) 30 - 39 91.6 (88.5-93.9) 40 - 49 89.4 (87.1-91.3) 50 - 59 84.4 (82.0-86.5) 60 - 69 78.2 (75.3-80.8) 70 + 56.9 (53.8-60.0)
Race/Ethnicity White non-Hispanic 80.5 (78.9-81.9) Black non-Hispanic 82.8 (78.8-86.1) Other non-Hispanic 76.3 (66.5-83.9) Hispanic 85.3 (73.8-92.3)
Education < High school 72.3 (65.8-78.0) High school grad 72.0 (69.1-74.8) Some college 82.3 (79.6-84.7) College grad 88.7 (87.0-90.3)
Household Income < $20,000 70.3 (65.8-74.4) $20,000 - $34,999 74.4 (70.9-77.6) $35,000 - $49,999 82.5 (79.0-85.5) $50,000 - $74,999 88.5 (85.6-90.9) ≥ $75,000 89.6 (86.9-91.9)
Note: Data included diagnostic tests. a Among women aged 18 years and older, the proportion who had a Pap test within the previous three years.
Had a Pap Test in the Past Three Years Among Women Aged 18 Years and Older
U.S. vs. Michigan, 1998-2008
70
80
90
100
1998 1999 2000 2002 2004 2006 2008
%
U.S. median Michigan
2008 MiBRFS
Prostate Cancer Screening
15
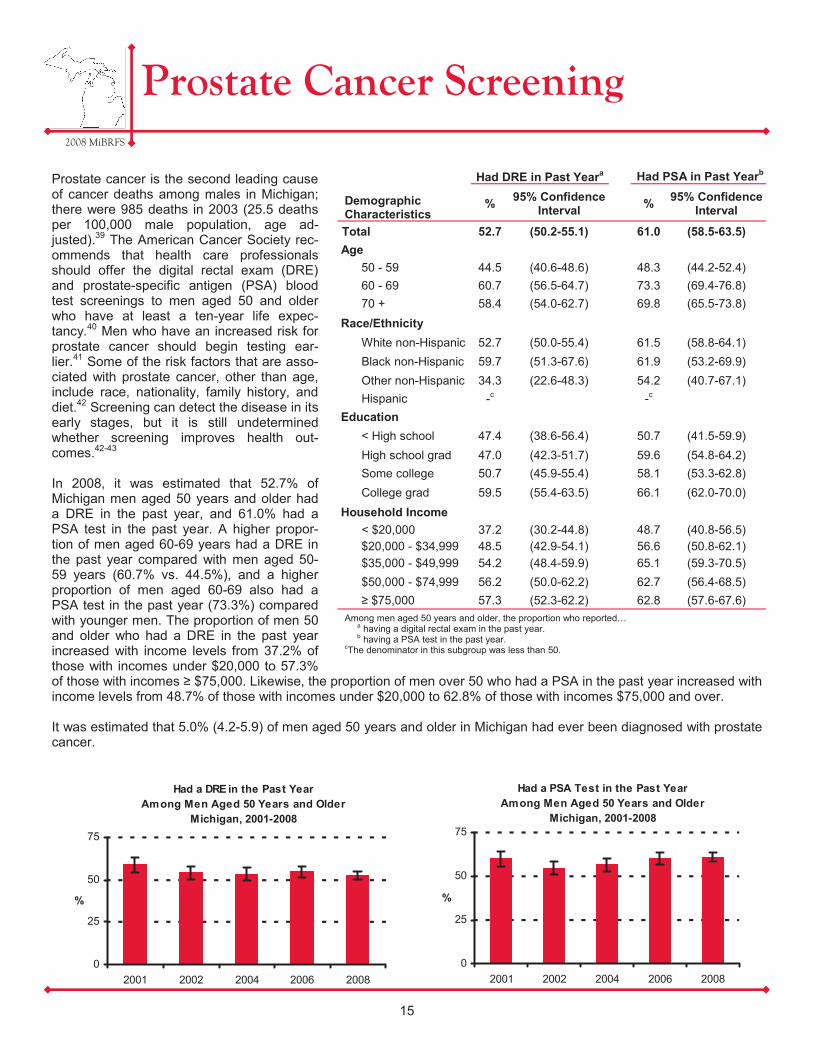
Prostate cancer is the second leading cause of cancer deaths among males in Michigan; there were 985 deaths in 2003 (25.5 deaths per 100,000 male population, age ad-justed).39 The American Cancer Society rec-ommends that health care professionals should offer the digital rectal exam (DRE) and prostate-specific antigen (PSA) blood test screenings to men aged 50 and older who have at least a ten-year life expec-tancy.40 Men who have an increased risk for prostate cancer should begin testing ear-lier.41 Some of the risk factors that are asso-ciated with prostate cancer, other than age, include race, nationality, family history, and diet.42 Screening can detect the disease in its early stages, but it is still undetermined whether screening improves health out-comes.42-43 In 2008, it was estimated that 52.7% of Michigan men aged 50 years and older had a DRE in the past year, and 61.0% had a PSA test in the past year. A higher propor-tion of men aged 60-69 years had a DRE in the past year compared with men aged 50-59 years (60.7% vs. 44.5%), and a higher proportion of men aged 60-69 also had a PSA test in the past year (73.3%) compared with younger men. The proportion of men 50 and older who had a DRE in the past year increased with income levels from 37.2% of those with incomes under $20,000 to 57.3% of those with incomes ≥ $75,000. Likewise, the proportion of men over 50 who had a PSA in the past year increased with income levels from 48.7% of those with incomes under $20,000 to 62.8% of those with incomes $75,000 and over. It was estimated that 5.0% (4.2-5.9) of men aged 50 years and older in Michigan had ever been diagnosed with prostate cancer.
Demographic Characteristics
Had DRE in Past Yeara Had PSA in Past Yearb
% 95% Confidence Interval % 95% Confidence
Interval
Total 52.7 (50.2-55.1) 61.0 (58.5-63.5) Age
50 - 59 44.5 (40.6-48.6) 48.3 (44.2-52.4) 60 - 69 60.7 (56.5-64.7) 73.3 (69.4-76.8) 70 + 58.4 (54.0-62.7) 69.8 (65.5-73.8)
Race/Ethnicity White non-Hispanic 52.7 (50.0-55.4) 61.5 (58.8-64.1) Black non-Hispanic 59.7 (51.3-67.6) 61.9 (53.2-69.9) Other non-Hispanic 34.3 (22.6-48.3) 54.2 (40.7-67.1) Hispanic -c -c
Education < High school 47.4 (38.6-56.4) 50.7 (41.5-59.9) High school grad 47.0 (42.3-51.7) 59.6 (54.8-64.2) Some college 50.7 (45.9-55.4) 58.1 (53.3-62.8) College grad 59.5 (55.4-63.5) 66.1 (62.0-70.0)
Household Income < $20,000 37.2 (30.2-44.8) 48.7 (40.8-56.5) $20,000 - $34,999 48.5 (42.9-54.1) 56.6 (50.8-62.1) $35,000 - $49,999 54.2 (48.4-59.9) 65.1 (59.3-70.5) $50,000 - $74,999 56.2 (50.0-62.2) 62.7 (56.4-68.5) ≥ $75,000 57.3 (52.3-62.2) 62.8 (57.6-67.6)
Among men aged 50 years and older, the proportion who reported… a having a digital rectal exam in the past year. b having a PSA test in the past year.
cThe denominator in this subgroup was less than 50.
0
25
50
75
2001 2002 2004 2006 2008
%
Had a DRE in the Past Year Among Men Aged 50 Years and Older
Michigan, 2001-2008
0
25
50
75
2001 2002 2004 2006 2008
%
Had a PSA Test in the Past Year Among Men Aged 50 Years and Older
Michigan, 2001-2008

2008 MiBRFS
Colorectal Cancer Screening
16
In 2005, colorectal cancer was the third leading cause of cancer-related deaths in Michigan and the second leading cause in the United States with 1,92944 and 53,00545 deaths, respectively. Fecal occult blood tests, sigmoidoscopy, and colonoscopy are screening procedures that are performed to detect colorectal cancer in the early stages. In the United States Preventive Services Task Force review of research litera-ture, they have found evidence that periodic fecal occult blood testing and sigmoidoscopy reduces mortality from colorectal cancer; colonoscopy has not been studied adequately yet.46-47 One Healthy People 2010 objective is to in-crease the proportion of adults aged 50 years and older who have received a fecal occult blood test within the preceding two years to 33%.4 An estimated 22.4% of Michigan adults aged 50 years and older had a blood stool test in the past two years. Over half (57.4%) of all Michigan adults aged 50 years and older had a sigmoidoscopy or colonoscopy in the past five years. The figure shows the current trends in the use of colorectal cancer screening. The percentage of those having a blood stool test in the past two years has steadily decreased since 2001, while the percentage of those having a sigmoi-doscopy or colonoscopy in the past five years has increased since 2001.
Risk factors associated with colorectal cancer in-clude having a family history, ethnic background, age, diet from animal sources, physical inactivity, diabetes, smoking, and alcohol intake.48 Those who were active in their leisure time in 2008 were more likely to have had a sigmoidoscopy or colonoscopy in the previous five years than those who were inactive in their leisure time (58.9% [57.1-60.7] vs. 53.2% [50.5-56.0]). Current smokers (43.3% [39.3-47.5]) were less likely than those who were former smokers (63.4% [61.0-65.8]) or never smokers (56.7% [54.5-58.8]) to have had a sigmoidoscopy or colonoscopy in the past five years.
Demographic Characteristics
Had Blood Stool Test in Past Two Yearsa
Had Sigmoidoscopy or Colonoscopy in Past 5
Yearsb
% 95% Confidence Interval % 95% Confidence
Interval Total 22.4 (21.2-23.7) 57.4 (55.9-58.9) Age
50 - 59 15.9 (14.1-17.9) 49.3 (46.7-51.9) 60 - 69 28.0 (25.7-30.4) 64.1 (61.5-66.6) 70 + 26.7 (24.5-29.0) 63.2 (60.6-65.6)
Gender Male 21.8 (19.9-23.9) 57.4 (54.9-59.8) Female 22.9 (21.4-24.5) 57.5 (55.6-59.3)
Race/Ethnicity White non-Hispanic 22.1 (20.8-23.4) 58.3 (56.6-60.0) Black non-Hispanic 26.4 (22.3-31.1) 56.5 (51.7-61.2) Other non-Hispanic 20.1 (14.6-27.1) 43.1 (34.8-51.9)
Education < High school 19.6 (15.8-24.0) 49.3 (43.7-55.0) High school grad 22.9 (20.8-25.2) 54.6 (52.0-57.2) Some college 21.6 (19.4-24.1) 57.8 (54.9-60.6) College grad 23.3 (21.1-25.7) 61.7 (59.0-64.4)
Household Income < $20,000 22.2 (19.2-25.5) 46.8 (42.8-50.8) $20,000 - $34,999 21.4 (19.0-24.1) 53.4 (50.1-56.7) $35,000 - $49,999 23.0 (19.8-26.4) 59.0 (55.1-62.8) $50,000 - $74,999 24.8 (21.5-28.5) 57.8 (53.6-61.9) ≥ $75,000 22.0 (19.2-25.1) 63.6 (60.1-67.0)
a Among those aged 50 years and older, the proportion who had a blood stool test within the past two years using a home kit. b Among those aged 50 years and older, the proportion who had a sigmoidoscopy or colonoscopy within the past five years. c The denominator in this subgroup was less than 50.
Hispanic 21.0 (12.2-33.6) 53.6 (40.3-66.4)
0
25
50
75
2001 2002 2004 2006 2008
%
Had a Blood Stool Test in the Past 2 YearsHad a Sigmoidoscopy or Colonoscopy in the Past 5 Years
Colorectal Cancer Screening Among Adults Aged 50 Years and Older
Michigan, 2001-2008
C
M
Y
CM
MY
CY
CMY
K
85093 BRD BRFS Annual Report 12.18.09.pdf 1 01/08/2010 1:36:28 PM
2008 MiBRFS
Acknowledgements
Data were collected for the 2008 Michigan Behavioral Risk Factor Survey (MiBRFS) by the Institute for Public Policy and Social Research, Office of Survey Research, at Michigan State University. The authors are grateful to Larry Hembroff, Ph.D., and his staff for conducting the survey. We also appreciate the assistance provided by the Behavioral Surveillance Branch at the Centers for Disease Control and Prevention in Atlanta, Georgia. We are especially grateful to the residents of Michigan who agreed to participate in this survey.
iv

2008 MiBRFS
Oral Health
17
Oral health is an important part of one’s general health and quality of life. Regular dental care includes preventive dental services such as teeth cleaning, and permits early diagnosis and treatment of tooth decay and periodontal diseases.49 It has been estimated that low income adults aged 18 years and older are 2.5 times more likely to have at least one untreated decayed tooth compared with higher income adults (40% vs. 16%).50 An estimated 25.2% of Michigan adults did not visit the dentist in the past year. Men were more likely than women (27.4% vs. 23.2%) to have not seen the dentist in the past year. This pro-portion declined with education and income levels. Tooth loss is the result of disease or injury.49 In 2008, an esti-mated 13.8% (13.1-14.6) of Michigan adults had six or more teeth missing due to tooth decay or gum disease. The propor-tion with six or more missing teeth increased with age from 0.8% (0.3-2.1) of those 18-24 to 44.0% (41.0-47.2) of those 75 and older. Blacks had a higher proportion with six or more missing teeth than Whites (19.9% [17.5-22.5] vs. 12.6% [11.8-13.4]). This proportion decreased with education and income. Periodontal disease is associated with certain chronic condi-tions, such as diabetes, cardiovascular disease, and stroke.49 One Healthy People 2010 objective is to increase the propor-tion of persons with diabetes who have had at least one annual dentist examination.4 However, in 2008, those who had diabe-tes were more likely to have not visited the dentist in the past year compared with those without diabetes (33.2% [29.9-36.8] vs. 24.3% [23.1-25.6]). Tobacco use is one of the greatest preventable risk factors for oral cancer.49 Current smokers were more likely than former smokers and never smokers to have not seen the dentist in the past year (39.2% [36.1-42.4], 24.0% [21.9-26.1], 20.5% [19.0-22.1], respectively).
Demographic Characteristics
No Dental Visit in Past Yeara
% 95% Confidence Interval
Total 25.2 (24.0-26.4) Age
18 - 24 25.9 (21.2-31.3) 25 - 34 30.1 (26.5-34.1) 35 - 44 25.0 (22.3-27.9) 45 - 54 23.8 (21.6-26.1) 55 - 64 20.3 (18.4-22.4) 65 - 74 24.9 (22.5-27.5) 75 + 27.7 (25.1-30.6)
Gender Male 27.4 (25.5-29.4) Female 23.2 (21.7-24.6)
Race/Ethnicity White non-Hispanic 22.6 (21.4-23.9) Black non-Hispanic 36.7 (32.7-40.9) Other non-Hispanic 34.9 (28.7-41.6)
Education < High school 48.0 (42.4-53.7) High school grad 32.1 (29.8-34.5) Some college 24.7 (22.5-26.9) College grad 14.4 (12.8-16.1)
Household Income < $20,000 46.9 (42.8-51.0) $20,000 - $34,999 34.7 (31.6-37.9) $35,000 - $49,999 24.9 (21.8-28.4) $50,000 - $74,999 19.4 (16.8-22.3) ≥ $75,000 12.3 (10.5-14.3)
a The proportion who reported that they had not visited a dentist or dental clinic for any reason in the previous year.
Hispanic 26.0 (18.4-35.4)
Oral Health Risk Factors by Race-EthnicityMichigan, 2008
0
15
30
45
White non-Hispanic
Black non-Hispanic
Other non-Hispanic
Hispanic
%
No Dental Visit in Past Year 6+ Teeth Missing
C
M
Y
CM
MY
CY
CMY
K
85093 BRD BRFS Annual Report 12.18.09.pdf 1 01/08/2010 1:43:00 PM
C
M
Y
CM
MY
CY
CMY
K
85093 BRD BRFS Annual Report 12.18.09.pdf 1 01/08/2010 2:52:39 PM
C
M
Y
CM
MY
CY
CMY
K
85093 BRD BRFS Annual Report 12.18.09.pdf 1 01/08/2010 3:36:42 PM
2008 MiBRFS
Acknowledgements
Data were collected for the 2008 Michigan Behavioral Risk Factor Survey (MiBRFS) by the Institute for Public Policy and Social Research, Office of Survey Research, at Michigan State University. The authors are grateful to Larry Hembroff, Ph.D., and his staff for conducting the survey. We also appreciate the assistance provided by the Behavioral Surveillance Branch at the Centers for Disease Control and Prevention in Atlanta, Georgia. We are especially grateful to the residents of Michigan who agreed to participate in this survey.
iv

2008 MiBRFS
Adult Immunizations
Adult immunizations against influenza and pneumococcal disease are important health indicators that need to be routinely monitored since morbidity and mortality are associated with both of these dis-eases among different demographic groups.51-52 Influenza and pneumococcal infections cause an estimated 36,000 and 40,000 deaths each year, respectively. In addition, deaths from pneumococcal in-fection account for more deaths than any other vaccine-preventable bacterial dis-ease. Approximately half of these deaths could potentially be prevented through the use of the pneumococcal vaccine.51, 53 A Healthy People 2010 objective is to ensure that 90% of adults aged 65 years and older are vaccinated annually against influenza and ever vaccinated against pneumococcal disease.54 Results from the 2008 BRFS indicate that 70.1% of Michigan adults aged 65 years and older were immunized against influenza in the past year, 66.4% had ever received a pneumococcal vaccination, and 59.2% (57.1-61.2) had received both. Although the prevalence of current flu vaccination has not changed significantly since 1997, the prevalence of ever receiving the pneumonia vaccine has increased nearly 45% (from 45.8% to 66.4%). Another Healthy People 2010 objective is to increase the vaccination rate to 60% among those aged 18-64 years who have chronic health conditions such as diabe-tes and asthma.4 Among those aged 18-64 years in Michigan, an estimated 52.4% (47.3-57.4) of those who had dia-betes had an influenza vaccination in the past year compared with 27.3% (25.9-28.7) of those who did not have diabetes. An estimated 43.2% (38.2-48.3) of those who had diabetes had a pneumococcal shot compared to 12.4% (11.3-13.6) of those who did not have diabetes. Those who had current asthma in this age group were also more likely to have had an in-fluenza vaccination than those who did not have asthma (41.1% [36.3-46.2] vs. 27.7% [26.3-29.2]).
18
Demographic Characteristics
Had Flu Vaccine in Past Yeara Ever Had Pneumonia
Vaccineb
% 95% Confidence Interval % 95% Confidence
Interval Total 70.1 (68.1-72.0) 66.4 (64.4-68.4) Age
65 - 74 64.9 (62.1-67.6) 58.3 (55.3-61.2) 75 + 75.5 (72.8-78.1) 74.9 (72.2-77.5)
Gender Male 70.4 (67.0-73.5) 61.1 (57.6-64.6) Female 69.9 (67.4-72.2) 70.2 (67.8-72.5)
Race/Ethnicity White non-Hispanic 72.1 (70.0-74.1) 68.6 (66.4-70.7) Black non-Hispanic 54.8 (48.2-61.2) 47.9 (41.4-54.5) Other non-Hispanic 71.1 (57.4-81.7) 64.3 (50.1-76.3) Hispanic -c -c
Education < High school 70.1 (64.3-75.4) 61.7 (55.5-67.6) High school grad 68.6 (65.5-71.6) 69.0 (65.9-72.0) Some college 67.7 (63.5-71.6) 65.3 (61.0-69.4) College grad 74.9 (70.9-78.6) 65.7 (61.3-69.8)
Household Income < $20,000 60.9 (55.9-65.6) 64.2 (59.2-68.9) $20,000 - $34,999 70.6 (66.7-74.2) 68.9 (65.0-72.6) $35,000 - $49,999 75.5 (70.3-80.0) 71.9 (66.6-76.6) $50,000 - $74,999 66.4 (59.7-72.5) 60.4 (53.4-67.0) ≥ $75,000 75.5 (68.1-81.7) 60.0 (52.3-67.2)
a Among those aged 65 years and older, the proportion who reported that they had a flu vaccine, either by an injection in the arm or sprayed in the nose during the past 12 months. b Among those aged 65 years and older, the proportion who reported that they ever had a pneumo-coccal vaccine. c The denominator in this subgroup was less than 50.
Ever Had a Pneumococcal Vaccination Among Adults Aged 65 and Older
U.S. vs. Michigan, 1999-2008
30
40
50
60
70
1999 2001 2002 2003 2004 2005 2006 2007 2008
%
U.S. median Michigan

2008 MiBRFS
HIV Testing
It is estimated that 18,200 people are living with HIV/AIDS in Michigan, 4,550 of whom do not know that they are infected.55 Early awareness of an HIV infection through HIV testing can prevent further spread of the disease, and an early start on antiretroviral therapy can increase the quality of life among those who are living with HIV/AIDS.56
An estimated 37.3% of Michigan adults aged 18-64 years had ever been tested for HIV, apart from blood donations. The prevalence of HIV testing decreased with age from 51.6% among those aged 35-44 years to 22.5% among those aged 55-64 years. Women were more likely than men (41.1% vs. 33.5%) to have ever been tested and Blacks were more likely than Whites. Since 2000, the lifetime prevalence of HIV testing in Michigan among adults aged 18-64 years has decreased 23.6% (from 48.8% to 37.3%). The most frequently reported places where Michigan adults had their last HIV test were at a private doctor or HMO office (46.9% [44.2-49.6]), at a clinic (18.8% [16.7-21.0]), and at a hospital (18.5% [16.5-20.7]). Rapid HIV antibody tests provide results within a couple of hours. Of those tested for HIV in the past 12 months, 25.4% (20.4-31.1) reported that a rapid test was used, and 74.6% (68.9-79.6) reported that a conventional test was used.
Demographic Characteristics
Ever Had an HIV Testa
% 95% Confidence Interval
Total 37.3 (35.7-38.9) Age
18 - 24 24.0 (19.4-29.2) 25 - 34 51.4 (47.1-55.6) 35 - 44 51.6 (48.3-54.8) 45 - 54 32.0 (29.6-34.5) 55 - 64 22.5 (20.5-24.6)
Gender Male 33.5 (31.2-35.9) Female 41.1 (39.1-43.2)
Race/Ethnicity White non-Hispanic 32.1 (30.5-33.8) Black non-Hispanic 62.9 (57.9-67.6) Other non-Hispanic 43.6 (36.1-51.5) Hispanic 41.9 (31.8-52.8)
Education < High school 43.3 (35.7-51.1) High school grad 33.5 (30.6-36.6) Some college 38.2 (35.4-41.1) College grad 38.8 (36.2-41.4)
Household Income < $20,000 46.5 (41.3-51.7) $20,000 - $34,999 39.5 (35.5-43.8) $35,000 - $49,999 35.5 (31.5-39.7) $50,000 - $74,999 33.8 (30.5-37.4) ≥ $75,000 37.1 (34.3-40.0)
a Among those aged 18-64 years the proportion who reported that they ever had been tested for HIV, apart from tests that were part of a blood donation.
19
Ever Tested for HIV Among Adults Aged 18-64 Years
Michigan, 1999-2008
0
20
40
60
1999 2000 2001 2002 2003 2004 2005 2006 2007 2008
%

2008 MiBRFS
Asthma in Adults
Asthma is a chronic inflammatory disorder of the lungs, and is characterized by wheezing, coughing, difficulty breathing, and chest tight-ness. Asthma attacks can be triggered by a variety of factors, such as cold air, allergens, irritants, and respiratory viral infections. Aller-gies, a family history of asthma or allergy, low birth weight, and exposure to tobacco smoke are just a few potential risk factors that are associated with the development of asthma.57-58
In 2008, the estimated proportion of Michigan adults ever told by a health care professional that they had asthma was 15.4% and an esti-mated 9.9% of all Michigan adults currently had asthma. Women (12.7%) were more likely than men (6.9%) to have current asthma. In addition, individuals with house-hold incomes of less than $20,000 (13.5%) were more likely to have current asthma when compared to individuals with household incomes of greater than or equal to $75,000 (7.6%). Over the past seven years, the proportion of Michigan adults who ever reported having asthma has significantly increased from 12.4% (11.2-13.5) in 2001 to 15.4% (14.4-16.5) in 2008. In addition, the prevalence of lifetime asthma among Michigan adults has been consistently higher than that of the U.S. median.
Demographic Characteristics
Lifetime Asthmaa Current Asthmab
% 95% Confidence Interval % 95% Confidence
Interval Total 15.4 (14.4-16.5) 9.9 (9.1-10.8) Age
18 - 24 28.2 (23.3-33.8) 16.3 (12.4-21.0) 25 - 34 16.2 (13.4-19.5) 9.9 (7.6-12.9) 35 - 44 12.6 (10.7-14.7) 8.6 (7.1-10.4) 45 - 54 13.8 (12.2-15.7) 9.0 (7.7-10.5) 55 - 64 13.5 (12.0-15.2) 9.8 (8.5-11.3) 65 - 74 14.1 (12.2-16.2) 9.9 (8.3-11.8) 75 + 9.1 (7.5-11.0) 5.9 (4.6-7.5)
Gender Male 12.8 (11.3-14.4) 6.9 (5.9-8.2) Female 17.8 (16.5-19.3) 12.7 (11.6-14.0)
Race/Ethnicity White non-Hispanic 14.7 (13.6-15.8) 9.4 (8.6-10.4) Black non-Hispanic 16.7 (13.7-20.3) 11.3 (8.8-14.5) Other non-Hispanic 22.1 (16.5-28.9) 13.7 (9.7-19.1)
Education < High school 22.0 (17.5-27.2) 16.9 (13.1-21.6) High school grad 13.8 (12.1-15.7) 8.9 (7.6-10.5) Some college 18.2 (16.2-20.4) 11.2 (9.7-13.0) College grad 12.8 (11.2-14.5) 8.3 (7.0-9.8)
Household Income < $20,000 20.5 (17.3-24.0) 13.5 (11.1-16.4) $20,000 - $34,999 17.0 (14.2-24.0) 11.8 (9.3-14.8) $35,000 - $49,999 12.9 (10.7-15.4) 8.3 (6.7-10.4) $50,000 - $74,999 14.4 (12.1-17.0) 8.5 (6.8-10.7) ≥ $75,000 12.3 (10.6-14.2) 7.6 (6.4-9.1)
a The proportion who reported that they were ever told by a doctor, nurse, or other health care profes-sional that they had asthma. b Among all respondents, the proportion who reported that they still had asthma.
Hispanic 17.0 (10.8-25.6) 9.8 (5.4-16.9)
20
Lifetime Adult Asthma U.S. vs. Michigan, 2001 - 2008
0
5
10
15
20
2001 2002 2003 2004 2005 2006 2007 2008
%
U.S. median Michigan

2008 MiBRFS
Asthma in Children
Although asthma can affect people of all ages, in most cases it begins during child-hood. Children with a family history of asthma and allergy are at higher risk of de-veloping asthma during childhood. In chil-dren, more boys develop asthma than girls, which is the exact opposite of what is re-ported in adults (i.e., more adult females have asthma than adult males).59
Based on proxy information provided by the adult respondent, the estimated proportion of Michigan children aged 0-17 years who were ever told by a health care professional that they had asthma for 2008 was 15.4% and an estimated 10.4% of children currently had asthma. Boys were more likely than girls to have ever been told they had asthma (17.9% vs. 13.0%), but were similar in terms of cur-rent asthma status (11.5% vs. 9.3%). White boys were more likely than White girls to have ever been told they had asthma (16.3% vs. 11.1%), but there was no differ-ence between Black boys and girls.
Demographic Characteristics
Lifetime Asthmaa Current Asthmab
% 95% Confidence Interval % 95% Confidence
Interval Total 15.4 (13.9-17.2) 10.4 (9.0-11.9) Age
0 - 4 9.0 (6.2-12.9) 6.1 (3.8-9.7) 5 - 9 15.5 (12.4-19.3) 11.7 (9.0-15.1) 10 - 14 18.4 (15.4-21.9) 11.8 (9.2-14.9) 15 - 17 20.4 (16.9-24.5) 12.5 (9.7-15.9)
Gender Male 17.9 (15.5-20.5) 11.5 (9.5-13.8) Female 13.0 (11.0-15.3) 9.3 (7.6-11.4)
Race/Ethnicity White non-Hispanic 13.7 (12.1-15.6) 8.8 (7.5-10.3) Black non-Hispanic 21.2 (16.2-27.2) 15.6 (11.1-21.5) Other non-Hispanic 20.9 (14.1-30.0) 15.3 (9.5-23.8) Hispanic 18.6 (10.9-30.1) 13.8 (7.1-25.2)
Respondent Education < High school 15.7 (8.8-26.4) 10.2 (5.0-19.6) High school grad 13.6 (10.9-16.8) 9.0 (6.8-11.9) Some college 17.7 (14.6-21.2) 11.6 (9.0-14.8) College grad 14.8 (12.5-17.5) 10.3 (8.3-12.7)
Household Income < $20,000 19.1 (13.3-26.6) 14.5 (9.3-22.0) $20,000 - $34,999 16.7 (12.7-21.6) 11.3 (8.2-15.4) $35,000 - $49,999 15.6 (11.7-20.4) 10.6 (7.4-14.9) $50,000 - $74,999 15.1 (11.8-19.2) 10.4 (7.6-14.2) ≥ $75,000 13.6 (11.3-16.4) 8.7 (6.8-11.1)
a Estimated proportion of Michigan children aged 0-17 years ever diagnosed with asthma, using proxy information from adult respondent. b Estimated proportion of Michigan children aged 0-17 years with current asthma.
21
Lifetime Child Asthma by Race and GenderMichigan, 2008
0
5
10
15
20
25
30
35
kcalBetihW
%
Total
Male
Female
C
M
Y
CM
MY
CY
CMY
K
85093 BRD BRFS Annual Report 12.18.09.pdf 1 01/08/2010 1:50:16 PM
2008 MiBRFS
Acknowledgements
Data were collected for the 2008 Michigan Behavioral Risk Factor Survey (MiBRFS) by the Institute for Public Policy and Social Research, Office of Survey Research, at Michigan State University. The authors are grateful to Larry Hembroff, Ph.D., and his staff for conducting the survey. We also appreciate the assistance provided by the Behavioral Surveillance Branch at the Centers for Disease Control and Prevention in Atlanta, Georgia. We are especially grateful to the residents of Michigan who agreed to participate in this survey.
iv

2008 MiBRFS
Cardiovascular Disease
Demographic Characteristics
Ever Told Heart Attacka
Ever Told Angina or Coronary
Heart Diseaseb Ever
Told Strokec
% 95%
Confidence Interval
% 95%
Confidence Interval
% 95%
Confidence Interval
Total 4.5 (4.1-4.9) 4.7 (4.3-5.1) 3.0 (2.6-3.3) Age
18 - 34 0.4 (0.1-1.1) 0.2 (0.0-1.0) 0.8 (0.4-1.7) 35 - 44 0.9 (0.5-1.8) 1.1 (0.6-2.0) 0.7 (0.3-1.5) 45 - 54 2.8 (2.1-3.8) 3.3 (2.5-4.3) 2.2 (1.5-3.1) 55 - 64 8.2 (6.8-9.8) 8.5 (7.1-10.1) 4.4 (3.5-5.4) 65 - 74 11.8 (10.1-13.8) 13.2 (11.5-15.3) 5.1 (4.0-6.4) 75 + 16.9 (14.7-19.3) 17.1 (14.8-19.6) 12.5 (10.6-14.7)
Gender Male 5.6 (4.9-6.3) 5.3 (4.6-6.0) 2.6 (2.2-3.2) Female 3.5 (3.1-4.0) 4.2 (3.7-4.7) 3.3 (2.8-3.8)
Race/Ethnicity White non-Hispanic 4.5 (4.0-5.0) 5.0 (4.5-5.5) 2.7 (2.3-3.1) Black non-Hispanic 3.8 (2.9-5.0) 3.3 (2.5-4.4) 4.4 (3.3-5.8) Other non-Hispanic 5.4 (3.4-8.4) 5.2 (3.6-7.7) 4.4 (2.7-7.0) Hispanic 4.2 (1.9-9.1) 3.2 (1.4-7.2) 1.2 (0.3-4.5)
Education < High school 10.2 (8.0-13.0) 6.9 (5.2-9.1) 7.6 (5.7-10.1) High school grad 5.8 (5.0-6.8) 5.4 (4.6-6.2) 3.4 (2.8-4.1) Some college 3.6 (3.0-4.4) 4.8 (4.0-5.7) 2.8 (2.2-3.6) College grad 2.8 (2.3-3.5) 3.5 (2.9-4.2) 1.7 (1.3-2.2)
Household Income < $20,000 8.2 (6.8-10.0) 6.9 (5.7-8.4) 6.4 (5.1-8.1) $20,000 - $34,999 7.4 (6.1-8.9) 7.4 (6.2-8.9) 4.3 (3.4-5.4) $35,000 - $49,999 4.6 (3.6-5.8) 5.5 (4.3-6.9) 2.8 (2.0-4.0) $50,000 - $74,999 3.0 (2.2-3.9) 4.1 (3.2-5.4) 1.3 (0.8-2.0) ≥ $75,000 1.9 (1.4-2.7) 2.3 (1.8-3.0) 0.9 (0.6-1.4)
Among all adults, the proportion who had ever been told by a doctor that: a they had a heart attack or myocardial infarction, b they had angina or coronary heart disease, or c they had a stroke.
Heart disease and stroke are the first and third leading causes of death, respectively, in both Michigan and the United States.60-61 More than 615,000 people in the United States died from heart disease in 2007.61 Cardiovascu-lar disease costs an estimated $475 billion annually.62 Modifying risk fac-tors offers the greatest potential for reducing death and disability from cardiovascular disease.62 In 2008, 4.5% of Michigan adults had ever been told they had a heart attack or myocardial infarction, 4.7% had ever been told angina or coronary heart disease, and 3.0% had ever been told stroke. All three indicators of cardiovascular disease decreased with education and income, and in-creased with age. 8.9% (8.3-9.5) of Michigan adults re-ported ever being told that they had cardiovascular disease (i.e., ever told heart attack, angina/coronary heart disease, or stroke). Men were more likely than women to have ever been diagnosed with a heart attack (5.6% vs. 3.5%). How-ever, men (9.6% [8.7-10.7]) and women (8.1% [7.4-8.9]) had similar prevalence of ever being diagnosed with any form of cardiovascular dis-ease.
22
Cardiovascular Disease by GenderMichigan, 2008
0
2
4
6
8
Heart Attack Angina or CoronaryDisease
Stroke
%
Male
Female
C
M
Y
CM
MY
CY
CMY
K
85093 BRD BRFS Annual Report 12.18.09.pdf 1 01/08/2010 1:56:32 PM
C
M
Y
CM
MY
CY
CMY
K
85093 BRD BRFS Annual Report 12.18.09.pdf 1 01/08/2010 2:55:59 PM
2008 MiBRFS
Acknowledgements
Data were collected for the 2008 Michigan Behavioral Risk Factor Survey (MiBRFS) by the Institute for Public Policy and Social Research, Office of Survey Research, at Michigan State University. The authors are grateful to Larry Hembroff, Ph.D., and his staff for conducting the survey. We also appreciate the assistance provided by the Behavioral Surveillance Branch at the Centers for Disease Control and Prevention in Atlanta, Georgia. We are especially grateful to the residents of Michigan who agreed to participate in this survey.
iv
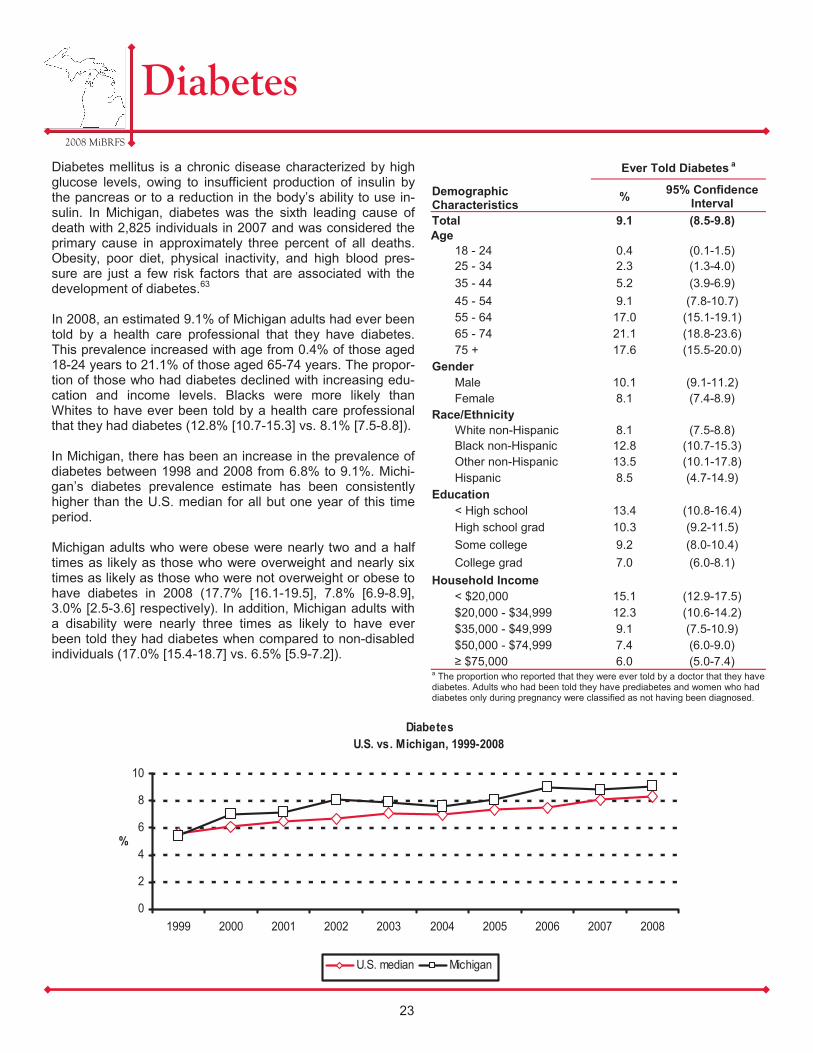
2008 MiBRFS
Diabetes
Diabetes mellitus is a chronic disease characterized by high glucose levels, owing to insufficient production of insulin by the pancreas or to a reduction in the body’s ability to use in-sulin. In Michigan, diabetes was the sixth leading cause of death with 2,825 individuals in 2007 and was considered the primary cause in approximately three percent of all deaths. Obesity, poor diet, physical inactivity, and high blood pres-sure are just a few risk factors that are associated with the development of diabetes.63
In 2008, an estimated 9.1% of Michigan adults had ever been told by a health care professional that they have diabetes. This prevalence increased with age from 0.4% of those aged 18-24 years to 21.1% of those aged 65-74 years. The propor-tion of those who had diabetes declined with increasing edu-cation and income levels. Blacks were more likely than Whites to have ever been told by a health care professional that they had diabetes (12.8% [10.7-15.3] vs. 8.1% [7.5-8.8]). In Michigan, there has been an increase in the prevalence of diabetes between 1998 and 2008 from 6.8% to 9.1%. Michi-gan’s diabetes prevalence estimate has been consistently higher than the U.S. median for all but one year of this time period. Michigan adults who were obese were nearly two and a half times as likely as those who were overweight and nearly six times as likely as those who were not overweight or obese to have diabetes in 2008 (17.7% [16.1-19.5], 7.8% [6.9-8.9], 3.0% [2.5-3.6] respectively). In addition, Michigan adults with a disability were nearly three times as likely to have ever been told they had diabetes when compared to non-disabled individuals (17.0% [15.4-18.7] vs. 6.5% [5.9-7.2]).
Demographic Characteristics
Ever Told Diabetes a
% 95% Confidence Interval
Total 9.1 (8.5-9.8) Age
18 - 24 0.4 (0.1-1.5) 25 - 34 2.3 (1.3-4.0) 35 - 44 5.2 (3.9-6.9) 45 - 54 9.1 (7.8-10.7) 55 - 64 17.0 (15.1-19.1) 65 - 74 21.1 (18.8-23.6) 75 + 17.6 (15.5-20.0)
Gender Male 10.1 (9.1-11.2) Female 8.1 (7.4-8.9)
Race/Ethnicity White non-Hispanic 8.1 (7.5-8.8) Black non-Hispanic 12.8 (10.7-15.3) Other non-Hispanic 13.5 (10.1-17.8)
Education < High school 13.4 (10.8-16.4) High school grad 10.3 (9.2-11.5) Some college 9.2 (8.0-10.4) College grad 7.0 (6.0-8.1)
Household Income < $20,000 15.1 (12.9-17.5) $20,000 - $34,999 12.3 (10.6-14.2) $35,000 - $49,999 9.1 (7.5-10.9) $50,000 - $74,999 7.4 (6.0-9.0) ≥ $75,000 6.0 (5.0-7.4)
a The proportion who reported that they were ever told by a doctor that they have diabetes. Adults who had been told they have prediabetes and women who had diabetes only during pregnancy were classified as not having been diagnosed.
Hispanic 8.5 (4.7-14.9)
23
Diabetes U.S. vs. Michigan, 1999-2008
0
2
4
6
8
10
1999 2000 2001 2002 2003 2004 2005 2006 2007 2008
%
U.S. median Michigan
C
M
Y
CM
MY
CY
CMY
K
85093 BRD BRFS Annual Report 12.18.09.pdf 1 01/08/2010 1:58:32 PM
C
M
Y
CM
MY
CY
CMY
K
85093 BRD BRFS Annual Report 12.18.09.pdf 1 01/08/2010 2:57:00 PM
2008 MiBRFS
Acknowledgements
Data were collected for the 2008 Michigan Behavioral Risk Factor Survey (MiBRFS) by the Institute for Public Policy and Social Research, Office of Survey Research, at Michigan State University. The authors are grateful to Larry Hembroff, Ph.D., and his staff for conducting the survey. We also appreciate the assistance provided by the Behavioral Surveillance Branch at the Centers for Disease Control and Prevention in Atlanta, Georgia. We are especially grateful to the residents of Michigan who agreed to participate in this survey.
iv

The national Behavioral Risk Factor Surveillance System (BRFSS) consists of annual telephone surveys conducted in-dependently by the states, District of Columbia, and U.S. territories and is coordinated through cooperative agreements with the Centers for Disease Control and Prevention (CDC). The annual Michigan Behavioral Risk Factor Surveys (MiBRFS) follow the CDC protocol for the BRFSS and use the standardized English core questionnaire. The 2008 MiBRFS data were collected quarterly by the Institute for Public Policy and Social Research at Michigan State University (http://www.ippsr.msu.edu). The sample of telephone numbers was selected using a list-assisted, random-digit-dialed methodology with disproportionate stratification based on listedness and population density of African Americans.
The 2008 MiBRFS data were weighted to adjust for the probabilities of selection (based on the probability of telephone number selection, the number of adults in the household, and the number of residential phone lines) and a post-stratification weighting factor that adjusted for sex, age, and race (using 2007 estimated Michigan population distribu-tions with bridged race categories).64 Prevalence estimates and asymmetric 95% confidence intervals (CIs) were calculated using SAS-Callable SUDAAN (version 10.0), a statistical computing program that was designed for analyzing data from multistage sample surveys.65 If the CIs for two estimates from different subpopulations or different survey years did not overlap, they were assumed to be statistically different. In addition, selected pair-wise comparisons were tested for statistical significance using a t-test or chi-square. Although results of these statistical tests are not reported, they were used to guide the presentation of results. Unless otherwise specified, respondents who answered that they did not know or refused to answer were not included in the calculation of estimates. For comparison purposes, the median of estimates from all participating states and territories was used as a national estimate. All 50 states, three territories (Puerto Rico, Guam, and the Virgin Islands), and the District of Columbia partici-pated in the 2008 BRFSS. Sample Results for the 2008 MiBRFS A total of 110,490 telephone numbers were used for the 2008 MiBRFS. The total number of eligibles was 13,966, of which 9,016 resulted in a completed or partially completed interview; 73,727 were ineligible; and 22,797 were of un-known eligibility. The CASRO (Council of American Survey Research Organizations) response rate is a measure of respondent contact and cooperation. This rate includes completed interviews and partial interviews, in which at least 50 percent of the core questionnaire has been completed, in the numerator and an estimate of the number of eligible sample units in the de-nominator (including a proportion of the unknowns). The CASRO response rate for the 2008 MiBRFS was 54.6%.66
Health of the MiBRFS The CASRO response rate for MiBRFS has increased or held steady in the re-cent past, at a time when the median of CASRO rates for other states has been dropping. The survey contractor, Office for Survey Research in the Institute for Public Policy and Social Research at Michigan State University, has worked diligently to improve the CASRO rate.
2008 MiBRFS
BRFSS Methods
24
CASRO Response RateU.S. vs. Michigan, 1992-2008
0
20
40
60
80
1992 1994 1996 1998 2000 2002 2004 2006 2008
%
U.S. median Michigan

In addition, MDCH has recently been able to increase the number of interviews each year. A larger sample size increases the utility of the survey by providing more pre-cise estimates, allowing for increased number of topics to be covered each year, and enabling the calculation of estimates for more demographic and geographic subpopulations. For example, single year estimates were calculable for Hispanic adults for the first time in 2005, because the large sample size allowed for ade-quate number of completed interviews in this group.
2008 MiBRFS
BRFSS Methods, continued
25
0
2000
4000
6000
8000
10000
12000
14000
1989 1991 1993 1995 1997 1999 2001 2003 2005 2007 2009
#
Number of InterviewsMichigan BRFS 1989-2009
2008 MiBRFS
Bibliography
1. Michigan Department of Community Health. (2009). Critical Health Indicators. http://www.michigan.gov/mdch/0,1607,7-132-2946_5093-17501--,00.html. (April 2009).
2. Michigan Cancer Consortium. (2009) MCC Priorities. http://www.michigancancer.org/AboutTheMCC/PriorityObjectives.cfm (August 2009).
3. Link MW, Battaglia MP, Frankel MR, Osborn L, Mokdad AH. 2006. Address-based versus random-digit-dial surveys: Comparison of key health and risk indicators. Am J Epidemiol 164(10):1019-1025.
4. Office of Disease Prevention, U.S. Department of Health and Human Services. (2000). Healthy People 2010: A Sys-tematic Approach to Health Improvement. http://www.healthypeople.gov/document/html/uih/uih_2.htm. (August 2009).
5. Centers for Disease Control and Prevention. Measuring Healthy Days. Atlanta, Georgia: CDC, November 2000.
6. Centers for Disease Control and Prevention (2009). Health-Related Quality of Life. http://www.cdc.gov/hrqol. (August 2009).
7. Office of Disease Prevention, U.S. Department of Health and Human Services. (2000). Healthy People 2010: Dis-ability and Secondary Conditions. http://www.healthypeople.gov/Document/HTML/Volume1/06Disability.htm. (August 2009).
8. McNeil JM. 1997. Disabilities Affect One-Fifth of All Americans. Census Brief, U.S. Department of Commerce, Economics and Statistics Administration, Bureau of the Census. CENBR/97-5.
9. Centers for Disease Control and Prevention (2009). Overweight and Obesity. http://www.cdc.gov/nccdphp/dnpa/obesity. (August 2009).
10. Finkelstein EA, IC Fiebelkorn, G Wang. 2004. State-level Estimates of Annual Medical Expenditures Attributable to Obesity. Obes Res 12(1):18-24.
11. Hoffman C, Paradise, J. 2008. Health Insurance and Access to Health Care in the United States. Ann N Y Acad Sci 1136:149-160.
12. Agency for Healthcare Research and Quality. (2008). The Guide to Clinical Preventive Services. http://www.ahrq.gov/clinic/pocketgd.htm. (September 2009).
13. National Center for Health Statistics. “Health, United States, 2007: with Chartbook on Trends in the Health of Ameri-cans,” 2007; Center for American Progress, The Case for Health Reform, February 2009.
14. Shi L, Macinko J, Starfield B, et al. 2003. The Relationship Between Primary Care, Income Inequality, and Mortality in US States, 1980-1995. J Am Board Fam Pract 16:412-422.
15. Centers for Disease Control and Prevention. (2008). Physical Activity for Everyone. http://www.cdc.gov/nccdphp/dnpa/physical/everyone/index.htm. (September 2009).
16. Centers for Disease Control and Prevention. (2008). Fruit & Vegetable Benefits. http://www.fruitsandveggiesmatter.gov/benefits/index.html#. (September 2009).
17. U.S. Department of Health and Human Services. (2004). The Health Consequences of Smoking: A Report of the Surgeon General. http://www.cdc.gov/tobacco/sgr/sgr_2004/index.htm. (August 2009).
18. Centers for Disease Control and Prevention. (2009). Economic Facts about U.S. Tobacco Use and Tobacco Production. http://www.cdc.gov/tobacco/data_statistics/fact_sheets/economics/econ_facts/index.htm. (August 2009).
19. Office of Disease Prevention, U.S. Department of Health and Human Services. (2000). Healthy People 2010: Tobacco Use. http://www.healthypeople.gov/Document/HTML/Volume2/27Tobacco.htm. (August 2009).
26

2008 MiBRFS
Bibliography
20. Gulliford MC, Sedgwick JEC, Pearce AJ. 2003. Cigarette smoking, health status, socio-economic status and access to health care in diabetes mellitus: a cross-sectional survey. BMC Health Serv Res 3(4):1-9.
21. Centers for Disease Control and Prevention. (2008). General Information on Alcohol Use and Health. http://www.cdc.gov/alcohol/quickstats/general_info.htm. (August 2009).
22. National Center for Statistics & Analysis. (2008). Fatality Analysis Reporting System Encyclopedia: Fatal Crashes and Percent Alcohol-Related. http://www-fars.nhtsa.dot.gov/Crashes/CrashesAlcohol.aspx. (September 2009).
23. Office of Disease Prevention, U.S. Department of Health and Human Services. (2000). Healthy People 2010: Substance Abuse. http://www.healthypeople.gov/Document/HTML/Volume2/26Substance.htm. (August 2009).
24. National Highway Traffic Safety Administration. (2009). Traffic Safety Facts: 2008 Traffic Safety Annual Assessment - Highlights. http://www-nrd.nhtsa.dot.gov/Pubs/811172.PDF. (September 2009).
25. National Highway Traffic Safety Administration. (2003). Buckle Up America Click It or Ticket Fact Sheet. www.nhtsa.dot.gov/people/injury/airbags/buckleplan/mayplanner2003/factsheet.html. (June 5, 2007).
26. Michigan State Police. (2009). 2008 Michigan Traffic Crash Facts Executive Summary. www.michigantraffic crash-facts.org. (September 2009).
27. Michigan Quality Improvement Consortium. (2009). About MQIC. http://www.mqic.org/abou.htm#1. (August 2009).
28. Michigan Cancer Consortium. (2009). Comprehensive Cancer Control Plan for Michigan: 2009-2015. http://www.michigancancer.org/PDFs/MichCompCaControlPlan(2009-2015)/AllSections.pdf. (September 2009).
29. American Cancer Society. (2009). How Many Women Get Breast Cancer? http://www.cancer.org/docroot/CRI/content/CRI_2_2_1X_How_many_people_get_breast_cancer_5.asp?rnav=cri. (September 2009).
30. American Cancer Society. (2008). Cancer facts and figures 2008. http://www.cancer.org/downloads/STT/2008CAFFfinalsecured.pdf. (September 2009).
31. Vital Records & Health Data Development Section, Michigan Department of Community Health. (2008). Total deaths by cause and sex, Michigan residents, 2007. www.mdch.state.mi.us/pha/osr/deaths/DXCause113.asp. (September 2009).
32. Michigan Cancer Consortium. (2007). Guidelines for early detection of breast cancer. http://www.michigancancer.org/PDFs/EarlyDetectionRecs/MCCBreastCaGuidelines-053107.pdf. (September 2009).
33. Office of Disease Prevention, U.S. Department of Health and Human Services. (2000). Healthy People 2010. www.healthypeople.gov/Document/HTML/Volume1/03Cancer.htm. (August 2009).
34. National Cancer Institute. (2003). Task force announces new cervical cancer screening guidelines. Bethesda. www.cancer.gov/newscenter/pressreleases/cervicalscreen. (August 2009).
35. Saslow D, CD Runowicz, D Solomon, et al. 2002. American Cancer Society for the early detection of cervical neo-plasia and cancer. CA Cancer J Clin 52: 342-362.
36. U.S. Preventive Services Task Force. (2008). Screening for cervical cancer: recommendations and rationale. http://www.ahrq.gov/clinic/pocketgd08/gcp08s2.htm#Cervical. (September 2009.)
37. American Cancer Society. (2009). Cancer prevention & early detection facts & figures 2008. http://www.cancer.org/downloads/STT/CPED_2008.pdf. (September 2009).
38. Michigan Cancer Consortium. (2007). Recommendations for the early diagnosis of cervical cancer. http://www.michigancancer.org/PDFs/EarlyDetectionRecs/MCCCervCAGuidelines-Dec2007.pdf. (September 2009).
27

39. Vital Records & Health Data Development Section. 2009. Invasive prostate cancer incidence and mortality trends, Michigan male residents, 1985-2007. Lansing, MI: MDCH. www.mdch.state.mi.us/pha/osr/Cancer/stateinc.asp?CDxID=IncTrendsProstate. (September 2009.)
40. American Cancer Society. (2009). Detailed guide: prostate cancer - can prostate cancer be found early? www.cancer.org/docroot/CRI/content/CRI_2_4_3X_Can_prostate_cancer_be_found_early_36.asp?rnav=cri. (September 2009).
41. American Cancer Society. (2009). Detailed guide: prostate cancer - what are the risk factors for prostate cancer?. www.cancer.org/docroot/CRI/content/CRI_2_4_2X_What_are_the_risk_factors_for_prostate_cancer_36.asp?rnav=cri. (September 2009).
42. Harris R and KN Lohr. 2002. Screening for prostate cancer: an update of the evidence for the U.S. Preventive Ser-vices Task Force. Ann Intern Med 137(11): 917-929.
43. Brawley OW. 1997. Prostate carcinoma incidence and patient mortality. Cancer 80: 1857-1863.
44. Vital Records & Health Data Development Section, Michigan Department of Community Health. (2009). Invasive colorectal cancer incidence and mortality trends, Michigan residents, 1985-2007. www.mdch.state.mi.us/pha/osr/Cancer/stateinc.asp?CDxID=IncTrendsColo. (September 2009).
45. Centers for Disease Control and Prevention. (2009). Colorectal (Colon) Cancer. http://www.cdc.gov/cancer/colorectal/. (September 2009).
46. Pignone M, M Rich, SM Teutsch, et al. 2002. Screening for colorectal cancer in adults at average risk: a summary of the evidence for the U.S. Preventive Services Task Force. Ann Intern Med 137(2): 132-141.
47. United States Preventive Services Task Force. (2002). Screening for colorectal cancer: recommendations and ra-tionale. Ann Intern Med 137(2): 129-131
48. American Cancer Society. (2009). Detailed guide: colon and rectum cancer - what are the risk factors for colorectal cancer?. http://www.cancer.org/docroot/CRI/content/CRI_2_4_2X_What_are_the_risk_factors_for_colon_and_rectum_cancer.asp?sitearea=. (September 2009).
49. National Institute of Dental and Craniofacial Research. (2008). Oral health in America: a report of the surgeon gen-eral. http://www.nidcr.nih.gov/DataStatistics/SurgeonGeneral/sgr/home.htm. (September 2009).
50. Centers for Disease Control and Prevention. (2006). Fact sheet: oral health for adults. http://www.cdc.gov/OralHealth/publications/factsheets/adult.htm. (September 2009).
51. Fiore AE, Shay DK, Broder K, et al. 2008. Prevention and control of influenza: recommendations of the Advisory Committee on Immunization Practices (ACIP). MMWR 57:1-60.
52. The Advisory Committee on Immunization Practices. (2006). Recommended adult immunization schedule, United States, October 2006-September 2007. http://www.cdc.gov/vaccines/recs/schedules/downloads/adult/06-07/adult-schedule.pdf. (July 2008).
53. Centers for Disease Control and Prevention. 1997. Prevention of Pneumococcal Disease: Recommendations of the Advisory Committee on Immunization Practices. 46(RR-08):1-24.
54. Office of Disease Prevention, U.S. Department of Health and Human Services. (2000). Healthy People 2010: Immunization and Infectious Disease. http://www.healthypeople.gov/Document/HTML/Volume1/14Immunization.htm. (August 2009).
55. Michigan Department of Community Health, Bureau of Epidemiology. (2009). HIV/AIDS Quarterly Analyses. http://www.michigan.gov/documents/mdch/Jul_2009_286299_7.pdf. (September 2009).
2008 MiBRFS
Bibliography
28

56. Department of Health and Human Services. (2008). Panel for Antiretroviral Guidelines for Adults and Adolescents: Guidelines for the use of antiretroviral agents in HIV-1-infected adults and adolescents. http://aidsinfo.nih.gov/contentfiles/AdultandAdolescentGL.pdf. (August 2009).
57. National Institutes of Health. (2008). What is Asthma?. http://www.nhlbi.nih.gov/health/dci/Diseases/Asthma/Asthma_WhatIs.html. (August 2009).
58. National Institutes of Health. (2008). What Causes Asthma?. http://www.nhlbi.nih.gov/health/dci/Diseases/Asthma/Asthma_Causes.html. (August 2009).
59. National Institutes of Health. (2008). Who Is At Risk For Asthma?. http://www.nhlbi.nih.gov/health/dci/Diseases/Asthma/Asthma_WhoIsAtRisk.html. (August 2009).
60. Xu J, Kochanek KD, Tejada-Vera B. 2009. Deaths: Preliminary data for 2007. Natl Vital Stat Rep 58(1):1-51.
61. Michigan Department of Community Health. (2009). 2007 Michigan Resident Death File. http://www.mdch.state.mi.us/pha/osr/deaths/causrankcnty.asp. (September 2009).
62. American Heart Association. (2009). Cardiovascular Disease Costs. http://www.americanheart.org/presenter.jhtml?identifier=4475. (September 2009).
63. Centers for Disease Control and Prevention. (2008). National diabetes fact sheet, 2007. http://www.cdc.gov/diabetes/pubs/pdf/ndfs_2007.pdf. (September 2009).
64. National Center for Health Statistics. (2009). Bridged-race Vintage 2007 postcensal population estimates for July 1, 2000 - July 1, 2007, by year, county, single-year of age, bridged-race, Hispanic origin, and sex. http://www.cdc.gov/nchs/nvss/bridged_race/data_documentation.htm#vintage2007. (February 2009).
65. Research Triangle Institute (RTI). 2008 SUDAAN language manual. Release 10.0. Research Triangle Part, NC: RTI.
66. Centers for Disease Control and Prevention. (2009). 2008 BRFSS Summary Data Quality Report. ftp://ftp.cdc.gov/pub/Data/Brfss/2008_Summary_Data_Quality_Report.pdf. (March 2009).
2008 MiBRFS
Bibliography
29

Jennifer M. Granholm, Governor Janet Olszewski, Director
Number of copies: 750 Total printing cost: $1919.66
Price per unit: $2.56
MDCH is an equal opportunity employer, service & program provider.
C
M
Y
CM
MY
CY
CMY
K
85093 BRD BRFS Annual Report 12.18.09.pdf 1 01/08/2010 2:00:59 PM