2008 doe hydrogen program review · 2008 doe hydrogen program review june 9-13, 2008 rod borup,...
TRANSCRIPT
2008 DOE Hydrogen Program ReviewJune 9-13, 2008
Rod Borup, John Davey, Hui Xu, Axel Ofstad, Fernando Garzon, Bryan Pivovar
Los Alamos National Laboratory
PEM Fuel Cell Durability
FC26 This presentation does not contain any proprietary, confidential, or otherwise restricted information

Overview
Budget• FY04: $900k• FY05: $950k• FY06: $1000k• FY07: $0 $300• FY08: $300
Timeline2001: Project started as Fuel Cell
Stack Durability on Gasoline Reformate
2004: Changed focus PEM H2Durability
2007: Ended. Restarted at $300k
Barriers
Collaborators• No Formal Partners• ORNL (Karren More)• LANL H2 Storage Center• Analysis:
• Univ. New Mexico, Augustine Scientific, LANL MPA-MC
• Materials:• Gore, SGL, Cabot Fuel Cells
• Durability• Cost • Electrode Performance

• Define degradation mechanisms• Design materials with improved durability• Identify and quantify factors that limit PEMFC Durability
• Measure property changes in fuel cell components during life testing• Life testing of materials
• Examine testing conditions, incl. drive cycle• Membrane-electrode durability• Electrocatalyst activity and stability• Electrocatalyst and GDL carbon corrosion• Gas diffusion layer hydrophobicity• Bipolar plate materials and corrosion products
• Develop/apply methods for accelerated and off-line testing• Improve durability
Objectives:Quantify and Improve PEM Fuel Cell Durability
2010-2015 Technical Target: 5000 hours Durability (with cycling)

Approach to Durability Studies• Fuel Cell MEA Durability Testing and Study
• Constant voltage/current/power and power cycling (drive cycle)• VIR / cell impedance• Catalyst active area• Effluent water analysis
• in situ and post-characterization of MEAs, catalysts, GDLs• SEM / XRF / XRD (ex situ and in situ) / TEM / ICP-MS / neutron scattering / H2 adsorption / Inverse Gas Chromatography / Contact Angle / totalporosity / hydrophillic vs. hydrophobic porosity
• Develop and test with off-line and accelerated testing techniques• Potential cycling • Environmental component aging, testing and characterization• Component interfacial durability property measurements

Durability Testing Issues• Testing times can be lengthy (and costly)
– 5,000 hrs = ~ 7 months (automotive target)– 40,000 hrs = ~ 4.6 years (stationary system target)– Need relevant accelerated testing – Need to close ‘field / lab gap’ or ‘transfer function’
• Lab single cell ‘real’ stacks field data
• Operating variables effect not fully understood– Many degradation mechanisms likely yet undefined– Power transients - vehicle fuel cell/battery hybridization– Transient power, temperature, RH– Shut down / start-up
• Materials still being developed and improved– Need relevant accelerated testing

Comparison of Accelerated Testing MethodsUSFCC Accelerated Catalyst Test #1
Step vs. Triangle Potential Cycle
-100
-80
-60
-40
-20
0
20
40
60
80
100
0 200 400 600 800 1000 1200
Voltage / V
Cur
rent
0 Cycles400 Cycles1600 Cycles2800 Cycles4000 Cycles8000 Cycles
0
0.25
0.5
0.75
1
1.25
0 50 100 150 200
Time / sec
Volta
ge /
V
• Accelerated catalyst testing by potential cycling in H2 / Air
• Voltage cycling: 0.6 and 0.96V (H2/Air)
Step Potential Cycle Triangle Potential Cycle
• H2/Air requires load bank for high current (can’t use potentiostat).• Some MEAs do not reach 0.96V OCP with standard load control• Triangle potential sweep shows much faster degradation
-400
-300
-200
-100
0
100
200
300
0 200 400 600 800 1000 1200
Voltage / V
Cur
rent
0 Cycles400 Cycles1200 Cycles2400 Cycles4000 Cycles8000 Cycles16000 Cycles
0
0.25
0.5
0.75
1
1.25
0 50 100 150 200
Time / sec
Volta
ge /
V

Comparison of Accelerated Testing ProtocolsTest #1. Voltage cycling: 0.6 and 0.96V (H2/air)
Step vs. Triangle Potential Cycle
0.80
0.83
0.86
0.89
0.92
0.95
0 5000 10000 15000 20000
# Cycles
OC
P / V
0.80
0.83
0.86
0.89
0.92
0.95
0 5000 10000 15000 20000
# Cycles
OC
P / V
• OCP decreases with cycles• Varies potential limits
• Increase in sample HFR • H2/Air cycling not just
catalyst degradation
• Difficulties with this test being consistent and repeatable• Does not separate catalyst durability from other components
0.00.10.20.30.40.50.60.70.80.91.0
0.0 0.5 1.0 1.5Current Density / A/cm2
Volta
ge /
V
0.000
0.005
0.010
0.015
0.020
0.025
0.030
0.035
0.040
HFR
0 Cycles400 Cycles1600 Cycles2800 Cycles4000 Cycles8000 CyclesHFR 0 CyclesHFR 400 CyclesHFR 1600 CyclesHFR 2800 CyclesHFR 4000 CyclesHFR 8000 Cycles
Step Potential Cycle Triangle Potential Cycle
0.00.10.20.30.40.50.60.70.80.91.0
0.0 0.5 1.0 1.5
Current Density / A/cm2
Volta
ge /
V
0.000
0.005
0.010
0.015
0.020
0.025
0.030
0.035
0.040
HFR
0 Cycles400 Cycles1600 Cycles2800 Cycles4000 Cycles8000 Cycles16000 CyclesHFR 0 CyclesHFR 400 CyclesHFR 1600 CyclesHFR 2800 CyclesHFR 4000 CyclesHFR 8000 CyclesHFR 16000 Cycles
OCP vs. Cycles OCP vs. Cycles
VIR curves over 16,000 Cycles VIR curves over 8,000 Cycles

Shut-down/Start-up Effects
Modified from: Sathya Motupally, UTC Power
• ‘Reverse Current’ degradation• Non-homogeneous mixture of H2 on anode • H2/air portion of cell drives ‘reverse current’ elsewhere
Stop-Start Cycling Effect on Carbon Corrosion
0
5
10
15
20
25
0 1000 2000 3000 4000Time / sec
CO
2 Out
let /
ppm
CO2 (ppm)Anode:Flowrate: 100 sscm H2
Purge: 50 sccm Air
66.5
386.1
50 cm2
25 oC
Start-up
Shut-down
0
5
10
15
20
25
0 500 1000 1500 2000 2500Time / sec
CO
2 Out
let
/ ppm
CO2 (ppm)
13125.5
Anode:Flowrate: 400 sscm H2
Purge: 200 sccm Air
50 cm225 oC Start-up
Shut-down
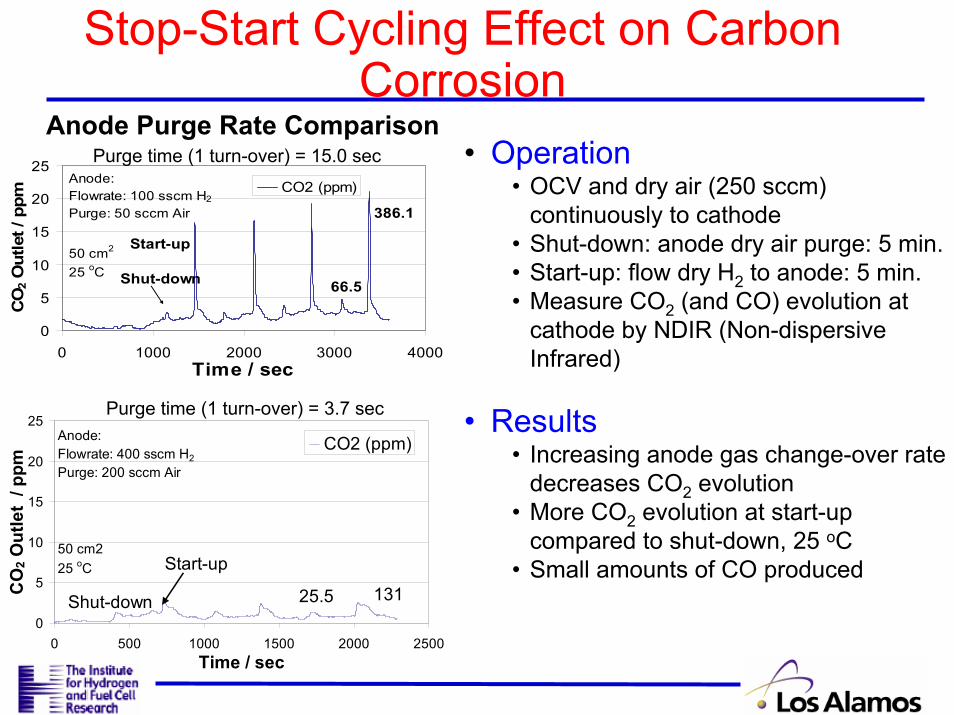
• Operation• OCV and dry air (250 sccm)
continuously to cathode • Shut-down: anode dry air purge: 5 min.• Start-up: flow dry H2 to anode: 5 min. • Measure CO2 (and CO) evolution at
cathode by NDIR (Non-dispersive Infrared)
• Results• Increasing anode gas change-over rate
decreases CO2 evolution • More CO2 evolution at start-up
compared to shut-down, 25 oC• Small amounts of CO produced
Anode Purge Rate Comparison
Purge time (1 turn-over) = 3.7 sec
Purge time (1 turn-over) = 15.0 sec

Temperature Effect on Carbon Corrosion During Stop-Start Cycling
0
5
10
15
20
25
30
35
40
0 500 1000 1500 2000 2500Time / sec
CO
2 Out
let C
onc.
/ pp
m CO2 (ppm)60 oC
Shut-downStart-up 7700 3160
Anode Flowrate: 100 sscm H2
Purge: 50 sccm Air50 cm2
05
10152025303540
0 500 1000 1500 2000 2500Time / sec
CO
2 Out
let C
onc.
/ pp
m CO2 (ppm)80 oC
Shut-down
Start-up2659
2604
Anode Flowrate: 100 sscm H2
Purge: 50 sccm Air50 cm2
•CO2 Evolution at Slow Purge Rate•25 oC
• Higher at start-up than shut-down• Much lower evolution than at 60 oC
•60 oC• Greatest evolution• Higher evolution at shut-down
• 80 oC• Non-zero steady-state evolution• ~ Equal shut-down/start-up evolution
0
5
10
15
20
25
30
35
40
0 1000 2000 3000 4000Time / sec
CO
2 Out
let C
onc.
/ pp
m CO2 (ppm)
Anode Flowrate: 100 sscm H2
Purge: 50 sccm Air50 cm2
66.5
386.1Start-up
Shut-down
25 oC

GDL DurabilityContact Angle Changes
130132134136138140142144146148150
0 100 200 300 400 500 600
Time After Drop Placement (seconds)
Con
tact
Ang
le (d
egre
es)
Untreated
DN NaCl-01-Cathode
DN NaCl -01-Anode
DN NaCl-03-Cathode
DN NaCl-03-Anode
Contact angles with aging (Single Fiber Measurements)
• GDLs lose hydrophobicity with aging• Exposure to NaCl make GDLs more hydrophobic
• Also slows rate of water uptake
78
80
82
84
86
88
90
92
94
96
UnagedTGP-H 120
(Plain)
UnagedTGP-H 090
#1 (17.2wt% FEP)
UnagedTGP-H 090
#2 (17.0wt% FEP)
N2, 60°C,460 hr;
TGP-H 060(17.2 wt%
FEP)
N2, 80°C,460 hr;
TGP-H 090(16.7 wt%
FEP)
Air, 60°C,680 hr;
TGP-H 060(16.9 wt%
FEP)
Air, 80°C,680 hr;
TGP-H 090(17.0 wt%
FEP)
Con
tact
Ang
le (d
eg)
Hydrophobic
Hydrophilic
Increasing Aggressiveness of Aging Environment
Contact angles with NaCl exposure(Paper Sessile Drop Measurements)

Surface Analysis of GDL Material• Confirm –COOH surface species
– Observe –OH and C=O IR
• Confirm acyl chloride – Reduction of –OH, and/or C-Cl
MPA-MC, John Rau, Clay Macomber
DRIFTS Spectra of Aged GDL(Diffuse Reflectance Infrared Transmission Spect.)
• -OH species identified• Not yet satisfactorily identified
surface species• Using DRIFTS, will also explore
Raman
-OH
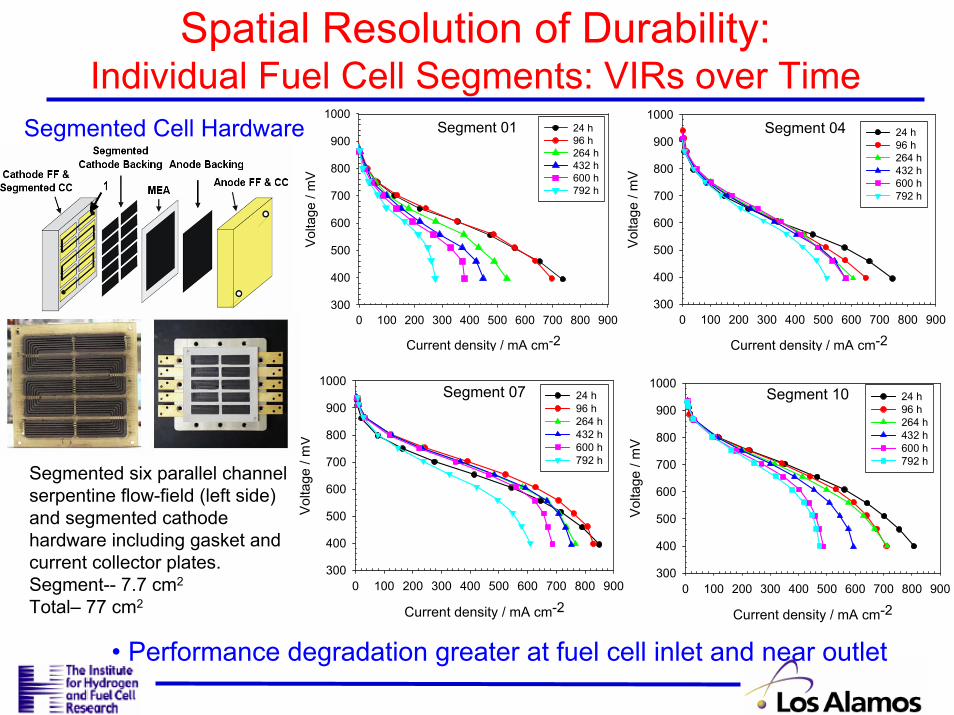
Spatial Resolution of Durability:Individual Fuel Cell Segments: VIRs over Time
Segment 01
Current density / mA cm-20 100 200 300 400 500 600 700 800 900
Vol
tage
/ m
V300
400
500
600
700
800
900
100024 h96 h264 h432 h600 h792 h
Segment 04
Current density / mA cm-20 100 200 300 400 500 600 700 800 900
Vol
tage
/ m
V
300
400
500
600
700
800
900
100024 h96 h264 h432 h600 h792 h
Segment 10
Current density / mA cm-20 100 200 300 400 500 600 700 800 900
Vol
tage
/ m
V
300
400
500
600
700
800
900
100024 h96 h264 h432 h600 h792 h
Segment 07
Current density / mA cm-20 100 200 300 400 500 600 700 800 900
Vol
tage
/ m
V
300
400
500
600
700
800
900
100024 h96 h264 h432 h600 h792 h
• Performance degradation greater at fuel cell inlet and near outlet
Segmented six parallel channel serpentine flow-field (left side) and segmented cathode hardware including gasket and current collector plates.Segment-- 7.7 cm2
Total– 77 cm2
Segmented Cell Hardware

Crossover Current DensityElectrocatalyst Surface Area
Seg
01
Seg
02
Seg
03
Seg
04
Seg
05
Seg
06
Seg
07
Seg
08
Seg
09
Seg
10
Cro
ssov
er c
urre
nt d
ensi
tyat
0.2
5 V
/ m
A c
m-2
0
5
10
15
20
25
30
24 h 96 h 264 h 432 h600 h 792 h
Note: Because of segmented flowfield traversing in series, each subsequent segment cross-over is cumulative for all previous segments
• H2 cross-over per segment is ~ constant
• Unclear about segment 10
Seg
01
Seg
02
Seg
03
Seg
04
Seg
05
Seg
06
Seg
07
Seg
08
Seg
09
Seg
10
EC
A /
cm2 P
t cm
-2
10
20
30
40
50
60
70
80
90
100
24 h 96 h264 h 432 h 600 h792 h
•Loss of electrocatalyst surface area (ECA) predominately at cathode outlet • (higher water content)
•Loss of ECA at inlet doesn’t explain significant performance loss at inlet

RH Effect on Membrane Degradation
Time (hours)0 50 100 150 200
Cur
rent
Des
ity (m
A/c
m2 )
0
4
8
12
16
20
24un-humid. 20% RH 60% RH 100%RH
H2, 500 sccm, 26psi; cathode: air/N2, 1000 sccm, 26psi.
• Increase in H2 crossover at medium RHs (20-60%)
Time (hours)0 50 100 150 200
OC
V
0.6
0.7
0.8
0.9
1.0un-humid.20% RH60% RH100% RH
• Stable OCP at 100% RH• OCP degrades at 20 & 60% RH
• More H2 and O2 crossover results in greater H2O2formation
Hydrogen Crossover Open-Circuit (OCP)

Fluoride Emission Rate (FER)
Time (hours)0 50 100 150 200
FER
, μm
ol/(h
.cm
2 )
10-4
10-3
10-2
10-1
100
un-humid.20% RH 60 %RH 100% RH
Time (hours)0 50 100 150 200
FER
, μm
ol/(h
.cm
2 )10-4
10-3
10-2
10-1
100
un-humid.20% RH 60 %RH 100% RH
CathodeAnode
• Highest fluoride ion emission rate at 60% RH at anode and cathode• 20% RH rate similar to 100% RH rate
Anode: H2, 500 sccm, 26psi; cathode: air, 1000 sccm, 26psi.

Durability Test with Hydrogen from Chemical Hydride
0
0.1
0.2
0.3
0.4
0.5
0.6
0.7
0.8
0 0.5 1 1.5 2 2.5 3Time / hr
Cur
rent
(A) /
Vol
tage
(V)
0
50
100
150
200
250
Flow
rate
/ sc
cm
Cell VoltsCell AmpsH2 FlowrateAir Flowrate
H2 from Tank
H2 f
Out of Hydrogen
0
0.2
0.4
0.6
0.8
1
1.2
0 20 40 60 80 100Time / hr
Cur
rent
(A) /
Cel
l Vol
tage
(V)
Cell VoltsCell Amps
Switched to H2 from H2 Storage Material
H2 from Tube Trailer
(small recovery)
Tube Trailer H2
5 cm2 Cell80 oC100 % Inlet
Cell reaches zero current within ~ 3 hours
Test #1 Test #2
• Immediate decrease in cell performance upon switching to H2 from H2 Storage Material
• Complete failure in 3 hours• Gas analysis suggests B-N
species
• Cell gradually recovered ~ 80% over several days
• Used carbon filter in H2 line• No immediate decrease in
performance• Simple filtration may work
Supporting LANL H2 Storage COE

MilestonesPEM Fuel Cell Durability
Mon Yr Milestone May 07 Shut-down / start-up protocol comparison of degradation
rates Dec 07 Electrocatalyst particle size growth measurements
performed on 2010 and 2015 DOE target loadingsJan 08 Comparison of off-line potential square-wave cycling
with fuel cell operation with square-wave cycling
Jun 08 Segmented Cell OperationSept 08 Peroxide formation results as function of Temperature,
Operating potential and Electrocatalyst
Carboncorrosion
DOE/USFCCH2/AirH2/N2
S.S.

Summary - Durability Testing• Durability testing remains difficult and time intensive
• Time constraints led to accelerated type testing• Decay mechanisms required to define accelerated test protocols
• Need to understand all degradation mechanisms• Need to correlate accelerated testing with real fuel cell life
• Operational variables important to component durability• RH, temperature, potential and potential cycling• Shut-down / start-up variations important to corrosion
• Components• Electrocatalyst (Particle growth)• Membrane (Chemical and mechanical degradation)• GDL (Hydrophobicity loss/gain, porosimetry losses)

• Not sure of future funding status (>FY08)• MEA durability measurements
– Drive cycle testing, operating effects (shut-down), spatial distribution– Identification of degradation mechanisms
• Accelerated testing and durability correlation– Correlate accelerated durability tests to fuel cell performance– Continue to develop accelerated tests for degradation mechanisms
• Component interfacial durability property measurements– GDL / MEA catalyst layer material interfacial contact
Remainder of FY08:– Evaluate surface species leading to hydrophobicity changes
• (both decreasing and increasing)– Evaluate mechanisms leading to change in hydrophobicity
• Examine Nafion / PTFE degradation and carbon bonding
Future Activities