2008 fall conference october 1 2 3 duluth, mn community education: what could it look like?
TRANSCRIPT

2008 Fall ConferenceOctober 1 • 2 • 3
Duluth, MN
Community Education:
What Could it Look Like?

About your Presenter …Mike Looby
Executive Director of Community Engagement District 279 – Osseo Area Schools, MN
Community Education and District 279 Foundation
5th largest in Minnesota 22,000 K-12 students 133,000 lifelong learners 3rd most diverse, 43% students of color Suburban/urban, 15 minutes to downtown Minneapolis 66.5 square miles All or parts of 8 communities
District 277
NCEA President 2008

This Session …
Community Education:
What Could it Look Like?
Outcomes: Participants will … Discover our current reality Learn about our current collective impact Take a glimpse at the future Broaden our thinking Prepare for next steps Have fun!

Discover OurCurrent Reality
What does Community Education look like
now?

CE … What Does it Look Like NOW?
What does it look like now? Programs Services Verbs / Action Words?
Individually think of 1-2 items (innovative)(2-3 word description for each item)
Share items with a person near you Share with large group

Our Current Collective Impact
Community Education has a positive
measurable impact!

An Assumption
“Community Education reaches out to be inclusive. It is synergistic. Everyday, it proves that the community and the schools, working together, can be greater than the sum of their individual parts.”
Gary Marx, PresidentCenter for Public Outreach, Vienna, Virginia

Measurable Impacts of Measurable Impacts of Community Education on K-12Community Education on K-12
By Bill Morris,By Bill Morris,
Decision Resources, Ltd.Decision Resources, Ltd.

1. Community Education program users rate the quality of 1. Community Education program users rate the quality of education provided by their School District higher than education provided by their School District higher than
non-users.non-users.
A majority of Community Education program users rate the quality of education A majority of Community Education program users rate the quality of education in their School Districts as "excellent." in their School Districts as "excellent."
Perception of District Quality of Education
50%
20%
36%
36%
6%
15%
6%
7%
2%
22%
0% 10% 20% 30% 40% 50% 60% 70% 80% 90% 100%
Program Users
Program Non-Users
Excellent Good Only Fair Poor Unsure

In the case of the School District's Superintendent and AdministrationIn the case of the School District's Superintendent and AdministrationCommunity Education program users post an average increase of 9% in theCommunity Education program users post an average increase of 9% in thefavorable rating. For School Boards, the average increase is 8%. Infavorable rating. For School Boards, the average increase is 8%. Incomparing Community Education program users and non-users, every agecomparing Community Education program users and non-users, every agegroup and household type – senior, empty-nest, or parent –showed increases.group and household type – senior, empty-nest, or parent –showed increases.
2. Community Education program users have more favorable 2. Community Education program users have more favorable impressions of both the Superintendent/Administration and impressions of both the Superintendent/Administration and School Board than non-users.School Board than non-users.
Favorable Ratings of District Administration and School Board
47%
38%
61%
53%
0% 10% 20% 30% 40% 50% 60% 70%
Program Users
Program Non-Users
Superintendent/Administration School Board

District Spent Tax Money Effectively & Efficiently During Last 2 YearsDistrict Spent Tax Money Effectively & Efficiently During Last 2 Years
3. Community Education program users are more positive 3. Community Education program users are more positive than non-users about their School District's financial than non-users about their School District's financial management.management.
The fiscal credibility of a School District receives a boost of 15% amongThe fiscal credibility of a School District receives a boost of 15% amongCommunity Education Program users when compared with program non-users.Community Education Program users when compared with program non-users.
District Spent Tax Money Effectively & Efficiently during Last 2 Years
59%
44%
30%
37%
11%
19%
Program Users
Program Non-Users
Agree Disagree Unsure

4. Community Education program users are stronger 4. Community Education program users are stronger supporters of referendum proposals.supporters of referendum proposals.
Community Education program users are 14% more supportive of referendum proposalCommunity Education program users are 14% more supportive of referendum proposalthan non-users. These gains are also realized among all age groups and householdthan non-users. These gains are also realized among all age groups and householdtypes. More striking, though, Community Education programs users are three-timestypes. More striking, though, Community Education programs users are three-timesmore likely to be "strongly" supportive of referendum efforts. In fact, among seniors overmore likely to be "strongly" supportive of referendum efforts. In fact, among seniors overthe age of 65, a solid majority of program users support referenda; among non-users, the age of 65, a solid majority of program users support referenda; among non-users, seniors oppose referenda by a two-to-one majority.seniors oppose referenda by a two-to-one majority.
Level of Referendum Support
67%
53%
21%
28%
12%
19%
0% 10% 20% 30% 40% 50% 60% 70% 80% 90% 100%
Program Users
Program Non-Users
Support Oppose Unsure

5. Community Education program users are better informed 5. Community Education program users are better informed about their School District than non-users.about their School District than non-users.
By an almost 20% margin, Community Education program participants feel wellBy an almost 20% margin, Community Education program participants feel well
informed about their School District.informed about their School District.
Feeling Informed about School District
68%
32%49%
51%
0% 10% 20% 30% 40% 50% 60% 70% 80%
Very/Somewhat Informed
Not Too/Not At All Informed
Program Users Program Non-Users

In general, Community Education program In general, Community Education program participants are better informed and view their participants are better informed and view their School District much more positively than School District much more positively than non-participants.non-participants.
The impact of Community Education The impact of Community Education programs goes far beyond simply providing programs goes far beyond simply providing opportunities beyond the K-12 educational opportunities beyond the K-12 educational experience – it significantly alters perceptions experience – it significantly alters perceptions about the entire educational enterprise. about the entire educational enterprise.

A Glimpse at the Future ofCommunity Education
What are they saying now? Peter Hutchinson Community Education Staff
What is Community Education?

“Government is Broken” Public is cynical Belief government wants taxes to pay its costs Citizens pay taxes and they want results Government is losing the competition for public
support “Government will win only if it delivers the
results citizens want, at the price they are willing to pay”
Peter Hutchinson, The Public Strategies Group

7 Question Looby SurveyJuly 2004
What is Community Education? Classes, activities, programs, access to
school facilities (13) Meets community & individual needs
(5) Lifestyle of learning Leader, facilitator, change agent Collaboration, coordination, avoid
duplication of services

Community Education is …
Process of coordinating the human, physical, and financial resources of the community, to meet the educational, recreational, social, and cultural needs and interests of people in all age groups

Community Education is …
Process of coordinating the human, physical, and financial resources of the community, to meet the educational, recreational, social, and cultural needs and interests of people in all age groups
Process vs. Programs

Limited Thinking? When you think about CE today, it is
easy to think about its programs
Early childhood, after-school, and adult learning have rich potential
With this in mind, however, when thinking about CE, our immediate thoughts about “program” tend to limit our thinking

Let’s broaden our thinking …
Demographics Local (school system) State Nation
A glance globally What about technology? 21st Century learning
skills?

District 279 Population Trends
80%
100%
120%
140%
160%
180%
200%
220%
1980 1985 1990 1995 2000 2005
Total Pop
66,500 98,500 116,300 130,900
District 279, Total Population

District 279 Population Trends
80%
100%
120%
140%
160%
180%
200%
220%
1980 1985 1990 1995 2000 2005
Total Pop
K-12
15,400 19,300 21,600 21,700
District 279, K-12 Population

Minnesota Population Trends
80%
90%
100%
110%
120%
130%
140%
1980 1985 1990 1995 2000 2005
Total Pop
4.1 M 4.4 M 4.9 M 5.2 M
Minnesota, Total Population
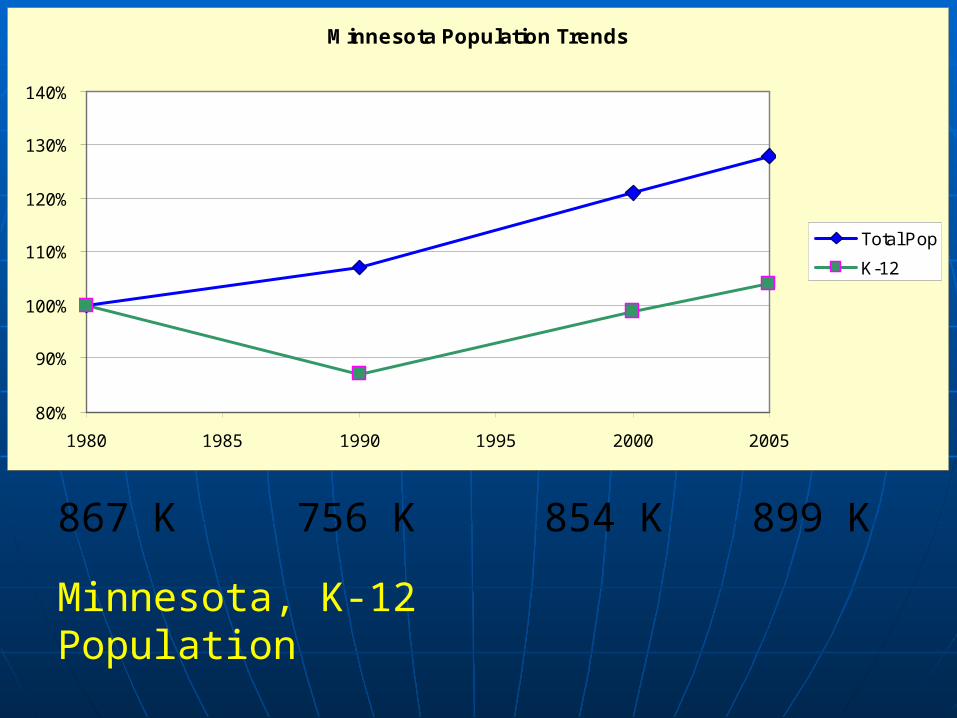
Minnesota Population Trends
80%
90%
100%
110%
120%
130%
140%
1980 1985 1990 1995 2000 2005
Total Pop
K-12
867 K 756 K 854 K 899 K
Minnesota, K-12 Population

US Population Trends
80%
90%
100%
110%
120%
130%
140%
1980 1985 1990 1995 2000 2005
Total Pop
227 M 249 M 281 M 296 M
United States, Total Population

US Population Trends
80%
90%
100%
110%
120%
130%
140%
1980 1985 1990 1995 2000 2005
Total Pop
K-12
46.3 M 46.4 54.2 M 53.1 M
United States, K-12 Population

Demographic TrendsDemographic Trends
Increasing populationIncreasing population Aging population (less children)Aging population (less children) More culturally diverse populationMore culturally diverse population
• Shift from “majority” to “plurality”Shift from “majority” to “plurality”

We are not … but ratherWe are not … but rather … … We are not a school district of 22,000 K-12 students, We are not a school district of 22,000 K-12 students,
but rather a community of 133,000 lifelong learners!but rather a community of 133,000 lifelong learners!
We are not only a state of 900,000 K-12 students, We are not only a state of 900,000 K-12 students, we are a state of 5.2 million lifelong learners!we are a state of 5.2 million lifelong learners!
We are not a nation of 53 million K-12 students, but We are not a nation of 53 million K-12 students, but rather a nation of 300 million lifelong learners!rather a nation of 300 million lifelong learners!
LocalLocal23%23% 17%17%
StateState21%21% 17%17%
NationalNational20%20% 18%18%

Let’s look more globally …
“Did You Know?”
(“Shift Happens”)
Originally created by Karl Fisch and Scott McLeod
for a faculty meeting in 2006 at
Arapahoe High School Centennial, Colorado
www.shifthappens.wikispaces.com

So … What Could Community Ed Look Like?
1. What are your initial reactions to what you just saw?
2. What skills will we need to survive and thrive in this new era?
3. What implications does this have for our current way of doing things?
4. How do we get from here to there?
5. What challenges must we overcome as we move forward?
6. What kind of commitments will we need to make with each other, our students, and our community to move forward?

Thinking Broader … We need to be very mindful, no longer thinking just
about CE, but over-all “Education” initiatives
CE started by identifying and meeting community needs
It’s time to re-examine the importance of “process”
CE needs to play a role in supporting kids (and families) coming to school without social capital, helping to assure child development and student success
…but this is only a part of it!

Realizing Our CE Future … What can we do in the future to:
Help kids be more successful? Customize initiatives in meeting local needs? Meet the needs of unserved or underserved
populations?
How can we: Keep current with trends and needs? Keep the community well positioned? Turn our words into actions?

“From Birth: Whole Child – Whole Community”
NCEA Newsletter Deb Elder, 2007 President’s
Article How about Malachi?

Mortgage Foreclosures
Suburban Hennepin County (Minneapolis)
August 1, 2006 to
January 31, 2008

More from the SurveyJuly 2004
What do you like best about your work?
Love working with people / staff, public, teachers (13)
Developing new programs / variety of work (6) Making a difference in improving people’s lives /
achieve success (5) Work independently / be flexible (2) Knowledgeable and supportive CE team (2) Growth opportunity
Great people can do great things!

CE … What Could it Look Like?
Looking for Opportunities …
Looking for the Right People …
Looking for Potential …
Jason McElwainRochester, New York
Bob Schiefferformer anchor of the Saturday edition of
theCBS Evening News

The right people?
“Everything that can be invented
has been invented.”
Charles H. Duell
Director of U.S. Patent Office
1899

The right people?
“Sensible and responsible women
do not want to vote.”
Grover Cleveland
Former President of the United States
1905

The right people?
Ah yes … change … a beautiful thing
“Who the hell
wants to hear actors talk?”
Harry M. Warner
Warner Bros. Pictures, c.
1927

Community
Education:
Whatcould will
it look like?

It’s time for a sign on your door …

LeadershipBenjamin Zander, ConductorBoston Phil Harmonic Symphony
Leadership is like a “symphony” … “Sounding Together.” The purpose of a conductor (leader) is to enliven and
awaken the possibilities in other people. Think of an orchestra. What makes the beautiful sounds?
… the musicians. Which musician makes no sounds?… the conductor.
The conductor may get the glory with the bows on the stage and the exciting photos on the album covers, but the musicians are the ones who truly shine as they make the music come out, letting it soar. The success is in the sounds of the musicians. How many sounds does the conductor make?
The conductor can’t play the musician’s instrument. Only the musician can play the sweet songs.
Rule #6: Don’t take yourself too seriously!

Maestro …Let’s get to the future!
Ready for some fun?

A thought on Leadership …
If you want to go fast … go alone.If you want to go far … go together!

Better decisions emergewhen diverse perspectives
are intentionally includedin a collaborative process.

WE CAN DO IT … TOGETHER!
WE … the CE Advisory Council(s) WE … the CE staff WE … the school district WE … the school district partners WE … the greater community
We can shape the future or we can let the future happen to us.

Developing your specific plan
of action
Your Strategic Plan

