2008 interim strategic plan towards ... - city of fort collins · recycling — push toward 50%...
TRANSCRIPT

Interim Strategic Plan Towards 2020 Goal
2008
December 2008


Executive Summary . . . . . . . . . . . . . . . . . . . . . . . . . . . . . . . . . . . . . . . . . . . . . . . . . . . . . . . . . . i
Introduction . . . . . . . . . . . . . . . . . . . . . . . . . . . . . . . . . . . . . . . . . . . . . . . . . . . . . . . . . . . . . . . . . . .1Need For Climate Protection . . . . . . . . . . . . . . . . . . . . . . . . . . . . . . . . . . . . . . . . . . . . . . . . . . . . . . . .1Benefits of Climate Protection . . . . . . . . . . . . . . . . . . . . . . . . . . . . . . . . . . . . . . . . . . . . . . . . . . . . . .2Role of Local Governments . . . . . . . . . . . . . . . . . . . . . . . . . . . . . . . . . . . . . . . . . . . . . . . . . . . . . . . . .3Opportunities . . . . . . . . . . . . . . . . . . . . . . . . . . . . . . . . . . . . . . . . . . . . . . . . . . . . . . . . . . . . . . . . . . . . . .4
Fort Collins Evolving Commitment to Greenhouse Gas Reduction . . . . . . . . . . . . . . . . . . . . . . . . . . . . . . . . . . . . . . . . . . . . . .6Original Fort Collins Greenhouse Gas Goal and Plan . . . . . . . . . . . . . . . . . . . . . . . . . . . . . . . . .6Success to Date . . . . . . . . . . . . . . . . . . . . . . . . . . . . . . . . . . . . . . . . . . . . . . . . . . . . . . . . . . . . . . . . . . . .6Reporting and Progress . . . . . . . . . . . . . . . . . . . . . . . . . . . . . . . . . . . . . . . . . . . . . . . . . . . . . . . . . . . .7Climate Task Force . . . . . . . . . . . . . . . . . . . . . . . . . . . . . . . . . . . . . . . . . . . . . . . . . . . . . . . . . . . . . . . . .9New Greenhouse Gas Goals . . . . . . . . . . . . . . . . . . . . . . . . . . . . . . . . . . . . . . . . . . . . . . . . . . . . . . 10Development of Fort Collins Climate Action Plan . . . . . . . . . . . . . . . . . . . . . . . . . . . . . . . . . 11
Fort Collins Greenhouse Gas Inventory and Projections . . . . . . . . . . . . . . . . . . . . . . . . . . . . . . . . . . . . . . . . . . . . . . . . . . . . . . . . . . . . . . 12
Climate Protection Strategies . . . . . . . . . . . . . . . . . . . . . . . . . . . . . . . . . . . . . . . . . . . . 15Support for Multiple Goals . . . . . . . . . . . . . . . . . . . . . . . . . . . . . . . . . . . . . . . . . . . . . . . . . . . . . . . 15Existing Measures . . . . . . . . . . . . . . . . . . . . . . . . . . . . . . . . . . . . . . . . . . . . . . . . . . . . . . . . . . . . . . . . 15New Measures . . . . . . . . . . . . . . . . . . . . . . . . . . . . . . . . . . . . . . . . . . . . . . . . . . . . . . . . . . . . . . . . . . . 16New Qualitative Measures . . . . . . . . . . . . . . . . . . . . . . . . . . . . . . . . . . . . . . . . . . . . . . . . . . . . . . . . 33
Monitoring and Reporting . . . . . . . . . . . . . . . . . . . . . . . . . . . . . . . . . . . . . . . . . . . . . . . . 39Metrics . . . . . . . . . . . . . . . . . . . . . . . . . . . . . . . . . . . . . . . . . . . . . . . . . . . . . . . . . . . . . . . . . . . . . . . . . . 39Annual Report . . . . . . . . . . . . . . . . . . . . . . . . . . . . . . . . . . . . . . . . . . . . . . . . . . . . . . . . . . . . . . . . . . . 39Biennial Review . . . . . . . . . . . . . . . . . . . . . . . . . . . . . . . . . . . . . . . . . . . . . . . . . . . . . . . . . . . . . . . . . . 39
Conclusion . . . . . . . . . . . . . . . . . . . . . . . . . . . . . . . . . . . . . . . . . . . . . . . . . . . . . . . . . . . . . . . . . . . 40
Appendix — City Council Resolution 2008-051 . . . . . . . . . . . . . . . . . . . . . . . 41
Climate Action Plan Outline Table of Contents
AcknowledgementsOur gratitude goes out to members of the 2007/2008 Fort Collins Climate Task Force for their significant contribution to the content of this Plan . Thanks are also due to citizens and Board and Commission members for sharing their insights and suggestions along the way, and to the City Manager and City staff who worked in many capacities to support the process .

Executive Summary
The Challenge Widespread consensus exists that human emissions of greenhouse gases are im-pacting Earth’s climate system, causing the potential for unprecedented large-scale adverse health, social, economic and ecological effects . Coloradoans may not be surprised by predictions such as these because we are already seeing the changes . Observations in recent decades show that Colorado is already experiencing shorter and warmer winters, with thinner snow pack and earlier spring runoff, less precipita-tion overall, longer periods of drought, more wildfires and other ecological effects potentially related to climate change .
Our Responsibility Local communities are vulnerable to the many risks posed by a changing climate . Likewise, cities can make a difference in avoiding climate instability by exercising key powers over land use, transportation, building construction, waste management and energy and water supplies and management . It is fitting for local governments to take responsibility for emissions occurring within their jurisdictions . Local actions not only bring local benefits, they can speed the development of technology-based solutions and promote more rapid market transformation that will help drive reductions in global emission levels .
Fort Collins Greenhouse Gas Emissions About half of Fort Collins’ greenhouse gas emissions come from electricity use, primar-ily to light and cool buildings . The second largest source is emissions from combus-tion of fossil fuels for transportation (30%) . The third largest source is natural gas use, primarily for heating buildings (~20%) and a small portion of emissions result from organic matter decay in the landfill .
Fort Collins 2007 Greenhouse Gas Emissions by Source
i
executive summary
Fort Collins 2007 Greenhouse Emissions Sources by Use Sectors
2.65 Millon Tons CO2 2.65 Millon Tons CO2

ii
executive summary
Fort Collins Greenhouse Reduction Goals and EffortsIn 1999 Fort Collins was among the first wave of communities in the nation to commit to reducing local emissions . City Council adopted a greenhouse gas reduction goal for 2010 and a plan to meet it . Through innovation, leadership and local involvement, the community has benefited significantly from climate protection actions . Thanks to the success of the voluntary Climate Wise program, for example, by 2007, innovative busi-nesses avoided emitting more than 82,000 tons of carbon dioxide equivalent (CO2e), while saving over $12 million since 2000 . As a result of foresight in leadership, Fort Collins established the first renewable energy standard in the state of Colorado . And our participatory community tells us through recent surveys that they not only sup-port but also expect further greening efforts .
In 2008 City Council renewed its commitment to climate protection by adopting Colorado’s statewide goals to reduce emissions .• Reduceemissions20%below2005levelsby2020• Reduceemissions80%below2005levelsby2050
During 2007 and 2008, a dedicated citizen task force worked to recommend actions that will help Fort Collins make progress on climate protection . Their report can be found at: http://fcgov .com/ctf
Fort Collins Greenhouse Reduction Goals
Climate Action Plan This Climate Action Plan offers a well-considered list of strategies that will help Fort Collins advance our progress towards future carbon reduction goals, while affording the community other economic and environmental benefits . The Plan is based largely on the recommendations of the Climate Task Force . It builds upon existing successes and encompasses a range of strategies such as expanding the enormously successful Climate Wise program, increasing residential and business recycling, reducing vehicle miles traveled, providing various incentives for reducing CO2 and increasing energy efficiency . It offers cost-effective strategies that will also support our local economy, reduce risks for energy and fuel price increases and volatility and bring a wide range of other environmental, social and economic benefits . Actions that reduce greenhouse emissions also support other local community goals and contribute to sustaining Fort Collins as a vibrant, world class community .
Business As Usual Forecast
Emissions
Tons
CO
2e

iii
executive summary
New Measures
2012 Estimated Benefit 2020 Estimated Benefit MEasurE NaME (Tons CO2e) (Tons CO2e)
EXISTING MEASURES 104,000 104,000
MENu OF OPTIONs
COMMUNITY LEADERSHIP Expand Climate Wise 73,000 – 94,000 143,000 Government Organizations Set GHG Goals 42,000 217,000 Community-wide Climate Challenge 28,000 34,000 Colorado Carbon Fund 5,000 8,000
Community Leadership sub-total 148,000 – 169,000 402,000
RECYCLING — Push Toward 50% Diversion Goal Ban cardboard from waste stream 46,000 – 58,000 68,000 Private paper/glass drop-off 5,000- 6,000 8,000 Increase residential education 4,000 – 5,000 15,000 Larger residential recycling containers 3,000 – 4,000 5,000 Require haulers to provide residential yard waste collection for added cost 1,000 1,000 Enhance residential PAYT (2nd can costs more) 11,000 – 17,000 21,000 Commercial recycling co-ops 1,000 – 7,000 8,000 Residential yard waste drop-off and ban yard waste 0 – 4,000 5,000 C&D Drop-off 0 – 34,000 39,000 C&D contract preferences for City contracts 1,000 1,000 Commercial recycling fee embedded in rates (Additional benefit above cardboard ban) 81,000
recycling sub-total 73,000 – 137,000 253,000
ENERGY 2008 Energy Policy Efficiency Programs 20,000 – 30,000 214,000 SmartGrid, Advanced Metering Infrastructure, Pricing, Conservation 10,000 – 20,000 246,000 Renewable Energy (Colorado Renewable Portfolio Standard and voluntary programs) 0 190,000 Natural Gas Energy Conservation 5,000 – 10,000 52,000
Energy sub-total 35,000 – 60,000 703,000
GREEN BUILDING Update Residential Building Code 1,000 4,000
Green Building sub-total 1,000 4,000
TRANSPORTATION Reduce Vehicle Miles of Travel 2,000 – 12,000 14,000 Modern Roundabouts 1,000 2,000
Transportation sub-total 3,000 – 13,000 16,000
TOTAL (before double-counting removed) 366,000 – 486,000 1,481,000
TOTAL (after double-counting removed)* 268,000 – 378,000 1,212,000
*Double-counting between measures with overlapping benefits was addressed as follows: •ClimateWise—50%overlapwithothermeasures •Gov.OrgsSetGHGGoals—75%overlap •CommunityClimateChallenge—90%overlap •LocalCarbonOffsetProgram—62%overlap

If fully implemented, the Plan will bring Fort Collins to nearly 80% of the 2012 reduc-tion objective and 90% of the 2020 goal . Annual progress reports and biennial reviews will allow the plan to evolve along with City budget priorities, carbon markets and technology opportunities .
Future Projection reduction Estimated (Business as usual) Goal Needed reductions from Year Tons CO2 Tons CO2 Tons CO2 Climate action Plan
2012 2,951,000 2,466,000 485,000 tons/yr 268,000 – 378,000 in 2012 tons/yr in 2012 2020 3,407,000 2,032,000 1,375,000 tons/yr 1,212,000 in 2020 tons/yr in 2020 2050 Not calculated 508,000 1,524,000/year below 2020 goal level Not estimated
Fort Collins’ 2020 goal allows the opportunity to embrace strategies that have a long-term benefit yet take more time to develop and implement . The Plan also includes measures that have not been quantified but that can play an important role in mak-ing progress towards the 2020 goal . These strategies are listed in the table below and described in this Climate Action plan .
Summary of New Qualitative Measures
Community Engagement• CityofFortCollinsGovernmentLeadership
Transportation• SeekAdequateFundingtoImplementTransportationPlans,
with Funding for Transit as a Priority to Achieve Best Practices • DevelopPartnershipstoReduceVehicleTravel• ParkingManagement
Land Use• ImplementLandUseCodeChangesthat
Support Greenhouse Gas Emissions Reductions• PromoteandPursueInfillandRefillDevelopment• PromoteTransit-OrientedDevelopment• ConsiderRequirementsforNewDevelopmentstoHaveLess
Travel Demand than Comparable Existing Developments
Green Building• RegularUpdatesofBuildingEnergyCodes• ContinuedSupportforAboveCodeGreenbuildingInitiatives• RequireGreenBuildingasaPrerequisiteforPublicFinancing• ExploreNetZeroReadyHomes• ExploreLEEDforNeighborhoods
Urban Forestry• PromoteTreePlanting
Support State and Federal Climate Protection Actions
iv
executive summary

v
executive summary
ConclusionReducing our community’s carbon footprint will be a major challenge . Implementing some of these strategies will not be easy; nor will it be cost free . However, because these strategies are cost-effective, the future payback is expected to be large . It is far more costly to ignore global warming than to take action to avert the worst of its impacts . An increasing number of studies show that, in addition to being less costly overall, taking action to avert global warming can be immediately profitable .
Fortunately, Fort Collins abounds with innovators and technical expertise that can be harnessed to help address this challenge . Organizations leading sustainability efforts locally include Poudre School District, Colorado State University and the wide array of Climate Wise partners who have publicly committed to voluntarily reduce their orga-nization’s greenhouse gas emissions . The groundbreaking work of the Clean Energy ClusterandthevisionofFortZEDpositionFortCollinswellforsuccessinreducingemissions while maintaining a robust economy .
The benefits to our community from increased efforts to reduce carbon emissions will be significant . Not only will our CO2 footprint be reduced, but the City will introduce leading edge practices and technologies that will save consumers and businesses money, create new business opportunities and cement Fort Collins’ reputation and reality as a high performing, vibrant and attractive place to live and conduct business .

1
introduction
Introduction
Need For Climate Protection Widespread consensus exists that human emissions of greenhouse gases (GHG) are impacting Earth’s climate system, causing the potential for unprecedented large-scale adverse health, social, economic and ecological effects . In the past two decades, the science connecting global warming to human augmentation of the greenhouse effect has progressed dramatically . Many changes that had been predicted are now occur-ring, and the observed pattern of change points to the enhanced greenhouse effect . Climate disruption is likely to cause, and may already be causing, damage to the en-vironmental and economic health of Colorado communities, introducing risks associ-ated with reduced snow pack and earlier snowmelt that could affect both water supply and tourism and secondary impacts such as changes in agriculture economics .
Two summary reports of the International Panel on Climate Change (IPCC) released in 2007 find that global warming is real and will have significant impacts . Approximately 600 authors from 40 countries produced the IPCC reports . Over 620 expert reviewers and a large number of government reviewers also participated . Representatives from 113 governments reviewed and revised the summaries before adopting them .
In February 2007 Working Group I of the IPCC released a summary for policy makers on the science of climate change . They concluded that:• Warmingoftheclimatesystemisunequivocal.• Mostofthewarmingthatourclimatesystemhasexperiencedinthelast50years
is very likely (meaning over 90% likely) due to human caused greenhouse gas emissions .
• Itisverylikely(meaningover90%likely)thatheatextremes,heatwavesandheavyprecipitation will become more frequent .
In April 2007 Working Group II of the IPCC released a summary of expected global warming impacts . Their conclusions about impacts in North America include:• TensofmillionsofAmericansarelikelytobeexposedtogreaterriskforinjury,dis-
ease and mortality due to higher pollution levels, more frequent and more intense heat waves, more intense storms and more favorable conditions for the spread of water and insect-borne diseases, in the absence of effective counter-measures .
• Westernregionsarealreadyfacingincreasedwaterscarcityandareexpectedtoexperience inadequate water supplies and reliability losses as snow pack diminishes and evaporation increases .
• NorthAmericanforestsfaceescalatingdestructionfromincreasingoutbreaksofwildfire, insect infestation and disease .
• Between15%and40%ofNorthAmericanplantandanimalspeciesarelikelytobecome extinct by 2050 .
Coloradoans may not be surprised by predictions such as these . Observations in recent decades show that Colorado is already seeing the following:• Shorterandwarmerwinters,withthinnersnowpackandearlierspringrunoff.• Lessprecipitationoverall,andmorefallingasrainthansnow.• Longerperiodsofdrought.• Morewildfires,burningtwiceasmanyacreseachyearthanbefore1980.• RapidspreadofWestNileVirusduetohighersummertemperatures.

2
introduction
The European Union considers that a temperature rise of 2 degrees Celsius (3 .6° Fahrenheit) over pre-industrial times is the threshold for “dangerous change” that must be avoided . The Center for International Climate and Environmental Research in Oslo found that, in order to have a 50% chance of avoiding this 2 degree Celsius threshold, we would have to reduce global emissions of greenhouse gases 80% by the year 2050, at the latest .
The cost of inaction may exceed the cost of taking action by an order of magnitude . Sir Nicholas Stern, head of the UK Government Economic Service and former Chief Economist of the World Bank, stated in October 2006:
There is still time to avoid the worst impacts of climate change, if we take action now… If we don’t act, the overall costs and risks of climate change will be equivalent to losing at least5%ofglobalGDPperyear,nowandforever.Ifawiderrangeofrisksandimpactsistakenintoaccount,theestimatesofdamagecouldriseto20%ofGDPormore… Incontrast,thecostofaction—reducinggreenhousegasemissionstoavoidtheworstimpactsofclimatechange—canbelimitedtoaround1%ofGDPperyear.
The evidence of climate change is overwhelming and undeniable . The vast majority of scientists agree that global warming is real, it’s already happening and that it is the result of human activities and not a natural occurrence . We are already seeing changes . It is far more costly to ignore global warming than to take action to avert the worst of its impacts .
Benefits of Climate ProtectionAn increasing number of studies show that, in addition to being less costly overall, taking action to avert global warming can be immediately profitable .
Nations and corporations that take action to reduce greenhouse gases end up sav-ing money . David Northrop, director of Sustainable Development for the Rockefeller Brothers Fund, reported in July 2006, “Every company and city taking action to reduce greenhouse gas emissions has saved money doing so .” Examples include:
Table 1 — Example Economic Benefits
Greenhouse Entity Gas Reductions Economic Benefits
DuPont 72% since 1990 $2 Billion Savings
Alcoa 26% since 1990 $100 Million Savings through 2006
British Petroleum 10% below 1990 $650 Million Net Present Value Savings
IBM 38% $791 Million
Germany 19% since 1990 450,000 New Jobs in Renewable Energy
Urban regions can thrive while also reducing greenhouse gases, as demonstrated by Portland/Multnomah County . While net greenhouse gas emissions in Multnomah County are about at 1990 levels, and per capita CO2 emissions have dropped over 12%, the inflation-adjusted payroll has increased 29% and employment has increased about 12% .

3
introduction
Finally, to demonstrate local benefits we need look no further than Fort Collins’ own Climate Wise program . In 2007 Climate Wise reported a cumulative cost savings of over $12 million from projects completed by partners through 2007, the same year the partners collectively reduced over 82,000 tons of carbon dioxide equivalent (CO2e) .
The Fort Collins community could realize tremendous ancillary economic, envi-ronmental and social benefits by undertaking responsible steps to combat climate change, including:• Supportlocalbusinessesandstimulateeconomicdevelopment.• Provideeconomicstimulationofresearchanddevelopmentactivities.• Reducehomeandbusinessenergycostsforheating,coolingandlighting.• Reducehomeandbusinessmotorvehiclefuelcosts.• Reducedependenceonforeignfuelsources.• Reducevulnerabilitytoenergypriceincreasesandvolatility.• Reducepeakenergydemandandimproveutilizationoftheelectricitysystem.• Diversifyenergysupplyandreduceloadsontransmissionsystem.• Reduceairpollutionemissionsincludingozoneprecursorsandfineparticles.• Improvepublichealth.• Improvelocalvisibility.• Reducewasteandincreaselandfilldiversionrates.• Reducevehiclemilesoftravelandroadcongestion.• Reducewaterconsumptioninthecommunity.• IncreaseFortCollins’abilitytoadapttoachangingclimate.• Provideopportunitiesforregional,stateandnationalleadershipandrecognition.
Local governments have strong financial incentives to address climate change . Reducing local carbon emissions means pursuing a variety of programs and practices that are energy prudent, and thus ultimately fiscally responsible .
Role of Local GovernmentsLocal governments can greatly influence their communities’ greenhouse gas emissions by exercising key powers over land use, transportation, building construction, waste management and, in many cases, energy and water supplies and management .
Cities can make a difference in avoiding climate instability . The U .S . is among the larg-est emitters of human-caused greenhouse gas emissions . Across the country, more and more local governments are committing to reduce emissions and developing plans to achieve their pledges . Over 160 cities and counties, including Fort Collins, have joined the Cities for Climate Protection Campaign of the International Council for Local Environmental Initiatives (ICLEI) . These cities represent about 20% of the U .S . population, have reduced 23 million tons CO2 annually and have eliminated over 43,000 tons of local air pollutants .
As of June 2008, 850 mayors across the country signed the Seattle “Mayor’s Agreement,” pledging their community to:• StrivetomeetorbeattheKyotoProtocoltargetsintheirowncommunities,through
actions ranging from anti-sprawl land-use policies to urban forest restoration proj-ects and public information campaigns;
• Urgetheirstategovernmentsandfederalgovernmenttoenactpoliciesandprogramsto meet or beat the greenhouse gas emission reduction target suggested for the United States in the Kyoto Protocol — 7% reduction from 1990 levels by 2012; and,

4
introduction
• UrgetheU.S.Congresstopassbipartisangreenhousegasreductionlegislation,which would also establish a national emissions trading system .
It is appropriate for Fort Collins to reduce greenhouse gas emissions even if some neighboring communities do not . City Council in 1999 adopted the policy that “The city shall proactively identify and implement actions that reduce Fort Collins’ contribu-tion to total global greenhouse gas emissions .” Numerous benefits accrue from climate protection activities including pollution reduction, human heath benefits, cost savings, economic development, reduced vulnerability to peak oil, reduced dependence on foreign oil, increased opportunity to attract grant funding and leadership . Collectively, climate protection activities will enhance the sustainability of our community .
It is equally appropriate for local governments to take responsibility for their emis-sions, even if they are overshadowed by rapidly increasing emissions elsewhere in the world . Despite this size disparity, it should be recognized that the U .S . still leads the world in per capita greenhouse gas emissions . By acting to reduce emissions, Fort Collins joins other communities in sending a signal that will speed the development of technology-based solutions and more rapidly promote the transformations needed to drive change in global emission levels .
Cities need not wait for state or national programs to begin . It may take a few to sev-eral years before carbon emission legislation, programs and regulations are developed . The sooner local communities begin to take action, the sooner they will reap the benefits .
These are some examples of Colorado cities taking action:• Denverhascommittedtoreducepercapitagreenhousegasemissions10%below
1990 levels by 2011 in their Greenprint plan . • Boulderrecentlypassedacarbontaxthatwillenabletheircommunitytoreduce
emissions 7% below 1990 levels by 2012 through home energy efficiency, switching to renewable energy and alternative fuels and reducing vehicle miles of travel .
• Recognizingspecialvulnerabilitytodisruptionsinwatersupplyfromclimatechange, Aspen launched the Canary Initiative in 2005 to reduce global warming pol-lution, inform the public about impacts and solutions and advocate for actions at all levels of government .
• Carbondalehascommittedtoreducegreenhousegasemissions25%below2004levels by 2012, and voters passed a $1 .8 million Clean Energy Bond to fund a town-owned renewable energy facility .
• Telluridehascommittedtodecreaseemissionsfrom2004levelsbynolessthan15%by December 2010, and by no less than another 15% of 2004 levels by December 2015 .
OpportunitiesThe Fort Collins community offers a unique combination of innovation and technical expertise that can be leveraged to develop long-term sustainable solutions and facili-tate action by community sectors and organizations to reduce emissions .
Market opportunities and technologies are evolving rapidly to support carbon reduc-tion activities . Technology-based advancements are occurring in the areas of biofu-els, including algae-based biofuels; electricity grid distribution improvements; and bio-refineries that integrate biomass conversion processes and equipment to produce fuels, power and chemicals from biomass . A dramatic increase in cleaner and more efficient energy technology and sources has occurred in recent years . New industries and programs bring with them strong economic growth opportunities .

5
introduction
Northern Colorado has become a leader in many aspects of clean energy technology development and application . The Northern Colorado Clean Energy cluster, a public/private sector partnership, aims to provide “clean” energy by using renewable energy (e .g ., solar and wind), efficient energy technology, green building and energy utiliza-tion . Sixty businesses in the cluster employ more than 450 people locally . Colorado State University is recognized internationally for pioneering clean and renewable energytechnologies.Additionally,FortZED,azero-energydistrictinthehistoricdown-town, will begin to model what policy makers and scientists deem to be the living situation of the future: balanced energy use and renewable energy sourcing . Action on climate change supports the local economy by increasing demand for the services and products that companies in the Clean Energy Cluster provide .
Markets are being created to make greenhouse gas reduction economically efficient . Carbon markets are thriving in Europe, and although the U .S . does not have a national carbon registry and trading policy, voluntary markets are emerging here as well . Examples include the Regional Greenhouse Gas Initiative (RGGI), a greenhouse gas cap-and-trade system being developed by seven northeast states; California’s cap-and-trade system to meet its strict greenhouse gas emission targets; and the Chicago Climate Exchange (CCX), a voluntary mechanism for trading carbon; and the Colorado Carbon Fund, a voluntary carbon offset program .
In light of all these financial and business development initiatives, the Fort Collins com-munity has the opportunity to create a thriving future based on practical energy use .

Fort Collins Evolving Commitment to Greenhouse Gas Reduction
Original Greenhouse Gas Goal and PlanIn 1997 the City of Fort Collins joined ICLEI’s Cities for Climate Protection (CCP) Campaign . In doing so, Fort Collins committed to: • Developa1990baselinegreenhousegasinventoryandforecastfor2010.• Setagreenhousegasreductiongoal.• Developaplantomeetthegoal.
The community-wide 1990 emissions inventory showed emissions at 1 .36 million tons of CO2e, which includes both carbon dioxide and methane emissions . The majority of emis-sions were produced by electricity use . The 2010 forecast was developed by applying a business as usual projection from 1997 out to the year 2010 . This included a 7% annual increase in vehicle miles traveled, causing the transportation sector to increase signifi-cantly . The original 2010 forecast, often referred to as the worst case forecast, shows a 160% increase in emissions above 1990 levels . Figure 1 illustrates the 1990 emissions inventory and the 2010 forecast prepared in 1998 .
Figure 1 — Fort Collins Original Emission Inventory, Forecast and Goal (1999)
Following completion of the emissions inventory and forecast, a Staff Technical Team and a Citizen Advisory Committee met for over a year to identify and recommend a prioritized list of cost-effective actions to reduce local greenhouse gas emissions . In 1999 City Council adopted Resolution 99-137, setting a goal to “Reduce (community-wide) greenhouse gas emissions 30% below predicted 2010 levels by 2010.” The 1999 FortCollinsLocalActionPlantoReduceGreenhouseGasEmissions(LAP) was also adopted by Council Resolution 99-137 . The plan outlined how to accomplish that goal and called for biennial progress reporting .
Success to Date Benefits to the City from implementing the 1999 LAP have been wide-ranging and include air pollution reduction, reduced waste disposal in the landfill, increased
6
Fort collins evolving commitment to greenhouse gas reduction
Mill
ion
Tons
CO
2e

7
Fort collins evolving commitment to
greenhouse gas reduction
support for local businesses and the economy and generally improved quality of life . The highlights from several specific measures identified in the 1999 LAP that have now been implemented are discussed below .
Conversion of Traffic Signals to Energy Efficient Light-Emitting Diodes This action was ranked the highest priority for implementation in the LAP . The conver-sion of red and green signals to LEDs in 2001 saves over $110,000/year in electricity and maintenance costs, with an initial capital cost of $370,000, for a 3+ year payback .
Climate Wise Business OutreachThe Fort Collins Climate Wise program, a voluntary business outreach program, was initiated in 2000 and has been growing ever since . As of 2007, the 75 partners col-lectively avoided over 82,000 tons CO2e in that year alone, and reported over $12 .5 million in cumulative cost savings since 2001 . The program has now grown to over 115 partners, and the greenhouse gas reduction and cost savings are increasing as well .
2004 Update to Residential Building Code The 2004 energy code update for Fort Collins’ residential buildings requires energy efficiency improvements (R-18 walls, low-e windows, more effective furnaces, duct work, right-sized AC systems) . These upgrades will save homeowners $90 - $150 a year per home in utility costs and will avoid 1 .2-1 .5 tons CO2e per home per year .
Wind Energy ProgramFort Collins Utilities has offered renewable energy to customers through the wind pro-gram since 1998 . The wind program went through a rebranding in 2007 to the Green Energy program . By 2007, there were over 1,700 residential and over 110 commercial subscribers, purchasing over 35,000 megawatt-hours of renewable energy .
Electric Energy Supply PolicyIn addition to measures included in the 1999 LAP, the passage of the Fort Collins Electric Energy Supply Policy in 2003 has led to significant greenhouse gas reductions . The targets of the supply policy are: • Reducepercapitaelectricconsumption10%from2002levelsby2012.• Reducepercapitapeakdemand15%.• Achieve15%renewableenergyby2017.
A 2% fee on utility bills funds the energy efficiency and renewable energy programs . The Policy has supported a rapid expansion of energy efficiency programs and the addition of renewable energy to the rate-based electricity sources .
Addition of a Centralized Recycling Drop-Off SiteA City recycling drop-off facility opened at Rivendell School in March 2002 . Approxi-mately 1,400 tons of materials are recycled annually . This results in approximately 1,800 tons CO2e avoided and provides added convenience to citizens for recycling .
Reporting & Progress Council Resolution 99-137 which established the original greenhouse gas goal also called for a biennial report to track progress and identify additional greenhouse gas-reducing activities that merit consideration, in recognition of changing scenarios and advances in technology . Several biennial climate status reports have been completed and are posted at: http://fcgov .com/climateprotection/policy .php

8
Table 2 shows that the quantified tons of avoided CO2e have grown steadily since 2000 . However, Figure 2 shows that the reductions have not been able to keep pace with emissions growth, and net emissions have continued to grow .
Table 2 — Biennial Climate Protection Status Reports
report Tons CO2 avoided in Year % reduction
2000 Climate 190,000 tons CO2e 9% Protection Status Report avoided in 2000
2001/2002 Climate 237,000 tons CO2e 10% Protection Status Report avoided in 2001
2003/2004 Climate 241,000 tons CO2e 9% Protection Status Report avoided in 2004
2005/2006 Climate 244,000 tons CO2e 9% Protection Status Report avoided in 2006
Figure 2 — Fort Collins Greenhouse Gas Emissions
Following the completion of the 2005 emissions inventory, it became apparent that Fort Collins was not on track to meet the 2010 goal, as 2005 emissions exceeded the 2010 goal threshold . One of the reasons Fort Collins is not on track to meet the 2010 goal is that the 1999 LAP included a few large strategies that were directly within local control (Denver Commuter Rail, More Stringent Vehicle Fuel Efficiency Standards and Landfill Methane Capture), and one strategy was not met (VMT Growth Rate Not Exceed Population Growth Rate) . Together, these four strategies represented over 50% of the total reduction strategies contained in the original LAP . Additionally, the original LAP did not establish interim milestones by which to assess progress on the 2010 goal .
Fort collins evolving commitment to greenhouse gas reduction
Mill
ion
Tons
CO
2e

9
While early biennial climate status reports identified strategies for implementation in the next budget cycle, projections of these strategies to 2010 were not done . Some of the additional strategies were only partially implemented or were not implemented . Consequently, Fort Collins could not meet the 2010 goal, despite successful implemen-tation of a number of measures .
Climate Task Force When it became apparent that Fort Collins was not on track to meet its 2010 emissions target, a local community group, the Fort Collins Sustainability Group, approached City Council in the Fall of 2006, asking that efforts be undertaken by the City to update the Plan . In March 2007 Fort Collins City Council passed Resolution 2007-015, approving the formation of a task force to address the issue . (See Appendix X for Resolution 2007-015 .)
The Climate Task Force (CTF) was convened in May 2007, consisting of 12 members representing key community organizations and stakeholders in local climate protec-tion efforts .
CTF FindingsThrough its investigation into climate protection in Fort Collins, the CTF made the following findings:
• TheFortCollinscommunityhasdemonstrateditsleadershipontheissueofclimateprotection and should continue to act from a position of leadership and focused in-tent so as to inspire other communities across the region, state and globe to likewise step up to share in the solution .
• Thecommunitywillrealizetremendousancillaryeconomic,environmentaland social benefits when taking responsible steps to combat climate change . Accord-ingly the goal and plan should actively pursue and manage these benefits including but not limited to economic vitality, community cohesion, societal and individual health, improved air quality and state and national recognition .
• TheCityofFortCollinsgovernmentshouldplayaspecialroleinenergizingthecom-munity by first leading by example in greening its own operations, then by establish-ing policy directions that will lead the community to a sustainable future, and most importantly by inspiring community involvement .
• FortCollinsisfortunatetohaveanumberoforganizationsleadingsustainabilityef-forts including Poudre School District, Colorado State University and the wide array of Climate Wise partners that have publicly committed to voluntarily reduce their organizations’ greenhouse gas emissions . For perspective, the Climate Wise program represents the city’s top employers (representing more than 20,000 employees) and the city’s top energy users (representing approximately one third of Fort Collins Utilities’ total annual electricity delivered) . Collaborating and sharing experiences with other leaders in the community and region will be integral to achieving success .
• Basedonscientificevidence,forecastsandmodelsunderdifferentscenariosof action, the CTF believes that the local goal should target an 80% or greater reduc-tion in our greenhouse gas emissions inventory by mid-century in order for Fort Collins to perform at a level consistent with global requirements for reversing the effects of climate change .
• Intheend,wemustcometogetherasacommunity,astate,anationandaglobetodedicate ourselves to the serious task of addressing climate change while not losing sight of the fact that we can make a difference and leave the world a better place for future generations .
Fort collins evolving commitment to
greenhouse gas reduction

10
CTF ProcessThe CTF met 17 times between May 2007 and May 2008, working primarily to develop strategies to meet the 2010 goal . During this process, citizen input was gathered from several City advisory boards, two public open houses were held, and input was received via a Web comment form . In February 2008 a preliminary list of strategies was presented at a City Council work session, along with estimated costs and benefits . At that time, Council decided to revisit the appropriateness of the 2010 goal . Based in part upon recommendations from the CTF, the City Council adopted new community-wide carbon reduction goals in May 2008 . These goals are discussed below .
The CTF revisited its recommendations in light of the new goals . The CTF final recom-mendations address how a 2012 milestone could be met and how significant progress towards the 2020 goal could be achieved . The CTF final recommendations were pre-sented to the City Manager in June 2008 . The full report of the CTF recommendations can be found at: http://fcgov .com/ctf
New Greenhouse Gas GoalsIn May 2008 Fort Collins City Council set visionary new community-wide greenhouse gas goals for 2020 and 2050 that align with goals for the State of Colorado:• ReduceGHGemissions20%below2005levelsby2020• ReduceGHGemissions80%below2005levelby2050
Council also expressed interest in continuing short-term progress and stated the intent to reduce 2012 emissions to 2 .466 million tons of CO2e (comparable to the original 2010 goal) .
Figure 3 below illustrates these goals .
Figure 3 — Fort Collins Greenhouse Reduction Goals
Achieving the 2020 goal will mean reducing community emissions to 2 .032 million tons of CO2e, a 40% drop below predicted 2020 business as usual levels . This 40% drop equates to 1 .375 million tons of CO2e reduction that are needed by the year 2020, campared to business as usual levels, to achieve the goal . In order to meet the 2012 reduction intent, 485,000 tons of CO2 per year will be needed by 2012, compared to predicted business as usual emission of that year .
Fort collins evolving commitment to greenhouse gas reduction
Tons
CO
2e
Business As Usual Forecast
Emissions

11
Development of Fort Collins Climate Action PlanFollowing completion of the CTF recommendations, City staff evaluated the strate-gies, updated the assumptions and made adjustments, where necessary . This Climate Action Plan presents a list of strategies that current and future City Councils can select in order to continue making progress towards the 2020 goal . These flexible, innovative strategies will benefit Fort Collins’ citizens and businesses in many ways, now and into the future, regardless of changes in carbon regulation or advancements in technology .
Fort collins evolving commitment to
greenhouse gas reduction

Fort Collins Greenhouse Gas Inventory and Projections
An important first step in developing a plan to reduce greenhouse gas emissions is to understand current sources and estimate future emissions . Understanding emissions sources can help guide the selection of reduction strategies . This inventory reflects the two most common human-caused greenhouse gases; carbon dioxide and methane .
Fort Collins’ inventory looks at total gross emissions; it does not subtract carbon sequestration by vegetation or soils . It considers consumption-based emissions within the energy sector by evaluating community usage of electricity and natural gas . The emissions inventory does not factor in the energy needed to manufacture materi-als, products and food that is transported into and used in Fort Collins . The inventory methodology follows currently generally accepted principles and guidelines estab-lished by ICLEI and represented in the Clean Air Climate Protection Software . As inven-tory methodologies evolve, Fort Collins will continue to evaluate and, when appropri-ate, update its inventory methods .
In 2007 Fort Collins generated approximately 2,653,000 tons of carbon dioxide equiva-lent (CO2e)1 . The largest source is electricity consumption, followed by the transpor-tation sector and then natural gas consumption . Below, Figures 4 and 5 show 2007 emissions by emissions source and user category .
Figure 4 — Fort Collins 2007 Greenhouse Gas Emissions by Source
Emissions in Fort Collins have grown by 94% since 1990, when community-wide emis-sions were 1,366,000 tons CO2e . Figures 6 and 7 compare 1990 and 2007 greenhouse gas emissions by source . The electricity sector contribution grew from 42% in 1990 to 48% in 2007, while the natural gas percentage dropped from 25 % to 19% of citywide GHG emissions for the same period . The relative increase in electricity generation’s contribu-tion to emissions can be attributed to reduced availability of federal hydroelectric power to Platte River Power Authority, increased use of electronics in homes and a dramatic increase in the use of residential air conditioning . The transportation sector decreased slightly in relative contribution of total GHG emissions from 1990 to 2007 .
1CO2e =Carbondioxideequivalent.Sincemethaneisatleast21timesmorepotentagreenhousegasthancarbondioxide,therelativeglobalwarmingpotentialofCO2=1andofmethane=21.Whenmethaneandcarbondioxideemissionsaresummed,theyarereferredtoasCO2e, indicating methane hasbeenconvertedtoCO2equivalent.
12
Fort collins greenhouse gas inventory and Projections
Figure 5 — Fort Collins 2007 Greenhouse Emissions Sources by Use Sectors
2.65 Millon Tons CO2 2.65 Millon Tons CO2

13
Figure 6 — Fort Collins 1990 Emissions
Figure 8 — Fort Collins Greenhouse Gas Emissions and Projections to 2020
Fort collins greenhouse gas inventory
and Projections
Figure 7 — Fort Collins 2007 Emissions
1.366 Millon Tons CO2 2.65 Millon Tons CO2
Natural Gas18%
Tons
CO
2e
14
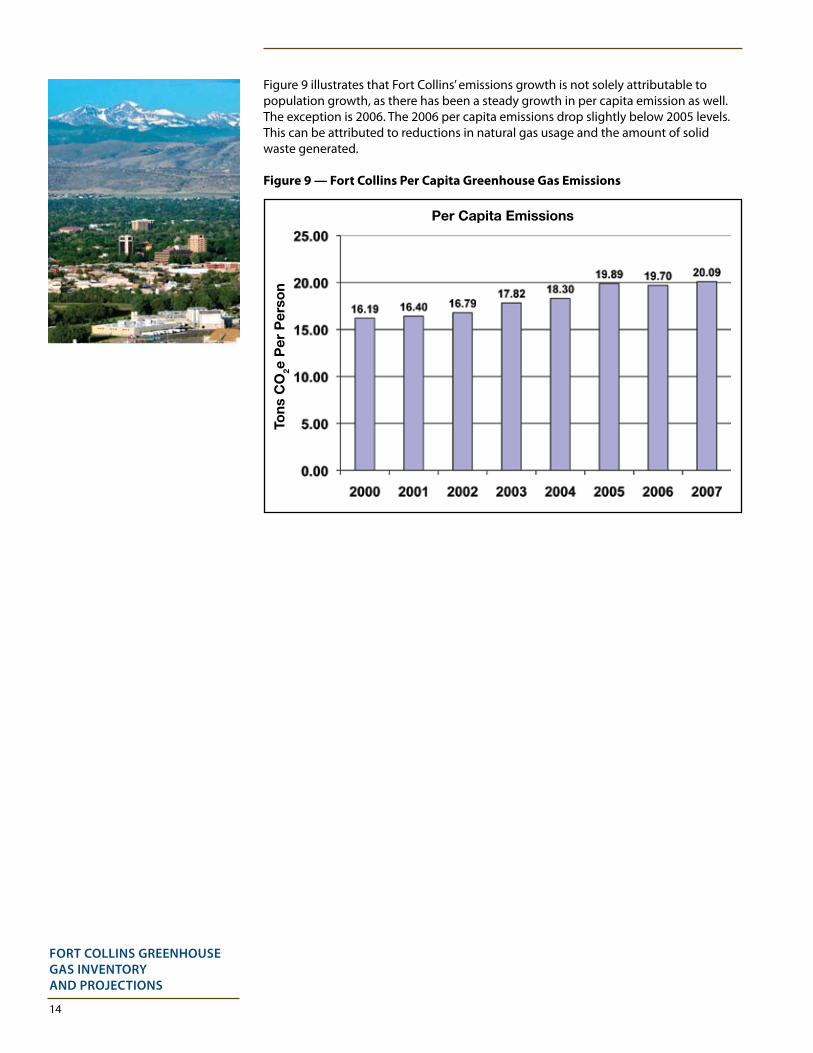
Figure 9 illustrates that Fort Collins’ emissions growth is not solely attributable to population growth, as there has been a steady growth in per capita emission as well . The exception is 2006 . The 2006 per capita emissions drop slightly below 2005 levels . This can be attributed to reductions in natural gas usage and the amount of solid waste generated .
Figure 9 — Fort Collins Per Capita Greenhouse Gas Emissions
Fort collins greenhouse gas inventory and Projections
Tons
CO
2e P
er P
erso
n
Per Capita Emissions

15
Climate Protection Strategies
Support for Multiple GoalsThe majority of actions that reduce emissions also support other local community goals and contribute to sustaining Fort Collins as a vibrant, world class community . In fact, many existing actions that benefit the climate were initiated to meet other prior-ity goals, such as supporting the economy, reducing environmental impacts, exercis-ing fiscal responsibility and increasing mobility . However, carbon reduction adds one more important reason for implementing these strategies . See Figure 10 .
Figure 10 — Fort Collins: A Vibrant, World Class Community
Existing MeasuresEfforts to identify new emissions reduction strategies should start with an analysis of existing actions to reduce emissions . Fort Collins has been working to reduce its green-house gas emissions since 1999, when the original reduction goal was adopted . This Plan recognizes the role that existing efforts, if continued, will have on reducing future emissions . It considers only the benefit of these actions above 2007 levels, as projected out to the year 2012 under current plans and anticipated growth rates .
climate Protection strategies
Fort Collins: A Vibrant, World Class Community
EconomicHealth
(More green jobs)
QualityNeighborhoods
(Efficient neighborhood design)
EnvironmentalHealth
• Climate• Energy• WaterPolicy• WasteReduction• NaturalAreas
SafeCommunity
(Roundabouts)
High-PerformingGovernment
(Energy efficient facilities & fleets)
Cultural(Local food)
ImproveTransportation
(Improved mobility)
SUSTAINABILITY(Includes climate protection)

16
Table 3 — 2012 Anticipated Benefits of Existing Actions
Estimated Tons CO2e reduced Measure Name in 2012 above 2007 Levels
Energy Efficiency Programs 40,000
Climate Wise Program 37,000
Single Stream Recycling 14,000
Business and Residential Recycling 7,000
Electronics Waste Ban 6,000
State-mandated Natural Gas Efficiency Programs (HB1037) 5,000
2005 Residential Energy Code 4,000
FortZEDJumpstart 3,000
PSD Greenhouse Gas Goal 2,000
Commercial Energy Code 1,000
Mason Corridor 400
VAN GO 300
Test Ride Transit and FC Bikes 100
TOTAL (After double-counting removed)* 104,000
*50%ofClimateWiseprogrambenefitisassumedtooverlapwith otherexistingmeasurebenefits.
New MeasuresThe strategies listed in Table 4 are identified to help Fort Collins achieve progress towards the 2020 reduction goal . If fully implemented, the existing and new measures combined sum up to 1,212,000 tons of CO2e avoided in the year 2020, or approximately 90% of the reductions needed to meet the 2020 goal . The strategies listed would lead Fort Collins to achieve between 55-80% of the 2012 stated reduc-tion intent . Through the biennial review process, the list of strategies can be updated to incorporate changes in the carbon market and technology opportunities, as well as citizen support for climate protection and City budget priorities .
Many of the strategies presented will require significant decisions about City budget priorities and trade-offs between community costs and benefits . However, the list of strategies proposed here is sound and will move Fort Collins towards its carbon reduc-tion goals .
climate Protection strategies

17
Table 4 — New Measures
2012 Estimated Benefit 2020 Estimated Benefit MEasurE NaME (Tons CO2e) (Tons CO2e)
EXISTING MEASURES 104,000 104,000
MENu OF OPTIONs
COMMUNITY LEADERSHIP Expand Climate Wise 73,000 – 94,000 143,000 Government Organizations Set GHG Goals 42,000 217,000 Community-wide Climate Challenge 28,000 34,000 Colorado Carbon Fund 5,000 8,000
Community Leadership sub-total 148,000 – 169,000 402,000
RECYCLING — Push Toward 50% Diversion Goal Ban cardboard from waste stream 46,000 – 58,000 68,000 Private paper/glass drop-off 5,000- 6,000 8,000 Increase residential education 4,000 – 5,000 15,000 Larger residential recycling containers 3,000 – 4,000 5,000 Require haulers to provide residential yard waste collection for added cost 1,000 1,000 Enhance residential PAYT (2nd can costs more) 11,000 – 17,000 21,000 Commercial recycling co-ops 1,000 – 7,000 8,000 Residential yard waste drop-off and ban yard waste 0 – 4,000 5,000 C&D Drop-off 0 – 34,000 39,000 C&D contract preferences for City contracts 1,000 1,000 Commercial recycling fee embedded in rates (Additional benefit above cardboard ban) 81,000
recycling sub-total 73,000 – 137,000 253,000
ENERGY 2008 Energy Policy Efficiency Programs 20,000 – 30,000 214,000 SmartGrid, Advanced Metering Infrastructure, Pricing, Conservation 10,000 – 20,000 246,000 Renewable Energy (Colorado Renewable Portfolio Standard and voluntary programs) 0 190,000 Natural Gas Energy Conservation 5,000 – 10,000 52,000
Energy sub-total 35,000 – 60,000 703,000
GREEN BUILDING Update Residential Building Code 1,000 4,000
Green Building sub-total 1,000 4,000
TRANSPORTATION Reduce Vehicle Miles of Travel 2,000 – 12,000 14,000 Modern Roundabouts 1,000 2,000
Transportation sub-total 3,000 – 13,000 16,000
TOTAL (before double-counting removed) 366,000 – 486,000 1,481,000
TOTAL (after double-counting removed)* 268,000 – 378,000 1,212,000
*Double-counting between measures with overlapping benefits was addressed as follows: •ClimateWise—50%overlapwithothermeasures •Gov.OrgsSetGHGGoals—75%overlap •CommunityClimateChallenge—90%overlap •LocalCarbonOffsetProgram—62%overlap
climate Protection strategies
The quantified, “short-term” measures are discussed in more detail on the following pages.

18
MEasurEExpand Climate Wise
Supporting City Polices: Resolution07-051—The Fort Collins community offers a unique combination of in-novation and technical expertise that can be utilized to develop long-term sustainable solutions and facilitate all sectors and organizations in Fort Collins to take action to reduce emissions .
BudgetingforOutcomesEconomicHealthResult— Support Fort Collins having a healthy economy that reflects the values of our community in a changing world .
BudgetingforOutcomesEnvironmentalHealth—Seek reductions in greenhouse gas emissions that puts the City on track to meet the…policy objectives .
CityPlanPolicyENV1-13.Innovations—The City will consider adoption of successful air quality improvement strategies in effect elsewhere, including municipal practices, public information campaigns, incentive/promotion programs and regulations .
Measure Description: Climate Wise is a successful voluntary business outreach pro-gram . It offers technical assistance and recognition to partners who reduce their emis-sions and report progress . This measure proposes to increase Climate Wise program savings from 82,000 tons CO2e avoided in 2007 to 200,000+ tons in 2010 by adding 130 new partners above 2007 levels and providing additional resources to assist exist-ing partners implement and report more projects . This measure adds new personnel and resources to provide direct hands-on assistance for partners . As more partners and resources are added, the efficiency of the program will increase even further, due to economies of scale .
Other Benefits:• Supportlocalbusinessesandstimulateeconomicdevelopment• Improveemployeeattractionandretention• Increasepartnercustomerloyalty• Providepeernetworkingopportunities• Reducebusinessenergycostsforheating,coolingandlighting• Reducebusinessmotorvehiclefuelcosts• Specifically,ClimateWisepartnershavesavedover$12Mcumulativelysince2000• Reducepartnervulnerabilitytoenergypriceincreasesandvolatility• Reducepeakenergydemandandimproveutilizationoftheelectricitysystem• Reduceairpollutionemissionsincludingozoneprecursorsandfineparticles• Improvepublichealth• Improvelocalvisibility• Reducewasteandincreaselandfilldiversionrates• Reducevehiclemilesoftraveledandroadcongestion• Reducewaterconsumptioninthecommunity• Provideopportunitiesforregional,stateandnationalleadershipandrecognition Relationship to Other Programs: The Colorado Climate Action Panel has recom-mended implementation of a state-wide voluntary business program offering free technical assistance and continuous support as a means of reducing carbon emissions from energy, water, transportation and solid waste, emulating Fort Collins’ successful Climate Wise program .
climate Protection strategiesexpand climate Wise
Estimated Additional CO2 Savings in 2012: 73,000 – 94,000 Tons CO2e
Estimated Additional CO2 Savings in 2020: 143,000 Tons CO2e
Double-Counting: Considered to overlap 50% with other short-term climate strategies
Lead Implementing Department: Natural Resources and Utilities
Recommended Approach for Implementation: Seek new FTE and funding for expanded partner outreach as soon as possible
Recommended Timeframe for Completion: 2010
Estimated Cost to the City: $100,000/yr
Potential Funding Source(s): City General Fund; grants
Cost Savings: Net $2/ton average savings for CO2 avoided by Climate Wise part-ners (historic average)

19
ClimateWisewasselectedasoneofthetop50InnovationGovermentProgramsintheU.S.,asrecognizedbyHarvardUniversity,fromapoolofapproximately1,000applicants.
climate Protection strategies
expand climate Wise
“
”
“TherecognitionoftheClimateWise
ProgramasoneoftheTop50
innovative government programs in
thecountryspeaksvolumesabout
thecommitmentbyFortCollins
businesses to lead in environmental
stewardshipandeconomicvitality,”
says City of Fort Collins City
Manager Darin Atteberry .“Weare
proud of the close collaboration the
Cityhasforgedwithlocalorganiza-
tions,aswepavethewaytomaking
FortCollinsaworld-classgreencity
through sustainable, economic and
qualityoflifeimprovements.”

20
MEasurELocal Government Organizations Establish Greenhouse Gas Goals
Supporting City Polices: AirQualityPlanPolicyAQ-16.1.LeadbyExample— The City will make efforts to reduce and mitigate its own air pollution emissions before asking or requiring others to reduce and mitigate their own emissions .
AirQualityPlanPolicyAQ-16.2.Cooperation—The City will initiate and cooperate with other efforts to improve air quality, while avoiding unproductive duplication of effort . Others include governmental entities, non-profit sector, businesses and educational institutions .
BFOEnvironmentalHealth—Seek reductions in greenhouse gas emissions that puts the City on track to meet the…policy objectives .
CityPlanPolicyENV1-13.Innovations— The City will consider adoption of successful air quality improvement strategies in effect elsewhere, including municipal practices, public information campaigns, incentive/promotion programs and regulations .
Measure Description: Recognizing the importance of leading by example, the mea-sure supports large local government organizations (CSU, City of Fort Collins, Larimer County and Poudre School District) in making progress on carbon reduction goals . All four organizations are currently members of the Climate Wise program .
In their 2006 Sustainability Management System, Poudre School District set a goal to reduce their emissions from energy and water 15% between 2006 and 2016 . In June 2008, Colorado State University signed the AmericanCollegeandUniversityPresidentsClimateCommitment. In July 2008, CSU President Penley announced CSU’s goal to become carbon neutral by 2020 . In July 2008, the City of Fort Collins drafted a municipal goal identical to the community’s goal; to reduce emissions 20% below 2005 levels by 2020, by reducing municipal emissions at least 2% per year, starting in 2009 . Larimer County is actively implementing carbon–reduction programs and is discussing a goal for the organization .
Recommended Approach for Implementation for the City:• CityofFortCollinswilldevelopaprocesstoreduce,trackandreportmunicipal
greenhouse gas emissions by the first quarter 2009 .• Alllargelocalgovernmentorganizations(CSU,PSD,City,County)willreportprogress
annually through Climate Wise reporting . The Climate Wise program encourages and inspires partner members to advance to the Platinum Level, which involves complet-ing an emissions inventory, setting a reduction goal and reporting progress .
Cost Savings: The City of Fort Collins spends over $1 .9 million on the utilities for the majority of its buildings . Over ¾ of this is for electricity and natural gas . As these utility costs increase, the potential for avoided costs also increases .
Other Benefits:• Reducebusinessenergycostsforheating,coolingandlighting• Reducebusinessmotorvehiclefuelcosts• Reducevulnerabilitytoenergypriceincreasesandvolatility
Estimated CO2 Savings in 2012: 42,000 Tons CO2e
Estimated CO2 savings in 2020: 217,000 Tons CO2e
Double-Counting: Considered to overlap 75% with other short-term climate strategies
Lead Implementing Department for City of Fort Collins: Operations Services
Recommended Timeframe for Completion: Variable
Estimated Cost to the City: Currently undetermined
Potential Funding Source(s): City General Fund; grants; Utilities rebates
climate Protection strategieslocal government organizations establish greenhouse gas goals

21
• Reducepeakenergydemandandimproveutilizationoftheelectricitysystem• Reduceairpollutionemissionsincludingozoneprecursorsandfineparticles• Improvepublichealth• Improvelocalvisibility• Reducewasteandincreaselandfilldiversionrates• Reducevehiclemilesoftraveledandroadcongestion• Reducewaterconsumptioninthecommunity• Provideopportunitiesforregional,stateandnationalleadershipandrecognition
climate Protection strategies
local government organizations establish greenhouse gas goals

22
MEasurE Community Climate Challenge
Supporting City Polices: PrincipleENV-9— The City will continue to develop and implement sustainability practices that address long-term social, environmental and economic considerations of the Fort Collins community .
PolicyAQ-5—ToolboxofApproaches. The City will seek to achieve local air quality goals through education, incentives and price mechanisms and regulation .
PolicyAQ-7—Information. The City will report available air quality information to the public on a frequent and regular basis . The City will assist citizens in finding air quality information that is of interest to them .
Measure Description: Develop a local “Community Climate Challenge” for the residential sector, focusing on an educational campaign to promote actions with a goal of reducing 1% of per capita GHG emissions . A key component would be youth-focused programs (in-school programs, scouts, youth groups, church groups, services groups, etc .) . Recommended Approach for Implementation:• AssembleinterdepartmentalCityteamforinput• Establishcarboncalculatorprotocol• Developthenimplementpilotchallenge• Reportonprogressandrecommendationfornextstepsbyendof2010
Other Benefits:• Supportlocalbusinessesandstimulateeconomicdevelopment• Assistbusinessesandcitizensinmeetingcarbonreductiongoals• Reinvestmentdollarscanfundotherlocalcarbon-reducingprojects Relationship to Other Programs: Many other communities are implementing community climate chanllenges . Denver has proposed a community climate challenge that they believe will achieve 28% of their GHG goal . Burlington, VT, has the “10% Challenge,” a voluntary program to raise public awareness about global climate change and to encourage households and businesses to reduce their greenhouse gas emissions by at least 10% .
climate Protection strategiescommunity climate challenge
Estimated CO2 Savings in 2012: 28,000 Tons CO2e
Estimated CO2 savings in 2020: 34,000 Tons CO2e
Double-Counting: Considered to overlap 90% with other short-term climate strate-gies . Tree-planting and unantici-pated behavior changes account for the new 10% of benefit .
Lead Implementing Department: Utilities (for 2009 Pilot program)
Estimated Cost to the City: $30,000/yr (pilot program) for incentives plus existing staff time
Potential Funding Source(s): Fort Collins Utilities
Cost Savings: Variable

23
MEasurE Colorado Carbon Fund
Supporting City Polices:BudgetingforOutcomesEconomicHealthResult—Support Fort Collins having a healthy economy that reflects the values of our community in a changing world .
BudgetingforOutcomesEnvironmentalHealth—Seek reductions in greenhouse gas emissions that puts the City on track to meet the…policy objectives .
Measure Description: The Colorado Carbon Fund is a voluntary carbon offset program developed by the Governor’s Energy Office (GEO) to advance the following objectives: 1) develop a funding source for community-based efficient energy and renewable energy projects in Colorado; 2) support Colorado’s climate change mitiga-tion objectives; and 3) provide high quality, credible offsets for individuals, businesses and government agencies interested in mitigating their carbon footprint . GEO is developing a mechanism to reinvest a portion of the revenue (10-40%) to participating communities . These dollars can then fund new local carbon reduction programs and marketing efforts .
This measure recommends that the City of Fort Collins partner with GEO on the Colorado Carbon Fund, market the program heavily and urge Fort Collins citizens and businesses to donate to the Colorado Carbon Fund to offset their emissions and support new clean energy .
Recommended Approach for Implementation:• ApplytotheGEOfor$3,000-$5,000ingrantfundingforparticipationinthe
Colorado Carbon Fund• ConsiderandproposelocaloffsetsprojectsforColoradoCarbonFund• ActivelypromotetheprojecttoFortCollins’businessesandcitizens• Developandimplementlocalcleanenergyprojectstobefundedwithreinvestment
revenue
Other Benefits:• Supportlocalbusinessesandstimulateeconomicdevelopment• Assistbusinessesandcitizensinmeetingcarbonreductiongoals• Reinvestmentdollarscanfundotherlocalcarbon-reducingprojects
climate Protection strategies
colorado carbon Fund
IftwopercentofFortCollinscitizens(2,600people)offsetoneroundtripairlineflightfromDenvertoNewYorkCityeachyear,itwouldcostthem$34/year,wouldcollectivelyavoid5,000tonsCO2e and would lead to reinvestment revenue of $8,000 - $34,000 to support addi-tionallocalprograms.
Estimated CO2 Savings in 2012: 5,000 Tons CO2e
Estimated CO2 savings in 2020: 7,000 Tons CO2e (conservative)
Double-Counting: Considered to overlap 62% with other short-term climate strategies
Lead Implementing Department: Utilities and Natural Resources
Estimated Cost to the City: Staff time to participate with Colorado Carbon Fund
Potential Funding Source(s): Voluntary purchases in private sector at $20/ton

24
MEasurE Push Towards 50% Waste Diversion Goal
Supporting City Polices: PRINCIPLEENV-10— The city will apply cost-effective pollution prevention and zero-waste strategies that will help protect all environmental resources, including air, soil and water and accelerate the community’s ability to meet the city’s adopted goal of diverting 50% of the waste stream from disposal in landfills by 2010 .
ENV10.2Coordination— The City will participate with private businesses, non-profit groups, CSU, Poudre School District and other government agencies to increase local infrastructure and improve market conditions for recycling, composting and reuse industries, and to educate the public about pollution prevention and recycling .
ENV10.3Composting—Organic waste materials should be diverted from landfill disposal and put to beneficial secondary use, such as amending soils to increase local water conservation or to generate alternative sources of energy .
ENV10.4Regulation—Existing municipal ordinances that promote waste reduction, efficient resource use and recycling will continue to be an important mechanism for helping people reach public policy goals . The city will support efforts that reduce materials consumption and facilitate reuse, recovery and recycling .
BudgetingforOutcomeEnvironmentalHealthIndicator#4—Improvement in solid waste diversion rate .
Measure Description: A number of strategies have been identified from the 2006 Draft Strategic Plan for 50% Waste Diversion that are especially effective at reducing greenhouse gas emissions . These strategies include a residential yard waste drop-off site, the option to recycle yard waste though trash haulers and an ultimate ban on yard waste from curbside trash collection . The Draft Strategic Plan also recommends amending Fort Collins Pay As You Throw ordinance to include commercial customers, and implementing construction and demolition debris reduction strategies . Many of these strategies are also being considered under the 2008 Trash Services Study . These strategies include:
ResidentialCustomers:• Implementon-goingcurbsiderecyclingprogramimprovements,includingmore
designated materials and standard options for larger recycling containers .• AmendFortCollins’PayAsYouThrowresidentialtrashordinancesothatratedesign
further enhances waste reduction efforts .• BanyardwastefromFortCollins’curbsidecollection.Requirehaulerstoprovide
residential yard waste pick-up as a separate new service .
CommercialCustomers:• Helpformrecyclingcooperativesforsmallbusinesses.
AllCustomers:• Implementcardboardbaninallsectors.(Asalong-termalternative,considerthe
measure to embed recycling fees in commercial trash rates for all commercial customers .)
• Enhanceshort-termeducationaroundnewmeasures.• Inabsenceofappropriateprivatesectorfacilities,createCity-sponsored
construction and demolition (C&D) drop-off site .
climate Protection strategiesPush towards 50% Waste diversion goal
Estimated CO2 Savings in 2012: 73,000 – 137,000 Tons CO2e
Estimated CO2 savings in 2020: 253,000 Tons CO2e
Lead Implementing Department: Natural Resources Department
Potential Funding Source(s): General Fund, grants, public/pri-vate partnerships, fees
Cost Savings: Avoided landfill costs (gate fees) of $75,000 - $285,000 (calculated at $5/ton trash)

25
CityGovernment:• Establishcontractpreferencestoencouragerecyclingandwastereductionfor
City C&D jobs .• TheCitywouldencourageprivatepartnershipsforconstructingmultiplecommunity
drop-offs to collect more recyclables (paper, glass, etc .) .
Strategies recommended by staff for higher priority consideration are increasing custom-er education and outreach, providing larger recycling containers, requiring trash haulers to provide residential yard waste collection, developing public/private partnerships for glass and paper recycling drop-off sites and banning cardboard from the waste stream . This later strategy is anticipated to more cost-effectively achieve a good portion of the benefits associated with embedding recycling fees in commercial trash rates .
Recommended Approach for Implementation:• DevelopordinancesforCouncilconsiderationincluding,butnotlimitedto;PayAs
You Throw and recycling enhancements; additional licensing requirements and implementation of recycling strategies; and possible city-wide contracts for trash collection services .
• Considerimplementationofanynewwastereductioninitiativesthatemergefromthe Trash Services Study, such as larger recycling bins for commercial customers, cardboard ban, curbside yard waste or changes to haulers’ licensing requirements .
• Considerfuturebudgetrequestsforanynewsolidwastereductioninitiativesthatwere adopted as a result of the 2008 Trash Services Study, including a budget request for an additional staff person .
Estimated Cost to the City: • $106,000/yearby2010forstrategiesrecommendedforearlyconsideration• $235,000/yearby2010forfullsuiteofmeasures• $524,000/yearby2015forfullsuiteofmeasures Other Benefits:• Supportlocalbusinessesandstimulateeconomicdevelopment• Offerdiversionstrategiesdesignedtoreducetrashbillcosts• Prolonglifespanofthelocallandfills,thusdelayingcostlyconstructionofnew
landfill facilities• Promoteviablere-useofwastematerials• Stimulatebettermarketsforrecycleditems• Assistbusinessesandcitizensinmeetingcarbonandwastereductiongoals• Reduceupstreampollutionassociatedwithmanufactureandtransportof
new materials• Lowerdependenceonforeignoilbyreducingpetrochemicalsneededforvirgin
plastics manufacture• Promotewiseuseofnaturalresourcessuchasmineralsandforestproducts
Relationship to Other Programs: Pay As You Throw is an industry best practice . A principal element of the Fort Collins waste reduction program is PAYT trash systems that provide financial rewards for households that reduce the amount of waste they generate .
Did You Know:• TheEPAestimatesthat75%of
what Americans throw in the trash couldactuallyberecycled.
• Typicalbusinessofficesgenerateabout1.5poundsofwastepaperperemployeeperday!
• Recyclingonealuminumcansavesenoughenergytoruna TVforthreehours—ortheequivalent of a half a gallon of gasoline.
climate Protection strategies
Push towards 50% Waste diversion goal

26
MEasurE Fort Collins 2008 Energy Policy
Measure Description: The draft 2008 Fort Collins Energy Policy proposes a 2050 vision “to serve the community with highly reliable, affordable carbon neutral electric service, guided by an ethic of sustainable innovative and responsible management .” The policy has four goals:1) Provide highly reliable electric service .2) Support the community’s carbon emissions goal of reducing the City’s carbon
footprint 20% below 2005 levels by 2020 and 80% by 2050 .3) Enhance local economic vitality .4) Maintain Fort Collins Utilities collaborative relationship with Platte River Power
Authority .
To achieve these goals, it also proposes the following actions that support carbon reduction:• Developamethodologyforreportingcarbonemissionsandsavingsrelatedto
overall electricity consumption, reductions in energy use from efficiency programs, substitution of fossil fuel based electricity with renewable or clean resources and increases in use of electricity for transportation .
• Reduceelectricutilityrelatedemissions20%below2005levelsby2020.• Reduceelectricityuse1%peryearthroughenergyefficiencyandconservation
programs .• Complywiththestate-mandatedRenewablePortfolioStandard(10%renewable
energy by 2020) .• Increasethecontributionofrenewableenergyenoughtoreach20%reductionby
2020, after accounting for the contributions of energy efficiency, conservation, mini-mum renewable energy requirements and voluntary renewable energy programs .
• DevelopaSmartGridroadmapbytheendof2009.• By2020,manage10%ofpeakloaddemandthroughloadmanagement,smartgrid
and distributed generation .
Other Benefits:• Reduceutilitybills• Maintainhighelectricreliability• Improvetheeconomy• Supportsmartgriddevelopment• Reducedependenceonforeignfuelsources• Reducevulnerabilitytoenergypriceincreasesandvolatility• Reducepeakenergydemandandimproveutilizationoftheelectricitysystem• Diversifyenergysupply• Reduceairpollutionemissionsincludingozoneprecursorsandfineparticles• Improvepublichealth• Improveairquality
climate Protection strategiesFort collins 2008 energy Policy
Estimated CO2 Savings in 2012: 30,000 – 50,000 Tons CO2e
Estimated CO2 savings in 2020: 650,000 Tons CO2e
Supporting City Polices: Council Resolution 2003-038, Adopting the Electric Energy Supply Policy
Lead Implementing Department: Fort Collins Utilities
Recommended Approach for Implementation: The 2008 Energy Policy is being considered by City Council in a separate but parallel process to the Climate Plan .
Recommended Timeframe for Completion: 2020 to reduce electricity emis-sions 20% below 2005 levels .
Estimated Cost to the City: To be determined . Implementa-tion plans for elements of the Energy Policy will be presented to Council during budget and typical review processes .

27
MEasurE Natural Gas Energy Conservation
Supporting City Polices: PrincipleENV-5 — Energy efficiency and use of renewable energy resources will be encouraged, facilitated and regulated in both the public and private sector through information and educational services, incentive programs, requirements and enforce-ment of regulations such as the Energy Policy .
Measure Description: Natural gas use comprises 19% of Fort Collins greenhouse gas emissions . The City levies a Gas Company Occupation Tax to Xcel Energy of $445,000/year that has been unchanged since 1988 . (See Chapter 25, Article VI of the Code at: http://www .colocode .com/ftcollins/municipal/chapter25 .htm#articleVI)
This measure would seek to replace Xcel’s Occupation Tax with a Franchise Fee Agreement . The vast majority of local governments in Colorado including Loveland, Longmont, Louisville, (list others too) have a 3% franchise fee agreement for natural gas . Under this agreement, the City would charge Xcel 3% of annual revenue for gas sales . Xcel would pass this increase (~ 1 .5% increase above the current Occupation Tax) on to customers and return the revenue to the City . The City could use this additional revenue to fund climate protection programs .
Recommended Approach for Implementation: • DetermineCityCouncilinterestinpursuingfranchisefeeagreement• DevelopagreementswithXcelEnergy• ObtainapprovalfromtheColoradoPublicUtilitiesCommission Potential Funding Source(s): Any increase that would result from the franchise fee (above the existing Occupation Tax) would be passed through to Xcel customers . Other Benefits:• Conservationandefficiencyprogramscanleadtolowerutilitybills• Reduceconsumptionofalimitednaturalresource• Reducevulnerabilitytonaturalgaspriceincreasesandvolatility
Relationship to Other Programs: The vast majority of local governments in Colorado, including Loveland, Longmont, Louisville, Denver and Boulder, have a 3% franchise fee agreement for the provision of natural gas .
climate Protection strategies
natural gas energy conservation
Estimated CO2 Savings in 2012: 5,000 – 10,000 Tons CO2e
Estimated CO2 savings in 2020: 52,000 Tons CO2e
Lead Implementing Department: Finance
Estimated Cost to the City: Existing staff resources

28
MEasurE Update Residential Building Code
Supporting City Polices: “The City aspires to become a coordinated center for advancing green building in the Fort Collins community by increasing general aware-ness, raising the bar for what is required, helping engaged stakeholders achieve better and greener buildings, and rewarding high performers .” (Excerpt from 2007 City of Fort Collins Roadmap for Coordinated and Enhanced Green Building Services .)
PolicyHSG-2.7—ImpactsofNewPoliciesandRegulations.The City will assess the effects of new policies and regulations, or changes to existing policies and regulations, on housing development costs and overall housing affordability, in order to achieve an appropriate balance between housing affordability and other objectives such as urban design quality, maintaining neighborhood character and protecting public health, safety and welfare .
Measure Description: Electricity and natural gas use by residences is responsible for 24% of Fort Collins’ greenhouse gas emissions . Fort Collins has historically been, and will continue to be, on the leading edge of progressive building and energy code updates with our local amendments . The residential code was significantly updated in 2005 to the 2003 IRC and the 2005 Fort Collins Residential Energy Code, which exceeds the model code energy-efficiency . The Commercial Code was updated in 2008 to the latest model energy code (ASHRAE 90 .1-2007 and IECC 2006) .
Starting in late 2008, the City will again consider upgrades to the residential building and energy codes . Alternatives codes to consider include the recently adopted 2009 IECC model energy code or the “30% Solution .” The 2009 IECC model energy code governing new home construction will offer significant improvements over the current code . The 30% Solution” is an alternative code that boosts energy efficiency 30% over the former model code . Although the 30% Solution fell just short of adoption by the IECC in September 2008, it has been endorsed by the National Association of State Energy Officials, the American Council for an Energy-Efficient Economy, the Consumer Federation of America, the American Public Power Association, U .S . Department of Energy, and the U .S . Conference of Mayors . Recommended Approach for Implementation: • Convenecitizentaskgrouptoprovideinputinresidentialcodeupdateprocess• CityCouncilconsidersadoptionofcodeupdate
Cost Savings: It is more cost effective to incorporate energy efficiency measures into buildings during new construction and major renovations because the improvements can be financed as part of the entire package, and benefits are realized throughout the entire life of the building .
Other Benefits:• Reducedenergybills• Reducedpeakelectricitydemand• Improved(electrical)systemreliability• Supportstheeconomybecausedollarssavedonenergybillstendtobereinvested
locally
climate Protection strategiesupdate residential Building code
Estimated CO2 Savings in 2012: 1,000 Tons CO2e
Estimated CO2 savings in 2020: 4,000 tons of CO2
Lead Implementing Depart-ment: Neighborhood and Building Services
Estimated Cost to the City: No anticipated additional costs
ArecentpollbytheNational AssociationofHomeBuilders confirmsthatenergyefficiencyis a feature that appeals to home buyers.The2/14/2008issueof BuilderOnlinereports:“HomeBuyersWillingtoPayforEnergyEfficiency.NewNAHBstudyofconsumersreportsthat51percentarewillingtopayupto$11,000moreifenergycostsarereduced$1,000annually.”

29
MEasurE Reduce Vehicle Miles of Travel Supporting City Polices: CityPlanVision — Fort Collins will confront and mitigate the negative impact of cars on our life .
PolicyENV-2.1ActionsonVehicleMilesTraveled—The City will slow the growth of vehicle-miles of travel by employing strategies that reduce vehicle trip rates, reduce vehicle trip length and increase vehicle occupancy .
PRINCIPLET-1—The physical organization of the City will be supported by a frame-work of transportation alternatives that balances access, mobility, safety and emergen-cy response throughout the city, while working towards reducing the rate of growth of vehicle miles of travel and dependence on the private automobile .
PRINCIPLET-2—Mass transit will be an integral part of the City’s overall transportation system .
PRINCIPLET-3—City transportation programs shall address themselves to reduce vehicle miles of travel through strategies that reduce trip generation, reduce trip length and increase vehicle occupancy .
PRINCIPLET-4—Bicyclingwillserveasapracticalalternativetoautomobileuseforalltrippurposes.
PRINCIPLET-5—TheCitywillacknowledgepedestriantravelasapracticaltransportationmodeandelevateitinimportancetobeinbalancewithallothermodes.Directpedestrianconnectionswillbeprovidedfromplacesofresidencetotransit,schools,activitycenters,workandpublicfacilities.
PolicyT9.1VehicleMilesTraveled(VMT) — The City will continually strive to reduce the growth rate in VMT by implementing a VMT reduction program that strives to meet or exceed the performance of similar programs in comparable cities .
Measure Description: Transportation demand management (also called mobility management or VMT reduction) includes a range of strategies that improve travel options and encourage people to use more efficient forms of travel . Reducing travel demand is in the public interest, provides multiple community benefits and is worthy of community support and investment .
This measure recommends four key strategies to reduce Fort Collins VMT by almost 2% . Since the City of Fort Collins is already implementing efforts in all of these areas, these measures refer to efforts beyond the current level . The relative anticipated VMT reduction from each program area is identified in Table 6 .
Collectively, these approaches would avoid 12,000 tons CO2e per year, above the busi-ness as usual scenario . Accomplishing these objectives will require the provision of adequate funding and increased partnership and collaboration with other organiza-tions throughout the community .
Walking and Bicycling Improvements: According to some estimates, 5% to 10% of automobile trips can reasonably be shifted to non-motorized transport in a typical urban area, and non-motorized improvements can have leverage effects that increase climate Protection
strategiesreduce vehicle miles of travel
Estimated CO2 Savings in 2012: 2,000 – 12,000 Tons CO2e
Estimated CO2 savings in 2020: 14,000 Tons CO2e
Lead Implementing Department: Planning, Development and Transportation
Estimated Cost to the City: Increased capital and operations funding will be needed . (Transit improvement costs will be identi-fied in the Transit Strategic Plan .) Potential Funding Source(s): General fund, state and federal grants, other grants

30
their importance . This analysis assumes that through a combination of pedestrian and bicycle programs, 1% of total Fort Collins VMT could be avoided by 2012, or approxi-mately 10,000,000 VMT/year reduced . The 2008 Bicycle Plan provides specific recom-mendations in the areas of engineering and the bike network, education, enforcement, enhancing community benefits and multi-modal connectivity that, if implemented, will serve to significantly advance bicycling in Fort Collins .
Transportation Demand Management-Type Program with Employer Focus: Historically, the Fort Collins SmartTrips program has worked with businesses, schools and organizations to reduce VMT . More recently, City Transportation Services has implemented several elements of TDM programs including Fort Collins Bikes, transit promotions, Test Ride Transfort, Safe Routes to School as well as the updated Passfort employer bus pass program . The North Front Range Metropolitan Planning Organiza-tion is handling VanPool and carpool activities in the region .
This recommendation calls for a special focus on increasing employee commuter outreach . Employee commute trip reduction programs have achieved noteworthy success, including the Seattle area and Utah . Denver’s Greenprint plan has established a goal to increase employee transit ridership 10% over the 2005 baseline level by 2011 . They assume that 20% of employees approached with a program will participate, and that those participating reduce 0 .55 tons CO2/employee/year (about 1,000 miles/year/employee) . If a Fort Collins commuter outreach program achieved the same level of effectiveness, this would result in approximately 8,566,000 VMT reduced .
School Transport Management Program: School Transport Management Programs encourage parents, students and staff members to reduce automobile trips and use alternative modes for travel to and from schools . These programs generally include walking, cycling and ridesharing encouragement . In addition, these programs may have significant long-term impacts by helping children establish more multi-modal travel habits that continue later in life . (Source: Mobility Management Review at: http://fcgov .com/airquality/pdf/mm-best-practices06 .pdf )
This analysis assumes that at least 1,000,000 miles could be avoided through car pool-ing, Walk a Child to School, Safe Route to School and prize-based competitions encour-aging students to use and document alternative modes . The number of avoided VMT could grow through increased efforts to decrease travel by single-occupancy vehicle to school campuses .
Transit Service Innovations and Improvements: It is recognized that the Mason Corridor will serve as a key backbone to an enhanced transit system in Fort Collins . The City is optimistic about receiving federal funding to build the Bus Rapid Transit ele-ment of the corridor, with completion anticipated by 2011 . The Transit Strategic Plan update (2008/2009) will foster a dialogue with the community and region on transit opportunities and challenges; review existing fixed route service and performance standards; examine the existing four-phased approach to a grid transit network; and address the financial solutions required to create and sustain a high-performing transit system for our community and region . Poudre School District and the City of Loveland are participating as strategic partners .
Recommended Approach for Implementation:• Fundandimplementthe2008BicyclePlan• CompleteandconsideradoptionandfundingfortheTransitStrategicPlan(2009)• ImplementtheSafeRoutestoSchoolProgram• SeekfundingtoimplementtheMasterStreetsPlanandtransportation
improvementsclimate Protection strategiesreduce vehicle miles of travel

31
Cost Savings: Fuel and vehicle maintenance savings to participants in VMT-reduction programs .
Other Benefits:• Economicdevelopmentbenefitsthroughtheexpansionofalternativemodes• ImprovemobilityinFortCollins• Reducedependenceonforeignfuelsources• Reducevulnerabilitytoenergypriceincreasesandvolatility• Reduceairpollutionemissionsincludingozoneprecursorsandfineparticles• Improvepublichealth• Improvelocalvisibility
climate Protection strategies
reduce vehicle miles of travel

32
MEasurE Modern Roundabouts
Supporting City Polices: PolicyT-1.2Multi-ModalStreets — Street corridors will provide for safe, convenient and efficient use of all modes of travel, including motor vehicles, transit, bicycles and pedestrians .
PolicyT-1.4AdequateFacilities—The City will ensure the provision of adequate facili-ties for the movement of goods and people while maintaining the integrity of existing streets and minimizing travel-related impacts within neighborhoods .
Measure Description: Roundabouts are an alternative to the standard traffic signal that provide a safer, more efficient, economically advantageous and environmentally friendly way to move traffic along the roadway system . This strategy recommends that the City build five roundabouts at new or significantly redeveloped intersections by the end of 2013 . A recent study of 10 Virginia intersections demonstrated 200,000 gal-lons of fuel savings annually, from the construction of roundabouts .
Recommended Approach for Implementation: A City 2001 ordinance requires that roundabouts be considered for any arterial or arterial collectors slated for im-provements . Staff anticipates possible construction of four (possibly five) new round-aboutsinthenextfewyears,includingtheZieglerandHorsetoothroundaboutthathas just been completed . Other Benefits:Roundaboutssavelives...• Uptoa90%reductioninfatalities• 76%reductionininjurycrashes• 30-40%reductioninpedestriancrashes• 75%fewerconflictpointsthana4-wayintersection
Slowervehiclespeedsmean...• Drivershavemoretimetojudgeandreacttoothercarsorpedestrians• Anadvantageoussituationforolderandnovicedrivers• Areductionintheseverityofcrashes• Asafersituationforpedestrians
Efficienttrafficflow...• 30-50%increaseintrafficcapacity• Reductioninpollutionandfueluse• Improvedtrafficflowforintersectionsthathandleahighnumberofleftturns• Reducedneedforstoragelanes
Moneysaved...• Nosignalequipmenttoinstallandrepair• Savingsestimatedatanaverageof$5,000peryearinelectricity&maintenancecosts• Servicelifeofaroundaboutis25years,comparedto10yearsforatraditionaltraffic
signal
climate Protection strategiesmodern roundabouts
Estimated CO2 Savings in 2012: 1,000 Tons CO2e
Estimated CO2 savings in 2020: 2,000 Tons CO2e
Lead Implementing Department: Planning, Development and Transportation
Estimated Cost to the City: Net savings for O&M; Capital costs can be variable but typically roundabouts are less expensive to build than traditional intersections .
Potential Funding Source(s): Funding for roundabouts would come through capital improvement dollars or private developers .
Cost Savings: Fuel savings to roundabout users

33
New Qualitative MeasuresThis Plan also includes measures that have not been quantified but that can play an important role in making progress towards the 2020 goal . These measures are outlined in Table 5 and described on the following pages .
Table 5 — Summary of New Qualitative Measures
Community Engagement
• CityofFortCollinsGovernmentLeadership
Transportation
• SeekAdequateFundingtoImplementTransportationPlans, with Funding for Transit as a Priority to Achieve Best Practices
• DevelopPartnershipstoReduceVehicleTravel• ParkingManagement
Land Use
• ImplementLandUseCodeChangesthat Support Greenhouse Gas Emissions Reductions
• PromoteandPursueInfillandRefillDevelopment• PromoteTransit-OrientedDevelopment• ConsiderRequirementsforNewDevelopmentstoHaveLess
Travel Demand than Comparable Existing Developments
Green Building
• RegularUpdatesofBuildingEnergyCodes• ContinuedSupportforAboveCodeGreenbuildingInitiatives• RequireGreenBuildingasaPrerequisiteforPublicFinancing• ExploreNetZeroReadyHomes• ExploreLEEDforNeighborhoods
Urban Forestry
• PromoteTreePlanting
Support State and Federal Climate Protection Actions
City of Fort Collins Government LeadershipThe City government is well positioned to influence a community’s carbon footprint through modeling best practices for the internal organization and establishing policies that support greenhouse gas reduction within the community .
This strategy recommends that the City of Fort Collins identify and communicate overarching organizational goals that will support greenhouse gas reduction, not only for the municipal government but for the community . It is also recommended that the City adopt a standard management framework such as ISO14001, an Environmental Management System or a Sustainability Management System to implement and track progress on these overarching goals .
climate Protection strategies
Qualitative measures

34
Seek Funding to Implement Transportation Plan with a Focus on TransitThe 2004 Transportation Master Plan contains numerous strategies to improve trans-portation efficiency, yet there is inadequate funding to fully implement the plan .
In addition to the Transportation Master Plan, the City has numerous plans that sup-port reduced single-occupancy vehicle trips, including the Bicycle Plan Update, the Pedestrian Plan and the Transit Plan . Further, Transportation Demand Management (TDM) strategies are most effective when they are implemented as an integrated package, where strategies can support each other (e .g ., improved transit along with improved pedestrian access to bus stops) .
It is recommended that the City dedicate resources to pursue funding to finance the key components of the 2004 Transportation Master Plan and associated TDM Plans, with a special emphasis on expanding transit infrastructure and completing enhanced travel corridors .
Develop Partnerships to Reduce Vehicle TravelSeek to develop effective partnerships among major community and regional institu-tions to reduce single-occupancy trips . Optimizing mobility management in Fort Collins will require active support not only from the City Council, but also from the North Front Range MPO, major employers, Poudre School District, Colorado State University, the Chamber of Commerce, Downtown Business Association and many others .
Table 6 — Multiple Benefits of Transportation Demand Management
Economic • Reducedcongestion• Roadandparkingcost
savings • Consumercost
savings • Crashcostsavings• Increasedlocal
employment and business activity
Social• Improvedmobility
for non-drivers • Increasedcommunity
livability • Improvedpublic
health and fitness
Environmental• Energyconservation• Reducedair,noise
and water pollution • Reducedpavement
and sprawl
As large Fort Collins institutions examine their footprint (environmental, economic and social impacts), the Fort Collins City Council could encourage each of them, including the City of Fort Collins, to include the impact of all the vehicle trips taken to and from their campuses, and to become active in finding ways to reduce them . The City Council could perhaps offer a sample resolution that each organization could adopt . Partner-ships could also be extended through channels such as the Mason Corridor Project, Downtown Area planning, and the UniverCity Connections .
Parking ManagementParking Management includes a variety of strategies that encourage more efficient use of existing parking facilities, improve the quality of service provided to parking facility users and improve parking facility design . Current parking planning practices (such as generous minimum parking requirements and public provision of on- and off-street parking) tend to result in abundant and generally free parking at most destinations .
climate Protection strategiesQualitative measures

35
This subsidizes automobile travel and encourages lower-density land use patterns . More efficient parking management can address these problems, helping to achieve a variety of transportation, land use development, economic and environmental objec-tives . Examples of parking management programs include:• Createadowntownparkingdistricttooptimizetheparkingresourceandreduce
pollution and congestion . • Optimizetheavailabilityanduseofparkinggarages.• Encourageuseoflowemissionvehiclesbyofferingfreeparkingspacesorlowcost
parking to those vehicles .• Implementparkingcashoutprogramsthatallowsemployeestoopt-outofhavinga
parking space and instead receive compensation .
In addition to new strategies, parking management elements can be implemented through existing projects such as the Mason Corridor, the Downtown Way Finding ProjectandtheTransit-OrientedDevelopmentOverlayZone.
Implement Land Use Code Changes that Support Greenhouse Gas Emissions ReductionsCity Plan contains the community’s 2010 greenhouse gas policy goal to reduce emissions 30% below predicted 2010 levels by 2010 . Additionally, City Plan and the resulting Structure Plan were built upon the analysis of a range of density and land use configurations . The final scenario upon which these plans were built optimized trans-portation and land use efficiencies .
While City Plan policies and the Structure Plan support smart growth, the City could improve the speed of implementation . Many of these changes would be made within the Land Use Code that implements City Plan and the Structure Plan . Specific recom-mendations for Fort Collins include:• AdheretotheexistingStructurePlan.• ImplementGreenRoofs.• Marryhistoricpreservationeffortswithgreenbuilding.• Establishrequirementsforgreenbuildinginaffordablehousingdevelopments.• Establishandrequireaminimumlevelofgreenbuildingstandardsforanydevelop-
ment project to receive City subsidies .• Enhancepublic/privatepartnershiptosupportgreenbuildingandsustainable
design .• Considerincentivesinthedevelopmentreviewprocessforgreenbuilding.• Developarevolvingzerointerestloanfundtohelpdevelopersofgreenprojects
overcome initial upfront high development costs .
Promote and Pursue Infill and Refill DevelopmentInfill and refill developments have the potential to address air quality and greenhouse gas emissions by reducing the number of vehicle miles of travel (VMT) and allowing easier access to transit and pedestrian-oriented facilities . According to the Center for Clean Air Policy’s Transportation Emissions Guidebook, infill and brownfield redevel-opment has the largest potential for reducing site-specific VMT . These strategies are believed to reduce VMT 15-50% . (The only other strategy showing up to a 50% VMT reduction potential in this source is “smart school siting” .)
Redevelopment and infill can help revitalize aging commercial areas, contribute to the vitality of Fort Collins downtown area and add variety to our housing opportunities .
climate Protection strategies
Qualitative measures

36
Experience has shown, however, redevelopment and infill projects frequently encoun-ter particular challenges - obsolete structures, contamination, poor access to utilities, public opposition, etc . impeding development .
In 2006 EDAW completed a report for the City of Fort Collins that identified a number of challenges and solutions to refill development . The RefillFortCollins 2006 report specifically identifies the challenge that the City fee structure can be unreasonably burdensome for infill and redevelopment projects . Recommended solutions include:• Considertheuseofpublic/privatefinancingmechanismstopayforneededinfra-
structure improvements and infill/refill areas .• Considerreductionoffeesinspeciallydesignatedredevelopmentareas.
Promote Transit-Oriented DevelopmentTransit-oriented development is one of the top strategies for reducing a community’s carbon footprint from transportation . The Center for Clean Air Policy’s Transporta-tion Emissions Guidebook lists this as typically reducing VMT by 20-30% . Fort Collins already has established at TOD overlay zone along the Mason Corridor . A second potential location would be along the Harmony Corridor .
Consider Requirements for All New Developments to have Less Travel Demand than Comparable Existing DevelopmentsThe City of Aspen has included a strategy in their Climate Action Plan to establish a city policy to require a net decrease in transportation-related emissions compared to exist-ing developments, such as affordable housing projects . For some developments, this may involve purchasing carbon offsets for new emissions .
Green BuildingPromote green building in new and existing buildings as an overall strategy to im-prove the built environment and reduce carbon emissions . The Fort Collins Green Building Roadmap provides a summary of current programs and services related to green building and a set of recommendations for advancing green building efforts . The recommendations are specific actions that can be undertaken now and in the future to sustain green building in Fort Collins . These specific actions are categorized according to the following four general actions:1) Mandate minimum performance and remove barriers2) Encourage green building innovation3) Reward green building success4) Build internal City capacity to support green building
Potential strategies for reducing carbon emissions through green building include are discussed below .
Regular Updates on Building Energy CodesNew construction and major renovation represent cost-effective times to incorporate energy efficiency measures into buildings because the improvements can be financed as part of the entire package, and benefits are realized throughout the entire life of the building .
climate Protection strategiesQualitative measures

37
Continued Support for ‘Above Code’ Green Guilding InitiativesMany “above code” initiatives already exist, including the Northern Colorado ENERGY STAR New Homes collaboration and the Integrated Design Assistance Program:• http://www .fcgov .com/conservation/biz-idap .php • http://www .nocoenergystarhomes .org/
Require Green Building as a Prerequisite for Public FinancingThe City of Fort Collins’ Roadmap for Green Building calls for a mid-term strategy (within three years) to require green building as a prerequisite for any projects that offer public financing . The City already has a Leadership in Energy and Environmental Design (LEED) goal for new City buildings . This strategy recommends developing new policies requiring green building targets for projects that receive direct or indirect public financing from the City .
As one example, the Portland Development Commission’s Green Building Program requires developers receiving financial assistance from the commission, as well as direct commission funded projects, to integrate green building practices into con-struction projects and meet established LEED standards .
Promote Net Zero Ready HomesThis measures calls for the exploration of building codes and ordinances requiring that all homes over a certain size be required to achieve net zero energy use and the expansion of this requirement, over time, to all new homes .
Austin, TX, intends to pass a series of code amendments that will make new homes built by 2015 all “net zero” capable . See: http://ci .austin .tx .us/council/downloads/mw_zech_release .pdf
BoulderCountyhasincludeda“NetZeroEnergyHomes”strategyintheir Sustainable Energy Plan approved by County Commissioners in February 2008 . See: http://bouldercounty .org/sustain/pdf/SEP_final_draft .pdf
Promote LEED for NeighborhoodsThe LEED for Neighborhood Development Rating System integrates the principles of smart growth, urbanism and green building into the first national system for neighbor-hood design . LEED certification provides independent, third-party verification that a development’s location and design meet accepted high levels of environmentally responsible, sustainable development . Currently in its pilot period, LEED for Neighborhood Development is a collaboration among the U .S . Green Building Council, the Congress for the New Urbanism and the Natural Resources Defense Council . The City of Fort Collins should consider incorpora-tion of LEED for Neighborhood requirements into the development review process .
Urban Tree PlantingUrban trees are a good economic and environmental investment . A study published in 2003 in collaboration with the USDA Forest Service, the Center for Urban Forest Research and the City of Fort Collins (Benefit-CostAnalysisofFortCollins’Municipal
climate Protection strategies
Qualitative measures

38
Forest) concludes that the 31,000 park and street trees in Fort Collins provide substan-tial environmental and economic benefits for taxpayers . For every $1 invested in tree management, residents receive $2 .18 in benefits . The net cost benefits are presented below .
Energy savings $112,045Carbon dioxide reduction $43,686Air quality improvement $18,472Stormwater $403,597Property value $1,596,247
TOTAL BENEFITS $2,147,047
Goals should be established to maximize responsible tree planting on public and private property to fill empty planting spaces . Trees should be strategically planted to optimize building energy efficiency by reducing heating and cooling needs . Trees should be selected and maintained in a way that minimizes carbon emissions associ-ated with maintenance, fertilizers and irrigation .
Partnerships with other local organizations could be developed to increase local tree planting . For example, the City of Boulder set a long-term goal to increase industrial canopy cover from 7% to 9% . Denver set a goal to plant thousands of new trees an-nually in parks, natural areas and on private property, thus increasing Denver’s tree canopy from 6% to a total of 18% tree cover, as identified in the Denver Parks Game Plan . Portland planted 750,000 trees and shrubs between 1996 and 2005 to help sequester carbon emissions .
Promote Climate Protection and Adaptation Strategies at State, Regional and Federal LevelsWhile Fort Collins’ climate protection efforts should not be unduly reliant on actions at other levels of government to reach its stated goals, local progress could be greatly advanced by passage of climate protection programs at the state and federal levels . Fort Collins should support or lobby for legislation that cost-effectively reduces green-house gas emission . Some programs are better addressed at high levels of govern-ment . Examples include regulations to reduce the greenhouse gas intensity of trans-portation fuels and/or establish greenhouse gas emissions standards for new vehicles .
climate Protection strategiesQualitative measures

39
Monitoring and Reporting
A key to the achievement of any goal is measurement and accountability . Council Resolution 2008-051 establishes regular reporting requirements for assessing progress towards established climate goals .
MetricsProgress towards the 2020 goal will be monitored through changes to the community-wide emissions inventory . During 2009 the City will assess its inventory methodology and update it if appropriate . As inventory methodologies evolve, the baseline (2005) and subsequent inventories will be updated to reflect those changes .
Annual ReportCity Council Resolution 2008-051 calls for an annual report tracking progress toward attainment of the goals established for 2020 and 2050 . This annual report should include an evaluation of community-wide greenhouse gas emissions and a list of quantified reduction activities for the prior year . This report will be prepared by the City’s Energy Management Team and presented to the City Manager no later than June for the prior year . Annual reporting will commence in 2009 for the year of 2008 .
Biennial Review City Council Resolution 2008-051 also establishes a requirement that biennially, at least six months in advance of the City’s budget, a report should be prepared that evaluates progress on greenhouse gas reduction relative to interim milestones and recommend actions for future implementation . The interim milestones identified in Table 7 below approximate a linear descent from 2007 to 2020 . However, progress towards the 2020 goal may not follow a linear path, as some programs take longer to ramp up and as future carbon reduction opportunities emerge . The biennial review process will address progress towards the 2020 goal and recommend adjustments as necessary .
The biennial review reports will serve as informal updates to the Climate Action Plan .
Table 7 — Biennial Review Schedule
annual Progress Milestone Biennial Budget Year report (Tons CO2) review recommendations
2009 X Fall 2009 for 2010/2011 2010 X 2011 X Spring 2011 for 2010 Fall 2011 for 2012/2013 2012 X 2,466,000 2013 X Spring 2013 for 2012 Fall 2013 for 2014/2015 2014 X 2015 X Spring 2015 for 2014 Fall 2015 for 2016/2017 2016 X 2,263,000 2017 X Spring 2017 for 2016 Fall 2017 for 2018/2019 2018 X 2019 X Spring 2019 for 2018 Fall 2019 for 2020/2021 2020 X 2,032,000
monitoring and rePorting

40
Conclusion
“Ajourneyofathousandmilesbeginswithasinglestep.”
—LaoTzu
Fort Collins has been a pioneer in climate protection among US cities and continues to lead the way . Since taking a momentous step in 1999 when City Council committed to reduce greenhouse gas emissions, Fort Collins recognized the significance of global climate change and embraced the active role its citizens play in this challenging local task with global implications .
Through innovation, leadership and local involvement, the community has benefited significantly from climate protection actions . Thanks to the success of the voluntary Climate Wise program, for example, innovative businesses avoided emitting more than 82,000 tons of CO2e, while saving over $12 million since 2000 . Thanks to foresight in leadership, Fort Collins established the first renewable energy standard in the State of Colorado . And our participatory community tells us through recent surveys that they not only support but also expect further greening efforts .
Clearly, our community is ready to tackle the next set of climate protection action chal-lenges that recommits our City to the shared duty of reducing our local greenhouse gas emissions . Stepping up to the plate again with vision and leadership in May 2008, the Fort Collins City Council established an aggressive goal to reduce emissions 80% by 2025, an interim reduction goal of 20% by 2020 and an insightful 2012 check-point to ensure we remain on track to the longer-term goals .
Reducing emissions 80% by 2050 sets Fort Collins on the path towards a sustainable future . The mid-term target to reduce emissions 20% by 2020 represents an ambitious undertaking that is within our grasp . Both goals will require staunch commitment and participation by all community sectors and forward-thinking leadership by City gov-ernment and other large organizations in Fort Collins .
Our path to making significant progress early on is guided by the hard-working efforts of the Fort Collins Climate Task Force that developed specific, short-term strategies . They also recommended that work begin on important long-term strategies, such as setting performance standards for new buildings, establishing land use policies that will reduce greenhouse gas emissions and seeking funding to build sustainable trans-portation systems . Additional work will be needed to develop short-term implementa-tion plans as well as longer-term plans to clarify the path to 2020 and 2050 goals .
The time for action is now . We have begun this journey alongside other committed municipalities, state agencies, universities, business and citizens in Colorado’s Front Range and around the nation . Working cooperatively, we can reduce our emissions, maximize technologies and co-create the evolution of carbon markets . Together we can sow the seeds to reap the benefits of a more sustainable life experience for our-selves and generations to come .
conclusion

Appendix — City Council Resolution 2008-51
WHEREAS, there is widespread consensus that human emissions of greenhouse gases are impacting the earth’s climate system, causing the potential for unprecedented large-scale adverse health, social, economic and ecological effects; and
WHEREAS, climate disruption is likely to cause, and may already be causing, damage to the environmental and economic health of Colorado communities, risks associated with reduced snow pack that could affect both water sup-ply and tourism, and secondary impacts such as changes in agriculture economics; and
WHEREAS, local governments can greatly influence their communities’ greenhouse gas emissions by exercising key powers over land use, transportation, building construction, waste management, and, in many cases, energy and water supplies and management; and
WHEREAS, there is currently no comprehensive federal regulations of greenhouse gas emissions and the United States is itself the largest per capita emitter of greenhouse gas emissions; and
WHEREAS, it is appropriate for local governments to take responsibility for emissions occurring within their jurisdictions since local community actions can speed the development of technology-based solutions and more rap-idly promote market transformation that will help drive reductions in global emission levels; and
WHEREAS, the Fort Collins community could realize tremendous ancillary economic, environmental, and social benefits by undertaking responsible steps to combat climate change; and
WHEREAS, by the adoption of Resolution 1999-137, the City Council established a policy that the City shall proactively identify and implement actions to reduce greenhouse gas emissions within the City by at least 30% below predicted 2010 levels by 2010 while achieving cost-effectiveness in each program; and
WHEREAS, by the adoption of Resolution 1999-137, the City Council established a policy that the City shall proactively identify and implement actions to reduce greenhouse gas emissions within the city by at least 30% below predicted 2010 levels by 201 while achieving cost-effectiveness in each program; and
WHEREAS, the City has demonstrated its leadership on the issue of climate protection through the implementa-tion of Climate Wise, the Electric Energy Supply Policy, recycling initiatives and other programs to reduce emis-sions, and should continue to lead by example so as to encourage other communities across the region, state, and globe to share in the solution to the problem of greenhouse gas emissions; and
WHEREAS, despite this progress, Fort Collins is not on track to meet the greenhouse gas emissions goal estab-lished by Resolution 1999-137 to reduce carbon dioxide emissions to an inventory level of 2.466 million tons in the year 2010; and
WHEREAS, the Fort Collins community offers a unique combination of innovation and technical expertise that can be utilized to develop long-term sustainable solutions and facilitate all sectors and organizations in Fort Collins in taking action to reduce emissions; and
WHEREAS, scientists have identified a need to reduce the global emission of greenhouse gases by 80% by the year 2050, at the latest, in order to avert the worst impacts of global warming; and
WHEREAS, the 2007 recommendations of the Colorado Climate Project convened by the Rocky Mountain Climate Organization to reduce the state’s contribution and vulnerability to climate change include reducing state-wide emissions in the vicinity of 20% below 2005 levels by 2020 and 80% below 2005 levels by 2050; and
WHEREAS, the 2007 Colorado Climate Action Plan establishes these same goals; and
RESOLUTION 2008-051OF THE COUNCIL OF THE CITY OF FORT COLLINS
ESTABLISHING CITY GREENHOUSE GAS REDUCTION GOALS
41
aPPendix — city council resolution

42
WHEREAS, the City Council is intent upon continuing its efforts to achieve meaningful reductions in local greenhouse gas emissions; and
WHEREAS, aligning local greenhouse gas goals with state goals will minimize confusion on the part of the pub-lic and facilitate statewide collaboration in reducing the damage caused and risks created by greenhouse gas emis-sions, and
WHEREAS, the Fort Collins Climate Task Force has recommended that Council include in this Resolution an additional goal to the effect that the Fort Collins community reduce its current greenhouse gas emissions so that, by the end of 2012, such emissions do not exceed 2.466 million tons.
NOW, THEREFORE, BE IT RESOLVED BY THE COUNCIL OF THE CITY OF FORT COLLINS as follows:
Section 1. That the Council hereby establishes the goals of reducing Fort Collins’ community-wide greenhouse gas emissions 20% below 2005 levels by 2020 and 80% below 2005 levels by 2050.
Section 2. That, pending attainment of such goals, the Council hereby expresses its intent to reduce current community-wide greenhouse gas emissions by the end of 2012 to a level not to exceed 2.466 million tons.
Section 3. That the City government must lead by example in this area by minimizing greenhouse gas emis-sions in its own operations through the establishment of policies and directions that will lead the community to a sustainable future, and, most importantly, by inspiring community involvement in the effort to reduce greenhouse gas emissions.
Section 4. That the City Manager is hereby directed to prepare for Council consideration an updated plan to reduce greenhouse gas emissions within the Fort Collins community that identifies interim milestones needed to put Fort Collins on a trajectory to meet the 2020 goal, including a milestone for the year 2012 referenced in Section 2 above.
Section 5. That such updated plan shall include a list of strategies demonstrating how interim milestones can be met and that these strategies should: consider relevant technical, economic, political, and social factors; promote economic vitality and prioritize investments in the Fort Collins community; address all emissions sectors; and pro-mote involvement by all segments of the community (local businesses, governments, utilities, schools, universities, non-profit organizations, homeowners, and other individuals).
Section 6. That the City Manager is further hereby directed to: (a) prepare an annual report tracking progress toward attainment of the goals established herein, including a community-wide greenhouse gas emissions inventory and a list of quantified emission reductions actions for the preceding calendar year; and (b) biennially, at least six months in advance of the City’s biennial budget preparation, prepare a report evaluating progress on greenhouse gas reduction relative to established interim milestones and recommending actions for consideration in the upcoming budget cycle.
Section 7. That the Council hereby recognizes that new data, scientific findings, mitigation technologies, and quantification methodologies may emerge over time and that future Councils may choose to update the community greenhouse gas goal to take in account evolving science, technology or other opportunities.
Passed and adopted at a regular meeting of the Council of the City of Fort Collins this 20th day of May A.D. 2008.
aPPendix — city council resolution


For more information, visit http://fcgov .com/climateprotection
or call the City of Fort Collins Natural Resources Department at (970) 221-6600