2008 nasa cost estimating handbook - macos serverorigins.sese.asu.edu/ses405/reference...
TRANSCRIPT

2008 NASA Cost Estimating
Handbook

Cost Estim
atingC
ost Risk
Economic &
Supporting AnalysisC
areer Developm
ent Guide
Reference
Know
ledge Managem
entC
ost Estimating
Cost R
iskEconom
ic & Supporting Analysis
Career D
evelopment G
uideR
eferenceK
nowledge M
anagement
2008 NASA Cost Estimating Handbook
Page i
Welcome to the 2008 NASA Cost Estimating Handbook (CEH)
The 2008 NASA Cost Estimating Handbook (CEH) is a reorganized and updated handbook that has been streamlined and consolidated into useful volumes based on input from the NASA Cost Estimating Community. The primary goal of the 2008 NASA CEH is to incorporate the survey feedback from the NASA Cost Estimating Community, implement comments collected through [email protected], provide interim updates from the prior CEH tasks, and include data on new cost initiatives.
This handbook provides useful information on cost estimating for the entire NASA Cost Estimating Community. It is to be both informative for the new NASA cost estimator and a good reference document for the experienced NASA cost estimator. Based on the extensive feedback from the NASA Cost Estimating Community, the 2008 edition of the handbook has been streamlined to make references easy to find, simplified to make new initiatives easy to understand, and clarified to communicate key policy messages efficiently. This handbook�’s information provides NASA-relevant perspectives and NASA-centric data useful in the NASA environment and facilitates the development of reliable, comprehensive, defensible, and well-documented cost estimates.
The 2008 CEH is separated into the following distinct volumes:
�• Volume 1: Cost Estimating
�• Volume 2: Cost Risk
�• Volume 3: Economic & Supporting Analysis
�• Volume 4: NASA Cost Estimator Career Development Guide
�• Volume 5: Knowledge Management
�• Volume 6: Reference
The Cost Estimating Volume within the CEH is available in hardcopy at each Center�’s cost group. A downloadable version of the entire handbook in Adobe Acrobat .PDF format is available at http://www.ceh.nasa.gov. This web site also hosts the handbook in HTML format. For best viewing results, use Internet Explorer (IE).
Revision Highlights:
�• A streamlined Cost Estimating Volume that separates the cost estimating tasks and project life cycle phase considerations. This streamlining of the Cost Estimating Volume makes it easy for the user to find the appropriate references. This volume also includes updates to the �“Role of Cost Estimating�” and �“The Cost Estimating Process�” sections
�• An expanded and separate Cost Risk Volume that provides information to help the NASA Cost Estimating Community perform cost risk assessments. Included in this volume are relevant NASA policy Directives & Requirements and various accepted methods for

Cost Estim
atingC
ost Risk
Economic &
Supporting AnalysisC
areer Developm
ent Guide
Reference
Know
ledge Managem
entC
ost Estimating
Cost R
iskEconom
ic & Supporting Analysis
Career D
evelopment G
uideR
eferenceK
nowledge M
anagement
2008 NASA Cost Estimating Handbook
Page ii
performing cost risk. The Cost Risk Volume also provides summaries of many cost risk models and outside risk handbook information
�• A new NASA Cost Estimator Career Development Guide. This volume outlines the process for developing the NASA cost professional with the appropriate resource references to identify a career path, enhance career development, and align skills and capabilities with organizational needs
�• A new Knowledge Management Volume. This volume outlines the process of getting the right information to the right people at the right time, and helping people create knowledge and share and act upon information in ways that will measurably improve the performance of NASA and its partners
�• Updates to numerous NASA initiatives such as NPR 7120.5, NPR 8400.4, CADRe, ONCE, budget guidelines, and the NASA Standardized WBS
�• Updates to the Acronym List, Glossary, and References
Using the Handbook:
The 2008 NASA CEH is designed to be an electronic resource. Not intended to be read cover-to-cover, this handbook�’s design helps to facilitate fast topic searches, extractions of specific pages, graphics, or sections as stand alone topical references to use or to share in hard copy or electronically with your colleagues, and provide in-depth write ups to describe topics without disturbing the flow of the document for the reader.
The 2008 NASA CEH is not officially available in hard copy. If you would like to print a personal copy of the 2008 NASA CEH, the following printing guidelines should be helpful. The layout of the document has specific margins to allow for online viewing and spiral binding. Following the printing guidelines below will allow the most efficient use of your 2008 NASA CEH.
�• Print the document single sided in color to take advantage of the document�’s color-coding for easy reference and to make personal notes on the blank side of each page
�• Reverse the last printed page of the document to provide a back cover
�• Insert viewgraph sheets in the front and back of the document, providing a protective cover for long-term use
�• Have the document spiral bound (print departments or copy stores can quickly provide this service).
Feedback and/or suggested improvements are welcomed. Information requests can be sent to [email protected]. Please send your comments and feedback on the CEH to NASA Cost Analysis Division [email protected]. Please send specific requests on the CEH to NASA Cost Analysis Division at [email protected].

Cost Estim
atingC
ost Risk
Economic &
Supporting AnalysisC
areer Developm
ent Guide
Reference
Know
ledge Managem
entC
ost Estimating
Cost R
iskEconom
ic & Supporting Analysis
Career D
evelopment G
uideR
eferenceK
nowledge M
anagement
2008 NASA Cost Estimating Handbook
Page iii
Preface
The NASA CEH has proven to be a dynamic, living document, changing with the many positive developments within the NASA Cost Estimating Community. The new developments at NASA covered in this handbook will help improve the NASA Cost Estimating Community�’s ability to provide quality and accurate cost estimates, help generate realistic budget submissions, and provide decision makers with accurate and realistic cost data. This will aid in delivering projects on time and within budget and improve NASA�’s reputation with external stakeholders.
The new developments at NASA include:
�• Updates to NPR 7120.5
�• Updates to NPR 8400.4
�• Updated CADRe templates and submission guidelines
�• NASA Standardized WBS
�• The One NASA Cost Engineering (ONCE) database
�• Cost Risk
�• The Planning Programming Budgeting and Execution (PPBE) process
The NASA CEH brings the fundamental concepts and techniques of cost estimating to NASA Cost Estimating Community personnel in a way that recognizes the nature of NASA systems and the NASA environment. This handbook is a top-level overview of cost estimating as a discipline, not an in-depth examination of each and every aspect of cost estimating. It is called the Cost Estimating Handbook so it is not confused as a resource that covers the entire discipline of cost analysis. It is a useful reference document, providing many references and links to other sources for details to complement and to enhance the information provided on these pages. The CEH strikes a balance between documenting processes and providing basic resources for cost estimators from the beginner to the experienced, while providing the detail and �“how to�” function of the NASA Space Flight Program and Project Management Requirements (NPR 7120.5). It is supplemented by Center specific examples, best practices, and lessons learned where appropriate.
The NASA CEH was developed not only for the NASA cost estimators, but for those who interface with cost estimators and need to understand the process. These others include Resource Managers who manage project budgets, engineers who are often asked to provide �“engineering estimates,�” and the cost estimating customer to include Project Managers and NASA leadership. The NASA CEH was written in a direct manner so users can utilize the CEH as a reference and designed so an estimator can copy and paste graphics or sections of text into customer presentations to help them understand the estimating process and help increase consistency in the cost estimating message presented to decision makers.
Accurate and defensible estimates are key to the credibility of the NASA Cost Estimating Community. The estimator must always remember that the ultimate customer is the cost-

Cost Estim
atingC
ost Risk
Economic &
Supporting AnalysisC
areer Developm
ent Guide
Reference
Know
ledge Managem
entC
ost Estimating
Cost R
iskEconom
ic & Supporting Analysis
Career D
evelopment G
uideR
eferenceK
nowledge M
anagement
2008 NASA Cost Estimating Handbook
Page iv
estimating discipline regardless of the customer and the decision maker. Truth and accuracy combined with a defensible and well-documented estimate will always earn the respect of the customer and decision maker. Cost estimation is part science, part art. There are many well-defined processes within the cost estimating discipline. There is also a subjective element to cost estimating that makes the discipline an art form learned over time and through experience. Cost estimating is not a �“black box�” process. The more understanding and credibility we gain with our customers, the more they will understand the structured process that cost estimators follow and the disciplined process and tools used in an estimate. An attempt is made to capture the art form as well as the science in this text. The current perception that cost estimating is a �“black box�” can be demystified by accurate, defensible, well-documented estimates that are consistently presented and can be easily understood. This handbook is a starting point.
This version of the CEH has continued the previous CEH versions�’ philosophy of staying connected to the NASA Cost Estimating Community. The goal of the 2008 CEH was to build upon the 2002 and 2004 versions by capturing the feedback of the community and include the new Program Analysis and Evaluation (PA&E) Cost Analysis Division (CAD) initiatives and leadership while keeping the CEH streamlined and easy to use understand and reference and to ensure that this data is presented in the most useful and relevant format for the NASA cost estimating community.
The CEH continues to build upon the success of the previous versions by keeping the development of subsequent versions a collaborative effort that involves the expertise and needs of the NASA Cost Estimating Community. With your help and constructive feedback, processes are tested, templates used, procedures navigated and they will evolve for the better. Speak your mind as you use this information. Check for updates to the CEH on the web site: http://www.ceh.nasa.gov/ and send comments to us at [email protected]. We want to hear from you.
Cost Estim
atingC
ost Risk
Economic &
Supporting AnalysisC
areer Developm
ent Guide
Reference
Know
ledge Managem
entC
ost Estimating
Cost R
iskEconom
ic & Supporting Analysis
Career D
evelopment G
uideR
eferenceK
nowledge M
anagement
2008 NASA Cost Estimating Handbook
Page v
Acknowledgements
Many people contributed to the publication of this 2008 edition of the CEH. The NASA Cost Analysis Steering Group (CASG) has proven once again to be the foundation of the CEH, providing hours of discussion and reviews. The information from these discussions formed a foundation for areas that needed to be enhanced, updated, or created in this version of the CEH to keep it a useful document for the estimator and the customer. Special thanks go to Tom Coonce and Sheryl McGurk for providing the leadership, direction and contractual means to update the CEH from the 2004 NASA CEH to the 2008 NASA CEH edition.
Many additional NASA personnel and others outside NASA have contributed their time to participate in workshops, interviews, and in many cases contributed data for write ups and reviewed drafts of many CEH topics. A complete list of participants in the 2008 NASA CEH can be found in the Reference Volume. Our thanks go to all participants and we acknowledge your important contribution to this edition of the NASA CEH.

Cost Estim
atingC
ost Risk
Economic &
Supporting AnalysisC
areer Developm
ent Guide
Reference
Know
ledge Managem
entC
ost Estimating
Cost R
iskEconom
ic & Supporting Analysis
Career D
evelopment G
uideR
eferenceK
nowledge M
anagement
2008 NASA Cost Estimating Handbook
Page vi
Table of Contents
Note: Volumes 2�–6 are available only in .pdf or web-based formats at www.ceh.nasa.gov
Volume 1 Cost Estimating Section 1. Introduction ................................................................................................................ 1-1 Section 2. The Role of Cost Estimating ..................................................................................... 1-2 Section 3. Cost Estimating at NASA.......................................................................................... 1-13 Section 4. Cost Estimating Process ............................................................................................ 1-19
Volume 2 Cost Risk Section 1. Cost Risk...................................................................................................................... 2-1 Section 2. Cost Risk Approaches................................................................................................ 2-15 Section 3. Model Summaries/Overview .................................................................................. 2-42 Section 4. Risk Handbook Summaries ...................................................................................... 2-53
Volume 3 Economic and Supporting Analysis Section 1. Economic Analysis..................................................................................................... 3-1 Section 2. Other Cost Estimating Considerations.................................................................... 3-33
Volume 4 NASA Cost Estimator Career Development Guide Section 1. Introduction to the NASA Cost Estimator Career Development Guide ............ 4-1 Section 2. Cost Estimator Career Development Philosophy.................................................. 4-4 Section 3. Leadership Development Philosophy..................................................................... 4-5 Section 4. Minimum Actions to Ensure Effective Career Development............................... 4-6 Section 5. Career Directions and General Career Paths.......................................................... 4-7 Section 6. General and Technical Competencies ..................................................................... 4-9 Section 7. Attitudes...................................................................................................................... 4-10 Section 8. Training and Development Experiences................................................................. 4-11 Section 9. Certification and Continuing Professional Education .......................................... 4-14 Section 10. Individual Development Planning .......................................................................... 4-17 Appendix A: Scope......................................................................................................................... 4-28 Appendix B: Job Category Definitions ........................................................................................ 4-29 Appendix C: General Competencies and Associated Training................................................ 4-34 Appendix D: Technical Competencies for Cost Estimators...................................................... 4-44 Appendix E: Core Curriculum...................................................................................................... 4-52 Appendix F: Training Providers................................................................................................... 4-54 Appendix G: Training Providers and Other Training Links .................................................... 4-64 Appendix H: Mentoring and Coaching....................................................................................... 4-65
Volume 5 Knowledge Management Section 1. Cost Estimating Knowledge Management Dimensions ....................................... 5-1
Volume 6 Reference Section 1. NASA Specific Cost Estimating Resources............................................................. 6-1 Section 2. Cost Estimating Resources........................................................................................ 6-23 Section 3. Acronyms .................................................................................................................... 6-29 Section 4. Glossary....................................................................................................................... 6-38 Section 5. Acknowledgements ................................................................................................... 6-59 Section 6. Index ............................................................................................................................ 6-60

Cost Estim
atingC
ost Risk
Economic &
Supporting AnalysisC
areer Developm
ent Guide
Reference
Know
ledge Managem
entC
ost Estimating
Cost R
iskEconom
ic & Supporting Analysis
Career D
evelopment G
uideR
eferenceK
nowledge M
anagement
2008 NASA Cost Estimating Handbook
Page vii
Figures and Tables
Figure 1-1 The Triple Constraint Concept.......................................................................................... 1-4 Figure 1-2. NASA and the PMA .......................................................................................................... 1-5 Figure 1-3. Cost, Schedule, Budgeting, and Reporting Integrations............................................... 1-6 Figure 1-4. Creating the President�’s Budget ...................................................................................... 1-7 Figure 1-5. Continuous Flow of the Federal Budgeting Cycle ........................................................ 1-8 Figure 1-6. NASA's Planning Programming Budgeting Execution Process.................................. 1-9 Figure 1-7. The Cost Estimating and Budgeting Connection .......................................................... 1-12 Figure 1-8. NASA Cost Estimating Organizations and Interfaces .................................................. 1-13 Figure 1-9. Project Categorizations...................................................................................................... 1-18 Figure 1-10. The Cost Methodology Process...................................................................................... 1-19 Figure 1-11. Four Critical Elements to Understand and Agree Before Conducting a Cost
Estimate............................................................................................................................. 1-21 Figure 1-12. Parametric Cost Estimating Process Steps.................................................................... 1-27 Figure 1-13. Cost Complexity Chart.................................................................................................... 1-28 Figure 1-14. Method for Developing Engineering Build Up Estimate ............................................ 1-32 Figure 1-15. Life Cycle Influence ......................................................................................................... 1-45 Figure 2-1. When Integrated Cost-Risk is Required........................................................................... 2-7 Figure 2-2. Statistics of the Triangular and Normal Distributions................................................... 2-11 Figure 2-3. Central Limit Theorem....................................................................................................... 2-11 Figure 2-4. Cost Modeling and Technical Input Risk ........................................................................ 2-13 Figure 2-5. Statistical Scenario Based Method (Garvey).................................................................... 2-16 Figure 2-6. Standard Deviation on a Normal Distribution Curve ................................................... 2-17 Figure 2-7. Cumulative Normal Distribution Curve ......................................................................... 2-19 Figure 2-8. Cumulative Lognormal Distribution Curve.................................................................... 2-19 Figure 2-9. Normal and Lognormal Distributions ............................................................................. 2-22 Figure 2-10. Triangular Distribution Example.................................................................................... 2-23 Figure 2-11. Culmination of CER and Technical Risk ....................................................................... 2-24 Figure 2-12. Statistical Summation Process Results (SSCAG Space Systems Cost Risk
Handbook page 14).......................................................................................................... 2-26 Figure 2-13. 5X5 Risk Matrix ................................................................................................................. 2-28 Figure 2-14. 5x5 Matrix Cost Risk Conversion Process Summary ................................................... 2-29 Figure 2-15. Program Activities/Risks Map ....................................................................................... 2-31 Figure 2-16. Risk Adjusted Cost (RAC) and Risk Adjusted Schedule (RAS) ................................. 2-32 Figure 2-17. Risk Assessment Template Example.............................................................................. 2-33 Figure 2-18. Design & Engineering Risk Template Example............................................................ 2-34 Figure 2-19. Complexity Risk Template Example .............................................................................. 2-35 Figure 2-20. Interaction/Interdependency Template Example........................................................ 2-35 Figure 2-21. Reference Parameter Values ............................................................................................ 2-37 Figure 2-22. Discrete Risk Analysis Using the RRW Process............................................................ 2-38
Cost Estim
atingC
ost Risk
Economic &
Supporting AnalysisC
areer Developm
ent Guide
Reference
Know
ledge Managem
entC
ost Estimating
Cost R
iskEconom
ic & Supporting Analysis
Career D
evelopment G
uideR
eferenceK
nowledge M
anagement
2008 NASA Cost Estimating Handbook
Page viii
Figure 2-23. Portfolio Effect Assuming Normally Distributed Total Project Costs ....................... 2-39 Figure 2-24. S-Curve and Cumulative S-Curve .................................................................................. 2-40 Figure 2-25. NAFCOM CER Major Inputs .......................................................................................... 2-45 Figure 2-26. Effect of Correlation on Estimates .................................................................................. 2-46 Figure 2-27. NAFCOM Probability Distribution Function Report................................................... 2-47 Figure 2-28. Available ACEIT tools...................................................................................................... 2-47 Figure 2-29. ACEIT Cost Estimating Risk Input screen..................................................................... 2-47 Figure 2-30. ACEIT Technical Risk Input Screen ............................................................................... 2-48 Figure 2-31. ACEIT Correlation Input Screen..................................................................................... 2-48 Figure 2-32. ACEIT Cost Risk Reports................................................................................................. 2-49 Figure 2-33. Future ACEIT Cost Risk output reports ........................................................................ 2-49 Figure 2-34. Crystal Ball Cost Estimating Risk Input Screen............................................................ 2-50 Figure 2-35. Crystal Ball Correlation Input Screen............................................................................. 2-50 Figure 2-36. Crystal Ball Cost Estimating Risk input screen............................................................. 2-51 Figure 2-37. Crystal Ball Correlation input screen ............................................................................. 2-51 Figure 2-38. Rollup to a Total Cost Estimate (Page 14 SSCRH)........................................................ 2-54 Figure 2-39. Normal, Triangular, Uniform, and Lognormal Probability Distributions ................ 2-55 Figure 2-40. CER Input Distribution, CER Output Distribution, Correlation Matrix,
Simulation Results ........................................................................................................... 2-56 Figure 2-41. Cost Risk Analysis Interaction with the Risk Management Process.......................... 2-56 Figure 2-42. Budget Risk........................................................................................................................ 2-57 Figure 2-43. Unallocated Future Expense............................................................................................ 2-57 Figure 2-44. Approaches to Calculate Total Estimate Uncertainty .................................................. 2-60 Figure 2-45. Combining Input Uncertainties ...................................................................................... 2-62 Figure 2-46. Generating the Statistics of the WBS Parent levels....................................................... 2-62 Figure 2-47. Impact of Adding Applied Correlation On Top of Functional Correlation.............. 2-63 Figure 2-48. Allocating Risk Dollars from the Second Level WBS in the Missile Example.......... 2-65 Figure 2-49. Time Phased Risk Allocated TY Dollars ........................................................................ 2-66 Figure 2-50. A Nonstatistical Scenario-Based Approach................................................................... 2-67 Figure 3-1. NASA New Start Inflation Index Excerpt and Example Calculations......................... 3-2 Figure 3-2. Cost versus Performance ................................................................................................... 3-3 Figure 3-3. CAIV Process Tailored to NASA ...................................................................................... 3-5 Figure 3-4. CAIV Trade Space............................................................................................................... 3-6 Figure 3-5. Beta Curve Cost Spreading............................................................................................... 3-10 Figure 3-6. BCA Framework.................................................................................................................. 3-12 Figure 3-7. Cost Benefit Analysis Framework .................................................................................... 3-12 Figure 3-8. Relationship between Present Value, Base Year, and Budget Year Dollars................ 3-15 Figure 3-9. Compounding and Discounting ....................................................................................... 3-16 Figure 3-10. Example of Discounting................................................................................................... 3-16 Figure 3-11. Net Present Value Calculation Example........................................................................ 3-18 Figure 3-12. Discounted Pay Back Period............................................................................................ 3-19 Figure 3-13. Gantt or Bar Chart............................................................................................................ 3-24

Cost Estim
atingC
ost Risk
Economic &
Supporting AnalysisC
areer Developm
ent Guide
Reference
Know
ledge Managem
entC
ost Estimating
Cost R
iskEconom
ic & Supporting Analysis
Career D
evelopment G
uideR
eferenceK
nowledge M
anagement
2008 NASA Cost Estimating Handbook
Page ix
Figure 3-14. PERT Chart / Logic Diagram......................................................................................... 3-24 Figure 3-15. Full Cost Simplification Methodology ........................................................................... 3-34 Figure 3-16. Function Point Analysis Summary Diagram ................................................................ 3-40 Figure 3-17. The Dual Modes of O&S Cost Estimating ..................................................................... 3-44 Figure 3-18. GOTS O&S Cost Model Capability................................................................................. 3-46 Figure 4-1. General Career Paths .......................................................................................................... 4-7 Figure 4-2. Career Growth Integration ................................................................................................ 4-9 Figure 4-3. NASA Career Planning Steps............................................................................................ 4-18 Figure 5-1. Lifecycle Cost Estimating Knowledge Management Dimensions ............................... 5-1 Figure 6-1. IPAO Cost Estimate Sufficiency Report (SR) ................................................................. 6-12 Figure 6-2. Technology Readiness Levels............................................................................................ 6-21 Figure 6-3. Customer Feedback Survey............................................................................................... 6-22 Table 1-1. Cost Estimating Community Impact ................................................................................ 1-6 Table 1-2. Major Cost Estimating Organizations within NASA...................................................... 1-14 Table 1-3. Cost Estimating Methodology Selection Chart................................................................ 1-27 Table 1-4. Regression Definitions ........................................................................................................ 1-29 Table 1-5. Evaluating Regression Analysis Results............................................................................ 1-29 Table 1-6. Strengths and Weaknesses of Parametric/CER Cost Methodology............................. 1-30 Table 1-7. Strengths and Weaknesses of Analogy Method of Cost Estimating............................. 1-31 Table 1-8. Strengths and Weaknesses of Engineering Build Up Method of Cost
Estimating ......................................................................................................................... 1-33 Table 1-9. Data Types and Sources...................................................................................................... 1-36 Table 1-10. Inflation and Escalation Terms ........................................................................................ 1-37 Table 2-1. Subjective Correlation Coefficients (SSCAG Space Systems Cost Risk
Handbook page 15).......................................................................................................... 2-25 Table 2-2. Example Application of Outputs-Based Simulation Set-up ........................................... 2-67 Table 2-3. Program Probabilities........................................................................................................... 2-68 Table 2-4. Portfolio Probabilities........................................................................................................... 2-68 Table 3-1. Slope by Industry.................................................................................................................. 3-8 Table 3-2. Types of Business Case Analysis: From the GAO Cost Assessment Guide ................ 3-13 Table 3-3. Full Cost Points of Contact .................................................................................................. 3-36 Table 3-4. Converting Between Physical and Logical SLOC ............................................................ 3-40 Table 3-5. Function Point Advantages and Disadvantages .............................................................. 3-41 Table 3-6. Effort Adjustment Multipliers for Software Heritage...................................................... 3-42 Table 3-7. Software Development Productivity for JPL and NASA Average Projects
(Equivalent Logical SLOC) ............................................................................................. 3-42 Table 3-8. Software Development Productivity for Industry Average Projects (Equivalent
Logical SLOC) .................................................................................................................. 3-43 Table 6-1. Roles and Responsibilities ................................................................................................... 6-4 Table 6-2. NASA Standard WBS.......................................................................................................... 6-6 Table 6-3. Cost Models & Tools with Active Data.............................................................................. 6-19 Table 6-4. Cost Models & Tools with Inactive Data........................................................................... 6-20

2008 NASA Cost Estimating Handbook
Volume 1 –Cost Estimating

Cost Estim
atingC
ost Risk
Economic &
Supporting AnalysisC
areer Developm
ent Guide
Reference
Know
ledge Managem
entC
ost Estimating
Cost R
iskEconom
ic & Supporting Analysis
Career D
evelopment G
uideR
eferenceK
nowledge M
anagement
2008 NASA Cost Estimating Handbook Contents
Volume 1 Page 1-i
Volume 1 Cost Estimating
Table of Contents
Section 1. Introduction....................................................................................................................... 1-1
Section 2. The Role of Cost Estimating........................................................................................... 1-2 2.1 The Importance of Life Cycle Management and Cost Estimating ................................. 1-2 2.2 Life Cycle Management and the Role Cost Plays............................................................. 1-4
2.2.1 The Triple Constraint Concept ............................................................................. 1-4 2.3 Government Wide Imperatives .......................................................................................... 1-4 2.4 NASA-Specific Imperatives................................................................................................. 1-6
2.4.1 The Federal Budget Process .................................................................................. 1-7 2.4.2 Budgeting at NASA................................................................................................ 1-8
2.5 Confidence Levels and Budgeting at NASA..................................................................... 1-12 2.6 NASA Full Cost Requirement............................................................................................. 1-12
Section 3. Cost Estimating at NASA................................................................................................ 1-13 3.1 The NASA Cost Estimating Community........................................................................... 1-13 3.2 Cost Estimating Products .................................................................................................... 1-14
3.2.1 Project Life Cycle Cost Estimate (LCCEs) ........................................................... 1-15 3.2.2 Independent Cost Estimates (ICEs)...................................................................... 1-15 3.2.3 Non-Advocate Review (NAR) .............................................................................. 1-15 3.2.4 Independent Annual Review (IAR) ..................................................................... 1-16 3.2.5 Cost Estimate Reconciliation................................................................................. 1-16 3.2.6 Announcement of Opportunity (AO) and NASA Research
Announcement (NRA) Proposal Estimates ........................................................ 1-16 3.2.7 Other NASA Cost Estimates ................................................................................. 1-17
3.3 Project Category Overviews................................................................................................ 1-17
Section 4. Cost Estimating Process .................................................................................................. 1-19 4.1 Part 1: Project Definition Tasks .......................................................................................... 1-20
4.1.1 Task 1: Receive Customer Request and Understand the Project..................... 1-20 4.1.2 Task 2: Build or Obtain WBS................................................................................ 1-21 4.1.3 Task 3: Obtain/Participate in the Development of Project Technical
Description .............................................................................................................. 1-23 4.2 Part 2: Cost Methodology Tasks ........................................................................................ 1-25
4.2.1 Task 4: Develop Ground Rules and Assumptions (GR&A).............................. 1-25 4.2.2 Task 5: Select Cost Estimating Methodology..................................................... 1-27 4.2.3 Task 6: Select/Construct Cost Model ................................................................. 1-33 4.2.4 Task 7: Gather and Normalize Data.................................................................... 1-35
4.3 Part 3: Estimate Tasks........................................................................................................... 1-38 4.3.1 Task 8: Develop Point Estimate ........................................................................... 1-38 4.3.2 Task 9: Develop and Incorporate Cost Risk Assessment ................................. 1-39 4.3.3 Task 10: Document Probabilistic Cost Estimate ................................................ 1-41 4.3.4 Task 11: Present Estimate Results........................................................................ 1-43 4.3.5 Task 12: Update Cost Estimate on Regular Basis .............................................. 1-44
4.4 Cost Estimating Considerations By Project Life Cycle Phases ....................................... 1-44 4.4.1 Pre-Phase A ............................................................................................................. 1-45

Cost Estim
atingC
ost Risk
Economic &
Supporting AnalysisC
areer Developm
ent Guide
Reference
Know
ledge Managem
entC
ost Estimating
Cost R
iskEconom
ic & Supporting Analysis
Career D
evelopment G
uideR
eferenceK
nowledge M
anagement
2008 NASA Cost Estimating Handbook Contents
Volume 1 Page 1-ii
4.4.2 Phase A Design Concept........................................................................................ 1-46 4.4.3 Phase B �– Detailed Design..................................................................................... 1-49 4.4.4 Phase C/D Design, Development Test and Evaluation (DDT&E) .................. 1-52 4.4.5 Special Case: Phase D (Production) .................................................................... 1-54 4.4.6 Phase E �– Operations, Support & Disposal ......................................................... 1-55
Figures and Tables
Figure 1-1 The Triple Constraint Concept.......................................................................................... 1-4 Figure 1-2. NASA and the PMA .......................................................................................................... 1-5 Figure 1-3. Cost, Schedule, Budgeting, and Reporting Integrations............................................... 1-6 Figure 1-4. Creating the President�’s Budget ...................................................................................... 1-7 Figure 1-5. Continuous Flow of the Federal Budgeting Cycle ........................................................ 1-8 Figure 1-6. NASA's Planning Programming Budgeting Execution Process.................................. 1-9 Figure 1-7. The Cost Estimating and Budgeting Connection .......................................................... 1-12 Figure 1-8. NASA Cost Estimating Organizations and Interfaces .................................................. 1-13 Figure 1-9. Project Categorizations...................................................................................................... 1-18 Figure 1-10. The Cost Methodology Process...................................................................................... 1-19 Figure 1-11. Four Critical Elements to Understand and Agree Before Conducting a Cost
Estimate............................................................................................................................. 1-21 Figure 1-12. Parametric Cost Estimating Process Steps.................................................................... 1-27 Figure 1-13. Cost Complexity Chart.................................................................................................... 1-28 Figure 1-14. Method for Developing Engineering Build Up Estimate ............................................ 1-32 Figure 1-15. Life Cycle Influence ......................................................................................................... 1-45 Table 1-1. Cost Estimating Community Impact ................................................................................ 1-6 Table 1-2. Major Cost Estimating Organizations within NASA...................................................... 1-14 Table 1-3. Cost Estimating Methodology Selection Chart................................................................ 1-27 Table 1-4. Regression Definitions ........................................................................................................ 1-29 Table 1-5. Evaluating Regression Analysis Results............................................................................ 1-29 Table 1-6. Strengths and Weaknesses of Parametric/CER Cost Methodology............................. 1-30 Table 1-7. Strengths and Weaknesses of Analogy Method of Cost Estimating............................. 1-31 Table 1-8. Strengths and Weaknesses of Engineering Build Up Method of Cost
Estimating ......................................................................................................................... 1-33 Table 1-9. Data Types and Sources...................................................................................................... 1-36 Table 1-10. Inflation and Escalation Terms ........................................................................................ 1-37

Cost Estim
atingC
ost Risk
Economic &
Supporting AnalysisC
areer Developm
ent Guide
Reference
Know
ledge Managem
entC
ost Estimating
Cost R
iskEconom
ic & Supporting Analysis
Career D
evelopment G
uideR
eferenceK
nowledge M
anagement
2008 NASA Cost Estimating Handbook Section 1. 381BIntroduction
Volume 1 Page 1-1
Section 1. Introduction
This volume approaches broad cost-estimating topics through general concept discussions and generic processes, techniques, and tool descriptions. It describes cost estimating as it should be applied to NASA projects and provides information on cost estimating and analysis practices. It does not provide actual policy guidance or project requirements, however it does provide details on how one would implement cost estimating requirements
found in NPR 7120.5D NASA Space Flight Program and Project Management Requirements.
Cost estimating requirements and approaches vary to some extent, based on the NASA Centers�’ differing missions. However, across NASA, the fundamental cost estimating requirements and approaches are the same. Each NASA cost estimating office may choose to supplement these general guidelines, when appropriate, with specific instructions, processes, and procedures that address each Center�’s unique situations and requirements. Furthermore, each cost estimator is expected to reach beyond these approaches and methodologies, when they prove inadequate or when circumstances warrant.

Cost Estim
atingC
ost Risk
Economic &
Supporting AnalysisC
areer Developm
ent Guide
Reference
Know
ledge Managem
entC
ost Estimating
Cost R
iskEconom
ic & Supporting Analysis
Career D
evelopment G
uideR
eferenceK
nowledge M
anagement
2008 NASA Cost Estimating Handbook Section 2. The Role of Cost Estimating
Volume 1 Page 1-2
Section 2. The Role of Cost Estimating
In this section, the handbook describes the importance of cost estimating both within the Government at large and specifically within the NASA community. There are many initiatives underway to improve project management and cost estimating at NASA. Some are described in this handbook. Strictly following the processes outlined in this handbook will bring NASA closer to improved cost estimating and project risk management.
2.1 The Importance of Life Cycle Management and Cost Estimating An integrated, process-centered, and disciplined approach to life cycle management of projects provides real and tangible benefits to all project stakeholders. Organizations that ask great things from their membership, like NASA, must provide them with the resources necessary to accomplish greatness. This includes the realistic estimates of what those resources will cost. That is why cost estimating is so important at NASA. Through upfront trade studies and cost-risk performance analyses joined with the application of proven software, hardware, and system engineering principles and best practices, risks inherent with the successful delivery of the right product on time and within budget are minimized. Additional inherent results include:
�• Early recognition of interoperability requirements and constraints
�• Complete, unambiguous, and documented functional requirements
�• Bounded and clearly defined product functional expectations and acceptance criteria, understood and agreed to by all stakeholders
�• More accurate, credible, and defensible scope, cost, and schedule estimates
�• More complete and timely risk identification, leading to more effective risk mitigation
�• A basis for properly quantifying, evaluating, and controlling the acceptance and timing of changes to requirements (i.e., precluding �“scope creep�”)
�• Final products that deliver better reliability, adaptability, usability, performance, maintainability, supportability, and functionality -- in short, higher quality and value
�• Insight into near, mid and long term technology, design, infrastructure and operational investment needs as they relate to different effects on the phases and trade-offs within the life-cycle
�• Earlier and more consistent visibility to problems (fewer surprises)
�• Shorter development cycles and reduced development and O&S costs
�• More efficient project management (management by exception reduces information overload and focuses resources on the most pressing issues)
�• Historical data to gauge process improvements and effectiveness
�• Promotion of organizational credibility and reputation

Cost Estim
atingC
ost Risk
Economic &
Supporting AnalysisC
areer Developm
ent Guide
Reference
Know
ledge Managem
entC
ost Estimating
Cost R
iskEconom
ic & Supporting Analysis
Career D
evelopment G
uideR
eferenceK
nowledge M
anagement
2008 NASA Cost Estimating Handbook Section 2. The Role of Cost Estimating
Volume 1 Page 1-3
This is not an all-inclusive list. Understanding the benefits of life cycle management for a project leads to better understanding of the cost estimate and its role in the project life cycle. Understanding the type of estimate that is required and being conducted is important for the cost estimator to provide a useful estimate to the decision makers.
Cost estimates are key elements of a project plan and project personnel expend considerable effort preparing them. They provide the basis for programming the total requirement and the recommended phasing of budgets. Obtaining accurate cost estimates can be difficult as NASA projects usually involve new technologies and require years to complete. Inaccurate estimates can result from an inability to predict and/or define requirements, technological advancements, task complexity, economic conditions, schedule requirements, support environments, or system employment concepts adequately. Worse, managers sometimes feel pressured to provide optimistic estimates in order to obtain project go-ahead approval. Yet a poor cost estimate can create an unexecutable plan.
A project with an inaccurate cost estimate eventually must face the consequences. A poor cost estimate is a destablizer. When the faulty estimate is discovered, a revised plan based on the adjusted cost will be needed if the project is to continue.
Accurate and reliable cost estimating has a direct, positive impact on NASA. NASA�’s cost estimating community does not take this responsibility lightly because:
�• Overestimating Life Cycle Costs (LCCs) may result in the program being deemed unaffordable and therefore risking not being funded
�• Underestimating LCCs will prevent decision-makers from allocating the proper funding required to support the project
�• Properly estimating cost supports the budgeting and funding profile process
�• Repeatable and documented estimates allows �“apples to apples�” comparisons to occur, supporting the decision-making process
A Life Cycle Cost Estimate (LCCE) is an estimate that includes total cost of ownership over the system life cycle, including all project feasibility, project definition, system definition, preliminary and final design, fabrication and integration, deployment, operations and disposal efforts. It provides an exhaustive and structured accounting of all resources necessary to identify all cost elements including development, deployment, operation and support and disposal costs. A LCCE is used for budgetary decisions, system trades and studies, milestone review support, and to determine a projects viability, appropriate scope, and size

Cost Estim
atingC
ost Risk
Economic &
Supporting AnalysisC
areer Developm
ent Guide
Reference
Know
ledge Managem
entC
ost Estimating
Cost R
iskEconom
ic & Supporting Analysis
Career D
evelopment G
uideR
eferenceK
nowledge M
anagement
2008 NASA Cost Estimating Handbook Section 2. The Role of Cost Estimating
Volume 1 Page 1-4
2.2 Life Cycle Management and the Role Cost Plays
2.2.1 The Triple Constraint Concept A project can have numerous goals and objectives, depending on its size, structure, and complexity, but they all intersect when making decisions. This intersection often requires tradeoffs among competing objectives and goals. The specific tradeoffs may vary from project to project, but they always return to the concept of the triple constraint �– technical requirements, schedule, and cost. Following an integrated, process-centered, and disciplined approach to life cycle management will drive results, improve cost and risk performance, and allow NASA to be responsive to Government- wide imperatives.
2.3 Government Wide Imperatives Over the past 18 years, Congress has enacted legislation to change the way Federal agencies address common management problems and to address public opinion that Federal agencies should do their jobs more efficiently and effectively with fewer people and at lower costs. Using cost data to drive decision-making is essential in an era of stiff competition for limited resources. The legislative and policy framework requiring cost accountability include:
Government-Wide Imperatives
Chief Financial Officers Act of 1990 Government Performance & Results Act (GPRA) of 1993 Federal Acquisition Streamlining Act of 1994 (Title V) Paperwork Reduction Act of 1995 Federal Financial Management Improvement Act of 1996 Clinger-Cohen Act of 1996 (also known as ITMRA) Circular A-11, Preparation and Submission of Budget Estimates Government Paperwork Elimination Act of 1998 Circular A-127, Financial Management Systems Circular A-123, Management Accountability and Control OMB memorandum M-97-02, October 25, 1996, Funding Information Systems Investments Circular A-130, Management of Federal Information Resources Circular A-76, Competitive Analysis “Performance of Commercial Activities” OMB memorandum M-00-07, February 28, 2000, Incorporating and Funding Security in
Information Systems Investments
These new �“accountability�” laws and regulations, especially GPRA, are aimed at improving project performance. This legislative framework tasks government agencies like NASA to:
�• Focus on agency mission, strategic goals, performance, and outcomes �• Make strategic decisions about fiscal investments �• Get the biggest �“bang for the buck�” �• Deliver results
RISK
Technical
Schedule Cost
Figure 1-1 The Triple Constraint Concept

Cost Estim
atingC
ost Risk
Economic &
Supporting AnalysisC
areer Developm
ent Guide
Reference
Know
ledge Managem
entC
ost Estimating
Cost R
iskEconom
ic & Supporting Analysis
Career D
evelopment G
uideR
eferenceK
nowledge M
anagement
2008 NASA Cost Estimating Handbook Section 2. The Role of Cost Estimating
Volume 1 Page 1-5
For Federal Executive Agencies, the policy imperatives require capital planning and business case analysis and are supported by the guidance and reporting requirements incorporated into the Federal budget process by the Office of Management and Budget (OMB) in Circulars A-11, A-130, and A-94.
The President�’s Management Agenda (PMA)1 identifies five mutually reinforcing Government-wide initiatives. The Executive Branch Management Scorecard tracks how well the Government�’s departments and major agencies are executing these. The NASA cost estimating community will have a direct impact on three: Competitive Sourcing, Improved Financial Performance, and Budget and Performance Integration (see Figure 1-2 below).
Competitive Sourcing Detailed estimates of full cost government performance to the taxpayer are needed for identifying the most efficient means of accomplishing a task. NASA converted to Full Cost in GFY 2004 and all NASA cost estimates reflect full cost.
Improved Financial Performance Erroneous payments and accounting errors reduce confidence in Government systems. Changes will be made in the budget process to allow “better measure of the real cost and performance of programs.”
Budget and Performance IntegrationImprovements will have little impact unless they are linked to better results. A budget comparison of procurement funds requested and identified need is not an accurate measure of performance results achieved with previous budgets.
The NASA cost estimating community provides estimates in full cost. We have influence on this initiative by providing estimates to support studies, and conducting trade studies for efficiency.
The NASA cost estimating community can have an impact on this initiative by providing timely and accurate cost estimates that serve as performance baselines and reconciling and updating the estimates frequently.
Realistic and defensible cost estimates, integrated and incorporated, into the NASA IBPDs can have an impact on future requirements and demonstrating results.
Figure 1-2. NASA and the PMA
Congress and OMB want to ensure NASA is achieving its objectives and desire greater visibility into how budgets are being utilized. For example, in the recently passed FY 2008 Appropriations Conference Report it was noted that �“The Appropriations Committees reiterate concern expressed in the House report that NASA is not able to anticipate adequately technical problems and project overruns on existing programs, and are especially concerned that new programs, such as Project Constellation, will encounter similar problems.�”
One way NASA is mitigating this concern is by integrating cost and schedule data with budgeting and external reporting activities. Figure 1-3 below presents how the Program Analysis and Evaluation Office (PA&E) is responding to this need.
1 For more, see the President�’s Management Agenda at http://www.whitehouse.gov/omb/budintegration/pma_index.html.

Cost Estim
atingC
ost Risk
Economic &
Supporting AnalysisC
areer Developm
ent Guide
Reference
Know
ledge Managem
entC
ost Estimating
Cost R
iskEconom
ic & Supporting Analysis
Career D
evelopment G
uideR
eferenceK
nowledge M
anagement
2008 NASA Cost Estimating Handbook Section 2. The Role of Cost Estimating
Volume 1 Page 1-6
Let projects known when a threshold has been exceeded
Direct Costsfrom Project
Indirect Costsfrom OCFO
Quarterly data
collection
Consolidated Data Tracking
PA&E, Strategic Investments Division
Budget & MPAR
GAOReporting
OMBReports
Figure 1-3. Cost, Schedule, Budgeting, and Reporting Integrations
Following this approach is allowing NASA to evaluate cost estimates and perform comparative analysis with budget data and external reports, which should lead to improved budget plans and cost estimates.
2.4 NASA-Specific Imperatives NASA is constantly striving to deliver maximum results with its limited budget. It is the responsibility of the NASA cost estimating community to revitalize and enhance the current cost estimating infrastructure. This transformation is providing greater information management support, more accurate and timely cost estimates, and more complete cost risk assessments that will increase the credibility of the cost estimates that NASA cost estimating community produces, and in turn, the credibility of NASA as an agency.
The NASA cost estimating community serves to provide decision-makers throughout NASA with accurate, reliable, and defensible cost estimates. These cost estimates are one of the best tools available to meet NASA�’s stated objectives (see Table 1-1).
Table 1-1. Cost Estimating Community Impact
NASA Cost Community Contributions to Each Goal Impact
Credible cost estimates are critical to sound management decisions Collecting, managing and sharing cost data across the entire agency Protecting data from our projects and our contractors Cost trade analysis to optimize use of resources Career development plan for cost estimators
Enable the Agency to carry out its responsibilities effectively, efficiently, and safely through sound management decisions and practices
Credible cost estimates are critical to providing effective and efficient services
Provide cost estimating to technology insertion studies, analyze the economics of commercial partnerships
Work synergistically with NASA’s engineering capability Provide knowledge capture and implementation of cost effective best
practices to support continuous improvement
Enable NASA's Mission Directorates and their Centers to deliver products and services to our customers more effectively and efficiently
Support decision making for funding, prioritizing and selecting research projects with credible cost estimates
Archive, maintain and share data Capture and share lessons learned and best practices
Extend the boundaries of knowledge of science and engineering through high-quality research
Cost Estim
atingC
ost Risk
Economic &
Supporting AnalysisC
areer Developm
ent Guide
Reference
Know
ledge Managem
entC
ost Estimating
Cost R
iskEconom
ic & Supporting Analysis
Career D
evelopment G
uideR
eferenceK
nowledge M
anagement
2008 NASA Cost Estimating Handbook Section 2. The Role of Cost Estimating
Volume 1 Page 1-7
Cost estimating has taken on a greater importance in light of government legislation and guidance directing agencies to be more accountable and responsible stewards of taxpayer dollars. Whereas years ago, cost estimating was used solely as a means of getting project money (i.e., arriving at a number to plug in a budget), now its utility and power cannot be overlooked or denied. Its ability to tie costs with benefits and risks is essential for decision makers as they prepare the necessary project documentation to receive funding [e.g., OMB 300s or the NASA Integrated Budget Performance Document (IBPD)].
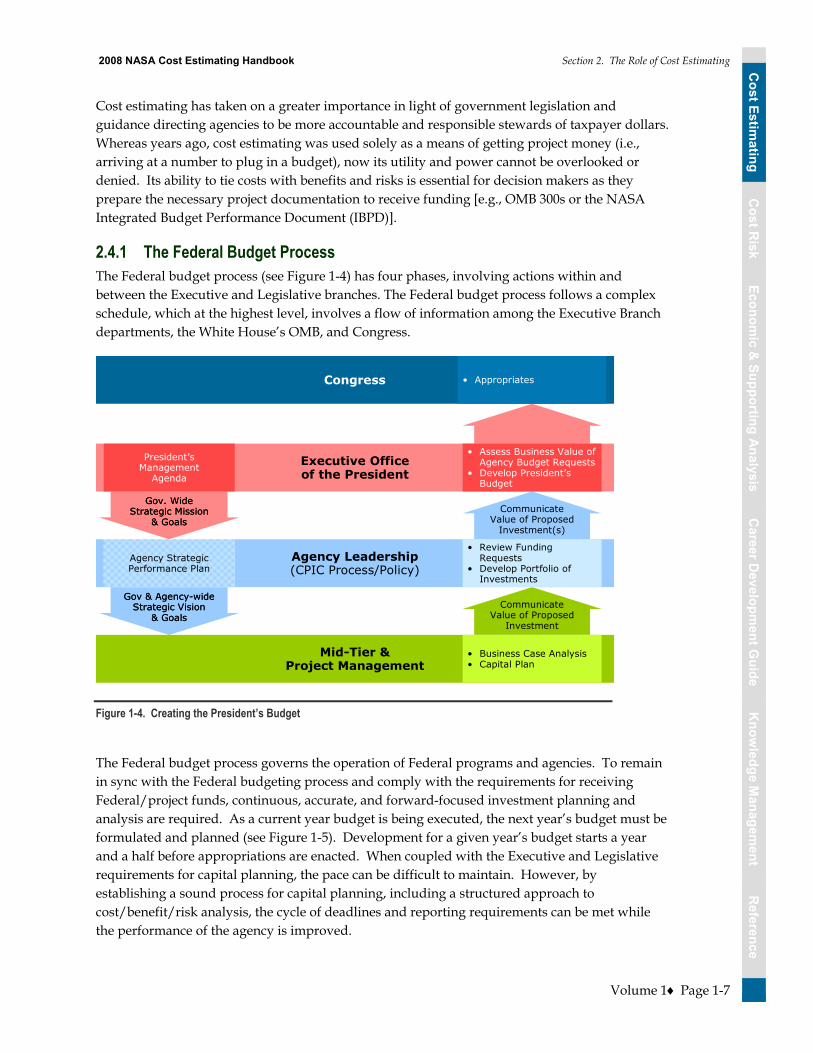
2.4.1 The Federal Budget Process The Federal budget process (see Figure 1-4) has four phases, involving actions within and between the Executive and Legislative branches. The Federal budget process follows a complex schedule, which at the highest level, involves a flow of information among the Executive Branch departments, the White House�’s OMB, and Congress.
Congress
Executive Officeof the President
Agency Leadership(CPIC Process/Policy)
Mid-Tier &Project Management
CommunicateValue of Proposed
Investment
• Appropriates
Agency Strategic Performance Plan
Gov & Agency-wideStrategic Vision
& Goals
Gov. WideStrategic Mission
& Goals
Gov & Agency-wideStrategic Vision
& Goals
Gov. WideStrategic Mission
& Goals
President’sManagement
Agenda
• Business Case Analysis• Capital Plan
CommunicateValue of Proposed
Investment(s)
• Review Funding Requests
• Develop Portfolio of Investments
• Assess Business Value of Agency Budget Requests
• Develop President’s Budget
Figure 1-4. Creating the President’s Budget
The Federal budget process governs the operation of Federal programs and agencies. To remain in sync with the Federal budgeting process and comply with the requirements for receiving Federal/project funds, continuous, accurate, and forward-focused investment planning and analysis are required. As a current year budget is being executed, the next year�’s budget must be formulated and planned (see Figure 1-5). Development for a given year�’s budget starts a year and a half before appropriations are enacted. When coupled with the Executive and Legislative requirements for capital planning, the pace can be difficult to maintain. However, by establishing a sound process for capital planning, including a structured approach to cost/benefit/risk analysis, the cycle of deadlines and reporting requirements can be met while the performance of the agency is improved.

Cost Estim
atingC
ost Risk
Economic &
Supporting AnalysisC
areer Developm
ent Guide
Reference
Know
ledge Managem
entC
ost Estimating
Cost R
iskEconom
ic & Supporting Analysis
Career D
evelopment G
uideR
eferenceK
nowledge M
anagement
2008 NASA Cost Estimating Handbook Section 2. The Role of Cost Estimating
Volume 1 Page 1-8
Execute FY X + 1 Budget
Congress reviews the President’s FY X + 1 budget, develops its own budget and approves spending and revenue bills
Execute FY X Budget
OMB Prepares the President’s Budget and forwards it to Congress
Appeals/Appeals Resolution
OMB Passback
OMB Review of Budget Reviews
October -September
September
August
July
June
May
April
March
February
December
November
October
January X + 1
September
July
June
May
August
March
February
January X
April
OMB prepares FY X budget documentation and forwards it to Congress
Congress reviews the President’s FY X budget, develops its own budget, and approves spending and revenue bills
Identify Initiatives for FY X + 1
Identify Alternative Solutions for FY + 1
Conduct & Document Capital Plan / Business Case (prepare cost estimates) for FY + 1
Internal Review of FY + 1 Budget Requests
FY X + 1 IBPD submitted to OMB
Prepare IBPD
Preparing for FY X
Preparing forFY X + 1
Preparing forFY X + 2
OMB Review of Budget Requests
Prepare FY X + 2 IBPD
Internal Review
Conduct & Document Capital Plan / Business Case Analysis (prepare cost estimates)
Identify Initiatives
Identify Alternative Solutions
FY X + 2 IBPD Submitted to OMB
Figure 1-5. Continuous Flow of the Federal Budgeting Cycle
2.4.2 Budgeting at NASA Over the past few years NASA�’s budgeting practices were change to provide a fully integrated approach with other planning and execution practices. This was manifested in a formalized policy to utilize the Planning Programming Budgeting and Execution (PPBE) process as an agency-wide methodology for aligning resources in a comprehensive, disciplined, top-down approach. NASA�’s PPBE supports the agency�’s vision and mission and focuses on translating strategy into actionable programs and brings together agency priorities and strategic outcomes within the agency�’s resource constraints.

Cost Estim
atingC
ost Risk
Economic &
Supporting AnalysisC
areer Developm
ent Guide
Reference
Know
ledge Managem
entC
ost Estimating
Cost R
iskEconom
ic & Supporting Analysis
Career D
evelopment G
uideR
eferenceK
nowledge M
anagement
2008 NASA Cost Estimating Handbook Section 2. The Role of Cost Estimating
Volume 1 Page 1-9
The PPBE Process NASA tailored the PPBE process to capitalize on analytical approaches to decision-making with several benefits to the Agency:
�• A focus on ensuring successful implementation of the strategic goals
�• Strong emphasis on a high-level, multi-year structured analysis of alternatives and capabilities
�• Clearly defined roles and responsibilities
�• Complete and integrated budget process outputs
�• Strong emphasis on performance and resource management
�• Less repetitive calculation of budget details
�• Timely, high-quality budget support of NASA�’s mission
�• A stable funding baseline plan to expedite and streamline funds distribution
Figure 1-6 provides an overview of the PPBE process at NASA, as referenced in the NASA Financial Management Requirements, Volume 4:
Internal/External Studies & Analysis
Planning
NASA Strategic Plan
Program & Resources Guidance
Programming
Program Analyses & Alignment
Programmatic & Institutional
Guidance
Budgeting
OMB Budget Development
Operating Plan & Reprogramming
Execution
Monthly Phasing Plans
Annual Performance
Goals
Implementation Plans
Institutional Infrastructure
Analyses
Program Review/ Issues Book
President’s Budget
Analyses of Performance/ Expenditures
Close-Out
StrategicPlanning Guidance
Program Decision Memorandum
(PDM)Appropriation
Performance & Accountability
Report
Figure 1-6. NASA's Planning Programming Budgeting Execution Process
PPBE goes beyond NASA�’s traditional Program Operating Plan (POP) budget approaches of the past and introduced an enhanced level of analysis to ensure that resource alignment supports the accomplishment of agency strategic goals and objectives.

Cost Estim
atingC
ost Risk
Economic &
Supporting AnalysisC
areer Developm
ent Guide
Reference
Know
ledge Managem
entC
ost Estimating
Cost R
iskEconom
ic & Supporting Analysis
Career D
evelopment G
uideR
eferenceK
nowledge M
anagement
2008 NASA Cost Estimating Handbook Section 2. The Role of Cost Estimating
Volume 1 Page 1-10
PA&E and the Office of the Chief Financial Officer (OCFO) jointly govern the PPBE processes with PA&E having the primary responsibility for the Planning and Programming Phases, and the OCFO has primary responsibility for the Budgeting and Execution Phases. The PPBE process is divided into four phases with multiple steps in each phase. The process begins with senior management developing strategic planning guidelines, which are then translated into actionable programs by the analysis of resource requirements and development of budget documents, including justification data and supporting narratives, and followed by the implementation of fully executable Agency Operating and Agency Execution Plans. Most of this process is pre-decisional in nature, and data confidentiality must be maintained. It is not to be discussed outside the agency, either to the public, media, or Congress, unless specifically approved by OCFO and PA&E. Each of the Phases is described in more detail below:
Planning Phase NASA�’s planning activities include analyzing changing internal and external conditions, trends, threats, and technologies that will affect the Agency; examining alternative strategies for adjusting to these changes and conditions; and defining long-term strategic goals, multi-year outcomes, and short-term performance goals that will challenge and enable the agency to achieve its mission. Planning activities also include developing NASA�’s performance measurement strategy and specific metrics that will be used to monitor, assess, and report on the agency�’s progress toward achieving these goals. The current NASA Strategic Plan, NASA�’s Governance and Strategic Management Requirements, GPRA, and other internal and external requirements provide policy for the Planning Phase activities. The steps included in the Planning Phase are listed below.
�• Conduct internal/external studies and analyses �• Develop/update NASA Strategic Plan �• Establish annual performance goals �• Establish implementation planning �• Establish strategic planning guidance
The PPBE Programming and Budgeting Phases use the products developed in the Planning Phase to develop the priorities and content of NASA�’s annual budget.
Programming Phase The Programming Phase included the definition and analysis of programs and projects, together with their multi-year resource implications, and the evaluation of possible alternatives, including a risk assessment of each option. Programming also serves to balance and integrate resources among the various programs according to identified priorities. The steps in this phase are listed below.
�• Develop Program and Resources Guidance �• Conduct program analyses and alignment �• Conduct institutional infrastructure analyses �• Prepare program review/issues book �• Develop Program Decision Memorandum

Cost Estim
atingC
ost Risk
Economic &
Supporting AnalysisC
areer Developm
ent Guide
Reference
Know
ledge Managem
entC
ost Estimating
Cost R
iskEconom
ic & Supporting Analysis
Career D
evelopment G
uideR
eferenceK
nowledge M
anagement
2008 NASA Cost Estimating Handbook Section 2. The Role of Cost Estimating
Volume 1 Page 1-11
During the Programming Phase of the PPBE it is important to utilized sound cost estimates to ensure the fidelity of the full life-cycle costs of the programs are captured. In addition, proper documentation of estimates is critical to support the budget figures as they move through the Budgeting Phase.
Budgeting Phase The Budgeting Phase includes justification of the budget to OMB and Congress. The steps of the Budgeting Phase are listed below.
�• Establish programmatic and institutional guidance �• Review OMB Budget �• Implement President�’s Budget �• Create Appropriation
Execution Phase The Execution Phase is the process by which financial resources are made available to agency components and managed to achieve the purposes and objectives for which the budget was approved. The steps in this phase are listed below.
�• Establish operating plan �• Create and follow monthly phasing plan �• Conduct analysis of performance/expenditures �• Implement Close-Out �• Prepare Performance & Accountability Report (PAR)
NASA’s Integrated Budget Performance Document
As required by Federal law, NASA consolidates all of its budget inputs into the IBPD for Congressional Submission. The IBPD supplies:
�• Budget information (i.e., the IBPD is the budget format) �• Performance commitments and metrics supported by this budget �• 7120.5D compliant Key Decision Points Performance Baselines �• Commitment to proceed to development [i.e., the development sheet captures all the
information of a Program Commitment Agreement (PCA)] �• Supplemental project information for OMB (i.e., OMB 300B forms) �• Detailed cost and schedule information by phase, year, and WBS level
How Cost Estimates Feed into the NASA Budget
Cost estimating is a critical first step in establishing program budgets for NASA. Within the context of NASA PPBE process, Figure 1-7 provides an overview of the process.

Cost Estim
atingC
ost Risk
Economic &
Supporting AnalysisC
areer Developm
ent Guide
Reference
Know
ledge Managem
entC
ost Estimating
Cost R
iskEconom
ic & Supporting Analysis
Career D
evelopment G
uideR
eferenceK
nowledge M
anagement
2008 NASA Cost Estimating Handbook Section 2. The Role of Cost Estimating
Volume 1 Page 1-12
Congress
Pre-PhaseA
PhaseA
PhaseB
PhaseC/D
Special Case Phase D
est. range of cost
prob
abili
ty
est. range of cost
prob
abili
ty
Phase E
est. range of cost
prob
abili
ty
est. range of cost
prob
abili
ty
est. range of cost
prob
abili
ty
est. range of cost
prob
abili
ty
est. range of cost
prob
abili
ty
est. range of cost
prob
abili
ty
est. range of cost
prob
abili
ty
est. range of cost
prob
abili
ty
est. range of cost
prob
abili
ty
est. range of cost
prob
abili
ty
est. range of cost
prob
abili
ty
OMB
PDRPre-PDR
NAR**
CDR**
* Denotes organizations that may perform advocacy or non-advocacy estimates or both
** Reconciliation review may be initiated after each milestone
Governing PMC may be initiated at each milestone
NASA HQ
MultiplePrime
Contractor
Engineering Organization
ProjectOffice
CFO*
SMO*
ADVOCACY ESTIMATES
NON-ADVOCACY ESTIMATES
CFO*
SMO* NASA IPAO
How Cost Estimators Add Value to One NASA Budget Process:
Many People Are Involved in Building a Credible Cost Estimate
Figure 1-7. The Cost Estimating and Budgeting Connection
2.5 Confidence Levels and Budgeting at NASA NASA Mission Directorates must be able to prepare and submit project budget requests that reflect a 70% confidence level based on an independent cost estimate which can be funded by the project, Mission Directorate, or performed by NASA�’s Independent Program Assessment Office (IPAO). Requiring projects to maintain a 70 % confidence level is one of the more important ways that NASA can improve the quality of its cost estimates, its ability to stay within budget guidelines, and hence its reputation with its external stakeholders. Further information pertaining to Cost Risk at NASA can be found in the Cost Risk Volume of this handbook.
2.6 NASA Full Cost Requirement To be consistent with guidance from the 1990 Chief Financial Officers Act, the 1993 Government Performance and Results Act, the 1995 NASA Zero Base Review, and the 1996 Federal Financial Management Improvement Act, NASA initiated a full cost concept in 1995 and began budgeting and accounting in Full Cost for FY 2004. Under the original full cost approach, NASA allocated the cost to run each Center to projects based upon their workforce at the Center. Since costs to operate a Center are not solely a function of the size of the workforce, the overhead costs for the smaller Centers were significantly higher than for the larger Centers. To eliminate the cost advantages/disadvantages between Centers, beginning in fiscal year 2007, NASA is managing Center overhead costs with a single rate for all nine Federal centers. A single Agency-wide rate for Center Management and Operations (CM&O) will be allocated to each of the Agency�’s non-JPL projects and programs based on each project�’s direct budget. A more detailed description of NASA�’s full cost approach is provided in the Economic & Supporting Analysis Volume, Section 2.1 Full Cost Accounting.
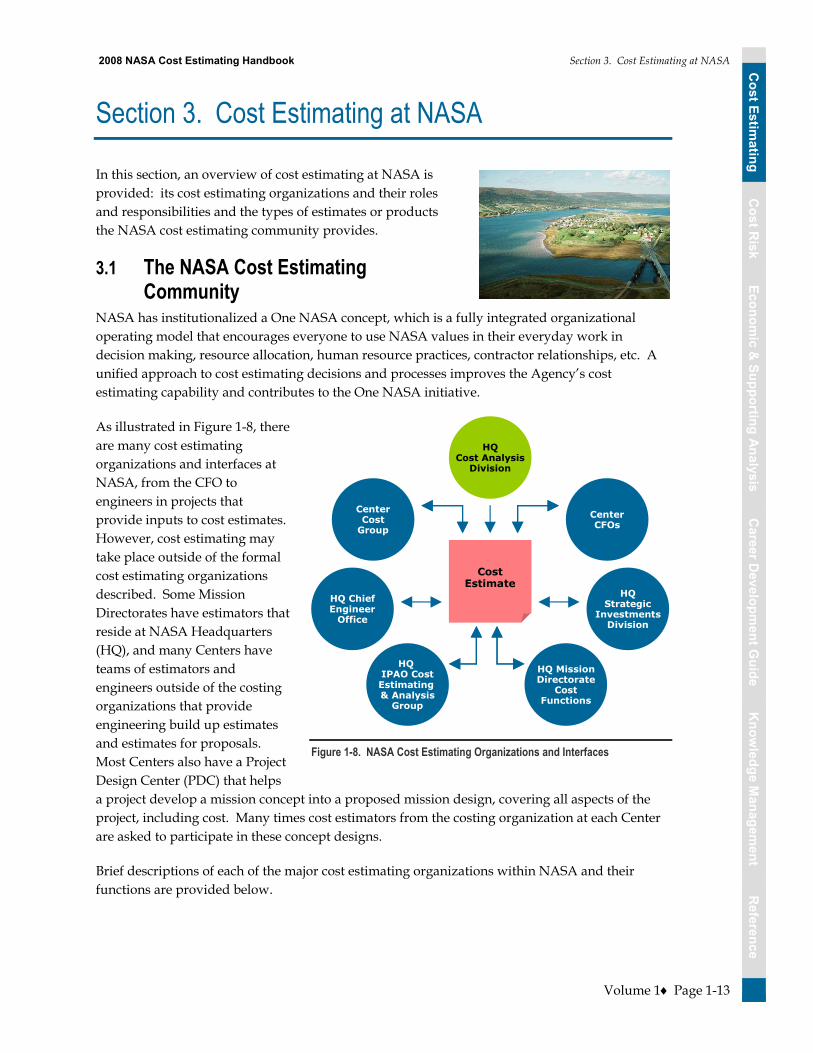
Cost Estim
atingC
ost Risk
Economic &
Supporting AnalysisC
areer Developm
ent Guide
Reference
Know
ledge Managem
entC
ost Estimating
Cost R
iskEconom
ic & Supporting Analysis
Career D
evelopment G
uideR
eferenceK
nowledge M
anagement
2008 NASA Cost Estimating Handbook Section 3. Cost Estimating at NASA
Volume 1 Page 1-13
Section 3. Cost Estimating at NASA
In this section, an overview of cost estimating at NASA is provided: its cost estimating organizations and their roles and responsibilities and the types of estimates or products the NASA cost estimating community provides.
3.1 The NASA Cost Estimating Community
NASA has institutionalized a One NASA concept, which is a fully integrated organizational operating model that encourages everyone to use NASA values in their everyday work in decision making, resource allocation, human resource practices, contractor relationships, etc. A unified approach to cost estimating decisions and processes improves the Agency�’s cost estimating capability and contributes to the One NASA initiative.
As illustrated in Figure 1-8, there are many cost estimating organizations and interfaces at NASA, from the CFO to engineers in projects that provide inputs to cost estimates. However, cost estimating may take place outside of the formal cost estimating organizations described. Some Mission Directorates have estimators that reside at NASA Headquarters (HQ), and many Centers have teams of estimators and engineers outside of the costing organizations that provide engineering build up estimates and estimates for proposals. Most Centers also have a Project Design Center (PDC) that helps a project develop a mission concept into a proposed mission design, covering all aspects of the project, including cost. Many times cost estimators from the costing organization at each Center are asked to participate in these concept designs.
Brief descriptions of each of the major cost estimating organizations within NASA and their functions are provided below.
CenterCost
Group
Cost Estimate
HQ ChiefEngineer
Office
HQ IPAO CostEstimating & Analysis
Group
CenterCFOs
HQStrategic
InvestmentsDivision
HQ MissionDirectorate
CostFunctions
HQCost Analysis
Division
Figure 1-8. NASA Cost Estimating Organizations and Interfaces

Cost Estim
atingC
ost Risk
Economic &
Supporting AnalysisC
areer Developm
ent Guide
Reference
Know
ledge Managem
entC
ost Estimating
Cost R
iskEconom
ic & Supporting Analysis
Career D
evelopment G
uideR
eferenceK
nowledge M
anagement
2008 NASA Cost Estimating Handbook Section 3. Cost Estimating at NASA
Volume 1 Page 1-14
Table 1-2. Major Cost Estimating Organizations within NASA
Organization Function
Office of Program Analysis and Evaluation (PA&E)
The Office of Program Analysis and Evaluation (PA&E) was established on April 29, 2005 to provide objective, transparent, and multidisciplinary analysis of NASA programs to inform strategic decision-making. The PA&E office is has been charged to lead the Agency's strategic planning efforts.
Cost Analysis Division (CAD)
The Cost Analysis Division (CAD), within the Office of PA&E, performs various activities in support of its function as the cost estimating arm of PA&E. The CAD has the responsibility for establishing and maintaining cost estimating policy, cost estimating methodologies (with an emphasis of cost risk techniques), tools, and databases. The CAD is also responsible for communicating cost policy to both internal and external stakeholders. The CAD develops estimates and analyses for NASA organizations on an as-needed basis. The CAD’s primary goal is to improve the quality of NASA cost estimates that are used to support budget requests.
Independent Program Assessment Office (IPAO)
The IPAO, within the Office of PA&E, is responsible for enabling the independent review of the maturity, health, and status of the Agency's programs and projects at life cycle milestones. The IPAO ensures the objectivity, quality, integrity, and consistency of the independent review process required by NPR 7120.5 and NPR 7123.1. This independent program and project review process is a collaborative effort among PA&E, the Mission Directorates, the Office of the Chief Engineer, Office of Safety and Mission Assurance, Chief Health and Medical Office (as needed), the independent technical authority community at the NASA Centers, and the NASA Engineering and Safety Center (NESC) support of the Agency's Program Management Councils.
Cost Analysis Steering Group (CASG)
The NASA Cost Analysis Steering Group (CASG) serves as the Agency’s forum for aerospace cost and risk policies, standards, and activities. Its purpose is to strengthen NASA’s cost estimating standards and practices by improving tools, processes, and resources. This working group surveys, promotes, and records key innovations and achievements in the cost estimating field such as parametric cost modeling techniques and methodologies; cost, schedule, and risk models and applications; and cost management and policy. It also fosters cooperation and interchange across the Agency cost analysis community and promotes interdisciplinary understanding of costing aerospace systems and their applications to government and commercial endeavors.
NASA Center Cost Offices
Center cost offices (also called cost engineering or analysis offices) are charged with implementing Agency and Center cost estimating policy and guidance; providing tools, models, training, and other resources for more effective cost estimating at the Center. In many cases Center cost offices perform both advocacy and independent cost estimates, proposal estimates and analyses of projects at the Center level and may also support Agency level cost estimating exercises and NARs. Centers using a PDC have a cost chair where a Center cost office representative usually participates.
3.2 Cost Estimating Products The following section details the types of estimates conducted at NASA and NASA cost estimating products generated in support of this function.

Cost Estim
atingC
ost Risk
Economic &
Supporting AnalysisC
areer Developm
ent Guide
Reference
Know
ledge Managem
entC
ost Estimating
Cost R
iskEconom
ic & Supporting Analysis
Career D
evelopment G
uideR
eferenceK
nowledge M
anagement
2008 NASA Cost Estimating Handbook Section 3. Cost Estimating at NASA
Volume 1 Page 1-15
3.2.1 Project Life Cycle Cost Estimate (LCCEs) The life cycle of a project equals its total life, beginning with mission feasibility and extending through operation and disposal or conclusion of the project. The Project LCCE is comprehensive and structured to identify all cost elements. As members of the product or project design team, cost estimators prepare a Project LCCE by translating the technical and design parameter characteristics and schedules, based on the project definition documentation (technical baseline or Cost Analysis Data Requirement [CADRe]) , into cost estimates using established cost estimating methodologies. Iterative and on-going reviews are conducted with the technical team during the design process until the cost estimator and the project management team is confident that the cost estimate credibly reflects the baseline project�’s design requirements, technical capabilities, management structure, and operational scenarios. Then, the Project LCCE becomes the basis for the project�’s budget baseline.
3.2.2 Independent Cost Estimates (ICEs) The ICE is based on the same project definition documentation (technical baseline or Cost Analysis Data Requirement [CADRe]) as used for the Project LCCE --including life cycle, WBS, and phase. However, this estimate, including the data sources and cost estimating approaches, is intentionally independent from the LCCE. NPR 7120.5C identifies the types, purpose, and frequency of these independent reviews. The independent review team develops an ICE to provide an alternative assessment of the project�’s LCCs.
3.2.3 Non-Advocate Review (NAR) The approval sub process for selected projects must include a NAR. A team, led by the IPAO, comprised of individuals outside of the project�’s advocacy chain, conducts the NAR. A Pre-NAR is conducted when the project is moving from Phase A to Phase B. A NAR is conducted when a project is moving from Phase B to Phase C. The purpose of conducting a NAR is to provide an independent verification of a candidate program or project�’s plans, LCC status, and readiness to proceed to the next phase of the program�’s life cycle.
What is a Project LCCE?
A full cost accounting of all resources necessary to design, develop, deploy, field, operate, maintain, and dispose of a systems over its lifetime.
What is an ICE?
ICEs are LCCEs prepared as a result of an independent review of a project.
What is a NAR?
A NAR is an independent verification of a candidate project’s plans, LCC status, and readiness to proceed to the next phase of the life cycle.

Cost Estim
atingC
ost Risk
Economic &
Supporting AnalysisC
areer Developm
ent Guide
Reference
Know
ledge Managem
entC
ost Estimating
Cost R
iskEconom
ic & Supporting Analysis
Career D
evelopment G
uideR
eferenceK
nowledge M
anagement
2008 NASA Cost Estimating Handbook Section 3. Cost Estimating at NASA
Volume 1 Page 1-16
3.2.4 Independent Annual Review (IAR) An IAR provides:
�• An assessment of progress/milestone achievement against original baseline
�• A review and evaluation of the cost, schedule, and technical content of the project over its entire life cycle
�• An assessment of technical progress, risks remaining, and mitigation plans
�• An identification of any project deficiencies that will result in revised projections exceeding predetermined thresholds
3.2.5 Cost Estimate Reconciliation During the cost estimate reconciliation process, estimators examine estimates for completeness, analyze similarities and differences, and resolve problems of duplication or omission. Estimate reconciliation may results in a synthesized cost estimate or leave two estimates at different values with a documented set of differences. If the estimate cannot be synthesized, the estimates are brought forward for higher-level adjudication.
3.2.6 Announcement of Opportunity (AO) and NASA Research Announcement (NRA) Proposal Estimates
Selections through proposals can involve multi-million dollar budgets for the largest projects. These proposals are usually awarded through contracts, to Centers, industry, non-profit organizations, and occasionally through grants. Many NASA Centers have developed proposal tools and templates to help expedite the development of an AO proposal estimate for these quick turnaround efforts, with the contractor supplying much of the data needed to support a proposal estimate.
AO Proposal Estimates. RFPs are used to procure an item competitively, at almost any level of cost from a few thousand dollars to many millions. AOs are generally used for medium cost projects that are less well defined or more experimental than items procured with RFP, and price of the proposal is an important criteria. These procurements are also usually used to buy science, not necessarily a spacecraft. The goal in NASA source selection is to determine which proposal offers the "best" science for the least risk. AOs are usually cost-capped missions, so price is not a consideration, as long as it's below the cap. NASA owns the spacecraft/instruments developed, and the science data obtained, which is always made available to the public. NASA ICEs of each AO give a measure of risk and chance of success to assist in the proposal evaluation process.
What is an IAR?
An IAR validates conformance to the Program Commitment Agreement (PCA) and provides the status and performance of the project to the NASA Program Management Council (PMC).
What is cost estimate
reconciliation?
A cost estimate reconciliation is a comparison or reconciliation of competing estimates (e.g., a project LCCE and an ICE) that are based on the same NASA CADRe
What are AO and NRA proposal
estimates?
An AO and a NRA proposal estimate responds to unique research investigation opportunities.
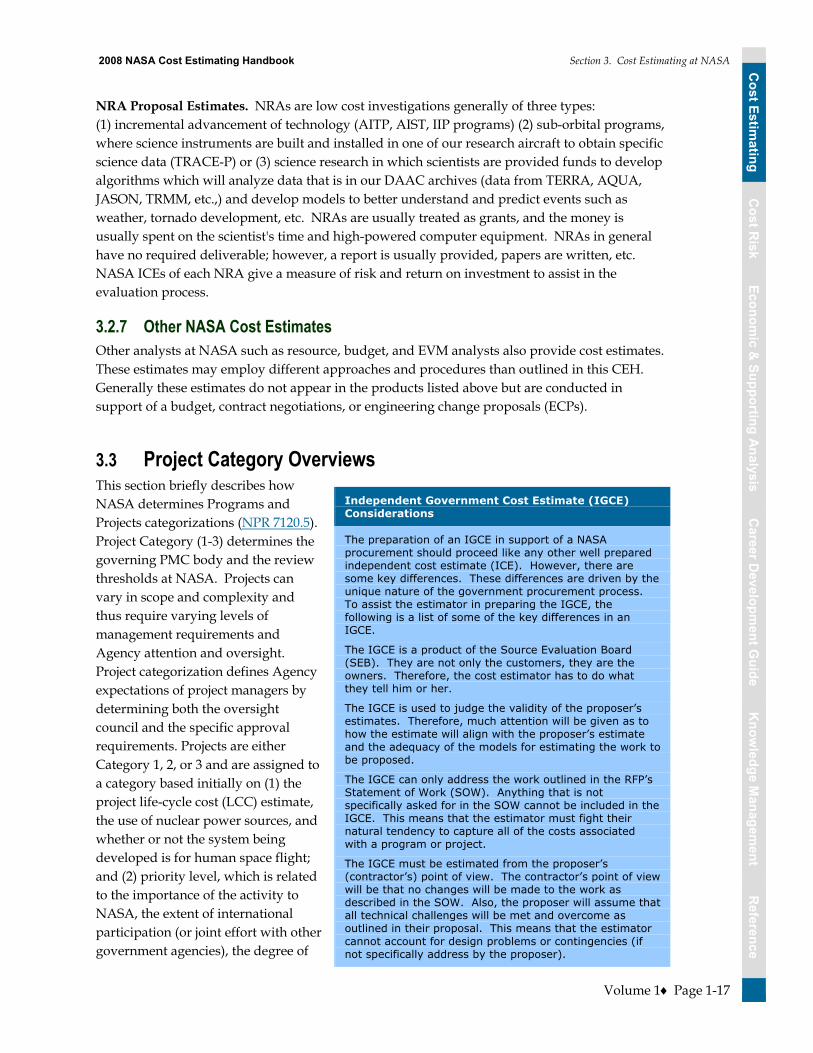
Cost Estim
atingC
ost Risk
Economic &
Supporting AnalysisC
areer Developm
ent Guide
Reference
Know
ledge Managem
entC
ost Estimating
Cost R
iskEconom
ic & Supporting Analysis
Career D
evelopment G
uideR
eferenceK
nowledge M
anagement
2008 NASA Cost Estimating Handbook Section 3. Cost Estimating at NASA
Volume 1 Page 1-17
NRA Proposal Estimates. NRAs are low cost investigations generally of three types: (1) incremental advancement of technology (AITP, AIST, IIP programs) (2) sub-orbital programs, where science instruments are built and installed in one of our research aircraft to obtain specific science data (TRACE-P) or (3) science research in which scientists are provided funds to develop algorithms which will analyze data that is in our DAAC archives (data from TERRA, AQUA, JASON, TRMM, etc.,) and develop models to better understand and predict events such as weather, tornado development, etc. NRAs are usually treated as grants, and the money is usually spent on the scientist's time and high-powered computer equipment. NRAs in general have no required deliverable; however, a report is usually provided, papers are written, etc. NASA ICEs of each NRA give a measure of risk and return on investment to assist in the evaluation process.
3.2.7 Other NASA Cost Estimates Other analysts at NASA such as resource, budget, and EVM analysts also provide cost estimates. These estimates may employ different approaches and procedures than outlined in this CEH. Generally these estimates do not appear in the products listed above but are conducted in support of a budget, contract negotiations, or engineering change proposals (ECPs).
3.3 Project Category Overviews This section briefly describes how NASA determines Programs and Projects categorizations (NPR 7120.5). Project Category (1-3) determines the governing PMC body and the review thresholds at NASA. Projects can vary in scope and complexity and thus require varying levels of management requirements and Agency attention and oversight. Project categorization defines Agency expectations of project managers by determining both the oversight council and the specific approval requirements. Projects are either Category 1, 2, or 3 and are assigned to a category based initially on (1) the project life-cycle cost (LCC) estimate, the use of nuclear power sources, and whether or not the system being developed is for human space flight; and (2) priority level, which is related to the importance of the activity to NASA, the extent of international participation (or joint effort with other government agencies), the degree of
Independent Government Cost Estimate (IGCE) Considerations
The preparation of an IGCE in support of a NASA procurement should proceed like any other well prepared independent cost estimate (ICE). However, there are some key differences. These differences are driven by the unique nature of the government procurement process. To assist the estimator in preparing the IGCE, the following is a list of some of the key differences in an IGCE.
The IGCE is a product of the Source Evaluation Board (SEB). They are not only the customers, they are the owners. Therefore, the cost estimator has to do what they tell him or her.
The IGCE is used to judge the validity of the proposer’s estimates. Therefore, much attention will be given as to how the estimate will align with the proposer’s estimate and the adequacy of the models for estimating the work to be proposed.
The IGCE can only address the work outlined in the RFP’s Statement of Work (SOW). Anything that is not specifically asked for in the SOW cannot be included in the IGCE. This means that the estimator must fight their natural tendency to capture all of the costs associated with a program or project.
The IGCE must be estimated from the proposer’s (contractor’s) point of view. The contractor’s point of view will be that no changes will be made to the work as described in the SOW. Also, the proposer will assume that all technical challenges will be met and overcome as outlined in their proposal. This means that the estimator cannot account for design problems or contingencies (if not specifically address by the proposer).

Cost Estim
atingC
ost Risk
Economic &
Supporting AnalysisC
areer Developm
ent Guide
Reference
Know
ledge Managem
entC
ost Estimating
Cost R
iskEconom
ic & Supporting Analysis
Career D
evelopment G
uideR
eferenceK
nowledge M
anagement
2008 NASA Cost Estimating Handbook Section 3. Cost Estimating at NASA
Volume 1 Page 1-18
uncertainty surrounding the application of new or untested technologies, and spacecraft/ payload development risk classification (see NPR 8705.4, Risk Classification for NASA Payloads). Guidelines for determining project categorization are shown in below, but categorization may be changed based on recommendations by the Mission Directorate Associate Administrator (MDAA) that consider additional risk factors facing the project. The NASA Associate Administrator (AA) approves final project categorization. The Office of the Chief Engineer (OCE) is responsible for the official listing of NASA programs and projects and their categorization. For purposes of project categorization, the project life-cycle cost estimate includes Phases A through F, all WBS Level 2 elements, and is measured in real-year (nominal) dollars.
Project Categorizations are shown below:
* The Mission Directorate PMC evaluates all projects executed within that Mission Directorate and provides input to the MDAA. For Category 1 projects, the MDAA carries forward the MDPMC findings and recommendations to the Agency PMC.
COSTLCC < $250M$250M LCC $1BLCC $1B *
High Medium LowRISK
Category 1
Category 2
Category 2 Category 3
* This category also includes the use of nuclear power source or human rated space flight projects regardless of the life cycle costs.
Categorization Governing PMCCategory 1 Agency PMC *
Category 2 Mission Directorate PMC
Category 3 Mission Directorate PMC
Figure 1-9. Project Categorizations

Cost Estim
atingC
ost Risk
Economic &
Supporting AnalysisC
areer Developm
ent Guide
Reference
Know
ledge Managem
entC
ost Estimating
Cost R
iskEconom
ic & Supporting Analysis
Career D
evelopment G
uideR
eferenceK
nowledge M
anagement
2008 NASA Cost Estimating Handbook Section 4. Cost Estimating Process
Volume 1 Page 1-19
Section 4. Cost Estimating Process
This section presents the �“how to,�” from start to finish details of the cost estimating process. Shown in the graphic to the right, there are three main parts to the NASA 12 step cost estimating process.
The first part of the NASA CEH process is called Project Definition. During this part, the estimator clarifies the reason for the estimate, defines expectations, and begins to understand the project that will be estimated. As the
estimate is being defined and data is gathered, a Work Breakdown Structure (WBS) and technical description are obtained. These items help define the project and form the foundation for the estimate. As the estimator continues through the estimating process, these steps may be revisited as new information is obtained.
Part 2 of the cost estimating process, the Cost Methodology, includes four tasks that create the approach and framework for the estimate. Developing the ground rules and assumptions will be the most revisited task in this Part of the process. As methodologies are selected and the data is gathered, the ground rules and assumptions, methodologies, and even the cost model may be refined as appropriate.
1. Project Definition
2. Cost Methodology
3. Estimate
Receive Customer Request and
Understand Project
Receive Customer Request and
Understand ProjectBuild or
Obtain WBSBuild or
Obtain WBSObtain/Participate in
Development of Project Technical Description
Obtain/Participate in Development of Project Technical Description
Develop Ground Rules and
Assumptions
Develop Ground Rules and
Assumptions
Select Cost Estimating
Methodology
Select Cost Estimating
MethodologySelect/BuildCost Model
Select/BuildCost Model
Gather and Normalize Data
Gather and Normalize Data
DevelopPoint
Estimate
DevelopPoint
Estimate
Develop and Incorporate Cost Risk Assessment
Develop and Incorporate Cost Risk Assessment
Document Probabilistic
Cost Estimate
Document Probabilistic
Cost Estimate
Present EstimateResults
Present EstimateResults
Update Cost Estimate on a Regular Basis
Update Cost Estimate on a Regular Basis
1 2 3
4 5 6
8 9 10
7
11 12
Figure 1-10. The Cost Methodology Process

Cost Estim
atingC
ost Risk
Economic &
Supporting AnalysisC
areer Developm
ent Guide
Reference
Know
ledge Managem
entC
ost Estimating
Cost R
iskEconom
ic & Supporting Analysis
Career D
evelopment G
uideR
eferenceK
nowledge M
anagement
2008 NASA Cost Estimating Handbook Section 4. Cost Estimating Process
Volume 1 Page 1-20
Part 3 of the cost estimating process, the Estimate, has five tasks that include the actual conduct, presentation, and maintenance of the cost estimate. All of these tasks are important in their own right and together, they become critical for a defensible and complete estimate.
4.1 Part 1: Project Definition Tasks To properly estimate the cost of a project, it is vital that the project be thoroughly defined and understood by the estimators. The first three tasks in the cost estimating process relate to defining the project.
4.1.1 Task 1: Receive Customer Request and Understand the Project The goal of this task is to interface sufficiently with the customer to gather enough project information to generate an accurate estimate.
There are two major activities associated with understanding the project:
1. Gather and review all relevant project data for evaluation (e.g., an existing technical baseline or CADRe, previous estimates, lessons learned and customer feedback, budget data and programmatic data such as schedules) and discuss schedule, data, expectations, and resource requirements with the requesting customer
2. Evaluate the project's mission needs, objectives, and goals and assess the operating environment and life cycle phase for the project within the context of the NASA enterprise architecture
When a request for a cost estimate is received, the supervisor of the cost group must ascertain if he/she has the resources to accept the assignment based upon his/her understanding of the expectations of the estimate. The estimator then determines the magnitude of the workload required, i.e., the type of estimate, the due date(s), and relative priority of the request. If the request is accepted, the supervisor will notify the requester of this fact and will assign an estimator (or estimators) to the task. As illustrated in Figure 1-11, there are four critical elements to any estimate that need to be understood and agreed upon between the cost estimator and the decision-maker before a methodology can be chosen and an estimate can be developed. These four elements are resources, data, schedule, and expectations.
1. Project Definition
2. Cost Methodology
3. Estimate

Cost Estim
atingC
ost Risk
Economic &
Supporting AnalysisC
areer Developm
ent Guide
Reference
Know
ledge Managem
entC
ost Estimating
Cost R
iskEconom
ic & Supporting Analysis
Career D
evelopment G
uideR
eferenceK
nowledge M
anagement
2008 NASA Cost Estimating Handbook Section 4. Cost Estimating Process
Volume 1 Page 1-21
ResourceResource
• How many people are required to conduct the estimate?
• How many people are available to conduct the estimate?
• What is the budget required to conduct the estimate?
• What is the available budget to conduct the estimate?
• How many people are required to conduct the estimate?
• How many people are available to conduct the estimate?
• What is the budget required to conduct the estimate?
• What is the available budget to conduct the estimate?
ScheduleSchedule
DataData ExpectationExpectation
• What data do you need?• Is the data readily available?• If the data is not readily available,
what are your alternatives?• Are the organizations you need to
collect the data from cooperative & accessible?
• Are non-disclosure agreements required?
• What data do you need?• Is the data readily available?• If the data is not readily available,
what are your alternatives?• Are the organizations you need to
collect the data from cooperative & accessible?
• Are non-disclosure agreements required?
• What is your expectation of the estimate?• What is the expected outcome or usage of
the estimate? (based on estimate type)• What is the decision maker’s expectation of
the estimate?• What is the team expectation of the estimate?• What are the agency-wide expectations of the
estimate outcome and usage?
• How long have you been given to complete the estimate?
• How long do you need to complete the estimate, given the available resources and data?
• Do you have the resources needed to conduct the estimate with the allotted schedule?
• Do you have the time to collect the required data and analyze the data?
Figure 1-11. Four Critical Elements to Understand and Agree Before Conducting a Cost Estimate
In early life cycle phases of a project, there will be many unknowns. It is the role of the cost estimator to ask insightful questions that help the Project Management staff make decisions regarding key aspects not normally considered in an early stage (e.g., maintenance concept, testing strategy, etc.,) and to address issues such as manpower, schedule, technologies, and cost drivers that can have a major impact on risk. Data gathering is no less important in later phases of a project, when more is known and overlooking any element could affect the estimate�’s outcome.
4.1.2 Task 2: Build or Obtain WBS The objective of this task is to provide a consistent structure that includes all elements of the project the cost estimate will cover.
Determining the initial need and the desired outcome of the estimate are essential to starting an estimate off on a solid foundation. This initial communication and understanding among all participants will provide the estimate with adequate resources, funding, and support for a successful outcome.
There are three activities associated with preparing or obtaining a WBS:
�• Determine if a WBS exists or work with the project to create
�• Create a WBS Dictionary to define the WBS elements
�• Ensure that the cost estimating WBS is consistent between functions such as budgeting, weight statements, EVM, project plan, System Engineering Master Plan (SEMP), contracts, Integrated Enterprise Management (IEM), etc., to enable improved cost estimation, future data collection, and performance measurement and management

Cost Estim
atingC
ost Risk
Economic &
Supporting AnalysisC
areer Developm
ent Guide
Reference
Know
ledge Managem
entC
ost Estimating
Cost R
iskEconom
ic & Supporting Analysis
Career D
evelopment G
uideR
eferenceK
nowledge M
anagement
2008 NASA Cost Estimating Handbook Section 4. Cost Estimating Process
Volume 1 Page 1-22
According to NPR 7120.5, the WBS �“is a key element of project management. The purpose of a WBS is to divide the project into manageable pieces of work to facilitate planning and control of cost, schedule, and technical content.�” A WBS ensures that all work to be performed on the project is organized and aligned in accordance with the total scope of a program, using a hierarchical structure. This structure becomes the cost estimator�’s framework for ensuring full coverage of the project's objectives, including:
�• Project and technical planning and scheduling
�• Cost estimation and budget formulation (in particular, costs collected in a product-based WBS can be compared to historical data collected against the same products)
�• Defining the scope of statements of work and specifications for contract efforts
�• Project status reporting, including schedule, cost, workforce, technical performance, and integrated cost/schedule data (such as earned value management [EVM] and estimated cost at completion [EAC])
�• Plans such as the SEMP and other documentation products such as specifications and drawings
The WBS is also used as a communication tool to present the project�’s scope in an understandable form that can be easily communicated to the project team and other stakeholders. This initial communication and understanding among all participants will provide the estimate with adequate resources, funding, and support for a successful outcome.
In Pre-Phase A, the cost estimator will either obtain a high-level Project WBS(s) from the project staff or work with them to develop one. A Project WBS is the comprehensive WBS including all life cycle phases, recurring and non-recurring costs and items including the hardware for the product, and other items such as training, Systems Engineering and Integration (SE&I), Integration and Test (I&T), system test, and project management. Additionally, a companion high-level WBS dictionary that describes the content of each major element of the WBS must be developed to avoid duplication and to ensure full coverage.
The NASA Systems Engineering Handbook sets forth policies and processes for preparing WBSs. The NASA Standard WBS structure is located in the Reference Volume. WBSs should be standard and consistent throughout NASA and during Pre-Phase A and Phase A is the right time to begin creating this standard structure. This means that WBS elements for similar projects within each NASA organization will have standard and consistent labels and definitions (i.e., content) and be standard and consistent across different cost disciplines (e.g., CADRe reporting, cost estimating, EVM, cost databases, etc.). This consistency will enable improved cost estimation, performance measurement, and project management. To the extent possible, these WBSs should also be consistent with the WBSs contained in the cost models used at NASA (e.g., NAFCOM, PRICE, SEER, etc.).
Cost Estim
atingC
ost Risk
Economic &
Supporting AnalysisC
areer Developm
ent Guide
Reference
Know
ledge Managem
entC
ost Estimating
Cost R
iskEconom
ic & Supporting Analysis
Career D
evelopment G
uideR
eferenceK
nowledge M
anagement
2008 NASA Cost Estimating Handbook Section 4. Cost Estimating Process
Volume 1 Page 1-23
WBS Tips and References A WBS may also be called a Cost Estimating Structure (CES), Cost Element Structure
(CES), or Cost Breakdown Structure (CBS)
MIL HDBK 881B is the DOD�’s guide to WBSs (https://acc.dau.mil/GetAttachment.aspx?id=56317&pname=file&lang=en-US&aid=19668)
The OSD CAIG (http://www.dtic.mil/pae/paeosg04.html) provides guidelines for the development and definition of standard elements for Operations and Support (O&S) cost estimates
The WBS you create might not necessarily map to the estimating structures found in commercial tools used in the estimating community. Know the tool you plan to use before you begin and be prepared to provide a map of your WBS back to the project WBS if there are differences.
4.1.3 Task 3: Obtain/Participate in the Development of Project Technical Description
The objective of this task is to establish a common baseline document that thoroughly describes the project to be used by the project team and independent estimators to develop their estimate(s).
There are two activities associated with developing or obtaining a project technical description:
�• Describe the level two or lower system characteristics, configuration, quality factors, security, its operational concept, and the risks associated with the system for use by the cost estimator
�• Describe the system�’s (or the project�’s) milestones, schedule, management strategy, implementation/deployment plan, test strategy, security considerations, and acquisition strategy
Every estimate, regardless of size, needs to define what is being estimated. The NASA organization sponsoring a project will prepare, as a basis for life-cycle cost estimates, a description of features pertinent to costing the system being developed and acquired. The type of document used to record this project technical description depends on the time available to conduct the estimate, the size of the project, technical information available, including the requirements�’ thresholds and goals (objectives), and the phase of the life cycle in which it exists. Projects that are smaller in size or earlier in their project lives may only require a simple data sheet with technical requirements provided by the project to support developing a Rough Order Magnitude (ROM) cost estimate.
The project technical description defines and provides quantitative and qualitative descriptions of the project characteristics from which cost estimates will be derived. As such, the project technical description ensures that cost projections jointly developed by the Project Offices and the independent review organizations are based on a common definition of the system and project. The project technical description should identify any area or issue that could have a major cost impact (e.g., risks) and, therefore, must be addressed by the cost estimator. If a CADRe has already been created for the system being estimated, it can be used as the technical baseline for the estimate. A further benefit derived from the CADRe is its built-in requirement for end-of-

Cost Estim
atingC
ost Risk
Economic &
Supporting AnalysisC
areer Developm
ent Guide
Reference
Know
ledge Managem
entC
ost Estimating
Cost R
iskEconom
ic & Supporting Analysis
Career D
evelopment G
uideR
eferenceK
nowledge M
anagement
2008 NASA Cost Estimating Handbook Section 4. Cost Estimating Process
Volume 1 Page 1-24
contract actual costs and technical parameters (by WBS element) used to update NASA cost models. These values (e.g., key engineering performance parameters [KEPPs]) and actual costs at the end-of-contract are ported into the ONCE database.
A CADRe is a hybrid requirement that is unique within NASA that combines key elements of two previously used DRDs - the Cost Analysis Requirements Description (CARD) and LCCE into a single, coordinated document. The CADRe, like the technical baseline, is �“owned�” by the Project Manager (PM), although populating most of its content can be a contractual requirement. While it does not incorporate the WBS DRD, the information contained in the CADRe DRD must conform to the approved project WBS in order to ensure that every element of the entire project is included.
Technical Baseline Tips: �• A technical baseline is also called a CARD, which is often used in the DOD
�• For estimating purposes, a technical baseline or a CADRe can be used as the foundation of the estimate
�• The major difference between a technical baseline/CARD and a CADRe is that cost information is only captured in the NASA CADRe
CADRe Overview
A CADRe is a hybrid requirement that is unique within NASA that combines key elements of two previously used DRDs - the Cost Analysis Requirements Description (CARD) and LCCE into a single, coordinated document. The CADRe, like the technical baseline, is �“owned�” by the Project Manager (PM), although populating most of its content can be a contractual requirement. While it does not incorporate the WBS DRD, the information contained in the CADRe DRD must conform to the approved project WBS in order to ensure that every element of the entire project is included.
The CADRe is a NASA project-level requirement mandated by NPR 7120.5. The CADRe documents the programmatic, technical, and life cycle cost information of a project. NPR 7120.5 specifically states that Category I and Category II Flight Systems and Ground Support Projects require the development of a CADRe and will typically require five CADRe submissions across the project life cycle. CADRes are developed following the Pre-Non Advocate Review (PNAR), Preliminary Design Review (PDR), and Critical Design Review (CDR) site reviews, after launch, and during the last year of a project�’s planned life.
The NASA PM is responsible for the CADRe and has several options available to develop CADRes. The NASA PM may choose to develop the CADRe within the Project Office with his/her own staff, or he/she may use one of the NASA Headquarters-sponsored support contractors to develop the CADRe. It is recommended that the projects include the CADRe as a DRD on contract(s) in order to ensure the proper data is available to complete the CADRe. Because the CADRe collects Full Cost information, it is likely that the project will have to perform final integration of a contractor prepared CADRe to include all Full Cost information.
Many times, in Pre-Phase A, a formal CADRe is not required. However, following the basic format for the NASA CADRe in developing the project technical description for these projects in Pre-Phase A is encouraged. It will help in the eventual development of the CADRe in later life cycle phases when required.

Cost Estim
atingC
ost Risk
Economic &
Supporting AnalysisC
areer Developm
ent Guide
Reference
Know
ledge Managem
entC
ost Estimating
Cost R
iskEconom
ic & Supporting Analysis
Career D
evelopment G
uideR
eferenceK
nowledge M
anagement
2008 NASA Cost Estimating Handbook Section 4. Cost Estimating Process
Volume 1 Page 1-25
The body of the CADRe contains three parts with templates for each:
�• Part A contains general descriptive information about the project�’s LCC
�• Part B contains hardware and software technical parameters necessary to estimate the project's life cycle cost
�• Part C contains the project LCCE and the PM is responsible for collecting the inputs from the various participants including Full Cost elements and submitting an integrated cost estimate
The required data for submission by the Contractor are CADRe Part B spreadsheet technical data required for the Project to complete the full CADRe and some detailed cost data to support Part C. Most of these data will be available through technical documents presented at the PDR, CDR, etc., and cost data provided through NF533 and Contractor Performance Reports. Info: http://ceh.nasa.gov/downloadfiles/CADRe.html
CADRe templates (Parts A, B, and C) and information pertaining to the submission process and guidelines can be referenced at http://ceh.nasa.gov/downloadfiles/CADRe.html. Additional information pertaining to the CADRe, including the review and submission process, the value of the CADRe process to NASA, and CADRe availability can be found in the Reference Volume.
4.2 Part 2: Cost Methodology Tasks The next four tasks of the cost estimating process relate to selecting and administering the cost methodology, which will guide the development of the cost estimate. These four tasks are detailed below.
4.2.1 Task 4: Develop Ground Rules and Assumptions (GR&A) The objective of developing GR&As is to communicate the scope, context, and environment within which the estimate is being developed.
There are three activities associated with developing the GR&As:
�• Establish a set of programmatic, technical, and schedule GR&As to define the scope of the estimate (i.e., what costs are being included and what cost are excluded)
�• Achieve consensus on the GR&A with stakeholders, vendors, end users, etc., to ensure their applicability
�• Fully document the GR&As as they evolve during the entire estimate process
The cost estimator works with the NASA PM and members of the technical team to establish and document a complete set of GR&A that are necessary to provide definition to the project and the estimate and to bound its scope. GR&A let everyone understand what costs are being included and what costs are excluded in the current estimate. This allows for easy comparisons to future estimates and to ones conducted by independent agencies. GR&A should be developed in coordination with and agreed upon by the NASA PM. Then, the cost estimator should spend time socializing the GR&A with other stakeholders so that consensus can be built and problems leading to inaccurate or misleading estimates can be avoided.
1. Project Definition
2. Cost Methodology
3. Estimate

Cost Estim
atingC
ost Risk
Economic &
Supporting AnalysisC
areer Developm
ent Guide
Reference
Know
ledge Managem
entC
ost Estimating
Cost R
iskEconom
ic & Supporting Analysis
Career D
evelopment G
uideR
eferenceK
nowledge M
anagement
2008 NASA Cost Estimating Handbook Section 4. Cost Estimating Process
Volume 1 Page 1-26
Each estimate should have two sets of GR&A, global and element specific. Global GR&A apply to the entire estimate and include ground rules such as base year dollars, schedules, what is and is not included in the cost estimate, and total quantities. Detail element GR&A are developed as each WBS element is being estimated and are found in the detail section for each WBS element. Detail element GR&A provide details for each element such as unit quantities and schedules. Since it is impossible to know every technical or programmatic parameter with certainty before and into the design phase of a program/project, a complete set of realistic and well-documented GR&A adds to the soundness of a cost estimate. Descriptions of relevant missions and system characteristics, manning, maintenance, support, and logistics policies are generally included in the GR&A. GR&A are more prominent in less defined Pre Phase A and Phase A projects, because there are more unknowns. Conversely, GR&As are less prominent in well defined Phase B projects because there are less unknowns about the program. Global and detail element GR&A can also be found in the CADRe and should be in sync with the estimate.
The following areas should be covered by an estimator preparing the GR&A:
�• Guidance on how to interpret the estimate properly (i.e., what base year dollars the cost results are expressed in, e.g., FY08$, inflation indices used, the operations concept employed such as launch vehicle used, location of Mission Control Center [MCC], use of Tracking and Data Relay Satellite System [TDRSS], Deep Space Network [DSN], or other communication systems, etc., and O&S period, maintenance concept(s) and if required, training strategy
�• Clarification as to the limit and scope in relationship to acquisition milestones especially specific items or costs excluded from the cost estimate
�• Percentages (or approach) used for computing program level wraps (i.e., unallocated future expense/reserves, program support, OCD, HQ taxes, Level II Program Office, etc.)
�• Technology assumptions and new technology to be developed and commonality or design inheritance assumptions
�• Production unit quantities, including assumptions regarding spares, long lead items and make or buy decisions and the quantity of development units, prototype, or protoflight units
�• LCC considerations such as mission lifetimes, hardware replacement assumptions, hardware and software heritage, launch rates, and number of flights per year and any cost sharing or joint funding arrangements with other government agencies, if any (e.g., partnerships), make buy decisions, outsourcing or commercialization approach
�• Implementation approach aspects such as Integration and test approach/test articles, mission assurance/safety approach, planetary protection approach, launch approval approach, commercialization and outsourcing approach, and partner commitments
�• Schedule information: development and production start and stop dates, Phase B Authorization to Proceed (ATP), Phase C/D ATP, first flight, and Initial Operating Capability (IOC) timeframe for LCC computations, etc.
�• Use of existing facilities, modifications to existing facilities, and new facility requirements
�• Management concepts, especially if cost credit is taken for charge in management culture, New Ways of Doing Business (NWODB), in-house versus contract, etc.

Cost Estim
atingC
ost Risk
Economic &
Supporting AnalysisC
areer Developm
ent Guide
Reference
Know
ledge Managem
entC
ost Estimating
Cost R
iskEconom
ic & Supporting Analysis
Career D
evelopment G
uideR
eferenceK
nowledge M
anagement
2008 NASA Cost Estimating Handbook Section 4. Cost Estimating Process
Volume 1 Page 1-27
4.2.2 Task 5: Select Cost Estimating Methodology The goal of this task is to select the best cost estimating methodology (or combination of methodologies) for the data available to develop the most accurate cost estimate possible.
Based upon the phase that the project/system is entering and the data available to conduct the estimate, follow the quick reference chart shown in Table 1-3 to select the cost estimating methodology (or methodologies).
Table 1-3. Cost Estimating Methodology Selection Chart
Pre-Phase A Phase A Phase B Phase C/D Phase E
Parametric 4 4 2 2 0
Analogy 4 2 2 2 0
Engineering Build Up 2 2 4 4 4
Legend: 4 Primary 2 Applicable 0 Not Applicable
Parametric Cost Estimating
Estimates created using a parametric approach are based on historical data and mathematical expressions relating cost as the dependent variable to selected, independent, cost-driving variables through regression analysis. Generally, an estimator selects parametric cost estimating when only a few key pieces of data are known, such as weight and volume. The implicit assumption of parametric cost estimating is that the same forces that affected cost in the past will affect cost in the future. For example, NASA cost estimates are frequently of space systems or software. The data that relates to estimates of these are weight characteristics and design complexity respectively. The major advantage of using a parametric methodology is that the estimate can usually be conducted quickly and be easily replicated. Figure 1-12 shows the steps associated with parametric cost estimating.
Define Estimating
“Hypothesis”Collect
“Relationship”Data
Evaluate & Normalize
DataAnalyze Data for Candidate Relationships
Perform Statistical
(Regression) Analysis
Test Relationships Select Cost
Estimating Relationship
Figure 1-12. Parametric Cost Estimating Process Steps
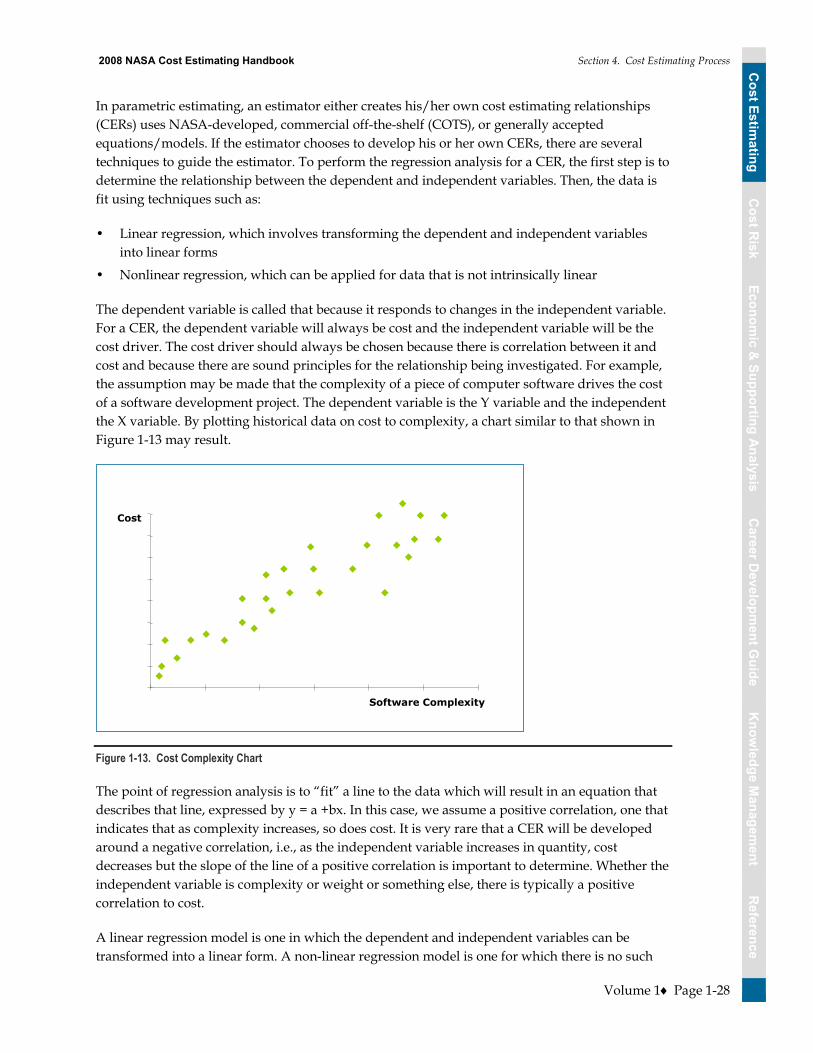
Cost Estim
atingC
ost Risk
Economic &
Supporting AnalysisC
areer Developm
ent Guide
Reference
Know
ledge Managem
entC
ost Estimating
Cost R
iskEconom
ic & Supporting Analysis
Career D
evelopment G
uideR
eferenceK
nowledge M
anagement
2008 NASA Cost Estimating Handbook Section 4. Cost Estimating Process
Volume 1 Page 1-28
In parametric estimating, an estimator either creates his/her own cost estimating relationships (CERs) uses NASA-developed, commercial off-the-shelf (COTS), or generally accepted equations/models. If the estimator chooses to develop his or her own CERs, there are several techniques to guide the estimator. To perform the regression analysis for a CER, the first step is to determine the relationship between the dependent and independent variables. Then, the data is fit using techniques such as:
�• Linear regression, which involves transforming the dependent and independent variables into linear forms
�• Nonlinear regression, which can be applied for data that is not intrinsically linear
The dependent variable is called that because it responds to changes in the independent variable. For a CER, the dependent variable will always be cost and the independent variable will be the cost driver. The cost driver should always be chosen because there is correlation between it and cost and because there are sound principles for the relationship being investigated. For example, the assumption may be made that the complexity of a piece of computer software drives the cost of a software development project. The dependent variable is the Y variable and the independent the X variable. By plotting historical data on cost to complexity, a chart similar to that shown in Figure 1-13 may result.
Software Complexity
Cost
Figure 1-13. Cost Complexity Chart
The point of regression analysis is to �“fit�” a line to the data which will result in an equation that describes that line, expressed by y = a +bx. In this case, we assume a positive correlation, one that indicates that as complexity increases, so does cost. It is very rare that a CER will be developed around a negative correlation, i.e., as the independent variable increases in quantity, cost decreases but the slope of the line of a positive correlation is important to determine. Whether the independent variable is complexity or weight or something else, there is typically a positive correlation to cost.
A linear regression model is one in which the dependent and independent variables can be transformed into a linear form. A non-linear regression model is one for which there is no such

Cost Estim
atingC
ost Risk
Economic &
Supporting AnalysisC
areer Developm
ent Guide
Reference
Know
ledge Managem
entC
ost Estimating
Cost R
iskEconom
ic & Supporting Analysis
Career D
evelopment G
uideR
eferenceK
nowledge M
anagement
2008 NASA Cost Estimating Handbook Section 4. Cost Estimating Process
Volume 1 Page 1-29
transformation. More formally, a non-linear regression model is one for which the first-order conditions for least-squares estimation of the parameters are non-linear functions of the parameters.
With the addition of possible explanatory variables (see Table 1-4), a more precise and robust regression equation can be obtained. Since more than one independent variable is likely to have an effect on the dependent variable, one can calculate multivariate regression:
Table 1-4. Regression Definitions
Regression Coefficient
Meaning
1 Impact of a one-unit increase in X1 on the dependent variable Y, holding constant all the other included independent variables (X2 and X3)
2 Impact of a one-unit increase in X2 on Y, holding X1 and X3 constant
3 Impact of a one-unit increase in X3 on Y, holding X1 and X2 constant
The usual method of regression coefficient estimation is using a computer program capable of calculating estimated coefficients with a technique called Ordinary Least Squares (OLS). Table 1-5 provides a reference guide to help evaluate regression results.
Table 1-5. Evaluating Regression Analysis Results
The Regression Analysis Methodology requires the following steps:
�• Review the literature and develop the theoretical model �• Specify the model �• Select the independent variables(s) and the functional form
Symbol Check Point Reference Decision
X, Y Data Observations Check for errors, especially outliers in the data
Correct any errors. If the quality of the data is poor, may want to avoid regression analysis or use just OLS
A Estimated Coefficient
Compare signs and magnitudes to expected values
If they are unexpected, re-specify the model if appropriate or assess other statistics for possible correct procedures
ei Residual Check for transcription errors Take appropriate corrective action
R2 Coefficient of Determination
Measures the degree of overall fit of the model to the data
A guide to overall fit
2 R2 adjusted for degrees of freedom
Same as R2. Also attempts to show the contribution of an additional explanatory variable
One indication that an explanatory variable is irrelevant is if the 2 falls when it is added
TSS Total Sum of Squares TSS = 2
1
)( YYn
ii
Used to compute R2 and 2
RSS Residual Sum of Squares RSS = 2
1
)( i
n
ii YY
Used to compute 2 and 2

Cost Estim
atingC
ost Risk
Economic &
Supporting AnalysisC
areer Developm
ent Guide
Reference
Know
ledge Managem
entC
ost Estimating
Cost R
iskEconom
ic & Supporting Analysis
Career D
evelopment G
uideR
eferenceK
nowledge M
anagement
2008 NASA Cost Estimating Handbook Section 4. Cost Estimating Process
Volume 1 Page 1-30
�• Hypothesize the expected signs of the coefficients �• Collect the data �• Estimate and test the hypotheses regarding the model�’s parameters �• Document the results
Regression analysis is used not to confirm causality, as many believe, but rather to test the strength and direction of the quantitative relationships involved. In other words, no matter the statistic significance of a regression result, causality cannot be proven. Instead, regression analysis is used to estimate and test hypotheses regarding the model�’s parameters.
When using the NAFCOM database, the estimator selects the inputs and NAFCOM will calculate the linear regression. Using a COTS package such as SEER or PRICE (see Cost Model Prospectus listed in the Reference volume) gives the estimator the option to generate the entire estimate or to generate a point estimate to be used as output to another model.
CERs established early must be periodically examined to ensure that they are current throughout the life of an estimate and that the input range of data being estimated is applicable to the system. All CERs should be detailed and documented. If a CER is improperly applied, a serious estimating error could result. Microsoft Excel or other commercially available modeling tools are most often used for these calculations. Table 1-6 lists some strengths and weaknesses of using parametric methodology to develop a cost estimate.
Table 1-6. Strengths and Weaknesses of Parametric/CER Cost Methodology
Strengths Weaknesses
Once developed, CERs are an excellent tool to answer many "what if" questions rapidly
Often difficult for others to understand the relationships
Statistically sound predictors that provide information about the estimator’s confidence of their predictive ability
Must fully describe and document selection of raw data, adjustments to data, development of equations, statistical findings and conclusions for validation and acceptance
Eliminates reliance on opinion through the use of actual observations
Collecting appropriate data and generating statistically correct CERs is typically difficult, time consuming, and expensive
Defensibility rests on logical correlation, thorough and disciplined research, defensible data, and scientific method
Loses predictive ability/credibility outside its relevant data range
Analogy Cost Estimating Methodology
Analogy estimates are performed on the basis of comparison and extrapolation to like items or efforts. Cost data from one past program that is technically representative of the program to be estimated serves as the basis of estimate. Cost data is then subjectively adjusted upward or downward, depending upon whether the subject system is felt to be more or less complex than the analogous program. Clearly subjective adjustments compromise the validity and defensibility of the estimate and should be avoided. Best-fit, linear extrapolations from the analog are acceptable �“adjustments.�” Utilizing historical data about like systems is a time-tested estimating technique.
This estimating approach is typically used when an adequate amount of program and technical definition is available to allow proper selection, and adjustment, of comparable program costs.
Cost Estim
atingC
ost Risk
Economic &
Supporting AnalysisC
areer Developm
ent Guide
Reference
Know
ledge Managem
entC
ost Estimating
Cost R
iskEconom
ic & Supporting Analysis
Career D
evelopment G
uideR
eferenceK
nowledge M
anagement
2008 NASA Cost Estimating Handbook Section 4. Cost Estimating Process
Volume 1 Page 1-31
With this technique, a currently fielded system (comparable system) similar in design and/or operation of the proposed system is identified. An analogous approach is also used when attempting to estimate a generic system with very little definition.
The analogy system approach places heavy emphasis on the opinions of "experts" to modify the comparable system data to approximate the new system and is therefore increasingly untenable as greater adjustments are made. Table 1-7 provides a list of the strengths and weaknesses of using an analogous system method to develop a cost estimate.
Table 1-7. Strengths and Weaknesses of Analogy Method of Cost Estimating
Strengths Weaknesses
Based on actual historical data Relies on single data point
Quick Can be difficult to identify appropriate analog
Readily understood Requires "normalization" to ensure accuracy
Accurate for minor deviations from the analog Relies on extrapolation and/or expert judgment for "adjustment factors"
Complexity or adjustment factors can be applied to an analogy estimate to make allowances including year of technology, inflation, basing modes, and technology maturation. A complexity factor usually is used to modify a CER for complexity (e.g., an adjustment from an air system to a space system). A traditional complexity factor is a linear multiplier that is applied to the subsystem cost produced by a cost model. In its simplest terms, it is a measure of the complexity of the subsystem being costed compared to the composite of the CER database being used or compared to the single point analog data point being used.
The most uncomplicated approach to determining a value for the complexity factor of a subsystem is to work closely with the design engineer responsible for that subsystem. The following steps would generally be followed to determine the complexity factor. The design engineer (with the assistance of the cost estimator) would:
�• Become familiar with the historical data points that are candidates for selection as the costing analog
�• Select that data point that is most analogous to the new subsystem being designed
�• Assess the complexity of the new subsystem compared to that of the selected analog in terms of:
�– Design maturity of the new subsystem compared to the design maturity of the analog when it was developed
�– Technology readiness of the new design compared to the technology readiness of the analog when it was developed
�– Specific design differences that make the new subsystem more or less complex than the analog (examples would be comparisons of pointing accuracy requirements for a
Tips: Complexity Factors
Tables have been prepared by various NASA cost offices as guidelines to design engineers in making these judgments regarding selection of a complexity factor. Although these are not absolute standards, they may be useful as general guidance if the engineer is having difficulty quantifying his/her assessment of the relative complexities.
Source: JSC NASA Cost Estimating Guidelines

Cost Estim
atingC
ost Risk
Economic &
Supporting AnalysisC
areer Developm
ent Guide
Reference
Know
ledge Managem
entC
ost Estimating
Cost R
iskEconom
ic & Supporting Analysis
Career D
evelopment G
uideR
eferenceK
nowledge M
anagement
2008 NASA Cost Estimating Handbook Section 4. Cost Estimating Process
Volume 1 Page 1-32
guidance system, data rate and storage requirements for a computer, differences in materials for structural items, etc.)
�• Make a quantitative judgment for a value of the complexity factor based on the above considerations
�• Document the rationale for the selection of the complexity factor
Engineering Build Up Methodology
Sometimes referred to as �“grass roots�” or �“bottom-up�” estimating, the engineering build up methodology rolls up individual estimates for each element into the overall estimate. This costing methodology involves the computation of the cost of a WBS element by estimating at the lowest level of detail (often referred to as the �“work package�” level) wherein the resources to accomplish the work effort are readily distinguishable and discernable. Often the labor requirements are estimated separately from material requirements. Overhead factors for cost elements such as Other Direct Costs (ODCs), General and Administrative (G&A) expenses, materials burden, and fee are generally applied to the labor and materials costs to complete the estimate. A technical person who is very experienced in the activity typically works with the cost analyst, who prepares these engineering build up estimates. The cost estimator�’s role is to review the grassroots estimate for reasonableness, completeness, and consistency with the program/project GR&A. It is also the cost estimator�’s responsibility to test, understand, and validate the knowledge base and data used to derive estimates.
Figure 1-14 illustrates a method for deriving an engineering build up estimate. While this is a simple illustration of the engineering build up methodology, it is important to remember to conduct other detail activities such as documenting the Basis of Estimates (BOEs) and schedules, and applying wage and overhead rates.
Segregate into CES/WBS Decompose
CES/WBS into “Work Packages”
Estimate Individual
“Work Packages” Aggregate“Work Packages”
Perform “Sanity Check”
Aggregate into “Total Estimate”
Test for Omissions & Duplications
Figure 1-14. Method for Developing Engineering Build Up Estimate
There are also situations where the engineering community provides their �“professional judgment,�” but only in the absence of empirical data. Experience and analysis of the environment and available data provides latitude in predicting costs for the estimator with this method. This method of engineering judgment and expert opinion is known as the Delphi method. The cost estimator�’s interview skills are important when relying on the Delphi method to capture and properly document the knowledge being shared from an engineer�’s expert opinion. Delphi

Cost Estim
atingC
ost Risk
Economic &
Supporting AnalysisC
areer Developm
ent Guide
Reference
Know
ledge Managem
entC
ost Estimating
Cost R
iskEconom
ic & Supporting Analysis
Career D
evelopment G
uideR
eferenceK
nowledge M
anagement
2008 NASA Cost Estimating Handbook Section 4. Cost Estimating Process
Volume 1 Page 1-33
method usually involves getting a group of experts to converge on a value by iterating estimates using varying amounts of feedback. During this process, individuals are generally not identified to the outside, and in some experiments, not identified to each other.
Table 1-8 provides a list of the strengths and weaknesses of using the engineering build up method to develop a cost estimate.
Table 1-8. Strengths and Weaknesses of Engineering Build Up Method of Cost Estimating
Strengths Weaknesses
Intuitive Costly; significant effort (time and money) required to create a build-up estimate
Defensible Not readily responsive to "what if" requirements
Credibility provided by visibility into the BOE for each cost element
New estimates must be "built-up" for each alternative scenario
Severable; the entire estimate is not compromised by the miscalculation of an individual cost element
Cannot provide "statistical" confidence level
Provides excellent insight into major cost contributors
Does not provide good insight into cost drivers
Reuse; easily transferable for use and insight into individual project budgets and individual performer schedules
Relationships/links among cost elements must be "programmed" by the analyst
4.2.3 Task 6: Select/Construct Cost Model The objective of this task is to select the most appropriate tool/model or to create a model to estimate the cost. Factors that influence the selection process include data and resource availability, schedule, and cost.
There are three activities associated with selecting or constructing a model.
�• Review available choices and make a selection. If no suitable alternatives exist, explore the option of creating a model
�• Ensure that the model is validated and full cost compliant
�• Be prepared to defend the choice
Many cost estimating models exist, and, similar to the estimating methodologies, no single cost model can be used for all purposes. Some models are a basic construct to be used as a tool while other models are estimating environments that can be all-inclusive and automate many functions for the cost estimator. A model can also use a variety of estimating methodologies and direct inputs to complete a full estimate.
For each methodology described in the previous section, there are a multitude of both commercially available and government developed or owned models from which the cost estimator can make his/her selection. Generally speaking, one of these models and/or tools should help the cost estimator complete his/her task in a more efficient/effective manner. Many of the tools provide a construct to use for the model, standard WBSs, as well as data and CERs that can be used in the estimate. In addition, many cost estimators use Excel to create their own model when there are estimating needs that cannot be met by commercially available models.
Cost Estim
atingC
ost Risk
Economic &
Supporting AnalysisC
areer Developm
ent Guide
Reference
Know
ledge Managem
entC
ost Estimating
Cost R
iskEconom
ic & Supporting Analysis
Career D
evelopment G
uideR
eferenceK
nowledge M
anagement
2008 NASA Cost Estimating Handbook Section 4. Cost Estimating Process
Volume 1 Page 1-34
Information about many modeling products can be found in the Cost Model Prospectus listed in the Reference volume.
Many commercially available models are parametric models that generate estimates based on specific parameters that drive an estimate�’s cost. These cost drivers include items such as weight, volume, quantity, and schedule. These models can be used when only a few of these input parameters are known to generate a high level estimate. If many of the cost drivers have been identified and there are many known technical input parameters, these models can also be used to generate very detailed and complex cost estimates. Commercially available parametric models use normalized industry data sets in generic and sometimes proprietary algorithms. In many cases, these models should be calibrated based on the product that is being estimated to ensure the estimate takes into account factors such as the project environment (e.g., space, air) for a more accurate estimate. If a NASA estimator chooses to create his or her own parametric model with NASA data, the model is in effect, self-calibrated.
In some cases, an estimator may develop an extensive set of CERs for a specific item or to support a specific deliverable or purpose. In such cases, it may be more efficient for the estimator to develop and tailor their own model if the estimator is skilled at CER development, model building, and can have the model validated.
Most commonly used, Excel is a powerful, flexible spreadsheet tool used by the Government and the private sector. Due to its popularity, many in industry are savvy users and can deliver impressive models using the formulas, graphs, and Visual Basic functions that are embedded in the software. The Microsoft software packages, including Access, Excel, PowerPoint, and Word are compatible with each other, which creates a seamless environment of automated tools. The advantage of creating your model in Excel is the ability of having a �“glass box�” model where all formulas and intricacies of your creation can be easily traced. The powerful formula and Visual Basic functions that are part of Excel provide endless avenues of creative model formulation. The ability to transfer the model from one place to another is fluid.
The disadvantage of creating a model in Excel is that the cost estimator needs to build the model from scratch. The analyst must take the time to draw the layout of how the model is going to look and how all the equations are going to fit together. Excel does not have embedded risk tools in the software but add-in tools are available to conduct risk analysis.
If an estimator chooses to build his or her own model, following a disciplined process will ensure a credible product. Once the estimator has identified the need for a model and determined the model type, the model design can begin. The importance of spending time up front to design and understand the model cannot be underestimated. The model developer needs to define the scope of the model, how it will ultimately be used, and the approach for integrating the data and CERs collected and developed. While planning the development, it is important to document the model GR&A that will be used.
After the model has been developed and populated with at least preliminary cost data, it must be validated before the estimator uses it. Once the model has been validated and any corrections or updates incorporated, it is fit for use to generate estimates. To complete the model development process, user documentation and training should be prepared.

Cost Estim
atingC
ost Risk
Economic &
Supporting AnalysisC
areer Developm
ent Guide
Reference
Know
ledge Managem
entC
ost Estimating
Cost R
iskEconom
ic & Supporting Analysis
Career D
evelopment G
uideR
eferenceK
nowledge M
anagement
2008 NASA Cost Estimating Handbook Section 4. Cost Estimating Process
Volume 1 Page 1-35
4.2.4 Task 7: Gather and Normalize Data The objective of this task is to arm the cost estimator with as much information as possible so that he/she can develop the most accurate and justifiable cost estimate.
There are four activities associated with gathering and normalizing data.
�• Identify data needed and potential data sources �• Review, interview, and/or survey data sources to obtain data �• Conduct project schedule analysis �• Normalize data
Data collection is one of the most difficult, time-consuming, and costly activities in cost estimating. Data needs are not always clear at the assignment�’s beginning and data requirements often evolve during an estimate�’s development. An estimator needs to recognize that data adjustments may be necessary to support a particular NASA Project Office�’s need.
It is also critical to collect risk data at this time to support the cost-risk assessment. Many of the experts that will be interviewed and the data that will be reviewed in this effort will not only support the cost estimate, but can assist in identifying risks early, and can also save time by reducing data collection later in the process during the cost risk assessment.
Typically, this is the step in the process where data collection occurs. However, as previously noted, data collection can occur in earlier steps, such as collecting data for regression analysis to support a methodology or even earlier in the process when the estimator is understanding the project. The following are potential mechanisms available to the cost estimator for identifying quantitative cost data:
�• Surveys and/or questionnaires
�• Model specific data collection/input forms
�• Interviews
�• Focus groups
�• Target research (public domain or otherwise), including reviews, papers, and statistical analysis
�• Specific cost, technical, and programmatic data from primary and secondary sources (e.g., budget data, contract cost data, labor rates, manpower estimates, etc.)
NDAs are required for non-government employee access to Confidential Business Information (CBI), which includes proprietary and competition-sensitive contractor data. Applicable NDAs must be in-place between the originating and requesting organizations before access to such information can be provided. NASA places the highest priority on protection of contractor technical and cost data. Federal employees are subject to the relevant provisions of the Federal Trade Secrets Act. For further information on this subject, contact the HQ Cost Analysis Division.
Based upon the resources, the schedule and the expectations, the estimator should use as many of these data collection methods as can be supported. The cost estimator will work with the PM and
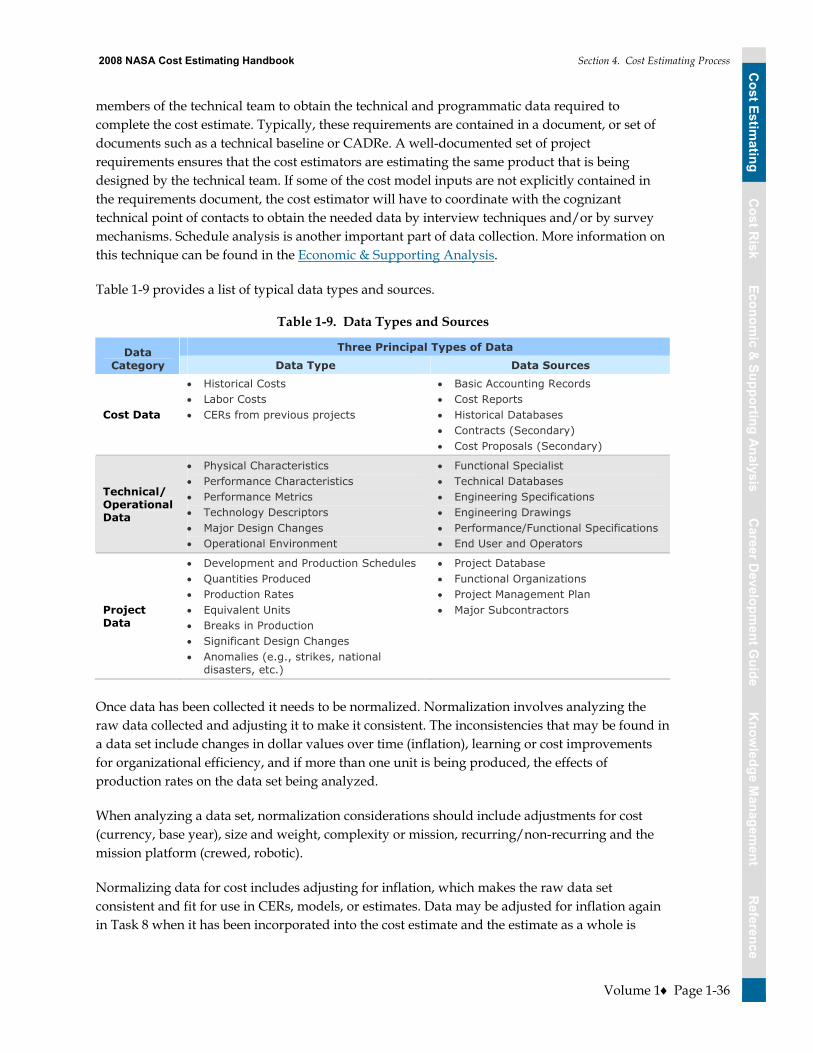
Cost Estim
atingC
ost Risk
Economic &
Supporting AnalysisC
areer Developm
ent Guide
Reference
Know
ledge Managem
entC
ost Estimating
Cost R
iskEconom
ic & Supporting Analysis
Career D
evelopment G
uideR
eferenceK
nowledge M
anagement
2008 NASA Cost Estimating Handbook Section 4. Cost Estimating Process
Volume 1 Page 1-36
members of the technical team to obtain the technical and programmatic data required to complete the cost estimate. Typically, these requirements are contained in a document, or set of documents such as a technical baseline or CADRe. A well-documented set of project requirements ensures that the cost estimators are estimating the same product that is being designed by the technical team. If some of the cost model inputs are not explicitly contained in the requirements document, the cost estimator will have to coordinate with the cognizant technical point of contacts to obtain the needed data by interview techniques and/or by survey mechanisms. Schedule analysis is another important part of data collection. More information on this technique can be found in the Economic & Supporting Analysis.
Table 1-9 provides a list of typical data types and sources.
Table 1-9. Data Types and Sources
Three Principal Types of Data Data Category Data Type Data Sources
Cost Data
Historical Costs Labor Costs CERs from previous projects
Basic Accounting Records Cost Reports Historical Databases Contracts (Secondary) Cost Proposals (Secondary)
Technical/ Operational Data
Physical Characteristics Performance Characteristics Performance Metrics Technology Descriptors Major Design Changes Operational Environment
Functional Specialist Technical Databases Engineering Specifications Engineering Drawings Performance/Functional Specifications End User and Operators
Project Data
Development and Production Schedules Quantities Produced Production Rates Equivalent Units Breaks in Production Significant Design Changes Anomalies (e.g., strikes, national
disasters, etc.)
Project Database Functional Organizations Project Management Plan Major Subcontractors
Once data has been collected it needs to be normalized. Normalization involves analyzing the raw data collected and adjusting it to make it consistent. The inconsistencies that may be found in a data set include changes in dollar values over time (inflation), learning or cost improvements for organizational efficiency, and if more than one unit is being produced, the effects of production rates on the data set being analyzed.
When analyzing a data set, normalization considerations should include adjustments for cost (currency, base year), size and weight, complexity or mission, recurring/non-recurring and the mission platform (crewed, robotic).
Normalizing data for cost includes adjusting for inflation, which makes the raw data set consistent and fit for use in CERs, models, or estimates. Data may be adjusted for inflation again in Task 8 when it has been incorporated into the cost estimate and the estimate as a whole is
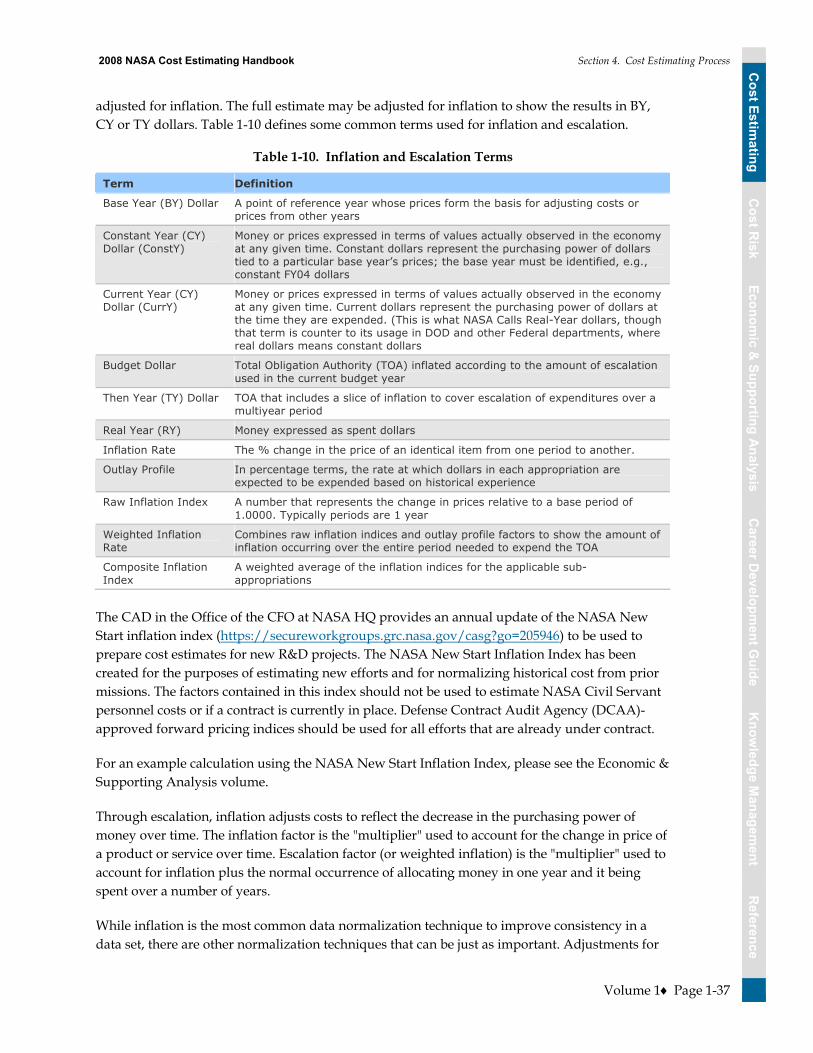
Cost Estim
atingC
ost Risk
Economic &
Supporting AnalysisC
areer Developm
ent Guide
Reference
Know
ledge Managem
entC
ost Estimating
Cost R
iskEconom
ic & Supporting Analysis
Career D
evelopment G
uideR
eferenceK
nowledge M
anagement
2008 NASA Cost Estimating Handbook Section 4. Cost Estimating Process
Volume 1 Page 1-37
adjusted for inflation. The full estimate may be adjusted for inflation to show the results in BY, CY or TY dollars. Table 1-10 defines some common terms used for inflation and escalation.
Table 1-10. Inflation and Escalation Terms
Term Definition
Base Year (BY) Dollar A point of reference year whose prices form the basis for adjusting costs or prices from other years
Constant Year (CY) Dollar (ConstY)
Money or prices expressed in terms of values actually observed in the economy at any given time. Constant dollars represent the purchasing power of dollars tied to a particular base year’s prices; the base year must be identified, e.g., constant FY04 dollars
Current Year (CY) Dollar (CurrY)
Money or prices expressed in terms of values actually observed in the economy at any given time. Current dollars represent the purchasing power of dollars at the time they are expended. (This is what NASA Calls Real-Year dollars, though that term is counter to its usage in DOD and other Federal departments, where real dollars means constant dollars
Budget Dollar Total Obligation Authority (TOA) inflated according to the amount of escalation used in the current budget year
Then Year (TY) Dollar TOA that includes a slice of inflation to cover escalation of expenditures over a multiyear period
Real Year (RY) Money expressed as spent dollars
Inflation Rate The % change in the price of an identical item from one period to another.
Outlay Profile In percentage terms, the rate at which dollars in each appropriation are expected to be expended based on historical experience
Raw Inflation Index A number that represents the change in prices relative to a base period of 1.0000. Typically periods are 1 year
Weighted Inflation Rate
Combines raw inflation indices and outlay profile factors to show the amount of inflation occurring over the entire period needed to expend the TOA
Composite Inflation Index
A weighted average of the inflation indices for the applicable sub-appropriations
The CAD in the Office of the CFO at NASA HQ provides an annual update of the NASA New Start inflation index (https://secureworkgroups.grc.nasa.gov/casg?go=205946) to be used to prepare cost estimates for new R&D projects. The NASA New Start Inflation Index has been created for the purposes of estimating new efforts and for normalizing historical cost from prior missions. The factors contained in this index should not be used to estimate NASA Civil Servant personnel costs or if a contract is currently in place. Defense Contract Audit Agency (DCAA)-approved forward pricing indices should be used for all efforts that are already under contract.
For an example calculation using the NASA New Start Inflation Index, please see the Economic & Supporting Analysis volume.
Through escalation, inflation adjusts costs to reflect the decrease in the purchasing power of money over time. The inflation factor is the "multiplier" used to account for the change in price of a product or service over time. Escalation factor (or weighted inflation) is the "multiplier" used to account for inflation plus the normal occurrence of allocating money in one year and it being spent over a number of years.
While inflation is the most common data normalization technique to improve consistency in a data set, there are other normalization techniques that can be just as important. Adjustments for
Cost Estim
atingC
ost Risk
Economic &
Supporting AnalysisC
areer Developm
ent Guide
Reference
Know
ledge Managem
entC
ost Estimating
Cost R
iskEconom
ic & Supporting Analysis
Career D
evelopment G
uideR
eferenceK
nowledge M
anagement
2008 NASA Cost Estimating Handbook Section 4. Cost Estimating Process
Volume 1 Page 1-38
learning or cost improvement curves may apply to the data set that you have collected. Production rate (units produced over a time period) may also have an affect on the raw data set, which calls for adjustment. In the case of production rates, there may be patterns or influences in the production of the item such as facilities or manpower that affect the data. At NASA, there are not many projects that involve production, however data collected from other sources that may be used in NASA estimates may have production considerations that should be taken into account. Other adjustments that may need to be made to normalize data include:
�• Checking for scope consistency between the historical data of a product and the product being estimated
�• Unusual events or anomalies in a projects life, such as extra testing, failures, or labor anomalies
�• Technology improvements and advancements, where the data may need to be adjusted by using engineering judgment
�• Raw data adjustments from reporting system anomalies or changes, such as a change in rates, factors, or hours for standard reporting
�• Reporting system differences which may require mapping accounting classifications or categories of data to WBS elements
Once data has been normalized, it should be reviewed and validated by the estimator to ensure that a consistent data collection methodology, consistent data collection formats, and procedures to identify data anomalies are in place. Considerations such as data sufficiency to support the estimating methodology selected and documentation to ensure traceability of adjustments made to the data are also critical. These documented factors assist the estimator with the validation of the data and lead to data reliability and ultimately contribute to estimate credibility.
If an estimator takes each of these steps into consideration when identifying and collecting data, analyzing schedules, and normalizing data, the repeatability and credibility of the data supporting the estimate will be improved.
4.3 Part 3: Estimate Tasks Cost estimates are used as baseline rationale to develop budget submissions for Presidential and Congressional approval and are used internally to support program reviews and investment decisions. The last five tasks of the cost estimating process revolve around the actual generation and documentation of the estimate. These tasks are detailed below.
4.3.1 Task 8: Develop Point Estimate The goal of this task is to create an accurate LCC point estimate to be used in conjunction with the cost risk assessment to develop the final estimate.
There are eight activities associated with developing a point estimate:
�• Populate model with the normalized data collected �• Verify the GR&As �• Ensure the estimate is full cost compliant
1. Project Definition
2. Cost Methodology
3. Estimate
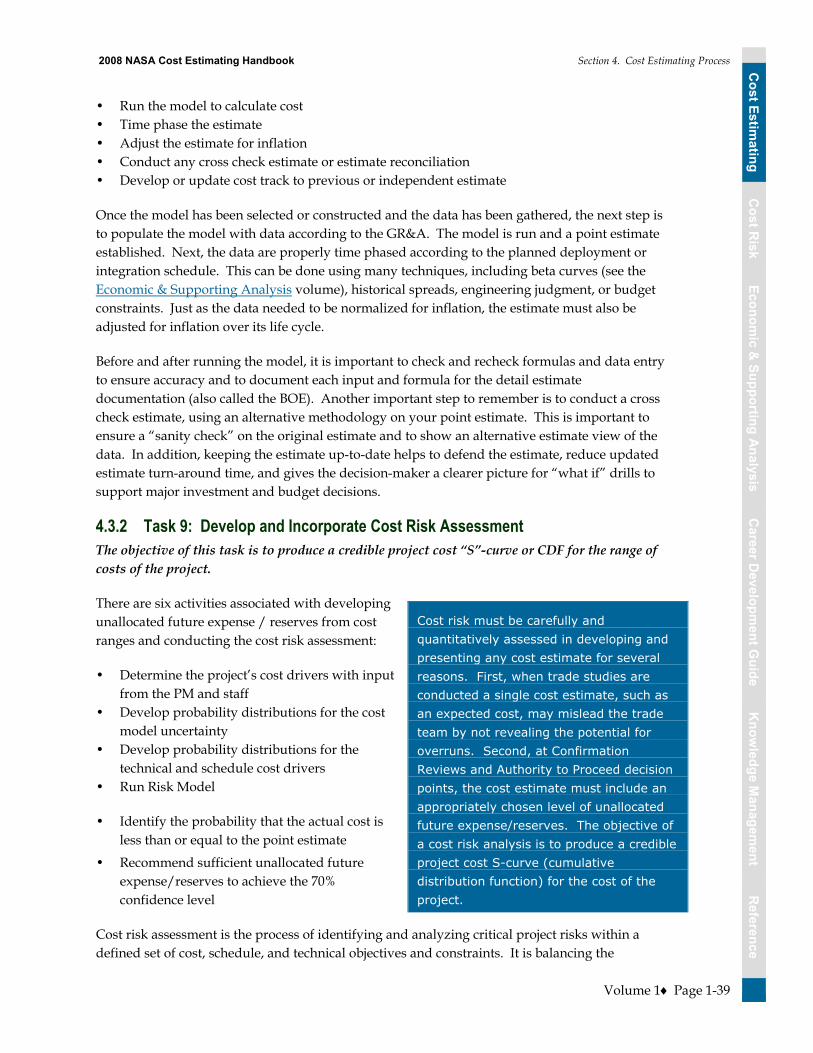
Cost Estim
atingC
ost Risk
Economic &
Supporting AnalysisC
areer Developm
ent Guide
Reference
Know
ledge Managem
entC
ost Estimating
Cost R
iskEconom
ic & Supporting Analysis
Career D
evelopment G
uideR
eferenceK
nowledge M
anagement
2008 NASA Cost Estimating Handbook Section 4. Cost Estimating Process
Volume 1 Page 1-39
�• Run the model to calculate cost �• Time phase the estimate �• Adjust the estimate for inflation �• Conduct any cross check estimate or estimate reconciliation �• Develop or update cost track to previous or independent estimate
Once the model has been selected or constructed and the data has been gathered, the next step is to populate the model with data according to the GR&A. The model is run and a point estimate established. Next, the data are properly time phased according to the planned deployment or integration schedule. This can be done using many techniques, including beta curves (see the Economic & Supporting Analysis volume), historical spreads, engineering judgment, or budget constraints. Just as the data needed to be normalized for inflation, the estimate must also be adjusted for inflation over its life cycle.
Before and after running the model, it is important to check and recheck formulas and data entry to ensure accuracy and to document each input and formula for the detail estimate documentation (also called the BOE). Another important step to remember is to conduct a cross check estimate, using an alternative methodology on your point estimate. This is important to ensure a �“sanity check�” on the original estimate and to show an alternative estimate view of the data. In addition, keeping the estimate up-to-date helps to defend the estimate, reduce updated estimate turn-around time, and gives the decision-maker a clearer picture for �“what if�” drills to support major investment and budget decisions.
4.3.2 Task 9: Develop and Incorporate Cost Risk Assessment The objective of this task is to produce a credible project cost �“S�”-curve or CDF for the range of costs of the project.
There are six activities associated with developing unallocated future expense / reserves from cost ranges and conducting the cost risk assessment:
�• Determine the project�’s cost drivers with input from the PM and staff
�• Develop probability distributions for the cost model uncertainty
�• Develop probability distributions for the technical and schedule cost drivers
�• Run Risk Model
�• Identify the probability that the actual cost is less than or equal to the point estimate
�• Recommend sufficient unallocated future expense/reserves to achieve the 70% confidence level
Cost risk assessment is the process of identifying and analyzing critical project risks within a defined set of cost, schedule, and technical objectives and constraints. It is balancing the
Cost risk must be carefully and quantitatively assessed in developing and presenting any cost estimate for several reasons. First, when trade studies are conducted a single cost estimate, such as an expected cost, may mislead the trade team by not revealing the potential for overruns. Second, at Confirmation Reviews and Authority to Proceed decision points, the cost estimate must include an appropriately chosen level of unallocated future expense/reserves. The objective of a cost risk analysis is to produce a credible project cost S-curve (cumulative distribution function) for the cost of the project.

Cost Estim
atingC
ost Risk
Economic &
Supporting AnalysisC
areer Developm
ent Guide
Reference
Know
ledge Managem
entC
ost Estimating
Cost R
iskEconom
ic & Supporting Analysis
Career D
evelopment G
uideR
eferenceK
nowledge M
anagement
2008 NASA Cost Estimating Handbook Section 4. Cost Estimating Process
Volume 1 Page 1-40
probability of failing to achieve a particular outcome against the consequences of failing to achieve that outcome. This task also allows the cost estimator to document risks in a manner that accommodates proactive management of project costs. Details about methodologies and how to conduct cost risk assessments are provided in the Cost Risk volume.
Cost risk analysis quantifies the necessary budgeted unallocated future expense/reserves necessary for acceptable level of confidence. When asked how much of the dollar figure being proposed is for management unallocated future expense/reserve, a good strategy is to prepare the calculation below in advance, so that you can respond to that question by saying that the percentage (namely, whatever [(70th-50th)/50th] x 100% turns out to be) is the amount by which the 70th percentile cost exceeds the 50th, and therefore can be considered unallocated future expense/reserves. Risk dollars should be phased in the estimate where they will most likely be needed. Most often the risk dollars are needed when common problems manifest between PDR and CDR and then again during Integration and Test. High leverage risk mitigation is commonly most effective prior to PDR.
It is recommended that a sensitivity analysis be performed to identify the major cost drivers, i.e., those variables whose changes create the greatest changes in cost. Sensitivity analysis helps to determine how the different ranges of estimates affect the point estimates. For decision-makers, a range estimate with an understanding of the certainty of how likely it is to occur within that range is generally more useful than a point estimate. Due to the nature of the NASA design and development process, there will always be uncertainty about the values of some, if not all, of the technical parameters during the definition phase of a project. Likewise, many of the assumptions made at the beginning of a project�’s definition phase will turn out to be inaccurate. Therefore, once the point estimate is developed, it is often desirable to determine how sensitive the total cost estimate is to changes in the input data.
While sensitivity analyses can occur at any stage of an estimate, it generally makes sense to derive an unconstrained solution that meets all mission objectives initially, and then begin to �“back off�” that solution in the interests of saving money. Care must be taken, however, not to impact the material solution to such an extent that the benefits derived from that solution are significantly altered through introduction of the changes.
Choosing the Level of Unallocated Future Expense / Reserves
The level of unallocated future expense/reserves or unallocated future expense/reserve percentage should be selected based upon achieving a particular level of confidence from the resultant cost S-curve for the entire program/project. The appropriate level of confidence is chosen by the Program/PM after the analysis, and the resulting unallocated future expense/reserves should be identified as the recommended level at all Confirmation Reviews.
Cost Estim
atingC
ost Risk
Economic &
Supporting AnalysisC
areer Developm
ent Guide
Reference
Know
ledge Managem
entC
ost Estimating
Cost R
iskEconom
ic & Supporting Analysis
Career D
evelopment G
uideR
eferenceK
nowledge M
anagement
2008 NASA Cost Estimating Handbook Section 4. Cost Estimating Process
Volume 1 Page 1-41
For trade studies and formal analyses of alternatives, the cost analyst may choose to add unallocated future expense/reserves so as to hold the level of confidence constant across all alternatives and report the resulting cost, or to add unallocated future expense reserves so as to hold the cost constant and report the resulting level of confidence
4.3.3 Task 10: Document Probabilistic Cost Estimate The objective of this task is to capture, in a continuous fashion, from project initiation through completion, the LCC results of the cost estimating process, and all of its by products (confidence levels, Cost Readiness Level (CRL), risk unallocated future expense/reserves).
There are three activities associated with documenting the cost estimate:
�• Document the LCC estimate and any BOE required to support the LCCE. �• Determine the quality of the cost estimate, fitness for use, and document the CRL. �• Conduct peer review
The purpose of the cost documentation is to provide a written justification for the program cost estimate. Given the size and importance of programs, the documentation clearly should be viewed as a substantive and professional effort. A general rule-of-thumb is that the final product should provide sufficient information on how the estimate was developed so that independent cost analysts--or other review team members--could reproduce the estimate. Although standardization of the content and format of the cost estimate documentation across all NASA Centers is unrealistic, it is recommended that each Center maintain as much consistency internally with respect to the documentation content and format as possible since this promotes completeness and quality agency-wide of the cost estimate�’s documentation. Cost estimators document the LCC results throughout the entire cost estimating process�—not just when the estimate is complete. The final documentation should capture both the estimates for each element supporting the point estimate and the cost risk assessment integration.
The means by which each part of an estimate has been derived must be fully explained, and the databases employed must be provided in the documentation or clearly identified. A Comparison Cost Track by element to identify and explain any deviations between the estimate and the prior estimate should also be included. If other alternatives are being considered, a brief summary of each alternative should also be included.
In addition to providing a brief description of the system or project being estimated, cost documentation provides:
�• Methodology and/or models used
�• Sufficient information on how the estimate was developed to allow independent cost analysts or other review team members to reproduce the estimate if required:
�– Inflation and other supporting assumptions
�– Data sources
�– BOE (e.g., equations applied, quantities used, labor rates and manpower estimates, schedules)
�– New facilities, initial spares, and other start-up investment costs
Cost Estim
atingC
ost Risk
Economic &
Supporting AnalysisC
areer Developm
ent Guide
Reference
Know
ledge Managem
entC
ost Estimating
Cost R
iskEconom
ic & Supporting Analysis
Career D
evelopment G
uideR
eferenceK
nowledge M
anagement
2008 NASA Cost Estimating Handbook Section 4. Cost Estimating Process
Volume 1 Page 1-42
�– Operations costs with specific operational scenarios
�– Sunk costs and project remaining life-cycle costs by phase
�– Net Present Value
�• The means by which each part of an estimate and the databases used can be fully explained
�• A brief description of the acquisition strategy as it impacts/influences the LCC
�• Cost S-curve and unallocated future expense/reserves sufficiency analysis
�• Sensitivity analyses
�• A comparison track to identify and explain any deviations between the current estimate and any prior estimate
�• CRL
The benefit of a well-documented estimate is that the differences with other cost estimating efforts for the same program/project should be easily reconcilable from the documented information. Its value is in providing an understanding of the cost elements so that decision-makers can make informed decisions. Reasons why proper documentation is important in a cost estimate include:
�• Experience from formal cost reviews, such as NARs, has proven that poorly documented analyses do not fare well. The credibility of the total project suffers if the analyst is unable to explain the rationale used to derive each of the cost estimates. Conversely, if a reviewer understands your inputs, approach, and assumptions, your estimate remains credible in his/her eyes regardless of whether disagreements remain or adjustments are recommended
�• If the BOE is explicitly documented, it is easier to modify key assumptions as they change during the course of the project life cycle, facilitating updates to the estimate and providing a verifiable trace to a new cost baseline. Importantly, this supports the requirement imposed by NPR 7120.4 to revalidate the Program Cost Commitment (PCC) annually. A well-documented CADRe not only facilitates the establishment of the baseline PCC, but also aids the revalidation process and the development of updated PCCs
Documentation should include a qualitative assessment of each line item, along with risk confidence levels for each element. The summary is where the detailed estimate is located. The level of detail varies with the estimate but the rule of thumb is enough detail to be replicable by another estimator. Supporting data too complex for this section should be included in the appendix. It is important for the documentation to be accessible which means not just available in the actual cost model. There should be an accompanying written document such as a BOE that provides an explanation of estimate details and data sources.
A peer review is another important part of completing an estimate. Once the estimate has been completed and documented and before the estimate is presented to decision makers, it is important for the estimator to get an outside review. This �“sanity check�” can provide an outside perspective and a fresh view of the estimate, which can catch any issues with the estimate to be corrected before presentation. This review can also prepare the estimator for the actual process of briefing the estimate to decision makers. A peer review can be conducted continuously during the cost estimating process or at any point along the way, but should be completed in full once the estimate is complete and documented.

Cost Estim
atingC
ost Risk
Economic &
Supporting AnalysisC
areer Developm
ent Guide
Reference
Know
ledge Managem
entC
ost Estimating
Cost R
iskEconom
ic & Supporting Analysis
Career D
evelopment G
uideR
eferenceK
nowledge M
anagement
2008 NASA Cost Estimating Handbook Section 4. Cost Estimating Process
Volume 1 Page 1-43
Cost Documentation Best Practices
�• Begin documentation efforts early and continue throughout the full estimate development process. Document sources in the actual models and carry these documentation details through to the estimate write up as well as the estimate presentations
�• When a CER is used, it should be presented and its source must be cited fully, or the model and the set of data with which it was calibrated must be cited. A cost estimator reviewing the cost documentation should be able to obtain enough information either from the document or from the sources cited therein to reconstruct the CER and evaluate its associated statistics. CER documentation should include descriptive statistics, such as R-squared, correlation coefficients, T-statistics, relevant range, etc. This information is necessary to assess the applicability of a CER adequately
�• Where subjective judgments (Delphi method) are used to adjust estimates made by analogy with other systems or components of systems, the professions of those making the judgments must be identified (e.g., cost analysts, engineers, etc.,) and full citations for the source(s) of the costs of each element in an engineering or �“grass roots�” estimate must also be cited
�• Present detailed examples of the first and second levels of the cost elements normally included in LCCEs for the each phase
�• When used in the estimate, actual cost history from past or present contracts or analogous programs should be provided
�• Areas of uncertainty such as pending negotiations, concurrency, schedule risk, performance requirements that are not yet firm, appropriateness of analogies, level of knowledge about support concepts, critical assumptions, etc., should be presented
�• Sensitivity analysis should be performed to include the cost of changing significant input parameters. Risk analysis should include risk adjusted point estimates. Crosschecks should be included for all high cost/high risk portions of the estimate
�• Tracking through a comparison or cost track is required when an estimate changes. Documentation must include the specific reasons for the change
4.3.4 Task 11: Present Estimate Results While it may not be realistic to standardize the content and format of the cost estimating briefing charts across all NASA Centers for all estimate types, the objective of this task is to promote the quality of the cost estimating and analysis documentation by advocating consistency across and in Centers.
There are three activities associated with presenting/briefing results:
�• Create briefing materials and supporting documentation to be used for internal and external presentations as appropriate. (See the Cost Estimate Briefing Template in the Reference Volume)
�• Present and defend the estimate
�• Gather from customers and provide feedback to capture improvements for the next estimate. (See the Sample Customer Feedback Form in the Reference Volume)

Cost Estim
atingC
ost Risk
Economic &
Supporting AnalysisC
areer Developm
ent Guide
Reference
Know
ledge Managem
entC
ost Estimating
Cost R
iskEconom
ic & Supporting Analysis
Career D
evelopment G
uideR
eferenceK
nowledge M
anagement
2008 NASA Cost Estimating Handbook Section 4. Cost Estimating Process
Volume 1 Page 1-44
Consistency in presenting cost estimates across and in Centers facilitates understanding during the management review process and promotes completeness and quality of the cost estimating and analysis documentation. A template for the first five pages for a standard cost estimate briefing at NASA has been provided for download at ceh.nasa.gov/downloadfiles. A summary of this template and its use has been provided in the Reference volume. Estimators are encouraged to use this template for all estimate briefings to increase consistency, decision maker familiarization, and comfort with the template and in the long run, to build credibility in estimate presentations at all levels at NASA.
The cost estimator should prepare briefing material and supporting documentation to be used for internal and external presentations as appropriate. It is again recommended that each Center maintain as much consistency internally as to the data format as possible since this facilitates understanding during the management review process and promotes completeness and quality of the cost estimating and analysis documentation by using the provided template. Thorough documentation is essential for a valid and defensible cost estimate. Cost presentation documentation provides a concise, focused illustration of key points that should direct the reader�’s attention to the cost drivers and cost results.
4.3.5 Task 12: Update Cost Estimate on Regular Basis The purpose of updating the cost estimate is to defend the estimate over time, to reduce updated estimate turn-around time, and to give decision-makers a clearer picture for major decisions or �“what if�” drills.
There are two activities associated with updating the cost estimate on a regular basis:
�• Assess and utilize customer feedback along with lessons learned and incorporate this feedback to the next version of the estimate
�• Update estimate when project content changes and as the project moves through its life cycle phases and conducts milestone reviews
Cost estimates must be updated whenever project content changes and reconciled to the estimate baseline. By accomplishing a cost estimate on proposed program alternatives, the Project Office can determine the cost impact of the alternatives.
4.4 Cost Estimating Considerations By Project Life Cycle Phases In this section, the twelve tasks in the cost estimating process are described in relationship to the six phases of the project life cycle. When conducting an estimate it is important for the cost estimator to understand the impact that the life cycle phase of the program can have on each of the cost estimating process steps. This section focuses on high-level information in the context of the process. Details about how to conduct each task within the cost estimating process are provided in the previous section. Figure 1-15 illustrates that the life cycle phase influences the type of estimate required and which organizations get involved. In this section, the overall objectives, issues and challenges, roles and responsibilities, and exit criteria for each of the six NASA life cycle phases are described. As shown in the figure below, the CRL can be influenced by the project life cycle phase.

Cost Estim
atingC
ost Risk
Economic &
Supporting AnalysisC
areer Developm
ent Guide
Reference
Know
ledge Managem
entC
ost Estimating
Cost R
iskEconom
ic & Supporting Analysis
Career D
evelopment G
uideR
eferenceK
nowledge M
anagement
2008 NASA Cost Estimating Handbook Section 4. Cost Estimating Process
Volume 1 Page 1-45
Projects Perform Estimates With Center Cost Organization, CFO
Involvement----------------
CAD/IPAO Cognizance
Cost Readiness Level 1-3
LCC Communicated To OMB (As A Range Estimate); Firm Cost
for Year 1 of C/D----------------
CAD/IPAO Review
Cost Readiness Level 3-5
Phase A Phase BPhase D
(Special Case) Phase E
ATP IOC
Commitment Estimate
----------------CAD/IPAO Review
Cost Readiness Level 5-7
Acquisition Life Cycle Phases
Pre-Phase A Phase C/D
Figure 1-15. Life Cycle Influence
4.4.1 Pre-Phase A Pre-Phase A activities uncover, invent, create, concoct and/or device a broad spectrum of ideas and alternatives for missions from which new projects (programs) can be selected. This phase consists of loosely structured examinations of new ideas, usually without central control and mostly oriented toward small studies. It�’s major product is a stream of suggested projects, based on the identification of needs and the discovery of opportunities that are potentially consistent with NASA�’s mission, capabilities, priorities, and resources. In this phase, the system or product configuration is generally in concept development and therefore, Pre-Phase A is characterized by intense early cost/performance trade analyses between requirements and costs. Pre-Phase A is also a time of early project definition of multiple options, with the development of the initial WBS and project technical description.
Pre-Phase A Overall Objectives
Investments should contribute directly to an organization successfully meeting its mission. Working closely with the project technical staff to examine the costs, benefits, and risks associated with making an investment, the overall objectives in Pre-Phase A are to determine the best solution to meet NASA�’s mission, goals, and objectives within its cost, technical performance, and risk tolerance baselines. This is done by conducting and analyzing ROM LCC estimates, by establishing performance metrics, and by analyzing benefits and risks. The cost estimator must work with the PM to establish the cost risk margin(s) that are broad enough in range to account for the level of uncertainty and to ensure that the CRL reflects this uncertainty.
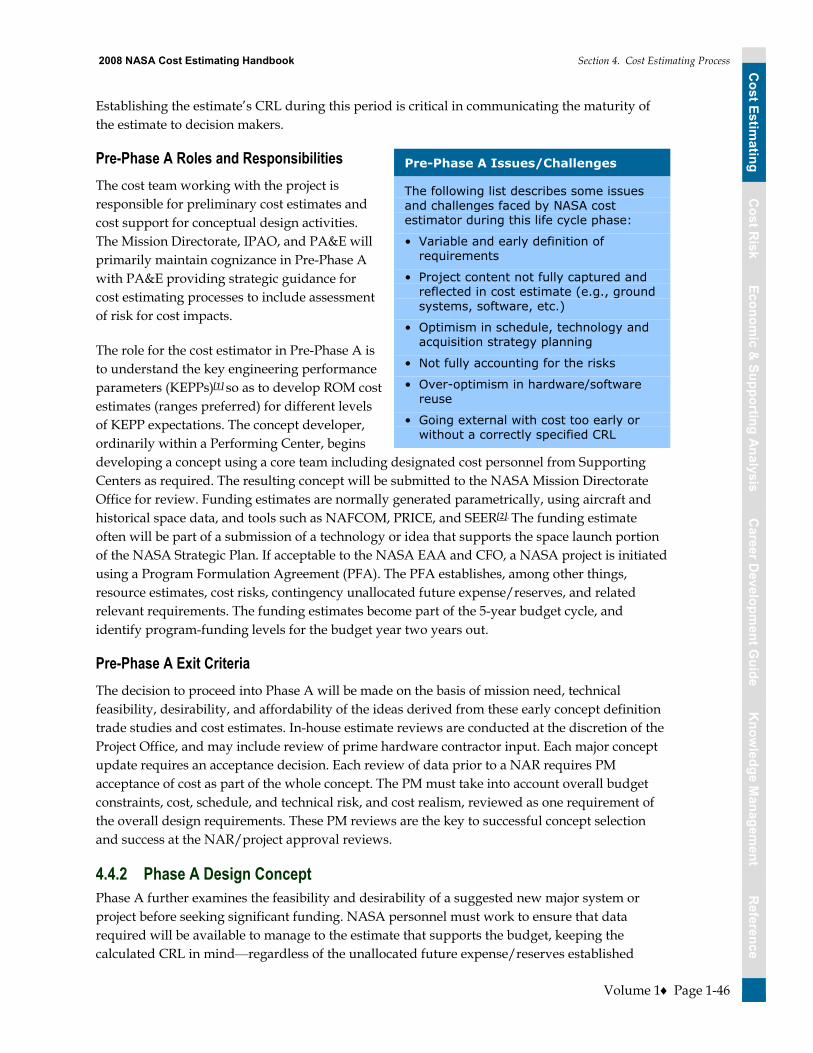
Cost Estim
atingC
ost Risk
Economic &
Supporting AnalysisC
areer Developm
ent Guide
Reference
Know
ledge Managem
entC
ost Estimating
Cost R
iskEconom
ic & Supporting Analysis
Career D
evelopment G
uideR
eferenceK
nowledge M
anagement
2008 NASA Cost Estimating Handbook Section 4. Cost Estimating Process
Volume 1 Page 1-46
Establishing the estimate�’s CRL during this period is critical in communicating the maturity of the estimate to decision makers.
Pre-Phase A Roles and Responsibilities
The cost team working with the project is responsible for preliminary cost estimates and cost support for conceptual design activities. The Mission Directorate, IPAO, and PA&E will primarily maintain cognizance in Pre-Phase A with PA&E providing strategic guidance for cost estimating processes to include assessment of risk for cost impacts.
The role for the cost estimator in Pre-Phase A is to understand the key engineering performance parameters (KEPPs)[1] so as to develop ROM cost estimates (ranges preferred) for different levels of KEPP expectations. The concept developer, ordinarily within a Performing Center, begins developing a concept using a core team including designated cost personnel from Supporting Centers as required. The resulting concept will be submitted to the NASA Mission Directorate Office for review. Funding estimates are normally generated parametrically, using aircraft and historical space data, and tools such as NAFCOM, PRICE, and SEER[2]. The funding estimate often will be part of a submission of a technology or idea that supports the space launch portion of the NASA Strategic Plan. If acceptable to the NASA EAA and CFO, a NASA project is initiated using a Program Formulation Agreement (PFA). The PFA establishes, among other things, resource estimates, cost risks, contingency unallocated future expense/reserves, and related relevant requirements. The funding estimates become part of the 5-year budget cycle, and identify program-funding levels for the budget year two years out.
Pre-Phase A Exit Criteria
The decision to proceed into Phase A will be made on the basis of mission need, technical feasibility, desirability, and affordability of the ideas derived from these early concept definition trade studies and cost estimates. In-house estimate reviews are conducted at the discretion of the Project Office, and may include review of prime hardware contractor input. Each major concept update requires an acceptance decision. Each review of data prior to a NAR requires PM acceptance of cost as part of the whole concept. The PM must take into account overall budget constraints, cost, schedule, and technical risk, and cost realism, reviewed as one requirement of the overall design requirements. These PM reviews are the key to successful concept selection and success at the NAR/project approval reviews.
4.4.2 Phase A Design Concept Phase A further examines the feasibility and desirability of a suggested new major system or project before seeking significant funding. NASA personnel must work to ensure that data required will be available to manage to the estimate that supports the budget, keeping the calculated CRL in mind�—regardless of the unallocated future expense/reserves established
Pre-Phase A Issues/Challenges
The following list describes some issues and challenges faced by NASA cost estimator during this life cycle phase:
• Variable and early definition of requirements
• Project content not fully captured and reflected in cost estimate (e.g., ground systems, software, etc.)
• Optimism in schedule, technology and acquisition strategy planning
• Not fully accounting for the risks
• Over-optimism in hardware/software reuse
• Going external with cost too early or without a correctly specified CRL
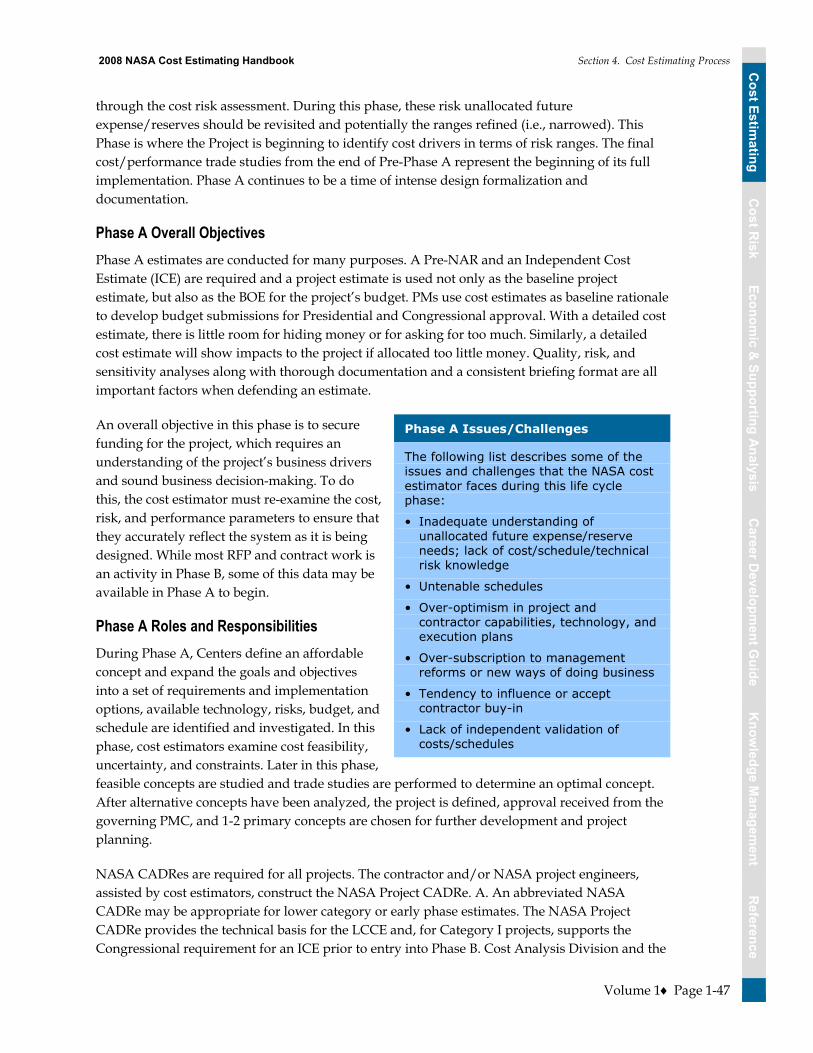
Cost Estim
atingC
ost Risk
Economic &
Supporting AnalysisC
areer Developm
ent Guide
Reference
Know
ledge Managem
entC
ost Estimating
Cost R
iskEconom
ic & Supporting Analysis
Career D
evelopment G
uideR
eferenceK
nowledge M
anagement
2008 NASA Cost Estimating Handbook Section 4. Cost Estimating Process
Volume 1 Page 1-47
through the cost risk assessment. During this phase, these risk unallocated future expense/reserves should be revisited and potentially the ranges refined (i.e., narrowed). This Phase is where the Project is beginning to identify cost drivers in terms of risk ranges. The final cost/performance trade studies from the end of Pre-Phase A represent the beginning of its full implementation. Phase A continues to be a time of intense design formalization and documentation.
Phase A Overall Objectives
Phase A estimates are conducted for many purposes. A Pre-NAR and an Independent Cost Estimate (ICE) are required and a project estimate is used not only as the baseline project estimate, but also as the BOE for the project�’s budget. PMs use cost estimates as baseline rationale to develop budget submissions for Presidential and Congressional approval. With a detailed cost estimate, there is little room for hiding money or for asking for too much. Similarly, a detailed cost estimate will show impacts to the project if allocated too little money. Quality, risk, and sensitivity analyses along with thorough documentation and a consistent briefing format are all important factors when defending an estimate.
An overall objective in this phase is to secure funding for the project, which requires an understanding of the project�’s business drivers and sound business decision-making. To do this, the cost estimator must re-examine the cost, risk, and performance parameters to ensure that they accurately reflect the system as it is being designed. While most RFP and contract work is an activity in Phase B, some of this data may be available in Phase A to begin.
Phase A Roles and Responsibilities
During Phase A, Centers define an affordable concept and expand the goals and objectives into a set of requirements and implementation options, available technology, risks, budget, and schedule are identified and investigated. In this phase, cost estimators examine cost feasibility, uncertainty, and constraints. Later in this phase, feasible concepts are studied and trade studies are performed to determine an optimal concept. After alternative concepts have been analyzed, the project is defined, approval received from the governing PMC, and 1-2 primary concepts are chosen for further development and project planning.
NASA CADRes are required for all projects. The contractor and/or NASA project engineers, assisted by cost estimators, construct the NASA Project CADRe. A. An abbreviated NASA CADRe may be appropriate for lower category or early phase estimates. The NASA Project CADRe provides the technical basis for the LCCE and, for Category I projects, supports the Congressional requirement for an ICE prior to entry into Phase B. Cost Analysis Division and the
Phase A Issues/Challenges
The following list describes some of the issues and challenges that the NASA cost estimator faces during this life cycle phase:
• Inadequate understanding of unallocated future expense/reserve needs; lack of cost/schedule/technical risk knowledge
• Untenable schedules
• Over-optimism in project and contractor capabilities, technology, and execution plans
• Over-subscription to management reforms or new ways of doing business
• Tendency to influence or accept contractor buy-in
• Lack of independent validation of costs/schedules

Cost Estim
atingC
ost Risk
Economic &
Supporting AnalysisC
areer Developm
ent Guide
Reference
Know
ledge Managem
entC
ost Estimating
Cost R
iskEconom
ic & Supporting Analysis
Career D
evelopment G
uideR
eferenceK
nowledge M
anagement
2008 NASA Cost Estimating Handbook Section 4. Cost Estimating Process
Volume 1 Page 1-48
IPAO will coordinate on this ICE, which will be communicated as preliminary and presented as a range of possible costs that are clearly subject to change. A full NASA Project CADRe is required for entry into Phase C to support the Phase C ICE and project LCCE, whose cost ranges should be greatly reduced from the Phase B ICE and project LCCE.
Mission Directorates identify ICE applicable projects early in a FY (e.g., >$ 150M). An ICE is integrated into IPAO reviews and during the process, Cost Analysis Division assigns a cost team drawn as appropriate from Cost Analysis Division, IPAO, and the Center. The team may also draw upon Center cost organizations, support contractors, Federally Funded Research and Development Centers (FFRDCs), and consultants. The review team reports to the governing PMC and then the Cost Analysis Division works with the Office of Legislative Affairs to draft the Congressional report. For Category I projects, the Project LCCE, based on the technical requirements defined in the NASA CADRe, is first developed by the project and coordinated between the project and the Center Independent Review Organization or Center cost group near the end of Phase A. In some cases a separate and additional estimate is developed by the Mission Directorate as a crosscheck that also becomes part of the coordination. At the same time, the IPAO develops an ICE, based on the same Project CADRe, with CAD cognizance. A coordination meeting, chaired by CAD/Office of the Chief Engineer, presents the Project/Center Independent Review Organization/Mission Directorate LCCE and the IPAO ICE to coordinate on the two positions. A period of 30 days is allotted for full coordination/reconciliation between both cost positions. In the unlikely event of irreconcilable differences between the estimates, a pre-Agency PMC (APMC) reconciliation review is held, chaired by Office of the Chief Engineer/Office of the Chief Financial Officer to formulate a recommended cost position to the APMC.
Phase A Exit Criteria
There are two primary categories of cost review during conceptual design. The first type is an internal PM review of the contractor and in-house (or advocate) estimates. The second type of review is the external pre-NAR or at some Centers, an Independent Assessment (IA). For the space launch programs, one NAR occurs early in formulation on advanced concept review. This is done after basic program documents such as the project plan and a draft Systems Concept Document are developed. This pre-NAR is part of the preliminary program approval review performed by the PMC.
The PM�’s estimate is reviewed externally against an ICE, developed outside the project by the IPAO using the same CADRe as a technical baseline. The focus, or criteria, for the review is the thoroughness and realism of the cost estimate including estimated unallocated future expense/reserve requirements. Exit criteria include:
�• All cost estimates done in full cost
�• A minimum of a preliminary CADRe exists in late Phase A for any category project
�• All WBS items are costed (no TBDs)
�• A preliminary Cost Analysis Division/IPAO ICE at end of Phase A for projects with expected LCC>$250M
�– OMB-provided first year of implementation funding; out years as ranges
�– CRLs calculated, documented, and clearly communicated

Cost Estim
atingC
ost Risk
Economic &
Supporting AnalysisC
areer Developm
ent Guide
Reference
Know
ledge Managem
entC
ost Estimating
Cost R
iskEconom
ic & Supporting Analysis
Career D
evelopment G
uideR
eferenceK
nowledge M
anagement
2008 NASA Cost Estimating Handbook Section 4. Cost Estimating Process
Volume 1 Page 1-49
�– Probabilistic cost/schedule risk range across multiple configurations/design solutions
�– At Confirmation Reviews and Authority to Proceed (ATP) decision point, the cost estimate must include an appropriately chosen level of unallocated future expense/reserves
The PM must correct estimating problems, questions, and issues identified by the NAR team and the PMC. If the cost estimate must be revised, the iterative cost/design process, discussed in the estimate refinement section, is used and the updated estimate provided to the Project Office and the PMC. In Phase A, the PM should review estimates for approval/disapproval against the following minimum criteria:
�• Affordability: Based on the affordability estimate and preliminary budget data from NASA, ensure that the cost estimate indicates that the candidate system is affordable. To determine this, the PM must review the estimate to ensure it is compatible with the budget. An estimate/budget reconciliation and an understanding of any disconnects is helpful at this stage. The PM should be aware that a primary difficulty in cost estimation in this early stage is decision-maker demand for unrealistic precision that is above the state-of-the-art given concept definition fidelity. Clearly defining the decision criteria and demonstrating that the precision available supports those criteria may mitigate this difficulty.
�• Realism: The probability that the cost estimate is within a realistic range. This requires that the level of precision be such that the cost estimates are representative of the expected value and consistent relative to other options. A high-level cost risk assessment is also important at this point, based on the technical risk assessment already documented in the technical baseline or the Phase A CADRe, schedule analysis, and cost risks. Ensure that the �‘typical�’ cost drivers are identified as well as the magnitude of the risk that they represent. This will allow the PM to identify estimates that are unrealistically optimistic in areas such as technology assessment, schedule, or general support requirements. At this point it is also recommended that a cross check estimate be conducted, either using a different estimating methodology, or at a minimum, using a different cost model to help reveal any issues or items that may have been overlooked or not fully understood in the estimate.
�• Sufficient Detail: Ensure the cost estimate is completed at the level and precision needed to influence the current stage of the design. Has the estimate identified the cost drivers in the system, and does the estimate adequately address these drivers? Early estimates should reflect the nature of decisions being made at an early stage, and need only distinguish between early level alternatives.
4.4.3 Phase B – Detailed Design Phase B is used to define the project in enough detail to establish an initial baseline capable of meeting mission needs. Initial concepts are down-selected to a manageable number in Phase B and then are provided to the internal NASA design teams, through the Project Office, to develop an optimal architecture. During this Phase, there should be a single selected design approach, with possibly several lower level optional characteristics.

Cost Estim
atingC
ost Risk
Economic &
Supporting AnalysisC
areer Developm
ent Guide
Reference
Know
ledge Managem
entC
ost Estimating
Cost R
iskEconom
ic & Supporting Analysis
Career D
evelopment G
uideR
eferenceK
nowledge M
anagement
2008 NASA Cost Estimating Handbook Section 4. Cost Estimating Process
Volume 1 Page 1-50
Phase B Overall Objectives During this phase, an objective for the cost estimator is to refine the point estimate�’s accuracy by scrutinizing the assumptions, the cost drivers, risks, and conducting periodic Probabilistic Risk Assessment (PRAs). During this phase, more specific data is available to develop a solid technical baseline or NASA CADRe, conduct a full LCCE, and reconcile it with a NAR. Estimates should be based on PDR or near PDR quality definition. The maturity of the data and the better-defined project should also help improve the CRL for each of the estimates. In Phase B, the numbers of concepts are down-selected to a manageable number from which the internal NASA design teams, through the Program Office, develop an optimal architecture. During this Phase, there should be a single selected approach possibly with several lower level optional characteristics.
Cost/schedule risk analysis should be driven by PRA-identified risks plus programmatic and management risks. A contractor estimate(s) is often developed separately and the various estimates compared for completeness, standardized GR&A, and reasonableness. At this Phase, a CADRe is required and there is also a NAR reviewed and adjusted cost estimate.
Phase B Roles and Responsibilities The role of the cost estimator during this phase is critical. It is important to understand the BOE, from the technical baseline to the cost risk assessment and to be able to document and present the results of these efforts to the decision makers. Findings during this phase for cost, performance trades, and risks influence the acquisition of a system and the execution of the project. It is the cost estimator�’s responsibility to test, understand, and validate the knowledge base used to derive estimates. It is also the responsibility of the cost estimator to ensure the best possible LCCE with recommended unallocated future expense/reserves based on updated cost risk assessments in Phase B. These estimates will support budget formulation as well as source selection in the transition from Phase B to Phase C/D. The cost estimator work with the project staff to ensure that the NASA CADRe used as the basis for the estimate is as complete and accurate as possible and that it is the same version that the project LCC team and the NAR team uses to build their estimates. In this phase, another critical responsibility of the cost estimator is to work with the PM and acquisition team to ensure that solid WBS reporting structures and data collection mechanisms for the execution of the project are in place.
Making this process more efficient, NASA has established a program of cooperative engineering centers called Project Design Centers (PDCs). At these centers, the engineers and cost analysts
Phase A Issues/Challenges
The following list describes some of the issues and challenges that the NASA cost estimator faces during this life cycle phase:
• Trying to overcome the lack of cost/ schedule/technical risk knowledge, to be able to defend unallocated future expense/reserves as demonstrated by the evolving nature of a Project
• Unrealistic schedule constraints due to corporate or contractor commitments
• Over-optimism in project and contractor capabilities, technology, and execution plans
• Over-subscription to management reforms or new ways of doing business
• Tendency to influence or accept contractor buy- in as RFP release approaches
• Independent validation of costs/ schedules may lead to new issues to be reconciled and resolved before proceeding according to schedule

Cost Estim
atingC
ost Risk
Economic &
Supporting AnalysisC
areer Developm
ent Guide
Reference
Know
ledge Managem
entC
ost Estimating
Cost R
iskEconom
ic & Supporting Analysis
Career D
evelopment G
uideR
eferenceK
nowledge M
anagement
2008 NASA Cost Estimating Handbook Section 4. Cost Estimating Process
Volume 1 Page 1-51
determine the relative benefit of specific technologies or mission concepts to improve space transportation or the mission using individual workstations and the variety of analysis tools. Center and visiting/teleconferenced experts analyze all aspects of a space project, from the technical aspects of flight operations to a business model to determine the return on investment (ROI). The PDCs enable cost personnel to rapidly estimate costs for a variety of concepts. As the program or project matures during the formulation sub-process, concept definition designs are refined and their number reduced, with more detail being added to the cost estimate. The earlier concept definition tools are generally phased out and engineering expertise and actual data are used more frequently.
The office responsible for building these concept cost estimates, particularly the Design Development (DD) estimate, is the cognizant cost office at the performing Center, using tools like NAFCOM, the PRICE estimating suite, and SEER. Operations and Support (O&S) estimates are generated using a different set of tools such as MESSOC, SOCM, RMAT, COMET/OCM, GEM-FLO for cycle time, and Architectural Assessment Tools-enhanced (AATe)[1]. Supporting NASA Centers provide cost data input in such areas as spaceport operations (Kennedy Space Center), mission operations and data analysis (Goddard Space Flight Center and Jet Propulsion Laboratory), and airframes (Langley Research Center). Together, these cost analysts work to build a concept architecture. In some cases, they study the impact of infusing new technology into a reference vehicle and its impact on cost. In many cases, they study concepts initially generated by contractors, then selected by the PM for cost, schedule, and technical merit.
Phase B Exit Criteria Throughout the process, cost personnel support a variety of reviews. PMs may specify internal reviews, in addition to the required NAR required to move a project into the implementation process. These reviews ensure the concept being developed meets NASA resourcing goals and objectives for the project, among other requirements. Towards the end of project design phases (Pre-Phase A, A, and B), as system requirements are sufficiently developed, the project prepares for a Project Approval Review by the Center PMC, usually in concert with the NAR. Part of this review includes an ICE, performed by a cost estimation office outside of the performing Center. The Phase A independent LCC estimate is reviewed, including funding resource requirements, unallocated future expense/reserve allocations, workforce and infrastructure requirements, and partnering efforts. Contractor estimates and the ICE are reviewed, differences analyzed, and potentially reconciled, by the cost office. Subsequently, one, or a combination of the cost estimates, is presented by the PM during the project approval process to the assigned PMC. If costs are accepted, the estimates become part of the overall approval process to move the system to implementation. If estimates are not satisfactory, they are returned to the cost office for additional estimation and analysis.
The PM should review estimates for approval/disapproval and reconciliation based upon the following checklist:
�• Ensure the cost estimate is comparable to other estimates, notably the ICE, and between the various contractor estimates. The reason for major differences between estimates should be clearly understood and explained as part of the reconciliation and review

Cost Estim
atingC
ost Risk
Economic &
Supporting AnalysisC
areer Developm
ent Guide
Reference
Know
ledge Managem
entC
ost Estimating
Cost R
iskEconom
ic & Supporting Analysis
Career D
evelopment G
uideR
eferenceK
nowledge M
anagement
2008 NASA Cost Estimating Handbook Section 4. Cost Estimating Process
Volume 1 Page 1-52
�• Ensure the cost estimate has a detailed cost risk assessment that is documented in the estimate documentation and supporting risk data is detailed in the CADRe. At this point, the areas of cost risk addressed earlier should have been mitigated or reduced to a manageable level, and this reduction documented and reflected in the estimate. This does not mean that the cost estimator has ignored cost realism and removed or minimized the risks and their impact. It means that the cost estimator has worked with the technical team to identify, understand, and document trade studies, alternatives, and risk mitigation strategies and this risk mitigation is realistically reflected in the cost estimate
�• Verify the full cost aspects of the estimate �• Ensure the estimate meets NAR requirements, to include funding resource requirements,
unallocated future expense/reserve allocations, workforce, and infrastructure requirements, risk assessment, and external contributions such as partnering
A successful late Phase B review moves the project, including its associated cost estimate, into the Detailed Design and Development Phase C/D, and out of the Preliminary Design Phase B. Exit criteria guidelines include:
�• NASA CADRe or abbreviated CADRe in late Phase B depending on project category �• IPAO/Cost Analysis Division ICE based on increased detail (eventually major assembly,
component level)
�• Probabilistic cost/schedule risk analysis (tied to PRA identified risks) plus programmatic and management risks
�• Updated cost/performance trade/CAIV study (ies) �• Field Center, Mission Directorate and Cost Analysis Division reconcile to one probabilistic
estimate for PMC
4.4.4 Phase C/D Design, Development Test and Evaluation (DDT&E) Phase C establishes a complete design (�“build-to�” baseline) that is ready to fabricate (or code), integrate, and verify. During this phase, technical parameters, schedules, and budgets are closely tracked to ensure that undesirable trends (such as an unexpected growth in spacecraft mass or increase in its cost) are recognized early enough to take corrective action. As the project proceeds through design, development, and test and evaluation, the project technical description/NASA CADRe is updated as necessary to reflect major engineering and requirements changes. Updates to the reference point estimate, risk assessment, and cost-risk impacts, and CRL are made and reflected in new cost-risk distributions.
Cost trend data captured in the earned value management system (EVMS) is an input to these LCCE updates since there is much to be gained from exploiting the cost, risk, and cost-risk knowledge captured via EVM and possibly IEM during development for improving cost and cost-risk databases, cost models and, ultimately, estimates on future projects.
Phase D builds and verifies the system designed in the previous phase, deploys it, and prepares for operations. Subsystems (including the operations system) are built and integrated to create the system. As the project completes design, development, test and evaluation and proceeds to production, the project technical description/NASA CADRe is updated as necessary to reflect

Cost Estim
atingC
ost Risk
Economic &
Supporting AnalysisC
areer Developm
ent Guide
Reference
Know
ledge Managem
entC
ost Estimating
Cost R
iskEconom
ic & Supporting Analysis
Career D
evelopment G
uideR
eferenceK
nowledge M
anagement
2008 NASA Cost Estimating Handbook Section 4. Cost Estimating Process
Volume 1 Page 1-53
final engineering decisions along with associated updates to the reference point estimate (in conjunction with the EVM specialists tracking the cost trends in the Cost Performance Reports (CPRs), risk assessments, and cost-risk impacts. Since the end of Phase D represents the completion of project development, this is the most critical phase to capture the cost, risk, and cost-risk knowledge captured via EVM, possibly IEM, of actual cost data along with final development phase technical parameters in the CADRe. This documentation should help improve cost and cost-risk databases, cost models and, ultimately, future project estimates.
Design changes continue to be an iterative process in this Phase, with cost estimates analyzed for affordability and effectiveness at each Engineering Change Proposal (ECP) and design change. Estimates are based on CDR/near CDR quality definition and new estimates include estimates of major engineering changes. These should be integrated with EVMS by this Phase and processes for capturing cost analysis knowledge should also be in place to improve cost model accuracy. Some of these processes are contractor cost data collection requirements integrated into EVM, civil service cost data collection requirements integrated into IEM, and prime contractor special cost analysis DRs still required for other cost data requirements such as heritage of parts/software and other information.
Phase C/D Overall Objectives The connection between the Definition and the Design phases of an investment�’s life cycle is critical to maintain in order to realize estimated benefits and stay within estimated costs. Cost/performance trade studies are ongoing in this phase and updated periodically. In addition to creating the foundation for certain plans, the benefits and their definitions should be considered THE performance metrics and targets for the on-going evaluation of the investment. It is only logical that the criteria against which the investment was assessed would be the same as the criteria against which the performance of that investment is tracked and assessed through test and evaluation. The cost estimator, in developing the costs for these trades, plays a key role in this crucial assessment.
Phase C/D Roles and Responsibilities The cost estimator�’s role in Phase C/D is to review the engineering build up estimate for reasonableness, completeness, and consistency with the project�’s GR&A. It is also the cost estimator�’s responsibility to test, understand, and validate the knowledge base used to derive engineering build up estimates. It is important for the estimator to understand his/her role in
Phase C Issues/Challenges
The following list describes some of the issues and challenges that the NASA cost estimator faces during this life cycle phase:
• Basic requirement changes
• Make-it-work changes
• Inadequate risk mitigation
• Integration and test difficulties
• Reluctance to reduce headcounts after peak
• Inadequate insight/oversight
• Lack of understanding or poor use of EVM and schedule analysis as an effective early warning capability
• De-scoping science and/or operability features to reduce nonrecurring cost:
– Contract and design changes between the Development and Operations phases
– Reassessing cost estimates and cost phasing due to funding instability and stretch outs
– Development difficulties
• Manufacturing breaks

Cost Estim
atingC
ost Risk
Economic &
Supporting AnalysisC
areer Developm
ent Guide
Reference
Know
ledge Managem
entC
ost Estimating
Cost R
iskEconom
ic & Supporting Analysis
Career D
evelopment G
uideR
eferenceK
nowledge M
anagement
2008 NASA Cost Estimating Handbook Section 4. Cost Estimating Process
Volume 1 Page 1-54
supporting the cost management phase of a project and how his/her updated estimates, actual cost data, and documentation can assist the PM. It is also important for the cost estimator to recognize his/her responsibility in capturing data from this phase of the Project to benefit future efforts. If actual cost data is captured and documented in a methodical manner, data collection after the program ends and during its execution is much easier and ensures that the data is more reliable.
While it is not as common for the estimator to be involved in Phase D estimates, it is becoming increasingly important. Costs and risks from the early phases of a project should have been captured and documented as actuals in the estimate to date. It is important for the cost estimator to ensure this data is reflected in the program LCCE. It is important to capture the data for the immediate project estimates and as data for estimating the costs of future projects.
Phase C/D Exit Criteria
Reviews at this Phase with Office of the Chief Engineer/Cost Analysis Division involvement and the governing PMCs are designed to minimize duplication with other reports and organizations involved. These reviews ensure the concept being tested and deployed meets NASA re-sourcing goals and objectives for the project, among other requirements. Phase C/D estimates involve project surveillance and estimates of any new or modified concepts. If costs are accepted, the estimates become part of the overall approval process to move the system to operations. If estimates are not satisfactory, they are returned to the cost office for additional estimation and analysis. Exit criteria include:
�• Estimates of major engineering changes (in cooperation with EVM community) �• Estimates if project re-baselines �• Improved processes for capturing cost estimating knowledge for future cost models �• Using NASA CADRe and update via EVM and possibly IEM
4.4.5 Special Case: Phase D (Production) Cost estimates in Phase D still focus on major engineering changes (in cooperation with EVM community) and estimates if project re-baselines. Reviews and cross check estimates are conducted at the end of Phase D to evaluate production costs and readiness to move to operations and support in Phase E. During special case Phase D, it is important for the estimator to focus on using improved processes for capturing cost estimating knowledge for future cost models as production runs at NASA are not common on all Projects. Using the NASA CADRe data and augmenting it with EVM and possibly IEM data is important for collecting actuals for future Projects.
In the unusual case at NASA that more than one unit of a system is produced (e.g., reusable launch vehicles, multiple TDRSs, etc.,) the Project enters Special Case Phase D. For the most part, the tasks followed in Phase C/D should also be followed in Special Case Phase D, Production. For example, both the WBS and CADRe should be updated to prepare for updates to the reference point cost estimate, risk assessment, and �“S�”-curve. Also, the CRL should be updated in the cost estimate documentation.
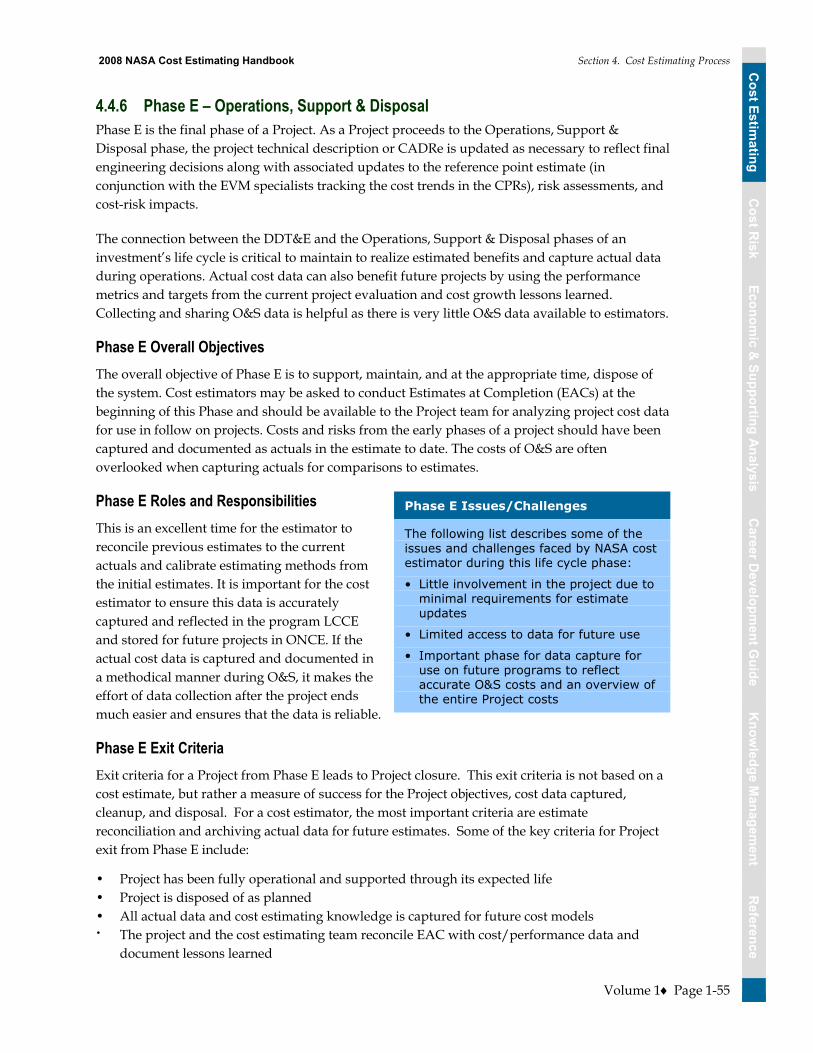
Cost Estim
atingC
ost Risk
Economic &
Supporting AnalysisC
areer Developm
ent Guide
Reference
Know
ledge Managem
entC
ost Estimating
Cost R
iskEconom
ic & Supporting Analysis
Career D
evelopment G
uideR
eferenceK
nowledge M
anagement
2008 NASA Cost Estimating Handbook Section 4. Cost Estimating Process
Volume 1 Page 1-55
4.4.6 Phase E – Operations, Support & Disposal Phase E is the final phase of a Project. As a Project proceeds to the Operations, Support & Disposal phase, the project technical description or CADRe is updated as necessary to reflect final engineering decisions along with associated updates to the reference point estimate (in conjunction with the EVM specialists tracking the cost trends in the CPRs), risk assessments, and cost-risk impacts.
The connection between the DDT&E and the Operations, Support & Disposal phases of an investment�’s life cycle is critical to maintain to realize estimated benefits and capture actual data during operations. Actual cost data can also benefit future projects by using the performance metrics and targets from the current project evaluation and cost growth lessons learned. Collecting and sharing O&S data is helpful as there is very little O&S data available to estimators.
Phase E Overall Objectives
The overall objective of Phase E is to support, maintain, and at the appropriate time, dispose of the system. Cost estimators may be asked to conduct Estimates at Completion (EACs) at the beginning of this Phase and should be available to the Project team for analyzing project cost data for use in follow on projects. Costs and risks from the early phases of a project should have been captured and documented as actuals in the estimate to date. The costs of O&S are often overlooked when capturing actuals for comparisons to estimates.
Phase E Roles and Responsibilities
This is an excellent time for the estimator to reconcile previous estimates to the current actuals and calibrate estimating methods from the initial estimates. It is important for the cost estimator to ensure this data is accurately captured and reflected in the program LCCE and stored for future projects in ONCE. If the actual cost data is captured and documented in a methodical manner during O&S, it makes the effort of data collection after the project ends much easier and ensures that the data is reliable.
Phase E Exit Criteria
Exit criteria for a Project from Phase E leads to Project closure. This exit criteria is not based on a cost estimate, but rather a measure of success for the Project objectives, cost data captured, cleanup, and disposal. For a cost estimator, the most important criteria are estimate reconciliation and archiving actual data for future estimates. Some of the key criteria for Project exit from Phase E include:
�• Project has been fully operational and supported through its expected life �• Project is disposed of as planned �• All actual data and cost estimating knowledge is captured for future cost models �• The project and the cost estimating team reconcile EAC with cost/performance data and
document lessons learned
Phase E Issues/Challenges
The following list describes some of the issues and challenges faced by NASA cost estimator during this life cycle phase:
• Little involvement in the project due to minimal requirements for estimate updates
• Limited access to data for future use
• Important phase for data capture for use on future programs to reflect accurate O&S costs and an overview of the entire Project costs

Cost Estim
atingC
ost Risk
Economic &
Supporting AnalysisC
areer Developm
ent Guide
Reference
Know
ledge Managem
entC
ost Estimating
Cost R
iskEconom
ic & Supporting Analysis
Career D
evelopment G
uideR
eferenceK
nowledge M
anagement
2008 NASA Cost Estimating Handbook Section 4. Cost Estimating Process
Volume 1 Page 1-56
Phase E Special Considerations
Estimating costs for the operational phase of complex aerospace programs, especially using full cost, presents unique challenges, including:
�• Inadequate data/information technology (IT) systems during operational phases for relating labor, materials, and activity functions to flight and ground system designs. Project and program management needs for project controls such as budget insight and controls may not match the type of data or systems required to provide linkages of design decisions to operational costs. The later type data collection and IT systems are an easy target in project cost cutting efforts. This hobbles the prediction and understanding that can be applied from real world experience to future systems
�• Uniqueness of end items, limiting data available to draw CERs that would otherwise be reinforced or confirmed by more data points, as with similar systems for similar environments. This again hobbles the prediction and understanding that can be applied from real world experience to future systems
�• Low flight rates, such that operating data that is available (e.g., failures, costs, delays, processes) associated with the operation, maintenance, logistics, sustaining engineering, work control, management and infrastructure upkeep and operation, does not approach a quantity of quality data that would easily identify drivers or bottlenecks. When every data point has unique circumstances and derives from a process with high variation, the conclusions drawn from such data, even after filtering and cleanup, can significantly introduce uncertainty. This again hobbles the prediction and understanding that can be applied from real world experience to future systems.
Promising approaches to overcoming obstacles in gathering operations data can be accomplished by various technical and non-technical strategies such as:
�• Development of electronic data interchange formats, databases, or ontologies that ease the use and reuse of product description data by all stakeholders, from program and project management, to design and manufacturing, to cost estimators, including those looking to operations years ahead. As of 2006, The NASA Exploration initiative has such an approach in practice referred to as NExIOM or NASA Exploration Information Ontology Model
�• Establishment, management support, and continuous capability development for such corporate knowledge as organizations sufficiently long lived to gather data across programs, studies and recurring organizational restructurings. Such capability should be refreshed as needed with operational experience, new-hires and institutional succession planning, and dedicated cost estimators
�• Over-communication on estimation methods, rationale, logic, calculations, limitations of data, implications of such to the estimate, best and worse case analysis, and operations drivers, to overcome both the data adequacy issues as well as the perceived lesser importance of a cost not yet to be incurred for many years. Operations are a cost to be inherited by a decision maker/manager that is often NOT the one deciding the emphasis on understanding such estimates in the near term. Communication is key. Estimates must withstand sanity checks

Cost Estim
atingC
ost Risk
Economic &
Supporting AnalysisC
areer Developm
ent Guide
Reference
Know
ledge Managem
entC
ost Estimating
Cost R
iskEconom
ic & Supporting Analysis
Career D
evelopment G
uideR
eferenceK
nowledge M
anagement
2008 NASA Cost Estimating Handbook Section 4. Cost Estimating Process
Volume 1 Page 1-57
Lastly, not all operations cost estimation exists in a vacuum from other key systems engineering factors. Although not as easily measurable, it is often the responsibility of the operations cost estimator to highlight related factors that should feed into decision making, or cost estimators recommendations. For example, as witnessed in the Columbia Accident Investigation Board (CAIB) report, a sub-system (such as thermal protection systems) may receive organizational attention only as a maintenance issue, with an accepted, well understood, known turn-around cost. Regardless, costs perspectives must not neglect to seek out and integrate with systems engineering perspectives or that of other areas such as risk covered elsewhere in this handbook.

Volume 2 –Cost Risk
2008 NASA Cost Estimating Handbook

Cost Estim
atingC
ost Risk
Economic &
Supporting AnalysisC
areer Developm
ent Guide
Reference
Know
ledge Managem
entC
ost Estimating
Cost R
iskEconom
ic & Supporting Analysis
Career D
evelopment G
uideR
eferenceK
nowledge M
anagement
2008 NASA Cost Estimating Handbook Contents
Volume 2 Page 2-i
Volume 2 Cost Risk
Table of Contents
Section 1. Cost Risk............................................................................................................................ 2-1 1.1 Cost Risk at NASA................................................................................................................ 2-2 1.2 NASA Cost Risk Policy ........................................................................................................ 2-4
1.2.1 NPR 7120.5 Space Flight Program and Project Management Requirements .......................................................................................................... 2-4
1.2.2 NPR 8000.4 Risk Management Procedural Requirements ................................ 2-5 1.2.3 Cost Risk Management Requirements in NPR 8000.4....................................... 2-5 1.2.4 Cost-Risk Management.......................................................................................... 2-5
1.3 Cost Risk Assessment........................................................................................................... 2-10 1.4 Cost Risk as Part of the Cost Estimating Process ............................................................. 2-12
Section 2. Cost Risk Approaches ..................................................................................................... 2-15 2.1 Analytic Approach ............................................................................................................... 2-15
2.1.1 Scenario Based Method (SBM).............................................................................. 2-15 2.1.2 Formal Risk Assessment (FRISK)/Method of Moments................................... 2-21
2.2 Simulation Approach ........................................................................................................... 2-21 2.2.1 Step 1 �– Generate/Obtain Point Estimate ........................................................... 2-21 2.2.2 Step 2 �– Quantify Cost Estimating Uncertainty.................................................. 2-21 2.2.3 Step 3 �– Quantify Technical Risk.......................................................................... 2-22 2.2.4 Step 4 �– Quantify Correlation ............................................................................... 2-24 2.2.5 Step 5 �– Run Simulation......................................................................................... 2-26 2.2.6 Step 6 �– Assess Risk Dollars/Unallocated Future Expense .............................. 2-26 2.2.7 Step 7 �– Allocate Risk Dollars to the WBS........................................................... 2-27
2.3 Hybrid Scenario Based Approach ...................................................................................... 2-27 2.3.1 Step 1 �– Develop Reference Estimate ................................................................... 2-27 2.3.2 Step 2 �– Develop Risk Matrix................................................................................ 2-28 2.3.3 Step 3 �– Run Simulation......................................................................................... 2-28 2.3.4 Summary.................................................................................................................. 2-29
2.4 Integrated Risk Management .............................................................................................. 2-30 2.4.1 Integrated Risk Management Process.................................................................. 2-30 2.4.2 Integrated Risk Management: Information, Not Just Data............................... 2-31 2.4.3 Tailoring Integrated Risk Management for Specific Needs.............................. 2-32
2.5 Relative Risk Weighting (RRW).......................................................................................... 2-32 2.6 Discrete Risk Analysis.......................................................................................................... 2-37 2.7 Sensitivity Analysis .............................................................................................................. 2-39 2.8 Program Portfolio Effect ...................................................................................................... 2-39 2.9 Cost Risk Output................................................................................................................... 2-40
Section 3. Model Summaries/Overview ......................................................................................... 2-42 3.1 PRICE Systems Solution ...................................................................................................... 2-42
3.1.1 Cost Risk Approach................................................................................................ 2-42 3.1.2 Correlation............................................................................................................... 2-43
3.2 SEER 2-43 3.2.1 Cost Risk Approach................................................................................................ 2-44

Cost Estim
atingC
ost Risk
Economic &
Supporting AnalysisC
areer Developm
ent Guide
Reference
Know
ledge Managem
entC
ost Estimating
Cost R
iskEconom
ic & Supporting Analysis
Career D
evelopment G
uideR
eferenceK
nowledge M
anagement
2008 NASA Cost Estimating Handbook Contents
Volume 2 Page 2-ii
3.2.2 Integration with Other Approach/Tools ............................................................ 2-44 3.2.3 Correlation............................................................................................................... 2-44 3.2.4 Reports & Charts Summarizing Cost Risk Results ............................................ 2-44
3.3 NAFCOM............................................................................................................................... 2-44 3.3.1 Cost Risk Approach................................................................................................ 2-45 3.3.2 Correlation............................................................................................................... 2-46 3.3.3 Reports and Charts Summarizing Cost Risk Results......................................... 2-47
3.4 Automated Cost Estimating Integrated Tools (ACEIT)................................................... 2-47 3.4.1 Cost Estimating Risk .............................................................................................. 2-47 3.4.2 Technical Input Risk............................................................................................... 2-48 3.4.3 Correlation............................................................................................................... 2-48 3.4.4 Simulation Process ................................................................................................. 2-48 3.4.5 Reports and Charts Summarizing Cost Risk Results......................................... 2-48
3.5 Crystal Ball............................................................................................................................. 2-49 3.5.1 Technical Input Risk............................................................................................... 2-49 3.5.2 Cost Estimating Risk .............................................................................................. 2-50 3.5.3 Correlation............................................................................................................... 2-50 3.5.4 Cost Risk Approach................................................................................................ 2-50 3.5.5 Reports and Charts Summarizing Cost Risk Results......................................... 2-51
3.6 @Risk 2-51 3.6.1 Cost Risk Approach................................................................................................ 2-51 3.6.2 Reports and Charts Summarizing Cost Risk Results......................................... 2-52 3.6.3 Integration with Other Approach/Tools ............................................................ 2-52
Section 4. Risk Handbook Summaries ........................................................................................... 2-53 4.1 Space Systems Cost Analysis Group (SSCAG) �– Space Systems Cost Risk
Handbook �– Applying the Best Practices in Cost Risk Analysis to Space System Cost Estimates, November 16, 2005 ................................................................................... 2-54 4.1.1 Introduction............................................................................................................. 2-54 4.1.2 Perspectives and Applications.............................................................................. 2-57 4.1.3 Constructing a Risk Estimate ................................................................................ 2-58 4.1.4 Cost Risk Examples Using Popular Cost Models............................................... 2-59 4.1.5 Bibliography............................................................................................................ 2-59
4.2 Air Force Cost Risk and Uncertainty Handbook (AF CRUH) April, 2007.................... 2-59 4.2.1 Introduction............................................................................................................. 2-60 4.2.2 Input-Based Simulation Approach....................................................................... 2-61 4.2.3 Complete the Simulation....................................................................................... 2-61 4.2.4 How to �“Buy�” Additional Certainty.................................................................... 2-64 4.2.5 How to Allocate and Time Phase Risk Dollars................................................... 2-64 4.2.6 How to Present the �“Risk Story�” .......................................................................... 2-66 4.2.7 Alternatives to the Inputs-Based Simulation Approach ................................... 2-66 4.2.8 A Discussion on How to Select a Funding Level ............................................... 2-67 4.2.9 References................................................................................................................ 2-69
Figures and Tables
Figure 2-1. When Integrated Cost-Risk is Required........................................................................... 2-7 Figure 2-2. Statistics of the Triangular and Normal Distributions................................................... 2-11 Figure 2-3. Central Limit Theorem....................................................................................................... 2-11

Cost Estim
atingC
ost Risk
Economic &
Supporting AnalysisC
areer Developm
ent Guide
Reference
Know
ledge Managem
entC
ost Estimating
Cost R
iskEconom
ic & Supporting Analysis
Career D
evelopment G
uideR
eferenceK
nowledge M
anagement
2008 NASA Cost Estimating Handbook Contents
Volume 2 Page 2-iii
Figure 2-4. Cost Modeling and Technical Input Risk ........................................................................ 2-13 Figure 2-5. Statistical Scenario Based Method (Garvey).................................................................... 2-16 Figure 2-6. Standard Deviation on a Normal Distribution Curve ................................................... 2-17 Figure 2-7. Cumulative Normal Distribution Curve ......................................................................... 2-19 Figure 2-8. Cumulative Lognormal Distribution Curve.................................................................... 2-19 Figure 2-9. Normal and Lognormal Distributions ............................................................................. 2-22 Figure 2-10. Triangular Distribution Example.................................................................................... 2-23 Figure 2-11. Culmination of CER and Technical Risk ....................................................................... 2-24 Figure 2-12. Statistical Summation Process Results (SSCAG Space Systems Cost Risk
Handbook page 14).......................................................................................................... 2-26 Figure 2-13. 5X5 Risk Matrix ................................................................................................................. 2-28 Figure 2-14. 5x5 Matrix Cost Risk Conversion Process Summary ................................................... 2-29 Figure 2-15. Program Activities/Risks Map ....................................................................................... 2-31 Figure 2-16. Risk Adjusted Cost (RAC) and Risk Adjusted Schedule (RAS) ................................. 2-32 Figure 2-17. Risk Assessment Template Example.............................................................................. 2-33 Figure 2-18. Design & Engineering Risk Template Example............................................................ 2-34 Figure 2-19. Complexity Risk Template Example .............................................................................. 2-35 Figure 2-20. Interaction/Interdependency Template Example........................................................ 2-35 Figure 2-21. Reference Parameter Values ............................................................................................ 2-37 Figure 2-22. Discrete Risk Analysis Using the RRW Process............................................................ 2-38 Figure 2-23. Portfolio Effect Assuming Normally Distributed Total Project Costs ....................... 2-39 Figure 2-24. S-Curve and Cumulative S-Curve .................................................................................. 2-40 Figure 2-25. NAFCOM CER Major Inputs .......................................................................................... 2-45 Figure 2-26. Effect of Correlation on Estimates .................................................................................. 2-46 Figure 2-27. NAFCOM Probability Distribution Function Report................................................... 2-47 Figure 2-28. Available ACEIT tools...................................................................................................... 2-47 Figure 2-29. ACEIT Cost Estimating Risk Input screen..................................................................... 2-47 Figure 2-30. ACEIT Technical Risk Input Screen ............................................................................... 2-48 Figure 2-31. ACEIT Correlation Input Screen..................................................................................... 2-48 Figure 2-32. ACEIT Cost Risk Reports................................................................................................. 2-49 Figure 2-33. Future ACEIT Cost Risk output reports ........................................................................ 2-49 Figure 2-34. Crystal Ball Cost Estimating Risk Input Screen............................................................ 2-50 Figure 2-35. Crystal Ball Correlation Input Screen............................................................................. 2-50 Figure 2-36. Crystal Ball Cost Estimating Risk input screen............................................................. 2-51 Figure 2-37. Crystal Ball Correlation input screen ............................................................................. 2-51 Figure 2-38. Rollup to a Total Cost Estimate (Page 14 SSCRH)........................................................ 2-54 Figure 2-39. Normal, Triangular, Uniform, and Lognormal Probability Distributions ................ 2-55 Figure 2-40. CER Input Distribution, CER Output Distribution, Correlation Matrix,
Simulation Results ........................................................................................................... 2-56 Figure 2-41. Cost Risk Analysis Interaction with the Risk Management Process.......................... 2-56 Figure 2-42. Budget Risk........................................................................................................................ 2-57 Figure 2-43. Unallocated Future Expense............................................................................................ 2-57 Figure 2-44. Approaches to Calculate Total Estimate Uncertainty .................................................. 2-60

Cost Estim
atingC
ost Risk
Economic &
Supporting AnalysisC
areer Developm
ent Guide
Reference
Know
ledge Managem
entC
ost Estimating
Cost R
iskEconom
ic & Supporting Analysis
Career D
evelopment G
uideR
eferenceK
nowledge M
anagement
2008 NASA Cost Estimating Handbook Contents
Volume 2 Page 2-iv
Figure 2-45. Combining Input Uncertainties ...................................................................................... 2-62 Figure 2-46. Generating the Statistics of the WBS Parent levels....................................................... 2-62 Figure 2-47. Impact of Adding Applied Correlation On Top of Functional Correlation.............. 2-63 Figure 2-48. Allocating Risk Dollars from the Second Level WBS in the Missile Example.......... 2-65 Figure 2-49. Time Phased Risk Allocated TY Dollars ........................................................................ 2-66 Figure 2-50. A Nonstatistical Scenario-Based Approach................................................................... 2-67 Table 2-1. Subjective Correlation Coefficients (SSCAG Space Systems Cost Risk
Handbook page 15).......................................................................................................... 2-25 Table 2-2. Example Application of Outputs-Based Simulation Set-up ........................................... 2-67 Table 2-3. Program Probabilities........................................................................................................... 2-68 Table 2-4. Portfolio Probabilities........................................................................................................... 2-68

Cost Estim
atingC
ost Risk
Economic &
Supporting AnalysisC
areer Developm
ent Guide
Reference
Know
ledge Managem
entC
ost Estimating
Cost R
iskEconom
ic & Supporting Analysis
Career D
evelopment G
uideR
eferenceK
nowledge M
anagement
2008 NASA Cost Estimating Handbook Section 1. Cost Risk
Volume 2 Page 2-1
Section 1. Cost Risk
NASA is embracing cost risk assessment to improve its reputation with external stakeholders to deliver projects on time and within budget. NASA management believes that all projects should submit budgets that are based upon a quantification of all the risks that could cause the project to take longer or cost more than initially anticipated. Program Managers must request budget amounts that reflect a 70%
probability that the project will be completed at or below this amount. NASA management recognizes it will take time to fully implement this policy and has created an interim approach for the FY 2009 guidance. Confidence level policy will be reflected in the Interim NPD 7120.4 and in the Strategic Planning Guidance located on the NASA internal Knowledge Information Center website: https://pollux.hq.nasa.gov/kic/2.
NASA�’s policy update is in response to the United States General Accounting Office�’s (GAO) report to the Subcommittee on Space and Aeronautics, Committee on Science, House of Representatives on Lack of Disciplined Cost-Estimating Process Undermines NASA�’s Ability to Effectively Manage Its Programs. This report, in addition to a 2002 United States Air Force Space and Missile Systems Center report, Space Systems Development Growth Analysis3, identified major causes of cost growth including: incomplete cost risk assessment, acquisition workforce problems, �‘corporate-directed�’ actions, competitive environment, and flawed initial program planning.
The GAO completed a detailed examination of NASA�’s cost estimating processes and methodologies for various programs. This examination included the comparison of NASA�’s cost estimating processes to the cost estimating criteria developed by Carnegie Mellon University�’s Software Engineering Institute (SEI). THE GAO reported that none of the reviewed programs met all of the SEI criteria. This report made numerous recommendations to establish a standard framework for developing life cycle cost estimates, including:
�• Base cost estimates on a full life cycle cost for the program �• Prepare a cost analysis requirements description �• Prepare an independent government estimate at each milestone of the program �• Conduct a cost risk assessment that identifies the level of uncertainty inherent in the estimate
A quantitative analysis of the existing space programs in The Space Systems Development Growth Analysis report found cost estimation and underestimating risk accounts for more than one third of the cause for space development cost growth. Findings on cost growth included: programs budgeted too early; software and integration underestimated; budget instability, inadequate pre-acquisition planning and risk reduction; and optimistic and extrapolated estimates. Specific reasons cited (including both government and vendor estimators) included: 2 KIC access is restricted to authorized users. To gain access, potential users need to submit a completed NHQ Form 224 for approval
to the Office of Human Resources at NASA Headquarters. 3 Booz Allen Hamilton, �“Space Systems Development Growth Analysis,�” October 2002
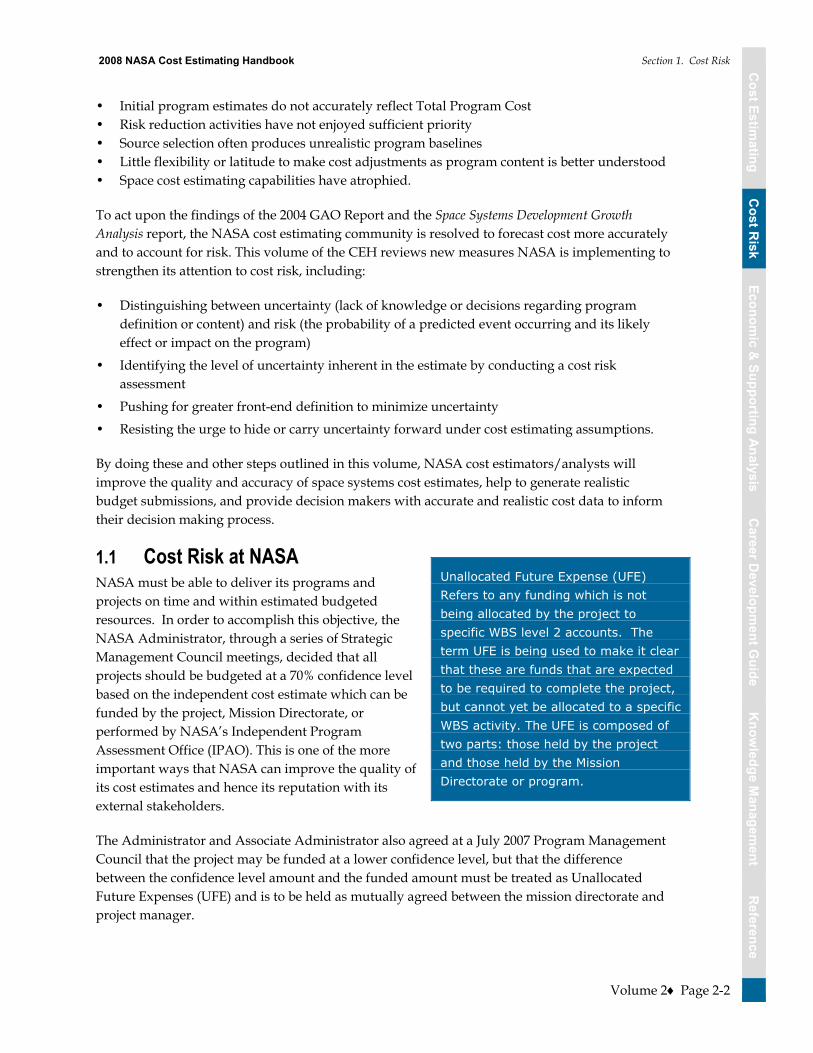
Cost Estim
atingC
ost Risk
Economic &
Supporting AnalysisC
areer Developm
ent Guide
Reference
Know
ledge Managem
entC
ost Estimating
Cost R
iskEconom
ic & Supporting Analysis
Career D
evelopment G
uideR
eferenceK
nowledge M
anagement
2008 NASA Cost Estimating Handbook Section 1. Cost Risk
Volume 2 Page 2-2
�• Initial program estimates do not accurately reflect Total Program Cost �• Risk reduction activities have not enjoyed sufficient priority �• Source selection often produces unrealistic program baselines �• Little flexibility or latitude to make cost adjustments as program content is better understood �• Space cost estimating capabilities have atrophied.
To act upon the findings of the 2004 GAO Report and the Space Systems Development Growth Analysis report, the NASA cost estimating community is resolved to forecast cost more accurately and to account for risk. This volume of the CEH reviews new measures NASA is implementing to strengthen its attention to cost risk, including:
�• Distinguishing between uncertainty (lack of knowledge or decisions regarding program definition or content) and risk (the probability of a predicted event occurring and its likely effect or impact on the program)
�• Identifying the level of uncertainty inherent in the estimate by conducting a cost risk assessment
�• Pushing for greater front-end definition to minimize uncertainty
�• Resisting the urge to hide or carry uncertainty forward under cost estimating assumptions.
By doing these and other steps outlined in this volume, NASA cost estimators/analysts will improve the quality and accuracy of space systems cost estimates, help to generate realistic budget submissions, and provide decision makers with accurate and realistic cost data to inform their decision making process.
1.1 Cost Risk at NASA NASA must be able to deliver its programs and projects on time and within estimated budgeted resources. In order to accomplish this objective, the NASA Administrator, through a series of Strategic Management Council meetings, decided that all projects should be budgeted at a 70% confidence level based on the independent cost estimate which can be funded by the project, Mission Directorate, or performed by NASA�’s Independent Program Assessment Office (IPAO). This is one of the more important ways that NASA can improve the quality of its cost estimates and hence its reputation with its external stakeholders.
The Administrator and Associate Administrator also agreed at a July 2007 Program Management Council that the project may be funded at a lower confidence level, but that the difference between the confidence level amount and the funded amount must be treated as Unallocated Future Expenses (UFE) and is to be held as mutually agreed between the mission directorate and project manager.
Unallocated Future Expense (UFE) Refers to any funding which is not being allocated by the project to specific WBS level 2 accounts. The term UFE is being used to make it clear that these are funds that are expected to be required to complete the project, but cannot yet be allocated to a specific WBS activity. The UFE is composed of two parts: those held by the project and those held by the Mission Directorate or program.

Cost Estim
atingC
ost Risk
Economic &
Supporting AnalysisC
areer Developm
ent Guide
Reference
Know
ledge Managem
entC
ost Estimating
Cost R
iskEconom
ic & Supporting Analysis
Career D
evelopment G
uideR
eferenceK
nowledge M
anagement
2008 NASA Cost Estimating Handbook Section 1. Cost Risk
Volume 2 Page 2-3
Mission Directorates (or programs) may fund the project at a lower confidence level, but shall hold the difference as UFE. Such amounts shall be distributed in any amount at any time as mutually agreed between the mission directorate and the project office. UFE funds held by the Mission Directorate (or program) shall only be used to pay for unexpected cost increases for projects within the mission directorate�’s (or program�’s) portfolio. (The Constellation Program, part of the Exploration Systems Mission Directorate, has a waiver for this requirement. It must be able to prepare and submit budget submissions at a 65% confidence level.)
All flight and ground system projects shall submit budget requests that reflect a �“reconciled�” 70 percent confidence level Life Cycle Cost Estimate at KDPs B and C. The 70 percent confidence level is defined as the estimated cost and time such that there is a 70 percent chance of being successful at or below those estimated resources. The appropriate management council decision authority must approve any deviation from this requirement. A reconciled life cycle cost estimate is the Independent Cost Estimate (ICE) after the independent estimators and the project staff have thoroughly reviewed respective estimates and understand the differences.
The Independent Program Assessment Office (IPAO) shall perform the ICE for programs and category I projects at Milestones B and C, and upon request from The Agency Associate Administrator for Category II programs and projects. The Mission Directorates are responsible for ensuring that an ICE is performed for Category II and III projects at Milestones B and C (See the Cost Estimating Volume, section 3.3 Project Category Overviews). The Cost Analysis Division within Program Analysis and Evaluation shall ensure that all generated ICEs comply with policy and will perform Basis of Estimate reviews for all programs and projects entering Phase A.
The confidence level can be adjusted, with approval, higher or lower than the 70th percentile under certain circumstances such as:
1. Phase of the Project. Projects in early phases suggest a lower confidence requirement due to the fact that Missions that are in Pre-Phase A, Phase A, or Early Phase B have not closed their trade spaces and may still have substantial uncertainties regarding their final configuration. Additionally, the S-curve is expected to become steeper and shift as risks are retired and the project technical definition matures over the life cycle.
2. Number of projects within a Program. The higher the number of projects would suggest a lower confidence requirement due to the �“portfolio effect�”
3. Correlation between the projects with a specific Program. A higher correlation between projects would suggest a higher confidence level. The level of correlation between projects in a multiple project program affects the degree to which cost risk dollars are magnified. Less correlation between projects tends to shield other projects in the program from being affected by an over-run in any single project. When projects are tightly related to on another, cost over runs in one project tend to induce problems in related projects.
4. If deemed appropriate by the Governing Program Management Council, a high payoff technology project might be pursued even though the known cost risk exceeds normal guidelines.

Cost Estim
atingC
ost Risk
Economic &
Supporting AnalysisC
areer Developm
ent Guide
Reference
Know
ledge Managem
entC
ost Estimating
Cost R
iskEconom
ic & Supporting Analysis
Career D
evelopment G
uideR
eferenceK
nowledge M
anagement
2008 NASA Cost Estimating Handbook Section 1. Cost Risk
Volume 2 Page 2-4
1.2 NASA Cost Risk Policy There is no specific cost risk policy that directs the cost estimator on how a cost risk assessment should be performed and included in a cost estimate. The only requirement is that a cost risk assessment has been conducted, the results incorporated into the estimate and the probabilistic cost estimate is presented at the 70% confidence level. NASA Policy Directives (NPDs) are policy statements that describe what NASA must do to achieve its vision, mission, and external mandates and that detail who is responsible for carrying out those requirements. NASA Procedural Requirements (NPRs) provide Agency-mandatory instructions and requirements to implement NASA policy as delineated in an associated NPD. The following NPDs and NPRs provide information pertaining to NASA�’s cost risk requirements. These NPRs in conjunction with this Cost Risk Volume of the NASA CEH provide the guidance and references for the NASA cost estimator to conduct the cost risk estimate as appropriate.
1.2.1 NPR 7120.5 Space Flight Program and Project Management Requirements
NPR 7120.5, NASA Space Flight Program and Project Management Requirements, (http://nodis3.gsfc.nasa.gov/displayDir.cfm?Internal_ID=N_PR_7120_005D) covers requirements by which NASA formulates and implements space flight programs and projects, consistent with the governance model contained in NPD 1000.0,NASA Strategic Management and Governance Handbook, (http://nodis.hq.nasa.gov/displayDir.cfm?t=NPD&c=1000&s=0)
Specific to cost risk, this NPR covers program and project management�’s cost risk roles and responsibilities as well as program and project cost risk requirements by life cycle phase. This includes:
�• Risk assessments �• Risk evaluations �• Risk mitigation �• Identification of margin and reserves �• Associated oversight and approval processes.
A number of cost risk related activities are required early in the project�’s lifecycle (Pre-Phase A through Phase B). Listed below are required activities or products relevant to cost risk during a program or project�’s life cycle:
1. A high-level WBS consistent with the NASA standard space flight project WBS, schedule, and a rough order of magnitude cost estimate and cost range.
2. A baseline mission concept document that includes key risk drivers and mitigation options.
3. A preliminary full cost life cycle cost estimate that includes reserves, along with the level of confidence estimate provided by the reserves based on a cost risk analysis
The instructions and requirements stated in this NPR are associated with the policy set forth in NPD 7120.4C, NASA Program/Project Management (http://nodis3.gsfc.nasa.gov/ displayDir.cfm?t=NPD&c=7120&s=4C). This document describes the management system governing formulation, approval, implementation, and evaluation of programs and projects.

Cost Estim
atingC
ost Risk
Economic &
Supporting AnalysisC
areer Developm
ent Guide
Reference
Know
ledge Managem
entC
ost Estimating
Cost R
iskEconom
ic & Supporting Analysis
Career D
evelopment G
uideR
eferenceK
nowledge M
anagement
2008 NASA Cost Estimating Handbook Section 1. Cost Risk
Volume 2 Page 2-5
1.2.2 NPR 8000.4 Risk Management Procedural Requirements NPR 8000.4, NASA Risk Management Procedural Requirements (http://nodis3.gsfc.nasa.gov/ displayDir.cfm?t=NPR&c=8000&s=4) outlines program and project requirements and information that pertain to risk management, as required by NPR 7120.5D and NPD 8700.1, NASA Policy for Safety and Mission Success (http://nodis.hq.nasa.gov/ displayDir.cfm?t=NPD&c=8700&s=1C). This NPR also introduces the Continuous Risk Management (CRM) process and defines risk management concepts, risk management requirements, and risk management responsibilities.
CRM is a six step process that is used to manage risk in order to achieve planned objectives. This process involves identifying, analyzing, planning, tracking, controlling, documenting, and communicating risks effectively.
NPR 8000.4 requires programs and projects to perform risk analyses that consist of estimating the likelihood and the consequences of risks and the timeframe in which action must be taken on an identified risk to avoid harm. The recommended methods of analyzing risk include, but are not limited to, the following:
�• Individual or group expert judgment
�• Statistical analysis of historical data
�• Uncertainty analysis of cost, performance, and schedule projections (consists of building and running a probabilistic model of the system under investigation, including the chance variation inherent in real-life cost, performance, and schedule).
1.2.3 Cost Risk Management Requirements in NPR 8000.4 NPR 8000.4 Chapter 4, �“Special Requirements for Programs and Projects�”, paragraph 4.2 �“Cost Risk Management�”, requires cost risk management to be part of the Continuous Risk Management process and delineates specific cost risk requirements but does not describe the process or how they are to implemented. This cost estimating handbook contains that information.
1.2.4 Cost-Risk Management While some cost-risk methodologies can be generalized to Space Flight Programs, or even non-Space Flight endeavors, the focus and the tools discussed here are applied to Category I & II major Space Flight Projects. The objective of cost risk management is to continuously determine the rolled-up risk impact on the cost of the program/project by organizing, obtaining and using cost-risk information.
Stakeholder interest in integrated cost-risk was codified in June 2006 with the OMB update of Circular A-11, Part 7 and the Supplement to Part 7 (Capital Programming Guide) and in July of 2006 with the update of the FAR (FAR Case 2004-019) that implements EVMS policy in accordance with the changes to Circular A-11, Part 7. These updates require the creation and management of risk adjusted budgets. This supplemented GAO interest in better NASA cost-risk management as documented in the May 2004 GAO report on NASA cost estimating.
Cost Estim
atingC
ost Risk
Economic &
Supporting AnalysisC
areer Developm
ent Guide
Reference
Know
ledge Managem
entC
ost Estimating
Cost R
iskEconom
ic & Supporting Analysis
Career D
evelopment G
uideR
eferenceK
nowledge M
anagement
2008 NASA Cost Estimating Handbook Section 1. Cost Risk
Volume 2 Page 2-6
Cost risk management integrates the CRM process, cost estimating, cost-risk assessment/analysis (utilizing the identified risks in the project risk list and the cost estimate), and EVM, with procurement, source selection, cost data collection and cost data analysis as supporting disciplines.
There are three activities that make up integrated cost-risk: Identify and Quantify Cost-Risk; Establish Cost-Risk Reporting; and, Manage Cost-Risk Using Reported Data. These activities are summarized below:
Identify and Quantify Cost-Risk �• Identify and assess risk
�• Translate risk assessment into cost impact
�• Perform �“S�”-curve and CRM scenario-based cost-risk
�• Incorporate CRM scenario-based and �“S�”-curve cost-risk in CADRe Part C life cycle cost estimate (LCCE)
Establish Cost-Risk Reporting �• Develop RFP CADRe & EVM Data Requirements Description (DRD�’s) and equivalent project
plan requirements
�• Evaluate EVM and LCCE DRD�’s in proposals/project plans
�• Do Integrated Baseline Review
Manage Cost-Risk Using Reported Data �• Do EVM performance measurement & CADRe �“S�”-curve analysis
�• Compile end-of-contract cost-risk data for database updates, data evaluation and analysis and cost-risk algorithm updates
Cost risk management is performed in three overlapping stages during Phases of the project life-cycle. Generally speaking, identification and quantification and establishing cost-risk reporting occur at the end of each Phase followed by the use of that reporting for cost-risk management in the next Phase. This cycle repeats as illustrated in Figure 2-1.

Cost Estim
atingC
ost Risk
Economic &
Supporting AnalysisC
areer Developm
ent Guide
Reference
Know
ledge Managem
entC
ost Estimating
Cost R
iskEconom
ic & Supporting Analysis
Career D
evelopment G
uideR
eferenceK
nowledge M
anagement
2008 NASA Cost Estimating Handbook Section 1. Cost Risk
Volume 2 Page 2-7
ProgramPhases
Formulation Implementation
AO-DrivenProjects
TraditionalWaterfall
Developmentor DirectedMissions
KDP A
Flight ProjectsLife Cycle
Phases
Pre-Phase A:ConceptStudies
Phase A:Concept
Development
Phase B:
Preliminary Design
Phase C:
Detailed Design
Phase D:Fab, Assy & Test
Phase E:Operations &Sustainment
Phase F:Disposal
CRSelect Step 2
DownSelectStep 1
CDRLaunch
Legend
GPMC Mission Decision Review/ICR
CADRe’s
Id & Quantify Cost-Risk
Establish Cost-Risk Reporting
Manage Cost-Risks Using Reported Data
KDP B KDP C KDP D KDP E KDP F
Figure 2-1. When Integrated Cost-Risk is Required
Pre-Phase A/Phase A to Phase B In pre-Phase A and early Phase A of Formulation, programs/projects shall identify and quantify cost-risk to be incorporated in the project�’s CADRe life cycle cost estimate (LCCE) that forms the basis for the proposed project budget.
The CADRe has three-parts: Part A �– Narrative project description; Part B �– technical characteristics; and, Part C �– risk-adjusted LCCE. Part C requires any actual costs-to-date plus an estimate-to-complete with cost methodology and cost-risk quantification documentation. Near the end of Phase A, an Independent Cost Estimate (ICE) is performed, assessing cost and cost risk in preparation for transition to Phase B. CRM risk identification is a key input into cost-risk quantification for the project�’s CADRe life cycle cost estimate (LCCE). CRM risk likelihood-based cost impacts are compared with the cost estimating cost-risk impacts and reconciled to produce the project�’s CADRe LCCE. Also in late Phase A the project develops data requirements to establish cost-risk reporting for cost-risk management using that reported cost-risk data beginning early and extending throughout Phase B.
Phase B to Phase C In late Phase B, programs/projects update their CADRe LCCE including identification and quantification of cost-risk and document reasons for cost growth for the final risk-adjusted budget for approval at Confirmation. Once approved, program/projects incorporate the risk handling budgets for cost-risk in the EVM system�’s performance measurement baseline (PMB) to be tracked and managed in Phase C of Implementation. Establishing new cost-risk reporting in Phase B is only activated if there are any changes necessary in that reporting data used in managing Phase C cost-risk. Projects then incorporate and budget risk handling tasks in their
Cost Estim
atingC
ost Risk
Economic &
Supporting AnalysisC
areer Developm
ent Guide
Reference
Know
ledge Managem
entC
ost Estimating
Cost R
iskEconom
ic & Supporting Analysis
Career D
evelopment G
uideR
eferenceK
nowledge M
anagement
2008 NASA Cost Estimating Handbook Section 1. Cost Risk
Volume 2 Page 2-8
EVM system. Projects also flow down the requirements for cost-risk in any contractor�’s EVM system in all appropriate procurements.
Phase C to Phases D & E Identification, quantification and updating cost-risk reporting (if necessary) of integrated cost-risk is again repeated prior to entry into Implementation Phases D & E to manage cost-risk using reported data in those Phases. Working synergistically with integrated cost-risk, Earned Value Management (EVM) is used to plan and budget for risk handling and reporting. Program/Project offices shall also specifically evaluate EVM cost-risk handling performance measurement on a monthly basis.
EVM system Control Accounts contain Work Packages where risk handling activities are planned, budgeted and measured. Programs/projects meeting EVMS requirement thresholds incorporate meaningful, measurable, and relevant risk handling activities in the EVMS. Risk Handling activities are budgeted, scheduled and assessed as part of the project�’s EVM planning and performance assessment process. EVM data is used to track performance measurement progress of the risk handling activities, against the project�’s integrated baseline, that is, the performance measurement baseline (PMB) integrated with the Integrated Master Schedule (IMS). The rationale for this is that all risk handling activities ultimately involve use of project resources (e.g., personnel, schedule, and budget). EVM allows the project to plan and assess performance based upon an integration of these resources.
Performance against the plan and EVM reporting can include WBS elements identified as risky during integrated cost-risk activities to ensure the project manager has performance measurement information on those WBS elements most likely to cause cost and schedule problems.
Each month�’s estimate at completion (EAC) from the EVM system can include a cost-risk exercise resulting in an EAC cost-risk S-curve for the effort. The cost-risk S-curve provides higher quality information to the project manager about how confident he or she should be about the project�’s EAC versus the contractor�’s Latest Revised Estimate (LRE) that includes cost impacts due to current levels of risk. Using EVM metrics (e.g., Cost Performance Index (CPI); Schedule Performance Index (SPI); Schedule/Cost Index (SCI); etc.) in combination with Excel and monte carlo simulation software, Control Account and Work Package activity cost-risks can be modeled and statistically summarized for S-curve evaluation.
EVM cost-risk reporting requirements should be described in the solicitation�’s data requirements section such that contractors understand that risks identified in the cost estimate, by the source evaluation boards and independent risk identification teams are to be reported in the EVM contract performance reports (CPR). Such CPR data requirement language should read like the following as developed by the EVM Working Group and posted on the Cost Analysis Division website.
Contents The CPR shall include data pertaining to all authorized contract work, including both priced and unpriced effort that has been authorized at a not-to-exceed amount in accordance with the Contracting Officer's direction. The CPR shall separate direct and indirect costs and identify
Cost Estim
atingC
ost Risk
Economic &
Supporting AnalysisC
areer Developm
ent Guide
Reference
Know
ledge Managem
entC
ost Estimating
Cost R
iskEconom
ic & Supporting Analysis
Career D
evelopment G
uideR
eferenceK
nowledge M
anagement
2008 NASA Cost Estimating Handbook Section 1. Cost Risk
Volume 2 Page 2-9
elements of cost for all direct reporting. The CPR shall include Formats 1 -- 5, down to a WBS Level -4. A lower level of reporting may be required for elements that are classified as �“special interest�” technical, schedule, or cost risk areas.
Earned value performance measurement data for Government and/or contractor-identified medium- and high-risk WBS items shall be reported on Format 1 of the monthly CPR until such time as both Government project management and the Contractor agree that they no longer represent high risks. This reporting shall be at a level where the risk resides in the WBS. For medium- and high-risk elements lower than Level 4, specific narrative variance analyses are not required unless classified as �“special interest�”.
To ensure an integrated approach to risk management, the data provided by this CPR DID shall be in consonance with the Work Breakdown Structure (WBS), Integrated Master Schedule (IMS), Risk Management Processes, Plans and Reports (where required), Probabilistic Risk Assessment Processes and Reports (where required), the CADRe and the Monthly/Quarterly Contractor Financial Management Reports (533/Q). The Financial Management Reports shall include reconciliation between the 533Q and the CPR. This reconciliation may be included within the required CPR Formats.
Format CPR formats shall be completed according to the instructions outlined in DI-MGMT-81466A and the following forms: Format 1 (DD Form 2734/1); Format 2 (DD Form 2734/2); Format 3 (DD Form 2734/3); Format 4 (DD Form 2734/4); and Format 5 (DD Form 2734/5). Samples of the forms are located at http://www.dtic.mil/whs/directives/infomgt/forms/ddforms2500-2999.htm. Variance analysis thresholds which, if exceeded, require problem analysis, narrative explanations and corrective action plan descriptions for all level three and other special interest WBS elements. Variance analysis thresholds will initially be +/- 10% of both current and cumulative cost and schedule variance to date. The variance analysis thresholds may change once the personnel evaluate the contractor�’s schedule and cost performance and risk. Special emphasis should be placed in the variance analysis on cost and schedule growth linked to technical risks (e.g. technology development efforts, design engineering, integration, complexity, project management, systems engineering, duration constraints, etc.) identified by both the Government and contractor.
Contractor format may be substituted for CPR formats whenever they contain all the required data elements at the specified reporting levels in a form suitable for NASA management use. The CPR shall be submitted electronically and followed up with a signed paper copy. The American National Standards Institute (ANSI) X12/XML standards (transaction sets 839 for cost and 806 for schedule), or the United National Electronic Data Interchange for Administration, Commerce and Transport (EDIFACT), http://www.unece.org/trade/untdid/welcome.htm equivalent, or any other electronic delivery method deemed acceptable to the Project Office shall be used for Electronic Data Interchange.
Refer to the EVM website, http://evm.nasa.gov, for additional information regarding EVM. Refer to NPR 7120.5 for EVM applicability and NASA requirements.

Cost Estim
atingC
ost Risk
Economic &
Supporting AnalysisC
areer Developm
ent Guide
Reference
Know
ledge Managem
entC
ost Estimating
Cost R
iskEconom
ic & Supporting Analysis
Career D
evelopment G
uideR
eferenceK
nowledge M
anagement
2008 NASA Cost Estimating Handbook Section 1. Cost Risk
Volume 2 Page 2-10
1.3 Cost Risk Assessment Cost risk assessment is the process of identifying and analyzing critical project risks within a defined set of cost, schedule, and technical objectives and constraints. It is balancing the probability of failing to achieve a particular outcome against the consequences of failing to achieve that outcome. Assessing cost risk also allows the cost estimator to document risks in a manner that accommodates proactive management of project costs.
The purpose of cost risk assessment is to capture uncertainty in cost methodology, technical parameters, schedule, and programmatic factors in order to move the deterministic point estimate to a probabilistic estimate. A credible baseline estimate is the key starting point in generating a cost risk adjusted estimate and the development of confidence intervals.
Historically, on large-scale projects, possible impacts of risks were addressed by establishing contingencies to a base cost estimate. Contingencies were typically point estimate budget allowances that were set using simple rules of thumb such as 10 percent (%) of the base cost.
Risk analysis provides an analytical basis for establishing defensible cost estimates that quantitatively account for likely project risks. It is important to keep in mind that this analysis should be continuously reviewed and updated as more data becomes available. By projecting how the future will turn out as a result of undertaking a certain course of action (or inaction), risk can be analyzed. A risk analysis, therefore, fundamentally consists of answering the following questions4:
�• What can happen? �• How likely is it that it will happen? �• If it does happen, what are the consequences?
Risk analysis utilizes various methods of modeling, analysis, and evaluation and thus contains various types of uncertainty. In general, these uncertainties may be attributable to a number of factors such as: 1) the statistical nature of data, 2) insufficient understanding of physical and biological phenomena, and/or 3) unpredictable events (e.g., natural, biological and human behavior)5. For cost estimates, the uncertainty stems from risks encountered during the course of project development, from planning through production.
The cost risk assessment process forces the consideration of cost risks by the cost estimator and the Project or Program Manager and provides tangible data for use as the basis of decisions.
Generating a point estimate is an important step, but is just the beginning of the cost risk process. It is important to understand that when actual project costs are being estimated, the costs are an uncertain quantity and that the point estimate is not the only possible estimate. Figure 2-2 graphically demonstrates that point estimates of individual WBS elements using the triangular and normal distributions can be quantified as, �“Most Likely�” (Mode), �“50th Percentile (Median),
4 Kaplan S. and Garrick B.J., "On The Quantitative Definition of Risk," Risk Analysis, Vol. 1, No. 1, 1981. 5 Kastenberg, W.E. and Solomon, K.A., "On the Use of Confidence Levels in Risk Management," Journal of Hazardous Materials,
10, 263-278, 1985.

Cost Estim
atingC
ost Risk
Economic &
Supporting AnalysisC
areer Developm
ent Guide
Reference
Know
ledge Managem
entC
ost Estimating
Cost R
iskEconom
ic & Supporting Analysis
Career D
evelopment G
uideR
eferenceK
nowledge M
anagement
2008 NASA Cost Estimating Handbook Section 1. Cost Risk
Volume 2 Page 2-11
or �“Expected Value�” (Mean). The use of this terminology implies that costs are statistical in nature and are defined by their probability distributions.
Mean, Median, Mode = 15
0 5 10 15 20 25 30
Mode 15.00
5 10 15 20 25 30 35
Mean 18.33
Median 17.75
Figure 2-2. Statistics of the Triangular and Normal Distributions
When the number of WBS elements increase, the distribution of the total cost of the WBS elements approximates the normal distribution (Figure 2-3). This is known as the Central Limit Theorem. The Central Limit Theorem (CLT) states that the average of the sum of a large number of independent, identically distributed random variables with finite means and variances converges "in distribution" to a normal random variable.
Most Likely
Most Likely
Most Likely
Most LikelyTotal Cost
Roll Up of Most Likely WBS
Element Costs
WBS Element Triangular Cost Distributions
Merge WBS Element Cost Distributions into Total Cost Normal Distribution
Figure 2-3. Central Limit Theorem

Cost Estim
atingC
ost Risk
Economic &
Supporting AnalysisC
areer Developm
ent Guide
Reference
Know
ledge Managem
entC
ost Estimating
Cost R
iskEconom
ic & Supporting Analysis
Career D
evelopment G
uideR
eferenceK
nowledge M
anagement
2008 NASA Cost Estimating Handbook Section 1. Cost Risk
Volume 2 Page 2-12
In addition to the Central Limit Theorem, another statistical theorem states that the sum of the WBS element means equals the total cost mean. From this theorem it can be assumed that:
�• The total cost mean = the sum of the WBS element means �• The total cost median = the sum of the WBS element means �• The total cost mode = the sum of the WBS element means �• The sum of the WBS element modes < total cost mode �• The sum of the WBS element medians < total cost median
1.4 Cost Risk as Part of the Cost Estimating Process Cost risks are those risks due to economic factors such as rate uncertainties, cost estimating errors, and statistical uncertainty inherent in the estimate. Cost risk is dependent upon other fundamental risk dimensions (technical, schedule, and programmatic risks) so these must all be assessed to arrive at a true picture of project risk.
Cost-risk assessment takes into account cost, schedule, and technical risks that are then factored back into the cost estimate. To quantify the cost impacts due to risk, sources of risk need to be identified. NASA cost analysts should be concerned with three sources of risk and ensure that the model calculating the cost accounts for:
�• Risk inherent in the cost estimating methodology. For example, if a regression-based cost estimating relationship (CER) is used, it has an associated standard error of the estimate (SEE), confidence intervals, and prediction intervals, any of which can be used to include cost estimating methodology risk in the estimate.
�• Risk inherent in the technical aspects of the systems being developed. Into this category of risk fall risk sources such as the technology�’s state of the art (TRLs are good indicators of this risk source), design/engineering, integration, manufacturing, schedule, complexity, etc. Quantifying the cost impacts due to these kinds of risk is not as statistically derivative as is CER risk. Figure 2-4 graphically displays the effects of cost estimating methodology risk and technical input risk.
�• Risk inherent in the correlation between WBS elements. Correlation assessment determines to what degree one WBS element�’s change in cost is related to another�’s and in which direction. For example, if the cost of the satellite�’s payload goes up and the cost of the propulsion system goes up then there is a positive correlation between both subsystems�’ costs. Many WBS elements within space systems have positive correlations with each other and the cumulative effect of this positive correlation tends to increase the range of the possible costs.
Even as early as Pre-Phase A, it is important to capture risk in cost estimates, especially technical, schedule, programmatic and cost data. Even at this early stage, there are many risks that can and should be identified and addressed in a cost risk assessment. Cost estimating uncertainty, technical input variable uncertainty, and correlation risks all need to be considered. Schedule risk can be handled outside these three types of risk by applying probabilistic activity duration risk to the critical path analysis (CPA).

Cost Estim
atingC
ost Risk
Economic &
Supporting AnalysisC
areer Developm
ent Guide
Reference
Know
ledge Managem
entC
ost Estimating
Cost R
iskEconom
ic & Supporting Analysis
Career D
evelopment G
uideR
eferenceK
nowledge M
anagement
2008 NASA Cost Estimating Handbook Section 1. Cost Risk
Volume 2 Page 2-13
Cost Driver (Weight)Inputvariable
CostEstimate
$
Historical data point
Cost estimating relationship
Standard percent error bounds
Cost = a + bXc
COMBINED COST MODELING AND TECHNICAL RISK
TECHNICALRISK
COST MODELINGUNCERTAINTY
Figure 2-4. Cost Modeling and Technical Input Risk
Working with project office staff, the cost estimator should identify cost-risk drivers and vary the operating scenarios and input parameters through the conduct of a comprehensive probabilistic and deterministic cost-risk and sensitivity analyses. It is the job of the cost estimator to estimate the effects of identifying, assessing, and analyzing cost-risk drivers (e.g., probabilistic cost-risk analysis) and varying cost drivers (e.g., deterministic cost-risk) and to revise the life cycle cost (LCC) estimates reflecting the selected variations, pointing out the relationship between the LCC and the key technical and/or operational parameter risks. Discrete technical cost-risk assessments involve identifying and cost estimating specific cost-driving technical risks.
For example, a notional new electronic component for a spacecraft might have risk in key engineering performance parameters (KEPPs) such as dynamic load resistance, operating voltage, power regulation, radiation resistance, emissivity, component mass, operating temperature range and operating efficiency. Technical staff can identify these KEPP risks during cost-risk assessment. Instead of probabilistic distributions and Monte Carlo simulations, however, mitigation costs for these risks are estimated based on their probabilities of manifesting discrete changes in the technical parameters (e.g., increased component mass or power regulation). Justifying the amount of cost risk dollars is a function of the detail specification of cost estimating, technical, and correlation risks that drive the cost risk range. Cost risk dollars that add, for example, 30% additional costs to the point estimate, have to be defensible with a cost-risk methodology that justifies the endpoints of individual WBS element cost-risk distributions, SEE regression line, and solid correlation coefficients.
As a project moves through the conceptual design phase, the range of feasible alternatives decrease and the definition of those alternatives increase. At this stage, there is a crucial need to

Cost Estim
atingC
ost Risk
Economic &
Supporting AnalysisC
areer Developm
ent Guide
Reference
Know
ledge Managem
entC
ost Estimating
Cost R
iskEconom
ic & Supporting Analysis
Career D
evelopment G
uideR
eferenceK
nowledge M
anagement
2008 NASA Cost Estimating Handbook Section 1. Cost Risk
Volume 2 Page 2-14
identify pertinent cost issues and to correct them before corrective costs become prohibitive. Issues and cost drivers must be identified to build successful options. By accomplishing a cost estimate on proposed project alternatives, a Project Office can determine the cost impact of the alternatives. These cost drivers feed an increasingly detailed cost-risk assessment that takes into account cost, technical, and schedule risks for the estimate. The point estimate and the risk assessment work together to create the total LCC estimate.
As a project moves through the preliminary design phase and the project definition increases, cost estimators should keep the estimate up-to-date with definition changes and have a full cost risk assessment to defend the estimate, reduce updated estimate turn-around time, and give the decision-maker a clearer picture for �“what if�” drills or major decisions. The role of the cost estimator during this phase is critical. It is important to understand the basis of the estimate, from the technical baseline to the cost risk assessment and to be able to document and present the results of these efforts to the decision makers. It is the cost estimator�’s responsibility to ensure the best possible LCCE with recommended levels of UFE is based on updated cost risk assessments in Phase B. These estimates will support budget formulation as well as source selection support in the transition from Phase B to Phase C/D.
When conducting Phase C/D estimates, new information collected from contractor sources and from testing must be fed back into the point estimate and the risk assessment creating a more detailed project estimate. During this phase, the cost-risk assessment should be very detailed, not only including any changes in requirements or project design, but other details provided by project technical experts such as testing and schedule impacts. While the product is being designed, developed, and tested, there are changes which can impact the estimate and the risk assessment. It is critical to capture these changes to maintain a realistic program estimate now and in the future. During this phase, programmatic data may have just as much of an impact on the estimate and risk assessment as technical data.

Cost Estim
atingC
ost Risk
Economic &
Supporting AnalysisC
areer Developm
ent Guide
Reference
Know
ledge Managem
entC
ost Estimating
Cost R
iskEconom
ic & Supporting Analysis
Career D
evelopment G
uideR
eferenceK
nowledge M
anagement
2008 NASA Cost Estimating Handbook Section 2. Cost Risk Approaches
Volume 2 Page 2-15
Section 2. Cost Risk Approaches
Decision makers prefer, as a general rule, lower estimates to higher ones. The reason is fairly obvious. If estimates are lower, either more projects can be developed within limited available funding or proposed projects are more appealing to funding appropriators (or both). Cost-risk assessments generally add to estimated project costs so decision makers will want justification before agreeing to cost-risk assessments. Cost estimators need methodologies
that produce cost-risk assessments that are beyond reproach.
This handbook presents two high-level cost risk approaches: the Analytic approach and the Simulation approach.
2.1 Analytic Approach The Analytic approach to cost risk provides non-simulation/analytical alternatives for quantifying cost risk. Presented in this section of the handbook are two methods for conducting the Analytic approach: Scenario Based Method (SBM) and the FRISK/Method of Moments approach.
2.1.1 Scenario Based Method (SBM) The SBM is derived from a variation of sensitivity analysis. The principle strengths of the SBM is its visibility, defensibility, and the cost impacts of specifically identified risks. The SBM specifies a well-defined set of conditions or scenarios (i.e., Prime Scenario/Protect Scenario) that would create a condition that management would like to guard against. The SBM postulates on specified scenarios that, if they occurred, would result in costs higher than the level planned or budgeted. These scenarios do not have to represent worst cases; rather, they should reflect a set of conditions a Program Manager or decision-maker would want to budget for, should any or all of those conditions occur.
The eight steps associated with the SBM are depicted in Figure 2-5 and described below.
The Air Force Cost Risk and Uncertainty Handbook (AF CRUH) (pages 43-44, and 108-111) provides an overview, associated formulas, and detailed examples of the SBM. Additional resources include Paul Garvey�’s white paper entitled, �“A Scenario-Based Method for Cost Risk Analysis,�” and his presentation entitled, �“Cost Risk Analysis without Statistics.�”
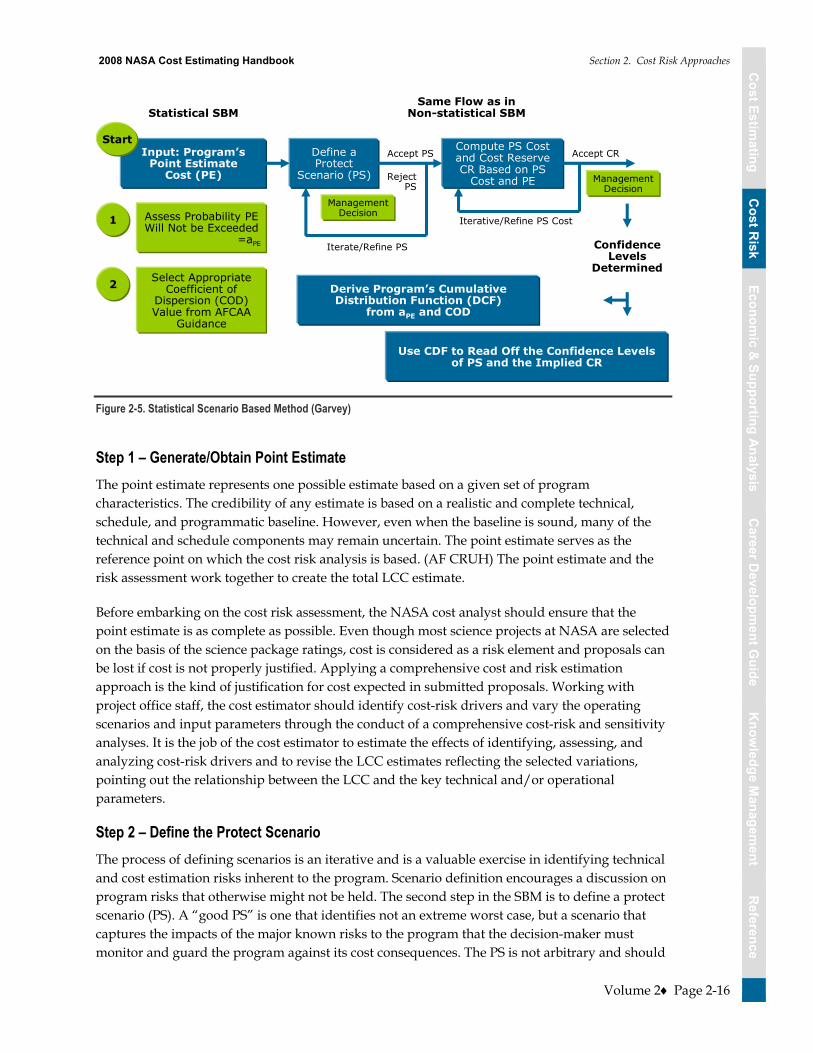
Cost Estim
atingC
ost Risk
Economic &
Supporting AnalysisC
areer Developm
ent Guide
Reference
Know
ledge Managem
entC
ost Estimating
Cost R
iskEconom
ic & Supporting Analysis
Career D
evelopment G
uideR
eferenceK
nowledge M
anagement
2008 NASA Cost Estimating Handbook Section 2. Cost Risk Approaches
Volume 2 Page 2-16
Statistical SBMSame Flow as in
Non-statistical SBM
Input: Program�’s Point Estimate
Cost (PE)
Assess Probability PE Will Not be Exceeded
=aPE
Select Appropriate Coefficient of
Dispersion (COD) Value from AFCAA
Guidance
Define a Protect
Scenario (PS)
Management Decision
Compute PS Cost and Cost Reserve CR Based on PS
Cost and PE
Confidence Levels
Determined
Start
1
2
Management Decision
Derive Program�’s Cumulative Distribution Function (DCF)
from aPE and COD
Use CDF to Read Off the Confidence Levels of PS and the Implied CR
Iterate/Refine PS
RejectPS
Accept PS
Iterative/Refine PS Cost
Accept CR
Figure 2-5. Statistical Scenario Based Method (Garvey)
Step 1 – Generate/Obtain Point Estimate
The point estimate represents one possible estimate based on a given set of program characteristics. The credibility of any estimate is based on a realistic and complete technical, schedule, and programmatic baseline. However, even when the baseline is sound, many of the technical and schedule components may remain uncertain. The point estimate serves as the reference point on which the cost risk analysis is based. (AF CRUH) The point estimate and the risk assessment work together to create the total LCC estimate.
Before embarking on the cost risk assessment, the NASA cost analyst should ensure that the point estimate is as complete as possible. Even though most science projects at NASA are selected on the basis of the science package ratings, cost is considered as a risk element and proposals can be lost if cost is not properly justified. Applying a comprehensive cost and risk estimation approach is the kind of justification for cost expected in submitted proposals. Working with project office staff, the cost estimator should identify cost-risk drivers and vary the operating scenarios and input parameters through the conduct of a comprehensive cost-risk and sensitivity analyses. It is the job of the cost estimator to estimate the effects of identifying, assessing, and analyzing cost-risk drivers and to revise the LCC estimates reflecting the selected variations, pointing out the relationship between the LCC and the key technical and/or operational parameters.
Step 2 – Define the Protect Scenario
The process of defining scenarios is an iterative and is a valuable exercise in identifying technical and cost estimation risks inherent to the program. Scenario definition encourages a discussion on program risks that otherwise might not be held. The second step in the SBM is to define a protect scenario (PS). A �“good PS�” is one that identifies not an extreme worst case, but a scenario that captures the impacts of the major known risks to the program that the decision-maker must monitor and guard the program against its cost consequences. The PS is not arbitrary and should
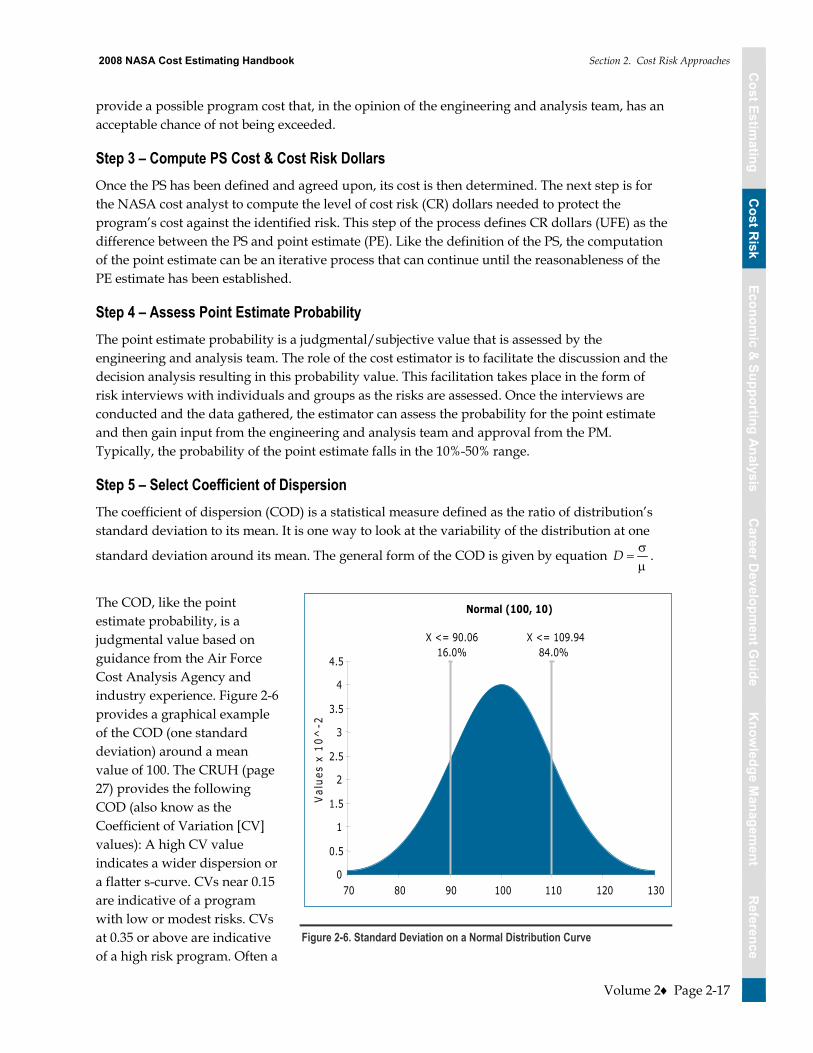
Cost Estim
atingC
ost Risk
Economic &
Supporting AnalysisC
areer Developm
ent Guide
Reference
Know
ledge Managem
entC
ost Estimating
Cost R
iskEconom
ic & Supporting Analysis
Career D
evelopment G
uideR
eferenceK
nowledge M
anagement
2008 NASA Cost Estimating Handbook Section 2. Cost Risk Approaches
Volume 2 Page 2-17
provide a possible program cost that, in the opinion of the engineering and analysis team, has an acceptable chance of not being exceeded.
Step 3 – Compute PS Cost & Cost Risk Dollars
Once the PS has been defined and agreed upon, its cost is then determined. The next step is for the NASA cost analyst to compute the level of cost risk (CR) dollars needed to protect the program�’s cost against the identified risk. This step of the process defines CR dollars (UFE) as the difference between the PS and point estimate (PE). Like the definition of the PS, the computation of the point estimate can be an iterative process that can continue until the reasonableness of the PE estimate has been established.
Step 4 – Assess Point Estimate Probability
The point estimate probability is a judgmental/subjective value that is assessed by the engineering and analysis team. The role of the cost estimator is to facilitate the discussion and the decision analysis resulting in this probability value. This facilitation takes place in the form of risk interviews with individuals and groups as the risks are assessed. Once the interviews are conducted and the data gathered, the estimator can assess the probability for the point estimate and then gain input from the engineering and analysis team and approval from the PM. Typically, the probability of the point estimate falls in the 10%-50% range.
Step 5 – Select Coefficient of Dispersion
The coefficient of dispersion (COD) is a statistical measure defined as the ratio of distribution�’s standard deviation to its mean. It is one way to look at the variability of the distribution at one
standard deviation around its mean. The general form of the COD is given by equation D .
The COD, like the point estimate probability, is a judgmental value based on guidance from the Air Force Cost Analysis Agency and industry experience. Figure 2-6 provides a graphical example of the COD (one standard deviation) around a mean value of 100. The CRUH (page 27) provides the following COD (also know as the Coefficient of Variation [CV] values): A high CV value indicates a wider dispersion or a flatter s-curve. CVs near 0.15 are indicative of a program with low or modest risks. CVs at 0.35 or above are indicative of a high risk program. Often a
Normal (100, 10)
X <= 90.0616.0%
X <= 109.9484.0%
0
0.5
1
1.5
2
2.5
3
3.5
4
4.5
70 80 90 100 110 120 130
Val
ues
x 10
^-2
Figure 2-6. Standard Deviation on a Normal Distribution Curve
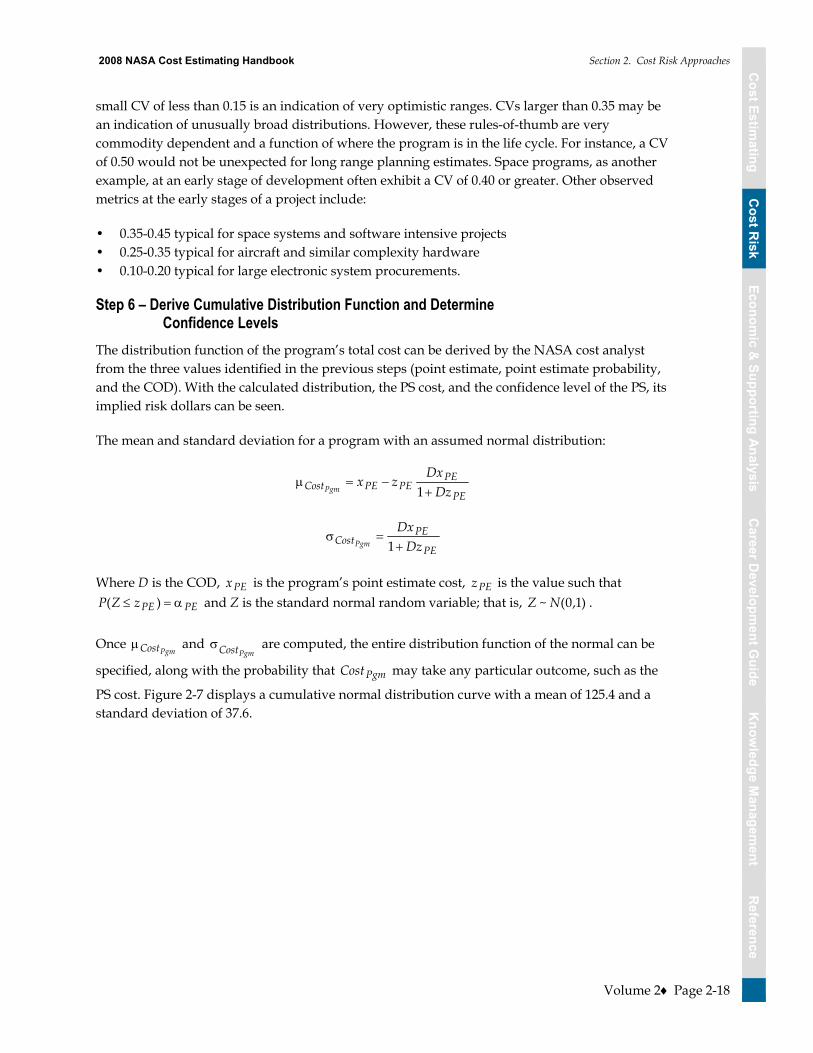
Cost Estim
atingC
ost Risk
Economic &
Supporting AnalysisC
areer Developm
ent Guide
Reference
Know
ledge Managem
entC
ost Estimating
Cost R
iskEconom
ic & Supporting Analysis
Career D
evelopment G
uideR
eferenceK
nowledge M
anagement
2008 NASA Cost Estimating Handbook Section 2. Cost Risk Approaches
Volume 2 Page 2-18
small CV of less than 0.15 is an indication of very optimistic ranges. CVs larger than 0.35 may be an indication of unusually broad distributions. However, these rules-of-thumb are very commodity dependent and a function of where the program is in the life cycle. For instance, a CV of 0.50 would not be unexpected for long range planning estimates. Space programs, as another example, at an early stage of development often exhibit a CV of 0.40 or greater. Other observed metrics at the early stages of a project include:
�• 0.35-0.45 typical for space systems and software intensive projects �• 0.25-0.35 typical for aircraft and similar complexity hardware �• 0.10-0.20 typical for large electronic system procurements.
Step 6 – Derive Cumulative Distribution Function and Determine Confidence Levels
The distribution function of the program�’s total cost can be derived by the NASA cost analyst from the three values identified in the previous steps (point estimate, point estimate probability, and the COD). With the calculated distribution, the PS cost, and the confidence level of the PS, its implied risk dollars can be seen.
The mean and standard deviation for a program with an assumed normal distribution:
PE
PEPEPECost
Dz
Dxzx
Pgm 1
PE
PECost
Dz
Dx
Pgm 1
Where D is the COD, PEx is the program�’s point estimate cost, PEz is the value such that
PEPEzZP )( and Z is the standard normal random variable; that is, )1,0(~ NZ .
Once PgmCost and
PgmCost are computed, the entire distribution function of the normal can be
specified, along with the probability that PgmCost may take any particular outcome, such as the
PS cost. Figure 2-7 displays a cumulative normal distribution curve with a mean of 125.4 and a standard deviation of 37.6.
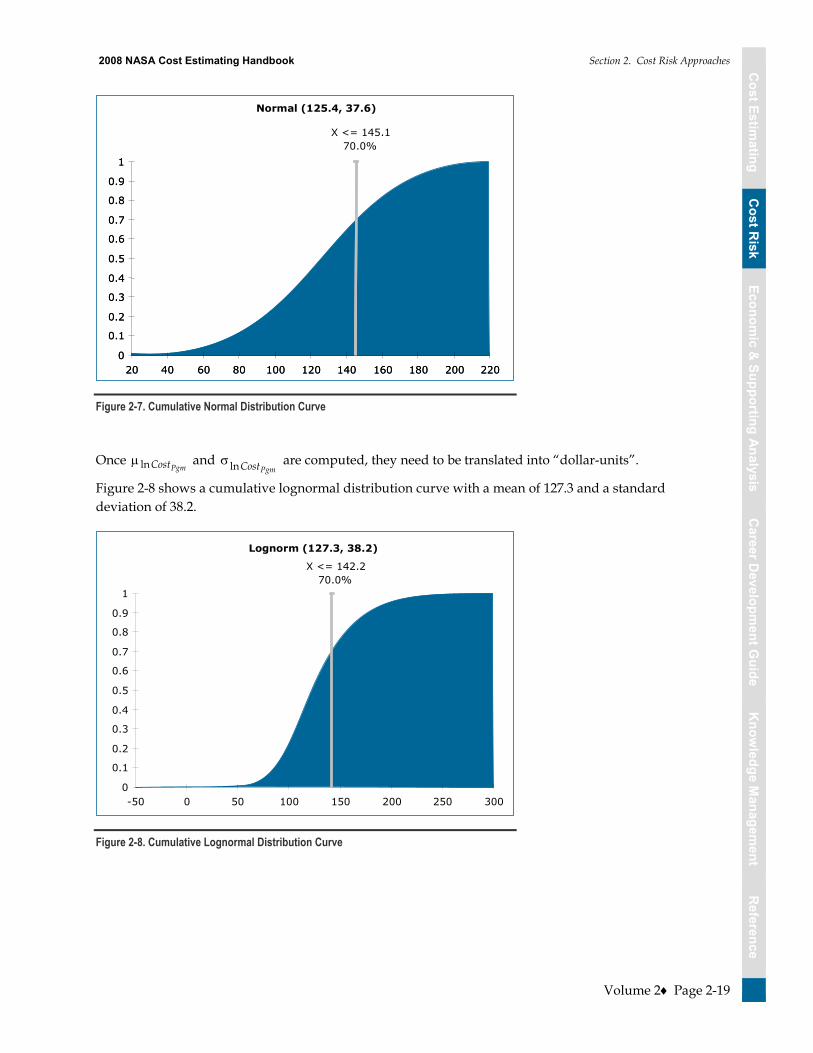
Cost Estim
atingC
ost Risk
Economic &
Supporting AnalysisC
areer Developm
ent Guide
Reference
Know
ledge Managem
entC
ost Estimating
Cost R
iskEconom
ic & Supporting Analysis
Career D
evelopment G
uideR
eferenceK
nowledge M
anagement
2008 NASA Cost Estimating Handbook Section 2. Cost Risk Approaches
Volume 2 Page 2-19
Normal (125.4, 37.6)
X <= 145.170.0%
0
0.1
0.2
0.3
0.4
0.5
0.6
0.7
0.8
0.9
1
20 40 60 80 100 120 140 160 180 200 2200
0.1
0.2
0.3
0.4
0.5
0.6
0.7
0.8
0.9
1
20 40 60 80 100 120 140 160 180 200 220
Figure 2-7. Cumulative Normal Distribution Curve
Once PgmCostln and
PgmCostln are computed, they need to be translated into �“dollar-units�”.
Figure 2-8 shows a cumulative lognormal distribution curve with a mean of 127.3 and a standard deviation of 38.2.
Lognorm (127.3, 38.2)
X <= 142.270.0%
0
0.1
0.2
0.3
0.4
0.5
0.6
0.7
0.8
0.9
1
-50 0 50 100 150 200 250 300
Figure 2-8. Cumulative Lognormal Distribution Curve

Cost Estim
atingC
ost Risk
Economic &
Supporting AnalysisC
areer Developm
ent Guide
Reference
Know
ledge Managem
entC
ost Estimating
Cost R
iskEconom
ic & Supporting Analysis
Career D
evelopment G
uideR
eferenceK
nowledge M
anagement
2008 NASA Cost Estimating Handbook Section 2. Cost Risk Approaches
Volume 2 Page 2-20
2ln2
1ln PgmCostPgmCost
PgmeCost
)1(2ln
2lnln2
PgmCostPgmCostPgmCost
Pgmee
Cost
Once PgmCost and
PgmCost are computed, the entire distribution function of the lognormal can
be specified, along with the probability that PgmCost may take a particular outcome.
Step 7 – Perform Sensitivity Analysis
After step six, the NASA cost analyst performs a sensitivity analysis on both of the subjective statistical inputs (point estimate probability) and COD to assess where changes in assumed values affect cost risk and needed levels of UFE. The point estimate probability can range from 10% to 50% and the COD can vary for each program �– not only as a function of the program�’s type but its maturity and lifecycle phase.
The sensitivity analysis is intended to demonstrate how the results can fluctuate with wide variations in the COD. In reality, a program would not experience such wide swings in COD values. However, it is good practice to vary the COD by some amount around the �“point�” value to see what possible variations in confidence levels or dollars results. The analysis can signal where additional refinements to scenarios, and the underling analytical assumptions, may be needed.
Step 8 – Allocate Risk Dollars
There are several existing methodologies to assist the analyst in allocating risk dollars, including the most recent version of NAFCOM, which incorporates a risk dollar allocation algorithm. The NASA cost analyst must be able to allocate the risk dollars to the lower level WBS elements in order to move the WBS elements�’ deterministic point estimates to probabilistic estimates.
The SSCRH (pages 140-145) provides a detailed approach of a �“needs�” based allocation method proposed by Dr. Stephen Book. This method states that a WBS element�’s �“need�” for risk dollars arises out of the uncertainty in the cost of that WBS element, a quantitative description of that �“need�” should be the logical basis of the risk-dollar computation. In general, the more uncertain the cost is, the more risk dollars will be needed to cover a reasonable probability (e.g., 0.70) of being able to complete that element of the system. This methodology also states that inter-WBS-element correlations must be taken into account in order to properly allocate risk dollars back to the individual WBS elements.
Dr. Book�’s presentation, �“Allocating �‘Risk Dollars�’ Back to Individual Cost Elements�” provides a more in depth mathematical and graphical explanation of this method.
The AF CRUH provides guidance on the needs based method (pages 92-93) and another method of allocating risk dollars based on prorating of the risk dollars based on confidence level (pages 34-35). It also provides guidance on time phasing the allocated risk dollars (pages 36-37).

Cost Estim
atingC
ost Risk
Economic &
Supporting AnalysisC
areer Developm
ent Guide
Reference
Know
ledge Managem
entC
ost Estimating
Cost R
iskEconom
ic & Supporting Analysis
Career D
evelopment G
uideR
eferenceK
nowledge M
anagement
2008 NASA Cost Estimating Handbook Section 2. Cost Risk Approaches
Volume 2 Page 2-21
2.1.2 Formal Risk Assessment (FRISK)/Method of Moments The FRISK/Method of Moments method is an analytic statistical approximation technique. This method utilizes triangular distributions of inputs that approximate the total system using a lognormal distribution. It works by fitting the total-cost mean and standard deviation ("sigma value") to the formulas for the mean and standard deviation of a lognormal distribution and solving the simultaneous equations thereby established for the parameters of the underlying normal distribution. This method supports cost risk analysis by allowing the user to statistically sum WBS elements to obtain a probability distribution of total cost.
FRISK is based on two fundamental postulates:
1. The sum of a series of triangular probability distributions is a lognormal distribution. 2. There is pairwise Pearson correlation between cost elements.
The NAFCOM model utilizes the FRISK/Method of Moments method to calculate cost risk. Information pertaining to this methodology can be found in the NAFCOM model, the CRUH (page 96), and the Space Systems Cost Analysis Group (SSCAG) Space Systems Cost Risk Handbook, referred to in this volume as the SSCRH (pages 140-142, and page 156).
2.2 Simulation Approach The Simulation approach uses either a Monte Carlo or Latin Hypercube simulation to calculate numerous scenarios of a model by repeatedly picking random values from the input variable distributions for each "uncertain" variable and calculating the results. Typically, a simulation will consist of 2,500 to 10,000 iterations. The results of the simulation approach include risk-adjusted estimates and corresponding statistical estimate distributions. The estimate distributions provide the decision-maker with a range of possible outcomes with a minimum and maximum value or bounds. The SSCRH (pages 12-15 and 25-29) and the AF CRUH (page 5) provide an overview of the Simulation approach. Furthermore, the AF CRUH makes a distinction between an Inputs-Based Simulation approach (pages 7-20) and an Outputs-Based Simulation Approach (page 42). Commercially available products such as Crystal Ball, @Risk, and ACE have the capability to perform the Simulation approach.
The steps associated with the inputs based Simulation approach are described below:
2.2.1 Step 1 – Generate/Obtain Point Estimate As described in Section 2.1.1, the point estimate represents one possible estimate based on a given set of program characteristics. The credibility of any estimate is based on a realistic and complete technical, schedule and programmatic baseline. The point estimate serves as the reference point on which the cost risk analysis is based (AF CRUH page 2).
2.2.2 Step 2 – Quantify Cost Estimating Uncertainty The second step of the Simulation approach is to quantify the probability distributions by describing the modeling uncertainty of all cost estimating relationships (CERs), cost factors, and other estimating methods, and specifically the type of distribution (e.g., normal, triangular, lognormal, beta, etc.,) as well as the mean, standard deviation, and other statistical measures (see Figure 2-9). For example, if a regression-based CER is used, it has an associated SEE, confidence

Cost Estim
atingC
ost Risk
Economic &
Supporting AnalysisC
areer Developm
ent Guide
Reference
Know
ledge Managem
entC
ost Estimating
Cost R
iskEconom
ic & Supporting Analysis
Career D
evelopment G
uideR
eferenceK
nowledge M
anagement
2008 NASA Cost Estimating Handbook Section 2. Cost Risk Approaches
Volume 2 Page 2-22
intervals, and prediction intervals, any of which can be used to include cost estimating methodology risk in the estimate. Cost risks are those risks due to economic factors such as rate uncertainties, cost estimating errors, and statistical uncertainty inherent in the estimate.
Normal (100, 5.5)
X <= 05.4784.0%
X <= 94.5316.0%
0
1
2
3
4
5
6
7
8
85 90 95 100 105 110 115
Val
ues
x 10
^-2
< 16.0% 16.0% >68.0%
94.53 105.47
Normal (100, 5.5)
X <= 05.4784.0%
X <= 94.5316.0%
0
1
2
3
4
5
6
7
8
85 90 95 100 105 110 115
Val
ues
x 10
^-2
< 16.0% 16.0% >68.0%
94.53 105.47< 16.0% 16.0% >68.0%
Lognorm (10, 5.5)
X <= 4.6184.0%
X <= 5.2616.0%
0
0.02
0.04
0.06
0.08
0.1
0.12
-5 0 5 10 15 20 25 30 35
5.26 14.61< 16.0% 16.0% >68.0%
Lognorm (10, 5.5)
X <= 4.6184.0%
X <= 5.2616.0%
0
0.02
0.04
0.06
0.08
0.1
0.12
-5 0 5 10 15 20 25 30 35
5.26 14.61
Figure 2-9. Normal and Lognormal Distributions
There are many references to the various probability distributions that can be used to quantify cost estimating uncertainty including the SSCRH, which provides definitions, formulas and guidance on probability distributions on pages 16-24. The AF CRUH provides examples and guidance on measuring cost estimating uncertainty and probability distributions on pages 10-15. It also provides detailed guidance on measuring CER uncertainty on pages 97-105 in addition to providing statistical benchmarks for statistical measures such as the CV and measurements of estimating accuracy on pages 65-67. The Society of Cost Estimating and Analysis (SCEA) CostProf Regression Analysis training Module 8 provides definitions, formulas, and guidance on developing and assessing CERs. The training module also provides guidance on measuring error in CERs and using the quantified error in measuring cost estimating uncertainty.
2.2.3 Step 3 – Quantify Technical Risk The third step in the Simulation approach revolves around developing probability distributions for the technical and schedule cost drivers. The technical risk probability distributions (e.g., normal, triangular, lognormal, beta, etc.,) quantify the cost effects due to technical risks as well as provide the mean, standard deviation, and variance of the cost effects.
The distribution commonly used for characterizing technical risk is a triangular distribution shown in Figure 2-10. The triangular distribution is fairly simple to characterize since the cost-risk analyst only needs to produce three points: a reference point (sometimes called the �“most

Cost Estim
atingC
ost Risk
Economic &
Supporting AnalysisC
areer Developm
ent Guide
Reference
Know
ledge Managem
entC
ost Estimating
Cost R
iskEconom
ic & Supporting Analysis
Career D
evelopment G
uideR
eferenceK
nowledge M
anagement
2008 NASA Cost Estimating Handbook Section 2. Cost Risk Approaches
Volume 2 Page 2-23
likely�”), a pessimistic point and an optimistic point. A process called the Relative Risk Weighting approach (detailed in section 2.4) can be used to obtain and defend technical risk distributions. The subjective method of Elicitation (Expert Opinion) is another approach for quantifying technical risk. The AF CRUH provides (pages 15-17) provides guidance on this approach and also provides guidance on bounding subjective inputs when upper and lower limits are not available from Subject Matter Experts.
16.0% 16.0%68.0%
14.00 23.07
Triang (10, 15, 30)
X <= 14.0016.0%
X <= 23.0784.0%
0
0.02
0.04
0.06
0.08
0.1
0.12
5 10 15 20 25 30 35
Figure 2-10. Triangular Distribution Example
Both the cost estimating methodology cost-risk and the technical cost-risk distributions must be
accounted for in the final cost-risk distribution.6 Figure 2-11 shows the culmination of CER cost estimating and technical risk.
6 Graham, David R., �“Integrating Technical Cost-Risk with Cost Estimating Cost-Risk,�” Oct 1998.
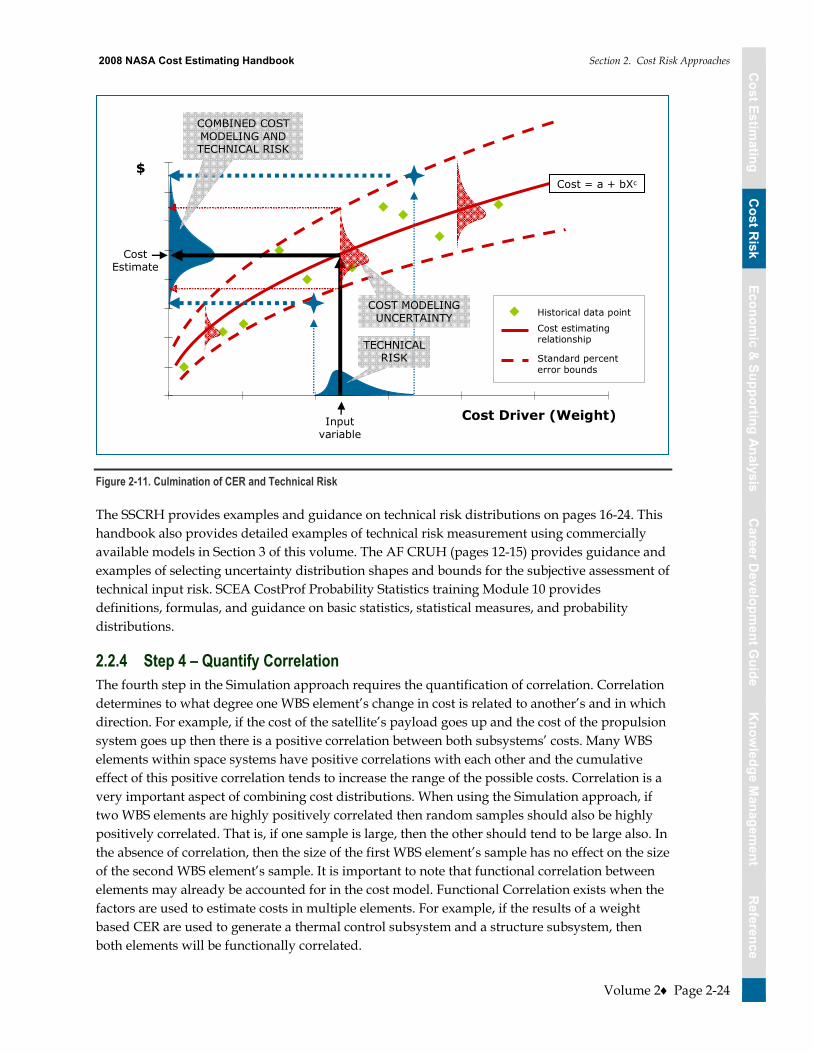
Cost Estim
atingC
ost Risk
Economic &
Supporting AnalysisC
areer Developm
ent Guide
Reference
Know
ledge Managem
entC
ost Estimating
Cost R
iskEconom
ic & Supporting Analysis
Career D
evelopment G
uideR
eferenceK
nowledge M
anagement
2008 NASA Cost Estimating Handbook Section 2. Cost Risk Approaches
Volume 2 Page 2-24
Cost Driver (Weight)Inputvariable
CostEstimate
$
Historical data point
Cost estimating relationship
Standard percent error bounds
Cost = a + bXc
COMBINED COST MODELING AND TECHNICAL RISK
TECHNICALRISK
COST MODELINGUNCERTAINTY
Figure 2-11. Culmination of CER and Technical Risk
The SSCRH provides examples and guidance on technical risk distributions on pages 16-24. This handbook also provides detailed examples of technical risk measurement using commercially available models in Section 3 of this volume. The AF CRUH (pages 12-15) provides guidance and examples of selecting uncertainty distribution shapes and bounds for the subjective assessment of technical input risk. SCEA CostProf Probability Statistics training Module 10 provides definitions, formulas, and guidance on basic statistics, statistical measures, and probability distributions.
2.2.4 Step 4 – Quantify Correlation The fourth step in the Simulation approach requires the quantification of correlation. Correlation determines to what degree one WBS element�’s change in cost is related to another�’s and in which direction. For example, if the cost of the satellite�’s payload goes up and the cost of the propulsion system goes up then there is a positive correlation between both subsystems�’ costs. Many WBS elements within space systems have positive correlations with each other and the cumulative effect of this positive correlation tends to increase the range of the possible costs. Correlation is a very important aspect of combining cost distributions. When using the Simulation approach, if two WBS elements are highly positively correlated then random samples should also be highly positively correlated. That is, if one sample is large, then the other should tend to be large also. In the absence of correlation, then the size of the first WBS element�’s sample has no effect on the size of the second WBS element�’s sample. It is important to note that functional correlation between elements may already be accounted for in the cost model. Functional Correlation exists when the factors are used to estimate costs in multiple elements. For example, if the results of a weight based CER are used to generate a thermal control subsystem and a structure subsystem, then both elements will be functionally correlated.

Cost Estim
atingC
ost Risk
Economic &
Supporting AnalysisC
areer Developm
ent Guide
Reference
Know
ledge Managem
entC
ost Estimating
Cost R
iskEconom
ic & Supporting Analysis
Career D
evelopment G
uideR
eferenceK
nowledge M
anagement
2008 NASA Cost Estimating Handbook Section 2. Cost Risk Approaches
Volume 2 Page 2-25
Correlations between WBS elements (Step 4) must be accounted for in the combining of cost estimating (Step 2) and technical cost-risk distributions (Step 3). Commercial Monte Carlo simulation models such as @RISK and Crystal Ball contain the capability to apply correlation during the statistical summing of a project�’s WBS element cost-risk distributions. The correlation values between all WBS elements that are estimated using CERs and other methods can range from NO correlation, MILD correlation, to HIGH correlation, for example: NONE: r = 0, MILD: r = ±0.2, MODERATE: r = ± 0.6, HIGH: r = ± 0.8. The thought to keep in mind is that correlation affects the overall cost variance.
The NASA cost analyst must provide the correlation values to the simulation models. This value can be derived using a variety of methods.
A subjective method for deriving correlation values is to develop approximate correlation coefficients between WBS elements. This can be as simple as determining whether two WBS elements are correlated by a small amount, or by a large amount, and whether that correlation is positive or negative. For example, if you believe two WBS elements have a small amount of positive correlation, then you would choose a correlation value of 0.3. It is then necessary to follow documented procedures within the Monte Carlo simulation software to produce the desired correlations in your cost estimate (SSCRH page 15).
Table 2-1. Subjective Correlation Coefficients (SSCAG Space Systems Cost Risk Handbook page 15)
Positive
Correlation Negative
Correlation
Uncorrelated 0 0
Small Amount of Correlation 0.3 -0.3
Large Amount of Correlation 0.75 -0.75
The SSCRH provides an overview and guidance on a method that quantifies correlation values by deriving the empirical residual correlation coefficients of a cost model. This method however requires the exclusive use of a specific cost model and to the model�’s CERs, and all the data used to derive the CERs. (SSCRH pages 137-139). It also provides an overview of correlation that provides summary of methods, types of correlations and case studies that outline the effects of correlation and the effects of misinterpreting correlation (SSCRH pages 14-15, 114-119).
The CRUH provides an overview of correlation on pages 23-25. This overview defines the different types of correlation and guidance on how to measure correlation using @Risk & Crystal Ball (Spearman Rank) and Excel�’s CORREL formula (Pearson Product Moment) as well as metrics for measuring correlation adequacy. The handbook also provides detailed guidance on the types of correlation and formulas pertaining to the Pearson correlation coefficient and the Spearman Rank Order Correlation (AF CRUH pages 70-72).
Stephen Book�’s presentation entitled, �“A Theory of Modeling Correlations for Use in Cost-Risk Analysis�” provides an approach that quantifies correlation values for WBS elements based on the relationship of the elements�’ Standard Error (as a percent of their point estimate), the Percentage of New Technology in the element, and an assumed cost growth sensitivity factor.

Cost Estim
atingC
ost Risk
Economic &
Supporting AnalysisC
areer Developm
ent Guide
Reference
Know
ledge Managem
entC
ost Estimating
Cost R
iskEconom
ic & Supporting Analysis
Career D
evelopment G
uideR
eferenceK
nowledge M
anagement
2008 NASA Cost Estimating Handbook Section 2. Cost Risk Approaches
Volume 2 Page 2-26
2.2.5 Step 5 – Run Simulation Running the simulation model is the fifth step in the process. The cost analyst will set up and run the cost estimate in a Monte Carlo/Latin Hypercube framework (e.g., Crystal Ball , @RISK ) that incorporates cost estimating, technical and correlation risk. This will result in a cumulative distribution function from which an appropriate (e.g., 70th) percentile can be easily identified.
The simulation will run iterations on the cost estimating and technical input uncertainty in conjunction with the correlation values to calculate element cost-risk distributions and statistically sum all the WBS elements to arrive at a probabilistic range of the potential cost for the program. Figure 2-12 illustrates the results of a statistical summation process normally performed by the simulation.
GFE
1.6
1.4.3
1.4.2
1.4.1
1.3
1.2.2
1.2.1
1.1
WBSTheme
Segment(Launch, Space, Ground)
Forms a Probability
Distribution for EMD &LCCCosts for a
Project
Figure 2-12. Statistical Summation Process Results (SSCAG Space Systems Cost Risk Handbook page 14)
2.2.6 Step 6 – Assess Risk Dollars/Unallocated Future Expense Risk dollars represented as Unallocated Future Expense (UFE) at NASA is defined to be the difference between the 70th percentile and the �“as specified�” project cost (e.g., arithmetic sum of WBS element reference point, deterministic cost estimates) and represents the estimate of �“risk dollars.�” Risk dollars can be allocated downward to any level of WBS using a variety of approaches that are summarized in the next step. The most recent version of NAFCOM incorporates such a risk dollar allocation algorithm. The derivation of risk dollars for planning purposes begins with the probabilistic cost estimate range. As possible cost impacts due to estimation, technical, programmatic, and dependency risks are incorporated into the cost estimate, the UFE at the LCC level is identified. This UFE is quantified as the difference between the arithmetic sum of the WBS reference point estimates and the cost at the 70th percentile level of confidence. The 70th percentile level is chosen due to the NASA corporate UFE requirement for a

Cost Estim
atingC
ost Risk
Economic &
Supporting AnalysisC
areer Developm
ent Guide
Reference
Know
ledge Managem
entC
ost Estimating
Cost R
iskEconom
ic & Supporting Analysis
Career D
evelopment G
uideR
eferenceK
nowledge M
anagement
2008 NASA Cost Estimating Handbook Section 2. Cost Risk Approaches
Volume 2 Page 2-27
not-to exceed 80th percentile Mission Directorate -level UFE. If each project within a Mission Directorate is budgeted at the 80th percentile level the Mission Directorate UFE will be statistically equivalent to approximately 96th percentile level, which is unacceptable from a Congressional appropriation request perspective.
2.2.7 Step 7 – Allocate Risk Dollars to the WBS As stated in step 6 above, risk dollars are defined as the difference between a specific confidence level and the point estimate (arithmetic sum of WBS element reference point, deterministic cost estimates). The analyst will need to be able to allocate the risk dollars to the lower level WBS elements in order to move the WBS elements�’ deterministic point estimates to probabilistic estimates. There are several existing methodologies to assist the analyst in allocating risk dollars, including the most recent version of NAFCOM which incorporates a risk dollar allocation algorithm.
The SSCRH (pages 140-145) provides a detailed approach of a �“needs�” based allocation method proposed by Dr. Stephen Book. This method states that a WBS element�’s �“need�” for risk dollars arises out of the uncertainty in the cost of that WBS element, a quantitative description of that �“need�” should be the logical basis of the risk-dollar computation. In general, the more uncertain the cost is, the more risk dollars will be needed to cover a reasonable probability (e.g., 0.70) of being able to complete that element of the system. This methodology also states that inter-WBS-element correlations must be taken into account in order to properly allocate risk dollars back to the individual WBS elements.
Dr. Book�’s presentation, �“Allocating �‘Risk Dollars�’ Back to Individual Cost Elements�” provides a more in depth mathematical and graphical explanation of this method.
The AF CRUH provides guidance on the needs based method (page 91-92) and another method of allocating risk dollars based on prorating of the risk dollars based on confidence level (pages 34-35). It also provides guidance on time phasing the allocated risk dollars (pages 36-38).
2.3 Hybrid Scenario Based Approach Another cost estimating approach combines scenario-based identification and assessment of the specific risk scenarios with probabilistic analysis of the cost-risk consequences that may occur to create a risk-adjusted cost estimate. This cost-risk assessment and analysis approach also provides the "common language" for cost estimators, project managers and risk managers when they try to determine cost-risk quantification.
2.3.1 Step 1 – Develop Reference Estimate To utilize the Hybrid Scenario-based estimating approach, the cost estimator must first develop the reference point cost estimate by using an analogy, bottoms up, or parametric approach. Then, the cost estimator must identify all the risks that pose a threat to a project, identify the likelihood of each risk's occurrence within relevant Work Breakdown Structure (WBS) elements, and assess their cost consequences. Ideally, the cost estimator will have access to engineering subject matter experts (SMEs) who, through their experience with similar project risks, can assist with risk identification, cost consequence assessment, and determination of the likelihood of these risks occurring.

Cost Estim
atingC
ost Risk
Economic &
Supporting AnalysisC
areer Developm
ent Guide
Reference
Know
ledge Managem
entC
ost Estimating
Cost R
iskEconom
ic & Supporting Analysis
Career D
evelopment G
uideR
eferenceK
nowledge M
anagement
2008 NASA Cost Estimating Handbook Section 2. Cost Risk Approaches
Volume 2 Page 2-28
2.3.2 Step 2 – Develop Risk Matrix After estimating a potential cost consequence for each risk, the cost estimator then employs the traditional 5X5 likelihood versus consequence risk matrix paradigm to qualitatively array low, medium and high risks (see Figure 2-13 below). Risk management personnel (not necessarily cost estimators) generally use this approach to qualitatively assess risk impacts but stop short of the quantification necessary to utilize these results in a cost estimate.
Consequence5 Additional resources > 10%4 Additional resources = 7-10% 3 Additional resources = 5-7%2 Additional resources < 5%1 Minimal or no impact
OPP Potential cost savings (added to matrix for this exercise)
* Note: As taken from Risk Management Guide for DoD Acquisition
Identified risks span the full range of the standard risk matrix.
Level Likelihood of Occurrence1 Remote (10%)2 Unlikely (30%)3 Likely (50%)4 Highly likely (70%)5 Near certainty (90%)
Con
sequ
ence
Likelihood
5
4
3
2
1
OPP
5
4
3
2
1
OPP
001100
002011
101421
214220
100442
001100
002011
101421
214220
100442
1 2 3 4 51 2 3 4 5
118
13
4
36
Medium =Low =
High =
Opportunities =
Total Risks =
Figure 2-13. 5X5 Risk Matrix
2.3.3 Step 3 – Run Simulation Extending this approach, the cost estimator then employs a Monte Carlo simulation to produce a distribution of cost-risk impact that identify confidence levels associated with each cost value in the range of a cost-risk distribution.
Using the qualitative results produced above, the cost estimator can apply a random number generator on a range from 0 to 1 in a Monte Carlo simulation using a uniform distribution that produces random draws to simulate the likelihood of risks occurring. Each simulation's result is used to identify which risks might occur and sum the cost consequences for each such identified risk with a likelihood value of equal to or less than the random number generated.
The rule for including the cost consequences is that if the random draw produces a number equal to or less than the subjective likelihood of that risk occurring then add 100% of its cost consequence, otherwise, if the random draw produces a number higher than the likelihood, its cost consequence is not added. This rule assures that the cost consequences are included in the final distribution in accordance with the engineering SMEs�’ assessments of the likelihood that those risks will occur.

Cost Estim
atingC
ost Risk
Economic &
Supporting AnalysisC
areer Developm
ent Guide
Reference
Know
ledge Managem
entC
ost Estimating
Cost R
iskEconom
ic & Supporting Analysis
Career D
evelopment G
uideR
eferenceK
nowledge M
anagement
2008 NASA Cost Estimating Handbook Section 2. Cost Risk Approaches
Volume 2 Page 2-29
For example, if the likelihood for a risk is 80% and its cost consequence is $5M, then the $5M would be included in the addition for each draw that was 0.8 or less. If the draw produces a likelihood of 0.9, no cost would be included for that risk. For another random draw, if the likelihood of a risk was 30% and its cost consequence was $10M, then the $10M would be added for the number of draws that were 0.3 or less. If the draw is 0.7, then no cost consequence is included during that simulation for that risk. This process is repeated up to the total number of the simulations to construct a risk consequence probability density function. This cost-risk distribution, which represents the potential dollars to be added for risk, would then be convolved with the WBS element estimating methodology uncertainty distributions in an additive fashion to arrive at a combined distribution representing a summary cost-risk distribution for protecting against the occurrences of the risks at different levels of confidence. Of course, correlations between the WBS elements and the scenario-based cost-risk distribution would be specified to ensure an optimally credible total cost estimate distribution from which a cost estimate confidence level value can be selected for budgeting. Figure 2-14 illustrates this process.
Estimate LikelihoodRemoteUnlikelyLikelyVery LikelyNear Certainty
Con
sequ
ence
Likelihood
5
4
3
2
1
MLLLL
HMMLL
HHMML
HHHML
HHHHM
5
4
3
2
1
MLLLL
HMMLL
HHMML
HHHML
HHHHM
1 2 3 4 51 2 3 4 5
Run 10,000 iterations
Develop Cumulative Distribution
0%
10%
20%
30%
40%
50%
60%
70%
80%
90%
100%
$- $25 $50 $75 $100 $125 $150 $175 $200 $225 $250 $275 $300
Additional Cost Over Baseline (FY07$M)
Perc
ent L
ikel
ihoo
d of
Com
ing
in o
n Bu
dget
(%)
5x5 Risk DistributionBest CaseMost Likely ScenarioWorst Case Scenario
Estimate Consequence– WBS, Months delay,
Phase of Delay– WBS % Increase in NRE,
RE or both– Convert both to $
Identify Discrete RisksRisk #1Risk #2Risk #3…
N = 1
Max. # Risks
MC Draw <Likelihood
No consequence
Fullconsequence
Yes
No
Figure 2-14. 5x5 Matrix Cost Risk Conversion Process Summary
2.3.4 Summary While this is not the only way a scenario-based cost estimate can be performed, it is unique in that it allows for the analysis of all potential combinations of scenarios simultaneously after the specification of unique scenarios.

Cost Estim
atingC
ost Risk
Economic &
Supporting AnalysisC
areer Developm
ent Guide
Reference
Know
ledge Managem
entC
ost Estimating
Cost R
iskEconom
ic & Supporting Analysis
Career D
evelopment G
uideR
eferenceK
nowledge M
anagement
2008 NASA Cost Estimating Handbook Section 2. Cost Risk Approaches
Volume 2 Page 2-30
For example, a specific scenario may be the substitution of nickel-hydrogen batteries for lithium-ion batteries. Lithium-ion batteries are lighter and produce more power per pound but the technology is not mature. So, if the expected lithium-ion development and production does not materialize, the cost consequences of the substitution would require the specific changes due to the necessary changes in battery weight, structure weight, accommodation for electrical power processing changes, etc., for substituting nickel-hydrogen batteries for lithium-ion batteries. A new cost estimate would be made that took these specific changes into account. However, only two estimates would then be produced, the one with the lithium-ion batteries and the alternative with the nickel-hydrogen and no evaluation of the confidence level would be available. Additionally, other potential risks not identified in this battery-specific scenario are not being considered.
The potential number of costed risk scenarios can quickly become astronomical both in time and if all combinations are distinctly costed. However, this one specific scenario variation described above would be implicitly included within the analysis of the Hybrid Scenario-Based estimate as part of the Monte Carlo simulation. It would be among the total combination of identified risk scenarios that could occur due to its likelihood and cost consequence being selected in one (or many) of the random draws and its cost consequence would be included within one of the values along with others in the cost-risk distribution range associated with a given confidence level.
2.4 Integrated Risk Management Integrated Risk Management is a fully mature management capability that employs an array of proven best practices that capitalize upon and integrate traditional programmatic items such as cost estimates, WBS, schedules, risk assessments, technical requirements, and performance measures. Integrated Risk Management is an innovative approach to delivering integrated, actionable information for a timely response to the persistent questions:
�• Which technical solution? �• Are the goals too aggressive? �• What�’s driving program cost? �• What is my risk exposure? �• Do I have adequate cost risk dollars? �• Which mitigation plans are best?
Originally developed in response to cost and schedule growth trends in the space acquisition community, Integrated Risk Management provides benefits for a wide range of applications at the project, program, and portfolio level.
2.4.1 Integrated Risk Management Process It useful to view the Integrated Risk Management process as progressing through three phases, each of which has it own benefits while providing a foundation for follow-on efforts.
�• Risk Process Enhancement: Working closely with technical and programmatic decision makers, quantitative risk impact definitions can be developed that are aligned with the program�’s risk tolerance levels. This ensures that the leadership�’s guidance is well

Cost Estim
atingC
ost Risk
Economic &
Supporting AnalysisC
areer Developm
ent Guide
Reference
Know
ledge Managem
entC
ost Estimating
Cost R
iskEconom
ic & Supporting Analysis
Career D
evelopment G
uideR
eferenceK
nowledge M
anagement
2008 NASA Cost Estimating Handbook Section 2. Cost Risk Approaches
Volume 2 Page 2-31
communicated to all program staff and replaces subjective risk scoring practices with �“facts based�” scores that can be tested for validity
�• Risk Impact Analysis: Risks are mapped to program activities and cost accounts through the WBS (Figure 2-15). This allows a quantitative analysis of risk impacts on cost and schedule baselines, produces a way of mapping risks to schedule tasks and cost accounts that improves both analysis and communication, and imposes structure that allows a direct comparison to previous baselines as the program matures
�• Mitigation Effectiveness Analysis: Mitigation plans are developed and then compared in a rigorous fashion for effectiveness in reducing overall risk exposure. This ensures that the application of mitigation resources is optimized to reduce program risk exposure most effectively
WBS# WBS Element Com
ms
Con
curr
ency
Cos
t
Des
ign
Dev
elop
er
Logi
stic
s
M&
S
Mgm
t
Perf
orm
ance
Prod
uctio
n
Req
uire
men
ts
Sch
edul
e
T&E
Tech
nolo
gy
Thre
at
Tota
l
1.0 Prog Mgmt 1 1
2.0 Network 1 1 1 3
3.0 Mission 2 1 1 1 5
4.0 Ground 4 1 1 6
4.1 GSE 3 3
4.2 Program Management 1 1
4.3 Subcontractor 2 3 1 1 2 2 1 1 12
4.4 TT&C 2 1 2 1 1 7
4.5 Communications
50 Launch 1 2
6.0 Space PMO
7.0 Space SEIT 1 1
8.0 Bus 1 5 2 2 2 1 1 2 1 3 29
9.0 Payload 5 5 10
10.0 Spacecraft AI&T 1 1 1 1 4
TOTAL 3 8 11 8 3 9 3 16 7 7
Figure 2-15. Program Activities/Risks Map
2.4.2 Integrated Risk Management: Information, Not Just Data Program and project managers are often overwhelmed by an abundance of data when what is truly needed is actionable information. Integrated Risk Management process outputs have been adapted to a wide array of presentation formats to provide ease of comprehension and enhanced decision making ability. Particular products that have been used successfully include WBS Mapping, Risk Adjusted Cost (RAC), Risk Adjusted Schedule (RAS) and Sensitivity Analysis. The WBS Mapping provides a concise way to demonstrate where risks are grouped �– highlighting both where additional attention should be focused due to large concentration of risks and where the absence of identified risk may warrant further investigation.
As shown in Figure 2-16, the RAC displays, in a concise format, the uncertainty in a program�’s initial cost estimate, the impact of risk, and the benefits of mitigation. The RAS provides the same information for program duration and provides an independent check of cost realism. Sensitivity
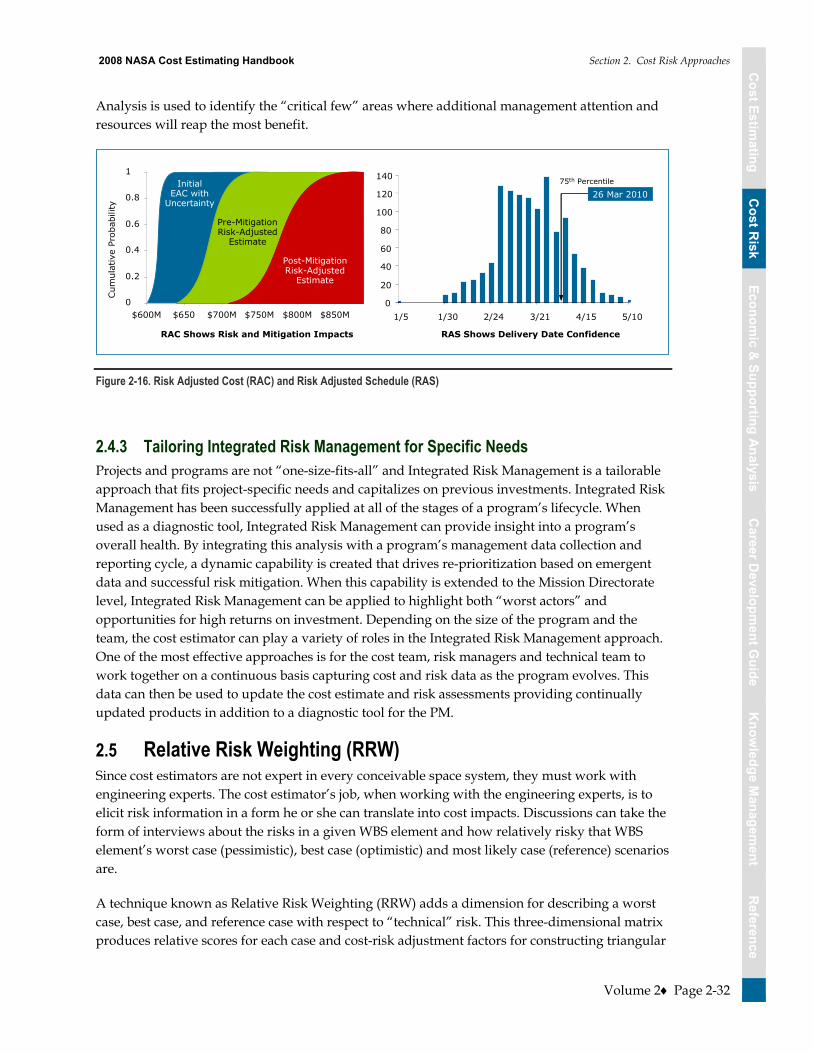
Cost Estim
atingC
ost Risk
Economic &
Supporting AnalysisC
areer Developm
ent Guide
Reference
Know
ledge Managem
entC
ost Estimating
Cost R
iskEconom
ic & Supporting Analysis
Career D
evelopment G
uideR
eferenceK
nowledge M
anagement
2008 NASA Cost Estimating Handbook Section 2. Cost Risk Approaches
Volume 2 Page 2-32
Analysis is used to identify the �“critical few�” areas where additional management attention and resources will reap the most benefit.
RAS Shows Delivery Date ConfidenceRAC Shows Risk and Mitigation Impacts
75th Percentile
Cum
ulat
ive
Prob
abili
ty
0
0.2
0.4
0.6
0.8
1
$600M $650 $700M $750M $800M $850M
Initial EAC with
Uncertainty
Post-Mitigation Risk-Adjusted
Estimate
Pre-MitigationRisk-Adjusted
Estimate
0
20
40
60
80
100
120
140
1/5 1/30 2/24 3/21 4/15 5/10
26 Mar 2010
Figure 2-16. Risk Adjusted Cost (RAC) and Risk Adjusted Schedule (RAS)
2.4.3 Tailoring Integrated Risk Management for Specific Needs Projects and programs are not �“one-size-fits-all�” and Integrated Risk Management is a tailorable approach that fits project-specific needs and capitalizes on previous investments. Integrated Risk Management has been successfully applied at all of the stages of a program�’s lifecycle. When used as a diagnostic tool, Integrated Risk Management can provide insight into a program�’s overall health. By integrating this analysis with a program�’s management data collection and reporting cycle, a dynamic capability is created that drives re-prioritization based on emergent data and successful risk mitigation. When this capability is extended to the Mission Directorate level, Integrated Risk Management can be applied to highlight both �“worst actors�” and opportunities for high returns on investment. Depending on the size of the program and the team, the cost estimator can play a variety of roles in the Integrated Risk Management approach. One of the most effective approaches is for the cost team, risk managers and technical team to work together on a continuous basis capturing cost and risk data as the program evolves. This data can then be used to update the cost estimate and risk assessments providing continually updated products in addition to a diagnostic tool for the PM.
2.5 Relative Risk Weighting (RRW) Since cost estimators are not expert in every conceivable space system, they must work with engineering experts. The cost estimator�’s job, when working with the engineering experts, is to elicit risk information in a form he or she can translate into cost impacts. Discussions can take the form of interviews about the risks in a given WBS element and how relatively risky that WBS element�’s worst case (pessimistic), best case (optimistic) and most likely case (reference) scenarios are.
A technique known as Relative Risk Weighting (RRW) adds a dimension for describing a worst case, best case, and reference case with respect to �“technical�” risk. This three-dimensional matrix produces relative scores for each case and cost-risk adjustment factors for constructing triangular
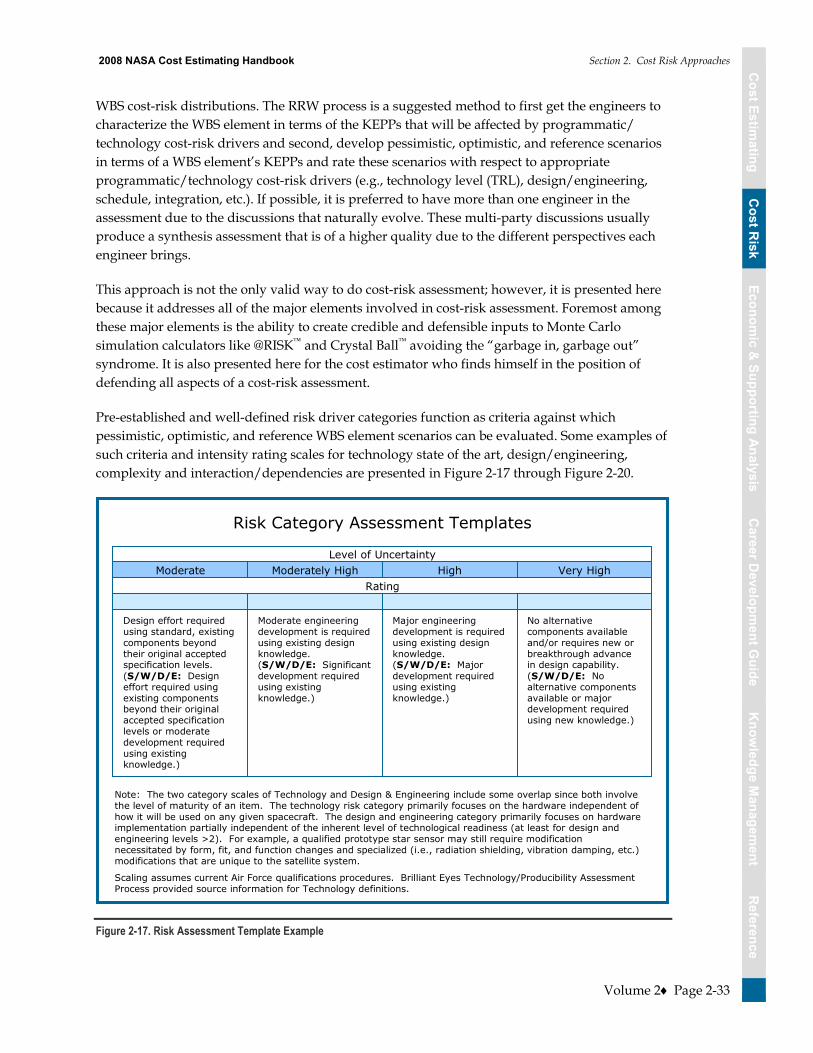
Cost Estim
atingC
ost Risk
Economic &
Supporting AnalysisC
areer Developm
ent Guide
Reference
Know
ledge Managem
entC
ost Estimating
Cost R
iskEconom
ic & Supporting Analysis
Career D
evelopment G
uideR
eferenceK
nowledge M
anagement
2008 NASA Cost Estimating Handbook Section 2. Cost Risk Approaches
Volume 2 Page 2-33
WBS cost-risk distributions. The RRW process is a suggested method to first get the engineers to characterize the WBS element in terms of the KEPPs that will be affected by programmatic/ technology cost-risk drivers and second, develop pessimistic, optimistic, and reference scenarios in terms of a WBS element�’s KEPPs and rate these scenarios with respect to appropriate programmatic/technology cost-risk drivers (e.g., technology level (TRL), design/engineering, schedule, integration, etc.). If possible, it is preferred to have more than one engineer in the assessment due to the discussions that naturally evolve. These multi-party discussions usually produce a synthesis assessment that is of a higher quality due to the different perspectives each engineer brings.
This approach is not the only valid way to do cost-risk assessment; however, it is presented here because it addresses all of the major elements involved in cost-risk assessment. Foremost among these major elements is the ability to create credible and defensible inputs to Monte Carlo simulation calculators like @RISK and Crystal Ball avoiding the �“garbage in, garbage out�” syndrome. It is also presented here for the cost estimator who finds himself in the position of defending all aspects of a cost-risk assessment.
Pre-established and well-defined risk driver categories function as criteria against which pessimistic, optimistic, and reference WBS element scenarios can be evaluated. Some examples of such criteria and intensity rating scales for technology state of the art, design/engineering, complexity and interaction/dependencies are presented in Figure 2-17 through Figure 2-20.
Note: The two category scales of Technology and Design & Engineering include some overlap since both involve the level of maturity of an item. The technology risk category primarily focuses on the hardware independent of how it will be used on any given spacecraft. The design and engineering category primarily focuses on hardware implementation partially independent of the inherent level of technological readiness (at least for design and engineering levels >2). For example, a qualified prototype star sensor may still require modification necessitated by form, fit, and function changes and specialized (i.e., radiation shielding, vibration damping, etc.) modifications that are unique to the satellite system.
Scaling assumes current Air Force qualifications procedures. Brilliant Eyes Technology/Producibility Assessment Process provided source information for Technology definitions.
Moderate Moderately High High Very HighRating
Level of Uncertainty
Design effort required using standard, existing components beyond their original accepted specification levels. (S/W/D/E: Design effort required using existing components beyond their original accepted specification levels or moderate development required using existing knowledge.)
Moderate engineering development is required using existing design knowledge. (S/W/D/E: Significant development required using existing knowledge.)
Major engineering development is required using existing design knowledge. (S/W/D/E: Major development required using existing knowledge.)
No alternative components available and/or requires new or breakthrough advance in design capability. (S/W/D/E: No alternative components available or major development required using new knowledge.)
Risk Category Assessment Templates
Figure 2-17. Risk Assessment Template Example

Cost Estim
atingC
ost Risk
Economic &
Supporting AnalysisC
areer Developm
ent Guide
Reference
Know
ledge Managem
entC
ost Estimating
Cost R
iskEconom
ic & Supporting Analysis
Career D
evelopment G
uideR
eferenceK
nowledge M
anagement
2008 NASA Cost Estimating Handbook Section 2. Cost Risk Approaches
Volume 2 Page 2-34
Moderate Moderately High High Very HighRating
Level of Uncertainty
A brassboard example has been fabricated and tested for performance and qualifications. (S/W Tech: Critical algorithms, functions, and characteristics demonstrated by a prototype).
Critical functions/ characteristics have been demonstrated by a brassboard example. (S/W Tech: Conceptual design formulated and tested for performance considerations; proof of principle completed.
Conceptual design formulated and tested for performance and qualification considerations. (S/W Tech: Conceptual design formulated.)
Scientific research is required and ongoing. (S/W Tech: Scientific research ongoing, new algorithm concept needed.)
Risk Category Assessment Templates
Cost-Risk Driver Category Very Low Low Moderately LowRating
Level of Uncertainty
Technology: Uncertainties to system performance due to reliance on the availability and promise of technology. Technology uncertainty includes the required level of technological sophistication and reflects the current stage of hardware development and testing maturity. Hardware maturity ranges from scientific research, conceptual design, brassboard, breadboard, prototype, to an operational unit. Technology risk analysis is performed at the subsystem or lower (e.g., assembly) level. (S/W: Uncertainties due to availability and status of concepts and algorithms required to satisfy system performance. Technology uncertainty includes the current stage of concept and algorithm development and testing maturing. Maturity ranges from scientific research, conceptual design, proof of principle complete4d, prototype built, to operational. Technology risk is performed at the software item level or lower level.)
Hardware is currently operational and deployed. (S/W Tech: S/W is currently operational and deployed.)
Hardware is in limited production and has passed all acceptance tests. (S/W Tech: Software successfully implemented, requires qualification.)
Prototype is currently in qualification tests, but has passed performance requirements. (S/W Tech: A prototype has been built and meets program requirements.)
Figure 2-18. Design & Engineering Risk Template Example7
7 Other rating scales exist, e.g., Maxwell Risk Matrix

Cost Estim
atingC
ost Risk
Economic &
Supporting AnalysisC
areer Developm
ent Guide
Reference
Know
ledge Managem
entC
ost Estimating
Cost R
iskEconom
ic & Supporting Analysis
Career D
evelopment G
uideR
eferenceK
nowledge M
anagement
2008 NASA Cost Estimating Handbook Section 2. Cost Risk Approaches
Volume 2 Page 2-35
Moderate Moderately High High Very HighRating
Level of Uncertainty
Significant number of parts/processes making up the whole and moderate complexity in making the combinations.
Significant number of parts/processes making up the whole and some new parts required and higher complexity in making the combinations.
Significant number of parts/processes and almost totally new parts/processes and high complexity in making the combinations.
Very large number of parts/processes totally new parts/processes and very high complexity with much uncertainty in in making the combinations.
Risk Category Assessment Templates
Cost-Risk Driver Category Very Low Low Moderately LowRating
Complexity: Degrees of uncertainties due to combining parts/processes to make up the whole.
Very simple combinations and/or not very many parts/ processes making up the whole.
Simple combinations; only a few parts and processes making up the whole.
Fair amount of parts/processes making up the whole with somewhat complex combinations.
Level of Uncertainty
Figure 2-19. Complexity Risk Template Example
Moderate Moderately High High Very HighRating
Level of Uncertainty
Dependent on three external interfaces.
Dependent on four external interfaces.
Dependent on five external interfaces.
Dependent on more than five external interfaces.
Risk Category Assessment Templates
Cost-Risk Driver Category Very Low Low Moderately LowRating
Interaction/Dependencies: Degrees of uncertainties due to dynamic interplay between and among external interfaces (e.g., gimball with P/L, EPS, thrusters, etc.)
Completely independent of external interfaces.
Dependent on external interface.
Dependent on two external interfaces.
Level of Uncertainty
Figure 2-20. Interaction/Interdependency Template Example
It is important to note that not all WBS elements need to be rated against technology state of the art, design/engineering, complexity or interaction/dependencies rating scales. The general rule is that whatever cost-risk driver categories are relevant to the WBS element being rated are the

Cost Estim
atingC
ost Risk
Economic &
Supporting AnalysisC
areer Developm
ent Guide
Reference
Know
ledge Managem
entC
ost Estimating
Cost R
iskEconom
ic & Supporting Analysis
Career D
evelopment G
uideR
eferenceK
nowledge M
anagement
2008 NASA Cost Estimating Handbook Section 2. Cost Risk Approaches
Volume 2 Page 2-36
ones that should be used. This may involve developing different risk driver categories such as integration, schedule, manufacturing, etc., with associated definitions for both the cost-risk driver and the intensity scales used to rate the degree of risk level involved for the pessimistic, optimistic, and reference scenarios. Cost-risk driver templates are the foundation for the interactions between the cost estimators and engineers in determining risk levels in each risk scenario for later use in quantifying their cost impacts.
The risk scores for each WBS element risk scenario are developed by first deriving weights for both the risk driver categories and the rating scale intensities (e.g., very high or medium low etc.). A useful technique for deriving the weights for both risk driver categories and rating scale intensities is the application of the Analytic Hierarchy Process (AHP)8,910 Weights resulting from the AHP are ratio-scale weights, that is, they have a meaningful zero point and thus have the integrity for use in all mathematical operations. The same cannot be said of ordinal or even interval level numbers.11, 12 The scores result from the sum of the products of each risk category weight and each rating scale intensity weight.
The RRW process involves creating pessimistic, optimistic, and reference risk profiles for a CER-driving parameter (e.g., weight). The application of the resulting RRW ratios to the nominal (reference) parameter value from the CADRe reflects the parameter�’s potential range of values (see Figure 2-21). When this range of values is entered into the CER, a range of costs is produced that adds to the cost range driven by the uncertainty inherent within the CER itself.
8 John R. Canada, William G. Sullivan; �“Economic and Multivariate Evaluation of Advanced Manufacturing Systems. 9 Michele A. Maurino, James T. Luxøj; �“Analysis of a Group Decision Support System (GDSS) for Aviation Safety Risk Evaluation. 10 Standard Practice for Asset Utility, Designation E 2495-06 �– ASTM International. 11 Forman, Ernest H., Doctor of Science; (George Washington University/Expert Choice Inc.), �“Key Topics and Concepts Relating to
the Analytic Hierarchy Process�”, paragraph 10, �“Essential Concept: Numeric Scales�”; Team Expert Choice Training, Feb 1998. 12 Pariseau, Richard Dr.; Oswalt, Ivar Dr.; �“Using Data Types and Scales for Analysis and Decision Making�”;DSMC Acquisition
Review Quarterly, Spring 1994.

Cost Estim
atingC
ost Risk
Economic &
Supporting AnalysisC
areer Developm
ent Guide
Reference
Know
ledge Managem
entC
ost Estimating
Cost R
iskEconom
ic & Supporting Analysis
Career D
evelopment G
uideR
eferenceK
nowledge M
anagement
2008 NASA Cost Estimating Handbook Section 2. Cost Risk Approaches
Volume 2 Page 2-37
RRW
Create Parameter Reference Point Scaling Ratios
TECHNOLOGY DES/ENG COMPLEXITY SCHEDULE
0.048
Mod
Mod
Low
0.237
High
Mod
Moderate
0.441
Very High
Mod
Mod Low
0.278
High
Mod High
Low
WBS ELEMENT PROFILES
1. Pessimistic Parameter Profile
2. Reference Parameter Profile (Card)
3. Optimistic Parameter Profile
TOTAL
1.00
0.180
0.140
0.034
OPTIMISTIC “SCORE”“REFERENCE SCORE”
=0.0340.140
= 0.24 = LOW END RISK FACTOR FORREFERENCE PARAMETER
PESSIMISTIC “SCORE”“REFERENCE SCORE”
=0.1800.140
= 1.30 = HIGH END RISK FACTOR FORREFERENCE PARAMETER
These factors are then applied to the RPE to obtain the “low and high end” costs
Apply the CER with 3 parameter values
to get costs
0.24 * RefParameter
ReferenceParameter
1.30 * RefParameter
OptimisticCost
ReferenceCost
PessimisticCost
Figure 2-21. Reference Parameter Values
2.6 Discrete Risk Analysis Discrete Risk Analysis for programmatic/technical costs involves identifying and estimating specific cost-driving risks. Instead of probabilistic distributions and Monte Carlo simulations, however, the mitigation costs for these risks are estimated based on their probabilities of manifesting discrete changes in the technical parameters (e.g., increased component mass or power regulation) and cost results compared to probabilistic cost results.
The CRUH (pages 18-19) provides two methods for quantifying discrete risks and provides specific examples using commercially available tools on pages 124, 141, and 157. It also provides plans for accounting for risk mitigation on page 32 and presenting risk mitigation costs on page 39. The SSCAG Space Systems Cost Risk Handbook provides issues and pitfalls associated with Discrete Risk Analysis and guidance on how to avoid them on pages 111-125.
A variation of the RRW process described in the prior section can be used to quantify discrete risks. The discrete KEPP risks are identified and defined during the construction of the risk scenarios: pessimistic, optimistic, and reference. Each scenario has the same risks identified, and the pessimistic scenario, the worst observance of them is hypothesized to occur. For example, the pessimistic scenario is a situation surrounding the development of the WBS element that assumes the realization of the worst conditions under each category of risk affecting the element in meeting the WBS performance expectations.

Cost Estim
atingC
ost Risk
Economic &
Supporting AnalysisC
areer Developm
ent Guide
Reference
Know
ledge Managem
entC
ost Estimating
Cost R
iskEconom
ic & Supporting Analysis
Career D
evelopment G
uideR
eferenceK
nowledge M
anagement
2008 NASA Cost Estimating Handbook Section 2. Cost Risk Approaches
Volume 2 Page 2-38
The profile or scenario for each WBS element must be written, and should detail the specific, discrete KEPP risks to ensure that during the RRW process, the reason for a recommended confidence level for budgeting are clearly justified.
The templates documented in prior section (Figure 2-17 through Figure 2-20) are used by the engineers in rating the KEPP risks for the risk scenarios of the WBS element. Figure 2-22 illustrates this variation of the RRW process. This process uses the risk scores generated by the risk rating process to define two ratios that are used as factors on the reference point cost estimate to derive a pessimistic and optimistic cost. Together with the reference point estimate, these two derived costs define that WBS elements triangular risk distribution.
Translate Risk into Cost Impacts
These factors are then applied to the RPE to obtain the “low and high end” costs
0.7*RPE(“Low End” Cost)
RPE 2.0*RPE(“High End” Cost)
0.7*RPE(“Low End” Cost)
RPE 2.0*RPE(“High End” Cost)
TECHNOLOGY DES/ENG COMPLEXITY SCHEDULE
0.35
High
Mod
Low
0.25
Very High
Mod
Mod Low
0.2
Very High
Mod
Mod
0.2
High
Mod
Mod
WBS ELEMENT PROFILES
1. Pessimistic Profile
2. Reference Profile
3. Optimistic Profile
TOTAL
1.00
5.9
2.9
2.0
PESSIMISTIC “SCORE”“REFERENCE SCORE”
=5.92.9
= 2.0 = HIGH END RISK FACTOR FOR S/C
OPTIMISTIC “SCORE”“REFERENCE SCORE”
=2.02.9
= 0.7 = LOW END RISK FACTOR FOR S/C
Figure 2-22. Discrete Risk Analysis Using the RRW Process
The discrete KEPP risks are rated in pessimistic, optimistic, and reference scenarios to calculate relative risk scores for cost-risk triangular distribution development in the RRW process. Additionally, since the risks for each KEPP have been documented, it is possible to develop strategies for mitigating each KEPP risk and, in parallel with the RRW process, produce discrete cost-risk assessments. A cost is thus estimated for handling and/or mitigating each discrete KEPP risk to determine its specific contribution to the total cost.
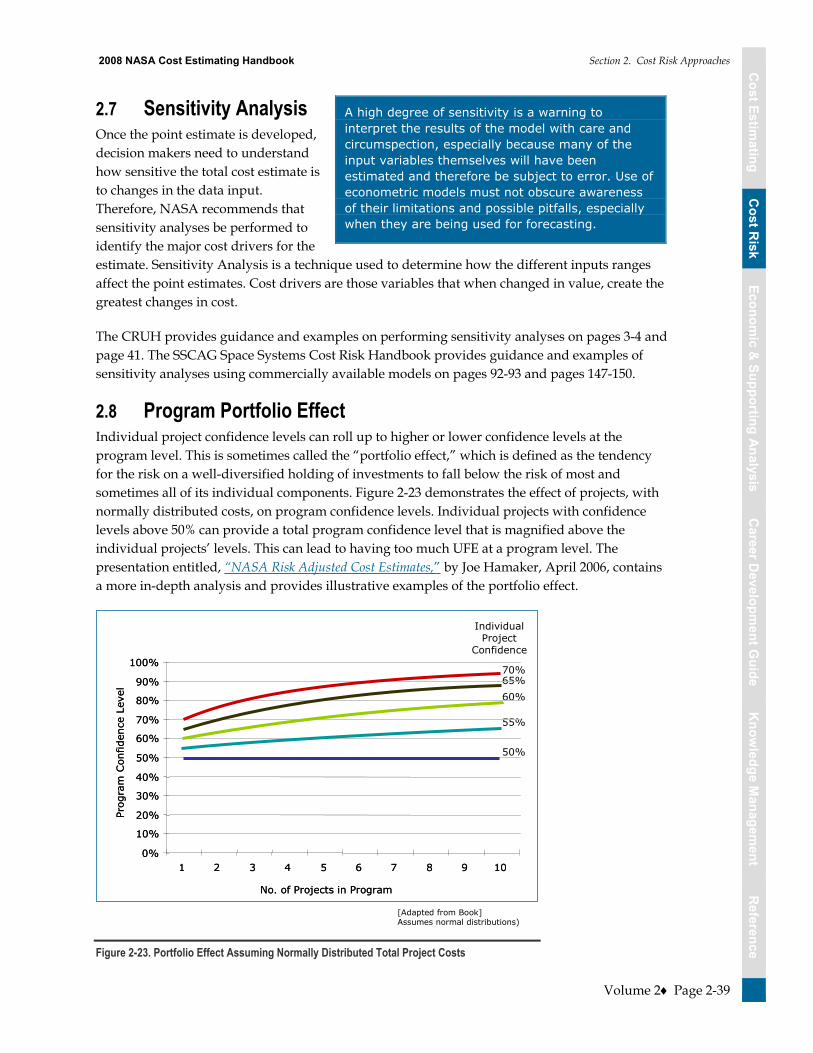
Cost Estim
atingC
ost Risk
Economic &
Supporting AnalysisC
areer Developm
ent Guide
Reference
Know
ledge Managem
entC
ost Estimating
Cost R
iskEconom
ic & Supporting Analysis
Career D
evelopment G
uideR
eferenceK
nowledge M
anagement
2008 NASA Cost Estimating Handbook Section 2. Cost Risk Approaches
Volume 2 Page 2-39
2.7 Sensitivity Analysis Once the point estimate is developed, decision makers need to understand how sensitive the total cost estimate is to changes in the data input. Therefore, NASA recommends that sensitivity analyses be performed to identify the major cost drivers for the estimate. Sensitivity Analysis is a technique used to determine how the different inputs ranges affect the point estimates. Cost drivers are those variables that when changed in value, create the greatest changes in cost.
The CRUH provides guidance and examples on performing sensitivity analyses on pages 3-4 and page 41. The SSCAG Space Systems Cost Risk Handbook provides guidance and examples of sensitivity analyses using commercially available models on pages 92-93 and pages 147-150.
2.8 Program Portfolio Effect Individual project confidence levels can roll up to higher or lower confidence levels at the program level. This is sometimes called the �“portfolio effect,�” which is defined as the tendency for the risk on a well-diversified holding of investments to fall below the risk of most and sometimes all of its individual components. Figure 2-23 demonstrates the effect of projects, with normally distributed costs, on program confidence levels. Individual projects with confidence levels above 50% can provide a total program confidence level that is magnified above the individual projects�’ levels. This can lead to having too much UFE at a program level. The presentation entitled, �“NASA Risk Adjusted Cost Estimates,�” by Joe Hamaker, April 2006, contains a more in-depth analysis and provides illustrative examples of the portfolio effect.
IndividualProject
Confidence
[Adapted from Book]Assumes normal distributions)
70%65%60%
55%
50%
0%
10%
20%
30%
40%
50%
60%
70%
80%
90%
100%
1 2 3 4 5 6 7 8 9 10
Prog
ram
Con
fiden
ce L
evel
No. of Projects in Program
0%
10%
20%
30%
40%
50%
60%
70%
80%
90%
100%
1 2 3 4 5 6 7 8 9 10
Prog
ram
Con
fiden
ce L
evel
No. of Projects in Program
Figure 2-23. Portfolio Effect Assuming Normally Distributed Total Project Costs
A high degree of sensitivity is a warning to interpret the results of the model with care and circumspection, especially because many of the input variables themselves will have been estimated and therefore be subject to error. Use of econometric models must not obscure awareness of their limitations and possible pitfalls, especially when they are being used for forecasting.
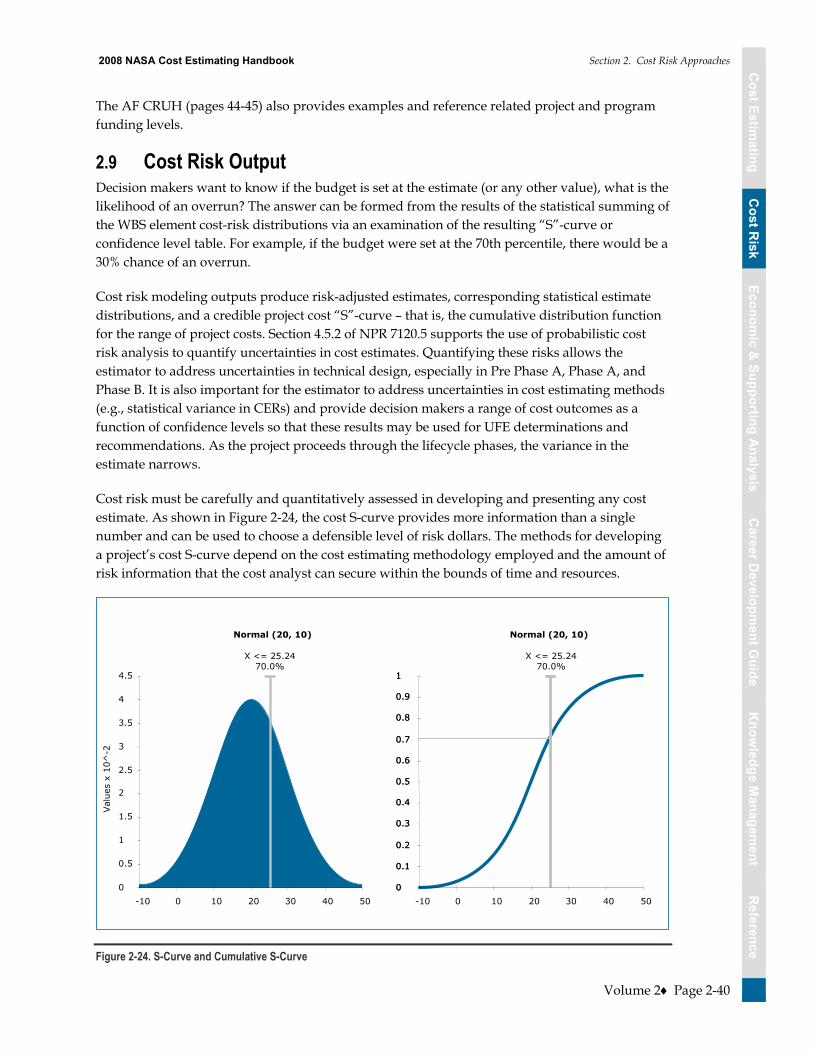
Cost Estim
atingC
ost Risk
Economic &
Supporting AnalysisC
areer Developm
ent Guide
Reference
Know
ledge Managem
entC
ost Estimating
Cost R
iskEconom
ic & Supporting Analysis
Career D
evelopment G
uideR
eferenceK
nowledge M
anagement
2008 NASA Cost Estimating Handbook Section 2. Cost Risk Approaches
Volume 2 Page 2-40
The AF CRUH (pages 44-45) also provides examples and reference related project and program funding levels.
2.9 Cost Risk Output Decision makers want to know if the budget is set at the estimate (or any other value), what is the likelihood of an overrun? The answer can be formed from the results of the statistical summing of the WBS element cost-risk distributions via an examination of the resulting �“S�”-curve or confidence level table. For example, if the budget were set at the 70th percentile, there would be a 30% chance of an overrun.
Cost risk modeling outputs produce risk-adjusted estimates, corresponding statistical estimate distributions, and a credible project cost �“S�”-curve �– that is, the cumulative distribution function for the range of project costs. Section 4.5.2 of NPR 7120.5 supports the use of probabilistic cost risk analysis to quantify uncertainties in cost estimates. Quantifying these risks allows the estimator to address uncertainties in technical design, especially in Pre Phase A, Phase A, and Phase B. It is also important for the estimator to address uncertainties in cost estimating methods (e.g., statistical variance in CERs) and provide decision makers a range of cost outcomes as a function of confidence levels so that these results may be used for UFE determinations and recommendations. As the project proceeds through the lifecycle phases, the variance in the estimate narrows.
Cost risk must be carefully and quantitatively assessed in developing and presenting any cost estimate. As shown in Figure 2-24, the cost S-curve provides more information than a single number and can be used to choose a defensible level of risk dollars. The methods for developing a project�’s cost S-curve depend on the cost estimating methodology employed and the amount of risk information that the cost analyst can secure within the bounds of time and resources.
Normal (20, 10)
X <= 25.2470.0%
0
0.5
1
1.5
2
2.5
3
3.5
4
4.5
-10 0 10 20 30 40 50
Val
ues
x 10
^-2
Normal (20, 10)
X <= 25.2470.0%
0
0.1
0.2
0.3
0.4
0.5
0.6
0.7
0.8
0.9
1
0
0.1
0.2
0.3
0.4
0.5
0.6
0.7
0.8
0.9
1
-10 0 10 20 30 40 50
Figure 2-24. S-Curve and Cumulative S-Curve
Cost Estim
atingC
ost Risk
Economic &
Supporting AnalysisC
areer Developm
ent Guide
Reference
Know
ledge Managem
entC
ost Estimating
Cost R
iskEconom
ic & Supporting Analysis
Career D
evelopment G
uideR
eferenceK
nowledge M
anagement
2008 NASA Cost Estimating Handbook Section 2. Cost Risk Approaches
Volume 2 Page 2-41
In addition to determining the S-curve, conducting cost risk assessments contribute to:
�• Determining the project�’s cost drivers. Analyzing which input variables will have a significant effect on the final cost can help determine which design (or programmatic) parameters deserve the most attention during the project�’s definition and design phase
�• Estimating the probability of achieving the point estimate. When a simulation risk analysis technique is performed using the low, most likely, and high values provided for the input variables, it can often be demonstrated that the point estimate has a less than 50-50 chance of being achieved
�• Providing a cost range. Establishes the low and the high end of the cost estimate with a series of low and high values of the input parameters.
Cost risk analysis quantifies the budgets necessary for the required level of confidence. When asked how much of the dollar figure being proposed is for UFE, a good strategy is to prepare the calculation below in advance, so that you can respond to that question by saying that the percentage (namely, whatever [(80th-50th)/50th]x100% turns out to be) is the amount by which the 80th percentile cost exceeds the 50th, and therefore can be considered UFE. Risk dollars should be phased in the estimate where they will most likely be needed.

Cost Estim
atingC
ost Risk
Economic &
Supporting AnalysisC
areer Developm
ent Guide
Reference
Know
ledge Managem
entC
ost Estimating
Cost R
iskEconom
ic & Supporting Analysis
Career D
evelopment G
uideR
eferenceK
nowledge M
anagement
2008 NASA Cost Estimating Handbook Section 3. Model Summaries/Overview
Volume 2 Page 2-42
Section 3. Model Summaries/Overview
There are a number of commercially-available cost modeling tools to assist the NASA cost estimator develop realistic risk adjusted cost estimates. Presented below are six profiles of commercially-available software packages that can be used. Each profile highlights the software�’s capabilities with regards to cost risk.
3.1 PRICE Systems Solution The PRICE Systems Solutions consist of two sets of parametric cost estimating models: the legacy PRICE Estimating Suite (PES), which includes the PRICE H and PRICE S models and the new generation TruePlanner, which includes True H and True S. In addressing risk, the PES employs simulation, while TruePlanner uses the FRISK/Method of Moments. In both tools, to address technical risk, PRICE assigns probability distributions to model inputs resulting in a very robust risk analysis.
3.1.1 Cost Risk Approach For both PES and TruePlanner, the risk analysis process consists of five basic steps:
1. Structure the estimate for the hardware or software system so that high risk elements can be identified.
2. Determine the most uncertain input parameters for those elements.
3. Quantify the uncertainty for each parameter in each element chosen.
4. Perform the risk analysis.
5. Evaluate the results.
PES assigns one of four possible probability distributions to the cost element input parameters selected for risk analysis. These are the normal, triangular, beta, and uniform. The selection of the distribution then determines additional data that is required to satisfy that particular distribution. PES then employs one of two possible sampling techniques for the simulation: Monte Carlo or Latin Hypercube. The number of iterations ranges from 25 to 8,000 with 1,000 being the default. Model inputs to each iteration of the simulation are derived for the selected probability distributions using a pseudo-number generator with seed values ranging from 0 to 10,000; one is the default.
PES outputs include a graphical portrayal of the resultant probability distribution function and the cumulative distribution function. They also include a tabular listing of all input parameters identified for risk analysis, along with the probability distribution and parameters for the
For more information, visit www.pricesystems.com PRICE Systems, L.L.C.17000 Commerce Parkway, Suite A Mount Laurel, NJ 08054 Phone: 1.856.608.7200 Fax: 1.856.608.7247
Cost Estim
atingC
ost Risk
Economic &
Supporting AnalysisC
areer Developm
ent Guide
Reference
Know
ledge Managem
entC
ost Estimating
Cost R
iskEconom
ic & Supporting Analysis
Career D
evelopment G
uideR
eferenceK
nowledge M
anagement
2008 NASA Cost Estimating Handbook Section 3. Model Summaries/Overview
Volume 2 Page 2-43
For more information visit www.galorath.com Galorath Incorporated 100 N. Sepulveda Boulevard, Suite 1801 El Segundo, CA 90245 Phone: 1 (310) 414 3222 Fax: 1 (310) 414 3220 E-mail: [email protected]
distribution; figures of merit for the random sample, including mean, standard deviation, coefficient of variation, and mean standard error; and precise output for every fifth percentile of the output cumulative distribution function. It is also possible to export the inputs and outputs from each iteration for additional analysis outside the model.
3.1.2 Correlation Correlation in PES is addressed through a series of check boxes that establish a dependency between total weight and weight of structure with and without weight of electronics and also inter-element dependency, which assures that parameters for the selected elements move in the same direction.
The new generation TruePlanner employs the FRISK/Method of Moments methodology developed in the early 1990s by Philip H. Young at the Aerospace Corporation. TruePlanner assigns triangular probability distributions to model element input parameters that are selected for risk analysis. These triangular distributions are then combined into a lognormal distribution. The lognormal distribution is appealing to the cost analyst because the lower bound is zero, which eliminates negative cost and the upper bound is infinite, to permit infinitely high cost, but with a very low probability.
Inter-element Pearson correlation is based on user input and the relationship of cost elements one to another in the estimate. The user selects the correlation to be none, very loose, nominal, tight, very tight, or total with corresponding numerical values ranging from zero to one. The relationship of the cost elements, same parent or different parent, also determines the strength of the correlation.
The primary risk output from TruePlanner is a precise tabular listing for every fifth percentile of the cumulative distribution function of the output lognormal distribution. Also included are the mean, mode, and variance for the distribution.
3.2 SEER SEER models capture technical input and cost estimating risk (uncertainty regarding the correct input value) by soliciting a range of input values for most parametric inputs. These parameters require least, likely, and most inputs. Least represents the lowest reasonable value for the parameter (1% probability that the value would be lower than the stated least value) whereas most input represents a 99% probability that the actual value will be less than the stated value. The likely input represents the highest probability of occurrence, the value that the estimator would enter if only a point value estimate was required. The estimator can thus specify a reasonable range for each parameter, anywhere from certainty (Least = Likely = Most) to any desired degree of uncertainty. The range does not need to be symmetrical, but should reflect the estimator�’s best judgment based on technical inputs as to the reasonable range for the parameter value.
For each parameter where least, likely and most is specified, SEER constructs an input distribution. The lowest cost input (which may be least or most, depending on the definition of

Cost Estim
atingC
ost Risk
Economic &
Supporting AnalysisC
areer Developm
ent Guide
Reference
Know
ledge Managem
entC
ost Estimating
Cost R
iskEconom
ic & Supporting Analysis
Career D
evelopment G
uideR
eferenceK
nowledge M
anagement
2008 NASA Cost Estimating Handbook Section 3. Model Summaries/Overview
Volume 2 Page 2-44
For more information visit https://nafcom-government.saic.com/ SAIC 10260 Campus Point Drive San Diego, CA 92121
the parameter) forms the lower (1%) bound, the highest cost input forms the upper (99%) bound, and the 50% point is defined by a PERT mean of the least, likely, and most values. The PERT mean is defined as {[Least + (4 * Likely) + Most]/6}. A normal distribution is assumed, so standard deviation is calculated as one third of the difference between the PERT mean and the respective endpoints.
3.2.1 Cost Risk Approach At the level of an individual hardware or software work element in the SEER WBS, the estimator can select a confidence level between 1% and 99%. For each parameter where a range of values is required, the SEER model will select the appropriate confidence level value for each parameter and calculate a result.
Rollup work elements aggregate several lower-level hardware and/or software items in the SEER WBS. Sums (at the selected confidence level of the lower level elements) can be displayed, but the sum does not generally adequately capture the summation of the underlying distributions. A Monte Carlo technique is used to calculate uncertainty distributions for rollup work elements. The estimator can specify the desired number of Monte Carlo iterations to be used.
3.2.2 Integration with Other Approach/Tools SEER models incorporate basic risk analysis features, but can also provide inputs to more sophisticated risk analysis tools. When using SEER models with ACEIT, entering the SEER 50% and 90% confidence level estimates for an individual work element and using a log-normal distribution in ACEIT will normally allow ACEIT to produce a good approximation of the SEER risk distribution at confidence levels above 50%. Galorath is also developing an interface with Crystal Ball to allow automated, sophisticated risk analysis capabilities.
3.2.3 Correlation At the individual work element level, confidence levels represent fully correlated results. Each parameter which includes a range of values is evaluated at the same probability. In SEER-SEM, the Risk Tuner feature allows the estimator to specify different confidence levels for different categories of parameters, thus capturing varying degrees of correlation.
At the Rollup level, Monte Carlo results are calculated for full (100%) correlation and no (0%) correlation. The estimator can use these endpoints to interpolate for varying degrees of correlation between the work elements.
3.2.4 Reports & Charts Summarizing Cost Risk Results SEER models provide textual and graphical representations of risk at the work element and rollup levels. Risk Analysis reports display a table of values at varying confidence levels (1%-99% for individual work elements, 10-90% for rollups). Risk charts display the cumulative distribution function (CDF) for the selected domain (cost, effort, schedule, software defects).
3.3 NAFCOM For each subsystem-level complexity generator input �– weight, technical and management parameters �– the user enters into NAFCOM a low

Cost Estim
atingC
ost Risk
Economic &
Supporting AnalysisC
areer Developm
ent Guide
Reference
Know
ledge Managem
entC
ost Estimating
Cost R
iskEconom
ic & Supporting Analysis
Career D
evelopment G
uideR
eferenceK
nowledge M
anagement
2008 NASA Cost Estimating Handbook Section 3. Model Summaries/Overview
Volume 2 Page 2-45
value, a most likely value, and a high value. Each of the low values is input to the CER, yielding a �“low�” estimate. Each of the most likely values is input to the CER, yielding a �“most likely�” estimate. And each of the high value is input to the CER, yielding a �“high�” estimate. A triangular distribution representing the technical risk is defined using these three values.
3.3.1 Cost Risk Approach NAFCOM incorporates estimating risk through the NAFCOM complexity generator cost-estimating relationships, or CERs, have the power equation form:
Y = aX1b1X2b2�…. Xnbn.
The CERs are calculated using transformed ordinary least squares (OLS). The natural logarithms of the dependent variable and independent variables are calculated, and then OLS is applied to the transformed data. In other words, OLS is applied to the logarithmic transformed (�“log�”) model:
ln(Y) = ln(a)+b1ln(X1)+b2ln(X2)+�…+bnln(Xn).
The coefficients calculated by ordinary least squares, b1, b2, �…, bn, are used in the model Y = aX1b1X2b2�…Xnbn, and the transformation exp(ln(log model a-value)) = a-value is performed to yield the corresponding coefficient for the power equation.
The estimation error for the log model is a normal distribution, with mean equal to zero and standard deviation equal to the standard error of the model. The log model standard error is:
2
))ˆln()(ln(1
2
kn
YYSE
n
iii
,
where n = number of data points and k = number of independent variables.
Note this is not the standard error of the CER. However, the CER standard error can be calculated from this standard error. A random variable X is said to be lognormally distributed if ln(X) is normally distributed. Since the errors of the log model are normally distributed and the log model is simply a logarithmic transformation of the power equation, then the error for the power equation model is lognormally distributed, with mean and standard deviation:
Figure 2-25. NAFCOM CER Major Inputs
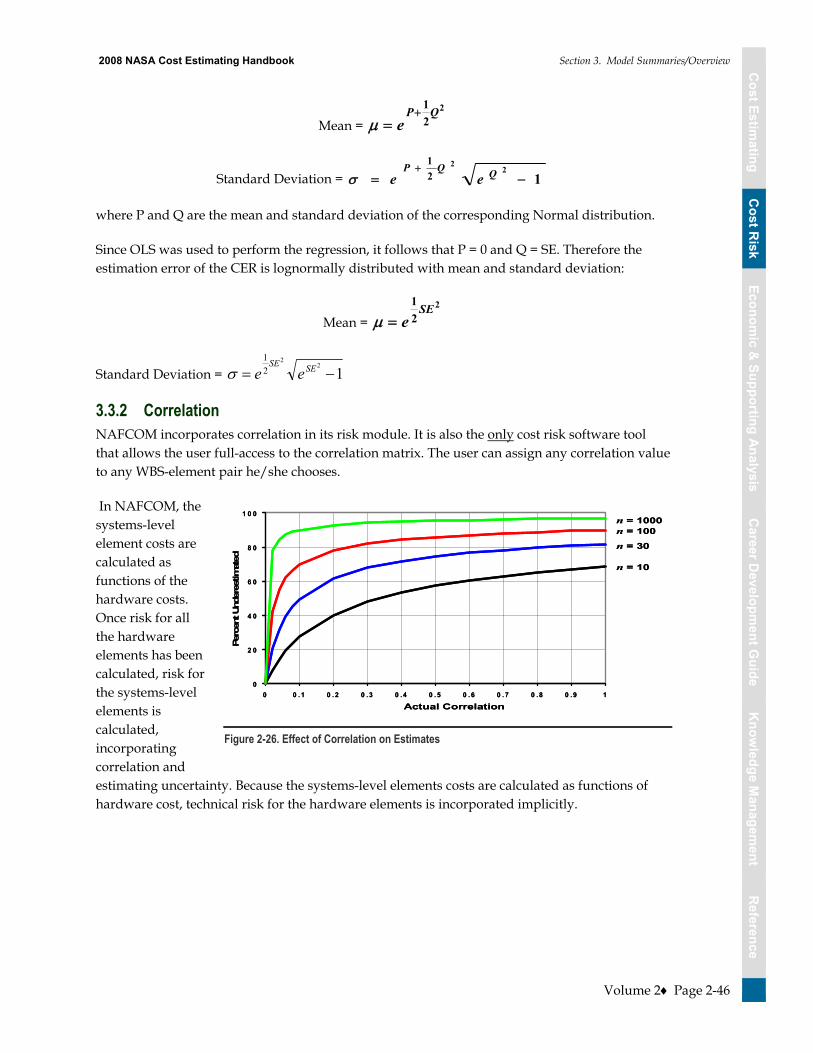
Cost Estim
atingC
ost Risk
Economic &
Supporting AnalysisC
areer Developm
ent Guide
Reference
Know
ledge Managem
entC
ost Estimating
Cost R
iskEconom
ic & Supporting Analysis
Career D
evelopment G
uideR
eferenceK
nowledge M
anagement
2008 NASA Cost Estimating Handbook Section 3. Model Summaries/Overview
Volume 2 Page 2-46
Mean = 2
21QP
e
Standard Deviation = 12
221
QQPee
where P and Q are the mean and standard deviation of the corresponding Normal distribution.
Since OLS was used to perform the regression, it follows that P = 0 and Q = SE. Therefore the estimation error of the CER is lognormally distributed with mean and standard deviation:
Mean = 2
21SEe
Standard Deviation = 12
2
21
SESEee
3.3.2 Correlation NAFCOM incorporates correlation in its risk module. It is also the only cost risk software tool that allows the user full-access to the correlation matrix. The user can assign any correlation value to any WBS-element pair he/she chooses.
In NAFCOM, the systems-level element costs are calculated as functions of the hardware costs. Once risk for all the hardware elements has been calculated, risk for the systems-level elements is calculated, incorporating correlation and estimating uncertainty. Because the systems-level elements costs are calculated as functions of hardware cost, technical risk for the hardware elements is incorporated implicitly.
0
2 0
4 0
6 0
8 0
1 0 0
0 0 .1 0 .2 0 .3 0 .4 0 .5 0 .6 0 .7 0 .8 0 .9 1
Actual Correlation
Perc
ent U
nder
estim
ated
n = 10
n = 30
n = 100n = 1000
0
2 0
4 0
6 0
8 0
1 0 0
0 0 .1 0 .2 0 .3 0 .4 0 .5 0 .6 0 .7 0 .8 0 .9 1
Actual Correlation
Perc
ent U
nder
estim
ated
n = 10
n = 30
n = 100n = 1000
Figure 2-26. Effect of Correlation on Estimates

Cost Estim
atingC
ost Risk
Economic &
Supporting AnalysisC
areer Developm
ent Guide
Reference
Know
ledge Managem
entC
ost Estimating
Cost R
iskEconom
ic & Supporting Analysis
Career D
evelopment G
uideR
eferenceK
nowledge M
anagement
2008 NASA Cost Estimating Handbook Section 3. Model Summaries/Overview
Volume 2 Page 2-47
For more information visit www.aceit.com Tecolote Research Inc. 5266 Hollieter Ave Suite 201 Santa Barbara, CA 93111 805.964.6964
3.3.3 Reports and Charts Summarizing Cost Risk Results
NAFCOM provides the following reports:
�• Probability Density Function (PDF) Reports
�• Cumulative Distribution Function (CDF) Reports
�• Risk Statistics Reports �• Risk Allocation Reports
3.4 Automated Cost Estimating Integrated Tools (ACEIT) ACEIT is a Government funded, special purpose program, specifically developed for cost analysis. It automates the primary tools and techniques of the cost analysis trade such as WBS structures, inflation, learning, time-phasing, cost as an independent variable (CAIV), cost-category reports, documentation, /what-if analysis and risk analysis. ACEIT provides capability that allows you to conduct a risk analysis on the cost, schedule, and technology uncertainty in your cost estimate.
3.4.1 Cost Estimating Risk Automated Cost Estimator (ACE) allows an analyst to specify risk distributions for any element within the model. This allows a user to explicitly specify the uncertainty distribution associated with cost estimating relationships. For any element in the ACE model a user can specify the bounds around the point estimate. The current version of ACE (Version 7.0) provides six distributions (Triangular, Normal, LogNormal, Uniform, Beta, Weibull). The bounds for each of these distributions can be specified via low and high bounds or via statistical metrics (standard deviation, adjusted standard error, coefficient of variation). ACE treats the point estimate as the most likely value (except for lognormal where it is treated as the median) and uses the distribution
Figure 2-27. NAFCOM Probability Distribution Function Report
Figure 2-28. Available ACEIT tools
Uncertainty Assumptions
Total confidence level of the point estimate
Figure 2-29. ACEIT Cost Estimating Risk Input screen

Cost Estim
atingC
ost Risk
Economic &
Supporting AnalysisC
areer Developm
ent Guide
Reference
Know
ledge Managem
entC
ost Estimating
Cost R
iskEconom
ic & Supporting Analysis
Career D
evelopment G
uideR
eferenceK
nowledge M
anagement
2008 NASA Cost Estimating Handbook Section 3. Model Summaries/Overview
Volume 2 Page 2-48
information as the bounds for the simulation process. Upon completion of the calculation, ACE provides the confidence level of the estimate result next to the estimated result.
3.4.2 Technical Input Risk In addition to cost estimating uncertainty, ACE allows an analyst to specify uncertainty on any input driver to a calculation. To do this, an analyst specifies the cost estimating uncertainty on the row containing the CER and then also specifies a distribution for the row in the model where the input parameter is defined. During the simulation process, ACE will first determine the value of the input parameter based on its distribution information. Once this is determined, ACE uses the input parameter value to calculate the equation and determine a cost result based on the uncertainty specified for the CER. In this manner, the uncertainty of the technical inputs is included with the cost estimating uncertainty for a specific cost element. The tables to the right show the difference when inputs are placed on only the inputs, only on the CER, and when combined.
3.4.3 Correlation ACE incorporates a correlation technique similar to that of the Lurie-Goldberg algorithm for creating a set of variables that match a supplied correlation matrix. ACE provides a RI$K Grouping and Correlation Dialog to help you enter a single correlation vector. Once the desired rows are in the group, you can enter the vector values into the strength column and the entire correlation matrix is determined.
3.4.4 Simulation Process ACE applications uses a Latin Hypercube simulation method to derive aggregate or parent level distributions based on specified distributions for WBS elements and their associated interactions (both through the CERs and their inputs). The Latin Hypercube method requires a lower number of iteration then the Monte Carlo method but it still requires the user to choose a sufficient number of iterations to converge on a distribution. The Latin Hypercube technique ensures that the entire range of each variable is sampled.
3.4.5 Reports and Charts Summarizing Cost Risk Results ACEIT provides numerous reports to view the results of the risk analysis. These range from statistical reports to charts and graphics depicting the resulting analysis. Users can quickly create
5% Value
Most Likely Value
95% Value Distribution Shape
Calculated uncertainty with distribution only on the CER Inputs
93% $43 K 133%
Calculated uncertainty with distribution only on the CER
75% $43 K 125%
Calculated uncertainty with distribution the CER and the CER Inputs
81% $43 K 144%
Figure 2-30. ACEIT Technical Risk Input Screen
Figure 2-31. ACEIT Correlation Input Screen

Cost Estim
atingC
ost Risk
Economic &
Supporting AnalysisC
areer Developm
ent Guide
Reference
Know
ledge Managem
entC
ost Estimating
Cost R
iskEconom
ic & Supporting Analysis
Career D
evelopment G
uideR
eferenceK
nowledge M
anagement
2008 NASA Cost Estimating Handbook Section 3. Model Summaries/Overview
Volume 2 Page 2-49
graphical results to see the PDF and S-Curves or to compare the risk analysis results for two options.
Figure 2-32. ACEIT Cost Risk Reports
Currently, the next version of ACEIT is in development. This version will incorporate three new risk reports: Tornado, Spider, and Variance Analysis. These reports will allow a user to obtain a deeper understanding of what cost elements and/or input parameters are driving the overall risk analysis. Examples of the Tornado and Spider charts are below.
Missile System ($696,110)At 10%, 90% confidence levels
$635,106
$655,106
$675,106
$695,106
$715,106
$735,106
$755,106
$775,106
$795,106
SEPM Factor
Software Manmonths From Third Party Tool
Guidance and Control
Airframe Weight (lbs)
Software Labor Rate ($/month)
Training Factor
Sys Test Eval Factor
Airframe
Initial Spares Factor
Engineering Changes Factor
Estimate Total
Missile System ($696,110)From 10% to 90% confidence levels
$635,106
$655,106
$675,106
$695,106
$715,106
$735,106
$755,106
$775,106
$795,106
10%
20%
30%
40%
50%
60%
70%
80%
90%
Confidence Value
Estim
ate
Tot
SEPM Factor
Software Manmonths From Third PartyTool
Guidance and Control
Airframe Weight (lbs)
Software Labor Rate ($/month)
Training Factor
Sys Test Eval Factor
Airframe
Initial Spares Factor
Engineering Changes Factor
Figure 2-33. Future ACEIT Cost Risk output reports
3.5 Crystal Ball
3.5.1 Technical Input Risk Crystal Ball® is a suite of analytical software applications enhancing the way Microsoft® Excel® is used. By introducing analytical approaches such as simulation, optimization, and time-series forecasting into a spreadsheet, Crystal Ball increases the accuracy and ease of forecasting and risk analysis. Excel spreadsheets contain single point estimates or one value in each cell. Crystal Ball allows a range
For more information visit www.crystalball.com Decisioneering, Inc. – Makers of Crystal Ball Software 1515 Arapahoe St. Suite 1300 Denver, CO 80202 800.289.2550

Cost Estim
atingC
ost Risk
Economic &
Supporting AnalysisC
areer Developm
ent Guide
Reference
Know
ledge Managem
entC
ost Estimating
Cost R
iskEconom
ic & Supporting Analysis
Career D
evelopment G
uideR
eferenceK
nowledge M
anagement
2008 NASA Cost Estimating Handbook Section 3. Model Summaries/Overview
Volume 2 Page 2-50
to be put around values so all intermediate values can be accounted for. These ranges are represented by probability distributions. Crystal Ball uses Monte Carlo simulation to generate thousands of scenarios by randomly sampling different values that lie within the defined range or distribution.
3.5.2 Cost Estimating Risk The Crystal Ball sensitivity chart is a particularly powerful approach for pinpointing the drivers of uncertainty within a forecast. Generated during the simulation, this chart describes which of the uncertain factors have the greatest impact on the bottom line, with the factors at top exerting the greatest influence.
3.5.3 Correlation Crystal Ball has a correlation function to account for cost elements that move together.
3.5.4 Cost Risk Approach Crystal Ball uses Monte Carlo simulation to answer questions traditional estimating approaches do not, such as �“what is the most likely cost,�” �“how likely is the baseline estimate to be overrun,�” �“what is the cost risk exposure,�” and �“where is the risk in this project,�” because it takes into account the uncertainty around project costs. Simulation removes the limitations of spreadsheets by avoiding reliance on average values and providing valuable insights into the effects of variability on a forecast. Traditional spreadsheet analysis fails to produce accurate forecasts because it is generally restricted to a limited number of �“what-if�” scenarios or to using the classic �“best, worst, and most-likely case�” approach. In both techniques, the analyst is limited to a relatively small number of alternative scenarios that provide no associated probability of occurrence. With Monte Carlo simulation, Crystal Ball simulations move from a deterministic, or static, analysis to a probabilistic world view that recognizes and compensates for uncertainty, risk or variation.
Figure 2-34. Crystal Ball Cost Estimating Risk Input Screen
Figure 2-35. Crystal Ball Correlation Input Screen

Cost Estim
atingC
ost Risk
Economic &
Supporting AnalysisC
areer Developm
ent Guide
Reference
Know
ledge Managem
entC
ost Estimating
Cost R
iskEconom
ic & Supporting Analysis
Career D
evelopment G
uideR
eferenceK
nowledge M
anagement
2008 NASA Cost Estimating Handbook Section 3. Model Summaries/Overview
Volume 2 Page 2-51
3.5.5 Reports and Charts Summarizing Cost Risk Results
Crystal Ball has many reporting and charting options. Charts used during the simulation include assumption, forecast, overlay, trend, and sensitivity. After a simulation is run, results can be exported into an Excel spreadsheet displaying the data created from the simulation results.
3.6 @Risk @RISK uses Monte Carlo simulation to show how many possible outcomes can occur from a Microsoft Excel spreadsheet �– and tells how likely they are to occur. This allows the user to judge which risks to take and which ones to avoid. While no software package can predict the future, @RISK can help the user select the best strategy based on the available information.
The power of Monte Carlo simulation lies in the picture of possible outcomes it creates. Simply by running a simulation, @RISK takes a spreadsheet model from representing just one possible outcome to representing thousands. With @RISK, answers to questions like, �“what is the probability of profit exceeding $10,000,000?�” or �“what are the chances of losing money on this venture?�” can be derived.
3.6.1 Cost Risk Approach Choosing which @RISK distribution function to use is easy. @RISK comes with a distribution viewer that allows the user to preview various distributions before selecting them. A user can even set up distributions using percentiles as well as standard parameters. Furthermore, a user can use historical data and @RISK�’s integrated data fitting tool to select the best function and the right parameters.
Figure 2-36. Crystal Ball Cost Estimating Risk input screen
Figure 2-37. Crystal Ball Correlation input screen
For more information visit www.palisade.com Palisade Corporation 798 Cascadilla Street Ithaca, NY 14850 USA Tel: 800-432-7475 or 607-277-8000 Fax: 607-277-8001 Email: [email protected]

Cost Estim
atingC
ost Risk
Economic &
Supporting AnalysisC
areer Developm
ent Guide
Reference
Know
ledge Managem
entC
ost Estimating
Cost R
iskEconom
ic & Supporting Analysis
Career D
evelopment G
uideR
eferenceK
nowledge M
anagement
2008 NASA Cost Estimating Handbook Section 3. Model Summaries/Overview
Volume 2 Page 2-52
@RISK also provides Sensitivity and Scenario Analyses. The Sensitivity Analysis can be used to rank the distribution functions in the user�’s model according to the impact they have on outputs. Outputs are clearly displayed with an easy-to-interpret Tornado diagram.
3.6.2 Reports and Charts Summarizing Cost Risk Results @RISK provides a wide range of graphs for interpreting and presenting results to others. Histograms and cumulative curves show the probability of different outcomes occurring. Overlay graphs can be used to compare multiple results, and summary graphs can be used to see risk over time. @RISK also allows the generation of one-page, ready-to-print Quick Report of statistical results and graphs.
3.6.3 Integration with Other Approach/Tools @RISK for Excel is compatible with Excel versions 2000 through 2007.
Cost Estim
atingC
ost Risk
Economic &
Supporting AnalysisC
areer Developm
ent Guide
Reference
Know
ledge Managem
entC
ost Estimating
Cost R
iskEconom
ic & Supporting Analysis
Career D
evelopment G
uideR
eferenceK
nowledge M
anagement
2008 NASA Cost Estimating Handbook Section 4. Risk Handbook Summaries
Volume 2 Page 2-53
Section 4. Risk Handbook Summaries
There are many excellent resources available for further information pertaining to cost risk. This handbook summarizes and reference just two: the SSCAG Space Systems Cost Risk Handbook and the Air Force Cost Risk and Uncertainty Analysis Handbook. These summaries and the references used in this Volume from these Handbooks have been included with the permission of the respective
organizations in the spirit of keeping industry information consistent and widely communicated.
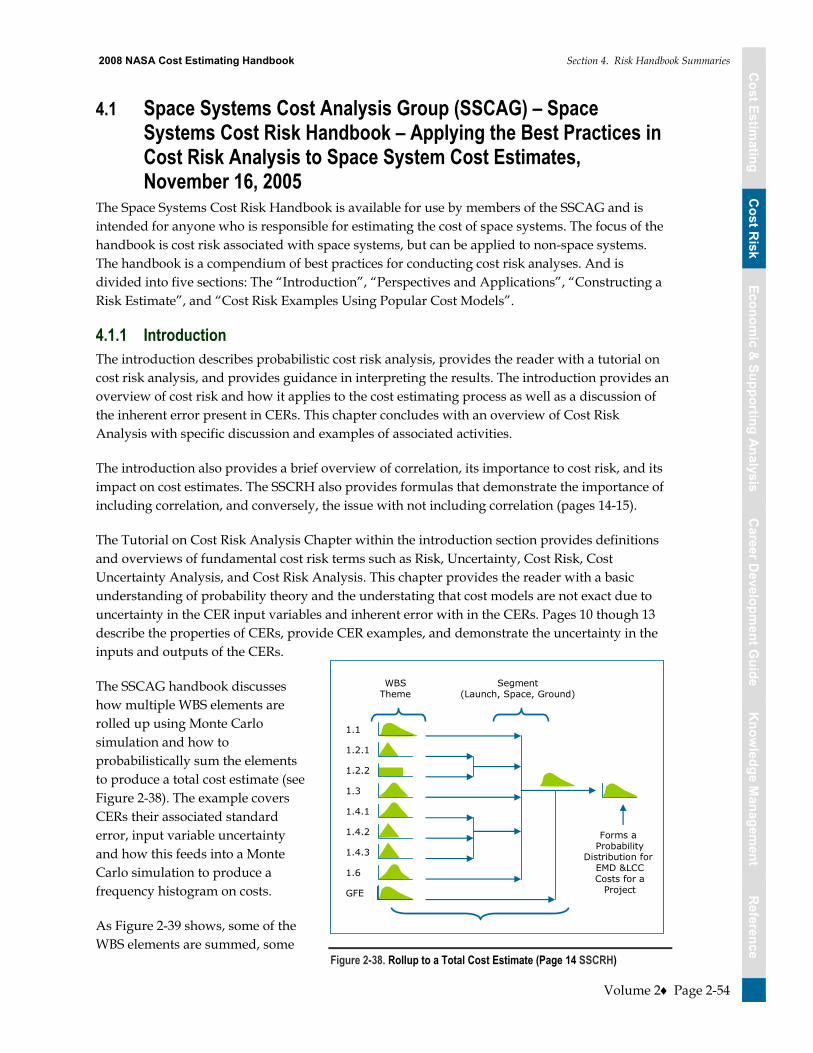
Cost Estim
atingC
ost Risk
Economic &
Supporting AnalysisC
areer Developm
ent Guide
Reference
Know
ledge Managem
entC
ost Estimating
Cost R
iskEconom
ic & Supporting Analysis
Career D
evelopment G
uideR
eferenceK
nowledge M
anagement
2008 NASA Cost Estimating Handbook Section 4. Risk Handbook Summaries
Volume 2 Page 2-54
4.1 Space Systems Cost Analysis Group (SSCAG) – Space Systems Cost Risk Handbook – Applying the Best Practices in Cost Risk Analysis to Space System Cost Estimates, November 16, 2005
The Space Systems Cost Risk Handbook is available for use by members of the SSCAG and is intended for anyone who is responsible for estimating the cost of space systems. The focus of the handbook is cost risk associated with space systems, but can be applied to non-space systems. The handbook is a compendium of best practices for conducting cost risk analyses. And is divided into five sections: The �“Introduction�”, �“Perspectives and Applications�”, �“Constructing a Risk Estimate�”, and �“Cost Risk Examples Using Popular Cost Models�”.
4.1.1 Introduction The introduction describes probabilistic cost risk analysis, provides the reader with a tutorial on cost risk analysis, and provides guidance in interpreting the results. The introduction provides an overview of cost risk and how it applies to the cost estimating process as well as a discussion of the inherent error present in CERs. This chapter concludes with an overview of Cost Risk Analysis with specific discussion and examples of associated activities.
The introduction also provides a brief overview of correlation, its importance to cost risk, and its impact on cost estimates. The SSCRH also provides formulas that demonstrate the importance of including correlation, and conversely, the issue with not including correlation (pages 14-15).
The Tutorial on Cost Risk Analysis Chapter within the introduction section provides definitions and overviews of fundamental cost risk terms such as Risk, Uncertainty, Cost Risk, Cost Uncertainty Analysis, and Cost Risk Analysis. This chapter provides the reader with a basic understanding of probability theory and the understating that cost models are not exact due to uncertainty in the CER input variables and inherent error with in the CERs. Pages 10 though 13 describe the properties of CERs, provide CER examples, and demonstrate the uncertainty in the inputs and outputs of the CERs.
The SSCAG handbook discusses how multiple WBS elements are rolled up using Monte Carlo simulation and how to probabilistically sum the elements to produce a total cost estimate (see Figure 2-38). The example covers CERs their associated standard error, input variable uncertainty and how this feeds into a Monte Carlo simulation to produce a frequency histogram on costs.
As Figure 2-39 shows, some of the WBS elements are summed, some
GFE
1.6
1.4.3
1.4.2
1.4.1
1.3
1.2.2
1.2.1
1.1
WBSTheme
Segment(Launch, Space, Ground)
Forms a Probability
Distribution for EMD &LCCCosts for a
Project
Figure 2-38. Rollup to a Total Cost Estimate (Page 14 SSCRH)

Cost Estim
atingC
ost Risk
Economic &
Supporting AnalysisC
areer Developm
ent Guide
Reference
Know
ledge Managem
entC
ost Estimating
Cost R
iskEconom
ic & Supporting Analysis
Career D
evelopment G
uideR
eferenceK
nowledge M
anagement
2008 NASA Cost Estimating Handbook Section 4. Risk Handbook Summaries
Volume 2 Page 2-55
are functions of other WBS elements, and the desired end result is a probability distribution of total cost. One of the most effective ways of accomplishing this goal is to use Monte Carlo simulation. The technique is as follows:
1. Take a random sample from each WBS element in accordance with its probability distribution.
2. Add or multiply the result of each random sample as required to arrive at a total cost.
3. Record this total as one observation.
4. Repeat steps 1 through 3 thousands of times.
5. Develop a histogram of all total costs.
6. Use distribution-fitting techniques to convert the histogram into a total cost probability distribution.
The SSCRH provides overviews, definitions, formulas, and guidance on choosing from among the more commonly used probability distributions (Figure 2-40) for both CER input and CER outputs including Normal, Triangular Uniform, and Log Normal (pages 16-23).
The SSCRH provides a sample LEO satellite program (page 25-29). The example covers the sample WBS, deterministic point estimate, summary of the CERs and input variables, CER input distributions, and CER output distributions. The example also covers correlation coefficients, the Monte Carlo simulation process, simulation results, and interpretation of the results.
Figure 2-39. Normal, Triangular, Uniform, and Lognormal Probability Distributions

Cost Estim
atingC
ost Risk
Economic &
Supporting AnalysisC
areer Developm
ent Guide
Reference
Know
ledge Managem
entC
ost Estimating
Cost R
iskEconom
ic & Supporting Analysis
Career D
evelopment G
uideR
eferenceK
nowledge M
anagement
2008 NASA Cost Estimating Handbook Section 4. Risk Handbook Summaries
Volume 2 Page 2-56
Figure 2-40. CER Input Distribution, CER Output Distribution, Correlation Matrix, Simulation Results
The final portion of the Introduction (pages 30-33) provides a brief overview of the output of the cost risk analysis, specifically risk dollars, the risk adjusted estimate, how �“risky�” is the estimate, and estimate UFE (Figure 2-41). Page 31 of the SSCRH states that a properly developed independent cost estimate, with realistic cost drivers, in which both cost estimating and technical uncertainty have been quantified and included in the process, is known as a risk-adjusted estimate.
SSCRH defines Budget Risk as the probability of overrunning a specific dollar value (budget) on the cost distribution curve. Every budget contains risk, which is: the budget is too low. The amount of risk contained in any budget is measured by the probability of overrunning that particular budget. Budget risk has a direct correspondence to the percentiles of the risk-adjusted estimate�’s probability distribution. Figure 2-42 shows the Risk Adjusted cost estimate and the associated budget risk.
RISKMANAGEMENT
PROCESS
COSTANALYSIS
RiskAssessment
Cost RiskAnalysis
RiskPlanning
RiskMonitoring
RiskHandling
CAIVTrades
Life CycleCost
Figure 2-41. Cost Risk Analysis Interaction with the Risk Management Process

Cost Estim
atingC
ost Risk
Economic &
Supporting AnalysisC
areer Developm
ent Guide
Reference
Know
ledge Managem
entC
ost Estimating
Cost R
iskEconom
ic & Supporting Analysis
Career D
evelopment G
uideR
eferenceK
nowledge M
anagement
2008 NASA Cost Estimating Handbook Section 4. Risk Handbook Summaries
Volume 2 Page 2-57
UFE (Figure 2-43) is money that is in the budget, but not earmarked for any specific risk. The expected value of the risk-adjusted cost estimate has just enough money to cover normal acquisition plus anticipated risks. If a decision maker wants UFE, he/she will have to budget at a value that is higher than the expected value of the cost distribution. In other words, the difference between the budget and the expected value of the cost distribution is UFE.
Under current government acquisition practices, UFE is unlikely to be available. If any program manager has UFE sitting in an account somewhere, it will be swept up by the comptroller for use somewhere else. In practice, therefore, the largest budget anyone can reasonably ask for is the expected value of the risk-adjusted cost probability distribution (SSCRH page 33).
4.1.2 Perspectives and Applications The second section �“Perspectives and Applications�” (SSCRH pages 52-88) provides government and commercial philosophies and applications of cost risk analysis. Including an overview and a multi-spacecraft satellite system example involving the Risk Management Process, Cost Analysis, and where the two approaches intersect. This intersection covers Cost Risk Analysis and Risk Assessment.
This section presents a summary of a specific approach to risk management as it relates to cost, cost risk analysis approach, and sample cost risk results as calculated for a long-term spacecraft and ground engineering, production, replenishment, and O&S program.
The Handbook explains a step-by-step cost risk analysis approach that can be used to produce realistic estimates of costs and program resources for Government decision makers. The main goal of this approach is to fully integrate the risk management process with the cost risk analysis in order to maintain consistency in the evaluations of risk.
Risk-Adjusted Estimate
Risk-AdjustedEstimate $345M
0 100 200 300 400 500 600
Budget Risk= 51%
700 800
FY$MLi
kelih
ood
Figure 2-42. Budget Risk
Risk-Adjusted Estimate
Risk-AdjustedEstimate $345M
ManagementReserve $59M
0 100 200 300 400 500 600
Budget$435M
700 800
FY$M
Like
lihoo
d
Figure 2-43. Unallocated Future Expense

Cost Estim
atingC
ost Risk
Economic &
Supporting AnalysisC
areer Developm
ent Guide
Reference
Know
ledge Managem
entC
ost Estimating
Cost R
iskEconom
ic & Supporting Analysis
Career D
evelopment G
uideR
eferenceK
nowledge M
anagement
2008 NASA Cost Estimating Handbook Section 4. Risk Handbook Summaries
Volume 2 Page 2-58
The main elements in risk management discussed in the handbook include risk planning, assessment, handling, and monitoring. The handbook covers Risk Mitigation (SSCRH page 56), Cost Analysis Approach (SSCRH page 57), and Cost Analysis Assessment (SSCAG page 58-60) in detail. The handbook illustrates the these topics in the context of a multi-spacecraft satellite system and provides definitions and examples of nonrecurring costs, recurring cost, associated risk levels, correlation coefficients. And detailed cost risk distributions.
The final chapter of this section (pages 74-88) illustrates the value of cost risk-opportunity analysis to management�’s business decisions. The chapter includes nine aerospace actual case studies that show how cost risk analysis added valuable decision information and enabled the contractor and customer to avoid financial risk. The case studies include:
�• Case 1: Increase proposed engineering labor hours, due to assessed risk (page 80) �• Case 2: Bid subcontract estimates without further adjustment (page 81) �• Case 3: Redirect Program Strategy (page 82) �• Case 4: Avoid decrements to proposed manufacturing labor (page 83) �• Case 5: Re Direct Contract EAC and New Statement of Work (page 84) �• Case 6: Re Structure 7 year Operations Contract (page 85) �• Case 7: Cancel IR&D project (page 86) �• Case 8: Reduce Reported Estimates at Completion Profit (EAC) (page 87) �• Case 9: Redirect new program focus (page 87)
4.1.3 Constructing a Risk Estimate The third section of the SSCRH, �“Constructing a Risk Estimate�” describes various tools and techniques used in creating probabilistic cost risk analyses, potential pitfalls, as well as other special topics that are often overlooked or ignored such as correlation and Monte Carlo sampling techniques. Included in this section are brief overviews of the NRO Cost Group (NCG) and Air Force SMC approach for completing complete risk adjusted cost estimates and the NASA General Tenets of Cost Risk (page 90-108).
Mathematical errors related to probability and statistics are the most mistakes in cost risk analysis. Other examples include programmatic assumptions and improper simulation techniques. The SSCAG Cost Risk Handbook outlines all the common mistakes, their impact on cost risk analysis, and how to avoid their potential pitfalls. The handbook also includes a checklist that can be used to critique the cost risk analysis (pages 110-125).
The next chapter (pages 127-134) is based on a selective review of the literature of elicitation, both in the cost risk field and in other areas where elicitation has been a topic of research, primarily statistics and psychology. Because of a lack of empirical work in elicitation, especially in cost risk, the author also interviewed a number of senior people in the cost risk community who gave insight into the practices of the field.
Elicitation in cost risk analysis focuses on obtaining a subjective cost probability distribution directly or (more commonly) eliciting a subjective probability distribution for some project characteristic that is a cost driver, such as weight, power usage, or development schedule. Since these variables are used as independent cost drivers in CERs, the subjective distributions can be used to get a predictive distribution for cost that includes uncertainties in the inputs as well as

Cost Estim
atingC
ost Risk
Economic &
Supporting AnalysisC
areer Developm
ent Guide
Reference
Know
ledge Managem
entC
ost Estimating
Cost R
iskEconom
ic & Supporting Analysis
Career D
evelopment G
uideR
eferenceK
nowledge M
anagement
2008 NASA Cost Estimating Handbook Section 4. Risk Handbook Summaries
Volume 2 Page 2-59
the estimating relationship, and the resulting distributions for subsystems can be added with other cost distributions via Monte Carlo simulation or analytic approaches to get an overall cost probability distribution for the entire project (Garvey, 2000, Arena et al, forthcoming). The SSCRH covers the uses of Elicitation on cost risk analysis including the overall approach and best practices.
The SSCRH provides an overview of the approach and formulas to drive correlation coefficients empirically (pages 137-139). The overview also provides a step by step process to obtaining correlations using the Pearson Product Moment approach, detailed below:
1. Access to the CERs and all of the data used to derive those CERs.
2. Calculate estimates for subsystem nonrecurring and first unit costs for all of the CERS and for all of the programs in the database.
3. Calculate the residuals between actual costs and estimated costs for all of the CERs and for all of the programs in the database.
4. Populate the Pearson Product Moment equation with the pair-wise subsystem residuals.
The final chapter in this section covers the Formal Risk Assessment of System Cost Estimates (FRISK) approach (pages 140-145). FRISK supports cost-risk analysis by allowing the user to statistically sum Work Breakdown Structure (WBS)-element costs, represented by probability distributions, to obtain a probability distribution of total cost.
The mathematical principles of FRISK are defined and covered in detail. The mathematical principles are used to calculate the mean, standard deviation, and the percentiles of total cost. These factors are used to allocate the risk dollars back to the WBS elements. This allocating is based on each WBS element�’s need for risk dollars based on each elements level of uncertainty. This allocation method can be used by analysts to logically defend the risk dollars applied to individual WBS elements and the total estimate.
4.1.4 Cost Risk Examples Using Popular Cost Models The fourth section of the SSCRH, �“Cost Risk Examples Using Popular Cost Models�” shows how cost risk analysis can be performed using the Unmanned Space Vehicle Cost Model (USCM), The NASA/Air Force Cost Model (NAFCOM), PRICE, SEER, the Automated Cost Estimator (ACE) and the Aerospace Corporation Small Satellite Cost Model (SSCM) (pages 147-188).
4.1.5 Bibliography The fifth and final section of the SSCRH contains a comprehensive bibliography of seminal works in cost risk analysis (pages 190-191).
4.2 Air Force Cost Risk and Uncertainty Handbook (AF CRUH) April, 2007
The Air Force Cost Risk and Uncertainty Handbook (AF CRUH) is a first draft handbook that describes acceptable analytical techniques to characterize the uncertainty in cost estimates and to calculate cost risk. This handbook presents a variety of risk analysis methods and procedures, but is not intended to be interpreted as official guidance on how to do risk analysis. The handbook

Cost Estim
atingC
ost Risk
Economic &
Supporting AnalysisC
areer Developm
ent Guide
Reference
Know
ledge Managem
entC
ost Estimating
Cost R
iskEconom
ic & Supporting Analysis
Career D
evelopment G
uideR
eferenceK
nowledge M
anagement
2008 NASA Cost Estimating Handbook Section 4. Risk Handbook Summaries
Volume 2 Page 2-60
provides a comprehensive list of cost uncertainty sources, and specific guidance on how to model them for each of the approaches described (Inputs-Based Simulation, Outputs Based Simulation, and the Scenario Based Approach) with a specific focus on the Inputs-Based Simulation Approach. The handbook also provides metrics for measuring the adequacy of correlation and the coefficient of variation of the overall results, as well as guidance on interpreting and presenting the cost risk results.
4.2.1 Introduction The AF CRUH Introduction section (pages 1-7) discusses the reasons for performing cost risk analysis, pertinent key terminology, and acceptable approaches. The Technical Baseline Estimate (TBE) is defined, as is its importance as an anchor for the cost risk analysis process and its relation to the program of record. Technical Baseline Point Estimate (TBE): It is critical to properly define the structure and content of the point estimate. Essential elements include but are not limited to: capturing all cost elements, developing cost drivers to reflect their most likely value, and ensuring that the model is sensitive to schedule. The handbook provides a simplified TBE WBS that is used throughout the handbook as an illustrative example of cost risk approaches, processes, and reports.
The Introduction section also provides a brief definition, overview, and example of Sensitivity Analysis. Sensitivity Analysis is defined as a systematic approach used to identify the cost impacts of potential changes to one or more of an estimate�’s major input parameters. The objective is to vary input parameters over a range of probable values and recalculate the estimate to determine how sensitive outcomes are to changes in the selected parameters.
Although the handbook states that the Simulation Inputs Approach is the preferred approach, the Introduction section provides a comparison and overview of the Simulation Inputs Approach, Simulation Outputs Approach, and the Scenario Based Approach (Figure 2-44) (AF CRUH page 5).
Allocate, Phase, Report
Technical Baseline Estimate (TBE)
Simulation Scenario Based
Inputs�–Based Analysis
Outputs-Based Analysis Protect Scenario
•CERs•Factors
•CER Inputs (Config)•Other Cost Drivers•Schedule (durations)•CER Adjustments•Correlation•Distribution shape•Skew•Bound Selection•Bound Interpretation
ObjectiveUncertainty
SubjectiveUncertainty
Total EstimateUncertainty
Identify Factors by Cost Element
Correlate FactorsDerive Statistics from TBE Confidence Level
& CV
Figure 2-44. Approaches to Calculate Total Estimate Uncertainty
Cost Estim
atingC
ost Risk
Economic &
Supporting AnalysisC
areer Developm
ent Guide
Reference
Know
ledge Managem
entC
ost Estimating
Cost R
iskEconom
ic & Supporting Analysis
Career D
evelopment G
uideR
eferenceK
nowledge M
anagement
2008 NASA Cost Estimating Handbook Section 4. Risk Handbook Summaries
Volume 2 Page 2-61
4.2.2 Input-Based Simulation Approach The second section of the AF CRUH (pages 7-20) provides a detailed overview of the Inputs-Based Approach. This section covers program/project uncertainties, CER output uncertainty, CER input uncertainty, discrete uncertainties, and technical/schedule uncertainties.
The handbook provides approaches for determining the uncertainties in parametric CERs, CER inputs, and elicitation of subjective bounds. An overview is provided for parametric CERs, including: regression approaches, distribution shapes, distribution bounds, and a discussion on regression statistics.
Elicitation is defined by the handbook as the process of obtaining subjective information from subject matter experts in order to identify the bounds of independent variables in CERs and cost driver elements. The handbook identifies pitfalls, best practices, and default subjective distribution bounds for the Elicitation process on pages 14-15.
Discrete uncertainty is defined (AF CRUH page 17) as a cost impact that has a specified probability of occurrence. The handbook provides two approaches to account for known �“problems�” that have some probability of occurring.
The Handbook discusses the issue of technical and schedule differences between the historical data that serves as the basis of the CER and the project in which the CER is being used. When this is not the case, the handbook provides guidance on CER adjustments that will account for the different technical and schedule challenges faced by the project in question. The handbook recommends developing a cost model that accounts for these differences directly, but provides these factors when doing so is not feasible.
4.2.3 Complete the Simulation Pages 21 through 32 detail the simulation, correlation, and a review and interpretation of the Inputs-Based Simulation Approach outlined in the previous section. This section also provides metrics for determining the adequacy of correlation and metrics for characterizing the overall result using the coefficient of correlation.
The purpose of the simulation is to combine all the uncertainties specified in the model to estimate the total uncertainty at the parent levels. Figure 2-45 and Figure 2-46 illustrate how the simulation process combines uncertainties within the model.
Cost Estim
atingC
ost Risk
Economic &
Supporting AnalysisC
areer Developm
ent Guide
Reference
Know
ledge Managem
entC
ost Estimating
Cost R
iskEconom
ic & Supporting Analysis
Career D
evelopment G
uideR
eferenceK
nowledge M
anagement
2008 NASA Cost Estimating Handbook Section 4. Risk Handbook Summaries
Volume 2 Page 2-62
Cost Driver (Weight)Inputvariable
CostEstimatefor theelement
$
Historical data point
Cost estimating relationship
Prediction interval
Cost = a + bXc
COMBINED CERAND INPUT
UNCERTAINTY
INPUT UNCERTAINTY
CERUNCERTAINTY
Adapted from a chart created by the Aerospace Corp for the NRO
Figure 2-45. Combining Input Uncertainties
Space System NR $516,744.2 (22%)Program Management/System $ 83,978.8 (35%)Payload ()/L) Non Recurring
Payload $128,875.3 (15%)Integration, Assembly, $ 18,526.6 (28%)Software Integration $ 808.5 (20%)
Payload PME NR $109,540.1 (16%)Optical Telescope $ 10,490.2 (34%)
Structure $ 6,850.5 (50%)Electrical $ 3,639.7 (19%)
With suitable adjustments to capture correlation, schedule and technical considerations, the uncertainty associated with all the elements are combined to arrive at the uncertainty for the total estimate.
Figure 2-46. Generating the Statistics of the WBS Parent levels
The risk analysis is not complete until there is an assessment of correlation. If correlation is ignored, the variance at the total levels in the estimate will be understated, in most cases dramatically. The results of the first simulation run can be used to measure the correlation already present in the model due to functional relationships. All the tools permit the user to add additional correlation to model the relationship between cost elements and their associated uncertainty (positively, negatively, or both). For example, when the cost of element A increases due to risk, the cost of element B should also increase and perhaps element F should decrease. This interrelationship between risk impacts is commonly known as "dependency�” or �“correlation.�”
The AF CRUH outlines two types of correlation: functional correlation and applied correlation. Functional correlation is defined as correlation captured through the functional relationships in

Cost Estim
atingC
ost Risk
Economic &
Supporting AnalysisC
areer Developm
ent Guide
Reference
Know
ledge Managem
entC
ost Estimating
Cost R
iskEconom
ic & Supporting Analysis
Career D
evelopment G
uideR
eferenceK
nowledge M
anagement
2008 NASA Cost Estimating Handbook Section 4. Risk Handbook Summaries
Volume 2 Page 2-63
the cost model itself. For example, if the cost of Training is modeled by using a factor times the cost of the Prime Mission Equipment (PME) cost, then by definition Training will be correlated in risk simulation, meaning as PME increases, so will the cost of Training. (AF CRUH page 22) In situations where functional correlation is not captured by the estimating relationships, an applied correlation value must be quantified for the cost elements.
The handbook details an approach used to measure functional correlation using commercially available tools such as Crystal Ball and @Risk in conjunction with Excel. Pages 23-25 of the handbook outlines correlation metrics and steps involved in assessing the functional correlation present in the model, applied correlation, and the impact of both types of correlation on the overall results (Figure 2-47).
Figure 2-47. Impact of Adding Applied Correlation On Top of Functional Correlation
The cumulative distribution function (CDF) is the output of the simulation. The AF CRUH provides guidance on metrics for reviewing and interpreting the results (pages 25-27). The guidance is given in conjunction with summary of the point estimate and risk results of the missile system example.
It is recommended that the analyst examine the coefficient of variation (CV) (a measure of dispersion defined as the standard deviation divided by the mean) of the top-line of each phase of the estimate. Examining lower level elements is desirable; however, the range in acceptable answers is much broader. In general, analysts are likely to be able to compile meaningful ranges of acceptable CV for the overall estimate (by phase) by commodity.
CV is a statistic provided by all the common tools. A higher value indicates a wider dispersion or a flatter s-curve. CVs near 0.15 are indicative of a program with low or modest risks. CVs at 0.35 or above are indicative of a high risk program. Often a small CV of less than 0.15 is an indication of very optimistic ranges or a lack of correlation. CVs larger than 0.35 may be an indication of

Cost Estim
atingC
ost Risk
Economic &
Supporting AnalysisC
areer Developm
ent Guide
Reference
Know
ledge Managem
entC
ost Estimating
Cost R
iskEconom
ic & Supporting Analysis
Career D
evelopment G
uideR
eferenceK
nowledge M
anagement
2008 NASA Cost Estimating Handbook Section 4. Risk Handbook Summaries
Volume 2 Page 2-64
unusually broad distributions. However, these rules-of-thumb are very commodity dependant and a function of where the program is in the life cycle. For instance, a CV of 0.50 would not be unexpected for long range planning estimates. Space programs, as another example, at an early stage of development often exhibit a CV of 0.40 or greater.
Another indicator of the quality of the risk assessment is the confidence level of the point estimate. The point estimate generally falls in the 15% to 30% confidence range. When the point estimate confidence level is very low (<15%) this is often an indication that the CV may also be very low (i.e., insufficient uncertainty). When the point estimate confidence level is greater than 35%, this is often an indication that the point estimate may already be padded with some amount of uncertainty.
The �“Complete the Simulation�” sections of the AF CRUH concludes with a summary of other influences on simulation accuracy (page 27-29) such as seed numbers, simulation sampling approach, and number of iterations. This section also provides a brief discussion on the accounting for risk mitigation plans and references to risk score mapping products (page 32).
4.2.4 How to “Buy” Additional Certainty The fourth section of the AF CRUH (pages 32-34) defines the process of �“buying�” uncertainty by adding risk dollars to the TBE. The handbook defines risk dollars as the amount of funds needed to bring the TBE value up to a selected confidence level. To calculate risk dollars, a desired confidence level must be selected. This level may be mandated or it may be simply an organizational practice. The examples in this section assume a 60% probability level. This section provides a step by step process of determining risk dollars and an illustrative example using the sample Missile system.
4.2.5 How to Allocate and Time Phase Risk Dollars The fifth section of the AF CRUH deals with the issues of lower level WBS element results not summing to the parent level for a specific confidence level and how to allocate the risk dollars over time. Essentially, this section answers the �“where�” and �“when�” questions pertaining to risk dollars.
A recommended risk dollar allocation approach is provided on page 35 and alternative approach is provided on pages 91-92. The recommended approach outlines a step by step process that allocates sub elements to a selected confidence level. The alternative approach is needs based allocation approach that takes into account the lower level elements with the largest right hand tail along with correlation between the elements. The appropriate formulas and example based on the sample Missile System are provided.
Once the risk dollars have been calculated and allocated, the next step is to determine how the risk dollars should be phased. Phasing cost estimates is necessary in order to arrive at annualized values and to properly account for inflation. Several approaches are outlined, including, a proration approach, a backloading approach, a time based approach, and an approach based on confidence level.

Cost Estim
atingC
ost Risk
Economic &
Supporting AnalysisC
areer Developm
ent Guide
Reference
Know
ledge Managem
entC
ost Estimating
Cost R
iskEconom
ic & Supporting Analysis
Career D
evelopment G
uideR
eferenceK
nowledge M
anagement
2008 NASA Cost Estimating Handbook Section 4. Risk Handbook Summaries
Volume 2 Page 2-65
The handbook provides an in depth example (Figure 2-48) of allocating risk dollars based on the selected confidence and phasing the risk dollars (Figure 2-49) level using the sample Missile System.
234567891011121314151617181920212223242526272829303132333435
B C D E G H I J K L M
Point Estimate Std Dev
60% Confidenc
e Level From Risk
Model
Difference Between
Parent and Sum of
Children
Sum of Children's Std Dev
Prorated Difference
to Each Child
Difference Between
Parent (Incl its Additional
Proration) and Sum of
Children
Prorated Difference
to Each Child
Sum of 60% From
Risk Model plus Proration
Difference from
Statistical Result
Missile System $696,344 $231,798 $963,145 $956,398 -0.7% Sys Dev & Demo Phase $164,898 $81,542 $221,766 $171 $87,163 $221,766 0.0% Air Vehicle $111,549 $54,857 $144,041 $63,262 $108 ($173) $144,149 0.1% Design & Development $25,000 $6,509 $31,196 ($18) $31,178 -0.1% Prototypes $9,749 $6,044 $15,674 ($17) $15,657 -0.1% Software $76,800 $50,709 $97,452 ($139) $97,313 -0.1% Sys Engineering/Program Mgmt $21,000 $4,958 $25,732 $10 $25,742 0.0% System Test and Evaluation $22,310 $21,091 $37,562 $41 $37,603 0.1% Training $5,577 $3,680 $8,112 $7 $8,119 0.1% Data $2,231 $1,480 $3,267 $3 $3,270 0.1% Support Equipment $2,231 $1,097 $2,881 $2 $2,883 0.1%
Production Phase $531,212 $181,997 $734,632 ($4,959) $213,354 $734,632 0.0% Air Vehicle $333,396 $74,435 $424,253 $98,189 ($1,730) ($3,774) $422,523 -0.4% Propulsion $11,416 $3,006 $15,065 ($116) $14,949 -0.8% Payload $16,271 $4,499 $21,116 ($173) $20,943 -0.8% Airframe $112,250 $26,776 $119,916 ($1,029) $118,887 -0.9% Guidance and Control $186,979 $61,745 $260,818 ($2,373) $258,445 -0.9% Integration, Assy, Test & Checkout $6,480 $2,163 $9,382 ($83) $9,299 -0.9% Engineering Changes $16,670 $9,092 $24,799 ($211) $24,588 -0.9% Sys Engineering/Program Mgmt $93,351 $94,298 $160,801 ($2,192) $158,609 -1.4% System Test and Evaluation $1,000 $135 $1,074 ($3) $1,071 -0.3% Training $33,340 $16,003 $51,664 ($372) $51,292 -0.7% Data $6,668 $2,400 $9,613 ($56) $9,557 -0.6% Peculiar Support Equipment $6,668 $2,424 $9,611 ($56) $9,555 -0.6% Common Support Equipment $113 $47 $124 ($1) $123 -0.9% Initial Spares and Repair Parts $40,007 $14,520 $57,652 ($337) $57,315 -0.6%G4: =E4-(E5+SUM(E9:E13))H5: =SUM(D6:D8)I5: =$G$4*D5/$H$4J5: =E5+I5-SUM(E6:E8)K6: =$J$5*D6/$H$5L6: =E6+K6
Figure 2-48. Allocating Risk Dollars from the Second Level WBS in the Missile Example

Cost Estim
atingC
ost Risk
Economic &
Supporting AnalysisC
areer Developm
ent Guide
Reference
Know
ledge Managem
entC
ost Estimating
Cost R
iskEconom
ic & Supporting Analysis
Career D
evelopment G
uideR
eferenceK
nowledge M
anagement
2008 NASA Cost Estimating Handbook Section 4. Risk Handbook Summaries
Volume 2 Page 2-66
Total TY $KPoint Estimate $175,472Prorate Risk Consistent with PE Phasing $238,158Risk Phased with 40/60 Beta $239,082
Compare Risk Phasing Impact on SDD Total TY $KRisk $ Allocated from 2nd level of WBS (SDD and Production)
TY $K
$0
$10,000
$20,000
$30,000
$40,000
$50,000
$60,000
$70,000
$80,000
$90,000
2008 2009 2010 2011 2012
Fiscal YearTotal TY $K
Point Estimate $175,472Prorate Risk Consistent with PE Phasing $238,158Risk Phased with 40/60 Beta $239,082
Compare Risk Phasing Impact on SDD Total TY $KRisk $ Allocated from 2nd level of WBS (SDD and Production)
TY $K
$0
$10,000
$20,000
$30,000
$40,000
$50,000
$60,000
$70,000
$80,000
$90,000
2008 2009 2010 2011 2012
Fiscal Year
Figure 2-49. Time Phased Risk Allocated TY Dollars
4.2.6 How to Present the “Risk Story” The sixth section of the AF CRUH provides examples of presenting cost risk results to senior leadership or to a review Agency. The purpose of the risk story presentation is to entail a clear communication of:
�• The nature of the TBE �• General approach of how the uncertainty was defined and, in the case of the simulation
approach, how the bounds and distributions were chosen �• TY dollars (not BY dollars) risk allocated results in graphical format (S-Curve) �• TY dollars, phased allocated result �• Identify the cost drivers that have the most impact on the cost estimate �• Identify the most important contributors to the cost estimate uncertainty and any risk
mitigation initiatives captured by the estimate.
Pages 39-41 provide sample charts related to the sample Missile System. The handbook makes note that the charts present risk results without mention of �“risk dollars.�”
4.2.7 Alternatives to the Inputs-Based Simulation Approach The seventh section of the AF CRUH (pages 41-44) discusses alternatives to the inputs based simulation approach, including the outputs based simulation approach and the scenario bases approach. Considerations that would lead an analyst to choose to apply Outputs-Based Simulation or the Scenario Based approach include: available data, available resources, available

Cost Estim
atingC
ost Risk
Economic &
Supporting AnalysisC
areer Developm
ent Guide
Reference
Know
ledge Managem
entC
ost Estimating
Cost R
iskEconom
ic & Supporting Analysis
Career D
evelopment G
uideR
eferenceK
nowledge M
anagement
2008 NASA Cost Estimating Handbook Section 4. Risk Handbook Summaries
Volume 2 Page 2-67
schedule, the complexity of the estimate, and the consequences of �“less precise results.�” The AF CRUH recommends the Inputs-Based simulation approach for conducting cost risk analysis. A sound rationale for diverting from this approach is required if either of the following approaches are chosen as the primary approach.
The Outputs-Based Simulation approach (Table 2-2) is used to apply uncertainty directly to the results (cost model outputs). By use of uncertainty distributions on the outputs, the aggregate uncertainty of both the approaches and the inputs is addressed.
Table 2-2. Example Application of Outputs-Based Simulation Set-up
WBS Description Simulation
Point Estimate
(PE)
Output Uncertainty
Median Distribution
Form 85% High
Subjective Uncertainty
Payload PE * Uncertainty $11,416 1 Lognormal 1.168 Low
Propulsion PE * Uncertainty $16,271 1 Lognormal 1.168 Low
Airframe PE * Uncertainty $112,250 1 Lognormal 1.296 Medium
Guidance & Control PE * Uncertainty $186,979 1 Lognormal 1.296 Medium
The Scenario Based Approach (SBM) (Figure 2-50) postulates on specified scenarios that, if they occurred, would result in costs higher than the level planned or budgeted. These scenarios do not have to represent worst cases; rather, they should reflect a set of conditions a Program Manager or decision-maker would want to budget for, should any or all of those conditions occur.
Non-Statistical SBM
Input: Program�’s Point Estimate
Cost (PE)
Define a Protect
Scenario (PS)
Management Decision
Compute PS Cost and Cost Reserve CR Based on PS
Cost and PE
Start
Management Decision
Iterate/Refine PS
RejectPS
Accept PS
Iterate/Refine PS Cost
Accept CR
Figure 2-50. A Nonstatistical Scenario-Based Approach
The process of defining scenarios is a good practice. It builds the supportive rationale and provides a traceable and defensible analytical basis behind a �“derived�” measure of cost risk; this is often lacking in traditional simulation approaches. Visibility, traceability, defensibility, and the cost impacts of specifically identified risks are principal strengths of the SBM.
The handbook provides references to outside sources and further details in the handbook�’s reference section (pages 46-48) and appendices (pages 109-111).
4.2.8 A Discussion on How to Select a Funding Level The AF CRUH provides a discussion on project confidence levels and how the values from coupled projects can affect the confidence level of a program (pages 44-45). This is sometimes referred to as the �“portfolio effect�”, which is defined as the risk on a well-diversified holding of

Cost Estim
atingC
ost Risk
Economic &
Supporting AnalysisC
areer Developm
ent Guide
Reference
Know
ledge Managem
entC
ost Estimating
Cost R
iskEconom
ic & Supporting Analysis
Career D
evelopment G
uideR
eferenceK
nowledge M
anagement
2008 NASA Cost Estimating Handbook Section 4. Risk Handbook Summaries
Volume 2 Page 2-68
investments to fall below the risk of most of its individual components. The handbook does not dictate a confidence level to which Air Force programs should be funded and no official policy guidance exists for this topic. In the absence of such guidance it is not uncommon for Air Force programs to seek to budget at the 50% confidence level. However, an argument for funding to the 60% confidence level is provided.
The handbook provides various statistics for four programs with varying levels of dispersion. The cost uncertainty distributions presented in the handbook represent the most likely estimate with the mean estimate to its right.
Table 2-3. Program Probabilities
WBS Description
SE in Log
Space
Unit Space Stdev Mean
Median (50/50)
Probability of Mean
Mean / 50/50
60% Value/ 50/50
Low Dispersion 0.150 0.153 1.011 1.000 53% 1.011 1.039
Med Dispersion 0.250 0.262 1.032 1.000 55% 1.032 1.065
High Dispersion 0.350 0.384 1.063 1.000 57% 1.063 1.093
Very High Dispersion 0.450 0.524 1.107 1.000 59% 1.107 1.121
The handbook addresses the analysis of portfolios sized with five, ten, or twenty programs with High Dispersion. The handbook�’s table shows assumptions of programs funded at probabilities of 50%, 60%, 70%, and 80%. The third column shows the overall portfolio confidence level of each case with the programs uncorrelated. The fourth column shows the same but with the programs correlated at 25%. Note the results in each case where the constituent programs were funded at 60%. The portfolio probability is near 60% as well. And note that if the portfolio is comprised of ten or more programs the expected result approximately doubles that of a portfolio of programs funded to 50%. (Table 2-4)
Table 2-4. Portfolio Probabilities
Portfolio Probability
# Projects
Project Probability
No correlation
0.25 Correlation
5 50% 38% 40%
5 60% 61% 59%
5 70% 80% 78%
5 80% 94% 92%
10 50% 32% 36%
10 60% 62% 61%
10 70% 87% 83%
10 80% 98% 96%
20 50% 24% 32%
20 60% 65% 61%
20 70% 94% 86%
20 80% 99% 98%

Cost Estim
atingC
ost Risk
Economic &
Supporting AnalysisC
areer Developm
ent Guide
Reference
Know
ledge Managem
entC
ost Estimating
Cost R
iskEconom
ic & Supporting Analysis
Career D
evelopment G
uideR
eferenceK
nowledge M
anagement
2008 NASA Cost Estimating Handbook Section 4. Risk Handbook Summaries
Volume 2 Page 2-69
4.2.9 References The final section of the AF CRUH provides a list of outside references, an extensive definitions list, a detailed guidance section, Missile System examples runs in @Risk, Ace, and Crystal Ball, and Acronym list.
The definitions appendix (pages 49-92) presents definitions for technical terms used throughout the handbook. This appendix elaborates on many of the terms both mathematically and graphically in order to clarify their use in the handbook.
The detailed guidance appendix (pages 93-111) expands on the information in the body of the handbook with additional detail that would have otherwise made it too cumbersome. The paragraphs in this appendix correspond to those of the handbook body for quick reference.
The Missile System appendix (pages 112-161) presents a hypothetical missile system example using @RISK, ACE, and Crystal Ball. These sections are not intended to be a tutorial of these models, but meant only to illustrate the use of guidance contained in the body of the Air Force Cost Risk and Uncertainty Handbook.
An Acronym list is provides on (pages 162-163) and contains �“A Scenario-Based Method for Cost Risk Analysis�”, by Paul Garvey (pages 164-187).

Volume 3 –Economic & Supporting Analysis
2008 NASA Cost Estimating Handbook

Cost Estim
atingC
ost Risk
Economic &
Supporting AnalysisC
areer Developm
ent Guide
Reference
Know
ledge Managem
entC
ost Estimating
Cost R
iskEconom
ic & Supporting Analysis
Career D
evelopment G
uideR
eferenceK
nowledge M
anagement
2008 NASA Cost Estimating Handbook Contents
Volume 3 Page 3-i
Volume 3 Economic and Supporting Analysis
Table of Contents
Section 1. Economic Analysis ........................................................................................................... 3-1 1.1 Inflation .................................................................................................................................. 3-1
1.1.1 Definition................................................................................................................. 3-1 1.1.2 How to Apply Inflation ......................................................................................... 3-1 1.1.3 Additional Resources ............................................................................................. 3-2
1.2 Trade Studies......................................................................................................................... 3-3 1.2.1 Definition................................................................................................................. 3-3 1.2.2 Steps for Performing a Trade Study..................................................................... 3-3 1.2.3 Additional Resources ............................................................................................. 3-4
1.3 Cost as an Independent Variable (CAIV) .......................................................................... 3-4 1.3.1 Definition................................................................................................................. 3-4 1.3.2 Steps in the CAIV Approach................................................................................. 3-5 1.3.3 Additional Resources ............................................................................................. 3-6
1.4 Learning Curves.................................................................................................................... 3-6 1.4.1 Definition................................................................................................................. 3-7 1.4.2 Calculating the Learning Curve ........................................................................... 3-7 1.4.3 Additional Resources for Learning Curves ........................................................ 3-8
1.5 Spreading Model (Based on Beta Curve)........................................................................... 3-9 1.5.1 Beta Curve Definition ............................................................................................ 3-9 1.5.2 Methodology ........................................................................................................... 3-9 1.5.3 Additional Resources ............................................................................................. 3-11
1.6 Business Case Analysis ........................................................................................................ 3-11 1.6.1 Definition................................................................................................................. 3-11 1.6.2 BCA Methodology.................................................................................................. 3-12 1.6.3 Additional Resources ............................................................................................. 3-13
1.7 Present Value......................................................................................................................... 3-14 1.7.1 Definition................................................................................................................. 3-14 1.7.2 Calculating Present Value ..................................................................................... 3-14 1.7.3 Additional Resources ............................................................................................. 3-16
1.8 Net Present Value (NPV) ..................................................................................................... 3-16 1.8.1 Definition................................................................................................................. 3-16 1.8.2 Calculating NPV..................................................................................................... 3-17 1.8.3 Additional Resources ............................................................................................. 3-18
1.9 Return on Investment (ROI) Metrics.................................................................................. 3-18 1.9.1 Definition................................................................................................................. 3-18 1.9.2 Maximizing ROI ..................................................................................................... 3-19 1.9.3 Additional Resources ............................................................................................. 3-20
1.10 Schedule Analysis................................................................................................................. 3-20 1.10.1 Definition................................................................................................................. 3-20 1.10.2 Purpose .................................................................................................................... 3-21 1.10.3 Obtaining a Complete Schedule ........................................................................... 3-21 1.10.4 Good Scheduling Practices.................................................................................... 3-22 1.10.5 Analysis Methods ................................................................................................... 3-23 1.10.6 How Schedule Affects Cost................................................................................... 3-26

Cost Estim
atingC
ost Risk
Economic &
Supporting AnalysisC
areer Developm
ent Guide
Reference
Know
ledge Managem
entC
ost Estimating
Cost R
iskEconom
ic & Supporting Analysis
Career D
evelopment G
uideR
eferenceK
nowledge M
anagement
2008 NASA Cost Estimating Handbook Contents
Volume 3 Page 3-ii
1.10.7 Additional Resources ............................................................................................. 3-26 1.11 Earned Value Management (EVM) .................................................................................... 3-26
1.11.1 Definition................................................................................................................. 3-27 1.11.2 Steps in the EVM Process ...................................................................................... 3-27 1.11.3 Additional Resources ............................................................................................. 3-28
1.12 Affordability .......................................................................................................................... 3-28 1.12.1 Definition................................................................................................................. 3-28 1.12.2 Determining Affordability .................................................................................... 3-29 1.12.3 Additional Resources ............................................................................................. 3-29
1.13 Real Option Valuation.......................................................................................................... 3-29 1.13.1 Definition................................................................................................................. 3-30 1.13.2 Calculating the Value of a Real Option ............................................................... 3-30 1.13.3 Additional Real Option Valuation Reference ..................................................... 3-31
1.14 Lease Versus Buy Analysis.................................................................................................. 3-31 1.14.1 Definition................................................................................................................. 3-31 1.14.2 Lease Versus Buy Approach Considerations...................................................... 3-32 1.14.3 Additional Resources ............................................................................................. 3-32
Section 2. Other Cost Estimating Considerations......................................................................... 3-33 2.1 Full Cost Accounting............................................................................................................ 3-33
2.1.1 Overview of Budget Planning in Full Cost ......................................................... 3-35 2.1.2 Service Pools............................................................................................................ 3-36 2.1.3 Summary.................................................................................................................. 3-36 2.1.4 For Further Information......................................................................................... 3-36
2.2 Construction of Facilities ..................................................................................................... 3-37 2.2.1 Overview of the CoF Process ................................................................................ 3-38
2.3 Software Estimating ............................................................................................................. 3-39 2.3.1 Function Point Analysis (FPA) ............................................................................. 3-40 2.3.2 Effort Estimation..................................................................................................... 3-41 2.3.3 Parametric Model Based Estimates ...................................................................... 3-43
2.4 Estimating Operations and Support................................................................................... 3-44 2.4.1 Estimating O&S Costs for New Systems............................................................. 3-45 2.4.2 Operations and Support Cost Estimation Issues/Challenges.......................... 3-47 2.4.3 Understanding the Supply Chain ........................................................................ 3-48 2.4.4 Additional Resources ............................................................................................. 3-49
Figures and Tables
Figure 3-1. NASA New Start Inflation Index Excerpt and Example Calculations......................... 3-2 Figure 3-2. Cost versus Performance ................................................................................................... 3-3 Figure 3-3. CAIV Process Tailored to NASA ...................................................................................... 3-5 Figure 3-4. CAIV Trade Space............................................................................................................... 3-6 Figure 3-5. Beta Curve Cost Spreading............................................................................................... 3-10 Figure 3-6. BCA Framework.................................................................................................................. 3-12 Figure 3-7. Cost Benefit Analysis Framework .................................................................................... 3-12 Figure 3-8. Relationship between Present Value, Base Year, and Budget Year Dollars................ 3-15 Figure 3-9. Compounding and Discounting ....................................................................................... 3-16

Cost Estim
atingC
ost Risk
Economic &
Supporting AnalysisC
areer Developm
ent Guide
Reference
Know
ledge Managem
entC
ost Estimating
Cost R
iskEconom
ic & Supporting Analysis
Career D
evelopment G
uideR
eferenceK
nowledge M
anagement
2008 NASA Cost Estimating Handbook Contents
Volume 3 Page 3-iii
Figure 3-10. Example of Discounting................................................................................................... 3-16 Figure 3-11. Net Present Value Calculation Example........................................................................ 3-18 Figure 3-12. Discounted Pay Back Period............................................................................................ 3-19 Figure 3-13. Gantt or Bar Chart............................................................................................................ 3-24 Figure 3-14. PERT Chart / Logic Diagram......................................................................................... 3-24 Figure 3-15. Full Cost Simplification Methodology ........................................................................... 3-34 Figure 3-16. Function Point Analysis Summary Diagram ................................................................ 3-40 Figure 3-17. The Dual Modes of O&S Cost Estimating ..................................................................... 3-44 Figure 3-18. GOTS O&S Cost Model Capability................................................................................. 3-46 Table 3-1. Slope by Industry.................................................................................................................. 3-8 Table 3-2. Types of Business Case Analysis: From the GAO Cost Assessment Guide ................ 3-13 Table 3-3. Full Cost Points of Contact .................................................................................................. 3-36 Table 3-4. Converting Between Physical and Logical SLOC ............................................................ 3-40 Table 3-5. Function Point Advantages and Disadvantages .............................................................. 3-41 Table 3-6. Effort Adjustment Multipliers for Software Heritage...................................................... 3-42 Table 3-7. Software Development Productivity for JPL and NASA Average Projects
(Equivalent Logical SLOC) ............................................................................................. 3-42 Table 3-8. Software Development Productivity for Industry Average Projects (Equivalent
Logical SLOC) .................................................................................................................. 3-43

Cost Estim
atingC
ost Risk
Economic &
Supporting AnalysisC
areer Developm
ent Guide
Reference
Know
ledge Managem
entC
ost Estimating
Cost R
iskEconom
ic & Supporting Analysis
Career D
evelopment G
uideR
eferenceK
nowledge M
anagement
2008 NASA Cost Estimating Handbook Section 1. Economic Analysis
Volume 3 Page 3-1
Section 1. Economic Analysis
One of the most important tasks for a cost analyst at NASA occurs when he or she performs the analyses described in this volume. These analyses help to make �“apples to apples�” comparisons of competing alternatives, and allow NASA cost analysts to present investment determinations and subsequent recommendations to decision makers on how estimated costs, benefits, and risks interact with each other for each alternative under consideration.
This volume presents various economic analyses used by NASA cost analysts in the course of their daily work in addition to other cost estimating techniques. Each section presented in this volume first defines the economic analysis or cost estimating technique, presents how the economic analysis or cost estimating technique is done, and concludes with additional resources for the NASA cost analyst to turn to for more information or in-depth discussions.
1.1 Inflation NASA programs and projects cover many years. To have a meaningful discussion of cost, it is important that cost analysts calculate and apply inflation to their cost estimates.
1.1.1 Definition Inflation refers to a general rise in prices measured against a standard level of purchasing power and is measured by comparing two sets of goods at two points in time, and computing the increase in cost.
1.1.2 How to Apply Inflation The NASA New Start Inflation Index has been created for the purposes of estimating new efforts and for normalizing historical cost from prior missions. The factors contained in this index should not be used to estimate NASA Civil Servant personnel costs or if a contract is currently in place. Defense Contract Audit Agency (DCAA)-approved forward pricing indices should be used for all efforts that are already under contract.
Inflation refers to a general rise in prices measured against a standard level of purchasing power and is measured by comparing two sets of goods at two points in time, and computing the increase in cost.

Cost Estim
atingC
ost Risk
Economic &
Supporting AnalysisC
areer Developm
ent Guide
Reference
Know
ledge Managem
entC
ost Estimating
Cost R
iskEconom
ic & Supporting Analysis
Career D
evelopment G
uideR
eferenceK
nowledge M
anagement
2008 NASA Cost Estimating Handbook Section 1. Economic Analysis
Volume 3 Page 3-2
Figure 3-1 is an example of the calculation performed by the NASA New Start Inflation Index�’s Excel spreadsheet. The first example shows the escalation of costs, using inflation factors, from 1999 (Base Year [BY]13) to 2007 (Then Year [TY]14). The second example shows the discounting of costs from 2007 (BY) to 1999 (TY). It is important to note that the NASA New Start Inflation Index provides the compounded inflation rate given a specified BY and TY (e.g., the compounded inflation rate for a 1999 BY and a 2007 TY is 30.534%).
1.1.3 Additional Resources NASA New Start Inflation Index is updated annually on the NASA Cost Analysis
Steering Group website (requires membership) https://secureworkgroups.grc.nasa.gov/casg?go=156800
13 A point of reference year whose prices form the basis for adjusting costs or prices from other years. 14 Includes a slice of inflation to cover escalation of expenditures over a multiyear period.
YearFrom 1999To 2007
YEAR 1999 2000 2001 2002 2003 2004 2005 2006 2007INFL.RATE 2.0% 3.3% 3.3% 3.5% 3.9% 4.2% 3.0% 2.7% 3.2%FACTORS 1.020 1.033 1.033 1.035 1.039 1.042 1.030 1.027 1.032
= 1.033 * 1.033 * 1.035 * 1.039 * 1.042 * 1.030 * 1.027 * 1.032= 1.30534
Base Year (1999) CostThen Year (2007) Cost = 125,000 * 1.30534
YearFrom 2007To 1999
YEAR 1999 2000 2001 2002 2003 2004 2005 2006 2007INFL.RATE 2.0% 3.3% 3.3% 3.5% 3.9% 4.2% 3.0% 2.7% 3.2%FACTORS 1.020 1.033 1.033 1.035 1.039 1.042 1.030 1.027 1.032
= 1 /(1.033 * 1.033 * 1.035 * 1.039 * 1.042 * 1.030 * 1.027 * 1.032)= 0.76608
Base Year (2007) CostThen Year (1999) Cost = 125,000 * 0.76608
Amount
95,760.00$
100.000130.534
100.00076.608
Amount
125,000.00$ 163,167.50$
125,000.00$
Figure 3-1. NASA New Start Inflation Index Excerpt and Example Calculations
Cost Estim
atingC
ost Risk
Economic &
Supporting AnalysisC
areer Developm
ent Guide
Reference
Know
ledge Managem
entC
ost Estimating
Cost R
iskEconom
ic & Supporting Analysis
Career D
evelopment G
uideR
eferenceK
nowledge M
anagement
2008 NASA Cost Estimating Handbook Section 1. Economic Analysis
Volume 3 Page 3-3
1.2 Trade Studies Trade studies are at the heart of the affordability process, and their solutions are often represented in a multi-dimensional trade space bounded by a cost element and by one or more performance parameters. Figure 3-2 illustrates a simplified, two-dimensional trade space15 with a plot connecting candidate design alternatives. A multi-dimensional trade space may be substituted to show the interaction of multiple cost drivers, including performance, schedule, and risk.
Solutions (data points) at the far left of the trade space may show alternatives that look attractive from a cost perspective but that may not satisfy even the threshold (minimal required) performance requirements. Similarly, data points at the far right may be alternatives that exceed the threshold cost boundary, only to provide performance beyond the requirement, which may not justified.
1.2.1 Definition Cost/performance trade studies are systematic, interdisciplinary examinations of the factors affecting system costs. These studies are accomplished by analyzing numerous system concepts to find acceptable ways to attain necessary performance while balancing essential requirements that must be satisfied for the system to be successful. The objective of the cost performance trade study is not to minimize the cost of the system, but to achieve a specified level of cost reduction established by the target costing system. Conducting cost/performance trade studies is one of the most effective means used, especially in the early life cycle phases, to define a system, to help narrow the universe of potential technologies, processes, and/or operational concepts, to the most optimal solution.
1.2.2 Steps for Performing a Trade Study Cost estimates are key inputs during cost/performance trade studies, used to determine the most realistic and cost effective mission architectures and system designs. The objective of a trade study is to obtain the merit of the worth (in a single figure) of each candidate and to select the one having the greatest relative value. The steps of conducting a trade study include:
1. Define the purpose. 2. State the problem. 3. Describe the selection scheme and criteria used. 4. Define the alternatives.
15 In real life, the alternatives shown may not be readily connected because their attributes are not orthogonal, but it helps to sort
them out by establishing which alternatives offer only marginal performance improvement with relatively large cost expenditures.
Figure 3-2. Cost versus Performance

Cost Estim
atingC
ost Risk
Economic &
Supporting AnalysisC
areer Developm
ent Guide
Reference
Know
ledge Managem
entC
ost Estimating
Cost R
iskEconom
ic & Supporting Analysis
Career D
evelopment G
uideR
eferenceK
nowledge M
anagement
2008 NASA Cost Estimating Handbook Section 1. Economic Analysis
Volume 3 Page 3-4
5. Estimate the costs and assess the performance of each alternative 6. Determine the preferred approach. 7. Formulate recommendation(s).
A cost/performance trade within a CAIV study (described in Section 1.4 below) can be viewed as being a special application of the cost/performance trade, one in which the cost is fixed, (i.e., independent) and the three other variables in the CAIV �“equation�”, performance, schedule and risk levels, are dependent on that fixed cost. A less formal process than a traditional CAIV analysis can also be considered and used, if appropriate. Referred to as Business Case Analysis and Cost-Effectiveness Analysis (described in Section 1.8), this discipline covers studies often referred to as Target Costing and Value Engineering.
1.2.3 Additional Resources NPR 7120.5 NASA Program and Project Management Processes and Requirements
http://nodis.hq.nasa.gov/displayDir.cfm?Internal_ID=N_PR_7120_005D_
OMB Circular A-94 http://www.whitehouse.gov/omb/circulars/a094/a094.html
1.3 Cost as an Independent Variable (CAIV) The purpose of a CAIV study is to ensure that an affordable design solution meets threshold performance requirements. One key tenet to remember is that design can converge on cost rather than allowing cost to converge on design. In applying the CAIV process, NASA program leadership will be able to demonstrate the following:
�• Performance is not sacred and certain performance requirements may be challenged if significant cost savings are possible
�• The CAIV process continually challenges the requirements when affordability is at stake
1.3.1 Definition CAIV is a system acquisition process that the U.S. government embraced in the mid-1990s to counter massive program acquisition and sustainment cost overruns. This process has been adopted by aerospace and NASA contractors; a similar process is applied in commercial practice, where it is typically identified as �“target costing�” or �“target pricing.�” CAIV results can help the Project Office, working with its acquisition staff, develop robust incentives proposed within any contract for achieving cost reduction objectives. This requires a system of performance metrics to facilitate progress tracking and evaluation.

Cost Estim
atingC
ost Risk
Economic &
Supporting AnalysisC
areer Developm
ent Guide
Reference
Know
ledge Managem
entC
ost Estimating
Cost R
iskEconom
ic & Supporting Analysis
Career D
evelopment G
uideR
eferenceK
nowledge M
anagement
2008 NASA Cost Estimating Handbook Section 1. Economic Analysis
Volume 3 Page 3-5
1.3.2 Steps in the CAIV Approach Figure 3-3 depicts, at a high level, the CAIV process tailored to NASA.
Step 1 involves high-level planning and development of the CAIV/Total Ownership Cost (TOC) methodology that the contractor will use, the establishment of coarse goals and broad responsibilities, and agreement (buy-in) on CAIV procedures that the contractor will follow.
Step 2 involves CAIV training for systems engineers, technical discipline engineers, and managers within NASA. In order to for CAIV to be applied accurately and consistently, it is important that awareness training be provided at all levels. CAIV is tied closely to the existing parametric estimating process within the NASA Centers and its cost analysis support contractors.
Step 3 uses the cost baseline for the program and holds that variable (cost) constant while allowing identified cost drivers to be manipulated to see their effect on cost. A hierarchy of affordability metrics can be derived from this baseline as an outcome of the CAIV and consists of the following:
�• Cost Targets �– absolute values of cost, with a probability dimension, for specific programs, phases, contracts, or activities. An example of a Cost Target is to procure the Crew Exploration Vehicle (CEV) for a total acquisition cost of $9B (in Constant Year 2007 dollars), including all government and contractor expenses. Cost Targets can be expressed as a range of values that bound the �“trade space;�” the boundaries can be defined as follows:
�– Threshold Cost �– the absolute highest cost allowable for an element if overall program estimated LCC goals can be achieved. Breaching the threshold cost gives reason to cancel the element or project
�– Objective Cost �– a lower Cost Target that would be more difficult to achieve but that could offset overruns elsewhere in the program architecture
�– Cost Performance Measures (CPMs) �– measures that combine absolute cost values with relevant performance measures. Examples include dollars per mission or flight, dollars per equivalent source line of software code (SLOC) developed or maintained, and dollars per pound of hardware developed or produced. These measures will change over time to reflect changing requirements, evolving design, and maturation of the program
Figure 3-3. CAIV Process Tailored to NASA
Cost Estim
atingC
ost Risk
Economic &
Supporting AnalysisC
areer Developm
ent Guide
Reference
Know
ledge Managem
entC
ost Estimating
Cost R
iskEconom
ic & Supporting Analysis
Career D
evelopment G
uideR
eferenceK
nowledge M
anagement
2008 NASA Cost Estimating Handbook Section 1. Economic Analysis
Volume 3 Page 3-6
Step 4 integrates CAIV trades with the mainstream of systems engineering trades. When managers have a complete understanding of system-level cost drivers and the application of experience-calibrated parametric cost estimating models, they can oversee the trade process, ensuring that affordable design options are identified and objectively considered in the trade process.
Figure 3-4 demonstrates the overall trade space that is defined by the objective and threshold performance parameters, as well as by the objective and threshold cost values. If enough alternatives can be compared, their relationship might indicate a curve that may detect the �“knee,�” or point of diminishing return, i.e., where a slight performance improvement incurs an unacceptable cost increase. Initial performance-cost trades may be limited to the Key Driving Requirements (KDR) to focus on primary cost drivers and to validate (or challenge) the main requirements based on affordability.
1.3.3 Additional Resources Cost As An Independent Variable (CAIV) Principles and Implementation
http://ceh.nasa.gov/downloadfiles/NASA_CEH_Downloadable_Files.htm#NASA_CEH_Downloadable_Files_2.htm
Cost as an Independent Variable: Principles and Implementation http://www.dau.mil/pubs/arq/2000arq/kaye.pdf
Controlling Costs �– A Historical Perspective http://www.dau.mil/pubs/pm/pmpdf96/kausal2.pdf
1.4 Learning Curves Learning curves, sometimes referred to as improvement curves or progress functions, are based on the concept that resources required to produce each additional unit decline as the total number of units produced increases.
Figure 3-4. CAIV Trade Space

Cost Estim
atingC
ost Risk
Economic &
Supporting AnalysisC
areer Developm
ent Guide
Reference
Know
ledge Managem
entC
ost Estimating
Cost R
iskEconom
ic & Supporting Analysis
Career D
evelopment G
uideR
eferenceK
nowledge M
anagement
2008 NASA Cost Estimating Handbook Section 1. Economic Analysis
Volume 3 Page 3-7
1.4.1 Definition The learning curve concept is used primarily for uninterrupted manufacturing and assembly tasks, which are highly repetitive and labor intensive. The learning curve effect states that the more times a task has been performed, the less time will be required on each subsequent iteration.
1.4.2 Calculating the Learning Curve The major premise of learning curves is that each time the product quantity doubles the resources (labor hours) required to produce the product will reduce by a determined percentage of the prior quantity resource requirements. This percentage is referred to as the curve slope. Simply stated, if the curve slope is 90% and it takes 100 hours to produce the first unit then it will take 90 hours to produce the second unit. As the quantity doubles (from 1 to 2) the resource requirement reduces from 100 to 90 (100 * 90%).
The two types of learning curve approaches are the cumulative average curve and the unit curve. The main difference between the two approaches is as indicated by their names, the cumulative average curve calculates the average unit value for the entire curve to a set point while the unit curve calculates the unit value for a specific quantity point. In other words, in the cumulative average curve, the cumulative average cost is reduced by the some constant percentage and in the unit curve, unit cost is reduced by the same constant percentage.
Over the first few units, the cumulative average curve equation will show a much greater reduction in cost than an operation following unit curve equation using the same slope. This difference decreases as the quantity increases.
Learning curve analysis is primarily used in situations that provide an opportunity for improvement or reduction in labor hours per unit. The following list illustrates some circumstances where it is appropriate to use learning curves:
�• High proportion of manual labor �• Uninterrupted production �• Production of complex items �• No major technological change during the production repetitions �• Continuous pressure to improve
Cumulative Average Curve (T.P. Wright, traditional approach) calculates average unit value of production lot:
Y = Cum average unit value of the Xth unit
A = Theoretical first unit value (T1) X = Cumulative Number of Units b = Log(slope)/Log (2)
Unit Curve (J.R. Crawford / Boeing Approach) calculates unit value of specific point on curve:
Y = Unit value of the Xth unit A = Theoretical first unit value (T1) bXAY *
bXAY *
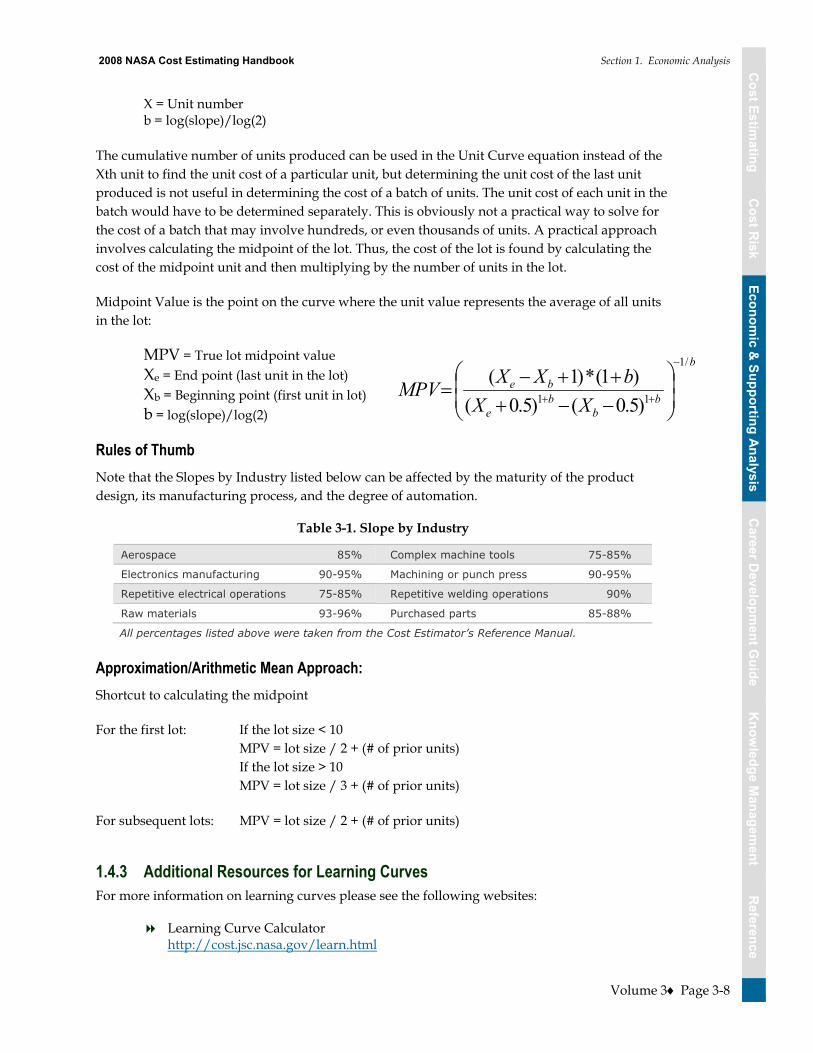
Cost Estim
atingC
ost Risk
Economic &
Supporting AnalysisC
areer Developm
ent Guide
Reference
Know
ledge Managem
entC
ost Estimating
Cost R
iskEconom
ic & Supporting Analysis
Career D
evelopment G
uideR
eferenceK
nowledge M
anagement
2008 NASA Cost Estimating Handbook Section 1. Economic Analysis
Volume 3 Page 3-8
X = Unit number b = log(slope)/log(2)
The cumulative number of units produced can be used in the Unit Curve equation instead of the Xth unit to find the unit cost of a particular unit, but determining the unit cost of the last unit produced is not useful in determining the cost of a batch of units. The unit cost of each unit in the batch would have to be determined separately. This is obviously not a practical way to solve for the cost of a batch that may involve hundreds, or even thousands of units. A practical approach involves calculating the midpoint of the lot. Thus, the cost of the lot is found by calculating the cost of the midpoint unit and then multiplying by the number of units in the lot.
Midpoint Value is the point on the curve where the unit value represents the average of all units in the lot:
MPV = True lot midpoint value Xe = End point (last unit in the lot) Xb = Beginning point (first unit in lot) b = log(slope)/log(2)
Rules of Thumb
Note that the Slopes by Industry listed below can be affected by the maturity of the product design, its manufacturing process, and the degree of automation.
Table 3-1. Slope by Industry
Aerospace 85% Complex machine tools 75-85%
Electronics manufacturing 90-95% Machining or punch press 90-95%
Repetitive electrical operations 75-85% Repetitive welding operations 90%
Raw materials 93-96% Purchased parts 85-88%
All percentages listed above were taken from the Cost Estimator’s Reference Manual. Approximation/Arithmetic Mean Approach:
Shortcut to calculating the midpoint
For the first lot: If the lot size < 10 MPV = lot size / 2 + (# of prior units) If the lot size > 10 MPV = lot size / 3 + (# of prior units)
For subsequent lots: MPV = lot size / 2 + (# of prior units)
1.4.3 Additional Resources for Learning Curves For more information on learning curves please see the following websites:
Learning Curve Calculator http://cost.jsc.nasa.gov/learn.html
b
bb
be
be
XXbXXMPV
/1
11 )5.0()5.0()1(*)1(

Cost Estim
atingC
ost Risk
Economic &
Supporting AnalysisC
areer Developm
ent Guide
Reference
Know
ledge Managem
entC
ost Estimating
Cost R
iskEconom
ic & Supporting Analysis
Career D
evelopment G
uideR
eferenceK
nowledge M
anagement
2008 NASA Cost Estimating Handbook Section 1. Economic Analysis
Volume 3 Page 3-9
Article on The Learning Curve http://www.computerworld.com/news/2001/story/0,11280,61762,00.html
Department of Energy Office of Science Article on Learning Curves http://www.sc.doe.gov/sc-80/sc-82/430-1/430-1-chp21.pdf
Defense Procurement & Acquisition Policy Contract Pricing Reference Guide http://guidebook.dcma.mil/22/dc05-138.htm
FAA Pricing Handbook http://fast.faa.gov/pricing/98-30c18.htm
1.5 Spreading Model (Based on Beta Curve) The Beta curve, also known as the Beta distribution curve, was developed at Johnson Space Center (JSC) in the 1960s. It is used for spreading parametrically derived cost estimates and for Research and Development (R&D) type contracts where costs build up slowly during the initial phases, and then escalate as the midpoint of the contract approaches.
1.5.1 Beta Curve Definition A Beta curve is a combination of percent spent against percent time elapsed between two points in time. Although the actual mathematical formulation of the Beta curve is somewhat complicated, its shape can be specified by two easy-to-understand parameters: cost fraction, or the fraction of dollars spent by 50% time; and a peakedness coefficient, a measure of the peakedness of the curve shape.
1.5.2 Methodology As an example, if estimating the software for a satellite program, a rule of thumb is to use a 60/40 Beta curve (60% of the funds spent in the first half of the project and the other 40% in the second half) for space software costs and 40/60 Beta Curve (40% of the funds spent in the first half of the project and the other 60% in the second half) for ground software costs spread between two designated dates (e.g., January 1, 2002 to December 31, 2006). This example is mapped out on the table below.
Beta Curve Cost Spread Factors Spread Factor Categories �• (First Half/Second Half) �• 50:50 �• 60:40 (40:60 use percents in reverse sequence) �• 70:30 (30:70, use percents in reverse sequence) Annual Factor (percent) By Year
SPREAD Yrs 1 2 3 4 5 6 7 8 9 10
50:50 1 100
2 50 50
3 21 58 21
4 10 40 40 10
5 6 26 36 26 6

Cost Estim
atingC
ost Risk
Economic &
Supporting AnalysisC
areer Developm
ent Guide
Reference
Know
ledge Managem
entC
ost Estimating
Cost R
iskEconom
ic & Supporting Analysis
Career D
evelopment G
uideR
eferenceK
nowledge M
anagement
2008 NASA Cost Estimating Handbook Section 1. Economic Analysis
Volume 3 Page 3-10
Annual Factor (percent) By Year
SPREAD Yrs 1 2 3 4 5 6 7 8 9 10
6 4 17 29 29 17 4
7 3 12 22 26 22 12 3
8 2 9 17 22 22 17 9 2
9 1 7 13 19 20 19 13 7 1
10 1 5 11 15 18 18 15 11 5 1
60:40 1 100
2 60 40
3 31 53 16
4 19 41 32 8
5 12 31 33 20 4
6 9 23 28 24 13 3
7 6 17 24 24 18 9 2
8 5 14 20 22 19 13 6 1
9 4 11 16 19 19 15 10 5 1
10 3 9 14 17 17 16 12 8 3 1
70:30 1 100
2 70 30
3 45 42 13
4 28 42 23 7
5 18 38 25 14 5
6 12 32 26 17 10 3
7 9 26 25 18 12 7 3
8 7 21 24 18 13 9 6 2
9 5 16 23 18 14 10 7 5 2
10 4 13 21 18 14 11 8 6 4 1
Figure 3-5. Beta Curve Cost Spreading
Another way of spreading costs using the Beta curve is to express the cumulative cost fraction as a function of the cumulative time fraction, T:
Cum Cost Fraction = 10T2(1 �– T)2(A + BT) + T4(5 - 4T) for 0 T 1
Where:
A and B are parameters (with 0 A + B 1)
T is fraction of time
A=1, B= 0 gives 81% expended at 50% time
A=0, B= 1 gives 50% expended at 50% time
A=0, B= 0 gives 19% expended at 50% time
Regardless of with method is used to calculate the shape of the Beta curve, it is important to be aware of the potential risks introduced with an inefficient Beta curve. For example, a Beta curve that provides too little on the front end of the curve for a project with challenging technical

Cost Estim
atingC
ost Risk
Economic &
Supporting AnalysisC
areer Developm
ent Guide
Reference
Know
ledge Managem
entC
ost Estimating
Cost R
iskEconom
ic & Supporting Analysis
Career D
evelopment G
uideR
eferenceK
nowledge M
anagement
2008 NASA Cost Estimating Handbook Section 1. Economic Analysis
Volume 3 Page 3-11
designs can result in fewer tests that, in turn, can result in failures and cost overruns during integration.
1.5.3 Additional Resources NASA Systems Engineering Handbook: Beta Curve formula and methodology
http://ntrs.nasa.gov/archive/nasa/casi.ntrs.nasa.gov/19960002194_1996102194.pdf
Online Beta Curve Cost Spreading Calculator http://cost.jsc.nasa.gov/beta.html
1.6 Business Case Analysis Business Case Analysis (BCA) is a method to aid decision makers in the comparison of alternative approaches, options, or projects.
1.6.1 Definition A BCA considers not only all life cycle costs identified by a Life Cycle Cost Estimate (LCCE), but also other quantifiable and non-quantifiable benefits. It should be unbiased by considering all possible alternatives.
Benefits is an economic term that is generally understood to be measured in monetary units. Effectiveness is a multi-attributed construct used when the consequences of the choice are not or cannot be measured in dollars. Often, the terms benefits and effectiveness are used as if they are interchangeable and synonymous�—they do in fact have different definitions within the cost estimating community. A valuable reference for cost benefit analysis guidelines in federal programs is OMB Circular A-94. To quote from OMB Circular A-94, Guidelines and Discount Rates for Benefit-Cost Analysis of Federal Programs16, "benefit-cost analysis is recommended as the technique to use in a formal economic analysis of government programs or projects". Benefit-Cost Analysis of government programs is required by Circular A-94 in order to promote efficient resource allocation through well-informed decision-making by the federal government �– this is the goal Circular A-94 and benefit-cost analyses are meant to achieve. In other words, OMB wants to ensure that the government spends, i.e., invests, the taxpayers' money wisely when agencies decide which programs to fund.
16 http://www.whitehouse.gov/omb/circulars/a094/a094.html

Cost Estim
atingC
ost Risk
Economic &
Supporting AnalysisC
areer Developm
ent Guide
Reference
Know
ledge Managem
entC
ost Estimating
Cost R
iskEconom
ic & Supporting Analysis
Career D
evelopment G
uideR
eferenceK
nowledge M
anagement
2008 NASA Cost Estimating Handbook Section 1. Economic Analysis
Volume 3 Page 3-12
1.6.2 BCA Methodology Figure 3-6 illustrates the simple principle behind a BCA�—to determine the preferred alternative among various alternatives based upon cost and benefit data.
As shown in Figure 3-7 on the next page, the benefit streams that are expected to flow from investments are typically comprised of multiple components, some of which can be characterized in terms of cost savings and cost avoidances (i.e., in financial terms), others that can be quantified, but not in cost or financial terms, and still others that simply can not be quantified.
For the benefit streams that can be quantified in financial terms, the concept of Present Value is applied to investment cash flows (costs) and cash flows from cost savings and cost avoidances (benefits) on a comparable basis with respect to timing.
The development of Return on Investment (ROI) metrics, typically in the form of a ratio, can help decision makers select among investment alternatives. ROI ratios, such as Savings/Investment and Payback Ratio can be used to identify attractive alternatives. The computation of any traditional ROI metrics can only take into account outcomes that are characterized in cost or financial terms. What is not immediately evident from Figure 3-7 is the fact that the generation of an ROI metric can only result from a comparison of two or more alternatives, one of which serves as a reference point and is typically defined as the "Business as Usual' or the Status Quo Alternative.
Financially quantifiable benefits and ROI metrics should not be the sole basis leaders rely upon when selecting alternatives for NASA. To paint the complete picture, the contribution to effectiveness of quantifiable, non-financial benefits and the contribution to effectiveness of typically non-quantifiable benefits should be measured using decision framework techniques such as the Analytic Hierarchy Process (AHP) or the Multi-Attribute Utility Theory (MAUT). These decision framework techniques bring structure to complex problems where multiple alternatives need to be considered across a range of goals and objectives. They also help to develop stakeholder buy-in and understanding of the project complexities and the decision
Alternative n
Costs
Benefits
Alternative n
Costs
Benefits PreferredAlternative
PreferredAlternative
Alternative 2
Costs
Benefits
Alternative 2
Costs
Benefits
Alternative 1
Costs
Benefits
Alternative 1
Costs
Benefits
Status Quo
Costs
Benefits
Status Quo
Costs
Benefits
Figure 3-6. BCA Framework
Life Cycle Cost
Development
Production
Ops & Support
Mission Benefits
Quantifiable Returns, in
Cost or Financial Terms
Quantifiable Returns, in
Terms other than Cost or Financial
Non-Quantifiable
Returns
ROI MetricsROI Metrics
Figure 3-7. Cost Benefit Analysis Framework

Cost Estim
atingC
ost Risk
Economic &
Supporting AnalysisC
areer Developm
ent Guide
Reference
Know
ledge Managem
entC
ost Estimating
Cost R
iskEconom
ic & Supporting Analysis
Career D
evelopment G
uideR
eferenceK
nowledge M
anagement
2008 NASA Cost Estimating Handbook Section 1. Economic Analysis
Volume 3 Page 3-13
making process. The techniques establish a structure that articulates and prioritizes the goals and objectives that different alternatives are expected to meet, and provide a mechanism to develop normalized scores of effectiveness. The quantification of financial benefits, development of ROI metrics, and the measurement of the effectiveness of non-financial benefits and non quantifiable benefits serve the overall objective of making a sound recommendation in a BCA.
Table 3-2. Types of Business Case Analysis: From the GAO Cost Assessment Guide
Different Types of Business Case Analyses Description
Analysis of Alternatives (AoA)
Level of Effort:
Requires a large team, may take many months to accomplish, and addresses the full LCCE
An AOA compares the operational effectiveness, suitability, and life-cycle cost estimate of alternatives that appear to satisfy established capability needs. Its two major components are a cost effectiveness analysis and a cost analysis. AOAs attempt to identify the most promising of several conceptual alternatives; its analysis and conclusions are then typically used to justify initiating an acquisition program. An AOA also looks at mission threat and dependencies on other programs. Many times, AOAs cannot quantify benefits. For example, there is no agreed upon monetary value for what a human life is worth. In this case, a cost-effectiveness analysis is more appropriate. CEAs are conducted whenever it is unnecessary or impractical to consider the dollar value of the benefits. This happens when the various alternatives have the same annual monetary benefits. Both the AOA and CEA should address each alternative’s advantages and disadvantages and the associated risks and uncertainties of how these might influence the comparison.
Economic Analysis (EA)
Level of Effort:
Requires a large team, may take many months to accomplish, and addresses the full LCCE
This is a conceptual framework for systematically investigating problems of choice. Posing various alternatives for reaching an objective, it analyzes the life cycle cost estimate and benefits of each one usually with a Return On Investment (ROI) analysis. Present Value is also an important concept. Since there is time-value to money, it is necessary to determine when the expenditures for the alternatives will be made. Economic analysis expands cost analysis by examining the effects of the time-value of money on investment decisions. After cost estimates have been generated, they must be time-phased to allow for alternative expenditure patterns. Assuming equal benefits, the alternative whose Present Value cost is least is the most desirable, because it implies a more efficient allocation of resources.
1.6.3 Additional Resources NASA NPR 2830.1 NASA Enterprise Architecture Procedures - APPENDIX E:
Approaches for Conducting Alternatives Analysis http://nodis3.gsfc.nasa.gov/displayDir.cfm?Internal_ID=N_PR_2830_0001_&page_name=AppendixE
NPR 7120.5 NASA Program and Project Management Processes and Requirements http://nodis.hq.nasa.gov/displayDir.cfm?Internal_ID=N_PR_7120_005D_
NASA Business Case Guide for Facilities Projects http://www.hq.nasa.gov/office/codej/codejx/Assets/Docs/Case_Guide_4-20-06.pdf
OMB Circular A-94 http://www.whitehouse.gov/omb/circulars/a094/a094.html
Cost Estim
atingC
ost Risk
Economic &
Supporting AnalysisC
areer Developm
ent Guide
Reference
Know
ledge Managem
entC
ost Estimating
Cost R
iskEconom
ic & Supporting Analysis
Career D
evelopment G
uideR
eferenceK
nowledge M
anagement
2008 NASA Cost Estimating Handbook Section 1. Economic Analysis
Volume 3 Page 3-14
GAO Cost Assessment Guide http://www.gao.gov/new.items/d071134sp.pdf
Institute of Marketing & Innovation http://www.boku.ac.at/mi/ahp/ahptutorial.pdf
An Analytical Hierarchy Process Approach to the Analysis of Quality in Telecommunications Systems http://ieeexplore.ieee.org/iel2/645/6841/00276672.pdf?arnumber=276672
Multiattribute Utility Theory Tutorial http://ait.unl.edu/dolson/mcdm.ppt
1.7 Present Value The Present Value concept captures the time value of money by adjusting through compounding and discounting cash flows to reflect the increased value of money when invested.
1.7.1 Definition The Present Value of a cash flow reflects in today�’s terms, the value of future cash flows adjusted for the cost of capital. In essence, the time value of money reflects the fact that money in hand today is more valuable than an identical amount of money received in the future and that benefits and costs have a greater value if they are realized earlier. Since money today can earn interest, all costs must be adjusted to reflect the inflation rate and then discounted to reflect their Present Value. The time value of money reflects the idea that a dollar in hand today is worth more than a dollar in the future, even after making adjustments for inflation.
1.7.2 Calculating Present Value To determine the Present Value of money, a discount rate must be applied to costs. There are two different types of discount rates:
�• Real discount rate is adjusted to eliminate the effects of expected inflation and used to discount Constant Year dollars or real benefits or costs.
�• A nominal discount rate is adjusted to reflect inflation used to discount Then Year dollars or
nominal benefits and costs.
Figure 3-8 illustrates this relationship between Present Value, Base Year, and Budget Year dollars.
Nominal Discount Rate
– Expected Inflation Rate
= Real Discount Rate

Cost Estim
atingC
ost Risk
Economic &
Supporting AnalysisC
areer Developm
ent Guide
Reference
Know
ledge Managem
entC
ost Estimating
Cost R
iskEconom
ic & Supporting Analysis
Career D
evelopment G
uideR
eferenceK
nowledge M
anagement
2008 NASA Cost Estimating Handbook Section 1. Economic Analysis
Volume 3 Page 3-15
Present Value Dollars
Present Value Dollars
Nominal Discount Rate4.9%
Base Year Dollars
(Constant Year)
Base Year Dollars
(Constant Year)Budget Year
DollarsBudget Year
Dollars
Real Discount Rate2.5%
Inflation Rate2.5%
Figure 3-8. Relationship between Present Value, Base Year, and Budget Year Dollars
Budget Year dollars incorporate the effects of inflation and adjust for the time value of money �– the concept that a given amount of money is worth more today than in the future due to inflation. Base Year dollars are adjusted for the time value of money, and Present Value dollars have the effects of inflation and time value of money removed.
Real and nominal discount rates are provided by the OMB in Circular No. A-94. The rates are updates each calendar year and can be found at: http://www.whitehouse.gov/omb/circulars/a094/a94_appx-c.html.
The purpose and goal of this Circular is to promote efficient resource allocation through well-informed decision-making by the federal government. It provides general guidance for conducting benefit-cost and cost-effectiveness analyses. It also provides specific guidance on the discount rates to be used in evaluating federal programs whose benefits and costs are distributed over time. The general guidance will serve as a checklist of whether an agency has considered and properly dealt with all the elements for sound benefit-cost and cost-effectiveness analyses.
The Present Value of an investment is calculated from the time series of projected cash flows using discount rates specified in the OMB Circular A-94, Appendix C http://www.whitehouse.gov/omb/circulars/a094/a94_appx-c.html
To estimate Present Value, future benefits and costs must be discounted. Discount factors can be reflected in real or nominal terms as defined by OMB Circular A-94 Appendix C. The discount rate used depends on the type of dollars to be adjusted.
Discounting translates projected cash flows into Present Value terms using specified discount factors., As illustrated Figure 3-9, the discount factor is equal to 1/(1+ i)n or (1+ i)-n where i is the interest rate and n is the number of years from the date of initiation for the project. Figure 3-10 provides an example of how discounting is applied.
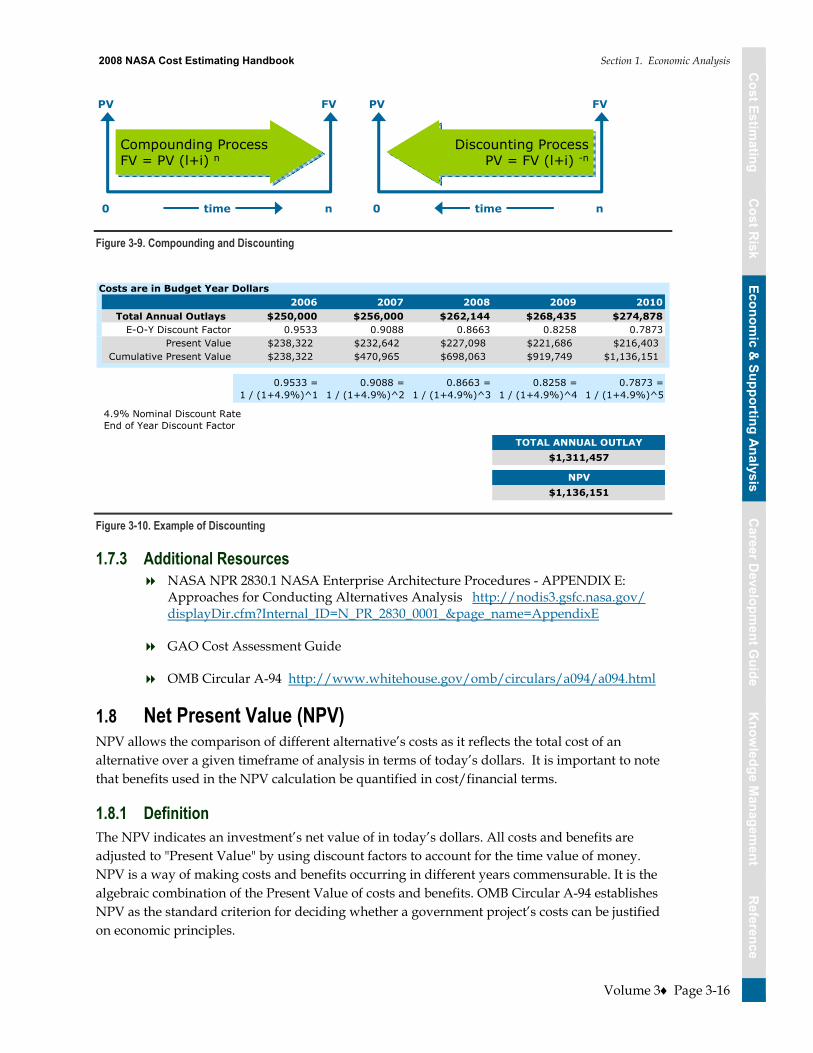
Cost Estim
atingC
ost Risk
Economic &
Supporting AnalysisC
areer Developm
ent Guide
Reference
Know
ledge Managem
entC
ost Estimating
Cost R
iskEconom
ic & Supporting Analysis
Career D
evelopment G
uideR
eferenceK
nowledge M
anagement
2008 NASA Cost Estimating Handbook Section 1. Economic Analysis
Volume 3 Page 3-16
Compounding ProcessFV = PV (l+i) nCompounding ProcessFV = PV (l+i) n
Discounting ProcessPV = FV (l+i) -n
Discounting ProcessPV = FV (l+i) -n
0 n
PV FV
time 0 n
PV FV
time
Figure 3-9. Compounding and Discounting
2006 2007 2008 2009 2010Total Annual Outlays $250,000 $256,000 $262,144 $268,435 $274,878
E-O-Y Discount Factor 0.9533 0.9088 0.8663 0.8258 0.7873Present Value $238,322 $232,642 $227,098 $221,686 $216,403
Cumulative Present Value $238,322 $470,965 $698,063 $919,749 $1,136,151
0.9533 = 1 / (1+4.9%)^1
0.9088 = 1 / (1+4.9%)^2
0.8663 = 1 / (1+4.9%)^3
0.8258 = 1 / (1+4.9%)^4
0.7873 = 1 / (1+4.9%)^5
4.9% Nominal Discount RateEnd of Year Discount Factor
$1,136,151
Costs are in Budget Year Dollars
TOTAL ANNUAL OUTLAY
$1,311,457
NPV
Figure 3-10. Example of Discounting
1.7.3 Additional Resources NASA NPR 2830.1 NASA Enterprise Architecture Procedures - APPENDIX E:
Approaches for Conducting Alternatives Analysis http://nodis3.gsfc.nasa.gov/ displayDir.cfm?Internal_ID=N_PR_2830_0001_&page_name=AppendixE
GAO Cost Assessment Guide
OMB Circular A-94 http://www.whitehouse.gov/omb/circulars/a094/a094.html
1.8 Net Present Value (NPV) NPV allows the comparison of different alternative�’s costs as it reflects the total cost of an alternative over a given timeframe of analysis in terms of today�’s dollars. It is important to note that benefits used in the NPV calculation be quantified in cost/financial terms.
1.8.1 Definition The NPV indicates an investment�’s net value of in today�’s dollars. All costs and benefits are adjusted to "Present Value" by using discount factors to account for the time value of money. NPV is a way of making costs and benefits occurring in different years commensurable. It is the algebraic combination of the Present Value of costs and benefits. OMB Circular A-94 establishes NPV as the standard criterion for deciding whether a government project�’s costs can be justified on economic principles.

Cost Estim
atingC
ost Risk
Economic &
Supporting AnalysisC
areer Developm
ent Guide
Reference
Know
ledge Managem
entC
ost Estimating
Cost R
iskEconom
ic & Supporting Analysis
Career D
evelopment G
uideR
eferenceK
nowledge M
anagement
2008 NASA Cost Estimating Handbook Section 1. Economic Analysis
Volume 3 Page 3-17
1.8.2 Calculating NPV To estimate NPV, future benefits and costs must be discounted. Discount factors can be reflected in real* or nominal terms as defined by OMB Circular A-94 Appendix C. The discount rate used depends on the type of dollars to be adjusted.
Real Discount Rates—Adjusted to eliminate the effects of expected inflation and used to discount Constant Year dollars or real benefits and costs. A real discount rate can be approximated by subtracting expected inflation from a nominal discount rate.
Nominal Discount Rates—Reflect expected inflation and used to discount Then Year (inflated) dollars or nominal benefits and costs. * in this case, “real” indicates that the effects of general inflation have been removed
�“Net Present Value is computed by assigning monetary values to benefits and costs, discounting future benefits and costs using an appropriate discount rate, and subtracting the sum total of discounted costs from the sum total of discounted benefits. Discounting benefits and costs transforms gains and losses occurring in different time periods to a common unit of measurement.
Mathematically, NPV is calculated as shown:
NPVNPV
– PV(Annual Cost)– PV(Annual Cost)
PV(Annual Benefits)PV(Annual Benefits)
NPVNPV
– PV(Annual Cost)– PV(Annual Cost)
PV(Annual Benefits)PV(Annual Benefits)
For most government generated cost estimates, discount rates provided in OMB Circular A-94 are used to discount all cash flows as shown:
NPVNPV
– PV(Investment)– PV(Investment)
[ PV(Internal Project Cost Savings, Operation) +PV (Mission Cost Savings)]
[ PV(Internal Project Cost Savings, Operation) +PV (Mission Cost Savings)]
Projects with positive NPV increase social resources are generally preferred. Projects with negative NPV should generally be avoided.�”
NPV > 0 AcceptNPV > 0 Accept
NPV < 0 RejectNPV < 0 Reject
The simplified NPV accept/ reject criterion is:
The simplified NPV accept/ reject criterion is:
Figure 3-11 illustrates the NPV calculations. Investment costs and cost savings are in Budget Year dollars (include the inflation and the time value of money, i.e., nominal inflation rate). The Present Value of the sum of the difference between the initial investment costs and cost savings equals the NPV.

Cost Estim
atingC
ost Risk
Economic &
Supporting AnalysisC
areer Developm
ent Guide
Reference
Know
ledge Managem
entC
ost Estimating
Cost R
iskEconom
ic & Supporting Analysis
Career D
evelopment G
uideR
eferenceK
nowledge M
anagement
2008 NASA Cost Estimating Handbook Section 1. Economic Analysis
Volume 3 Page 3-18
Costs are in Budget Year Dollars Year 2006 2007 2008 2009 2010 Total NPV Initial Investment $250,000 $256,000 $262,144 $268,435 $274,878 $1,311,457 $1,136,151 Cost Savings $0 $0 $0 $760,678 $776,653 $1,537,331 $1,239,635
Savings Minus Investment -$250,000 -$256,000 -$262,144 $492,243 $501,775 $225,873 $ 103,484
E-O-Y Discount Factor 0.9533 0.9088 0.8663 0.8258 0.7873
Present Value of Savings Minus Investment -$238,322 -$232,642 -$227,098 $406,516 $395,031 $103,484
NPV $103,484
Figure 3-11. Net Present Value Calculation Example
1.8.3 Additional Resources NASA NPR 2830.1 NASA Enterprise Architecture Procedures - APPENDIX E:
Approaches for Conducting Alternatives Analysis http://nodis3.gsfc.nasa.gov/ displayDir.cfm?Internal_ID=N_PR_2830_0001_&page_name=AppendixE
GAO Cost Assessment Guide
OMB Circular A-94 http://www.whitehouse.gov/omb/circulars/a094/a094.html
1.9 Return on Investment (ROI) Metrics To determine how much value (non-financial benefits) an investment will realize, or how much money it will save, and or what its impact on the overall organization will be, financial and non-financial benefits should be compared to the estimated cost. These Return-On-Investment (ROI) metrics assure senior managers and decision-makers that the investments they authorize will contribute to making the federal government more cost-efficient and responsive to mission accomplishment. It is important to note, however, that cost-efficiency is only one data point in the decision-making process. No matter how cost efficient an investment appears to be, if it fails to improve the effectiveness of the government, it is unlikely to show any benefit at all. For this reason, ROI should be used as an indicator, along with other performance and risk indicators for a comprehensive view of program value.
1.9.1 Definition ROI is the net benefit expressed as a percentage of the investment amount:
It is the incremental financial gain from an investment, divided by the cost of the investment. The ROI for a project using the data from Figure 3-11 equals 9.1%.
Present Value of the investment = $ 1,136,151 Present Value of the cost savings = $ 1,239,635 NPV = $ 103,484 ROI = $ 103,484 / $ 1,136,151 = 9.1%
NPVNPV
PV InvestmentPV InvestmentROIROI =

Cost Estim
atingC
ost Risk
Economic &
Supporting AnalysisC
areer Developm
ent Guide
Reference
Know
ledge Managem
entC
ost Estimating
Cost R
iskEconom
ic & Supporting Analysis
Career D
evelopment G
uideR
eferenceK
nowledge M
anagement
2008 NASA Cost Estimating Handbook Section 1. Economic Analysis
Volume 3 Page 3-19
The Savings to Investment Ratio (SIR), a popular ROI metric, represents the ratio of savings to investment. In terms the basic NPV formula, "Savings" represents PV of the cost savings and "investment" is PV of the investment costs.
SIR = PV cost savings/PV investment SIR = $ 1,239,635/$ 1,136,151 = 1.09
Computing the amount of time it takes for a project to pay for itself (or return its initial investment) is another commonly used criterion for selecting among alternative courses of action. Typically, the relevant time period is expressed in terms of the number of years it takes before an investment breaks even. Assuming that one is using discounted cash flows as the basis for the calculation of the payback period, the basic question to be answered is at what point in time do the PV(cost savings) equal the PV(initial investment)? In the simplest of cases, the benefits (or returns) begin predictably at the completion of the investment phase and occur in an equal amount each time period. However, in the analyses we typically do, especially for large projects that take years to complete, benefits begin accruing prior to completion of the investment phase and do not occur in equal annual amounts. In both simple and complex situations, the Payback Period in years, x, can be found in accordance with the following formula (where t = time periods in years):
xt
t 1
)InvestmentPV(InitialSavings)PV(Cost
This formula may require solution by iteration and is likely to result in an answer that represents a fraction of a year and is found by interpolation. The mathematically correct answer to this equation can also be portrayed graphically in a form that generates a more approximate answer. An example of such a graph is shown in Figure 3-12.
1.9.2 Maximizing ROI The ROI of an investment can be maximized by:
�• Minimizing Costs �• Maximizing Returns �• Accelerating Returns
Discounted Pay Back Period
$0
$200,000
$400,000
$600,000
$800,000
$1,000,000
$1,200,000
$1,400,000
2006 2007 2008 2009 2010
Year
NP
V
PV of Cost Savings
PV of Investment Costs
PV of Cost Savings
PV of Investment Costs
Figure 3-12. Discounted Pay Back Period

Cost Estim
atingC
ost Risk
Economic &
Supporting AnalysisC
areer Developm
ent Guide
Reference
Know
ledge Managem
entC
ost Estimating
Cost R
iskEconom
ic & Supporting Analysis
Career D
evelopment G
uideR
eferenceK
nowledge M
anagement
2008 NASA Cost Estimating Handbook Section 1. Economic Analysis
Volume 3 Page 3-20
A relatively small improvement in all three may have a major impact on overall economic return of the investment.
1.9.3 Additional Resources GAO Cost Assessment Guide
http://www.gao.gov/new.items/d071134sp.pdf
Capability-Development Return on Investment for the NASA Aeronautics Program http://ieeexplore.ieee.org/iel5/10446/33170/01562857.pdf?isnumber=&arnumber=1562857
Return on Investment for Software IV&V http://pmchallenge.gsfc.nasa.gov/Docs/2006attendee-presentations/2006presentationsCD-attendee/Ken.Costello.pdf
1.10 Schedule Analysis Project schedules play an important role in the development of any project. The cost estimator needs to understand how to estimate schedule realism as well as to understand the effects proposed compressions or delays in a project schedule will have on cost. A cost estimator/analyst must be able to quantify the impacts that schedule changes will have on the cost and risks of the project and translate them in terms of impact to the cost estimate. Schedule analysis should occur throughout the life cycle of a project. Many software tools exist to track, calculate, and predict impacts to schedule and for every tool there are multiple methodologies for each to be effective, but before any of these tools can be used, a firm understanding of the WBS is imperative as well as the resources needed and the dependencies among the planned elements. These interdependencies are critical to successful project planning. In every industry area, there is a body of knowledge that associates the accomplishment of known work efforts with a time duration. In some industries, there are books recording industry standards for use by cost and schedule estimators. Interviewing those who have had experience with similar projects is an effective way to determine how long things should take. A properly resource loaded and complete scope-defined schedule is vital to the execution and success of any project or technical task order. For effective project controls, the scheduler and the cost estimator must work in concert in the development of the work flow of each component of the project�’s scope. The final project costs will be determined by the identification and validation of direct and indirect labor, materials, and other direct costs. This identification and validation must be performed in a time-phased evaluation of the schedule and its resources. The potential costs for initial project risks and requirements external to the project must be identified, documented, and quantified. During the execution of the project, these known risks and external requirements must be monitored and validated in conjunction with new, modified, or deleted schedule and cost related project issues. The schedule and resource analysis is an on-going component of project management controls that are essential to the successful evaluation of the project�’s estimated final delivery date and cost.
1.10.1 Definition Schedule analysis is the analysis, validation, and updating of the intended work flow and resource loading plan that are established with the project management and team, and all

Cost Estim
atingC
ost Risk
Economic &
Supporting AnalysisC
areer Developm
ent Guide
Reference
Know
ledge Managem
entC
ost Estimating
Cost R
iskEconom
ic & Supporting Analysis
Career D
evelopment G
uideR
eferenceK
nowledge M
anagement
2008 NASA Cost Estimating Handbook Section 1. Economic Analysis
Volume 3 Page 3-21
internal and external shareholders in the proposal phase of the project. All known scope requirements, risks, and assumptions should be documented during the inception of the schedule and cost development. The schedule, resource loading, and associated costs should be baselined shortly after project award to provide a historical perspective of the intended work and cash flow plans. The schedule and resource plans are dynamic and will be impacted and adjusted during the execution of the project through changes to assumptions, discovery of unknown internal and external issues, and reassessment of the initial plan. Any deviation from this baseline must be analyzed to ensure the resource and cost components are not impacted. The identified schedule deviations and cost impacts should be presented in a timely manner to project management and any internal or external shareholders. The consistent and validated schedule and cost analyses will provide valuable insight to the project management team on potential delays or improvements to interim milestone and project completion schedule and cost forecasts.
1.10.2 Purpose A project schedule validates that the project is executing to the plan. Any deviation from the schedule likely introduces cost and technical risks to the project. The purpose of schedule analysis is to identify these areas of potential cost impact and account for them in the cost estimate by manipulating impacts to risk or degree of difficulty of design in most software estimating suites. When a project is completed early, there may be cost savings associated with using fewer resources, unless resources were fully utilized in a more compressed time period. More often, schedules impact cost when projects are late and more resources are consumed in an effort to come in on time or when the timeframe is expanded to make time to catch up on the tasks.
1.10.3 Obtaining a Complete Schedule To conduct a detailed schedule analysis, the cost estimator needs to first verify that there is a schedule with a completion date and that the schedule is complete. A complete schedule should cover the entire scope of work to be performed �– or the lifecycle of the estimate being conducted. It should have defined all logical dependencies between the inner tasks, such as specifying a predecessor and successor and defining the relationship type (e.g., finish to start, finish to finish etc.). A complete schedule should also identify external dependencies, which are those things that are outside the control of the project management but that can influence the project�’s success.
To create a complete schedule, detailed information related to the project management and technical approach needs to be defined. To determine if the schedule is complete (and accurate), the cost analyst may need to speak with project management personnel or technical experts subject matter experts ( SMEs) to determine if the schedule accurately captures all of the pertinent information. This can help identify items that are often neglected in schedule preparation such as the transition time between tasks. When developing the schedule, organizations or resources
For example, imagine a project that is scheduled to be completed in one year. Instead, assume that the project is actually completed in one year and three months. If the original schedule was used to estimate total costs, then there are three months of cost unaccounted for in the original estimate. Even if no additional project materials were necessary, there would still be three months of time-related costs for labor, facilities, utilities, etc., which were not included in the original estimate. Schedule analysis helps answer the questions of how long will the project be delayed, and what those delays will cost.

Cost Estim
atingC
ost Risk
Economic &
Supporting AnalysisC
areer Developm
ent Guide
Reference
Know
ledge Managem
entC
ost Estimating
Cost R
iskEconom
ic & Supporting Analysis
Career D
evelopment G
uideR
eferenceK
nowledge M
anagement
2008 NASA Cost Estimating Handbook Section 1. Economic Analysis
Volume 3 Page 3-22
outside of the direct control of the project may not share the sense of schedule adherence and their work may take longer to complete. Ultimately, being aware of all external dependency relationships helps refine the schedule with a considerable level of realism and with the risk assessment of the schedule.
1.10.4 Good Scheduling Practices Ideally the cost analyst will receive a schedule from an experienced scheduler. Sometimes this is not the case so the analyst is faced with creating a schedule from scratch or compiling a complete schedule from existing pieces. This section describes �‘best practices�’ to follow if faced with creating a complete project schedule. Consistent use of good scheduling practices will lead to effective schedules and will enable all parties to comprehend the intent of the work flow.
The intent of the schedule is to communicate to all internal and external shareholders a detailed view of the project execution plan and sequence of events to make that execution possible. The scheduler should read and reference the project proposal and the project contract in the development of the schedule and utilize these documents as reference points throughout the continuing schedule analysis. The scheduler should be involved in the development of all scope changes and will need to reference the proposal and contract documents in the validation of the proposed change. The scheduler should have knowledge of or access to SMEs in any internal and client-required processes and any code or industry standards. If applicable, the requirements of these processes and standards should be incorporated into the schedule.
A schedule should include activities that are generally no longer than 10 business days in duration. These activities should have a discrete functional description that will allow for progress measurement by management. The activity should include only one entity, one discipline, or one action. The ability to assign resources and costs to each activity should exist in the schedule development. For example; the scope �‘Develop and Test�’ should be two activities as this is usually two different disciplines that are executing this scope of work. A definite end to the Develop scope will precede the commencement of the Test scope. The discrete activities with durations no greater than 10 days should reveal timely schedule indicators for management intervention.
With respect to logical relationships, each activity should have at least one preceding and at least one succeeding activity relationship. The only activity without a predecessor should be the contract start and the only activity without a successor should be the contract finish. The absence of logic relationships is a flag to a possible schedule validation issue. The specific type of relationship is usually a finish to start relationship, but start-to-start and finish-to-finish relationships can be used. There also exists a start-to-finish relationship, but it is rarely used. Lead and lag times are permissible with the relationship types and positive lead or lag durations are preferred.
The duration should not be the best case forecast, but rather the most likely or worst case to help mitigate risk. Risk aversion should be included in the schedule duration and any updates. The duration should be validated with a unit rate comparison of the assigned resources.
In the analysis of the schedule, float is a valuable component utilized in the execution and management of the project. Total float does not exclusively belong to one individual entity and

Cost Estim
atingC
ost Risk
Economic &
Supporting AnalysisC
areer Developm
ent Guide
Reference
Know
ledge Managem
entC
ost Estimating
Cost R
iskEconom
ic & Supporting Analysis
Career D
evelopment G
uideR
eferenceK
nowledge M
anagement
2008 NASA Cost Estimating Handbook Section 1. Economic Analysis
Volume 3 Page 3-23
should be a shared commodity that is addressed in communications with project management. Total float is defined as the duration that a series of activities can be delayed without impacting the interim milestone or project completion dates. Free float is a component of total float and is the duration an activity can be delayed without impacting the start date of its succeeding activities. The identification and proper use of free float will allow the project manager or task lead to temporarily redirect resources to execute more critical activities.
The critical path is defined as the sequence of activities that potentially will delay the contractual project or interim milestone completion dates. The sequences of activities that will lead to and set the date for the end of the project or task are considered the critical path. The critical path is usually defined as the sequence of activities with a total float equal to or less than 0 days. Near critical paths can be defined as a sequence with a total float equal to or less than five days. Project management will set the expectation for the identification of critical paths. A project can have more than one critical path.
The schedule should be updated and analyzed on a consistent basis (preferably weekly) and the update duration is dependent on the criticality of addressing schedule slippage. Progress on all current schedule activities should be maintained through the current date of schedule analysis. This will allow for proper schedule analysis and validation. In addition, all schedule and resource assumptions and deviations in the execution plan should be documented for future reference. Written records of schedule and resource assumptions and discussions are critical components in the internal and external auditing processes and potential dispute resolutions.
1.10.5 Analysis Methods The schedule and the cost estimating analysts are facilitators for the review and validation of the project�’s schedule and resources. The entire project team should be consulted and provide input to the review and validation process for schedule and resources. The schedule and cost estimating analysts should be able to acknowledge the identification of potential and actual additions, modifications or deletions in scope, and their impact on the current project schedule and cost forecasts. Proper inclusion, analysis, and validation of the identified deviation are essential to the effectiveness of the schedule and cost analysis roles.
After the inclusion of the identified scope deviation, the scheduler may use one of three commonly used components of a scheduling software package to analyze the impact of this deviation. These components are the Gantt chart (see Figure 3-13), the PERT chart (shown in Figure 3-14), and the resource profiles.
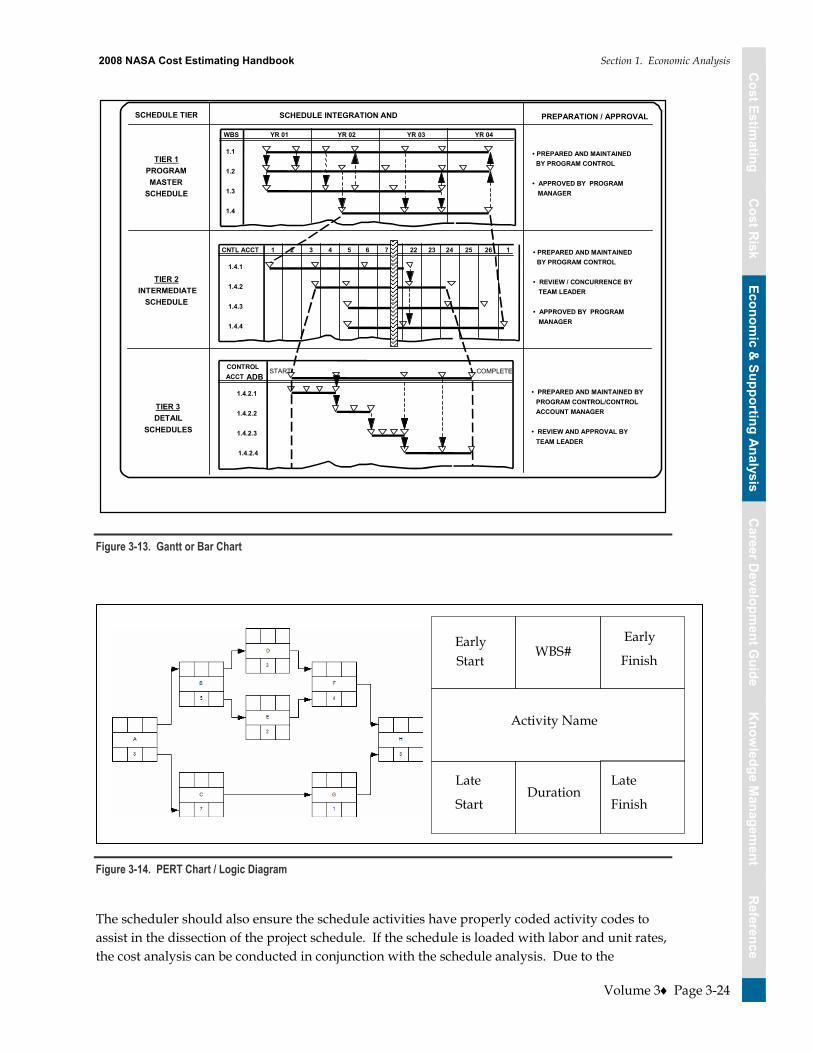
Cost Estim
atingC
ost Risk
Economic &
Supporting AnalysisC
areer Developm
ent Guide
Reference
Know
ledge Managem
entC
ost Estimating
Cost R
iskEconom
ic & Supporting Analysis
Career D
evelopment G
uideR
eferenceK
nowledge M
anagement
2008 NASA Cost Estimating Handbook Section 1. Economic Analysis
Volume 3 Page 3-24
WBS YR 01 YR 02 YR 03 YR 04
1.1
1.2
1.3
1.4
CNTL ACCT
1.4.1
1.4.2
1.4.3
1.4.4
1 2 3 4 5 6 7 22 23 24 25 26 1
START COMPLETECONTROLACCT ADB
1.4.2.1
1.4.2.2
1.4.2.3
1.4.2.4
TIER 1PROGRAMMASTER
SCHEDULE
TIER 2INTERMEDIATE
SCHEDULE
TIER 3DETAIL
SCHEDULES
• PREPARED AND MAINTAINED BY PROGRAM CONTROL
• APPROVED BY PROGRAM MANAGER
• PREPARED AND MAINTAINED BY PROGRAM CONTROL
• REVIEW / CONCURRENCE BY TEAM LEADER
• APPROVED BY PROGRAM MANAGER
• PREPARED AND MAINTAINED BYPROGRAM CONTROL/CONTROLACCOUNT MANAGER
• REVIEW AND APPROVAL BYTEAM LEADER
PREPARATION / APPROVALSCHEDULE INTEGRATION ANDTRACEABILITY
SCHEDULE TIER
Figure 3-13. Gantt or Bar Chart
Figure 3-14. PERT Chart / Logic Diagram
The scheduler should also ensure the schedule activities have properly coded activity codes to assist in the dissection of the project schedule. If the schedule is loaded with labor and unit rates, the cost analysis can be conducted in conjunction with the schedule analysis. Due to the
EarlyStart
WBS# Early
Finish
Late
StartDuration Late
Finish
Activity Name
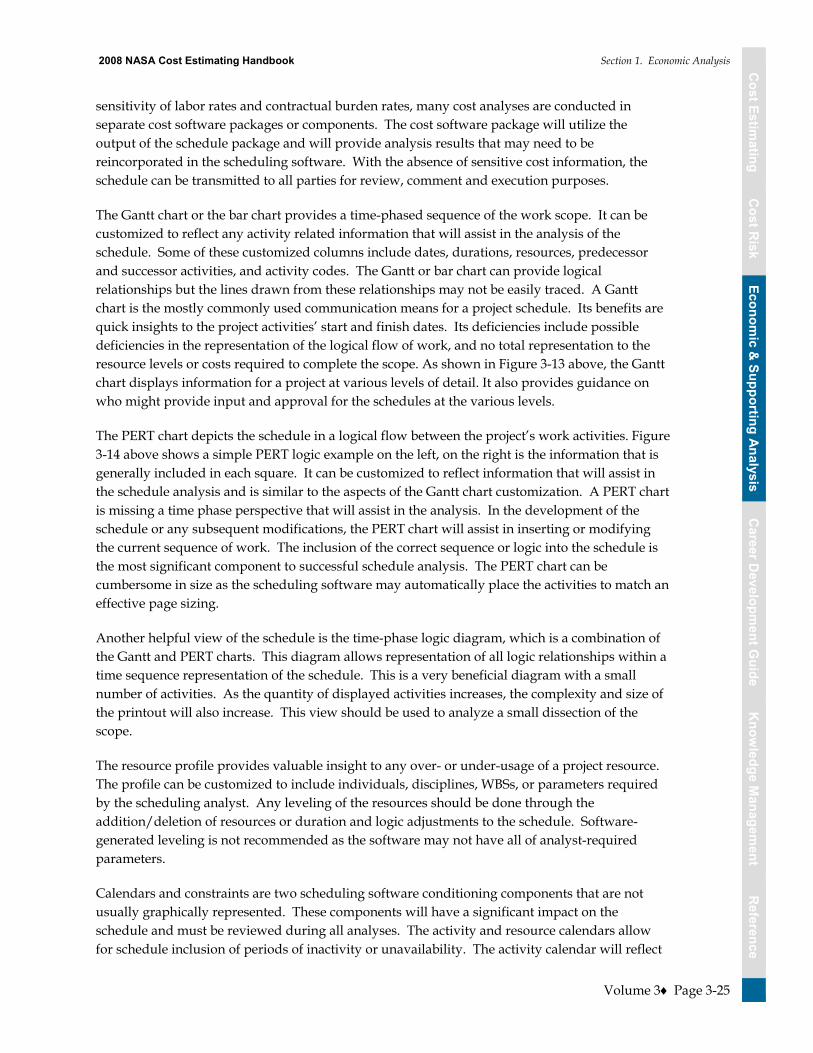
Cost Estim
atingC
ost Risk
Economic &
Supporting AnalysisC
areer Developm
ent Guide
Reference
Know
ledge Managem
entC
ost Estimating
Cost R
iskEconom
ic & Supporting Analysis
Career D
evelopment G
uideR
eferenceK
nowledge M
anagement
2008 NASA Cost Estimating Handbook Section 1. Economic Analysis
Volume 3 Page 3-25
sensitivity of labor rates and contractual burden rates, many cost analyses are conducted in separate cost software packages or components. The cost software package will utilize the output of the schedule package and will provide analysis results that may need to be reincorporated in the scheduling software. With the absence of sensitive cost information, the schedule can be transmitted to all parties for review, comment and execution purposes.
The Gantt chart or the bar chart provides a time-phased sequence of the work scope. It can be customized to reflect any activity related information that will assist in the analysis of the schedule. Some of these customized columns include dates, durations, resources, predecessor and successor activities, and activity codes. The Gantt or bar chart can provide logical relationships but the lines drawn from these relationships may not be easily traced. A Gantt chart is the mostly commonly used communication means for a project schedule. Its benefits are quick insights to the project activities�’ start and finish dates. Its deficiencies include possible deficiencies in the representation of the logical flow of work, and no total representation to the resource levels or costs required to complete the scope. As shown in Figure 3-13 above, the Gantt chart displays information for a project at various levels of detail. It also provides guidance on who might provide input and approval for the schedules at the various levels.
The PERT chart depicts the schedule in a logical flow between the project�’s work activities. Figure 3-14 above shows a simple PERT logic example on the left, on the right is the information that is generally included in each square. It can be customized to reflect information that will assist in the schedule analysis and is similar to the aspects of the Gantt chart customization. A PERT chart is missing a time phase perspective that will assist in the analysis. In the development of the schedule or any subsequent modifications, the PERT chart will assist in inserting or modifying the current sequence of work. The inclusion of the correct sequence or logic into the schedule is the most significant component to successful schedule analysis. The PERT chart can be cumbersome in size as the scheduling software may automatically place the activities to match an effective page sizing.
Another helpful view of the schedule is the time-phase logic diagram, which is a combination of the Gantt and PERT charts. This diagram allows representation of all logic relationships within a time sequence representation of the schedule. This is a very beneficial diagram with a small number of activities. As the quantity of displayed activities increases, the complexity and size of the printout will also increase. This view should be used to analyze a small dissection of the scope.
The resource profile provides valuable insight to any over- or under-usage of a project resource. The profile can be customized to include individuals, disciplines, WBSs, or parameters required by the scheduling analyst. Any leveling of the resources should be done through the addition/deletion of resources or duration and logic adjustments to the schedule. Software-generated leveling is not recommended as the software may not have all of analyst-required parameters.
Calendars and constraints are two scheduling software conditioning components that are not usually graphically represented. These components will have a significant impact on the schedule and must be reviewed during all analyses. The activity and resource calendars allow for schedule inclusion of periods of inactivity or unavailability. The activity calendar will reflect
Cost Estim
atingC
ost Risk
Economic &
Supporting AnalysisC
areer Developm
ent Guide
Reference
Know
ledge Managem
entC
ost Estimating
Cost R
iskEconom
ic & Supporting Analysis
Career D
evelopment G
uideR
eferenceK
nowledge M
anagement
2008 NASA Cost Estimating Handbook Section 1. Economic Analysis
Volume 3 Page 3-26
common holidays and any expected project inactivity (e.g., plant shutdowns). A resource�’s vacation or project related availability would be included in the resource calendar. The constraint dates are included in the schedule whenever the schedule activity logic or the respective calendars do not properly provide the required start or finish date or project calendar condition.
The scheduling analyst will utilize all of these views, profiles, and conditions in the analysis of the schedule. For proper and complete schedule analysis, the analyst must understand all of inherent features of the schedule�’s logic, durations, and resource availability and the scheduling software�’s conditioning and output aspects.
1.10.6 How Schedule Affects Cost Once the schedule analysis has been completed, a cost and risk impact must be assigned to any schedule delays for cost estimating or assessment purposes. Once again there are several methodologies for estimating this impact, based on available data, resources, and project knowledge. One of these methods is calculating an average burn rate for the project. A very simplistic approach would be to divide the total cost of the project by the number of weeks (or days) the project has been open, to arrive at an average weekly burn rate. This rate can then be multiplied by the number of weeks of schedule delay identified as likely, to derive an estimate of the total cost of the schedule delay. This method is too simple for most complex projects in NASA. It is not recommended for use except in Rough Order of Magnitude (ROM) estimates of delay impact. This type of estimate should always be followed by a more detailed examination of the impact of schedule delay to cost. A more detailed estimate of the burn rate may be calculated by identifying the resources impacted by a particular schedule delay (only labor, or labor, facilities and material) and calculating the burn rate based only on the cost of those resources impacted. It can also be complicated by what phase the project is in and the development, manufacturing, and storage costs that are indicative of those phases. In all cases, schedule analysis relies on clearly documented assumptions and methodologies so that the estimates may be more easily reusable, transferable, and understood by all relevant stakeholders.
1.10.7 Additional Resources Schedule Risk Analysis: Why it is important and how to use it
http://sunset.usc.edu/GSAW/gsaw2002/s11a/book.pdf
PERT Charts Take Precedence http://appel.nasa.gov/ask/issues/11/practices/index.html
1.11 Earned Value Management (EVM) All acquisition programs have risk and managing those risks is a fundamental task of project managers and NASA centers. The Earned Value Management (EVM) methodology is a project management technique that allows decision makers to:
�• Integrate performance, cost, and schedule with risk management �• Perform an objective assessment and quantification of current project performance �• Predict future performance based on trends

Cost Estim
atingC
ost Risk
Economic &
Supporting AnalysisC
areer Developm
ent Guide
Reference
Know
ledge Managem
entC
ost Estimating
Cost R
iskEconom
ic & Supporting Analysis
Career D
evelopment G
uideR
eferenceK
nowledge M
anagement
2008 NASA Cost Estimating Handbook Section 1. Economic Analysis
Volume 3 Page 3-27
1.11.1 Definition EVM is a project management technique that measures forward progress objectively. EVM has the unique ability to combine measurements of technical performance (i.e., accomplishment of planned work), schedule performance (i.e., behind/ahead of schedule), and cost performance (i.e., under/over budget) within a single integrated methodology. If implemented properly, EVM provides an early warning of performance problems while there is still time for corrective action.
The genesis of EVM dates back to the 1960s and Cost/Schedule Control System Criteria (C/SCSC). All cost, schedule, and technical reporting requirements were organized into 35 system criteria, which later evolved into the industry standard-American National Standards Institute/Electronic Industries Alliance (ANSI/EIA) -748, Earned Value Management Systems. This standard establishes 32 minimum management guidelines for an Earned Value Management System (EVMS) to ensure the validity of the information used by management. The US government has adopted the guidelines in ANSI/EIA-748 for use on government programs and contracts through OMB Circular A-11, Part 7, Section 300. It requires EVM on all capital asset acquisitions, and states �“Agencies are expected to achieve, on average, 90 percent of the cost, schedule and performance goals for major acquisitions.�”
NPR 7120.5 describes the implementation of Earned Value Management (EVM) and requires:
�• The project�’s EVM approach is consistent with the participating Center�’s best practices
�• If the project�’s primary NASA Center has a fully validated Earned Value Management System (EVMS), the project uses that system rather than EVM principles
�• The project�’s EVM approach is in-place by KDP C and implemented in Phase C through KDP E
�• Project EVM reporting begins within 60 days after the start of Phase C
�• As a minimum, EVM principles, as defined by ANSI/EIA-748, Earned Value Management Systems apply from KDP C through KDP E, if the project�’s life-cycle cost is at or greater than $20M
�• For development or production (including flight and ground support) contracts and subcontracts valued at $20M or more, the contractor EVMS must comply with the guidelines in ANSI/EIA-748
�• For development or production (including flight and ground support) contracts and subcontracts valued at $50M or more, the contractor EVMS has been formally determined compliant with ANSI/EIA-748 by the cognizant Federal contract management agency
1.11.2 Steps in the EVM Process NASA policy requires that contractors�’ management systems be compliant with the current version on ANSI/EIA-748 whenever EVM is required. This standard covers the organization, planning and budgeting, accounting considerations, analysis and management reports, and revisions and data maintenance management guidelines.

Cost Estim
atingC
ost Risk
Economic &
Supporting AnalysisC
areer Developm
ent Guide
Reference
Know
ledge Managem
entC
ost Estimating
Cost R
iskEconom
ic & Supporting Analysis
Career D
evelopment G
uideR
eferenceK
nowledge M
anagement
2008 NASA Cost Estimating Handbook Section 1. Economic Analysis
Volume 3 Page 3-28
1.11.3 Additional Resources NPR 7120.5 NASA Program and Project Management Processes and Requirements
http://nodis.hq.nasa.gov/displayDir.cfm?Internal_ID=N_PR_7120_005D_
OMB Circular No. A-11 Preparing, Submitting, and Executing the Budget http://www.whitehouse.gov/omb/circulars/a11/current_year/a11_toc.html
NDIA PMSC ANSI/EIA-748-A Standard for Earned Value Management Systems Intent Guide http://www.ndia.org/Content/ContentGroups/Divisions1/Procurement/PDFs10/NDIA_PMSC_EVMS_IntentGuide_Jan2005.pdf
NASA EVM Overview http://evm.nasa.gov/index.html
Defense Acquisition University EVM Gold Card https://acc.dau.mil/CommunityBrowser.aspx?id=19577
1.12 Affordability The Vision for Space Exploration (February 2004) calls on NASA to implement �“a sustained and affordable human and robotic program to explore the solar system and beyond.�”
Affordability should be incorporated into all programmatic decisions as sound affordability practices have proven highly beneficial when developed and implemented as part of complex programs and projects. Much of the LCC associated with human space systems occurs during program/project operations and sustainment. Therefore, careful attention to affordability, particularly by establishing an affordability process and methodology in the early program/project phases, will help NASA maximize cost savings, define best value solutions to the top-level requirements set, and reduce future program/project operations and sustainment costs.
1.12.1 Definition Affordability can be defined as the engineering process or management discipline which assures the final system, program, project, product, or service can be delivered (or owned, operated, developed, and produced) at a cost which meets previously-established funding (or best value) constraints while still meeting all approved requirements (or standards, needs, and specifications).
Affordability is a continuous, overarching process applied throughout the program/project life cycle that helps a program/project to achieve the following:
�• Optimal system performance for total LCC while satisfying scheduling requirements and managing risks
�• Methodologies to acquire and operate affordable systems by setting aggressive yet achievable cost objectives and managing those objectives throughout the full program/project life cycle

Cost Estim
atingC
ost Risk
Economic &
Supporting AnalysisC
areer Developm
ent Guide
Reference
Know
ledge Managem
entC
ost Estimating
Cost R
iskEconom
ic & Supporting Analysis
Career D
evelopment G
uideR
eferenceK
nowledge M
anagement
2008 NASA Cost Estimating Handbook Section 1. Economic Analysis
Volume 3 Page 3-29
�• A balance between cost objectives and mission needs with projected out-year resources, taking into account anticipated product and process improvements
�• Cost as a principle input variable in the program/project structure and in the design, development, production, operation, and support of a system
�• Cost becoming more of a constraint, and less of a variable, in the process of developing and supporting affordable systems once system performance and cost targets are determined
1.12.2 Determining Affordability Affordability is achieved by establishing top-level affordability goals that are then flowed down to projects and by challenging unaffordable requirements through cost-driven trade studies. Useful affordability tools include parametric cost estimating models, historic cost databases, cost trade processes and modeling and simulation. Modeling and Simulation (M&S) includes adapting and applying models and simulations to a variety of applications (types of analyses and domains) and, if needed, developing new models and simulations for new domains not previously analyzed/quantified; and performing verification, validation, and accreditation (VV&A) of models and simulations. Models and simulations provide a powerful tool for assistance in cost estimating as well as performing cost/performance trades and CAIV studies.
The Interim NASA Technical Standard provides uniform engineering and technical requirements for processes, procedures, practices and methods to meet urgent program and project technical needs. The Standard for Models and Simulations (NASA-STD-(I)-7009), ensures that the credibility of the results from M&S is properly conveyed to those making critical program and project decisions. In addition, the M&S standard assures that the credibility of the results from M&S meets the project requirements
1.12.3 Additional Resources The Standard for Models and Simulations (NASA-STD-(I)-7009)
http://standards.nasa.gov/public/public_detail.taf?Documents_uid1=6365&doc_name=NASA-STD-(I)-7009#
NASA Program and Project Management Processes and Requirements NPR 7120.5 http://nodis.hq.nasa.gov/displayDir.cfm?Internal_ID=N_PR_7120_005D_
NASA Systems Engineering Processes and Requirements NPR 7123.1 http://nodis.hq.nasa.gov/displayDir.cfm?t=NPR&c=7123&s=1A
1.13 Real Option Valuation Real option valuation has already been applied to a variety of investment decisions by industry, and is widely taught as part of a modern curriculum in business investment analysis. Only

Cost Estim
atingC
ost Risk
Economic &
Supporting AnalysisC
areer Developm
ent Guide
Reference
Know
ledge Managem
entC
ost Estimating
Cost R
iskEconom
ic & Supporting Analysis
Career D
evelopment G
uideR
eferenceK
nowledge M
anagement
2008 NASA Cost Estimating Handbook Section 1. Economic Analysis
Volume 3 Page 3-30
recently, though, has real options modeling and analysis been applied to space systems17 and NASA investments.18
1.13.1 Definition Real options valuation is a financial technique for evaluating investments under conditions of uncertainty, particularly uncertainty associated with market variables such as future product demand or the future value of an asset. Option pricing is a well-developed area of financial engineering, dealing with the valuation of puts, calls, and more complex derivatives, but when applied to non-financial assets, the term �“real options�” is used. In real options valuation, the general ideas from financial options pricing theory are used along with some of the mathematics.
Basically, real options valuation is a way of capturing value that goes unrecognized in traditional NPV analysis. In particular, when the future is uncertain, there is a value in having the flexibility to decide what to do after some of that uncertainty has been resolved. The managerial flexibility to wait, abandon, or expand on an investment opportunity is captured in a real option. The real option value of the investment opportunity, then, is what a value-maximizing firm would pay for the right to undertake the investment project with its inherent decision points.
1.13.2 Calculating the Value of a Real Option The value v of a real (non-income producing) option that pays off W(T) at future time T is given by the general formula:
v(t,T) = exp( �–r (T �– t)) E[ max(0, W(T))]
where t is current time, E denotes the risk-neutral expected value, and r is the riskless discount rate.
The expected value of the truncated payoff function, W( ), rarely can be computed analytically. Generally, W( ), or an argument of it, is assumed to follow a stochastic to process, and methods such as Monte Carlo simulation can be employed to approximate its full probability distribution at time T. The simulated payoffs can then be averaged and discounted to obtain the option value.
Consider, for example, an R&D investment or pilot project to develop a lower-cost technological process. The Present Value of the cost of the R&D or pilot project is C. Such a strategic investment opportunity can be viewed as a call option, having as [its] underlying asset the Present Value of the expected cash inflows from the completed and operating follow-on project, VT, with [the] exercise price being the necessary investment outlay, I.
The ability to defer (for T �– t periods) investment in the follow-on project under market demand uncertainty creates valuable flexibility for management. If, during the later stages, market demand develops favorably, the firm can make the follow-on investment and obtain the project�’s
17 Saleh, Joseph H., Lamassoure, Elizabeth, and Hastings, Daniel E., �“Space Systems Flexibility Provided by On-Orbit Servicing:
Part 1�”, Journal of Space Cost Estimating Community Spacecraft and Rockets, July-August 2002, 39(4), pp. 551-560; and Lamassoure, Elizabeth, Saleh, Joseph H., and Hastings, Daniel E., Space Systems Flexibility Provided by On-Orbit Servicing: Part 2�”, Journal of Space Cost Estimating Community Spacecraft and Rockets, July-August 2002, 39(4), pp. 561-570.
18 Shishko, Robert, Ebbeler, Donald H. and Fox, George, �“NASA Technology Assessment Using Real Options Valuation�”, Systems Engineering, 2003, 6(4), pp. 224-234.

Cost Estim
atingC
ost Risk
Economic &
Supporting AnalysisC
areer Developm
ent Guide
Reference
Know
ledge Managem
entC
ost Estimating
Cost R
iskEconom
ic & Supporting Analysis
Career D
evelopment G
uideR
eferenceK
nowledge M
anagement
2008 NASA Cost Estimating Handbook Section 1. Economic Analysis
Volume 3 Page 3-31
Net Present Value at that time, NPVT = VT �– I [ W(T)]. If, however, market demand is weak, management can decide not to invest and its value would be truncated to 0.
In option pricing thinking, the entire investment program is worth �–C + the value of the call option on the follow-on project, namely, �–C + v(t,T) = �–C + exp( �–r (T �– t)) E[ max(0, NPVT)].
1.13.3 Additional Real Option Valuation Reference A Real Options Approach for NASA Strategic Technology Selection
http://trs-new.jpl.nasa.gov/dspace/bitstream/2014/18213/1/99-1681.pdf
A Real Options Framework for Space Mission Design http://ieeexplore.ieee.org/iel5/10432/33126/01559307.pdf?arnumber=1559307
Numerous books and articles have been published on real options topics. For a very simple exposition of real options and their valuation, including what makes option value different from NPV, see:
�• Timothy A. Luehrman, �“Investment Opportunities as Real Options: Getting Started on the Numbers�”, Harvard Business Review, July-August 1998.
�• Timothy A. Luehrman, �“Strategy as a Portfolio of Real Options�”, Harvard Business Review, September-October 1998.
For more advanced reading, see:
�• Avinash K. Dixit and Robert Pindyck, Investment Under Uncertainty, Princeton University Press, Princeton, NJ, 1994.
�• Lenos Trigeorgis, Real Options: Managerial Flexibility and Strategy in Resource Allocation, MIT Press, Cambridge, MA, 1996.
�• Eduardo S. Schwartz and Lenos Trigeorgis, eds., Real Options and Investment Under Uncertainty: Classical Readings and Recent Contributions, M.I.T. Press, Cambridge, MA, 2001.
1.14 Lease Versus Buy Analysis A lease versus buy analysis can be performed once the decision is made to acquire an asset. This analysis is commonly used in business cases and applies most often to facilities and Information Technology (IT) projects. While the process of analyzing the economics of buying an asset has been discussed in this document, the analysis behind the decision is slightly different. For a lease versus buy analysis, various tradeoffs need to be examined.
1.14.1 Definition When analyzing the financial considerations under the lease versus buy decision process, one needs to consider the LCC of either leasing or buying and operating and maintaining the hardware. The most meaningful financial comparison is the cost of lease financing versus the cost of debt financing. While comparing absolute LCC is important, it is equally critical to take into consideration fiscal budgetary constraints. While the LCC of leasing may be higher over the entire term the hardware is leased, the annual expenditures may fit better with NASA�’s

Cost Estim
atingC
ost Risk
Economic &
Supporting AnalysisC
areer Developm
ent Guide
Reference
Know
ledge Managem
entC
ost Estimating
Cost R
iskEconom
ic & Supporting Analysis
Career D
evelopment G
uideR
eferenceK
nowledge M
anagement
2008 NASA Cost Estimating Handbook Section 1. Economic Analysis
Volume 3 Page 3-32
budgetary limitations. However, the lease versus buy decision cannot be based purely on financial data or budgetary considerations. The decision must be made on a best value consideration. A best value selection analysis would introduce intangible benefits that could be benefits of either leasing or buying.
1.14.2 Lease Versus Buy Approach Considerations Sample factors to consider when making the decision to lease or buy:
�• Asset redeployment/disposal �• Asset tracking �• Maintenance options �• Political considerations �• Value of cancellation options �• Shortened product life cycle �• Technology refresh �• Convenience �• Ease of contracting �• Transference of residual risk
Traditionally, factors such as asset tracking and asset redeployment/disposal are considered to be advantages of leasing, however, circumstances could exist which would make these factors a disadvantage. Similarly, these types of benefits could be provided through certain procurement vehicles. It is critical to be aware of all competing purchase alternatives to leasing as well as being aware of the legislative and policy directives guiding leasing.
1.14.3 Additional Resources NASA Business Case Guide for Facilities Projects
http://www.hq.nasa.gov/office/codej/codejx/Assets/Docs/Case_Guide_4-20-06.pdf

Cost Estim
atingC
ost Risk
Economic &
Supporting AnalysisC
areer Developm
ent Guide
Reference
Know
ledge Managem
entC
ost Estimating
Cost R
iskEconom
ic & Supporting Analysis
Career D
evelopment G
uideR
eferenceK
nowledge M
anagement
2008 NASA Cost Estimating Handbook Section 2. Other Cost Estimating Considerations
Volume 3 Page 3-33
Section 2. Other Cost Estimating Considerations
2.1 Full Cost Accounting In response to NASA requirements and federal guidance, NASA began budgeting and recording cost using Full Cost in FY 2004. Cost estimates done after FY2004 reflect full cost at a level consistent with the data available. Full cost will impact much of what we do but the ability to operate in a full cost environment is not meant to be a substitute for sound management practices as defined in the Strategic Management Handbook and the Program/Project Management Handbook (NPR 7120.5).
After three years of full cost implementation, NASA conducted a review of the implementation and effects of full cost management on Agency operations. The primary
finding from that review was that the overhead allocations were more complex than necessary, and that the overhead allocation approach created disadvantages for NASA�’s smaller research Centers.
The original full cost approach allocates the cost to run each Center to projects based upon their workforce at the Center. Since costs to operate a Center are not solely a function of the size of the workforce, the overhead costs for the smaller Centers were significantly higher than for the larger Centers. To eliminate the cost advantages/disadvantages between Centers, beginning in fiscal year 2007, NASA is managing Center overhead costs with a single rate for all nine Federal centers. (The overhead for NASA�’s Jet Propulsion Laboratory is included in its contract rates as a Federally-Funded Research and Development Center). A single Agency-wide rate for Center Management and Operations (CM&O) will be allocated to each of the Agency�’s non-JPL projects and programs based on each project�’s direct budget.
The other change implemented for FY 2007 was to re-balance the allocation of responsibilities between the Centers and Mission Directorates. Management of the technical capabilities of the Center, primarily for Engineering and Safety and Mission Assurance, was moved to the Center Director, with associated budgets transferred to CM&O. This re-allocation of overhead costs was content neutral for the Mission Directorate projects. Those projects based at the smaller Centers will see a net reduction in allocated overhead, and thus full cost budget. Projects at the larger Centers will receive additional overhead allocations, increasing their total full cost budget, but their direct content remains unchanged. The total budget for each Center, both for Center operations and for conducting projects, remains unchanged. The change in the full cost methodology is outlined in Figure 3-15.

Cost Estim
atingC
ost Risk
Economic &
Supporting AnalysisC
areer Developm
ent Guide
Reference
Know
ledge Managem
entC
ost Estimating
Cost R
iskEconom
ic & Supporting Analysis
Career D
evelopment G
uideR
eferenceK
nowledge M
anagement
2008 NASA Cost Estimating Handbook Section 2. Other Cost Estimating Considerations
Volume 3 Page 3-34
Total NOA less corporate
Direct NOA
Overhead Allocation is Simplified
Complexity and effort required of previous approach exceeded the benefit
New
Corporate G&A/Inst Inv$1.0B (NOA)
Note: Numbers are still in development and are not yet final.
Direct Projects$13.8B
Technical Service Pools$0.3B
Direct NOA
Old
Corporate G&A/Inst Inv$1.0B (NOA)
Direct Projects$13.8B
Technical Service Pools$0.4B
($63M)
IT Services Pool$0.2B (seats)
Facilities Services Pool$0.4B (sq footage)
($87M)
($66M)
($12M)
($4M)
($10M)
Center Management & Ops$1.7B (NOA)
Center G&A$1.1B (workforce)
Figure 3-15. Full Cost Simplification Methodology
Key Full Cost Simplification points include:
�• Substitute Center G&A with a new Center Management and Operations (CM&O) budget that consolidates the overhead costs from the nine NASA field Centers
�• Allocate CM&O to Agency�’s (non-JPL) projects on basis of each project�’s direct budget
�• Establish Center-specific CM&O budgets during Agency�’s annual budget process
�• Promote competition based on quality of capabilities rather than costs at Centers
�• Maintain the Agency�’s research capabilities and share proportionally across all Agency projects
The concept of full cost ties all Agency direct and indirect costs (including civil service personnel costs) to major activities called cost objects. These cost objects are NASA�’s programs and projects. In the past, civil service personnel costs and certain other costs of the institution were not tied to projects. However, now they are charged or allocated. Cost estimators and financial managers need to include these costs in project/program estimates and must also conduct adequate reviews of proposals to ensure that these costs are included.

Cost Estim
atingC
ost Risk
Economic &
Supporting AnalysisC
areer Developm
ent Guide
Reference
Know
ledge Managem
entC
ost Estimating
Cost R
iskEconom
ic & Supporting Analysis
Career D
evelopment G
uideR
eferenceK
nowledge M
anagement
2008 NASA Cost Estimating Handbook Section 2. Other Cost Estimating Considerations
Volume 3 Page 3-35
QUESTION: What is the full cost of a project?
ANSWER: The full cost of a project is the sum of all direct costs, service costs, and Center Management and Operations (CM&O) costs associated with the project. Because service and CM&O costs cannot be immediately and directly identified with a specific project, service activity costs and CM&O cost pools are used to accumulate costs of similar purpose.
QUESTION: How are costs categorized when using a full cost approach?
ANSWER: Costs may be categorized in different ways. NASA's full cost approach separates costs into three general categories:
1. Direct Costs �– Direct costs are costs that are obviously and physically related to a project at the time they are incurred such as purchased goods and services, contracted support, and direct civil service salaries/benefits/travel.
2. Service Costs �– Service pool costs are costs that cannot be specifically and immediately identified to a project, but can subsequently be traced or linked to a project and are assigned based on usage or consumption. Each pool carries all supporting costs for that function including: civil service salaries/benefits; contractor labor; travel; purchases; pool management; facility related costs. Note that the NASA Full Cost Simplification has eliminated/reduced many Center specific service pools.
3. Center Management and Operations (CM&O) Costs �– CM&O costs are costs that cannot be related or traced to a specific project, but benefit all activities. Such costs are allocated to a project at the Headquarters level using a standard rate for all projects. Project CM&O dollars remain at NASA Headquarters when project budgets are sent to the implementing Centers.
2.1.1 Overview of Budget Planning in Full Cost During budget planning and execution, the three general categories of cost are further refined into the following elements of cost:
a. Procurements �– purchases of contractor hardware, contractor labor, equipment, etc.
b. Personnel �– cost of civil service personnel labor and benefits.
c. Travel �– cost of project travel.
d. Service Pools �– specific infrastructure capabilities that support multiple programs/projects at a Center. These costs can be traced/linked to a given project based on usage/consumption. NASA Full Cost Simplification has eliminated/reduced many Center specific service pools.
e. CM&O �– CM&O costs captures Center costs that cannot be related or traced to a specific project, but benefit all activities. The following standard types of costs/functions are included in the CM&O account: CM&O civil service salaries/benefits/travel; center training and awards; grounds maintenance; pavement/roads; fire protection; library; public affairs; non-program CoF; transportation services; human resources department; financial management, equal opportunity; educational outreach; medical services; procurement, security, and legal. CM&O costs are aggregated at the Agency level and are allocated to the projects using an Agency rate for all projects.
f. Corporate G&A �– Costs related to the business operations of NASA Headquarters as a Center and Agency level functions that are G&A in nature performed at a Center (for

Cost Estim
atingC
ost Risk
Economic &
Supporting AnalysisC
areer Developm
ent Guide
Reference
Know
ledge Managem
entC
ost Estimating
Cost R
iskEconom
ic & Supporting Analysis
Career D
evelopment G
uideR
eferenceK
nowledge M
anagement
2008 NASA Cost Estimating Handbook Section 2. Other Cost Estimating Considerations
Volume 3 Page 3-36
example, IEMP). This includes costs for: the NASA Administrator and immediate staff; the Mission Directorate level/management; Headquarters Operations management; and Functional management, including Safety and Mission Assurance (SMA).
Although CM&O and Corporate G&A are assessed to projects at the Agency level, during the estimating process for a new initiative, it may be requested by the solicitor to be included. For example, when submitting proposals for NASA Research Announcements (NRA) or Announcements of Opportunity (AO), CM&O and Corporate G&A may be required to support the cost evaluation of the proposals.
2.1.2 Service Pools Full Cost Simplification has allowed several Centers to eliminate all service pools while the number of service pools at the Center level have been reduced from six to two or less at most Centers. Test Service and Manufacturing Service are the two common service pools remaining at Centers still employing service pools.
Full Cost Simplification has also eliminated the complicated flow down of costs from pool to pool.
2.1.3 Summary NASA Full Cost Simplification has resulted in the following:
�• Moved service pool overhead into the CM&O account
�• Eliminated or reduced service pools at all Centers
�• Eliminated Center level G&A
�• Created the Agency level CM&O account
�• Changed the method of allocation from the old Center G&A approach (direct workforce) to the new CM&O approach (percentage of project direct cost)
�• Eliminated the pool to pool assessment process
2.1.4 For Further Information NASA FY 2008 Budget Estimates (Supporting Data)
http://www.nasa.gov/pdf/168652main_NASA_FY08_Budget_Request.pdf
NASA Financial Management Requirements http://www.nasa.gov/offices/ocfo/references/ocfo_fmr_detail.html
NASA Full Cost Initiative website http://www.hq.nasa.gov/fullcost/
Table 3-3. Full Cost Points of Contact
Center Contact Name Email
NASA Headquarters David Schurr [email protected]
Ames Research Center John Lee [email protected]
Dryden Flight Research Center Steve Sterk [email protected]
Glenn Research Center Bob Sefcik [email protected]

Cost Estim
atingC
ost Risk
Economic &
Supporting AnalysisC
areer Developm
ent Guide
Reference
Know
ledge Managem
entC
ost Estimating
Cost R
iskEconom
ic & Supporting Analysis
Career D
evelopment G
uideR
eferenceK
nowledge M
anagement
2008 NASA Cost Estimating Handbook Section 2. Other Cost Estimating Considerations
Volume 3 Page 3-37
Center Contact Name Email
Goddard Space Flight Center Garry Gaukler [email protected]
Jet Propulsion Laboratory n/a n/a
Johnson Space Center Grace Martinez [email protected]
Kennedy Space Center Janice Robertson [email protected]
Langley Research Center Debbie Schroeder [email protected]
Marshall Space Flight Center Michael White (Labor) Karen Dugard (Reimbursables)
[email protected] [email protected]
Stennis Space Center Rena Perwien [email protected]
2.2 Construction of Facilities
Construction of Facilities (CoF) cost estimating is different in discipline and methodology than space cost or research and development of technology (R&T) estimating. In contrast to most space cost and R&T estimating, which is guided by NPR 7120.5, NPR 8820.2 Design and Construction of Facilities, is the guidance for most CoF design and implementation estimating.
Most CoF estimators have little in common with space system cost or R&T estimators; except in offices that have oversight into all NASA functions. In addition to the RS Means published lists of tables and regional metrics, Centers have access to various guidelines and tools used to create facilities cost estimates. �“Success Cost Estimator�” is a tool developed for Kennedy Space Center (KSC) which can be used for estimating the cost of facilities construction. �“Standards for Facility Project Cost Estimating�” is a manual as well as standard estimating template developed at Johnson Space Center for use in creating construction estimates. The needs and considerations in creating a facilities cost estimates vary somewhat depending on the type and use of the facility. This section of the handbook is intended to provide an overview of the five year CoF process as well as describing some of the lessons learned, special considerations and tools used when creating a CoF
CoF Lessons Learned Input provided by Dan Tweed, KSC
1. In preparing your cost estimate, remember that the construction schedule must be coordinated with not only project stakeholders but with the Center’s mission and operational schedules (Including State Historical Preservation Office, Real Estate Office, Environmental Office, Energy Office, Security, Health, Fire and Life Safety Office etc). Build those interruptions and associated costs into the estimate and schedule by adding money and additional contingencies for schedule integration needs. In KSC’s launch processing environment, we have to coordinate implementation schedules with shuttle operations schedules and payload processing schedules or space station element processing. Sometimes we have to start and stop construction around launches.
2. Remember to estimate for support costs during construction. For example, if during construction a utility service has to be taken offline, then temporary facilities must be provided and paid for that out of the construction budget. This includes items like temporary road closures, rerouting roads, sidewalks, pavements, utility service interruptions, scheduled outages, temporary power etc.)
3. Estimate and plan to spend more money initially on soil borings to get enough of a distribution on a building’s footprint and find any unsuitable materials. During a building construction, KSC received an unpleasant surprise with a muck layer that was in between soil borings we took; the resulting fix cost a lot more money.
4. When estimating maintenance, rehabilitation, or revitalization for older structures, be aware of human safety needs and special handling requirements for components like lead paint or asbestos. Identify and estimate for these additional costs.

Cost Estim
atingC
ost Risk
Economic &
Supporting AnalysisC
areer Developm
ent Guide
Reference
Know
ledge Managem
entC
ost Estimating
Cost R
iskEconom
ic & Supporting Analysis
Career D
evelopment G
uideR
eferenceK
nowledge M
anagement
2008 NASA Cost Estimating Handbook Section 2. Other Cost Estimating Considerations
Volume 3 Page 3-38
estimate.
2.2.1 Overview of the CoF Process The CoF process is based on a five-year cycle. The cycle begins when a budget call is initiated to determine the priority of CoF projects. Approved projects are prioritized and assigned a year of execution. This information is included in the 5-year budget submitted by each Center on an annual basis. At a Center, the Facilities Division is responsible for CoF projects, which are directed by a program manager, with a facility project manager assigned to each project. Project managers have cradle to grave responsibility for each project. If needed, a support contractor does Independent Cost Estimates (ICEs). In addition, the center�’s independent assessment team may be asked for additional support. The Center�’s CoF program manager requests input from individuals across the Center. A list of required CoF projects is prepared, including associated parametric estimates. In addition to the parametric estimate, the engineering staff will prepare a Rough Order of Magnitude (ROM) estimate. Included in the CoF program manager�’s submission is an estimate for civil servant labor costs for each program year. The Facilities Division collects and prioritizes the input received based on a risk assessment matrix provided by Headquarter�’s Facilities Engineering and Real Property Division. The Center Director and his team prioritize and approve those projects that will be submitted for budget inclusion. The CoF portion of the budget request is sent additionally to Headquarters FERP (Facilities Engineering and Real Property Division) for evaluation and prioritization. The funded project list is sent back to the Center after FERP approval. CoF cost estimating, project planning and design can begin two years out, when HQ Facilities Engineering and Real Property Division authorizes Facilities, Planning and Design (FP&D) money based on 2-year out project approved budget. (For example, in FY04, the centers will receive FY04 construction money and FY06 design money.) Cost estimating, project planning and design are paid for by FP&D allocations. After FP&D money is received, the Facilities Division project manager issues a SOW for the design of each project. This SOW identifies project budget, scope and an estimated construction price based on approved budget amount (current cost estimate or CCE). The CCE includes construction contract award budget (must include construction escalation), approximately 10% for contingency, and 10% for supervision, inspection, and engineering services (SEIS). These values are approximations and can vary greatly from Center to Center. Architecture/Engineering or Civil, Structural, Mechanical, and Electrical firms may hold on-call design services contracts. Some Centers have in-house NASA engineers that will comprise the design team. The SOW includes the target cost available to the design team for the effort. The team will estimate and design to this budgeted amount. The project is competitively awarded through procurement with advice from the Facilities Division. Following the design contract award to a firm, the Facilities Division project manager will hold a kickoff meeting �–which can include the design team, Facilities Division office representatives and other stakeholders to start a process for establishing the detailed scope. Reviews usually follow at 30, 60, and 90% design and cost milestones, but can vary from Center to Center.

Cost Estim
atingC
ost Risk
Economic &
Supporting AnalysisC
areer Developm
ent Guide
Reference
Know
ledge Managem
entC
ost Estimating
Cost R
iskEconom
ic & Supporting Analysis
Career D
evelopment G
uideR
eferenceK
nowledge M
anagement
2008 NASA Cost Estimating Handbook Section 2. Other Cost Estimating Considerations
Volume 3 Page 3-39
Typically, a design team prepares a detailed ground-up estimate, initially based on square foot estimates (at the 30% review.). Then, the designer creates detailed estimates, incorporating material take-offs and linear square foot costs against each system and vendor quotes for different building components. Information is gathered from tools like RS Means and local vendor�’s estimates, historical data from past projects, and estimates include calculations for present year cost versus future year costs and expected inflation. Each project estimate is always separated into both CoF funded and non-CoF funded estimates. (Non-CoF funded examples include outfitting an office building and activation activities after facility construction.) At the 100% design and cost milestone, the facilities division project manager will review the design team�’s cost estimate, giving input on design and tracking changes. When reviewing the cost estimate, the project manager looks for anything out of the ordinary, such as costs higher than those budgeted, and what elements are CoF funded and what elements are non-CoF funded. It is important for the facilities division project manager to review all source documents used in preparing the cost estimate to make sure that all costs can be traced back to their source/origin and can be easily referenced from the source document for auditability/reproducibility. All unit costs (e.g. units of measure and quantities for each significant item should be the norm vs. using �“lump-sum�” estimates whenever feasible. This due diligence will assist the Contracting Officer (CO) during the procurement phase of this project which includes contract negotiations and making a best value contracting decision
2.3 Software Estimating Software represents a substantial portion of the cost for space systems. Estimating the cost, schedule, and effort associated with a proposed software development project is a challenging task.
Although software estimation is treated as a special case of cost estimation the cost estimating process described in this handbook still applies. The primary difference between costing software and hardware or systems is that the dominant cost component is labor, therefore correctly estimating the development effort is key. The estimation methods will depend on the resources available and the level of understanding of the needs and objectives (Task 1) and the ground rules and assumptions (Task 4). (A CADRe will usually not be developed specifically for a software project, but software development will typically be a section in a space system project�’s WBS/CADRe.) The estimation methods will depend on the amount of data available and the size and complexity of the project. All estimates are made based upon some form of comparison using measures or data that have been recorded from completed software projects. Whether the estimator chooses tool-driven estimation, historical analogy estimation, or �“Rules-of-Thumb�” depends on the size and complexity of the project.
The most comprehensive process for software estimation is documented in Jet Propulsion Laboratory�’s (JPL�’s) Software Cost Estimation Handbook [6]. Marshall Space Flight Center�’s (MSFC�’s) Flight Software Group uses tool-driven estimation, in this case the Constructive Cost Model or COCOMO19. Finally, JSC�’s Flight Software Group uses a �“Rule of Thumb�” based on historical data for mostly small developments (only one development greater than 200K software lines of code (SLOC).
19 MSFC FSG Software Project Estimating Guide.

Cost Estim
atingC
ost Risk
Economic &
Supporting AnalysisC
areer Developm
ent Guide
Reference
Know
ledge Managem
entC
ost Estimating
Cost R
iskEconom
ic & Supporting Analysis
Career D
evelopment G
uideR
eferenceK
nowledge M
anagement
2008 NASA Cost Estimating Handbook Section 2. Other Cost Estimating Considerations
Volume 3 Page 3-40
Regardless of the method used for estimation, one of the most important and most difficult steps is determining software size. There are three sizing methods that are typically used: physical source lines of code (PSLOC), logical source lines of code (LSLOC) and function point analysis. There are advantages and disadvantages to each method. For all three methods it is important to handle inherited code properly, for details see [7].
Whatever method used, it must to be applied consistently and its counting rules be clearly documented. The most common sizing method within NASA is based on PSLOC20. The PSLOC metric is very simple to count (carriage returns excluding comments and blanks) and easily lends itself to automated counting tools.21 Also historical physical SLOC data is available to support analogical comparisons and calibrating models. There are variations in Logical statements counting rules, which can cause differences in the number of lines counted between tools but logical SLOC measures more consistent across languages. FPA provides a sizing methodology that is tied to a functional design but the counting is subjective and the bases of counting in not well known to most reviewers making it more difficult to communicate. A table for converting between physical and logical SLOC is provided in Table 3-4.
Table 3-4. Converting Between Physical and Logical SLOC
Language To Derive Logical SLOC
Assembly and Fortran Assume Physical SLOC = Logical SLOC
Third-Generation Languages (C, Cobol, Pascal, Ada 83)
Reduce Physical SLOC by 25%
Fourth-Generation Languages (SQL, Perl, Oracle)
Reduce Physical SLOC by 40%
Object-oriented Languages (Ada 95, C++, Java, Python)
Reduce Physical SLOC by 30%
2.3.1 Function Point Analysis (FPA) Function points were established in the late 1970s as an alternative to SLOC, but only recently have they gained more attention and use. Function points measure software size based on the functionality requested by and provided to the end user. Functions are categorized as data or transactions. Data functions include logical data groups that are captured and stored by the application being estimated and external data referenced by the application. Transaction functions encompass inputs (add, change, and delete), outputs (reports), and inquiries (searches or
20 SLOC does not include comments, blank lines, data and non-delivered programmer debug statements. 21 Jones, T. Capers (1998), p. 319.
InputsOutputs
Inquiries
EndUser
Application Being Assessed
ExternalInterfaces
Other Applications/Systems
Internal Logical Data
Inputs
Outputs
Inquiries
Figure 3-16. Function Point Analysis Summary Diagram

Cost Estim
atingC
ost Risk
Economic &
Supporting AnalysisC
areer Developm
ent Guide
Reference
Know
ledge Managem
entC
ost Estimating
Cost R
iskEconom
ic & Supporting Analysis
Career D
evelopment G
uideR
eferenceK
nowledge M
anagement
2008 NASA Cost Estimating Handbook Section 2. Other Cost Estimating Considerations
Volume 3 Page 3-41
retrievals).
One of the key benefits of using function points as the sizing method is that counting standards are established and maintained for the technique. The International Function Point Users Group (IFPUG)22 manages, regulates, and issues updates to these standards, making function points fully documentable and traceable. Many resources can avail themselves to function point analysis at various stages in the development life cycle, including user or estimator interviews, requirements and design documents, data dictionaries and data models, use cases and user guides, and even screen captures or the actual software. Function points, like SLOC, offer certain advantages and disadvantages, which are detailed in Table 3-5.
Table 3-5. Function Point Advantages and Disadvantages
Advantages Disadvantages
Standards are established and reviewed frequently Largely a manual process
Resulting metrics are logical and straightforward Accurate counting requires in-depth knowledge of standards
Counting resources are available from requirements stage and applicable for full life-cycle analysis
Some variations exist that are not standardized (Mark II, 3D, full, feature points, object points, etc.)
Technology, platform, and language independent Not as much historical data available as SLOC
Objectively defines software application from the user’s perspective
Sometimes backfiring, derived from SLOC can be inaccurate and misleading
2.3.2 Effort Estimation Because software effort estimates are required when the requirements and design are immature, it is important that more then one estimate be generated to establish the basis of estimate (BOE). It is recommended that two to three different types of estimates be derived:
�• A traditional engineering estimate typically based on a bottom-up decomposition �• A model based estimate �• An analogical comparison to other similar tasks
JPL and other Centers track the size of development efforts and can derive a size estimate based on analogy to the historical data. Sizing by analogy, however, does not address all the relevant issues. What requires effort is the amount of code that needs to be written, modified and tested, not the amount of code that gets delivered. To estimate the development effort, the number of Equivalent SLOC needs to be derived, which is based on weighting the cost of an inherited line relative to the cost of delivering a new line of code. Historically, there is a tendency to over estimate the amount of inheritance and to underestimate the cost of inheritance, so be conservative. The cost models have algorithms built in to compute equivalent SLOC. For a simplified approach to computing equivalent SLOC, apply the adjustment factors displayed in Table 3-6.
22 For more information on function points visit www.ifpug.org.

Cost Estim
atingC
ost Risk
Economic &
Supporting AnalysisC
areer Developm
ent Guide
Reference
Know
ledge Managem
entC
ost Estimating
Cost R
iskEconom
ic & Supporting Analysis
Career D
evelopment G
uideR
eferenceK
nowledge M
anagement
2008 NASA Cost Estimating Handbook Section 2. Other Cost Estimating Considerations
Volume 3 Page 3-42
Table 3-6. Effort Adjustment Multipliers for Software Heritage23
Software Heritage Category Effort Multiplier
New design and new code 1.2
Similar design and new code (nominal case) 1.0
Similar design and some code reuse 0.8
Similar design and extensive code reuse 0.6
Because no analogy is ever perfect and because expert judgment must be applied to obtain a best guess as to the SLOC to be developed, it is also important that estimation uncertainty is factored in. It is recommended that the estimator estimate a size distribution based on the least or minimum number of time, the likely amount of time, and the most amount of time for a development effort for each software function. These can then be combined using Monte Carlo techniques or by computing the mean of the distribution. Most parametric cost models have this feature built-in. If you do not have access to Monte Carlo or statistical software, then an easy to compute heuristic is done with by calculating the mean with the equation Mean = (Least + 4*Likely + Most)/6.
The key to translating the number of SLOC into development effort (labor months) is the productivity factor, that is the assumption made on SLOC per labor (work) month.24 The JPL Cost Estimation Handbook offers two productivity averages, one based on historical experience at JPL and NASA25 and another based on industry averages. Additionally, JSC�’s Flight Avionics Group has noted a productivity factor ranging from a low of 165.5 SLOC/LM to a high of 8,333 SLOC/LM. As can be seen in the tables below, the productivity ranges are very large. Hence, it is very important that software cost metrics repositories be established so that the estimator has access to data consistent with their environment.
Table 3-7. Software Development Productivity for JPL and NASA Average Projects (Equivalent Logical SLOC)
Software Class Mean SW Development
Productivity (SLOC/WM) Range SW Development Productivity (SLOC/WM)
Mission Critical Flight SW 125 13-467
Mission Support Flight SW 184 80-262
DSMS 197 148-347
Mission Critical Ground SW 239 116-519
Mission Support Ground SW 295 103-607
Development Support Ground SW 157 129-207
23 Based on Team X�’s ACS Cost Model, which is based mainly on Discovery-class missions. 24 JPL uses the acronym WM for work month, other sources use LM. They both mean the same thing. 25 The data in the JPL table is computed based on the NASA Software Cost Database (1986-1990), the JPL Software Resource
Center (SORCE), the JPL Interplanetary Network Directorate (IND) Software Cost Database (1990-1998) and the JPL SQI Software Cost Database (2001-present).

Cost Estim
atingC
ost Risk
Economic &
Supporting AnalysisC
areer Developm
ent Guide
Reference
Know
ledge Managem
entC
ost Estimating
Cost R
iskEconom
ic & Supporting Analysis
Career D
evelopment G
uideR
eferenceK
nowledge M
anagement
2008 NASA Cost Estimating Handbook Section 2. Other Cost Estimating Considerations
Volume 3 Page 3-43
Table 3-8. Software Development Productivity for Industry Average Projects (Equivalent Logical SLOC)
Characteristic Software Development Productivity (SLOC/WM)
Classical rates 130-195
Evolutionary approaches26 244-325
New embedded flight software 17-105
Finally, to the development effort should be added all the additional activities related to a development life cycle such as the Software Management effort and maintenance (sustainment). This arrives at the total work effort (labor months).
Once the development effort is calculated, the effort is costed using labor rate information. Either burdened civil service rates, contractor bid rates (if known) or industry average rates.
2.3.3 Parametric Model Based Estimates Software development cost estimating tools are available to the cost estimator. At some Centers, such as MSFC�’s Flight Software Group, parametric cost models are the estimation method of choice, whereas JPL�’s approach is to rely on models for cost assessment or validation. In any case, more insight is gathered when both methods are used for the purpose of comparison and validation. Parametric tools are based on data collected from hundreds of actual projects. The algorithms that drive them are derived from the numerous inputs to the models such as personnel capabilities, experience, development environment, amount of code reuse, and programming language. These tools usually provide default settings for these input parameters, which means that a reasonable estimate can be derived from a minimal amount of data. Additionally, these parametric tools provide flexibility by accepting multiple sizing metrics, so estimators can apply any number of sizing methodologies. Parametric estimation tools can receive size data either as SLOC or function points. Software cost models produce even better results when calibrated to specific development teams using actual project data. Another significant benefit of automated tools is their ability to perform sensitivity and risk analyses for a project estimate. Estimators can manipulate various inputs to gauge the overall sensitivity to parameter assumptions and then assess the overall project risk based on the certainty of those inputs.
The main drawback to software cost estimating tools is the cost and the need for users training. Some tools are expensive and complex. Many commercial software estimation tools are available on the market. Currently, NASA has agency-wide licenses for both PRICE and SEER estimating suites, which both include software estimation tools. These two specific tools trend toward the higher side of the cost-complexity spectrum, but there are several other models available to estimate software costs. Although PRICE and SEER are the two agency-wide licensed tools, JPL, MSFC, and JSC also use the COCOMO, which was developed by the Center for Software Engineering (CSE) at the University of Southern California, headed by Dr. Barry Boehm27. Training on COCOMO is available through NASA Training programs. Included in the licensing 26 Only for simpler, less complex systems and not a flight system. 27 JPL is an affiliate member of the CSE.
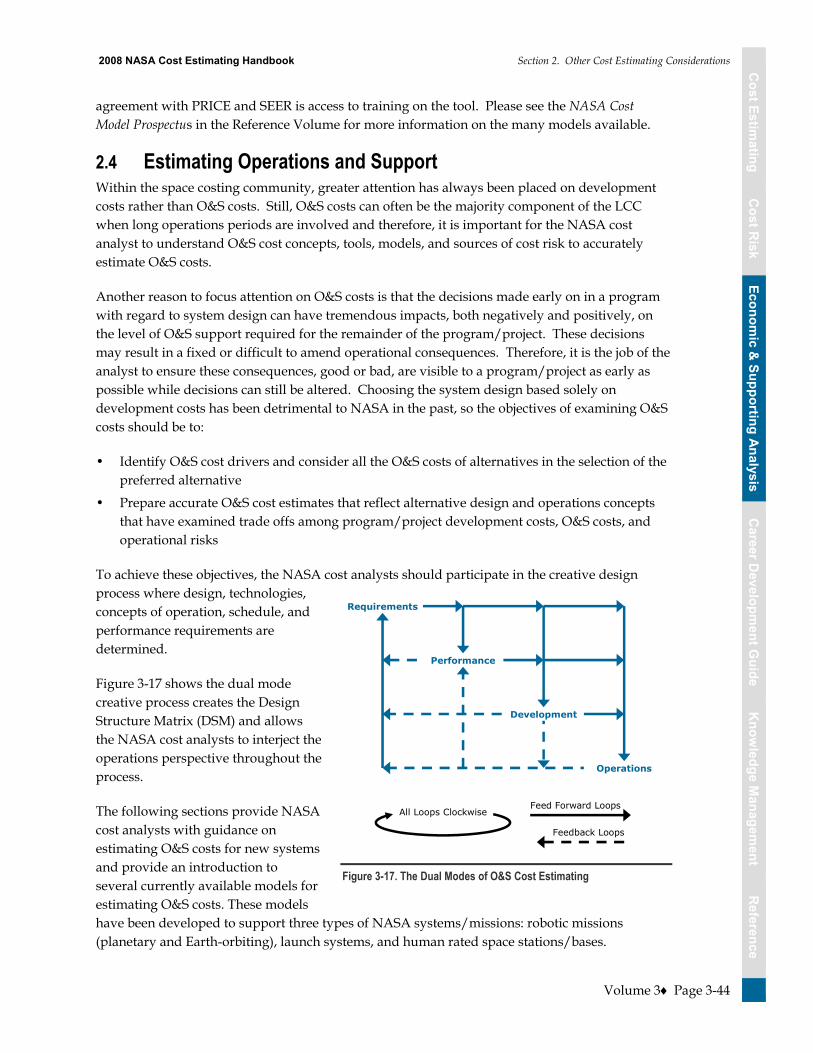
Cost Estim
atingC
ost Risk
Economic &
Supporting AnalysisC
areer Developm
ent Guide
Reference
Know
ledge Managem
entC
ost Estimating
Cost R
iskEconom
ic & Supporting Analysis
Career D
evelopment G
uideR
eferenceK
nowledge M
anagement
2008 NASA Cost Estimating Handbook Section 2. Other Cost Estimating Considerations
Volume 3 Page 3-44
agreement with PRICE and SEER is access to training on the tool. Please see the NASA Cost Model Prospectus in the Reference Volume for more information on the many models available.
2.4 Estimating Operations and Support Within the space costing community, greater attention has always been placed on development costs rather than O&S costs. Still, O&S costs can often be the majority component of the LCC when long operations periods are involved and therefore, it is important for the NASA cost analyst to understand O&S cost concepts, tools, models, and sources of cost risk to accurately estimate O&S costs.
Another reason to focus attention on O&S costs is that the decisions made early on in a program with regard to system design can have tremendous impacts, both negatively and positively, on the level of O&S support required for the remainder of the program/project. These decisions may result in a fixed or difficult to amend operational consequences. Therefore, it is the job of the analyst to ensure these consequences, good or bad, are visible to a program/project as early as possible while decisions can still be altered. Choosing the system design based solely on development costs has been detrimental to NASA in the past, so the objectives of examining O&S costs should be to:
�• Identify O&S cost drivers and consider all the O&S costs of alternatives in the selection of the preferred alternative
�• Prepare accurate O&S cost estimates that reflect alternative design and operations concepts that have examined trade offs among program/project development costs, O&S costs, and operational risks
To achieve these objectives, the NASA cost analysts should participate in the creative design process where design, technologies, concepts of operation, schedule, and performance requirements are determined.
Figure 3-17 shows the dual mode creative process creates the Design Structure Matrix (DSM) and allows the NASA cost analysts to interject the operations perspective throughout the process.
The following sections provide NASA cost analysts with guidance on estimating O&S costs for new systems and provide an introduction to several currently available models for estimating O&S costs. These models have been developed to support three types of NASA systems/missions: robotic missions (planetary and Earth-orbiting), launch systems, and human rated space stations/bases.
All Loops Clockwise
Feedback Loops
Feed Forward Loops
Requirements
Performance
Development
Operations
Figure 3-17. The Dual Modes of O&S Cost Estimating

Cost Estim
atingC
ost Risk
Economic &
Supporting AnalysisC
areer Developm
ent Guide
Reference
Know
ledge Managem
entC
ost Estimating
Cost R
iskEconom
ic & Supporting Analysis
Career D
evelopment G
uideR
eferenceK
nowledge M
anagement
2008 NASA Cost Estimating Handbook Section 2. Other Cost Estimating Considerations
Volume 3 Page 3-45
2.4.1 Estimating O&S Costs for New Systems In estimating O&S costs, the NASA cost analyst should follow the standard 12 cost estimating tasks defined in the NASA cost estimating process as tailored and described below. Typically, certain tasks within the process are performed iteratively, especially as guidelines are revised and better data become available.
Project Definition Tasks (1, 2, and 3)
The analyst should understand not only the systems in the program/project, but be involved in the development of the program/project�’s operations concepts. At a minimum, the analyst should help to shape the program/project�’s approach to:
�• Real-time operations �• Flight planning �• Training �• Maintenance and support (both on-orbit and ground systems) �• Sustaining engineering �• Communications �• Data handling and analysis �• User/science integration
These activities are generally common to planetary, Earth-orbiting, observatory, and space station operations; for space transportation vehicles and spaceport operations, the analyst needs to understand additional operations concepts such as vehicle processing.
These activities often (but not always) form the basis for a program/project�’s operations WBS. In the O&S cost models listed in the NASA Cost Model Prospectus, these costs are typically elements of the cost breakdown structure chosen by the model developers. As such, the costs of these activities are explicitly calculated by the model, but the analyst may need to transform them to accommodate a program/project operations WBS that does not conform to the model.
The CADRe should provide strong visibility to O&S concepts and cost drivers embodied in the system design. This includes visibility of O&S parameters for all operations epochs of the mission and operational risks.
Cost Methodology Tasks (4, 5, 6, and 7)
The cost analyst should understand the Ground Rules and Assumptions (GR&A) with regard to O&S costs. This includes defining:
�• The period of operations and start date of operations
�• The types of dollars needed to be consistent with the development cost estimates
�• The inflation rates and discounting assumptions
�• The lengths/types of mission epochs, as applicable
�• The planetary: spiral out/in, cruise, orbit insertion/encounter, Entry, Descent, and Landing (EDL), surface operations, extended operations, disposal

Cost Estim
atingC
ost Risk
Economic &
Supporting AnalysisC
areer Developm
ent Guide
Reference
Know
ledge Managem
entC
ost Estimating
Cost R
iskEconom
ic & Supporting Analysis
Career D
evelopment G
uideR
eferenceK
nowledge M
anagement
2008 NASA Cost Estimating Handbook Section 2. Other Cost Estimating Considerations
Volume 3 Page 3-46
�• For Earth-Orbiting and Observatories: deployment, routine operations, servicing/logistics operations, disposal
�• For human rated Space Stations: launch and assembly, mature operations, phase-out operations, disposal
�• Whether operations are multi-mission (e.g., Are facilities costs to be shares, such as the STS and ISS Mission Control Center? Are operations teams to be shared across several missions?)
�• The cost-sharing arrangements with partners
�• The Government or Non-Government Organization (NGO) operations
�• The planned degree of Government oversight
The cost analyst needs to select/develop a model depending on the level of detail available and the issues to be addressed at the time the estimate is requested. The analyst needs to ensure that the full scope of O&S costs are included, and should focus on those areas of O&S costs where costs may be substantially different for different alternatives. When selecting a model, the analyst should be concerned with model credibility and validity. The O&S cost model's computational methodology must be sound, and the results must be reproducible by another qualified analyst using the model.
A number of Government off-the-shelf (GOTS) models listed in the NASA Cost Model Prospectus in the Reference Volume are available to NASA costs analysts to deal with O&S costs for a wide variety of NASA missions. These models are capable of providing O&S cost estimates at different levels of resolution and fidelity. Generally, early in the project life cycle when information is scarce, only a ROM cost estimate may be possible or needed. For the CAIV study, the O&S cost model selected should at a minimum provide sufficient information to support architectural trades. Sometimes, more depth in the O&S cost model is needed to address critical system design and supportability issues. To populate O&S cost model inputs, the cost analyst can check to see if CADRe data is available for similar projects, interact with the development team for system characteristics, and interact with the O&S team for operations/logistics concepts and ground system characteristics. Figure 3-18 shows the capability of various GOTS O&S models to support trade studies. Other O&S assessment tools listed in the NASA Cost Model Prospectus may be very useful in providing data for lower resolution models.
Capability (Model) Rough Order of Magnitude Architectural Trades Design Trades
MOCM (General
SOCM (Robotic)
MESSOC (ISS)
OCM/COMET (LS)
AATe (LS)
INCREASING RESOLUTION
Figure 3-18. GOTS O&S Cost Model Capability

Cost Estim
atingC
ost Risk
Economic &
Supporting AnalysisC
areer Developm
ent Guide
Reference
Know
ledge Managem
entC
ost Estimating
Cost R
iskEconom
ic & Supporting Analysis
Career D
evelopment G
uideR
eferenceK
nowledge M
anagement
2008 NASA Cost Estimating Handbook Section 2. Other Cost Estimating Considerations
Volume 3 Page 3-47
The Estimate Tasks (8, 9, 10, 11, and 12)
The cost analyst should follow standard methods of performing sensitivity analyses and cost risk analyses. Some of the areas that can cause cost risk and that must be addressed while developing an O&S estimate are: mission scenario, operating tempo (such as flight rate), system reliability, and operating environments. If, for example, an O&S cost estimate is sensitive to the reliability and maintainability (R&M) of the system or one of its subsystems, the cost analyst must apply alternative R&M assumptions, just as a risk analyst would in a PRA.
Because O&S trade-offs tend to affect a program/project�’s more visible and near-term factors in exchange for benefits that may not be proven out until many years down the road, the need for defendable, measurable, credible estimation becomes especially critical. Examining R&M means examining if a more reliable system may be traded for one that fails more often but is easier to maintain by virtue of its layout or design. Alternatively, a more maintainable system may affect performance through the addition of a feature that adds weight to the system. Trading for a more reliable system and improved O&S may reduce weight, but requires many more test/fail/fix cycles to evolve, thereby affecting development cost, and schedule. The O&S analyst must work with performance, development, and production focused leads to consider all these factors and their costs when conducting CAIV studies and developing and documenting cost estimates.
The cost documentation should provide a concise presentation of key results and permit a detailed review of the GR&A (for consistency with current program/project documents), cost estimating methods and models, data sources and quality, and the supporting rationale for the O&S cost estimates. Key results should cover not only costs, but operating tempo and other measures of operational effectiveness as well. O&S costs should be time-phased, showing both Real Year and Constant Year dollars by government fiscal year (GFY). Key results also include programmatic and design cost drivers, sensitivity analyses, and cost risk results (the cost S-curve).
It is also useful to identify actual O&S costs for similar systems, noting major differences between the historical system and the one to be estimated because it will add credibility to the estimate and help the decision maker justify their choice(s). Another useful display shows how estimates for the new system have evolved over the life cycle, again providing explanation for significant changes (e.g., changes in flight rates, program/project descopes, improved understanding of the system).
Just like development cost models, O&S cost models require updating to be capable of providing the best estimates. These updates may include cost factors such as fully burden full time equivalent (FTE) costs, wraps, and inflation rates. They may also require structural updating from time-to-time to model current operations concepts.
2.4.2 Operations and Support Cost Estimation Issues/Challenges There are a number of issues and challenges the NASA O&S cost estimator faces when trying to develop an estimate for a new program/project. These include:
�• Historical data for O&S CER development non-existent or sparse �• Operations concept(s) not established or elaborated

Cost Estim
atingC
ost Risk
Economic &
Supporting AnalysisC
areer Developm
ent Guide
Reference
Know
ledge Managem
entC
ost Estimating
Cost R
iskEconom
ic & Supporting Analysis
Career D
evelopment G
uideR
eferenceK
nowledge M
anagement
2008 NASA Cost Estimating Handbook Section 2. Other Cost Estimating Considerations
Volume 3 Page 3-48
�• Cost estimates dependent on activity levels (e.g., flight rates) that are not yet known �• O&S teams not yet formed; hard to identify O&S discipline experts �• Maintenance data (e.g., failure rates and repair times) subject to great uncertainty �• Independent validation of models usually not possible until late in project/program
2.4.3 Understanding the Supply Chain A unique and daunting O&S cost estimation challenge involves estimating the supply chain costs of a future system. Traditionally, program/projects have considered factors such as sustaining engineering, logistics, and communications among others, as areas that are less visible, but which can easily comprise significant O&S costs. As more precise and comprehensive estimates are required of programs/projects, it is no longer sufficient to estimate components of a systems support functions as gross percentages of more direct functions such as hands on activity. Nor is it sufficient any longer to estimate these areas as independent components of a broader system, each devoid of interaction with other support functions. The supply chain design and the factors considered as affecting its nature and cost can be viewed from an operations perspective as equal to and as critical as the design of a flight system or of a facility in which a flight system is worked upon.
One of the main factors contributing to the operations cost of exploration architectures is the cost of shipping required cargo and supplies, especially for long-duration missions. It is important that logistics be taken into account at an early stage in the design process, because the exploration architecture and vehicle design can impact logistics-related operations costs. In order to understand the specific logistics costs associated with various exploration architecture choices, a modeling framework and planning tool for logistics is required.
Because of the recognized need to reduce lifecycle operations costs for future programs, and the mounting complexity of supplying exploration missions, logistics operations must be streamlined. Both the military and commercial enterprises have been highly successful in reducing costs and increasing efficiency through the implementation of supply chain management. Generally these gains have been achieved by simultaneously reducing shipping costs, reducing inventory holding costs while increasing service levels.28
Each of the 12 cost estimating process tasks, when applied to O&S cost estimating, should integrate supply chain considerations throughout for completeness, especially as concept definition increases. Detail at a software/hardware/component level should be matched in time by evolving operations supply chain design, understanding, and cost insight.
28 Erica L. Gralla, Sarah Shull, Olivier de Weck, Gene Lee, and Robert Shishko �“A Modeling Framework for Interplanetary Supply
Chains�”

Cost Estim
atingC
ost Risk
Economic &
Supporting AnalysisC
areer Developm
ent Guide
Reference
Know
ledge Managem
entC
ost Estimating
Cost R
iskEconom
ic & Supporting Analysis
Career D
evelopment G
uideR
eferenceK
nowledge M
anagement
2008 NASA Cost Estimating Handbook Section 2. Other Cost Estimating Considerations
Volume 3 Page 3-49
2.4.4 Additional Resources The NASA Exploration Supply Chain, SCOR, Simulation & Analysis
http://science.ksc.nasa.gov/shuttle/nexgen/Nexgen_Downloads/SCOR_Conv_Forum_Oct_06_Zapata_Galuzzi_r2.ppt
Foundations of Supply Chain Management for Space Application http://science.ksc.nasa.gov/shuttle/nexgen/Nexgen_Downloads/Foundations_of_SCM_for_Space_Application.doc
A Modeling Framework for Interplanetary Supply Chains http://pdf.aiaa.org/preview/CDReadyMSPACE06_1393/PV2006_7229.pdf

Volume 4 –Career Development Guide
2008 NASA Cost Estimating Handbook

Cost Estim
atingC
ost Risk
Economic &
Supporting AnalysisC
areer Developm
ent Guide
Reference
Know
ledge Managem
entC
ost Estimating
Cost R
iskEconom
ic & Supporting Analysis
Career D
evelopment G
uideR
eferenceK
nowledge M
anagement
2008 NASA Cost Estimating Handbook Contents
Volume 4 Page 4-i
Volume 4 NASA Cost Estimator Career Development Guide
Table of Contents
Section 1. Introduction to the NASA Cost Estimator Career Development Guide................ 4-1 1.1 Using This Guide .................................................................................................................. 4-2 1.2 Purpose................................................................................................................................... 4-3
Section 2. Cost Estimator Career Development Philosophy....................................................... 4-4
Section 3. Leadership Development Philosophy.......................................................................... 4-5
Section 4. Minimum Actions to Ensure Effective Career Development .................................. 4-6
Section 5. Career Directions and General Career Paths .............................................................. 4-7 5.1 Career Stages ......................................................................................................................... 4-7
Section 6. General and Technical Competencies .......................................................................... 4-9
Section 7. Attitudes............................................................................................................................. 4-10
Section 8. Training and Development Experiences...................................................................... 4-11
Section 9. Certification and Continuing Professional Education .............................................. 4-14
Section 10. Individual Development Planning............................................................................... 4-17 10.1 Cost Estimator Individual Development Plan.................................................................. 4-17 10.2 The Benefits of Career Planning ......................................................................................... 4-17 10.3 General Steps in Career Planning....................................................................................... 4-18 10.4 Working the Career Planning Process ............................................................................... 4-18
Appendix A: Scope ............................................................................................................................... 4-28
Appendix B: Job Category Definitions............................................................................................. 4-29
Appendix C: General Competencies and Associated Training.................................................... 4-34
Appendix D: Technical Competencies for Cost Estimators.......................................................... 4-44
Appendix E: Core Curriculum............................................................................................................ 4-52
Appendix F: Training Providers ........................................................................................................ 4-54
Appendix G: Training Providers and Other Training Links........................................................ 4-64
Appendix H: Mentoring and Coaching ............................................................................................ 4-65

Cost Estim
atingC
ost Risk
Economic &
Supporting AnalysisC
areer Developm
ent Guide
Reference
Know
ledge Managem
entC
ost Estimating
Cost R
iskEconom
ic & Supporting Analysis
Career D
evelopment G
uideR
eferenceK
nowledge M
anagement
2008 NASA Cost Estimating Handbook Contents
Volume 4 Page 4-ii
Figures
Figure 4-1. General Career Paths .......................................................................................................... 4-7 Figure 4-2. Career Growth Integration ................................................................................................ 4-9 Figure 4-3. NASA Career Planning Steps............................................................................................ 4-18

Cost Estim
atingC
ost Risk
Economic &
Supporting AnalysisC
areer Developm
ent Guide
Reference
Know
ledge Managem
entC
ost Estimating
Cost R
iskEconom
ic & Supporting Analysis
Career D
evelopment G
uideR
eferenceK
nowledge M
anagement
2008 NASA Cost Estimating Handbook Section 1. Introduction to the NASA Cost Estimator Career Development Guide
Volume 4 Page 4-1
Section 1. Introduction to the NASA Cost Estimator Career Development Guide
This NASA Cost Estimator Career Development Guide is based in part on the NASA Chief Financial Office Career Development Guide and has been tailored to fit the needs of NASA Cost Estimators. The Cost Analysis Division of the Office of Program Analysis and Evaluation (PA&E) has the responsibility for maintaining this document. This guide is intended for NASA employees working at Centers or Headquarters whose major duties include cost estimating, whether assigned to a staff office, an institutional office, a project office, or a program office.
Cost Estimating is a methodology that involves the application of quantitative techniques to calculate and forecast development, production, operation and support, and disposal costs (i.e., life-cycle costs) within a scheduled time frame and defined scope. Included in these costs are an assessment and evaluation of risks and uncertainties. Cost estimators are responsible for preparing or obtaining a Work Breakdown Structure (WBS), gathering, normalizing, and verifying cost data, developing cost estimating relationships (CERs), evaluating specific elements of costs, and evaluation of the reasonableness and appropriateness of the cost data. NASA cost estimators follow this methodology for the development of cost estimates for space system hardware, space system software, construction of facilities, and research and development of technology (R&T). The results are used to assist decision makers in determining the optimal use of resources and to make cost-effective decisions throughout the life cycle. If this describes the type of work you do, this Guide may be helpful to assist you in planning your career and planning associated training. Refer to Appendices A and B for a list of job titles and corresponding job series and applicable job category definitions.
This guide is consistent with the NASA Competency Management System (CMS), the web application used to collect, manage and report on the workforce competencies as they relate to people, positions, and projects. CMS is an additional resource to aid cost estimators in career development. In addition, NASA has several offices that support training needs, which personnel should be familiar with. Brief descriptions of these resources are listed below, along with links to web pages:
�• The NASA Office of Human Capital Management is responsible for keeping pace with the changing demands of NASA's work and its workforce. NASA�’s workforce is a primary focus of the Office of Human Resources in maintaining NASA's position as an employer of choice. The NASA Office of Human Capital Management webpage is available at: http://nasapeople.nasa.gov
�• The NASA Agency Training and Development Office extends opportunities to help employees gain the necessary knowledge and skill to fulfill NASA�’s mission through formal education, training, and on the job developmental experiences. The organization is responsible for the Agency�’s overall leadership development training needs serving all NASA Centers, Mission Directorates, and Mission Support organizations. This office works in collaboration with Center training offices, HQs functional offices, and stakeholders in the

Cost Estim
atingC
ost Risk
Economic &
Supporting AnalysisC
areer Developm
ent Guide
Reference
Know
ledge Managem
entC
ost Estimating
Cost R
iskEconom
ic & Supporting Analysis
Career D
evelopment G
uideR
eferenceK
nowledge M
anagement
2008 NASA Cost Estimating Handbook Section 1. Introduction to the NASA Cost Estimator Career Development Guide
Volume 4 Page 4-2
SATERN on-line learning environment to ensure that employees receive opportunities to build their professional development in three main areas: Building Leaders, Building Technical Excellence, and Building Effective Organizations. Effort in these areas is focused on results through fostering a culture of honesty, learning, and knowledge sharing. The NASA Agency Training and Development Office webpage is available at: http://nasapeople.nasa.gov/training
�• System for Administration, Training and Educational Resource for NASA (SATERN) is NASA's Learning Management System that offers Web-based access to training and career development resources. NASA employees must use this SATERN to register for web-based and classroom training, as well as for conferences. A user name and password is required to enter the site. The SATERN web page is available at: https://saterninfo.nasa.gov/
�• NASA Centers�’ training site links: Each NASA Center has a career development and training resource site for employees. These are also good tools for cost estimators to review, as some sites are better than others. The information is available at the following web page: http://nasapeople.nasa.gov/Training/other_sites.html
1.1 Using This Guide To obtain maximum benefit from this guide, follow these steps:
Step 1: Read and review this document Task 1. Read Sections 1-10 of this guide to learn about:
�– Philosophy on NASA cost estimator career development �– General Career Paths available within the NASA cost estimating community �– Tailoring your NASA Cost Estimator Individual Development Plan (IDP)
Task 2. Review the general competencies and associated training and developmental
experiences identified in Appendix C.
Step 2: Examine your career situation Task 1. Refer to Section 7 and Appendix B to select the job category and career stage that
best describes your current position.
Task 2. Refer to Appendix D and thoroughly review the suggested technical competencies for cost estimators presented by career stage, entry level, journey level, senior level, and executive level.
Note: The technical competencies are cumulative. For example, individuals at the journey level are expected to master all pertinent knowledge/skills at the entry and journey levels. Similarly, individuals at the senior level are expected to master all pertinent knowledge/skills at the entry, journey, and senior levels.
Task 3. Identify the knowledge/skills you possess and can demonstrate through achievement of the related learning objectives. Simultaneously, identify the pertinent knowledge/skills required for effective job performance.

Cost Estim
atingC
ost Risk
Economic &
Supporting AnalysisC
areer Developm
ent Guide
Reference
Know
ledge Managem
entC
ost Estimating
Cost R
iskEconom
ic & Supporting Analysis
Career D
evelopment G
uideR
eferenceK
nowledge M
anagement
2008 NASA Cost Estimating Handbook Section 1. Introduction to the NASA Cost Estimator Career Development Guide
Volume 4 Page 4-3
Step 3: Identify the training and other developmental experiences that you need Task 1. See Appendix E for the core curriculum relating to the technical competencies for
cost estimators presented by career stage.
Task 2. Identify relevant training and other developmental experiences required to potentially improve your job performance and to advance your career.
Refer to Appendix D for a comprehensive list of all available training for the technical competencies relating to cost estimators presented by career stage and knowledge/skill.
Refer to Appendix C for available courses relating to general competencies.
Step 4: Prepare Your Individual Development Plan Task 1. With your supervisor, jointly prepare an Individual Development Plan (IDP).
An example of a Cost Estimator IDP is located in Section 10 of this guide.
Task 2. Periodically review the IDP for progress and potential adjustments. Reviews on a semi-annual basis are encouraged.
Step 5: Ongoing Mentorship If you have a mentor(s), discuss your assessment with the mentor(s) and solicit his/her thoughts concerning your progress and potential training and developmental experiences. If you do not have a mentor(s), in consultation with your supervisor, identify individual(s) who possess the requisite knowledge and aptitude to serve as a mentor and seek their support.
1.2 Purpose The purpose of the NASA Cost Estimator Career Development Guide is to outline the process for developing the NASA cost professional from a new hire to an executive capable of leading NASA cost estimation and analysis offices, as well as for developing cost estimators in all other career stages. This guide is intended to provide resources to NASA cost professionals to identify a career path, enhance career development, prepare individuals for advancement to the next level of their career, and align skills and capabilities with organizational needs to ensure that qualified individuals are available to meet mission requirements. The NASA Cost Estimator Career Development Guide provides the members of the NASA cost community with a consolidated reference document that:
�• Suggests a general road map for continuing professional development
�• Provides employees with a comprehensive list of general and technical competencies required to perform the major tasks in their occupation and to plan their careers
�• Offers employees and their supervisors a consolidated reference document to identify and sequence training and other developmental activities when preparing an IDP
�• Assists supervisors in making effective use of training resources by identifying competencies and training courses to aid employees�’ attendance at appropriate courses

Cost Estim
atingC
ost Risk
Economic &
Supporting AnalysisC
areer Developm
ent Guide
Reference
Know
ledge Managem
entC
ost Estimating
Cost R
iskEconom
ic & Supporting Analysis
Career D
evelopment G
uideR
eferenceK
nowledge M
anagement
2008 NASA Cost Estimating Handbook Section 2. Cost Estimator Career Development Philosophy
Volume 4 Page 4-4
Section 2. Cost Estimator Career Development Philosophy
Career development is a process where employees strategically explore, plan, and create their future at work by designing a personal learning plan to achieve their potential and fulfill the organization�’s need for a vital and effective workforce. Career development involves continual learning, seeking new opportunities, taking risks, and finding ways to contribute to the organization in a productive and motivated fashion. Its purpose is to enhance current performance and enable individuals to take advantage of future opportunities.
Professional development is a shared responsibility of the employee and supervisor. In order to design a successful career, each employee needs to take responsibility to create a career development plan and initiate actions that will lead him/her to a career goal. To optimize current and future employee contributions, supervisors and managers must be actively involved with their employees in developing their career plans. This involvement includes periodic assessments of each employee�’s knowledge, skills, abilities, and experience. This assessment may lead to the generation of an IDP, identifying work assignments, training, and other developmental experiences that promote reaching NASA and employee goals.
Professional development for an individual should contribute to improved performance. Career development, however, does not directly correlate to a promotion or an increase in pay -- there are no guarantees. A career path is a personal decision and career choices are what you make of them. The more this guide, career resources, mentors and your leadership guidance are leveraged, the more the estimator will gain from the process to enhance their career. Members of the NASA cost estimating community are encouraged not only to maintain a current set of skills, but to continually seek out opportunities to stay abreast of the industry, learn new or enhance their skills set, and to consider their continued professional education, as well as obtaining certification by one or more of the relevant organizations listed in Section Nine.
In establishing a cost estimator career development template, personnel in similar disciplines will share tools and approaches and should become "universally assignable" across the Agency. Common tools and approaches will improve efficiency, decrease turnaround times, reduce down time, improve customer service, and cut costs.

Cost Estim
atingC
ost Risk
Economic &
Supporting AnalysisC
areer Developm
ent Guide
Reference
Know
ledge Managem
entC
ost Estimating
Cost R
iskEconom
ic & Supporting Analysis
Career D
evelopment G
uideR
eferenceK
nowledge M
anagement
2008 NASA Cost Estimating Handbook Section 3. Leadership Development Philosophy
Volume 4 Page 4-5
Section 3. Leadership Development Philosophy
The challenges facing the NASA cost estimating community require a cadre of skilled and motivated leaders dedicated to creating and sustaining a new culture to enable safe, successful, and affordable mission accomplishment. Successful leaders have a compelling vision and clear intention for the future that draws others to join them and to co-create that future. Research clearly demonstrates the imperative that leaders generate trust, requiring relationship building and a constancy of behavior. Another critical leadership competency is management of self by knowing one�’s skills, leveraging one�’s strengths, and deploying them effectively. A successful cost estimator leader should combine technical expertise with skill in relating to others, leading change, and leading others.
An effective leader values continuous learning and mastering achievement. Enhanced learning occurs in the context of a learning community where all members support each other�’s career and leadership development goals.
Employees in the NASA cost estimating community are strongly encouraged to take advantage of Center and Agency-sponsored leadership development programs and to continually enhance their leadership skills through other appropriate means, including developmental assignments. Additional information regarding Agency-level policy and programs for leadership development is accessible at the NASA Leadership and Management Development Home Page and in Appendix C.

Cost Estim
atingC
ost Risk
Economic &
Supporting AnalysisC
areer Developm
ent Guide
Reference
Know
ledge Managem
entC
ost Estimating
Cost R
iskEconom
ic & Supporting Analysis
Career D
evelopment G
uideR
eferenceK
nowledge M
anagement
2008 NASA Cost Estimating Handbook Section 4. Minimum Actions to Ensure Effective Career Development
Volume 4 Page 4-6
Section 4. Minimum Actions to Ensure Effective Career Development
Career development, whether focused on leadership development or development of functional expertise, is a shared responsibility among employees, managers, and the organization. The following list identifies recommended minimum actions each NASA component should take to ensure effective career development:
Employees: �• Determine professional goals for today, as well as five and ten years in the future
�• Assess their aptitudes, strengths, and development needs with their mentor(s) and supervisor
�• Seek mentor and supervisor input and prepare an IDP, if necessary, that supports both their current job requirements and their long-term professional goals
�• Work with their supervisor to schedule appropriate on-the-job training, complementary formal training, and other developmental activities as required
(See Section 10 for guidance on the Cost Estimator IDP and instructions on how to prepare an IDP. Appendices C and E identify specific training and developmental experiences for the general and technical competencies, respectively)
Managers: �• Support the development and training of their subordinates, providing opportunities to
discuss career goals and plans with every employee
�• Determine the job-related knowledge, skills, abilities and experience employees need to effectively accomplish the work of the organization and achieve career development goals
�• Mentor and coach employees in their professional development planning (See Appendix H)
�• Help the employee define the short-term and long-term development and training needs
Organizations: �• Ensure an organizational structure exists that supports the required knowledge, skill, ability,
and experience development of its employees
�• Provide resources �– dollars and time �– for development to occur
�• Provide a clear road map for career development activities
�• Utilize the talents, abilities and resources of each employee in support of organizational goals
�• Develop a proactive and realistic approach to meet future staffing needs

Cost Estim
atingC
ost Risk
Economic &
Supporting AnalysisC
areer Developm
ent Guide
Reference
Know
ledge Managem
entC
ost Estimating
Cost R
iskEconom
ic & Supporting Analysis
Career D
evelopment G
uideR
eferenceK
nowledge M
anagement
2008 NASA Cost Estimating Handbook Section 5. Career Directions and General Career Paths
Volume 4 Page 4-7
Section 5. Career Directions and General Career Paths
The combination of individual career preferences and organizational opportunities shape the direction of an employee�’s career. The proficiency of an individual is a reflection of three aspects of career development: on-the-job training, formal training courses, and developmental experiences/activities. Career paths identify job progression opportunities and provide employees with assistance in pursuing their career goals. This section of the guide explains the primary career path within the NASA cost estimating community (see Figure 4-1). Studying this path will lead to a better understanding of available career options and will result in more effective career planning.
Administrative
Engineering
Mathematics & Statistics
Technical Disciplines: Cost Estimator/
Analyst/Engineer
GS-343: Management/Program Analyst
GS-801: General EngineerGS-861: Aerospace Engineer
GS-1515: Operations Research Analyst
Center
• Director, Cost Estimating/Economic Analysis Office
• CFO• Deputy CFO• Director, Systems Management Office• Other SES, e.g. Project Manager
Agency
• Director, Cost Analysis Division• Director, Independent Program
Assessment Office• Deputy Director, Independent Program
Assessment Office• Associate Administrator, Program
Analysis & Evaluation• Deputy Associate Administrator,
Program Analysis & Evaluation• Other SES, e.g. Associate Administrator
Journey Senior Executive
Manager/Supervisor (Section, Branch,
Division, Project/Program)Resident Expert
Entry
Figure 4-1. General Career Paths
5.1 Career Stages The NASA cost estimator career development model consists of four career stages, reflecting increased responsibilities and performance expectations as employees move through each stage in their career. The NASA cost estimator career development model defines the technical competencies using these stages, as follows.
Entry: �• Performs fundamental, basic, and routine cost estimation and analysis activities while
gaining knowledge and experience
�• Applies knowledge and training under direct supervision and direction

Cost Estim
atingC
ost Risk
Economic &
Supporting AnalysisC
areer Developm
ent Guide
Reference
Know
ledge Managem
entC
ost Estimating
Cost R
iskEconom
ic & Supporting Analysis
Career D
evelopment G
uideR
eferenceK
nowledge M
anagement
2008 NASA Cost Estimating Handbook Section 5. Career Directions and General Career Paths
Volume 4 Page 4-8
Journey: �• Functions independently or as part of a team, applying cost estimating and analysis
knowledge and experience to variety of complex problems
�• Identifies gaps in knowledge ands seeks training, performs research etc., to fill those gaps
Senior: �• A recognized cost estimator expert with broad scope of responsibility and high visibility
�• Senior expert in the field of cost estimation and analysis who operates as a team leader or supervisor with broad scope and responsibility; or individually as the cost consultant for a major Agency component, such as a mission directorate, program, project or functional organization
�• Can identify and recruit other cost experts to fill gaps in knowledge and experience
Executive: �• A leader in the NASA cost community responsible for strategic management of the cost
estimation and analysis function
�• Defines and implements Agency-level policy and guidance on cost estimating and analysis

Cost Estim
atingC
ost Risk
Economic &
Supporting AnalysisC
areer Developm
ent Guide
Reference
Know
ledge Managem
entC
ost Estimating
Cost R
iskEconom
ic & Supporting Analysis
Career D
evelopment G
uideR
eferenceK
nowledge M
anagement
2008 NASA Cost Estimating Handbook Section 6. General and Technical Competencies
Volume 4 Page 4-9
Section 6. General and Technical Competencies
This guide defines the types of competencies that are required for NASA employees in the NASA cost estimating community. The guide differentiates between general and technical competencies and the general competencies are aligned with the competencies in the NASA Leadership Model.
Figure 4-2 illustrates that effective performance and career growth within the NASA cost estimating community involves the successful integration of career experience with general competencies, technical competencies and demonstration of key attitudes.
Attitudes
Example of these professional characteristics are Perseverance, Energy
EffectivePerformance
& Career Growth
CareerExperience
Example of past accomplishments
include Previous Jobs, Rotational Assignments
GeneralCompetencies
Examples of these cross-functional competencies
are Leadership, Critical Thinking
TechnicalCompetencies
Examples of these functional competencies are General Budgeting Concepts and
Principles, Program/Project Management and Control
Figure 4-2. Career Growth Integration
Both general and technical competencies consist of multiple knowledge/skills that are required to achieve success in job performance. Knowledge/skills are measured by the achievement of learning objectives that reflect the expected performance level required to be competent. To appreciate all relevant competencies needed to perform one�’s job effectively, an employee must address both general and technical competencies for his/her job category.
A matrix that identifies general competency training can be found in Appendix C. The technical competencies, arrayed for cost estimators by career stage, are defined in Appendix D. Attitudes are discussed in Section 7.0 of this guide.

Cost Estim
atingC
ost Risk
Economic &
Supporting AnalysisC
areer Developm
ent Guide
Reference
Know
ledge Managem
entC
ost Estimating
Cost R
iskEconom
ic & Supporting Analysis
Career D
evelopment G
uideR
eferenceK
nowledge M
anagement
2008 NASA Cost Estimating Handbook Section 7. Attitudes
Volume 4 Page 4-10
Section 7. Attitudes
Attitudes are pre-dispositions to behaving in a certain way. Sometimes they are manifestations of innate talents. In other instances, they are learned through life experiences. Normally, training does not affect attitudes in any substantial way. Nevertheless, attitudes can change through perseverance and practice. One of the most successful management books, 7 Habits of Highly Effective People (by Stephen Covey), emphasizes that attitudes can be developed.
Attitudes, although observable, are very difficult to measure. Despite this fact, highly successful managers in the cost estimating community agree that the following attitudes are required to excel in the NASA cost estimating community:
�• Portability �– flexibility, adaptability and willingness to accept rotational assignments �• Energy �– demonstrates positive presence �• Willingness to learn �– seeks new opportunities and challenges �• Independence �– individual contribution is valued regardless or working alone or on a team �• Perseverance �– patience and application of new ideas to accomplish difficult tasks;
willingness to ask hard questions
Cost Estim
atingC
ost Risk
Economic &
Supporting AnalysisC
areer Developm
ent Guide
Reference
Know
ledge Managem
entC
ost Estimating
Cost R
iskEconom
ic & Supporting Analysis
Career D
evelopment G
uideR
eferenceK
nowledge M
anagement
2008 NASA Cost Estimating Handbook Section 8. Training and Development Experiences
Volume 4 Page 4-11
Section 8. Training and Development Experiences
To support the full utilization of the NASA workforce in achieving NASA�’s strategic outcomes, it is Agency policy to make training and developmental opportunities widely available to employees to:
�• Improve organizational performance �• Maintain scientific, professional, technical, and management proficiency �• Build and retain a skilled and effective workforce �• Enhance individual capabilities.
More specifically, NASA policy is to:
�• Use on-the-job-training through selected work experiences as the primary method of developing the job-related knowledge, skills, and abilities of employees
�• Support systematic plans to broaden employees' knowledge and skills through planned, work-related developmental assignments including "on-the-job" training, rotational assignments, and non-NASA work experiences
�• Use formal training and educational experiences to complement work experiences
�• Provide new supervisors with at least 40 hours of supervisory and management training within six months of their assignment, 80 hours within the first two years, advanced training for all supervisors and managers as needed, and continual development and training for senior executives
�• Support employee training, retraining, and organizational development activities leading to better ways of delivering services, improving work performance, and increasing the value of employee contributions to current and future Agency missions
Appendix C suggests the type of training and developmental experiences to demonstrate the general competencies. Appendix E identifies course areas that are considered "core." Employees, in coordination with their mentor and supervisor, should select those classes relevant to their unique developmental needs.
Developmental Activities
Developmental activities are structured work/training experiences, agreed to between employee and supervisor, with well-defined objectives intended to enhance job knowledge and skills. Some people refer to developmental activities as a combination of structured "on-the-job" activities and formal classroom training. Some developmental experiences are designed to broaden an employee�’s knowledge and understanding of the Agency through a combination of expanded work experiences and formal training. Others may be particularly related to specific job requirements, when skill enhancement is required to properly perform a task.
Developmental work assignments, with appropriate levels of responsibility, can be beneficial to developing the competencies required of all NASA employees in the cost estimating community. Developmental assignments can involve short work assignments outside one's own organization, but inside the Center. When broad and insightful knowledge of Agency management and
Cost Estim
atingC
ost Risk
Economic &
Supporting AnalysisC
areer Developm
ent Guide
Reference
Know
ledge Managem
entC
ost Estimating
Cost R
iskEconom
ic & Supporting Analysis
Career D
evelopment G
uideR
eferenceK
nowledge M
anagement
2008 NASA Cost Estimating Handbook Section 8. Training and Development Experiences
Volume 4 Page 4-12
program operations is required, developmental work assignments outside of the home Center are an effective means of acquiring this experience.
Refer to Appendix C for additional information on Agency and inter-Agency developmental opportunities.
Rotational Assignments
Rotational assignments are a type of developmental experience. Rotational assignments benefit both the organization and the individual. As the federal workforce continues to experience streamlining pressures, generalists with greater breadth and depth of knowledge and skills are increasingly in demand because of their flexibility and adaptability to new challenges. These employees experience more intrinsic and extrinsic benefits in terms of job challenge, satisfaction and visibility; greater recognition and awards; enhanced promotional opportunities; and increased marketability.
There are many types of rotational assignments. Some examples are:
�• Cross-disciplinary, i.e., between cost estimating and engineering, cost estimating and resources management, between cost estimating and acquisition, etc.
�• Across cost estimating support functions, i.e., between institutional or staff support and direct project support
�• Assignment of tasks outside of normal responsibilities and within the current work unit
Rotational assignments can occur within a Center, between NASA Centers, on an interagency basis, between the public and private sectors, as well as between segments of the public sector (federal, state, and local). In the IDP process, consideration should be given to identifying rotational assignments that involve realistic and attainable goals that will benefit both the individual and the organization.
Refer to Appendix C for detailed information on the types of rotational and other developmental assignments presently available to the NASA cost estimating workforce.
Formal Training Activities
Formal training activities supplement the development of general and technical competencies. Each formal training activity usually consists of a well-defined lesson plan, specific training objectives, and a clear definition of learning objectives. The delivery of training may take one of several formats, and may be delivered by training providers or NASA subject matter experts:
�• Classroom-based training �• Telephone-based training �• Computer-based training �• Intact work team training �• "Train-the-Trainer" �• Self-study, e.g., correspondence �• Video/satellite-based training �• Web-based �• Video and audio tapes
Cost Estim
atingC
ost Risk
Economic &
Supporting AnalysisC
areer Developm
ent Guide
Reference
Know
ledge Managem
entC
ost Estimating
Cost R
iskEconom
ic & Supporting Analysis
Career D
evelopment G
uideR
eferenceK
nowledge M
anagement
2008 NASA Cost Estimating Handbook Section 8. Training and Development Experiences
Volume 4 Page 4-13
System for Administration, Training and Educational Resource for NASA (SATERN) is NASA's Learning Management System that offers Web-based access to training and career development resources. NASA employees must use this SATERN to register for web-based and classroom training, as well as for conferences. A user name and password is required to enter the site. The SATERN web page is available at: https://saterninfo.nasa.gov/.
The Academy of Program/Project Engineering Leadership (APPEL) offers classroom-based training at NASA Headquarters and at the NASA Centers focusing on many aspects of project management. Many of its courses apply to members of the NASA cost estimating community. Information on APPEL courses is available at: http://appel.nasa.gov/node/17.
Additional information on NASA-wide training opportunities is available at http://nasapeople.nasa.gov/training/.
A list of the training providers that have been identified in this Guide and their web sites can be found in Appendix G.

Cost Estim
atingC
ost Risk
Economic &
Supporting AnalysisC
areer Developm
ent Guide
Reference
Know
ledge Managem
entC
ost Estimating
Cost R
iskEconom
ic & Supporting Analysis
Career D
evelopment G
uideR
eferenceK
nowledge M
anagement
2008 NASA Cost Estimating Handbook Section 9. Certification and Continuing Professional Education
Volume 4 Page 4-14
Section 9. Certification and Continuing Professional Education
Achievement of professional certification, as well as continuing professional education, enhances the cost estimating workforce of the Agency. Continuing professional education improves job performance and can lead to certification. An employee's commitment to education reflects the pride placed in one's chosen profession. Professional certification and continuing professional education allow employees to create networks for personal benefit and organizational gain. For example, employees enhance their general and technical competencies while adopting a bigger picture perspective. In turn, the organization can benefit by adopting best practices successfully implemented by other organizations.
Certification is a process that formally recognizes professional workers for achieving expertise and excellence in their field and is a means to encourage employees to continue their education and hone their professional skills. Cost Estimating related certification programs are primarily sponsored by professional associations. Certification requirements typically consist of specific types of formal education and experience, character references, and passing of an examination. To maintain certification, there may also be a continuing education requirement. Since certification provides recognition for achievement of professional excellence, NASA encourages its cost estimators to seek certification appropriate to their occupation.
There are several professional associations offering certification to cost analysts. Members of the NASA cost estimating community are encouraged to participate in one or more of these societies, as time allows.
The Society of Cost Estimating and Analysis (SCEA) http://www.sceaonline.org
SCEA is a nonprofit organization chartered by the State of Virginia and operated by the National Officers acting under the policies of the National Board of Directors and the counsel of the Board of Regents. The Society�’s Certified Cost Estimator/Analyst (CCE/A) program provides a professional credential to SCEA members and nonmembers who demonstrate mastery of basic concepts and methods. The individuals achieving certification:
1. Pass a written exam testing their knowledge and skills
2. Qualify to take the exam by demonstrating nominal levels of training and work experience. SCEA regularly offers the exam three times a year, in April, June, and November, at sites across the country and internationally
Additional information is available on the SCEA website or you can contact the SCEA National office at [email protected] or at 703-938-5090 if you have any questions about these or other matters.
Cost Estim
atingC
ost Risk
Economic &
Supporting AnalysisC
areer Developm
ent Guide
Reference
Know
ledge Managem
entC
ost Estimating
Cost R
iskEconom
ic & Supporting Analysis
Career D
evelopment G
uideR
eferenceK
nowledge M
anagement
2008 NASA Cost Estimating Handbook Section 9. Certification and Continuing Professional Education
Volume 4 Page 4-15
International Society of Parametric Analysts (ISPA) http://www.ispa-cost.org
ISPA is a professional society dedicated to the improvement and promotion of parametric cost modeling techniques and methodologies, risk analysis, econometrics, design-to-cost, technology forecasting, and cost management. ISPA provides a forum that encourages the professional development of its members through the interchange of ideas and perspectives. ISPA members represent government agencies, universities, and nearly 200 organizations in 12 countries. ISPA's membership ranges in experience from beginners to seasoned professionals. They are united by their interest in the practical application of parametric analysis. ISPA sponsors certification for the Certified Parametric Practitioner (CPP). Additional information is available on the ISPA website.
Space Systems Cost Analysis Group (SSCAG) http://sscag.saic.com
SSCAG is a non-profit, international association of aerospace organizations representing industry and government. SSCAG was established in 1977 by the U.S. Air Force Space & Missile Center (SMC). It is co-sponsored by the Air Force and the National Aeronautics and Space Administration (NASA). SSCAG is a working group of space systems organizations whose representatives (1) promote cost analysis research, (2) provide a cooperative forum for government and industry discussions (3) jointly work resolution of common problems, and (4) share ideas, data, and experiences to enhance the cost analysis profession, and (5) produce valuable cost analysis products. Additional information is available on the SSCAG website.
American Institute of Aeronautics and Astronautics (AIAA) http://www.aiaa.org
AIAA is the professional society for the field of aerospace engineering. The AIAA was founded in 1963 from the merger of four earlier societies: the American Rocket Society (ARS), founded in 1930 as the American Interplanetary Society (AIS), and the Institute of Aerospace Sciences (IAS), founded in 1932 as the Institute of Aeronautical Sciences. The AIAA is the U.S. representative on the International Astronautical Federation and the International Council on the Aeronautical Sciences. Additional information is available on the AIAA website.
Association for the Advancement of Cost Engineering (AACE) http://www.aacei.org
AACE is an international professional society that has been on the leading-edge professional society for cost estimators, cost engineers, schedulers, project managers, and project control specialists since 1956. With more than 5,500 members worldwide, AACE International is the largest organization serving the entire spectrum of cost management professionals. AACE International is industry independent, and has members in 78 countries and 71 local sections. AACE sponsors several different certification programs, such as Cost Consultant Certification, Certified Cost Engineer, Planning & Scheduling Professional Certification, and Earned Value Professional Certification. Additional information is available on the AACE website.
Cost Estim
atingC
ost Risk
Economic &
Supporting AnalysisC
areer Developm
ent Guide
Reference
Know
ledge Managem
entC
ost Estimating
Cost R
iskEconom
ic & Supporting Analysis
Career D
evelopment G
uideR
eferenceK
nowledge M
anagement
2008 NASA Cost Estimating Handbook Section 9. Certification and Continuing Professional Education
Volume 4 Page 4-16
American Society of Professional Estimators (ASPE) – Construction Estimating http://www.aspenational.org/
ASPE is a professional society that serves construction estimators by providing education, fellowship, and opportunity for professional development. ASPE encourages a wide range of educational activities that provide learning experiences for estimators at all experience levels. As professionals, ASPE members are constantly seeking to improve their knowledge of estimating and the construction industry. Chapter meetings throughout the country are held and include educational talks and mini-seminars on estimating and other construction related topics. ASPE sponsors a Certified Professional Estimator (CPE) certification program for qualified applicants. Additional information is available on the ASPE website.

Cost Estim
atingC
ost Risk
Economic &
Supporting AnalysisC
areer Developm
ent Guide
Reference
Know
ledge Managem
entC
ost Estimating
Cost R
iskEconom
ic & Supporting Analysis
Career D
evelopment G
uideR
eferenceK
nowledge M
anagement
2008 NASA Cost Estimating Handbook Section 10. Individual Development Planning
Volume 4 Page 4-17
Section 10. Individual Development Planning
10.1 Cost Estimator Individual Development Plan The IDP employs a concept that emphasizes discussion and joint decisions by the employee and the supervisor, with input from mentor(s), on the specific developmental experiences necessary to fulfill the mutual goals of individual career development and organizational enhancement. Each IDP is uniquely tailored to the needs of the individual and the organization. One might identify extensive skill training; another might emphasize a more academic approach. There is no set pattern -- the term "individual" is basic to the concept -- especially as it applies to the employee's willingness and capacity to learn and grow. The IDP is a personal action plan, jointly agreed to by you and your supervisor that identifies your short and long-term career goals. An IDP also identifies the training and other developmental experiences needed to achieve those goals, for the benefit of the individual and organization, within a specified timeframe.
10.2 The Benefits of Career Planning Why should you be concerned about planning your career? It�’s your career. If you don't take responsibility for the success of your career, then who will? Besides, considering all the time and energy you spend at work, why not ensure you get maximum satisfaction from your work and career? Additionally, NASA benefits from having a competent and motivated workforce, capable of "re-tooling" itself to meet the demands placed on it by constant organizational and technological changes.
The workplace has been affected by a number of significant changes or trends, which have definite ramifications for your career planning:
�• Less job security: Gone is the era of high job security, with the same employer for life, where good employees automatically move up well-defined career ladders. Even in the federal sector, in response to increased pressures to reduce costs, solutions like restructuring, down-sizing and automation will continue to eliminate some jobs and drastically alter others. Workers will, of necessity, need to be more mobile in finding the right job--and employer.
�• Up is not the only way: With the thinning of management positions and flattening of organizational structures, the traditional linear career patterns will be less available. Employees will need to be more flexible, adaptable, and creative in identifying their next job, and may need to consider lateral moves or rotational assignments to broaden their experience or leverage their skills.
�• Technical knowledge and skills obsolescence: Rapid advancements in technology and state-of-the-art knowledge requires employees to upgrade their skills and "re-tool" themselves just to remain current with their job requirements. For example, in high-tech organizations, some skills have a half-life of 18 months. Also, missions and projects end and new ones start up, often requiring new or different technical skills or expertise from the workforce.
It is definitely to your advantage to position yourself for long-term employability in the rapidly changing world of work. Begin preparing now for the future.

Cost Estim
atingC
ost Risk
Economic &
Supporting AnalysisC
areer Developm
ent Guide
Reference
Know
ledge Managem
entC
ost Estimating
Cost R
iskEconom
ic & Supporting Analysis
Career D
evelopment G
uideR
eferenceK
nowledge M
anagement
2008 NASA Cost Estimating Handbook Section 10. Individual Development Planning
Volume 4 Page 4-18
10.3 General Steps in Career Planning Figure 4-3 illustrates the general steps involved in any career planning process. More detailed steps are identified in the next section, "Working the Career Planning Process."
Individual Development
Plan (IDP)
Goal Development
What do I want to accomplish?
Knowledge of Work Environment
What is going on around me at work (now and in the future)?
Integration of Knowledge of Self and Work Environment
How well do NASA and I match up?
Method for Taking Action
What actions will I take?
Knowledge of Self
Who am I?
1
3
4
5
2
Figure 4-3. NASA Career Planning Steps
10.4 Working the Career Planning Process Now that you are a little more clear about the benefits of career planning, it is time to begin working on the process. As with any major decision, you will need a certain amount of data upon which to make your career decisions. The following worksheets are designed to help you generate relevant data for each step in the process. Note that it pays to be as thorough as possible, so you may need to spend a significant amount of time at one or more steps.
�• Complete the "Current Career Issues" worksheet in this section
�• Assess the "big picture" and achieve a solid understanding of the current and future work environments. Complete the second worksheet in this section titled "Knowledge of Work Environment" to reflect this understanding
�• Read the appropriate sections of this Guide as follows:
o Thoroughly review the technical competencies in Appendix D for your job category to identify those knowledge/skills for which you are competent. You can consider yourself competent in a knowledge/skill if you have, or can, demonstrate achievement of all of the learning objectives associated with that skill.
o Since the technical competencies are cumulative, it is important to review the knowledge/skills associated with the technical competencies for your current and previous career stages.
Cost Estim
atingC
ost Risk
Economic &
Supporting AnalysisC
areer Developm
ent Guide
Reference
Know
ledge Managem
entC
ost Estimating
Cost R
iskEconom
ic & Supporting Analysis
Career D
evelopment G
uideR
eferenceK
nowledge M
anagement
2008 NASA Cost Estimating Handbook Section 10. Individual Development Planning
Volume 4 Page 4-19
o If you aspire to the next career stage in your job category, then review the technical competencies for that stage to identify the knowledge/skills you do and do not possess. Using the previous example, if you are at the senior level and if you aspire to an executive level position, it would also be appropriate to read Appendix D.
o Identify all knowledge/skills you have not achieved. Referring to Appendix E, identify the training associated with the knowledge/skills you wish to achieve. Referring to Appendix E, identify other developmental experiences that would aid your achievement of these technical competencies.
o Similarly review Appendix C and identify the general competencies you do not possess or wish to strengthen. Again, discussions with your mentor(s) may prove useful.
�• Complete the "Knowledge of Self Assessment", "Integration of Knowledge of Self and Work Environment", "Goal Development", and "Method for Taking Action" worksheets found in this section.
�• Prepare a draft IDP that states your goals, includes knowledge/skills you wish to acquire or improve, your proposed actions, and your projected completion dates for each action. Identify the training and/or other developmental assignments by which you propose to acquire/improve these knowledge/skills. A suggested IDP format is included in this section. Discussions with your mentor(s) at this stage are encouraged.
�• Meet with your supervisor and review your proposed IDP. After considering supervisory input, finalize and sign the IDP. Obtain your supervisor's signature.
�• Follow the plan in your IDP and periodically review the document, especially at your mid-term performance review, and make any appropriate adjustments.

Cost Estim
atingC
ost Risk
Economic &
Supporting AnalysisC
areer Developm
ent Guide
Reference
Know
ledge Managem
entC
ost Estimating
Cost R
iskEconom
ic & Supporting Analysis
Career D
evelopment G
uideR
eferenceK
nowledge M
anagement
2008 NASA Cost Estimating Handbook Section 10. Individual Development Planning
Volume 4 Page 4-20
CURRENT CAREER ISSUES WORKSHEET What are your career issues?
How much time and effort you need to spend at any one step in the career planning process depends on your career issues. It is important to be clear about these career issues, so that you can develop an effective strategy for dealing with them. Career issues cover a broad spectrum, ranging from getting up to speed in a new job, to making a major career field change, or planning your retirement.
The following is a list of statements that reflect the full range of career issues people face at one time or another. Which ones are relevant for you now? Place an "X" in front of the statements that are true for you at this time.
You are new in your job and must learn the basics to get up to speed and feel comfortable and productive.
You have been in your job for a while and are striving for increased competence, in general.
You need to improve your performance in certain areas of your current job.
You need to update your skills or expertise to keep up with the changing technologies or state-of-the-art knowledge in your line of work.
Your job duties have changed recently (or will change), requiring some new skills or expertise on your part.
Your job may be eliminated due to reengineering or restructuring, and you want to begin "re-tooling" to be ready for future opportunities.
You want to prepare for a promotion or move to the next higher level of responsibility.
You want to broaden your skills or expertise to allow yourself more flexibility for future job moves.
You want to change jobs within your current job category, and...
Stay at your Center Stay within NASA Stay in the Federal Government Leave the Federal Government
You want to change job categories, and
Stay at your Center Stay within NASA Stay in the Federal Government Leave the Federal Government
You don't see much of a future if you remain in your current job, but aren't sure of your options.
You want to plan your retirement.
Other (fill in the blank):

Cost Estim
atingC
ost Risk
Economic &
Supporting AnalysisC
areer Developm
ent Guide
Reference
Know
ledge Managem
entC
ost Estimating
Cost R
iskEconom
ic & Supporting Analysis
Career D
evelopment G
uideR
eferenceK
nowledge M
anagement
2008 NASA Cost Estimating Handbook Section 10. Individual Development Planning
Volume 4 Page 4-21
KNOWLEDGE OF WORK ENVIRONMENT WORKSHEET Answer the following questions to identify what is currently going on around me, at my Center, and at NASA, and what changes I expect to occur in the near future: �• How is the mission of my organization (e.g., branch, office, division or lab) changing?
�• What other changes are occurring regarding our customers, services/products, work processes, organizational structure, reporting relationships and personnel?
�• Is this a change of which I want to be a part or is it time for me to consider a move?
�• What are the organization's changing needs regarding the workforce and what new expertise and skills will be required or desirable?
�• What opportunities are available for developing this new expertise and skills (work experiences, training, rotational assignments, professional conferences, mentoring, etc.)?
�• How might my role (job) change in my organization? How can I prepare for or develop new skills for these changes?
�• New expertise and skills my organization wants me to learn include...
�• What new missions or projects at my Center or within NASA appeal to me?
�• What are the organization's future needs?
�• What kinds of development activities would help position me for participation in another work project?

Cost Estim
atingC
ost Risk
Economic &
Supporting AnalysisC
areer Developm
ent Guide
Reference
Know
ledge Managem
entC
ost Estimating
Cost R
iskEconom
ic & Supporting Analysis
Career D
evelopment G
uideR
eferenceK
nowledge M
anagement
2008 NASA Cost Estimating Handbook Section 10. Individual Development Planning
Volume 4 Page 4-22
KNOWLEDGE OF SELF WORKSHEET To gain a better understanding of your self, answer the following questions: �• Of the new and recent developments in my organization or field, what interests me the most?
�• What are my current strengths for pursuing these interests?
�• What do I need to do to reposition my career so that I can get involved in these new developments?
�• Is it time for me to consider working outside of my Center or NASA?
�• If I am considering a complete career change, what experiences and learning would help reposition my career in the direction of my new interests?
�• Of all the things I have done in the last 5 years (work and non-work related), what specific activities and functions have energized me the most?
�• What developmental activities work experiences, learning, skill building--would help me grow in or increase these energizing functions?
�• Other things I would like to learn are...
�• What non-work related issues do I need to consider that will likely impact my career plans (e.g., health, family, financial, and social)?

Cost Estim
atingC
ost Risk
Economic &
Supporting AnalysisC
areer Developm
ent Guide
Reference
Know
ledge Managem
entC
ost Estimating
Cost R
iskEconom
ic & Supporting Analysis
Career D
evelopment G
uideR
eferenceK
nowledge M
anagement
2008 NASA Cost Estimating Handbook Section 10. Individual Development Planning
Volume 4 Page 4-23
INTEGRATION OF KNOWLEDGE OF SELF AND WORK ENVIRONMENT WORKSHEET
To address the match between you and your career goals and organizational needs, answer the following questions:
�• In what areas do my interests and personal plans overlap with the changing needs of my organization? [Any areas of overlap represent "first choice" development targets.]
�• What knowledge, skills or abilities are important for increasing or maintaining the quality of my performance in my present assignments? (See Appendix C and Appendix D)
�• What knowledge, skills or abilities would help prepare me for opportunities or roles I might have in the future? (See Appendix C and Appendix D)
�• Compared to the development needs suggested by these factors, other interests for development that are important to me include...

Cost Estim
atingC
ost Risk
Economic &
Supporting AnalysisC
areer Developm
ent Guide
Reference
Know
ledge Managem
entC
ost Estimating
Cost R
iskEconom
ic & Supporting Analysis
Career D
evelopment G
uideR
eferenceK
nowledge M
anagement
2008 NASA Cost Estimating Handbook Section 10. Individual Development Planning
Volume 4 Page 4-24
GOAL DEVELOPMENT WORKSHEET A goal is a statement of a desired outcome or accomplishment that is specific, observable and realistic. Based on the data you have generated about yourself on the previous worksheets and your specific career issues, write some career goals for the next 1, 2 and 3 years and answer the following questions:
�• What I want to accomplish and the knowledge/skills I want to acquire or improve by this time next year are�…
�• What I want to accomplish and the knowledge/skills I want to acquire or improve by the end of the second year are...
�• What I want to accomplish and the knowledge/skills I want to acquire or accomplish by the end of the third year are...
�• What barriers or obstacles might prevent me from accomplishing my goals on time (e.g., time, money, and other commitments)?
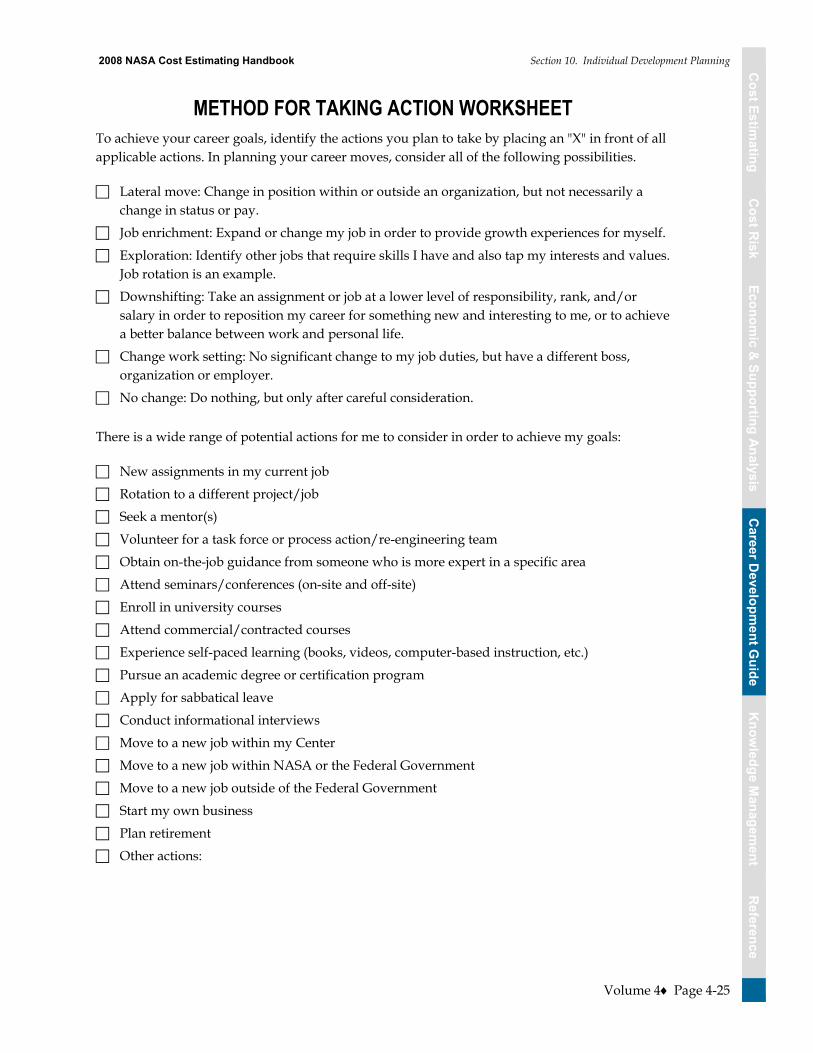
Cost Estim
atingC
ost Risk
Economic &
Supporting AnalysisC
areer Developm
ent Guide
Reference
Know
ledge Managem
entC
ost Estimating
Cost R
iskEconom
ic & Supporting Analysis
Career D
evelopment G
uideR
eferenceK
nowledge M
anagement
2008 NASA Cost Estimating Handbook Section 10. Individual Development Planning
Volume 4 Page 4-25
METHOD FOR TAKING ACTION WORKSHEET To achieve your career goals, identify the actions you plan to take by placing an "X" in front of all applicable actions. In planning your career moves, consider all of the following possibilities.
Lateral move: Change in position within or outside an organization, but not necessarily a change in status or pay.
Job enrichment: Expand or change my job in order to provide growth experiences for myself.
Exploration: Identify other jobs that require skills I have and also tap my interests and values. Job rotation is an example.
Downshifting: Take an assignment or job at a lower level of responsibility, rank, and/or salary in order to reposition my career for something new and interesting to me, or to achieve a better balance between work and personal life.
Change work setting: No significant change to my job duties, but have a different boss, organization or employer.
No change: Do nothing, but only after careful consideration. There is a wide range of potential actions for me to consider in order to achieve my goals:
New assignments in my current job
Rotation to a different project/job
Seek a mentor(s)
Volunteer for a task force or process action/re-engineering team
Obtain on-the-job guidance from someone who is more expert in a specific area
Attend seminars/conferences (on-site and off-site)
Enroll in university courses
Attend commercial/contracted courses
Experience self-paced learning (books, videos, computer-based instruction, etc.)
Pursue an academic degree or certification program
Apply for sabbatical leave
Conduct informational interviews
Move to a new job within my Center
Move to a new job within NASA or the Federal Government
Move to a new job outside of the Federal Government
Start my own business
Plan retirement
Other actions:
Cost Estim
atingC
ost Risk
Economic &
Supporting AnalysisC
areer Developm
ent Guide
Reference
Know
ledge Managem
entC
ost Estimating
Cost R
iskEconom
ic & Supporting Analysis
Career D
evelopment G
uideR
eferenceK
nowledge M
anagement
2008 NASA Cost Estimating Handbook Section 10. Individual Development Planning
Volume 4 Page 4-26
YOUR INDIVIDUAL DEVELOPMENT PLAN To the extent that any of your career goals involve acquiring some new skills or expertise, an Individual Development Plan (IDP) will be very helpful. The attached IDP form shows one example of an IDP. NASA Centers may have unique IDP forms so check with your Human Resource group to inquire whether or not a specific IDP form exists at your Center. If not, you may use the one shown in this Guide. When beginning your plan, refer back to the goals you formulated on the "Goal Development Worksheet" and the relevant actions from the "Method for Taking Action Worksheet." Dependent on the IDP form used, you may be able to enter this information onto your form. In selecting actions, try to achieve a balance between formal training activities (e.g., courses, seminars) and other kinds of learning experiences (e.g., work assignments, reading books). Also, include realistic time frames for completing your actions.
Your Supervisor’s Role
Your supervisor is in an excellent position to support your development by:
�• Providing feedback on your performance in your current job and identifying your strengths and areas for improvement
�• Acting as a mentor and coach
�• Representing the organization's needs, goals and opportunities
�• Communicating what is happening around your Center and within NASA
�• Helping assess your advancement potential and your qualifications for other positions
�• Acting as a resource and referral for exploring your career development options
�• Supporting your training and development, providing training opportunities and funding if related to NASA's mission and funds are available
�• Mentor(s) can also support your career development. See Appendix H for a discussion of mentors and their role.

Cost Estim
atingC
ost Risk
Economic &
Supporting AnalysisC
areer Developm
ent Guide
Reference
Know
ledge Managem
entC
ost Estimating
Cost R
iskEconom
ic & Supporting Analysis
Career D
evelopment G
uideR
eferenceK
nowledge M
anagement
2008 NASA Cost Estimating Handbook Section 10. Individual Development Planning
Volume 4 Page 4-27
EXAMPLE OF A NASA COST ESTIMATOR INDIVIDUAL DEVELOPMENT PLAN*
Name Current Position Organization Name/Code Date
Job Category: Cost Estimator Current Career Stage: Entry Journey Senior Executive Goals ** Action(s) *** Completion Date
First Year:
Goals Action(s) Completion Date
Second Year:
Goals Action(s) Completion Date
Third Year:
Goals Action(s) Completion Date
Longer Term:
Employee Signature and Date (Optional) Supervisor Signature and Date (Optional)
* IDP Forms may vary by Center; check with your Human Resource group to see if an IDP form exists for your Center; if so, use the one specific to your Center
** Goals: Identify knowledge/skills and learning objectives. See Appendices C and D for additional information for each job category and career stage.
*** Action(s): Identify training courses and other development activities. See Appendices C and E.

Cost Estim
atingC
ost Risk
Economic &
Supporting AnalysisC
areer Developm
ent Guide
Reference
Know
ledge Managem
entC
ost Estimating
Cost R
iskEconom
ic & Supporting Analysis
Career D
evelopment G
uideR
eferenceK
nowledge M
anagement
2008 NASA Cost Estimating Handbook Appendix A: Scope
Volume 4 Page 4-28
Appendix A: Scope
This guide applies to all employees whose principal job responsibilities include cost estimating. In general, it includes employees who are classified in the following job series:
Series Title
GS -343 Management and Program Analyst
GS – 801 General Engineer
GS – 861 Aerospace Engineer
GS – 1515 Operations Research Analyst
Additional information regarding position classifications for these job series can be found at the OPM website: http://www.opm.gov/fedclass/gsintro.pdf .

Cost Estim
atingC
ost Risk
Economic &
Supporting AnalysisC
areer Developm
ent Guide
Reference
Know
ledge Managem
entC
ost Estimating
Cost R
iskEconom
ic & Supporting Analysis
Career D
evelopment G
uideR
eferenceK
nowledge M
anagement
2008 NASA Cost Estimating Handbook Appendix B: Job Category Definitions
Volume 4 Page 4-29
Appendix B: Job Category Definitions
This Cost Estimator Career Development Guide model is based on the cost estimating job categories taken from the CMS dictionary. Listed below is the cost estimating definition as defined from the CMS dictionary:
Cost Estimator: (COSTEST) [121] This competency refers to the knowledge, capabilities, and practices associated with the determination, estimation, and analysis of costs. It encompasses analytical techniques required to develop and assess estimates for hardware/software acquisition; design, integration and test, production, operations and support costs (e.g., life-cycle costs) of programs, projects, systems, and resources. Estimating and cost analysis methodologies used include engineering, parametric, analogy, cost performance analysis, schedule analysis, and statistical risk analysis. Knowledge and skills required include Work Breakdown Structure (WBS) development, data collection, cost estimating relationship development and documentation, application of cost models, and evaluation of cost realism in proposals.
Additional competencies for cost estimators exist. This list represents some of the competencies identified through the NASA CMS system, but it does not represent all the possibilities. Some competencies that have been identified include the following:
Program/Project Management: (PROJPROGMT) [122] This competency refers to the knowledge, capabilities, and practices associated with formulating, planning, implementing, managing, tracking and evaluating work and its associated requirements and risks, ranging from the one-time projects to the program-level work. Critical abilities are to define customer and stakeholder needs and constraints, reduce ambiguity in objectives, develop and manage an efficient project organizational structure, and apply system architecture principles to develop and manage technical requirements in order to achieve the appropriate balance between resources, schedule and technical requirements. Includes knowledge associated with system architecture, finance, budgeting, risk assessment, schedule, configuration management, contract technical management, and project controls.
Business Management: (BUSMMT) [113] This competency refers to the knowledge of principles and practices related to managing the internal and external operations of a business unit, such as a Center, to accomplish mission objectives and goals efficiently. Includes ability to integrate performance goals with budget and financial resources as well as the ability to achieve customer satisfaction, develop strong relationships with other NASA and external entities, and adhere to agencywide programs, policies, and procedures. Understanding of Agency and federal government financial, budget and performance operations and processes, and how to apply these processes to optimize operational and investment decisions.
Cost estimating work takes numerous forms. It may involve serving as a cost expert and advisor to management by using analytical and evaluative methods to assess program development or
Cost Estim
atingC
ost Risk
Economic &
Supporting AnalysisC
areer Developm
ent Guide
Reference
Know
ledge Managem
entC
ost Estimating
Cost R
iskEconom
ic & Supporting Analysis
Career D
evelopment G
uideR
eferenceK
nowledge M
anagement
2008 NASA Cost Estimating Handbook Appendix B: Job Category Definitions
Volume 4 Page 4-30
program execution. It may involve efforts to improve organization effectiveness and efficiency. Duties may also require utilization of budgetary and financial management principles and technical and resource loading for long range planning of programs and objectives. This may include supporting the development and implementation of NASA and Center-level polices processes and procedures consistent with cost estimating efforts.
The scope of this work is to accurately forecast the resource requirements of the program and to accurately judge and justify resource requirement for review by management. The work involves isolating and defining unknown conditions and resolving critical problems. The work product affects the work of other experts, the development of major projects, and the well being of a substantial number of employees.
Cost Estimating and Analysis
Cost Estimating
1. Has general knowledge of hardware, software, and life-cycle cost estimating principles.
2. Has general knowledge of budgeting and cost estimating principles, methods and procedures of complex aerospace programs.
3. Performs in-depth systems cost analysis, cost model development, proposal evaluations, and cost-risk analyses for advanced space-related programs and projects.
4. Identifies parameters that affect cost and analyzes them to develop meaningful cost assessment relationships.
5. Performs cost sensitivity analysis on cost estimates and determines which design parameters most significantly affect the cost.
6. Uses technical expertise to review and validate cost estimates performed by others to ensure completeness, accuracy, and adherence to Center and Agency directives and procedures.
7. Performs independent evaluations and analysis of projects in the areas of cost, schedule, and resource management.
8. Completes comparisons and assessments through mathematical, statistical, economic, and scientific research and analysis.
Cost Risk Analysis
1. Identify cost and schedule risks and recommend measures to mitigate these risks through out the project life cycle.
2. Supports the integration of cost, technical, and schedule risk analyses including resource loading and analysis of ramifications of schedule and technical changes.
Cost Phasing
1. Performs time phasing of cost estimates to determine annual funding requirements based on the technical requirements of the project.

Cost Estim
atingC
ost Risk
Economic &
Supporting AnalysisC
areer Developm
ent Guide
Reference
Know
ledge Managem
entC
ost Estimating
Cost R
iskEconom
ic & Supporting Analysis
Career D
evelopment G
uideR
eferenceK
nowledge M
anagement
2008 NASA Cost Estimating Handbook Appendix B: Job Category Definitions
Volume 4 Page 4-31
2. Reviews and evaluates highly complex financial and workforce plans to determine spending rates and staff requirements.
Economic Analysis
1. Performs economic or cost-benefit analysis to quantify the cost benefits of alternative solutions for accomplishing an objective in order to find the most efficient solution.
2. Uses or develops economic models to determine net present value, discounted cash flow in evaluation of program or project.
Business Management
Resource Management
1. Has knowledge of the technical, financial, and resource information that predicts controls, and manages resources. This includes all budget data, project scheduling, life cycle cost estimating, and monthly and annual resource planning.
2. Develops complete, integrated program resource plans by means of independent analysis, monitoring and evaluation, of performance, performing trade assessments, and recommending alternative courses of action.
Budget Management
1. Has knowledge of the federal budget process in general, NASA in particular, and associated Agency financial management systems and processes.
Acquisition Management
1. Has knowledge of acquisition strategies, contracting and procurement practices.
Program/Project Management
Project Management
1. Has knowledge of the theory, techniques, and practices of the major R&D aerospace programs and resources management and of how technical programs are developed (including requirements analysis and the operational aspects.)
2. Has knowledge of risk analysis, configuration management, and schedule systems and techniques.
3. Has knowledge of resource planning and control, cost/schedule management trade-off studies, cost/benefit and risk analysis, performance measurement requirement reviews, and trend data analyses.
4. Has knowledge of the use of advanced project management analytical tools and processes for improving costs, life cycle costs, and schedule estimating and analysis capabilities.
Program/Project Planning
1. Prepares, coordinates, and reviews project cost and staffing agreements and statements of work.
2. Evaluates new proposals in terms of resource feasibility and compatibility with the overall project of program.
Cost Estim
atingC
ost Risk
Economic &
Supporting AnalysisC
areer Developm
ent Guide
Reference
Know
ledge Managem
entC
ost Estimating
Cost R
iskEconom
ic & Supporting Analysis
Career D
evelopment G
uideR
eferenceK
nowledge M
anagement
2008 NASA Cost Estimating Handbook Appendix B: Job Category Definitions
Volume 4 Page 4-32
3. Analyzes the impact of alternative decisions and presents the analysis to managements.
4. Compares programs, schedules, rationale and cost-effectiveness.
Performance Assessment
1. Has knowledge of the quantitative and analytical techniques and technical principles used in analyzing large aerospace programs and projects. This includes mathematical modeling, economic analysis, and engineering techniques.
2. Performs analyses and maintains a monitoring system for project changes to ensure cost and schedule effectiveness and technical success.
3. Assesses the impact of major technical changes or schedule adjustments and proposes reprogramming/rebalancing actions when necessary.
4. Identifies technical and resource issues in specific program and project elements including complex programmatic risks associated with resource requirements that should be addressed by management.
5. Reviews the schedule of hardware deliveries to see of they meet requirements for the present program and/or project.
Science and Engineering
1. Has knowledge of the major operating programs, functions, and objectives of NASA.
2. Has knowledge of space technology, engineering principles, and the general business of space.
Personal and Professional Effectiveness
Communications
1. Must be able to influence, motivate, or direct persons or groups.
2. People contacted may be skeptical or uncooperative and the employee must skillfully approach the individual to obtain the desired outcome.
3. May have contacts with people inside or outside the Agency. These contacts are not routine, the purpose and extent are different, and the role and authority of each party is developed during the contact.
4. Summarize the results, and presents and defends them to project management.
5. Effectively communicates recommendations to management.
6. Converts complex programmatic data into lay terms.
7. Provides on the job training and support to junior and other analysts.
Time Management
1. Prepares short and long range plans to accomplish priorities, define technical milestones and conduct analysis.
2. Plans and carries out assignments, resolves conflicts, coordinates work with others, and interprets policy.
Cost Estim
atingC
ost Risk
Economic &
Supporting AnalysisC
areer Developm
ent Guide
Reference
Know
ledge Managem
entC
ost Estimating
Cost R
iskEconom
ic & Supporting Analysis
Career D
evelopment G
uideR
eferenceK
nowledge M
anagement
2008 NASA Cost Estimating Handbook Appendix B: Job Category Definitions
Volume 4 Page 4-33
3. Assesses technical requirements necessary to carry out the work.
4. Must be versatile and innovative in adapting, modifying, or making compromises.
5. Uses initiative and resourcefulness in deviating from traditional methods to accomplish the work.
Computer and Information Technology
1. Is proficient in computer software systems such as Microsoft Windows, Microsoft Office, and specialized Agency financial databases.
2. Is proficient in the use of computer tools and databases for cost estimating and analysis.

Cost Estim
atingC
ost Risk
Economic &
Supporting AnalysisC
areer Developm
ent Guide
Reference
Know
ledge Managem
entC
ost Estimating
Cost R
iskEconom
ic & Supporting Analysis
Career D
evelopment G
uideR
eferenceK
nowledge M
anagement
2008 NASA Cost Estimating Handbook Appendix C: General Competencies and Associated Training
Volume 4 Page 4-34
Appendix C: General Competencies and Associated Training
Overview of General Competencies The following matrix identifies the general competency training available at the Agency and Center levels. General competencies apply to the performance of all job categories, regardless of specific duties. Therefore, regardless of job position or organizational level, general competencies apply to everyone in the NASA cost estimating community.
NASA has identified the following four broad general competency categories that apply to all members of the NASA cost estimating community as:
�• Leadership �• Critical Thinking �• Individual �• Business Relationships
At NASA, �“mission success starts with safety.�” NASA is pursuing a course of action known as the Agency Safety Initiative that specifies NASA will be the Nation's leader in safety and occupational health. Safety and health is NASA's highest priority and most important core value. Consequently, safety must be reflected in all we do. In the context of this Guide, safety is considered an element of each and every general competency.
The table shown below summarizes the four broad general competency categories and their associated knowledge/skills. These general competency categories are listed in random order, while the knowledge/skills within each general competency category are listed in alphabetical order. The outer frame reflects the fact that all competencies encompass safety:
SAFETY
Leadership
Coaching Empowerment External Awareness Internal Awareness Leading and Managing Change Leading and Managing People and Work Managing Technology Mentoring Negotiating and Influencing Strategic Thinking, Planning and Evaluating
Individual
Adaptability/Flexibility Communication Skills Continuous Learning Insight and Judgment Integrity and Ethics Interpersonal Skills, including Advocacy Skills
Self Management Stress Management Time Management
S A F E T Y
Critical Thinking
Creative Thinking and Innovation Decision Making Knowledge Management Problem Solving and Analytical Thinking
Business Relationships
Customer Focus Partnering and Networking Teamwork
S A F E T Y
SAFETY
Cost Estim
atingC
ost Risk
Economic &
Supporting AnalysisC
areer Developm
ent Guide
Reference
Know
ledge Managem
entC
ost Estimating
Cost R
iskEconom
ic & Supporting Analysis
Career D
evelopment G
uideR
eferenceK
nowledge M
anagement
2008 NASA Cost Estimating Handbook Appendix C: General Competencies and Associated Training
Volume 4 Page 4-35
To better understand these general competencies, refer to the following definitions:
�• Leadership consists of the knowledge/skills that encompass an understanding of the organization, the internal and external environment that impacts the organization, and the skills needed to influence, motivate, and challenge others in the workplace.
�• Individual consists of knowledge/skills that relate to the development and enhancement of personal business habits needed to communicate effectively and honestly, manage time and stress, and attract others to well reasoned and logical points of view.
�• Critical Thinking consists of the knowledge/skills required by employees to gather data, analyze problems, evaluate options, and develop/implement creative solutions to organizational challenges.
�• Business Relationships consists of the knowledge/skills needed to effectively collaborate, internally and externally, with customers, partners, and team members in the business environment.
LEADERSHIP Coaching: Clearly communicates performance expectations to peers and employees; openly shares information for the benefit of the organization; models and communicates the values, behaviors, and work practices expected of the workforce; provides constructive feedback
Empowerment: Creates and sustains an organizational culture which encourages others to provide the quality of service essential to high performance; enables others to acquire resources and tools, including the responsibility and authority for work accomplishment
External Awareness: Identifies external environment, e.g., political, economic, social, that impact the work of the organization; understands and responds to internal and external strategy, policies, and regulations that impact NASA; approaches each problem situation with a clear perception of organizational and political reality; recognizes the impact of alternative courses of action
Internal Awareness: Knows the organization's vision, mission, and culture and how its social, and political systems work; operates effectively within these systems to maximize their benefit to the organization; understands and leverages the impact of unwritten organizational rules; understands NASA and Center organizational structure, strategic goals, and management approach
Leading and Managing Change: Takes a long-term view, acts as a catalyst for, and contributes to organizational change; actively leads and manages change, while integrating key stakeholder, customer, and organizational goals and values; balances the requirements of change and continuity, while continually improving all aspects of product and service delivery, within the basic organizational framework; maintains focus, intensity, and persistence in an environment of competing interests; identifies and mitigates risks associated with change; removes obstacles that create resistance to change

Cost Estim
atingC
ost Risk
Economic &
Supporting AnalysisC
areer Developm
ent Guide
Reference
Know
ledge Managem
entC
ost Estimating
Cost R
iskEconom
ic & Supporting Analysis
Career D
evelopment G
uideR
eferenceK
nowledge M
anagement
2008 NASA Cost Estimating Handbook Appendix C: General Competencies and Associated Training
Volume 4 Page 4-36
Leading and Managing People and Work: Maximizes NASA's human capital and people's commitment to achieving organizational goals; sets performance expectations; works with team members to establish mutually acceptable requirements, performance objectives, and milestones; evaluates work performance and provides feedback to others on their performance; ensures that staff are appropriately selected, utilized, developed, appraised, and are treated in a fair, equitable, and respectful manner; provides rewards and recognition to the team and individuals; removes obstacles to team and individual performance; takes appropriate corrective action, when required
Managing Technology: Comprehends relevant technologies available at NASA and their potential for organizing and managing workflow, including leading virtual teams; selects and uses those appropriate for managing work; knows and uses technology policies effectively (NF-1767-ITAR); uses technology to improve own performance
Mentoring: Counsels others, through formal or informal methods; willingly serves as a role model; shares organization insights and lessons learned; provides sound advice on career development goals, strategies, and options
Negotiating and Influencing: Persuades others to accept recommendations and exchange information or change their behavior in order to accomplish common goals; works with others toward an agreement; builds consensus to achieve mutually acceptable solutions, facilitating the discussion of sensitive issues; manages and successfully resolves conflicts and disagreements through give and take; promotes an atmosphere where mistakes can be discussed openly
Strategic Thinking, Planning and Evaluating: Takes a long-term view, acts as a catalyst for, and contributes to organizational change; builds a shared vision with others; influences others to translate vision into action; identifies and implements appropriate metrics to measure progress
INDIVIDUAL Adaptability/Flexibility: Open to change and new information; adapts behavior and work methods in response to new information, changing conditions, or unexpected obstacles; adjusts rapidly to new situations warranting attention and resolution; champions new ideas and methods, despite opposition, when the organizational benefits outweigh the costs
Communication Skills: Expresses information, in writing and orally, in a succinct and organized manner that is appropriate for the intended audience; effectively listens to others, seeks understanding, and clarifies information as needed; ensures that people are clear about the information communicated; correctly and accurately uses the English language (i.e., grammar, spelling, punctuation, syntax)
Continuous Learning: Grasps the essence of new information; masters new technical and business knowledge; recognizes own strengths and weaknesses; pursues self-development; seeks feedback from others, including unsolicited feedback; seeks opportunities to master new knowledge
Insight and Judgment: Uses common sense; maintains confidentiality; uses the culture and politics of the organization effectively
Cost Estim
atingC
ost Risk
Economic &
Supporting AnalysisC
areer Developm
ent Guide
Reference
Know
ledge Managem
entC
ost Estimating
Cost R
iskEconom
ic & Supporting Analysis
Career D
evelopment G
uideR
eferenceK
nowledge M
anagement
2008 NASA Cost Estimating Handbook Appendix C: General Competencies and Associated Training
Volume 4 Page 4-37
Integrity and Ethics: Acts according to the highest ethical standards; demonstrates consistency among actions and words; takes responsibility for actions; admits a mistake when one is made; understands the impact of violating these standards on the organization, self, and others
Interpersonal Skills: Considers and responds appropriately to the needs, feelings and capabilities of different people in different situations; is tactful, compassionate and sensitive, and treats others with respect; relates well to people from varied backgrounds, cultures, and international business environment; is sensitive to cultural diversity, race, gender, disabilities, and other individual differences
Self-Management: Sets well-defined and realistic personal goals; displays a high level of initiative, effort, and commitment toward completing assignments in a timely manner; demonstrates a passion to perform work; performs with minimal supervision; is motivated to achieve, despite obstacles; demonstrates responsible behavior
Stress Management: Deals calmly and effectively with high-stress situations, such as tight deadlines, hostile individuals, and emergency and dangerous situations; balances job and personal pressures, making considered and well informed decisions regarding work, family, and self
Time Management: Uses time in the most effective and productive way, and properly assess and utilizes priorities in time allocation; controls distractions that waste time and break work flow
CRITICAL THINKING Creative Thinking and Innovation: Uses imagination to develop new solutions to problems; designs new methods where established methods and procedures are ineffective or nonexistent; encourages creative thinking and innovation; experiments with new ideas and approaches
Decision Making: Makes sound, well informed, and timely decisions; perceives the impact and implications of these decisions; commits to action, even in uncertain situations, that support accomplishment of organizational goals
Knowledge Management: Identifies a need for and knows how to gather information; organizes and maintains information in a logical fashion; applies appropriate information to organizational challenges; captures, stores, and shares information, knowledge, best practices and lessons learned
Problem Solving and Analytical Thinking: Identifies problems; determines accuracy and relevancy of information; uses sound judgment to generate and evaluate alternatives; makes timely recommendations; clarifies issues; keeps focused on the things that are most important
BUSINESS RELATIONSHIPS Customer Focus: Works with clients, customers, and partners to accurately assess their needs and wants; matches team capabilities to customer needs; provides information and assistance, resolves customer problems; evaluates service and acts to ensures customer satisfaction
Partnering and Networking: Identifies common goals and objectives with new and prospective partners; pursues mutually beneficial and cooperative activities; develops networks and builds

Cost Estim
atingC
ost Risk
Economic &
Supporting AnalysisC
areer Developm
ent Guide
Reference
Know
ledge Managem
entC
ost Estimating
Cost R
iskEconom
ic & Supporting Analysis
Career D
evelopment G
uideR
eferenceK
nowledge M
anagement
2008 NASA Cost Estimating Handbook Appendix C: General Competencies and Associated Training
Volume 4 Page 4-38
alliances; engages in cross-functional activities; facilitates "win-win" situations; establishes and uses informal networks to obtain resources and information
Teamwork: Encourages and facilitates cooperation, pride, trust, and group identity; fosters commitment and team spirit; works effectively with others to achieve goals; facilitates an open exchange of ideas; fosters an atmosphere of open communication
Technical Competencies Technical competencies correlate to the functional expertise required for one�’s job category. This Guide provides a comprehensive list of technical competencies for the cost estimator job category in Appendix D. A competency is a generalized subject/performance area that an employee must be capable of performing adequately at the appropriate stage of his/her career. Each competency consists of knowledge and multiple skills and is measured by the achievement of learning objectives. Learning objectives reflect the expected level of performance required to be competent.
Individuals do not need to master all competencies at the entry level in order to progress to the journey level. Employees and supervisors should identify those competencies that are pertinent for the employee�’s current job assignment and chosen career path. Whether one has achieved a level of mastery should be jointly determined by the employee and his/her supervisor and appropriately reflected in the employee�’s IDP.
As one�’s career advances from entry through journey, and perhaps through senior and executive career stages, the expected level of technical competency increases. Additionally, employees are expected to achieve cross-functional competency as their level of job responsibility increases. For example, individuals at the journey level are expected to have mastered all pertinent technical competencies at the entry level. In turn, employees at the senior level are expected to have mastered all the pertinent technical competencies at both the entry and journey levels. In addition to mastering pertinent technical competencies at the entry, journey, senior, and executive levels, individuals at the executive level must also possess the executive core qualifications published by the U.S. Office of Personnel Management. These core qualifications, and their underlying competencies, are published in the Guide to Senior Executive Service Qualifications, available on the Internet at: https://www.opm.gov/ses/references/SES_Quals_Guide_2006.pdf
Developmental Experiences The following matrix displays a sampling of the current developmental programs available to individuals working in the cost estimating community at NASA. Each program's length (duration), schedule, minimum eligibility requirements (career stage, target grade level, and job category), estimated cost, description, and web address(es) for additional program information are displayed. Courses may change in time a well as course offerings so check the Center training web pages, SATERN and the NASA Training and Development program for up to date information.
The programs are categorized as follows:
�• Fellows programs and other programs offered by independent organizations �• NASA-wide programs

Cost Estim
atingC
ost Risk
Economic &
Supporting AnalysisC
areer Developm
ent Guide
Reference
Know
ledge Managem
entC
ost Estimating
Cost R
iskEconom
ic & Supporting Analysis
Career D
evelopment G
uideR
eferenceK
nowledge M
anagement
2008 NASA Cost Estimating Handbook Appendix C: General Competencies and Associated Training
Volume 4 Page 4-39
�• NASA Center-specific programs �• Programs sponsored by other government agencies �• University- sponsored programs
Most programs primarily address the general competency categories (leadership, critical thinking, individual, and business relationships) discussed in Section 6. However, many of the programs can be tailored to address the specific needs of the participant. The majority of the non-university programs provide a mixture of formal classroom training, briefings, and on-the-job developmental assignments.
Current Developmental Programs Available for Cost Estimator Employees Eligibility
Program Length Program Schedule Career Stage Grade Level
Job Cat.
Estimated Cost
Council for Excellence in Government (EIG) Sponsored:
1 yr. Sept - Sept Senior/ Executive with Masters 14 – 15 (Exceptional 13s)
CE Tuition: $9400 plus travel EIG Fellows Program
http://www.excelgov.org/displaycontent.asp Intensive leadership program designed to build the capacity of mid-level federal managers to lead organizations and produce results; while continuing in their current jobs, Fellows participate in a year-long series of activities (monthly meetings, workshops, benchmarking site visits to corporations and government organizations, seminars, and team meetings).
Federal Executive Institute (FEI) Sponsored:
4 wks. Offered throughout year Executive SES and high 15
CE Tuition: Standard-$10,950 plus travel & Appl. Learning $11,450 plus travel
Leadership for a Democratic Society Program
http://www.leadership.opm.gov/programs/Executive-Leadership-Development/LDS/Index.aspx At FEI in Charlottesville, VA, the program help participants build a healthier working culture by exchanging ideas on improving program performance and addressing areas of interagency cooperation and conflict with colleagues from other departments.
Government Affairs Institute (GAI) at Georgetown University:
12 or 7 mos. Jan - Jan (with Dec. orientation)
Senior/ Executive 13 and above
CE Training: $4000 for 7-month program; $5400 for 12-month program plus travel $
Capital Hill Fellows Program
http://www3.georgetown.edu/programs/gai/programscourses/program/fellowship.html Program provides executive branch employees the opportunity to serve full-time in assignments with the Congress, gaining a hands-on understanding of how the Legislative Branch works and how decisions affecting federal agencies programs are made; consists of GAI training and developmental assignments while carrying out the duties of a congressional personal staffer or committee staffer.
18 mos. Dependent on participant and courses selected
Senior/ Executive 12 and above
CE $25 application fee, plus 5 courses at approx. $600-1,200 per class plus travel
Certificate Program in Legislative Studies
http://grad.georgetown.edu/pages/graduate_programs.cfm?dept_id=26&show=study_areas Program's focus is on the congressional process, organization, and practices, and on the relationship between Congress and the other branches of the federal government; mix of classroom courses (min. 5) and actual time spent on Capital Hill interfacing with actual players.
NASA HQ-Sponsored: (for use Agency-wide)
Variable variable Full time permanent who has not received long-term fellowship within 5 years and short-term fellowship within 3 years
CE variable NASA Fellowship Program
http://fellowship.nasa.gov/ The NASA Fellowship Program provides high potential employees with the opportunity to attend world-class academic programs as a means of enhancing their management and leadership capabilities. These programs provide an excellent opportunity for participants to study and work with individuals Government wide, nationally with industry participants, and globally with international students.
NASA Administrator Fellowship Program
http://university.gsfc.nasa.gov/programs/nafp.jsp This program is designed to enhance the professional development of NASA employees and the Science, Technology, Engineering, and Mathematics (STEM) faculty of Historically Black Colleges and Universities (HBCUs) and Other Minority Universities. The program also seeks to increase the ability of these Minority Universities to respond to NASA's overall research and development mission. Six fellowships are awarded each year.

Cost Estim
atingC
ost Risk
Economic &
Supporting AnalysisC
areer Developm
ent Guide
Reference
Know
ledge Managem
entC
ost Estimating
Cost R
iskEconom
ic & Supporting Analysis
Career D
evelopment G
uideR
eferenceK
nowledge M
anagement
2008 NASA Cost Estimating Handbook Appendix C: General Competencies and Associated Training
Volume 4 Page 4-40
Eligibility Program Length Program Schedule
Career Stage Grade Level
Job Cat.
Estimated Cost
12 to 18 mos.
Usually 1 year; offered every 2 years
Executive 14 – 15
CE Training costs dependent on participant’s needs; plus travel $
SES Candidate Development Program (SESCDP)
http://nasapeople.nasa.gov/training/devprogs/sescdp.htm Provides a series of developmental experiences for individuals who have high potential for assuming executive responsibilities; mix of formal courses/seminars, developmental work assignments, and individual mentoring from current SES members.
variable GS 13-15 CE Variable NASA Leadership Development Program http://ldp.nasa.gov/
As part of an integrated Strategic Human Capital Plan, the LDP is a succession-planning tool aimed at ensuring that NASA has the leaders it needs for the future. The LDP is intended to prepare leaders to take on higher and broader roles and responsibilities in the near future.
NASA Center-Specific:
(1) Ames Research Center
Depends on participant Depends on participant and specific degree program
All Levels CE Tuition Costs dependent on College/university attending
Academic Programs - Undergraduate Level http://ameshr.arc.nasa.gov/training/academic/Academic.html
Undergraduate program leading to degrees at various area community colleges/universities.
Depends on participant Depends on participant and specific degree program
All Levels CE Tuition costs dependent on college/ university attending
Academic Program - Graduate Level
http://ameshr.arc.nasa.gov/training/academic/Academic.html Program enables employees to attend graduate school on a part-time basis; principle purpose is to improve skills and knowledge in ways that benefit Ames and courses must be consistent with this; participants are generally limited to 2 courses per semester/quarter.
1 year Dependsonparticipant All Levels CE Tuition costs dependent on college/ university attending
Full Time Graduate Study
http://ameshr.arc.nasa.gov/training/academic/Academic.html Program allows high potential technical or administrative professionals an educational opportunity to enhance their professional development of NASA Ames employees by attending a graduate school on a full time basis. The principle purpose is to improve skills and knowledge in ways that are strategically aligned with NASA Agency and Ames missions.
(2) Dryden Research Center
Varies Sept- August All Levels CE $600/course or $4800 Continuing Education Program
Varies Sept- June All Levels; Competitive CE $2000/course or $16,000 Graduate Studies Program
(3) Glenn Research Center
9 months Oct – June GS 9-13 CE $750 Cleveland Federal Community Leadership Institute
http://www.grc.nasa.gov/WWW/ODT/devprog.htm (Internal NASA only) To assist Federal agencies in the professional development of leaders and to understand and develop community partnerships.
varies varies TS CE varies Development Programs
http://www.grc.nasa.gov/WWW/ODT/devprog.htm
Varies Varies Feb-April application
7 and above CE Tuition costs dependent on university attending
Full-Time Graduate Study Program
http://www.grc.nasa.gov/WWW/ODT/links.htm Program allows select employees to attend graduate school on a full time basis for a limited number of Ph.D. and exceptional Master's candidates each year; individuals approved for full-time study can either participate in part-time courses while working, or request attendance at school without working for the residence portion of their program; proposed programs of full-time study should relate directly to the work the individual is responsible for and the proposed research/work should contribute significantly to Glenn’s programs/mission.
2 yr. Sept-June 7 and above CE Tuition costs dependent on university attending
MBA Graduate Study Program
http://www.grc.nasa.gov/WWW/ODT/announce.htm (Internal NASA only) Program consists of business courses offered on-site by Cleveland State University; program’s purpose is to provide an opportunity for employees with a job/mission related need that supports agency goals, to develop knowledge, abilities, attitudes, and understanding that will constitute a foundation for their growth into competent and responsible business administrators; program is targeted for employees who are in Professional Administrative, Scientist and Engineer, or Supervisory positions, who have graduate standing with an accredited university.
6 mos. Jan – July; May - Nov Journey 7-11 CE Training: $1995 New Leader Program
http://www.grc.nasa.gov/WWW/ODT/announce.htm(Internal NASA only) http://grad.usda.gov/course_details.php?cid=NLED7300L Program is designed to prepare future leaders by developing skills necessary for federal workers to be effective in a rapidly changing federal environment; mix of classroom and developmental assignments.

Cost Estim
atingC
ost Risk
Economic &
Supporting AnalysisC
areer Developm
ent Guide
Reference
Know
ledge Managem
entC
ost Estimating
Cost R
iskEconom
ic & Supporting Analysis
Career D
evelopment G
uideR
eferenceK
nowledge M
anagement
2008 NASA Cost Estimating Handbook Appendix C: General Competencies and Associated Training
Volume 4 Page 4-41
Eligibility Program Length Program Schedule
Career Stage Grade Level
Job Cat.
Estimated Cost
2 yrs. Sept - June 7 and above CE Training costs dependent on participant’s needs
On-Site Graduate Education Program
http://www.grc.nasa.gov/WWW/ODT/HRP/PHDMemo01.pdf Program offers individuals an opportunity to complete Master's and Doctoral level Engineering coursework provided by five Ohio universities; courses are provided both through live and televised instruction; principle purpose is to improve skills and knowledge in ways that benefit Glenn and courses must be consistent with this.
2 yrs. Sept - June 7 and above CE Training costs dependent on participant’s needs
Part-Time Graduate Study Program
http://www.grc.nasa.gov/WWW/ODT/ Program enables employees to attend graduate school on a part-time basis; principle purpose is to improve skills and knowledge in ways that benefit Glenn and courses must be consistent with this; participants are limited to two courses per semester/quarter.
Varies Offered throughout year 7 and above CE Training costs dependent on participant’s needs
Part-Time Undergraduate Study Program
http://www.grc.nasa.gov/WWW/ODT/ Program enables one to attend undergraduate school on a part-time basis leading to degrees at various area community colleges/ universities; certificate programs are also available at college/univ. extensions; also sponsors on-site business courses through Cuyahoga Community College and Baldwin Wallace University; the purpose of the undergraduate series is to assist employees in preparing for the Certified Professional Secretary (CPS) Examination, and to further the education of those with CPS rating; it is also open to employees in the STEP, GO, and CEP Upward Mobility Programs and other employees with job related needs.
1 yr. Sept - June Journey/ Senior 11 – 12 CE Training: $3650 Women's Executive Leadership Program
http://www.grc.nasa.gov/WWW/DT/HRP/fellowshipdesc.htm#welp Program develops high potential women for a career in management and leadership positions; is tailored to one's specific developmental needs with emphasis on the Leadership Effectiveness Framework.
(4) Goddard Space Flight Center
9 months Once a calendar year Journey/Senior 12 - 15 CE Tuition: Approximately $10K plus travel to Greenbelt, MD for non-Goddard personnel. Center-funded for Goddard personnel.
Leadership Alchemy Program
http://ohcm.gsfc.nasa.gov/DevGuide/DevPrograms/Alchemy/home.htm A state-of-the-art, award-winning program designed by NASA GSFC with up to 4 slots available for other NASA Centers. The program focuses on leadership development from the inside-out and emphasizes the practices of action learning, appreciative inquiry, emotional intelligence, developing the presence of a leader, and reading and reflection.
Depends on participant Depends on participant’s program
All levels CE Tuition cost dependent on university attending
Part-Time Graduate Study Program
http://ohcm.gsfc.nasa.gov/DevGuide/DevPrograms/part.htm Program allows limited number of Goddard employees to pursue advanced academic study; participants may attend training up to 16 hours during workweek.
max12 monthswith1-yearoptionto extend
Dependsonparticipant’s program
GS11 and abovewith min.1 year asfull time employee
CE Center funded; varies depending on institution/ research facility; max. $5,000 travel cost
Study Fellowship Program (SFP)
http://ohcm.gsfc.nasa.gov/DevGuide/DevPrograms/SFP-FY08-AcademicCall.doc Goddard’s RFP provides an opportunity for employees to broaden their knowledge through interaction with peers at academic institutions or research facilities. Employees who are selected may pursue independent or cooperative research at domestic or foreign accredited educational institutions or appropriate research facilities.
Maximum 2-year participation
annual call full time permanent or term employee with min. 1 year experience and GPA requirement
CE Tuition, fees, and textbooks covered; costs dependent on university attending
Undergraduate Study (US) Program
http://ohcm.gsfc.nasa.gov/devguide/devprograms/usp/fy07uspapp.doc The US program is designed to encourage continual learning by facilitating part-time study at the undergraduate level. With supervisory approval, participants may be released for up to 16 hours per week (4 hours per 3 or 4 credit course taken) from scheduled work, with pay, to attend and prepare for classes.
(5) NASA Headquarters
Depends on participant Admission to program annually
Non-professionals up to GS-11
CE Tuition cost dependent on university attending
Continuing Education Program (CEP)
http://ohcm.gsfc.nasa.gov/DevGuide/DevPrograms/ hqacademic_cep.htm Program designed to provide employees with the opportunity to obtain the education needed to enhance their career potential; attend college courses related to specific career goals.
Depends on participant
Admission to program annually - June deadline
All levels CE Tuition, fees, and portion of textbooks covered; depending on university attending
Graduate Study Program (GSP)
http://ohcm.gsfc.nasa.gov/DevGuide/DevPrograms/gsp.htm Program enables employees to pursue job-related graduate study while still performing their work functions.

Cost Estim
atingC
ost Risk
Economic &
Supporting AnalysisC
areer Developm
ent Guide
Reference
Know
ledge Managem
entC
ost Estimating
Cost R
iskEconom
ic & Supporting Analysis
Career D
evelopment G
uideR
eferenceK
nowledge M
anagement
2008 NASA Cost Estimating Handbook Appendix C: General Competencies and Associated Training
Volume 4 Page 4-42
Eligibility Program Length Program Schedule
Career Stage Grade Level
Job Cat.
Estimated Cost
(6) Johnson Space Center
1 year Depends on participant; January application date
All levels; must have minimum 3 yrs. JSC service
CE Tuition & related fees covered; travel $ not covered
JSC Fellowship Program (Graduate Study)
http://nasapeople.nasa.gov/Training/default.htm(INTERNAL NASA ONLY) Program allows one to attend graduate school on a leave-with-pay basis for 1 continuous year; participants chosen through a competitive Center process.
Depends on participant Depends on participant All levels CE Tuition costs; 6 credit hour maximum per semester
Part-Time Graduate Study
http://nasapeople.nasa.gov/Training/default.htm (INTERNAL NASA ONLY) Provides tuition assistance for academic coursework that is job and/or mission-related; usually after hours; time away from work will be made up unless course is a job requirement.
2 yearsduringregularduty hrs.
Dependsonparticipant; February application date
Entry & journey;must haveminimum 1 yrJSC service
CE Tuition & related fees covered Project Increased Qualifications Program (Project IQ)
http://nasapeople.nasa.gov/Training/default.htm (INTERNAL NASA ONLY) Program allows one to attend undergraduate academic courses during duty hours; is designed to strengthen one's qualifications for a position with higher promotion potential or to upgrade abilities for one's current position; must have completed at least 6 hrs. college work and does not possess a bachelor's degree.
(7) Kennedy Space Center
Depends on participant Starts in fall annually All levels CE Tuition, fees, and textbooks covered
Kennedy Graduate Fellowship Program (KGFP) http://ba.ksc.nasa.gov/tdindex.htm
Program provides participation in full- and part-time doctoral programs and full-time master’s program; approved participants may attend on a full-time basis up to 1 calendar year.
Depends on participant Starts in fall annually All levels CE Tuition, fees, and textbooks covered
Kennedy Undergraduate Studies Program (KUSP) http://ba.ksc.nasa.gov/tdindex.htm
Program provides an internal source of qualified candidates in shortage category occupations requiring an academic degree; restricted to AST and professional administrative degree; may allow participants up to 4 hours duty time per week for training.
(8) Langley Research Center
2 years part-time
Starts in fall annually; May/June Call Letter
All levels CE Tuition, fees, and textbooks covered
Executive MBA (EMBA) Program – College of William and Mary http://mason.wm.edu/Mason/Programs/EMBA/
Program designed to provide participants an MBA over a 2-year period; attend classes on a part-time basis during workweek and on weekends.
Depends on participant Depends on participant; Nov/Dec Call Letter
All levels CE Tuition and textbooks covered
Full-Time Graduate Study- Advanced Study Program http://www.nasa.gov/centers/langley/home/index.html
Program designed to provide additional graduate level study directly related to Langley work performed by program participant; full-time graduate-level courses taken.
Depends on participant Depends on participant; Call Letter at start of semester
All levels CE Tuition costs dependent on university attending
Part-Time Graduate Program- Advanced Study Program http://www.nasa.gov/centers/langley/home/index.html
Program designed to assist college graduates in becoming more productive via part-time graduate-level study.
Dependsonparticipant Dependsonparticipant Dependsonparticipant CE Tuition costs dependent on university attending
Part-Time Undergraduate Program
http://www.nasa.gov/centers/langley/home/index.html Program designed to assist employees who are obtaining additional job-related training in order to develop themselves for their current position.
Depends on participant Depends on participant Depends on participant CE Training costs dependent on participant’s needs; plus travel
Professional Development Program (PDP)---Level III
Provides a developmental work assignment within another Langley organization at or outside NASA; assignment provides experimental learning in new tasks/functions; is supplemented by seminars and formal classroom education tailored to the individual needs.
(9) Marshall Space Flight Center
Two separate modules, each is 40 hours
Module I – January Module II – May
GS 11-13 CE Approximately $1,100 per participant
A&M Executive Development Program
Program designed to increase employees awareness of management/leadership strategies and practices; participation in Module I is not a prerequisite for participation in Module II.
Depends on grade level at program entry
According to time of program entry
Entry-Journey CE Salary of participants Professional Intern Program (PIP)
http://ohc.msfc.nasa.gov/old/ Program provides a systematic plan for the development and advancement of interns; designed to provide background knowledge in several job specialties and specific knowledge in one specialty; thereby decreasing the time required for interns to achieve full job effectiveness.

Cost Estim
atingC
ost Risk
Economic &
Supporting AnalysisC
areer Developm
ent Guide
Reference
Know
ledge Managem
entC
ost Estimating
Cost R
iskEconom
ic & Supporting Analysis
Career D
evelopment G
uideR
eferenceK
nowledge M
anagement
2008 NASA Cost Estimating Handbook Appendix C: General Competencies and Associated Training
Volume 4 Page 4-43
Eligibility Program Length Program Schedule
Career Stage Grade Level
Job Cat.
Estimated Cost
1 yr. usually Aug - Aug All levels CE Tuition dependent on university attending
Full-Time Study Program
http://ohc.msfc.nasa.gov/old/ Program designed to provide additional graduate level study in participant's field of choice; full-time study at a college/ university; provides opportunity to concentrate on academic training in order to enhance one's current and future work performance and efficiency.
Depends on participant Depends on participant All levels CE Tuition dependent on university attending
Part-Time Graduate Study
http://ohc.msfc.nasa.gov/old/ Program designed to assist employees in obtaining additional, job-related training via a university graduate-level course of study.
Depends on participant Depends on participant All levels CE Tuition dependent on university attending
Part-Time Undergraduate Study
http://ohc.msfc.nasa.gov/old/ Program designed to assist employees in obtaining additional, job-related training via a university graduate-level course of study.
(10) Stennis Space Center
Varies Aug - July Entry-Journey CE Averages $750 per semester Continuing Education Program http://www6.ssc.nasa.gov/hr/training.html (Internal NASA only) NASA/SSC Training and Development Plan LA00-CWI-
002; Program participants may take up to 2 classes per semester.
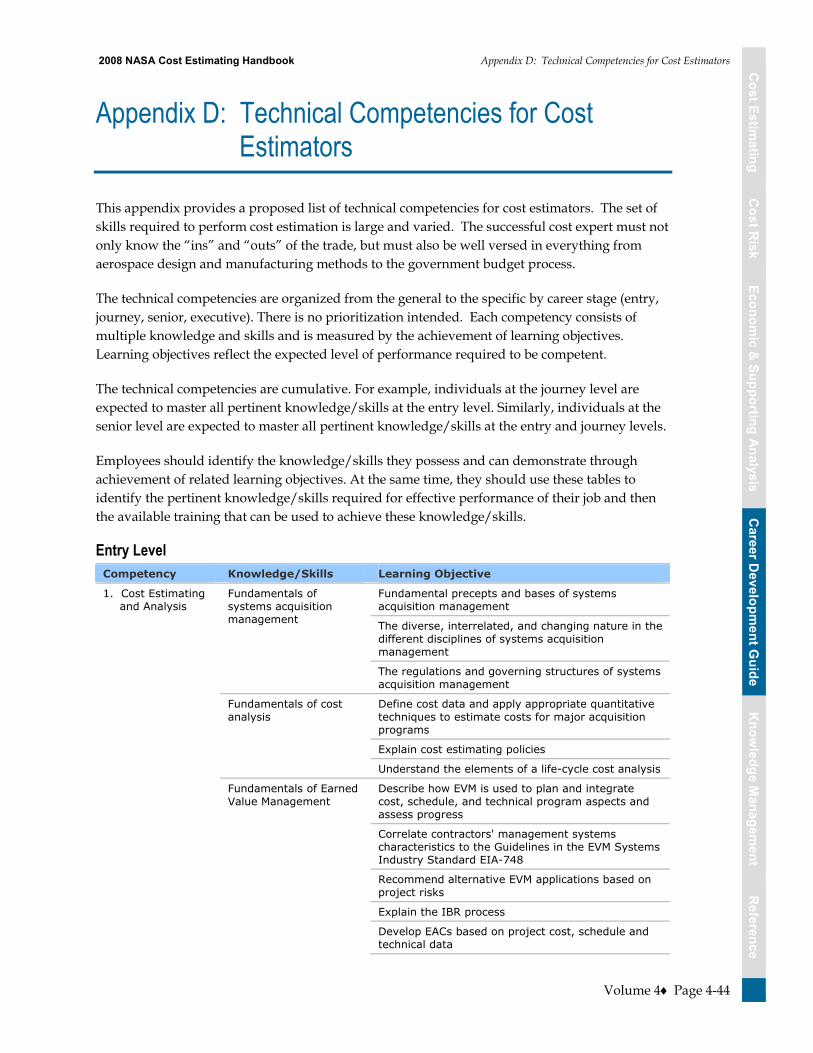
Cost Estim
atingC
ost Risk
Economic &
Supporting AnalysisC
areer Developm
ent Guide
Reference
Know
ledge Managem
entC
ost Estimating
Cost R
iskEconom
ic & Supporting Analysis
Career D
evelopment G
uideR
eferenceK
nowledge M
anagement
2008 NASA Cost Estimating Handbook Appendix D: Technical Competencies for Cost Estimators
Volume 4 Page 4-44
Appendix D: Technical Competencies for Cost Estimators
This appendix provides a proposed list of technical competencies for cost estimators. The set of skills required to perform cost estimation is large and varied. The successful cost expert must not only know the �“ins�” and �“outs�” of the trade, but must also be well versed in everything from aerospace design and manufacturing methods to the government budget process.
The technical competencies are organized from the general to the specific by career stage (entry, journey, senior, executive). There is no prioritization intended. Each competency consists of multiple knowledge and skills and is measured by the achievement of learning objectives. Learning objectives reflect the expected level of performance required to be competent.
The technical competencies are cumulative. For example, individuals at the journey level are expected to master all pertinent knowledge/skills at the entry level. Similarly, individuals at the senior level are expected to master all pertinent knowledge/skills at the entry and journey levels.
Employees should identify the knowledge/skills they possess and can demonstrate through achievement of related learning objectives. At the same time, they should use these tables to identify the pertinent knowledge/skills required for effective performance of their job and then the available training that can be used to achieve these knowledge/skills.
Entry Level Competency Knowledge/Skills Learning Objective
1. Cost Estimating and Analysis
Fundamental precepts and bases of systems acquisition management
The diverse, interrelated, and changing nature in the different disciplines of systems acquisition management
Fundamentals of systems acquisition management
The regulations and governing structures of systems acquisition management
Fundamentals of cost analysis
Define cost data and apply appropriate quantitative techniques to estimate costs for major acquisition programs
Explain cost estimating policies
Understand the elements of a life-cycle cost analysis
Fundamentals of Earned Value Management
Describe how EVM is used to plan and integrate cost, schedule, and technical program aspects and assess progress
Correlate contractors' management systems characteristics to the Guidelines in the EVM Systems Industry Standard EIA-748
Recommend alternative EVM applications based on project risks
Explain the IBR process
Develop EACs based on project cost, schedule and technical data

Cost Estim
atingC
ost Risk
Economic &
Supporting AnalysisC
areer Developm
ent Guide
Reference
Know
ledge Managem
entC
ost Estimating
Cost R
iskEconom
ic & Supporting Analysis
Career D
evelopment G
uideR
eferenceK
nowledge M
anagement
2008 NASA Cost Estimating Handbook Appendix D: Technical Competencies for Cost Estimators
Volume 4 Page 4-45
Competency Knowledge/Skills Learning Objective
Identify relevant acquisition organizations, key players and formal agreements
Fundamentals of business financial management
Describe the overall resource allocation process and identify the terminology and concepts used in analyzing the costs of acquisition programs
Explain the appropriations, policies, and practices applicable to developing a program budget
Examine the Planning, Programming and Budgeting System (PPBS) and the impact of programming and budgeting decisions on acquisition programs
Summarize the Congressional enactment process and the impact of Congressional actions of acquisition programs
Identify the processes by which budget authority is apportioned, executed in accordance with public law, and reprogrammed
Demonstrate basic knowledge of budget, cost accounting, cost/schedule management and program terminology, concepts and principles
Describe applicable Agency, legislative, administrative, and regulatory requirements
2. Business Management
Knowledge of budget, cost accounting, cost/schedule management and program terminology, concepts, policies, and principles Research questions concerning application of
generally accepted budgeting principles
Basic Project Management Concepts
The Life Cycle Management Approach
3. Program/ Project Management and Control
Foundations of Project Management
Project Planning
Scheduling and Control Basics
NASA Program/Project Cost Estimating Techniques
NASA Program/Project Budgeting and Interaction with the Federal Budgeting Process
Project Data, Information and Configuration Management Processes
Contract Engineering and the Procurement Process
Contract and Project Baseline Management
Earned Value Management
4. Science and Engineering
Understanding Space Basic knowledge and a “big picture” perspective about space technology, engineering and the business of space.
Basic knowledge of time management to improve performance and reduce stress
Minimize crisis by encouraging proper planning
Organize and access critical information associated with your planning tool
Focus on high-leverage activities that will increase return on investment
Create a healthy balance between personal and professional development
5. Personal and Professional Effectiveness, Leadership, and Supervisory
Time & Stress Management
Share a common vision and mission that creates unity among team members
Communication Skills Basic knowledge of effective writing skills

Cost Estim
atingC
ost Risk
Economic &
Supporting AnalysisC
areer Developm
ent Guide
Reference
Know
ledge Managem
entC
ost Estimating
Cost R
iskEconom
ic & Supporting Analysis
Career D
evelopment G
uideR
eferenceK
nowledge M
anagement
2008 NASA Cost Estimating Handbook Appendix D: Technical Competencies for Cost Estimators
Volume 4 Page 4-46
Competency Knowledge/Skills Learning Objective
Basic knowledge of effective speaking and oral presentation skills
6. Computer and Information Technology
Basic office applications: operating system, web browsing, email, word processing, spreadsheet, presentation graphics
Basic knowledge and ability to use personal computer software including operating system, email, web browser, word processing, spreadsheet and presentation applications.
Hardware cost models Basic knowledge of NAFCOM, PRICE H, and SEER H
Journey Level Competency Knowledge/Skills Learning Objective
1. Cost Estimating and Analysis
Intermediate systems acquisition management
Enhance and apply knowledge of the business, technical, and managerial aspects of acquisition
Understand and appreciate the critical role that each functional discipline plays in the acquisition process
Effectively participate in integrated product teams to develop plans and resolve problems
Understand the cost estimating process
Intermediate cost analysis
Normalize data for content, quantity, and economic year
Develop cost estimates using various techniques
Document cost models and estimates
Apply time-phasing techniques in development, production and operation and support phases of the life cycle, including cost improvement curves
Understand and perform sensitivity and risk analysis of an estimate
Intermediate earned value management
Synthesize the relationship between EVM and acquisition management
Prepare EVM requirements for the RFP
Evaluate a contractor's management systems against the 32 EVM Guidelines
Synthesize the planning, organization, execution, and follow-up of an integrated baseline review
Identify working relationships of stakeholders
Use EVM techniques and automated tools to analyze information from the Cost Performance Report and critical path scheduling tools to assess and report a contractor's cost and schedule performance
Contractor finance Recognize and analyze financial and business issues
Use the vocabulary and concepts necessary to discuss these issues with the contractor community
Prepare, justify, and defend budget exhibits and obligation/expenditure plans
Formulate impact statements and reports
2. Business Management and Program Control
Knowledge of budget, cost accounting, cost/ schedule management and program terminology, concepts, policies, and principles
develop and defend business aspect of the acquisition cycle
Project Management Possess a basic understanding of project management and related issues
3. Program/Project Management and Control
Critical Tools and Techniques Used in the Technical
Management of Projects

Cost Estim
atingC
ost Risk
Economic &
Supporting AnalysisC
areer Developm
ent Guide
Reference
Know
ledge Managem
entC
ost Estimating
Cost R
iskEconom
ic & Supporting Analysis
Career D
evelopment G
uideR
eferenceK
nowledge M
anagement
2008 NASA Cost Estimating Handbook Appendix D: Technical Competencies for Cost Estimators
Volume 4 Page 4-47
Competency Knowledge/Skills Learning Objective
Tools and Techniques for the Effective Management of Teams and Project Members
Future Trends of Project Management from the Perspective of Both Internal and External Leaders in the Project Management Business and Allied Fields
Best Practices Emerging from NASA Research and Experience Papers
Other Institutional Approaches to Managing Projects and Establishing Critical Networks for Future Success
Systems Management Describe the project system engineering process
Direct the project requirements development process
Manage the system architecture development including concept tradeoffs
Direct integration of system components and verify that requirements have been met
Manage system documentation, data configuration management and flow
4. Science and Engineering
Fundamentals of Orbital and Launch Mechanics
Familiarity with the principles, major tools, and analysis techniques necessary to make the design choices and operational decisions required for overall space flight mission success
Space Mission Analysis and Design
An integrated view of space mission design and operations, from mission objectives and requirements definition, through spacecraft design, development and test, to creating mission operations concepts and ground infrastructure capabilities
Situational Leadership Develop a shared understanding and common vocabulary necessary for effective leadership
Gain insight into effective leadership skills
5. Personal and Professional Effectiveness, Leadership, and Supervisory
Influencing Others Learn to use the Situational Leadership model Guidelines to influence the behavior of others in various situations
Learn to deal more effectively with conflict situations to achieve positive outcomes
Learn to interact effectively in group situations
Learn how to capitalize on the strengths of your communication and behavioral type (Myers-Briggs) in order to interact more effectively with others
Learn how to identify and understand the levels of listening
Learn to use more effective listening techniques
Crossroads Examine the utility and impact of different management styles and practices
Assess your interpersonal and leadership skills through questionnaire feedback from co-workers
Identify specific opportunities for increasing your effectiveness back at work
Evaluate your interest in and desire for supervisory positions
Crossing Department Lines
Understand his/her primary influence style and use alternative methods of influencing others
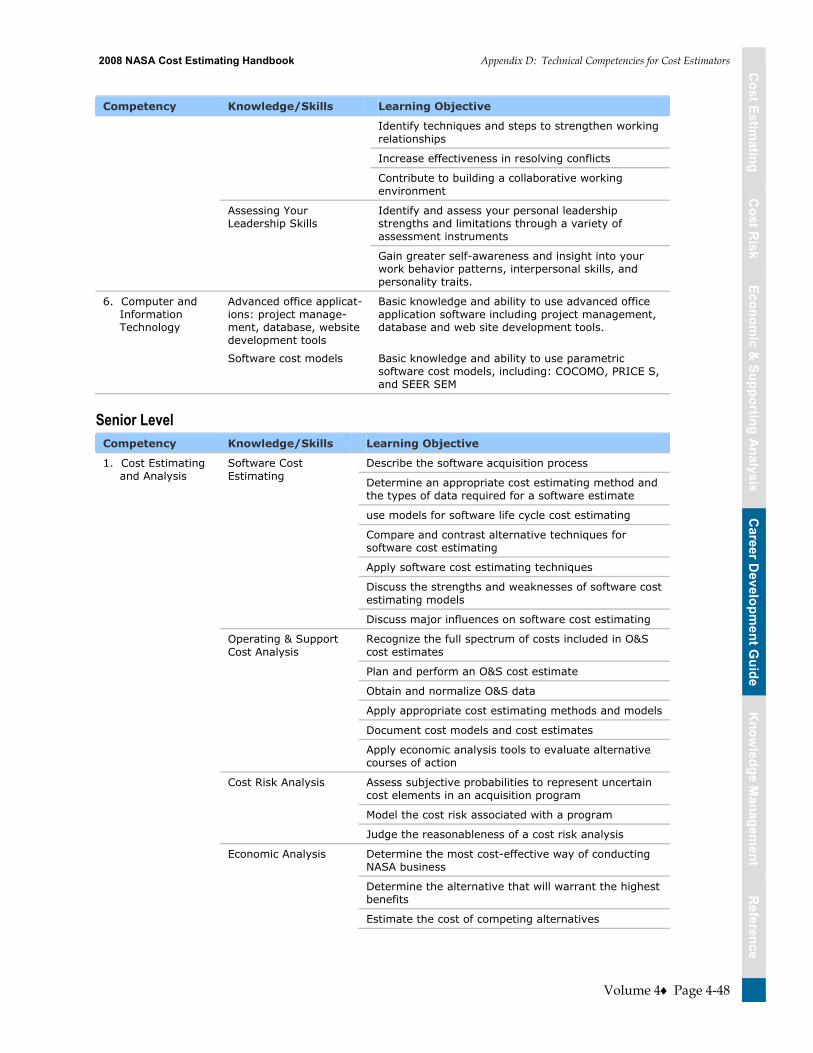
Cost Estim
atingC
ost Risk
Economic &
Supporting AnalysisC
areer Developm
ent Guide
Reference
Know
ledge Managem
entC
ost Estimating
Cost R
iskEconom
ic & Supporting Analysis
Career D
evelopment G
uideR
eferenceK
nowledge M
anagement
2008 NASA Cost Estimating Handbook Appendix D: Technical Competencies for Cost Estimators
Volume 4 Page 4-48
Competency Knowledge/Skills Learning Objective
Identify techniques and steps to strengthen working relationships
Increase effectiveness in resolving conflicts
Contribute to building a collaborative working environment
Assessing Your Leadership Skills
Identify and assess your personal leadership strengths and limitations through a variety of assessment instruments
Gain greater self-awareness and insight into your work behavior patterns, interpersonal skills, and personality traits.
6. Computer and Information Technology
Advanced office applicat-ions: project manage-ment, database, website development tools
Basic knowledge and ability to use advanced office application software including project management, database and web site development tools.
Software cost models Basic knowledge and ability to use parametric software cost models, including: COCOMO, PRICE S, and SEER SEM
Senior Level Competency Knowledge/Skills Learning Objective
Describe the software acquisition process 1. Cost Estimating and Analysis
Software Cost Estimating
Determine an appropriate cost estimating method and the types of data required for a software estimate
use models for software life cycle cost estimating
Compare and contrast alternative techniques for software cost estimating
Apply software cost estimating techniques
Discuss the strengths and weaknesses of software cost estimating models
Discuss major influences on software cost estimating
Operating & Support Cost Analysis
Recognize the full spectrum of costs included in O&S cost estimates
Plan and perform an O&S cost estimate
Obtain and normalize O&S data
Apply appropriate cost estimating methods and models
Document cost models and cost estimates
Apply economic analysis tools to evaluate alternative courses of action
Cost Risk Analysis Assess subjective probabilities to represent uncertain cost elements in an acquisition program
Model the cost risk associated with a program
Judge the reasonableness of a cost risk analysis
Economic Analysis Determine the most cost-effective way of conducting NASA business
Determine the alternative that will warrant the highest benefits
Estimate the cost of competing alternatives

Cost Estim
atingC
ost Risk
Economic &
Supporting AnalysisC
areer Developm
ent Guide
Reference
Know
ledge Managem
entC
ost Estimating
Cost R
iskEconom
ic & Supporting Analysis
Career D
evelopment G
uideR
eferenceK
nowledge M
anagement
2008 NASA Cost Estimating Handbook Appendix D: Technical Competencies for Cost Estimators
Volume 4 Page 4-49
Competency Knowledge/Skills Learning Objective
Assess the uncertainty that may exist, using sensitivity analysis and prior estimates of benefits and cost of competing alternatives
Provide a rationale for conclusions
Explain the tasks and duties of BCEFM functions
Define current BCEFM-related laws, re-calculations, policies and procedures
2. Business Management
Business, Cost Estimating & Financial Management Workshop Evaluate the interrelationships among the BCEFM
functions
Point out the appropriate decision-making information based on the integrated nature of a BCEFM task
Selection and Application of the Appropriate Tools of Life Cycle Management
Tailoring the Project Cycle
3. Program/Project Management and Control
Advanced Project Management
Project Teamwork
Personnel Leadership, Coaching and Mentoring
Project Risk Management
Personal Development
Project Performance Measurement and Assessment
Operating Within NASA Environment
4. Science and Engineering
Human Spaceflight Mission Analysis and Design
An integrated view of crewed space mission design and operations, from mission objectives and requirements definition, through spacecraft design, development and test, to creating mission operations concepts and ground infrastructure capabilities
Space Launch and Transportation Systems
An integrated view of space launch and transportation systems design and operations, from customer needs, objectives and requirements, through launch and transportation system design, development, test and manufacturing to creating operations, concepts and infrastructure capabilities
Challenges Facing the Technical Leader
Identify people skills vs. technical competence in managing technical functions
Understand how to turn the characteristics of technical specialists into positive leadership skills
Apply leadership techniques
5. Personal and Professional Effectiveness, Leadership, and Supervisory
Learn new ways to develop yourself and your subordinates
Communication Skills Why adapting your communication style could prove critical to successful communication
How "packaging" and "positioning" strategies can improve your communication with the next level of management
Common communication missteps to avoid
Feedback techniques that create positive change while leaving others feeling comfortable and confident
How to bring out the best ideas in a team, increase involvement, and move a group quickly toward its objectives
Conflict Management Heighten your understanding of work behavior styles

Cost Estim
atingC
ost Risk
Economic &
Supporting AnalysisC
areer Developm
ent Guide
Reference
Know
ledge Managem
entC
ost Estimating
Cost R
iskEconom
ic & Supporting Analysis
Career D
evelopment G
uideR
eferenceK
nowledge M
anagement
2008 NASA Cost Estimating Handbook Appendix D: Technical Competencies for Cost Estimators
Volume 4 Page 4-50
Competency Knowledge/Skills Learning Objective
Develop a better perception and awareness of yourself and your behavior patterns
Learn about the differences of others and the environment required for maximum productivity and harmony in the work organization
Learn to confront situations with responses which enhance productive growth and development
Identify individualized strategies for coping with performance evaluations, giving and receiving assignments, and conducting team meetings
6. Computer and Information Technology
Life Cycle Cost Models Basic knowledge and ability to use life cycle cost models
Executive Level Competency Knowledge/Skills Learning Objective
Program Management Organizational Relationships
Congressional Level Budgeting Concerns
Leadership
Strategic Planning and Goal Establishment
Advocacy
Relationship with Capitol Hill
Executing the Budget
External Environment
1. Program/Project Management and Control
Working with the Office of Management & Budget
An understanding of an organization model and its component systems
2. Personal and Professional Effectiveness, Leadership, and Supervisory
Management Education Program An understanding of NASA's past, present and future
and how all Centers contribute to the larger NASA goals
An analysis of the participant's own managerial practices with a comparison to practices that are most effective in NASA
Steps that each participant can take to strengthen his or her managerial performance
Simulations of team and organization performance
Presentations and discussions of current theories, concepts and issues conducted by recognized experts in the fields of organizational management and behavior
Discussions with several Associate Administrators or their deputies on current issues facing the Agency
Creating and demonstrating a model of influence
Managing the Influence Process
An analysis of the participant's own influence practices with a comparison to practices that are most effective in NASA
Steps that each participant can take to strengthen their influence behaviors
Simulations of team or organization performance

Cost Estim
atingC
ost Risk
Economic &
Supporting AnalysisC
areer Developm
ent Guide
Reference
Know
ledge Managem
entC
ost Estimating
Cost R
iskEconom
ic & Supporting Analysis
Career D
evelopment G
uideR
eferenceK
nowledge M
anagement
2008 NASA Cost Estimating Handbook Appendix D: Technical Competencies for Cost Estimators
Volume 4 Page 4-51
Competency Knowledge/Skills Learning Objective
Presentations and discussions of current theories, concepts and issues conducted by recognized experts in the fields of organization behavior
An understanding of NASA's past, present and future and how all Centers contribute to the larger NASA goals
Discussions on current issues facing the Agency with several Associate Administrators or their deputies
The Human Element The overarching concepts of Truth and Choice as problem-solving tools for understanding human behavior
The interpersonal behaviors of Inclusion, Control and Openness
The underlying interpersonal feelings of Significance, Competence and Likeability
The behaviors and feeling applied to the self: The Self-Concept and Self-Esteem
Defense Mechanisms
Health and Illness: The Mind-Body Connection
Team Compatibility and Work Relations (This is where work-teams most benefit)
Concordant Decision-Making
Workshop methodologies include lecturettes, self-assessment instruments, Guided imagery, feedback, and non-verbal activities.
Crossing Department Lines
Assess the effects of the participants' style of influence on their relationships with their peers
Identify dynamics of effective team performance
Identify methods for handling conflict and resolving differences among peers who are an integral part of the network of people whose cooperation the participant needs to get his/her job done
Identify the opportunities participants have to increase their effectiveness and improve relationships with their peers.

Cost Estim
atingC
ost Risk
Economic &
Supporting AnalysisC
areer Developm
ent Guide
Reference
Know
ledge Managem
entC
ost Estimating
Cost R
iskEconom
ic & Supporting Analysis
Career D
evelopment G
uideR
eferenceK
nowledge M
anagement
2008 NASA Cost Estimating Handbook Appendix E: Core Curriculum
Volume 4 Page 4-52
Appendix E: Core Curriculum
The NASA cost estimating community has identified a group of recommended training areas in the technical competencies a person in cost estimating should take to perform his/her job competently. The following table lists these areas arrayed by job category and career stage. The courses marked with asterisks represent core courses highly recommended for cost estimators. Courses without asterisks are also recommended and can during later career stages as time allows.
Job Category: Cost Estimating & Analysis Career Stage Course Area
Entry Fundamentals of Cost Estimating and Analysis* Fundamentals of Earned Value Management* Fundamentals of Systems Acquisition Management* Fundamentals of Business Financial Management* Fundamentals of Engineering Economic Analysis* Hardware Cost Models: NAFCOM, Price and SEER* Risk Management* Fundamentals of R&D Schedules Fundamentals of Space Systems Foundations of Project Management NASA Organizations and Functions Time & Stress Management Understanding Space Communication Skills Basic Office Applications Appropriations Law
Journey Professional Cost Estimating Certification Intermediate Cost Estimating and Analysis* Intermediate Earned Value Management* Intermediate Systems Acquisition Management* Cost Risk Analysis* Economic Analysis* Software Cost Estimating* Hardware Cost Model Updates or Refresh: NAFCOM, Price and SEER* Software Cost Models: Price and SEER* Operating and Support Cost Analysis* ACE-IT* Business, Cost Estimating & Financial Management Workshop Federal Budgeting for Non-Budget Personnel Contractor Finance Acquisition Business Management Project Management Systems Management Fundamentals of Orbital and Launch Mechanics Space Mission Analysis and Design Advanced Degree Leadership Skills for Non-Supervisors Teamwork Skills Advanced Office Applications

Cost Estim
atingC
ost Risk
Economic &
Supporting AnalysisC
areer Developm
ent Guide
Reference
Know
ledge Managem
entC
ost Estimating
Cost R
iskEconom
ic & Supporting Analysis
Career D
evelopment G
uideR
eferenceK
nowledge M
anagement
2008 NASA Cost Estimating Handbook Appendix E: Core Curriculum
Volume 4 Page 4-53
Career Stage Course Area
Senior Hardware Cost Model Updates or Refresh: NAFCOM, Price and SEER* Software Cost Model Updates or Refresh: Price and SEER* EVM Training for Managers and Executives Risk Management Refresh* Advanced Project Management Human Spaceflight Mission Analysis and Design Space Launch and Transportation Systems Executive Supervisory Skills Leadership and Supervisory Skills Life Cycle Cost Models Congressional Operations Advanced Degree
Executive Program Management Management Education Program (MEP) Managing the Influence Process (MIP) Crossing Department Lines (CDL) Advanced Degree NASA Executive Fellowship Program

Cost Estim
atingC
ost Risk
Economic &
Supporting AnalysisC
areer Developm
ent Guide
Reference
Know
ledge Managem
entC
ost Estimating
Cost R
iskEconom
ic & Supporting Analysis
Career D
evelopment G
uideR
eferenceK
nowledge M
anagement
2008 NASA Cost Estimating Handbook Appendix F: Training Providers
Volume 4 Page 4-54
Appendix F: Training Providers
The following is a sampling of courses recommended for NASA cost estimators by training providers, identified by career stage, by competency, skill and learning objective:
Entry Level Competency Knowledge/Skill Learning Objectives
1. Cost Estimating and Analysis
Fundamentals of systems acquisition management
Fundamental precepts and bases of systems acquisition management
The diverse, interrelated, and changing nature in the different disciplines of systems acquisition management
The regulations and governing structures of systems acquisition management
Course Listings
Course Name Training Provider Methodology Duration
(hr) Primary Topics Tracking
No.
Fundamentals of Systems Acquisition Management (ACQ 101)
Defense Acquisition University
Distance Learning NA Systems acquisition management
Competency Knowledge/Skill Learning Objectives
1. Cost Estimating and Analysis
Fundamentals of cost analysis
Define cost data and apply appropriate quantitative techniques to estimate costs for major acquisition programs
Explain cost estimating policies Perform a life-cycle cost analysis
Course Listings
Course Name Training Provider Methodology Duration
(hr) Primary Topics Tracking
No.
Fundamentals of Cost Analysis (BCF 101)
Defense Acquisition University
Resident/On-site 80 Cost Analysis
CostProf Society of Cost Estimating and Analysis
Self Paced/ On-site; NASA owns license for training for cost estimators at all Centers
40 Cost Estimating, Cost Analysis, Analytical Methods, Special Cost Methods, Management Applications
Competency Knowledge/Skill Learning Objectives
1. Cost Estimating and Analysis
Fundamentals of earned value management
Describe how EVM is used to plan and integrate cost, schedule, and technical program aspects and assess progress
Correlate contractors' management systems characteristics to the Guidelines in the EVM Systems Industry Standard EIA-748
Recommend alternative EVM applications based on project risks Explain the IBR process Develop EACs based on project cost, schedule and technical data Identify relevant acquisition organizations, key players and formal
agreements
Course Listings
Course Name Training Provider Methodology Duration
(hr) Primary Topics Tracking
No.
Fundamentals of Earned Value Management (BCF 102)
Defense Acquisition University
Distance Learning NA Earned Value Management
CostProf Society of Cost Estimating and Analysis
Self Paced/On-site; NASA owns license for training for cost estimators at all Centers
40 Earned Value Management

Cost Estim
atingC
ost Risk
Economic &
Supporting AnalysisC
areer Developm
ent Guide
Reference
Know
ledge Managem
entC
ost Estimating
Cost R
iskEconom
ic & Supporting Analysis
Career D
evelopment G
uideR
eferenceK
nowledge M
anagement
2008 NASA Cost Estimating Handbook Appendix F: Training Providers
Volume 4 Page 4-55
Competency Knowledge/Skill Learning Objectives
1. Cost Estimating and Analysis
Fundamentals of business financial management
Describe the overall resource allocation process and identify the terminology and concepts used in analyzing the costs of acquisition programs
Explain the appropriations, policies, and practices applicable to developing a program budget
Examine the Planning, Programming and Budgeting System (PPBS) and the impact of programming and budgeting decisions on acquisition programs
Summarize the Congressional enactment process and the impact of Congressional actions of acquisition programs
Identify the processes by which budget authority is apportioned, executed in accordance with public law, and reprogrammed
Course Listings
Course Name Training Provider Methodology Duration
(hr) Primary Topics Tracking
No.
Fundamentals of Business Financial Management (BCF 103)
Defense Acquisition University
Distance Learning NA Business Financial Management
Competency Knowledge/Skill Learning Objectives
2. Business Management
Knowledge of budget, cost accounting, cost/schedule management and program terminology, concepts, policies, and principles
Demonstrate basic knowledge of budget, cost accounting, cost/schedule management and program terminology, concepts and principles
Describe applicable Agency, legislative, administrative, and regulatory requirements
Research questions concerning application of generally accepted budgeting principles
Course Listings
Course Name Training Provider Methodology Duration
(hr) Primary Topics Tracking
No.
Federal Budget Process various Classroom-Based 8 Federal Budget Process
Appropriations Law NASA Stennis Space Center
Classroom-Based 24 Appropriation Law
Appropriations Law NASA HQ (Manage-ment Concepts, Inc.)
Classroom-Based 32 Appropriation Law
Appropriations Law Seminar 5111
Management Concepts, Inc.
Classroom-Based 32 Appropriation Law
Competency Knowledge/Skill Learning Objectives
3. Program/Project Management and Control
Foundations of project management
Basic Project Management Concepts The Life Cycle Management Approach Project Planning Scheduling and Control Basics NASA Program/Project Cost Estimating Techniques NASA Program/Project Budgeting and Interaction with the Federal
Budgeting Process Project Data, Information and Configuration Management
Processes Contract Engineering and the Procurement Process Contract and Project Baseline Management Earned Value Management
Course Listings
Course Name Training Provider Methodology Duration
(hr) Primary Topics Tracking
No.
Foundations of Project Management
NASA Academy of Program and Project Leadership (APPEL)
Classroom-Based 32 Project Management
Art of Project Management
various Classroom-Based 24 Project Management

Cost Estim
atingC
ost Risk
Economic &
Supporting AnalysisC
areer Developm
ent Guide
Reference
Know
ledge Managem
entC
ost Estimating
Cost R
iskEconom
ic & Supporting Analysis
Career D
evelopment G
uideR
eferenceK
nowledge M
anagement
2008 NASA Cost Estimating Handbook Appendix F: Training Providers
Volume 4 Page 4-56
Competency Knowledge/Skill Learning Objectives
4. Science and Engineering
Understanding space Basic knowledge and a “big picture” perspective about space technology, engineering and the business of space.
Course Listings
Course Name Training Provider Methodology Duration
(hr) Primary Topics Tracking
No.
Understanding Space Seminar
Various Classroom-based 16 Space Technology
Competency Knowledge/Skill Learning Objectives
5. Personal and Professional Effectiveness, Leadership, and Supervisory
Time & Stress Management
Basic knowledge of time management to improve performance and reduce stress
Minimize crisis by encouraging proper planning Organize and access critical information associated with your
planning tool Focus on high-leverage activities that will increase return on
investment Create a healthy balance between personal and professional
development Share a common vision and mission that creates unity among
team members
Course Listings
Course Name Training Provider Methodology Duration
(hr) Primary Topics Tracking
No.
Stress Management: A Psychological, Physiological and Practical Overview
Various Classroom-Based 4 Stress management
Time Management Various Classroom-Based 8 Time Management
Competency Knowledge/Skill Learning Objectives
5. Personal and Professional Effectiveness, Leadership, and Supervisory
Communication Skills
Basic knowledge of effective writing skills Basic knowledge of effective speaking and oral
presentation skills
Course Listings
Course Name Training Provider Methodology Duration
(hr) Primary Topics Tracking
No.
Dynamics of Daily Negotiation various Classroom 8 Negotiation skills
Effective Presentation Skills various Classroom 4 Presentation skills Public Speaking as a Two-Way Dialogue
various Classroom 8 Public Speaking
Writing Effective Email various Classroom 16 Writing Writing that Works various Classroom 16.5 Writing
Competency Knowledge/Skill Learning Objectives
6. Computer and Information Technology
Basic office applications: operating system, web browsing, email, word processing, spreadsheet, presentation graphics
Basic knowledge and ability to use personal computer software including operating system, email, web browser, word processing, spreadsheet and presentation applications.
Course Listings
Course Name Training Provider Methodology Duration
(hr) Primary Topics Tracking
No.
Basic Microsoft Outlook various Basic Microsoft Word various
Basic Microsoft Excel various Basic Microsoft PowerPoint various
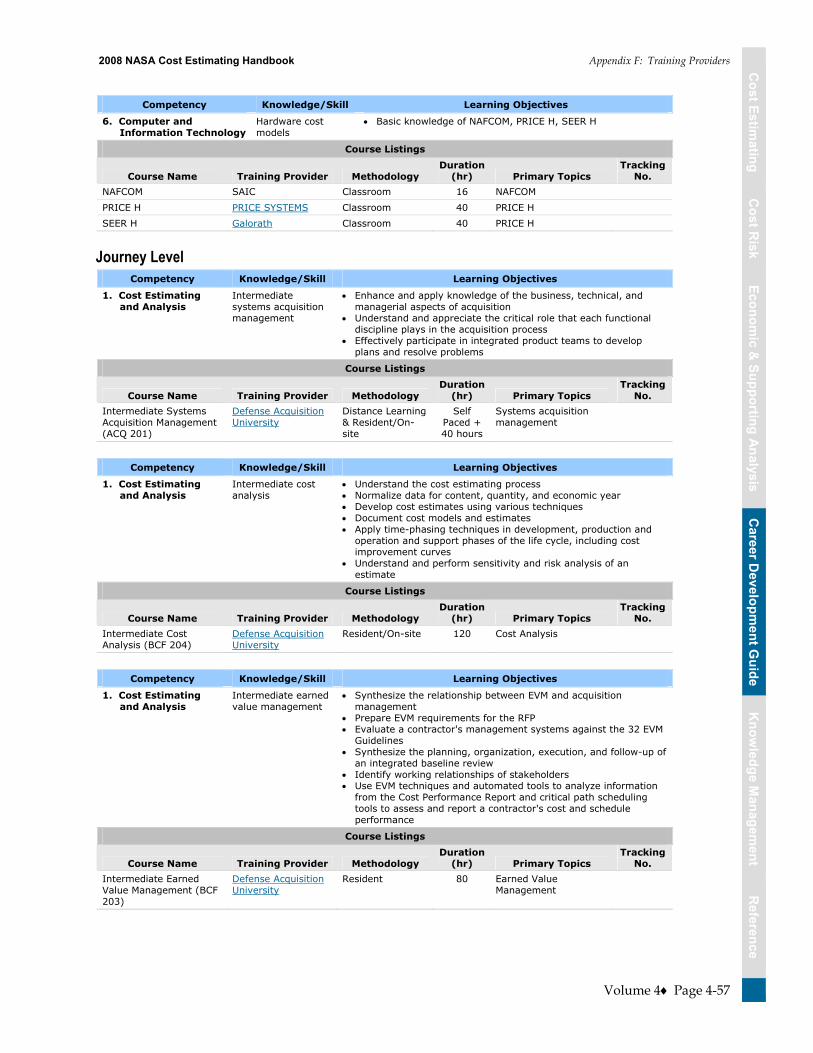
Cost Estim
atingC
ost Risk
Economic &
Supporting AnalysisC
areer Developm
ent Guide
Reference
Know
ledge Managem
entC
ost Estimating
Cost R
iskEconom
ic & Supporting Analysis
Career D
evelopment G
uideR
eferenceK
nowledge M
anagement
2008 NASA Cost Estimating Handbook Appendix F: Training Providers
Volume 4 Page 4-57
Competency Knowledge/Skill Learning Objectives
6. Computer and Information Technology
Hardware cost models
Basic knowledge of NAFCOM, PRICE H, SEER H
Course Listings
Course Name Training Provider Methodology Duration
(hr) Primary Topics Tracking
No.
NAFCOM SAIC Classroom 16 NAFCOM
PRICE H PRICE SYSTEMS Classroom 40 PRICE H SEER H Galorath Classroom 40 PRICE H
Journey Level Competency Knowledge/Skill Learning Objectives
1. Cost Estimating and Analysis
Intermediate systems acquisition management
Enhance and apply knowledge of the business, technical, and managerial aspects of acquisition
Understand and appreciate the critical role that each functional discipline plays in the acquisition process
Effectively participate in integrated product teams to develop plans and resolve problems
Course Listings
Course Name Training Provider Methodology Duration
(hr) Primary Topics Tracking
No.
Intermediate Systems Acquisition Management (ACQ 201)
Defense Acquisition University
Distance Learning & Resident/On-site
Self Paced + 40 hours
Systems acquisition management
Competency Knowledge/Skill Learning Objectives
1. Cost Estimating and Analysis
Intermediate cost analysis
Understand the cost estimating process Normalize data for content, quantity, and economic year Develop cost estimates using various techniques Document cost models and estimates Apply time-phasing techniques in development, production and
operation and support phases of the life cycle, including cost improvement curves
Understand and perform sensitivity and risk analysis of an estimate
Course Listings
Course Name Training Provider Methodology Duration
(hr) Primary Topics Tracking
No.
Intermediate Cost Analysis (BCF 204)
Defense Acquisition University
Resident/On-site 120 Cost Analysis
Competency Knowledge/Skill Learning Objectives
1. Cost Estimating and Analysis
Intermediate earned value management
Synthesize the relationship between EVM and acquisition management
Prepare EVM requirements for the RFP Evaluate a contractor's management systems against the 32 EVM
Guidelines Synthesize the planning, organization, execution, and follow-up of
an integrated baseline review Identify working relationships of stakeholders Use EVM techniques and automated tools to analyze information
from the Cost Performance Report and critical path scheduling tools to assess and report a contractor's cost and schedule performance
Course Listings
Course Name Training Provider Methodology Duration
(hr) Primary Topics Tracking
No.
Intermediate Earned Value Management (BCF 203)
Defense Acquisition University
Resident 80 Earned Value Management

Cost Estim
atingC
ost Risk
Economic &
Supporting AnalysisC
areer Developm
ent Guide
Reference
Know
ledge Managem
entC
ost Estimating
Cost R
iskEconom
ic & Supporting Analysis
Career D
evelopment G
uideR
eferenceK
nowledge M
anagement
2008 NASA Cost Estimating Handbook Appendix F: Training Providers
Volume 4 Page 4-58
Competency Knowledge/Skill Learning Objectives
1. Cost Estimating and Analysis
Contractor finance Recognize and analyze financial and business issues Use the vocabulary and concepts necessary to discuss these
issues with the contractor community
Course Listings
Course Name Training Provider Methodology Duration
(hr) Primary Topics Tracking
No.
Contractor Business Strategies (BCF 205)
Defense Acquisition University
Resident/On-site 40 Contractor finance
Competency Knowledge/Skill Learning Objectives
2. Business Management
Knowledge of budget, cost accounting, cost/schedule management and program terminology, concepts, policies, and principles
Prepare, justify, and defend budget exhibits and obligation/expenditure plans
Formulate impact statements and reports develop and defend business aspect of the
acquisition cycle
Course Listings
Course Name Training Provider Methodology Duration
(hr) Primary Topics Tracking
No.
Acquisition Business Management (BCF 211)
Defense Acquisition University
Hybrid Distance Learning and Resident
40 hr classroom
Acquisition business management
Operating and Support Cost Analysis (BCF 215)
Defense Acquisition University
Resident/On-site 72 Business, Cost Estimating & Financial Management
Competency Knowledge/Skill Learning Objectives
2. Business Management
Business, Cost Estimating & Financial Management
Explain the tasks and duties of BCEFM functions Define current BCEFM-related laws, regulations, policies and
procedures Evaluate the interrelationships among the BCEFM functions Point out the appropriate decision-making information based on
the integrated nature of a BCEFM task
Course Listings
Course Name Training Provider Methodology Duration
(hr) Primary Topics Tracking
No.
Business, Cost Estimating & Financial Management Workshop (BCF 301)
Defense Acquisition University
Resident/ On-site
72 Business, Cost Estimating & Financial Management
Economic Analysis (BCF 207)
Defense Acquisition University
Resident/ On-site
40 Business, Cost Estimating & Financial Management
Principles of Schedule Management (BCF 263)
Defense Acquisition University
Resident/ On-site
24 Business, Cost Estimating & Financial Management
Software Cost Estimating (BCF 208)
Defense Acquisition University
Resident/ On-site
40 Business, Cost Estimating & Financial Management
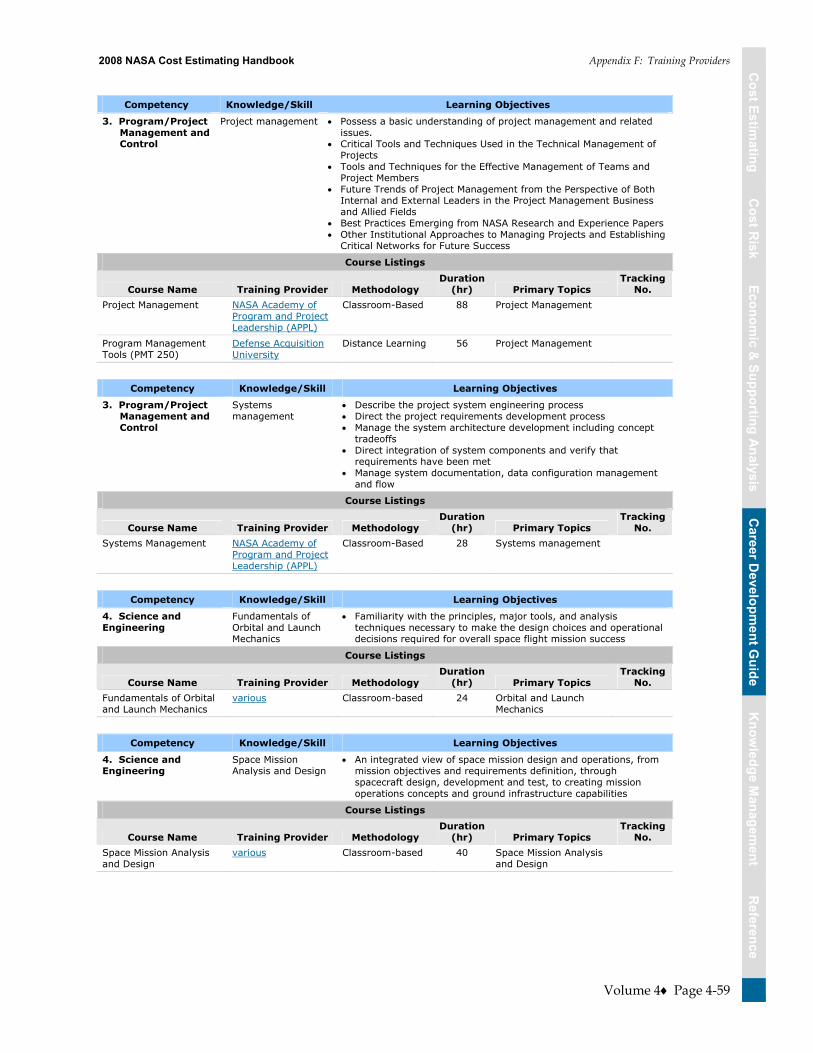
Cost Estim
atingC
ost Risk
Economic &
Supporting AnalysisC
areer Developm
ent Guide
Reference
Know
ledge Managem
entC
ost Estimating
Cost R
iskEconom
ic & Supporting Analysis
Career D
evelopment G
uideR
eferenceK
nowledge M
anagement
2008 NASA Cost Estimating Handbook Appendix F: Training Providers
Volume 4 Page 4-59
Competency Knowledge/Skill Learning Objectives
3. Program/Project Management and Control
Project management Possess a basic understanding of project management and related issues.
Critical Tools and Techniques Used in the Technical Management of Projects
Tools and Techniques for the Effective Management of Teams and Project Members
Future Trends of Project Management from the Perspective of Both Internal and External Leaders in the Project Management Business and Allied Fields
Best Practices Emerging from NASA Research and Experience Papers Other Institutional Approaches to Managing Projects and Establishing
Critical Networks for Future Success
Course Listings
Course Name Training Provider Methodology Duration
(hr) Primary Topics Tracking
No.
Project Management NASA Academy of Program and Project Leadership (APPL)
Classroom-Based 88 Project Management
Program Management Tools (PMT 250)
Defense Acquisition University
Distance Learning 56 Project Management
Competency Knowledge/Skill Learning Objectives
3. Program/Project Management and Control
Systems management
Describe the project system engineering process Direct the project requirements development process Manage the system architecture development including concept
tradeoffs Direct integration of system components and verify that
requirements have been met Manage system documentation, data configuration management
and flow
Course Listings
Course Name Training Provider Methodology Duration
(hr) Primary Topics Tracking
No.
Systems Management NASA Academy of Program and Project Leadership (APPL)
Classroom-Based 28 Systems management
Competency Knowledge/Skill Learning Objectives
4. Science and Engineering
Fundamentals of Orbital and Launch Mechanics
Familiarity with the principles, major tools, and analysis techniques necessary to make the design choices and operational decisions required for overall space flight mission success
Course Listings
Course Name Training Provider Methodology Duration
(hr) Primary Topics Tracking
No.
Fundamentals of Orbital and Launch Mechanics
various Classroom-based 24 Orbital and Launch Mechanics
Competency Knowledge/Skill Learning Objectives
4. Science and Engineering
Space Mission Analysis and Design
An integrated view of space mission design and operations, from mission objectives and requirements definition, through spacecraft design, development and test, to creating mission operations concepts and ground infrastructure capabilities
Course Listings
Course Name Training Provider Methodology Duration
(hr) Primary Topics Tracking
No.
Space Mission Analysis and Design
various Classroom-based 40 Space Mission Analysis and Design

Cost Estim
atingC
ost Risk
Economic &
Supporting AnalysisC
areer Developm
ent Guide
Reference
Know
ledge Managem
entC
ost Estimating
Cost R
iskEconom
ic & Supporting Analysis
Career D
evelopment G
uideR
eferenceK
nowledge M
anagement
2008 NASA Cost Estimating Handbook Appendix F: Training Providers
Volume 4 Page 4-60
Competency Knowledge/Skill Learning Objectives
5. Personal and Professional Effectiveness, Leadership, and Supervisory
Teamwork Skills Develop a shared understanding and common vocabulary necessary for effective leadership
Gain insight into effective leadership skills Identify and assess your personal leadership strengths and
limitations through a variety of assessment instruments Gain greater self-awareness and insight into your work behavior
patterns, interpersonal skills, and personality traits.
Course Listings
Course Name Training Provider Methodology
Duration (hr) Primary Topics
Tracking No.
Situational Leadership various Classroom 4 Situational leadership Assessing Your Leadership Skills various Classroom 16 Leadership assessment
Influencing Others various Classroom 16 Situational leadership Crossroads various Classroom 16 Leadership assessment
Crossing Department Lines various Classroom 16 Collaborative work
Competency Knowledge/Skill Learning Objectives
6. Computer and Information Technology
Advanced office applications: project management, database, website development tools
Basic knowledge and ability to use advanced office application software including project management, database and web site development tools.
Course Listings
Course Name Training Provider Methodology Duration
(hr) Primary Topics Tracking
No.
Microsoft Project various Microsoft Access various Microsoft FrontPage various
Competency Knowledge/Skill Learning Objectives
6. Computer and Information Technology
Software Cost Models
Basic knowledge and ability to use parametric software cost models, including: COCOMO, PRICE S, and SEER SEM
Course Listings
Course Name Training Provider Methodology Duration
(hr) Primary Topics Tracking
No.
COCOMO Various Classroom
PRICE S PRICE Systems Classroom SEER SEM Galorath Classroom
Software Acquisition Management (SAM -101)
Defense Acquisition University
Distance Learning Software Cost Estimating
Senior Level Competency Knowledge/Skill Learning Objectives
1. Cost Estimating and Analysis
Software Cost Estimating
Describe the software acquisition process Determine an appropriate cost estimating method and the types of data
required for a software estimate use models for software life cycle cost estimating Compare and contrast alternative techniques for software cost estimating Apply software cost estimating techniques Discuss the strengths and weaknesses of software cost estimating models Discuss major influences on software cost estimating
Course Listings
Course Name Training Provider Methodology Duration
(hr) Primary Topics Tracking
No.
Advanced Software Acquisition Management (SAM 301)
Defense Acquisition University
Resident/On-site 72 Software Cost Estimating
Intermediate Software Acquisition Management (SAM 201)
Defense Acquisition University
Resident/On-site 40 Software Cost Estimating
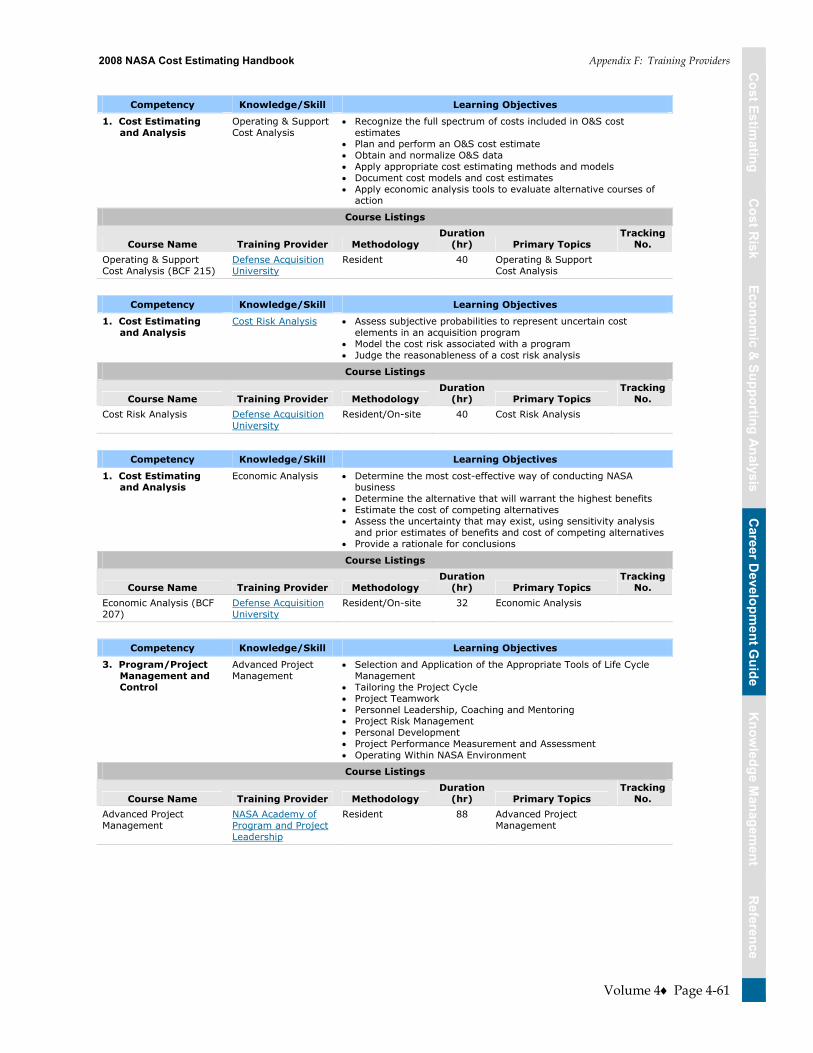
Cost Estim
atingC
ost Risk
Economic &
Supporting AnalysisC
areer Developm
ent Guide
Reference
Know
ledge Managem
entC
ost Estimating
Cost R
iskEconom
ic & Supporting Analysis
Career D
evelopment G
uideR
eferenceK
nowledge M
anagement
2008 NASA Cost Estimating Handbook Appendix F: Training Providers
Volume 4 Page 4-61
Competency Knowledge/Skill Learning Objectives
1. Cost Estimating and Analysis
Operating & Support Cost Analysis
Recognize the full spectrum of costs included in O&S cost estimates
Plan and perform an O&S cost estimate Obtain and normalize O&S data Apply appropriate cost estimating methods and models Document cost models and cost estimates Apply economic analysis tools to evaluate alternative courses of
action
Course Listings
Course Name Training Provider Methodology Duration
(hr) Primary Topics Tracking
No.
Operating & Support Cost Analysis (BCF 215)
Defense Acquisition University
Resident 40 Operating & Support Cost Analysis
Competency Knowledge/Skill Learning Objectives
1. Cost Estimating and Analysis
Cost Risk Analysis Assess subjective probabilities to represent uncertain cost elements in an acquisition program
Model the cost risk associated with a program Judge the reasonableness of a cost risk analysis
Course Listings
Course Name Training Provider Methodology Duration
(hr) Primary Topics Tracking
No.
Cost Risk Analysis Defense Acquisition University
Resident/On-site 40 Cost Risk Analysis
Competency Knowledge/Skill Learning Objectives
1. Cost Estimating and Analysis
Economic Analysis Determine the most cost-effective way of conducting NASA business
Determine the alternative that will warrant the highest benefits Estimate the cost of competing alternatives Assess the uncertainty that may exist, using sensitivity analysis
and prior estimates of benefits and cost of competing alternatives Provide a rationale for conclusions
Course Listings
Course Name Training Provider Methodology Duration
(hr) Primary Topics Tracking
No.
Economic Analysis (BCF 207)
Defense Acquisition University
Resident/On-site 32 Economic Analysis
Competency Knowledge/Skill Learning Objectives
3. Program/Project Management and Control
Advanced Project Management
Selection and Application of the Appropriate Tools of Life Cycle Management
Tailoring the Project Cycle Project Teamwork Personnel Leadership, Coaching and Mentoring Project Risk Management Personal Development Project Performance Measurement and Assessment Operating Within NASA Environment
Course Listings
Course Name Training Provider Methodology Duration
(hr) Primary Topics Tracking
No.
Advanced Project Management
NASA Academy of Program and Project Leadership
Resident 88 Advanced Project Management
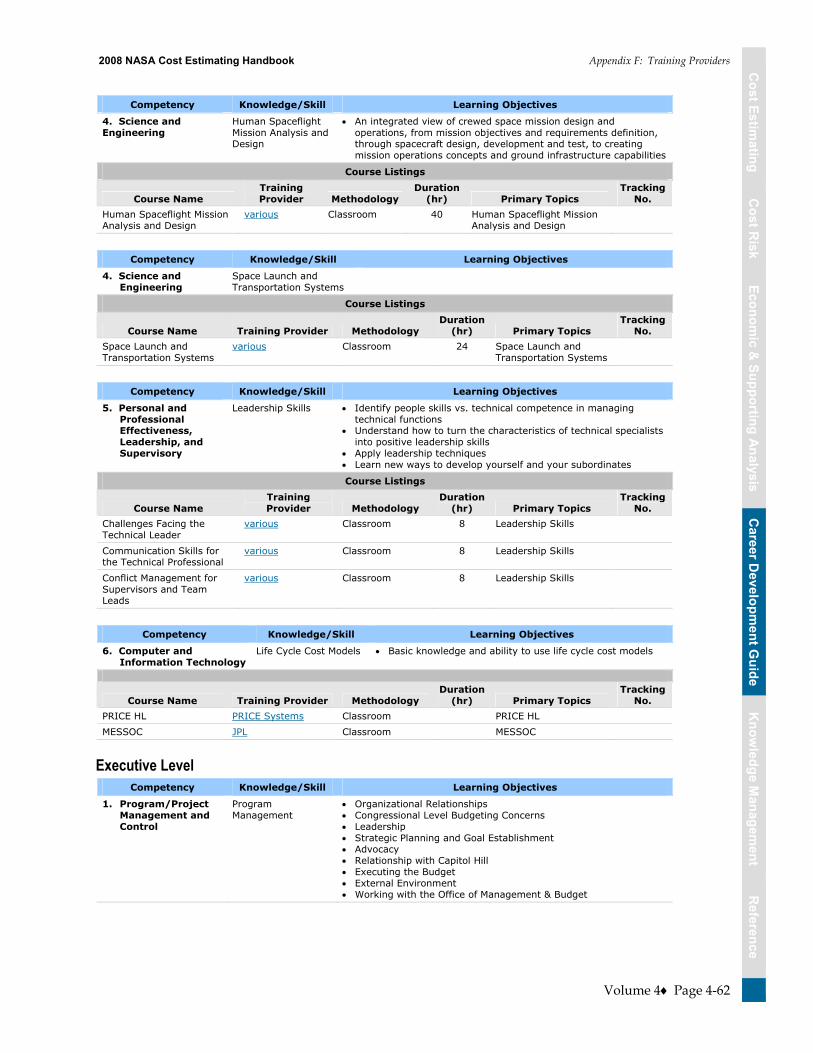
Cost Estim
atingC
ost Risk
Economic &
Supporting AnalysisC
areer Developm
ent Guide
Reference
Know
ledge Managem
entC
ost Estimating
Cost R
iskEconom
ic & Supporting Analysis
Career D
evelopment G
uideR
eferenceK
nowledge M
anagement
2008 NASA Cost Estimating Handbook Appendix F: Training Providers
Volume 4 Page 4-62
Competency Knowledge/Skill Learning Objectives
4. Science and Engineering
Human Spaceflight Mission Analysis and Design
An integrated view of crewed space mission design and operations, from mission objectives and requirements definition, through spacecraft design, development and test, to creating mission operations concepts and ground infrastructure capabilities
Course Listings
Course Name Training Provider Methodology
Duration (hr) Primary Topics
Tracking No.
Human Spaceflight Mission Analysis and Design
various Classroom 40 Human Spaceflight Mission Analysis and Design
Competency Knowledge/Skill Learning Objectives
4. Science and Engineering
Space Launch and Transportation Systems
Course Listings
Course Name Training Provider Methodology Duration
(hr) Primary Topics Tracking
No.
Space Launch and Transportation Systems
various Classroom 24 Space Launch and Transportation Systems
Competency Knowledge/Skill Learning Objectives
5. Personal and Professional Effectiveness, Leadership, and Supervisory
Leadership Skills Identify people skills vs. technical competence in managing technical functions
Understand how to turn the characteristics of technical specialists into positive leadership skills
Apply leadership techniques Learn new ways to develop yourself and your subordinates
Course Listings
Course Name Training Provider Methodology
Duration (hr) Primary Topics
Tracking No.
Challenges Facing the Technical Leader
various Classroom 8 Leadership Skills
Communication Skills for the Technical Professional
various Classroom 8 Leadership Skills
Conflict Management for Supervisors and Team Leads
various Classroom 8 Leadership Skills
Competency Knowledge/Skill Learning Objectives
6. Computer and Information Technology
Life Cycle Cost Models Basic knowledge and ability to use life cycle cost models
Course Name Training Provider Methodology Duration
(hr) Primary Topics Tracking
No.
PRICE HL PRICE Systems Classroom PRICE HL MESSOC JPL Classroom MESSOC
Executive Level Competency Knowledge/Skill Learning Objectives
1. Program/Project Management and Control
Program Management
Organizational Relationships Congressional Level Budgeting Concerns Leadership Strategic Planning and Goal Establishment Advocacy Relationship with Capitol Hill Executing the Budget External Environment Working with the Office of Management & Budget
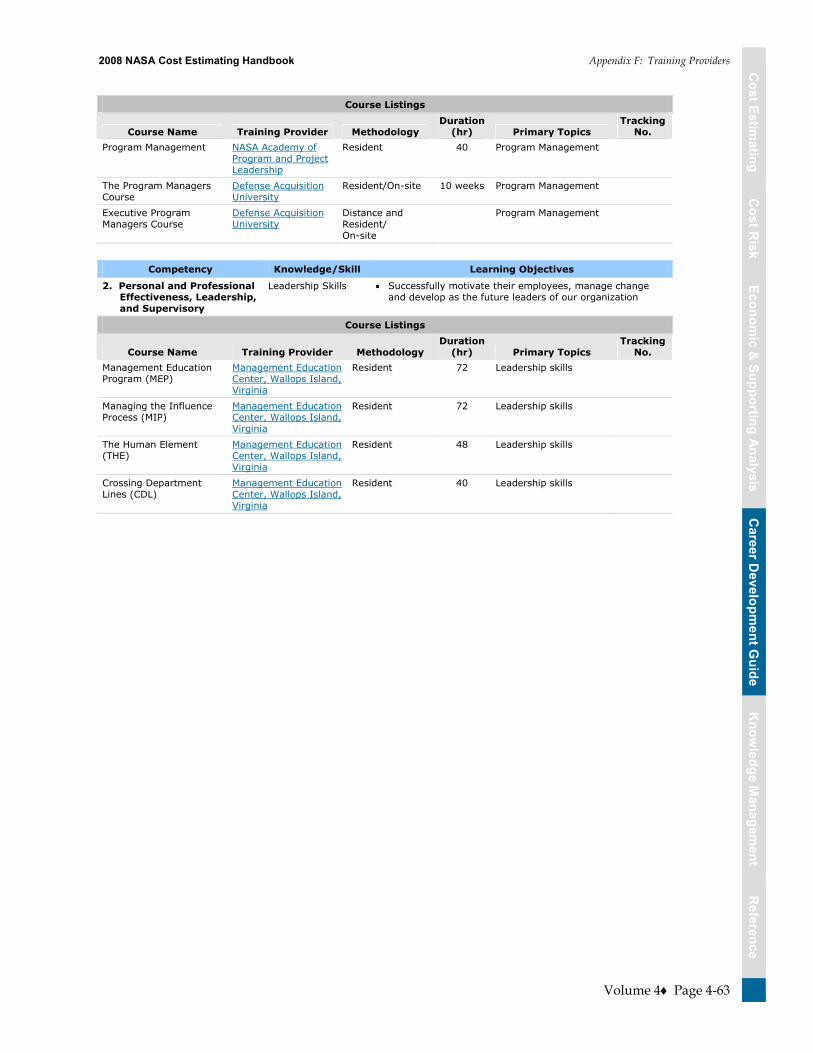
Cost Estim
atingC
ost Risk
Economic &
Supporting AnalysisC
areer Developm
ent Guide
Reference
Know
ledge Managem
entC
ost Estimating
Cost R
iskEconom
ic & Supporting Analysis
Career D
evelopment G
uideR
eferenceK
nowledge M
anagement
2008 NASA Cost Estimating Handbook Appendix F: Training Providers
Volume 4 Page 4-63
Course Listings
Course Name Training Provider Methodology Duration
(hr) Primary Topics Tracking
No.
Program Management NASA Academy of Program and Project Leadership
Resident 40 Program Management
The Program Managers Course
Defense Acquisition University
Resident/On-site 10 weeks Program Management
Executive Program Managers Course
Defense Acquisition University
Distance and Resident/ On-site
Program Management
Competency Knowledge/Skill Learning Objectives
2. Personal and Professional Effectiveness, Leadership, and Supervisory
Leadership Skills Successfully motivate their employees, manage change and develop as the future leaders of our organization
Course Listings
Course Name Training Provider Methodology Duration
(hr) Primary Topics Tracking
No.
Management Education Program (MEP)
Management Education Center, Wallops Island, Virginia
Resident 72 Leadership skills
Managing the Influence Process (MIP)
Management Education Center, Wallops Island, Virginia
Resident 72 Leadership skills
The Human Element (THE)
Management Education Center, Wallops Island, Virginia
Resident 48 Leadership skills
Crossing Department Lines (CDL)
Management Education Center, Wallops Island, Virginia
Resident 40 Leadership skills
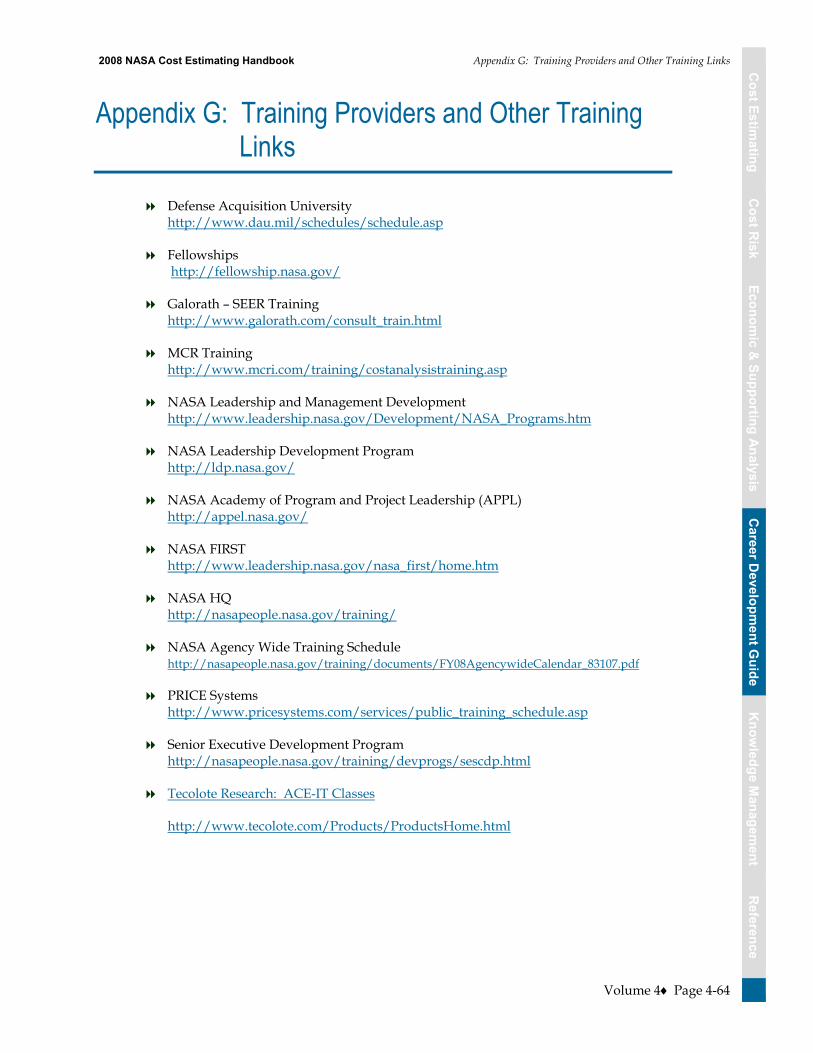
Cost Estim
atingC
ost Risk
Economic &
Supporting AnalysisC
areer Developm
ent Guide
Reference
Know
ledge Managem
entC
ost Estimating
Cost R
iskEconom
ic & Supporting Analysis
Career D
evelopment G
uideR
eferenceK
nowledge M
anagement
2008 NASA Cost Estimating Handbook Appendix G: Training Providers and Other Training Links
Volume 4 Page 4-64
Appendix G: Training Providers and Other Training Links
Defense Acquisition University http://www.dau.mil/schedules/schedule.asp
Fellowships http://fellowship.nasa.gov/
Galorath �– SEER Training http://www.galorath.com/consult_train.html
MCR Training http://www.mcri.com/training/costanalysistraining.asp
NASA Leadership and Management Development http://www.leadership.nasa.gov/Development/NASA_Programs.htm
NASA Leadership Development Program http://ldp.nasa.gov/
NASA Academy of Program and Project Leadership (APPL) http://appel.nasa.gov/
NASA FIRST http://www.leadership.nasa.gov/nasa_first/home.htm
NASA HQ http://nasapeople.nasa.gov/training/
NASA Agency Wide Training Schedule http://nasapeople.nasa.gov/training/documents/FY08AgencywideCalendar_83107.pdf
PRICE Systems http://www.pricesystems.com/services/public_training_schedule.asp
Senior Executive Development Program http://nasapeople.nasa.gov/training/devprogs/sescdp.html
Tecolote Research: ACE-IT Classes
http://www.tecolote.com/Products/ProductsHome.html
Cost Estim
atingC
ost Risk
Economic &
Supporting AnalysisC
areer Developm
ent Guide
Reference
Know
ledge Managem
entC
ost Estimating
Cost R
iskEconom
ic & Supporting Analysis
Career D
evelopment G
uideR
eferenceK
nowledge M
anagement
2008 NASA Cost Estimating Handbook Appendix H: Mentoring and Coaching
Volume 4 Page 4-65
Appendix H: Mentoring and Coaching
Mentoring involves counseling others, through formal or informal methods. A mentor willingly serves as a role model for his/her protégé, sharing organization insights and lessons learned. Mentors provide sound advice on career development goals, strategies, and options.
Mentoring involves guiding and nurturing the growth of others through various stages of their development. Mentoring is a technique with strategies and practices that can be learned. Generally speaking, a mentor is someone of substantial experience, talent or professional standing who nurtures the career of a protégé (e.g., apprentice, intern or understudy). Mentoring can be conducted through a formal program or by an informal understanding between a mentor and protégé. The best mentors combine technical competence, business acumen, relevant experience, the ability to effectively communicate, and most importantly the ability to listen and provide candid and constructive feedback.
A mentor's role includes:
�• Assisting you with recommendations for training and work experience at each career level
�• Working with individuals so that the employee can seek appropriate assignments
�• Acting as a sounding board for career decisions, and providing information about important organizational issues
�• Meeting frequently and regularly with you to review progress.
The key steps in the mentoring process include:
�• Reviewing this Guide �• Generating a personal vision �• Holding career discussions with your supervisor �• Holding career discussions with your mentor(s).
Mentoring may be performed by managers or non-managers, either internal or external to an employee�’s organization. NASA cost estimators are encouraged to seek an appropriate mentor(s). However, whether or not you have a mentor-protégé relationship is entirely up to you. Employees may choose to have more than one mentor. You and your supervisor should discuss the need for a mentor.
Coaching involves clearly communicating performance expectations to peers and employees, and openly sharing information for the benefit of the organization. Coaches also model and communicate the values, behaviors, and work practices expected of the workforce. Like a mentor, coaches provide constructive feedback. Coaching is normally done in the context of a supervisor-employee relationship, and can be a daily activity.
Volume 5 –Knowledge Management
2008 NASA Cost Estimating Handbook

Cost Estim
atingC
ost Risk
Economic &
Supporting AnalysisC
areer Developm
ent Guide
Reference
Know
ledge Managem
entC
ost Estimating
Cost R
iskEconom
ic & Supporting Analysis
Career D
evelopment G
uideR
eferenceK
nowledge M
anagement
2008 NASA Cost Estimating Handbook Contents
Volume 5 Page 5-i
Volume 5 Knowledge Management
Table of Contents
Section 1. Cost Estimating Knowledge Management Dimensions ........................................... 5-1 1.1 Recruitment ........................................................................................................................... 5-2 1.2 Training and Development ................................................................................................. 5-3 1.3 Retention ................................................................................................................................ 5-5 1.4 Outreach................................................................................................................................. 5-6 1.5 Policy ...................................................................................................................................... 5-7
1.5.1 Federal Acquisition Regulation (FAR)................................................................. 5-7 1.5.2 NASA Policy Directive (NPD) 1000.0, Strategic Management and
Governance Handbook.......................................................................................... 5-7 1.5.3 NPD 7120.4, Program/Project Management ...................................................... 5-8 1.5.4 NPR 7123.1, NASA Systems Engineering Processes and Requirements ........ 5-8 1.5.5 NPR 9501.2, NASA Contractor Financial Management Reporting ................. 5-8 1.5.6 NASA Cost Estimating Handbook....................................................................... 5-9
1.6 Career Path/Career Development ..................................................................................... 5-9
Figures
Figure 5-1. Lifecycle Cost Estimating Knowledge Management Dimensions ............................... 5-1

Cost Estim
atingC
ost Risk
Economic &
Supporting AnalysisC
areer Developm
ent Guide
Reference
Know
ledge Managem
entC
ost Estimating
Cost R
iskEconom
ic & Supporting Analysis
Career D
evelopment G
uideR
eferenceK
nowledge M
anagement
2008 NASA Cost Estimating Handbook Section 1. Cost Estimating Knowledge Management Dimensions
Volume 5 Page 5-1
Section 1. Cost Estimating Knowledge Management Dimensions
Knowledge Management (KM), is getting the right information to the right people at the right time, and helping people create knowledge and share and act upon information in ways that will measurably improve the performance of NASA and its partners. For NASA this means delivering the systems and services that will help our employees and partners get the information they need to make better decisions.
NASA faces a wave of retirements in the near future that could lead to a situation referred to as a �“knowledge crisis�” for the cost estimating community.29 To avoid or lessen the impact that may result from a large portion of the workforce retiring, it is important to capture, retain, and transfer skill competency and knowledge via cost estimating knowledge management dimensions. By doing so, a successful knowledge transfer can occur between the current cost estimating community and the next generation of cost estimators at NASA.
Figure 5-1 illustrates the six lifecycle dimensions of cost estimating knowledge management. To maintain a healthy cost estimating community at NASA, each dimension must be successfully understood, integrated, and managed. Integration across all six dimensions encompasses the complete lifecycle of cost estimating knowledge management. Each of the six dimensions outlined in Figure 5-1 below are discussed in detail in the subsections that follow.
Recruitment Training & Development Retention Outreach
• Entry Level• Coops• Fresh outs• Interns• Mid level• Senior Level• Jobs Link Page• Associations w/
Universities• Junior Engineer
Tracks• Design
Competitions• Senior Design
Projects
Cost Estimating Knowledge Management Dimensions
• Cost 101• Cost Risk/Confidence Level• Cost Estimating Handbook
Training• Degree Programs• College Curriculum• Career Development Guide
Update• Symposia• Professional Societies• Professional Certification• Tool Specific Training• PBMA• Cost Section in General
Training
• Career Path• Promotion/
Advancement• Awards• Recognition
• CAD Web Site• Presentations• Road Show• Professional Meetings• CASG• Cost Symposium• Non-Cost Professional
Societies (e.g. AIAA)• Center Newsletters
Policy
• 7120• 7123• FAR• FMM• CEH• National
Policy
Career Path
• Project• Program• Center
(Institutional)
• Mission Directorate• PA&E CAD• IPAO
• Cost Estimating Job Classification
• Rotational Assignments
Figure 5-1. Lifecycle Cost Estimating Knowledge Management Dimensions
29 See Building a Better NASA Workforce: Meeting the Workforce Needs for the National Vision for Space
Exploration (2007).

Cost Estim
atingC
ost Risk
Economic &
Supporting AnalysisC
areer Developm
ent Guide
Reference
Know
ledge Managem
entC
ost Estimating
Cost R
iskEconom
ic & Supporting Analysis
Career D
evelopment G
uideR
eferenceK
nowledge M
anagement
2008 NASA Cost Estimating Handbook Section 1. Cost Estimating Knowledge Management Dimensions
Volume 5 Page 5-2
1.1 Recruitment Recruitment refers to the process of finding the right person for the right job or function and succeeding at getting the person to accept the job or function. Recruitment is more than a management or human resource function. It is a shared responsibility among all NASA cost estimators at every Center and at Headquarters. The title of the book written by Harvey Mackay, sums it up best, �“Dig Your Well, Before You're Thirsty�”. It is imperative that all members of the NASA cost community work to establish and maintain a network of various sources of pre-qualified cost estimators. Relationships with potential cost estimators should be fostered as early as possible. NASA cost estimators are encouraged to actively recruit others via networking. This option allows estimators to spread information by word-of-mouth regarding vacant positions or upcoming vacancies in their networks of friends and associates.
Recruitment can also take place at conferences if cost estimators take time to meet and get to know potential candidates. Finally, cost estimators can make a difference by taking time to gather business cards from and develop relationships with potential employees from their own social networks, as well as professional societies, academic connections, etc. The following list identifies a variety of options that contribute to a healthy recruitment strategy:
Entry level: Develop a proactive approach to hire the following:
�• Cooperative students (co-ops) �• Fresh-outs; recent graduates with pertinent skills from academic institutions �• Interns.
Journey level: Develop a proactive approach to hire journey-level cost estimators. Sources to consider are:
�• Laterals within NASA o Within the cost estimating career field o From other career fields
�• Laterals from outside of NASA o From Department of Defense (DoD) o From industry o From other Government Agencies
�• Other: o DoD and Military Services:
Graduates from the Air Force Institute of Technology (AFIT) Obtain list of AFIT graduates Follow-up to see if graduates have interest in working for NASA after Air Force
commitments are up Graduates from Navy Operations Research Center
Obtain list of graduates Follow-up to see if graduates have interest in working for NASA after Navy
commitments are up Interface with other cost estimators from DoD and Military Services to determine if
the employee has any interest in working for NASA
Cost Estim
atingC
ost Risk
Economic &
Supporting AnalysisC
areer Developm
ent Guide
Reference
Know
ledge Managem
entC
ost Estimating
Cost R
iskEconom
ic & Supporting Analysis
Career D
evelopment G
uideR
eferenceK
nowledge M
anagement
2008 NASA Cost Estimating Handbook Section 1. Cost Estimating Knowledge Management Dimensions
Volume 5 Page 5-3
o Interface with other cost estimators, both government and contractors, through professional societies such as the International Society of Parametric Analysts (ISPA), the Society of Cost Estimating and Analysis (SCEA), the Consortium on Space Technology Estimating Research (CoSTER), etc., to determine if the colleague has any interest in working for NASA
o Target specialized talent outside of NASA Support contractors Commercial/industrial entities that perform cost estimation.
Senior Level: Develop a proactive approach to hire senior level cost estimators. Sources to consider are:
�• Laterals within NASA o Within the cost estimating career field o From other career fields
�• Laterals from outside of NASA o From DoD o From industry o From other Government Agencies
�• Interface with other cost estimators, both government and contractors, through professional societies such as ISPA, SCEA, CoSTER, etc., determine if the colleague has any interest in working for NASA
�• Target specialized talent outside of NASA.
Job Link Page: Create a job page for cost estimators to view vacancies and learn about future employment needs within NASA. Headquarters and Centers are represented and information is kept up to date by the respective focal point.
Association with Universities: Foster and improve associations with relevant universities by attending job fairs, providing literature about career opportunities, etc.
Sponsor Special Events: Special events are a great way to showcase exciting aspects of careers and to draw interest to them. There are several different special events to consider in the cost estimating career field at various career stages as well, such as:
�• Junior Engineer Tracks: currently sponsored as part of the Institute of Electrical and Electronics Engineers (IEEE) Aerospace Conference, but could also be done as part of the NASA Cost Symposium
�• Design competitions
�• Senior design projects.
1.2 Training and Development Training and development is another dimension of the cost estimating knowledge management lifecycle. Training and development opportunities are offered at NASA in order to help employees gain the necessary knowledge and skill to fulfill NASA�’s mission through formal education, training, and on the job developmental experiences. Cost estimators should be given

Cost Estim
atingC
ost Risk
Economic &
Supporting AnalysisC
areer Developm
ent Guide
Reference
Know
ledge Managem
entC
ost Estimating
Cost R
iskEconom
ic & Supporting Analysis
Career D
evelopment G
uideR
eferenceK
nowledge M
anagement
2008 NASA Cost Estimating Handbook Section 1. Cost Estimating Knowledge Management Dimensions
Volume 5 Page 5-4
frequent opportunities to learn and grow in their careers, knowledge, and skills as well as understand how their jobs/performance affects organizations. Without the opportunity to try new opportunities, sit on challenging committees as part of professional organizations, or attend conferences or seminars, cost estimators can stagnate. A career-oriented, valued estimator must experience growth opportunities, therefore, training and development is a shared responsibility among employees, managers, and the organization. The following list identifies a variety of options that contribute to a healthy training and development strategy:
�• Cost Estimating 101: Develop a Cost Estimating 101 Course and put it on the Program Analysis and Evaluation (PA&E) Cost Analysis web page, the Cost Analysis Steering Group (CASG) website, and in SATERN. The course could also be given at the NASA Cost Symposium if attendance warrants it.
�• Develop and conduct a cost risk/confidence level training course: Develop a Cost Risk/ Confidence Level training course and put it on the PA&E Cost Analysis web page, the CASG website, and in SATERN. The course could also be given at the NASA Cost Symposium if attendance warrants it.
�• Develop and conduct a CEH training course: Develop a Cost Estimating Handbook training course and put it on the PA&E Cost Analysis web page, the CASG website, and in SATERN. The course could also be given at the NASA Cost Symposium if attendance warrants it.
�• Degree program: Conduct research to see if there are any degree programs currently offered by colleges or universities in cost estimating; if not; discuss whether it makes sense to hold discussions with colleges or universities to create one. Build strong ties with these institutions to aide them in referring high quality graduates to NASA.
�• College curriculum: Conduct research to see what courses exist that would be applicable for cost estimators. If no courses are available, discuss whether it makes sense to hold discussions with colleges or universities to see if they could create courses that would be beneficial. Build strong ties with these institutions to aide them in referring high quality graduates to NASA.
�• Career Development Guide (CDG) Update: Update and expand on career development information contained in the 2004 Cost Estimating Handbook; Add a career path section to the Cost Estimating Handbook.
�• Symposia: Continue to hold annual cost symposiums for NASA cost estimators and the extended cost community. Cost estimators should attend other conferences or symposiums that can further individual development or that may provide training. Continue to hold CASG meetings as necessary to keep the NASA cost community informed and intact as a community.
�• Professional Societies: Cost estimators should join one of the cost estimating societies referred to in the Guide to stay current in the latest cost estimating trends and methods.
�• Professional Certification: Pursue certification as a cost estimator. See information on this topic in the Guide.

Cost Estim
atingC
ost Risk
Economic &
Supporting AnalysisC
areer Developm
ent Guide
Reference
Know
ledge Managem
entC
ost Estimating
Cost R
iskEconom
ic & Supporting Analysis
Career D
evelopment G
uideR
eferenceK
nowledge M
anagement
2008 NASA Cost Estimating Handbook Section 1. Cost Estimating Knowledge Management Dimensions
Volume 5 Page 5-5
�• Tool Specific Training: Determine your training needs using an IDP (see the IDP example found in Section 10 of the Career Development Volume); take refreshers as needed.
�• Process Based Mission Assurance Secure Work Groups (PBMA) Cost Analysis Steering Group (CASG): This website provides top-level information applicable to cost estimators across NASA. It also provides a multi-dimensional, collaborative functionality to support the CASG community at large. Log-on to the PBMA CASG website to stay current on the NASA cost community.
�• Cost Section in General Training: Insert cost training content into the general training given by NASA and its Centers.
�• Research and Publications: Conduct research, present papers at cost related symposiums and conferences, and submit results to appropriate avenues to get published.
1.3 Retention Employee retention is another dimension of the cost estimating knowledge management lifecycle. Employees must not only be recruited and hired; they must also be retained. In the past, government employees would often spend their entire careers in the government. Today there is a high demand in the public and private sectors for qualified employees in general. It is extremely difficult to find cost estimators, so once cost estimators are hired and trained by NASA, it is important to retain them. Retaining great staff is a key component for the success of the NASA cost estimating career field.
Talented cost estimators who continue to develop skills and increase their value to the cost community are our most important resource; therefore, it is important to develop a strong retention strategy that will entice people to stay. Creating an environment where cost estimators can thrive will help this happen. Retention issues are a shared responsibility among managers and the organization.
The following list identifies a variety of options that contribute to a healthy retention strategy:
�• Career Path: Add information regarding career paths for cost estimators to the Cost Estimating Handbook.
�• Promotion/Advancement: Managers are encouraged to ensure employees are using the IDP in this Guide to help guide cost estimators careers. Managers should be active in ensuring cost estimators are properly trained so promotions are not delayed due to lack of preparation. Mentors and coaches can also assist in guiding employees and increasing their job commitment and satisfaction.
�• Awards & Recognition: Awards and recognition are key elements that motivate personnel and contribute to pride in one�’s work. Good news should be shared by creating an area on the PBMA CASG website to post relevant information regarding awards cost estimators have received. When the situation warrants, good news should be sent to Inside NASA, Center newspapers, Center journals, etc.
Cost Estim
atingC
ost Risk
Economic &
Supporting AnalysisC
areer Developm
ent Guide
Reference
Know
ledge Managem
entC
ost Estimating
Cost R
iskEconom
ic & Supporting Analysis
Career D
evelopment G
uideR
eferenceK
nowledge M
anagement
2008 NASA Cost Estimating Handbook Section 1. Cost Estimating Knowledge Management Dimensions
Volume 5 Page 5-6
The list for recruitment opportunities and venues also points to ongoing community activities that can keep the job experience fresh and interesting.
1.4 Outreach Outreach is the fourth dimension of the cost estimating knowledge management lifecycle. Outreach refers to activities or events that are designed to reach out to other cost estimators. It is an attempt to keep the extended cost estimating community up-to-date on the most recent policy(ies), initiative(s) or other issues facing cost estimators. Outreach is a shared responsibility among employees, managers, and the organization. The following list identifies a variety of options that contribute to a healthy outreach strategy:
�• PBMA CASG Website: Continue to operate the CASG website and utilize it to conduct outreach to the extended NASA cost community. CASG can serve as a powerful tool to communicate and advertise all that is of interest to the cost estimating community across NASA.
�• Presentations and Road Shows: Develop and conduct presentations as a form of outreach, as needed, to NASA Centers. Deliver presentations in a timely fashion once a request is made. Conduct road shows as a form of outreach to NASA Centers, as needed. For example, if new a policy is established that affects cost estimating, a road show may be required to discuss the new policy, its impact on cost estimators, and to listen to feedback from Centers on the new policy.
�• Professional Meetings: Numerous cost estimating related professional organizations exist, as listed in this handbook. Outreach is achieved by participating in professional organizations, through attending meetings, and/or presenting research at professional meetings.
�• CASG/Executive Cost Analysis Steering Group (ECASG) Meetings: Outreach can be accomplished by continuing to hold CASG/ECASG meetings to keep the NASA cost community informed and intact as a community. Historically, CASG has met three times a year and this has been extremely effective in strengthening the NASA cost community.
�• Cost Symposium: Symposiums are an excellent opportunity for outreach. Specifically, the NASA Cost Symposium, serves as an excellent outreach event, allowing cost estimators from all Centers including the extended cost community supporting NASA, to come together to focus on cost estimating and related topics. Other related symposiums are also an excellent avenue for outreach. Attending and speaking at other conferences allows NASA outreach to occur.
�• Research and Publications: Conduct research, present papers at cost related symposiums and conferences, and submit results to appropriate avenues to get published.
�• Non-Cost Professional Societies: Outreach can be conducted by participating in other
professional societies not directly related to cost estimating and attending their conferences. For example, the Institute of Electrical and Electronics Engineers (IEEE), is the world's leading professional association for the advancement of technology. IEEE sponsors
Cost Estim
atingC
ost Risk
Economic &
Supporting AnalysisC
areer Developm
ent Guide
Reference
Know
ledge Managem
entC
ost Estimating
Cost R
iskEconom
ic & Supporting Analysis
Career D
evelopment G
uideR
eferenceK
nowledge M
anagement
2008 NASA Cost Estimating Handbook Section 1. Cost Estimating Knowledge Management Dimensions
Volume 5 Page 5-7
conferences that would be appropriate for cost estimators and also provide a good outreach opportunity.
�• Center Newsletters: Outreach can also be achieved by publishing cost estimating related events in Center newsletters. The more information we can provide to people about cost estimating, the better!
1.5 Policy Policy is the fifth dimension of the cost estimating knowledge management lifecycle. A policy is a deliberate plan of action to guide decisions and achieve rational outcomes. Cost estimating policy refers to the process of making important decisions regarding cost estimating. Policy issues primarily reside at the headquarters level with the Office of Program Analysis and Evaluation (PA&E), in both the Cost Analysis Division and in the Independent Program Assessment Office (IPAO); however, Center feedback can be used to shape policy. The following list identifies a variety of options that contribute to cost estimating and represent policy that makes up one of the dimensions of the cost estimating knowledge management.
1.5.1 Federal Acquisition Regulation (FAR) The FAR is the primary regulation for use by all Federal Executive agencies in their acquisition of supplies and services with appropriated funds. It became effective on April 1, 1984, and is issued within applicable laws under the joint authorities of the Administrator of General Services, the Secretary of Defense, and the Administrator for the NASA, under the broad policy guidelines of the Administrator, Office of Federal Procurement Policy, and Office of Management and Budget.
The FAR precludes agency acquisition regulations that unnecessarily repeat, paraphrase, or otherwise restate the FAR, limits agency acquisition regulations to those necessary to implement FAR policies and procedures within an agency, and provides for coordination, simplicity, and uniformity in the Federal acquisition process. It also provides for agency and public participation in developing the FAR and agency acquisition regulation.
1.5.2 NASA Policy Directive (NPD) 1000.0, Strategic Management and Governance Handbook
The Strategic Management and Governance Handbook (NPD 1000.0) has two primary aims: (1) to set forth the principles by which NASA will strategically manage the Agency and describe the means for doing so; and (2) to identify the specific requirements that drive NASA�’s strategic planning process, leading to products such as the Strategic Plan and the Annual Performance and Accountability Report.
NPD 1000.0 presents an overview of core strategic management requirements and is intended to give a basic understanding of how NASA is managed and what internal and external requirements drive this management strategy. It is composed of six chapters, each of which includes a brief written explanation of its subject, a visual graphic of the identified process, and a table of organizational roles and responsibilities. Related policy documents are cited for further description.

Cost Estim
atingC
ost Risk
Economic &
Supporting AnalysisC
areer Developm
ent Guide
Reference
Know
ledge Managem
entC
ost Estimating
Cost R
iskEconom
ic & Supporting Analysis
Career D
evelopment G
uideR
eferenceK
nowledge M
anagement
2008 NASA Cost Estimating Handbook Section 1. Cost Estimating Knowledge Management Dimensions
Volume 5 Page 5-8
1.5.3 NPD 7120.4, Program/Project Management This NPD describes the management system by which NASA formulates, approves, implements, and evaluates all programs and projects established for safe development and operation of aeronautical and space ground and flight systems and technologies. This management system is intended to be flexible, adaptable, and tailorable to the many types of programs and projects that NASA manages. A more extensive description of the management system requirements is provided in the NASA Procedural Requirements (NPR) 7120.5, Space Flight Program and Project Management Requirements.
1.5.4 NPR 7123.1, NASA Systems Engineering Processes and Requirements
Systems engineering at NASA requires the application of a systematic, disciplined engineering approach that is quantifiable, recursive, iterative, and repeatable for the development, operation, maintenance, and disposal of systems integrated into a whole throughout the life cycle of a project or program. The emphasis of systems engineering is on safely achieving stakeholder functional, physical, and operational performance requirements in the intended use environments over the system�’s planned life within cost and schedule constraints.
The purpose of this NPR is to clearly articulate and establish the requirements on the implementing organization for performing, supporting, and evaluating systems engineering. Systems engineering is a logical systems approach performed by multidisciplinary teams to engineer and integrate NASA�’s systems to ensure NASA products meet customers�’ needs. Implementation of this systems approach will enhance NASA�’s core engineering, management, and scientific capabilities and processes to ensure safety and mission success, increase performance, and reduce cost. This systems approach is applied to all elements of a system and all hierarchical levels of a system over the complete project life cycle.
This NPR establishes a core set of common Agency-level technical processes and requirements needed to define, develop, realize, and integrate the quality of the system products created and acquired by or for NASA. The processes described in this document build upon and apply best practices and lessons learned from NASA, other governmental agencies, and industry to clearly delineate a successful model to complete comprehensive technical work, reduce program and technical risk, and improve mission success. The set of common processes in this NPR may be supplemented and tailored to achieve specific project requirements.
1.5.5 NPR 9501.2, NASA Contractor Financial Management Reporting NPD 9501.1, NASA Contractor Financial Management Reporting System provides instructions to contractors and NASA managers for the Contractor Financial Management Reporting System and stresses the necessity for accurate and timely reporting to enable NASA to fulfill its program control, budgeting, functional management, and cost accounting responsibilities.
This NPR also provides basic requirements and instructions to assist in the preparation of the Contractor Financial Management Reports (NASA Form 533 reports). NASA Form 533 (NF 533) reports provide data necessary for:

Cost Estim
atingC
ost Risk
Economic &
Supporting AnalysisC
areer Developm
ent Guide
Reference
Know
ledge Managem
entC
ost Estimating
Cost R
iskEconom
ic & Supporting Analysis
Career D
evelopment G
uideR
eferenceK
nowledge M
anagement
2008 NASA Cost Estimating Handbook Section 1. Cost Estimating Knowledge Management Dimensions
Volume 5 Page 5-9
a. Projecting costs and hours to ensure that dollar and labor resources realistically support project and program schedules.
b. Evaluating contractors' actual cost and fee data in relation to negotiated contract value, estimated costs, and budget forecast data.
c. Planning, monitoring, and controlling project and program resources.
d. Accruing cost in NASA's accounting system resulting in liabilities reflected on the financial statements and providing program and functional management information. Cost is a financial measurement of resources used in accomplishing a specified purpose, such as performing a service, carrying out an activity, acquiring an asset, or completing a unit of work or project.
NASA is required by law to use accrual accounting, which requires cost to be reported in the period in which benefits are received, without regard to time of payment. To facilitate this process, NASA requires its contractors to report accrued costs on NF 533 reports on cost type, price re-determination, and fixed-price incentive contracts.
1.5.6 NASA Cost Estimating Handbook The NASA Cost Estimating Handbook (CEH), which serves as a reference for Agency cost estimators, was designed to bring the NASA cost estimating community together in a common vision as it begins to receive greater attention within NASA and beyond; this vision includes helping the Agency make critical decisions for mission success while maximizing the benefits from scarce resources. As part of this vision, the NASA cost estimating community has a responsibility to build consistency and credibility in NASA cost estimates.
1.6 Career Path/Career Development Career path is another dimension of the cost estimating knowledge management life cycle. Refer to Section 6 of the Career Development Volume for more detailed information on cost estimating career paths.

Volume 6 –Reference
2008 NASA Cost Estimating Handbook

CO
ST ESTIMA
TING
CO
ST RISK
SUPPO
RTIN
G A
NA
LYSISC
AR
EER D
EVELOPM
ENT G
UID
ER
EFEREN
CES
2008 NASA Cost Estimating Handbook Contents
Volume 6 Page 6-i
Volume 6 Reference
Table of Contents
Section 1. NASA Specific Cost Estimating Resources ................................................................. 6-1 1.1 NASA Policy, Procedures, and Guidelines ....................................................................... 6-1
1.1.1 NASA Policy Directives......................................................................................... 6-1 1.1.2 NASA Procedures and Guidelines....................................................................... 6-1
1.2 NASA HQ Cost Analysis Division (CAD) ........................................................................ 6-2 1.2.1 NASA Cost Analysis Steering Group (CASG) ................................................... 6-3 1.2.2 NASA Cost Data Requirement Descriptions (DRDs)........................................ 6-5 1.2.3 The NASA Cost Analysis Date Requirement (CADRe) .................................... 6-8 1.2.4 One NASA Cost Engineering (ONCE) Database ............................................... 6-9 1.2.5 NASA Inflation Index ............................................................................................ 6-10
1.3 NASA HQ Independent Program Assessment Office (IPAO) ....................................... 6-10 1.3.1 IPAO Cost Estimate Sufficiency Review Checklist ............................................ 6-11 1.3.2 Jump Start Program................................................................................................ 6-14
1.4 NASA Websites..................................................................................................................... 6-15 1.4.1 NASA Cost Estimating Websites.......................................................................... 6-15 1.4.2 NASA Center and Organization Websites.......................................................... 6-16 1.4.3 NASA General Information Websites.................................................................. 6-17 1.4.4 NASA Online Publications.................................................................................... 6-17
1.5 Model Prospectus Overview ............................................................................................... 6-17 1.5.1 Active Models ......................................................................................................... 6-18 1.5.2 Inactive Models....................................................................................................... 6-20
1.6 Technology Readiness Level ............................................................................................... 6-20 1.7 NASA Cost Estimate Briefing Template............................................................................ 6-21 1.8 Sample Customer Feedback Form...................................................................................... 6-22
Section 2. Cost Estimating Resources ............................................................................................. 6-23 2.1 Online Cost Estimating/Analysis Resources.................................................................... 6-23
2.1.1 Other Federal Agency (Non �– NASA) Guidelines and Websites..................... 6-23 2.1.2 Online Research Tools............................................................................................ 6-24 2.1.3 Online Publications ................................................................................................ 6-24 2.1.4 Professional Societies ............................................................................................. 6-25 2.1.5 Colleges and Universities ...................................................................................... 6-25
2.2 Cost Estimating Publications .............................................................................................. 6-26 2.2.1 Books ........................................................................................................................ 6-26 2.2.2 Handbooks and Manuals ...................................................................................... 6-27 2.2.3 Papers and Reports................................................................................................. 6-27
Section 3. Acronyms........................................................................................................................... 6-29
Section 4. Glossary ............................................................................................................................. 6-38
Section 5. Acknowledgements ......................................................................................................... 6-59

CO
ST ESTIMA
TING
CO
ST RISK
SUPPO
RTIN
G A
NA
LYSISC
AR
EER D
EVELOPM
ENT G
UID
ER
EFEREN
CES
2008 NASA Cost Estimating Handbook Contents
Volume 6 Page 6-ii
Figures and Tables
Figure 6-1. IPAO Cost Estimate Sufficiency Report (SR) ................................................................. 6-12 Figure 6-2. Technology Readiness Levels............................................................................................ 6-21 Figure 6-3. Customer Feedback Survey............................................................................................... 6-22 Table 6-1. Roles and Responsibilities ................................................................................................... 6-4 Table 6-2. NASA Standard WBS.......................................................................................................... 6-6 Table 6-3. Cost Models & Tools with Active Data.............................................................................. 6-19 Table 6-4. Cost Models & Tools with Inactive Data........................................................................... 6-20
CO
ST ESTIMA
TING
CO
ST RISK
SUPPO
RTIN
G A
NA
LYSISC
AR
EER D
EVELOPM
ENT G
UID
ER
EFEREN
CES
2008 NASA Cost Estimating Handbook Section 1. NASA Specific Cost Estimating Resources
Volume 6 Page 6-1
Section 1. NASA Specific Cost Estimating Resources
This volume provides a convenient, though not comprehensive, list of references for cost estimating. Some of these references were used in compiling this handbook; others should prove useful to the NASA Cost Estimating Community. This section is organized by resource type (e.g., NASA specific cost estimating resources versus general cost estimating resources) and by topic. In addition to the references listed below, a good locator source is the Library of Congress Online Catalog, which can be found at http://catalog.loc.gov/.
1.1 NASA Policy, Procedures, and Guidelines To find NASA Agencywide directives please reference the NASA Online Directives Information System (NODIS) at http://nodis3.gsfc.nasa.gov/
1.1.1 NASA Policy Directives NPD 1001.0: NASA Strategic Plan
http://nodis.hq.nasa.gov/displayDir.cfm?t=NPD&c=1001&s=0
NPD 1000.0: NASA Strategic Management and Governance Handbook http://nodis.hq.nasa.gov/displayDir.cfm?t=NPD&c=1000&s=0
NPD 1000.3C: The NASA Organization http://nodis3.gsfc.nasa.gov/displayDir.cfm?t=NPD&c=1000&s=3C
NPD 7120.4C: Program/Project Management http://nodis.hq.nasa.gov/displayDir.cfm?t=NPD&c=7120&s=4C
NPD 8700.1C: NASA Policy for Safety and Mission Success http://nodis.hq.nasa.gov/displayDir.cfm?t=NPD&c=8700&s=1C
1.1.2 NASA Procedures and Guidelines NPR 2830.1: NASA Enterprise Architecture Procedures �– APPENDIX E: Approaches
for Conducting Alternatives Analysis http://nodis3.gsfc.nasa.gov/ displayDir.cfm?Internal_ID=N_PR_2830_0001_&page_name=AppendixE
NPR 7120.5: Program and Project Management Processes and Requirements http://nodis3.gsfc.nasa.gov/displayDir.cfm?Internal_ID=N_PR_7120_005D_
NPR 7123.1A: NASA Systems Engineering Processes and Requirements NPR http://nodis.hq.nasa.gov/displayDir.cfm?t=NPR&c=7123&s=1A
NPR 7500.1: NASA Technology Commercialization Process http://nodis3.gsfc.nasa.gov/displayDir.cfm?t=NPR&c=7500&s=1
NPR 8000.4: NASA Risk Management Procedural Requirements http://nodis3.gsfc.nasa.gov/displayDir.cfm?t=NPR&c=8000&s=4
CO
ST ESTIMA
TING
CO
ST RISK
SUPPO
RTIN
G A
NA
LYSISC
AR
EER D
EVELOPM
ENT G
UID
ER
EFEREN
CES
2008 NASA Cost Estimating Handbook Section 1. NASA Specific Cost Estimating Resources
Volume 6 Page 6-2
1.2 NASA HQ Cost Analysis Division (CAD) The Cost Analysis Division (CAD) performs various activities in support of its function as the cost estimating arm of Program Analysis and Evaluation (PA&E). The CAD provides cost estimates and analyses for potential future Agency programs and assesses available cost estimating tools to ensure that the Agency�’s cost estimations are continually improving and increasing in accuracy. The CAD also establishes and maintains cost analysis policy and cost estimating methodologies (with an emphasis on cost risk techniques) for the Agency and communicates these improvements to both internal and external stakeholders. These critical activities support ongoing budget analysis activities and provide leadership, guidance and policy direction for cost estimating and analysis across the Agency.
Specifically, the Cost Analysis Division:
�• Identifies cost methodology and data weaknesses within the NASA community
�• In close coordination with the Independent Program Assessment Organization (IPAO), jointly sponsors, coordinates, and disseminates research on cost and schedule estimating methods, models and data
�• Recommends, coordinates and promulgates cost estimating policies and best practices in the NASA Cost Estimating Handbook
�• Ensures cost estimate policies and best practices are followed by reviewing cost estimates at Key Decision Points
�• Provides Independent Cost Assessments or other ad-hoc cost estimates or analyses for the IPAO upon request
�• Assists PA&E�’s Strategic Investment Division in assessing program and project budget requests for cost and schedule realism
�• Provides cost estimating support to PA&E Studies and Analysis Division
�• Coordinates with other NASA offices to ensure policies and procedures are in place for effective cost management of projects
�• Manages, directs, executes, and facilitates the Cost Analysis Steering Group (CASG) and approves all matters pertaining to the steering group
�• Updates, promotes, and distributes the cost estimating career development guide
�• Maintains the NASA Standard Work Breakdown Structure (WBS)
�• Maintains Cost Analysis Data Requirement (CADRe) templates and reviews CADRe compliance
�• Maintains the One NASA Cost Engineering Database (ONCE) and upgrades as necessary
�• Updates and maintains the NASA New Start Inflation Index
�• Maintains and reviews the NASA Cost Model Prospectus Library
�• Maintains and reviews the NASA Cost Research Prospectus Library
�• Maintains and reviews the NASA Cost Estimating Roadmap http://www.nasa.gov/offices/pae/organization/cost_analysis_division.html

CO
ST ESTIMA
TING
CO
ST RISK
SUPPO
RTIN
G A
NA
LYSISC
AR
EER D
EVELOPM
ENT G
UID
ER
EFEREN
CES
2008 NASA Cost Estimating Handbook Section 1. NASA Specific Cost Estimating Resources
Volume 6 Page 6-3
1.2.1 NASA Cost Analysis Steering Group (CASG) The NASA Cost Analysis Steering Group (CASG) serves as the Agency�’s forum for aerospace cost and risk policies, standards, and activities. Its purpose is to strengthen NASA�’s cost estimating standards and practices by improving tools, processes, and resources. This working group surveys, promotes, and records key innovations and achievements in the cost estimating field such as parametric cost modeling techniques and methodologies; cost, schedule, and risk models and applications; and cost management and policy. It also fosters cooperation and interchange across the Agency cost analysis community and promotes interdisciplinary understanding of costing aerospace systems and their applications to government and commercial endeavors. Its members�—through their craft�—provide Agency decision makers with credible cost and risk information.
Additionally, its mission encompasses the following:
�• Coordinates the joint development of tools, methodologies, data, and training
�• Communicates information about cost related research needed to improve the cost community and resolve challenges in the community
�• Communicates information about new tools and updates to current models being used in the cost estimating community
�• Encourages dialogue about NASA cost estimating and risk analysis policy
�• Promotes professionalism, coordinated positions, and continuous improvement in cost analysis policies, risk analysis, standards, and activities.
Established in the late-1990s, this working group grew out of the Centers�’ need for a common body to resolve aerospace cost analysis issues. At the time, the head of Cost Analysis at the Independent Program Assessment Office (IPAO) led efforts to create the steering group. Initially the steering group focused on resolving immediate issues within the aerospace cost analysis community. Since then, with the creation of the CAD, the role of leading the steering group has shifted from the IPAO to the Director of the CAD. The group�’s roles have evolved to bring about Agency-wide improvements in cost estimating policies, practices, tools, and methodologies, as well as standards and professional development.
The CASG consists of senior representatives from each Center, including the Jet Propulsion Laboratory, and the Headquarters Mission Directorates. These principal members also make up a smaller subset called the Executive-Cost Analysis Steering Group (E-CASG) and are referred to as E-CASG focal points. The E-CASG meets on an as-needed basis at the request of the Director of the CAD, NASA Office of PA&E. The Director of the CAD or a delegate chairs the CASG. Each Center has both a primary and backup member for CASG and E-CASG meetings. The CASG meets three times a year at different NASA locations. Attendance and participation at the CASG meetings is on a voluntary basis.
As shown in Table 6-1, the following members play important roles with specific responsibilities:

CO
ST ESTIMA
TING
CO
ST RISK
SUPPO
RTIN
G A
NA
LYSISC
AR
EER D
EVELOPM
ENT G
UID
ER
EFEREN
CES
2008 NASA Cost Estimating Handbook Section 1. NASA Specific Cost Estimating Resources
Volume 6 Page 6-4
Table 6-1. Roles and Responsibilities
Role Responsibilities
Director of the Cost Analysis Division
Has final approval authority on all matters related to the CASG and E-CASG
Coordinates CASG agendas
CASG Chair Coordinates, schedules, and selects location for CASG and E-CASG meetings
Coordinates agendas with the CAD Director Chairs the meetings and keeps the meetings on track Ensures that action items are taken and posted, distributes action
items, and works to close action items; ensures that appropriate time is on the CASG agenda to brief closed action items and provide status on open action items
Maintains and uploads CASG and E-CASG records in electronic format on the PBMA CASG Web site
Notifies members of meeting notices and agendas, collects presentations prior to meetings, and archives presentations
Maintains the PBMA CASG Web site
E-CASG Members Fund their participation to each CASG and E-CASG meetings Support CASG and E-CASG meetings Provide inputs and presentations to the CASG and E-CASG Facilitate the closure of action items Solicit input from the cost community at their represented Center Communicate CASG and E-CASG meeting outcomes to their
Center’s cost community Periodically assume the responsibility of hosting the CASG meeting
Support Contractors and Federally Funded Research and Development Centers
Attend CASG meetings and participate as advisors when they are directly involved in activities related to meeting agenda topics
Organizational membership in the CASG from across NASA includes the following:
�• PA&E CAD �• PA&E IPAO �• Ames Research Center (ARC) �• Dryden Flight Research Center (DFRC) �• Glenn Research Center (GRC) �• Goddard Space Flight Center (GSFC) �• Jet Propulsion Laboratory (JPL) �• Johnson Space Center (JSC) �• Kennedy Space Center (KSC) �• Langley Research Center (LaRC) �• Marshall Space Flight Center (MSFC)
�• Stennis Space Center (SSC) �• Applied Physics Laboratory (APL) �• Headquarters Aeronautics Research Mission
Directorate (HQ ARMD) �• Headquarters Exploration Systems Mission
Directorate (HQ ESMD) �• Headquarters Science Mission Directorate
(HQ SMD) �• Headquarters Space Operations Mission
Directorate (HQ SOMD)
Support contractors and Federally Funded Research and Development Centers (FFRDCs) in the cost estimating business as NASA deems appropriate according to the agenda topics.
The CAD sponsors the annual NASA Cost Symposium Workshop where NASA cost estimators, including support contractors, present technical briefs on topics such as the status of cost model development, case studies, lessons learned, and other cost analysis research areas. The CAD also
CO
ST ESTIMA
TING
CO
ST RISK
SUPPO
RTIN
G A
NA
LYSISC
AR
EER D
EVELOPM
ENT G
UID
ER
EFEREN
CES
2008 NASA Cost Estimating Handbook Section 1. NASA Specific Cost Estimating Resources
Volume 6 Page 6-5
maintains a Web site with cost estimating information and collaborative functionality to support the CASG community at large. This Web site at https://secureworkgroups.grc.nasa.gov/casg is maintained by the Cost Analysis Division with several Center-level administrators.
1.2.2 NASA Cost Data Requirement Descriptions (DRDs) The NASA Data Requirements Description (DRD) is the equivalent of the Department of Defense (DoD) Contract Data Requirements List (CDRL). NASA typically utilizes a DRD, which is inserted into a request for proposal (RFP), to define the data in a contract that is to be delivered to the Government by the contractor. This data may be in any form specified, such as hard copy, electronic, and electronic mailable. The specific form of delivery to NASA is specified either in the Statement of Work (SOW) and/or in each individual DRD item. The DRD that the cost community is responsible for is the CADRe, which is an integrated DRD that includes the WBS, Cost Input Report, and Cost Estimate Report. The cost community may also have input into the Contract Performance Report and EVM DRDs.
�• Contract Performance Report and EVM DRD examples http://ceh.nasa.gov/downloadfiles/ NASA_CEH_Downloadable_Files.htm#NASA_CEH_Downloadable_Files_2.htm
�• CADRe DRD example http://ceh.nasa.gov/downloadfiles/CADRe.html
�• CADRe information and templates on the Cost Analysis Steering Group �– PBMA Enhanced Security Work Group (requires membership) https://secureworkgroups.grc.nasa.gov/casg?go=z24617
Standard Work Breakdown Structure (WBS)
The NASA Standard WBS for unmanned space systems is provided below. This WBS is now being used in CADRe Part C (Project Life Cycle Cost Estimate). At the time of this handbook�’s publication, a Standard WBS for Manned Space Systems was not available.
Downloadable versions of the Standard WBS are available through the following web sites:
�• Cost Analysis Steering Group �– PBMA Enhanced Security Work Group (requires membership) https://secureworkgroups.grc.nasa.gov/casg?go=178875
�• NASA Cost Estimating Handbook Website http://ceh.nasa.gov/downloadfiles/CADRe.html

CO
ST ESTIMA
TING
CO
ST RISK
SUPPO
RTIN
G A
NA
LYSISC
AR
EER D
EVELOPM
ENT G
UID
ER
EFEREN
CES
2008 NASA Cost Estimating Handbook Section 1. NASA Specific Cost Estimating Resources
Volume 6 Page 6-6
Table 6-2. NASA Standard WBS
1.0 SYSTEM NAME
1.1 Project Management
1.2 Systems Engineering
1.3 Safety and Mission Assurance
1.4 Science/Technology
1.5 Payload(s) 1.5.1 Payload Management 1.5.2 System Engineering 1.5.3 Payload Product Assurance 1.5.4 Instrument n 1.5.4.1 Instrument n Management 1.5.4.2 Instrument n Systems Engineering 1.5.4.3 Instrument n Assurance 1.5.4.4 Antenna 1.5.4.5 Optics 1.5.4.6 Sensors/Detectors 1.5.4.7 Structures & Mechanisms 1.5.4.8 Thermal Control 1.5.4.9 Electronics 1.5.4.10 Power 1.5.4.11 Pointing Subsystem 1.5.4.12 Harness & Cabling 1.5.4.13 C&DH 1.5.4.14 Ground Support Equip 1.5.5 Integration, Assembly Test &
Check out
1.6 Flight System \ Spacecraft 1.6.1 Flight System Project Management 1.6.2 Flight System Systems Engineering 1.6.3 Flight System Product Assurance 1.6.4 Spacecraft 1.6.4.1 Spacecraft Management 1.6.4.2 Spacecraft Systems Engineering 1.6.4.3 Spacecraft Product Assurance 1.6.4.4 Spacecraft Structures & Mechanisms
Total 1.6.4.4.1 Structures/Mech. Management 1.6.4.4.2 Structures/Mech. Systems
Engineering Primary Structures 1.6.4.4.3 Load Carrying Shell/Truss 1.6.4.4.4 Equipment Compartments 1.6.4.4.5 Booms 1.6.4.4.6 Adapters Secondary Structures 1.6.4.4.7 Equipment (Instrument) Mountings 1.6.4.4.8 Ballast Mass Mechanisms 1.6.4.4.9 Positioning 1.6.4.4.10 Deployment and Storage
Equipment 1.6.4.4.11 Docking Mechanisms 1.6.4.4.12 Pyrotechnics 1.6.4.4.13 Structures/Mech. Subsystem I&T 1.6.4.5 Spacecraft Thermal Control 1.6.4.5.1 Thermal Management 1.6.4.5.2 Thermal Systems Engineering
Active Devices 1.6.4.5.3 Cryogenic Devices 1.6.4.5.4 Liquid Loops 1.6.4.5.5 Electric Cooling (Thermoelectric) 1.6.4.5.6 Electric Heaters Thermisters &
Thermostats 1.6.4.5.7 Shutters Passive Devices 1.6.4.5.8 Radiator Panel/Fins 1.6.4.5.9 Coatings 1.6.4.5.10 Heat Pipes 1.6.4.5.11 Insulation 1.6.4.5.12 Conductive Structures 1.6.4.5.13 Heat Activated louvers 1.6.4.5.14 Sun Shields 1.6.4.5.15 Second Surface Mirrors 1.6.4.5.16 Thermal Subsystem I&T 1.6.4.6 Spacecraft Electrical Power &
Distribution 1.6.4.6.1 EPS Management 1.6.4.6.2 EPS Systems Engineering Electrical Power Generation 1.6.4.6.3 Solar Cells 1.6.4.6.4 Nuclear Reactor 1.6.4.6.5 Radioisotope Thermionic Generator 1.6.4.6.6 Chemical (Fuel Cells) 1.6.4.6.7 Aux Power Unit(s) Electrical Power Conditioning 1.6.4.6.8 Power Control Electronics 1.6.4.6.9 Power Conversion Electronics 1.6.4.6.10 Power Dissipation Devices 1.6.4.6.11 Power Distribution Electronics Electrical Power Storage 1.6.4.6.12 Batteries 1.6.4.6.13 Charge Control Electronics 1.6.4.6.14 Harnesses & Cables 1.6.4.6.15 EPS Subsystem I&T 1.6.4.7 Spacecraft GN&C 1.6.4.7.1 GN&C Management 1.6.4.7.2 GN&C Systems Engineering Attitude Determination 1.6.4.7.3 Earth (Horizon) Sensors 1.6.4.7.4 Sun Sensors 1.6.4.7.5 Star Tracker/Sensors 1.6.4.7.6 GPS Receivers 1.6.4.7.7 Imagers 1.6.4.7.8 Magnetometers 1.6.4.7.9 Altimeters 1.6.4.7.10 Inertial Reference Unit 1.6.4.7.11 Rate Gyros 1.6.4.7.12 Accelerometers 1.6.4.7.13 Bearings and Power Transfer
Assembly Attitude Control 1.6.4.7.14 Reaction Wheels 1.6.4.7.15 Momentum Wheels 1.6.4.7.16 Control Moment Gyros 1.6.4.7.17 Energy Storage Devices (Flywheels) 1.6.4.7.18 Magnetic Control Devices 1.6.4.7.19 Spin Control Devices 1.6.4.7.20 Control Electronics 1.6.4.7.21 GN&C Subsystem I&T 1.6.4.8 Spacecraft Propulsion 1.6.4.8.1 Propulsion Management

CO
ST ESTIMA
TING
CO
ST RISK
SUPPO
RTIN
G A
NA
LYSISC
AR
EER D
EVELOPM
ENT G
UID
ER
EFEREN
CES
2008 NASA Cost Estimating Handbook Section 1. NASA Specific Cost Estimating Resources
Volume 6 Page 6-7
1.6.4.8.2 Propulsion Systems Engineering Tanks 1.6.4.8.3 Oxidizer Tanks 1.6.4.8.4 Fuel Tanks 1.6.4.8.5 Propellant Tanks 1.6.4.8.6 Pressurant Tanks 1.6.4.8.7 Plumbing Maneuvering Thrusters 1.6.4.8.8 Bipropellant 1.6.4.8.9 Monopropellant 1.6.4.8.10 Solar Electric 1.6.4.8.11 Ion 1.6.4.8.12 Electrostatic 1.6.4.8.13 Electromagnetodynamic 1.6.4.8.14 Cold Gas Translation Thrusters 1.6.4.8.15 Bipropellant 1.6.4.8.16 Monopropellant 1.6.4.8.17 Solar Electric 1.6.4.8.18 Ion 1.6.4.8.19 Electrostatic 1.6.4.8.20 Electromagnetodynamic 1.6.4.8.21 Cold Gas 1.6.4.8.22 Solid Propellant 1.6.4.8.23 Liquid Propellant 1.6.4.8.24 Propulsion Subsystem I&T 1.6.4.9 Spacecraft Communications 1.6.4.9.1 Telecom Management 1.6.4.9.2 Telecom Systems Engineering Antennas 1.6.4.9.3 Omnidirectional 1.6.4.9.4 Spiral 1.6.4.9.5 Horn 1.6.4.10 Patch 1.6.4.10.1 Parabolic Waveguides/Routers 1.6.4.10.2 Diplexers 1.6.4.10.3 Triplexers 1.6.4.10.4 Multiplexers 1.6.4.10.5 Multicouplers 1.6.4.10.6 Coaxial Switches 1.6.4.10.7 RF Switches 1.6.4.10.8 Filters 1.6.4.10.9 Waveguide Radio Frequency Equipment 1.6.4.10.10 Receivers 1.6.4.10.11 Transmitters 1.6.4.10.12 Transceivers 1.6.4.10.13 Transponders 1.6.4.10.14 Modulators 1.6.4.10.15 Demodulators 1.6.4.10.16 Traveling Wave Tube Assembly
(TWTA) 1.6.4.10.17 Solid State Power Amplifiers 1.6.4.10.18 GPS Receivers 1.6.4.10.19 Downconverters 1.6.4.10.20 Upconverters 1.6.4.10.21 Telecom Subsystem I&T 1.6.4.11 Spacecraft C&DH 1.6.4.11.1 C&DH Management 1.6.4.11.2 C&DH Systems Engineering 1.6.4.11.3 Processors 1.6.4.11.4 Solid State Memory 1.6.4.11.5 Decoders 1.6.4.11.6 Command Units
1.6.4.11.7 Telemetry Units 1.6.4.11.8 Command Sequencers 1.6.4.11.9 Timing Units 1.6.4.11.10 Frequency Generators 1.6.4.11.11 Signal Conditioners 1.6.4.11.12 Data Switches 1.6.4.11.13 COMSEC 1.6.4.11.14 Interface Units 1.6.4.11.15 Tape Recorders 1.6.4.11.16 Disk Recorders 1.6.4.11.17 C&DH Subsystem I&T 1.6.4.12 Spacecraft Software 1.6.4.12.1 Software Management 1.6.4.12.2 Software Systems Engineering 1.6.4.12.3 CSCI Name 1 1.6.4.12.4 CSCI Name 2 1.6.4.12.5 Software Subsystem I&T 1.6.5 Entry/Decent/Lander 1.6.6 Rover 1.6.7 Spacecraft Retirement & Disposal
1.7 Launch Vehicle/Services
1.8 Mission Operations System (MOS) 1.8.1 MOS Management 1.8.2 MOS Systems Engineering 1.8.3 Mission Operations Center 1.8.4 Science/Data Operations Center 1.8.5 Data Distribution & Archival 1.8.6 Communications/Network
Infrastructure 1.8.7 Training
1.9 Ground Data System (GDS) 1.9.1 GDS Management 1.9.2 GDS Systems Engineering 1.9.3 Mission Operations Center 1.9.3.1 Hardware 1.9.3.2 Software 1.9.3.3 Other 1.9.4 Science/Data Operations Center 1.9.4.1 Hardware 1.9.4.2 Software 1.9.4.3 Other 1.9.5 Data Distribution & Archival 1.9.5.1 Hardware 1.9.5.2 Software 1.9.5.3 Other 1.9.6 Ground Stations 1.9.7 Communications/Network
Infrastructure 1.9.7.1 Hardware 1.9.7.2 Software 1.9.7.3 Other 1.9.8 GDS Integration & Test 1.9.8.1 Hardware 1.9.8.2 Software 1.9.8.3 Other 1.10 System Integration, Assembly,
Test & Check Out 1.11 Education & Public Outreach
CO
ST ESTIMA
TING
CO
ST RISK
SUPPO
RTIN
G A
NA
LYSISC
AR
EER D
EVELOPM
ENT G
UID
ER
EFEREN
CES
2008 NASA Cost Estimating Handbook Section 1. NASA Specific Cost Estimating Resources
Volume 6 Page 6-8
1.2.3 The NASA Cost Analysis Date Requirement (CADRe) The CADRe is a NASA requirement mandated by NPR 7120.5. The CADRe documents the programmatic, technical, and life cycle cost information of a project. NPR 7120.5 specifically states that Category I and Category II Flight Systems and Ground Support Projects require the development of a CADRe and will typically require five CADRe submissions across the project life cycle. CADRes are developed following PNAR, PDR, and CDR site reviews, after launch, and during the last year of a project�’s planned life. The NASA Project Manager is responsible for the CADRe and has several options available to develop CADRes. The NASA Project Manager may choose to develop the CADRe within the Project Office with his/her own staff, or he/she may use one of the NASA Headquarters-sponsored support contractors to develop the CADRe. It is recommended that the projects include the CADRe as a DRD on contract(s) in order to ensure the proper data is available to complete the CADRe. Because the CADRe collects Full Cost information, it is likely that the project will have to perform final integration of a contractor prepared CADRe to include all Full Cost information.
The body of the CADRe contains three parts with templates for each:
�• Part A contains general descriptive information about the project
�• Part B contains hardware and software technical parameters necessary to estimate the project's life cycle cost
Part C contains the project's life cycle cost estimate (LCCE). Part C represents the Project's cost estimate and the Project Manager is responsible for collecting the inputs from the various participants including Full Cost elements and submitting an integrated cost estimate
CADRe templates (Parts A, B, and C) and information pertaining to the submission process and guidelines can be referenced at http://ceh.nasa.gov/downloadfiles/CADRe.html
CADRe Review and Submission Process
The CADRe process can vary, but will usually begin with a kickoff meeting between PA&E/CAD, Program Executive, Project Manager, Mission Directorate Cost Focal Point, and IPAO cost analyst(s). This meeting will cover the CADRe requirements and expectations and how the CADRe will be developed.
Support contractors, or Center personnel will develop the CADRe from supplied data. The information will populate the three CADRe sections based on the reference material provided by the Project. Typically, a large portion of Part A is assembled from the review material and various planning documents (Project Plan, Science Management Plan, etc.,) while Part B is completed using the Project�’s Master Equipment List (MEL) and Power Equipment List (PEL). Any additional technical parameters to be included in Part B may be obtained from the review material or other references. Finally, the cost data for Part C is obtained from the Project Business Manager. The structure of this data may vary from project to project, but it should be at a level of detail that allows mapping to the Part C outline found in the CADRe template.
During the process of creating the CADRe document, it is expected that there will be a low level of interaction with the Project Systems Engineer (or similar point of contact) to clarify any issues encountered while creating Parts A, B, and/or C. CADRe Parts A and B will be completed and

CO
ST ESTIMA
TING
CO
ST RISK
SUPPO
RTIN
G A
NA
LYSISC
AR
EER D
EVELOPM
ENT G
UID
ER
EFEREN
CES
2008 NASA Cost Estimating Handbook Section 1. NASA Specific Cost Estimating Resources
Volume 6 Page 6-9
submitted for Draft Review by center management. The CADRe will then be given to the necessary individuals for any independent cost estimation activities. After the milestone review, Parts A and B may need to be updated slightly to reflect the final design presented and Part C can then be completed with the final project costs.
Center and PA&E staff will review the CADRe for compliance with the CADRe templates and make any necessary revisions. The revised CADRe will be submitted to the Project Manager for any necessary revisions and approval. Once the PM provides approval and signs the CADRe, it will be forwarded to the appropriate Mission Directorate contact and will then be forwarded to PA&E/CAD.
Value of CADRe Process to NASA
The NASA financial system does not provide cost information that Project Managers and cost estimators need to develop credible cost estimates. NASA has no database or library that contains current or historical project data. The loss of historical records on projects has contributed to a lack of data needed to build credible cost models and cost estimates. The CADRe consolidates key project data pertaining to technical parameters that drive cost, as well as a project life cycle cost in the project�’s WBS along with a crosswalk to the NASA�’s cost estimating WBS. At its core, it captures and explains reasons for cost and schedule changes since the last CADRe submission. The cost estimates in the CADRe are critical to milestone decisions and determination of project life cycle costs. Furthermore, it provides historical traceability of project changes. The CADRe will be created and stored in the ONCE database, and the resulting database will help alleviate the Agency-wide problem of lack of data. CADRe and ONCE are extremely valuable to NASA because they will serve as a tool to provide data to inform the next generation of Cost Estimators, Project Managers, and other NASA employees. Center personnel can use data residing in the CADRe to update cost models with actuals to better project future costs of similar systems with greater precision.
CADRe Availability
To date, developed CADRes are contained on CDs kept at the NASA Headquarters CAD. In the future, CADRes will be assessable via the ONCE database. Data access will be strictly controlled by the CAD. Various HQ personnel will have access to all CADRe data while other NASA Center personnel will have access to their own pre-launch CADRe data as well as all CADRes after missions have been launched.
1.2.4 One NASA Cost Engineering (ONCE) Database The ONCE database will provide a common database for capturing NASA project cost, technical, and schedule data. Access rights will be granted for NASA users, consistent with access rights established with the CADRe initiative. The ONCE database will automate the manual CADRe process. ONCE is intended to be a web-based database that allows for electronic CADRE development while at the same time, populating the ONCE database. The database will consist of a repository of raw data from which analysts may draw information and perform analyses. The ONCE database will contain the CADRe data as developed and will include source documents. Users will be able to search, view and download the CADRe information either by project name or by one or more WBS elements, along with searchable technical and cost data
CO
ST ESTIMA
TING
CO
ST RISK
SUPPO
RTIN
G A
NA
LYSISC
AR
EER D
EVELOPM
ENT G
UID
ER
EFEREN
CES
2008 NASA Cost Estimating Handbook Section 1. NASA Specific Cost Estimating Resources
Volume 6 Page 6-10
from the CADRe. ONCE will allow concurrent users to access the system over a secure internet connection.
Through CADRe and ONCE, NASA will have access to actual cost data from completed projects and thus this will enable the NASA cost community to help develop lessons learned from the past; allow the agency to understand the underlying causes of cost growth across its projects; form the basis for developing more realistic independent cost estimates, and; strengthen the ability to develop Cost Estimating Relationships (CERs); therefore, assisting in the development of better cost estimates of future similar projects.
1.2.5 NASA Inflation Index The NASA New Start Inflation Index is updated annually and published on the CASG Process Based Mission Assurance (PBMA) website. This index has been created for the purposes of estimating new efforts and for normalizing historical cost from prior missions. The factors contained in this index should not be used to estimate NASA Civil Servant personnel costs or future costs of existing contracts. Defense Contract Audit Agency (DCAA) approved forward pricing indices should be used for all efforts that are already under contract.
Historically, NASA has experienced inflation that has run 1-2% higher than the standard CPI based indices. Therefore, NASA has relied on inflation data and projections that are specifically tied to Aerospace salaries, materials, and other relevant commodities. Due to the proprietary nature of the NASA New Start Inflation Index factors, this information can only be attained on the membership controlled CASG website on the PBMA Enhanced Security Work Group or from a Center�’s Chief Financial Officer�’s (CFO) office.
�• CASG�– PBMA Enhanced Security Work Group (requires membership) https://secureworkgroups.grc.nasa.gov/casg?go=205946
1.3 NASA HQ Independent Program Assessment Office (IPAO) To ensure the highest probability of mission success, the IPAO, within the Office of PA&E, is responsible for enabling the independent review of the maturity, health, and status of the Agency's programs and projects at life cycle milestones. The IPAO ensures the objectivity, quality, integrity, and consistency of the independent review process required by NPR 7120.5 and NPR 7123.1. This independent program and project review process is a collaborative effort among PA&E, the Mission Directorates, the Office of the Chief Engineer, Office of Safety and Mission Assurance, Chief Health and Medical Office (as needed), the independent technical authority community at the NASA Centers, and the NASA Engineering and Safety Center (NESC) support of the Agency's Program Management Councils. The IPAO ensures that the review needs of each of these communities are met while maintaining the integrity and independence of the review process consistent with the Agency's governance model as documented in the NASA Strategic Management and Governance Handbook, NPD 1000.0.
Specifically, the IPAO:
�• Develops and maintains the Agency handbook for the conduct of independent reviews
�• Provides Review Managers for programs, category 1 and 2 projects, and special request reviews as assigned

CO
ST ESTIMA
TING
CO
ST RISK
SUPPO
RTIN
G A
NA
LYSISC
AR
EER D
EVELOPM
ENT G
UID
ER
EFEREN
CES
2008 NASA Cost Estimating Handbook Section 1. NASA Specific Cost Estimating Resources
Volume 6 Page 6-11
�• Develops independent project cost estimates and independent program cost analyses as part of the independent reviews, particularly at the preliminary approval (e.g., pre-non-advocate review) and approval (e.g., non-advocate review) key decision points, and to support congressional reporting requirements for the Agency
�• Provides programmatic assessments of programs and projects, including compliance with NPR 7120.5, as a member of the independent standing review boards (SRBs) and facilitates the reporting of independent review results to all involved parties
�• Procures and distributes Agency licenses and Jump Start programs for industry standard cost models and oversees the incorporation of improvements in collaboration with the PA&E/CAD
�• Provides programmatic assessment tools (e.g., schedule assessment tools) to facilitate the highest quality independent review
�• Develops lessons learned and recommends independent review process improvements for incorporation in Agency policies and guidance
�• Performs other analyses, assessments, and duties as assigned.
1.3.1 IPAO Cost Estimate Sufficiency Review Checklist This checklist (Version 1a) should be used to review project office cost estimate for reasonableness, completeness, consistency, and compliance with generally accepted estimating processes. The end result of the sufficiency review will provide decision makers with an assessment on the quality of the cost estimate. Figure 6-1 contains the sample report and a list of detail questions that will serve as a repository of other questions and �“lessons learned�” matters.

CO
ST ESTIMA
TING
CO
ST RISK
SUPPO
RTIN
G A
NA
LYSISC
AR
EER D
EVELOPM
ENT G
UID
ER
EFEREN
CES
2008 NASA Cost Estimating Handbook Section 1. NASA Specific Cost Estimating Resources
Volume 6 Page 6-12
PART ONE
Project Name:
IPAO Reviewer:
Purpose of the SR: (example) This SR was done in conjunction with the project NAR.
Executive Summary:
1. Cost Readiness Level (CRL) of the cost estimate: 2. Bullet summary of the SR.
PART TWO
Detail report (the level depends on the scope of the cost estimate)
Traceability. Assessment and justification. Reasonableness. Assessment and justification. Soundness. Assessment and justification. Verification. Assessment and justification. Validity. Assessment and justification. Accuracy/Consistency. Assessment and justification. Completeness: Assessment and justification
(This list should be expanded with other questions tailored to your project.)
Risk related questions:
Have costs for discrete, identified risks been captured? How were inputs to cost-risk models (e.g., @Risk) developed? Were engineers consulted in the definition of the level of risks? Was CER, technical and correlation risk captured? Was both probabilistic and discrete risk analysis performed? Were the cost-risk distributions used justifiable? Were provisions for unknown-unknowns made in the estimate? Was schedule risk quantified along with cost-risk? Can the cost-risk analysis answer the questions: How many dollars are included to
cover discrete risks? What are the risky WBS elements? What is the likelihood of an overrun?
Figure 6-1. IPAO Cost Estimate Sufficiency Report (SR)
Standards IPAO looks for:
1. Traceability. Information presented in a traceable fashion containing supporting documentation and technical data. IPAO cost estimator must be able to trace with the given information.
2. Reasonableness. Information presented in a logical manner with appropriate analogies and cost estimating relationships (CERs).
3. Soundness. Information, assumptions, and recommendations presented must be sound arguments. IPAO cost estimator will carefully consider expert judgments or assumptions.
4. Verification. Information presented must be verifiable by the IPAO cost estimator. The IPAO cost estimator will check databases that were used to verify the technical parameters on the cost elements.

CO
ST ESTIMA
TING
CO
ST RISK
SUPPO
RTIN
G A
NA
LYSISC
AR
EER D
EVELOPM
ENT G
UID
ER
EFEREN
CES
2008 NASA Cost Estimating Handbook Section 1. NASA Specific Cost Estimating Resources
Volume 6 Page 6-13
5. Validity. Information presented must be logically correct, justifiable, and well-grounded. The IPAO cost estimator will review the ground rules and assumptions.
6. Accuracy/Consistency. Information presented is well organized, cohesive, supportable, and easily understood.
7. Completeness. Information presented must contain all necessary data, assumptions, and pertinent information.
How IPAO assesses cost estimates:
1. Receive the project cost estimate from the project office. What constitutes �“project cost estimate�”: documentation that contains the numeric tables with all supporting narrative (in soft copy).
2. Check the administrative information. Who prepared the estimate? For what purpose was the project office estimate generated? How much effort (staff months) did it take to do the estimate? What was the cost estimating schedule? Is this estimate a new estimate or an update of a prior estimate? Has anyone else reviewed this estimate or the prior estimate and what were the findings?
3. Review of the cost estimate documentation. This is to verify that in fact there are adequate �“materials�” to conduct the sufficiency review. Is the documentation organized according to the WBS�—if not, a logical manner that will provides structure for the IPAO cost estimator to follow. Are prior costs documented? Are the narratives explaining the estimating methodologies understandable? Are there pertinent historical information and project funding data? Are there supporting data or documentation available for those elements requiring further verification? Are the WBS definitions available? Can the IPAO cost estimator �“replicate�” what was done in the project office estimate�—from the documentation?
4. Assuming a reasonable level of documentation is present, the next step is to conduct the traceability from the final cost estimate �“rolled-up�” number to the appropriate level that show the basis of the estimate. The IPAO cost estimator will select a cost element and �“drill down�” to the basis of the estimate. The drill down process depends on the cost element and how it is �“bucketed�” and �“estimated.�” Generally, the estimator will track the number from one spreadsheet or chart to another and in the process �“decompose�” the summation number until he/she reaches a satisfactory level where the estimate is understood.
a. As a guideline, the IPAO cost estimator will target high cost, high risk, and high interest cost elements. Depending upon the project, this may fall into the 80/20 rule, where 80% of the cost resides in 20% of the cost elements.
b. Which cost elements are �“pass through�” elements? c. Once the cost elements are selected, the IPAO cost estimator will drill down each element
tailored to its component or system.
5. There are many questions an estimator can ask to understand the cost estimate. These are suggested questions to be asked in a drill down exercise�—this is not an inclusive list:
a. Are the costs rational to prior actual costs? b. Are the ground rules and assumptions reasonable? c. Is the learning curve (if applicable) and slopes reasonable?

CO
ST ESTIMA
TING
CO
ST RISK
SUPPO
RTIN
G A
NA
LYSISC
AR
EER D
EVELOPM
ENT G
UID
ER
EFEREN
CES
2008 NASA Cost Estimating Handbook Section 1. NASA Specific Cost Estimating Resources
Volume 6 Page 6-14
d. Were historical data used? e. Were correct inflation rates used? f. Were appropriate methods used? Is the estimate reflecting analogies and databases that
are within realm of reasonableness, such as technology, platforms, etc? g. Are the data points/range used in the cost estimate relevant? h. Are all pertinent costs included? i. Are costs time-phased over the fiscal years? Both inflated and non-inflated dollars? What
is the method of time phasing the point estimate? Is the project schedule consistent with cost estimate schedule used in the phasing?
j. Were analogous direct and overhead rates used? k. Did the estimate capture applicable full cost? l. Is appropriate cost risk analysis performed? Did the estimate capture the risks? m. Did the estimate cover the �“scope�” of the program in review? n. Did the estimate identify which cost elements were estimated and pass-throughs? o. Did the estimate provide a cumulative distribution curve (S-curve)?
6. The IPAO cost estimate will submit an IPAO Sufficiency Review Report (see appendix A). The report will consist of:
a. Executive summary (1-page) which will provide the cost estimate confidence level, via the Cost Readiness Level (CRL) and the rationale accompanying the assessment.
b. Detail report.
1.3.2 Jump Start Program To provide a running start on estimating at any Center by any new/experienced analyst (not just estimators), JUMP START will answer the common predicament faced by a new estimator challenged with a new project. Because of this situation, the estimator may end up asking a familiar question, �“Where do I start?�” Offering an immediate solution to these recurring situations, IPAO has provided the contractual vehicle for parametric model users to help setup the minimum required project-estimating task, allowing one to two days effort of expert help. The end results, in a relatively short time, are the new estimators--walking alone doing their own estimates.
The use of SEER or PRICE products requires the NASA user to setup the SEER or PRICE files by work breakdown structures and meaningful configuration of the estimating task. To facilitate this initial effort, each user requires a minimum effort that must be augmented by SEER or PRICE consultants to establish the first few steps of creating SEER or PRICE files. SEER or PRICE consultants will �“Jump Start�” the estimating and programmatic tasks.
Objective: The objective of JUMP START is to provide minimum technical assistance to NASA cost analysts throughout the Agency in conducting cost estimates and other programmatic tasks using SEER or PRICE products. This is a level of effort (labor-hours only) deliverable. Furthermore, each sub-task cannot be more than $3K each or 24 hours of expert consultation.
Task: The contractor will provide support to the NASA SEER or PRICE Model analyst in creating the cost estimate. The support will be in the form of mentoring the NASA SEER or
CO
ST ESTIMA
TING
CO
ST RISK
SUPPO
RTIN
G A
NA
LYSISC
AR
EER D
EVELOPM
ENT G
UID
ER
EFEREN
CES
2008 NASA Cost Estimating Handbook Section 1. NASA Specific Cost Estimating Resources
Volume 6 Page 6-15
PRICE Model analyst in creating model data files, data collection and evaluation, and model output evaluation.
PRICE Jump Start POC SEER Jump Start POC Rich Greathouse Ron Larson 757-864-9465 757-864-4382 [email protected] [email protected]
1.4 NASA Websites
1.4.1 NASA Cost Estimating Websites Advanced Missions http://cost.jsc.nasa.gov/AMCM.html
Aircraft Turbine Engine http://cost.jsc.nasa.gov/ATECM.html
Airframe http://cost.jsc.nasa.gov/airframe.html
Budget Request http://www.nasa.gov/about/budget/
CPI Inflation Calculator http://cost.jsc.nasa.gov/inflateCPI.html
Cost Spreading Model http://cost.jsc.nasa.gov/beta.html
Cost Analysis Steering Group https://secureworkgroups.grc.nasa.gov/casg
Cost Estimating Acronym Glossary http://cost.jsc.nasa.gov/acronyms.html
Cost Estimating Databases http://cost.jsc.nasa.gov/data.html
Cost Estimating Glossary http://cost.jsc.nasa.gov/glossary.html
Cost Estimating References http://cost.jsc.nasa.gov/references.html
Cost Estimating Resources http://cost.jsc.nasa.gov/resources.html
Employment Cost Index Inflation Calculator http://cost.jsc.nasa.gov/inflation/eci/inflateECI.html
GDP Deflator Inflation Calculator http://cost.jsc.nasa.gov/inflateGDP.html
Inflation Calculator http://cost.jsc.nasa.gov/inflate.html
Import Price Index (MPI) Inflation Calculator http://cost.jsc.nasa.gov/inflation/ipi/inflateIPI.html
JSC Cost estimating http://cost.jsc.nasa.gov/
Learning Curve Calculator http://cost.jsc.nasa.gov/learn.html
Mission Operations http://cost.jsc.nasa.gov/MOCM.html
NASA Congressional Budget and Strategic Plan http://www.nasa.gov/about/budget/index.html
NASA Federal Acquisition Regulation (FAR) Supplement http://www.hq.nasa.gov/office/procurement/regs/nfstoc.htm
NASA Full Cost Initiative Agencywide Implementation Guide http://www.hq.nasa.gov/office/oig/hq/audits/reports/FY99/pdfs/ig-99-024.pdf
NASA Online Cost Models http://cost.jsc.nasa.gov/models.htm
CO
ST ESTIMA
TING
CO
ST RISK
SUPPO
RTIN
G A
NA
LYSISC
AR
EER D
EVELOPM
ENT G
UID
ER
EFEREN
CES
2008 NASA Cost Estimating Handbook Section 1. NASA Specific Cost Estimating Resources
Volume 6 Page 6-16
Producer Price Index Inflation Calculator http://cost.jsc.nasa.gov/inflation/ppi/inflatePPI.html
1.4.2 NASA Center and Organization Websites Aeronautics Research Mission Directorate http://www.aeronautics.nasa.gov/
Ames Research Center http://www.nasa.gov/centers/ames/home/index.html
Chief Financial Officer http://www.nasa.gov/offices/ocfo/home/index.html
Dryden Flight Research Center http://www.nasa.gov/centers/dryden/home/index.html
Exploration Systems Mission Directorate http://exploration.nasa.gov/
External Relations http://www.hq.nasa.gov/office/oer/
Glenn Research Center http://www.nasa.gov/centers/glenn/home/index.html
Goddard Institute for Space Studies http://www.giss.nasa.gov/
Goddard Space Flight Center http://www.nasa.gov/centers/goddard/home/index.html
Human Resources and Education http://www.hq.nasa.gov/office/codef/
Independent Validation and Verification Facility http://www.nasa.gov/centers/ivv/home/index.html
Inspector General http://www.hq.nasa.gov/office/oig/hq/
Jet Propulsion Laboratory http://www.jpl.nasa.gov/
Johnson Space Center http://www.nasa.gov/centers/johnson/home/index.html
Kennedy Space Center http://www.nasa.gov/centers/kennedy/home/index.html
Kennedy Space Center Next Gen Site 3http://science.ksc.nasa.gov/shuttle/nexgen/rlvhp.htm
Langley Research Center http://www.nasa.gov/centers/langley/home/index.html
Legislative Affairs http://legislative.nasa.gov/
Marshall Space Flight Center http://www.nasa.gov/centers/marshall/home/index.html
NASA Advisory Council http://www.hq.nasa.gov/office/oer/nac/
NASA Earth Science Acronyms http://gcmd.gsfc.nasa.gov/Resources/FAQs/acronyms.html
NASA Headquarters http://www.nasa.gov/centers/hq/home/index.html
NASA Headquarters Office of Program Analysis & Evaluation http://www.nasa.gov/offices/pae/home/
NASA Headquarters Cost Analysis Division http://www.nasa.gov/offices/pae/organization/cost_analysis_division.html
NASA Homepage http://www.nasa.gov/
NASA Human Space Flight http://spaceflight.nasa.gov/home/index.html
NASA HQ Office of the Chief Engineer http://oce.nasa.gov/oce/home/index.html

CO
ST ESTIMA
TING
CO
ST RISK
SUPPO
RTIN
G A
NA
LYSISC
AR
EER D
EVELOPM
ENT G
UID
ER
EFEREN
CES
2008 NASA Cost Estimating Handbook Section 1. NASA Specific Cost Estimating Resources
Volume 6 Page 6-17
Media Contancts http://www.nasa.gov/news/media/contacts/
Procurement http://www.hq.nasa.gov/office/procurement/
Safety and Mission Assurance http://www.hq.nasa.gov/office/codeq/
Science@NASA http://science.nasa.gov/default.htm
Science Mission Directorate http://nasascience.nasa.gov/about-us
Small and Disadvantaged Business Utilization http://www.hq.nasa.gov/office/codek/
Space Operations Mission Directorate http://spaceoperations.nasa.gov/aboutus.htm
Stennis Space Center http://www.nasa.gov/centers/stennis/home/index.html
White Sands Test Facility http://www.wstf.nasa.gov/
Wallops Flight Facility http://www.nasa.gov/centers/wallops/home/index.html
1.4.3 NASA General Information Websites NASA Acronym List (GSFC)
http://www.sti.nasa.gov/nasaonly/acronym/main.html
NASA Earth Science Glossary http://gcmd.gsfc.nasa.gov/Aboutus/sitemap.html
NASA Engineering Network (accessible behind NASA firewall only) http://nen. nasa.gov/portal/site/llis/menuitem.0f8027f6c389bc42b649cc1036793ea0/
NASA Glossary of Financial Terms http://cost.jsc.nasa.gov/glossary.html
NASA Lessons Learned Information System http://nen.nasa.gov/portal/site/llis
NASA Spacelink http://spacelink.nasa.gov/
NASA Strategic Management Handbook http://www.hq.nasa.gov/office/codez/strahand/frontpg.htm
NASA Strategic Plan http://www.hq.nasa.gov/office/nsp/
1.4.4 NASA Online Publications The Critical Path Newsletter http://fpd.gsfc.nasa.gov/news.html
NASA Procurement Countdown http://www.hq.nasa.gov/office/procurement/cntdwn.html
NASA Systems Engineering Handbook http://ntrs.nasa.gov/archive/nasa/casi.ntrs.nasa.gov/19960002194_1996102194.pdf
NASA Technical Report Service http://ntrs.nasa.gov/search.jsp
1.5 Model Prospectus Overview This section contains a summary of the prospectus sheets on cost models and tools widely used in the space community (NASA, Air Force, and National Recognizance Organization [NRO]). The summaries are divided between models/tools that are actively used and based on current/updated databases, and those with historical/non-current databases. The cost models/tools are further divided among the following categories:
�• Space flight development cost models
CO
ST ESTIMA
TING
CO
ST RISK
SUPPO
RTIN
G A
NA
LYSISC
AR
EER D
EVELOPM
ENT G
UID
ER
EFEREN
CES
2008 NASA Cost Estimating Handbook Section 1. NASA Specific Cost Estimating Resources
Volume 6 Page 6-18
�• Processing/operations cost models �• Ground development cost models �• Risk tools and calculation tools �• Database tools �• Software development cost models.
The prospectus sheets represent the results of a recent data collection project by NASA across these cost communities and will be updated frequently. Each sheet highlights important model/tool features, such as:
�• Initial release date �• Last model update �• Planned updates �• Model/tool description �• Model/tool usage and applicability �• Strengths of the model/tool �• Limitations of the model/tool �• Data Source(s) for the model/tool.
The prospectus sheets also provide the current Point of Contact (POC) information. The cost model/tool POC can provide additional information and if the model/tool can be shared.
The prospectus sheets are currently available only on the Cost Analysis Steering Group �– PBMA Enhanced Security Work Group. In the future, the sheets will be made available on the Cost Analysis Division (CAD) website.
Cost Analysis Steering Group �– PBMA Enhanced Security Work Group (requires membership) https://secureworkgroups.grc.nasa.gov/casg?go=z22324
The following graphics summarize the Cost Model Prospectus Sheets that are current as of July 11, 2008.
1.5.1 Active Models Table 6-3 summarizes the models and tools that are actively used and are based on current and updated information.

CO
ST ESTIMA
TING
CO
ST RISK
SUPPO
RTIN
G A
NA
LYSISC
AR
EER D
EVELOPM
ENT G
UID
ER
EFEREN
CES
2008 NASA Cost Estimating Handbook Section 1. NASA Specific Cost Estimating Resources
Volume 6 Page 6-19
Table 6-3. Cost Models & Tools with Active Data Cost Methodology Parametric Analogy Build Up Use in Phase Model Type Pre-A A B C/D E
Space Flight Development Cost Models Aerospace Small Satellite Cost Model (SSCM) 1 QuickCost 2 Parametric Mission Cost Model (PMCM) Parametric Cost Model Integrated Cost an schedule Analysis Tool (ICSAT) Focal Plane Array Business as Should Be Cost Model (FPAM) Complexity Based Requirements Systems (CoBRA) Air Force Launch Vehicle Cost Model Advanced Missions Cost Model 3 Advanced Projects Design Team Instrument Cost Model (APDTICM) 4 Unmanned Spacecraft Cost Model (USCM8) 5 Predicting System Test Schedule Predicting Payload Schedules NASA Instrument Cost Model (NICM) Forecasting Technology (4Tek) SEER-H PRICE-H NASA Air Force Cost Model (NAFCOM) Processing / Operations Cost Models
Operations Cost Model (OCM) Model for Estimating Space Station Operations Cost (MESSOC) Space Operations Cost Model (SOCM) Shuttle Transition and Retirement Space Shuttle Program Retirement Model Shuttle Operations Simulation (ShuttOps Sim) Launch and Landing Effects Ground Operations Model (LLEGO) Generic Environment for Modeling Future Launch Operations (GEM-FLO) E20 Supply Chain Sim Ground Development Cost Models Ground Phasing Model D4Cost Method for Predicting Cost of Ground Segments for Space Systems Risk Tools and Calculation Tools Costimator JSC Calculators 6 @Risk Minitab Crystal Ball ACEIT Database Tools Root Cause Analysis Database Redstar Database Software Development Cost Models CoStar 7 COCOMO II 8 PRICE S / True S / True IT SEER-SEM 1 SSCM was last updated in 2005, updates expected in 2007 2 QuickCost was last updated in 2006, future updates expected 3 Advanced Missions Cost Model was last updated in 2004, future updates expected 4 APDTICM is updated yearly, but the database uses instrument data from the 80s through the late 90s 5 USCM8 was last updated in 2001, USCM9 is being updated 6 JSC Calculators are updated periodically 7 CoStar is based on COCOMO CERs, but with expected yearly updates 8 COCOMO II was last updated in 2000, but future calibrations to the model are expected

CO
ST ESTIMA
TING
CO
ST RISK
SUPPO
RTIN
G A
NA
LYSISC
AR
EER D
EVELOPM
ENT G
UID
ER
EFEREN
CES
2008 NASA Cost Estimating Handbook Section 1. NASA Specific Cost Estimating Resources
Volume 6 Page 6-20
1.5.2 Inactive Models Table 6-4 summarizes the models and tools that are based on historical databases and have not been updated.
Table 6-4. Cost Models & Tools with Inactive Data Cost Methodology Parametric Analogy Build Up Use in Phase Model Type Pre-A A B C/D E
Space Flight Development Cost Models Space Transportation Cost Model (TRANSCOST) Solid Rocket Motor Cost Model (Part of Tecolote LVCM) Profile Cluster Tool 1 Process Oriented Production Cost Model Passive Sensor Cost Model HyperCost Fast E EHF / SHF Communications Cost Relationships Study Cost Estimating Relationships for Nuclear Space Power and Propulsion Cost Estimating Relationships for Non Nuclear Power and Dynamic Isotope Systems CERs for Advanced Space Power and Electric Propulsion systems Aerospace Satellite Cost Model Aerospace Launch Vehicle Cost Model Spacecraft Cost Engineering and Estimating Design Optimization (SCEEDOS) Solid Technology Assessment and Cost Evaluation Model (STACEM) Microwave and Digital Cost Analysis (MADCAM) International Space Station Analytical Cost Model (ISSAC) Digital Signal and Data Processor Model
Processing / Operations Cost Models Reliability Maintainability Tool (RMAT) Architecture Assessment Tool-Enhanced (AATe) 2 Mission Operations Cost Model Activity Generator / Estimator (SAGE) 3
1 Profile Cluster Tool was last updated in 2006, no planned updates are expected 2 AATe was last updated in 2003, but no further updates are planned 3 SAGE was last updated in 2004, but no further updates are planned
1.6 Technology Readiness Level NASA uses TRLs to measure the maturity of a technology. The TRL ratings provide a metric for determining risk associated with the insertion of new technology. NPR 7123.1A outlines TRL rating and their associated descriptions (see Figure 6-2). Cost estimators may use TRLs to document the maturation level of technology in the technical baseline of the system and to express the risks associated with WBS elements in the estimate.
�• NPR 7123.1A: NASA Systems Engineering Processes and Requirements http://nodis3.gsfc.nasa.gov/npg_img/N_PR_7123_001A_/N_PR_7123_001A_.pdf
�• Office of Safety and Mission Assurance Technology Readiness Level graphic http://www.hq.nasa.gov/office/codeq/trl/trlchrt.pdf

CO
ST ESTIMA
TING
CO
ST RISK
SUPPO
RTIN
G A
NA
LYSISC
AR
EER D
EVELOPM
ENT G
UID
ER
EFEREN
CES
2008 NASA Cost Estimating Handbook Section 1. NASA Specific Cost Estimating Resources
Volume 6 Page 6-21
Figure 6-2. Technology Readiness Levels
1.7 NASA Cost Estimate Briefing Template This template provides the estimator with a draft outline for a presentation that addresses the major points that should be covered in an estimate briefing. The estimator can use this template to ensure consistency and familiarity when briefing program leadership and NASA Headquarters organizations. The Power Point slides can be customized with program/project specific details and images.
�• Blank: Provides program/project details and images
�• Introduction: Provides background information on the estimate
�• Project description: Provides narrative overview, mission statement, and concept of operations
�• Scope: Communicates the key points and purpose of the estimate
�• Groundrules and assumptions: Communicates the major groundrules and assumption
�• Methodologies: Summarizes the cost estimating methodologies used in the estimate
�• ICE Results and Comparisons: Provides a summary and comparison of various estimates
�• Cumulative Probability Distribution: Provides the S curve of the estimate and displays the cost ranges
�• Summary and recommendations: Outlines context of the estimate, any special circumstances surrounding the estimate, recommendations based on the estimate, and contact information
The Power Point version of the NASA Cost Estimate Briefing Template can be downloaded at: http://ceh.nasa.gov/downloadfiles/NASA_CEH_Downloadable_Files.htm#NASA_CEH_Downloadable_Files_2.htm

CO
ST ESTIMA
TING
CO
ST RISK
SUPPO
RTIN
G A
NA
LYSISC
AR
EER D
EVELOPM
ENT G
UID
ER
EFEREN
CES
2008 NASA Cost Estimating Handbook Section 1. NASA Specific Cost Estimating Resources
Volume 6 Page 6-22
1.8 Sample Customer Feedback Form Customer feedback can be used to capture lessons learned and improve the process and approach to conducting estimates for future efforts. This form is a sample that can be modified for your teams use after each estimate.
COST ANALYSIS OFFICE
CUSTOMER SURVEY Project: Date: The Cost Analysis Office is always looking for ways to improve the quality of its services. Please take a few minutes to answer the following questions based on your expectations of our product. Your comments and suggestions will be used to improve processes and our ability to respond to your future requests for services. Always Never 5 4 3 2 1 1. Did we effectively communicate with the project team to
gain a good understanding of the project?
2. Were any data collection forms and related preparation instructions clear and understandable?
3. Was our final product clear and documented at the level of detail that you required?
4. Did we provide appropriate supporting information to facilitate your understanding of the analysis scope and the methodology used?
5. Were the significant cost drivers clearly explained? 6. Were all your concerns/questions answered in a timely
manner?
7. Please provide us your ideas or suggestions which may help us develop better methods that you think will improve the quality of our response.
8. Is there a service that we currently do not provide that you would find helpful? If yes, please describe and be as specific as possible.
Excellent Poor 5 4 3 2 1 9. How would you rate the overall service provided? Thank you for your comments and suggestions. Please return this form to: Cost Analysis Office
Figure 6-3. Customer Feedback Survey

CO
ST ESTIMA
TING
CO
ST RISK
SUPPO
RTIN
G A
NA
LYSISC
AR
EER D
EVELOPM
ENT G
UID
ER
EFEREN
CES
2008 NASA Cost Estimating Handbook Section 2. Cost Estimating Resources
Volume 6 Page 6-23
Section 2. Cost Estimating Resources
2.1 Online Cost Estimating/Analysis Resources
2.1.1 Other Federal Agency (Non – NASA) Guidelines and Websites To find DoD Issuances please reference the Department of Defense Issuances
homepage at http://www.dtic.mil/whs/directives/index.html
Army Cost & Economic Analysis Center (CEAC) http://www.asafm.army.mil/ceac/ceac.asp
Carnegie Mellon Software Engineering Institute http://www.sei.cmu.edu/
DoD 5000.2-R Mandatory Procedures for Major Defense Acquisition Programs (MDAPS) and Major Automated Information System (MAIS) Acquisition Programs http://www.dtic.mil/whs/directives/corres/pdf/500002p.pdf
DoD 5000.4 Cost Analysis Improvement Group (CAIG) http://www.dtic.mil/whs/directives/corres/pdf/500004p.pdf
DOE Environmental Management (EM) Applied Cost Engineering (ACE) Team http://www.em.doe.gov/Pages/aceteam.aspx
Department of the Treasury http://www.ustreas.gov/
e-Government http://www.whitehouse.gov/omb/egov/
Federal Acquisition Regulation (FAR) http://www.arnet.gov/far/
General Accounting Office (GAO) http://www.gao.gov/
The Federal Activities Inventory Reform Act (FAIR), P.L. 105-270 http://www.whitehouse.gov/omb/procurement/fair-index.html
Military Handbook 881 for WBS http://www.acq.osd.mil/pm/currentpolicy/wbs/MIL_HDBK-881A/MILHDBK881A/WebHelp3/MILHDBK881A.htm
Office of Management and Budget (OMB) Circular No. A-11 Preparing and Submitting Budget Estimates http://www.whitehouse.gov/omb/circulars/a11/02toc.html
Office of Management and Budget (OMB) Circular No. A-76 Performance of Commercial Activities http://www.whitehouse.gov/omb/circulars/a076/a076.html
Office of Management and Budget (OMB) Circular No. A-76 Performance of Commercial Activities Revised Supplemental Handbook http://www.whitehouse.gov/omb/circulars/a076/a076s.html
Office of Management and Budget (OMB) Circular No. A-94 Guidelines and Discount Rates for Benefit-Cost Analysis of Federal Programs http://www.whitehouse.gov/omb/circulars/a094/a094.html
Office of Personnel Management Salary Tables http://www.opm.gov/oca/payrates/

CO
ST ESTIMA
TING
CO
ST RISK
SUPPO
RTIN
G A
NA
LYSISC
AR
EER D
EVELOPM
ENT G
UID
ER
EFEREN
CES
2008 NASA Cost Estimating Handbook Section 2. Cost Estimating Resources
Volume 6 Page 6-24
Title 10 United States Code Section 2306a (10 USC 2306a) Cost or Pricing Data: Truth in Negotiations http://www4.law.cornell.edu/uscode/10/2306a.html
Naval Sea Systems Command (NAVSEA) Cost Engineering and Industrial Analysis http://www.navsea.navy.mil/
Office of Management and Budget (OMB) http://www.whitehouse.gov/omb/
Office of the Under Secretary of Defense for Acquisition, Technology, and Logistics www.acq.osd.mil/
United States Government Standard General Ledger (USSGL) http://www.fms.treas.gov/ussgl/index.html
2.1.2 Online Research Tools DoD Dictionary http://www.dtic.mil/doctrine/jel/doddict/
Project Management Glossary http://www.maxwideman.com/pmglossary/index.htm
WorldWideWeb Acronym and Abbreviation Server http://silmaril.ie/cgi-bin/uncgi/acronyms
2.1.3 Online Publications Cost Analysis Improvement Group (CAIG) Operating and Support Cost Estimating
Guide 4http://www.dtic.mil/pae/
Contract Pricing Reference Guides http://www.acq.osd.mil/dpap/cpf/contract_pricing_reference_guides.html
Controller Magazine (Business Finance) http://www.businessfinancemag.com/
Department of the Army Cost Analysis Manual http://www.asafm.army.mil/pubs/cdfs/cam/CAM.pdf
Department of the Army Economic Analysis Manual http://www.asafm.army.mil/pubs/cdfs/manual/economic.pdf
Department of Defense Operating and Support Cost Estimating Guide http://www.ncca.navy.mil/resources/caig_os_guide.pdf
Department of Defense Primer on Cost Analysis Requirements Description (CARD) https://acc.dau.mil/CommunityBrowser.aspx?id=30382&lang=en-US
Department of Energy (DOE) Office of Science Article on Learning Curves http://www.sc.doe.gov/sc-80/sc-82/430-1/430-1-chp21.pdf
Federal Employee's News Digest http://www.federaldaily.com/
GAO Defense Acquisition: Historical Insights Into Navy Ship Leasing http://www.gao.gov/archive/1999/ns99141t.pdf
Government Executive http://www.govexec.com/
NASA Watch http://www.nasawatch.com/
The President�’s Management Agenda http://www.whitehouse.gov/omb/budintegration/pma_index.html
RAND Reports http://www.rand.org/search/pubs_search.html
CO
ST ESTIMA
TING
CO
ST RISK
SUPPO
RTIN
G A
NA
LYSISC
AR
EER D
EVELOPM
ENT G
UID
ER
EFEREN
CES
2008 NASA Cost Estimating Handbook Section 2. Cost Estimating Resources
Volume 6 Page 6-25
Software Size Measurement: A Framework for Counting Source Statements (by Robert E. Park) http://www.sei.cmu.edu/pub/documents/92.reports/pdf/tr20.92.pdf
2.1.4 Professional Societies American Institute of Aeronautics and Astronautics (AIAA) http://www.aiaa.org
American National Standards Institute (ANSI) http://www.ansi.org/
American Society of Professional Estimators (ASPE) http://www.aspenational.com/
Association for the Advancement of Computing in Education http://www.aace.org/
The Association for the Advancement of Cost Engineering through Total Cost Management (AACE) International http://www.aacei.org/
Association of Cost Engineers (ACostE) http://www.acoste.org.uk/
Center for International Project and Program Management (CIPPM) http://www.iol.ie/~mattewar/CIPPM/
International Cost Engineering Council (ICEC) http://www.icoste.org/
International Function Point Users Group (IFPUG) www.ifpug.org
International Project Management Association (IPMA) http://www.ipma.ch/
International Society of Parametric Analysts (ISPA) http://www.ispa-cost.org/
National Contract Management Association (NCMA) http://www.ncmahq.org/
Project Management Institute (PMI) http://www.pmi.org/
Society of Cost Estimating and Analysis (SCEA) http://www.sceaonline.net/
Society for Risk Analysis (SRA) http://www.sra.org/
Space Systems Cost Analysis Group (SSCAG) http://sscag.saic.com/
2.1.5 Colleges and Universities Air Force Institute of Technology (AFIT) http://www.afit.edu/
Army Logistics Management College (ALMC) http://www.almc.army.mil/
California State University, Long Beach (Regression) http://www.csulb.edu/~msaintg/ppa696/696regs.htm#REGRESSION
Carnegie Mellon University http://www.cmu.edu/
Defense Acquisition University (DAU) http://www.dau.mil/
University of Exeter (Regression) http://www.people.ex.ac.uk/SEGLea/psy2005/simpreg.html http://www.people.ex.ac.uk/SEGLea/psy2005/basicmlt.html
University of Southern California (Regression) http://www-rcf.usc.edu/~moonr/econ419/econ414_2.pdf

CO
ST ESTIMA
TING
CO
ST RISK
SUPPO
RTIN
G A
NA
LYSISC
AR
EER D
EVELOPM
ENT G
UID
ER
EFEREN
CES
2008 NASA Cost Estimating Handbook Section 2. Cost Estimating Resources
Volume 6 Page 6-26
2.2 Cost Estimating Publications
2.2.1 Books 2002 Craftsman Cost Estimating Guides
Advanced Engineering Economics (by Chan S. Park and Gunter P. Sharp-Bette)
CHAOS Chronicles 3.0 (by the Standish Group)
CMMI Distilled (by Ahern, Clouse, & Turner)
Construction Cost Analysis and Estimating (by Phillip F. Ostwald)
Cost Estimating (by Rodney D. Stewart)
Cost Estimator's Reference Manual (by Rodney D. Stewart, Richard M. Wyskida, and James D. Johannes)
Design to Cost (by Jack V. Michaels and William P. Wood)
Engineering Cost Estimating (by Phillip F. Ostwald)
Estimating and Bidding for Heavy Construction (by S.H. Bartholomew)
Estimating in Building Construction (by Frank R. Dagostino and Leslie Feigenbaum
Estimating Software Costs (by T. Capers Jones)
Financial Management Theory and Practice (by Eugene F. Brigham and Michael C. Gapenski)
Function Point Analysis: Measurement Practices for Successful Software Projects (by Garmus and Herron)
How to Estimate with Means Data & CostWorks (by Saleh Mubarak and Means)
Investment Under Uncertainty (by Avinash Dixit and Robert Pindyck)
IT Measurement: Practical Advice from the Experts (by IFPUG)
Managing the Construction Process: Estimating, Scheduling, and Project Control (by Frederick E. Gould)
Means Building Construction Cost Data (by R.S. Means Company, Inc. (http://www.rsmeans.com)
Practical Software Measurement: Objective Information for Decision Makers (by McGarry, et. al.)
Principles of Corporate Finance (by Richard A. Brealey and Stewart C. Myers)
Probability Methods for Cost Uncertainty Analysis: A Systems Engineering Perspective, Paul R. Garvey
Project Estimating and Cost Management, Parviz F. Rad
Real Options; Managerial Flexibility and Strategy in Resource Allocation (by Lenos Trigeorgis)
Real Options: Managing Strategic Investments in an Uncertain World (by Martha Amram and Nalin Kulatilaka)
Reducing Space Mission Cost (by James R. Wertz and Wiley J. Larson)
Reducing the Cost of Spacecraft Ground Systems and Operations, Jiun-Jih Miau
Simplified Estimating For Builders And Engineers (by Joseph E. Helton)

CO
ST ESTIMA
TING
CO
ST RISK
SUPPO
RTIN
G A
NA
LYSISC
AR
EER D
EVELOPM
ENT G
UID
ER
EFEREN
CES
2008 NASA Cost Estimating Handbook Section 2. Cost Estimating Resources
Volume 6 Page 6-27
Software Assessments, Benchmarks, and Best Practices (by Capers Jones)
Software Cost Estimation with COCOMO II, by Barry W. Boehm
Space Mission Analysis and Design (SMAD), by Wiley J. Larson and James Richard Wertz
Space Transportation: A Systems Approach to Analysis and Design, Walter E. Hammond
Statistical Methods for Learning Curves and Cost Analysis, Matthew Goldberg, PhD
Technological Forecasting for Decision Making, by Joseph P. Martino
The Economic Implications of Learning by Doing, The Review of Economic Studies, Vol. 2, No. 3
The Goal Question Metric Method, by van Solingen & Berghout
The Learning Curve and Pricing in Chemical Processing Industries, The RAND Journal of Economics, Vol. 15, No. 2
The Mythical Man Month, by Frederick P. Brooks
Walker's Building Estimator's Reference Book, by Scott Siddens and Frank R. Walker Co.
2.2.2 Handbooks and Manuals Air Force Space Command (AFSC) Cost Estimating Handbook Series, Volume VI �–
Space Handbook
Department of the Navy Center for Cost Analysis Software Development Estimating Handbook
IFPUG Counting Practices Manual, Version 4.1.1
IFPUG Case Study 1, Release 2.0: ERD, Hierarchical Process, DB2 Data Base, and GUI Windows
IFPUG Case Study 2, Release 2.0: ERD, Data Flow Diagrams, IMS Data Base, Common User Access Screens
IFPUG Case Study 3, Release 2.0: Class Diagram (UML), Use Case Diagrams, GUI Windows
IFPUG Case Study 4, Release 1.0: Traffic Control Systems with Real-Time Components
IFPUG Guidelines to Software Measurement (�’96-�’97)
IFPUG Guidelines to Counting Logical Files
IFPUG Guidelines to Counting Enhancements
ISBSG Benchmark Summary Release 6
NAFCOM Manual
PRICE Manual
SEER Manual
2.2.3 Papers and Reports Jacobs, Mark, �“Space Operations Cost Model (SOCM) Version 1.0 User�’s Manual and
Program Documentation�”, Science Applications International Corporation, January 1998

CO
ST ESTIMA
TING
CO
ST RISK
SUPPO
RTIN
G A
NA
LYSISC
AR
EER D
EVELOPM
ENT G
UID
ER
EFEREN
CES
2008 NASA Cost Estimating Handbook Section 2. Cost Estimating Resources
Volume 6 Page 6-28
Quintana, Mauricio, �“ISSAC Model (Version 2.0) User Guide�”, Booz Allen Hamilton, December 2003
Shishko, Robert, �“MESSOC (Version 3.16) Algorithms Documentation and User Help Files�” in html, Caltech Jet Propulsion Laboratory, October 2002.

CO
ST ESTIMA
TING
CO
ST RISK
SUPPO
RTIN
G A
NA
LYSISC
AR
EER D
EVELOPM
ENT G
UID
ER
EFEREN
CES
2008 NASA Cost Estimating Handbook Section 3. Acronyms
Volume 6 Page 6-29
Section 3. Acronyms
In addition to the following list of defined acronyms, other useful cost terms can be found on the following websites:
Acronym Finder http://www.acronymfinder.com/
Cost Estimating Acronym Glossary http://cost.jsc.nasa.gov/acronyms.html
NASA Acronym List (GSFC) http://library.gsfc.nasa.gov/Databases/Acronym/acronym.html
NASA Acronym List (KSC) http://www.ksc.nasa.gov/facts/acronyms.html
NASA Earth Science Acronyms http://gcmd.gsfc.nasa.gov/Aboutus/sitemap.html
Internet Acronym Server http://silmaril.ie/cgi-bin/uncgi/acronyms
AA Associate Administrator AACE Association for the Advancement of Cost Engineering AATe Architectural Assessment Tool �– Enhanced ABC Activity Based Costing ACE Advocacy Cost Estimate ACEIT Automated Cost Estimating Integrated Tools ACEO Assessments and Cost Estimating Office ACWP Actual Cost of Work Performed (�“Actuals�” or �“Cost�”) AFCRUH Air Force Cost Risk and Uncertainty Handbook AFIT Air Force Institute of Technology AFSC Air Force Space Command AFSMC Air Force Space and Missile Systems Center AGE Aerospace Ground Equipment AHP Analytic Hierarchy Process ALMC Army Logistics Management College AMCM Advanced Missions Cost Model ANP Analytic Network Process ANSI American National Standards Institute AO Announcement of Opportunity AoA Analysis of Alternatives APA Allowance for Program Adjustment APMC Agency Program Management Council ARC Ames Research Center ARR ATLO Readiness Review ASPE American Society of Professional Estimators AT Acceptance Test (DSMS) ATLO Assembly, Test, & Launch Operations ATP Authorization to Proceed AUW Authorized Unpriced Work BCA Business Case Analysis BCE Baseline Cost Estimate BCR Benefit/Cost Ratio

CO
ST ESTIMA
TING
CO
ST RISK
SUPPO
RTIN
G A
NA
LYSISC
AR
EER D
EVELOPM
ENT G
UID
ER
EFEREN
CES
2008 NASA Cost Estimating Handbook Section 3. Acronyms
Volume 6 Page 6-30
BCTE Baseline Cycle Time Estimate BCWP Budgeted Cost of Work Performed BCWS Budgeted Cost of Work Scheduled BDE Budget Direct Effort BVS Best Value Selection BMO Business Management Office BOE Basis of Estimate BY Base Year CA Cost Account CADRe Cost Analysis Data Requirement CAICAT Composite Affordability Initiative Cost Analysis Tool CAIG Cost Analysis Improvement Group CAIV Cost as an Independent Variable CAM Centrifuge Accommodation Module CAO Cost Analysis Office CASA Cost Analysis Strategy Assessment CBA Cost Benefit Analysis CBB Contract Budget Base CBS Cost Breakdown Structure CCDR Contractor Cost Data Report CCE Current Cost Estimate CCP Cost Credibility Plan CCRM Continuous Cost-Risk Management CCT Cost Credibility Team CDF Cumulative Distribution Function CDG Career Development Guide CDR Critical Design Review CEA Cost Estimation and Analysis CEC Cost Estimating Community CEH Cost Estimating Handbook CER Cost Estimating Relationship CERT Cost Estimation Reconciliation Team CES Cost Element Structure CEWG Cost Estimating Working Group CFO Chief Financial Officer CFSR Contract Funds Status Report CIC Capital Investment Council CLIN Contract Line Item Number CM Configuration Management COCOMO Constructive Cost Model CoF Construction of Facilities COMET Conceptual Operations Manpower Estimating Tool CONOPS Concept of Operations COSMIC Computer Software Management Information Center CoSTER Consortium on Space Technology Estimating Research COTS Commercial-off-the-Shelf
CO
ST ESTIMA
TING
CO
ST RISK
SUPPO
RTIN
G A
NA
LYSISC
AR
EER D
EVELOPM
ENT G
UID
ER
EFEREN
CES
2008 NASA Cost Estimating Handbook Section 3. Acronyms
Volume 6 Page 6-31
CPA Critical Path Analysis CPI Consumer Price Index CPIC Capital Planning and Investment Control CPM Critical Path Method CPR Cost Performance Report C/SCSC Cost/Schedule Control System Criteria CSE Center for Software Engineering CSRS Civil Service Retirement System C/SSR Cost/Schedule Status Report CTER Cycle Time Estimating Ratio CY Calendar Year CY Constant Year CY Current Year DACS Data and Analysis Center for Software DAU Defense Acquisition University DCAA Defense Contract Audit Agency DCF Discounted Cash Flow DCMA Defense Contract Management Agency DD Design Development DDT&E Design, Development, Test & Evaluation DFRC Dryden Flight Research Center DoD Department of Defense DR Data Request DR Data Requirements DRD Data Requirements Description DSMC Defense Systems Management College DSMS Deep Space Mission Systems DSN Deep Space Network DTC Design to Cost EA Economic Analysis EAC Estimate at Completion EADP Economic Analysis Development Plan ECHO Environmental Costs of Hazardous Operations ECI Employment Cost Index ECOM ESA Cost Modeling Software ECOS ESA Costing Software ECP Engineering Change Proposal EIA Electronic Industries Alliance EMP/EMI Electromagnetic Pulse / Electromagnetic Interference EOSDIS Earth Observing Station Data & Information System EQEA Environmental Quality Economic Analyses ERP Enterprise Resource Planning ESA European Space Agency ETC Estimate to Complete EVM Earned Value Management EVMS Earned Value Management System

CO
ST ESTIMA
TING
CO
ST RISK
SUPPO
RTIN
G A
NA
LYSISC
AR
EER D
EVELOPM
ENT G
UID
ER
EFEREN
CES
2008 NASA Cost Estimating Handbook Section 3. Acronyms
Volume 6 Page 6-32
FACGSE Spaceport Facility and GSE Acquisition Cost Estimator FAI Federal Acquisition Institute FAIR Federal Activities Reform FAR Federal Acquisition Regulation FCA Full Cost Accounting FEA Front End Analysis FEA Functional Economic Analysis FERS Federal Employees Retirement System FFE Friendly Front End FFP Firm Fixed Price FH Flight Hardware FPA Function Point Analysis FRISK Formal Risk Assessment of System Cost Estimates FSW Flight Software FTE Full-Time Equivalent (civil servant) FV Future Value FY Fiscal Year G&A General and Administrative GAO Government Accountability Office GDP Gross Domestic Product GEM-FLO Generic Environment for Modeling Future Simulation Launch Vehicle GFE Government Furnished Equipment GOTS Government-off-the-Shelf GPRA Government Performance and Results Act GR&A Ground Rules and Assumptions GRC Glenn Research Center GSE Ground Support Equipment GSFC Goddard Space Flight Center HIT Health Insurance Tax HQ Headquarters HSF Human Space Flight HW Hardware IA Independent Assessment IAF International Astronautics Federation IAR Independent Annual Review IBPD Integrated Budget Performance Document IBR Integrated Baseline Review ICE Independent Cost Estimate ICR Independent Cost Review IDEA ISS Downlink Enhancement Architecture IEEE Institute of Electrical and Electronics Engineers IFM Integrated Financial Management IEMP Integrated Enterprise Management Program IFMS Integrated Financial Management System IFPUG International Function Point Users Group IGCE Independent Government Cost Estimate
CO
ST ESTIMA
TING
CO
ST RISK
SUPPO
RTIN
G A
NA
LYSISC
AR
EER D
EVELOPM
ENT G
UID
ER
EFEREN
CES
2008 NASA Cost Estimating Handbook Section 3. Acronyms
Volume 6 Page 6-33
ILCCE Independent Life Cycle Cost Estimate IMLEO Initial Mass in Low-Earth Orbit IMS/IMP Integrated Master Schedule/Integrated Master Plans IND Interplanetary Network Directorate, (formerly TMOD) IOC Initial Operating Capability IPAO Independent Program Assessment Office IPI International Price Index IPR Initial Program Review IPT Integrated Product Team IR&D Independent Research and Development IRM Information Resource Management IRR Internal Rate of Return IRS Internal Revenue Service ISAT Inter-Center Systems Analysis Team ISE Intelligent Synthesis Environment ISO International Organization for Standardization ISPA International Society of Parametric Analysts ISS International Space Station ISSAC International Space Station Analytical Cost I&T Integration and Test IT Information Technology ITMRA Information Technology Management Reform Acquisition IV&V Independent Verification and Validation JPL Jet Propulsion Laboratory JSC Johnson Space Center Kbase Knowledge Base KPP Key Performance Parameter KEPP Key Engineering Performance Parameters KSC Kennedy Space Center L&FB Leave and Fringe Benefits LaRC Langley Research Center LCC Life-Cycle Cost LCCE Life Cycle Cost Estimate LOC Lines of Code LOE Level of Effort LOOS Launch and Orbital Operations Support LSBF Least Squares Best Fit MAIS Major Automated Information Systems MC Management Council MCC Mission Control Center MCPR Modified Cost Performance Report MDAPS Major Defense Acquisition Programs MESSOC Model for Estimating Space Station Operations Costs MICM Multi-Variable Instrument Cost Model MIL-STD Military Standard MNS Mission Needs Statement

CO
ST ESTIMA
TING
CO
ST RISK
SUPPO
RTIN
G A
NA
LYSISC
AR
EER D
EVELOPM
ENT G
UID
ER
EFEREN
CES
2008 NASA Cost Estimating Handbook Section 3. Acronyms
Volume 6 Page 6-34
MOU Memorandum of Understanding MPV Mid-Point Value MR Management Reserve MS Microsoft MSFC Marshall Space Flight Center MSI&T Mission System Integration and Test NAFCOM NASA/Air Force Cost Model NAR Non-Advocate Review NASA National Aeronautics and Space Administration NBS New Business Systems NCC Negotiated Contract Cost NCCA Naval Center for Cost Analysis NCMA National Contract Management Association NCRD NASA Cost-Risk Database NDI Non-Developmental Item NODIS NASA On-line Directives Information System NPD NASA Policy Directive NPG NASA Procedures and Guidelines NPR NASA Procedural Requirement NGR NASA Procedures and Requirements NPV Net Present Value N/R Not Relevant NRA NASA Research Announcement NroC Integrated RMAT OCM/COMET Model NWODB New Ways of Doing Business O&M Operating and Maintenance O&S Operations and Support OCM Operations Cost Model ODC Other Direct Cost OLS Ordinary Least Squares OMB Office of Management and Budget ONCE One NASA Cost Estimating database OPCU Orbiter Power Converter Unit OSP Orbital Space Plane OTB Over Target Baseline PAA Program Analysis and Alignment PAPAC Provide Aerospace Products and Capabilities PBS Product Breakdown Structure PC Personal Computer PCA Program Commitment Agreement PCAT Project Cost Analysis Tool PCC Program Cost Commitment PCD Performing Center Director PDC Project Design Center PDCR Preliminary Design and Cost Review PDF Probability Density Function
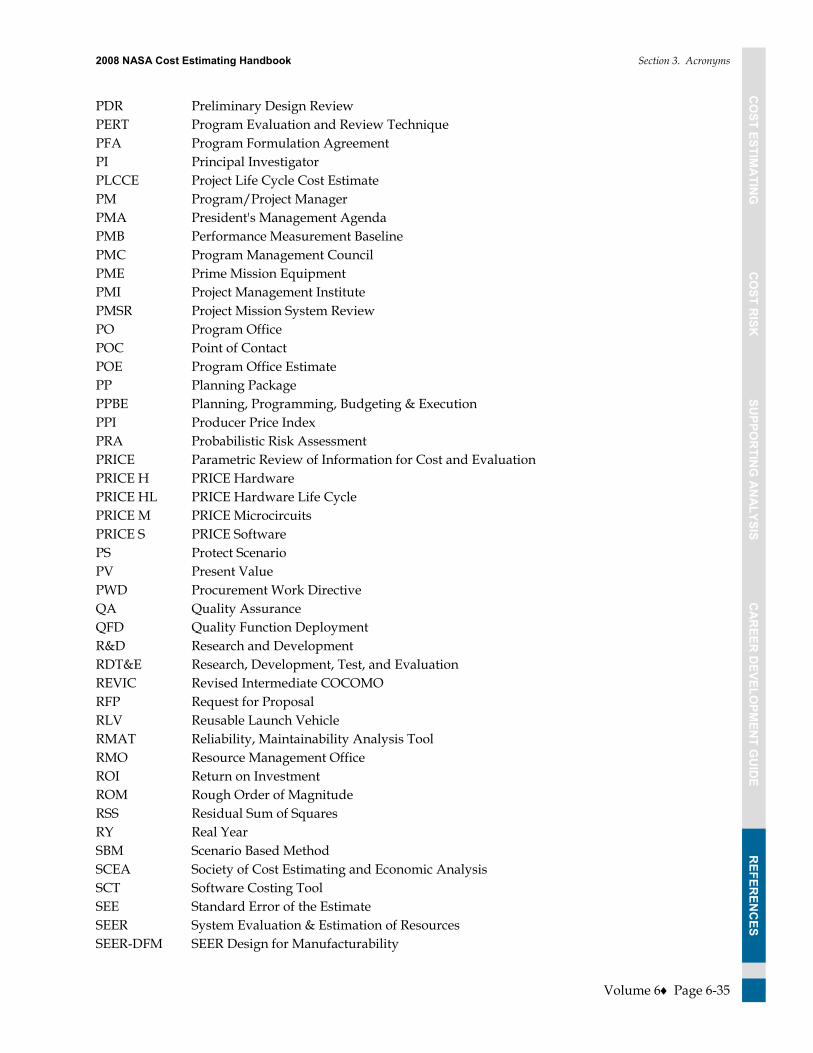
CO
ST ESTIMA
TING
CO
ST RISK
SUPPO
RTIN
G A
NA
LYSISC
AR
EER D
EVELOPM
ENT G
UID
ER
EFEREN
CES
2008 NASA Cost Estimating Handbook Section 3. Acronyms
Volume 6 Page 6-35
PDR Preliminary Design Review PERT Program Evaluation and Review Technique PFA Program Formulation Agreement PI Principal Investigator PLCCE Project Life Cycle Cost Estimate PM Program/Project Manager PMA President's Management Agenda PMB Performance Measurement Baseline PMC Program Management Council PME Prime Mission Equipment PMI Project Management Institute PMSR Project Mission System Review PO Program Office POC Point of Contact POE Program Office Estimate PP Planning Package PPBE Planning, Programming, Budgeting & Execution PPI Producer Price Index PRA Probabilistic Risk Assessment PRICE Parametric Review of Information for Cost and Evaluation PRICE H PRICE Hardware PRICE HL PRICE Hardware Life Cycle PRICE M PRICE Microcircuits PRICE S PRICE Software PS Protect Scenario PV Present Value PWD Procurement Work Directive QA Quality Assurance QFD Quality Function Deployment R&D Research and Development RDT&E Research, Development, Test, and Evaluation REVIC Revised Intermediate COCOMO RFP Request for Proposal RLV Reusable Launch Vehicle RMAT Reliability, Maintainability Analysis Tool RMO Resource Management Office ROI Return on Investment ROM Rough Order of Magnitude RSS Residual Sum of Squares RY Real Year SBM Scenario Based Method SCEA Society of Cost Estimating and Economic Analysis SCT Software Costing Tool SEE Standard Error of the Estimate SEER System Evaluation & Estimation of Resources SEER-DFM SEER Design for Manufacturability

CO
ST ESTIMA
TING
CO
ST RISK
SUPPO
RTIN
G A
NA
LYSISC
AR
EER D
EVELOPM
ENT G
UID
ER
EFEREN
CES
2008 NASA Cost Estimating Handbook Section 3. Acronyms
Volume 6 Page 6-36
SEER-H SEER Hardware Estimation and Life Cycle Cost Analysis SEER-IC SEER Custom Integrated Circuit Development SEER-SEM SEER Software Estimation Model SEER-SSM SEER Software Sizing Model SEI Software Engineering Institute SEMP System Engineering Master Plan SER Schedule Estimating Relationship SICM Scientific Instrument Cost Model SIR Savings to Investment Ratio SLOC Source Lines of Code SMAD Space Mission Design and Analysis SME Subject Matter Expert SMO Systems Management Office SOCM Space Operations Cost Model SORCE Software Resource Center SPP Summary Planning Package SQA Software Quality Assurance SQI Software Quality Improvement SRA Society for Risk Analysis SRCR Software Review/Certification Review SRR Software Requirements Review SSA Social Security Administration SSC Stennis Space Center SSCM Small Satellite Cost Model SSCRH Space Systems Cost Risk Handbook SVLCM Spacecraft/Vehicle Level Cost Model SW Software TAB Total Allocated Budget T&M Time and Materials T1 Theoretical First Unit Value TBD To Be Determined TCO Total Cost of Ownership TCOR Total Cost of Ownership Reduction TDRSS Tracking and Data Relay Satellite System TIM Technical Interchange Meeting TIMS Tactical Information Management System TOA Total Obligation Authority TOR Terms of Reference TPM Technical Performance Measure TRL Target Requirement List TRL Technical Readiness Level TRR Test Readiness Review TSP Thrift Savings Plan TSS Total Sum of Squares TY Then Year UB Undistributed Budget

CO
ST ESTIMA
TING
CO
ST RISK
SUPPO
RTIN
G A
NA
LYSISC
AR
EER D
EVELOPM
ENT G
UID
ER
EFEREN
CES
2008 NASA Cost Estimating Handbook Section 3. Acronyms
Volume 6 Page 6-37
UFE Unallocated Future Expense USC United States Code USCM Unmanned Spacecraft Cost Model USSGL United States Government Standard General Ledger WBS Work Breakdown Structure WP Work Package WYE Work Year Equivalent (contractor)

CO
ST ESTIMA
TING
CO
ST RISK
SUPPO
RTIN
G A
NA
LYSISC
AR
EER D
EVELOPM
ENT G
UID
ER
EFEREN
CES
2008 NASA Cost Estimating Handbook Section 4. Glossary
Volume 6 Page 6-38
Section 4. Glossary
@RISK �– Risk Analysis and Simulation add-in for Microsoft Excel® or Lotus® 1-2-3. @RISK uses Monte Carlo simulation that allows taking all possible outcomes into account. Replace uncertain values in the spreadsheet with @RISK functions, which represent a range of possible values. Select bottom-line cells, like Total Profits, as outputs, and start a simulation. @RISK recalculates the spreadsheet, each time selecting random numbers from the @RISK functions entered. The result is distributions of possible outcomes and the probabilities of getting those results. The results illustrate what could happen in a given situation, but also how likely it is that it will happen.
Accounting Estimate �– Uses engineering estimates of reliability, maintainability, and component cost characteristics, etc. to build estimates from the "bottom-up" for each cost category.
Acquisition Strategy �– The method utilized to design, develop, and deploy a system through its life cycle. It articulates the broad concepts and objectives, which direct and control the overall development, production, and deployment of a materiel system. It is the framework for planning, directing, contracting for, and managing a program. It provides a master schedule for research, development, test, production, fielding, modification, postproduction management, and other activities essential for program success.
Advocacy Cost Estimate (ACE) �– Prepared by cost analysts who are a part of the design team and provide the program/project management with an estimated cost based on translating the technical and design parameters characteristics into cost estimates using established cost estimating methodologies.
Analogous System Estimate �– With this technique, a currently fielded system (comparable system) similar in design and/or operation of the proposed system is identified. The cost of the proposed system is developed by taking the fielded system's data and adjusting it to account for any differences. Analogous estimates are also called Comparative or Extrapolated estimates.
Analysis of Alternatives (AoA) �– Broadly examines multiple elements of project or program alternatives including technical risk and maturity, and costs. AoAs are intended to illuminate the risk, uncertainty, and the relative advantages and disadvantages of the alternatives being considered; show the sensitivity of each alternative to possible changes in key assumptions; and aid decision-makers in judging whether or not any of the proposed alternatives offer sufficient operational and/or economic benefit to be worth the cost.
Analytic Hierarchy Process (AHP) �– Structures problems into a hierarchical structure in order to reduce complexity. AHP is a feature of Expert Choice software.
Analytic Network Process (ANP) �– Uses non-linear models to demonstrate the relationship between the elements. ANP is a feature of Expert Choice software.
Announcement of Opportunity (AO) �– This is generally used to solicit proposals for unique, high cost research investigation opportunities that typically involve flying experimental hardware
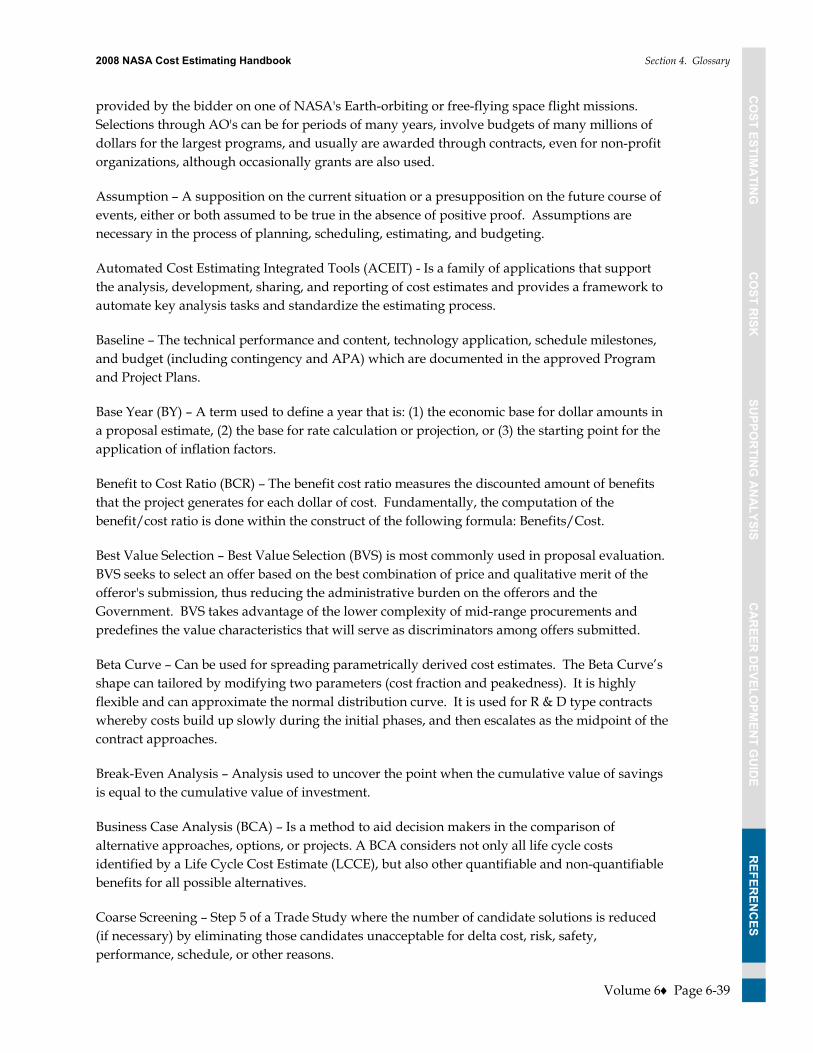
CO
ST ESTIMA
TING
CO
ST RISK
SUPPO
RTIN
G A
NA
LYSISC
AR
EER D
EVELOPM
ENT G
UID
ER
EFEREN
CES
2008 NASA Cost Estimating Handbook Section 4. Glossary
Volume 6 Page 6-39
provided by the bidder on one of NASA's Earth-orbiting or free-flying space flight missions. Selections through AO's can be for periods of many years, involve budgets of many millions of dollars for the largest programs, and usually are awarded through contracts, even for non-profit organizations, although occasionally grants are also used.
Assumption �– A supposition on the current situation or a presupposition on the future course of events, either or both assumed to be true in the absence of positive proof. Assumptions are necessary in the process of planning, scheduling, estimating, and budgeting.
Automated Cost Estimating Integrated Tools (ACEIT) - Is a family of applications that support the analysis, development, sharing, and reporting of cost estimates and provides a framework to automate key analysis tasks and standardize the estimating process.
Baseline �– The technical performance and content, technology application, schedule milestones, and budget (including contingency and APA) which are documented in the approved Program and Project Plans.
Base Year (BY) �– A term used to define a year that is: (1) the economic base for dollar amounts in a proposal estimate, (2) the base for rate calculation or projection, or (3) the starting point for the application of inflation factors.
Benefit to Cost Ratio (BCR) �– The benefit cost ratio measures the discounted amount of benefits that the project generates for each dollar of cost. Fundamentally, the computation of the benefit/cost ratio is done within the construct of the following formula: Benefits/Cost.
Best Value Selection �– Best Value Selection (BVS) is most commonly used in proposal evaluation. BVS seeks to select an offer based on the best combination of price and qualitative merit of the offeror's submission, thus reducing the administrative burden on the offerors and the Government. BVS takes advantage of the lower complexity of mid-range procurements and predefines the value characteristics that will serve as discriminators among offers submitted.
Beta Curve �– Can be used for spreading parametrically derived cost estimates. The Beta Curve�’s shape can tailored by modifying two parameters (cost fraction and peakedness). It is highly flexible and can approximate the normal distribution curve. It is used for R & D type contracts whereby costs build up slowly during the initial phases, and then escalates as the midpoint of the contract approaches.
Break-Even Analysis �– Analysis used to uncover the point when the cumulative value of savings is equal to the cumulative value of investment.
Business Case Analysis (BCA) �– Is a method to aid decision makers in the comparison of alternative approaches, options, or projects. A BCA considers not only all life cycle costs identified by a Life Cycle Cost Estimate (LCCE), but also other quantifiable and non-quantifiable benefits for all possible alternatives.
Coarse Screening �– Step 5 of a Trade Study where the number of candidate solutions is reduced (if necessary) by eliminating those candidates unacceptable for delta cost, risk, safety, performance, schedule, or other reasons.

CO
ST ESTIMA
TING
CO
ST RISK
SUPPO
RTIN
G A
NA
LYSISC
AR
EER D
EVELOPM
ENT G
UID
ER
EFEREN
CES
2008 NASA Cost Estimating Handbook Section 4. Glossary
Volume 6 Page 6-40
Commercial-Off-The-Shelf (COTS) �– Commercial items that require no unique government modifications or maintenance over the life cycle of the product to meet the needs of the procuring agency.
Competitive Sourcing Analysis Studies (A-76 Studies) �– Competitive sourcing is an economic analysis conducted to determine the most cost effective method of obtaining services that are available in the commercial market. Agency missions may be accomplished through commercial facilities and resources, Government facilities and resources or mixes thereof, depending upon the product, service, type of mission and the equipment required. The prevailing regulations for the Competitive Sourcing studies are the OMB Circular No. A-76 Revised Supplemental Handbook, Performance of Commercial Activities, revised 1999.
Compounding �– Process of going from today�’s values, or present values (PVs), to future values (FVs).
Constant (Base) Year Dollars �– This phase is always associated with a base year and reflects the dollar �“purchasing power�” for that year. An estimate is in constant dollars when prior-year costs are adjusted to reflect the level of prices of the base year, and future costs are estimated without inflation. A cost estimate is expressed in �“constant dollars�” when the effect of changes in the purchasing power of the dollar (inflation) has been removed.
Constructive Cost Model (COCOMO) �– A parametric software cost estimating tool developed and described by Dr. Barry Boehm in his book Software Engineering Economics. COCOMO has three standard modes of software development: Organic, Semi-Detached, and Embedded. The Air Force Cost Analysis Agency�’s REVIC model is based on the original COCOMO model.
Contingency �– Reserves, including funding, schedule, performance, manpower, and services, allocated to and managed by the Program/Project Manager for the resolution of problems normally encountered to mitigate risks while ensuring compliance to the specified program/project scope.
Contract Cost Analysis �– Contract cost analysis is the traditional method for analyzing a contractor's proposal. It is the analysis of the separate cost elements and profit of (1) an offeror's cost and pricing data and (2) the judgmental factors applied in projecting from the data to the estimated costs. The analyst does this to form an opinion on the degree to which the proposed costs represent what the contract should cost.
Contract Funds Status Report (CFSR) �– A report normally required on cost or incentive type contracts to inform the buyer of funds used and status of remaining funds.
Contract Line Item Number (CLIN) �– Items listed in a contract and priced individually. Some may be options.
Contract Work Breakdown Structure (WBS) �– A breakout or subdivision of a project typically down to level three which subdivides the project into all its major hardware, software, and service elements, integrates the customer and contractor effort, provides a framework for the planning, control, and reporting. A WBS applied within a contract.
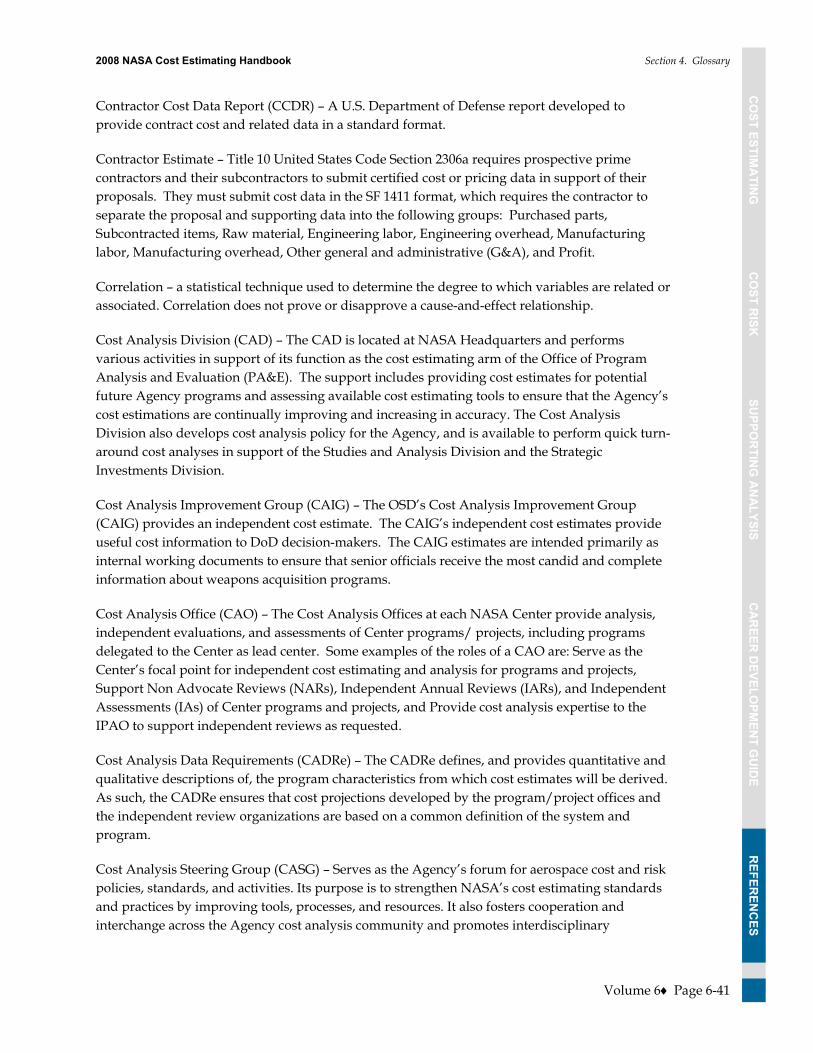
CO
ST ESTIMA
TING
CO
ST RISK
SUPPO
RTIN
G A
NA
LYSISC
AR
EER D
EVELOPM
ENT G
UID
ER
EFEREN
CES
2008 NASA Cost Estimating Handbook Section 4. Glossary
Volume 6 Page 6-41
Contractor Cost Data Report (CCDR) �– A U.S. Department of Defense report developed to provide contract cost and related data in a standard format.
Contractor Estimate �– Title 10 United States Code Section 2306a requires prospective prime contractors and their subcontractors to submit certified cost or pricing data in support of their proposals. They must submit cost data in the SF 1411 format, which requires the contractor to separate the proposal and supporting data into the following groups: Purchased parts, Subcontracted items, Raw material, Engineering labor, Engineering overhead, Manufacturing labor, Manufacturing overhead, Other general and administrative (G&A), and Profit.
Correlation �– a statistical technique used to determine the degree to which variables are related or associated. Correlation does not prove or disapprove a cause-and-effect relationship.
Cost Analysis Division (CAD) �– The CAD is located at NASA Headquarters and performs various activities in support of its function as the cost estimating arm of the Office of Program Analysis and Evaluation (PA&E). The support includes providing cost estimates for potential future Agency programs and assessing available cost estimating tools to ensure that the Agency�’s cost estimations are continually improving and increasing in accuracy. The Cost Analysis Division also develops cost analysis policy for the Agency, and is available to perform quick turn-around cost analyses in support of the Studies and Analysis Division and the Strategic Investments Division.
Cost Analysis Improvement Group (CAIG) �– The OSD�’s Cost Analysis Improvement Group (CAIG) provides an independent cost estimate. The CAIG�’s independent cost estimates provide useful cost information to DoD decision-makers. The CAIG estimates are intended primarily as internal working documents to ensure that senior officials receive the most candid and complete information about weapons acquisition programs.
Cost Analysis Office (CAO) �– The Cost Analysis Offices at each NASA Center provide analysis, independent evaluations, and assessments of Center programs/ projects, including programs delegated to the Center as lead center. Some examples of the roles of a CAO are: Serve as the Center�’s focal point for independent cost estimating and analysis for programs and projects, Support Non Advocate Reviews (NARs), Independent Annual Reviews (IARs), and Independent Assessments (IAs) of Center programs and projects, and Provide cost analysis expertise to the IPAO to support independent reviews as requested.
Cost Analysis Data Requirements (CADRe) �– The CADRe defines, and provides quantitative and qualitative descriptions of, the program characteristics from which cost estimates will be derived. As such, the CADRe ensures that cost projections developed by the program/project offices and the independent review organizations are based on a common definition of the system and program.
Cost Analysis Steering Group (CASG) �– Serves as the Agency�’s forum for aerospace cost and risk policies, standards, and activities. Its purpose is to strengthen NASA�’s cost estimating standards and practices by improving tools, processes, and resources. It also fosters cooperation and interchange across the Agency cost analysis community and promotes interdisciplinary

CO
ST ESTIMA
TING
CO
ST RISK
SUPPO
RTIN
G A
NA
LYSISC
AR
EER D
EVELOPM
ENT G
UID
ER
EFEREN
CES
2008 NASA Cost Estimating Handbook Section 4. Glossary
Volume 6 Page 6-42
understanding of costing aerospace systems and their applications to government and commercial endeavors.
Cost as an Independent Variable (CAIV) �– The process of examining cost drivers by holding cost independent. CAIV is founded upon two primary principles: first, system costs are constrained. Whereas some programs do obtain additional funding when needed, such funding is often at the expense of other programs or future modernization and second, �“trade space�” is the foundation for smart decisions. Trade space is the range of alternatives available to decision makers. It is four-dimensional, comprising performance, cost, schedule, and risk impacts.
Cost Benefit Analysis (CBA) �– An analytic technique that compares the costs and benefits of investments, programs, or policy actions in order to determine which alternative or alternatives maximize net profits. Net benefits of an alternative are determined by subtracting the present value of costs from the present value of benefits. CBA is comprised of 8 steps: analysis of the current environment, perform gap analysis, identify alternatives, estimate costs, perform sensitivity analysis, characterize and value benefits, determine net value of each alternative, and perform risk analysis.
Cost Driver �– Those input variables that will have a significant effect on the final cost.
Cost Element Structure (CES) �– A unit of costs to perform a task or to acquire an item. The cost estimated may be a single value or a range of values.
Cost Estimating �– A methodology involving the application of quantitative techniques to calculate and forecast development, production, operation and support, and disposal costs (I.e., life-cycle costs) within a scheduled time frame and defined scope. Included in these costs are an assessment and evaluation of risks and uncertainties. The methodology involves preparing or obtaining a work breakdown structure, gathering, normalizing, and verifying cost data, developing cost estimating relationships (CERs), evaluating specific elements of costs, and evaluation of the reasonableness and appropriateness of the cost data. NASA follows this methodology for the development of cost estimates for space system hardware, space system software, construction of facilities, and research and development of technology (R&T). The results are used to assist decision makers in determining the optimal use of resources and to make cost-effective decisions throughout the life cycle.
Cost Estimating Community (CEC) �– Includes all the cost estimating and cost analysis practitioners within the NASA workforce.
Cost Estimating Relationship (CER) �– A mathematical relationship that defines cost as a function of one or more parameters such as performance, operating characteristics, physical characteristics, etc.
Cost Estimation and Analysis (CEA) Competency �– The total capability of an organization to provide the cost estimates required by the organization for budget planning and execution, and program planning and approval.

CO
ST ESTIMA
TING
CO
ST RISK
SUPPO
RTIN
G A
NA
LYSISC
AR
EER D
EVELOPM
ENT G
UID
ER
EFEREN
CES
2008 NASA Cost Estimating Handbook Section 4. Glossary
Volume 6 Page 6-43
Cost Overruns �– The amount by which actual costs exceed the baseline or approved costs. Cost overruns can also refer to the amount by which a contractor exceeds or expects to exceed the estimated costs, and/or the final limitations (the ceiling) of a contract.
Cost Performance/Schedule Trade Study �– Systemic, interdisciplinary examination of the factors affecting the cost of a system to find methods for meeting system requirements at an acceptable cost. This is achieved by analyzing numerous system concepts to find ways to attain necessary performance while balancing essential requirements that must be satisfied for the system to be successful. The objective of the cost-performance trades is not to minimize the cost of the system, but to achieve a specified level of cost reduction established by the target costing system.
Cost Readiness Level (CRL) �– CRLs are designed to communicate the quality of the cost estimate by designating an associated CRL for each cost estimate to be funded in the Planning, Programming, Budgeting, and Execution (PPBE) process. CRLs have the same 1 to 9 ordinal scale as the NASA Technical Readiness Level (TRL).
Cost Risk �– Risk due to statistical uncertainty in the cost estimate, technical parameter uncertainty, economic factors, rate uncertainty, schedule uncertainty, and programmatic & technological factors.
Cost Spreading Model �– Takes the point-estimate derived from a parametric cost model and spreads it over the project�’s schedule, resulting in the project�’s annual phasing requirements.
Crystal Ball �– Software that employs an analytical technique, called Monte Carlo Simulation to provide the capability to conduct risk and uncertainty analyses within the construct of Excel-based models.
Cumulative Average Curve �– Predicts the average unit cost of a set number of production units. Also, referred to as the Wright curve or the Northrop curve.
Cumulative Distribution Function (CDF) Curve (�“S�” Curve) �– A display of cumulative costs, labor hours or other quantities plotted against time. The name derives from the S-like shape of the curve, flatter at the beginning and end and steeper in the middle, which is typical of most activities (and whole project). The beginning represents a slow, deliberate but accelerating start, while the end represents a deceleration as the work runs out.
Data Requirement Description �– The NASA Data Requirements Description (DRD) is the equivalent of the Department of Defense (DoD) Contract Data Requirements List (CDRL). The DRD defines the data in a contract that is to be delivered to the Government by the contractor. This data may be in any form specified, such as hard copy, electronic, and electronic mailable. The specific form of delivery to NASA is specified either in the SOW and/or in each individual DRD item. The DRD that the cost community is responsible for is the CADRe, which is an integrated DRD that includes the WBS Structure, Cost Input Report, and Cost Estimate Report. the CADRe DRD is proposed as a DR on Category I and high risk Category II flight projects at NASA.
Decision Tree �– A graphic representation of the sequence of a specific activity or operation.
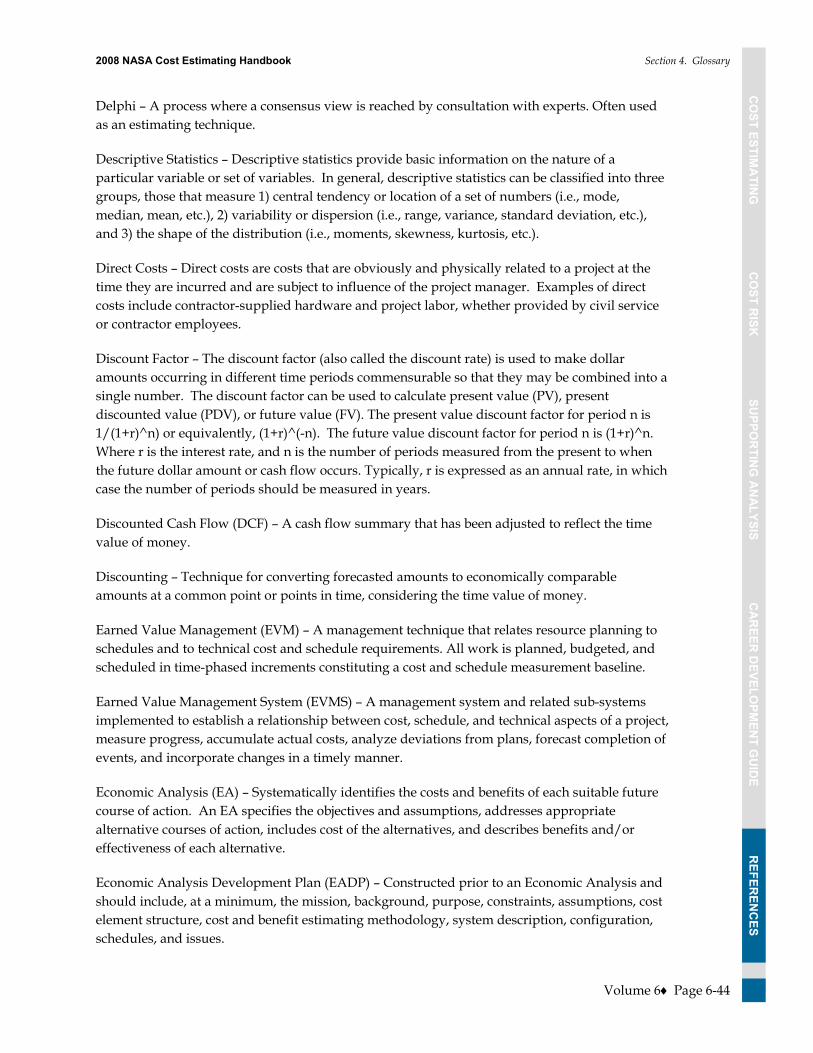
CO
ST ESTIMA
TING
CO
ST RISK
SUPPO
RTIN
G A
NA
LYSISC
AR
EER D
EVELOPM
ENT G
UID
ER
EFEREN
CES
2008 NASA Cost Estimating Handbook Section 4. Glossary
Volume 6 Page 6-44
Delphi �– A process where a consensus view is reached by consultation with experts. Often used as an estimating technique.
Descriptive Statistics �– Descriptive statistics provide basic information on the nature of a particular variable or set of variables. In general, descriptive statistics can be classified into three groups, those that measure 1) central tendency or location of a set of numbers (i.e., mode, median, mean, etc.), 2) variability or dispersion (i.e., range, variance, standard deviation, etc.), and 3) the shape of the distribution (i.e., moments, skewness, kurtosis, etc.).
Direct Costs �– Direct costs are costs that are obviously and physically related to a project at the time they are incurred and are subject to influence of the project manager. Examples of direct costs include contractor-supplied hardware and project labor, whether provided by civil service or contractor employees.
Discount Factor �– The discount factor (also called the discount rate) is used to make dollar amounts occurring in different time periods commensurable so that they may be combined into a single number. The discount factor can be used to calculate present value (PV), present discounted value (PDV), or future value (FV). The present value discount factor for period n is 1/(1+r)^n) or equivalently, (1+r)^(-n). The future value discount factor for period n is (1+r)^n. Where r is the interest rate, and n is the number of periods measured from the present to when the future dollar amount or cash flow occurs. Typically, r is expressed as an annual rate, in which case the number of periods should be measured in years.
Discounted Cash Flow (DCF) �– A cash flow summary that has been adjusted to reflect the time value of money.
Discounting �– Technique for converting forecasted amounts to economically comparable amounts at a common point or points in time, considering the time value of money.
Earned Value Management (EVM) �– A management technique that relates resource planning to schedules and to technical cost and schedule requirements. All work is planned, budgeted, and scheduled in time-phased increments constituting a cost and schedule measurement baseline.
Earned Value Management System (EVMS) �– A management system and related sub-systems implemented to establish a relationship between cost, schedule, and technical aspects of a project, measure progress, accumulate actual costs, analyze deviations from plans, forecast completion of events, and incorporate changes in a timely manner.
Economic Analysis (EA) �– Systematically identifies the costs and benefits of each suitable future course of action. An EA specifies the objectives and assumptions, addresses appropriate alternative courses of action, includes cost of the alternatives, and describes benefits and/or effectiveness of each alternative.
Economic Analysis Development Plan (EADP) �– Constructed prior to an Economic Analysis and should include, at a minimum, the mission, background, purpose, constraints, assumptions, cost element structure, cost and benefit estimating methodology, system description, configuration, schedules, and issues.

CO
ST ESTIMA
TING
CO
ST RISK
SUPPO
RTIN
G A
NA
LYSISC
AR
EER D
EVELOPM
ENT G
UID
ER
EFEREN
CES
2008 NASA Cost Estimating Handbook Section 4. Glossary
Volume 6 Page 6-45
ECONPAK �– Army-developed economic analysis tool, picked by HQs, to evaluate Construction of Facilities projects for Cost Benefit analyses.
e-Government �– The Office of Electronic Government in the General Services Administration was formerly named the Office of Electronic Commerce. E-Government is about using technology to enhance access to and delivery of information and services to citizens, business partners, employees, agencies, and government entities.
Environmental Quality Costs �– Those costs that are specifically related to activities within the Army environmental program including pollution prevention, compliance, restoration, and conservation.
Environmental Quality Economic Analysis (EQEA) �– Supports decision making associated with environmental quality costing alternatives. Environmental quality costs are those costs that are specifically related to activities including pollution prevention, compliance, restoration, and conservation. NASA NSTS 22254, Method for Conduct of Space Shuttle Program Hazard Analyses provides specific guidance related to conducting an EQEA.
Estimate at Completion (EAC) �– Actual cost of work completed to date plus the predicted costs and schedule for finishing the remaining work. It can also be the expected total cost of an activity, a group of activities, or of the project when the defined scope of work is completed.
Estimate to Completion (ETC) - The expected cost needed to complete all the remaining work for a schedule activity, work breakdown structure component, or project.
Expert Choice �– Advanced decision support application that uses Analytic Hierarchy Process (AHP) and Analytic Network Process (ANP) to help quantify qualitative decisions.
Factor Cost Estimate �– Cost factors are often used to address those program/project elements that must be accounted in the cost estimate but are largely undefined early in the design. Examples of cost elements that could be developed using factors and percentages include contractor fee, Advanced Development, Operations Capability Development, Program Support, and Center and agency taxes.
Federal Activities Inventory Reform (FAIR) Act �– The FAIR Act directs Federal agencies to issue each year an inventory of all commercial activities performed by Federal employees, e.g., those activities that are not inherently governmental. OMB is to review each agency's Commercial Activities Inventory and consult with the agency regarding its content. Upon the completion of this review and consultation, the agency must transmit a copy of the inventory to Congress and make it available to the public. The FAIR Act establishes a limited administrative appeals process under which an interested party may challenge the omission or the inclusion of a particular activity on the inventory as a commercial activity. With completion of the inventory, including the challenge and appeals process, the FAIR Act requires agencies to review the activities on the inventory.
Fixed Cost �– costs of an activity (manufacturing, production, assembly, operation, maintenance, etc) that do not vary significantly with the measure of the product or service output. Though these costs will be incurred regardless of the output of the system, the starting point scope of
CO
ST ESTIMA
TING
CO
ST RISK
SUPPO
RTIN
G A
NA
LYSISC
AR
EER D
EVELOPM
ENT G
UID
ER
EFEREN
CES
2008 NASA Cost Estimating Handbook Section 4. Glossary
Volume 6 Page 6-46
fixed costs are often determined by factors that can be controlled such as design, capacity planning, and infrastructure scope and business process steps. While traditionally used in commercial practice to refer to items such as rent, or property taxes, in aerospace it is often the cost to maintain physical infrastructure, information flows, and workforce, at basic levels necessary to supply a range of required demand such as launch rate or production rate.
Front-end Analysis �– Front-end analysis is comprised of two parts: a needs assessment and a task analysis. A needs assessment is the systematic effort to gather opinions and ideas from a variety of sources on performance problems or new systems and technologies. Task analysis breaks down job tasks into steps and solves performance problems. Task analysis works to determine the operational components of an objective, describe what and how they are to be performed, describe the sequence and describe the scope.
Full Cost Accounting �– Full cost accounting ties all Agency costs (including civil service personnel costs) to major activities. All costs will be associated with an activity and, as a result, referred to as a cost object.
Function Point Analysis (FPA) �– A standard methodology for measuring software development and maintenance using function points. Function points is a standardized metric that describes a unit of work product suitable for quantifying software that is based on the end-user�’s point of view.
Functional Economic Analysis (FEA) �– Economic Analysis type that documents the review of an entire functional process or sub-process, such as the use of alternative launch vehicles, etc. It requires a risk assessment of each alternative solution, requesting a high and low estimate for each cost element and subsequent probability distribution of expected costs.
Full Time Equivalent (FTE) - In the U.S. Federal government, FTE is defined by the Government Accountability Office (GAO) as the number of total hours worked (Annual leave, sick leave, and compensatory time off and other approved leave categories are considered to be �“hours worked�” for purposes of defining FTE employment) divided by the maximum number of compensable hours in a work year as defined by law. For example, if the work year is defined as 2,080 hours, then one worker occupying a paid full time job all year would consume one FTE. Two employees working for 1,040 hours each would consume one FTE between the two of them. FTEs do not include military personnel, uniformed services, or contract support.
Future Value (FV) �– Is the value of a set of cash flows at some future point assuming a certain interest rate and the time value of money.
Gap Analysis �– Step Two in the CBA process. After evaluation of the current environment, the results of the current process are compared to the investment's stated objectives (i.e., a "to-be" environment). The outcome of this comparison enables determination of current environment shortfalls and identifies change opportunities. The gaps between where the organization is today and how it wants to look after the investment represent the opportunities for improvement.
General and Administrative (G&A) Cost �– G&A costs are costs that cannot be related or traced to a specific project, but benefit all activities. Such costs are allocated to a project based on a

CO
ST ESTIMA
TING
CO
ST RISK
SUPPO
RTIN
G A
NA
LYSISC
AR
EER D
EVELOPM
ENT G
UID
ER
EFEREN
CES
2008 NASA Cost Estimating Handbook Section 4. Glossary
Volume 6 Page 6-47
reasonable, consistent basis. Examples of G&A costs include costs associated with financial management, procurement, security, and legal activities.
Government-Off-The-Shelf (GOTS) �– GOTS are pre-packaged software or (less commonly) hardware purchase alternatives. The technical staff of the government agency for which it is created typically develops them. It is sometimes developed by an external entity, but with funding and specification from the agency. Because agencies can directly control all aspects of GOTS products, these are generally preferred for government purposes.
Grassroots Cost Estimating �– This costing methodology approach involves the computation of the cost of a WBS element by estimating the labor requirements (in terms of man-hours or man-years, for example) and the materials costs for the specific WBS line item. It is also referred to as �“bottoms-up,�” or engineering build-up estimating.
Ground Rules and Assumptions (GR&A) �– Ground rules and assumptions include both internal and external circumstances or events that are believed likely to happen. They describe the major decisions and the economic environment that affects the cost estimate. Ground rules and assumptions are based on the operation, maintenance and support of the system. Ground rules and assumptions generally include: the O&M period, base year of dollars, type of dollars, inflation indices, costs to be included or excluded, guidance on how to interpret the estimate properly, and clarification to the limit and scope in relation to acquisition milestones.
Independent Annual Review (IAR) �– An IAR provides the status and performance of the project to the NASA Program Management Council (PMC) and is conducted to validate conformance to the Program Commitment Agreement (PCA) by detailing the progress/milestone achievement against original baseline; cost, schedule, and technical content evaluation and review of the project over its entire life cycle, technical progress, risks remaining, and mitigation plans, and any project deficiencies that will result in revised projections exceeding predetermined thresholds .
Independent Cost Analysis (ICA) �– An independent analysis of program resources and financial management associated with the program content over the program�’s budget horizon, conducted by an impartial body independent from the management or advocacy chain of the program. ICA includes, but is not limited to, the assessment of cost estimates, budgets, and schedules in relation to the program and its constituent projects�’ technical content, performance, and risk. ICAs may include Independent Cost Estimates (ICE), assessment of resource management, distribution and planning, and verification of cost-estimating methodologies. (ICAs are not life-cycle cost estimates but are assessments of the adequacy of the budget and management practices to accomplish the work scope through the budget horizon; as such, ICAs can be performed for programs/projects when a life-cycle ICE is not warranted.)
Independent Cost Estimate (ICE) �– An independent project cost estimate prepared by an office or other entity that is not under the supervision, direction, advocacy, or control of the project (or its chain of command) that is responsible for carrying out the development or acquisition of the program/project. An ICE is bounded by the project scope (total life cycle through all phases), schedule, technical content, risk, ground rules, and assumptions and is conducted with objectivity and the preservation of integrity of the cost estimate. ICEs are generally developed

CO
ST ESTIMA
TING
CO
ST RISK
SUPPO
RTIN
G A
NA
LYSISC
AR
EER D
EVELOPM
ENT G
UID
ER
EFEREN
CES
2008 NASA Cost Estimating Handbook Section 4. Glossary
Volume 6 Page 6-48
using parametric approaches that are tailored to reflect the design, development state, difficulty, and expertise of team members.
Independent Life Cycle Cost Estimate �– A life cycle cost estimate developed outside normal channels which generally includes representation from cost analysis, procurement, production management, engineering and project management.
Independent Program Assessment Office (IPAO) �– The IPAO is a headquarters office located at Langley Research Center (LaRC). The IPAO role in cost estimating is to provide leadership and strategic planning for the cost estimation core competency by: interfacing with the Agency CFO and the Office of the Chief Engineer at NASA Headquarters regarding cost analysis requirements and processes, providing instruction on cost tool use, developing specialized cost tools, ensuring consistent, high-quality estimates across the Agency, fostering a �“pipeline�” of competent NASA analysts, providing independent, non-advocate cost estimates and cost-benefit analyses, and chairing the Cost Estimating Working Group and the annual NASA Cost Symposium Workshop.
Indirect Costs �– Costs, which, because of their incurrence for common or joint objectives, are not readily subject to treatment as direct costs.
Inflation �– An increase in the volume of money and credit relative to available goods and services resulting in a continuing rise in the general price level.
In-House Project �– One that is conducted onsite or in the immediate vicinity of a NASA Center in which most major technical, business, and management tasks are performed primarily by the Center�’s civil service workforce.
Integrated Baseline Review (IBR) �– An IBR is a formal project-level review that includes total project (contracted as well as in-house NASA) efforts. It is conducted jointly with personnel responsible for the efforts. Specifically, an IBR verifies that the technical content of the performance measurement baseline is consistent with the contract scope, work breakdown structure, and actual budget and schedule; ensures that effort personnel have identified all risks and are aware of their responsibilities for their management; ensures that there is a logical sequence of effort planned consistent with the contract schedule; ensures the disciplined implementation of all project Earned Value Management Systems (EVMS); establishes a forum through which the Program/Project Manager and the technical staff gain a sense of ownership of the cost/schedule management process; and establishes the baseline for the life of the contract. A term used to define a year that is: (1) the economic base for dollar amounts in a proposal estimate, (2) the base for rate calculation or projection, or (3) the starting point for the application of inflation factors.
Integrated Budget Development Plan (IBDP) �– NASA�’s consolidated budget document.
Integrated Financial Management (IFM) �– NASA new integrated financial management system used to track budget and project costs.
Integration Complexity Risk �– Includes risks associated with the number of data dependencies, the number of actual interfaces between this module and other modules, and the technical issues involved regarding programming and application solutions.

CO
ST ESTIMA
TING
CO
ST RISK
SUPPO
RTIN
G A
NA
LYSISC
AR
EER D
EVELOPM
ENT G
UID
ER
EFEREN
CES
2008 NASA Cost Estimating Handbook Section 4. Glossary
Volume 6 Page 6-49
Interest �– The service charge for the use of money or capital, paid at agreed to intervals by the user, and commonly expressed as an annual percentage of principal.
Internal Rate of Return (IRR) �– The Internal Rate of Return (IRR) is another ROI metric used to measure an investment. The IRR is defined as the rate at which a bond's future cash flows, discounted back to today, equal its price. It is also defined as discount rate at which the NPV equals zero. IRR can be estimated using the formula: IRR = NPV = PV Benefits - PV Costs = 0.
Learning Curve �– Learning curves, sometimes referred to as improvement curves or progress functions, are based on the concept that resources required to produce each additional unit decline as the total number of units produced increases. The term learning curve is used when an individual is involved and the terms progress function or an improvement curve is used when all the components of an organization are involved. The learning curve concept is used primarily for uninterrupted manufacturing and assembly tasks, which are highly repetitive and labor intensive.
Lease �– A lease is a long-term agreement between a user (lessee) and the owner of an asset (lessor) where periodic payments are made by the lessee in exchange for most of the benefits of ownership.
Lease vs. Buy Decision �– The Lease vs. Buy decision has three steps: estimate the cash flows associated with borrowing and buying the asset, estimate the cash flows associated with leasing and asset, and compare the two financing methods to determine which has the lower cost. The decision rule for the acquisition of an asset is: buy the asset if the equivalent annual cost of ownership and operation is less than the best lease rate that can be acquired from an outsider.
Lessee �– Renter or the user of the asset. Lessee contracts to make a series of payments to the lessor, and in return, gets to use the asset for the lease term.
Lessor �– Legal owner and normally is entitled to the tax privileges of ownership like depreciation deductions or investment tax credits, if they are available. At the end of the lease period, the equipment reverts to the lessor.
Level of Effort (LOE) �– Effort of a general or supportive nature which does not produce definite end products or results, i.e., contract for man-hours.
Life Cycle Cost (LCC) �– The total cost for all phases of a project or system including design, development, verification, production, operations, maintenance, and disposal.
Linear Regression �– A mathematical modeling technique that finds the linear equation parameters that satisfy the criteria of minimizing the sum of the squared errors between the actual values and those estimated by the equation. It is also referred to as Simple Regression.
Logical Decisions for Windows �– Software that allows evaluation of numerous alternatives based on a hierarchy of goals and objectives.

CO
ST ESTIMA
TING
CO
ST RISK
SUPPO
RTIN
G A
NA
LYSISC
AR
EER D
EVELOPM
ENT G
UID
ER
EFEREN
CES
2008 NASA Cost Estimating Handbook Section 4. Glossary
Volume 6 Page 6-50
Manual Software Estimation �– Manual software estimation typically utilizes a simple, straightforward methodology to derive effort, cost, and schedule. This includes analogy, engineering buildup, or cost estimating relationship (CER) factors.
Margin �– The allowances carried in budget, projected schedules, and technical performance parameters (e.g., weight, power, or memory) to account for uncertainties and risks. Margin allocations are baselined in the formulation process, based on assessments of risks, and are typically consumed as the program / project proceeds through the life cycle.
Market Risk �– Includes risks associated with the stability of vendors and their software and related tools and services within the market (in this case federal HR commercial off-the-shelf [COTS] product market).
Model �– A representation of a system broken into its component factors, or parts, such as to mimic or behave as the actual system would, were such parts or factors to be varied and intermixed. A model is used to gain knowledge about a system without actually executing the system.
Monte Carlo Simulation �– Calculates numerous scenarios of a model by repeatedly picking random values from the input variable distributions for each "uncertain" variable and calculating the results.
Multivariate Regression �– A mathematical modeling technique that relates two or more independent variables to a dependent variable through a predetermined equation that minimizes the sum of the squared error.
NASA / Air Force Cost Model (NAFCOM) �– A parametric estimating tool for space hardware that uses cost estimating relationships (CERs) that correlate historical costs to mission characteristic to predict new project costs.
NASA Research Announcement �– An NRA is used to announce research in support of NASA's programs, and, after peer or scientific review using factors in the NRA, select proposals for funding. Unlike an RFP containing a statement of work or specification to which offerors are to respond, an NRA provides for the submission of competitive project ideas, conceived by the offerors, in one or more program areas of interest. NRAs may result in grants, contracts or cooperative agreements.
Net Present Value (NPV) �– Is the sum of the present value of the estimated future benefits minus the present value of the initial investment/cash outflows. Nominal Discount Rate �– The nominal discount rate is adjusted to reflect expected inflation used to discount Then Year (inflated) dollars or nominal benefits and costs.
Non-Advocate Review (NAR) �– An independent verification of a candidate project�’s plans, LCC status, and readiness to proceed to the next phase of the projects life cycle. A Pre-NAR is conducted when the project is moving from Phase A to Phase B. A NAR is conducted when a project is moving from Phase B to Phase C.

CO
ST ESTIMA
TING
CO
ST RISK
SUPPO
RTIN
G A
NA
LYSISC
AR
EER D
EVELOPM
ENT G
UID
ER
EFEREN
CES
2008 NASA Cost Estimating Handbook Section 4. Glossary
Volume 6 Page 6-51
Non-Developmental Item (NDI) �– Non-Developmental Items (NDI) are items, other than real property, that are customarily used for Non-Government purposes.
Non-Linear Regression �– Is a mathematical technique of modeling a non-linear functional relationship. Non-linear regression can be performed using variable transformations or analytical techniques (such as Gauss-Newton interpolation).
Non-Quantifiable Benefits �– Are those that cannot be reduced to quantified values. Non-quantifiable benefits include enhanced information security, consistency and compatibility, improved quality, enhancement of best practices, adherence to statutory and regulatory requirements, and enhanced modernization.
Normalize �– A method to adjust data to a common predetermined basis. Cost data is often normalized to remove the effects of inflation and to adjust the project content to match a defined WBS.
Ontology: An ontology is required to achieve truly consistent communication between analysts and decision makers (re.NASA NExIOM Primer). Ontologies resemble faceted taxonomies but use richer semantic relationships among terms and attributes, as well as strict rules about how to specify terms and relationships. Because ontologies do more than just control a vocabulary, they are thought of as knowledge representation. The oft-quoted definition of ontology is "the specification of one's conceptualization of a knowledge domain." (from http://www.noisebetweenstations.com/personal/essays/metadata_glossary/metadata_glossary.html)
Operating and Maintenance Costs (O&M) �– Those operating expenditures incurred in the normal course of business to operate, maintain, support and update the system. O&M costs are a subset of recurring costs.
Ordinary Least Squares (OLS) �– Regression technique that works to find the best possible equation (relationship) between variables while minimizing the squares of error terms.
Parametric Cost Estimate �– An estimating methodology using statistical relationships between historical costs and other project variables such as system physical or performance characteristics, contractor output measures, or manpower loading, etc. Also referred to as "top down" estimating.
Parametric Estimation �– Involves the development and utilization of cost estimation relationships between historical costs and program, physical, and performance characteristics. The analysis uses analysis tools, or models, that relate hardware elements, complexity, and risks of failure to expected costs �– a parametric analysis.
Payback Period �– The payback period is the time required for the cumulative value of savings to be equal to the cumulative value of investment. The payback period measures the number of years needed to recover the investment or break even. The accept-reject criterion for this financial indicator is the ability of the program to equal or better the organization�’s required payback period.
Point Estimate �– An estimate with a single point result, rather than a probabilistic estimate with a cost range.

CO
ST ESTIMA
TING
CO
ST RISK
SUPPO
RTIN
G A
NA
LYSISC
AR
EER D
EVELOPM
ENT G
UID
ER
EFEREN
CES
2008 NASA Cost Estimating Handbook Section 4. Glossary
Volume 6 Page 6-52
Present Value �– Reflects in today�’s terms the value of future cash flows adjusted for the time value of money. Present value is calculated from the time series of constant dollars estimates, using the real discount rate as specified by OMB policy.
PRICE H/HL/M �– A suite of hardware parametric cost estimating models that estimate development, production, and operations and support costs. The suite allows for generating estimates at any WBS level, which includes integration and test cost calculations. The models operate in Microsoft Windows and interface with Microsoft Excel, Project, and other office tools. Monte Carlo risk simulations capability is available with the suite.
PRICE S �– A suite of software sizing, development cost, and schedule, along with associated software operations and support cost models. The models operate in Microsoft Windows and interface with Microsoft Excel, Project, and other office tools. Monte Carlo risk simulations capability is available with the suite.
Probability Density Function (PDF) �– In mathematics, a probability density function (pdf) is a function that represents a probability distribution in terms of integrals. Informally, a probability density function can be seen as a "smoothed out" version of a histogram: if one empirically samples enough values of a continuous random variable, producing a histogram depicting relative frequencies of output ranges, then this histogram will resemble the random variable's probability density, assuming that the output ranges are sufficiently narrow.
Productivity Paradox �– The productivity paradox is a phenomenon where the programming language that seems to have the best productivity metrics (e.g. effort per SLOC), actually results in the highest total cost because the language is less efficient than other, more modern programming languages.
Program �– A strategic investment by a Mission Directorate or Mission Support Office that has a defined architecture, and/or technical approach, requirements, funding level, and a management structure that initiates and directs one or more projects. A program defines a strategic direction that the Agency has identified as needed to implement Agency goals and objectives.
Program Commitment Agreement (PCA) �– is the agreement between the MDAA (Mission Directorate Associate Administrator) and the NASA AA (Associate Administrator) that authorizes transition from formulation to implementation. The PCA is prepared by the Mission Directorate with support from the Program Manager, as requested. The PCA documents Agency requirements, program objectives, management and technical approach and associated architecture, technical performance, schedule, cost, safety and risk factors, internal and external agreements, independent reviews, and all attendant top-level program requirements.
Program Office Estimate (POE) �– A detailed estimate of acquisition and ownership costs normally required for high-level decisions. The estimate is performed early in the program and serves as the base point for all subsequent tracking and auditing purposes.
Program Formulation Agreement (PFA) �– The PFA establishes resource estimates, cost risks, contingency reserves, and related Level 1 requirements for the formulation phase of a program�’s lifecycle.

CO
ST ESTIMA
TING
CO
ST RISK
SUPPO
RTIN
G A
NA
LYSISC
AR
EER D
EVELOPM
ENT G
UID
ER
EFEREN
CES
2008 NASA Cost Estimating Handbook Section 4. Glossary
Volume 6 Page 6-53
Program Work Breakdown Structure (WBS) �– A hierarchical structure, usually product oriented, that organizes, defines, and graphically displays the hardware, software, services, and other work tasks necessary to accomplish the program objectives.
Project �– a specific investment identified in a Program Plan having defined requirements, a life-cycle cost, a beginning, and an end. A project also has a management structure and may have interfaces to other projects, agencies, and international partners. A project yields new or revised products that directly address NASA�’s strategic needs.
Project Schedule Risk �– Schedule risk is defined as uncertainty in the project completion or fielding schedule, and the subsequent impact on costs and level of benefits. A stretched-out schedule may increase costs due to extended level-of-effort funding requirements, and result in delivery of systems too late to have the desired effect (reduced benefits). Project Schedule Risk should address factors such as the thoroughness of project approach and plan, the degree to which plans incorporate risk mitigation techniques, and the impact of not meeting or adjusting the project�’s anticipated timeline.
Quantifiable Benefits �– Quantifiable benefits are those that can be measured or assigned a numeric value, such as dollars, physical count of tangible items, time, revenue, or percentage change. Dollar valued benefits comprise cost reductions, cost avoidance, and productivity improvements. Quantifiable benefits are calculated by subtracting the cost of an alternative from the cost of baseline operations over the period of the estimate (normally 10 years for IT investments).
Real Discount Rate �– Discount rate adjusted to eliminate the effects of expected inflation used to discount Constant Year dollars or real benefits and costs.
Real Options Approach �– The real options approach is a financial technique for valuing investment alternatives. This approach is primarily a decision tool that indicates whether or not to proceed with an investment after pre-established decision points are reached. This approach is more suited to large scale, multi-year acquisition projects where NASA would need to decide whether to continue spending or abandon a specific project. This approach integrates NPV techniques with a decision-tree framework to determine the whether a project should proceed or be terminated.
Regression Analysis �– Examines the relation of a dependent variable (response variable) to specified independent variables (explanatory variables). The mathematical model of their relationship is the regression equation. The dependent variable is modeled as a random variable because of uncertainty as to its value, given only the value of each independent variable. A regression equation contains estimates of one or more hypothesized regression parameters ("constants"). These estimates are constructed using data for the variables, such as from a sample. The estimates measure the relationship between the dependent variable and each of the independent variables. They also allow estimating the value of the dependent variable for a given value of each respective independent variable.
Request for Proposal (RFP) �– A formal invitation containing a scope of work, which seeks a formal response (proposal) describing both methodology and compensation to form the basis of a
CO
ST ESTIMA
TING
CO
ST RISK
SUPPO
RTIN
G A
NA
LYSISC
AR
EER D
EVELOPM
ENT G
UID
ER
EFEREN
CES
2008 NASA Cost Estimating Handbook Section 4. Glossary
Volume 6 Page 6-54
contract. The Request For Proposal consists of a Solicitation Letter, Instructions to Bidders, Evaluation Criteria, Statement of Work, and a System Specification. The provider issues an RFP to potential subcontractors.
Reserve �– A provision in the project plan to mitigate cost and/or schedule risk. Often used with a modifier (e.g., management reserve, contingency reserve) to provide further detail on what types of risk are meant to be mitigated and indicate who holds the reserve.
Return on Investment (ROI) �– The strict meaning of ROI is "Return on Invested Capital." Most business people, however, use "ROI" simply to mean the incremental gain from an investment, divided by the cost of the investment. ROI is the net benefit expressed as a percentage of the investment amount:
ROI = NPV / PV Investment
REVIC �– Parametric software cost estimating tool distributed by the Air Force Cost Analysis Agency that implements the Intermediate Constructive Cost Model (COCOMO) developed and described by Dr. Barry Boehm in his book Software Engineering Economics.
Risk �– A situation in which the outcome is subject to an uncontrollable event stemming from a known probability distribution.
Risk Analysis �– Process of examining each identified risk area to: isolate the cause; investigate the associative risk effects (e.g. dependencies/correlations); and determine the probable impacts.
Risk Assessment �– Process of identifying and analyzing critical process and entity risks to increase the likelihood of meeting cost, performance (technical), and schedule objectives.
Rough Order of Magnitude (ROM) Estimates �– It is an estimated cost based on approximate cost models or expert analysis. It is usually based on top-level requirements or specifications, and an overall prediction of work to be done to satisfy the requirements. The ROM is usually used for financial planning purposes only.
Savings to Investment Ratio (SIR) �– The NPV of the savings divided by the NPV of the investment. The savings is the difference in the recurring costs between the status quo alternative and the proposed alternative. When the SIR equals one then discounted payback occurs.
Service Cost �– Service costs are costs that cannot be specifically and immediately identified to a project, but can subsequently be traced or linked to a project and are assigned based on usage or consumption. Examples of services costs include automatic data processing and fabrication.
Scope of Work �– The work involved in the design, fabrication and assembly of the components of a project's deliverable into a working product.
SEER-DFM �– A software tool used to evaluate product and manufacturing costs, including variables that affect the manufacturing process such as labor, assembly, process, part design, and material. (Design for Manufacturability)

CO
ST ESTIMA
TING
CO
ST RISK
SUPPO
RTIN
G A
NA
LYSISC
AR
EER D
EVELOPM
ENT G
UID
ER
EFEREN
CES
2008 NASA Cost Estimating Handbook Section 4. Glossary
Volume 6 Page 6-55
SEER-H �– A development and production estimation and management tool that predicts, measures, and analyzes resources, materials and schedules for an array of products and complex systems. It presents a view of the operational and maintenance costs of a product throughout its life cycle. (Hardware Estimation and Life Cycle Cost Analysis)
SEER-IC �– A complement to SEER-H, helps estimate custom integrated circuit development and production costs, generate specifications, and evaluate potential yields. (Custom Integrated Circuit Development)
SEER-SEM �– A development and program management tool that predicts, measures, and analyzes costs, schedules, risks, and reliability for software projects. (Software Estimation Model)
SEER-SSM �– A software-sizing tool that creates realistic and highly reliable estimates of a project�’s scope. (Software Sizing Model)
Sensitivity Analysis �– A technique used to discover how sensitive the results from cost, economic, and financial analyses are to changes in the input values of the variables used to calculate the results. A high degree of sensitivity is a warning to interpret the results of the model with care and circumspection, especially because many of the input variables themselves, will have been estimated and therefore be subject to error.
Should Cost Analysis �– A study of contract price, which reflects reasonably achievable contractor economy and efficiency. It is accomplished by a government team of procurement, contract administration, audit and engineering representatives performing an in-depth cost analysis at the contractor's and subcontractor's plants. Its purpose is to develop a realistic price objective for negotiation purposes.
Simulation �– A representation in time of a system, especially representing the interaction of parts of a system, including the effects of randomness and interference as the system parts interact with each other. A simulation is used to gain knowledge about a system operation without actually exercising the system.
Source Lines of Code (SLOC) �– Is a software metric used to measure the size of a software program by counting the number of lines in the text of the program's source code. SLOC is typically used to predict the amount of effort that will be required to develop a program, as well as to estimate programming productivity or effort once the software is produced.
Space Operations Cost Model (SOCM) �– A tool used to estimate space mission operations costs for future NASA projects. The estimating methodology is based on a mix of parametric estimating relationships derived from collected data and constructive approaches capturing assessments of advanced technology impacts and reflecting experience from current mission planning teams. At completion, SOCM will include modules for Planetary and Earth Orbiting robotic science missions, Orbiting Space Facilities, Launch/Transportation Systems, and Human Spaceflight (Lunar/Mars) missions.
Spiral Development �– A form of evolutionary acquisition in which a desired goal or functional capability is identified, but the end-state requirements are not known at the outset. Those requirements are refined through test and demonstration, risk management, and continual
CO
ST ESTIMA
TING
CO
ST RISK
SUPPO
RTIN
G A
NA
LYSISC
AR
EER D
EVELOPM
ENT G
UID
ER
EFEREN
CES
2008 NASA Cost Estimating Handbook Section 4. Glossary
Volume 6 Page 6-56
user/operator feedback. Each spiral is an incremental step toward the desired goal or functional capability. Spiral development is seen as an approach to rapidly field systems incorporating the latest available technologies resulting from technology maturation investments. In spiral development, the product to be delivered is not specified at the outset, but instead, contractors and the Agency work in partnership to find the best way to meet the desired goal or functional capability.
Status Quo System �– The system as it currently exists.
Target Costing �– Structured approach to determine the cost at which a system or product with specified performance and reliability must be produced to shift the decision point toward proceeding with the project.
Technical Risk �– Technical risk is defined as uncertainty in the system performance or �“benefits.�” Technical risk may result from an immature technology, use of a lower-reliability component, degree to which products employ the latest standards in technology and design, availability of skilled resources to support the product, and then degree of tailoring required. Technical risk can be reflected in increased costs (to fix the technical problem) and lower overall system benefits.
Then-Year Dollars (TY) �– Dollars that are escalated into the time period of performance of a contract. Sometimes referred to as escalated costs, or inflated costs.
Time Phased Costs �– Costs that have been allocated to a schedule (e.g. deployment schedule and/or operating concept).
Time Value of Money �– The time value of money refers to the fact that a dollar in hand today is worth more than a dollar promised at some future time. By compounding and discounting, the time value of money adjusts cash flow to reflect the increased value of money when invested. The time value of money also reflects that benefits and costs are worth more if they are realized earlier.
Tool-Driven Software Estimation �– Parametric tools that are based on data collected from hundreds or thousands of actual projects. The algorithms that drive them are derived from the numerous inputs to the models from personnel capabilities and experience and development environment to amount of code reuse and programming language.
Total Cost of Ownership (TCO) �– Is the total cost to the Agency for a course of action. TCO reflects not only the cost of development or purchase but all aspects in the further use, operations, and maintenance of equipment, devices, or systems considered. This includes the costs of training support personnel and the users of the system, costs associated with failure or outage, diminished performance incidents, costs of security breaches (in loss of reputation and recovery costs), costs of disaster preparedness and recovery, floor space, electricity, testing expenses, quality assurance, marginal incremental growth, decommissioning, etc.
TOC is comprised of cost to research, develop, acquire, own, operate, and dispose of weapon and support systems, other equipment and real property, the costs to recruit, train, retain, separate

CO
ST ESTIMA
TING
CO
ST RISK
SUPPO
RTIN
G A
NA
LYSISC
AR
EER D
EVELOPM
ENT G
UID
ER
EFEREN
CES
2008 NASA Cost Estimating Handbook Section 4. Glossary
Volume 6 Page 6-57
and otherwise support military and civilian personnel, and other cost of business operations in DoD.
Trade Study �– A technique for comparing alternatives for the purpose of deciding which of them is preferred. Trade studies (also known as trade-off analyses) support decisions throughout the systems engineering process, including (but not limited to) functional allocation choices, performance requirements definition, physical architecture and design choices, technology selection, and risk management. Trade studies may be formal, as in the case of an Analysis of Alternatives (AoA), or informal using engineering judgment or �“back-of-the-envelope�” analyses, but in either case, the selection of the preferred alternative is based on specific quantitative criteria.
Unallocated Future Expense (UFE) �– Refers to any funding which is not being allocated by the project to specific WBS level 2 accounts. The term UFE is being used to make it clear that these are funds that are expected to be required to complete the project, but cannot yet be allocated to a specific WBS activity. The UFE is composed of two parts: those held by the project and those held by the MD or program.
Uncertainty �– A situation in which the outcome is subject to an uncontrollable event stemming from an UNKNOWN probability distribution.
Unit Curve �– One of the two types of learning curve approaches. The unit curve calculates the unit value for a specific quantity point. Using the unit curve approach, the unit cost is reduced by a constant percentage. Also referred to as the Crawford or Boeing curve.
Value Engineering �– A cost reduction methodology aimed at reducing the cost of a product or service in its production and/or operational phase. This is achieved by elimination, alteration, modification, or substitution of items without adversely affecting product performance or features.
Variable Cost �– costs of an activity (manufacturing, production, assembly, operation, maintenance, etc) that vary with the measure of the product or service output. These costs may be direct or in-direct. Being identified as variable requires a connection of the cost to the product or service being produced. This cost may be visible and direct, or allocated, less traceable and in-direct.
Variance �– A measure of the degree of spread among a set of values; a measure of the tendency of individual values to vary from the mean value. It is computed by subtracting the mean value from each value, squaring each of these differences, summing these results, and dividing this sum by the number of values in order to obtain the arithmetic mean of these squares.
Vendor Quote �– An estimated cost provided by a vendor for a specific product or service.
Work Breakdown Structure (WBS) �– A technique for representing all the components, software, services and data contained in the project scope statement. It establishes a hierarchical structure or product oriented "family tree" of elements. It is used to organize, define and graphically display all the work items or work packages to be done to accomplish the project's objectives.

CO
ST ESTIMA
TING
CO
ST RISK
SUPPO
RTIN
G A
NA
LYSISC
AR
EER D
EVELOPM
ENT G
UID
ER
EFEREN
CES
2008 NASA Cost Estimating Handbook Section 4. Glossary
Volume 6 Page 6-58
�“What-If�” Analyses �– The process of evaluating alternative strategies.
Wrap Rate �– NASA wrap rates can be defined as those additional charges that should be included in project/program estimates because they are a part of doing business from which projects/programs receive benefit. Examples (not all inclusive) of these charges or additional costs can include such items as: system engineering, project management, workstation maintenance, application programming, computer usage, facilities, and fabrication.
CO
ST ESTIMA
TING
CO
ST RISK
SUPPO
RTIN
G A
NA
LYSISC
AR
EER D
EVELOPM
ENT G
UID
ER
EFEREN
CES
2008 NASA Cost Estimating Handbook Section 5. Acknowledgements
Volume 6 Page 6-59
Section 5. Acknowledgements
The material for this handbook was drawn from many different sources, including Center cost estimating procedures, NASA Procedural Requirement (NPRs), and industry best practices. To gather the most up-to-date information for this handbook we gathered data from subject matter experts from NASA Centers including cost estimators, resource analysts and project managers. Our thanks go to all participants and we acknowledge your important contribution to this 2008 edition of the NASA CEH.
Location Name
NASA Headquarters (HQ) Rey Carpio Tom Coonce Claude Freaner David Graham Johanna Gunderson Cynthia Lodge Kevin McCulla
Sheryl McGurk Arlene Moore Eric Plumer Brian Rutkowski David Schurr Michael Wethington Mary Beth Zimmerman
Ames Research Center (ARC) Al Kile John Lee
Dryden Space Flight Center (DFRC) Steve Sterk
Glenn Research Center (GRC) Christopher Blake Tom Parkey
Dean Robertson Bob Sefcik
Goddard Space Flight Center (GSFC) Jonathan Bryson
Jet Propulsion Laboratory (JPL) Fred Doumani Jill Hardash Edward Jorgensen
Leigh Rosenberg Bob Shishko Sherry Stukes
Johnson Space Center (JSC) Steve Campbell Jesse Contreras Kelly Cyr
John Falker Perri Fox
Kennedy Space Center (KSC) Franci Brice Kristen Kehrer
Edgar Zapata
Langley Research Center (LaRC) Trina Chytka Debra Schroeder
Marshall Space Flight Center (MSFC) Steve Creech Joe Hamaker
Andy Prince Virginia Tickles
Stennis Space Center (SSC) Gigi Savona

CO
ST ESTIMA
TING
CO
ST RISK
SUPPO
RTIN
G A
NA
LYSISC
AR
EER D
EVELOPM
ENT G
UID
ER
EFEREN
CES
2008 NASA Cost Estimating Handbook Section 6. Index
Volume 6 Page 6-60
Section 6. Index
ACEIT, 2-44, 2-47, 2-48, 2-49, 6-19, 6-29, 6-39
Affordability, 1-49, 3-28, 3-29, 6-30
Analytic Approach, 2-15
Announcement of Opportunity (AO), 1-16, 3-36, 6-29, 6-38
Beta Curve, 3-9, 3-10, 3-11, 6-39
Business Case Analysis, 3-4, 3-11, 3-12, 3-13, 6-29, 6-39
Business Management, 4-29
CADRe, 1-15, 1-16, 1-20, 1-22, 1-23, 1-24, 1-25, 1-26, 1-36, 1-42, 1-47, 1-48, 1-49, 1-50, 1-52, 1-54, 1-55, 2-6, 2-7, 2-9, 2-36, 3-39, 3-45, 3-46, 6-2, 6-5, 6-8, 6-9, 6-10, 6-30, 6-41, 6-43
Career Path, 4-2, 4-7, 5-5, 5-9
Certification, 4-14, 4-15, 4-52, 5-4, 6-36
Competencies, 4-9, 4-34, 4-38, 4-44
Confidence Levels, 1-12, 2-10, 2-18
Construction of Facilities, 3-37, 6-30, 6-45
Core Curriculum, 4-52
Cost Analysis Division, 1-14, 1-35, 1-37, 1-47, 1-48, 1-52, 1-54, 2-3, 2-8, 4-1, 5-7, 6-2, 6-3, 6-4, 6-8, 6-9, 6-11, 6-16, 6-18, 6-41
Cost Analysis Steering Group (CASG), 1-14, 3-2, 5-4, 5-5, 5-6, 6-2, 6-3, 6-4, 6-5, 6-10, 6-15, 6-18, 6-41
Cost as an Independent Variable, 1-52, 2-47, 3-4, 3-5, 3-6, 3-29, 3-46, 3-47, 6-30, 6-42
Cost Estimating Community, 1-6, 1-13, 3-30, 6-1, 6-30, 6-42
Cost Estimating Process, 1-19, 1-27, 2-12
Cost Methodology Tasks, 1-25, 3-45
Cost Readiness Level (CRL), 1-41, 1-42, 1-44, 1-45, 1-46, 1-50, 1-52, 1-54, 6-12, 6-14, 6-43
Cost risk assessment, 1-39, 2-10
Data Requirements Documents (DRDs), 1-24, 6-5
Development Plan, 4-2, 4-3, 4-17, 4-26, 4-27, 4-43, 6-31, 6-44, 6-48
Discrete Risk, 2-37, 2-38
Distribution Curve, 2-17, 2-19
Earned Value Management, 1-17, 1-21, 1-22, 1-52, 1-53, 1-54, 1-55, 2-6, 2-7, 2-8, 2-9, 3-26, 3-27, 3-28, 4-44, 4-45, 4-46, 4-52, 4-53, 4-54, 4-55, 4-57, 6-5, 6-31, 6-44, 6-48
Estimate Tasks, 1-38, 3-47
Federal Acquisition Regulation (FAR), 5-7, 6-15, 6-23
Federal Budget, 1-7, 1-8, 4-45, 4-52, 4-55
Full Cost, 1-12, 1-24, 1-25, 3-33, 3-34, 3-35, 3-36, 6-8, 6-15, 6-32, 6-46
Function Point, 3-40, 3-41, 6-25, 6-26, 6-32, 6-46
GR&A, 1-25, 1-26, 1-32, 1-34, 1-38, 1-39, 1-50, 1-53, 3-45, 3-47, 6-32, 6-47
Independent Annual Review (IAR), 1-16, 6-32, 6-41, 6-47
Independent Cost Estimate (ICE), 1-15, 1-16, 1-17, 1-47, 1-48, 1-51, 1-52, 2-3, 2-7, 3-38, 6-21, 6-32, 6-47
Inflation, 1-37, 1-41, 3-1, 3-2, 3-14, 6-2, 6-10, 6-15, 6-16, 6-48
Integrated Budget Performance Document, 1-7, 1-11, 6-32
IPAO, 1-12, 1-14, 1-15, 1-46, 1-48, 1-52, 2-2, 2-3, 5-7, 6-2, 6-3, 6-4, 6-8, 6-10, 6-11, 6-12, 6-13, 6-14, 6-33, 6-41, 6-48
Job Category, 4-27, 4-29, 4-52
Jump Start Program, 6-14
Key Engineering Performance Parameters (KEPPs), 1-46, 2-13, 2-37, 2-38, 6-33
Learning curves, 3-6, 6-49
Life Cycle Cost (LCC), 1-3, 1-15, 1-17, 1-25, 1-26, 1-38, 1-41, 1-42, 1-45, 1-48, 1-50, 1-51, 2-3, 2-13, 2-14, 2-16, 2-26, 3-5, 3-11, 3-28, 3-

CO
ST ESTIMA
TING
CO
ST RISK
SUPPO
RTIN
G A
NA
LYSISC
AR
EER D
EVELOPM
ENT G
UID
ER
EFEREN
CES
2008 NASA Cost Estimating Handbook Section 6. Index
Volume 6 Page 6-61
31, 3-44, 4-50, 4-53, 4-62, 6-5, 6-33, 6-35, 6-36, 6-39, 6-48, 6-49, 6-50, 6-55
Life Cycle Management, 1-2, 1-4, 4-45, 4-49, 4-55, 4-61
Mentoring, 4-34, 4-36, 4-49, 4-61, 4-65
Model Prospectus, 1-30, 1-34, 3-44, 3-45, 3-46, 6-2, 6-17, 6-18
NAFCOM, 1-22, 1-30, 1-46, 1-51, 2-20, 2-21, 2-26, 2-27, 2-44, 2-45, 2-46, 2-47, 2-59, 4-46, 4-52, 4-53, 4-57, 6-19, 6-27, 6-34, 6-50
NASA Research Announcement (NRA), 1-16, 1-17, 3-36, 6-34, 6-50
NASA Strategic Plan, 1-10, 1-46, 6-1, 6-17
Net Present Value, 1-42, 3-16, 3-17, 3-18, 3-19, 3-30, 3-31, 6-34, 6-49, 6-50, 6-53, 6-54
Non Advocate Review (NAR), 1-15, 1-24, 1-46, 1-47, 1-48, 1-49, 1-50, 1-51, 1-52, 6-12, 6-34, 6-41, 6-50
NPD 7120.4 Program/Project Management, 2-4, 3-33, 4-29, 4-31, 4-46, 4-49, 4-50, 4-55, 4-59, 4-61, 4-62, 5-8, 6-1
NPD1000.0 Strategic Management and Governance Handbook, 2-4, 5-7, 6-1, 6-10
NPR 7120.5, 1-1, 1-14, 1-15, 1-17, 1-22, 1-24, 2-4, 2-5, 2-9, 2-40, 3-4, 3-13, 3-27, 3-28, 3-29, 3-33, 3-37, 6-1, 6-8, 6-10, 6-11
NPR 7123.1 NASA Systems Engineering Processes and Requirements, 3-29, 5-8, 6-1, 6-20
NPR 8000.4, 2-5, 6-1
NPR 9501.2 NASA Contractor Financial Management Reporting, 5-8
One NASA Cost Engineering Database, 1-24, 1-55, 6-2, 6-9, 6-10, 6-34
Operations and Support, 1-2, 1-23, 1-26, 1-51, 1-55, 2-57, 3-44, 3-45, 3-46, 3-47, 3-48, 4-48, 4-61, 6-34
Portfolio, 2-39, 2-68, 3-31
PPBE, 1-8, 1-9, 1-10, 1-11, 6-35, 6-43
Present Value, 3-12, 3-13, 3-14, 3-15, 3-16, 3-17, 3-18, 3-19, 3-30, 6-34, 6-35, 6-44, 6-49, 6-52, 6-54
President's Management Agenda (PMA), 1-5, 6-35
PRICE, 1-22, 1-30, 1-46, 1-51, 2-42, 2-59, 3-43, 4-46, 4-48, 4-57, 4-60, 4-62, 4-64, 6-14, 6-15, 6-19, 6-27, 6-35, 6-52
Project Definition Tasks, 1-20, 3-45
Real Option, 3-29, 3-30, 3-31, 6-26, 6-53
Return on Investment, 1-51, 3-12, 3-13, 3-18, 3-19, 6-35, 6-49, 6-54
Scenario Based Approach, 2-27, 2-60, 2-67
Schedule Analysis, 3-20
S-curve, 1-39, 1-40, 1-42, 2-3, 2-8, 2-40, 2-41, 3-47, 6-14
SEER, 1-22, 1-30, 1-46, 1-51, 2-43, 2-44, 2-59, 3-43, 4-46, 4-48, 4-52, 4-53, 4-57, 4-60, 4-64, 6-14, 6-15, 6-19, 6-27, 6-35, 6-36, 6-54, 6-55
Sensitivity Analysis, 2-20, 2-31, 2-32, 2-39, 2-52, 2-60, 6-55
Simulation Approach, 2-21, 2-60, 2-61, 2-66
Slope, 3-8
Source Lines of Code, 3-5, 3-39, 3-40, 3-41, 3-42, 3-43, 6-36, 6-52, 6-55
SSCAG, 2-21, 2-25, 2-26, 2-37, 2-39, 2-53, 2-54, 2-58, 4-15, 6-25
Technology Readiness Level, 2-33, 6-20, 6-21, 6-36, 6-43
Trade Studies, 3-3
Unallocated Future Expense, 1-40, 2-2, 2-3, 2-14, 2-17, 2-20, 2-26, 2-39, 2-40, 2-41, 2-56, 2-57, 6-37, 6-57
Work Breakdown Structure (WBS), 1-11, 1-15, 1-18, 1-19, 1-21, 1-22, 1-23, 1-24, 1-26, 1-32, 1-38, 1-45, 1-48, 1-50, 1-54, 2-2, 2-4, 2-8, 2-9, 2-10, 2-11, 2-12, 2-13, 2-20, 2-21, 2-24, 2-25, 2-26, 2-27, 2-29, 2-30, 2-31, 2-32, 2-33, 2-35, 2-36, 2-37, 2-38, 2-40, 2-44, 2-46, 2-47, 2-48, 2-54, 2-55, 2-59, 2-60, 2-62, 2-64, 2-65, 2-67, 2-68, 3-20, 3-39, 3-45, 4-1, 4-29, 6-2, 6-5, 6-6, 6-9, 6-12, 6-13, 6-20, 6-23, 6-37, 6-40, 6-43, 6-47, 6-51, 6-52, 6-53, 6-57

National Aeronautics and Space AdministrationNASA HeadquartersCost Analysis Division300 E Street SWWashington, DC 20546-0001
202-358-1002
http://www.nasa.gov/offices/pae/organization/cost_analysis_division.html
Booz Allen Hamilton, Inc.Key Tower, Suite 5300127 Public SquareCleveland, Ohio 44114-1313
216-696-1900www.boozallen.com
About the CoverWhile cruising around Saturn in early October 2004, Cassini captured a series of images that have been composed into the largest, most detailed, global natural color view of Saturn and its rings ever made. This grand mosaic consists of 126 images acquired in a tile-like fashion, covering one end of Saturn's rings to the other and the entire planet in between. The images were taken over the course of two hours on Oct. 6, 2004, while Cassini was approximately 6.3 million kilometers (3.9 million miles) from Saturn. Since the view seen by Cassini during this time changed very little, no re-projection or alteration of any of the images was necessary. Three images (red, green and blue) were taken of each of 42 locations, or "footprints", across the planet. The full color footprints were put together to produce a mosaic that is 8,888 pixels across and 4,544 pixels tall. The smallest features seen here are 38 kilometers (24 miles) across. Many of Saturn's splendid features noted previously in single frames taken by Cassini are visible in this one detailed, all-encompassing view: subtle color variations across the rings, the thread-like F ring, ring shadows cast against the blue northern hemisphere, the planet's shadow making its way across the rings to the left, and blue-grey storms in Saturn's southern hemisphere to the right. Tiny Mimas and even smaller Janus are both faintly visible at the lower left. The Sun-Saturn-Cassini, or phase, angle at the time was 72 degrees; hence, the partial illumination of Saturn in this portrait. Later in the mission, when the spacecraft's trajectory takes it far from Saturn and also into the direction of the Sun, Cassini will be able to look back and view Saturn and its rings in a more fully-illuminated geometry. The Cassini-Huygens mission is a cooperative project of NASA, the European Space Agency and the Italian Space Agency. The Jet Propulsion Laboratory, a division of the California Institute of Technology in Pasadena, manages the mission for NASA's Science Mission Directorate, Washington, D.C. The Cassini orbiter and its two onboard cameras were designed, developed and assembled at JPL. The imaging team is based at the Space Science Institute, Boulder, Colo.

National Aeronautics and Space AdministrationNASA HeadquartersCost Analysis Division300 E Street SWWashington, DC 20546-0001
202-358-1002
www.ceh.nasa.gov
Booz Allen Hamilton, Inc.Key Tower, Suite 5300127 Public SquareCleveland, Ohio 44114-1313
216-696-1900www.boozallen.com