© 2008 witcha imaram - university of...
TRANSCRIPT

1
REACTION OF PEROXYNITRITE AND URIC ACID STUDIED BY ESR SPIN TRAPPING AND MASS SPECTROMETRY: FREE RADICAL FORMATION AND PRODUCT
IDENTIFICATION
By
WITCHA IMARAM
A DISSERTATION PRESENTED TO THE GRADUATE SCHOOL OF THE UNIVERSITY OF FLORIDA IN PARTIAL FULFILLMENT
OF THE REQUIREMENTS FOR THE DEGREE OF DOCTOR OF PHILOSOPHY
UNIVERSITY OF FLORIDA
2008

2
© 2008 Witcha Imaram
3
To my parents, to my brother, and to my grandparents

4
ACKNOWLEDGMENTS
I particularly owe my deepest gratitude to my advisor Dr. Alexander Angerhofer for his
encouragement, valuable guidance and support throughout this study. I would like to express my
sincere gratitude to Dr. Richard J. Johnson for inspiring me to be involved in the exciting field of
biochemistry, in uric acid study. I am pleased to thank Dr. George N. Henderson for making the
MS work a reality, as well as his invaluable suggestions and discussion. I would like to thank my
doctoral dissertation committee members (Dr. William R. Dolbier, Dr. Lisa McElwee-White, and
Dr. Kirk S. Schanze) for their input and constructive comments. This study was supported by
grants from Gatorade and the University of Florida through an opportunity grant from its
Division of Sponsored Research, and by the University of Florida Chemistry Department. I am
grateful for the graduate stipend and tuition sponsored by the Development and Promotion of
Science and Technology Talent Project (DPST) scholarship from the Institute for the Promotion
of Teaching Science and Technology, Thailand.
I would also like to take this opportunity to further express my appreciation to my uric acid
project collaborators Dr. Christine Gersch, Dr. Sergiu P. Palii, and Dr. Kyung Mee Kim for their
invaluable training and guidance. I am also thankful to Dr. Yuri Y. Sautin for his helpful
suggestion. In addition to Dr. George N. Henderson and Dr. Kyung Mee Kim, I owe a debt of
gratitude to my MS collaborators Dr. David H. Powell and Dr. Jodie V. Johnson of the Mass
Spectrometry Services at the University of Florida Chemistry Department.
I am grateful to my colleagues and friends Dimitri Dascier, Fabrizio Guzzetta, Dooho Park
Vijay B. Krishna, Jirapat Jangjamras, Yun Wang, Suwussa Bamrungsap, and Pattaraporn
Vanachayangkul for their help, suggestion, and friendship.
5
I thank Dr. Ben Smith, Graduate Coordinator and chemistry departmental staff members
Lori Clark, Beth Douglas, and Vivian Thompson for their help and advice. I gratefully
acknowledge Rich Athey for his friendship and critical reading of this dissertation.
Finally, I would like to acknowledge my parents who have always supported, encouraged,
and inspired me to complete my dream.
6
TABLE OF CONTENTS
page
ACKNOWLEDGMENTS.................................................................................................................... 4
LIST OF TABLES................................................................................................................................ 9
LIST OF FIGURES ............................................................................................................................ 10
ABSTRACT ........................................................................................................................................ 14
CHAPTER
1 INTRODUCTION....................................................................................................................... 16
General Overview of Electron Spin Resonance Spin Trapping ............................................... 16 Uric Acid...................................................................................................................................... 18
Generation and Degradation ............................................................................................... 18 Uric Acid: The Oxidant-Antioxidant Paradox ................................................................... 20
Peroxynitrite ................................................................................................................................ 22 Peroxynitrite vs. Uric Acid ......................................................................................................... 25 Research Objectives .................................................................................................................... 26
2 RADICAL FORMATION FROM THE REACTION BETWEEN URIC ACID AND PEROXYNITRITE ..................................................................................................................... 28
Introduction ................................................................................................................................. 28 Materials and Methods ................................................................................................................ 29
Chemicals ............................................................................................................................. 29 ESR Experiments ................................................................................................................. 29 Sample Preparation for Liquid Chromatography-Mass Spectrometry ............................. 29 Liquid Chromatography-Mass Spectrometry Analysis ..................................................... 29
Fullscan liquid chromatography-mass spectrometry. ................................................ 30 Liquid chromatography-mass spectrometry tandem mass spectrometry
analysis. ..................................................................................................................... 30 Results .......................................................................................................................................... 30
Electron Spin Resonance Spin Trapping ............................................................................ 30 Product Identification of the Radical Adducts by Liquid Chromatography-Mass
Spectrometry Analysis ..................................................................................................... 35 Discussion .................................................................................................................................... 36
3 REACTIONS OF PEROXYNITRITE WITH MONO-, DI-, AND TRI-METHYLURIC ACIDS STUDIED BY LIQUID CHROMATOGRAPHY-MASS SPECTROMETRY AND ELECTRON SPIN RESONANCE SPECTROSCOPY ................................................. 46
Introduction ................................................................................................................................. 46 Materials and Methods ................................................................................................................ 47

7
Chemicals. ............................................................................................................................ 47 ESR Spin Trapping Experiments ........................................................................................ 48 Product Identification of the Reactions Conducted in Phosphate Buffer......................... 49 Product Identification of the Reactions Conducted in Methanol...................................... 50
Results .......................................................................................................................................... 52 Electron Spin Resonance Spin Trapping. ........................................................................... 52 Liquid Chromatography-Mass Spectrometry Analysis of the Reactions Conducted
in Phosphate Buffer. ........................................................................................................ 54 Liquid Chromatography-Mass Spectrometry Analysis of the Reactions Conducted
in Methanol....................................................................................................................... 55 Discussion .................................................................................................................................... 62
Reactions in Phosphate Buffer. ........................................................................................... 62 Reactions in Methanol. ........................................................................................................ 63
4 ESR SPIN TRAPPING OF THE REACTION BETWEEN URIC ACID AND PEROXYNITRITE: THE HYDROGEN ADDUCT ................................................................ 70
Introduction ................................................................................................................................. 70 Materials and Methods ................................................................................................................ 70
Chemicals. ............................................................................................................................ 70 pH Dependence Experiments on Urate-Peroxynitrite Reactions...................................... 70 Effect of Spin Trapping Agents on the Hydrogen Adduct Formation ............................. 71 Electron Spin Resonance Parameters ................................................................................. 71
Results .......................................................................................................................................... 71 pH Dependence Studies on Urate-Peroxynitrite Reactions .............................................. 71 Electron Spin Resonance Spin Trapping by PBN and POBN .......................................... 72
Discussion .................................................................................................................................... 76
5 CONCLUSIONS AND SUGGESTIONS FOR FUTURE WORK ......................................... 81
Conclusions ................................................................................................................................. 81 Suggestions for Future Work...................................................................................................... 82
APPENDIX
A LC CHROMATOGRAMS AND ELECTROSPRAY MASS SPECTRA OBTAINED FROM THE REACTIONS OF VARIOUS METHYLATED URIC ACIDS WITH PEROXYNITRITE CONDUCTED IN PHOSPHATE BUFFER ........................................... 84
B LC CHROMATOGRAMS OBTAINED FROM THE REACTIONS OF VARIOUS METHYLATED URIC ACIDS WITH PEROXYNITRITE CONDUCTED IN METHANOL ............................................................................................................................... 91
C FRAGMENTATION PATTERNS OF DIMETHOXYDEHYDROURIC ACIDS................ 98

8
D EFFECT OF DIVALENT METAL IONS ON THE REACTION BETWEEN URIC ACID AND PEROXYNITRITE .............................................................................................. 107
Introduction ............................................................................................................................... 107 Materials and Methods .............................................................................................................. 107
Chemicals ........................................................................................................................... 107 Electron Paramagnetic Resonance Parameters ................................................................ 107 Reaction Mixtures .............................................................................................................. 107
Results and Discussion ............................................................................................................. 108
LIST OF REFERENCES ................................................................................................................. 112
BIOGRAPHICAL SKETCH ........................................................................................................... 120
9
LIST OF TABLES
Table page 3-1 Hyperfine coupling constants a (Gauss) of PBN-radical adducts from the reaction
between uric acid and methylated uric acids with peroxynitrite at pH 7.4, and their relative ESR intensities compared to uric acid. .................................................................... 53
3-2 Reaction percent conversions and product yields of uric acids with one equivalent of peroxynitrite based on LC-MS analysis of the reaction products. ...................................... 55

10
LIST OF FIGURES
Figure page 1-1 Examples of nitrone spin trapping agents. ............................................................................ 18
1-2 Oxidative reaction of urate by xanthine oxidase (XO). ....................................................... 21
1-3 Scheme summarized the chemistry of peroxynitrite ............................................................ 23
1-4 Geometrical isomers of peroxynitrite. .................................................................................. 23
2-1 ESR spectra of PBN radical adducts ..................................................................................... 31
2-2 Effect of urate concentration on the production yield of the PBN-radical adduct. ............ 32
2-3 Effect of peroxynitrite concentration on the production yield of the PBN-radical adduct ...................................................................................................................................... 33
2-4 Effect of pH on the production yield of the PBN-radical adduct ........................................ 34
2-5 Effect of CO2 on the production yield of the PBN-radical adduct ..................................... 35
2-6 LC-MS study of the reaction between urate and peroxynitrite in phosphate buffer pH 7.4. ........................................................................................................................................... 37
2-7 MS/MS spectrum of the PBN-aminocarbonyl radical adduct. ............................................ 38
2-8 MS/MS spectrum of the PBN-triuretcarbonyl radical adduct. ............................................ 38
2-9 Fragmentation pattern of the hydroxylamine form of PBN-aminocarbonyl radical adduct. ..................................................................................................................................... 40
2-10 Fragmentation pattern of the hydroxylamine form of PBN-triuretcarbonyl radical adduct. ..................................................................................................................................... 41
2-11 Structures of PBN-radical adducts of aminocarbonyl radical 2, and triuretcarbonyl radical 3................................................................................................................................... 42
2-12 Proposed radical formation mechanism of the reaction between urate and peroxynitrite............................................................................................................................ 45
3-1 Structures of uric acid, monomethyluric acid, dimethyluric acid, and trimethyluric acid .......................................................................................................................................... 47
3-2 ESR spectra of the PBN-radical adducts from the reaction between uric acid and its methyl derivatives with peroxynitrite. .................................................................................. 52

11
3-3 LC-MS study of the reaction between uric acid and peroxynitrite in phosphate buffer pH 7.4.. .................................................................................................................................... 54
3-4 Proposed structures of the reaction products obtained from the reaction between uric acid (or various methylated uric acid analogues) and peroxynitrite. .................................. 56
3-5 LC-MS study of the reaction between uric acid and peroxynitrite in the presence of methanol.................................................................................................................................. 58
3-6 LC-MS study of the reaction between uric acid and peroxynitrite in the presence of d4-methanol. ............................................................................................................................ 59
3-7 Fragmentation pattern of uric acid glycol dimethyl ether 3a. ............................................. 60
3-8 Fragmentation pattern of uric acid glycol di-d3-methyl ether 3a. ....................................... 61
3-10 Steric hindrance between the methyl group of triuret moiety and the phenyl group of PBN prevents the PBN-radical adduct formation. ............................................................... 63
3-11 Proposed mechanism of the reaction between urate or methylurate derivatives with no methyl group at postion 3 and peroxynitrite, leading to the formation of various products. .................................................................................................................................. 66
3-12 Proposed mechanism of the reaction between methylurate derivatives with a methyl group at position 3 and peroxynitrite, leading to the formation of various products......... 67
3-13 Proposed mechanism of the formation of 9-methylurate-peroxynitrite adduct. ................ 68
4-1 pH dependence study of the urate-peroxynitrite reaction in Tris-buffer. ........................... 72
4-2 ESR spectrum of the PBN-radical adduct at pH 7.4. ........................................................... 73
4-3 ESR spectrum of the POBN-radical adduct at pH 7.4. ........................................................ 74
4-4 ESR spectrum of the PBN-radical adduct at pH 12 ............................................................. 74
4-5 ESR spectrum of the POBN-radical adduct at pH 12. ......................................................... 75
4-6 ESR spectra of the control reactions (without uric acid). .................................................... 75
4-7 Mechanism scheme shows the possible pathway of the PBN-H adduct formation. .......... 79
4-8 Resonance stabilization of POBN and PBN radical cations. .............................................. 80
A-1 LC-MS study of the reaction between 1-methyluric acid and peroxynitrite in phosphate buffer pH 7.4......................................................................................................... 84
A-2 LC-MS study of the reaction between 9-methyluric acid and peroxynitrite in phosphate buffer pH 7.4.. ...................................................................................................... 85
12
A-3 LC-MS study of the reaction between 1,3-dimethyluric acid and peroxynitrite in phosphate buffer pH 7.4......................................................................................................... 86
A-4 LC-MS study of the reaction between 1,7-dimethyluric acid and peroxynitrite in phosphate buffer pH 7.4......................................................................................................... 87
A-5 LC-MS study of the reaction between 1,9-dimethyluric acid and peroxynitrite in phosphate buffer pH 7.4......................................................................................................... 88
A-6 LC-MS study of the reaction between 3,7-dimethyluric acid and peroxynitrite in phosphate buffer pH 7.4......................................................................................................... 89
A-7 LC-MS study of the reaction between 1,3,7-trimethyluric acid and peroxynitrite in phosphate buffer pH 7.4......................................................................................................... 90
B-1 LC chromatogram of 10 mM 1-methylurate treated with 10 mM peroxynitrite in 50% methanol and 50% aqueous phosphate buffer solution at pH 7.4. ...................................... 91
B-2 LC chromatogram of 10 mM 9-methylurate treated with 10 mM peroxynitrite in 50% methanol and 50% aqueous phosphate buffer solution at pH 7.4. ...................................... 92
B-3 LC chromatogram of 10 mM 1,3-dimethylurate treated with 10 mM peroxynitrite in 50% methanol and 50% aqueous phosphate buffer solution at pH 7.4. ............................. 93
B-4 LC chromatogram of 10 mM 1,7-dimethylurate treated with 10 mM peroxynitrite in 50% methanol and 50% aqueous phosphate buffer solution at pH 7.4. ............................. 94
B-5 LC chromatogram of 10 mM 1,9-dimethylurate treated with 10 mM peroxynitrite in 50% methanol and 50% aqueous phosphate buffer solution at pH 7.4. ............................. 95
B-6 LC chromatogram of 10 mM 3,7-dimethylurate treated with 10 mM peroxynitrite in 50% methanol and 50% aqueous phosphate buffer solution at pH 7.4. ............................. 96
B-7 LC chromatogram of 10 mM 1,3,7-trimethylurate treated with 10 mM peroxynitrite in 50% methanol and 50% aqueous phosphate buffer solution at pH 7.4. ......................... 97
C-1 Fragmentation pattern of 1-methyluric acid glycol dimethyl ether 3b. .............................. 98
C-2 Fragmentation pattern of 1-methyluric acid glycol di-d3-methyl ether 3b. ........................ 99
C-3 Fragmentation pattern of 9-methyluric acid glycol dimethyl ether 3c. ............................ 100
C-4 Fragmentation pattern of 9-methyluric acid glycol di-d3-methyl ether 3c. ...................... 101
C-5 Fragmentation pattern of 1,3-dimethyluric acid glycol di-d3-methyl ether 3d. ............... 102
C-6 Fragmentation pattern of 1,7-dimethyluric acid glycol dimethyl ether 3e. ...................... 103
C-7 Fragmentation pattern of 1,7-dimethyluric acid glycol di-d3-methyl ether 3e. ................ 104

13
C-8 Fragmentation pattern of 1,9-dimethyluric acid glycol dimethyl ether 3f........................ 105
C-9 Fragmentation pattern of 1,9-dimethyluric acid glycol di-d3-methyl ether 3f. ................ 106
D-1 EPR spectra of the urate-Cd(II) complex ........................................................................... 109
D-2 EPR spectra urate-Zn(II) complex ...................................................................................... 110
D-3 Effect of ascorbate on the urate-Zn(II) complex formation. ............................................. 111

14
Abstract of Dissertation Presented to the Graduate School of the University of Florida in Partial Fulfillment of the Requirements for the Degree of Doctor of Philosophy
REACTION OF PEROXYNITRITE AND URIC ACID STUDIED BY ESR SPIN TRAPPING
AND MASS SPECTROMETRY: FREE RADICAL FORMATION AND PRODUCT IDENTIFICATION
By
Witcha Imaram
December 2008 Chair: Name Alexander Angerhofer Major: Chemistry
Uric acid is the most abundant antioxidant in plasma. However, under conditions of
elevated uric acid levels and oxidative stress, it becomes a pro-oxidant and causes endothelial
dysfunction. It is hypothesized that the generation of reactive intermediates such as free radicals
from the reaction of peroxynitrite and other oxidants mediate the pathological pro-oxidant
properties of uric acid. Peroxynitrite is a reactive oxidant produced in vivo in response to
oxidative and other stress by the diffusion-limited reaction of nitric oxide and superoxide. Our
research is focused on the identification of free radical metabolites of uric acid formed from its
reaction with peroxynitrite. Our experimental approach included the electron spin resonance
(ESR) spin trapping of the radical generated from the reaction between uric acid and
peroxynitrite at pH 7.4. Using PBN (N-tert-butyl-alpha-phenylnitrone) as the spin trapping
agent, a six-line ESR spectrum was obtained and its hyperfine coupling constants, a(N) = 15.6 G;
and a(H) = 3.6 G, corresponded to two carbon-based radicals. Further structural identifications of
the PBN-radical adducts were carried out using liquid chromatography-mass spectrometry (LC-
MS). After comparison with the control reactions, we could identify two molecules,
corresponding to the fragment ions of m/z 352 and 223, respectively. The PBN-triuretcarbonyl

15
radical adduct was characterized for m/z 352 and the latter was identified as a PBN-
aminocarbonyl radical adduct.
The pH dependence study of the reaction between uric acid and peroxynitrite revealed the
formation of hydrogen adduct at high pH and could be observed even without urate. Its
formation was proposed to undergo the inverted spin trapping mechanism, in which the spin trap
was initially oxidized rather than the antioxidant substrate, and followed by electron transfer.
We extended our studies to investigate the effect of methyl substitution at various nitrogen
positions on product and radical formation. No ESR signal was observed when conducting the
reactions with N-7 methylated uric acids in phosphate buffer pH 7.4. Moreover, the reactions
were purposely conducted in methanol to trap the reaction intermediate. Various products have
been identified by LC-MS, and those products indicated that a common intermediate in various
urate oxidation conditions, dehydroisouric acid, was formed.
16
CHAPTER 1 INTRODUCTION
General Overview of Electron Spin Resonance Spin Trapping
Free radicals are any chemical species capable of independent existence possessing one or
more unpaired electrons (1). Free radicals, and especially reactive oxygen species, play an
important role in living systems and they are widely believed to contribute to the development of
several age-related diseases and implicated in the pathology of a range of diseases including
ischemic and post-ischemic reperfusion damage, inflammation processes, cancers, and
neurodegenerative diseases (1-5). In these pathologies, oxidative damage initiated by free
radicals, such as lipid peroxidation process (6), DNA damage (7), and proteins and enzyme
inactivation, is occurring. Thus, the development of methods capable of detecting free radicals in
biological systems is very important and has become an active field in free radical research.
Electron spin resonance (ESR), known by many synonyms such as, electron paramagnetic
resonance (EPR), or electron magnetic resonance (EMR), has emerged as a powerful method for
direct detection and characterization of free radicals (2). Because of its high selectivity to detect
paramagnetic species such as free radicals, ESR is one of the most widely chosen methods for
studying the free-radical mediated process in a complex biological system (8). However, ESR
alone has some disadvantages, one of which is a short time-period for free radical detection (half
life t1/2 10-9 to 10 s). In many occasions, some radical processes may not be ESR detectable under
various physiological conditions because some free radicals are very short-lived. These short-
lived free radical species may not have sufficient enough time to accumulate their concentration
to reach a steady state level above the detection limit of ESR (~10-8 M) (8). Moreover, if free
radicals have very short spin relaxation time, this will make their line width too broad to be
17
observed by ESR (9). To circumvent this drawback, the spin trapping technique was introduced
in late 1960s (10).
Named by Janzen and Blackburn in 1969 (11), spin trapping is the chemical reaction
(Equation 1-1) in which a reactive free radical (R•) adds to a diamagnetic compound and spin
trapping agent (ST) to form a more stable radical, the spin adduct ([ST-R]•).
R• + ST → [ST-R]• (1-1)
The spin adduct (usually a nitroxide) that is paramagnetic gives the ESR spectrum which
contains useful information called hyperfine parameters. In general, one can characterize the
original free radical, from which the spin adduct was derived, by analyzing the number of
hyperfine parameters and the magnitude of the hyperfine coupling constants in the ESR spectrum
(8). Practically, such a full characterization is rarely obtained; however, it is still possible to
extract some information about the type of the radical (i.e., whether it is carbon-centered,
oxygen-centered, or nitrogen-centered) (9).
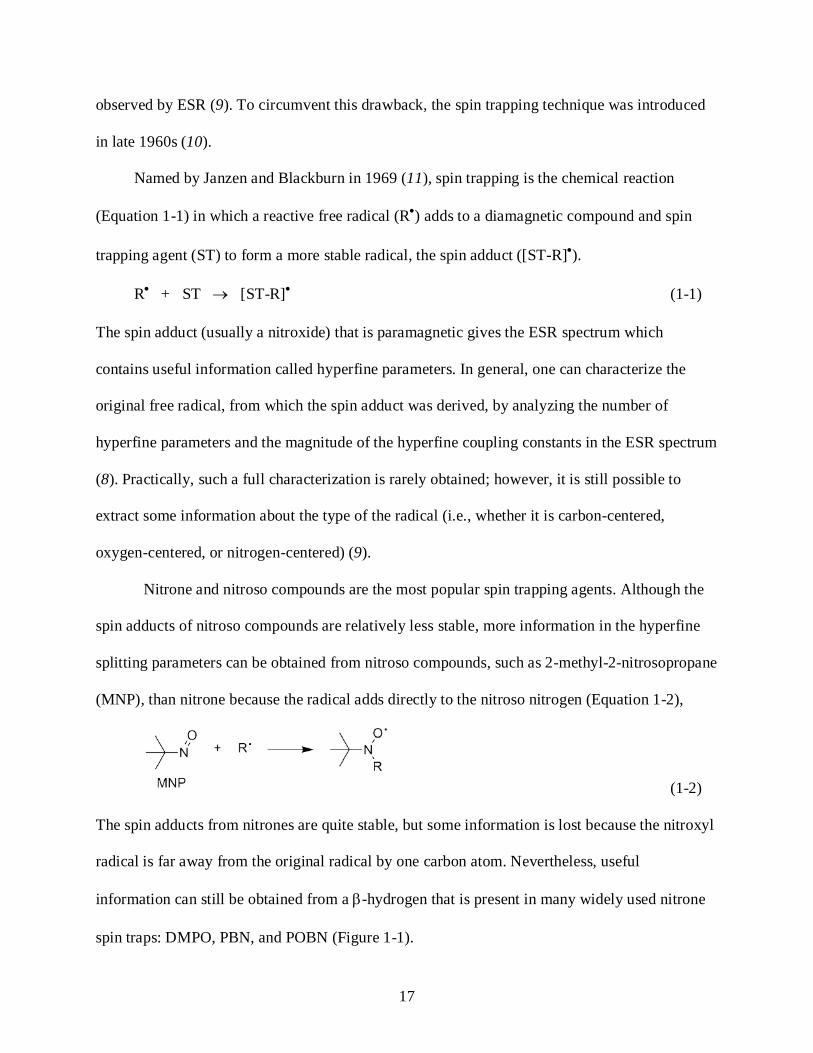
Nitrone and nitroso compounds are the most popular spin trapping agents. Although the
spin adducts of nitroso compounds are relatively less stable, more information in the hyperfine
splitting parameters can be obtained from nitroso compounds, such as 2-methyl-2-nitrosopropane
(MNP), than nitrone because the radical adds directly to the nitroso nitrogen (Equation 1-2),
(1-2)
The spin adducts from nitrones are quite stable, but some information is lost because the nitroxyl
radical is far away from the original radical by one carbon atom. Nevertheless, useful
information can still be obtained from a β-hydrogen that is present in many widely used nitrone
spin traps: DMPO, PBN, and POBN (Figure 1-1).
18
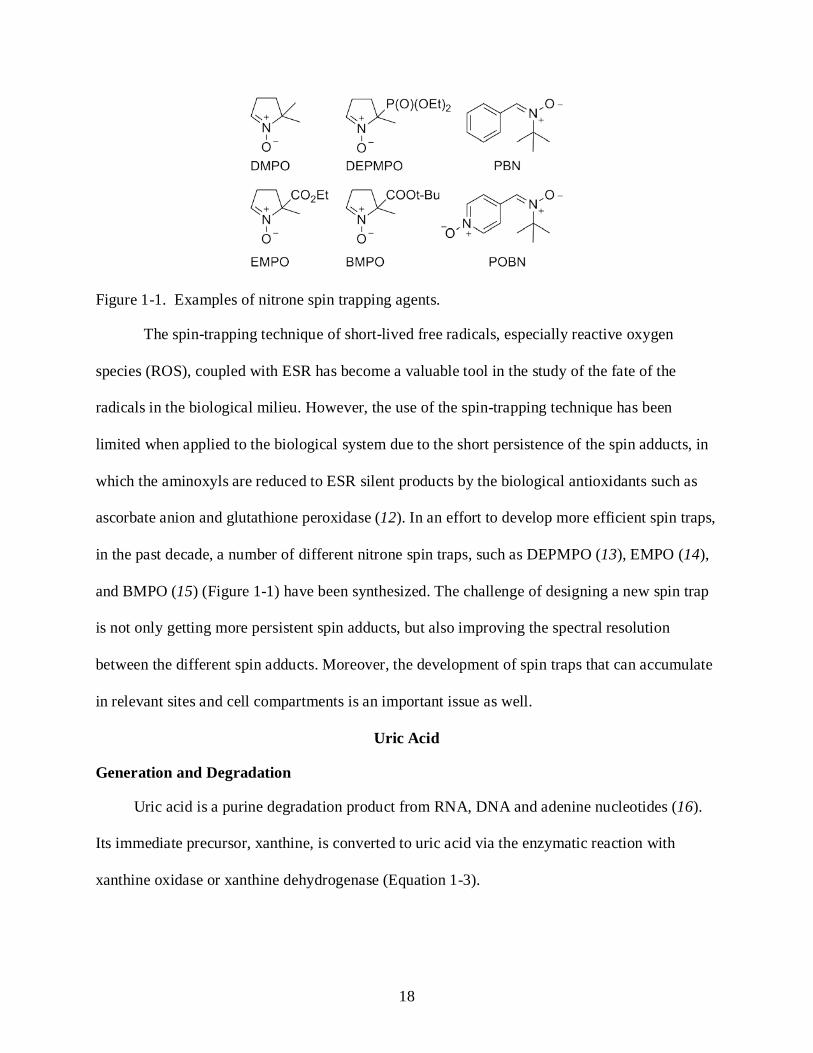
Figure 1-1. Examples of nitrone spin trapping agents.
The spin-trapping technique of short-lived free radicals, especially reactive oxygen
species (ROS), coupled with ESR has become a valuable tool in the study of the fate of the
radicals in the biological milieu. However, the use of the spin-trapping technique has been
limited when applied to the biological system due to the short persistence of the spin adducts, in
which the aminoxyls are reduced to ESR silent products by the biological antioxidants such as
ascorbate anion and glutathione peroxidase (12). In an effort to develop more efficient spin traps,
in the past decade, a number of different nitrone spin traps, such as DEPMPO (13), EMPO (14),
and BMPO (15) (Figure 1-1) have been synthesized. The challenge of designing a new spin trap
is not only getting more persistent spin adducts, but also improving the spectral resolution
between the different spin adducts. Moreover, the development of spin traps that can accumulate
in relevant sites and cell compartments is an important issue as well.
Uric Acid
Generation and Degradation
Uric acid is a purine degradation product from RNA, DNA and adenine nucleotides (16).
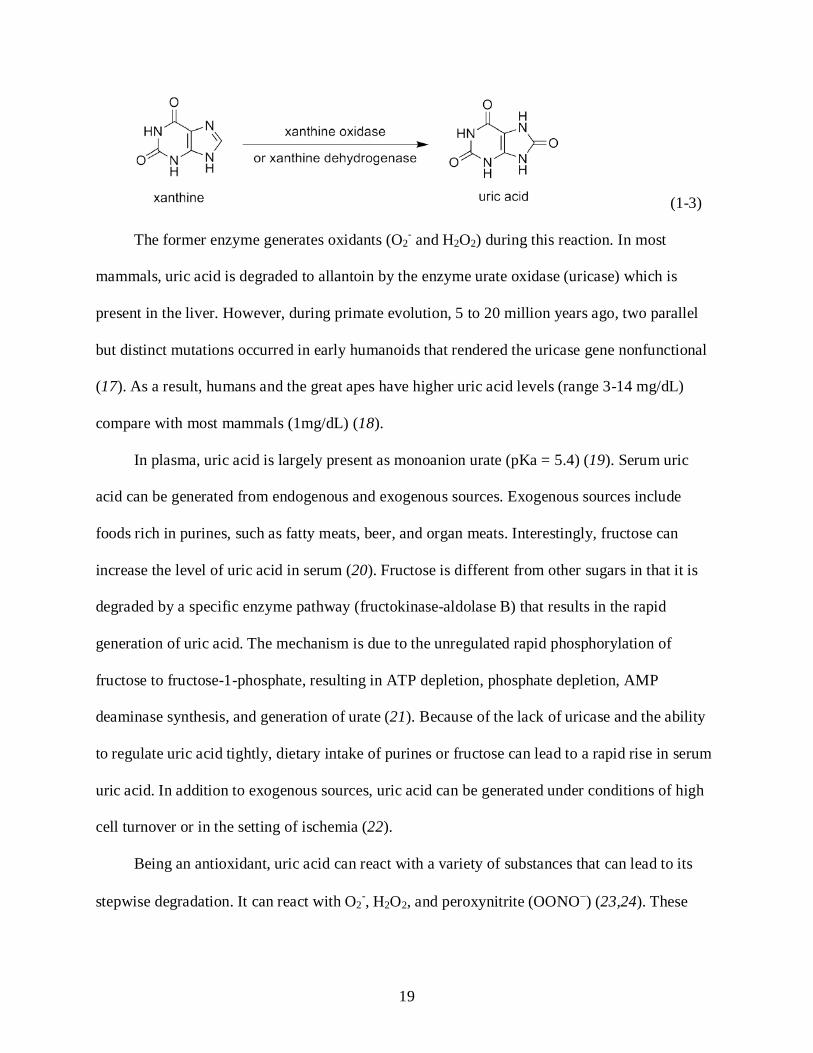
Its immediate precursor, xanthine, is converted to uric acid via the enzymatic reaction with
xanthine oxidase or xanthine dehydrogenase (Equation 1-3).
19
(1-3)
The former enzyme generates oxidants (O2- and H2O2) during this reaction. In most
mammals, uric acid is degraded to allantoin by the enzyme urate oxidase (uricase) which is
present in the liver. However, during primate evolution, 5 to 20 million years ago, two parallel
but distinct mutations occurred in early humanoids that rendered the uricase gene nonfunctional
(17). As a result, humans and the great apes have higher uric acid levels (range 3-14 mg/dL)
compare with most mammals (1mg/dL) (18).
In plasma, uric acid is largely present as monoanion urate (pKa = 5.4) (19). Serum uric
acid can be generated from endogenous and exogenous sources. Exogenous sources include
foods rich in purines, such as fatty meats, beer, and organ meats. Interestingly, fructose can
increase the level of uric acid in serum (20). Fructose is different from other sugars in that it is
degraded by a specific enzyme pathway (fructokinase-aldolase B) that results in the rapid
generation of uric acid. The mechanism is due to the unregulated rapid phosphorylation of
fructose to fructose-1-phosphate, resulting in ATP depletion, phosphate depletion, AMP
deaminase synthesis, and generation of urate (21). Because of the lack of uricase and the ability
to regulate uric acid tightly, dietary intake of purines or fructose can lead to a rapid rise in serum
uric acid. In addition to exogenous sources, uric acid can be generated under conditions of high
cell turnover or in the setting of ischemia (22).
Being an antioxidant, uric acid can react with a variety of substances that can lead to its
stepwise degradation. It can react with O2-, H2O2, and peroxynitrite (OONO−) (23,24). These

20
reactions lead to the complete degradation of uric acid and result in the generation of a number
of stable end products, including allantoin, alloxan, parabanic acid, and triuret (25,26).
Uric Acid: The Oxidant-Antioxidant Paradox
Because of the lack of uricase in humans after the primate evolution, uric acid has been
theorized to replace vitamin C and become a major antioxidant in human (23). Urate has been
proposed to inhibit the formation of nitrotyrosine resulted from peroxynitrite-mediated damage
(27) by scavenging the radical intermediates, the decomposition products of peroxynitrite (28),
which are responsible for nitration of tyrosine. Moreover, uric acid can chelate transition metal
ions and scavenge many reactive oxygen and nitrogen species; for example, superoxide, the
hydroxyl radical, singlet oxygen, and peroxynitrite (19,29).The antioxidant properties of uric
acid have been thought to be initiated by the donation of an electron by uric acid to generate the
urate radical (with a redox potential of 0.59V), followed by its nonreversible degradation to a
variety of products (25,26). In this regard the urate reaction is distinct from ascorbate, for
although ascorbate will also generate the ascorbyl radical, this latter reaction is reversible (30).
Despite the role of antioxidant in plasma, the growing evidence of uric acid being a true
risk factor to develop obesity, hypertension, and cardiovascular disease, conditions associated
with oxidative stress, has recently been reported (18,31). Uric acid can be a pro-oxidant by
forming free radials in various reactions. Maples and Mason detected the urate radical in a flow-
cell ESR experiment with both permanganate and the peroxidase/H2O2 system (32). The data
suggested that the UA radical was a π-delocalized radical that resided on the 5-membered ring.
Kahn et al. studied the oxidative reaction of urate (anion form of uric acid) by xanthine oxidase
(XO) and found that hydroperoxide and dehydrourate were two distinct intermediates (Figure 1-
2) (33,34). 5-hydroxyisourate was the primary product of the enzymatic oxidation and through

21
subsequent non-enzymatic ring opening leads to allantoin (33,35). This is an effective 2e–/2H+
oxidation mechanism which can also be observed by electrochemical oxidation (26,35).
Figure 1-2. The oxidative reaction of urate by xanthine oxidase (XO).
Attacked by peroxynitrite, urate was decomposed to form urate-derived radicals, which are
responsible for the amplification of lipid oxidation products found in liposomes and LDL when
treated with peroxynitrite (36). The fact that urate can be oxidized via a radical mechanism is
significant since this opens up the possibility for an explanation of the pro-oxidant effect of uric
acid (20,37-39). If the oxidation of uric acid in vivo processes via radical mechanism, it is
possible that radical chain reactions may be started and damage the cell (16).
Whether uric acid functions as an antioxidant or pro-oxidant remains ambiguous. Sautin et
al. suspected that uric acid may have a protective effect only in the hydrophilic environment, like
in plasma (16). On the other hand, the pro-oxidative effects of uric acid, which are usually
associated with lipid, may take place only in the hydrophobic environment created by lipid
within the cell (16). Thus, one may determine the true function of uric acid by analyzing the
effect of uric acid in various circumstances.
22
Peroxynitrite
Peroxynitrite (OONO−) or oxoperoxynitrate(1-) has been receiving great interest in several
fields. Beside earth, peroxynitrite was observed by the Mars Viking biology experiments to be
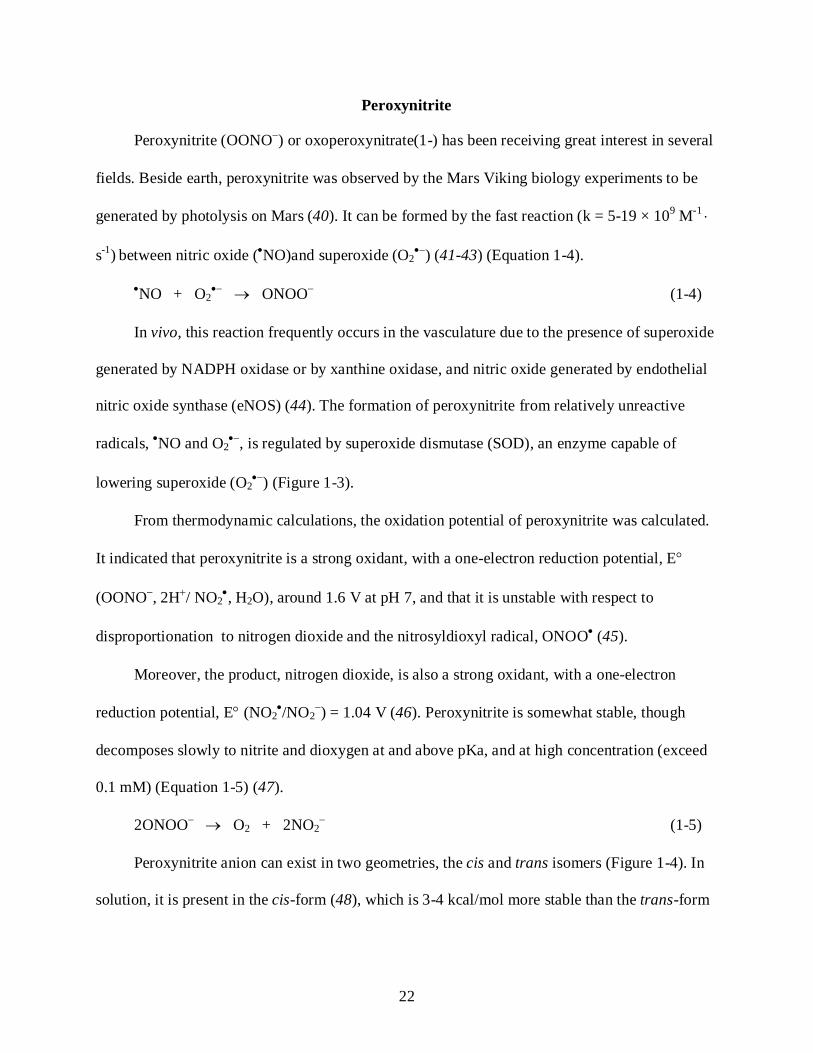
generated by photolysis on Mars (40). It can be formed by the fast reaction (k = 5-19 × 109 M-1 ⋅
s-1) between nitric oxide (•NO)and superoxide (O2•−) (41-43) (Equation 1-4).
•NO + O2•− → ONOO− (1-4)
In vivo, this reaction frequently occurs in the vasculature due to the presence of superoxide
generated by NADPH oxidase or by xanthine oxidase, and nitric oxide generated by endothelial
nitric oxide synthase (eNOS) (44). The formation of peroxynitrite from relatively unreactive
radicals, •NO and O2•−, is regulated by superoxide dismutase (SOD), an enzyme capable of
lowering superoxide (O2•−) (Figure 1-3).
From thermodynamic calculations, the oxidation potential of peroxynitrite was calculated.
It indicated that peroxynitrite is a strong oxidant, with a one-electron reduction potential, E°
(OONO−, 2H+/ NO2•, H2O), around 1.6 V at pH 7, and that it is unstable with respect to
disproportionation to nitrogen dioxide and the nitrosyldioxyl radical, ONOO• (45).
Moreover, the product, nitrogen dioxide, is also a strong oxidant, with a one-electron
reduction potential, E° (NO2•/NO2
−) = 1.04 V (46). Peroxynitrite is somewhat stable, though
decomposes slowly to nitrite and dioxygen at and above pKa, and at high concentration (exceed
0.1 mM) (Equation 1-5) (47).
2ONOO− → O2 + 2NO2− (1-5)
Peroxynitrite anion can exist in two geometries, the cis and trans isomers (Figure 1-4). In
solution, it is present in the cis-form (48), which is 3-4 kcal/mol more stable than the trans-form

23
(49). The energy barrier between the two conformers is approximately 24 kcal/mol for the anion,
and 10 kcal/mol less for the protonated form (49).
Figure 1-3. Scheme summarized the chemistry of peroxynitrite, including the postulated formation of peroxynitrite in vivo, the reaction between peroxynitrite and CO2, the decomposition of peroxynitrous acid, and the reaction pathways leading to the oxidation products.
Figure 1-4. Geometrical isomers of peroxynitrite.

24
Known to react as a nucleophile, peroxynitrite anion (OONO−) can undergo nucleophilic
addition with CO2 (50,51), aldehydes (52), and ketones (53), while peroxynitrous acid (ONOOH)
mediates ebselen oxidaton (52,54).
Peroxynitrous acid (ONOOH), a conjugate acid of peroxynitrite, is a strong both one- and
two-electron oxidizing agent (55), with a pKa of 6.5-7.5, depending on the ionic strength of the
medium (47). Unlike peroxynitrite anion, peroxynitrous acid isomerizes to nitrate (70%) with a
rate of 1.2 s-1 at 25 °C. In addition to isomerisation pathway, peroxynitrous acid has been
proposed to undergo homolysis (30%) to form the hydroxyl radical and nitrogen dioxide
(Equation 1-6) (56). However, Kissner et al. suggested that homolysis of the O-O bond in
peroxynitrous acid is unlikely(55), and concluded that peroxynitrous acid is not the source of
hydroxyl radicals (46).
ONOOH → HO• + •NO2 (1-6)
The actual nature of the decomposition of peroxynitrite is still debated. However, whether
peroxynitrous acid undergoes homolysis is irrelevant in a biological system, where the carbon
dioxide (CO2) exists in a high concentration (approximately 1 mM). The reaction of peroxynitrite
with CO2 is one of the main pathways of peroxynitrite chemistry in physiology. The rate constant
for reaction of CO2 with OONO− is large (approximately 5.8 × 10⁴ M-1 ⋅ s-1 depending on pH),
and faster than the rate of direct reaction between peroxynitrite and biological target molecules
such as ascorbate, glutathione, and urate (57). As a result, only a limited number of biomolecules
can compete with CO2 to scavenge peroxynitrite.
Nitrosoperoxycarbonate (ONOOCO2−) is the first intermediate formed by the reaction of
ONOO− and CO2 (Equation 1-7). This intermediate is very short-lived and decomposes to
regenerate CO2 and NO3− in ca. 70% yield (Equation 1-8), and produce the free radicals (in ca.
25
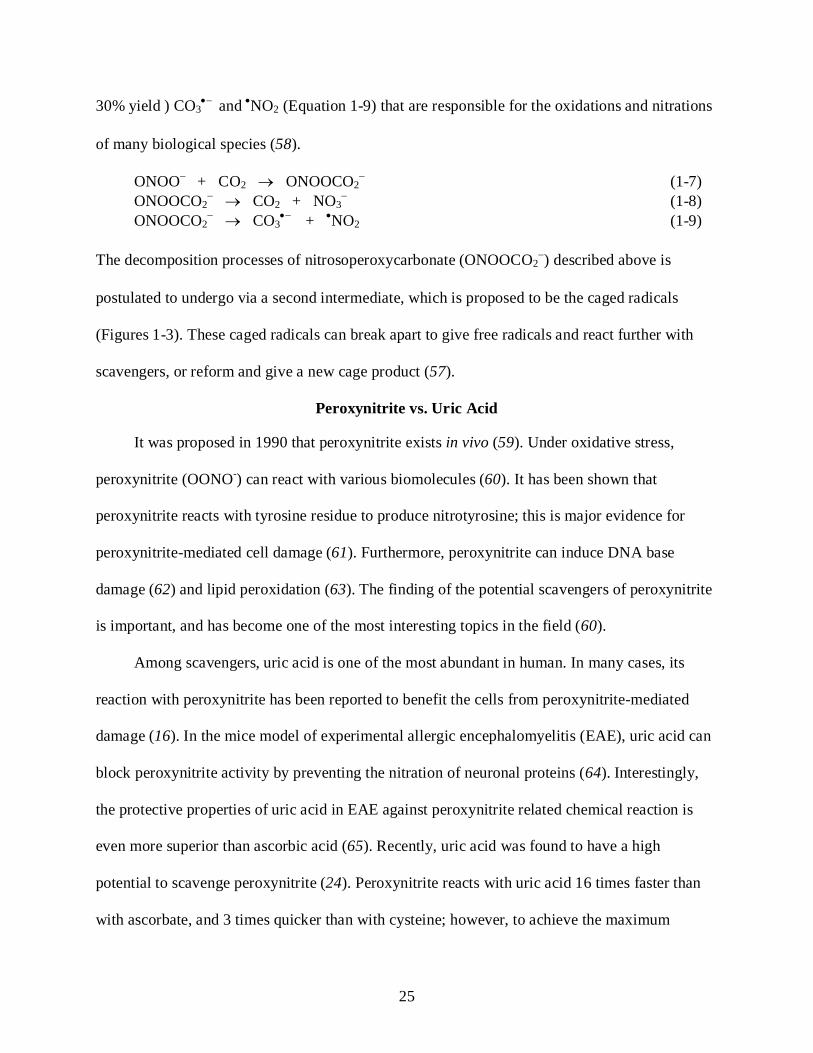
30% yield ) CO3•− and •NO2 (Equation 1-9) that are responsible for the oxidations and nitrations
of many biological species (58).
ONOO− + CO2 → ONOOCO2− (1-7)
ONOOCO2− → CO2 + NO3
− (1-8) ONOOCO2
− → CO3•− + •NO2 (1-9)
The decomposition processes of nitrosoperoxycarbonate (ONOOCO2−) described above is
postulated to undergo via a second intermediate, which is proposed to be the caged radicals
(Figures 1-3). These caged radicals can break apart to give free radicals and react further with
scavengers, or reform and give a new cage product (57).
Peroxynitrite vs. Uric Acid
It was proposed in 1990 that peroxynitrite exists in vivo (59). Under oxidative stress,
peroxynitrite (OONO-) can react with various biomolecules (60). It has been shown that
peroxynitrite reacts with tyrosine residue to produce nitrotyrosine; this is major evidence for
peroxynitrite-mediated cell damage (61). Furthermore, peroxynitrite can induce DNA base
damage (62) and lipid peroxidation (63). The finding of the potential scavengers of peroxynitrite
is important, and has become one of the most interesting topics in the field (60).
Among scavengers, uric acid is one of the most abundant in human. In many cases, its
reaction with peroxynitrite has been reported to benefit the cells from peroxynitrite-mediated
damage (16). In the mice model of experimental allergic encephalomyelitis (EAE), uric acid can
block peroxynitrite activity by preventing the nitration of neuronal proteins (64). Interestingly,
the protective properties of uric acid in EAE against peroxynitrite related chemical reaction is
even more superior than ascorbic acid (65). Recently, uric acid was found to have a high
potential to scavenge peroxynitrite (24). Peroxynitrite reacts with uric acid 16 times faster than
with ascorbate, and 3 times quicker than with cysteine; however, to achieve the maximum
26
protection, ascorbate and cysteine must be present along with urate in scavenging of
peroxynitrite (24).
As described in the previous topic, uric acid can become a pro-oxidant under a certain
condition, by forming radicals after reacting with oxidants including peroxynitrite. Santos et al.
observed a carbon-centered radical by ESR spin-trapping with the spin trap DMPO in reaction
mixtures of uric acid and peroxynitrite (36). It was identified as the aminocarbonyl radical and its
presence explained due to follow-up reactions between peroxynitrite and the primary reaction
products such as alloxan and parabanic acid (36). The generation of the aminocarbonyl radical
from urate was proposed to be responsible for amplified oxidation of LDL and liposomes.
Research Objectives
In recent years, Johnson et al. (31,66-71) demonstrated in a series of cell culture, animal,
and human studies that uric acid may be a true risk factor for hypertension, kidney disease, and
metabolic syndrome. A key issue is the upstream mechanism of how urate mediates these
biological effects. It is thus important to know that when uric acid gives up an electron and
proton as an anti-oxidant, it then becomes a urate radical (32) that can act as a pro-oxidant. A
major question is whether the effects of uric acid to activate cells is due to the uric acid itself or
to the urate radical, which is easily generated from uric acid in the presence of mild oxidative
stress (32,36). This has led us to hypothesize that uric acid, particularly in the presence of
oxidative stress, may convert to a urate radical or to an oxidative radical product of urate which
could then activate cells contributing to the pathogenesis of hypertension, the metabolic
syndrome, renal disease, and cardiovascular disease. Although the presence of the urate radical
has been shown previously (32,36), as well as its ability to act as a pro-oxidant (72-75), to date
there has been minimal study of the major urate radicals that are generated under physiological

27
conditions following reactions with oxidants, particularly as it relates to their structure, kinetics
and possible mechanisms of generation.
Here we examined the reaction between urate and peroxynitrite using electron spin
resonance (ESR) coupled with spin trapping as a primary tool to identify the radicals generated
from this reaction. Moreover, the structure of the radical adduct was also characterized by LC-
MS.

28
CHAPTER 2 RADICAL FORMATION FROM THE REACTION BETWEEN URIC ACID AND
PEROXYNITRITE
Introduction
A comprehensive study of uric acid oxidation by peroxynitrite has been done by Santos et
al (36). An apparent second order rate constant of this reaction has been determined (k = 4.8 ×
102 M-1 ⋅ s-1), and oxygen consumption has been observed (36). The reaction was proposed to
involve multiple interactions between uric acid and peroxynitrite, and generated various products
including radicals. The radical formation has been claimed to be produced by the addition of
peroxynitrite anion to the oxidation products that contain a carbonyl vicinal to aminocarbonyl
group such as alloxan and parabanic acid. This assumption is unlikely because no radical was
detected by ESR in incubations of peroxynitrite with those urate oxidation products in their study
(36).
Due to the complexity of the peroxynitrite-mediated oxidation of uric acid, its mechanism
has not been well established. During our investigation to unfold the chemistry of uric acid when
treated with peroxynitrite at pH 7.4, we discovered a novel urate-derived radical—
triuretcarbonyl radical—which could be an intermediate for the production of the aminocarbonyl
radical. The radicals were studied by electron spin resonance spectroscopy using spin trapping
method, and PBN was used as a spin trapping agent. The structure of the PBN-radical adducts
were characterized by liquid chromatography-mass spectrometry (LC-MS)

29
Materials and Methods
Chemicals. Uric acid was purchased from Sigma. Diethylenetriaminepentaacetic- acid
(DTPA) was purchased from Fluka. N-tert-butyl-α-phenylnitrone (PBN) was obtained from
Alexis Biochemicals. Peroxynitrite was synthesized following the method reported by Uppu and
Pryor (76). The peroxynitrite concentration was measured spectrophotometrically at 302 nm (ε =
1670 M-1 cm-1).
ESR Experiments. 100 mM stock solutions of uric acid (1) was prepared in 0.3 M
potassium hydroxide. The reaction mixtures, typically conducted in 0.3-0.5 M potassium
phosphate buffer at pH 7.4, contained the final concentration of 3 mM urate, 30 mM N-tert-
butyl-α-phenylnitrone (PBN), 0.1 mM DTPA, and 9 mM peroxynitrite. Then, the reaction
mixture was transferred into a quartz capillary of approximately 1×2 mm ID×OD for ESR
measurement. After two minutes, the ESR spectrum was recorded at room temperature, using a
commercial Bruker Elexsys E580 spectrometer, employing Bruker’s high-Q cavity (ER
4123SHQE). Spectral parameters were typically: 100 kHz modulation frequency, 1 G or 0.1 G
modulation amplitude, 20 mW microwave power, 9.87 GHz microwave frequency, 82 ms time
constant, and 164 ms conversion time/point.
Sample Preparation for Liquid Chromatography-Mass Spectrometry. The reaction
mixtures were prepared at room temperature in 0.3 M potassium phosphate buffer pH 7.4 and
contained a final concentration of 10 mM uric acid, 30 mM PBN, 0.1 mM DTPA, and 30 mM
peroxynitrite with the final volume of 10 mL. Then, the reaction mixtures were subsequently
extracted by 2×20 ml of CH2Cl2, dried under nitrogen gas, and re-suspended in 1 mL CH3CN.
Liquid Chromatography-Mass Spectrometry Analysis. The LC-MS analyses were
carried out with an Agilent 1100 liquid chromatography system (Agilent Technologies, Palo

30
Alto, CA, USA) and an TSQ 7000 triple-quadruple mass spectrometer (ThermoFinnigan, San
Jose, CA, USA) equipped with APCI interface operated in positive-ion mode detection. In a
TSQ 7000 instrument, nitrogen was used as both the sheath and the auxiliary gases. The second
quadrupole was used as a collision chamber, with argon as a collision gas, at a pressure in
vicinity of 2.5 × 10⁻³ Torr. The operation of the LC-MS and data analyses was performed using
the ThermoFinnigan Xcalibur 1.4 software.
Fullscan liquid chromatography-mass spectrometry. Liquid chromatography analyses
were performed in a gradient elution mode using Phenomenex Luna 5µ C18(2) 100Å (150 mm ×
4.6 mm) column (Phenomenex, Torrance, CA, USA) coupled with a Phenomenex Luna C18 (2),
5 µm particle size guard column. The mobile phase used included 5 mM ammonium acetate / 0.1
% acetic acid (A) and methanol (B) as a gradient. The mobile phase flow was 0.6 mL min-1, and
the injection volume was 20 μL. The gradient began at 90% A. Composition was linearly ramped
to 95% B over the next 10 min, remained constant for 3 min, then reversed to the original
composition of 90% A over 1 min, after which it was kept constant for 1 min to re-equilibrate the
column. The extracted reaction products, control samples and standard samples, were analyzed
in the fullscan mode at a mass range of m/z 90-450.
Liquid chromatography-mass spectrometry tandem mass spectrometry analysis. LC
analysis was performed as outlined above. The MS/MS analysis performed for M+1 ion 223 and
352 in the positive mode at a collision energy of 20V, with a mass scan range of m/z 40-230 for
M+1 ion 223, and a mass scan range of m/z 45-360 for the latter.
Results
Electron Spin Resonance Spin Trapping. To probe the generation of the PBN-radical
adducts at pH 7.4, the reaction between urate with peroxynitrite was monitored by ESR using
spin trapping method. The reaction between urate and peroxynitrite resulted in a six-line ESR
31
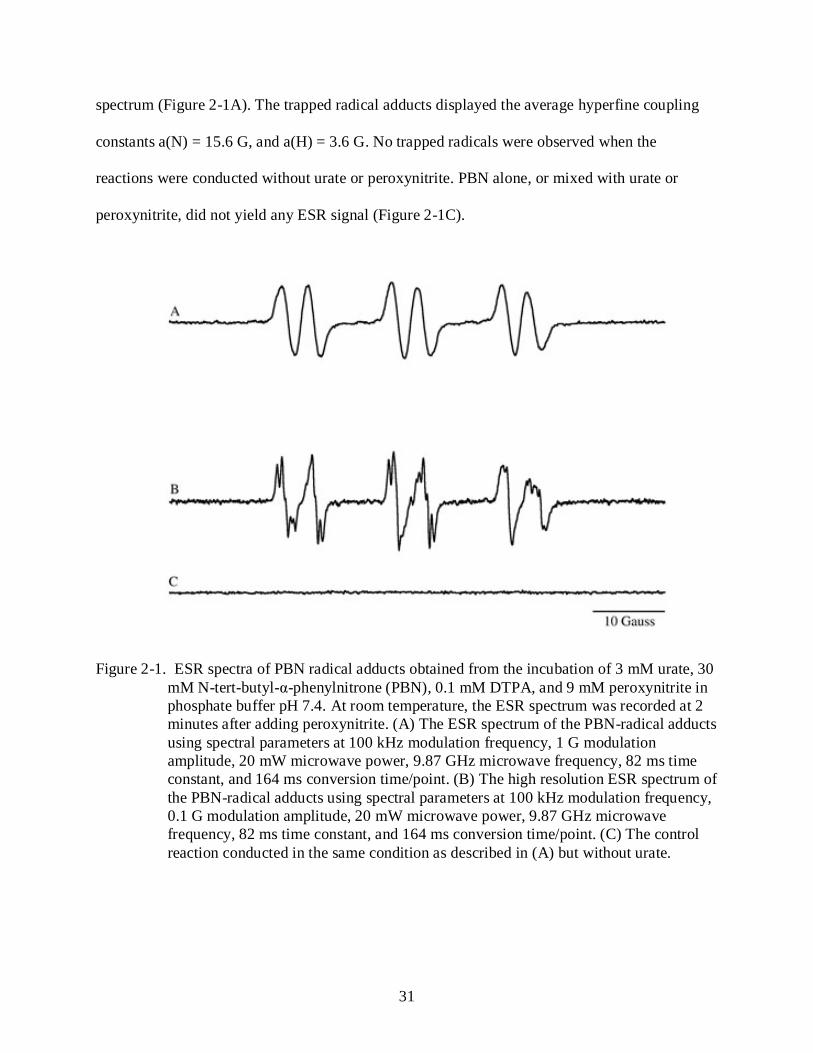
spectrum (Figure 2-1A). The trapped radical adducts displayed the average hyperfine coupling
constants a(N) = 15.6 G, and a(H) = 3.6 G. No trapped radicals were observed when the
reactions were conducted without urate or peroxynitrite. PBN alone, or mixed with urate or
peroxynitrite, did not yield any ESR signal (Figure 2-1C).
Figure 2-1. ESR spectra of PBN radical adducts obtained from the incubation of 3 mM urate, 30 mM N-tert-butyl-α-phenylnitrone (PBN), 0.1 mM DTPA, and 9 mM peroxynitrite in phosphate buffer pH 7.4. At room temperature, the ESR spectrum was recorded at 2 minutes after adding peroxynitrite. (A) The ESR spectrum of the PBN-radical adducts using spectral parameters at 100 kHz modulation frequency, 1 G modulation amplitude, 20 mW microwave power, 9.87 GHz microwave frequency, 82 ms time constant, and 164 ms conversion time/point. (B) The high resolution ESR spectrum of the PBN-radical adducts using spectral parameters at 100 kHz modulation frequency, 0.1 G modulation amplitude, 20 mW microwave power, 9.87 GHz microwave frequency, 82 ms time constant, and 164 ms conversion time/point. (C) The control reaction conducted in the same condition as described in (A) but without urate.

32
Furthermore, the ESR intensities increased when the urate concentration was increased
(Figure 2-2). These experiments confirmed that the observed radicals were derived from urate,
not artifacts. Moreover, when the experiment was performed at higher resolution (lower
modulation amplitude), we found that PBN could trap at least two different carbon-based
radicals (Figure 2-1B). The radical formation increased with the concentration of peroxynitrite,
but yielded maximum at a four-fold molar excess of peroxynitrite over urate (Figure 2-3).
Figure 2-2. Effect of urate concentration on the production yield of the PBN-radical adduct
derived from urate obtained from the oxidation of urate by peroxynitrite. The ESR spectra were recorded after 2 min of incubation of various urate concentraions, 19 mM N-tert-butyl-α-phenylnitrone (PBN), 0.1 mM DTPA, and 23 mM peroxynitrite in 0.3 M phosphate buffer pH 7.4. The instrumental parameters were 100 kHz modulation frequency, 0.5 G modulation amplitude, 20 mW microwave power, 9.87 GHz microwave frequency, 82 ms time constant, and 164 ms conversion time/point.

33
Figure 2-3. Effect of peroxynitrite concentration on the production yield of the PBN-radical adduct derived from urate obtained from the oxidation of urate by peroxynitrite. The ESR spectra were recorded after 2 min of incubation of 3 mM urate, 30 mM N-tert-butyl-α-phenylnitrone (PBN), 0.1 mM DTPA, and various concentrations of peroxynitrite in 0.5 M phosphate buffer pH 7.4. The instrumental parameters were 100 kHz modulation frequency, 1 G modulation amplitude, 20 mW microwave power, 9.87 GHz microwave frequency, 20 ms time constant, and 82 ms conversion time/point.
Depending on pH, both uric acid and peroxynitrite can exist in either neutral or anion form.
Therefore, the radical formation should be affected by pH as well. Indeed, the pH profiles show
that the urate-peroxynitrite reaction yielded more trapped radicals when pH increased (Figure 2-
4). This indicates that the radicals may not be produced by the direct reaction between
peroxynitrous acid or its decomposition products with uric acid. The simulated ESR titration
curve obtained a better fitting when the initial pHs of the buffers were used. Although the final
pHs of the solutions were preferred, we have not been able to find proper parameters to fit the

34
data obtained from the shifted pHs. Nevertheless, both pH profiles exhibited the same results; the
yield of radical adducts increased with pH. The obtained pH sigmoidal curve shows an inflection
point of 8.1, which is near the pKa of peroxynitrous acid determined previously by Kissner et al.
(47).
Figure 2-4. Effect of pH on the production yield of the PBN-radical adduct derived from urate
obtained from the oxidation of urate by peroxynitrite. The ESR spectra were recorded after 2 min of incubation of 3 mM urate, 30 mM N-tert-butyl-α-phenylnitrone (PBN), 0.1 mM DTPA, and 9 mM peroxynitrite in 0.5 M phosphate buffer at various pHs. The instrumental parameters were 100 kHz modulation frequency, 1 G modulation amplitude, 20 mW microwave power, 9.87 GHz microwave frequency, 20 ms time constant, and 82 ms conversion time/point. The measured ESR intensities corresponded to the first PBN-radical adduct peak to peak heigthts.
In addition to the effect of pH, we have investigated the effect of CO2 on the production of
radical adducts. The administration of CO2 decreased the observed ESR signals (Figure 2-5).
Interestingly, a four-fold excess of bicarbonate over peroxynitrite was required to completely
prevent the formation of the radical adducts. This is probably because the reactions were not

35
Figure 2-5. Effect of CO2 on the production yield of the PBN-radical adduct derived from urate obtained from the oxidation of urate by peroxynitrite. The ESR spectra were recorded after 2 min of incubation of 3 mM urate, 30 mM N-tert-butyl-α-phenylnitrone (PBN), 0.1 mM DTPA, and 9 mM peroxynitrite in 0.5 M phosphate buffer at pH 7.4 in the present of various concentrations of bicarbonate (HCO3
−). The instrumental parameters were 100 kHz modulation frequency, 1 G modulation amplitude, 20 mW microwave power, 9.87 GHz microwave frequency, 82 ms time constant, and 164 ms conversion time/point.
conducted in the gas-tight system. Therefore, some carbon dioxide gas could escape the reaction
mixtures. As a result, the excess amount of bicarbonate is required in order to completely quench
peroxynitrite.
Product Identification of the Radical Adducts by Liquid Chromatography-Mass
Spectrometry Analysis. From the reaction between urate and peroxynitrite in phosphate buffer
pH 7.4, the extracted radical adducts were separated and characterized by liquid chromatography
coupled with mass spectrometry (LC-MS). After comparison with the control reaction (Figure 2-
6B)—the reaction without urate—the fullscan LC-MS showed two products, at the retention time

36
of 10:56 minutes corresponding to the quasi ions at m/z 223; and at 13:13 minutes corresponding
to the quasi ion at m/z 352 (Figure 2-6A). As displayed in Figure 2-6A and 2-6B, the large area
of the LC traces at the retention time stating from 11.12 minutes to 15.00 minutes belonged to
the mass derived from PBN (M+1 = 178), and the small peak at 9 minutes was consistent with
benzaldehyde oxime (M+1 = 122), which is the decomposition product of PBN.
In addition to the fullscan, the ions at m/z 223 and 352 were selected and analyzed by
tandem mass spectrometry (MS/MS). At m/z 223, the following ions were identified: m/z (%
intensity): 223 (4%; M+1), 167 (30), 149 (29), 134 (12), 132 (5), 122 (24) and 104 (100%), see
Figure 2-7, and the fragment of m/z 352 exhibited the following ions m/z (% intensity): 352 (2%;
M+1), 335 (13%), 296(33), 279(25), 263 (100), 246 (83), 218 (7), 193(12), 177(24), 175 (22),
167 (9), 147(24), 122(8), 118 (6), 104 (9); and 61 (1), see Figure 2-8.
Discussion
Spin trapping allows the trapping of short lived radicals with a more stable radical adduct,
thereby allowing analysis. It is the method of choice to study short-lived radical intermediates
(77). The identification of the radical adducts and their proposed formation mechanism from the
peroxynitrite-urate reaction will be discussed.
The first spin-trapping studies on urate-derived radicals were reported by Santos et al. on
the peroxynitrite-urate system (36). A carbon-centered radical was trapped with the spin trap

37
DMPO (Figure 1-1) and analyzed by CW-ESR. It was tentatively identified as an aminocarbonyl
radical.
Figure 2-6. LC-MS study of the reaction between urate and peroxynitrite in phosphate buffer pH
7.4. Before submitting to LC, the reaction products were extracted by methylene chloride (CH2Cl2), dry under nitrogen gas, and resuspended in acetronitrile. (A) LC chromatogram of 10 mM urate treated with 30 mM peroxynitrite in the presence of 30 mM PBN and 0.1 mM DTPA. (B) LC chromatogram of the control reaction, which every reagent contained the same concentration as described in a) but without urate.

38
Figure 2-7. MS/MS spectrum of the PBN-aminocarbonyl radical adduct.
Figure 2-8. MS/MS spectrum of the PBN-triuretcarbonyl radical adduct.

39
Unlike reported by Santos et al (i.e., only spin trapping agent DMPO gave stable radical
adducts) (36), our experiment showed that PBN could trap at least two radicals. After a
comparison with data reported in a review by Buettner (9), the PBN adducts were found to
belong to carbon-centered radicals. The information from ESR spectra only gave a rough
estimation of the type of trapped radicals. Thus, the LC-MS analysis was performed to acquire
more structural information of the radical adducts. The fullscan LC-MS study showed two
distinctive products with m/z 223 (M+1) and 352 (M+1), which were absent in the control
reaction (Figure 2-6).
The analysis of the LC-MS/MS spectra (Figure 2-7 and 2-8) revealed that both ions
showed the same initial fragment loss of a neutral compound with a molecular weight (MW) of
56, corresponding to the loss of 2-methylpropene ([M+H-C4H8]+). This fragment loss could be
originated from the cleavage of tert-butyl group from the PBN moiety. Moreover, the
fragmentation pattern of both parent ions contained the same fragment daughter ion at m/z 122.
This ion was identified as benzaldehyde oxime (Figure 2-9 and 2-10), which was converted from
PBN as well. These results indicated that both parent ions were derived from PBN. Furthermore,
the loss of formamide (MW 45), in both 223 and 352 ions, and isocyanic acid (HNCO, MW 43),
in the case of 352 ion, indicated that at least one amide group was present in both compounds.
This hypothesis is further supported by the loss of ammonia (MW 17) in both 223 and 352 ions,
which reflects that the parent compounds have a functional group that contained a primary amine
such as amide. Based on the observations described above, the MS/MS fragmentation analysis
confirmed that the structure of the product corresponding to m/z 223 was consistent with the
hydroxylamine form of the PBN-aminocarbonyl radical adduct 2 (Figure 2-11), and the structure
corresponding to m/z 352 was proposed to be the hydroxylamine form of the PBN-

40
triuretcarbonyl radical adduct 3 (Figure 2-11). The existence of triuret moiety in compound 3 is
confirmed by the fragment ions at m/z 147, 104, and 61(Figure 2-10), which is a signature
fragmentation pattern of triuret (M+1 = 147) (25).
Figure 2-9. Fragmentation pattern of the hydroxylamine form of PBN-aminocarbonyl radical adduct.

41
Figure 2-10. Fragmentation pattern of the hydroxylamine form of PBN-triuretcarbonyl radical adduct.

42
Figure 2-11. The structures of PBN-radical adducts of aminocarbonyl radical 2, and
triuretcarbonyl radical 3.
Although the aminocarbonyl radical has been previously characterized, little is known
about its formational mechanism. Many possible pathways have been proposed for the
generation of aminocarbonyl radical. Santos et al. suggested that the aminocarbonyl radical was
produced from one of the products of a urate-peroxynitrite reaction, such as alloxan, parabanic
acid, or allantoin (36). Robinson et al. later suggested that triuret, a novel product from
peroxynitrite-induced oxidation of urate, could be accounted for the detection of aminocarbonyl
radical (25). These hypotheses, however, is unlikely because we have tested the reaction of these
products with peroxynitrite under the same condition as the oxidation of urate, and we did not
observe any radical adduct formation. Our observation indicated that aminocarbonyl radical was
not derived from these known urate-derived products.
In our study, the trapping of radical adduct 3 led us to postulate that triuretcarbonyl radical
12 can be an intermediate for the production of aminocarbonyl radical 13, and their formations
are proposed as depicted in (Figure 2-12). At pH 7.4, peroxynitrite, which its pKa is about 6.8,
can exist as a mixture of peroxynitrite anion, peroxynitrous acid, or its decomposition products
(25,46). We propose that urate is oxidized via one electron transfer by peroxynitrous acid,
forming urate radical 4 (Equation 2-1 to 2-2). Because we did not observe the PBN-OH radical
adduct, so the electron is likely transferred to oxygen of the hydroxyl moiety of peroxynitrous
acid, forming a hydroxide (−OH) and a nitrogen dioxide radical (NO2●) (Equation 2-2).

43
(2-1)
(2-2)
Then diimine 5, an oxidative intermediate of uric acid described in many urate oxidation
studies (26,36), can be produced by one electron and one proton transfer from urate radical 4 to
peroxynitrous acid. This second electron oxidation can be initiated by nitrogen dioxide radical
(NO2●), which is a decomposition product of peroxynitrous acid (Equation 2-2), as well because
of its strong oxidizing potential (46). In contrast to some studies (25,33), the dehydrourate (with
its structure depicted in Figure 1-2) is unlikely to be formed because it is antiaromatic molecule.
Therefore, we propose that the intermediate of the second electron transfer from urate is diimine
5. The diimine 5 is susceptible to nucleophilic addition and can rapidly react with nucleophile
such as water or ammonia (26). Peroxynitrite anion has been reported to undergo nucleophilic
addition in the reaction with diacetyl (78) and cyclicquinone (79). Moreover, our pH dependence
experiments show that the radical formation was increased when pH was raised (Figure 2-4), and
decreased when CO2 was present (Figure 2-5). This result indicates that peroxynitrite anion is
responsible for the production of radicals by reacting with an intermediate, initially formed from
the oxidation of original urate. Taken together, we thus propose that peroxynitrite anion can react
with diimine 5 to produce peroxo adduct 6. After undergoing homolysis of the O-O bond (78),
the peroxo adduct 6 decomposes to yield nitrite and radical intermediate 7, which then rearranges
to form carbonyl radical 8. The carbonyl radical 8 can be converted to radial 9 by either losing
carbon monoxide (CO) or reacting with O2 and releasing carbon dioxide (CO2). Another
molecule of peroxynitrite anion may react with intermediate 10, which is produced by reduction
44
of compound 9, to generate allantoin-peroxo adduct 11. The multi-molar equivalent consumption
of peroxynitrite leading to the radical formation was supported by our observation that the yield
of radical formation was at maximum when a four-fold excess peroxynitrite over urate was used
(Figure 2-3). By analogy similar to the degradation of 6, triuretcarbonyl radical 13 is obtained.
The β-cleavage of triuretcarbonyl radical 13 yields isocyanic acids and aminocarbonyl radical
14, which is subsequently trapped by PBN (Figure 2-12).
Aside from being the intermediate for aminocarbonyl radical, triuretcarbonyl radical could
be an intermediate candidate for the generation of triuret 15 as well (Figure 2-11). This
hypothesis was supported by our observation that no triuret was observed when the reaction
mixtures contained PBN. This indicates that PBN could quantitatively trapped the
triuretaminocarbonyl radical, preventing the formation of triuret.

45
Figure 2-12. Proposed radical formation mechanism of the reaction between urate and peroxynitrite.

46
CHAPTER 3 REACTIONS OF PEROXYNITRITE WITH MONO-, DI-, AND TRI-METHYLURIC ACIDS STUDIED BY LIQUID CHROMATOGRAPHY-MASS SPECTROMETRY AND ELECTRON
SPIN RESONANCE SPECTROSCOPY
Introduction
Uric acid is a purine degradation product from RNA, DNA and adenine nucleotides (16).
Several isomers of methyluric acid are also commonly present in vivo and are derived from the
metabolism of methylated purines such as caffeine, theobromine, theophylline, and plant
methylxanthines (80).
Methyluric acids can attain significant concentrations in vivo, and have even been reported
to cause kidney stones in subjects who are heavy coffee consumers (81). Indeed, Safranow and
Machoy reported that methylated uric acids are found in all uric acid stones (82). Nevertheless,
unlike the role of uric acid in quenching peroxynitrite mediated reactions, which is well
established, less is known about the reaction of peroxynitrite with methyluric acids. In previous
studies, depending on the reaction condition and the sources of the oxidants, the methylation at
certain nitrogen positions in uric acid has been reported to affect the reactivity of uric acid
(83,84). 1,3-Dimethyluric acid and 1,3,7-trimethyluric acid were found to have higher potency
than uric acid to prevent lipid peroxidation in human erythrocyte membranes (85-87). However,
when N-7 was methylated, the reactivity of uric acid toward the oxidation by 1,1-diphenyl-2-
picrylhydrazyl (DPPH) radical was markedly decreased (84). The radicals derived from uric acid
and its methyl derivatives upon photolysis in the presence of mild oxidants (not including
peroxynitrite) have been investigated by ESR spectroscopy and calculation study (88). The
radicals were proposed to be formed by hydrogen abstraction mechanism (88). The pKa values of
the corresponding N-methyluric acid radical-anions were determined to be in the range of 9.7-

47
11.2, and the intrinsic acidity of the N-H protons in both neutral and radical-anion forms was
calculated to follow the order N1H < N9H < N3H (88).
We therefore examined the reactivity of various methyluric acids with peroxynitrite using
liquid chromatography-mass spectrometry (LC-MS) and electron spin resonance (ESR)
spectroscopy, a) to understand the reactivity of these biologically significant molecules with
peroxynitrite and b) to test the hypothesis that methylation at N-7 might interfere with the
oxidative reaction. This report shows the radical formations and reaction products generated
from seven commercially available methyluric acids (Figure 3-1) upon reaction with
peroxynitrite in phosphate buffer pH 7.4. The radicals formed from these reactions were
investigated by ESR spin trapping method, using PBN as the spin trapping agent, and the
reaction products were identified by LC-MS. In an attempt to probe the intermediates in these
reactions we have incorporated methanol into the reaction mixtures to investigate if methanol
could trap any intermediates generated during the course of the reactions, which were monitored
by LC-MS.
Figure 3-1. Structures of uric acid, monomethyluric acid, dimethyluric acid, and trimethyluric acid
Materials and Methods
Chemicals. Shown in Figure 3-1 are the different methylated uric acid compounds used.
Uric acid (UA, 1a), 1,3-dimethyluric acid (1,3-DiMeUA, 1d) and 9-methyluric acid (9-MeUA,
48
1c) were purchased from Sigma. 1-Methyluric acid (1-MeUA, 1b), 1,7-dimethyluric acid (1,7-
DiMeUA, 1e), 1,9-dimethyluric acid (1,9-DiMeUA, 1f), 3,7-dimethyluric acid (3,7-DiMeUA,
1g), and 1,3,7-trimethyluric acid (1,3,7-TriMeUA, 1h) were purchased from Fluka. The d4-
methanol was purchased from Cambridge Isotopes. Distilled, deionized water (metal ion free)
and EDTA (500 mM) were purchased from Gibco. Peroxynitrite, used in the experiments
containing methanol, was purchased from Cayman Chemical. For the experiments conducted in
phosphate buffer, peroxynitrite was synthesized following the method reported by Uppu and
Pryor (76). The peroxynitrite concentration was measured spectrophotometrically at 302 nm (ε =
1670 M-1 cm-1). To ensure the same reactivity, both sources of peroxynitrite reacted with uric
acid in the same reaction conditions; the same reaction products, determined by LC-MS, were
obtained.
ESR Spin Trapping Experiments. 100 mM stock solutions of uric acid (1a) and selected
methyl derivatives of uric acids; namely, 1-methyluric acid (1b), 9-methyluric acid (1c), 1,3-
dimethyluric acid (1d), 1,7-dimethyluric acid (1e), 1,9-dimethyluric acid (1f), 3,7-dimethyluric
acid (1g), and 1,3,7-trimethyluric acid (1h) were prepared in 0.3 M potassium hydroxide. The
reaction mixtures, conducted in 0.3 M potassium phosphate buffer at pH 7.4, contained the final
concentration of 3 mM urate (or its analogues), 30 mM N-tert-Butyl-α-phenylnitrone (PBN), 0.1
mM DTPA, and 9 mM peroxynitrite. Then, the reaction mixture was transferred into a quartz
capillary of approximately 1×2 mm ID×OD for ESR measurement. After two minutes, the ESR
spectrum was recorded at room temperature using a commercial Bruker Elexsys E580
spectrometer, employing Bruker’s high-Q cavity (ER 4123SHQE). Spectral parameters were
typically: 100 kHz modulation frequency, 1 G modulation amplitude, 20 mW microwave power,
9.87 GHz microwave frequency, 82 ms time constant, and 164 ms conversion time/point.

49
Product Identification of the Reactions Conducted in Phosphate Buffer. Each reaction
sample, conducted in 0.5 M phosphate buffer pH 7.4, contained the final concentration of 10 mM
uric acid (or its methyl analogues), 0.1 M DTPA and 30 mM peroxynitrite. Then, the reaction
mixtures were placed on ice, transferred to LC-MS vials on ice, and stored at 4°C to await LC-
MS analysis.
The reaction mixtures were analyzed by LC-MS in the positive fullscan (both negative and
positive) mode using electrospray ionization (ESI) method. This enabled us to detect the positive
ions (mass range m/z: 50.0-900.0) as well as the fragmentation pattern of each intermediate, or
product. The TSQ Quantum Discovery mass spectrometer (ThermoFinnigan, San Jose, CA,
USA) and a ThermoFinnigan Surveyor liquid chromatography system (ThermoFinnigan, San
Jose, CA, USA) was equipped with a Phenominex Luna C18 column (250x4.6 mm). To
minimize the decomposition of labile intermediates, samples were kept cold until analysis. The
mobile phases included 5mM NH4OAc/0.1% AcOH and methanol (as gradient). Typical HPLC
analyses were carried out in a gradient elution mode, using an aqueous mobile phase A (5
mmol/L ammonium acetate and 0.1% by volume of AcOH in water) and MeOH as organic
mobile phase B. Mobile phase flow was 0.6 mL/min and the injection volume was 10 μL. The
HPLC run time was 16 min and the gradient used was as follows: the gradient began at 85% A.
The composition was linearly ramped to 10% A over the next 9 min and remained constant for 3
min, and reversed to the original composition of 85% A over 2 min, after which it was kept
constant for 2 min to reequilibrate the column.
In the Quantum Discovery mass spectrometer, nitrogen was used as both the sheath (40
psi) and the auxiliary (15 units) gas. The spray voltage was 4000 V. The heated capillary
temperature was maintained at 300 °C. The collision pressure was 1.5 × 10⁻³ Torr. The operation

50
of the LC-MS and data analyses was performed using the ThermoFinnigan Xcalibur 1.4
software.
Product Identification of the Reactions Conducted in Methanol. Each reaction sample
contained the final concentration of 10 mM uric acid (or its methyl analogues) and 10 mM
peroxynitrite in a mixed solvent of 50% alcohol (methanol or d4-methanol) and 50% aqueous
phosphate buffer solution at pH 7.4. Uric acid, or its methyluric acid powder, was added to
alcohol/aqueous solution. Under this condition, uric acid only partially dissolved. However, after
one equivalent of peroxynitrite was added to the reaction mixture, agitated, and allowed to
incubate at room temperature for 3 min, uric acid dissolved completely as the reaction
proceeded. Then, the reaction mixtures were placed on ice, transferred to LC-MS vials on ice,
and stored at -80°C to await LC-MS analysis.
The reaction mixtures were analyzed by LC-MS in the fullscan (both positive and
negative), tandem mass spectrometry (MS/MS), and single reaction monitoring (SRM) modes,
using the atmospheric pressure chemical ionization (APCI) method. In addition, some samples
were further analyzed using the electrospray ionization (ESI) method. This enabled us to detect
both positive and negative ions, as well as the fragmentation pattern of each intermediate or
product. The LC-MS analyses were performed using a Finnigan triple quadrupole mass
spectrometer model TSQ 7000 and an Agilent quaternary pump HPLC model 1100, equipped
with a Phenominex Luna C18 column (either 150 or 250x4.6 mm). To minimize the
decomposition of labile intermediates, samples were kept cold until analysis. The mobile phases,
used in the LC separation of the uric acid reaction products, included NH4OAc/AcOH and
methanol (as gradient), formic acid/methanol gradient, or NH4OAc/AcOH/acetonitrile gradient.
Typical HPLC analyses were carried out in a gradient elution mode using an aqueous mobile
51
phase A (5 mmol/L ammonium acetate and 0.1% by volume of AcOH in water) and MeOH as
organic mobile phase B. Mobile phase flow was 0.6 mL/min. Two typical HPLC gradients used
are as follows:
Gradient 1 (10 min HPLC run): the gradient began at 90% A. The composition was
linearly ramped to 75% A over the next 9 min, then remained constant for 0.5 min, and then
reversed to the original composition of 90% A over 0.5 min.
Gradient 2 (16 min HPLC run): the gradient began at 95% A. The composition was
linearly ramped to 80% A over the next 9 min and to 10% A over the next 3 min, then remained
constant for 2 min, and reversed to the original composition of 95% A over 1 min, after which it
was kept constant for 1 min to reequilibrate the column.
Evaluation of the molecular weight and fragmentation patterns of the intermediates and
products was performed using the mass spectrometer after the compounds had been separated on
the LC column. The mobile phase flow was 0.6 mL/min, and the injection volume was 20 μL.
Uric acid concentrations were determined in SRM mode using an APCI source in the negative
mode. For uric acid, reactions were monitored at the m/z 166.9→95.9 and 166.9→123.9 using
25V. In the TSQ 7000 instrument, nitrogen was used as both the sheath (80 psi) and auxiliary (10
units) gases. In the APCI mode, the vaporizer was kept at 500°C, and the heated capillary
temperature was maintained at 200°C. The corona current was set to 3 kA by applying
approximately 4 kV to the corona needle. The second quadrupole was used as a collision
chamber with argon as a collision gas at a pressure around 2.5 × 10⁻³ Torr. The LC-MS/MS ran
on Xcalibur software, which is a flexible Windows NT PC-based data acquisition system that
allowed complete instrument control. The operations of the LC-MS and data analyses were
performed using the ThermoFinnigan Xcalibur software.

52
In addition to the fullscan LC-MS analyses, MS/MS experiments, at 15 and 25 V, were
also conducted for M+1 ions (m/z 230.9, 245, 259), the mass corresponding to the uric acid (and
its mono-, di-, and tri-methyl isomers) glycol dimethyl ethers.
Results
Electron Spin Resonance Spin Trapping. At pH 7.4, the ESR spectra obtained from the
reactions of urate and its analogues with peroxynitrite are shown in Figure 3-2.
Figure 3-2. ESR spectra of the PBN-radical adducts from the reaction between uric acid and its
methyl derivatives with peroxynitrite. The reaction mixture contained 3 mM uric acid or its analogues, 0.1 mM DTPA, 30 mM PBN and 9 mM peroxynitrite in 0.3 M phosphate buffer pH 7.4. (a) uric acid 1a, (b) 1-methyluric acid 1b, (c) 9-methyluric acid 1c, (d) 1,3-dimethyluric acid 1d, (e) 1,7-dimethyluric acid 1e, (f) 1,9-dimethyluric acid 1f, (g) 3,7-dimethyluric acid 1g, (h) 1,3,7-trimethyluric acid 1h.
The reaction between urate 1a and peroxynitrite resulted in a six-line ESR spectrum with
the hyperfine coupling constants: a(N) = 15.7 G, and a(H) = 4.3 G (Table 3-1). All methylated
uric acids that gave ESR signals displayed similar hyperfine coupling constants, ranging from
4.2-4.4 G for a(H) and 15.7-16.0 G for a(N). These are close to the observed value from the uric

53
acid reaction, indicating that methylurates were converted to radicals, which are similar to the
radicals produced by urate. In addition, the ESR spectrum obtained from 9-methyluric acid 1c
was composed of a mixture of two spectra. These spectra were characterized by a six-line and a
nine-line ESR spectrum, with the hyperfine coupling constants: a(N) = 15.9 G, a(H) = 4.2 G and
a(N) = 16.8 G, a(H) = 10.6 G, respectively. The latter showed a characteristic hyperfine structure
of the hydrogen-PBN radical adduct.
Table 3-1. Hyperfine coupling constants a (Gauss) of PBN-radical adducts from the reaction between uric acid and methylated uric acids with peroxynitrite at pH 7.4, and their relative ESR intensities compared to uric acid.
Radicals from compound a(H) a(N) ESR Intensity (arb. unit.) Relative to Uric acida
UA (1a) 4.3 15.7 1.00 1-MeUA (1b) 4.4 15.9 0.61 9-MeUA (1c) 4.2 15.9 0.09 9-MeUA (1c) (H-adduct) 10.6 16.8 N/A 1,3-DiMeUA (1d) 4.4 16.0 0.18 1,7-DiMeUA (1e) N/A N/A N/A 1,9-DiMeUA (1f) 4.3 15.9 0.14 3,7-DiMeUA (1g) N/A N/A N/A 1,3,7-TriMeUA (1h) N/A N/A N/A a Carbon-based radical adducts
To compare the relative radical formation quantity, the measured ESR intensities
corresponded to the first PBN-radical adduct peak. Methyluric acid 1b formed radical adducts
that were approximately 60% of that observed with uric acid (Table 3-1). The radicals derived
from urate 1c, 1d, and 1f exhibited much lower ESR intensity than 1a, but still showed a
noticeable number of radical adducts formed. However, the generations of radical adducts from
1e, 1g and 1h (R7 = CH3) were barely detectable, and their ESR intensities were too low to be
accurately measured.
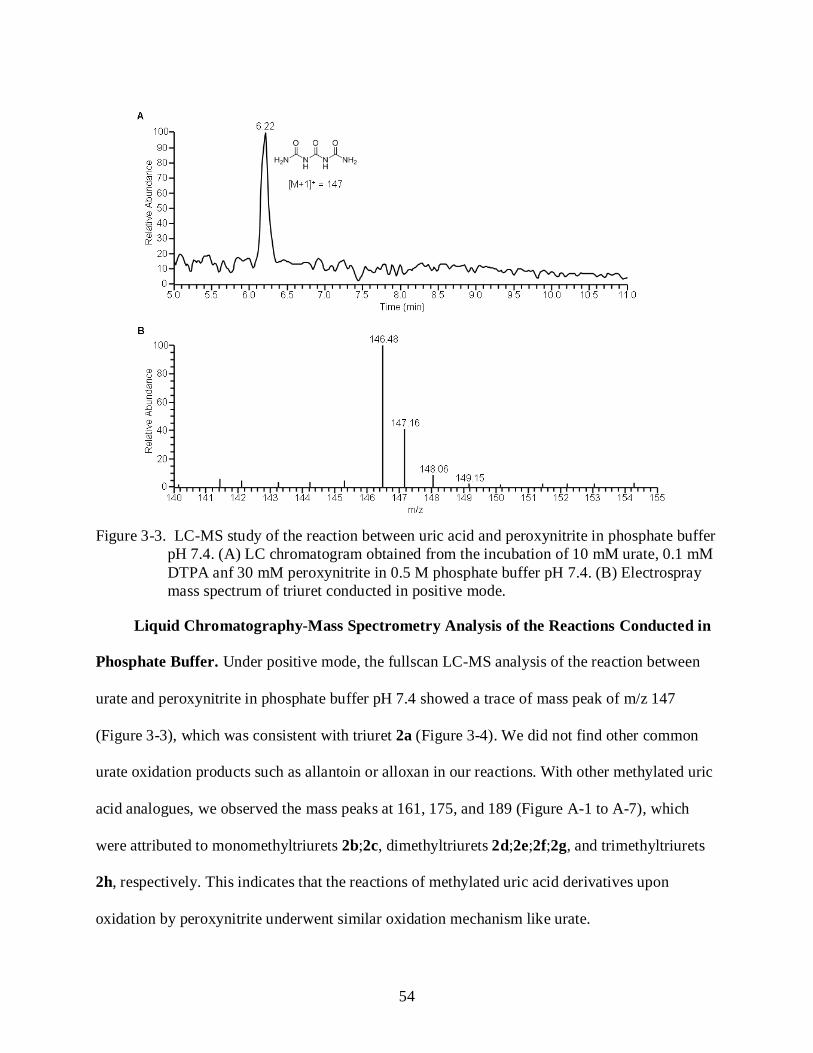
54
Figure 3-3. LC-MS study of the reaction between uric acid and peroxynitrite in phosphate buffer
pH 7.4. (A) LC chromatogram obtained from the incubation of 10 mM urate, 0.1 mM DTPA anf 30 mM peroxynitrite in 0.5 M phosphate buffer pH 7.4. (B) Electrospray mass spectrum of triuret conducted in positive mode.
Liquid Chromatography-Mass Spectrometry Analysis of the Reactions Conducted in
Phosphate Buffer. Under positive mode, the fullscan LC-MS analysis of the reaction between
urate and peroxynitrite in phosphate buffer pH 7.4 showed a trace of mass peak of m/z 147
(Figure 3-3), which was consistent with triuret 2a (Figure 3-4). We did not find other common
urate oxidation products such as allantoin or alloxan in our reactions. With other methylated uric
acid analogues, we observed the mass peaks at 161, 175, and 189 (Figure A-1 to A-7), which
were attributed to monomethyltriurets 2b;2c, dimethyltriurets 2d;2e;2f;2g, and trimethyltriurets
2h, respectively. This indicates that the reactions of methylated uric acid derivatives upon
oxidation by peroxynitrite underwent similar oxidation mechanism like urate.
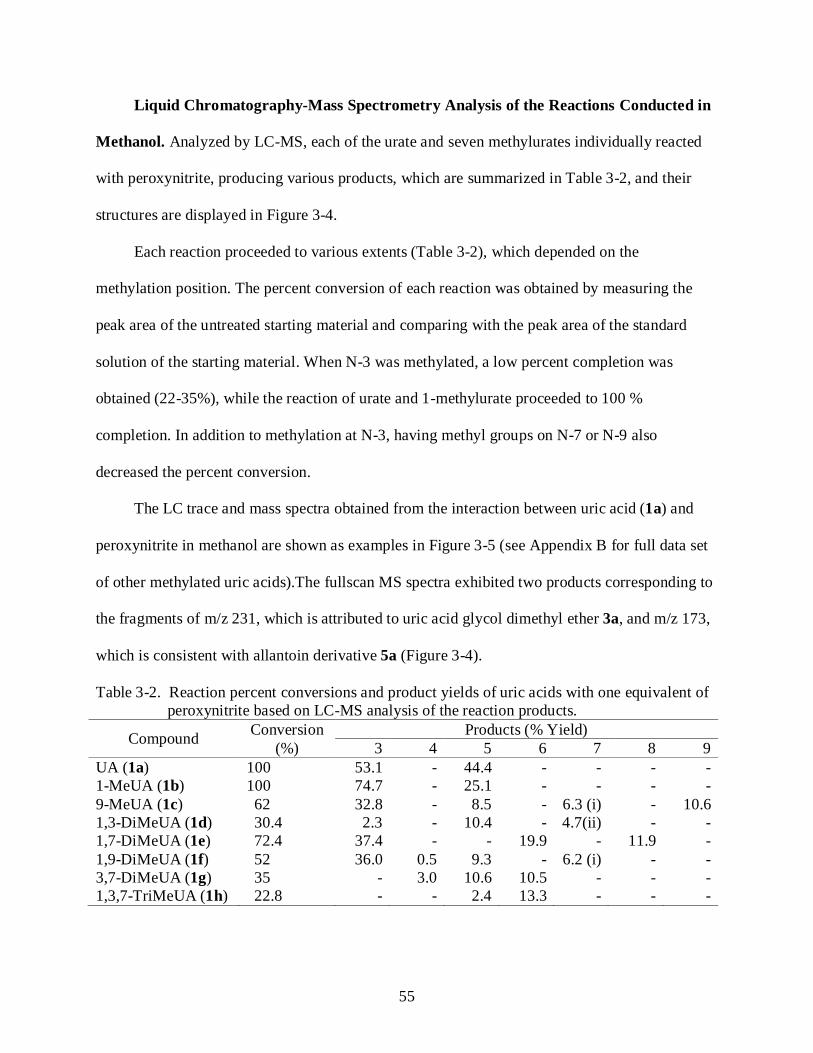
55
Liquid Chromatography-Mass Spectrometry Analysis of the Reactions Conducted in
Methanol. Analyzed by LC-MS, each of the urate and seven methylurates individually reacted
with peroxynitrite, producing various products, which are summarized in Table 3-2, and their
structures are displayed in Figure 3-4.
Each reaction proceeded to various extents (Table 3-2), which depended on the
methylation position. The percent conversion of each reaction was obtained by measuring the
peak area of the untreated starting material and comparing with the peak area of the standard
solution of the starting material. When N-3 was methylated, a low percent completion was
obtained (22-35%), while the reaction of urate and 1-methylurate proceeded to 100 %
completion. In addition to methylation at N-3, having methyl groups on N-7 or N-9 also
decreased the percent conversion.
The LC trace and mass spectra obtained from the interaction between uric acid (1a) and
peroxynitrite in methanol are shown as examples in Figure 3-5 (see Appendix B for full data set
of other methylated uric acids).The fullscan MS spectra exhibited two products corresponding to
the fragments of m/z 231, which is attributed to uric acid glycol dimethyl ether 3a, and m/z 173,
which is consistent with allantoin derivative 5a (Figure 3-4).
Table 3-2. Reaction percent conversions and product yields of uric acids with one equivalent of peroxynitrite based on LC-MS analysis of the reaction products.
Compound Conversion (%)
Products (% Yield) 3 4 5 6 7 8 9
UA (1a) 100 53.1 - 44.4 - - - - 1-MeUA (1b) 100 74.7 - 25.1 - - - - 9-MeUA (1c) 62 32.8 - 8.5 - 6.3 (i) - 10.6 1,3-DiMeUA (1d) 30.4 2.3 - 10.4 - 4.7(ii) - - 1,7-DiMeUA (1e) 72.4 37.4 - - 19.9 - 11.9 - 1,9-DiMeUA (1f) 52 36.0 0.5 9.3 - 6.2 (i) - - 3,7-DiMeUA (1g) 35 - 3.0 10.6 10.5 - - - 1,3,7-TriMeUA (1h) 22.8 - - 2.4 13.3 - - -

56
Figure 3-4. Proposed structures of the reaction products obtained from the reaction between uric acid (or various methylated uric acid analogues) and peroxynitrite.
The presence of methoxy groups in both products 3a and 5a is evidenced by using d4-
methanol to substitute non-labeled methanol. The ions at m/z 176 corresponding to d3-methoxy

57
compound 5a, and m/z 237 corresponding to di-d3-methoxy adduct 3a were observed (Figure 3-
6). The losses of methanol molecules (MW 32) exhibited in MS/MS fragmentation analysis
(Figure 3-7) further supported the proposed structure of the uric acid glycol dimethyl ether 3a.
Similar fragmentation patterns were also found in the MS/MS experiment of the corresponding
uric acid glycol di-d3-methyl ether 3a (Figure 3-8).
Similar products found in the urate-peroxynitrite reaction were observed in the reactions of
other methylated uric acid analogues treated with peroxynitrite as well. The fullscan MS spectra
obtained from the reaction mixtures of monomethylurate 1b and 1c displayed the quasi ions at
m/z 245, which were attributed to the methyluric acid glycol dimethyl ether 3b and 3c (Figure 3-
4), respectively. In the case of dimethylurate 1d, 1e, and 1f, the fragments of m/z 259 were
observed and identified as the dimethyluric acid glycol dimethyl ether; 3d, 3e, and 3f (Figure 3-
4), respectively. Using the same analogy as conducted in urate reaction, the identifications of
these dimethyl ethers 3 were confirmed by conducting isotope-labeled experiments using d4-
methanol and performing MS/MS analysis. In the presence of d4-methanol, the fragments of m/z
251; and 265 were found in the reactions of monomethylated urates 1b, 1c, and dimethylated
urates 1d, 1e, 1f, respectively. Furthermore, the fragmentation analyses from MS/MS studies of
ions m/z 251 and 265 exhibited a similar pattern (APPENDIX C) as observed in the MS/MS
spectrum of dimethyl ether 3a (Figure 3-7 and 3-8). These results indicate that two methoxy
groups are present in compounds with fragment ions of m/z 245 and 259, which were consistent
with dimethyl ether adducts 3. We did not observe the dimethyl ether adducts 3 when
dimethylurate 1g and trimethylurate 1h were used as reactants. However, in the reaction mixture
of dimethylurate 1g, we detected a mono-methoxy adduct 4g (m/z 229) as a minor product. A
small quantity (0.5%) of 4f was found in the reaction mixture of dimethylurate 1f.

58
Figure 3-5. LC-MS study of the reaction between uric acid and peroxynitrite in the presence of methanol. (A) The fullscan LC chromatogram obtained from the reaction of 10 mM urate treated with 10 mM peroxynitrite in 50% methanol and 50% aqueous phosphate buffer solution at pH 7.4. The first peak was monitored at m/z 172.9 (B), corresponding to allantoin derivative 5a. The second peak was monitored at m/z 230.9 (C), corresponding to uric acid glycol dimethyl ether 3a.

59
Figure 3-6. LC-MS study of the reaction between uric acid and peroxynitrite in the presence of d4-methanol. (A) The fullscan LC chromatogram obtained from the reaction of 10 mM urate treated with 10 mM peroxynitrite in 50% d4-methanol and 50% aqueous phosphate buffer solution at pH 7.4. The first peak was monitored at m/z 176.0 (B), corresponding to d3-methoxy-allantoin derivative 5a. The second peak was monitored at m/z 237 (C), corresponding to uric acid glycol di-d3-methyl ether 3a.

60
Figure 3-7. The fragmentation pattern of uric acid glycol dimethyl ether 3a.
In addition to dimethyl ethers 3, allantoin derivatives 5 (Figure 3-4) were observed in most
reaction mixtures as well (except 1e). We identified the structures of methoxy allantoin-like
products 5 based on the quasi ions at m/z 187 from methylurate 1b and 1c, m/z 201 from
dimethylurate 1d, 1e, 1f, and 1g, and m/z 215 from trimethylurate 1h. The presence of the
methoxy group, derived from solvent methanol, was confirmed by using d4-methanol. Indeed,
the expected ions at m/z 190, 204, and 218 were detected. In addition to these allantoin
derivatives 5, methylallantoin derivatives 6 (Figure 3-4), interpreted from m/z 187, and m/z 201,
were observed when R7 = CH3; however, when R7 = H (except 1a and 1b), the dehydroallantoins
7, corresponding to m/z 171 from methylurate 1c and m/z 185 from dimethylurate 1d and 1f,
were obtained.
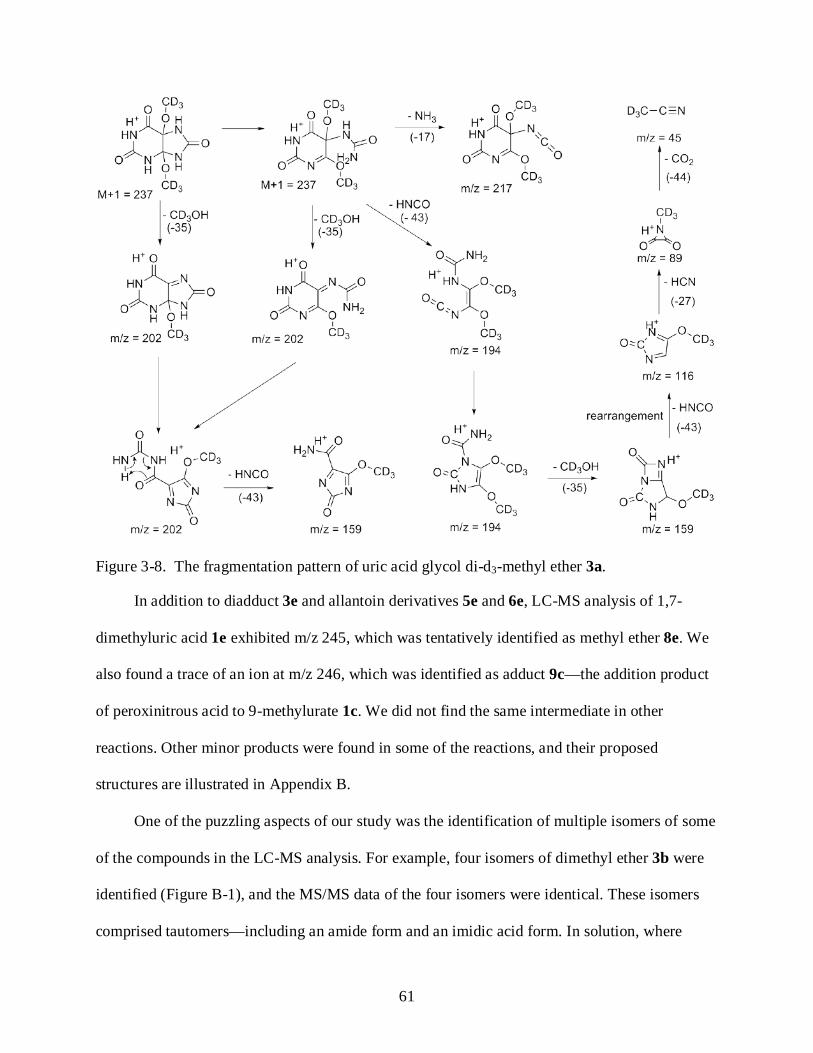
61
Figure 3-8. The fragmentation pattern of uric acid glycol di-d3-methyl ether 3a.
In addition to diadduct 3e and allantoin derivatives 5e and 6e, LC-MS analysis of 1,7-
dimethyluric acid 1e exhibited m/z 245, which was tentatively identified as methyl ether 8e. We
also found a trace of an ion at m/z 246, which was identified as adduct 9c—the addition product
of peroxinitrous acid to 9-methylurate 1c. We did not find the same intermediate in other
reactions. Other minor products were found in some of the reactions, and their proposed
structures are illustrated in Appendix B.
One of the puzzling aspects of our study was the identification of multiple isomers of some
of the compounds in the LC-MS analysis. For example, four isomers of dimethyl ether 3b were
identified (Figure B-1), and the MS/MS data of the four isomers were identical. These isomers
comprised tautomers—including an amide form and an imidic acid form. In solution, where

62
tautomerization is possible, the chemical equilibrium of the tautomers is reached quickly (Figure
3-9). As long as the hydrogen exchange is relatively slow, the tautomers may be separated by
HPLC and LC-MS. Several examples of such separations have been reported (89). Formation of
such tautomers could explain other compounds in this study exhibiting isomer formation.
Figure 3-9. Example of Tautomerization of compound 2b.
Discussion
These studies were initiated to determine the significance of the N-H group at various
positions, and to determine the reactive intermediates and products formed from their reactions
with peroxynitrite. In addition, we wanted to understand the mechanistic interaction of
methyluric acids with peroxynitrite as these molecules are ubiquitous in the body.
Reactions in Phosphate Buffer. The methyl groups, methylated on various nitrogen
position, were hypothesized to alter the course of radical adduct formation. The results indeed
showed a difference when a certain hydrogen of ureide nitrogen was replaced by a methyl group.
As shown in Figure 3-2, the intense six-line ESR spectra were observed only if N-7 was not
methylated. With methylation at N-7, the production of radical adduct was greatly diminished
(Figure 3-2). Moreover, not only methylation at N-7, but methylation at N-9 (1c, 1f) and N-3
(1d) also reduced the radical formations. This data indicated that the methyl group on N-7 and
either on N-3 or N-9 positions of uric acid has a great impact on the reactivity of urate with
peroxynitrite.

63
The LC-MS analysis suggested that all methylated uric acid analogues reacted with
peroxynitrite and formed methylated triuret derivatives as major products. As described in
Chapter 2, we hypothesized that triuret, a product generated from the oxidation of urate by
peroxynitrite, could be produced from the triuretcarbonyl radical. It is possible that methylated
triurets 2 derived from N-7 methylated uric acids could be produced from their corresponding
methylated triuretcarbonyl radicals as well. But these radicals may not be trapped by PBN
because of the steric hindrance between the methyl group of triuret moiety and the phenyl group
of PBN (Figure 3-10). As a result, there was no detected ESR signal in the reactions of N-7
methyl derivatives.
Figure 3-10. The steric hindrance between the methyl group of triuret moiety and the phenyl group of PBN prevents the PBN-radical adduct formation.
Reactions in Methanol. In the presence of methanol, our study documents that all
methyluric acids react with peroxynitrite as determined by mass spectrometry, with different
degree of conversions, depending on the position and extent of substitution (UA=MeUA >
DiMeUA > TriMeUA). Replacing hydrogen with a methyl group at N-3, N-7, or N-9 retarded
the reactions, giving relatively lower percent conversion. These studies suggest that the C4-C5
bond is the reaction center, and we speculate that methylation at N-3, N-7, or N-9 that are
adjacent to C4-C5 bond may control the stability of the intermediates, resulting to different
degree of conversions.
The addition of alcohols to the C4 and C5 position, forming dimethyl ether 3, and the
formation of alkylated allantoin analogues (compound 5 and 6) suggested that an intermediate
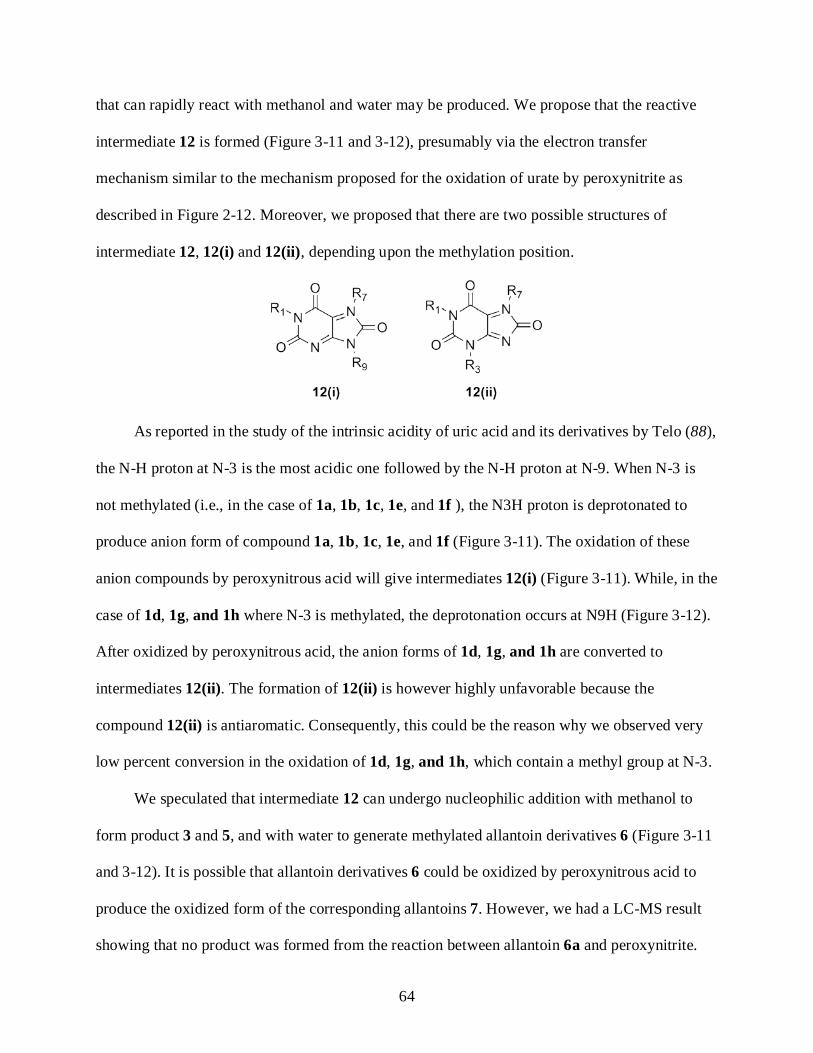
64
that can rapidly react with methanol and water may be produced. We propose that the reactive
intermediate 12 is formed (Figure 3-11 and 3-12), presumably via the electron transfer
mechanism similar to the mechanism proposed for the oxidation of urate by peroxynitrite as
described in Figure 2-12. Moreover, we proposed that there are two possible structures of
intermediate 12, 12(i) and 12(ii), depending upon the methylation position.
As reported in the study of the intrinsic acidity of uric acid and its derivatives by Telo (88),
the N-H proton at N-3 is the most acidic one followed by the N-H proton at N-9. When N-3 is
not methylated (i.e., in the case of 1a, 1b, 1c, 1e, and 1f ), the N3H proton is deprotonated to
produce anion form of compound 1a, 1b, 1c, 1e, and 1f (Figure 3-11). The oxidation of these
anion compounds by peroxynitrous acid will give intermediates 12(i) (Figure 3-11). While, in the
case of 1d, 1g, and 1h where N-3 is methylated, the deprotonation occurs at N9H (Figure 3-12).
After oxidized by peroxynitrous acid, the anion forms of 1d, 1g, and 1h are converted to
intermediates 12(ii). The formation of 12(ii) is however highly unfavorable because the
compound 12(ii) is antiaromatic. Consequently, this could be the reason why we observed very
low percent conversion in the oxidation of 1d, 1g, and 1h, which contain a methyl group at N-3.
We speculated that intermediate 12 can undergo nucleophilic addition with methanol to
form product 3 and 5, and with water to generate methylated allantoin derivatives 6 (Figure 3-11
and 3-12). It is possible that allantoin derivatives 6 could be oxidized by peroxynitrous acid to
produce the oxidized form of the corresponding allantoins 7. However, we had a LC-MS result
showing that no product was formed from the reaction between allantoin 6a and peroxynitrite.

65
Nevertheless, this result may not be the case with these methylated allantoins 6. In addition to the
oxidation of compound 6, product 7 can be generated from the process initiated by the
nucleophilic addition of peroxynitrite to intermediate 12 as well (Figure 3-11 and 3-12). By the
same analogy described in Chapter 2 (Figure 2-12), one would expect the formation of
methylated triurets in these reactions. Although we did not observe any methylated triuret
products in these reactions that contained methanol, this argument may still be valid because
based on our proposed mechanism in Figure 2-12, four mole of peroxynitrite is required to form
triuret. However, in the reaction condition that we performed, we have used only one equivalent
of peroxynitrite. This may be the factor that controls the progress of the reaction. Furthermore,
we have shown that the oxidation of uric acid 1a and 1-methyluric acid 1b with one equivalent
of peroxynitrite went to completion Table 3-2. These results suggested that the second electron
transfer from urate radical 10 could be initiated by nitrogen dioxide radical (NO2●) (Figure 3-11
and 3-12). Moreover, the existence of urate radical 10 is evidenced by the formation of product 4
because the only way that C-5 could form a covalent bond with hydrogen would be by a radical
process.
Beside the products that derived from intermediates 12, we also detected compound 9c,
which is the adduct of 9-methylurate and peroxynitrous acid. A similar product to compound 9,
has been proposed in the reaction between peroxynitrite and deoxyguanosine, and characterized
as 4,5-Dihyrdo-5-hydroxy-4-(nitrosooxy)-deoxyguanosine (90,91).
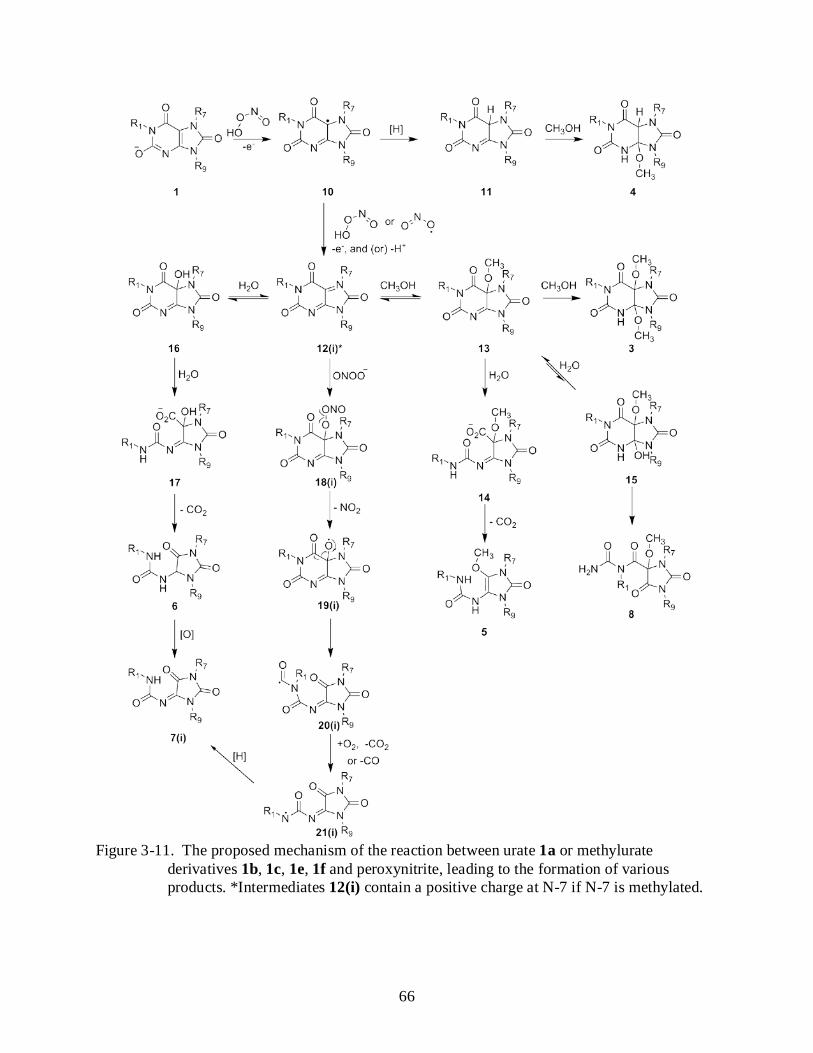
66
Figure 3-11. The proposed mechanism of the reaction between urate 1a or methylurate
derivatives 1b, 1c, 1e, 1f and peroxynitrite, leading to the formation of various products. *Intermediates 12(i) contain a positive charge at N-7 if N-7 is methylated.

67
Figure 3-12. The proposed mechanism of the reaction between methylurate derivatives 1d, 1g, 1h and peroxynitrite, leading to the formation of various products. *Intermediates 12(ii) contain a positive charge at N-7 if N-7 is methylated.

68
In our study, among the eight tested reactions, only the reaction of 1c yielded the proposed
adduct 9c. Its proposed formation was initiated by a single electron transfer from uric acid to
peroxynitrite. Peroxynitrite then dissociates to the nitrogen dioxide (NO2●) and the hydroxide
anion (−OH) which adds to the urate free radical, generating adduct 9c (Figure 3-13, route A).
Figure 3-13. The proposed mechanism of the formation of 9-methylurate-peroxynitrite adduct 8c.
Alternatively, the formation of intermediate 9c could also be obtained by the addition of
hydroxyl (HO●) and nitrogen dioxide (NO2●) free radicals, which are the decomposition products
from the homolytic cleavage of peroxynitrous acid (Equation 3-2), across the C4-C5 bond (92-
94) (Figure 3-13, route B).
ONOO- + H+ ONOOH (3-1) ONOOH [ONO●. ●OH] ●OH + NO2● (3-2)
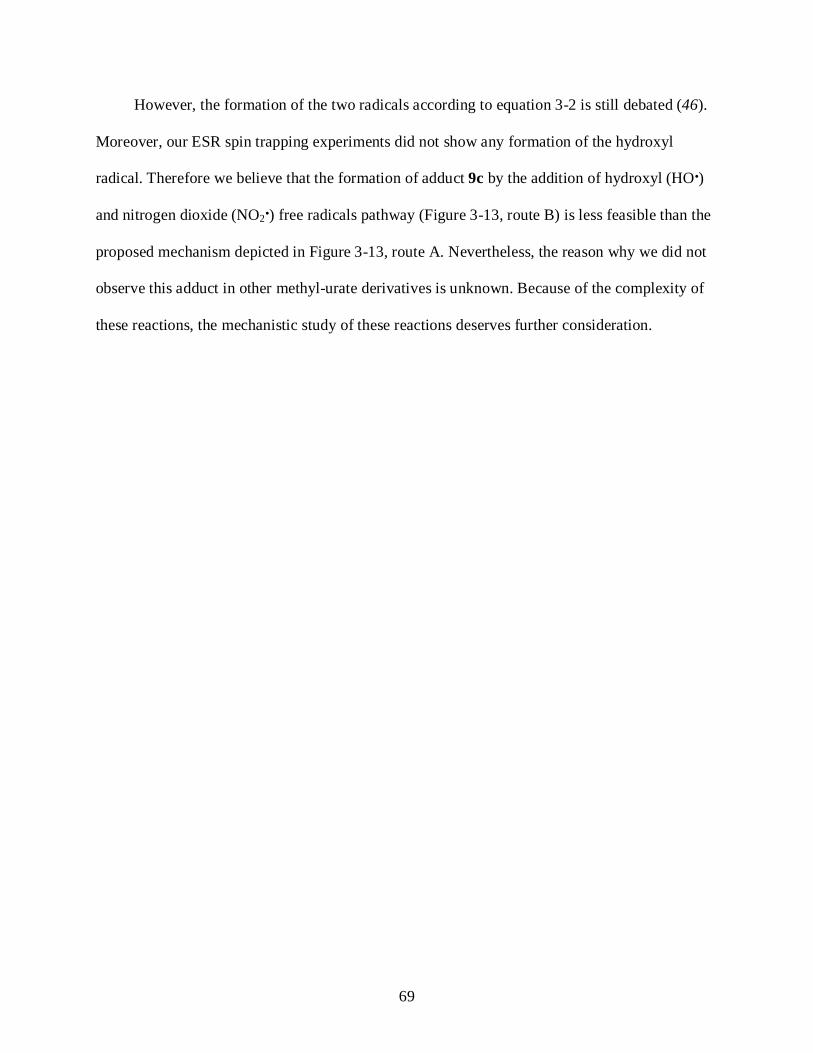
69
However, the formation of the two radicals according to equation 3-2 is still debated (46).
Moreover, our ESR spin trapping experiments did not show any formation of the hydroxyl
radical. Therefore we believe that the formation of adduct 9c by the addition of hydroxyl (HO●)
and nitrogen dioxide (NO2●) free radicals pathway (Figure 3-13, route B) is less feasible than the
proposed mechanism depicted in Figure 3-13, route A. Nevertheless, the reason why we did not
observe this adduct in other methyl-urate derivatives is unknown. Because of the complexity of
these reactions, the mechanistic study of these reactions deserves further consideration.

70
CHAPTER 4 ESR SPIN TRAPPING OF THE REACTION BETWEEN URIC ACID AND
PEROXYNITRITE: THE HYDROGEN ADDUCT
Introduction
Previously, we reported the trapping of the carbon-centered radicals from the reaction
between uric acid and peroxynitrite under phosphate buffer pH 7.4. In an attempt to understand
the in depth chemistry of the radical formation, we have employed the ESR spin trapping
experiment to investigate the generation of the free radicals from the reaction between uric acid
and peroxynitrite at various chemical conditions. Under a certain circumstance, we surprisingly
found a nine-line ESR spectrum, corresponding to the trapping of a hydrogen atom when PBN
was used as a spin trapping agent. This intriguing finding led us to study, in more detail, the
production of the hydrogen adduct (H-adduct). In this report, the factors that could affect the
forming of H-adduct and the mechanism of its formation will be discussed.
Materials and Methods
Chemicals. Uric acid was purchased from Sigma. Diethylenetriaminepentaacetic- acid
(DTPA) was purchased from Fluka. N-tert-butyl-α-phenylnitrone (PBN) and α-(4-Pyridyl 1-
oxide)-N-tert-butylnitrone (POBN) were obtained from Alexis Biochemicals. Peroxynitrite was
synthesized following the method reported by Uppu and Pryor (76). The peroxynitrite
concentration was measured spectrophotometrically at 302 nm (ε = 1670 M-1 cm-1).
pH Dependence Experiments on Urate-Peroxynitrite Reactions. The ESR spin trapping
of the reaction between uric acid and peroxynitrite at various pHs was performed by using 0.1 M
Tris-buffer with a range of pH 7.4-9.0. PBN was used as a spin trapping agent. The reaction
mixtures contained: 1.5 mM uric acid, 15 mM PBN, 0.1 mM DTPA, and 6 mM peroxynitrite in
0.1 M Tris-buffer.

71
Effect of Spin Trapping Agents on the Hydrogen Adduct Formation. The effect of the
spin trapping agent on the formation of the hydrogen adduct was performed in 0.3 M potassium
phosphate buffer pH 7.4 or 0.3 M KOH. The reaction mixtures contained: 3 mM urate, 30 mM
PBN or POBN, 0.1 mM DTPA, and 9 mM peroxynitrite.
Electron Spin Resonance Parameters. The reaction mixture was transferred into a quartz
capillary of approximately 1×2 mm ID×OD for ESR measurement. After two minutes, the ESR
spectrum was recorded at room temperature, using a commercial Bruker Elexsys E580
spectrometer, employing Bruker’s high-Q cavity (ER 4123SHQE). Spectral parameters were
typically: 100 kHz modulation frequency, 1 G or 0.2 G modulation amplitude, 20 mW
microwave power, 9.87 GHz microwave frequency, 82 ms time constant, and 164 conversion
time/point.
Results
pH Dependence Studies on Urate-Peroxynitrite Reactions. By using Tris-buffer, the
six-line ESR spectrum was the only observed ESR signal at pH 7.4-8.0. The ESR intensity of
this six-line spectrum was increased when we raised the pH form 7.4 to 8.0, and started to
decrease when the pH was raised to pH 8.5. At pH 9.0, the ESR spectrum exhibited an
overlapping between a six-line and a nine-line ESR (Figure 4-1). On the other hand, the ESR
spectrum obtained from pH 9 was derived from a mixture of a two trapped radical species. The
six-line ESR spectrum corresponded to the trapping of carbon-centered radical by PBN, while
the nine-line ESR spectra with relative intensities (1:2:1:1:2:1:1:2:1) displayed a characteristic
spectrum of the hydrogen-PBN adduct with the hyperfine splitting a(H) = 10.68 G and a(N) =
16.64 G.

72
Figure 4-1. The pH dependence study of the urate-peroxynitrite reaction in Tris-buffer. The ESR spectra obtained from the spin trapping experiment of the reaction between 1.5 mM urate and 6 mM peroxynitrite in the presence of 15 mM PBN and 0.1 mM DTPA in 0.1 M Tris-buffer at pH ranging from 7.4-9.0.
Electron Spin Resonance Spin Trapping by PBN and POBN. The hydrogen adduct
formation has been detected recently when POBN, another nitrone spin trapping agent, was used
(95). This prompted us to investigate whether we would obtained the same result when POBN
was used as a spin trapping agent under the same reaction condition as we performed with PBN.
In phosphate buffer at pH 7.4, the ESR spin trapping by PBN exhibited a six-line ESR spectrum
corresponding to the trapping of the carbon-based radical, which is the only observed product
from the oxidation of urate by peroxynitrite (Figure 4-2), while spin trapping by POBN
displayed a mixture of two radical species, a six-line and a nine-line spectrum (Figure 4-3). The
nine-line ESR spectrum belonged to the H-POBN adduct and has a much higher ESR intensity
than the six-line ESR spectrum which is consistent with the carbon-based radical adduct.
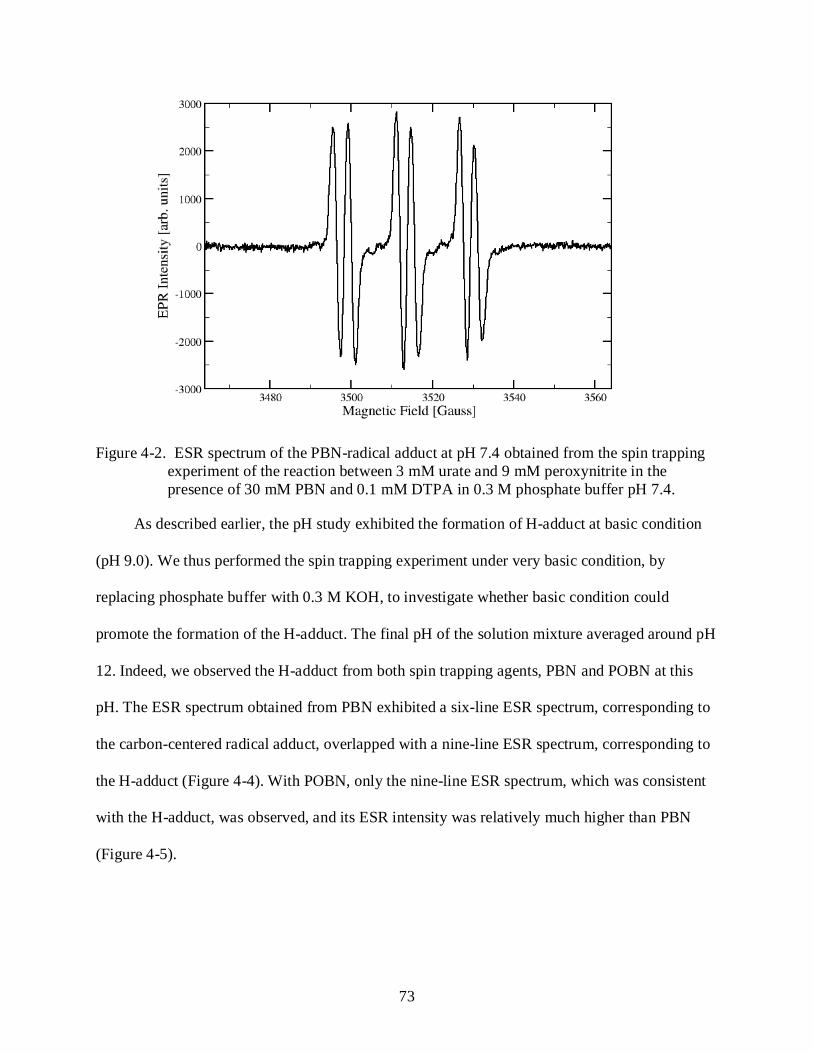
73
Figure 4-2. ESR spectrum of the PBN-radical adduct at pH 7.4 obtained from the spin trapping experiment of the reaction between 3 mM urate and 9 mM peroxynitrite in the presence of 30 mM PBN and 0.1 mM DTPA in 0.3 M phosphate buffer pH 7.4.
As described earlier, the pH study exhibited the formation of H-adduct at basic condition
(pH 9.0). We thus performed the spin trapping experiment under very basic condition, by
replacing phosphate buffer with 0.3 M KOH, to investigate whether basic condition could
promote the formation of the H-adduct. The final pH of the solution mixture averaged around pH
12. Indeed, we observed the H-adduct from both spin trapping agents, PBN and POBN at this
pH. The ESR spectrum obtained from PBN exhibited a six-line ESR spectrum, corresponding to
the carbon-centered radical adduct, overlapped with a nine-line ESR spectrum, corresponding to
the H-adduct (Figure 4-4). With POBN, only the nine-line ESR spectrum, which was consistent
with the H-adduct, was observed, and its ESR intensity was relatively much higher than PBN
(Figure 4-5).

74
Figure 4-3. ESR spectrum of the POBN-radical adduct at pH 7.4 obtained from the spin trapping
experiment of the reaction between 3 mM urate and 9 mM peroxynitrite in the presence of 30 mM POBN and 0.1 mM DTPA in 0.3 M phosphate buffer pH 7.4.
Figure 4-4. ESR spectrum of the PBN-radical adduct at pH 12 obtained from the spin trapping
experiment of the reaction between 3 mM urate and 9 mM peroxynitrite in the presence of 30 mM PBN and 0.1 mM DTPA in 0.3 M KOH.
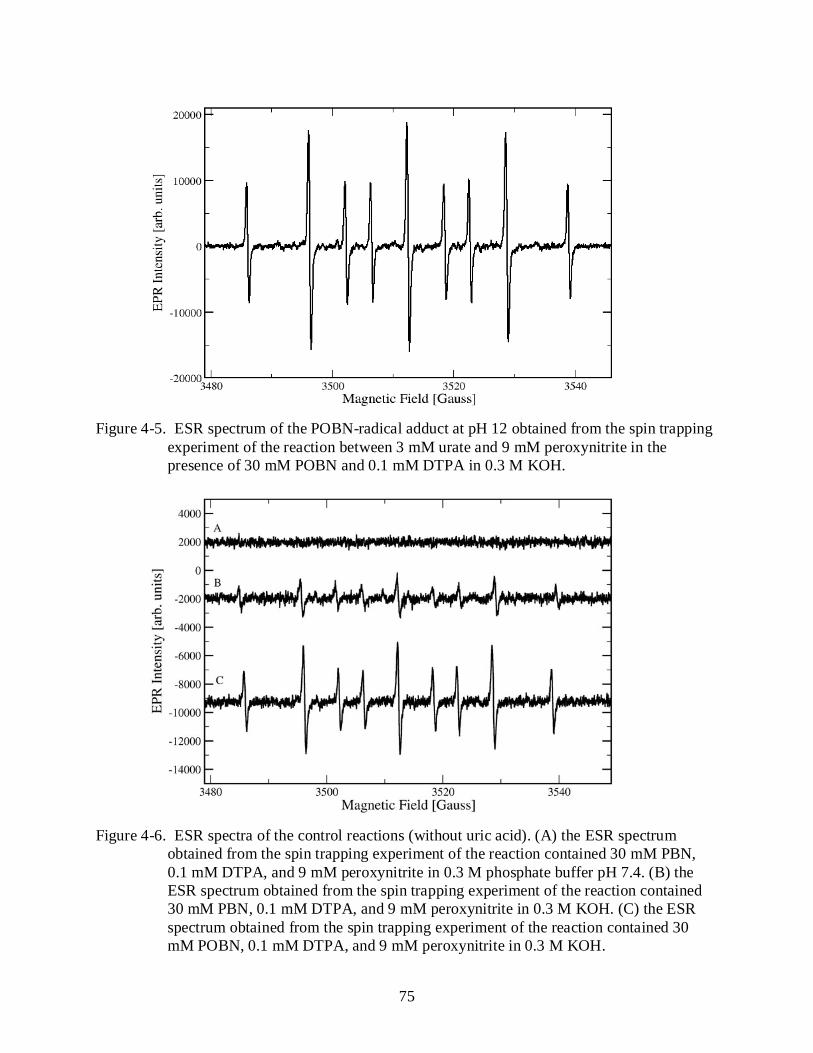
75
Figure 4-5. ESR spectrum of the POBN-radical adduct at pH 12 obtained from the spin trapping
experiment of the reaction between 3 mM urate and 9 mM peroxynitrite in the presence of 30 mM POBN and 0.1 mM DTPA in 0.3 M KOH.
Figure 4-6. ESR spectra of the control reactions (without uric acid). (A) the ESR spectrum
obtained from the spin trapping experiment of the reaction contained 30 mM PBN, 0.1 mM DTPA, and 9 mM peroxynitrite in 0.3 M phosphate buffer pH 7.4. (B) the ESR spectrum obtained from the spin trapping experiment of the reaction contained 30 mM PBN, 0.1 mM DTPA, and 9 mM peroxynitrite in 0.3 M KOH. (C) the ESR spectrum obtained from the spin trapping experiment of the reaction contained 30 mM POBN, 0.1 mM DTPA, and 9 mM peroxynitrite in 0.3 M KOH.

76
Interestingly, in the control reaction without uric acid, conducted in 0.3 M KOH, the PBN-
H adduct was also observed with less intensity than the reaction containing uric acid (Figure 4-
6). This indicates that the PBN-H adduct was not only derived from uric acid; however, the
presence of uric acid amplified the formation of H-adduct. Beside PBN, POBN-H adduct was
detected in the control reaction without uric acid as well, and its ESR intensity was even higher
than PBN-H. These results indicate that the formation of the H-adduct depends on the type of the
spin trapping agent.
Discussion
Recently, hydrogen adducts were identified in the peroxynitrite-mediated oxidation of
tetrahydrobiopterin by using spin trap, POBN (95).
The authors reported a mixture of two spin trapped components: a six-line spectrum
corresponding to a carbon-centered radical and a nine-line spectrum resulting from an H-atom
trapped by POBN. It was proposed that peroxynitrite promoted a homolytic cleavage of a N-H
bond of tetrahydrobiopterin, yielding a hydrogen radical, which could further react with POBN.
We speculated that even though a hydrogen atom can be generated, it is unlikely that the
hydrogen atom would survive long enough to be captured by the spin trap POBN.
We postulated that hydrogen adducts may be formed by an electron transfer mechanism.
Under basic condition, the electron transfer between PBN and a reducing agent could be favored
as depicted in Equation 4-1.

77
(4-1)
But what could be the source of the electron? In our study, we discovered that peroxynitrite
must be present in the reaction mixture in order to produce the H-adduct. Without it, the reaction
mixture of urate and PBN did not yield any ESR signal. This indicates that the reaction between
urate and peroxynitrite must take place and it may be one of the urate-derived intermediates that
provide an electron to the spin trapping agent (Equation 4-2).
(4-2)
This proposed mechanism could not however explain the formation of the H-adduct in the
control reaction that contained only the spin trapping agents and peroxynitrite. From this reaction
(the reaction without urate), we observed the H-adduct formation (in both PBN and POBN) but
its ESR intensity is much lower than the reaction that contained urate. Nevertheless, this
observation indicates that uric acid is not necessary to be the only specie that can give up one
electron to the spin trapping agents. However, it is unlikely that peroxynitrite can directly reduce
PBN, due to the strong oxidant property of peroxynitrite (45). This led us to postulate that other
species that could transfer an electron to spin trapping agents may be formed by a different
mechanism called inverted spin trapping (96-98).
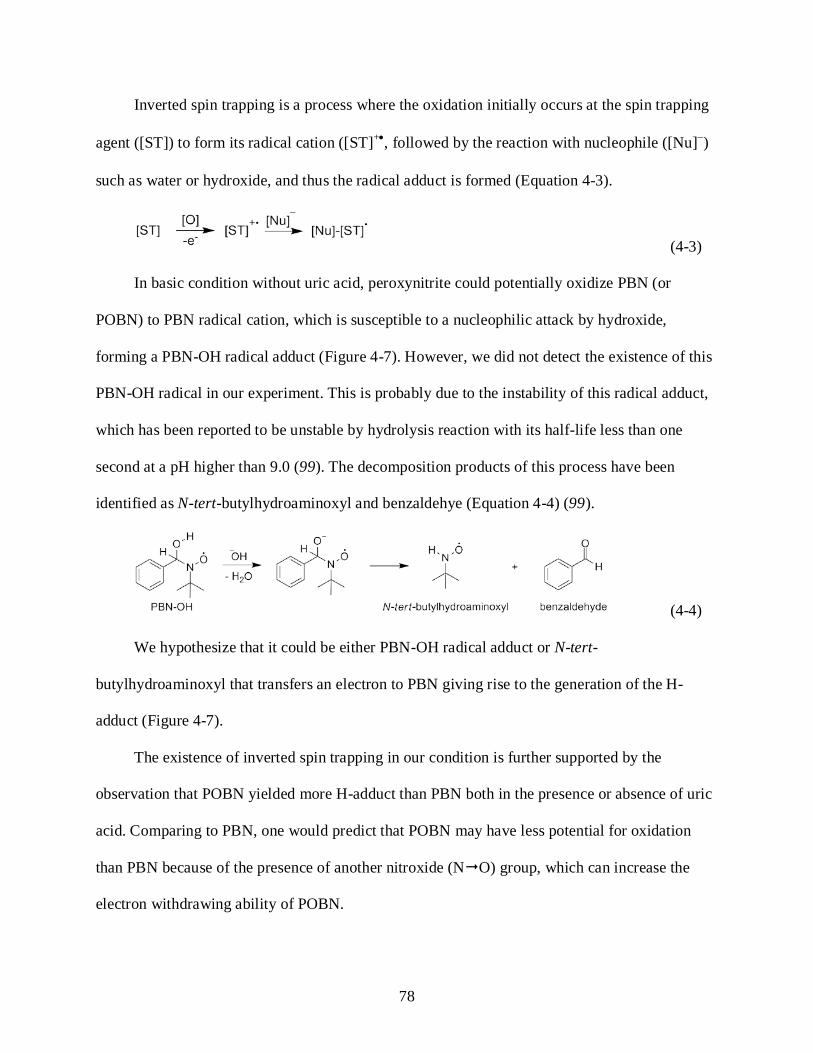
78
Inverted spin trapping is a process where the oxidation initially occurs at the spin trapping
agent ([ST]) to form its radical cation ([ST]+•, followed by the reaction with nucleophile ([Nu]−)
such as water or hydroxide, and thus the radical adduct is formed (Equation 4-3).
(4-3)
In basic condition without uric acid, peroxynitrite could potentially oxidize PBN (or
POBN) to PBN radical cation, which is susceptible to a nucleophilic attack by hydroxide,
forming a PBN-OH radical adduct (Figure 4-7). However, we did not detect the existence of this
PBN-OH radical in our experiment. This is probably due to the instability of this radical adduct,
which has been reported to be unstable by hydrolysis reaction with its half-life less than one
second at a pH higher than 9.0 (99). The decomposition products of this process have been
identified as N-tert-butylhydroaminoxyl and benzaldehye (Equation 4-4) (99).
(4-4)
We hypothesize that it could be either PBN-OH radical adduct or N-tert-
butylhydroaminoxyl that transfers an electron to PBN giving rise to the generation of the H-
adduct (Figure 4-7).
The existence of inverted spin trapping in our condition is further supported by the
observation that POBN yielded more H-adduct than PBN both in the presence or absence of uric
acid. Comparing to PBN, one would predict that POBN may have less potential for oxidation
than PBN because of the presence of another nitroxide (NO) group, which can increase the
electron withdrawing ability of POBN.

79
However, the electrochemical study of spin traps by McIntire et al. (100) discovered that in
fact, PBN is harder to oxidize than POBN. This can be rationalized by the fact that the
conjugation between the two nitroxide functions of POBN helps to stabilize the radical cation
that is formed after oxidation. On the other hand, POBN radical cation exhibits the number of
resonance structures more than PBN (Figure 4-8). As a consequence, POBN is more susceptible
toward oxidation by peroxynitrite than PBN, causing more pronounced hydrogen adduct
formation according to the inverted spin trapping scheme.
Figure 4-7. Mechanism scheme shows the possible pathway of the PBN-H adduct formation.

80
Figure 4-8. The resonance stabilization of POBN and PBN radical cations.

81
CHAPTER 5 CONCLUSIONS AND SUGGESTIONS FOR FUTURE WORK
Conclusions
By using ESR spin trapping coupled with LC-MS, we have discovered two urate-derived
radicals trapped by a spin trap, PBN, from the peroxynitrite-mediated urate oxidation. The
structures of the trapped radicals were characterized as the aminocarbonyl radical, which has
previously been described (36), and the new finding radical—triuretcarbonyl radical, which we
proposed to be the intermediate for the formations of aminocarbonyl radical and triuret.
Observed by ESR, the radical formation was pH dependent and exhibited lower yield when CO2
is present. These results indicate that peroxynitrite anion is responsible for the production of the
urate-derived radicals. The generation of this radical intermediate may be responsible for the
deleterious effect of urate in a biological system.
In addition to uric acid, we have extended our study to investigate the peroxynitrite-
mediated oxidation with various methylated uric acid isomers. We have reported the first mass
spectrometric analysis of these reactions. In phosphate buffer pH 7.4, the major products from
these reactions were methyl triuret dervatives, which were proposed to be produced by radical
processes as evidenced by ESR spin trapping results. Methylation at N-7 did not yield any ESR
signal; however, the radicals may still be produced, but the formation of the radical adducts are
not favored due to the steric effect (Figure 3-10). To trap the reaction intermediate, the reactions
were purposely conducted in methanol. The extent of the reactions depended on the position and
extent of the substitution (urate = methylurate > dimethylurate > trimethylurate). The
administration of methanol resulting in the formation of dimethyl ethers 3 and allantoin
derivatives 5 (Figure 3-4) indicated that diimine, a common intermediate found in various urate
oxidation conditions, was formed (Figure 3-11 and 3-12). Methylation at N-3, N-7, and N-9
82
could all reduce the extent of the reaction as compared to the reaction with uric acid, suggesting
that the C4-C5 bond of the uric acid scaffold is the initial reaction site. The ability of these
methylated uric acid analogues, which exist in the human body, to quench peroxynitrite may
prove to be important in their metabolism.
Under a very basic condition, the hydrogen adduct was formed as a major product from the
reaction between uric acid and peroxynitrite studied by ESR spin trapping, and it could be
observed even without urate. Without uric acid, its formation is proposed to undergo a non-
traditional spin trapping process called inverted spin trapping mechanism, followed by the
electron transfer between spin traps and the PBN-OH (or POBN-OH) adduct or its
decomposition product. The H-adduct formation is amplified when uric acid and peroxynitrite
are present. However, the exact nature of this amplification by urate is still unknown. Different
yields of H-adducts obtained from various spin traps supported the inverted spin trapping
mechanism and can be rationalized by the redox potential of the spin traps.
Suggestions for Future Work
It would be of interest to determine whether a urate radical resulting from one electron
oxidation by peroxynitrite is actually formed. Although, the direct detection of a urate radical has
been reported in various oxidizing conditions (32,100,101), the peroxynitrite-mediated oxidation
of urate is still not known. To detect a very short-lived radical, one can use a rapid-
mixing/continuous flow set-up coupled with ESR. This would allow enough accumulation of the
free radicals to reach the ESR detection limit. It would also be of interest in terms of urate-
peroxynitrite mechanism to determine if one of the oxygen of triuret is derived from
peroxynitrite as proposed in Figure 2-12. One can synthesize peroxynitrite with 18O isotope
labeled. The oxygen attached to C-2 of triuret should be labeled (Equation 5-1).
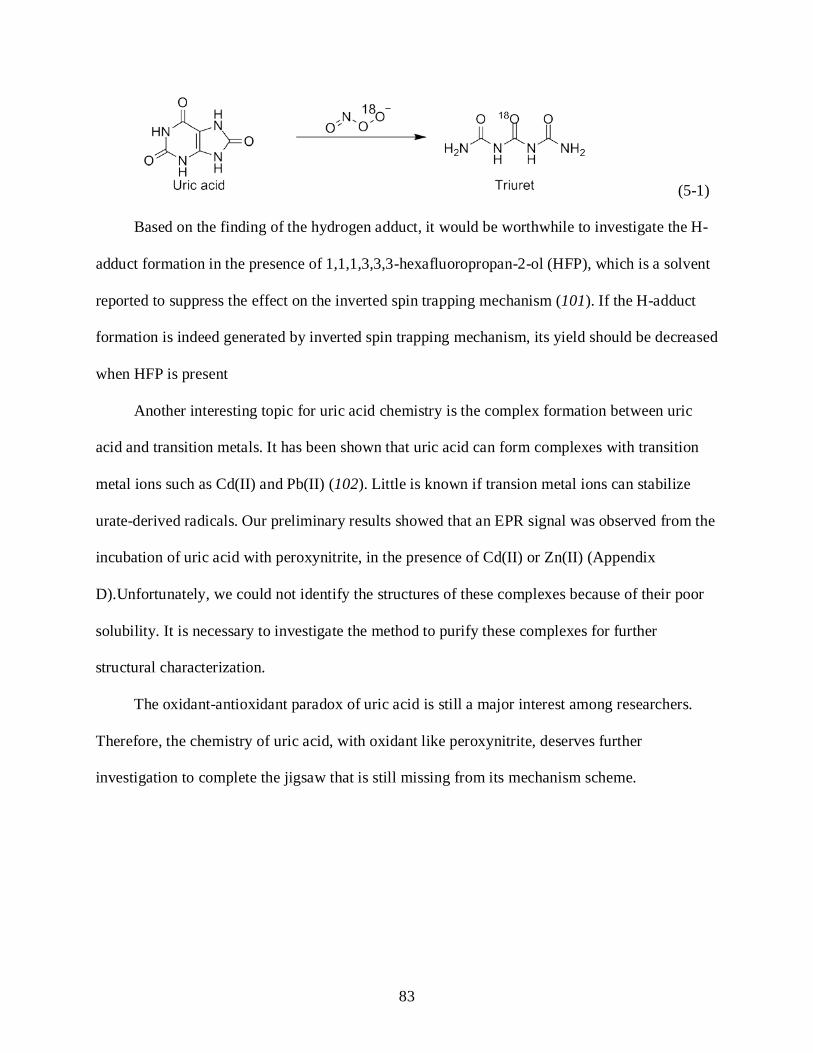
83
(5-1)
Based on the finding of the hydrogen adduct, it would be worthwhile to investigate the H-
adduct formation in the presence of 1,1,1,3,3,3-hexafluoropropan-2-ol (HFP), which is a solvent
reported to suppress the effect on the inverted spin trapping mechanism (101). If the H-adduct
formation is indeed generated by inverted spin trapping mechanism, its yield should be decreased
when HFP is present
Another interesting topic for uric acid chemistry is the complex formation between uric
acid and transition metals. It has been shown that uric acid can form complexes with transition
metal ions such as Cd(II) and Pb(II) (102). Little is known if transion metal ions can stabilize
urate-derived radicals. Our preliminary results showed that an EPR signal was observed from the
incubation of uric acid with peroxynitrite, in the presence of Cd(II) or Zn(II) (Appendix
D).Unfortunately, we could not identify the structures of these complexes because of their poor
solubility. It is necessary to investigate the method to purify these complexes for further
structural characterization.
The oxidant-antioxidant paradox of uric acid is still a major interest among researchers.
Therefore, the chemistry of uric acid, with oxidant like peroxynitrite, deserves further
investigation to complete the jigsaw that is still missing from its mechanism scheme.
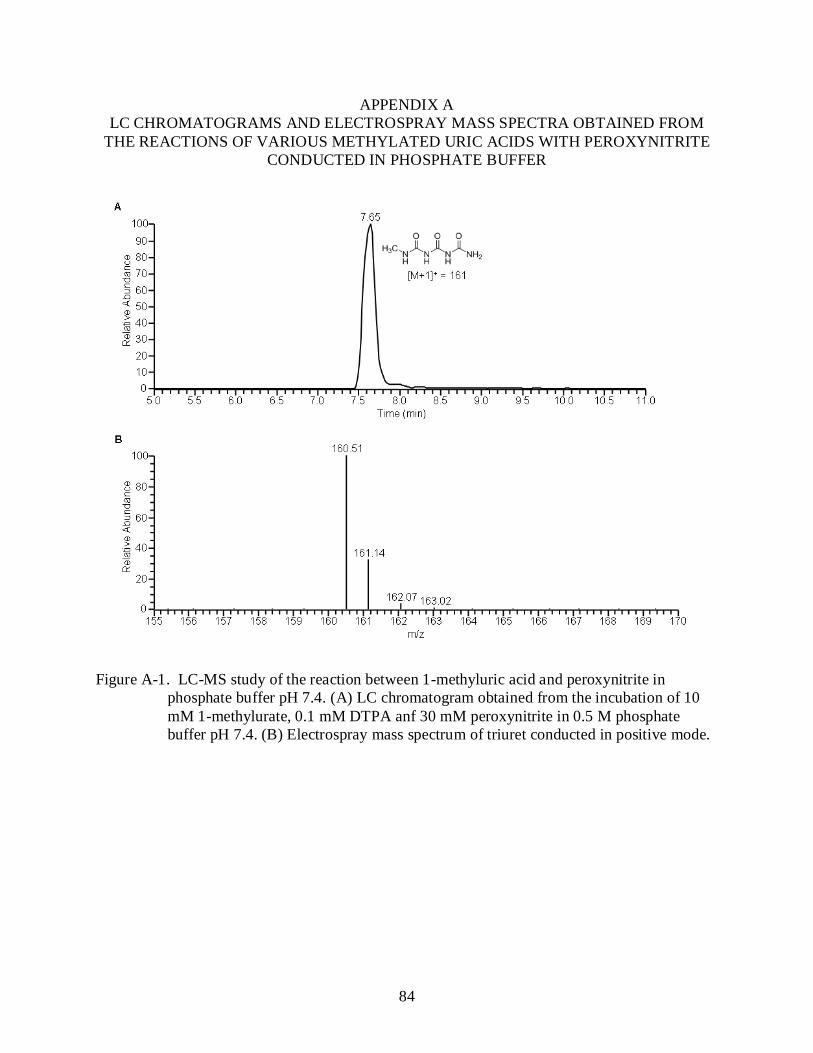
84
APPENDIX A LC CHROMATOGRAMS AND ELECTROSPRAY MASS SPECTRA OBTAINED FROM
THE REACTIONS OF VARIOUS METHYLATED URIC ACIDS WITH PEROXYNITRITE CONDUCTED IN PHOSPHATE BUFFER
Figure A-1. LC-MS study of the reaction between 1-methyluric acid and peroxynitrite in phosphate buffer pH 7.4. (A) LC chromatogram obtained from the incubation of 10 mM 1-methylurate, 0.1 mM DTPA anf 30 mM peroxynitrite in 0.5 M phosphate buffer pH 7.4. (B) Electrospray mass spectrum of triuret conducted in positive mode.
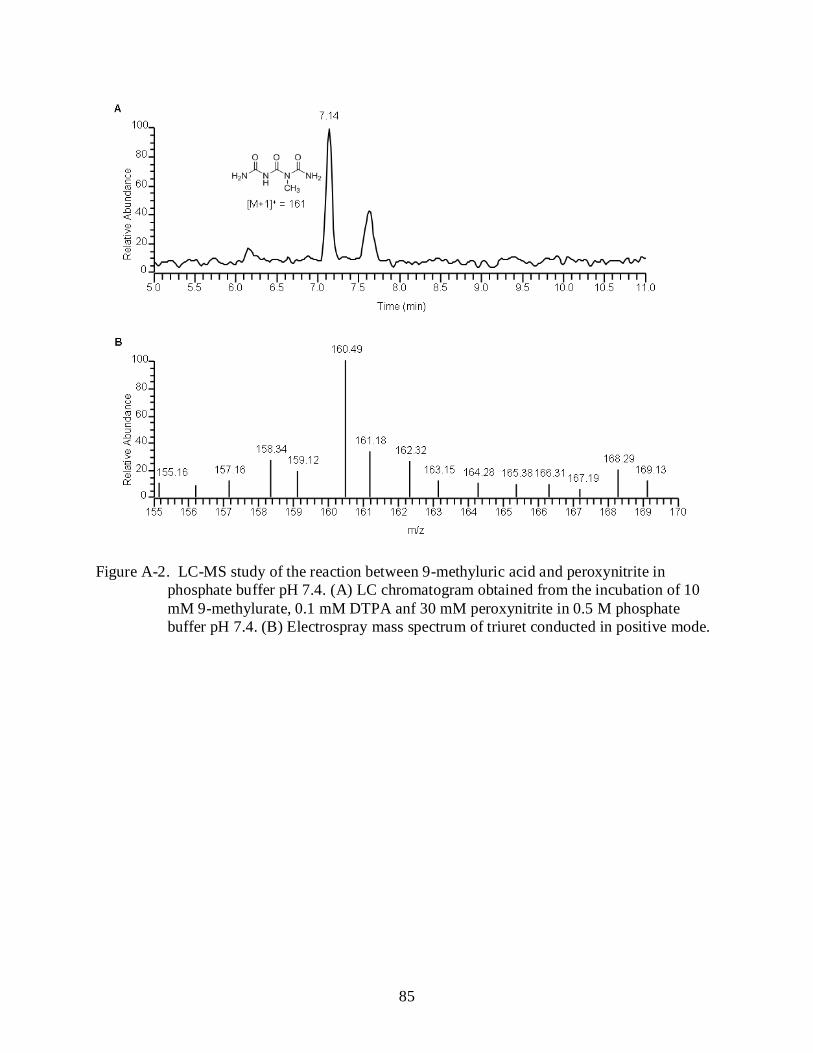
85
Figure A-2. LC-MS study of the reaction between 9-methyluric acid and peroxynitrite in
phosphate buffer pH 7.4. (A) LC chromatogram obtained from the incubation of 10 mM 9-methylurate, 0.1 mM DTPA anf 30 mM peroxynitrite in 0.5 M phosphate buffer pH 7.4. (B) Electrospray mass spectrum of triuret conducted in positive mode.

86
Figure A-3. LC-MS study of the reaction between 1,3-dimethyluric acid and peroxynitrite in
phosphate buffer pH 7.4. (A) LC chromatogram obtained from the incubation of 10 mM 1,3-dimethylurate, 0.1 mM DTPA anf 30 mM peroxynitrite in 0.5 M phosphate buffer pH 7.4. (B) Electrospray mass spectrum of triuret conducted in positive mode.

87
Figure A-4. LC-MS study of the reaction between 1,7-dimethyluric acid and peroxynitrite in phosphate buffer pH 7.4. (A) LC chromatogram obtained from the incubation of 10 mM 1,7-dimethylurate, 0.1 mM DTPA anf 30 mM peroxynitrite in 0.5 M phosphate buffer pH 7.4. (B) Electrospray mass spectrum of triuret conducted in positive mode.

88
Figure A-5. LC-MS study of the reaction between 1,9-dimethyluric acid and peroxynitrite in phosphate buffer pH 7.4. (A) LC chromatogram obtained from the incubation of 10 mM 1,9-dimethylurate, 0.1 mM DTPA anf 30 mM peroxynitrite in 0.5 M phosphate buffer pH 7.4. (B) Electrospray mass spectrum of triuret conducted in positive mode.

89
Figure A-6. LC-MS study of the reaction between 3,7-dimethyluric acid and peroxynitrite in phosphate buffer pH 7.4. (A) LC chromatogram obtained from the incubation of 10 mM 3,7-dimethylurate, 0.1 mM DTPA anf 30 mM peroxynitrite in 0.5 M phosphate buffer pH 7.4. (B) Electrospray mass spectrum of triuret conducted in positive mode.

90
Figure A-7. LC-MS study of the reaction between 1,3,7-trimethyluric acid and peroxynitrite in phosphate buffer pH 7.4. (A) LC chromatogram obtained from the incubation of 10 mM 1,3,7-trimethylurate, 0.1 mM DTPA anf 30 mM peroxynitrite in 0.5 M phosphate buffer pH 7.4. (B) Electrospray mass spectrum of triuret conducted in positive mode.
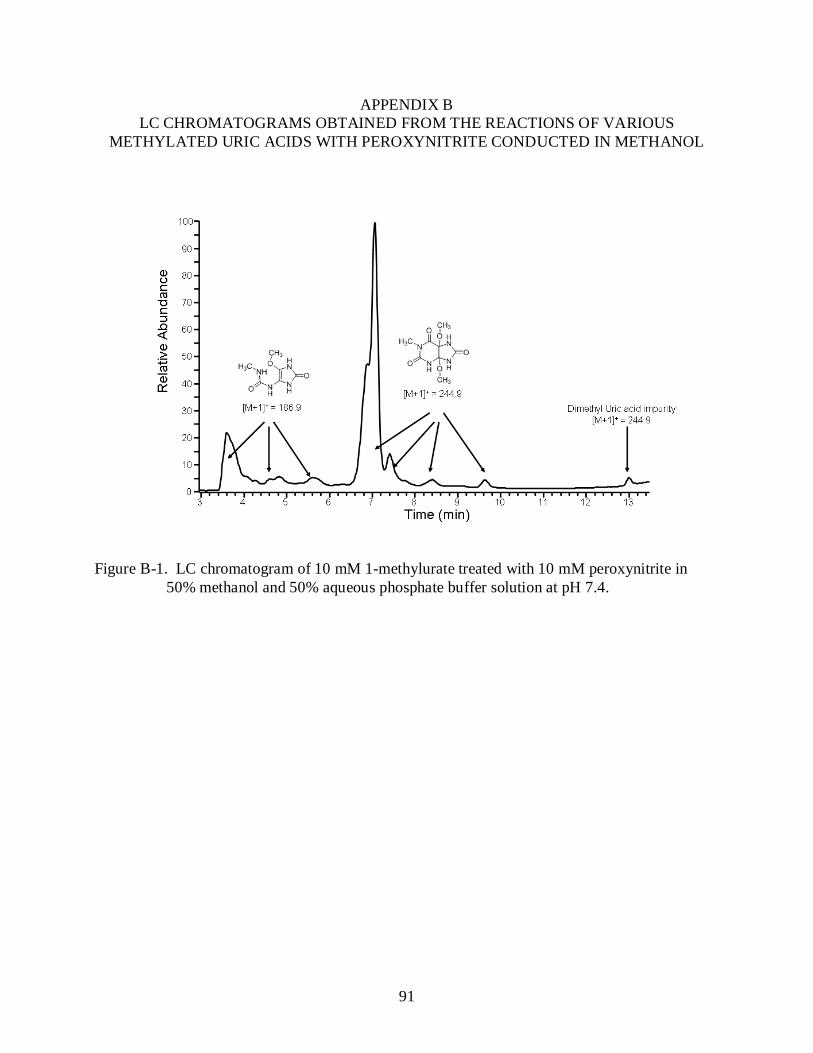
91
APPENDIX B LC CHROMATOGRAMS OBTAINED FROM THE REACTIONS OF VARIOUS
METHYLATED URIC ACIDS WITH PEROXYNITRITE CONDUCTED IN METHANOL
Figure B-1. LC chromatogram of 10 mM 1-methylurate treated with 10 mM peroxynitrite in
50% methanol and 50% aqueous phosphate buffer solution at pH 7.4.

92
Figure B-2. LC chromatogram of 10 mM 9-methylurate treated with 10 mM peroxynitrite in
50% methanol and 50% aqueous phosphate buffer solution at pH 7.4.

93
Figure B-3. LC chromatogram of 10 mM 1,3-dimethylurate treated with 10 mM peroxynitrite in
50% methanol and 50% aqueous phosphate buffer solution at pH 7.4.
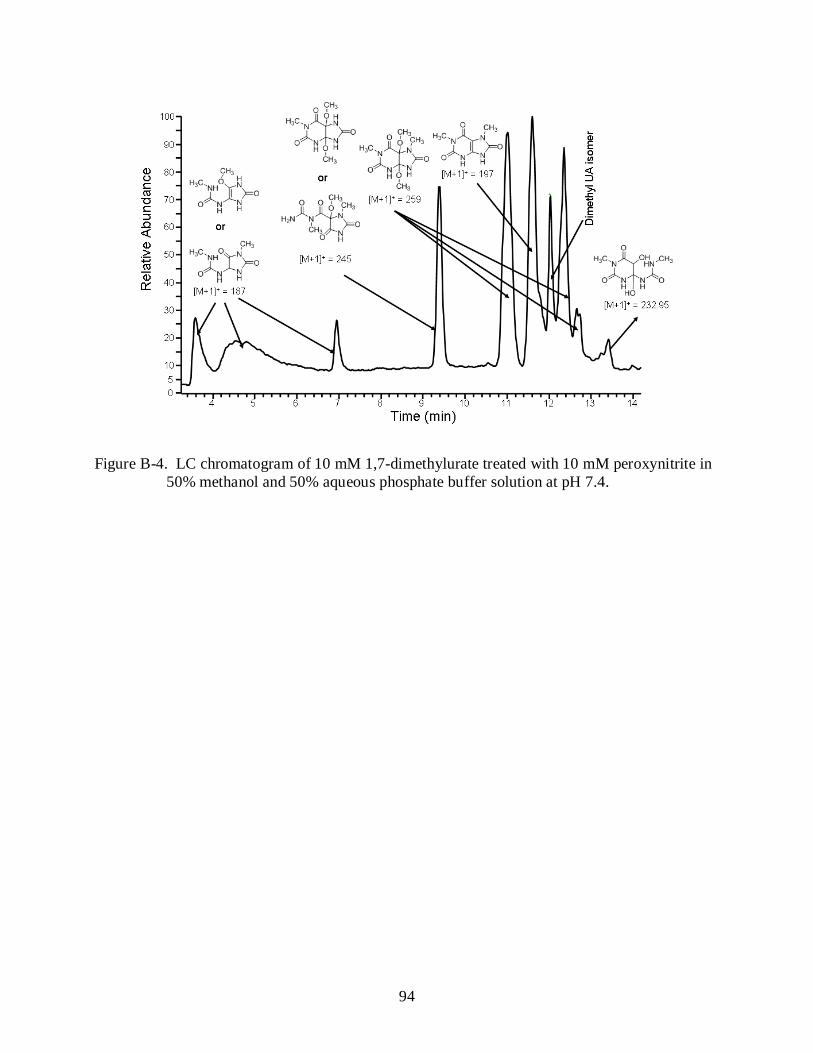
94
Figure B-4. LC chromatogram of 10 mM 1,7-dimethylurate treated with 10 mM peroxynitrite in
50% methanol and 50% aqueous phosphate buffer solution at pH 7.4.

95
Figure B-5. LC chromatogram of 10 mM 1,9-dimethylurate treated with 10 mM peroxynitrite in
50% methanol and 50% aqueous phosphate buffer solution at pH 7.4.
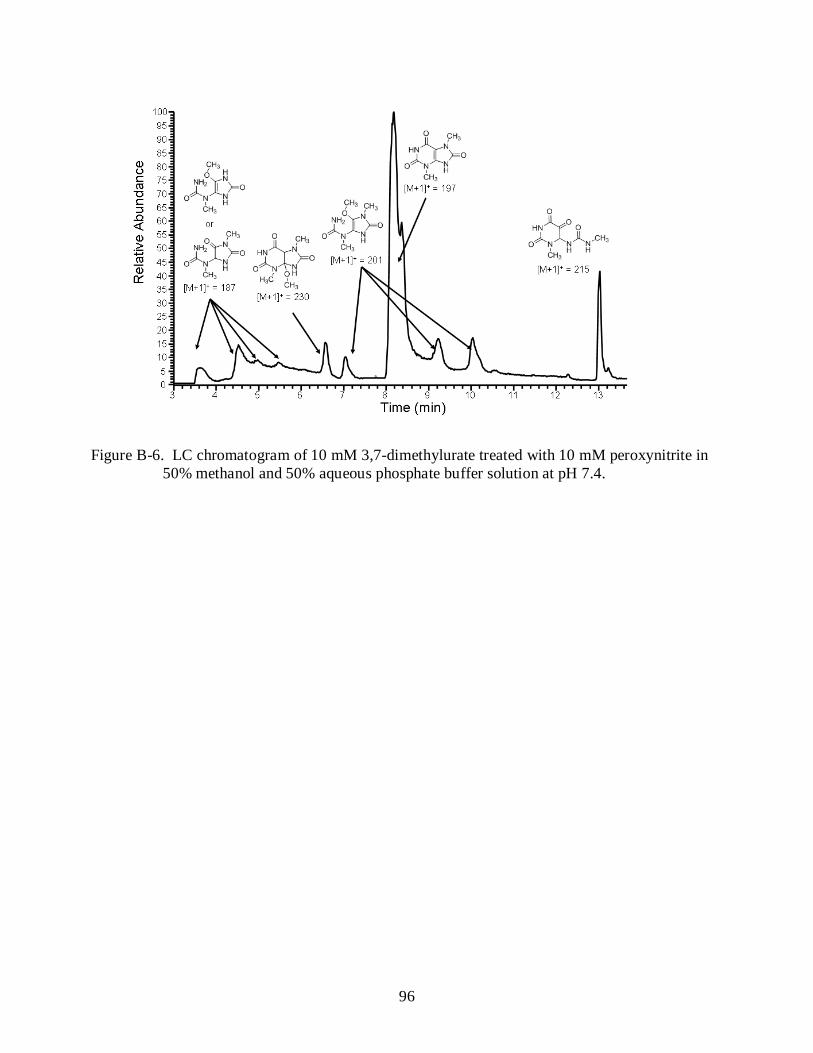
96
Figure B-6. LC chromatogram of 10 mM 3,7-dimethylurate treated with 10 mM peroxynitrite in
50% methanol and 50% aqueous phosphate buffer solution at pH 7.4.

97
Figure B-7. LC chromatogram of 10 mM 1,3,7-trimethylurate treated with 10 mM peroxynitrite
in 50% methanol and 50% aqueous phosphate buffer solution at pH 7.4.

98
APPENDIX C FRAGMENTATION PATTERNS OF DIMETHOXYDEHYDROURIC ACIDS
Figure C-1. Fragmentation pattern of 1-methyluric acid glycol dimethyl ether 3b.

99
Figure C-2. Fragmentation pattern of 1-methyluric acid glycol di-d3-methyl ether 3b.

100
Figure C-3. Fragmentation pattern of 9-methyluric acid glycol dimethyl ether 3c.

101
Figure C-4. Fragmentation pattern of 9-methyluric acid glycol di-d3-methyl ether 3c.

102
Figure C-5. Fragmentation pattern of 1,3-dimethyluric acid glycol di-d3-methyl ether 3d.

103
Figure C-6. Fragmentation pattern of 1,7-dimethyluric acid glycol dimethyl ether 3e.
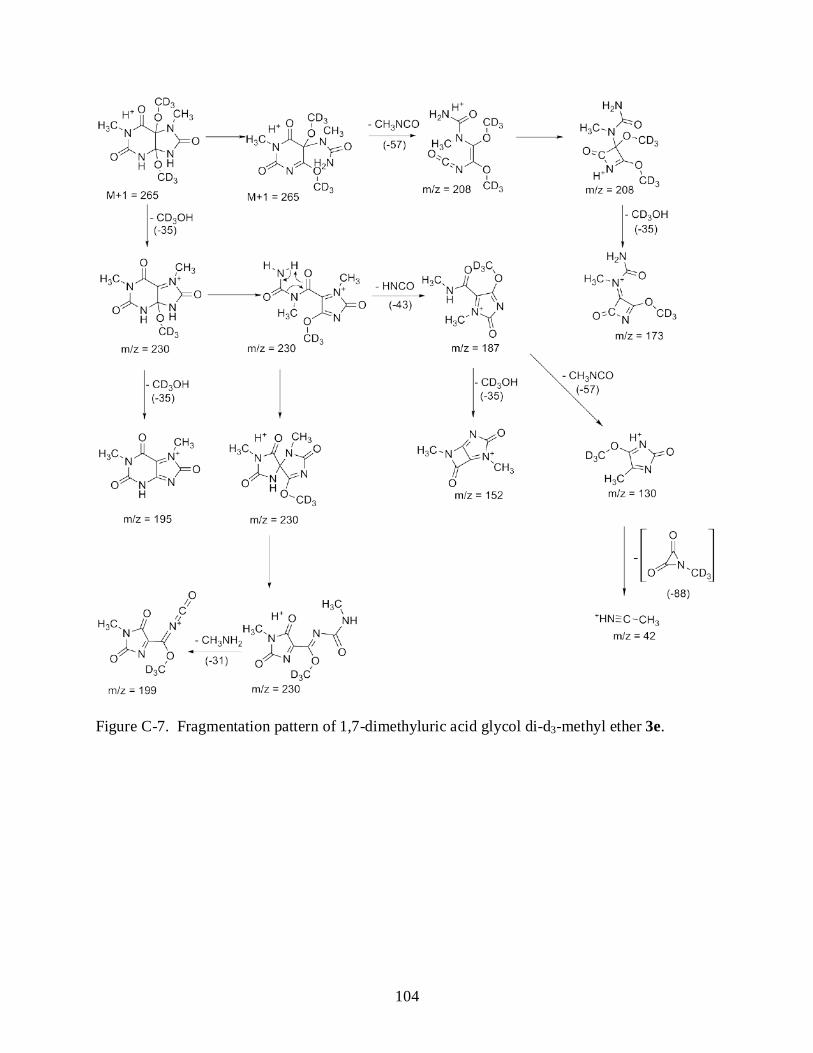
104
Figure C-7. Fragmentation pattern of 1,7-dimethyluric acid glycol di-d3-methyl ether 3e.

105
Figure C-8. Fragmentation pattern of 1,9-dimethyluric acid glycol dimethyl ether 3f.

106
Figure C-9. Fragmentation pattern of 1,9-dimethyluric acid glycol di-d3-methyl ether 3f.

107
APPENDIX D EFFECT OF DIVALENT METAL IONS ON THE REACTION BETWEEN URIC ACID AND
PEROXYNITRITE
Introduction
We extended our study to investigate the effect of divalent metal ions on the stability of the
urate derived radicals generated from the reaction between uric acid and peroxynitrite at pH 12.
The nine divalent metal ions, Ca(II), Zn(II), Mg(II), Cu(II), Ni(II), Co(II), Fe(II), Cd(II) and
Mn(II) were tested and monitored by X-band EPR.
Materials and Methods
Chemicals. Uric aid was purchased from Sigma. L-(+)-Ascorbic Acid was purchased from
Fisher and isoamyl nitrite was purchased from Acros Organics. All of the divalent metals used
were in the form of chloride salts and purchased from Fisher. Urate stock solutions were
prepared with 0.3 M potassium hydroxide (100 mM urate). Peroxynitrite was synthesized
according to Uppu and Pryor (76). The peroxynitrite stock solution concentration was measured
spectrophotometrically at 302 nm (ε = 1670 M-1 cm-1)
Electron Paramagnetic Resonance Parameters. EPR spectra were recorded at room
temperature using a Bruker Elexsys E580 spectrometer employing Bruker’s high-Q cavity
(model) and using quartz capillaries of approximately 1 mm ID. Spectral parameters were
typically: 100 kHz modulation frequency, 1 G modulation amplitude, 2 mW microwave power,
9.87 GHz microwave frequency, 20.48 ms time constant and 81.92 conversion time/point. All
spectra were recorded after the addition of peroxynitrite.
Reaction Mixtures. All reaction Mixtures contained a solution of 5 mM of urate and 25
mM of metal ions. Peroxynitrite was added to these solutions to 15 mM final concentration.

108
Results and Discussion
Of all the metal ions we tested. Only the reactions in the presence of Zn(II) and Cd(II) gave
EPR signals. The precipitates were formed from both reactions. After filtration, it was clearly
shown that the EPR signals came from the precipitates. As shown in Figure D-1, the Cd(II)
spectrum consists of a single intense line at g = 2.0149, while the Zn(II) spectrum displays a
similar line shape with g = 2.0124 (Figure D-2). Both g-values are consistent with carbon-
centered radicals. Interestingly, when ascorbate was added to the reaction mixture, the EPR
signal was diminished completely (Figure D-3) and the doublet EPR spectrum, corresponding to
the ascorbyl radical, was formed. We postulated that the EPR spectra arose from the formation of
the complexes between urate derived radicals, generated from the reaction between uric acid and
peroxynitrite, and metal ions, Zn(II) and Cd(II). However, we still need to do additional
experiments to identify the structures of these complexes.

109
Figure D-1. EPR spectra of the urate-Cd(II) complex obtained by incubating uric acid (5 mM), CdCl2 (25 mM) and peroxynitrite (PN) (15 mM) at room temperature at pH 12. The reaction mixture was filtered to separate the precipitate from the filtrate and monitored by EPR separately. Spectrometer settings: microwave power = 2 mW; modulation frequency = 100 kHz; modulation amplitude = 1 GHz; time constant = 20.48 ms; sweep time = 83.89 s; sweep width = 100 G; and receiver gain = 60 db.
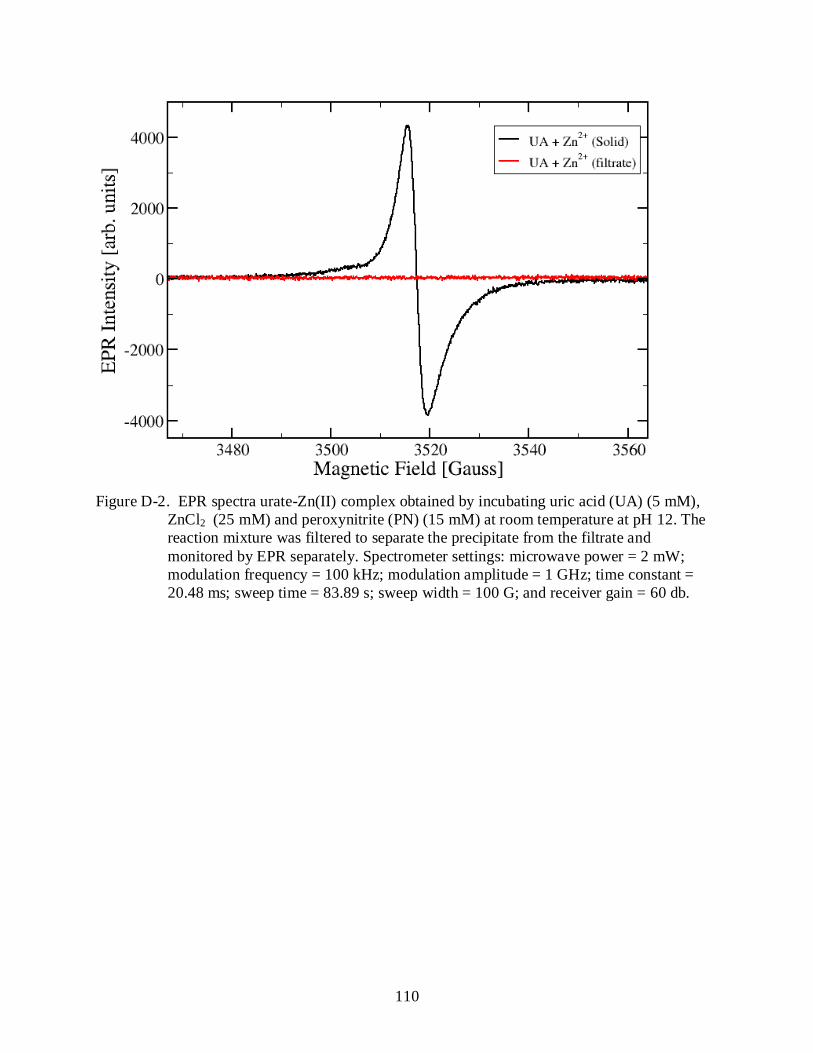
110
Figure D-2. EPR spectra urate-Zn(II) complex obtained by incubating uric acid (UA) (5 mM),
ZnCl2 (25 mM) and peroxynitrite (PN) (15 mM) at room temperature at pH 12. The reaction mixture was filtered to separate the precipitate from the filtrate and monitored by EPR separately. Spectrometer settings: microwave power = 2 mW; modulation frequency = 100 kHz; modulation amplitude = 1 GHz; time constant = 20.48 ms; sweep time = 83.89 s; sweep width = 100 G; and receiver gain = 60 db.

111
Figure D-3. Effect of ascorbate on the urate-Zn(II) complex formation. EPR spectra obtained by
incubating urate (5mM), ZnCl2 (25 mM) and peroxynitrite (PN) (15 mM) at room temperature at pH 12. An aliquot amount of the reaction mixture was withdrew to examine the stability of the radical complexes in the presence of ascorbate (1 mM) and monitored by EPR (–). Spectrometer settings: microwave power = 19.97 mW; modulation frequency = 100 kHz; modulation amplitude = 1 GHz; time constant = 20.48 ms; sweep time = 83.89 s; sweep width = 54 G; and receiver gain = 60 db.

112
LIST OF REFERENCES
1. Kopani, M., Celec, P., Danisovic, L., Michalka, P., and Biro, C. (2006) Oxidative stress and electron spin resonance. Clin. Chim. Acta. 364, 61-66.
2. Hardy, M., Ouari, O., Charles, L., Finet, J. P., Iacazio, G., Monnier, V., Rockenbauer, A., and Tordo, P. (2005) Synthesis and spin-trapping behavior of 5-ChEPMPO, a cholesteryl ester analogue of the spin trap DEPMPO. J. Org. Chem. 70, 10426-10433.
3. Finkel, T., and Holbrook, N. J. (2000) Oxidants, oxidative stress and the biology of ageing. Nature. 408, 239-247.
4. Beckman, K. B., and Ames, B. N. (1998) The free radical theory of aging matures. Physiological Reviews. 78, 547-581.
5. Xia, Y., Khatchikian, G., and Zweier, J. L. (1996) Adenosine deaminase inhibition prevents free radical-mediated injury in the postischemic heart. J. Biol. Chem. 271, 10096-10102.
6. Halliwell, B., and Chirico, S. (1993) Lipid-Peroxidation - Its Mechanism, Measurement, and Significance. Am. J. Clin. Nutr. 57, S715-S725.
7. Wiseman, H., and Halliwell, B. (1996) Damage to DNA by reactive oxygen and nitrogen species: Role in inflammatory disease and progression to cancer. Biochem. J. 313, 17-29.
8. Thornally, P. J. (1986) Theory and biological applications of the electron spin resonance technique of spin trapping. Life Chemistry Reports, 57-122
9. Buettner, G. R. (1987) Spin Trapping - Electron-Spin-Resonance Parameters of Spin Adducts. Free Radical Biol. Med. 3, 259-303.
10. Janzen, E. G., and BLACKBUR.BJ. (1968) Detection and Identification of Short-Lived Free Radicals by An Electron Spin Resonance Trapping Technique. J. Am. Chem. Soc. 90, 5909-&.
11. Janzen, E. G., and BLACKBUR.BJ. (1969) Detection and Identification of Short-Lived Free Radicals by Electron Spin Resonance Trapping Techniques (Spin Trapping) - Photolysis of Organolead, -Tin, and -Mercury Compounds. J. Am. Chem. Soc. 91, 4481-&.
12. Samuni, A., Samuni, A., and Swartz, H. M. (1989) The Cellular-Induced Decay of Dmpo Spin Adducts of .Oh and .O2-. Free Rad. Biol. Med. 6, 179-183.
13. Frejaville, C., Karoui, H., Tuccio, B., Lemoigne, F., Culcasi, M., Pietri, S., Lauricella, R., and Tordo, P. (1995) 5-(Diethoxyphosphoryl)-5-Methyl-1-Pyrroline N-Oxide - A New Efficient Phosphorylated Nitrone for the In-Vitro and In-Vivo Spin-Trapping of Oxygen-Centered Radicals. J. Med. Chem. 38, 258-265.
113
14. Olive, G., Mercier, A., Le Moigne, F., Rockenbauer, A., and Tordo, P. (2000) 2-Ethoxycarbonyl-2-methyl-3,4-dihydro-2H-pyrrole-1-oxide: evaluation of the spin trapping properties. Free Rad. Biol. Med. 28, 403-408.
15. Zhao, H. T., Joseph, J., Zhang, H., Karoui, H., and Kalyanaraman, B. (2001) Synthesis and biochemical applications of a solid cyclic nitrone spin trap: A relatively superior trap for detecting superoxide anions and glutathiyl radicals. Free Rad. Biol. Med. 31, 599-606.
16. Sautin, Y. Y., and Johnson, R. J. (2008) Uric acid: The oxidant-antioxidant paradox. Nucleosides, Nucleotides Nucleic Acids. 27, 608-619.
17. Wu, X. W., Muzny, D. M., Lee, C. C., and Caskey, C. T. (1992) Two independent mutational events in the loss of urate oxidase during hominoid evolution. J. Mol. Evol. 34, 78-84.
18. Johnson, R. J., Kang, D. H., Feig, D., Kivlighn, S., Kanellis, J., Watanabe, S., Tuttle, K. R., Rodriguez-Iturbe, B., Herrera-Acosta, J., and Mazzali, M. (2003) Is there a pathogenetic role for uric acid in hypertension and cardiovascular and renal disease? Hypertension. 41, 1183-1190.
19. Becker, B. F. (1993) Towards the Physiological-Function of Uric-Acid. Free Radical Biol. Med. 14, 615-631.
20. Bagnati, M., Perugini, C., Cau, C., Bordone, R., Albano, E., and Bellomo, G. (1999) When and why a water-soluble antioxidant becomes pro-oxidant during copper-induced low-density lipoprotein oxidation: a study using uric acid. Biochem. J. 340, 143-152.
21. Smith, C. M., Rovamo, L. M., and Raivio, K. O. (1977) Fructose-Induced Adenine-Nucleotide Catabolism in Isolated Rat Hepatocytes. Can. J. Biochem. 55, 1237-1240.
22. Friedl, H. P., Till, G. O., Trentz, O., and Ward, P. A. (1991) Role of Oxygen Radicals in Tourniquet-Related Ischemia-Reperfusion Injury of Human Patients. Klinische Wochenschrift. 69, 1109-1112.
23. Ames, B. N., Cathcart, R., Schwiers, E., and Hochstein, P. (1981) Uric-Acid Provides An Antioxidant Defense in Humans Against Oxidant-Caused and Radical-Caused Aging and Cancer - A Hypothesis. Proc. Natl. Acad. Sci. U. S. A. 78, 6858-6862.
24. Kuzkaya, N., Weissmann, N., Harrison, D. G., and Dikalov, S. (2005) Interactions of peroxynitrite with uric acid in the presence of ascorbate and thiols: Implications for uncoupling endothelial nitric oxide synthase. Biochem. Pharmacol. 70, 343-354.
25. Robinson, K. M., Morre, J. T., and Beckman, J. S. (2004) Triuret: a novel product of peroxynitrite-mediated oxidation of urate. Arch. Biochem. Biophys. 423, 213-217.
26. Volk, K. J., Yost, R. A., and Brajtertoth, A. (1989) Online Electrochemistry Thermospray Tandem Mass-Spectrometry As A New Approach to the Study of Redox Reactions - the Oxidation of Uric-Acid. Anal. Chem. 61, 1709-1717.

114
27. Whiteman, M., and Halliwell, B. (1996) Protection against peroxynitrite-dependent tyrosine nitration and alpha 1-antiproteinase inactivation by ascorbic acid. A comparison with other biological antioxidants. Free Radical Res. 25, 275-283.
28. Squadrito, G. L., Cueto, R., Splenser, A. E., Valavanidis, A., Zhang, H. W., Uppu, R. M., and Pryor, W. A. (2000) Reaction of uric acid with peroxynitrite and implications for the mechanism of neuroprotection by uric acid. Arch. Biochem. Biophys. 376, 333-337.
29. Kand'ar, R., Zakova, P., and Muzakova, V. (2006) Monitoring of antioxidant properties of uric acid in humans for a consideration measuring of levels of allantoin in plasma by liquid chromatography. Clin. Chim. Acta. 365, 249-256.
30. Howell, R. R., and Wyngaarden, J. B. (1960) Mechanism of Peroxidation of Uric Acids by Hemoproteins. J. Biol. Chem. 235, 3544-3550.
31. Mazzali, M., Hughes, J., Kim, Y. G., Jefferson, J. A., Kang, D. H., Gordon, K. L., Lan, H. Y., Kivlighn, S., and Johnson, R. J. (2001) Elevated uric acid increases blood pressure in the rat by a novel crystal-independent mechanism. Hypertension. 38, 1101-1106.
32. Maples, K. R., and Mason, R. P. (1988) Free-Radical Metabolite of Uric-Acid. J. Biol. Chem. 263, 1709-1712.
33. Kahn, K., Serfozo, P., and Tipton, P. A. (1997) Identification of the true product of the urate oxidase reaction. J. Am. Chem. Soc. 119, 5435-5442.
34. Kahn, K., and Tipton, P. A. (1998) Spectroscopic characterization of intermediates in the urate oxidase reaction. Biochemistry. 37, 11651-11659.
35. Goyal, R. N., Brajtertoth, A., Dryhurst, G., and Nguyen, N. T. (1982) A Comparison of the Peroxidase-Catalyzed and Electrochemical Oxidation of Uric-Acid. Bioelectrochem. Bioenerg. 9, 39-60.
36. Santos, C. X. C., Anjos, E. I., and Augusto, O. (1999) Uric acid oxidation by peroxynitrite: Multiple reactions, free radical formation, and amplification of lipid oxidation. Arch. Biochem. Biophys. 372, 285-294.
37. Aruoma, O. I., and Halliwell, B. (1989) Inactivation of Alpha-Antiproteinase by Hydroxyl Radicals - the Effect of Uric-Acid. FEBS Lett. 244, 76-80.
38. Kittridge, K. J., and Willson, R. L. (1984) Uric-Acid Substantially Enhances the Free Radical-Induced Inactivation of Alcohol-Dehydrogenase. FEBS Lett. 170, 162-164.
39. Sanguinetti, S. M., Batthyany, C., Trostchansky, A., Botti, H., Lopez, G. I., Wikinski, R. L. W., Rubbo, H., and Schreier, L. E. (2004) Nitric oxide inhibits prooxidant actions of uric acid during copper-mediated LDL oxidation. Arch. Biochem. Biophys. 423, 302-308.

115
40. Plumb, R. C., Tantayanon, R., Libby, M., and Xu, W. W. (1989) Chemical-Model for Viking Biology Experiments - Implications for the Composition of the Martian Regolith. Nature. 338, 633-635.
41. Kobayashi, K., Miki, M., and Tagawa, S. (1995) Pulse-Radiolysis Study of the Reaction of Nitric-Oxide with Superoxide. J. Chem. Soc., Dalton Trans., 2885-2889.
42. Huie, R. E., and Padmaja, S. (1993) The Reaction of No with Superoxide. Free Radical Res. Commun. 18, 195-199.
43. Goldstein, S., and Czapski, G. (1995) The Reaction of No-Center-Dot with O-2(Center-Dot-) and Ho2-Center-Dot - A Pulse-Radiolysis Study. Free Radical Biol. Med. 19, 505-510.
44. Pacher, P., Beckman, J. S., and Liaudet, L. (2007) Nitric oxide and peroxynitrite in health and disease. Physiological Reviews. 87, 315-424.
45. Koppenol, W. H., Moreno, J. J., Pryor, W. A., Ischiropoulos, H., and Beckman, J. S. (1992) Peroxynitrite, A Cloaked Oxidant Formed by Nitric-Oxide and Superoxide. Chem. Res. Toxicol. 5, 834-842.
46. Kissner, R., Nauser, T., Kurz, C., and Koppenol, W. H. (2003) Peroxynitrous acid - Where is the hydroxyl radical? Iubmb Life. 55, 567-572.
47. Kissner, R., Nauser, T., Bugnon, P., Lye, P. G., and Koppenol, W. H. (1997) Formation and properties of peroxynitrite as studied by laser flash photolysis, high-pressure stopped-flow technique, and pulse radiolysis. Chem. Res. Toxicol. 10, 1285-1292.
48. Tsai, J. H. M., Harrison, J. G., Martin, J. C., Hamilton, T. P., vanderWoerd, M., Jablonsky, M. J., and Beckman, J. S. (1994) Role of Conformation of Peroxynitrite Anion (Onoo-) in Its Stability and Toxicity. J. Am. Chem. Soc. 116, 4115-4116.
49. Tsai, H. H., Hamilton, T. P., Tsai, J. H. M., vanderWoerd, M., Harrison, J. G., Jablonsky, M. J., Beckman, J. S., and Koppenol, W. H. (1996) Ab initio and NMR study of peroxynitrite and peroxynitrous acid: Important biological oxidants. J. Phys. Chem. 100, 15087-15095.
50. Lymar, S. V., and Hurst, J. K. (1998) CO2-catalyzed one-electron oxidations by peroxynitrite: Properties of the reactive intermediate. Inorg. Chem. 37, 294-301.
51. Uppu, R. M., Squadrito, G. L., and Pryor, W. A. (1996) Acceleration of peroxynitrite oxidations by carbon dioxide. Arch. Biochem. Biophys. 327, 335-343.
52. Uppu, R. M., Winston, G. W., and Pryor, W. A. (1997) Reactions of peroxynitrite with aldehydes as probes for the reactive intermediates responsible for biological nitration. Chem. Res. Toxicol. 10, 1331-1337.

116
53. Yang, D., Tang, Y. C., Chen, J., Wang, X. C., Bartberger, M. D., Houk, K. N., and Olson, L. (1999) Ketone-catalyzed decomposition of peroxynitrite via dioxirane intermediates. J. Am. Chem. Soc. 121, 11976-11983.
54. Masumoto, H., and Sies, H. (1996) The reaction of ebselen with peroxynitrite. Chem. Res. Toxicol. 9, 262-267.
55. Koppenol, W. H., and Kissner, R. (1998) Can O = NOOH undergo homolysis? Chem. Res. Toxicol. 11, 87-90.
56. Merenyi, G., and Lind, J. (1997) Thermodynamics of peroxynitrite and its CO2 adduct. Chem. Res. Toxicol. 10, 1216-1220.
57. Squadrito, G. L., and Pryor, W. A. (1998) Oxidative chemistry of nitric oxide: The roles of superoxide, peroxynitrite, and carbon dioxide. Free Radical Biol. Med. 25, 392-403.
58. Squadrito, G. L., and Pryor, W. A. (2002) Mapping the reaction of peroxynitrite with CO2: Energetics, reactive species, and biological implications. Chem. Res. Toxicol. 15, 885-895.
59. Beckman, J. S., Beckman, T. W., Chen, J., Marshall, P. A., and Freeman, B. A. (1990) Apparent Hydroxyl Radical Production by Peroxynitrite - Implications for Endothelial Injury from Nitric-Oxide and Superoxide. Proc. Natl. Acad. Sci. U. S. A. 87, 1620-1624.
60. Vandervliet, A., Smith, D., Oneill, C. A., Kaur, H., Darleyusmar, V., Cross, C. E., and Halliwell, B. (1994) Interactions of Peroxynitrite with Human Plasma and Its Constituents - Oxidative Damage and Antioxidant Depletion. Biochem. J. 303, 295-301.
61. Ischiropoulos, H., Zhu, L., Chen, J., Tsai, M., Martin, J. C., Smith, C. D., and Beckman, J. S. (1992) Peroxynitrite-Mediated Tyrosine Nitration Catalyzed by Superoxide-Dismutase. Arch. Biochem. Biophys. 298, 431-437.
62. King, P. A., Anderson, V. E., Edwards, J. O., Gustafson, G., Plumb, R. C., and Suggs, J. W. (1992) A Stable Solid That Generates Hydroxyl Radical Upon Dissolution in Aqueous-Solutions - Reaction with Proteins and Nucleic-Acid. J. Am. Chem. Soc. 114, 5430-5432.
63. Radi, R., Beckman, J. S., Bush, K. M., and Freeman, B. A. (1991) Peroxynitrite-Induced Membrane Lipid-Peroxidation - the Cytotoxic Potential of Superoxide and Nitric-Oxide. Arch. Biochem. Biophys. 288, 481-487.
64. Hooper, D. C., Spitsin, S., Kean, R. B., Champion, J. M., Dickson, G. M., Chaudhry, I., and Koprowski, H. (1998) Uric acid, a natural scavenger of peroxynitrite, in experimental allergic encephalomyelitis and multiple sclerosis. Proc. Natl. Acad. Sci. U. S. A. 95, 675-680.

117
65. Spitsin, S. V., Scott, G. S., Mikheeva, T., Zborek, A., Kean, R. B., Brimer, C. M., Koprowski, H., and Hooper, D. C. (2002) Comparison of uric acid and ascorbic acid in protection against EAE. Free Radical Biol. Med. 33, 1363-1371.
66. Feig, D. I., and Johnson, R. J. (2003) Hyperuricemai in childhood essential hypertension. Pediatr. Res. 53, 524A.
67. Feig, D. I., Nakagawa, T., Karumanchi, S. A., Oliver, W. J., Kang, D. H., Finch, J., and Johnson, R. J. (2004) Hypothesis: Uric acid, nephron number, and the pathogenesis of essential hypertension. Kidney Int. 66, 281-287.
68. Kang, D. H., Nakagawa, T., Feng, L. L., Watanabe, S., Han, L., Mazzali, M., Truong, L., Harris, R., and Johnson, R. J. (2002) A role for uric acid in the progression of renal disease. Journal of the American Society of Nephrology. 13, 2888-2897.
69. Mazzali, M., Kanellis, J., Han, L., Feng, L., Xia, Y. Y., Chen, Q., Kang, D. H., Gordon, K. L., Watanabe, S., Nakagawa, T., Lan, H. Y., and Johnson, R. J. (2002) Hyperuricemia induces a primary renal arteriolapathy in rats by a blood pressure-independent mechanism. American Journal of Physiology-Renal Physiology. 282, F991-F997.
70. Nakagawa, T., Tuttle, K. R., Short, R. A., and Johnson, R. J. (2005) Hypothesis: fructose-induced hyperuricemia as a causal mechanism for the epidemic of the metabolic syndrome. Nature Clinical Practice Nephrology. 1, 80-86.
71. Nakagawa, T., Hu, H. B., Zharikov, S., Tuttle, K. R., Short, R. A., Glushakova, O., Ouyang, X., Feig, D. I., Block, E. R., Herrera-Acosta, J., Patel, J. M., and Johnson, R. J. (2006) A causal role for uric acid in fructose-induced metabolic syndrome. American Journal of Physiology-Renal Physiology. 290, F625-F631.
72. Aruoma, O. I., and Halliwell, B. (1989) Inactivation of Alpha-Antiproteinase by Hydroxyl Radicals - the Effect of Uric-Acid. FEBS Lett. 244, 76-80.
73. Bagnati, M., Perugini, C., Cau, C., Bordone, R., Albano, E., and Bellomo, G. (1999) When and why a water-soluble antioxidant becomes pro-oxidant during copper-induced low-density lipoprotein oxidation: a study using uric acid. Biochem. J. 340, 143-152.
74. Kittridge, K. J., and Willson, R. L. (1984) Uric-Acid Substantially Enhances the Free Radical-Induced Inactivation of Alcohol-Dehydrogenase. FEBS Lett. 170, 162-164.
75. Sanguinetti, S. M., Batthyany, C., Trostchansky, A., Botti, H., Lopez, G. I., Wikinski, R. L. W., Rubbo, H., and Schreier, L. E. (2004) Nitric oxide inhibits prooxidant actions of uric acid during copper-mediated LDL oxidation. Arch. Biochem. Biophys. 423, 302-308.
76. Uppu, R. M., and Pryor, W. A. (1996) Synthesis of peroxynitrite in a two-phase system using isoamyl nitrite and hydrogen peroxide. Anal. Biochem. 236, 242-249.
77. Janzen, E. G. (1971) Spin Trapping. Acc. Chem. Res. 4, 31-&.
118
78. Bechara, E. J., Massari, J., Fujy, D., Micke, G., Tokikawa, R., and Assuncao, N. (2008) Radical acetylation of amino acids and 2 '-deoxyguanosine coupled to the reaction of diacetyl with peroxynitrite in aerated medium. Free Radical Biol. Med. 44, 493.
79. Nonoyama, N., Oshima, H., Shoda, C., and Suzuki, H. (2001) The reaction of peroxynitrite with organic molecules bearing a biologically important functionality. The multiplicity of reaction modes as exemplified by hydroxylation, nitration, nitrosation, dealkylation, oxygenation, and oxidative dimerization and cleavage. Bull. Chem. Soc. Jpn. 74, 2385-2395.
80. Safranow, K., and Machoy, Z. (2005) Simultaneous determination of 16 purine derivatives in urinary calculi by gradient reversed-phase high-performance liquid chromatography with UV detection. J. Chromatogr. , B: Anal. Technol. Biomed. Life Sci. 819, 229-235.
81. Davies, K. J. A., Sevanian, A., Muakkassahkelly, S. F., and Hochstein, P. (1986) Uric-Acid Iron-Ion Complexes - A New Aspect of the Antioxidant Functions of Uric-Acid. Biochem. J. 235, 747-754.
82. Safranow, K., and Machoy, Z. (2005) Methylated purines in urinary stones. Clinical Chemistry. 51, 1493-1498.
83. Bhat, V. B., Sridhar, G. R., and Madyastha, K. M. (2001) Efficient scavenging of hydroxyl radicals and inhibition of lipid peroxidation by novel analogues of 1,3,7-trimethyluric acid. Life Sci. 70, 381-393.
84. Smith, R. C., Reeves, J., Mckee, M. L., and Daron, H. (1987) Reaction of Methylated Urates with 1,1-Diphenyl-2-Picrylhydrazyl. Free Radical Biol. Med. 3, 251-257.
85. Meadows, J., Smith, R. C., and Reeves, J. (1986) Uric-Acid Protects Membranes and Linolenic Acid from Ozone-Induced Oxidation. Biochem. Biophys. Res. Commun. 137, 536-541.
86. Nishida, Y. (1991) Inhibition of Lipid-Peroxidation by Methylated Analogs of Uric-Acid. J. Pharm. Pharmacol. 43, 885-887.
87. Smith, R. C., and Lawing, L. (1983) Antioxidant Activity of Uric-Acid and 3-N-Ribosyluric Acid with Unsaturated Fatty-Acids and Erythrocyte-Membranes. Arch. Biochem. Biophys. 223, 166-172.
88. Telo, J. P. (2003) Radicals derived from uric acid and its methyl derivatives in aqueous solution: an EPR spectroscopy and theoretical study. Org. Biomol. Chem. 1, 588-592.
89. Zhou, C. C., and Hill, D. R. (2007) The keto-enol tautomerization of ethyl butylryl acetate studied by LC-NMR. Magn. Reson. Chem. 45, 128-132.
90. Arteel, G. E., Briviba, K., and Sies, H. (1999) Protection against peroxynitrite. FEBS Lett. 445, 226-230.

119
91. Douki, T., Cadet, J., and Ames, B. N. (1996) An adduct between peroxynitrite and 2'-deoxyguanosine: 4,5-dihydro-5-hydroxy-4-(nitrosooxy)-2'-deoxyguanosine. Chem. Res. Toxicol. 9, 3-7.
92. Merenyi, G., and Lind, J. (1998) Free radical formation in the peroxynitrous acid (ONOOH) peroxynitrite (ONOO-) system. Chem. Res. Toxicol. 11, 243-246.
93. Althaus, J. S., Fici, G. J., Plaisted, S. M., Kezdy, F. J., Campbell, C. M., Hoogerheide, J. G., and VonVoigtlander, P. F. (1997) Protein nitration by peroxynitrite: A method for monitoring nitric oxide neurotoxicity. Microchem. J. 56, 155-164.
94. Xiong, Y. Q., Rabchevsky, A. G., and Hall, E. D. (2007) Role of peroxynitrite in secondary oxidative damage after spinal cord injury. J. Neurochem. 100, 639-649.
95. Kohnen, S. L., Mouithys-Mickalad, A. A., by-Dupont, G. P., Deby, C. M. T., Lamy, M. L., and Noels, A. F. (2001) Oxidation of tetrahydrobiopterin by peroxynitrite or oxoferryl species occurs by a radical pathway. Free Radical Res. 35, 709-721.
96. Eberson, L. (1992) Inverted Spin Trapping - Reactions Between the Radical Cation of Alpha-Phenyl-N-Tert-Butylnitrone and Ionic and Neutral Nucleophiles. J. Chem. Soc., Perkin Trans. 2. 10, 1807-1813.
97. Eberson, L., Lind, J., and Merenyi, G. (1994) Inverted Spin-Trapping .4. Application to the Formation of Imidyl Spin Adducts from N-Haloimides. J. Chem. Soc., Perkin Trans. 2. 6, 1181-1188.
98. Eberson, L. (1994) Inverted Spin-Trapping .3. Further-Studies on the Chemical and Photochemical Oxidation of Spin Traps in the Presence of Nucleophiles. J. Chem. Soc., Perkin Trans. 2. 2, 171-176.
99. Kotake, Y., and Janzen, E. G. (1991) Decay and Fate of the Hydroxyl Radical Adduct of Alpha-Phenyl-N-Tert-Butylnitrone in Aqueous-Media. J. Am. Chem. Soc. 113, 9503-9506.
100. Mcintire, G. L., Blount, H. N., Stronks, H. J., Shetty, R. V., and Janzen, E. G. (1980) Spin Trapping in Electrochemistry .2. Aqueous and Non-Aqueous Electrochemical Characterizations of Spin Traps. J. Phys. Chem. 84, 916-921.
101. Eberson, L., Hartshorn, M. P., and Persson, O. (1996) Inverted spin trapping .5. 1,1,1,3,3,3-hexafluoropropan-2-ol as a solvent for the discrimination between proper and inverted spin trapping. J. Chem. Soc., Perkin Trans. 2. 2, 141-149.
102. Gandour, M. A., Kasim, E. A., Amrallah, A. H., and Farghaly, O. A. (1994) Differential-Pulse Polarography of Cadmium-Urate and Lead-Urate and Adsorptive Stripping Voltammetric Determination of Uric-Acid. Talanta. 41, 439-444.
120
BIOGRAPHICAL SKETCH
Witcha Imaram was born in Ratchaburi, a province in the western part of Thailand.
Awarded by the Institute for the Promotion of Teaching Science and Technology, he received the
Development and Promotion of Science and Technology Talent Project (DPST) scholarship to
complete his high school education at Sriboonyanon School, Nonthaburi, Thailand in 1999, and a
Bachelor of Science (1st class honours) degree in chemistry from Kasetsart University, Bangkok,
Thailand, in 2003. After graduation, he received a Thai scholarship to pursue his Ph.D. degree at
the University of Florida in Fall 2003. In his graduate research work, he joined Dr. Alexander
Angerhofer’s research group to elucidate the mechanisms involved in the biological effects of
uric acid, using ESR spin trapping methods to probe the formation of reactive radical species
derived from uric acid.