2008_q2resultspresentation
DESCRIPTION
REPORTTRANSCRIPT
First City Monument Bank Plc.
Investor/Analyst Presentation
Review of H1 2008/9 results
Outline
PART A –REVIEW OF THE OPERATING ENVIRONMENT
Global Scan and Implications for Nigeria
Nigeria Macro Report
o Scorecard, Risk Factors & Mitigants and Outlook
o Analysis of the Stock Market and outlook
o Review of the Banking Sector
PART B-FCMBo Strategy & Strengths
o Highlights of Half year Results and Variance Analysis
o Outlook –April 2009
2

Implications of
the global crisis for Nigeria
With increased financial globalization “No one doubts that Africa will feel the effects of the crisis eventually. As world
trade contracts, so will the demand for Africa’s oil and minerals, the main commodity behind the recent boom” Benedicte
Christen-Deputy Director of IMF’s African Department
Impact of global recession (IMF-2009 global growth with slow to 3%, UBS-2.2%) on oil
prices and the likely downward pressure on revenue projections
Expected slowdown in exports stemming from the global recession
Heightened liquidity pressure on the stock market as foreign portfolio inflows reverse
Increased emphasis on the need to enhance supervision and regulatory oversight of
the financial system given the increased integration of markets
Global de–leveraging (shift from debt to cash) reduces the amount of external financing
available for developing and emerging economies
Merrill Lynch ranks Nigeria among the 10 least vulnerable economies in the world out of a
universe of 60 countries and based on 62 indicators
(China, Egypt, Peru, Oman, Indonesia, Mexico, Philippines, Russia) 3
Outline
PART A –REVIEW OF THE OPERATING ENVIRONMENT
Global Scan and Implications for Nigeria
Nigeria Macro Report
o Scorecard, Risk Factors & Mitigants and Outlook
o Analysis of the Stock Market and outlook
o Review of the Banking Sector
PART B-FCMBo Strategy & Strengths
o Highlights of Half year Results and Variance Analysis
o Outlook –April 2009
4

Macro Scorecard
o GDP growth remains fairly strong despite downward pressures on oil GDP
o Federally collected revenue, of which oil receipts is a key component has remained steady overtime
with a growing contribution from company income tax
o Inflationary pressures remain; Oct. YOY up to 14.7% from Sept. 13% but food inflation, month on
month, is down by 0.6%.
o The exchange rate remains stable and the CBN restates its commitment to defend the currency
Q1 2008 Q2 2008 Q3 2008
Real GDP growth rate 5.54% 6.65%
IMF & EIU
FY forecasts of
6.3%
Oil GDP growth rate -4.70% N/A N/A
non-oil GDP growth rate 9.67% 8.5% N/A
Federally Collected Revenue N1.89 trillion N1.88 trillion N/A
% Contribution of Oil Receipts 83% 82.6% N/A
Inflation rate (YOY) 7.8% 14% 12.40%
Average Exchange rates (N/USD) N118.04/$ N117.84/$ N117.77/$
Foreign Reserves (USD) 59.7 BILLION 59.2 BILLION 63 BILLION
Excess Crude Reserves (USD) as @ September 2008 US$17 billion
Current Account Surplus (Deficit) as at October 2008 US$21 billion
Crude Oil Prices (UDS/barrel)-Bonny Light US$98.9 US$138.74 US$121.07
Crude Oil Production (barrels per day) 2.02 million 1.82 million 2 million
5
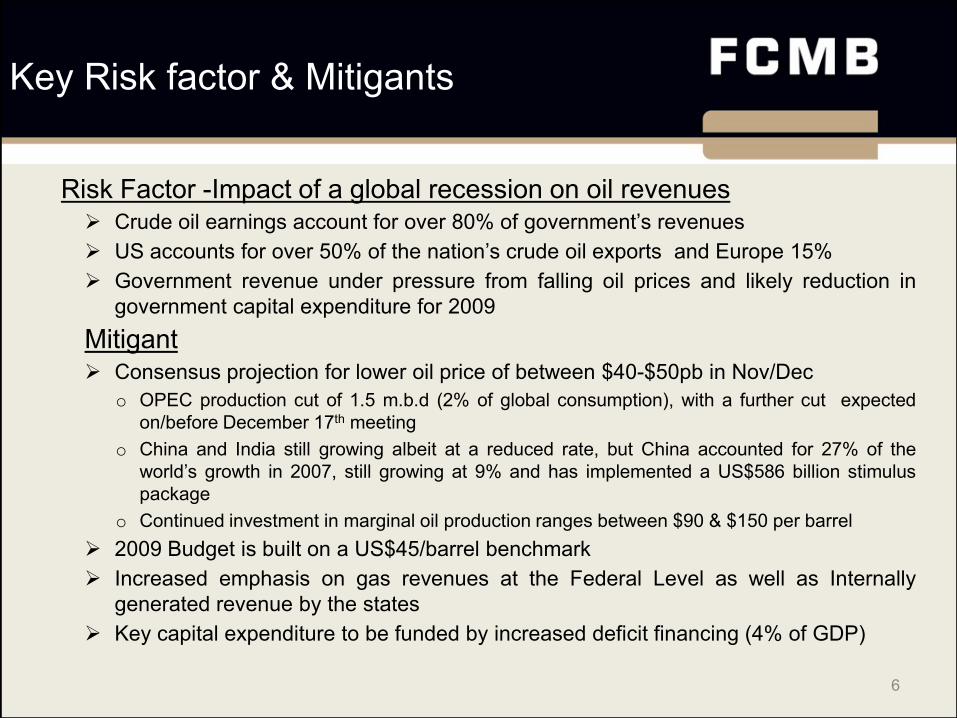
Key Risk factor & Mitigants
Risk Factor -Impact of a global recession on oil revenues Crude oil earnings account for over 80% of government’s revenues
US accounts for over 50% of the nation’s crude oil exports and Europe 15%
Government revenue under pressure from falling oil prices and likely reduction in
government capital expenditure for 2009
Mitigant Consensus projection for lower oil price of between $40-$50pb in Nov/Dec
o OPEC production cut of 1.5 m.b.d (2% of global consumption), with a further cut expected
on/before December 17th meeting
o China and India still growing albeit at a reduced rate, but China accounted for 27% of the
world’s growth in 2007, still growing at 9% and has implemented a US$586 billion stimulus
package
o Continued investment in marginal oil production ranges between $90 & $150 per barrel
2009 Budget is built on a US$45/barrel benchmark
Increased emphasis on gas revenues at the Federal Level as well as Internally
generated revenue by the states
Key capital expenditure to be funded by increased deficit financing (4% of GDP)
6

Source: ENERGY INFORMATION ADMINISTRATION WEBSITE
0
20
40
60
80
100
120
140
160
Jan 0
4, 2
00
8
Feb
04
, 20
08
Mar 0
4, 2
00
8
Ap
r 04
, 20
08
May
04
, 20
08
Jun 0
4, 2
00
8
Jul 0
4, 2
00
8
Aug 0
4, 2
00
8
Sep
04
, 20
08
Oct 0
4, 2
00
8
No
v 0
4, 2
00
8
Weekly Nigeria Bonny Light Spot Price FOB (Dollars per Barrel)
Weekly Nigeria Bonny Light Spot Price FOB (Dollars per Barrel)
7

Nigerian Banking Sectorstrongly capitalized
Globally banks are challenged in three ways; Huge losses from exposure to CDS & derivatives on the back of
subprime mortgages ; additional capital is required –hence the bail out packages of govt , but Long term markets for
funds are closed and fear of further exposure is limiting the interaction in the short term markets , despite all the
palliatives –The Economist
NOT the case for Nigerian Banks
o Having just raised significant capital with Capital Adequacy Ratios ranging between
25% and 42%
o Effective monetary policy is addressing liquidity constraints e.g. CBN’s fresh liquidity
window,
o Limited product sophistication, foreign ownership and depth of shadow markets
cushioned exposure to the global crisis
Current Challenges
o Liquidity pressure; NIBOR rates up from 12.7% in January to 17.6% by early
November
o Exposure to the Capital markets, estimated between N600 billion to N900 billion
o Vulnerability to oil price fluctuations and earnings will come under pressure from
reliance on govt. deposits 8

Opportunities
o Trade Finance at a monthly import bill of US$1 billion
o Consumer Banking opportunities remain real, 42 million subscribers vs.1 million
loans
o Infrastructural gaps estimated at US$150 billion over the next 6 years
o Mergers and Acquisitions amongst the banks on the back of more reasonable
valuations; 2009 PE of 5.8x and in other economic sectors,
Nigerian Banking Sector significant opportunities still exist
9

Nigerian Stock Market recovery is in view
Opportunities and Key Drivers of a recovery
o Market is approaching bottom
o Estimates; 40,000 by Dec. 08 and 60,000 by Dec. 09
o November 24th –ASI @ 33,836 and Market Cap @ US$64 billion
o Strong Corporate Earnings plus more reasonable valuations
o Impending equilibrium in financial markets sure to make the stock market attractive
again
o Domestic Institutional investors are growing and returning to the market; 25%-29% of
N1 trillion of PFA Assets and only 3.4 million Nigerians out of 150 million participate in
the scheme
o Market still shallow at 57% of GDP vs. 206% for SA (2007) and a Nascent Bond
market amidst huge infrastructural gaps
10

Outline
PART A –REVIEW OF THE OPERATING ENVIRONMENT
Global Scan and Implications for Nigeria
Nigeria Macro Report
o Scorecard, Risk Factors & Mitigants and Outlook
o Analysis of the Stock Market and outlook
o Review of the Banking Sector
PART B-FCMBo Strategy & Strengths
o Highlights of Half year Results and Variance Analysis
o Outlook –April 2009
11

Investment Case
Diversified Strategy with non-interest income accounting for 36% of earnings in H1 2008/9
Consumer Bank breaks even in Q4 of the 2008/9 FY
o Significant Upside from the Consumer Banking Business and the off payroll lending by
subsidiary-Credit Direct is reporting ROAs > 50%
Improving Competitive landscape
o Investment Banking shakeout
o Further banking industry consolidation likely
Exceptional Value for the discerning investor,
o P/NAV <1X
o Single digit PE Multiples vs. consistent EPS growth (avg. of 42% YOY from 2006/7 FY)
o Dividend yield >9% at current prices
12

Strategy & Strengthsdiversified model is a fundamental strength
• Value Proposition-Cash Mgt. and Trade Finance (Payments, Collections and liquidity Mgt. solutions)
• Key Revenue Drivers- Trade Volumes ,Low cost deposits (largely non-govt. deposits), No of Customer conversions as per value proposition
• Competition- Citibank, Standard Chartered Bank, Stanbic/IBTC, Oceanic, UBA, Zenith and GTBank
• Competitive Advantage -Robust product capability, 1st bank in Africa to provide liquidity management on an internet banking platform , Consultative sales process & Experienced Mgt. with low execution risk T
RA
NS
AC
TIO
N
BA
NK
ING
• Value Proposition-Off Payroll deduction loans, Salary loans, Mortgages, Wealth Mgt, Unique liability products
• Key Revenue Drivers-Low cost deposits (Salary earners and HNIs) ,Customer Acquisition and Activation
• Competition-UBA, GTBank and BankPHB
• Competitive Advantage -Robust Technology, Low Cost Distribution channels, Experienced Mgt. from rrelevant emerging markets, Experienced partnerships, Product Innovation (Wealth Mgt. Offering)
CO
NS
UM
ER
B
AN
KIN
G
• Value Proposition-Financial Advisory ,Capital Raising (Debt and Equity),Asset Management Infrastructure and Project Financing
• Key Revenue Drivers-Size of Capital Issues ,Size/No of infrastructural projects, Size/No. of Debt issues
• Competition-FBN Capital ,Chapel Hill and Stanbic/IBTC
• Competitive Advantage -Track Record and Strong Distribution through CSL
INV
ES
TM
EN
T
BA
NK
ING
KEY CUSTOMER SEGMENTS-Corporates, SMEs, Individuals and Government
Financial Implications -40% Revenue CAGR by 2012, confer continuing cost
efficiency leadership and ensure diversified earnings 13
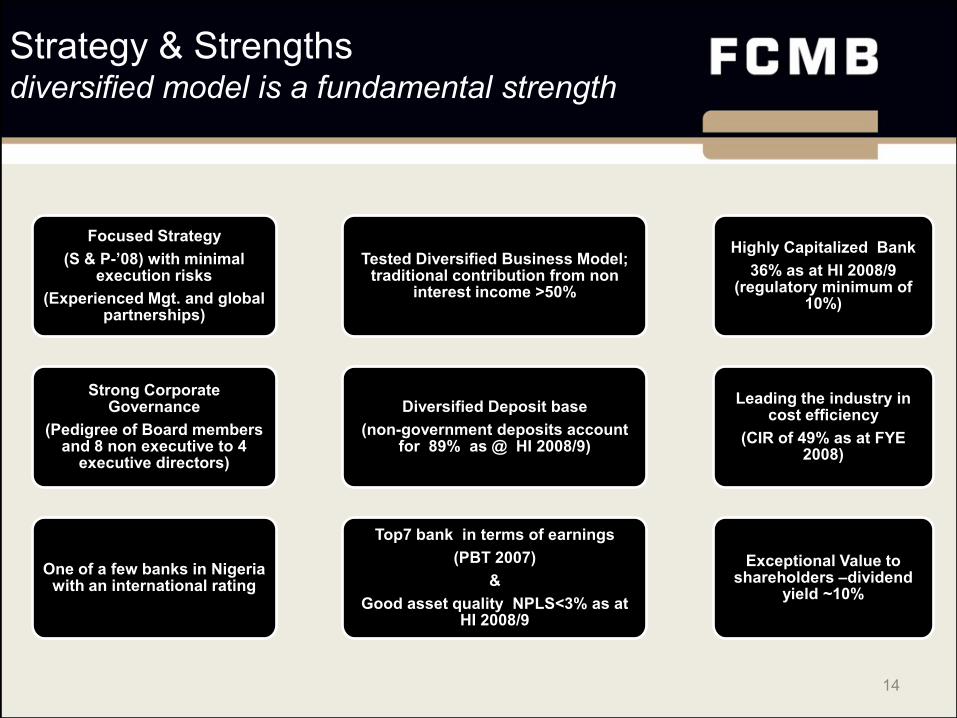
Strategy & Strengthsdiversified model is a fundamental strength
Focused Strategy
(S & P-’08) with minimal execution risks
(Experienced Mgt. and global partnerships)
Strong Corporate Governance
(Pedigree of Board members and 8 non executive to 4
executive directors)
One of a few banks in Nigeria with an international rating
Top7 bank in terms of earnings
(PBT 2007)
&
Good asset quality NPLS<3% as at HI 2008/9
Diversified Deposit base
(non-government deposits account for 89% as @ HI 2008/9)
Tested Diversified Business Model; traditional contribution from non
interest income >50%
Highly Capitalized Bank
36% as at HI 2008/9 (regulatory minimum of
10%)
Leading the industry in cost efficiency
(CIR of 49% as at FYE 2008)
Exceptional Value to shareholders –dividend
yield ~10%
14
Outline
PART A –REVIEW OF THE OPERATING ENVIRONMENT
Global Scan and Implications for Nigeria
Nigeria Macro Report
o Scorecard, Risk Factors & Mitigants and Outlook
o Analysis of the Stock Market and outlook
o Review of the Banking Sector
PART B-FCMBo Strategy & Strengths
o Highlights of Half year Results and Variance Analysis
o Outlook –April 2009
15

H1 2008/9-Highlightsgrowth over same period in FY 2007/8
HI 2008/9
(US$’ million)
HI 2007/8
(US$’ million) growth (%)
Deposits 2,484 950 161%
Risk Assets 2,429 838 190%
Shareholder Funds 1,066 285 274%
Gross Earnings 346 176 97%
Provision for losses 22 8 158%
Operating Expenses 107 67 58%
PBT 103 54 90%
Net Interest Income 150 66 127%
Corporate Finance Income 35 39 -12%
Foreign Exchange Earnings 8 4 90%16

HI 2008/9 –Variance analysis
for 90% acht. of PBT FORECAST
Operating Expenses recorded an additional 15% growth, reflected in the CIR
Corporate Finance Income was hampered by late take off of expected debt transactions
Trade related commissions were restricted by limited availability of offshore lines
Pressure of Trade and Corporate Finance explain the drop in the non funded income as a
% of net operating income to 36%
Healthier Net Interest Margins principally from;
o Repricing of risk assets to reflect money market realities with average lending rates at
18% per annum
o Less expensive mix of deposits with the impact on the cost of funds, non interest
bearing liabilities, mainly current accounts, contribute 59% of the deposit portfolio as
opposed to 45% as at FYE 2008 and up from 49% as at Q1 2008/9.
17

H1 2008/9Deposit Mix; current accounts
growing in contribution across periods
0% 10% 20% 30% 40% 50% 60% 70%
Current Accounts
Savings Accounts
Term Deposits
FCY Deposits
Deposit Mix
H1 2007/8
FYE 2008
Q1 2008/9
H1 2008/9
18

H1 2008/9Deposit Mix diversified across
business segments
11%
35%
27%
27%
Deposit Mix by Sector as @ Oct 31ST, 2008
Government deposits
Retail
Corporate Banking
Financial Institutions
19

H1 2008/9-Asset & Risk Asset mixLimited Margin exposure
Risk Asset Composition H1 2008/9 H1 2007/8 Q1 2008/9 FYE 2008
Overdrafts 27% 35% 25% 21%
Term Loans 30% 27% 21% 18%
Commercial Papers 37% 28% 46% 48%
Others 4% 2% 3% 7%
Margin Finance 3% 8% 4% 4%
33%
47%
7%
8%
5%
Asset Mix as @ H1 2007/8
Liquid Assets Risk Assets Fixed Assets
Other Assets Investment Securities
27%
59%
4%
6%4%
Asset Mix as @ H1 2008/9
Liquid Assets Risk Assets
Fixed Assets Other Assets
Investment Securities
The Bank’s Margin Lending is N7.9 billion but the bank is reviewing its borrower base to ascertain borrowers with capital market exposure, as this might have adverse effects on their cash flows and consequently their ability to service loan
obligations 20

H1 2008/9 vs. FYE 2007/8Key Ratios remain healthy
APRIL '08 OCT'08
Net Interest Margin 7.4% 9.1%
CIR 49.2% 50.8%
ROA 4.1% 4%
ROE 11.3% 15.32%
Loan to Deposit Ratio 75.2% 97.8%
Liquidity Ratio 81.3% 42.31%
NPLs 2.74% 2.85%
Coverage Ratios 127.8% 130.7%
Capital Adequacy Ratio 55.0% 36.00%
Non-Interest Income /Net Operating Income 51.9% 35.44%
21

Outline
PART A –REVIEW OF THE OPERATING ENVIRONMENT
Global Scan and Implications for Nigeria
Nigeria Macro Report
o Scorecard, Risk Factors & Mitigants and Outlook
o Analysis of the Stock Market and outlook
o Review of the Banking Sector
PART B-FCMBo Strategy & Strengths
o Highlights of Half year Results and Variance Analysis
o Outlook –April 2009
22

H2 2008/9 Estimates Expectations
Anticipate some FX volatility as the currency comes under pressure from traders and
manufacturers stocking up for year end
Continued pressure on available trade lines and the impact transferring the increased
pricing to customers (at least 200 basis points more)-boost commissions
Minimal Loan growth, in reaction to money market conditions and factoring transactions
already in the pipeline
Repricing of Naira Assets and maintaining the current deposit mix, where non interest
bearing liabilities account for 59% of the portfolio will assist the Net Interest Margin
Investment Bank will close on at least 3 transactions, boosting corporate finance income
23

H2 2008/9 Estimates
Low and Mid Case assumptions
Net interest margin will in either case come under pressure if money market conditions
persist
Loan growth will be negative in the low case and in the mid case, will stay at half year
levels and Risk Assets are assumed to account 65% of average earning assets
Deposits will grow at an average of 12% (mid case) and 10% (low case), to close the year
at 60% growth on FYE 2008
Non-interest income will account for at least 50% of net operating income in either case,
flowing from the diversified business model
A 3% loss norm is assumed for performing loans, NPLs in either case will be impacted by
a prudent provision for margin loans; 20% of exposure is assumed
CIR will at best improve to 47% as a result of a number of cost management initiatives;
fleet management and other outsourcing initiatives plus the implementation of a few
tactical measures and Exchange rate is assumed at NGN120/$ 24

H2 2008/9- revenue and cost drivers & assumptions
H2 2008/9 Estimates
-Assumptions
Low Case Mid Case
Net Interest Margin 7.6% 8.2%
Average Risk Assets (US$'000)2,010,685 2,456,691
Average Earning Assets (US$'000)3,093,361 3,779,525
Other Earning Assets (US$’000)1,082,676 1,322,834
Average Deposits (US$'000)2,680,913 2,729,657
Average Loan to Deposit Ratio 75% 90%
Non Interest Income/Net Operating Income 50% 50%
Provision for losses (US$'000)13,318 (62)
NPLs 4.0% 3.3%
Provision for NPLs (US$'000)(22,854) (22,854)
Cost to Income Ratio 49% 47%
25
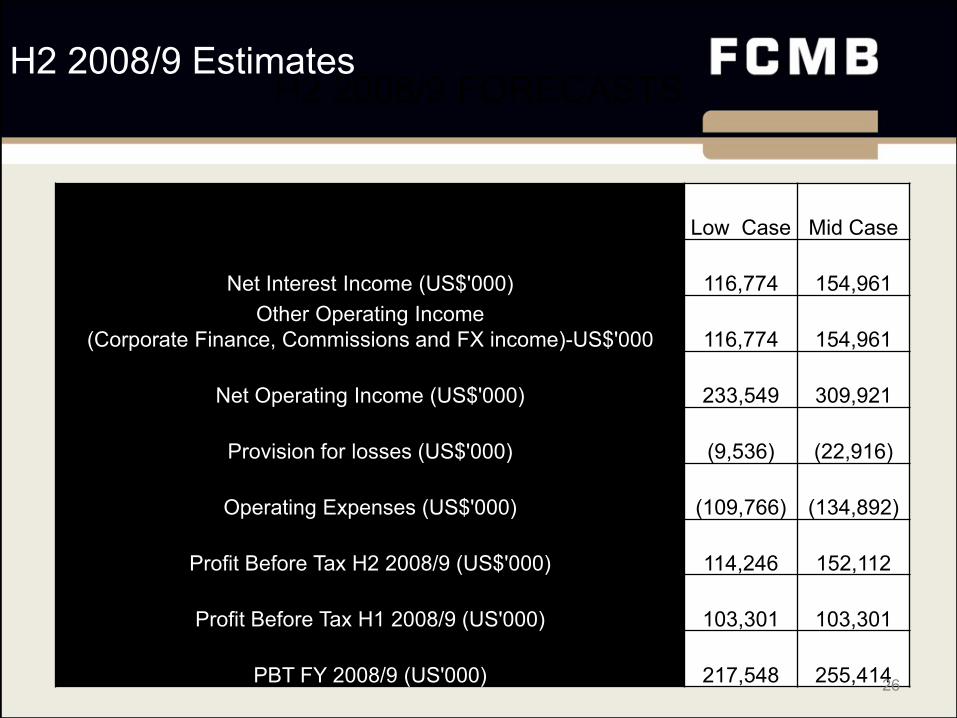
H2 2008/9 FORECASTS H2 2008/9 Estimates
Low Case Mid Case
Net Interest Income (US$'000) 116,774 154,961
Other Operating Income
(Corporate Finance, Commissions and FX income)-US$'000 116,774 154,961
Net Operating Income (US$'000) 233,549 309,921
Provision for losses (US$'000) (9,536) (22,916)
Operating Expenses (US$'000) (109,766) (134,892)
Profit Before Tax H2 2008/9 (US$'000) 114,246 152,112
Profit Before Tax H1 2008/9 (US'000) 103,301 103,301
PBT FY 2008/9 (US'000) 217,548 255,414 26
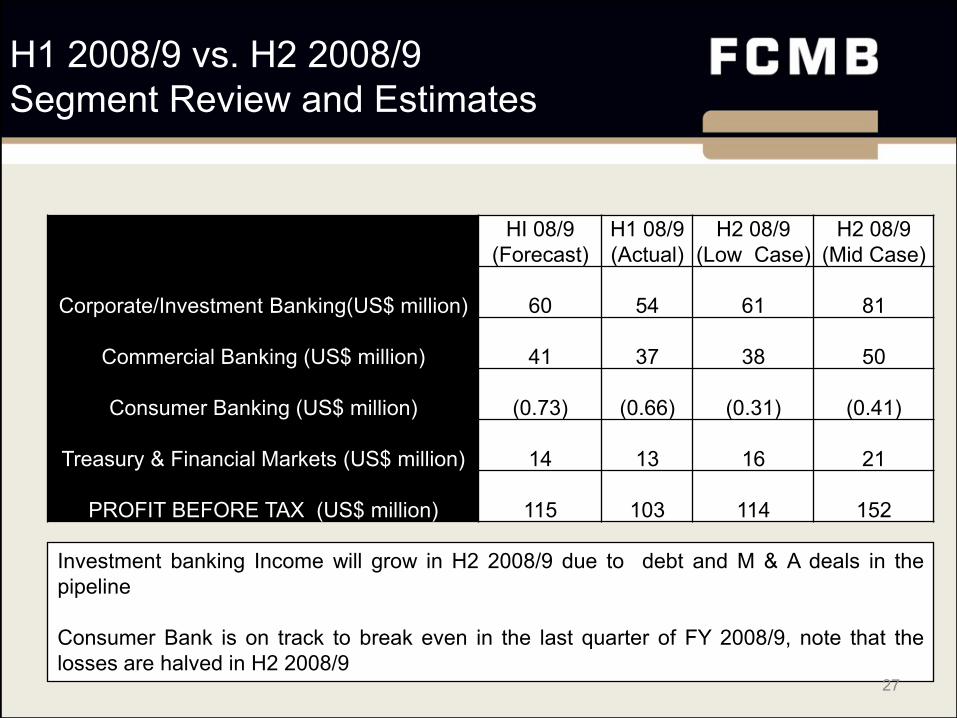
H1 2008/9 vs. H2 2008/9
Segment Review and Estimates
Investment banking Income will grow in H2 2008/9 due to debt and M & A deals in the
pipeline
Consumer Bank is on track to break even in the last quarter of FY 2008/9, note that the
losses are halved in H2 2008/9
HI 08/9
(Forecast)
H1 08/9
(Actual)
H2 08/9
(Low Case)
H2 08/9
(Mid Case)
Corporate/Investment Banking(US$ million) 60 54 61 81
Commercial Banking (US$ million) 41 37 38 50
Consumer Banking (US$ million) (0.73) (0.66) (0.31) (0.41)
Treasury & Financial Markets (US$ million) 14 13 16 21
PROFIT BEFORE TAX (US$ million) 115 103 114 152
27

CONSENSUS ESTIMATES
Source
Date of
Report
Dividend Yield
(%)
EPS
(NGN)
P/E
(X)
P/NAV
(X)
RoE
(%)
Afrinvest 17-Nov-08 11.5 1.41 4.86 0.7 13.7
RENCAP 14-Nov-08 11.8 1.34 5.1 0.79 15.8
African Alliance 14-Nov-08 8.3 1.43 4.83 0.76 15.7
CSL Research 11-Nov-08 11.2 1.38 4.5 0.68 15.9
Mean 10 1.43 4.72 0.73 15.28
H2 2008/9 Valuations
Low Case Mid Case
No of shares outstanding 16,271,192
Estimated EPS (kobo)126 148
Dividend Per share (Pay out Ratio of 45%)-kobo 57 66
PE Multiple at November 21st prices of N5.93 4.72 4.01
P/NAV at November 21st prices of N5.93 0.66 0.65
Dividend Yield at November 21st Prices 9.5% 11.2%
ROE 14.0% 16.1%
28

Conclusion
Despite external shocks, the Nigerian economy remains resilient, ranked least vulnerable
by Merrill Lynch, November 2008
Downside risks particularly from oil shocks, have been adequately mitigated at least in the
short term -6 months period
The bank’s diversified Business Model and focused strategy significantly reduces the risk
to earnings within the short and long term time frame
Strong Financial Performance given market realities
The bank remains adequately capitalized and liquidity ratios are well above the regulatory
requirements (RR); CAR @ 36% vs. 10% (RR) & Liquidity Ratio @ 42% vs. 30% (RR)
Current price offers unprecedented bargain
o P/NAV >1 times and single digit PE Multiples vs. consistent EPS growth (average of 42% growth
from 2006/7 FY); fair valued and often undervalued stock by consensus estimates
29
Sources
This Day Newspapers, various issues; citing “Federal Government of Nigeria 2009 Budget
Preparation and Submission Call Circular”
Transcript from Town Hall Meeting discussing the Global Crisis-organized by This Day
Newspapers
2008 Budget Speech by the President of Nigeria to the Joint session of the National
Assembly, November 2007
World Economic Outlook (IMF) October 2008
CBN 2nd Quarter Economic Report 2008 and monthly reports
Global Financial Meltdown: Impact on Nigeria's Capital Market and Foreign Reserves –
Mobolaji Aluko, PHD, October 2008
Sources
30

Sources
National Bureau of Statistics Trade Report (2006)
Nigerian National Petroleum Corporation (NNPC) Statistical Bulletin 2007
RENCAP Equity Research , November 2008
The Economists; several issues
Presentation by Bismarck Rewane, MD-Financial Derivatives at the Lagos Business
School, 02 November, 2008
Global Economics Review by Merrill Lynch –04 November 2008
Energy Information Administration websites
Reports by various Research Houses- as detailed in the Consensus estimates
31