2009 03 - regional heterogeneity in wage distributions. evidence … · · 2014-04-111 pplied...
TRANSCRIPT
Research Institute of Applied Economics 2009 Working Papers 2009/03, 35 pages
1
Regional heterogeneity in wage distributions.
Evidence from Spain.
By Elisabet Motellón†� , Enrique López-Bazo† and Mayssun El-Attar†‡
† AQR—IREA, University of Barcelona Avda Diagonal 690, 08034 Barcelona Email: [email protected]; [email protected]; [email protected] � Universitat Oberta de Catalunya ‡ European University Institute
Abstract: Regional differences in real wages have been shown to be both large and persistent in the U.S. and the U.K., as well as in the economies of other countries. Empirical evidence suggests that wage differentials adjusted for the cost of living cannot only be explained by the unequal spatial distribution of characteristics determining earnings. Rather, average wage gap decomposition reveals the important contribution made by regional heterogeneity in the price assigned to these characteristics. This paper proposes a method for assessing regional disparities in the entire wage distribution and for decomposing the effect of differences across regions in the endowments and prices of the characteristics. The hypothesis forwarded is that the results from previous studies obtained by comparing average regional wages may be partial and non-robust. Empirical evidence from a matched employer-employee dataset for Spain confirms marked differences in wage distributions between regions, which do not result from worker and firm characteristics but from the increasing role of regional differences in the return to human capital.
.
Key words: Regional Labour Markets, Human Capital, Wage Gap Decomposition, Counterfactual Distributions.
.
JEL codes: J24, J31, R23. .
Acknowledgments. EM and EL-B acknowledge financial support from the Ministerio de Ciencia y Tecnología, Programa Nacional de I+D+I, ECO2008-05314/ECON..

Research Institute of Applied Economics 2009 Working Papers 2009/03, 35 pages
2
1. INTRODUCTION
A large body of evidence points to the magnitude of regional inequalities in wage levels
and the persistence in these differences over time. Thus, according to Gerking and
Weirick (1983), “Interregional differences in average wages and earnings have been
observed particularly in the North and South of the U.S. ever since the mid-1800s”,
while a similar type of regional divide in wage levels has been reported for the U.K.
(e.g., Blackaby and Manning, 1990). These claims have given rise to a number of
studies in both countries aimed at quantifying the magnitude of these regional gaps and
identifying their origin. Most of these empirical analyses have been guided by two
classical ideas: the fact that regional labour markets are heterogeneous and that there are
compensating differentials that offset differences in price levels and non pecuniary
attributes across regions. As a result, the real wage paid to each class of worker should
be interregionally invariant. Therefore, in the classical paradigm, wage differentials are
merely an illusion caused by the failure to distinguish between types of labour. In other
words, the competitive model behind these assumptions suggests that the price of the
characteristics that determine wages will converge across regions in the absence of
imperfect information and persistent stochastic disturbances, and with some mobile
factors. In this scenario, identical workers in identical firms will receive wages that
differ only in the compensation for the regional attributes (Farber and Newman, 1989).
However, there are other sources of persistent regional premiums in real wages apart
from those derived from competitive theories. In their analysis of the U.K., Blackaby
and Murphy (1991) identify the role of labour market institutions (unionisation and the
bargaining system), the determination of an individual’s reservation wage, and variants
of efficiency wage theory as possible explanations for the observed persistence of
regional wage premiums in the presence of detailed controls on worker characteristics.
In the case of efficiency wage models, Farber and Newman (1989) claim that
interregional differences in the conditions requiring efficiency wage premiums
(turnover, shirking, adverse selection, threats of unionisation, worker’s morale, etc.)
will cause persistent differences across regions for identical workers. However, as these
conditions are assumed to correlate with industry-specific conditions such as firm size,
capital intensity and product market power, empirical analyses have focused on the
extent to which differences in worker, job and firm characteristics can account for

Research Institute of Applied Economics 2009 Working Papers 2009/03, 35 pages
3
regional wage differentials, or whether, on the contrary, regions also differ in the prices
associated with these characteristics.
Gerking and Weirick (1983), Dickie and Gerking (1987), and Farber and Newman
(1989) tested for interregional structural shifts in the wage equations estimated, and
concluded that real wages did not differ between macro-regions in the U.S. Rather,
differences in average real wages arose from heterogeneous worker characteristics. In
sharp contrast, Farber and Newman (1987) obtained results that suggest that differences
in returns (prices) may be at least as important in accounting for regional wage
differentials as differences in worker characteristics between regions. As pointed out by
these authors, the methodology they applied differs from that used in the other studies,
and this may account for the contrasting conclusions. Instead of testing equality of
coefficients across regional wage equations, they determined the contribution of price
and different endowments in accounting for wage differences across regions. Similar
conclusions were obtained for the U.K. using analogous decompositions of the regional
wage gaps in, for instance, Blackaby and Manning (1990), Reilly (1991), and Blackaby
and Murphy (1995).
Less attention has been paid to regional wage differentials in other economies, this
despite the fact that they are far from negligible in certain countries. In the case of the
EU regions, differences in wages show a rather stable pattern, characterised by
stratification and persistence (Webber, 2002). However, the lack of appropriate micro-
data at the regional level has impeded the collection of any broad evidence regarding the
contribution of differences in returns and endowments. Exceptions to this include Maier
and Weiss (1986), who analysed regional earning differentials in Austria, and García
and Molina (2002) and Cabral et al. (2005), who conducted similar analyses for Spain
and Portugal, respectively. Each of these studies decomposed the regional wage gaps in
the contribution of endowments and returns, concluding that differences in the latter are
largely responsible for wage differentials.
This paper aims at providing additional evidence on the magnitude and causes of
regional wage gaps, by analysing the case of the NUTS II regions in Spain. The wage
gap between high- and low-wage regions is decomposed in the contribution of
differences in the regional distribution of characteristics, and in the contribution of

Research Institute of Applied Economics 2009 Working Papers 2009/03, 35 pages
4
regional heterogeneity in their price. In contrast with the evidence provided in previous
studies, we do not just focus on the average wage gap or on the amount of dispersion.
Instead we report evidence for the entire distribution of wages. This is because it is our
belief that there may be significant regional differentials in important characteristics of
the wage distribution other than those related to their first moments, and because the
contribution of endowments and returns may vary along the wage distribution. In so
doing, we propose extending the decomposition proposed in Juhn et al. (1993) to the
entire wage distribution, based on the computation of counterfactual distributions
obtained under the assumption of the absence of differences across regions in the
distribution of observable and unobservable characteristics. In this regard, our approach
is in line with Dickey (2007), who states that studies based on the conditional mean and
those using inequality measures fail to indicate the region of the wage distribution in
which the effects are occurring. There is, however, a notable difference between her and
our methodological approaches. While she proposes comparison of estimated returns
from quantile regressions for each region, in this paper we assess the effect of
differences in returns and characteristics on the entire wage distribution.
Our empirical analysis takes advantage of micro-data from a matched employer-
employee dataset, the Spanish 1995 and 2002 waves of the Earnings Structure Survey.
It is a large enterprise sample survey providing detailed information on relationships
between the level of remuneration, individual characteristics of employees and their
employer. This allows us to control for a comprehensive set of wage determinants and
to separate the effects of worker human capital from those of job and firm
characteristics. This rich information on schooling, tenure and worker experience in the
labour market is used to check whether the heterogeneous spatial distribution of skilled
workers accounts for most of the differences in wage distributions across regions. If this
condition were to be met, convergence in the regional endowment of human capital
would lead to a decrease in regional wage disparities. In this regard, the Spanish
experience is interesting given the emphasis adopted by regional policy in promoting
the accumulation of human capital in less developed regions over recent decades, and
may add to the evidence obtained for the U.K. in Duranton and Monastiriotis (2002).
Interestingly, after controlling for the set of job and firm characteristics, our results
suggest that spatial equalisation of human capital endowments alone would not

Research Institute of Applied Economics 2009 Working Papers 2009/03, 35 pages
5
automatically remove real wage differentials given that they are, above all, originated
by differences across regions in their return.
The rest of this paper is organized as follows. In the second section we briefly describe
the dataset and provide evidence on the amount of disparities in regional wage
distributions. The methodology proposed to decompose the contribution of
characteristics and returns in the entire wage distribution is summarised in the third
section, while the results are presented and discussed in section 4. Finally, section 5
concludes.
2. DATA AND PRELIMINARY EVIDENCE
We drew our data from the matched employer-employee Spanish Earnings Structure
Survey (ESS). The ESS is an extensive survey carried out by the Spanish National
Institute of Statistics within the framework of the EU, employing a common
methodology and content criteria for all the Member States. It provides information on
wages, worker and firm characteristics for a sample of workers in establishments with
10 or more employees in 1995 and 2002. The sample is representative at the level of
each of the NUTS II regions in Spain, which makes it possible to perform the proposed
analysis. From the original sample available in the ESS we have selected those full-time
workers who were under the age of 65, excluding those employed in Ceuta and Melilla.1
In addition, so as to guarantee comparability between the two years, we removed
workers with a training contract in 1995 and workers employed in the health and
education sector in 2002, as there is data for only one of the years. The final samples
used in the analysis include 120,210 workers for 1995 and 95,232 workers for 2002.
The variable under analysis in this paper is the gross hourly wage, computed as the
gross wage (before income tax and the worker’s contribution to the public social
insurance system) in the month of October divided by the effective number of hours
worked during that month. The ESS includes earnings information for both the month
of October and the whole year. We used only monthly information because the 1 Two Spanish cities in the North of Africa, with distinct characteristics. For this reason we have decided to exclude them from the regional analysis performed in this paper.

Research Institute of Applied Economics 2009 Working Papers 2009/03, 35 pages
6
computation of the yearly salary in the ESS differs between the two years and because
the monthly information is more reliable than that for the whole year.2
An important feature of the ESS is that it allows us to identify the region in which the
employer is located. In conjunction with the fact that the sample of workers for each
region in the ESS is representative of its employee population, this enables us to obtain
evidence on the size of differences in the wage distribution across the Spanish regions,
in 1995 and 2002. Table 1 shows the average nominal hourly wage, its standard
deviation, the Gini index, and the number of observations in the sample for each of the
regions in the two years. Despite a certain decrease in the number of regional
disparities, the marked difference in average regional wages is clear in both years. In
Extremadura, the region with the lowest wage level in 1995, the average wage was only
57% of that paid in Madrid, the region with the highest wage level. The distance
between the bottom and the top region was lower in 2002, when the average salary in
Murcia was 63% of that paid in Madrid. Similar differences are also observed for the
groups of regions with the lowest and highest average wages. For instance, the ratio
between the top and bottom five regions was 1.44 in 1995 and 1.47 in 2002, while that
between the top and bottom three regions was 1.54 in both years. From these figures we
can conclude that the degree of regional wage inequality is comparable to that reported
for other key economic magnitudes such as income per capita and labour productivity
(see among others Goerlich et al., 2002).
For the empirical exercise we used the sample of workers from the three regions with
the highest wages (Cataluña, Madrid and País Vasco in both years) —HW— and from
the three regions with the lowest wages (Extremadura, Galicia and Murcia in 1995 and
Castilla y León, Extremadura and Murcia in 2002) —LW. Although certain alternatives
can be considered in the methodology in order to include the whole set of regions in the
analysis, we chose to compare the LW and HW groups because the regions within each
group have a number of important economic characteristics in common. In short, the
HW group is composed of the industrialised and traditionally most dynamic regions in
Spain, concentrating the most productive firms, R&D investment and skilled workers,
2 The main conclusions drawn in this paper are, however, robust to the use of wages based on the yearly information.

Research Institute of Applied Economics 2009 Working Papers 2009/03, 35 pages
7
while the LW group is composed of lagging regions, despite the recent positive trend in
the growth reported by some of them. These characteristics can explain some of the
similarities in the wage distribution of the regions within each group and the striking
differences across groups. The selection of LW and HW regions was therefore
undertaken in such a way so as to intensify similarities within groups and differences
across groups. We believe that this selection facilitates the interpretation of our results.
In any case, the results are robust to the inclusion of additional regions in each group.
Table 2 provides a description of wages in these regions. As mentioned above, the ratio
between the average wages in the HW and LW groups was 1.54 in both years. It might
be argued that part of this difference in nominal wages between the two groups might be
caused by the compensation paid for differences in the cost of living. To control for
such differences, we used an estimate of relative regional price levels to compute the
real hourly wage for the workers in the sample.3 The average real wage in the LW group
increased about 4% in 1995 and 7% in 2002 relative to the nominal wage due to the
lower price levels in those regions, whereas the average real wage in the HW group fell
as a consequence of their higher cost of living (3% in 1995 and 4% in 2002).
Nevertheless, the figures show that differences in relative prices only account for 11 and
16 percentage points of the wage gap between the HW and the LW regions in 1995 and
2002 respectively, and that regional differences in real wages remain important (the
ratios in this case being 1.43 in 1995 and 1.38 in 2002). Thus, the regional wage gap in
Spain is not mainly attributable to the compensation for differences in the cost of living
across regions. The rest of the analysis focuses on wage differentials net of the effect of
regional differences in living costs.
Besides the differences in the mean, the wage distributions of these two groups present
other interesting variations. The figures reported in Table 2 reveal the existence of
differences in the degree of dispersion. The Gini index for the HW regions is higher
than that for the LW regions, and the difference in inequality between both groups
actually increased in 2002 as a result of the stability in the HW group and the decrease 3 This information has been kindly provided by the Catalan Institute for Statistics (IDESCAT), which estimates the parity power standards for the 17 Spanish regions from the aggregate Spanish figures used by the Statistical Office of the EU, EUROSTAT, to produce a data net of the cost of living differences across the Member States. Note that given the common currency for the spatial units under analysis, parity power standards only account for differences in the cost of living.
Research Institute of Applied Economics 2009 Working Papers 2009/03, 35 pages
8
in inequality for the LW regions. This indicates the existence of greater inequality in
regions with high average wages. On the other hand, the magnitude of wage
differentials does not seem to be the same throughout the distribution. The last set of
columns in Table 2 report wages at certain percentiles. In both years, the wage level for
the HW group is higher than that for the LW group at all the percentiles, but the gap is
not homogeneous. It increases up to the highest percentiles where, particularly in 1995,
the ratio of wages for the two groups of regions stabilises. Differences in dispersion and
heterogeneity in the gap observed at different percentiles supports our idea of analysing
the entire wage distribution in the HW and the LW regions, instead of just comparing
their first moments (average wages).
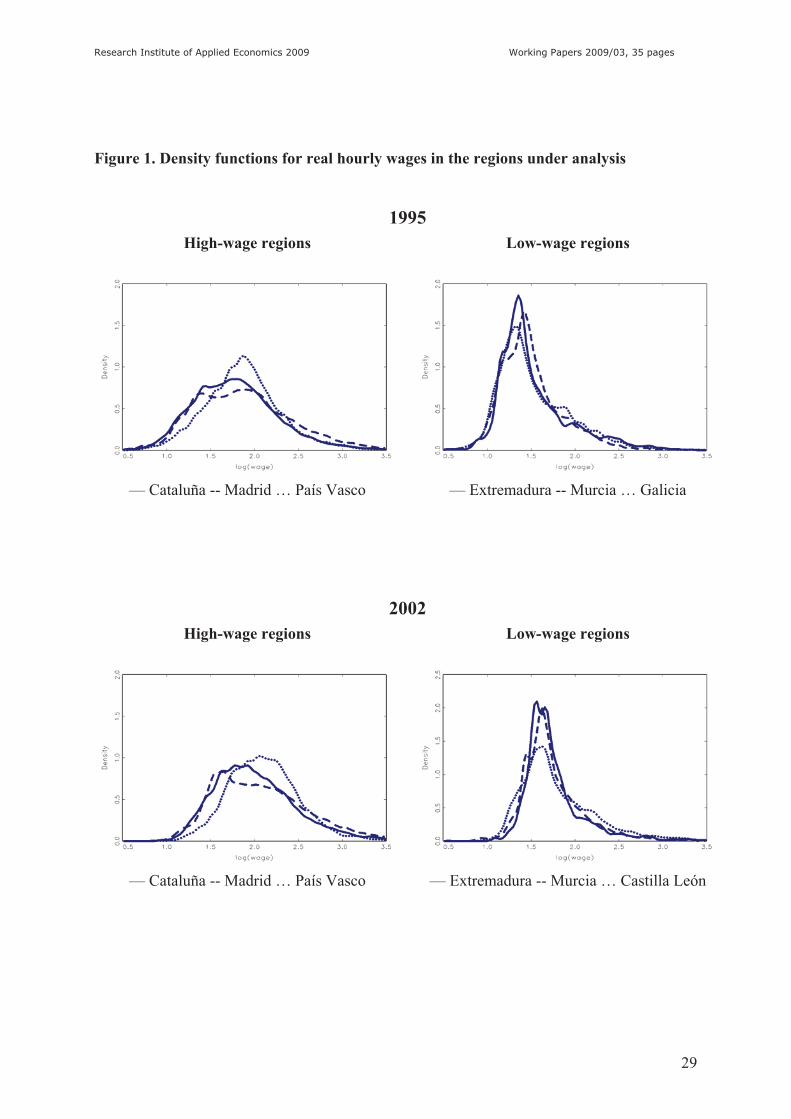
A comparison of the entire wage distribution in the regions under analysis confirms the
picture obtained by means of the traditional descriptive analysis outlined above. The
estimated density function summarises the most important features of the shape of the
wage distribution in each region. The comparison between regions helps to identify
particular differences in each of these features.4 The estimated densities for the
individual regions are shown in Figure 1, while Figures 2 and 3 depict the densities
associated with the distribution in the HW and LW groups, for 1995 and 2002
respectively. Not only are the modes of the distributions of Cataluña, Madrid, and País
Vasco to the right of those calculated for the low-wage regions, but the entire wage
distribution is shifted to the right. In fact, the wage level associated with the mode in the
latter group of regions corresponds to that for the lowest percentiles in the wage
distribution of the HW group. The respective shapes of the wage distributions of the two
groups of regions differ markedly, although within their respective groups the shapes of
these distributions are largely similar. In agreement with the figures for the Gini index
reported above, the wage distribution for the HW regions is much more dispersed than it
is in the case of regions with low wage levels. In addition, there is a mass of probability
in the right tail of the distribution for the LW regions, indicating that some workers in
these regions earn wages that are as high as those earned by some workers in the HW
regions. The key point, though, is that the relative number of workers with high wages
is much greater in the HW regions than in the LW group. The estimated density
functions for the groups of HW and LW regions in Figures 2 and 3 reproduce the
4 Density functions are estimated non-parametrically using the kernel method.

Research Institute of Applied Economics 2009 Working Papers 2009/03, 35 pages
9
features observed in the distributions for the individual regions, supporting the existence
of marked differences in the characteristics of the wage distributions between both types
of regions, in the two periods under analysis.
The J-measure proposed in Kullback and Leibler (1951) can be used to summarize the
degree of (dis)similarity between the wage distributions for the two groups of regions.5
The measure would equal zero if the wage distribution for the two groups of regions
was exactly the same and increase as the discrepancy between them grows. The J-
measure took a value of 0.58 in 1995, falling to 0.48 in 2002 (row and column labelled
Actual in Table 3). This means that despite a certain attenuation in the dissimilarity, the
wage distributions for the HW and the LW groups of regions clearly differ. It should be
noted that the values for the J-measure for the pairs of regions within each group are
much lower (an average of 0.09 for 1995 and 0.14 for 2002 in the case of the HW
group, and 0.07 for 1995 and 0.16 for 2002 in the LW group), while for the pairs of
regions across the two groups the values are much higher (an average of 0.71 for 1995
and 0.73 for 2002). These figures are thus consistent with the above-mentioned
similarity in the wage distributions within the two groups of regions and the discrepancy
between regions across the groups.6
A visual inspection of the estimated densities and the results for the J-measure confirms
the magnitude of regional wage disparities and the fact that they are not only related to
the distribution average. Rather, the evidence confirms that regional wage distributions
differ strongly in their shape as well. As a consequence, and following for instance
Butcher and DiNardo (2002) and Dickey (2007), it can be stated that an analysis based
on the first moment of the distributions (the means) would only provide us with partial
and non-robust conclusions as to the amount of wage disparities across regions, and
their origin. For this reason, we perform here an analysis based on the entire regional
wage distribution.
5 In their seminal paper, DiNardo et al. (1996) suggest the use of this measure to compare wage distributions. Here, we use it in section 4 to summarize the differences between actual and counterfactual wage distributions. A brief description of the J-measure is provided in the Appendix. 6 The full set of results for the J-measure for each pair of regions is available on request from the authors.

Research Institute of Applied Economics 2009 Working Papers 2009/03, 35 pages
10
Differences in the wage distributions for the HW and LW groups can be caused by
regional heterogeneity in the price or return to worker and firm characteristics, on the
one hand, and by differences across regions in the distribution of such characteristics,
on the other. In the sections that follow, we assess the contribution of these two sources
of regional differentials, but as a prior step we need to verify whether there are
differences in the endowment of characteristics between the regions in the HW and the
LW groups. For instance, if salary increases with workers’ schooling, then regions with
higher educational endowments will exhibit higher wages. Table 4 reports a simple
description of the observable worker and firm characteristics in the HW and LW groups.
It is for instance observed that regions with high wage levels have more skilled workers,
employed in relatively larger firms, and hired in a greater proportion by means of
permanent contract. Other differences worth mentioning include those related to
occupations that demand higher skill levels, to the type of collective bargaining, and to
the type of market for the firm’s production (national or foreign).7
Therefore, there seem to be differences in the characteristics of HW and LW regions
that result in differences in regional wage levels. But the fundamental point is whether
differences in human capital and firm characteristics can fully account for regional
differences in the wage distribution, or if on the contrary part of the gap is caused by
differences in returns across regions. In the case that the wage gap could be fully
explained by regional differences in the distribution of the observable characteristics,
then the conclusion would be that workers in the HW regions are paid a higher wage
because they and their employers are endowed with a set of characteristics that make
them more productive than their counterparts in the LW regions. Under such
circumstances, similar workers employed in similar firms but located in different
regions would earn the same wage. By contrast, if part of the wage gap could be
explained by differences in returns, this would then point to failures in regional labour
markets, as similar workers in comparable firms but in different regions would be
earning different wages. In the section that follows we aim to shed more light on this
issue.
7 Conclusions regarding the existence of regional differences in the average of these observed characteristics can be expanded to their entire distribution. Additional results are not reported for reasons of space but are available from the authors upon request.

Research Institute of Applied Economics 2009 Working Papers 2009/03, 35 pages
11
3. METHODOLOGY
In this section we outline the method proposed for assessing the contribution of
characteristics and their returns to differences in regional wage distributions. It
combines the wage decomposition procedure suggested in Juhn et al. (1993), which
allow us to account for both observable and unobservable characteristics, with the
principle contained in the analyses in Jenkins (1994), DiNardo et al. (1996) and Butcher
and DiNardo (2002) which strongly advocates studying the effects over the entire wage
distribution rather than simply focusing on the first moments.
As in traditional decompositions, our starting point is the estimation of a Mincerian-type
wage function for workers in each group of regions (HW and LW):
LWiLWLWiLWi
HWiHWHWiHWi
Xw
Xw
��
��
��
��
(1)
(2)
where giw denotes the logarithm of real hourly wages for a worker i in the group of
regions g (g=HW, LW), Xiq the vector of observable characteristics of worker i in the
group g, and �k the vector of returns to characteristics. Given the availability of a
matched employer-employee dataset, in our case the Xig vector includes information on
observable worker and firm characteristics. Worker characteristics include gender,
schooling measured by the number of years in the formal education system, and years of
experience, both general in the labour market and specific in the firm (tenure). While a
gender dummy aims at accounting for the widely reported gender wage gap, the other
characteristics are, broadly speaking, related to a worker’s human capital. On the other
hand, variables used to measure firm characteristics are industry (8 manufacturing and
service sectors), type of output market (national or foreign), the type of collective
bargaining (within the firm or at some centralized level), the firm’s size (measured by
the number of workers) and the ownership structure (fully private or public
participation). We have also included in this category the type of occupation (grouped in
8 categories of the International Standard Occupation Classification) and the type of
contract (fixed-term or permanent) as characteristics of the job and the employer-
employee relationship that affect the wage level.

Research Institute of Applied Economics 2009 Working Papers 2009/03, 35 pages
12
Following the proposal made in Juhn et al. (1993), the error term ig� , which is the
component of wages accounted for by the unobservables, can be considered as being
formed from two components: an individual’s percentile in the residual distribution, �ig,
and the distribution function of the residuals of the wage equation for group g, Fg ( ). By
definition of the cumulative distribution function:
� �igiggig XF |1 �� � (3)
where � �igg XF |1 is the inverse cumulative residual distribution for workers in group g
with characteristics igX . Thus, wages for workers in the two groups of regions can
alternatively be expressed as:
� �� �LWiLWiLWLWLWiLWi
HWiHWiHWHWHWiHWi
XFXw
XFXw
|
|1
1
��
��
��
��
(4)
(5)
Counterfactual wages can be defined for workers in the LW group under the assumption
that the wage structure and the distribution of the residuals (unobservable characteristics
and their returns) are the same as those in the HW regions. That is to say, the
counterfactual wage is the wage that would be expected (ceteris paribus) for the
workers in the LW regions if their characteristics were recompensed at the same level as
they were in the HW regions, and if there were no differences across regions in the
distribution and impact of unobservables:
� �LWiLWiHWHWLWiHWLWi XFXw |11, �� �� (6)
Similarly, counterfactual wages for workers in the LW group under the assumption that
they had the same returns to the observable characteristics as workers in the HW
regions, but a different distribution of the unobservables are obtained as:
� �LWiLWiLWHWLWiHWLWi XFXw |ˆ 12, �� �� (7)
Given an estimate of the wage equations for the two groups of regions, the contribution
of differences in characteristics, in returns, and in unobservables to the average regional
wage gap can be assessed by comparing the average of actual and counterfactual wages.
But the added value of this approach lies in the possibility it affords of measuring the
effect of these differences on the entire wage distribution. The joint effect of returns and

Research Institute of Applied Economics 2009 Working Papers 2009/03, 35 pages
13
unobservables to differences in the wage distributions can be assessed by comparing the
density function of LWw with that of 1,HWLWw . Correspondingly, the effect of regional
heterogeneity on returns is obtained by the comparison of LWw and 2HW,LWw . A shift to
the right and a change in the shape of the density of the counterfactual wage distribution
suggest that regional heterogeneity in returns and/or in unobservables play a role in
explaining differences in the distribution of wages across regions. On the contrary,
absence of changes in the counterfactual distribution should be read as evidence in
favour of regional differences in the distribution of observable characteristics that are
entirely responsible for causing the wage disparities.
Figure 4 helps illustrate these effects. It depicts densities for simulated distributions.
The distance between the density labelled Actual wage in LW group and that labelled
Counterfactual wage for LW group can be attributed to regional differentials in returns
and unobservables, while the distance between the density of the latter and that of the
Actual wage in HW group shows differences in the distribution of characteristics
between the groups of HW and LW regions. The comparison also sheds some light on
the origin of these differences in wage dispersion and in the shape of the wage
distributions. In this example, only part of the lower dispersion in the LW group can be
attributed to returns. Further, we see that they explain much of the difference at the
bottom of the distribution but virtually nothing of the difference for higher wage levels.
Results obtained from the visual comparison of the densities are complemented by the
J-measure and by results from the decomposition by Juhn et al. (1993) at selected
percentiles (JMP).
4. RESULTS
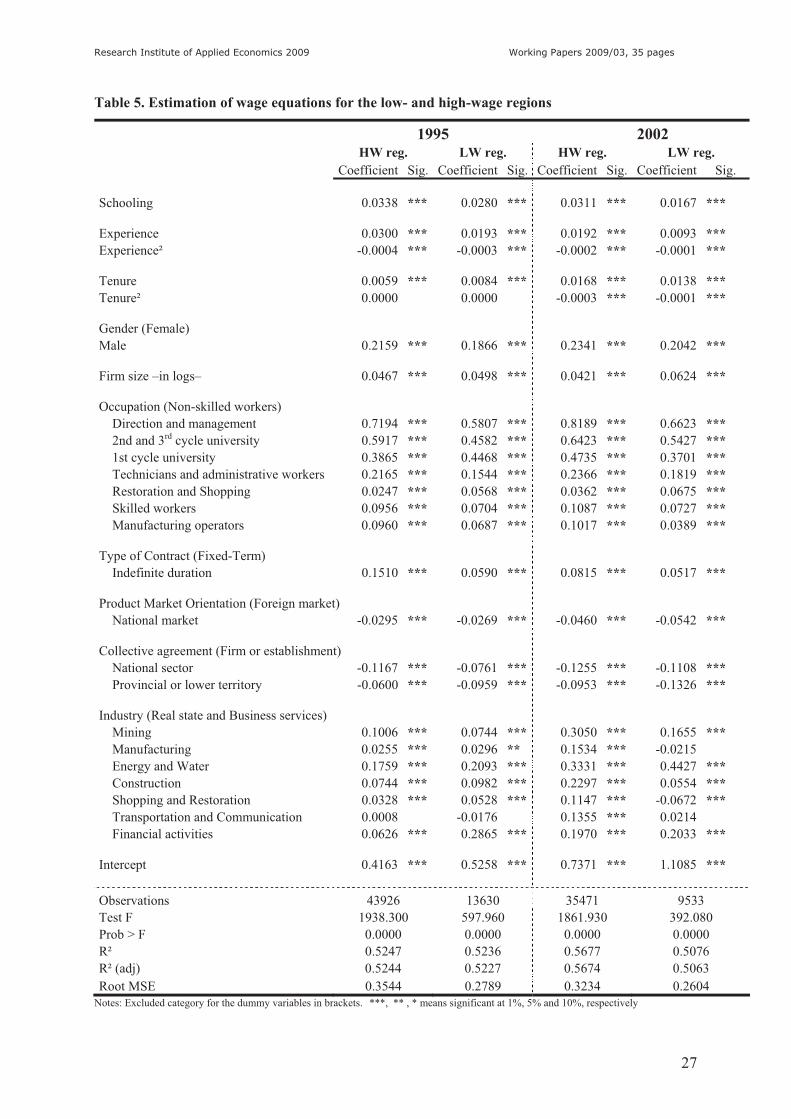
To compute the counterfactual wages we need an estimate of the coefficients of the
wage equations for the two groups of regions in each of the years. Results of the OLS
estimation for the HW and LW groups in 1995 and 2002 are summarised in Table 5.8
8 It might be argued that our OLS estimates are likely to be biased due to the non-exogeneity of education. As in other contributions to the literature that use the same dataset, the lack of appropriate instruments in the ESS prevents us from applying other estimation methods based on instrumental variables. In any case, the large set of controls for firm and job characteristics, such as occupation and the
Research Institute of Applied Economics 2009 Working Papers 2009/03, 35 pages
14
As expected, there are significant differences in returns between the two groups. In the
case of worker characteristics, for example, we see a higher return to schooling in the
HW regions. The return of a year of schooling for this group in 1995 was 3.38% vis a
vis 2.80% in the LW group. The gap in this return increases in 2002 as a result of the
sharp fall in return in the LW regions. The return to general experience in the labour
market is also lower in the LW group (the return to a year of experience computed in
the sample average in 1995 was 2.09% for the HW and 1.24% for the LW, and in 2002
1.50% and 0.73% respectively) although this is not the case for tenure (return to a year
in a firm computed in the sample average for 1995 was 0.59% in the HW and 0.84% in
the LW, and in 2002 1.40% and 1.32% respectively). Regional heterogeneity in returns
is also observed in most of a firm’s characteristics. For instance, the return to
occupations that require high skill levels is higher in the HW group, and the same is true
of being hired by a permanent contract. In contrast, the so-called size-wage effect seems
to be of the same magnitude in both groups, or even somewhat greater in the LW group
in 2002.
Yet, the heterogeneity in the estimated coefficients of the wage equation for the two
groups of regions should be read as an indication that at least part of their wage gap
could be due to differences in returns, and not just to the fact that workers, jobs and
firms differ across regions.
4.1. Effect of regional differences in returns and unobserved characteristics
A comparison of actual wage distributions in the two groups of regions ( LWw and
HWw ) and the distribution of counterfactual wages in the LW group with returns and
unobservables as in the HW regions ( 1,HWLWw ) can be made from the densities depicted in
Figure 5.9 In addition, the second column of results in Table 3 shows the J-measure for
this counterfactual distribution and the two real distributions, while results for the JMP
decomposition at selected quantiles are reported in Table 6. The estimated density for 1,HW
LWw clearly reveals that the counterfactual distribution shifted to the right, towards
type of contract, should capture the effect of worker omitted variables, such as ability, that might be biasing the estimates of the return to education. 9 It should be mentioned that as the wage equations used to compute the counterfactual wages include a number of dummy variables as regressors, the identification constraints suggested in Gardeazabal and Ugidos (2004) were imposed to guarantee that results were invariant to the omitted categories.

Research Institute of Applied Economics 2009 Working Papers 2009/03, 35 pages
15
higher wage levels, particularly in 2002. We also observe a change in the shape of the
counterfactual distribution, which is more similar to the actual distribution for the HW
regions than it is for the LW group. As a consequence, this evidence suggests that a
large proportion of the differences in wages across regions were caused by regional
heterogeneity in returns and by differences in the distribution of unobserved
characteristics. This is confirmed by the results of the (dis)similarity measure. The J-
coefficient obtained when comparing the counterfactual distribution for the LW group
with the actual distribution in the HW takes a much lower value than that obtained when
contrasting the two actual distributions (0.1236 versus 0.5804 in 1995 and 0.0987
versus 0.4851 in 2002). This means that when valuing the observed characteristics with
the same returns and equalising the distribution of the unobserved characteristics, most
differences in the wage distributions for the two groups of regions disappear.
A detailed analysis of the densities also reveals that the effect of differences in these
two factors were not homogeneous throughout the distribution. They do seem to be
fully responsible for the lower wage levels at the bottom of the distribution. In fact, the
left tail of the counterfactual density of the LW regions is to the right of that for the
actual distribution in the HW group in 2002, indicating that had returns and
unobservables been the same across regions, wages for workers at the bottom of the
distribution in the LW group would have been higher than those for workers with the
lowest wages in the HW group. Differences in returns and unobservables almost fully
explain differences among the top wage levels in 2002 as well. At other parts of the
distribution their effect is not so marked, although it is still greater than that attributable
to differences in observed characteristics. This is confirmed by the figures obtained
from the JMP decomposition (summarised in Table 6) for some selected quantiles. For
the first decile in both years and even for the lower quartile in 2002, differences in
returns alone caused a gap that would have been even greater than that observed in the
data. For these wage levels, the regional distribution of observed characteristics and the
effect of unobservables partially balance out the effect of regional differences in returns
(negative contribution to the wage gap). For the median and upper percentiles there is a
significant difference between the two years under analysis. Although in both cases the
most intense contribution is that of returns, in 1995 the effect of observable
characteristics is non-negligible whereas it diminished significantly in 2002.

Research Institute of Applied Economics 2009 Working Papers 2009/03, 35 pages
16
Our results so far suggest that the main discrepancy in wage distributions between the
HW and LW groups of regions cannot be explained by regional differences in observed
worker and firm characteristics. On the contrary, above all in 2002, they seem to be
associated with spatial heterogeneity in returns and unobservables. In addition, the
limited effect attributable to the unobserved characteristics in the JMP decomposition
combined with figures for the effect of differences in returns point to the latter as the
main contributor to the gap in wage distributions. The distribution of counterfactual
wages for the LW group resulting from assigning the returns of the HW group but
keeping its observed characteristics and the distribution of residuals unaltered, 2HW,LWw ,
is quite similar to that of 1,HWLWw , which confirms that most of the changes discussed
above correspond to differences in returns (Figure 6). The J-measure for both
counterfactual distributions is as low as 0.0161 in 1995 and 0.0318 in 2002. The main
difference between them is concerned with with dispersion around the mode, as the
counterfactual distribution is less dispersed when we only modify returns. Then, the
basic role of unobservables might be concerned with the difference in the degree of
dispersion of wages between the two groups of regions.
4.2. The effect of regional differences in the return to human capital
As mentioned in section 2, the use of a matched employer-employee dataset allows us
to control for worker and firm characteristics in our analysis. The availability of this
information is now crucial to study the separate contribution of differences in returns to
each of these sets of characteristics. We can compute counterfactual wages in the LW
group as if its workers had been paid for their individual characteristics as workers were
in the HW group. As this set of characteristics comprises gender and human capital
proxies, and given our interest in the effect of returns to the latter, counterfactual wages
in this case are computed modifying only returns to human capital ( HKHW,LWw ):10
� �LWiLWiLWLWiLWHKHWLWi
HKHWLWi XFXHKw |1**, ��� ��� (8)
where HKiLW is the vector of observations for schooling, experience and tenure for
worker i in the LW group, HKHW� is the vector of returns to the human capital variables in
the HW group, and the star denotes all the other characteristics.
10 Results, available upon request, are unaffected when modifying returns to gender as well.

Research Institute of Applied Economics 2009 Working Papers 2009/03, 35 pages
17
Alternatively, counterfactual wages in the case of balancing out only differences in
returns to firm characteristics ( FHW,LWw ) are computed as:
� �LWiLWiLWLWiLWFHWLWi
FHWLWi XFXFw |1##, ��� ��� (9)
where FiLW is the vector of observations for firm characteristics of worker i in the LW
group, FHW� is the vector of returns to these characteristics in the HW group, and #
denotes worker characteristics.
The estimated density function for HKHW,LWw is depicted in Figure 7, together with those
for actual wages. The shift to the right and the change in the shape is of the same
magnitude as that obtained for 2HW,LWw , that is the counterfactual, when returns to all the
characteristics were changed (Figure 6). The only difference of note is that related to the
reduction in the intensity of change in the shape of the counterfactural distribution for
1995 when only the returns to human capital are modified. Evidence from the visual
inspection of the densities is confirmed by the values of the J-measure in the fourth
column of results in Table 3. Its value when comparing the two counterfactuals is
0.0181 for 1995, but it falls even lower for 2002 (0.0072). Correspondingly, the J-
measure for the comparison between the distribution of HKHW,LWw and that of HWw
provides much lower values than those obtained for the comparison between the two
actual distributions, LWw and HWw .
The evidence points to differences in returns to human capital as being the main source
of regional variation in wage distributions. If it were in fact the case, the contribution of
returns to firm characteristics should be only marginal in explaining differences in wage
distributions across regions. This result is confirmed by Figure 8, which compares the
estimated densities for real wages and counterfactual wages FHW,LWw . In 1995, the latter
density accumulates less mass of probability around the mode than the density for the
LW regions, and this represents the single significant difference between the two
distributions. This discrepancy is even lower for 2002. The last column of results in
Table 3 for the J-measure also confirms in this case the evidence obtained from a visual
inspection of the densities. The values obtained when comparing the counterfactual
distribution with the actual distribution for the HW group are quite similar to those

Research Institute of Applied Economics 2009 Working Papers 2009/03, 35 pages
18
obtained when comparing the real distribution for the two groups, especially in 2002.
Correspondingly, the J-measure takes values close to zero when the counterfactual and
the actual distributions for the LW group are compared (0.0189 in 1995 and 0.0101 in
2002). Therefore, the evidence strongly supports our claim that differences in returns to
firm characteristics only played a minor role in explaining the discrepancy in the wage
distribution between the two groups of regions, and that most of the differences were
caused by regional heterogeneity in returns to human capital. In addition, these effects
would seem to be increasing over time.
5. CONCLUDING COMMENTS
Evidence from a comprehensive wage survey has confirmed the existence of differences
not only in average regional wages but also in other key features of the wage
distribution. Applying standard practices from the regional science literature for the
decomposition of average wage gaps would have provided only partial and, in all
likelihood, non-robust results regarding the origin of these spatial differentials. Rather,
by adhering to developments in the labour economics literature, here we have proposed
a method for assessing the contributions of regional differences in characteristics and of
spatial heterogeneity in their price, to the discrepancy between entire regional wage
distributions.
The results of the decomposition for Spain have revealed that most of the differences in
the regional distributions are not associated with compensating differentials and
structural variation. In other words, the evidence we have obtained suggests that
identical workers in identical jobs and identical firms receive different wages depending
on the region in which they are located. This holds true for all wage levels, albeit that
our analysis of the entire distribution indicates that the gap is not homogeneous. The
relative contribution of returns is greatest for workers with the lowest wage levels,
while the effects of worker and firm characteristics seem to be constrained to medium
wage levels.
The availability of information for a rich set of worker and job and firm characteristics
has allowed us to demonstrate that regional heterogeneity in the returns to human
Research Institute of Applied Economics 2009 Working Papers 2009/03, 35 pages
19
capital (lower in the case of the less developed regions) was the main factor explaining
wage disparities across regions. Had human capital in the less developed regions been
recompensed at the same level as in the more advanced regions, the bulk of the
differences observed in the wage distributions would have disappeared. This result has
interesting implications from a policy point of view. In brief, it questions the
effectiveness of policies that promote human capital accumulation in the less developed
regions as a means of fostering regional convergence. Firstly, if we assume the
existence of a link between wages and productivity, increasing the skills of workers in
these regions will not lead to productivity improvements of the same magnitude as those
in the advanced regions and, secondly, and related to this point, more highly skilled
workers will have the incentive to migrate to those regions in which they can obtain a
greater reward for their human capital. Recent evidence regarding differences in the
propensity of interregional migration for individuals with different levels of schooling
and the direction of migration flows in Spain supports this claim. The key point remains
then as to why returns to human capital differ across regions. Based on recently
published findings in Head and Mayer (2006), López-Rodríguez et al. (2007) and
Combes et al. (2008), we hypothesize that such returns may be related to economies of
density and market potential, although further research is clearly required on this issue.
We should stress that our conclusions are derived from a partial equilibrium exercise.
As is usual in a counterfactual analysis of this type, it is difficult to predict the reaction
of workers and firms, for instance, to the regional equalization of returns to human
capital. Further, counterfactual wages were computed here on the basis of estimated
returns from the conditional mean regression of wage equations, which is likely to be a
shortcoming if returns are not homogeneous for all wage levels, as in the case reported
by Dickey (2007) for the regions in Great Britain. The use of returns estimated from
quantile regressions should be explored in greater depth, although this would probably
cause the derivation of counterfactual wages to be more cumbersome. Finally, this paper
has only provided a static analysis of regional wage differentials, since our objective
here was to examine the roots of these differentials and not their changes over time.
However, as extending this methodology to incorporate a non-static analysis is quite
straightforward, it is in our future research agenda.

Research Institute of Applied Economics 2009 Working Papers 2009/03, 35 pages
20
APPENDIX
The J-measure of Kullback and Leibler (1951) can be used to summarise the amount of
discrepancy between any two distributions. Given two estimated densities � �wg1ˆ and
� �wg2ˆ it is obtained as:
� � � � � �� � � �� �dwwgwgwgwgwJ
��
02
12112 ˆ
ˆlnˆˆ
It will equal zero for identical distributions while values close to zero indicate that the
distributions do not differ greatly. Correspondingly, the higher the value for the J-
measure becomes, the larger the discrepancy between the distributions.

Research Institute of Applied Economics 2009 Working Papers 2009/03, 35 pages
21
REFERENCES
Blackaby D and Manning N (1990) The North-South divide: Questions of existence and
stability?, The Economic Journal, 100: 510–527
Blackaby D and Murphy P (1991) Industry characteristics and inter-regional wage differences,
Scottish Journal of Political Economy 38: 142-161
Blackaby D and Murphy P (1995) Earnings, unemployment and Britain's North-South divide:
Real or imaginary?, Oxford Bulletin of Economics and Statistics 57: 487-512
Butcher K and DiNardo J (2002) The immigrant and native-born wage distributions: Evidence
from United States censuses, Industrial and Labor Relations Review 56: 97-121
Cabral J A, Almeida J P and Borges M T (2005) Inter-regional wage dispersion in Portugal, IZA
DP No. 1664, Bonn, Germany
Combes P, Duranton G and Gobillon L (2008) Spatial wage disparities: Sorting matters!
Journal of Urban Economics 63: 723-742
Dickey H (2007) Regional earnings inequality in Great Britain: Evidence from quantile
regressions, Journal of Regional Science 47: 775-806
Dickey M and Gerking S (1987) Interregional wage differentials: An equilibrium perspective,
Journal of Regional Science 27: 577-585
DiNardo J, Fortin N and Lemieux T (1996) Labor market institutions and the distribution of
wages, 1973-1992: A semiparametric approach, Econometrica 64: 1001-1044
Duranton G and Monastiriotis V (2002) Mind the gaps: The evolution of regional earnings
inequalities in the U.K., 1982-1997, Journal of Regional Science 42, 219-256
Farber S and Newman R (1987) Accounting for South/Non-South real wage differentials and
for changes in those differentials over time, Review of Economics and Statistics 69: 215-
223
Farber S and Newman R (1989) Regional wage differentials and the spatial convergence of
worker characteristic prices, Review of Economics and Statistics 71: 224-231
García I and Molina A (2002) Inter-regional wage differentials in Spain, Applied Economics
Letters 9: 209-215
Gardeazabal, J and Ugidos, A (2004): More on identification in detailed wage decompositions.
The Review of Economics and Statistics 86:1034-1036
Gerking S and Weirick W (1983) Compensating differences and interregional wage
differentials, The Review of Economics and Statistics 65: 483-487
Goerlich FJ, Mas M and Pérez F (2002) Concentración, convergencia y desigualdad regional en
España, Papeles de Economía Española 93: 17-37
Head K and Mayer T (2006) Regional wage and employment responses to market potential in
the EU, Regional Science and Urban Economics 36: 573-594

Research Institute of Applied Economics 2009 Working Papers 2009/03, 35 pages
22
Jenkins SP (1994) Earnings discrimination measurement: a distributional approach, Journal of
Econometrics 61: 81-102
Juhn Ch, Murphy K and Pierce B (1993) Wage inequality and the rise in returns to skill, The
Journal of Political Economy 101: 410-442
Kullback S and Leibler R (1951) On Information and sufficiency, Annals of Mathematical
Statistics 22: 79-86
López-Rodríguez, J., Faiña, A. and López Rodríguez J. (2007) Human Capital Accumulation
and Geography: Empirical Evidence from the European Union, Regional Studies 42: 217-
234.
Maier G and Weiss P (1986) The importance of regional factors in the determination of
earnings: the case of Austria, International Regional Science Review 10: 211-220
Reilly B (1991) An analysis of local labour market wage differentials, Regional Studies 26: 257-
264.
Webber DJ (2002) Labour’s reward across regions of the EU: a distributional dynamic
approach, Applied Economics 34: 385-394

Res
earc
h In
stitu
te o
f App
lied
Econ
omic
s 20
09
W
orki
ng P
aper
s 20
09/0
3, 3
5 pa
ges
23
Tab
le 1
. Des
crip
tive
of r
egio
nal n
omin
al w
ages
in S
pain
1995
20
02
A
vera
ge*
Std.
Dev
. G
ini
N. O
bs.
Ave
rage
* St
d. D
ev.
Gin
i N
. Obs
. A
ndal
ucía
6.
276
3.58
5 0.
2802
10
808
7.60
9 5.
099
0.28
2 80
76
Ara
gón
5.99
2 3.
371
0.26
02
5937
7.
627
4.12
5 0.
242
4549
A
stur
ias
6.04
2 3.
547
0.26
49
4117
7.
074
3.62
7 0.
228
2985
B
alea
res
5.29
4 2.
857
0.23
50
3551
6.
670
4.08
8 0.
222
2645
C
anar
ias
5.26
6 3.
528
0.29
93
5572
6.
355
3.60
6 0.
258
3712
C
anta
bria
5.
256
2.69
0 0.
2313
27
51
6.45
9 3.
004
0.21
4 21
10
Cas
tilla
y L
eón
5.11
7 2.
737
0.25
39
5498
6.
337
3.45
2 0.
235
4420
C
astil
la L
a M
anch
a 6.
226
3.76
5 0.
2868
73
89
7.32
0 4.
043
0.25
7 54
41
Cat
aluñ
a 7.
094
4.48
8 0.
2852
19
230
9.06
7 5.
781
0.28
3 15
969
Com
. Val
enci
ana
5.72
5 3.
254
0.26
20
1060
4 7.
073
3.97
4 0.
242
9809
Ex
trem
adur
a 4.
502
2.67
5 0.
2500
23
81
5.36
5 2.
775
0.20
3 15
67
Gal
icia
5.
047
2.98
0 0.
2529
71
87
6.62
8 4.
051
0.26
1 58
20
Mad
rid
7.84
6 5.
918
0.33
10
1579
4 9.
532
7.46
6 0.
332
1299
5 M
urci
a 4.
639
2.27
9 0.
2150
40
62
5.97
5 3.
097
0.20
5 35
46
Nav
arra
6.
187
3.27
2 0.
2373
36
95
8.25
8 3.
602
0.20
5 30
95
País
Vas
co
7.47
0 3.
937
0.24
88
8902
9.
480
4.44
7 0.
229
6507
La
Rio
ja
5.09
7 2.
621
0.21
34
2732
6.
652
3.37
8 0.
200
1986
To
tal
6.28
2 4.
073
0.29
01
1202
107.
836
5.09
8 0.
279
9523
2 *
In c
urre
nt €

Res
earc
h In
stitu
te o
f App
lied
Econ
omic
s 20
09
W
orki
ng P
aper
s 20
09/0
3, 3
5 pa
ges
24
Tab
le 2
. Des
crip
tive
of w
ages
in th
e gr
oups
of l
ow- a
nd h
igh-
wag
e re
gion
s
N
omin
al G
ross
Hou
rly
Wag
e R
eal G
ross
Hou
rly
Wag
e
Perc
entil
es
A
vera
ge
Std.
Dev
. G
ini
Ave
rage
St
d D
ev.
Gin
i 10
%
25%
50
%
75%
90
%
1995
Cat
aluñ
a 7.
09
4.49
0.
285
6.77
4.
28
0.28
5 3.
30
4.21
5.
77
7.91
11
.06
Mad
rid
7.85
5.
92
0.33
1 7.
78
5.86
0.
331
3.37
4.
28
6.24
9.
10
13.7
9 Pa
ís V
asco
7.
47
3.94
0.
249
7.20
3.
79
0.24
9 3.
80
4.91
6.
41
8.28
11
.08
Hig
h-W
age
regi
ons
7.44
4.
97
0.29
7 7.
22
4.85
0.
298
3.40
4.
36
6.08
8.
37
11.9
9 Ex
trem
adur
a 4.
50
2.67
0.
250
5.12
3.
04
0.25
0 3.
14
3.57
4.
07
5.43
8.
29
Gal
icia
5.
05
2.98
0.
253
5.12
3.
03
0.25
3 3.
01
3.46
4.
12
5.84
8.
25
Mur
cia
4.64
2.
28
0.21
5 4.
83
2.37
0.
215
3.08
3.
54
4.21
5.
26
7.31
Lo
w-W
age
regi
ons
4.83
2.
74
0.24
3 5.
04
2.85
0.
242
3.07
3.
49
4.13
5.
58
8.00
20
02
C
atal
uña
9.07
5.
78
0.28
3 8.
51
5.43
0.
283
4.31
5.
33
7.05
9.
83
14.0
6 M
adrid
9.
53
7.47
0.
332
9.54
7.
47
0.33
2 4.
33
5.23
7.
44
11.1
3 16
.90
País
Vas
co
9.48
4.
45
0.22
9 8.
95
4.20
0.
229
5.12
6.
21
8.05
10
.45
13.6
2 H
igh-
Wag
e re
gion
s 9.
31
6.26
0.
293
8.97
6.
10
0.29
4 4.
42
5.44
7.
39
10.3
8 14
.92
Cas
tilla
y L
eón
6.34
3.
45
0.23
5 6.
87
3.74
0.
235
4.17
4.
91
5.69
7.
47
10.7
1 Ex
trem
adur
a 5.
37
2.77
0.
203
6.22
3.
22
0.20
3 4.
26
4.67
5.
29
6.35
8.
89
Mur
cia
5.98
3.
10
0.20
5 6.
08
3.15
0.
205
4.09
4.
57
5.23
6.
56
8.78
Lo
w-W
age
regi
ons
6.04
3.
24
0.22
2 6.
47
3.47
0.
221
3.88
4.
40
5.09
6.
51
9.13

Res
earc
h In
stitu
te o
f App
lied
Econ
omic
s 20
09
W
orki
ng P
aper
s 20
09/0
3, 3
5 pa
ges
25
Tab
le 3
. J-M
easu
re o
f (di
s)si
mila
rity
of d
istr
ibut
ions
.
A
ctua
l C
ount
erfa
ctua
l
Low
-Wag
e A
ll re
turn
s and
un
obse
rvab
les
All
retu
rns
Ret
urns
to h
uman
ca
pita
l R
etur
ns to
firm
s ch
arac
teris
tics
Act
ual
H
igh-
Wag
e
1
995
0.
5804
0.12
36
0.
1741
0.26
76
0.
4648
2
002
0.48
51
0.09
87
0.19
10
0.22
89
0.45
87
Low
-Wag
e
1
995
0.31
77
0.
3661
0.35
30
0.
0189
2
002
0.
5918
0.
7465
0.
7659
0.
0101
C
ount
erfa
ctua
l
All
retu
rns a
nd u
nobs
erva
bles
1
995
0.
0161
0.04
28
0.
2196
2
002
0.03
18
0.03
65
0.54
55
All
retu
rns
199
5
0.
0181
0.27
01
200
2
0.00
72
0.69
50
Ret
urns
to h
uman
cap
ital
199
5
0.26
72
2
002
0.71
57

Research Institute of Applied Economics 2009 Working Papers 2009/03, 35 pages
26
Table 4. Descriptive of observable worker and firm characteristics
1995 2002 HW reg. LW reg. HW reg. LW reg. Continuous variables (average and std. desv.) Schooling (in years) 9.367 8.099 10.128 8.502 (4.045) (3.493) (4.117) (3.427)
Experience (in years) 22.796 22.806 20.929 19.738 (11.711) (11.439) (12.056) (11.552)
Tenure (in years) 11.849 9.306 9.080 6.116 (10.230) (9.274) (10.431) (8.257)
Firm size (in number of employees) 281.982 90.383 349.993 62.197 (897.870) (417.224) (854.437) (74.917)
Discrete Variables (share) Gender Male 74.92% 80.80% 70.70% 78.53% Female 25.08% 19.20% 29.30% 21.47% Occupation Direction and management 5.24% 3.61% 3.06% 1.57% 2nd and 3rd cycle university 4.50% 1.49% 5.04% 1.48% 1rst cycle university 2.70% 1.20% 2.72% 1.66% Technicians and administrative workers 30.55% 21.78% 31.78% 19.58% Restoration and Shopping 6.30% 6.65% 6.32% 4.94% Skilled workers 17.96% 26.23% 17.74% 28.70% Manufacturing operators 23.66% 25.66% 25.93% 28.41% Non-skilled workers 9.09% 13.39% 7.41% 13.66% Type of Contract Indefinite duration 80.47% 67.59% 83.27% 70.28% Fixed-term 19.53% 32.41% 16.73% 29.72% Product Market Orientation National market 2.54% 0.43% 78.90% 96.15% Foreign market 97.46% 99.57% 21.10% 3.85% Collective agreement National sector 35.57% 33.85% 39.92% 45.06% Provincial or lower territory 33.30% 51.47% 41.65% 51.80% Firm or establishment 31.13% 14.67% 18.42% 3.14% Industry Mining 4.69% 8.69% 0.64% 0.43% Manufacturing 52.28% 46.35% 61.88% 64.22% Energy and Water 3.43% 2.14% 0.47% 0.86% Construction 6.80% 9.49% 6.96% 13.30% Shopping and Restoration 4.56% 6.26% 12.07% 12.63% Transportation and Communication 14.35% 16.64% 3.28% 2.94% Financial activities 6.47% 5.76% 5.04% 2.74% Real estate and Business services 7.42% 4.68% 9.65% 2.88%
Observations 43926 13630 35471 9533
Research Institute of Applied Economics 2009 Working Papers 2009/03, 35 pages
27
Table 5. Estimation of wage equations for the low- and high-wage regions
1995 2002 HW reg. LW reg. HW reg. LW reg.
Coefficient Sig. Coefficient Sig. Coefficient Sig. Coefficient Sig.
Schooling 0.0338 *** 0.0280 *** 0.0311 *** 0.0167 ***
Experience 0.0300 *** 0.0193 *** 0.0192 *** 0.0093 ***
Experience² -0.0004 *** -0.0003 *** -0.0002 *** -0.0001 ***
Tenure 0.0059 *** 0.0084 *** 0.0168 *** 0.0138 ***
Tenure² 0.0000 0.0000 -0.0003 *** -0.0001 ***
Gender (Female)
Male 0.2159 *** 0.1866 *** 0.2341 *** 0.2042 ***
Firm size –in logs– 0.0467 *** 0.0498 *** 0.0421 *** 0.0624 ***
Occupation (Non-skilled workers)
Direction and management 0.7194 *** 0.5807 *** 0.8189 *** 0.6623 *** 2nd and 3rd cycle university 0.5917 *** 0.4582 *** 0.6423 *** 0.5427 *** 1st cycle university 0.3865 *** 0.4468 *** 0.4735 *** 0.3701 *** Technicians and administrative workers 0.2165 *** 0.1544 *** 0.2366 *** 0.1819 *** Restoration and Shopping 0.0247 *** 0.0568 *** 0.0362 *** 0.0675 *** Skilled workers 0.0956 *** 0.0704 *** 0.1087 *** 0.0727 *** Manufacturing operators 0.0960 *** 0.0687 *** 0.1017 *** 0.0389 ***
Type of Contract (Fixed-Term)
Indefinite duration 0.1510 *** 0.0590 *** 0.0815 *** 0.0517 ***
Product Market Orientation (Foreign market)
National market -0.0295 *** -0.0269 *** -0.0460 *** -0.0542 ***
Collective agreement (Firm or establishment)
National sector -0.1167 *** -0.0761 *** -0.1255 *** -0.1108 *** Provincial or lower territory -0.0600 *** -0.0959 *** -0.0953 *** -0.1326 ***
Industry (Real state and Business services)
Mining 0.1006 *** 0.0744 *** 0.3050 *** 0.1655 *** Manufacturing 0.0255 *** 0.0296 ** 0.1534 *** -0.0215 Energy and Water 0.1759 *** 0.2093 *** 0.3331 *** 0.4427 *** Construction 0.0744 *** 0.0982 *** 0.2297 *** 0.0554 *** Shopping and Restoration 0.0328 *** 0.0528 *** 0.1147 *** -0.0672 *** Transportation and Communication 0.0008 -0.0176 0.1355 *** 0.0214 Financial activities 0.0626 *** 0.2865 *** 0.1970 *** 0.2033 ***
Intercept 0.4163 *** 0.5258 *** 0.7371 *** 1.1085 ***
Observations 43926 13630 35471 9533 Test F 1938.300 597.960 1861.930 392.080 Prob > F 0.0000 0.0000 0.0000 0.0000 R² 0.5247 0.5236 0.5677 0.5076 R² (adj) 0.5244 0.5227 0.5674 0.5063 Root MSE 0.3544 0.2789 0.3234 0.2604
Notes: Excluded category for the dummy variables in brackets. ***, ** , * means significant at 1%, 5% and 10%, respectively

Research Institute of Applied Economics 2009 Working Papers 2009/03, 35 pages
28
Table 6. Regional wage gap decomposition at selected quantiles.
Total
Difference Observed Quantities
Observed Returns
Unobserved Quantities and Returns
1995
10% 0.1033 -0.0047 0.1577 -0.0498
25% 0.2219 0.0577 0.1859 -0.0217
50% 0.3854 0.1654 0.2091 0.0110
75% 0.4058 0.1661 0.2039 0.0358
90% 0.4049 0.1428 0.2080 0.0540
2002
10% 0.0637 -0.1000 0.2249 -0.0612
25% 0.1398 -0.0677 0.2460 -0.0385
50% 0.3070 0.0320 0.2723 0.0026
75% 0.4078 0.0833 0.2851 0.0394
90% 0.4218 0.0553 0.3019 0.0646
Research Institute of Applied Economics 2009 Working Papers 2009/03, 35 pages
29
Figure 1. Density functions for real hourly wages in the regions under analysis
1995 High-wage regions Low-wage regions
— Cataluña -- Madrid … País Vasco
— Extremadura -- Murcia … Galicia
2002 High-wage regions Low-wage regions
— Cataluña -- Madrid … País Vasco
— Extremadura -- Murcia … Castilla León
Research Institute of Applied Economics 2009 Working Papers 2009/03, 35 pages
30
Figure 2. Density functions for real hourly wage in the LW and HW groups of regions,
1995
—— LW group --- HW group
Figure 3. Density functions for real hourly wage in the LW and HW groups of regions, 2002
—— LW group --- HW group

Figure 4. Interpretation of the contribution of characteristics and returns to
regional differences in wage distributions (densities for simulated wage
distributions).
Actual wage in HW group
Counterfactual wage for LW group Actual wage in LW group

Research Institute of Applied Economics 2009 Working Papers 2009/03, 35 pages
32
Figure 5. Effect of differences in returns to all characteristics and unobservables
1995
2002
—— actual LW group --- actual HW group ··· counterfactual LW group

Research Institute of Applied Economics 2009 Working Papers 2009/03, 35 pages
33
Figure 6. Effect of differences in returns to all characteristics
1995
2002
—— actual LW group --- actual HW group ··· counterfactual LW group

Research Institute of Applied Economics 2009 Working Papers 2009/03, 35 pages
34
Figure 7. Effect of differences in returns to human capital
1995
2002
—— actual LW group --- actual HW group ··· counterfactual LW group

Research Institute of Applied Economics 2009 Working Papers 2009/03, 35 pages
35
Figure 8. Effect of differences in returns to firm characteristics
1995
2002
—— actual LW group --- actual HW group ··· counterfactual LW group