2009 annual report · information technology, human resources, contracts, and store super-vision....
TRANSCRIPT

2009AnnuAlRepoRt
Serving Idaho Since 1935

1349 E. Beechcraft CourtP.O. Box 179001
Boise, Idaho 83717-9001(208) 947-9400
www.liquor.idaho.gov
Order Picker using stock picker to reach product on upper rack levels.
Carton in carton flow racking, showing location bar coded label.
Order Picker scanning pallet identification bar coded label.
Additional carton flow racking installed for slow moving, full case products.
Detail of location bar coded label.
Idaho State liquor Division 16 2009 Annual Report
TiTle
2009AnnuAlRepoRt
Serving Idaho Since 1935
Idaho State liquor Division 2 2009 Annual Report
“The Idaho State Liquor Division was established to provide
greater control over the distribution, sale, and consumption
of beverage alcohol. While we accomplish this goal, we are
also generating millions of dollars for the State’s General
Fund, other public programs and cities and counties…”

Table of ConTenTs
Idaho State liquor Division 3 2009 Annual Report
Director’s Message --------------------------------------------------------------------------------- 4
organization Structure and liquor Store locations ----------------------------------------- 6
Background and History -------------------------------------------------------------------------- 7
united States and Idaho Apparent per Capita Consumption of Distilled Spirits --------------------------------------------------- 8
Profit Distribution ---------------------------------------------------------------------------------- 9
Retail price Components ------------------------------------------------------------------------ 10
Five Year Comparisons:• Dollar Sales Comparison ------------------------------------------------------------------- 11
• Bottle Sales Comparison ------------------------------------------------------------------- 11
• Five Year Sales per Ftp Comparison ---------------------------------------------------- 11
• employee Compensation to Sales Ratio Comparison -------------------------------- 12
• Five Year net Income Comparison ------------------------------------------------------- 13
• net Income per Ftp Comparison -------------------------------------------------------- 13
Income Statement -------------------------------------------------------------------------------- 14
Balance Sheet -------------------------------------------------------------------------------------- 15
Statement of Changes in Fund equity -------------------------------------------------------- 16
operating expenses ------------------------------------------------------------------------------ 17
Schedule of Comparative Sales and Distribution of Profits by City/County ------------------------------------------------------------------ 18 – 24
Idaho State liquor Division 4 2009 Annual Report
DireCTor’s Message
It is my pleasure to submit the Annual Report of the Idaho State Liquor Division (ISlD) to Governor otter for the Fiscal Year ending June 30,
2009. Following is a summary of highlights for Fiscal Year 2009:• Sales increased $4.3 million from $130.8 million to $135.1 million,
an increase of 3.3%.• Profits increased $1.1 million from $45.1 million to $46.2 million, an
increase of 2.4%.• The Liquor Division once again distributed a record total from net
profits, $45.2 million, and over the past decade has contributed $304 million to the State’s General Fund, legislatively-mandated public programs, and to Idaho’s 200 incorporated cities and 44 counties.
Significant additional accomplishments for Fiscal Year 2009 included the following:
• Four new state-operated stores were opened during FY 2009, and are located in Ammon, eagle, Kuna and Rathdrum.
• The Liquor Division is in the final phase of a 3-year, $7.2 million project to expand and modernize the warehouse/distribution center at the Central Office in Boise. Construction is complete on a 17,000 square foot addition to the existing facility, and a state-of-the-art Warehouse Management System has been integrated into daily operations. The final phase of the project, involving the construction of an automated pallet storage and retrieval system, should be completed in early spring 2010.
• County-option Sunday packaged liquor sales continue to increase, especially in tourist regions. During FY 2009, Canyon and Payette brought to 29 the number of counties which have approved Sunday packaged liquor sales on what has become the second busiest shopping day of the week across the nation.
• At the conclusion of FY 2009, Sunday sales were offered in 24 of our 65 State stores, as well as 59 of our 99 contract store operators. Sunday sales generated more than $3.5 million dollars in revenue, doubling the total of the previous Fiscal Year, while providing enhanced customer service and more fully utilizing existing facilities.
The decline in the US and Idaho economies was felt by the Division, as occurred in nearly every other sector of the business community. However, as in the five most recent national recessions, sales of distilled spirits continued to outpace the national retail sector, though at a less robust pace than in previous recessions.
• After years of double-digit growth in sales revenues, the ISLD saw customers trading down from premium brand beverages to less expensive brands, mirroring a national trend which has slowed revenue growth.
• Restaurants and bars, comprising the discount (on-premise) portion of the ISLD sales, suffered in Idaho, as they did nationally. this sector was particularly hard-hit in the treasure Valley, which typically produces the Liquor Division’s greatest revenues and profits due to a large population base, but suffered significant job losses, leading to reduced consumer spending in FY 2009.
• Consumption in Idaho remains below that of other control states, and well below the national consumption level, even as revenues and profits continue to grow. However, the economic reality of consumer trade-down in price (both retail and discount), threatens profits and distribution, providing the most significant challenge for the Liquor Division during FY 2010.
• The Liquor Division has reacted to a shrinking gross profit by increasing the price of the least expensive spirits in all categories, an effort to recapture some of the lost profit resulting from the trade-down noted previously. The debate continues internally at the ISLD (as it does nationally) regarding the impact on revenues that any further price increases to consumers might bring in the form of diminishing returns.

Idaho State liquor Division 5 2009 Annual Report
A reduction in personnel dollars from the 2010 budget has created a much leaner operating model for the Liquor Division, one of the agencies which completed Zero Base Budgeting (ZBB) in preparing its 2011 budget proposal. The experience was extremely helpful in validating the proper use of funds available, and an important tool in demonstrating the minimum needs for successful operation of the agency.
the ZBB experience, though, has led to a growing concern that any further reduction in personnel dollars may create difficult choices late in FY 2010, and certainly for FY 2011. The safety of employees and the security of the product, the two main points of emphasis, require substantial oversight. A reduction of personnel funding necessary to meet budget requirements may well mean: either too many additional hours of solitary employees in liquor stores, or a reduction of operating hours to insure safety and security at the current level of personnel spending, but bringing the potential for a loss, perhaps significant, in revenues and profits for distribution.
I want to thank Governor otter, his staff, and the legislature for their continued support of the Idaho State liquor Division. I also want to express my sincere appreciation to the entire ISlD team for their ongoing dedicated service to the liquor Division and the State of Idaho. Sincerely,
Dyke nally, Director
15 Years of Growth
Fiscal Year 1996 2000 2005 2009 2010 (est)
FTE’s 134 142 160 196 201
State Stores 47 50 52 65 67
Contractors 92 103 100 99 99
Bottles Sold 5.4 Million 5.9 Million 7.4 Million 9.9 Million 10 Million
Gross Sales $37,875,032 $65,566,229 $95,213,920 $135,082,237 $136,442,000
Gross Profit $25,054,686 $30,249,627 $45,285,139 $64,034,594 $64,810,000
Net Income $16,866,559 $20,246,606 $32,163,890 $46,150,006 $46,666,663
Distribution $17,417,325 $19,891,672 $33,826,157 $45,193,360 $45,763,000

Idaho State liquor Division 6 2009 Annual Report
organizaTion sTruCTure anD liquor sTore loCaTions
Liquor Store Locationst State - 65
• Contract - 99
(ShADED ArEAS)
Counties with Sunday Liquor Sales (29)
AdaAdamsBannockBenewahBlaineBoiseBonnerCamasCanyonClarkClearwaterCusterElmoreGemGoodingIdahoJeromeKootenaiLatahLewisLincolnNez PerceOwyheePayettePowerShoshoneTetonTwin FallsValley
Governor
Director
Deputy Director
Procurement andDistribution
Accounting
InformationTechnology
AdministrativeSupport and
Human Resources
District 115 State Stores
26 Contract Stores
District 216 State Stores
27 Contract Stores
District 318 State Stores
22 Contract Stores
District 416 State Stores
24 Contract Stores

Idaho State liquor Division 7 2009 Annual Report
baCkgrounD anD HisTory
• Alabama• Idaho• Iowa• Maine• Michigan• Mississippi• Montana• New hampshire• North Carolina• Ohio• Oregon• Pennsylvania• Utah• Vermont• Virginia• Washington• West Virginia• Wyoming• Montgomery County, MD• Worcester County, MD
20 control Jurisdictions
the Idaho State liquor Division was established in 1935, following
the repeal of prohibition, as a means of providing greater control over the distribution, sale, and consumption of beverage alcohol. Organizationally, the Division has been a division of the Office of the Governor since 1974.
Idaho is one of 20 jurisdictions that control the sale of alcohol beverages. (eighteen control states and two counties in Maryland.) These juris-dictions account for almost one-third of the u.S. population, and regulate their own retail and/or wholesale distribution of beverage alcohol.
At fiscal year end, the Division oper-ated 164 retail outlets throughout the State. of those, 65 were state liquor stores staffed and operated by Division employees, and 99 were contract agencies. Stores are typi-cally open from 11:00 a.m. to 7:00 p.m. A few stores are open additional hours for extended customer service.
Selected stores in 29 of Idaho’s 44 counties have added limited Sunday hours as a customer service feature.
the state liquor store with the highest sales volume reported sales in excess of $5 million in FY 2009. Statewide, stores sell nearly ten million bottles annually. each state and contract store is stocked and maintained to meet the needs of customers including liquor-by-the-drink establishments. Outlets feature a selection of products priced uniformly throughout the state specific to the tastes and lifestyles of the local communities they serve. All products are priced uniformly throughout the state. the Division paid $5.2 million to the private sector for agency contract fees and store leases in FY 2009.
The Division’s central office and warehouse are located in Boise. A Central Office staff of 25 and four District Managers oversee all admin-istrative aspects of the business
including purchasing, accounting, information technology, human resources, contracts, and store super-vision. twenty warehouse personnel, co-located with the administrative office, receive, store and distribute more than 840,000 cases annually over a geographic area of 83,000 square miles. the warehouse typically contains about 180,000 cases valued at nearly $10 million.
Idaho’s system of liquor control provides benefits to all of Idaho’s citizens. Moderation and temperance in control states generally reduce social costs associated with alcohol consumption. Additionally, Idaho law provides for the distribution of liquor profits to specific state programs, the General Fund, and 44 counties and 200 cities. over the last decade $304 million was distributed to state programs, counties and cities.

Idaho State liquor Division 8 2009 Annual Report
uniTeD sTaTes anD iDaHo apparenT per CapiTa ConsuMpTion of DisTilleD spiriTs
Apparent per capita consumption is based on total population (i.e., not just adults age 21 and over). Statistics are based on point-of-sale data and may not take into account cross-border distilled spirits sales. Consumption in Idaho was 1.32 gallons in calendar year 2008 compared with 1.33 gallons for all control states and 1.50 gallons in open states. Consumption in open states is 13% more than in all control states and 14% more than in Idaho.
1998 1999 2000 2001 2002 2003 2004 2005 2006 2007 2008
caleNDar YearSource: Distilled Spirits Council of the United States (most recent data available)
OPEN STATES
US
CONTrOL STATES
IDAhO
Ga
llo
Ns
per
ca
pita
1.70
1.50
1.30
1.10
0.90
0.70

Idaho State liquor Division 9 2009 Annual Report
profiT DisTribuTion
statutory profit Distribution Formula:
• two percent surcharge on liquor sales to the Drug Court, Mental Health Court and Family Court Services Fund.
• Forty percent of profits (through FY 2009, increasing by 2% annually to 50% in FY 2014) are distributed as follows:
• Repay $1.8 million annually to the cities and counties during FY’s 2006 through 2009.• Annual fixed distributions totaling $5,650,000 to Substance Abuse Treatment Fund, Community
Colleges, Public Schools, Cooperative Welfare Fund, Court Services and Court Supervision Funds.
• Remaining balance to the General Fund.• Sixty percent of profits (through FY 2009, decreasing by 2% annually to 50% in FY 2014) are
distributed as follows:• 40% to counties in proportion to sales in each county.• 60% to cities as follows:
> 90% to those incorporated cities with liquor stores in proportion to sales.> 10% to those incorporated cities without liquor stores in proportion to population.
General Fund$9,594,000
21.2%
Public Schools$1,200,000
2.7%
Substance AbuseTreatment Fund
$2,080,0004.6%
Cooperative Welfare Fund$650,000
1.4%
Community Colleges$600,000
1.3%
Cities$16,419,600
36.4%
Counties$10,946,400
24.2%
CourtServices
$3,263,360 7.2%
CourtSupervision Fund
$440,0001.0% FY 2009
total Distribution$45,193,360

retail price $12.95
Court Services Fund Surcharge 26¢
Markup and handling $5.67
Federal Alcohol Tax $2.14
Product Cost $4.88
Idaho State liquor Division 10 2009 Annual Report
reTail priCe CoMponenTs

Idaho State liquor Division 11 2009 Annual Report
five year CoMparisons
10.0
9.5
9.0
8.5
8.0
7.5
7.0
6.5
6.0
140
130
120
110
100
90
80
70
2005 2006 2007 2008 2009FISCAL YEAr
Bottle sales increased 29.6% from 7.6 million in 2005 to 9.9 million in 2009.
2005 2006 2007 2008 2009FISCAL YEAr
Dollar sales increased 41.9% from $95.2 million in 2005 to $135.1 million in 2009.
Five Year Bottle sales comparison
BOTT
LES
(Mill
ions
)Five Year Dollar sales comparison
DO
LLA
rS
(Mill
ions
)

Idaho State liquor Division 12 2009 Annual Report
five year CoMparisons
Five Year employee compensation to sales ratio comparison
CO
MP
rAT
IO (
Perc
ent)
700
650
600
550
500
450 2005 2006 2007 2008 2009
FISCAL YEAr
The most recent figures available indicate that average dollar sales per employee is $563,000 in the Alcohol Beverage Industry. the liquor Division average dollar sales per employee was $672,000 in FY’09.
Five Year sales per Full-time position (Ftp) comparisonD
OLL
Ar
S (0
00’s)
8.5%
8.0%
7.5%
7.0%
6.5% 2005 2006 2007 2008 2009
FISCAL YEAr
the ratio of employee compensation to sales dollars improved from 7.9% in 2005 to 7.3% in 20091. This commonly used measure of efficiency is 11.7% nationwide for the retail trade industry, and 13.1% for the retail liquor industry, according to the most recent IRS Corporate Financial Ratios available.
1 Since 2009, the ISLD has opened five state-run stores. This has resulted in a modest increase in the compensation percentage, as these stores ramp-up sales.

Idaho State liquor Division 13 2009 Annual Report
five year CoMparisons
2005 2006 2007 2008 2009FISCAL YEAr
net income increased 43.5% from $32.2 million in 2005 to $46.2 million in 2009.
Five Year Net income comparisonD
OLL
Ar
S (M
illio
ns)
250
225
200
175
150
50
45
40
35
30
25
20
2005 2006 2007 2008 2009FISCAL YEAr
The most recent figures available indicate that average net income per employee is $51,000 in the Alcohol Beverage Industry. the liquor Division’s average net income per employee was $235,000 in FY’09.
Five Year Net income per Full-time position (Ftp) comparison
DO
LLA
rS
(000
’s)
Idaho State liquor Division 14 2009 Annual Report
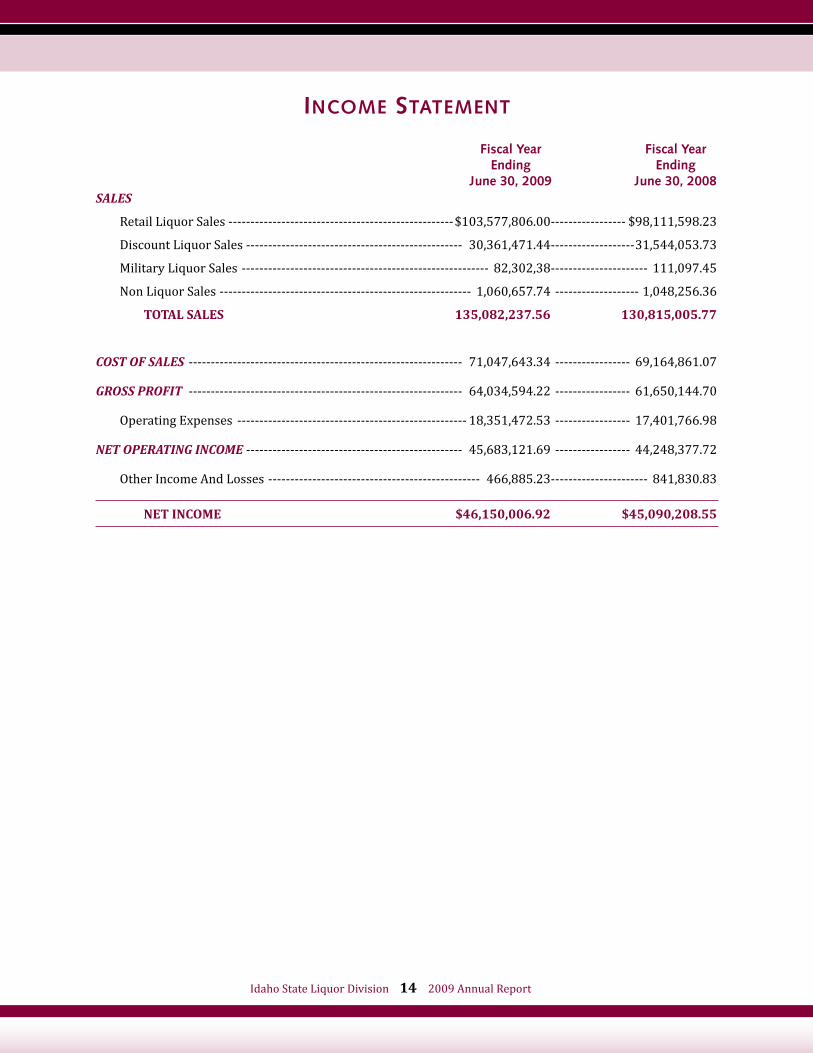
inCoMe sTaTeMenT
Fiscal Year Fiscal Year ending ending June 30, 2009 June 30, 2008SaleS
Retail liquor Sales ---------------------------------------------------$103,577,806.00----------------- $98,111,598.23
Discount liquor Sales ------------------------------------------------- 30,361,471.44-------------------31,544,053.73
Military liquor Sales -------------------------------------------------------- 82,302,38---------------------- 111,097.45
non liquor Sales --------------------------------------------------------- 1,060,657.74 ------------------- 1,048,256.36
ToTal SaleS 135,082,237.56 130,815,005.77
CoSt of SaleS -------------------------------------------------------------- 71,047,643.34 ----------------- 69,164,861.07
GroSS Profit -------------------------------------------------------------- 64,034,594.22 ----------------- 61,650,144.70
operating expenses ---------------------------------------------------- 18,351,472.53 ----------------- 17,401,766.98
Net oPeratiNG iNCome ------------------------------------------------- 45,683,121.69 ----------------- 44,248,377.72
other Income And losses ------------------------------------------------ 466,885.23---------------------- 841,830.83
NeT INcome $46,150,006.92 $45,090,208.55
Idaho State liquor Division 15 2009 Annual Report
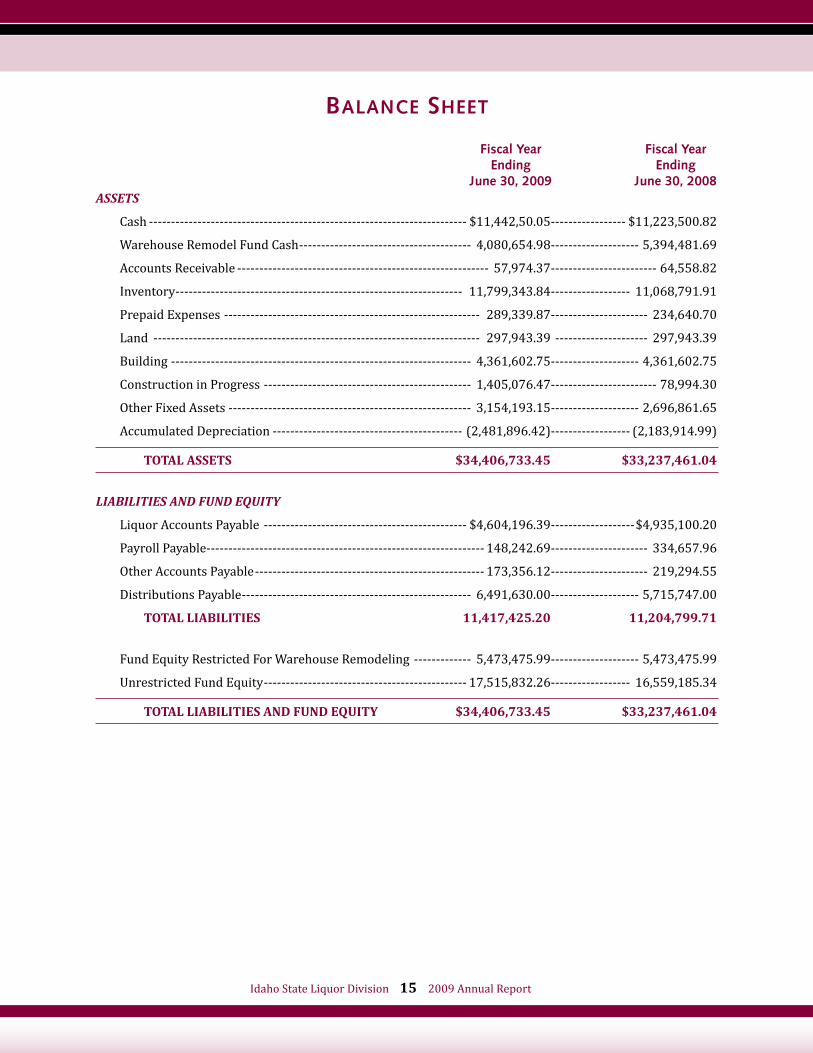
balanCe sHeeT
Fiscal Year Fiscal Year ending ending June 30, 2009 June 30, 2008aSSetS
Cash ------------------------------------------------------------------------ $11,442,50.05----------------- $11,223,500.82
Warehouse Remodel Fund Cash --------------------------------------- 4,080,654.98-------------------- 5,394,481.69
Accounts Receivable --------------------------------------------------------- 57,974.37------------------------ 64,558.82
Inventory ----------------------------------------------------------------- 11,799,343.84------------------ 11,068,791.91
prepaid expenses ---------------------------------------------------------- 289,339.87---------------------- 234,640.70
land -------------------------------------------------------------------------- 297,943.39 --------------------- 297,943.39
Building -------------------------------------------------------------------- 4,361,602.75-------------------- 4,361,602.75
Construction in progress ----------------------------------------------- 1,405,076.47------------------------ 78,994.30
other Fixed Assets ------------------------------------------------------- 3,154,193.15-------------------- 2,696,861.65
Accumulated Depreciation ------------------------------------------- (2,481,896.42)------------------ (2,183,914.99)
ToTal aSSeTS $34,406,733.45 $33,237,461.04
liabilitieS aNd fuNd equity
Liquor Accounts Payable ---------------------------------------------- $4,604,196.39-------------------$4,935,100.20
Payroll Payable--------------------------------------------------------------- 148,242.69---------------------- 334,657.96
Other Accounts Payable ---------------------------------------------------- 173,356.12---------------------- 219,294.55
Distributions Payable ---------------------------------------------------- 6,491,630.00-------------------- 5,715,747.00
ToTal lIabIlITIeS 11,417,425.20 11,204,799.71
Fund equity Restricted For Warehouse Remodeling ------------- 5,473,475.99-------------------- 5,473,475.99
unrestricted Fund equity ---------------------------------------------- 17,515,832.26------------------ 16,559,185.34
ToTal lIabIlITIeS aNd FuNd equITy $34,406,733.45 $33,237,461.04

Idaho State liquor Division 16 2009 Annual Report
sTaTeMenT of CHanges in funD equiTy
Fiscal Year Fiscal Year ending ending June 30, 2009 June 30, 2008
uNreSTrIcTed FuNd equITy aT begINNINg oF year $16,559,185.34 $13,106,645.78
additioNS
net Income -------------------------------------------------------------- 46,150,006.92------------------ 45,090,208.55
ToTal addITIoNS 46,150,006.92 45,090,208.55
traNSferS
transfer to Warehouse Remodel Fund ---------------------------------------------- 0------------------ (3,245,400.00)
transfer From Warehouse Remodel Fund to Fixed Assets --------------------- 0-------------------- 1,771,924.01
ToTal TraNSFerS (1,473,475.99)
diStributioNS
Cities ---------------------------------------------------------------------(16,419,600.00)---------------- (14,637,600.00)
Counties ---------------------------------------------------------------- (10,946,400.00)------------------ (9,758,400.00)
General Fund ------------------------------------------------------------ (9,594,000.00)------------------ (7,914,000.00)
Welfare Fund -------------------------------------------------------------- (650,000.00)-------------------- (650,000.00)
Substance Abuse Treatment Fund ---------------------------------- (2,080,000.00)------------------ (2,080,000.00)
Public Schools ----------------------------------------------------------- (1,200,000.00)------------------ (1,200,000.00)
Community Colleges ----------------------------------------------------- (600,000.00)-------------------- (300,000.00)
Drug Court, Mental Health Court, Family Court Services Fund ------------------------------------------ (2,583,360.00)------------------ (2,504,193.00)
Court Services ------------------------------------------------------------ (680,000.00)-------------------- (680,000.00)
Court Supervision Fund ------------------------------------------------- (440,000.00)-------------------- (440,000.00)
ToTal dISTrIbuTIoNS (45,193,360.00) (40,164,193.00)
uNreSTrIcTed FuNd equITy aT eNd oF year $17,515,832.26 $16,559,185.34

Idaho State liquor Division 17 2009 Annual Report
operaTing expenses
Fiscal Year Fiscal Year ending ending June 30, 2009 June 30, 2008
Salaries And Wages----------------------------------------------------------- $6,969,526.98 ----------------- $6,722,196.84
Employee Benefits ------------------------------------------------------------- 2,940,704.39 ------------------- 2,660,187.09
Special Distributor Commissions --------------------------------------------2,450,946.00 ------------------- 2,358,813.00
Rent --------------------------------------------------------------------------------2,746,244.71 ------------------- 2,454,658.21
Bank Card Fees -------------------------------------------------------------------- 924,216.25 ----------------------718,056.20
Store Furnishings, Fixtures, And Supplies ----------------------------------- 403,220.03 ----------------------528,497.57
utilities ----------------------------------------------------------------------------- 431,225.36 ----------------------388,520.15
leasehold Repairs And Maintenance ---------------------------------------- 212,644.29---------------------- 258,175.70
other Services --------------------------------------------------------------------- 210,660.92 ----------------------225,762.58
Communications ------------------------------------------------------------------ 198,022.76 ----------------------196,275.32
Computer Software, Development, And Maintenance --------------------- 49,756.61 ----------------------145,429.18
travel -------------------------------------------------------------------------------- 97,819.52---------------------- 129,045.07
State Government overhead -------------------------------------------------- 138,756.58 ----------------------123,427.19
employee Development Services ------------------------------------------------32,271.37 ----------------------- 62,386.36
Repairs And Maintenance ---------------------------------------------------------45,867.44 ----------------------- 38,809.80
Insurance -----------------------------------------------------------------------------46,964.28 ----------------------- 37,985.46
professional Services --------------------------------------------------------------15,800.00 ----------------------- 15,000.00
Miscellaneous expense ------------------------------------------------------------13,193.46 ----------------------- 10,591.90
Depreciation ---------------------------------------------------------------------- 423,631.58 ----------------------327,949.36
ToTal operaTINg expeNSeS --------------------------------- $18,351,472.53 -------------- $17,401,766.98

Idaho State liquor Division 18 2009 Annual Report
sCHeDule of CoMparaTive sales & DisTribuTion of profiTs by CiTy/CounTy
sales DistriBUtioNs
Fiscal Year Fiscal Year Fiscal Year Fiscal Year ending ending ending ending June 30, 2009 June 30, 2008 June 30, 2009 June 30, 2008
ada CouNty $3,131,906.00 $2,822,455.00 Boise $26,290,058.42 $26,510,983.16 3,031,534.00 2,746,127.00 eagle 3,758,943.88 3,257,025.18 369,992.00 330,560.00 Garden City 1,876,443.53 1,851,759.89 213,246.00 204,318.00 Kuna 1,083,916.62 974,943.98 109,582.00 103,019.00 Meridian 4,521,066.47 4,512,897.22 505,079.00 446,173.00 Star 476,026.22 490,939.51 55,060.00 45,913.00 ToTal 38,006,455.14 37,598,548.94 7,416,399.00 6,698,565.00
adamS CouNty 38,576.00 35,501.00 Council 212,377.79 215,221.65 24,348.00 21,511.00 new Meadows 234,910.11 247,756.65 28,451.00 27,170.00 ToTal 447,287.90 462,978.30 91,375.00 84,182.00
baNNoCK CouNty 534,297.00 467,103.00 Arimo — — 9,225.00 8,085.00 Chubbuck 1,264,938.47 1,078,355.71 124,927.00 108,050.00 Downey 56,339.64 44,986.45 16,342.00 14,544.00 Inkom — — 20,125.00 17,577.00 lava Hot Springs 229,925.03 227,601.38 26,110.00 24,085.00 McCammon — — 23,361.00 20,349.00 pocatello 5,178,167.76 5,035,418.79 575,426.00 504,489.00 ToTal 6,729,370.90 6,386,362.33 1,329,813.00 1,164,282.00
bear laKe CouNty 32,731.00 29,489.00 Bloomington — — 6,587.00 6,174.00 Fish Haven 123,029.98 115,441.75 — — Georgetown — — 13,784.00 12,974.00 Montpelier 312,495.12 283,840.47 32,804.00 29,196.00 paris — — 14,516.00 13,584.00 St. Charles — — 3,850.00 3,625.00 ToTal 435,525.10 399,282.22 104,272.00 95,042.00
beNeWaH CouNty 92,563.00 92,990.00 Fernwood 92,020.67 82,604.50 — — plummer 352,635.72 313,640.77 36,934.00 47,896.00 St. Maries 760,837.99 699,845.50 80,057.00 70,483.00 tensed — — 3,638.00 3,311.00 ToTal 1,205,494.38 1,096,090.77 213,192.00 214,680.00
biNGHam CouNty 108,807.00 98,891.00 Aberdeen — — 51,387.00 47,300.00 Atomic City — — 728.00 653.00 Basalt — — 12,182.00 11,142.00 Blackfoot 1,262,220.68 1,202,056.44 136,938.00 115,551.00 Firth — — 13,976.00 10,861.00 Shelley 195,392.49 188,743.72 30,596.00 30,596.00 ToTal 1,457,613.17 1,390,800.16 354,614.00 314,994.00

Idaho State liquor Division 19 2009 Annual Report
sCHeDule of CoMparaTive sales & DisTribuTion of profiTs by CiTy/CounTy
sales DistriBUtioNs
Fiscal Year Fiscal Year Fiscal Year Fiscal Year ending ending ending ending June 30, 2009 June 30, 2008 June 30, 2009 June 30, 2008
blaiNe CouNty $412,997.00 $386,433.00 Bellevue $723,251.31 $726,373.07 83,075.00 75,608.00 Carey 45,619.46 39,661.19 4,376.00 4,632.00 Hailey 1,394,467.25 1,377,949.76 159,196.00 145,738.00 Ketchum 2,517,195.79 2,646,314.41 308,295.00 296,232.00 Sun Valley 68,793.32 87,778.68 9,913.00 8,403.00 ToTal 4,749,327.13 4,878,077.11 977,852.00 917,046.00
boiSe CouNty 54,144.00 50,491.00 Crouch 309,340.84 286,864.82 32,659.00 29,828.00 Horseshoe Bend 184,423.24 180,481.35 20,491.00 18,866.00 Idaho City 169,171.90 156,465.40 17,734.00 17,567.00 lowman 32,014.89 27,752.17 — — placerville — — 1,695.00 1,568.00 ToTal 694,950.87 651,563.74 126,723.00 118,320.00
boNNer CouNty 537,107.00 489,041.00 Clark Fork 337,842.08 297,672.14 33,793.00 27,187.00 Coolin 151,273.75 144,388.36 — — Dover — — 14,713.00 12,414.00 east Hope — — 6,323.00 5,692.00 Hope — — 2,494.00 2,260.00 Kootenai — — 13,764.00 11,786.00 oldtown 1,175,887.17 1,079,268.75 121,925.00 106,958.00 ponderay 1,054,350.06 976,805.39 111,908.00 103,616.00 priest River 889,019.03 862,046.39 98,808.00 92,627.00 Sandpoint 2,636,606.85 2,674,958.79 306,156.00 284,234.00 Schweitzer 17,510.99 22,508.72 — — Tamrak/Priest Lake 392,114.80 372,412.54 — — ToTal 6,654,604.73 6,430,061.08 1,246,991.00 1,135,815.00
boNNeVille CouNty 582,680.00 505,873.00 Ammon 1,087,892.70 — 364,086.00 305,992.00 Idaho Falls 5,871,312.91 6,705,215.73 766,248.00 665,556.00 Iona — — 37,311.00 33,177.00 Irwin/Palisades 161,346.07 153,992.59 7,474.00 4,075.00 Ririe 153,038.79 124,920.86 14,232.00 13,374.00 Swan Valley — — 6,911.00 6,097.00 ucon — — 30,905.00 27,592.00 ToTal 7,273,590.47 6,984,129.18 1,809,847.00 1,561,736.00
bouNdary CouNty 73,086.00 65,387.00 Bonners Ferry 899,373.36 870,553.09 100,002.00 89,669.00 Moyie Springs — — 20,928.00 18,901.00 ToTal 899,373.36 870,553.09 194,016.00 173,957.00
butte CouNty 18,391.00 18,391.00 Arco 218,409.97 199,406.76 23,349.00 21,253.00 Butte City — — 2,107.00 1,915.00 Howe — — — — Moore — — 5,439.00 4,928.00 ToTal 218,409.97 199,406.76 49,286.00 46,487.00

Idaho State liquor Division 20 2009 Annual Report
sales DistriBUtioNs
Fiscal Year Fiscal Year Fiscal Year Fiscal Year ending ending ending ending June 30, 2009 June 30, 2008 June 30, 2009 June 30, 2008
CamaS CouNty $11,195.00 $11,195.00 Fairfield $95,879.10 $98,886.69 11,548.00 10,031.00 ToTal 95,879.10 98,886.69 22,743.00 21,226.00
CaNyoN CouNty 667,505.00 573,657.00 Caldwell 2,295,632.61 2,386,519.88 267,607.00 238,261.00 Greenleaf — — 25,743.00 23,322.00 Melba — — 15,219.00 13,658.00 Middleton 561,421.91 569,722.32 65,419.00 64,848.00 nampa 5,353,618.99 4,906,937.26 555,506.00 461,911.00 notus — — 17,303.00 14,219.00 parma 194,519.86 193,142.30 22,357.00 20,025.00 Wilder — — 41,861.00 37,978.00 ToTal 8,405,193.37 8,056,321.76 1,678,520.00 1,447,879.00
Caribou CouNty 38,469.00 33,610.00 Bancroft — — 10,167.00 9,268.00 Grace 76,140.33 69,634.63 8,109.00 8,109.00 Soda Springs 389,263.89 388,068.74 45,090.00 39,783.00 ToTal 465,404.22 457,703.37 101,835.00 90,770.00
CaSSia CouNty 87,881.00 69,845.00 Albion 70,240.68 59,435.27 6,886.00 5,176.00 Declo — — 9,466.00 8,660.00 Malta — — 4,967.00 4,552.00 oakley — — 20,211.00 18,503.00 Burley 980,594.72 1,001,709.28 115,036.00 92,091.00 ToTal 1,050,835.40 1,061,144.55 244,447.00 198,827.00
ClarK CouNty 11,475.00 11,475.00 Dubois 23,205.61 29,109.76 3,945.00 3,945.00 Spencer — — 969.00 894.00 ToTal 23,205.61 29,109.76 16,389.00 16,314.00
ClearWater CouNty 69,489.00 60,338.00 elk River 56,802.90 49,692.43 5,300.00 4,729.00 Orofino 674,884.34 642,195.18 73,477.00 64,157.00 pierce 69,695.75 60,027.37 8,208.00 8,208.00 Weippe 79,381.73 82,068.33 9,167.00 7,349.00 ToTal 880,764.72 833,983.31 165,641.00 144,781.00
CuSter CouNty 56,450.00 48,050.00 Challis 334,865.70 287,155.45 32,540.00 25,644.00 Clayton 38,911.07 47,333.62 5,492.00 4,350.00 Mackay 107,291.03 113,624.47 12,806.00 11,843.00 Stanley 229,093.88 228,788.94 26,416.00 24,072.00 ToTal 710,161.68 676,902.48 133,704.00 113,959.00
sCHeDule of CoMparaTive sales & DisTribuTion of profiTs by CiTy/CounTy

Idaho State liquor Division 21 2009 Annual Report
sCHeDule of CoMparaTive sales & DisTribuTion of profiTs by CiTy/CounTy
sales DistriBUtioNs
Fiscal Year Fiscal Year Fiscal Year Fiscal Year ending ending ending ending June 30, 2009 June 30, 2008 June 30, 2009 June 30, 2008
elmore CouNty $145,824.00 $126,026.00 Glenns Ferry $162,051.27 $161,123.56 18,955.00 18,122.00 Mountain Home AFB 49,929.35 84,688.75 — — Mountain Home 1,372,814.12 1,397,993.26 159,366.00 135,772.00 pine 95,602.43 91,593.74 — — prairie 11,372.92 11,519.76 — — ToTal 1,691,770.09 1,746,919.07 324,145.00 279,920.00
fraNKliN CouNty 30,760.00 30,760.00 Clifton — — 6,790.00 6,087.00 Dayton — — 12,818.00 11,903.00 Franklin — — 19,118.00 17,502.00 oxford — — 1,517.00 1,408.00 preston 385,062.92 357,209.61 41,340.00 37,431.00 Weston — — 12,583.00 11,620.00 ToTal 385,062.92 357,209.61 124,926.00 116,711.00
fremoNt CouNty 66,324.00 60,854.00 Ashton 150,049.67 126,991.80 14,839.00 13,945.00 Drummond — — 436.00 391.00 Island park 331,852.27 322,505.59 37,359.00 35,689.00 newdale — — 10,316.00 9,276.00 parker — — 9,258.00 8,326.00 St. Anthony 373,554.60 334,520.08 38,561.00 33,762.00 teton — — 16,573.00 14,766.00 Warm River — — 291.00 261.00 ToTal 855,456.54 784,017.47 193,957.00 177,270.00
Gem CouNty 64,704.00 55,156.00 emmett 824,076.00 778,310.68 88,615.00 75,631.00 ToTal 824,076.00 778,310.68 153,319.00 130,787.00
GoodiNG CouNty 73,821.00 63,832.00 Bliss 87,141.29 100,174.99 11,585.00 11,701.00 Gooding 389,412.65 362,814.03 41,031.00 32,582.00 Hagerman 220,915.21 188,317.78 21,459.00 17,429.00 Wendell 226,850.15 229,962.07 26,762.00 25,593.00 ToTal 924,319.30 881,268.87 174,658.00 151,137.00
idaHo CouNty 101,294.00 90,920.00 Cottonwood 131,077.26 137,779.53 15,958.00 15,606.00 elk City 75,591.70 61,656.26 — — Ferdinand — — 4,175.00 3,841.00 Grangeville 474,531.63 444,912.77 51,026.00 45,515.00 Kooskia 189,036.73 175,359.19 20,166.00 17,662.00 Riggins 293,164.55 305,203.32 35,059.00 31,746.00 Stites — — 6,520.00 5,991.00 Whitebird 86,486.84 79,607.19 9,275.00 7,811.00 ToTal 1,249,888.71 1,204,518.26 243,473.00 219,092.00
Idaho State liquor Division 22 2009 Annual Report
sCHeDule of CoMparaTive sales & DisTribuTion of profiTs by CiTy/CounTy
sales DistriBUtioNs
Fiscal Year Fiscal Year Fiscal Year Fiscal Year ending ending ending ending June 30, 2009 June 30, 2008 June 30, 2009 June 30, 2008
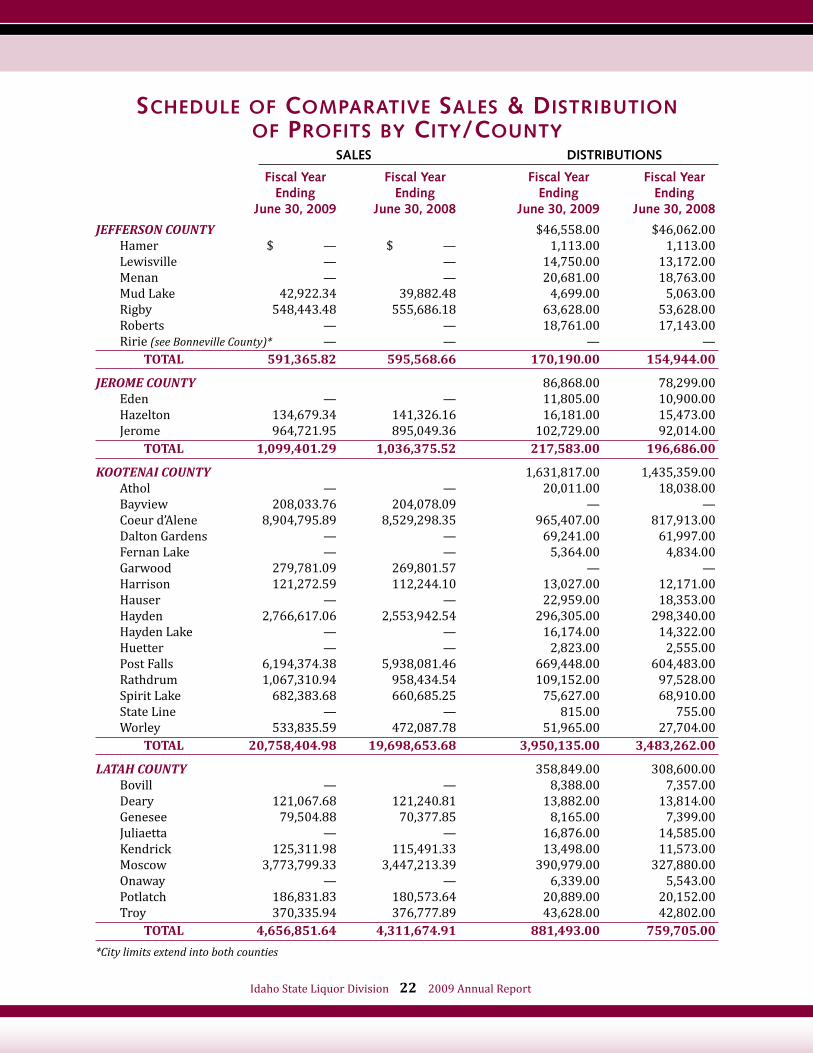
JefferSoN CouNty $46,558.00 $46,062.00 Hamer $ — $ — 1,113.00 1,113.00 lewisville — — 14,750.00 13,172.00 Menan — — 20,681.00 18,763.00 Mud lake 42,922.34 39,882.48 4,699.00 5,063.00 Rigby 548,443.48 555,686.18 63,628.00 53,628.00 Roberts — — 18,761.00 17,143.00 Ririe (see Bonneville County)* — — — — ToTal 591,365.82 595,568.66 170,190.00 154,944.00
Jerome CouNty 86,868.00 78,299.00 eden — — 11,805.00 10,900.00 Hazelton 134,679.34 141,326.16 16,181.00 15,473.00 Jerome 964,721.95 895,049.36 102,729.00 92,014.00 ToTal 1,099,401.29 1,036,375.52 217,583.00 196,686.00
KooteNai CouNty 1,631,817.00 1,435,359.00 Athol — — 20,011.00 18,038.00 Bayview 208,033.76 204,078.09 — — Coeur d’Alene 8,904,795.89 8,529,298.35 965,407.00 817,913.00 Dalton Gardens — — 69,241.00 61,997.00 Fernan lake — — 5,364.00 4,834.00 Garwood 279,781.09 269,801.57 — — Harrison 121,272.59 112,244.10 13,027.00 12,171.00 Hauser — — 22,959.00 18,353.00 Hayden 2,766,617.06 2,553,942.54 296,305.00 298,340.00 Hayden lake — — 16,174.00 14,322.00 Huetter — — 2,823.00 2,555.00 post Falls 6,194,374.38 5,938,081.46 669,448.00 604,483.00 Rathdrum 1,067,310.94 958,434.54 109,152.00 97,528.00 Spirit lake 682,383.68 660,685.25 75,627.00 68,910.00 State line — — 815.00 755.00 Worley 533,835.59 472,087.78 51,965.00 27,704.00 ToTal 20,758,404.98 19,698,653.68 3,950,135.00 3,483,262.00
lataH CouNty 358,849.00 308,600.00 Bovill — — 8,388.00 7,357.00 Deary 121,067.68 121,240.81 13,882.00 13,814.00 Genesee 79,504.88 70,377.85 8,165.00 7,399.00 Juliaetta — — 16,876.00 14,585.00 Kendrick 125,311.98 115,491.33 13,498.00 11,573.00 Moscow 3,773,799.33 3,447,213.39 390,979.00 327,880.00 onaway — — 6,339.00 5,543.00 potlatch 186,831.83 180,573.64 20,889.00 20,152.00 troy 370,335.94 376,777.89 43,628.00 42,802.00 ToTal 4,656,851.64 4,311,674.91 881,493.00 759,705.00
*City limits extend into both counties

Idaho State liquor Division 23 2009 Annual Report
sCHeDule of CoMparaTive sales & DisTribuTion of profiTs by CiTy/CounTy
sales DistriBUtioNs
Fiscal Year Fiscal Year Fiscal Year Fiscal Year ending ending ending ending June 30, 2009 June 30, 2008 June 30, 2009 June 30, 2008
lemHi CouNty $82,807.00 $77,298.00 leadore $20,770.79 $15,236.80 1,788.00 2,032.00 north Fork 58,854.82 49,903.08 — — Salmon 964,353.91 919,873.52 105,753.00 98,723.00 ToTal 1,043,979.52 985,013.40 190,348.00 178,053.00
leWiS CouNty 44,965.00 42,127.00 Craigmont 59,536.02 58,740.33 6,800.00 6,116.00 Kamiah 373,237.34 367,471.65 41,988.00 39,558.00 nez perce 76,352.49 78,820.21 8,858.00 7,972.00 Reubens — — 2,040.00 1,902.00 Winchester 34,252.31 32,765.17 3,905.00 4,144.00 ToTal 543,378.16 537,797.36 108,556.00 101,819.00
liNColN CouNty 19,113.00 18,877.00 Dietrich — — 4,649.00 4,240.00 Richfield — — 12,205.00 11,209.00 Shoshone 222,647.27 228,822.27 26,760.00 25,684.00 ToTal — — 35,967.00 34,326.00
madiSoN CouNty 55,299.00 55,299.00 Rexburg 260,753.78 247,734.23 74,914.00 74,914.00 Sugar City — — 43,649.00 37,562.00 ToTal 260,753.78 247,734.23 173,862.00 167,775.00
miNidoKa CouNty 57,782.00 57,782.00 Acequia — — 3,858.00 3,533.00 Heyburn — — 78,596.00 72,355.00 Minidoka — — 3,447.00 3,164.00 paul 126,282.94 119,857.78 14,096.00 13,954.00 Rupert 494,292.99 486,228.63 54,065.00 46,139.00 Burley (see Cassia County)* — — — — ToTal 620,575.93 606,086.41 211,844.00 196,927.00
NeZ PerCe CouNty 412,286.00 365,147.00 Culdesac 51,300.00 56,411.62 6,782.00 9,782.00 lapwai — — 32,707.00 29,159.00 lewiston 5,126,103.02 4,884,602.67 558,451.00 500,848.00 peck — — 5,383.00 4,803.00 ToTal 5,177,403.02 4,941,014.29 1,015,609.00 909,739.00
oNeida CouNty 17,698.00 17,698.00 Malad 222,865.35 203,492.13 23,661.00 21,071.00 ToTal 222,865.35 203,492.13 41,359.00 38,769.00
oWyHee CouNty 53,814.00 46,805.00 Bruneau 61,625.83 59,985.73 — — Grand View 63,748.44 64,952.63 7,400.00 6,085.00 Homedale 251,929.85 245,446.98 27,626.00 23,502.00 Marsing 277,086.59 280,512.30 31,769.00 28,549.00 ToTal 654,390.71 650,897.64 120,609.00 104,941.00 *City limits extend into both counties

Idaho State liquor Division 24 2009 Annual Report
sCHeDule of CoMparaTive sales & DisTribuTion of profiTs by CiTy/CounTy
sales DistriBUtioNs
Fiscal Year Fiscal Year Fiscal Year Fiscal Year ending ending ending ending June 30, 2009 June 30, 2008 June 30, 2009 June 30, 2008
Payette CouNty $89,616.00 $77,460.00 Fruitland $ — $ — 132,879.00 116,522.00 new plymouth 332,472.27 297,444.00 33,109.00 28,776.00 payette 865,686.30 779,635.44 89,596.00 77,435.00 ToTal 1,198,158.57 1,077,079.44 345,200.00 300,193.00
PoWer CouNty 28,526.00 26,230.00 American Falls 352,193.96 348,304.58 40,300.00 37,162.00 Rockland — — 9,178.00 8,564.00 ToTal 352,193.96 348,304.58 78,004.00 71,956.00
SHoSHoNe CouNty 125,608.00 110,713.00 Kellogg 674,382.97 654,758.85 75,126.00 68,437.00 Mullan — — 22,031.00 20,653.00 Osburn — — 40,719.00 38,117.00 pinehurst 386,162.65 385,593.80 44,091.00 38,327.00 Smelterville — — 17,464.00 16,146.00 Wallace 455,642.91 458,996.71 52,684.00 45,018.00 Wardner — — 5,745.00 5,297.00 ToTal 1,738,835.80 1,728,171.63 410,228.00 368,392.00
tetoN CouNty 91,178.00 74,745.00 Driggs 733,416.24 711,025.57 83,306.00 69,011.00 tetonia — — 6,901.00 6,363.00 Victor 344,440.63 389,945.34 43,681.00 35,781.00 ToTal 1,077,856.87 1,100,970.91 225,066.00 185,900.00
tWiN fallS CouNty 436,307.00 369,960.00 Buhl 453,654.03 470,352.43 53,459.00 46,857.00 Castleford 60,849.42 50,088.72 5,773.00 5,260.00 Filer 175,973.21 164,250.82 18,974.00 17,864.00 Hansen — — 27,958.00 25,098.00 Hollister 38,538.78 34,289.37 3,819.00 2,783.00 Kimberly 274,605.69 241,342.42 27,492.00 23,705.00 Murtaugh — — 4,182.00 3,653.00 twin Falls 4,623,438.38 4,284,783.83 487,901.00 411,959.00 ToTal 5,627,059.51 5,245,107.59 1,065,865.00 907,139.00
Valley CouNty 210,353.00 204,628.00 Cascade 377,087.58 397,055.77 44,967.00 43,271.00 Donnelly 348,645.26 404,430.92 44,980.00 48,782.00 McCall 1,689,864.26 1,720,436.23 196,485.00 187,475.00 Yellow pine 15,004.77 12,717.63 — — ToTal 2,430,601.87 2,534,640.55 496,785.00 484,156.00
WaSHiNGtoN CouNty 54,480.00 47,548.00 Cambridge 118,473.17 108,674.61 12,428.00 11,152.00 Midvale — — 6,074.00 4,791.00 Weiser 575,666.83 543,598.67 62,178.00 54,048.00 ToTal 694,140.00 652,273.28 135,160.00 117,539.00
FIScal year ToTalS $135,082,237.56 $130,815,005.77 $27,366,000.00 $24,396,000.00

Order picker is using pick to voice technology at the single bottle repack area. The single bottle repack enables ISLD to ship expensive or low volume products to stores in less than full case quantities. Order picker receives picking instructions and sends back picking confirmations using wireless technology.
Case pre-printed bar code being scanned for data maintenance.
Wireless portable computer used to send and receive picking instruction from host computer and used to transmit picked orders back to host computer. Each order picker is assigned a portable computer and wireless headset microphone.
Single bottle repack area, showing powered take-away conveyor and empty box monorail overhead. As orders are completed, central area of powered conveyor takes cases from 2nd floor mezzanine to main DC floor to be added to orders containing full cases.
Order picker using pick-to-voice technology, which provides wireless, 2-way communication between portable computer and host computer. Picking instructions and picking confirmations are communicated.

2009 AnnuAl RepoRt