2009 annual report - annualreports.com€¦ · management’s discussion and analysis of financial...
TRANSCRIPT

2 0 0 9 A N N U A L R E P O R T

Contents
Letter to the Shareholders 1
Product Spotlight 4
Market for CONMED’s Common Stock and Related Stockholder Matters 6
Five Year Summary of Selected Financial Data 6
Management’s Discussion and Analysis of Financial Condition and Results of Operations 7
Management’s Report on Internal Control Over Financial Reporting 17
Report of Independent Registered Public Accounting Firm 18
Consolidated Balance Sheets 19
Consolidated Statements of Operations 20
Consolidated Statements of Shareholders’ Equity 21
Consolidated Statements of Cash Flows 22
Notes to Consolidated Financial Statement 23
Board of Directors 38
Officers 39
Shareholder Information, Subsidiaries 40

A N N U A L R E P O R T 2 0 0 9 1
J o s e p h J. C o r a s a n t iPresident, Chief Executive Officer
To My Fellow Shareholders:
At the beginning of the year 2009, CONMED Corporation,
along with businesses in virtually every industry, faced
economic challenges that we have not seen for several
decades. Credit markets seized up, limiting access to capital.
Businesses saw declines in demand, as customers postponed
discretionary purchases and took other steps to conserve cash.
Although the markets for medical devices are typically
insulated from cyclical economic shifts, the swings we
encountered in 2009 were unprecedented. Even we were
affected, as hospitals delayed or cancelled the purchases of
capital items. As capital equipment accounts for 25% of our
revenues, this had a significant impact on our performance.
This reduced demand was also reflected to some degree in
the demand for disposables, although the impact there was
not as severe. While some elective procedures were canceled
or delayed, hospitals and surgeons continued to perform
necessary and sometimes life-saving surgeries. We have not
seen such declines in the demand for our products before,
nor do we think that anyone in the industry anticipated
these developments.
In the face of these challenging macro-economic trends, the
reduced demand for capital purchases and the reduced rate
of procedures, CONMED performed relatively well.
We continued to provide our customers with a reliable supply
of a broad range of products necessary for these life-saving
surgeries. In fact, we did more than this: we worked hard
throughout the year to focus on financial goals, operational
goals, new product development and cost reductions.
Our financial performance was as follows:
• Sales declined 6.4% compared to 2008 revenues.
In constant currency, the decline was a modest 3.7%.
In other words, while some of the decline was due to
reductions in purchases, a significant portion of the
decline was attributable to unfavorable foreign currency
exchange fluctuations. On a more positive note, we do
not believe that the reduced revenue reflected a decline in
market share.
• Sales outside the United States continued to increase as a
percentage of overall sales, growing to 44.7% of sales for
the entire year.
• GAAP diluted earnings per share for 2009 were $0.42
compared to $1.37 in 2008.
• Non-GAAP diluted earnings per share for 2009 were $1.00
compared to 2008 non-GAAP EPS of $1.54. As noted
above, a significant portion of this was currency-related.
• Cash from operations continued to be strong. For the year,
cash provided by operating activities was $25.0 million,
more than twice the Company’s net income.
Our Strategy
The strategy we have followed has served the Company
well, as our sales, net income and shareholder equity
have increased fairly steadily over the years. We made
some adjustments during 2009 as a result of the
economic challenges we faced, but otherwise adhered to
the same principles that brought us to where we are today.
March 2010

2
C O N M E D C O R P O R AT I O N
C O N M E D C o r p o r a t i o nCorporate Headquarters: French Road, Utica, NY
The final aspect of our growth strategy is acquisitions.
During 2009, we were unable to locate an acquisition target
on acceptable terms, but we are always looking. And, given
the strength of our balance sheet, we are well positioned to
take advantage of the right opportunities if and when they
present themselves.
2.IncreaseProfitabilityByMonitoringand
ReducingExpenses
In addition to our focus on the top line, we also are looking
to increase our profit margins. During 2009, we pursued
margin expansion through increased efficiencies and cost
reductions. We continue to pursue lean manufacturing
techniques to reduce costs and improve our manufacturing
operations. We have also completed the operating
restructuring plan we announced over a year ago, and
shifted several product lines from Central New York
facilities to our low-cost manufacturing facility in Mexico.
Administratively, we closed an office associated with the
Endoscopic Technologies division and merged those
activities with the functions of our corporate headquarters.
We also took the difficult step of freezing our defined benefit
pension plan. This was not an easy decision, as we truly
value our employees, whose service to the Company is
often measured in decades rather than in years or months.
But our employees recognized the need, and accepted the
decision with remarkable understanding. They know that
we all work for the shareholders, and we are determined to
increase shareholder value over the long term.
1.GrowtheTopLine
We have been focused on growing the top line for several
years, and our strategy has four components. First,
we continue to provide our customers and our sales
representatives with a steady stream of new and innovative
products. During 2009, we introduced several new
products, including the Shoulder Restoration System
(“SRS”). The SRS includes state-of-the art suture
anchors such as the PopLok™ Knotless Suture Anchor,
the CrossFT™ Fully Threaded Suture Anchor composed
of PEEK-OPTIMA® polymer technology, from Invibio®
Biomaterial Solutions, and the Super Revo®-FT and
ThRevo®-FT Fully Threaded Suture Anchors. The
combination of these implants and instruments offers a
comprehensive, versatile and easy-to-use solution for rotator
cuff repair, providing surgeons the ability to perform both
single-row and double-row fixation procedures.
Second, we are constantly looking for ways to better leverage
the skills of our sales professionals. We continue to provide
them with the best training on our products and the clinical
challenges our customers face. We add sales representatives
when we can do so responsibly.
Third, we continue to drive growth in the demand for our
products through surgeon education. Put simply, the more
our customers, or potential customers, know about our
products and how they address surgical challenges, the more
they like them.

A N N U A L R E P O R T 2 0 0 9 3
Joseph J. Corasanti
President, Chief Executive Officer
Outlook
The change in the economic climate during the last year
was remarkable, but the demand for our products began
to return to what used to be more normal levels during the
final six months of 2009. We have learned that we cannot
be overly confident about what the markets hold in store for
us, but we are confident that we remain well-positioned for
long-term growth. Our product offering meets the needs of
our hospital customers, and our team of managers and staff
is as strong as it has ever been. We fully expect to leverage
our existing structure, as we work to grow our sales at a rate
that we expect will far outpace the marginal increases in
costs necessary to achieve these goals.
In conclusion, we are optimistic about CONMED’s long-
term future. We remain committed to improving service
to our customers, and to increasing profitability for the
Company. Our strategy has worked well in the past, and it
served us well during the past year. We look forward to the
future with both determination and confidence.
As always, we thank you for your continued trust and
support.
Sincerely,
Reconciliation of Reported Net Income to Non-GAAP Net Income Before Unusual Items and Amortization of Debt Discount1
(In thousands except per share amounts) (Unaudited)
Twelve months ended December 31, 2008 2009
Reported net income $ 39,989 $ 12,137 _______ _______
Fair value inventory purchase accounting adjustment included in cost of sales 1,011 —
New plant/facility consolidation costs included in cost of sales 2,470 11,859
Endoscopic Technologies division consolidation — 845 _______ _______
Total cost of sales, other 3,481 12,704 _______ _______
Facility consolidation costs included in other expense 1,577 2,726
Endoscopic Technologies division consolidation — 4,080
Product recall — 5,992
Pension gain, net — (1,882) _______ _______
Total other expense 1,577 10,916 _______ _______
Gain on early extinguishment of debt (1,947) (1,083) _______ _______
Amortization of debt discount 4,823 4,111 _______ _______
Total unusual expense before income taxes 7,934 26,648
Provision (benefit) for income taxes on unusual expense (2,902) (9,633) _______ _______
Net income before unusual items $ 45,021 $ 29,152 _______ _______ _______ _______
Per share data:
Reported net income Basic $ 1.39 $ 0.42 Diluted 1.37 0.42
Net income before unusual items and amortization of debt discount Basic $ 1.56 $ 1.00 Diluted 1.54 1.00
1This table is provided to reconcile certain financial disclosures referenced
in the Letter to Shareholders. Management has provided this reconciliation
of net income before unusual items and amortization of debt discount
as an additional measure that investors can use to compare operating
performance between reporting periods. Management believes this
reconciliation provides a useful presentation of operating performance.
H e m o s t a s i s P r o b e sBiCap® Superconductor™ Probe.

4
C O N M E D C O R P O R AT I O N
technology, surgeons may find doing the procedure (less
invasively) with the SRS system provides an opportunity for a
more speedy patient recovery.
In addition, Sports Medicine specialty surgeons across
the country find the SRS line beneficial in treating
younger patients—often college and professional-level
athletes—who are able to return more quickly to their
sport or daily lifestyles.
The Shoulder Restoration System is a comprehensive
system for rotator cuff repair. It supports multiple surgical
techniques, allows for secure reconstruction, and positions the
surgeon to achieve successful clinical outcomes. The SRS
products are easy to use and provide an excellent fixation
strength to ensure a good outcome in the surgical procedure.
SRS products feature PEEK* technology
SRS products feature PEEK-OPTIMA® polymer technology,
from Invibio® Biomaterial Solutions. Several of CONMED
SRS products include state-of-the art instrumentation and
suture anchors, many of which are made from PEEK-
OPTIMA, a specialized polyetheretherketone (PEEK)
polymer. PEEK-OPTIMA was chosen as the material for
this new system because of its superior strength, outstanding
biostability, and its exceptional history of use in other
applications such as spinal fusion, trauma, and total joint
replacement. Additionally, the radiographic qualities of
PEEK-OPTIMA are superior to many materials when using
conventional imaging techniques such as X-ray, MRI and
Computer Tomography (CT).
“ W i t h S R S , w e h a v e s e t a n e w c o u r s e a n d a r e w e l l p l a c e d f o r f u t u r e s u c c e s s . ”
- Joseph Corasanti, CEO CONMED Corporation
Product Spotlight
CONMED Linvatec enhances its sports medicine
line with the Shoulder Restoration System: a new
generation of Sports Medicine products to drive
growth and provide surgeons with a choice in
treatment modalities.
The highly anticipated CONMED Linvatec Shoulder
Restoration System (SRS) was launched in July 2009 at
the American Orthopedic Society for Sports Medicine
(AOSSM) meeting in Keystone, Colorado. In less than a
year, the SRS has been quickly adopted as the treatment of
choice for surgeons performing Rotator Cuff Surgery. The
Florida-based orthopedic division of CONMED is growing
its business and developing new surgeon relationships as
a result of this innovative technology. The new shoulder
products are positioning CONMED as a leader in the field
of arthroscopic Sports Medicine.
This is an exciting time for CONMED because the SRS
products fill a gap in our portfolio and provide a choice
for surgeons in one of the fastest-growing segments of the
sports medicine market—shoulder arthroscopy. According
to CONMED Linvatec President Joe Darling, “People
want to be more
active later in life
than ever before.
This translates into more people—often the Baby Boomer
generation—undergoing shoulder procedures, which require
newer and better products.” Many repairs are still done
in what is called an “open procedure”…. meaning that
the surgery is done in a more invasive way. With our new
*PEEK-OPTIMA and Invibio are registered trademarks of Invibio Ltd. All rights are reserved.

A N N U A L R E P O R T 2 0 0 9 5
PopLok™ Knotless Suture Anchor
PopLok™ is designed for primary and lateral row fixation.
It is a PEEK (Polyetheretherketone) anchor offered in
3.5 and 4.5mm sizes. The PopLok™ is a significant step
forward in knotless technology because it provides for
tensioning sutures separately from anchor seating. PopLok™
is cannulated to channel growth factors to the repair site,
capitalizing on the body’s healing powers to restore rotator
cuff integrity.
CrossFT™ Fully Threaded Suture Anchor
Also composed of PEEK, the CrossFT™ is offered in 4.5,
5.5 and 6.5mm sizes with multiple suture configurations.
Incorporating both a fully-threaded design and a dual-
threaded profile, the CrossFT provides a radiolucent option
with significant fixation strength and security. As with the
PopLok™, the CrossFT™ is cannulated to channel growth
factors to the repair site.
Super Revo®-FT and ThRevo®-FT Fully Threaded
Suture Anchors
The Super Revo®-FT and ThRevo®-FT, both 5.0mm
titanium anchors, are offered with two or three sutures,
respectively. These anchors offer an excellent option for
surgeons who prefer to visualize the anchor after rotator
cuff repair, while capitalizing on the proven Revo® design
for exceptional performance. The self-drilling Revo®
design eliminates a step during the insertion process to save
valuable OR time.
What the Surgeons Say:
“The CONMED Shoulder Restoration System is a simple
and versatile solution to address rotator cuff pathology,”
said Dr. Jeffrey Abrams, a shoulder and sports medicine
specialist with Princeton Orthopaedic Associates, P.A.,
in Princeton, New Jersey. “The SRS allows me to intra-
operatively choose the type of repair most suitable for
the tear pattern and patient demands. All three anchors
in the system, The PopLok™, CrossFT™ and Super
Revo®/ThRevo®-FT, provide exceptional fixation
strength. The Linvatec SRS is a well thought-out system
that is a welcome addition to the CONMED Shoulder
Arthroscopy offering.”
In addition to redefining the suture anchor market with the
products listed above, CONMED has also revolutionized
the instrumentation segment of the market. By focusing
on innovation, a more efficient pilot-hole instrumentation
system has been developed, providing more options
to access and repair shoulder pathology in the rotator
cuff. The patent pending broaching punch, exclusive to
CONMED, simultaneously enhances fixation and reduces
stress fractures to bone.
“We are committed to providing surgeons with
solutions to help them achieve the best results for their
patients,” added Joe Darling. “Our Shoulder Restoration
System is an all-encompassing solution for rotator cuff
procedures, and adds further depth to the growing number
of products in our Shoulder Arthroscopy portfolio.”
D r . J e f f r e y A b r a m s
S R S P r o d u c t s U s e d i n R o t a t o r C u f f S u r g e r y
Princeton Orthopaedic Associates, P.A.
PopLok™ Knotless Suture Anchor CrossFT™ Fully Threaded Suture Anchor Super Revo®-FT and ThRevo®
FT Fully Threaded Suture Anchors

6
C O N M E D C O R P O R AT I O N
(In thousands, except per share data) Years Ended December 31, 2005 2006 2007 2008 2009Statements of Operations Data(2): Net sales $ 617,305 $ 646,812 $ 694,288 $ 742,183 $ 694,739 Income (loss) from operations 63,748 (4,603 ) 80,991 75,259 28,269 Net income (loss) 29,423 (15,233 ) 38,544 39,989 12,137Earnings (Loss) Per Share: Basic $ 1.00 $ (.54 ) $ 1.36 $ 1.39 $ 0.42 Diluted 0.99 (.54 ) 1.33 1.37 0.42Weighted Average Number of Common Shares In Calculating: Basic earnings (loss) per share 29,300 27,966 28,416 28,796 29,074 Diluted earnings (loss) per share 29,736 27,966 28,965 29,227 29,142Other Financial Data: Depreciation and amortization $ 34,863 $ 34,175 $ 36,152 $ 37,159 $ 41,283 Capital expenditures 16,242 21,895 20,910 35,879 21,444Balance Sheet Data (at period end): Cash and cash equivalents $ 3,454 $ 3,831 $ 11,695 $ 11,811 $ 10,098 Total assets 903,783 861,571 893,951 931,661 958,413 Long-term obligations 369,725 329,818 298,383 316,532 302,791 Total shareholders’ equity 471,926 456,548 518,284 540,215 576,515
(1) In May 2008, the FASB issued guidance which specifies that issuers of convertible debt instruments that permit or require the issuer to pay cash upon conversion should separately account for the liability and equity components in a manner that will reflect the entity’s nonconvertible debt borrowing rate when interest cost is recognized in subsequent periods. The Company is required to apply the guidance retrospectively to all past periods presented. We adopted this guidance on January 1, 2009 related to our 2.50% convertible senior subordinated notes due 2024 (“the Notes”). See additional discussion in Note 16 of the Consolidated Financial Statements.
(2) Results of operations of acquired businesses have been recorded in the financial statements since the date of acquisition.
Our common stock, par value $.01 per share, is traded on the NASDAq Stock Market under the symbol “CNMD”. At February 1, 2010, there were 939 registered holders of our common stock and approximately 6,548 accounts held in “street name”.
The following table sets forth quarterly high and low sales prices for the years ended December 31, 2008 and 2009, as reported by the NASDAq Stock Market.
2008 2009 Period High Low High Low ________________________________________________________________________________________________________ First Quarter $ 28.22 $ 21.59 $ 23.99 $ 11.68 Second Quarter 27.22 23.90 16.49 12.31 Third Quarter 32.99 25.02 20.58 15.00 Fourth Quarter 31.74 21.13 23.69 18.35
We did not pay cash dividends on our common stock during 2008 or 2009 and do not currently intend to pay dividends for the foreseeable future. Future decisions as to the payment of dividends will be at the discretion of the Board of Directors, subject to conditions then existing, including our financial requirements and condition and the limitation and payment of cash dividends contained in debt agreements.
Our Board of Directors has authorized a share repurchase program; see Note 7 to the Consolidated Financial Statements.
Information relating to compensation plans under which equity securities of CONMED Corporation are authorized for issuance is set forth below:
Equity Compensation Plan Information
Plan category Number of securities remaining Number of securities Weighted-average exercise price available for future issuance under to be issued upon exercise of outstanding options, equity compensation plans (excluding of outstanding options, warrants and rights securities reflected in column (a)) warrants and rights (a) (b) (c)
Equity compensation plans approved by security holders 2,875,709 $23.70 1,110,643
Equity compensation plans not approved by security holders — — — _________ ________ _________
Total 2,875,709 $23.70 1,110,643 _________ ________ _________ _________ ________ _________
Five Year Summary Of Selected Financial Data (As Adjusted) (1)
Market for CONMED’s Common Stock and Related Stockholder Matters

A N N U A L R E P O R T 2 0 0 9 7
The following discussion should be read in conjunction with the Five Year Summary of Selected Financial Data, and our Consolidated Financial Statements and related notes contained elsewhere in this report.
Overview of CONMED Corporation
CONMED Corporation (“CONMED”, the “Company”, “we” or “us”) is a medical technology company with an emphasis on surgical devices and equipment for minimally invasive procedures and monitoring. The Company’s products serve the clinical areas of arthroscopy, powered surgical instruments, electrosurgery, cardiac monitoring disposables, endosurgery and endoscopic technologies. They are used by surgeons and physicians in a variety of specialties including orthopedics, general surgery, gynecology, neurosurgery, and gastroenterology. These product lines and the percentage of consolidated revenues associated with each, are as follows: 2007 2008 2009Arthroscopy 38% 38% 39%Powered Surgical Instruments 21 21 21Electrosurgery 13 14 14Patient Care 11 11 10Endosurgery 9 9 9Endoscopic Technologies 8 7 7 ______ ______ ______Consolidated Net Sales 100% 100% 100% ______ ______ ______ ______ ______ ______
A significant amount of our products are used in surgical procedures with approximately 75% of our revenues derived from the sale of disposable products. Our capital equipment offerings also facilitate the ongoing sale of related disposable products and accessories, thus providing us with a recurring revenue stream. We manufacture substantially all of our products in facilities located in the United States, Mexico and Finland. We market our products both domestically and internationally directly to customers and through distributors. International sales approximated 42%, 44% and 45% in 2007, 2008 and 2009, respectively.
Business Environment and Opportunities
The aging of the worldwide population along with lifestyle changes, continued cost containment pressures on healthcare systems and the desire of clinicians and administrators to use less invasive (or noninvasive) procedures are important trends which are driving the long-term growth in our industry. We believe that with our broad product offering of high quality surgical and patient care products, we can capitalize on this growth for the benefit of the Company and our shareholders.
In order to further our growth prospects, we have historically used strategic business acquisitions and exclusive distribution relationships to continue to diversify our product offerings, increase our market share and realize economies of scale.
We have a variety of research and development initiatives focused in each of our principal product lines as continued innovation and commercialization of new proprietary products and processes are essential elements of our long-term growth strategy. Our reputation as an innovator is exemplified by recent new product introductions such as the CONMED Linvatec Shoulder Restoration System, a comprehensive system for rotator cuff repair.
Business Challenges
Given significant volatility in the financial markets and foreign currency exchange rates and depressed economic conditions in both domestic and international markets, 2009 presented significant business challenges. Our revenue declined in 2009 as compared to 2008 primarily as a result of the difficult economic environment. While we are cautiously optimistic that the overall global economic environment is improving and are therefore forecasting a return to revenue growth in 2010, there can be no assurance that the improvement in the
economic environment will be sustained or that revenue growth will be achieved. We will continue to monitor and manage the impact of the overall economic environment on the Company.
During 2009 we successfully completed the first phase of our operational restructuring plan which we had previously announced in the second quarter of 2008. During 2010, we will begin the second phase of our operational restructuring plan which involves further expanding our lower cost Mexican operations by transferring additional production lines to our Chihuahua, Mexico facility which we believe will yield additional cost savings. We expect the second phase of our restructuring plan to be largely completed by the fourth quarter of 2010. However, we cannot be certain such activities will be completed in the estimated time period or that planned cost savings will be achieved.
Our CONMED Endoscopic Technologies operating segment has suffered from sales declines and operating losses since its acquisition from C.R. Bard in September 2004. We have corrected the operational issues associated with product shortages that resulted following the acquisition of the Endoscopic Technologies business and have consolidated the administrative functions of the Endoscopic Technologies business from Chelmsford, Massachusetts to our Corporate Headquarters in Utica, New York. We believe by reducing costs while continuing to invest in new product development, we can achieve increased sales and ensure a return to profitability.
Our facilities are subject to periodic inspection by the United States Food and Drug Administration (“FDA”) and foreign regulatory agencies for, among other things, conformance to quality System Regulation and Current Good Manufacturing Practice (“CGMP”) requirements. Our products are also subject to product recall and we have made product recalls in the past, including $6.0 million in 2009 related to certain of our powered instrument handpieces. We are committed to the principles and strategies of systems-based quality management for improved CGMP compliance, operational performance and efficiencies through our Company-wide quality systems initiative. However, there can be no assurance that our actions will ensure that we will not receive a warning letter or other regulatory action, which may include consent decrees or fines, or that we will not make product recalls in the future.
Critical Accounting Policies
Preparation of our financial statements requires us to make estimates and assumptions which affect the reported amounts of assets, liabilities, revenues and expenses. Note 1 to the Consolidated Financial Statements describes the significant accounting policies used in preparation of the Consolidated Financial Statements. The most significant areas involving management judgments and estimates are described below and are considered by management to be critical to understanding the financial condition and results of operations of CONMED Corporation.
Revenue Recognition
Revenue is recognized when title has been transferred to the customer which is at the time of shipment. The following policies apply to our major categories of revenue transactions:
• Sales to customers are evidenced by firm purchase orders. Title and the risks and rewards of ownership are transferred to the customer when product is shipped under our stated shipping terms. Payment by the customer is due under fixed payment terms.
• We place certain of our capital equipment with customers in return for commitments to purchase disposable products over time periods generally ranging from one to three years. In these circumstances, no revenue is recognized upon capital equipment shipment and we recognize revenue upon the disposable product shipment. The cost of the equipment is amortized over the term of individual commitment agreements.
Management’s Discussion and Analysis of Financial Condition and Results of Operations

8
C O N M E D C O R P O R AT I O N
• Product returns are only accepted at the discretion of the Company and in accordance with our “Returned Goods Policy”. Historically the level of product returns has not been significant. We accrue for sales returns, rebates and allowances based upon an analysis of historical customer returns and credits, rebates, discounts and current market conditions.
• Our terms of sale to customers generally do not include any obligations to perform future services. Limited warranties are provided for capital equipment sales and provisions for warranty are provided at the time of product sale based upon an analysis of historical data.
• Amounts billed to customers related to shipping and handling have been included in net sales. Shipping and handling costs included in selling and administrative expense were $14.1 million, $13.4 million and $11.3 million for 2007, 2008 and 2009, respectively.
• We sell to a diversified base of customers around the world and, therefore, believe there is no material concentration of credit risk.
• We assess the risk of loss on accounts receivable and adjust the allowance for doubtful accounts based on this risk assessment. Historically, losses on accounts receivable have not been material. Management believes that the allowance for doubtful accounts of $1.2 million at December 31, 2009 is adequate to provide for probable losses resulting from accounts receivable.
Inventory Reserves
We maintain reserves for excess and obsolete inventory resulting from the inability to sell our products at prices in excess of current carrying costs. The markets in which we operate are highly competitive, with new products and surgical procedures introduced on an on-going basis. Such marketplace changes may result in our products becoming obsolete. We make estimates regarding the future recoverability of the costs of our products and record a provision for excess and obsolete inventories based on historical experience, expiration of sterilization dates and expected future trends. If actual product life cycles, product demand or acceptance of new product introductions are less favorable than projected by management, additional inventory write-downs may be required. We believe that our current inventory reserves are adequate.
Goodwill and Intangible Assets
We have a history of growth through acquisitions. Assets and liabilities of acquired businesses are recorded at their estimated fair values as of the date of acquisition. Goodwill represents costs in excess of fair values assigned to the underlying net assets of acquired businesses. Other intangible assets primarily represent allocations of purchase price to identifiable intangible assets of acquired businesses. We have accumulated goodwill of $290.5 million and other intangible assets of $190.8 million as of December 31, 2009.
In accordance with Financial Accounting Standards Board (“FASB”) guidance, goodwill and intangible assets deemed to have indefinite lives are not amortized, but are subject to at least annual impairment testing. It is our policy to perform our annual impairment testing in the fourth quarter. The identification and measurement of goodwill impairment involves the estimation of the fair value of our reporting units. Estimates of fair value are based on the best information available as of the date of the assessment, which primarily incorporate management assumptions about expected future cash flows and other valuation techniques. Future cash flows may be affected by changes in industry or market conditions or the rate and extent to which anticipated synergies or cost savings are realized with newly acquired entities. We completed our goodwill impairment testing as of October 1, 2009 and determined that no impairment existed at that date. For our CONMED Electrosurgery, CONMED Endosurgery and CONMED Linvatec operating units, our impairment testing utilized CONMED Corporation’s EBIT multiple adjusted for a market-based control premium with the resultant fair values exceeding carrying
values by 55% to 140%. Our CONMED Patient Care operating unit has the least excess of fair value over carrying value of our reporting units; we therefore utilized both a market-based approach and an income approach when performing impairment testing with the resultant fair value exceeding carrying value by 16%. The income approach contained certain key assumptions including that revenue would resume historical growth patterns in 2010 while including certain cost savings associated with the operational restructuring plan completed during 2009. We continue to monitor events and circumstances for triggering events which would more likely than not reduce the fair value of any of our reporting units and require us to perform impairment testing.
Intangible assets with a finite life are amortized over the estimated useful life of the asset and are evaluated each reporting period to determine whether events and circumstances warrant a revision to the remaining period of amortization. Intangible assets subject to amortization are reviewed for impairment whenever events or changes in circumstances indicate that its carrying amount may not be recoverable. The carrying amount of an intangible asset subject to amortization is not recoverable if it exceeds the sum of the undiscounted cash flows expected to result from the use of the asset. An impairment loss is recognized by reducing the carrying amount of the intangible asset to its current fair value.
Customer relationship assets arose principally as a result of the 1997 acquisition of Linvatec Corporation. These assets represent the acquisition date fair value of existing customer relationships based on the after-tax income expected to be derived during their estimated remaining useful life. The useful lives of these customer relationships were not and are not limited by contract or any economic, regulatory or other known factors. The estimated useful life of the Linvatec customer relationship assets was determined as of the date of acquisition as a result of a study of the observed pattern of historical revenue attrition during the 5 years immediately preceding the acquisition of Linvatec Corporation. This observed attrition pattern was then applied to the existing customer relationships to derive the future expected retirement of the customer relationships. This analysis indicated an annual attrition rate of 2.6%. Assuming an exponential attrition pattern, this equated to an average remaining useful life of approximately 38 years for the Linvatec customer relationship assets. Customer relationship intangible assets arising as a result of other business acquisitions are being amortized over a weighted average life of 17 years. The weighted average life for customer relationship assets in aggregate is 34 years.
We evaluate the remaining useful life of our customer relationship intangible assets each reporting period in order to determine whether events and circumstances warrant a revision to the remaining period of amortization. In order to further evaluate the remaining useful life of our customer relationship intangible assets, we perform an annual analysis and assessment of actual customer attrition and activity. This assessment includes a comparison of customer activity since the acquisition date and review of customer attrition rates. In the event that our analysis of actual customer attrition rates indicates a level of attrition that is in excess of that which was originally contemplated, we would change the estimated useful life of the related customer relationship asset with the remaining carrying amount amortized prospectively over the revised remaining useful life.
We test our customer relationship assets for recoverability whenever events or changes in circumstances indicate that the carrying amount may not be recoverable. Factors specific to our customer relationship assets which might lead to an impairment charge include a significant increase in the annual customer attrition rate or otherwise significant loss of customers, significant decreases in sales or current-period operating or cash flow losses or a projection or forecast of losses. We do not believe that there have been events or changes in circumstances which would indicate the carrying amount of our customer relationship assets might not be recoverable.

A N N U A L R E P O R T 2 0 0 9 9
See Note 4 to the Consolidated Financial Statements for further discussion of goodwill and other intangible assets.
Pension Plan
We sponsor a defined benefit pension plan covering substantially all our employees. Major assumptions used in accounting for the plan include the discount rate, expected return on plan assets, rate of increase in employee compensation levels and expected mortality. Assumptions are determined based on Company data and appropriate market indicators, and are evaluated annually as of the plan’s measurement date. A change in any of these assumptions would have an effect on net periodic pension costs reported in the consolidated financial statements.
On March 26, 2009, the Board of Directors approved a plan to freeze benefit accruals under our pension plan effective May 14, 2009. As a result, we recorded a curtailment gain of $4.4 million and a reduction in accrued pension of $11.4 million which is included in other long term liabilities. See Note 9 to the Consolidated Financial Statements.
The weighted-average discount rate used to measure pension liabilities and costs is set by reference to the Citigroup Pension Liability Index. However, this index gives only an indication of the appropriate discount rate because the cash flows of the bonds comprising the index do not match the projected benefit payment stream of the plan precisely. For this reason, we also consider the individual characteristics of the plan, such as projected cash flow patterns and payment durations, when setting the discount rate. This discount rate, which is used in determining pension expense, was 6.48% in 2008 compared to 5.97% for the first quarter of 2009. The discount rate used for purposes of remeasuring plan liabilities as of the date the plan freeze was approved and for purposes of measuring pension expense for the remainder of 2009 was 7.30%. The rate used in determining 2010 pension expense is 5.86%.
We have used an expected rate of return on pension plan assets of 8.0% for purposes of determining the net periodic pension benefit cost. In determining the expected return on pension plan assets, we consider the relative weighting of plan assets, the historical performance of total plan assets and individual asset classes and economic and other indicators of future performance. In addition, we consult with financial and investment management professionals in developing appropriate targeted rates of return.
We have estimated our rate of increase in employee compensation levels at 3.5% consistent with our internal budgeting.
Pension expense in 2010 is expected to be $1.5 million compared to a net pension gain of $0.8 million (including a $4.4 million curtailment gain and pension expense of $3.6 million) in 2009. In addition, we will be required to contribute approximately $3.0 million to the pension plan for the 2010 plan year.
We have recorded additional expense of approximately $4.0 million in the year ended December 31, 2009 related to an additional employer 401(k) contribution which is intended to offset some of the impact on employees of the freeze in pension benefit accruals.
See Note 9 to the Consolidated Financial Statements for further discussion.
Stock-Based Compensation
All share-base payments to employees, including grants of employee stock options, restricted stock units, and stock appreciation rights are recognized in the financial statements based at their fair values. Compensation expense is recognized using a straight-line method over the vesting period.
Income Taxes
The recorded future tax benefit arising from net deductible temporary differences and tax carryforwards is approximately $34.6 million at December 31, 2009. Management believes that our earnings during the periods when the temporary differences become deductible will be
sufficient to realize the related future income tax benefits.
We operate in multiple taxing jurisdictions, both within and outside the United States. We face audits from these various tax authorities regarding the amount of taxes due. Such audits can involve complex issues and may require an extended period of time to resolve. Our Federal income tax returns have been examined by the Internal Revenue Service (“IRS”) for calendar years ending through 2007. Tax years subsequent to 2007 are subject to future examination.
We have established a valuation allowance to reflect the uncertainty of realizing the benefits of certain net operating loss carryforwards recognized in connection with an acquisition. Effective January 1, 2009, changes in deferred tax valuation allowances and income tax uncertainties after the acquisition date, including those associated with acquisitions that closed prior to this effective date, generally will affect income tax expense. In assessing the need for a valuation allowance, we estimate future taxable income, considering the feasibility of ongoing tax planning strategies and the realizability of tax loss carryforwards. Valuation allowances related to deferred tax assets may be impacted by changes to tax laws, changes to statutory tax rates and ongoing and future taxable income levels.
Consolidated Results of Operations
The following table presents, as a percentage of net sales, certain categories included in our consolidated statements of income for the periods indicated:
Years Ended December 31, 2007 2008 2009Net sales 100.0% 100.0% 100.0%Cost of sales 49.7 48.5 51.4 ______ _______ ______ Gross margin 50.3 51.5 48.6Selling and administrative expense 34.6 36.7 38.3Research and development expense 4.4 4.5 4.6Other expense (income), net (0.4) 0.2 1.6 _______ ______ ______ Income from operations 11.7 10.1 4.1Gain on early extinguishment of debt — 0.3 0.1Amortization of debt discount 0.7 0.6 0.6Interest expense 2.3 1.4 1.0 ______ _______ ______Income before income taxes 8.7 8.4 2.6Provision for income taxes 3.1 3.0 0.9 ______ _______ ______ Net income 5.6% 5.4% 1.7% ______ _______ ______ ______ _______ ______
2009 Compared to 2008
Sales for 2009 were $694.7 million, a decrease of $47.5 million (-6.4%) compared to sales of $742.2 million in 2008 with the decreases occurring in all product lines except Endosurgery. Foreign currency exchange rates (when compared to the foreign currency exchange rates in the same period a year ago) accounted for approximately $20.4 million of the decrease. In local currency, sales decreased 3.7%. Sales of capital equipment decreased $31.9 million (-16.1%) from $197.8 million in 2008 to $165.9 million in 2009; sales of single-use and reposable products decreased $15.6 million (-2.9%) from $544.4 million in 2008 to $528.8 million in 2009. On a local currency basis, sales of capital equipment decreased 13.3% while single-use and reposable products decreased 0.1%. We believe the overall decline in sales is driven by capital purchasing constraints in hospitals due to the depressed economic conditions.
Cost of sales decreased to $357.4 million in 2009 as compared to $359.8 million in 2008 on overall decreases in sales volumes as described above. Gross profit margins decreased 2.9 percentage points to 48.6% in 2009 as compared to 51.5% in the same period a year ago. The decrease in gross profit margins of 2.9 percentage points is primarily a result of the effects of unfavorable foreign currency exchange rates on sales (1.5 percentage points) and restructuring of the Company’s operations as more fully described in Note 17 (1.8 percentage points) offset by improved product mix (0.4 percentage points).

10
C O N M E D C O R P O R AT I O N
Selling and administrative expense decreased from $272.4 million in 2008 to $266.3 million in 2009. Foreign currency exchange rates (when compared to the foreign currency exchange rates in the same period a year ago) accounted for approximately $6.8 million of the decrease. Selling and administrative expense as a percentage of net sales increased to 38.3% in 2009 from 36.7% in 2008. This increase of 1.6 percentage points is primarily attributable to higher benefit related costs (0.4 percentage points) and higher sales force and other administrative expenses (1.2 percentage points) as a percent of sales.
Research and development expense was $31.8 million in 2009 compared to $33.1 million in 2008. As a percentage of net sales, research and development expense increased to 4.6% in 2009 compared to 4.5% in 2008. The increase in research and development expense of 0.1 percentage point is due to increased spending on our CONMED Linvatec orthopedic products (0.5 percentage points) offset by decreases in other research and development spending (0.4 percentage points).
As discussed in Note 11 to the Consolidated Financial Statements, other expense in 2009 consisted of the following: a $2.7 million charge related to the restructuring of certain of the Company’s operations; a $4.1 million charge related to the consolidation of the administrative functions of the CONMED Endoscopic Technologies division; a $6.0 million charge related to a voluntary recall of certain of our powered instrument products; and a $1.9 million net pension gain resulting from the freezing of future benefit accruals effective May 14, 2009. Other expense in 2008 consisted of a $1.6 million charge related to the restructuring and relocation of certain of the Company’s facilities.
During the first quarter of 2009, we repurchased and retired $9.9 million of our 2.50% convertible senior subordinated notes (the “Notes”) for $7.8 million and recorded a gain on the early extinguishment of debt of $1.1 million net of the write-offs of $0.1 million in unamortized deferred financing costs and $1.0 million in unamortized Notes discount. During the fourth quarter of 2008, we repurchased and retired $25.0 million of our 2.50% convertible senior subordinated notes (the “Notes”) for $20.2 million and recorded a gain on the early extinguishment of debt of $1.9 million net of the write-off of $0.4 million in unamortized deferred financing costs and $2.4 million in unamortized Notes discount. See additional discussion under Management’s Discussion and Analysis of Financial Condition and Results of Operations—Liquidity and Capital Resources and Note 5 to the Consolidated Financial Statements.
Amortization of debt discount in 2009 was $4.1 million compared to $4.8 million in 2008. This amortization is associated with the implementation of FASB guidance as of January 1, 2009 as further described in Note 16 to the Consolidated Financial Statements.
Interest expense in 2009 was $7.1 million compared to $10.4 million in 2008. The decrease in interest expense is due to lower weighted average interest rates combined with lower weighted average borrowings outstanding in 2009 as compared to 2008. The weighted average interest rates on our borrowings (inclusive of the finance charge on our accounts receivable sale facility) decreased to 2.90% in 2009 as compared to 3.78% in 2008.
A provision for income taxes was recorded at an effective rate of 33.1% in 2009 and 35.5% in 2008 as compared to the Federal statutory rate of 35.0%. The effective tax rate for 2009 is lower than that recorded in the same period a year ago as a result of the settlement of our 2007 IRS examination in the first quarter of 2009, and the resulting adjustment to our reserves and reduction of income tax expense. A reconciliation of the United States statutory income tax rate to our effective tax rate is included in Note 6 to the Consolidated Financial Statements.
2008 Compared to 2007
Sales for 2008 were $742.2 million, an increase of $47.9 million (6.9%) compared to sales of $694.3 million in 2007 with the increase occurring in all product lines except Endoscopic Technologies.
Favorable foreign currency exchange rates in 2008 compared to 2007 accounted for $2.0 million of the increase while the purchase of our Italian distributor accounted for an increase in sales of approximately $18.3 million (see Note 15 to the Consolidated Financial Statements). In local currency, sales increased 6.6%. Sales of capital equipment increased $8.5 million (4.5%) from $189.3 million in 2007 to $197.8 million in 2008; sales of single-use and reposable products increased $39.4 million (7.8%) from $505.0 million in 2007 to $544.4 million in 2008. On a local currency basis, sales of capital equipment increased 4.1% while single-use and reposable products increased 7.6%.
Cost of sales increased to $359.8 million in 2008 compared to $345.2 million in 2007, primarily as a result of the increased sales volumes discussed above. Gross profit margins increased 1.2 percentage points from 50.3% in 2007 to 51.5% in 2008. The increase of 1.2 percentage points is comprised of improved gross margins from the newly acquired direct sales operation in Italy (1.2 percentage points) and increases in Patient Care and Linvatec gross margins (0.3 and 0.7 percentage points, respectively) as a result of higher selling prices and improved manufacturing efficiencies. These increases were offset by lower gross margins in our Endoscopic Technologies business (0.4 percentage points) due to pricing pressures and lower production volumes, additional costs incurred associated with our restructuring and relocation of certain of the Company’s facilities (0.3 percentage points) and product mix (0.3 percentage points).
Selling and administrative expense increased to $272.4 million in 2008 compared to $240.5 million in 2007. Foreign currency exchange rates (when compared to the foreign currency exchange rates in the same period a year ago) accounted for approximately $1.5 million of the increase. Selling and administrative expense as a percentage of net sales increased to 36.7% in 2008 from 34.6% in 2007. This increase of 2.1 percentage points is primarily attributable to higher selling and administrative expense associated with our newly acquired direct sales operation in Italy (1.5 percentage points), higher benefit costs (0.3 percentage points), and other selling and administrative costs (0.3 percentage points).
Research and development expense was $33.1 million in 2008 compared to $30.4 million in 2007. As a percentage of net sales, research and development expense remained flat at 4.5% in 2008 from 4.4% in 2007.
As discussed in Note 11 to the Consolidated Financial Statements, other expense in 2008 consisted of a $1.6 million charge related to the restructuring and relocation of certain of the Company’s facilities. Other expense in 2007 consisted of the following: $1.8 million charge related to the closing of our manufacturing facility in Montreal, Canada and a sales office in France, a $0.1 million charge related to the termination of our surgical lights product offering, $6.1 million in income related to the settlement of the antitrust case with Johnson & Johnson, and a $1.3 million charge related to the settlement of a product liability claim and defense related costs.
During the fourth quarter of 2008, we repurchased and retired $25.0 million of our 2.50% convertible senior subordinated notes (the “Notes”) for $20.2 million and recorded a gain on the early extinguishment of debt of $1.9 million net of the write-off of $0.4 million in unamortized deferred financing costs and $2.4 million in unamortized Notes discount. See additional discussion under Management’s Discussion and Analysis of Financial Condition and Results of Operations—Liquidity and Capital Resources and Note 5 to the Consolidated Financial Statements.
Amortization of debt discount in 2008 was $4.8 million compared to $4.6 million in 2007. This amortization is associated with the implementation of FASB guidance as of January 1, 2009 as further described in Note 16 to the Consolidated Financial Statements.
Interest expense in 2008 was $10.4 million compared to $16.2 million in 2007. The decrease in interest expense is due to lower

A N N U A L R E P O R T 2 0 0 9 11
weighted average interest rates combined with lower weighted average borrowings outstanding in 2008 as compared to 2007. The weighted average interest rates on our borrowings (inclusive of the finance charge on our accounts receivable sale facility) decreased to 3.78% in 2008 as compared to 5.51% in 2007.
A provision for income taxes was recorded at an effective rate of 35.5% in 2008 and 35.9% in 2007 as compared to the Federal statutory rate of 35.0%. The effective tax rate was lower in 2008 than in 2007 largely as a result of decreased apportionment factors to state taxing jurisdictions and a decreased level of stock-based compensation that is not expected to create a future tax deduction. A reconciliation of the United States statutory income tax rate to our effective tax rate is included in Note 6 to the Consolidated Financial Statements.
Operating Segment Results
Segment information is prepared on the same basis that we review financial information for operational decision-making purposes. We conduct our business through five principal operating segments: CONMED Endoscopic Technologies, CONMED Endosurgery, CONMED Electrosurgery, CONMED Linvatec and CONMED Patient Care. Based upon the aggregation criteria for segment reporting, we have grouped our CONMED Endosurgery, CONMED Electrosurgery and CONMED Linvatec operating segments into a single reporting segment. The economic characteristics of CONMED Patient Care and CONMED Endoscopic Technologies do not meet the criteria for aggregation due to the lower overall operating income (loss) of these segments.
The following tables summarize the Company’s results of operations by segment for 2007, 2008 and 2009:
CONMED Endosurgery, CONMED Electrosurgery and CONMED Linvatec 2007 2008 2009 _____________________________ Net sales $ 564,834 $ 612,521 $ 574,820Income from operations 87,569 98,101 62,715Operating margin 15.5% 16.0% 10.9%
Product offerings include a complete line of endo-mechanical instrumentation for minimally invasive laparoscopic procedures, electrosurgical generators and related surgical instruments, arthroscopic instrumentation for use in orthopedic surgery and small bone, large bone and specialty powered surgical instruments.
• Arthroscopy sales decreased $22.1 million (-7.6%) in 2009 to $269.8 million from $291.9 million in 2008. Unfavorable foreign currency exchange rates (when compared to the foreign currency exchange rates in the same period a year ago) accounted for approximately $9.2 million of the decrease. Sales of capital equipment decreased $19.6 million (-21.1%) from $92.9 million in 2008 to $73.3 million in 2009; sales of single-use products decreased $2.5 million (-1.3%) from $199.0 million in 2008 to $196.5 million in 2009. On a local currency basis, sales of capital equipment decreased 18.6% while single-use products increased 2.2%. We believe the overall decline in sales is driven by capital purchasing constraints in hospitals due to the depressed economic conditions. Arthroscopy sales increased $27.3 million (10.3%) in 2008 to $291.9 million from $264.6 million in 2007. These increases are principally a result of increased sales of our procedure specific, resection and video imaging products for arthroscopy and general surgery. Favorable foreign currency exchange rates (when compared to the foreign currency exchange rates in the same period a year ago) accounted for approximately $1.4 million of the increase. Sales of capital equipment increased $4.8 million (5.4%) from $88.1 million in 2007 to $92.9 million in 2008; sales of single-use products increased $22.5 million (12.7%) from $176.5 million in 2007 to $199.0 million in 2008. On a local currency basis, sales of capital equipment increased 5.1% while single-use products increased 12.1%.
• Powered surgical instrument sales decreased $11.7 million (-7.5%) in 2009 to $144.0 million from $155.7 million in 2008. Unfavorable foreign currency exchange rates (when compared to the same period
a year ago) accounted for approximately $6.1 million of the decrease. Sales of capital equipment decreased $8.7 million (-11.4%) from $76.4 million in 2008 to $67.7 million in 2009; sales of single-use products decreased $3.0 million (-3.8%) in 2009 to $76.3 million compared to $79.3 million in 2008. On a local currency basis, sales of capital equipment decreased 8.1% while single-use products increased 0.8%. We believe the overall decline in sales is driven by capital purchasing constraints in hospitals due to the depressed economic conditions. Powered surgical instrument sales increased $6.4 million (4.3%) in 2008 to $155.7 million from $149.3 million in 2007 on increased sales of large bone handpieces and large bone, small bone and specialty burs and blades. Favorable foreign currency exchange rates (when compared to the same period a year ago) accounted for approximately $1.0 million of the increase. Sales of capital equipment increased $0.8 million (1.1%) from $75.6 million in 2007 to $76.4 million in the 2008; sales of single-use products increased $5.6 million (7.6%) from $73.7 million in 2007 to $79.3 million in 2008. On a local currency basis, sales of capital equipment increased 0.4% while single-use products increased 6.9%.
• Electrosurgery sales decreased $5.5 million (-5.5%) in 2009 to $95.0 million from $100.5 million in 2008. Unfavorable foreign currency exchange rates (when compared to the foreign currency exchange rates in the same period a year ago) accounted for approximately $1.5 million of the decrease. Sales of capital equipment decreased $3.6 million (-12.6%) from $28.5 million in 2008 to $24.9 million in 2009; sales of single-use products decreased $1.9 million (-2.6%) from $72.0 million 2008 to $70.1 million in 2009. On a local currency basis, sales of capital equipment decreased 10.2% while single-use products decreased 1.5%. We believe the overall decline in sales is driven by capital purchasing constraints in hospitals due to the depressed economic conditions. Electrosurgery sales increased $8.4 million (9.1%) in 2008 to $100.5 million from $92.1 million in 2007 on increased sales of our System 5000™ electrosurgical generators, ABC® handpieces, pencils and electrodes. Foreign currency exchange rates (when compared to the foreign currency exchange rates in the same period a year ago) did not have a significant impact on sales. Sales of capital equipment increased $2.9 million (11.3%) to $28.5 million in 2008 from $25.6 million in 2007; sales of single-use products increased $5.5 million (8.3%) to $72.0 million 2008 from $66.5 million in 2007. On a local currency basis, sales of capital equipment increased 11.3% while single-use products increased 8.1%.
• Endosurgery sales increased $1.6 million (2.5%) in 2009 to $66.0 million from $64.4 million in 2008. Unfavorable foreign currency exchange rates (when compared to the foreign currency exchange rates in the same period a year ago) decreased sales approximately $1.6 million. On local currency basis, sales increased 5.0%. Endosurgery sales increased $5.5 million (9.3%) in 2008 to $64.4 million from $58.9 million in 2007. Unfavorable foreign currency exchange rates (when compared to the foreign currency exchange rates in the same period a year ago) decreased sales approximately $0.2 million. On local currency basis, sales increased 9.7%. The overall increase in sales is mainly driven by our VCARE product which we believe is an innovative product for laparoscopic hysterectomies.
• Operating margins as a percentage of net sales decreased 5.1 percentage points to 10.9% in 2009 compared to 16.0% in 2008. The decrease in operating margins is due to lower gross margins (1.7 percentage points) due to unfavorable foreign currency exchange rates, higher research and development spending (0.6 percentage points) due to increased emphasis on our CONMED Linvatec orthopedic products, and costs associated with the voluntary recall of certain powered instrument products (1.0 percentage points); see Note 11 to the Consolidated Financial Statements for further discussion. In addition, sales force and other relatively fixed administrative expenses increased 1.8 points as a percentage of lower overall sales.
• Operating margins as a percentage of net sales increased 0.5 percentage points to 16.0% in 2008 compared to 15.5% in 2007. The increase in operating margins are due to higher gross
12
C O N M E D C O R P O R AT I O N
margins (2.0 percentage points) in 2008 compared to 2007 as result of the newly acquired direct operations in Italy and improved manufacturing efficiencies and other decreases in selling and administrative expense (0.2 percentage points) offset by higher selling and administrative expenses associated with the newly acquired direct sales operation in Italy (1.7 percentage points).
CONMED Patient Care 2007 2008 2009 ____________________________ Net sales $ 76,711 $ 78,384 $ 70,978Income (loss) from operations 2,003 2,259 (1,263)Operating margin 2.6% 2.9% (1.8%)
Product offerings include a line of vital signs and cardiac monitoring products including pulse oximetry equipment & sensors, ECG electrodes and cables, cardiac defibrillation & pacing pads and blood pressure cuffs. We also offer a complete line of reusable surgical patient positioners and suction instruments & tubing for use in the operating room, as well as a line of IV products.
• Patient Care sales decreased $7.4 million (-9.4%) in 2009 to $71.0 million compared to $78.4 million in 2008 principally due to decreased sales of suction instruments and ECG electrodes to distributors. Unfavorable foreign currency exchange rates (when compared to the foreign currency exchange rates in the same period a year ago) accounted for approximately $0.5 million of the decrease. On a local currency basis, sales decreased 8.8%. We believe the decrease in sales is due to a general slowdown in hospital spending as a result of the weak economic environment. Patient Care sales increased $1.7 million (2.2%) in 2008 to $78.4 million compared to $76.7 million in 2007 on increased sales of defibrillator pads and ECG electrodes. Foreign currency exchange rates (when compared to the foreign currency exchange rates in the same period a year ago) did not have a significant impact on sales.
• Operating margins as a percentage of net sales decreased 4.7% percentage points to -1.8% in 2009 compared to 2.9% in 2008. The decreases in operating margins are primarily due to decreases in gross margins of 1.7 percentage points on lower sales volumes in 2009 compared to 2008. Higher selling and relatively fixed administrative costs (4.3 percentage points) accounted for the remaining increase and were offset by decreased research and development spending (1.3 percentage points) on our Endotracheal Cardiac Output Monitor (“ECOM”) project.
• Operating margins as a percentage of net sales increased 0.3% percentage points to 2.9% in 2008 compared to 2.6% in 2007. The increases in operating margins are primarily due to increases in gross margins of 3.1 percentage points in 2008 compared to 2007 as a result of higher selling prices and lower production variances offset by increased research and development costs (2.1 percentage points) associated with our Endotracheal Cardiac Output Monitor (“ECOM”) project and higher selling and administrative costs (0.7 percentage points).
CONMED Endoscopic Technologies
2007 2008 2009 ____________________________ Net sales $ 52,743 $ 51,278 $ 48,941Income (loss) from operations (6,250) (7,411) (7,904)Operating margin (11.8%) (14.5%) (16.2%)
Product offerings include a comprehensive line of minimally invasive endoscopic diagnostic and therapeutic instruments used in procedures which require examination of the digestive tract.
• Endoscopic Technologies net sales declined $2.4 million (-4.7%) in 2009 to $48.9 million from $51.3 million in 2008 principally due to decreased sales of disposable biopsy forceps. Unfavorable foreign currency exchange rates (when compared to the foreign currency exchange rates in the same period a year ago) accounted for approximately $1.4 million of the decrease. On a local currency basis, sales decreased 1.9%. We believe the decrease in sales is due to a general slowdown in hospital spending as a result of the
weak economic environment. Endoscopic Technologies net sales declined $1.4 million (-2.7%) in 2008 to $51.3 million from $52.7 million in 2007, principally due to decreased sales of forceps and pulmonary products as a result of production and operational issues which resulted in product shortages and backorders during the first half of 2008. Unfavorable foreign currency exchange rates (when compared to the foreign currency exchange rates in the same period a year ago) decreased sales approximately $0.2 million. On a local currency basis, sales decreased 2.3%
• Operating margins as a percentage of net sales decreased 1.7 percentage points to (-16.2%) in 2009 from (-14.5%) in 2008. The decrease in operating margins of 1.7 percentage points in 2009 is primarily due to charges associated with the consolidation of divisional administrative offices from Chelmsford, Massachusetts to our Corporate Headquarters in Utica, New York (8.3 percentage points); see Note 11 to the Consolidated Financial Statements. This increase in cost was partially offset by higher gross margins (2.3 percentage points), lower research and development spending of (2.5 percentage points) and overall lower spending in selling and administrative expenses (1.8 percentage points) as a result of our continued efforts to improve the profitability of the business.
• Operating margins as a percentage of net sales decreased 2.7 percentage points to (-14.5%) in 2008 from (-11.8%) in 2007. The decrease in operating margins of 2.7 percentage points in 2008 is primarily due to decreases in gross margins of 5.4 percentage points as a result of increased production costs and pricing pressures as well as higher selling and administrative expenses as a percentage of sales (0.9 percentage points) offset by decreased research and development spending as a percentage of sales (0.7 percentage points) and the charge in 2007 associated with the closure of a sales office in France (2.9 percentage points).
Liquidity and Capital Resources
Our liquidity needs arise primarily from capital investments, working capital requirements and payments on indebtedness under our senior credit agreement. We have historically met these liquidity requirements with funds generated from operations, including sales of accounts receivable and borrowings under our revolving credit facility. In addition, we use term borrowings, including borrowings under our senior credit agreement and borrowings under separate loan facilities, in the case of real property purchases, to finance our acquisitions. We also have the ability to raise funds through the sale of stock or we may issue debt through a private placement or public offering. We generally attempt to minimize our cash balances on-hand and use available cash to pay down debt or repurchase our common stock.
Operating Cash Flows
Our net working capital position was $246.5 million at December 31, 2009. Net cash provided by operating activities was $65.9 million in 2007, $61.1 million in 2008 and $25.0 million in 2009, generated on net income of $38.5 million in 2007, $40.0 million in 2008 and $12.1 million in 2009. The decline in operating cash flows for 2009 is due in part to a $27.9 million decline in net income compared to 2008. In addition, during 2009 we reduced sales of accounts receivable under our accounts receivable sales agreement by $13.0 million, thus reducing operating cash flows by $13.0 million, or $10.0 million more than in the previous year.
Investing Cash Flows
Capital expenditures were $20.9 million, $35.9 million and $21.4 million in 2007, 2008 and 2009, respectively. Capital expenditures are expected to approximate $22.0 million in 2010.
The decrease in capital expenditures in 2009 compared to 2008 is due to the completion during the second quarter of 2009 of the implementation of an enterprise business software application as

A N N U A L R E P O R T 2 0 0 9 13
well as certain other infrastructure improvements related to our restructuring efforts as more fully described in Note 17 and in “Restructuring” below.
During 2008, we purchased our Italian distributor (the “Italy acquisition”) for $21.8 million. See Note 15 to the Consolidated Financial Statements for further discussion of the Italy acquisition. The purchase of a business and a purchase price adjustment resulted in payments totaling $5.9 million in 2007.
Financing Cash Flows
Net cash used in financing activities during 2009 consisted of the following: $1.2 million in proceeds from the issuance of common stock under our equity compensation plans and employee stock purchase plan (See Note 7 to the Consolidated Financial Statements), $6.0 million in borrowings on our revolver under our senior credit agreement, $1.4 million in repayments of term borrowings under our senior credit agreement, $1.4 million in repayments on our mortgage notes, a $1.2 million net change in cash overdrafts, and a $7.8 million repurchase of our 2.50% convertible senior subordinated notes. See Note 5 to the Consolidated Financial Statements for further discussion of the repurchase of the Notes.
Our $235.0 million senior credit agreement (the “senior credit agreement”) consists of a $100.0 million revolving credit facility and a $135.0 million term loan. There were $10.0 million in borrowings outstanding on the revolving credit facility as of December 31, 2009. Our available borrowings on the revolving credit facility at December 31, 2009 were $81.6 million with approximately $8.4 million of the facility set aside for outstanding letters of credit. There were $56.3 million in borrowings outstanding on the term loan at December 31, 2009.
Borrowings outstanding on the revolving credit facility are due and payable on April 12, 2011. The scheduled principal payments on the term loan portion of the senior credit agreement are $1.4 million annually through December 2011, increasing to $53.6 million in 2012 with the remaining balance outstanding due and payable on April 12, 2013. We may also be required, under certain circumstances, to make additional principal payments based on excess cash flow as defined in the senior credit agreement. Interest rates on the term loan portion of the senior credit agreement are at LIBOR plus 1.50% (1.75% at December 31, 2009) or an alternative base rate; interest rates on the revolving credit facility portion of the senior credit agreement are at LIBOR plus 1.50% or an alternative base rate (3.625% at December 31, 2009). For those borrowings where the Company elects to use the alternative base rate, the base rate will be the greater of the Prime Rate or the Federal Funds Rate in effect on such date plus 0.50%, plus a margin of 0.50% for term loan borrowings or 0.25% for borrowings under the revolving credit facility.
The senior credit agreement is collateralized by substantially all of our personal property and assets, except for our accounts receivable and related rights which are pledged in connection with our accounts receivable sales agreement. The senior credit agreement contains covenants and restrictions which, among other things, require the maintenance of certain financial ratios, and restrict dividend payments and the incurrence of certain indebtedness and other activities, including acquisitions and dispositions. We were in full compliance with these covenants and restrictions as of December 31, 2009. We are also required, under certain circumstances, to make mandatory prepayments from net cash proceeds from any issuance of equity and asset sales.
We have a mortgage note outstanding in connection with the property and facilities utilized by our CONMED Linvatec subsidiary bearing interest at 8.25% per annum with semiannual payments of principal and interest through June 2019. The principal balance outstanding on the mortgage note aggregated $11.3 million at December 31, 2009. The mortgage note is collateralized by the CONMED Linvatec property and facilities.
We have outstanding $115.1 million in 2.50% convertible senior subordinated notes due 2024 (“the Notes”). During the year ended December 31, 2008, we repurchased and retired $25.0 million of the Notes for $20.2 million and recorded a gain on the early extinguishment of debt of $1.9 million net of the write-off of $0.4 million in unamortized deferred financing costs and $2.4 million in unamortized debt discount. During the year ended December 31, 2009, we repurchased and retired $9.9 million of the Notes for $7.8 million and recorded a gain on the early extinguishment of debt of $1.1 million net of the write-offs of $0.1 million in unamortized deferred financing costs and $1.0 million in unamortized debt discount. The Notes represent subordinated unsecured obligations and are convertible under certain circumstances, as defined in the bond indenture, into a combination of cash and CONMED common stock. Upon conversion, the holder of each Note will receive the conversion value of the Note payable in cash up to the principal amount of the Note and CONMED common stock for the Note’s conversion value in excess of such principal amount. Amounts in excess of the principal amount are at an initial conversion rate, subject to adjustment, of 26.1849 shares per $1,000 principal amount of the Note (which represents an initial conversion price of $38.19 per share). As of December 31, 2009, there was no value assigned to the conversion feature because the Company’s share price was below the conversion price. The Notes mature on November 15, 2024 and are not redeemable by us prior to November 15, 2011. Holders of the Notes have the right to put to us some or all of the Notes for repurchase on November 15, 2011, 2014 and 2019 and, provided the terms of the indenture are satisfied, we will be required to repurchase those Notes.
The Notes contain two embedded derivatives. The embedded derivatives are recorded at fair value in other long-term liabilities and changes in their value are recorded through the consolidated statements of operations. The embedded derivatives have a nominal value, and it is our belief that any change in their fair value would not have a material adverse effect on our business, financial condition, results of operations, or cash flows.
Our Board of Directors has authorized a share repurchase program under which we may repurchase up to $100.0 million of our common stock, although no more than $50.0 million may be purchased in any calendar year. We did not repurchase any shares during 2009. In the past, we have financed the repurchases and may finance additional repurchases through the proceeds from the issuance of common stock under our stock option plans, from operating cash flow and from available borrowings under our revolving credit facility.
Management believes that cash flow from operations, including accounts receivable sales, cash and cash equivalents on hand and available borrowing capacity under our senior credit agreement will be adequate to meet our anticipated operating working capital requirements, debt service, funding of capital expenditures and common stock repurchases in the foreseeable future. See “Business – Forward Looking Statements.”
Off-Balance Sheet Arrangements
We have an accounts receivable sales agreement pursuant to which we and certain of our subsidiaries sell on an ongoing basis certain accounts receivable to CONMED Receivables Corporation (“CRC”), a wholly-owned, bankruptcy-remote, special-purpose subsidiary of CONMED Corporation. CRC may in turn sell up to an aggregate $40.0 million undivided percentage ownership interest in such receivables (the “asset interest”) to a bank (the “purchaser”). The purchaser’s share of collections on accounts receivable are calculated as defined in the accounts receivable sales agreement, as amended. Effectively, collections on the pool of receivables flow first to the purchaser and then to CRC, but to the extent that the purchaser’s share of collections may be less than the amount of the purchaser’s asset interest, there is no recourse to CONMED or CRC for such shortfall. For receivables which have been sold, CONMED Corporation and its subsidiaries retain collection and administrative responsibilities as agent for the purchaser. As of December 31, 2008 and 2009, the undivided

14
C O N M E D C O R P O R AT I O N
percentage ownership interest in receivables sold by CRC to the purchaser aggregated $42.0 million and $29.0 million, respectively, which has been accounted for as a sale and reflected in the balance sheet as a reduction in accounts receivable. Expenses associated with the sale of accounts receivable, including the purchaser’s financing costs to purchase the accounts receivable, were $2.9 million, $1.7 million and $0.5 million, in 2007, 2008 and 2009, respectively, and are included in interest expense.
There are certain statistical ratios, primarily related to sales dilution and losses on accounts receivable, which must be calculated and maintained on the pool of receivables in order to continue selling to the purchaser. The pool of receivables is in compliance with these ratios. Management believes that additional accounts receivable arising in the normal course of business will be of sufficient quality and quantity to meet the requirements for sale under the accounts receivables sales agreement. In the event that new accounts receivable arising in the normal course of business do not qualify for sale, then collections on sold receivables will flow to the purchaser rather than being used to fund new receivable purchases. To the extent that such collections would not be available to CONMED in the form of new receivables purchases, we would need to access an alternate source of working capital, such as our $100 million revolving credit facility. Our accounts receivable sales agreement, as amended, also requires us to obtain a commitment (the “purchaser commitment”) from the purchaser to fund the purchase of our accounts receivable. The purchaser commitment was amended effective October 30, 2009 whereby the purchase commitment was decreased from $50.0 million to $40.0 million and extended through October 29, 2010 under otherwise substantially the same terms and conditions.
In June 2009, the FASB issued guidance which requires additional disclosures about the transfer and derecognition of financial assets, eliminates the concept of qualifying special-purpose entities, creates more stringent conditions for reporting a transfer of a portion of a financial asset as a sale, clarifies other sale-accounting criteria, and changes the initial measurement of a transferor’s interest in transferred financial assets. This guidance is effective for fiscal years beginning after November 15, 2009. As a result of this new guidance, our accounts receivable sales agreement, will no longer be permitted to be accounted for as a sale and reduction in accounts receivable beginning in 2010. As a result, accounts receivable sold under the agreement will be recorded as additional borrowings rather than as a reduction in accounts receivable.
Restructuring
During 2009, we completed the first phase of our operational restructuring plan which we had previously announced in the second quarter of 2008. The restructuring included the closure of two manufacturing facilities located in the Utica, New York area totaling approximately 200,000 square feet with manufacturing transferred into either our Corporate headquarters location in Utica, New York or into a newly constructed leased manufacturing facility in Chihuahua, Mexico. In addition, manufacturing previously done by a contract manufacturing facility in Juarez, Mexico was transferred in-house to the Chihuahua facility. Finally, certain domestic distribution activities were centralized in a new leased consolidated distribution center in Atlanta, Georgia. We believe our restructuring will reduce our cost base by consolidating our Utica, New York operations into a single facility and expanding our lower cost Mexican operations, as well as improve service to our customers by shipping orders from more centralized distribution centers. The closure of the two manufacturing facilities, consolidation of distribution activities and the first phase of transitioning manufacturing operations was substantially complete as of December 31, 2009. We expect the completion of the first phase of our operational restructuring plan to yield annual cost savings of approximately $3.0 - $5.0 million beginning in 2010.
During 2010, we plan to enter into the second phase of our restructuring plan which contemplates transferring additional production lines from Utica, New York to our manufacturing facility in Chihuahua, Mexico. We expect to incur $2.5 million in costs associated
with the second phase of our restructuring plan which we expect to yield annual cost savings of approximately $1.5 million beginning in 2011.
In conjunction with our restructuring plan, we considered FASB guidance which requires that long-lived assets be tested for recoverability whenever events or changes in circumstances indicate that their carrying amount may not be recoverable. As a result of our restructuring, two manufacturing facilities located in the Utica, New York area were closed prior to the end of their previously estimated useful lives. We determined one facility did not have any value and therefore recorded a $0.5 million charge for the remaining net book value of the facility in the fourth quarter of 2009. We plan to sell or lease the second facility and have tested it for impairment under the guidance for long-lived assets to be held and used. We performed our impairment testing on the second facility by comparing future cash flows expected to be generated by this facility (undiscounted and without interest charges) against the carrying amount ($2.1 million as of December 31, 2009). Since future cash flows expected to be generated by the second facility exceed its carrying amount, we do not believe any impairment exists at this time. However, we cannot be certain an impairment charge will not be required in the future.
As of December 31, 2009, we have incurred $18.6 million (including $4.1 million and $14.5 million, in the years ended December 31, 2008 and 2009, respectively) in costs associated with our restructuring.
Approximately $14.3 million (including $2.5 million and $11.8 million in the years ended December 31, 2008 and 2009, respectively) of the total $18.6 million in restructuring costs have been charged to cost of goods sold. The $14.3 million charged to cost of goods sold includes $6.1 million in under utilization of production facilities (including $1.2 million and $4.9 million, in the years ended December 31, 2008 and 2009, respectively), $2.4 million in accelerated depreciation (including $0.3 million and $2.1 million, in the years ended December 31, 2008 and 2009, respectively), $2.1 million in severance related charges (including $0.1 million and $2.0 million, in the years ended December 31, 2008 and 2009, respectively), and $3.7 million in other charges (including $0.9 million and $2.8 million, in the years ended December 31, 2008 and 2009, respectively).
The remaining $4.3 million (including $1.6 million and $2.7 million, in the years ended December 31, 2008 and 2009, respectively) in restructuring costs have been recorded in other expense and primarily include severance, lease and other charges related to the consolidation of our distribution centers.
As the second phase of our restructuring plan progresses, we will incur additional charges, including employee termination and other exit costs. Based on the criteria contained within FASB guidance, no accrual for such costs has been made at this time.
We estimate the total costs of the second phase of our restructuring plan will approximate $2.5 million during 2010, including $1.3 million related to employee termination costs and $1.2 million in other restructuring related activities. We expect these restructuring costs will be charged to cost of goods sold. The second phase of the restructuring plan impacts Corporate manufacturing facilities which support multiple reporting segments. As a result, costs associated with the second phase of our restructuring plan will be reflected in the Corporate line within our business segment reporting.

A N N U A L R E P O R T 2 0 0 9 15
Contractual Obligations
The following table summarizes our contractual obligations for the next five years and thereafter (amounts in thousands). Purchase obligations represent purchase orders for goods and services placed in the ordinary course of business. There were no capital lease obligations as of December 31, 2009.
Payments Due by Period Less than 1-3 3-5 More than Total 1 Year Years Years 5 YearsLong-term debt $ 192,692 $ 2,174 $ 66,800 $ 2,190 $ 121,528Purchase obligations 51,702 51,173 529 — —Operating lease obligations 37,538 6,456 10,516 8,030 12,536 _______ _______ _______ _______ _______Total contractual obligations $ 281,932 $ 59,803 $ 77,845 $ 10,220 $ 134,064 _______ _______ _______ _______ _______ _______ _______ _______ _______ _______
In addition to the above contractual obligations, we are required to make periodic interest payments on our long-term debt obligations; (see additional discussion under “quantitative and qualitative Disclosures About Market Risk—Interest Rate Risk” and Note 5 to the Consolidated Financial Statements). The above table does not include required contributions to our pension plan in 2010, which are expected to be approximately $3.0 million. (See Note 9 to the Consolidated Financial Statements). The above table also does not include unrecognized tax benefits of approximately $1.0 million, the timing and certainty of recognition for which is not known. (See Note 6 to the Consolidated Financial Statements).
Stock-Based Compensation
We have reserved shares of common stock for issuance to employees and directors under three shareholder-approved share-based compensation plans (the “Plans”). The Plans provide for grants of options, stock appreciation rights (“SARs”), dividend equivalent rights, restricted stock, restricted stock units (“RSUs”), and other equity-based and equity-related awards. The exercise price on all outstanding options and SARs is equal to the quoted fair market value of the stock at the date of grant. RSUs are valued at the market value of the underlying stock on the date of grant. Stock options, SARs and RSUs are non-transferable other than on death and generally become exercisable over a five year period from date of grant. Stock options and SARs expire ten years from date of grant. SARs are only settled in shares of the Company’s stock. (See Note 7 to the Consolidated Financial Statements).
New Accounting Pronouncements
See Note 14 to the Consolidated Financial Statements for a discussion of new accounting pronouncements.
quantitative and qualitative Disclosures About Market Risk
Market risk is the potential loss arising from adverse changes in market rates and prices such as commodity prices, foreign currency exchange rates and interest rates. In the normal course of business, we are exposed to various market risks, including changes in foreign currency exchange rates and interest rates. We manage our exposure to these and other market risks through regular operating and financing activities and as necessary through the use of derivative financial instruments.
Foreign Currency Risk
Approximately 45% of our total 2009 consolidated net sales were to customers outside the United States. We have sales subsidiaries in a significant number of countries in Europe as well as Australia, Canada and Korea. In those countries in which we have a direct presence, our sales are denominated in the local currency amounting to approximately 30% of our total net sales in 2009. The remaining 15% of sales to customers outside the United States was on an export basis
and transacted in United States dollars.
Because a significant portion of our operations consist of sales activities in foreign jurisdictions, our financial results may be affected by factors such as changes in foreign currency exchange rates or weak economic conditions in the markets in which we distribute products. During 2009, changes in foreign currency exchange rates decreased sales by approximately $20.4 million and income before income taxes by approximately $13.6 million.
We manage our foreign currency transaction risks through the use of forward contracts to hedge forecasted cash flows associated with foreign currency transaction exposures. We account for these forward contracts as cash flow hedges. To the extent these forward contracts meet hedge accounting criteria, changes in their fair value are not included in current earnings but are included in accumulated other comprehensive income (loss). These changes in fair value will be reclassified into earnings as a component of sales when the forecasted transaction occurs. The notional contract amounts for forward contracts outstanding at December 31, 2009 which have been accounted for as cash flow hedges totaled $80.2 million. Net realized losses recognized for forward contracts accounted for as cash flow hedges approximated $0.4 million for the year ended December 31, 2009. Net unrealized gains on forward contracts outstanding which have been accounted for as cash flow hedges and which have been included in accumulated other comprehensive income (loss) totaled $0.1 million at December 31, 2009. These unrealized gains will be recognized in income in 2010.
We also enter into forward contracts to exchange foreign currencies for United States dollars in order to hedge our currency transaction exposures on intercompany receivables denominated in foreign currencies. These forward contracts settle each month at month-end, at which time we enter into new forward contracts. We have not designated these forward contracts as hedges and have not applied hedge accounting to them. The notional contract amounts for forward contracts outstanding at December 31, 2009 which have not been designated as hedges totaled $28.6 million. Net realized losses recognized in connection with those forward contracts not accounted for as hedges approximated $3.9 million for the year ended December 31, 2009, offsetting gains on our intercompany receivables of $4.6 million for the year ended December 31, 2009. These gains and losses have been recorded in selling and administrative expense in the Consolidated Statements of Operations.
We record these forward foreign exchange contracts at fair value; the fair value for forward foreign exchange contracts outstanding at December 31, 2009 was $0.1 million and is included in Prepaid Expenses and Other Current Assets in the Consolidated Balance Sheets.
Refer to Note 13 in the Consolidated Financial Statements for further discussion.
Interest Rate Risk
At December 31, 2009, we had approximately $66.3 million of variable rate long-term debt outstanding under our senior credit agreement and an additional $29.0 million in accounts receivable sold under our accounts receivable sales agreement; we are not a party to any interest rate swap agreements as of December 31, 2009. Assuming no repayments other than our 2009 scheduled term loan payments, if market interest rates for similar borrowings and accounts receivable sales averaged 1.0% more in 2010 than they did in 2009, interest expense would increase, and income before income taxes would decrease by $0.9 million. Comparatively, if market interest rates for similar borrowings average 1.0% less in 2010 than they did in 2009, our interest expense would decrease, and income before income taxes would increase by $1.1 million.

16
C O N M E D C O R P O R AT I O N
Business Forward-Looking Statements
This Annual Report for the Fiscal Year Ended December 31, 2009 contains certain forward-looking statements (as such term is defined in the Private Securities Litigation Reform Act of 1995) and information relating to CONMED Corporation (“CONMED”, the “Company”, “we” or “us” — references to “CONMED”, the “Company”, “we” or “us” shall be deemed to include our direct and indirect subsidiaries unless the context otherwise requires) which are based on the beliefs of our management, as well as assumptions made by and information currently available to our management.
When used in this Annual Report, the words “estimate,” “project,” “believe,” “anticipate,” “intend,” “expect” and similar expressions are intended to identify forward-looking statements. These statements involve known and unknown risks, uncertainties and other factors which may cause our actual results, performance or achievements, or industry results, to be materially different from any future results, performance or achievements expressed or implied by such forward-looking statements. Such factors include, among others, the following:
• general economic and business conditions;
• changes in foreign exchange and interest rates;
• cyclical customer purchasing patterns due to budgetary and other constraints;
• changes in customer preferences;
• competition;
• changes in technology;
• the introduction and acceptance of new products;
• the ability to evaluate, finance and integrate acquired businesses, products and companies;
• changes in business strategy;
• the availability and cost of materials;
• the possibility that United States or foreign regulatory and/or administrative agencies may initiate enforcement actions against us or our distributors;
• future levels of indebtedness and capital spending;
• quality of our management and business abilities and the judgment of our personnel;
• the availability, terms and deployment of capital;
• the risk of litigation, especially patent litigation as well as the cost associated with patent and other litigation; and
• changes in regulatory requirements.

A N N U A L R E P O R T 2 0 0 9 17
The management of CONMED Corporation is responsible for establishing and maintaining adequate internal control over financial reporting. Internal control over financial reporting is a process designed to provide reasonable assurance regarding the reliability of financial reporting and the preparation of financial statements for external reporting purposes in accordance with generally accepted accounting principles. Our internal control over financial reporting includes policies and procedures that pertain to the maintenance of records that, in reasonable detail, accurately and fairly reflect transactions and dispositions of assets; provide reasonable assurances that transactions are recorded as necessary to permit preparation of financial statements in accordance with accounting principles generally accepted in the United States of America, and that receipts and expenditures are being made only in accordance with authorizations of management and the directors of the Company; and provide reasonable assurance regarding prevention or timely detection of unauthorized acquisition, use or disposition of our assets that could have a material effect on our financial statements. Because of its inherent limitations, internal control over financial reporting may not prevent or detect misstatements. Management assessed the effectiveness of CONMED’s internal control over financial reporting as of December 31, 2009. In making its assessment, management utilized the criteria set forth by the Committee of Sponsoring Organizations of the Treadway Commission (“COSO”) in “Internal Control-Integrated Framework”. Management has concluded that based on its assessment, CONMED’s internal control over financial reporting was effective as of December 31, 2009. The effectiveness of the Company’s internal control over financial reporting as of December 31, 2009 has been audited by PricewaterhouseCoopers LLP, an independent registered public accounting firm, as stated in their report which appears herein.
Joseph J. Corasanti Robert D. Shallish, Jr.President and Vice President-Finance andChief Executive Officer Chief Financial Officer
Management’s Report on Internal Control Over Financial Reporting
18
C O N M E D C O R P O R AT I O N
To the Board of Directors and Shareholders of CONMED Corporation
In our opinion, the accompanying consolidated balance sheets and the related consolidated statements of operations, of shareholders’ equity and of cash flows present fairly, in all material respects, the financial position of CONMED Corporation and its subsidiaries at December 31, 2009 and December 31, 2008, and the results of their operations and their cash flows for each of the three years in the period ended December 31, 2009 in conformity with accounting principles generally accepted in the United States of America. Also in our opinion, the Company maintained, in all material respects, effective internal control over financial reporting as of December 31, 2009, based on criteria established in Internal Control - Integrated Framework issued by the Committee of Sponsoring Organizations of the Treadway Commission (COSO). The Company’s management is responsible for these financial statements, for maintaining effective internal control over financial reporting and for its assessment of the effectiveness of internal control over financial reporting, included in the accompanying “Management’s Report On Internal Control Over Financial Reporting”. Our responsibility is to express opinions on these financial statements, and on the Company’s internal control over financial reporting based on our integrated audits. We conducted our audits in accordance with the standards of the Public Company Accounting Oversight Board (United States). Those standards require that we plan and perform the audits to obtain reasonable assurance about whether the financial statements are free of material misstatement and whether effective internal control over financial reporting was maintained in all material respects. Our audits of the financial statements included examining, on a test basis, evidence supporting the amounts and disclosures in the financial statements, assessing the accounting principles used and significant estimates made by management, and evaluating the overall financial statement presentation. Our audit of internal control over financial reporting included obtaining an understanding of internal control over financial reporting, assessing the risk that a material weakness exists, and testing and evaluating the design and operating effectiveness of internal control based on the assessed risk. Our audits also included performing such other procedures as we considered necessary in the circumstances. We believe that our audits provide a reasonable basis for our opinions.
As discussed in Note 16 to the consolidated financial statements, the Company changed the manner in which it accounts for convertible debt instruments effective January 1, 2009.
A company’s internal control over financial reporting is a process designed to provide reasonable assurance regarding the reliability of financial reporting and the preparation of financial statements for external purposes in accordance with generally accepted accounting principles. A company’s internal control over financial reporting includes those policies and procedures that (i) pertain to the maintenance of records that, in reasonable detail, accurately and fairly reflect the transactions and dispositions of the assets of the company; (ii) provide reasonable assurance that transactions are recorded as necessary to permit preparation of financial statements in accordance with generally accepted accounting principles, and that receipts and expenditures of the company are being made only in accordance with authorizations of management and directors of the company; and (iii) provide reasonable assurance regarding prevention or timely detection of unauthorized acquisition, use, or disposition of the company’s assets that could have a material effect on the financial statements.
Because of its inherent limitations, internal control over financial reporting may not prevent or detect misstatements. Also, projections of any evaluation of effectiveness to future periods are subject to the risk that controls may become inadequate because of changes in conditions, or that the degree of compliance with the policies or procedures may deteriorate.
PricewaterhouseCoopers LLP
Albany, New YorkFebruary 25, 2010
Report of Independent Registered Public Accounting Firm
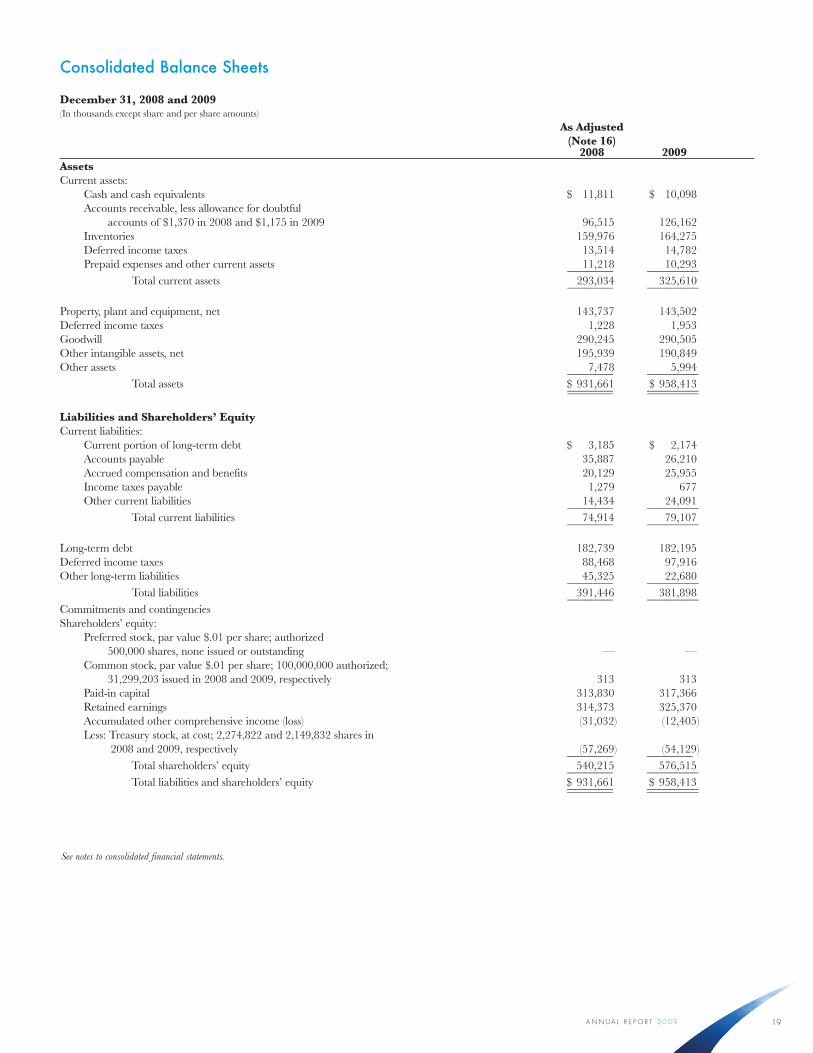
A N N U A L R E P O R T 2 0 0 9 19
December 31, 2008 and 2009(In thousands except share and per share amounts) As Adjusted (Note 16) 2008 2009AssetsCurrent assets: Cash and cash equivalents $ 11,811 $ 10,098 Accounts receivable, less allowance for doubtful accounts of $1,370 in 2008 and $1,175 in 2009 96,515 126,162 Inventories 159,976 164,275 Deferred income taxes 13,514 14,782 Prepaid expenses and other current assets 11,218 10,293 ________ _________ Total current assets 293,034 325,610 ________ _________
Property, plant and equipment, net 143,737 143,502Deferred income taxes 1,228 1,953Goodwill 290,245 290,505Other intangible assets, net 195,939 190,849Other assets 7,478 5,994 ________ _________ Total assets $ 931,661 $ 958,413 ________ _________ ________ _________
Liabilities and Shareholders’ EquityCurrent liabilities: Current portion of long-term debt $ 3,185 $ 2,174 Accounts payable 35,887 26,210 Accrued compensation and benefits 20,129 25,955 Income taxes payable 1,279 677 Other current liabilities 14,434 24,091 ________ _________ Total current liabilities 74,914 79,107 ________ _________
Long-term debt 182,739 182,195Deferred income taxes 88,468 97,916Other long-term liabilities 45,325 22,680 ________ _________ Total liabilities 391,446 381,898 ________ _________ Commitments and contingenciesShareholders’ equity: Preferred stock, par value $.01 per share; authorized 500,000 shares, none issued or outstanding — — Common stock, par value $.01 per share; 100,000,000 authorized; 31,299,203 issued in 2008 and 2009, respectively 313 313 Paid-in capital 313,830 317,366 Retained earnings 314,373 325,370 Accumulated other comprehensive income (loss) (31,032) (12,405) Less: Treasury stock, at cost; 2,274,822 and 2,149,832 shares in 2008 and 2009, respectively (57,269) (54,129) ________ ________ Total shareholders’ equity 540,215 576,515 ________ _________ Total liabilities and shareholders’ equity $ 931,661 $ 958,413 ________ _________ ________ _________
Consolidated Balance Sheets
See notes to consolidated financial statements.

20
C O N M E D C O R P O R AT I O N
Years Ended December 31, 2007, 2008 and 2009(In thousands except per share amounts) As Adjusted (Note 16) 2007 2008 2009Net sales $ 694,288 $ 742,183 $ 694,739Cost of sales 345,163 359,802 357,407 _________ _________ _________Gross profit 349,125 382,381 337,332 _________ _________ _________Selling and administrative expense 240,541 272,437 266,310Research and development expense 30,400 33,108 31,837Other expense (income) (2,807 ) 1,577 10,916 _________ _________ _________ 268,134 307,122 309,063 _________ _________ _________Income from operations 80,991 75,259 28,269Gain on early extinguishment of debt — 1,947 1,083Amortization of debt discount 4,618 4,823 4,111Interest expense 16,234 10,372 7,086 _________ _________ _________Income before income taxes 60,139 62,011 18,155Provision for income taxes 21,595 22,022 6,018 _________ _________ _________Net income $ 38,544 $ 39,989 $ 12,137 _________ _________ _________ _________ _________ _________Earnings per share Basic $ 1.36 $ 1.39 $ 0.42 Diluted 1.33 1.37 0.42
See notes to consolidated financial statements.
Consolidated Statements of Operations

A N N U A L R E P O R T 2 0 0 9 21
Years Ended December 31, 2007, 2008 and 2009(In thousands) As Adjusted (Note 16)
Accumulated Other Common Stock Paid-in Retained Comprehensive Treasury Shareholders’ __________________ Shares Amount Capital Earnings Income (Loss) Stock Equity
Balance at December 31, 2006 31,304 $ 313 $ 284,858 $ 247,425 $ (8,612) $ (83,630 ) $ 440,354 _______ _______ ________ ________ ________ _________ _________ _______ _______ ________ ________ ________ _________ _________ Adjustment for adoption of FASB guidance related to convertible debt — — 21,808 (5,614) — — 16,194 _______ _______ ________ ________ ________ _________ _________
Adjusted balance at December 31, 2006 31,304 $ 313 $ 306,666 $ 241,811 $ (8,612) $ (83,630 ) $ 456,548 _______ _______ ________ ________ ________ _________ _________ _______ _______ ________ ________ ________ _________ _________
Common stock issued under employee plans (5 ) (662) (4,031) 16,048 11,355
Tax benefit arising from common stock issued under employee plans (41) (41)
Stock-based compensation 3,771 3,771
Comprehensive income (loss):
Foreign currency translation adjustments 5,284
Pension liability (net of income tax expense of $1,654) 2,823
Net income 38,544
Total comprehensive income 46,651 _______ _______ ________ ________ ________ _________ _________
Balance at December 31, 2007 31,299 $ 313 $ 309,734 $ 276,324 $ (505) $ (67,582 ) $ 518,284 _______ _______ ________ ________ ________ _________ _________ _______ _______ ________ ________ ________ _________ _________
Common stock issued under employee plans (1,483) (1,940) 10,313 6,890
Tax benefit arising from common stock issued under employee plans 1,630 1,630
Stock-based compensation 4,178 4,178
Retirement of 2.50% convertible notes (229) (229)
Comprehensive income (loss):
Foreign currency translation adjustments (12,498)
Pension liability (net of income tax benefit of $10,566) (18,029)
Net income 39,989
Total comprehensive income 9,462 _______ _______ ________ ________ ________ _________ _________
Balance at December 31, 2008 31,299 $ 313 $ 313,830 $ 314,373 $ (31,032) $ (57,269 ) $ 540,215 _______ _______ ________ ________ ________ _________ _________ _______ _______ ________ ________ ________ _________ _________
Common stock issued under employee plans (1,245) (1,140) 3,140 755
Tax benefit arising from common stock issued under employee plans 561 561
Retirement of 2.50% convertible notes (88) (88)
Stock-based compensation 4,308 4,308
Comprehensive income:
Foreign currency translation adjustments 7,241
Pension liability (net of income tax expense of $6,629) 11,310
Cash flow hedging gain (net of income tax expense of $45) 76
Net income (loss) 12,137
Total comprehensive income 30,764 _______ _______ ________ ________ ________ _________ _________
Balance at December 31, 2009 31,299 $ 313 $ 317,366 $ 325,370 $ (12,405) $ (54,129) $ 576,515 _______ _______ ________ ________ ________ _________ _________ _______ _______ ________ ________ ________ _________ _________
Consolidated Statements of Shareholders’ Equity
See notes to consolidated financial statements.

22
C O N M E D C O R P O R AT I O N
Years Ended December 31, 2007, 2008 and 2009(In thousands) As Adjusted (Note 16)
2007 2008 2009Cash flows from operating activities: Net income $ 38,544 $ 39,989 $ 12,137 _________ _________ _________ Adjustments to reconcile net income to net cash provided by operating activities: Depreciation 13,101 14,641 18,651 Amortization of debt discount 4,618 4,823 4,111 Amortization, all other 18,433 17,695 18,521 Stock-based compensation 3,771 4,178 4,308 Deferred income taxes 15,008 16,304 4,241 Sale of accounts receivable to (collections on behalf of) purchaser 1,000 (3,000) (13,000) Income tax benefit of stock option exercises — 1,630 561 Excess tax benefit from stock option exercises — (1,738) (886) Gain on extinguishment of debt — (1,947) (1,083) Increase (decrease) in cash flows from changes in assets and liabilities, net of effects from acquisitions: Accounts receivable (6,301) (3,735) (12,879) Inventories (22,621) (8,110) (9,454) Accounts payable (2,414) (7,043) (7,400) Income taxes 3,118 2,627 (2,287) Accrued compensation and benefits 2,012 (238) 5,630 Other assets (83) (4,469) (197) Other liabilities (2,292) (10,458) 4,054 _________ _________ _________ 27,350 21,160 12,891 _________ _________ _________ Net cash provided by operating activities 65,894 61,149 25,028 _________ _________ _________Cash flows from investing activities: Payments related to business acquisitions, net of cash acquired (5,933) (22,023) (330) Purchases of property, plant and equipment (20,910) (35,879) (21,444) _________ _________ _________ Net cash used in investing activities (26,843) (57,902) (21,774) _________ _________ _________Cash flows from financing activities: Net proceeds from common stock issued under employee plans 11,355 7,347 1,198 Excess tax benefit from stock options exercises — 1,738 886 Payments on senior credit agreement (44,000) (1,350) (1,350) Proceeds of senior credit agreement — 4,000 6,000 Payments on mortgage notes (990) (1,109) (1,425) Payments on senior subordinated notes — (20,248) (7,808) Net change in cash overdrafts (1,770) 4,270 (1,188) _________ _________ _________ Net cash used in financing activities (35,405) (5,352) (3,687) _________ _________ _________Effect of exchange rate changes on cash and cash equivalents 4,218 2,221 (1,280) _________ _________ _________Net increase (decrease) in cash and cash equivalents 7,864 116 (1,713)Cash and cash equivalents at beginning of year 3,831 11,695 11,811 _________ _________ _________Cash and cash equivalents at end of year $ 11,695 $ 11,811 $ 10,098 _________ _________ _________ _________ _________ _________Supplemental disclosures of cash flow information: Cash paid during the year for: Interest $ 14,386 $ 9,381 $ 6,303 Income taxes 4,172 7,397 3,650
See notes to consolidated financial statements.
Consolidated Statements of Cash Flows

A N N U A L R E P O R T 2 0 0 9 23
Note 1 — Operations and Significant Accounting Policies
Organization and operations
CONMED Corporation (“CONMED”, the “Company”, “we” or “us”) is a medical technology company with an emphasis on surgical devices and equipment for minimally invasive procedures and monitoring. The Company’s products serve the clinical areas of arthroscopy, powered surgical instruments, electrosurgery, cardiac monitoring disposables, endosurgery and endoscopic technologies. They are used by surgeons and physicians in a variety of specialties including orthopedics, general surgery, gynecology, neurosurgery, and gastroenterology.
Principles of consolidation
The consolidated financial statements include the accounts of CONMED Corporation and its controlled subsidiaries. All significant intercompany accounts and transactions have been eliminated.
Use of estimates
The preparation of financial statements in conformity with accounting principles generally accepted in the United States of America requires management to make estimates and judgments which affect the reported amounts of assets, liabilities, related disclosure of contingent assets and liabilities at the date of the financial statements, and the reported amount of revenues and expenses during the reporting period. Estimates are used in accounting for, among other things, allowances for doubtful accounts, rebates and sales allowances, inventory allowances, purchased in-process research and development, pension benefits, goodwill and intangible assets, contingencies and other accruals. We base our estimates on historical experience and on various other assumptions which are believed to be reasonable under the circumstances. Due to the inherent uncertainty involved in making estimates, actual results reported in future periods may differ from those estimates. Estimates and assumptions are reviewed periodically, and the effect of revisions are reflected in the consolidated financial statements in the period they are determined to be necessary.
Cash and cash equivalents
We consider all highly liquid investments with an original maturity of three months or less to be cash equivalents.
Accounts receivable sale
We have an accounts receivable sales agreement pursuant to which we and certain of our subsidiaries sell on an ongoing basis certain accounts receivable to CONMED Receivables Corporation (“CRC”), a wholly-owned, bankruptcy-remote, special-purpose subsidiary of CONMED Corporation. CRC may in turn sell up to an aggregate $40.0 million undivided percentage ownership interest in such receivables (the “asset interest”) to a bank (the “purchaser”). The purchaser’s share of collections on accounts receivable are calculated as defined in the accounts receivable sales agreement, as amended. Effectively, collections on the pool of receivables flow first to the purchaser and then to CRC, but to the extent that the purchaser’s share of collections may be less than the amount of the purchaser’s asset interest, there is no recourse to CONMED or CRC for such shortfall. For receivables which have been sold, CONMED Corporation and its subsidiaries retain collection and administrative responsibilities as agent for the purchaser. As of December 31, 2008 and 2009, the undivided percentage ownership interest in receivables sold by CRC to the purchaser aggregated $42.0 million and $29.0 million, respectively, which has been accounted for as a sale and reflected in the balance sheet as a reduction in accounts receivable. Expenses associated with the sale of accounts receivable, including the purchaser’s financing costs to purchase the accounts receivable, were $2.9 million, $1.7 million and $0.5 million, in 2007, 2008 and 2009, respectively, and are included in interest expense.
There are certain statistical ratios, primarily related to sales dilution and losses on accounts receivable, which must be calculated and maintained on the pool of receivables in order to continue selling to the purchaser. The pool of receivables is in compliance with these ratios. Management believes that additional accounts receivable arising in the normal course of business will be of sufficient quality and quantity to meet the requirements for sale under the accounts receivables sales agreement. In the event that new accounts receivable arising in the normal course of business do not qualify for sale, then collections on sold receivables will flow to the purchaser rather than being used to fund new receivable purchases. To the extent that such collections would not be available to CONMED in the form of new receivables purchases, we would need to access an alternate source of working capital, such as our $100 million revolving credit facility. Our accounts receivable sales agreement, as amended, also requires us to obtain a commitment (the “purchaser commitment”) from the purchaser to fund the purchase of our accounts receivable. The purchaser commitment was amended effective October 30, 2009 whereby the purchase commitment was decreased from $50.0 million to $40.0 million and extended through October 29, 2010 under otherwise substantially the same terms and conditions.
In June 2009, the Financial Accounting Standards Board (“FASB”) issued guidance which requires additional disclosures about the transfer and derecognition of financial assets, eliminates the concept of qualifying special-purpose entities, creates more stringent conditions for reporting a transfer of a portion of a financial asset as a sale, clarifies other sale-accounting criteria, and changes the initial measurement of a transferor’s interest in transferred financial assets. This guidance is effective for fiscal years beginning after November 15, 2009. As a result of this new guidance, our accounts receivable sales agreement will no longer be permitted to be accounted for as a sale and reduction in accounts receivable beginning in 2010. As a result, accounts receivable sold under the agreement will be recorded as additional borrowings rather than as a reduction in accounts receivable.
Inventories
Inventories are valued at the lower of cost or market. Cost is determined on the FIFO (first-in, first-out) method of accounting.
Property, plant and equipment
Property, plant and equipment are stated at cost and depreciated using the straight-line method over the following estimated useful lives:
Building and improvements 40 years Leasehold improvements Shorter of life of asset or life of lease Machinery and equipment 2 to 15 years
Goodwill and other intangible assets
We have a history of growth through acquisitions. Assets and liabilities of acquired businesses are recorded at their estimated fair values as of the date of acquisition. Goodwill represents costs in excess of fair values assigned to the underlying net assets of acquired businesses. Other intangible assets primarily represent allocations of purchase price to identifiable intangible assets of acquired businesses. We have accumulated goodwill of $290.5 million and other intangible assets of $190.8 million as of December 31, 2009.
In accordance with FASB guidance, goodwill and intangible assets deemed to have indefinite lives are not amortized, but are subject to at least annual impairment testing. It is our policy to perform our annual impairment testing in the fourth quarter. The identification and measurement of goodwill impairment involves the estimation of the fair value of our reporting units. Estimates of fair value are based on the best information available as of the date of the assessment, which primarily incorporate management assumptions about expected future cash flows and other valuation techniques. Future cash flows may be affected by changes in industry or market conditions or the rate and extent to which anticipated synergies or cost savings are realized
Notes to Consolidated Financial Statements

24
C O N M E D C O R P O R AT I O N
with newly acquired entities. We completed our goodwill impairment testing as of October 1, 2009 and determined that no impairment existed at that date. For our CONMED Electrosurgery, CONMED Endosurgery and CONMED Linvatec operating units, our impairment testing utilized CONMED Corporation’s EBIT multiple adjusted for a market-based control premium with the resultant fair values exceeding carrying values by 55% to 140%. Our CONMED Patient Care operating unit has the least excess of fair value over carrying value of our reporting units; we therefore utilized both a market-based approach and an income approach when performing impairment testing with the resultant fair value exceeding carrying value by 16%. The income approach contained certain key assumptions including that revenue would resume historical growth patterns in 2010 while including certain cost savings associated with the operational restructuring plan completed during 2009. We continue to monitor events and circumstances for triggering events which would more likely than not reduce the fair value of any of our reporting units and require us to perform impairment testing.
Intangible assets with a finite life are amortized over the estimated useful life of the asset and are evaluated each reporting period to determine whether events and circumstances warrant a revision to the remaining period of amortization. Intangible assets subject to amortization are reviewed for impairment whenever events or changes in circumstances indicate that its carrying amount may not be recoverable. The carrying amount of an intangible asset subject to amortization is not recoverable if it exceeds the sum of the undiscounted cash flows expected to result from the use of the asset. An impairment loss is recognized by reducing the carrying amount of the intangible asset to its current fair value.
Customer relationship assets arose principally as a result of the 1997 acquisition of Linvatec Corporation. These assets represent the acquisition date fair value of existing customer relationships based on the after-tax income expected to be derived during their estimated remaining useful life. The useful lives of these customer relationships were not and are not limited by contract or any economic, regulatory or other known factors. The estimated useful life of the Linvatec customer relationship assets was determined as of the date of acquisition as a result of a study of the observed pattern of historical revenue attrition during the 5 years immediately preceding the acquisition of Linvatec Corporation. This observed attrition pattern was then applied to the existing customer relationships to derive the future expected retirement of the customer relationships. This analysis indicated an annual attrition rate of 2.6%. Assuming an exponential attrition pattern, this equated to an average remaining useful life of approximately 38 years for the Linvatec customer relationship assets. Customer relationship intangible assets arising as a result of other business acquisitions are being amortized over a weighted average life of 17 years. The weighted average life for customer relationship assets in aggregate is 34 years.
We evaluate the remaining useful life of our customer relationship intangible assets each reporting period in order to determine whether events and circumstances warrant a revision to the remaining period of amortization. In order to further evaluate the remaining useful life of our customer relationship intangible assets, we perform an annual analysis and assessment of actual customer attrition and activity. This assessment includes a comparison of customer activity since the acquisition date and review of customer attrition rates. In the event that our analysis of actual customer attrition rates indicates a level of attrition that is in excess of that which was originally contemplated, we would change the estimated useful life of the related customer relationship asset with the remaining carrying amount amortized prospectively over the revised remaining useful life.
We test our customer relationship assets for recoverability whenever events or changes in circumstances indicate that the carrying amount may not be recoverable. Factors specific to our customer relationship assets which might lead to an impairment charge include a significant increase in the annual customer attrition rate or otherwise significant loss of customers, significant decreases in sales or current-period operating or cash flow losses or a projection or forecast of losses. We
do not believe that there have been events or changes in circumstances which would indicate the carrying amount of our customer relationship assets might not be recoverable.
Other long-lived assets
We review asset carrying amounts for impairment (consisting of intangible assets subject to amortization and property, plant and equipment) whenever events or circumstances indicate that such carrying amounts may not be recoverable. If the sum of the expected future undiscounted cash flows is less than the carrying amount of the asset, an impairment loss is recognized by reducing the recorded value to its current fair value.
Fair value of financial instruments
The carrying amounts reported in our balance sheets for cash and cash equivalents, accounts receivable, accounts payable and long-term debt excluding the 2.50% convertible senior subordinated notes (the “Notes”) approximate fair value. The fair value of the Notes approximated $97.2 million and $108.3 million at December 31, 2008 and 2009, respectively, based on their quoted market price.
Translation of foreign currency financial statements
Assets and liabilities of foreign subsidiaries have been translated into United States dollars at the applicable rates of exchange in effect at the end of the period reported. Revenues and expenses have been translated at the applicable weighted average rates of exchange in effect during the period reported. Translation adjustments are reflected in accumulated other comprehensive income (loss). Transaction gains and losses are included in net income.
Foreign Exchange and Hedging Activity
We manage our foreign currency transaction risks through the use of forward contracts to hedge forecasted cash flows associated with foreign currency transaction exposures. We account for these forward contracts as cash flow hedges. To the extent these forward contracts meet hedge accounting criteria, changes in their fair value are not included in current earnings but are included in accumulated other comprehensive income (loss). These changes in fair value will be reclassified into earnings as a component of sales when the forecasted transaction occurs.
We also enter into forward contracts to exchange foreign currencies for United States dollars in order to hedge our currency transaction exposures on intercompany receivables denominated in foreign currencies. These forward contracts settle each month at month-end, at which time we enter into new forward contracts. We have not designated these forward contracts as hedges and have not applied hedge accounting to them. We record these forward contracts at fair value with resulting gains and losses included in selling and administrative expense in the Consolidated Statements of Income.
Income taxes
Deferred income tax assets and liabilities are based on the difference between the financial statement and tax basis of assets and liabilities and operating loss and tax credit carryforwards as measured by the enacted tax rates that are anticipated to be in effect in the respective jurisdictions when these differences reverse. The deferred income tax provision generally represents the net change in the assets and liabilities for deferred income taxes. A valuation allowance is established when it is necessary to reduce deferred income tax assets to amounts for which realization is likely.
Deferred income taxes are not provided on the unremitted earnings of subsidiaries outside of the United States when it is expected that these earnings are permanently reinvested. Such earnings may become taxable upon the sale or liquidation of these subsidiaries or upon the remittance of dividends. Deferred income taxes are provided when the Company no longer considers subsidiary earnings to be permanently invested, such as in situations where the Company’s subsidiaries plan to make future dividend distributions.
On January 1, 2007 we adopted the provisions for accounting for

A N N U A L R E P O R T 2 0 0 9 25
uncertainty in income taxes. Such guidance prescribes a recognition threshold and measurement attribute for the financial statement recognition and measurement of a tax position taken or expected to be taken in a tax return. The impact of this pronouncement was not material to the Company’s consolidated financial statements. See Note 6 to the Consolidated Financial Statements for further discussion.
Revenue recognition
Revenue is recognized when title has been transferred to the customer which is at the time of shipment. The following policies apply to our major categories of revenue transactions:
• Sales to customers are evidenced by firm purchase orders. Title and the risks and rewards of ownership are transferred to the customer when product is shipped under our stated shipping terms. Payment by the customer is due under fixed payment terms.
• We place certain of our capital equipment with customers in return for commitments to purchase disposable products over time periods generally ranging from one to three years. In these circumstances, no revenue is recognized upon capital equipment shipment and we recognize revenue upon the disposable product shipment. The cost of the equipment is amortized over the term of individual commitment agreements.
• Product returns are only accepted at the discretion of the Company and in accordance with our “Returned Goods Policy”. Historically the level of product returns has not been significant. We accrue for sales returns, rebates and allowances based upon an analysis of historical customer returns and credits, rebates, discounts and current market conditions.
• Our terms of sale to customers generally do not include any obligations to perform future services. Limited warranties are provided for capital equipment sales and provisions for warranty are provided at the time of product sale based upon an analysis of historical data.
• Amounts billed to customers related to shipping and handling have been included in net sales. Shipping and handling costs included in selling and administrative expense were $14.1 million, $13.4 million and $11.3 million for 2007, 2008 and 2009, respectively.
• We sell to a diversified base of customers around the world and, therefore, believe there is no material concentration of credit risk.
• We assess the risk of loss on accounts receivable and adjust the allowance for doubtful accounts based on this risk assessment. Historically, losses on accounts receivable have not been material. Management believes that the allowance for doubtful accounts of $1.2 million at December 31, 2009 is adequate to provide for probable losses resulting from accounts receivable.
Earnings per shareBasic earnings per share (“basic EPS”) is computed by dividing net income by the weighted average number of shares outstanding for the reporting period. Diluted earnings per share (“diluted EPS”) gives effect during the reporting period to all dilutive potential shares outstanding resulting from employee share-based awards. The following table sets forth the calculation of basic and diluted earnings per share at December 31, 2007, 2008 and 2009, respectively:
2007 2008 2009Net income $ 38,544 $ 39,989 $ 12,137 ________ ________ ________ ________ ________ ________Basic-weighted average shares outstanding 28,416 28,796 29,074Effect of dilutive potential securities 549 431 68 ________ ________ ________ Diluted-weighted average shares outstanding 28,965 29,227 29,142 ________ ________ ________ ________ ________ ________Basic EPS $ 1.36 $ 1.39 $ 0.42 ________ ________ ________ ________ ________ ________Diluted EPS $ 1.33 $ 1.37 $ 0.42 ________ ________ ________ ________ ________ ________
The shares used in the calculation of diluted EPS exclude options to purchase shares where the exercise price was greater than the average market price of common shares for the year. Such shares aggregated approximately 0.9 and 2.2 million at December 31, 2008 and 2009, respectively. Upon conversion of our 2.50% convertible senior subordinated notes (the “Notes”), the holder of each Note will receive the conversion value of the Note payable in cash up to the principal amount of the Note and CONMED common stock for the Note’s conversion value in excess of such principal amount. As of December 31, 2009, our share price has not exceeded the conversion price of the Notes, therefore the conversion value was less than the principal amount of the Notes. Under the net share settlement method, there were no potential shares issuable under the Notes to be used in the calculation of diluted EPS. The maximum number of shares we may issue with respect to the Notes is 5,750,000.
Stock-based compensation
We adopted FASB guidance related to stock-based compensation effective January 1, 2006. Such guidance requires that all share-based payments to employees, including grants of employee stock options, restricted stock units, and stock appreciation rights be recognized in the financial statements based on their fair values. Prior to January 1, 2006, no compensation expense was recognized for stock options under the provisions of previous guidance since all options granted had an exercise price equal to the market value of the underlying stock on the grant date.
We adopted the new guidance using the modified prospective transition method. Under this method, the provisions apply to all awards granted or modified after the date of adoption. In addition, compensation expense must be recognized for any nonvested stock option awards outstanding as of the date of adoption. We recognize such expense using a straight-line method over the vesting period. Prior periods have not been restated.
We elected to adopt the alternative transition method to calculate the tax effects of stock-based compensation for those employee awards that were outstanding upon adoption. The alternative transition method allows the use of a simplified method to calculate the beginning pool of excess tax benefits available to absorb tax deficiencies recognized subsequent to the adoption. The Company’s policy for intra-period tax allocation is the with and without approach for utilization of tax attributes.
During 2007, we began issuing shares under our stock-based compensation plans out of treasury stock whereby treasury stock is reduced by the weighted average cost of such treasury stock. To the extent there is a difference between the cost of the treasury stock and the exercise price of shares issued under stock-based compensation plans, we record gains to paid in capital; losses are recorded to paid in capital to the extent any gain was previously recorded, otherwise the loss is recorded to retained earnings.
Accumulated other comprehensive income (loss)
Accumulated other comprehensive income (loss) consists of the following: Accumulated Cash Flow Cumulative Other Hedging Pension Translation Comprehensive Gain Liability Adjustments Income (loss)Balance, December 31, 2008 $ — $ (27,592) $ (3,440) $ (31,032)Pension liability, net of income tax — 11,310 — 11,310Cash flow hedging gain, net of income tax 76 — — 76Foreign currency translation adjustments — — 7,241 7,241 ________ _________ _________ _________Balance, December 31, 2009 $ 76 $ (16,282) $ 3,801 $ (12,405) ________ _________ _________ _________ ________ _________ _________ _________
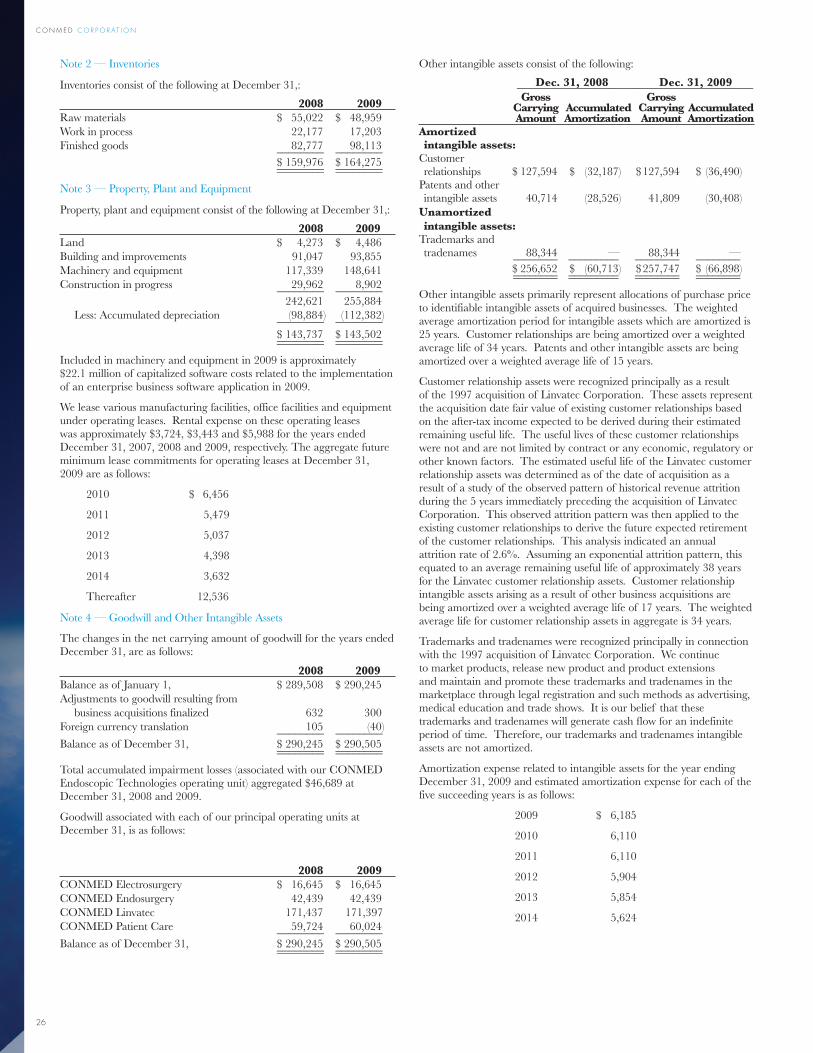
26
C O N M E D C O R P O R AT I O N
Note 2 — Inventories
Inventories consist of the following at December 31,:
2008 2009Raw materials $ 55,022 $ 48,959Work in process 22,177 17,203Finished goods 82,777 98,113 ________ ________ $ 159,976 $ 164,275 ________ ________ ________ ________
Note 3 — Property, Plant and Equipment
Property, plant and equipment consist of the following at December 31,:
2008 2009Land $ 4,273 $ 4,486Building and improvements 91,047 93,855Machinery and equipment 117,339 148,641Construction in progress 29,962 8,902 ________ ________ 242,621 255,884 Less: Accumulated depreciation (98,884 ) (112,382) ________ ________ $ 143,737 $ 143,502 ________ ________ ________ ________
Included in machinery and equipment in 2009 is approximately $22.1 million of capitalized software costs related to the implementation of an enterprise business software application in 2009.
We lease various manufacturing facilities, office facilities and equipment under operating leases. Rental expense on these operating leases was approximately $3,724, $3,443 and $5,988 for the years ended December 31, 2007, 2008 and 2009, respectively. The aggregate future minimum lease commitments for operating leases at December 31, 2009 are as follows:
2010 $ 6,456
2011 5,479
2012 5,037
2013 4,398
2014 3,632
Thereafter 12,536
Note 4 — Goodwill and Other Intangible Assets
The changes in the net carrying amount of goodwill for the years ended December 31, are as follows:
2008 2009Balance as of January 1, $ 289,508 $ 290,245 Adjustments to goodwill resulting from business acquisitions finalized 632 300Foreign currency translation 105 (40) ________ ________Balance as of December 31, $ 290,245 $ 290,505 ________ ________ ________ ________
Total accumulated impairment losses (associated with our CONMED Endoscopic Technologies operating unit) aggregated $46,689 at December 31, 2008 and 2009.
Goodwill associated with each of our principal operating units at December 31, is as follows:
2008 2009CONMED Electrosurgery $ 16,645 $ 16,645CONMED Endosurgery 42,439 42,439CONMED Linvatec 171,437 171,397CONMED Patient Care 59,724 60,024 ________ ________Balance as of December 31, $ 290,245 $ 290,505 ________ ________ ________ ________
Other intangible assets consist of the following:
Dec. 31, 2008 Dec. 31, 2009 _________________________________________ Gross Gross Carrying Accumulated Carrying Accumulated Amount Amortization Amount AmortizationAmortized intangible assets:
Customer relationships $ 127,594 $ (32,187) $ 127,594 $ (36,490)Patents and other intangible assets 40,714 (28,526) 41,809 (30,408)Unamortized intangible assets:
Trademarks and tradenames 88,344 — 88,344 — ________ _________ ________ ________ $ 256,652 $ (60,713) $ 257,747 $ (66,898) ________ _________ ________ ________ ________ _________ ________ ________
Other intangible assets primarily represent allocations of purchase price to identifiable intangible assets of acquired businesses. The weighted average amortization period for intangible assets which are amortized is 25 years. Customer relationships are being amortized over a weighted average life of 34 years. Patents and other intangible assets are being amortized over a weighted average life of 15 years.
Customer relationship assets were recognized principally as a result of the 1997 acquisition of Linvatec Corporation. These assets represent the acquisition date fair value of existing customer relationships based on the after-tax income expected to be derived during their estimated remaining useful life. The useful lives of these customer relationships were not and are not limited by contract or any economic, regulatory or other known factors. The estimated useful life of the Linvatec customer relationship assets was determined as of the date of acquisition as a result of a study of the observed pattern of historical revenue attrition during the 5 years immediately preceding the acquisition of Linvatec Corporation. This observed attrition pattern was then applied to the existing customer relationships to derive the future expected retirement of the customer relationships. This analysis indicated an annual attrition rate of 2.6%. Assuming an exponential attrition pattern, this equated to an average remaining useful life of approximately 38 years for the Linvatec customer relationship assets. Customer relationship intangible assets arising as a result of other business acquisitions are being amortized over a weighted average life of 17 years. The weighted average life for customer relationship assets in aggregate is 34 years.
Trademarks and tradenames were recognized principally in connection with the 1997 acquisition of Linvatec Corporation. We continue to market products, release new product and product extensions and maintain and promote these trademarks and tradenames in the marketplace through legal registration and such methods as advertising, medical education and trade shows. It is our belief that these trademarks and tradenames will generate cash flow for an indefinite period of time. Therefore, our trademarks and tradenames intangible assets are not amortized.
Amortization expense related to intangible assets for the year ending December 31, 2009 and estimated amortization expense for each of the five succeeding years is as follows:
2009 $ 6,185
2010 6,110
2011 6,110
2012 5,904
2013 5,854
2014 5,624

A N N U A L R E P O R T 2 0 0 9 27
Note 5 — Long-Term Debt
Long-term debt consists of the following at December 31,:
2008 2009Revolving line of credit $ 4,000 $ 10,000Term loan borrowings on senior credit facility 57,638 56,2872.50% convertible senior subordinated notes 111,549 106,770Mortgage notes 12,737 11,312 ________ ________ Total long-term debt 185,924 184,369Less: Current portion 3,185 2,174 ________ ________ $ 182,739 $ 182,195 ________ ________ ________ ________
Our $235.0 million senior credit agreement (the “senior credit agreement”) consists of a $100.0 million revolving credit facility and a $135.0 million term loan. There were $10.0 million in borrowings outstanding on the revolving credit facility as of December 31, 2009. Our available borrowings on the revolving credit facility at December 31, 2009 were $81.6 million with approximately $8.4 million of the facility set aside for outstanding letters of credit. There were $56.3 million in borrowings outstanding on the term loan at December 31, 2009.
Borrowings outstanding on the revolving credit facility are due and payable on April 12, 2011. The scheduled principal payments on the term loan portion of the senior credit agreement are $1.4 million annually through December 2011, increasing to $53.6 million in 2012 with the remaining balance outstanding due and payable on April 12, 2013. We may also be required, under certain circumstances, to make additional principal payments based on excess cash flow as defined in the senior credit agreement. Interest rates on the term loan portion of the senior credit agreement are at LIBOR plus 1.50% (1.75% at December 31, 2009) or an alternative base rate; interest rates on the revolving credit facility portion of the senior credit agreement are at LIBOR plus 1.50% or an alternative base rate (3.625% at December 31, 2009). For those borrowings where the Company elects to use the alternative base rate, the base rate will be the greater of the Prime Rate or the Federal Funds Rate in effect on such date plus 0.50%, plus a margin of 0.50% for term loan borrowings or 0.25% for borrowings under the revolving credit facility.
The senior credit agreement is collateralized by substantially all of our personal property and assets, except for our accounts receivable and related rights which are pledged in connection with our accounts receivable sales agreement. The senior credit agreement contains covenants and restrictions which, among other things, require the maintenance of certain financial ratios, and restrict dividend payments and the incurrence of certain indebtedness and other activities, including acquisitions and dispositions. We are also required, under certain circumstances, to make mandatory prepayments from net cash proceeds from any issuance of equity and asset sales.
We have a mortgage note outstanding in connection with the property and facilities utilized by our CONMED Linvatec subsidiary bearing interest at 8.25% per annum with semiannual payments of principal and interest through June 2019. The principal balance outstanding on the mortgage note aggregated $11.3 million at December 31, 2009. The mortgage note is collateralized by the CONMED Linvatec property and facilities.
We have outstanding $115.1 million in 2.50% convertible senior subordinated notes due 2024. During the year ended December 31, 2008, we repurchased and retired $25.0 million of the Notes for $20.2 million and recorded a gain on the early extinguishment of debt of $1.9 million net of the write-off of $0.4 million in unamortized deferred financing costs and $2.4 million in unamortized debt discount. During the year ended December 31, 2009, we repurchased and retired $9.9 million of the Notes for $7.8 million and recorded a gain on the early extinguishment of debt of $1.1 million net of the write-offs of $0.1 million in unamortized deferred financing costs and $1.0 million in unamortized debt discount. The Notes represent subordinated
unsecured obligations and are convertible under certain circumstances, as defined in the bond indenture, into a combination of cash and CONMED common stock. Upon conversion, the holder of each Note will receive the conversion value of the Note payable in cash up to the principal amount of the Note and CONMED common stock for the Note’s conversion value in excess of such principal amount. Amounts in excess of the principal amount are at an initial conversion rate, subject to adjustment, of 26.1849 shares per $1,000 principal amount of the Note (which represents an initial conversion price of $38.19 per share). As of December 31, 2009, there was no value assigned to the conversion feature because the Company’s share price was below the conversion price. The Notes mature on November 15, 2024 and are not redeemable by us prior to November 15, 2011. Holders of the Notes have the right to put to us some or all of the Notes for repurchase on November 15, 2011, 2014 and 2019 and, provided the terms of the indenture are satisfied, we will be required to repurchase those Notes.
The Notes contain two embedded derivatives. The embedded derivatives are recorded at fair value in other long-term liabilities and changes in their value are recorded through the consolidated statements of income. The embedded derivatives have a nominal value, and it is our belief that any change in their fair value would not have a material adverse effect on our business, financial condition, results of operations, or cash flows.
In May 2008, the FASB issued guidance which specifies that issuers of convertible debt instruments that permit or require the issuer to pay cash upon conversion should separately account for the liability and equity components in a manner that will reflect the entity’s nonconvertible debt borrowing rate when interest cost is recognized in subsequent periods. The Company was required to apply the guidance retrospectively to all past periods presented. We adopted this guidance on January 1, 2009 related to our 2.50% convertible senior subordinated notes due 2024.
Our effective borrowing rate for nonconvertible debt at the time of issuance of the Notes was estimated to be 6.67%, which resulted in $34.6 million of the $150.0 million aggregate principal amount of Notes issued, or $21.8 million after taxes, being attributable to equity. For the year ended December 31, 2007, 2008 and 2009, we have recorded interest expense related to the amortization of debt discount on the Notes of $4.6 million, $4.8 million and $4.1 million, respectively, at the effective interest rate of 6.67%. The debt discount on the Notes is being amortized through November 2011. For the years ended December 31, 2007, 2008 and 2009, we have recorded interest expense on the Notes of $3.8 million, $3.7 million and $2.9 million, respectively, at the contractual coupon rate of 2.50%.
Amounts recognized in the consolidated balance sheets related to the Notes consist of the following at December 31,:
2008 2009Principal value of the Notes $ 125,000 $ 115,093Unamortized discount (13,451) (8,323) ________ ________Carrying value of the Notes $ 111,549 $ 106,770 ________ ________ ________ ________Equity component $ 21,579 $ 21,491 ________ ________ ________ ________
The scheduled maturities of long-term debt outstanding at December 31, 2009 are as follows:
2010 $ 2,174
2011 12,244
2012 54,556
2013 1,050
2014 1,140
Thereafter 121,528

28
C O N M E D C O R P O R AT I O N
Note 6 — Income Taxes
The provision for income taxes for the years ended December 31, 2007, 2008 and 2009 consists of the following:
2007 2008 2009Current tax expense: Federal $ 2,634 $ 2,094 $ (1,281) State 1,102 498 791 Foreign 2,851 3,126 2,267 _______ _______ ________ 6,587 5,718 1,777Deferred income tax expense 15,008 16,304 4,241 _______ _______ ________ Provision for income taxes $ 21,595 $ 22,022 $ 6,018 _______ _______ ________ _______ _______ ________
A reconciliation between income taxes computed at the statutory federal rate and the provision for income taxes for the years ended December 31, 2007, 2008 and 2009 follows: 2007 2008 2009Tax provision at statutory rate based on income before income taxes 35.00% 35.00% 35.00%State income taxes 1.77 1.47 5.59Stock-based compensation 0.60 0.43 1.59Foreign income taxes 0.20 (0.58) (2.90)Research and development credit (1.29) (1.45) (4.46)Settlement of taxing authority examinations (1.05) — (5.60)Other nondeductible permanent differences .68 0.91 2.86Other, net — (0.27) 1.07 _______ _______ ________
35.91% 35.51% 33.15% _______ _______ ________ _______ _______ ________
The tax effects of the significant temporary differences which comprise the deferred income tax assets and liabilities at December 31, 2008 and 2009 are as follows: 2008 2009Assets: Inventory $ 4,376 $ 3,912 Net operating losses 2,493 780 Capitalized research and development — 4,757 Deferred compensation 2,302 2,331 Accounts receivable 2,534 2,524 Employee benefits 1,582 2,157 Accrued pension 11,783 3,436 Research and development credit 3,004 3,814 Foreign tax credit 1,140 1,513 Other 4,250 10,390 Valuation allowance (2,069) (1,058) ________ ________ 31,395 34,556 ________ ________Liabilities: Goodwill and intangible assets 83,524 95,049 Depreciation 6,054 4,548 State taxes 1,250 2,090 Contingent interest 14,293 14,050 ________ ________ 105,121 115,737 ________ ________ Net liability $ (73,726) $ (81,181) ________ ________ ________ ________
Income before income taxes consists of the following U.S. and foreign income: 2007 2008 2009U.S. income $ 53,046 $ 51,616 $ 10,108Foreign income 7,093 10,395 8,047 ________ ________ ________Total income $ 60,139 $ 62,011 $ 18,155 ________ ________ ________ ________ ________ ________
The net operating loss carryforward of an acquired subsidiary begins to expire in 2023. The net operating loss carryforward is subject to a pre-existing ownership change limitation under IRC section 382 as a result of the purchase of stock of the acquired subsidiary. The annual existing ownership change limitation on the acquired net operating loss is $2.1 million. We have established a valuation allowance to reflect the uncertainty of realizing the benefit of the net operating loss carryforward recognized in connection with an acquisition. Changes in deferred tax valuation allowances and income tax uncertainties after the acquisition date, including those associated with acquisitions generally will affect income tax expense.
The gross amount of Federal net operating loss carryforwards available is $3.8 million. This includes $2.1 million of net operating loss carryforward from an acquired subsidiary as discussed above. The remaining $1.7 million begins to expire in 2026. Approximately $1.7 million of the gross Federal net operating loss is attributable to stock-based compensation windfall tax deductions. In accordance with FASB guidance, the $0.6 million windfall tax benefit on the $1.7 million net operating loss carryforward has not been recorded as a deferred tax asset. The $0.6 million tax benefit will be recorded in additional paid-in capital when realized.
The amount of Federal Research and Development credit carryforward available is $3.8 million. These credits begin to expire in 2024. The total amount of Federal Foreign Tax Credit carryforward available is $1.5 million. These credits begin to expire in 2017.
Deferred tax amounts include approximately $3.5 million of future tax benefits associated with state tax credits which have an indefinite carryforward period.
We operate in multiple taxing jurisdictions, both within and outside the United States. We face audits from these various tax authorities regarding the amount of taxes due. Such audits can involve complex issues and may require an extended period of time to resolve. Our Federal income tax returns have been examined by the Internal Revenue Service (“IRS”) for calendar years ending through 2007.
We have not provided for federal income taxes on undistributed earnings of our foreign subsidiaries as it remains our intention to permanently reinvest such earnings (approximately $41.0 million at December 31, 2009.) It is not practicable given the complexities of the foreign tax credit calculation to estimate the tax due upon any possible repatriation.
On January 1, 2007 we adopted the provisions of accounting for uncertainty in income taxes that prescribe a recognition threshold and measurement attribute for the financial statement recognition and measurement of a tax position taken or expected to be taken in a tax return. The impact of this pronouncement was not material to the Company’s consolidated financial statements.
The following table summarizes the activity related to our unrecognized tax benefits for the years ending December 31,: 2007 2008 2009Balance as of January 1, $ 1,359 $ 1,866 $ 2,869Increases (decreases) for positions taken in prior periods (164) 212 139
Increases for positions taken in current periods 1,410 1,117 183Decreases in unrecorded tax positions related to settlement with the taxing authorities (739) (154) (1,322)
Decreases in unrecorded tax positions related to lapse of statute of limitations — (172 ) — ________ ________ ________
Balance as of December 31, $ 1,866 $ 2,869 $ 1,869 ________ ________ ________ ________ ________ ________
If the total unrecognized tax benefits of $1.9 million at December 31, 2009 were recognized, it would reduce our annual effective tax rate. The amount of interest accrued in 2009 related to these unrecognized

A N N U A L R E P O R T 2 0 0 9 29
tax benefits was not material and is included in the provision for income taxes in the consolidated statements of operations. It is reasonably possible that the amount of unrecognized tax benefits could change in the next 12 months as a result of the anticipated completion of taxing authority examinations for the tax years 2006 through 2008. The range of change in unrecognized tax benefits is estimated between $0.8 million and $1.5 million.
Note 7 — Shareholders’ Equity
Our shareholders have authorized 500,000 shares of preferred stock, par value $.01 per share, which may be issued in one or more series by the Board of Directors without further action by the shareholders. As of December 31, 2008 and 2009, no preferred stock had been issued.
On February 15, 2005, our Board of Directors authorized a share repurchase program under which we may repurchase up to $50.0 million of our common stock, although no more than $25.0 million could be purchased in any calendar year. The Board subsequently amended this program on December 2, 2005 to authorize repurchases up to $100.0 million of our common stock, although no more than $50.0 million may be purchased in any calendar year. The repurchase program calls for shares to be purchased in the open market or in private transactions from time to time. We may suspend or discontinue the share repurchase program at any time. Through December 31, 2006, we have repurchased a total of 2.2 million shares of common stock aggregating $53.2 million under this authorization. No stock repurchases were made in 2007, 2008 or 2009.
We have reserved 5.8 million shares of common stock for issuance to employees and directors under three shareholder-approved share-based compensation plans (the “Plans”) of which approximately 1.1 million shares remain available for grant at December 31, 2009. The exercise price on all outstanding options and stock appreciation rights (“SARs”) is equal to the quoted fair market value of the stock at the date of grant. Restricted stock units (“RSUs”) are valued at the market value of the underlying stock on the date of grant. Stock options, SARs and RSUs are non-transferable other than on death and generally become exercisable over a five year period from date of grant. Stock options and SARs expire ten years from date of grant. SARs are only settled in shares of the Company’s stock. The issuance of shares pursuant to the exercise of stock options and SARs and vesting of RSUs are from the Company’s treasury stock.
Total pre-tax stock-based compensation expense recognized in the Consolidated Statements of Operations was $3.8 million, $4.2 million and $4.3 million for the year ended December 31, 2007, 2008 and 2009, respectively. This amount is included in selling and administrative expenses on the Consolidated Statements of Operations. Tax related benefits of $0.8 million, $1.1 million and $1.3 million were also recognized for the years ended December 31, 2007, 2008 and 2009. Cash received from the exercise of stock options was $11.3 million, $6.9 million and $0.7 million for the years ended December 31, 2007, 2008 and 2009, respectively and is reflected in cash flows from financing activities in the Consolidated Statements of Cash Flows.
The weighted average fair value of awards of options and SARs granted in the years ended December 31, 2007, 2008 and 2009 was $11.88, $9.35 and $7.03, respectively. The fair value of these options and SARs was estimated at the date of grant using a Black-Scholes option pricing model with the following weighted-average assumptions for options and SARs granted in the years ended December 31, 2007, 2008 and 2009, respectively: risk-free interest rate of 4.56%, 3.25% and 2.48%; volatility factor of the expected market price of the Company’s common stock of 32.61%, 30.36% and 37.17%; a weighted-average expected life of the option and SAR of 5.7 years for 2007 and 2008 and 6.2 years for 2009; and that no dividends would be paid on common stock. The risk free interest rate is based on the option and SAR grant date for a traded zero-coupon U.S. Treasury bond with a maturity date closest to the expected life. Expected volatilities are based upon historical
volatility of the Company’s stock over a period equal to the expected life of each option and SAR grant. The expected life represents the period of time that the options and SARs are expected to be outstanding based on a study of historical data of option holder exercise and termination behavior.
The following table illustrates the stock option and SAR activity for the year ended December 31, 2009.:
Number of Shares Weighted-Average (in 000’s) Exercise PriceOutstanding at December 31, 2008 2,423 $ 24.10 Granted 233 $ 17.30 Forfeited (159 ) $ 22.38 Exercised (46 ) $ 16.92 _______ ________Outstanding at December 31, 2009 2,451 $ 23.70 _______ ________ _______ ________Exercisable at December 31, 2009 1,839 $ 23.94 _______ ________ _______ ________
The weighted average remaining contractual term for stock options and SARs outstanding and exercisable at December 31, 2009 was 5.0 years and 4.0 years, respectively. The aggregate intrinsic value of stock options and SARs outstanding and exercisable at December 31, 2009 was $4.8 million and $3.3 million, respectively. The aggregate intrinsic value of stock options and SARs exercised during the year ended December 31, 2007, 2008 and 2009 was $6.7 million, $4.0 million and $0.2 million, respectively.
The following table illustrates the RSU activity for the year ended December 31, 2009. There were no RSU’s granted prior to 2006.
Number Weighted-Average of Shares Grant-Date (in 000’s) Fair Value
Outstanding at December 31, 2008 336 $ 26.01 Granted 197 $ 17.02 Vested (77 ) $ 25.48 Forfeited (31 ) $ 24.67 _______ ________Outstanding at December 31, 2009 425 $ 22.03 _______ ________ _______ ________
The weighted average fair value of awards of RSUs granted in the years ended December 31, 2007, 2008 and 2009 was $29.13, $26.94 and $17.02, respectively.
The total fair value of shares vested was $0.6 million, $1.3 million and $1.8 million for the years ended December 31, 2007, 2008 and 2009, respectively.
As of December 31, 2009, there was $12.1 million of total unrecognized compensation cost related to nonvested stock options, SARs and RSUs granted under the Plan which is expected to be recognized over a weighted average period of 3.5 years.
We offer to our employees a shareholder-approved Employee Stock Purchase Plan (the “Employee Plan”), under which we have reserved 1.0 million shares of common stock for issuance to our employees. The Employee Plan provides employees with the opportunity to invest from 1% to 10% of their annual salary to purchase shares of CONMED common stock through the exercise of stock options granted by the Company at a purchase price equal to 95% of the fair market value of the common stock on the exercise date. During 2009, we issued approximately 28,900 shares of common stock under the Employee Plan. No stock-based compensation expense has been recognized in the accompanying consolidated financial statements as a result of common stock issuances under the Employee Plan.
Note 8 — Business Segments and Geographic Areas
CONMED conducts its business through five principal operating segments, CONMED Endoscopic Technologies, CONMED Endosurgery, CONMED Electrosurgery, CONMED Linvatec and CONMED Patient Care. We believe each of our segments are
30
C O N M E D C O R P O R AT I O N
similar in the nature of products, production processes, customer base, distribution methods and regulatory environment. Our CONMED Endosurgery, CONMED Electrosurgery and CONMED Linvatec operating segments also have similar economic characteristics and therefore qualify for aggregation. Our CONMED Patient Care and CONMED Endoscopic Technologies operating units do not qualify for aggregation since their economic characteristics do not meet the criteria for aggregation as a result of the lower overall operating income (loss) in these segments.
CONMED Endosurgery, CONMED Electrosurgery and CONMED Linvatec consist of a single aggregated segment comprising a complete line of endo-mechanical instrumentation for minimally invasive laparoscopic procedures, electrosurgical generators and related surgical instruments, arthroscopic instrumentation for use in orthopedic surgery and small bone, large bone and specialty powered surgical instruments. CONMED Patient Care product offerings include a line of vital signs and cardiac monitoring products as well as suction instruments & tubing for use in the operating room. CONMED Endoscopic Technologies product offerings include a comprehensive line of minimally invasive endoscopic diagnostic and therapeutic instruments used in procedures which require examination of the digestive tract.
The following is net sales information by product line and reportable segment:
2007 2008 2009Arthroscopy $ 264,637 $ 291,910 $ 269,820Powered Surgical Instruments 149,261 155,659 144,014 _________ _________ _________ CONMED Linvatec 413,898 447,569 413,834CONMED Electrosurgery 92,107 100,493 94,959CONMED Endosurgery 58,829 64,459 66,027 _________ _________ _________CONMED Linvatec, Electrosurgery, and Endosurgery 564,834 612,521 574,820CONMED Patient Care 76,711 78,384 70,978CONMED Endoscopic Technologies 52,743 51,278 48,941 _________ _________ _________ Total $ 694,288 $ 742,183 $ 694,739 _________ _________ _________ _________ _________ _________
Total assets, capital expenditures, depreciation and amortization information are impracticable to present by reportable segment because the necessary information is not available.
The following is a reconciliation between segment operating income (loss) and income before income taxes. The Corporate line includes corporate related items not allocated to operating units:
2007 2008 2009CONMED Linvatec, Electrosurgery, and Endosurgery $ 87,569 $ 98,101 $ 62,715CONMED Patient Care 2,003 2,259 (1,263)CONMED Endoscopic Technologies (6,250 ) (7,411 ) (7,904)Corporate (2,331 ) (17,690 ) (25,279) _________ _________ _________Income from operations 80,991 75,259 28,269Gain on early extinguishment of debt — 1,947 1,083Amortization of bond discount 4,618 4,823 4,111Interest expense 16,234 10,372 7,086 _________ _________ _________Income before income taxes $ 60,139 $ 62,011 $ 18,155 _________ _________ _________ _________ _________ _________
Net sales information for geographic areas consists of the following:
2007 2008 2009United States $ 404,434 $ 411,773 $ 385,770Canada 55,313 52,792 48,713United Kingdom 45,335 44,123 35,155Japan 26,274 28,026 29,244Australia 30,199 30,270 30,159All other countries 132,733 175,199 165,698 _________ _________ _________ Total $ 694,288 $ 742,183 $ 694,739 _________ _________ _________ _________ _________ _________
Sales are attributed to countries based on the location of the customer. There were no significant investments in long-lived assets located outside the United States at December 31, 2008 and 2009. No single customer represented over 10% of our consolidated net sales for the years ended December 31, 2007, 2008 and 2009.
Note 9 — Employee Benefit Plans
We sponsor an employee savings plan (“401(k) plan”) and a defined benefit pension plan (the “pension plan”) covering substantially all our employees.
Total employer contributions to the 401(k) plan were $2.5 million, $2.7 million and $6.8 million during the years ended December 31, 2007, 2008 and 2009, respectively. Included in the 2009 total is a discretionary one-time $4.0 million employer 401(k) contribution.
During the first quarter of 2009, the Company announced the freezing of benefit accruals under the defined benefit pension plan for United States employees (“the Plan”) effective May 14, 2009. As a result, the Company recorded a curtailment gain of $4.4 million and a reduction in accrued pension of $11.4 million which is included in other long term liabilities.
We use a December 31, measurement date for our pension plan. Gains and losses are amortized on a straight-line basis over the average remaining service period of active participants. The following table provides a reconciliation of the projected benefit obligation, plan assets and funded status of the pension plan at December 31,:
2008 2009Accumulated Benefit Obligation $ 61,514 $ 61,222 ________ ________ ________ ________ Change in benefit obligationProjected benefit obligation at beginning of year $ 56,592 76,610Service cost 5,835 187Interest cost 3,977 3,920Actuarial loss (gain) 14,837 (4,802)Curtailment gain — (11,358)Benefits paid (4,631 ) (3,335) ________ ________ Projected benefit obligation at end of year $ 76,610 $ 61,222 ________ ________ Change in plan assetsFair value of plan assets at beginning of year $ 48,532 $ 45,381Actual gain (loss) on plan assets (10,520 ) 6,723Employer contribution 12,000 4,073Benefits paid (4,631 ) (3,335) ________ ________ Fair value of plan assets at end of year $ 45,381 $ 52,842 ________ ________ Funded status $ (31,229 ) $ (8,380) ________ ________ ________ ________
Amounts recognized in the consolidated balance sheets consist of the following at December 31,: 2008 2009Accrued long-term pension liability $ 31,229 $ 8,380Accumulated other comprehensive income (loss) (43,762) (25,823)
The following actuarial assumptions were used to determine our accumulated and projected benefit obligations as of December 31,: 2008 2009Discount rate 5.97% 5.86%Expected return on plan assets 8.00% 8.00%Rate of compensation increase 3.50% 3.50%

A N N U A L R E P O R T 2 0 0 9 31
Accumulated other comprehensive income (loss) for the years ended December 31, 2008 and 2009 consists of the following items not yet recognized in net periodic pension cost (before income taxes): 2008 2009Net actuarial loss $ (48,216) $ (25,823)Transition liability (28) —Prior service cost 4,482 — ________ ________Accumulated other comprehensive income (loss) $ (43,762 ) $ (25,823 ) ________ ________ ________ ________
Other changes in plan assets and benefit obligations recognized in other comprehensive income in 2009 are as follows:
Current year actuarial gain $ 9,409 Curtailment gain 6,990Amortization of actuarial loss 1,627Amortization of prior service costs (credits) (88) Amortization of transition liability 1 ________ Total recognized in other comprehensive income $ 17,939 ________ ________
The estimated portion of net actuarial loss in accumulated other comprehensive income (loss) that is expected to be recognized as a component of net periodic pension cost in 2010 is $1,313.
Net periodic pension cost for the years ended December 31, consists of the following:
2007 2008 2009Service cost—benefits earned during the period $ 5,863 $ 5,835 $ 1,887
Interest cost on projected benefit obligation 3,216 3,977 3,920
Return on plan assets (3,226 ) (4,210 ) (3,817)Curtailment gain — — (4,368)Transition amount 4 4 1 Prior service cost (351 ) (351 ) (88)Amortization of loss 1,382 1,320 1,627 ________ ________ ________Net periodic pension cost $ 6,888 $ 6,575 $ (838) ________ ________ ________ ________ ________ ________
The following actuarial assumptions were used to determine our net periodic pension benefit cost for the years ended December 31,:
2007 2008 2009Discount rate 5.90% 6.48% 5.97%*
Expected return on plan assets 8.00% 8.00% 8.00%Rate of compensation increase 3.00% 3.50% 3.50%
*For the year ending December 31, 2009, the discount rate used in determining pension expense was 5.97% in the first quarter of 2009; the discount rate used for purposes of remeasuring plan liabilities as of the date the plan freeze was approved and for purposes of measuring pension expense for the remainder of 2009 was 7.30%.
In determining the expected return on pension plan assets, we consider the relative weighting of plan assets, the historical performance of total plan assets and individual asset classes and economic and other indicators of future performance. In addition, we consult with financial and investment management professionals in developing appropriate targeted rates of return.
Asset management objectives include maintaining an adequate level of diversification to reduce interest rate and market risk and providing adequate liquidity to meet immediate and future benefit payment requirements.
The allocation of pension plan assets by category is as follows at December 31,:
Percentage of Pension Target Plan Assets Allocation 2008 2009 2010Equity securities 47% 64% 75%Debt securities 53 36 25 _____ _____ _____ Total 100% 100% 100% _____ _____ _____ _____ _____ _____
As of December 31, 2009, the Plan held 27,562 shares of our common stock, which had a fair value of $0.6 million. We believe that our long-term asset allocation on average will approximate the targeted allocation. We regularly review our actual asset allocation and periodically rebalance the pension plan’s investments to our targeted allocation when deemed appropriate.
The following table sets forth the fair value of Plan assets as of December 31,: 2008 2009Common Stock $ 15,250 $ 20,795Money Market Fund 21,554 16,090 Equity Funds 6,162 13,247 Fixed Income Securities 2,328 2,638Accrued Interest and Dividend 87 72 ________ ________Total Assets at Fair Value $ 45,381 $ 52,842 ________ ________ ________ ________
FASB guidance, defines fair value, establishes a framework for measuring fair value and related disclosure requirements. A valuation hierarchy was established for disclosure of the inputs to the valuations used to measure fair value. This hierarchy prioritizes the inputs into three broad levels as follows. Level 1 inputs are quoted prices (unadjusted) in active markets for identical assets or liabilities. Level 2 inputs are quoted prices for similar assets and liabilities in active markets, quoted prices for identical or similar assets in markets that are not active, inputs other than quoted prices that are observable for the asset or liability, including interest rates, yield curves and credit risks, or inputs that are derived principally from or corroborated by observable market data through correlation. Level 3 inputs are unobservable inputs based on our own assumptions used to measure assets and liabilities at fair value. A financial asset or liability’s classification within the hierarchy is determined based on the lowest level input that is significant to the fair value measurement.
Following is a description of the valuation methodologies used for assets measured at fair value. There have been no changes in the methodologies used at December 31, 2008 and 2009:
Common Stock: Common stock is valued at the closing price reported on the common stock’s respective stock exchange and is classified within level 1 of the valuation hierarchy.
Money Market Fund: These investments are public investment vehicles valued using $1 for the Net Asset Value (NAV). The money market fund is classified within level 2 of the valuation hierarchy.
Equity Funds: These investments are public investment vehicles valued using the NAV provided by the administrator of the fund. The NAV is based on the value of the underlying assets owned by the fund, minus its liabilities, and then divided by the number of shares outstanding. The NAV is a quoted price in an active market and is classified within level 1 of the valuation hierarchy.
Fixed Income Valued at the closing price reported on the Securities: active market on which the individual securities are traded and are classified within level 1 of the valuation hierarchy.

32
C O N M E D C O R P O R AT I O N
The methods described above may produce a fair value calculation that may not be indicative of net realizable value or reflective of future fair values. Furthermore, while the Plan believes its valuation methods are appropriate and consistent with other market participants, the use of different methodologies or assumptions to determine the fair value of certain financial instruments could result in a different fair value measurement at the reporting date.
The following table sets forth by level, within the fair value hierarchy, the Plan’s assets at fair value as of December 31, 2009:
Level 1 Level 2 TotalCommon Stock $ 20,795 $ — $ 20,795Money Market Fund — 16,090 16,090Equity Funds 13,247 — 13,247Fixed Income Securities 2,638 — 2,638 _________ _________ _________Total Assets at Fair Value $ 36,680 $ 16,090 $ 52,770 _________ _________ _________ _________ _________ _________
We are required to contribute approximately $3.0 million to our pension plan for the 2010 Plan year.
The following table summarizes the benefits expected to be paid by our pension plan in each of the next five years and in aggregate for the following five years. The expected benefit payments are estimated based on the same assumptions used to measure the Company’s projected benefit obligation at December 31, 2009 and reflect the impact of expected future employee service.
2010 $ 2,7512012 2,8152012 2,9822013 3,1672014 3,311 2015-2019 19,216
Note 10 — Legal Matters
From time to time, we are a defendant in certain lawsuits alleging product liability, patent infringement, or other claims incurred in the ordinary course of business. Likewise, from time to time, the Company may receive a subpoena from a government agency such as the Equal Employment Opportunity Commission, Occupational Safety and Health Administration, the Department of Labor, the Treasury Department, and other federal and state agencies or foreign governments or government agencies. These subpoena may or may not be routine inquiries, or may begin as routine inquiries and over time develop into enforcement actions of various types. The product liability claims are generally covered by various insurance policies, subject to certain deductible amounts, maximum policy limits and certain exclusions in the respective policies or required as a matter of law. In some cases we may be entitled to indemnification by third parties. When there is no insurance coverage, as would typically be the case primarily in lawsuits alleging patent infringement or in connection with certain government investigations, or indemnification obligation of a third party we establish reserves sufficient to cover probable losses associated with such claims. We do not expect that the resolution of any pending claims or investigations will have a material adverse effect on our financial condition, results of operations or cash flows. There can be no assurance, however, that future claims or investigations, or the costs associated with responding to such claims or investigations, especially claims and investigations not covered by insurance, will not have a material adverse effect on our results of operations.
Manufacturers of medical products may face exposure to significant product liability claims. To date, we have not experienced any product liability claims that are material to our financial statements or condition, but any such claims arising in the future could have a material adverse effect on our business or results of operations. We currently maintain commercial product liability insurance of $25 million per incident and $25 million in the aggregate annually, which we believe is adequate. This coverage is on a claims-made basis. There can be no assurance
that claims will not exceed insurance coverage, that the carriers will be solvent or that such insurance will be available to us in the future at a reasonable cost.
Our operations are subject, and in the past have been subject, to a number of environmental laws and regulations governing, among other things, air emissions, wastewater discharges, the use, handling and disposal of hazardous substances and wastes, soil and groundwater remediation and employee health and safety. In some jurisdictions environmental requirements may be expected to become more stringent in the future. In the United States certain environmental laws can impose liability for the entire cost of site restoration upon each of the parties that may have contributed to conditions at the site regardless of fault or the lawfulness of the party’s activities. While we do not believe that the present costs of environmental compliance and remediation are material, there can be no assurance that future compliance or remedial obligations would not have a material adverse effect on our financial condition, results of operations or cash flows.
On April 7, 2006, CONMED received a copy of a complaint filed in the United States District for the Northern District of New York on behalf of a purported class of former CONMED Linvatec sales representatives. The complaint alleges that the former sales representatives were entitled to, but did not receive, severance in 2003 when CONMED Linvatec restructured its distribution channels. The range of loss associated with this complaint ranges from $0 to $3.0 million, not including any interest, fees or costs that might be awarded if the five named plaintiffs were to prevail on their own behalf as well as on behalf of the approximately 70 (or 90 as alleged by the plaintiffs) other members of the purported class. CONMED Linvatec did not generally pay severance during the 2003 restructuring because the former sales representatives were offered sales positions with CONMED Linvatec’s new manufacturer’s representatives. Other than three of the five named plaintiffs in the class action, nearly all of CONMED Linvatec’s former sales representatives accepted such positions.
The Company’s motions to dismiss and for summary judgment, which were heard at a hearing held on January 5, 2007, were denied by a Memorandum Decision and Order dated May 22, 2007. The District Court also granted the plaintiffs’ motion to certify a class of former CONMED Linvatec sales representatives whose employment with CONMED Linvatec was involuntarily terminated in 2003 and who did not receive severance benefits. With discovery essentially completed, on July 21, 2008, the Company filed motions seeking summary judgment and to decertify the class. In addition, on July 21, 2008, Plaintiffs filed a motion seeking summary judgment. These motions were submitted for decision on August 26, 2008. There is no fixed time frame within which the Court is required to rule on the motions. The Company believes there is no merit to the claims asserted in the Complaint, and plans to vigorously defend the case. There can be no assurance, however, that the Company will prevail in the litigation.
Note 11 — Other Expense (income)
Other expense (income) for the year ended December 31, consists of the following: 2007 2008 2009Termination of product offering $ 148 $ — $ —Facility closure costs 1,822 — —Gain on litigation settlement (6,072 ) — —Product liability settlement 1,295 — —New plant/facility consolidation costs — 1,577 2,726Net pension gain — — (1,882 )Product recall — — 5,992CONMED Endoscopic Technologies division consolidation costs — — 4,080 ________ ________ ________
Other expense (income) $ (2,807 ) $ 1,577 $ 10,916 ________ ________ ________ ________ ________ ________
A N N U A L R E P O R T 2 0 0 9 33
During 2004, we elected to terminate our surgical lights product line. We instituted a customer replacement program whereby all currently installed surgical lights were replaced by CONMED. We recorded charges totaling $5.5 million related to the surgical lights customer replacement program (including $0.1 million in the year ended December 31, 2007) in other expense (income). The surgical lights customer replacement program was completed during the second quarter of 2007.
During 2006, we elected to close our facility in Montreal, Canada which manufactured products for our CONMED Linvatec line of integrated operating room systems and equipment. The products which had been manufactured in the Montreal facility are now purchased from third party vendors. The closing of this facility was completed in the first quarter of 2007. We incurred a total of $2.2 million in costs associated with this closure, of which $1.3 million related to the write-off of inventory and was included in cost of goods sold during 2006. The remaining $0.9 million (including $0.3 million in 2007) primarily relates to severance expense and the disposal of fixed assets and has been recorded in other expense (income).
During 2007, we elected to close our CONMED Endoscopic Technologies sales office in France and incurred $1.5 million in costs associated with this closure primarily related to severance expense. We have recorded such costs in other expense (income).
In November 2003, we commenced litigation against Johnson & Johnson and several of its subsidiaries, including Ethicon, Inc. for violations of federal and state antitrust laws. In the lawsuit we claimed that Johnson & Johnson engaged in illegal and anticompetitive conduct with respect to sales of product used in endoscopic surgery, resulting in higher prices to consumers and the exclusion of competition. We sought relief including an injunction restraining Johnson & Johnson from continuing its anticompetitive practices as well as receiving the maximum amount of damages allowed by law. During the litigation, Johnson & Johnson represented that the marketing practices which gave rise to the litigation had been altered with respect to CONMED. On March 31, 2007, CONMED and Johnson & Johnson settled the litigation. Under the terms of the final settlement agreement, CONMED received a payment of $11.0 million from Johnson & Johnson in return for which we terminated the lawsuit. After deducting legal and other related costs, we recorded a pre-tax gain of $6.1 million related to the settlement which we have recorded in other expense (income).
Two of the Company’s subsidiaries settled a product liability claim asserted against it and several of the Company’s subsidiaries in a case captioned Wehner v. Linvatec Corp., et al. Total settlement and defense related costs amounted to $1.3 million which were recorded in other expense (income) during 2007.
During 2008, we announced a plan to restructure certain of our operations. We incurred $18.6 million in restructuring costs of which $4.3 million (including $1.6 million and $2.7 million in the years ending December 31, 2008 and 2009, respectively) have been recorded in other expense (income) and include charges related to the consolidation of our distribution centers. The remaining $14.3 million (including $2.5 million and $11.8 million in the years ending December 31, 2008 and 2009, respectively) in restructuring costs have been charged to cost of goods sold and represent startup activities associated with a new manufacturing facility in Chihuahua, Mexico and the closure of two Utica, New York area manufacturing facilities (See Note 17).
During 2009, we elected to freeze benefit accruals under the defined benefit pension plan for United States employees, effective May 14, 2009. As a result, we recorded a net pension gain of $1.9 million in the first quarter of 2009 associated with the elimination of future benefit accruals under the pension plan (see Note 9).
During 2009, we announced a voluntary recall of certain model numbers of the PRO5 & PRO6 series battery handpieces and certain lots of the MC5057 Universal Cable used with certain of CONMED Linvatec’s powered handpieces. Current models of products are not
affected. The cost of this recall is expected to be approximately $6.0 million and we have recorded this cost in 2009. We have performed repairs on $0.9 million of the total $6.0 million of expected costs in 2009.
During 2009, we elected to consolidate the administrative offices and operations of the CONMED Endoscopic Technologies division from its offices in Chelmsford, Massachusetts to our Corporate headquarters in Utica, New York. The sales force and product portfolio remain unchanged and CONMED Endoscopic Technologies continues to operate as a separate division of the Company. We incurred a total of $4.9 million in charges of which $4.1 million have been recorded in other expense (income) and include charges relating to severance, lease termination costs, write down of fixed assets and other transition costs. The remaining $0.8 million in costs relate to the write-down of inventory and is included in cost of goods sold. We believe the divisional consolidation is now complete and do not expect any further costs.
Note 12 — Guarantees
We provide warranties on certain of our products at the time of sale. The standard warranty period for our capital and reusable equipment is generally one year. Liability under service and warranty policies is based upon a review of historical warranty and service claim experience. Adjustments are made to accruals as claim data and historical experience warrant.
Changes in the carrying amount of service and product warranties for the year ended December 31, are as follows:
2007 2008 2009Balance as of January 1, $ 3,617 $ 3,306 $ 3,341 ________ ________ ________Provision for warranties 3,078 3,581 3,638Claims made (3,389 ) (3,546 ) (3,596) ________ ________ ________Balance as of December 31, $ 3,306 $ 3,341 $ 3,383 ________ ________ ________ ________ ________ ________
Note 13 — Fair Value Measurement
In March 2008, the FASB issued guidance which requires entities to provide enhanced disclosure about how and why the entity uses derivative instruments, how the instruments and related hedged items are accounted and how the instruments and related hedged items affect the financial position, results of operations, and cash flows of the entity. We adopted such guidance during the quarter ended March 31, 2009.
We enter into derivative instruments for risk management purposes only. We operate internationally and, in the normal course of business, are exposed to fluctuations in interest rates, foreign exchange rates and commodity prices. These fluctuations can increase the costs of financing, investing and operating the business. We use forward contracts, a type of derivative instrument, to manage our foreign currency exposures.
By nature, all financial instruments involve market and credit risks. We enter into forward contracts with a major investment grade financial institution and have policies to monitor credit risk. While there can be no assurance, we do not anticipate any material non-performance by our counterparty.
Foreign Currency Forward Contracts. We manage our foreign currency transaction risks through the use of forward contracts to hedge forecasted cash flows associated with foreign currency transaction exposures. We account for these forward contracts as cash flow hedges. To the extent these forward contracts meet hedge accounting criteria, changes in their fair value are not included in current earnings but are included in Accumulated Other Comprehensive Loss. These changes in fair value will be into earnings as a component of sales when the forecasted transaction occurs. The notional contract amounts for forward contracts outstanding at December 31, 2009 which have been accounted for as cash flow hedges totaled $80.2 million. Net realized losses recognized for forward contracts accounted for as cash flow hedges approximated $0.4 million for the year ended December 31,

34
C O N M E D C O R P O R AT I O N
2009. Net unrealized gains on forward contracts outstanding which have been accounted for as cash flow hedges and which have been included in accumulated other comprehensive income (loss) totaled $0.1 million at December 31, 2009. It is expected these unrealized gains will be recognized in income in 2010.
We also enter into forward contracts to exchange foreign currencies for United States dollars in order to hedge our currency transaction exposures on intercompany receivables denominated in foreign currencies. These forward contracts settle each month at month-end, at which time we enter into new forward contracts. We have not designated these forward contracts as hedges and have not applied hedge accounting to them. The notional contract amounts for forward contracts outstanding at December 31, 2009 which have not been designated as hedges totaled $28.6 million. Net realized losses recognized in connection with those forward contracts not accounted for as hedges approximated $3.9 million for the year ended December 31, 2009, offsetting gains on our intercompany receivables of $4.6 million for the year ended December 31, 2009. These gains and losses have been recorded in selling and administrative expense in the consolidated statements of income.
We record these forward foreign exchange contracts at fair value; the following table summarizes the fair value for forward foreign exchange contracts outstanding at December 31, 2009:
Asset Liabilities Net Balance Sheet Fair Balance Sheet Fair Fair Location Value Location Value ValueDerivatives designated as hedged instruments:
Foreign Prepaid Expenses Prepaid Expenses Exchange and other and other Contracts current assets $ 739 current assets $ (618) $ 121 _____ ______ ______
Derivatives not designated as hedging instruments:
Foreign Prepaid Expenses Prepaid Expenses Exchange and other and other Contracts current assets 25 current assets (51) (26) _____ ______ ______
Total derivatives $ 764 $ (669) $ 95 _____ ______ ______ _____ ______ ______
Our forward foreign exchange contracts are subject to a master netting agreement and qualify for netting in the consolidated balance sheets. Accordingly, we have recorded the net fair value of $0.1 million in prepaid expenses and other current assets.
Fair Value Disclosure. FASB guidance, defines fair value, establishes a framework for measuring fair value and related disclosure requirements. This guidance applies when fair value measurements are required or permitted. The guidance indicates, among other things, that a fair value measurement assumes that the transaction to sell an asset or transfer a liability occurs in the principal market for the asset or liability or, in the absence of a principal market, the most advantageous market for the asset or liability. Fair value is defined based upon an exit price model.
We adopted this guidance as of January 1, 2008, with the exception of its application to non-recurring nonfinancial assets and nonfinancial liabilities, which was delayed to fiscal years beginning after November 15, 2008, which we therefore adopted as of January 1, 2009. As of December 31, 2009, we do not have any significant non-recurring measurements of nonfinancial assets and nonfinancial liabilities.
Valuation Hierarchy. A valuation hierarchy was established for disclosure of the inputs to the valuations used to measure fair value.
This hierarchy prioritizes the inputs into three broad levels as follows. Level 1 inputs are quoted prices (unadjusted) in active markets for identical assets or liabilities. Level 2 inputs are quoted prices for similar assets and liabilities in active markets, quoted prices for identical or similar assets in markets that are not active, inputs other than quoted prices that are observable for the asset or liability, including interest rates, yield curves and credit risks, or inputs that are derived principally from or corroborated by observable market data through correlation. Level 3 inputs are unobservable inputs based on our own assumptions used to measure assets and liabilities at fair value. A financial asset or liability’s classification within the hierarchy is determined based on the lowest level input that is significant to the fair value measurement.
Valuation Techniques. Liabilities carried at fair value and measured on a recurring basis as of December 31, 2009 consist of forward foreign exchange contracts and two embedded derivatives associated with our 2.50% convertible senior subordinated notes. The value of these liabilities was determined within Level 2 of the valuation hierarchy and was not material either individually or in the aggregate to our financial position, results of operations or cash flows.
The carrying amounts reported in our balance sheets for cash and cash equivalents, accounts receivable, accounts payable and long-term debt excluding the 2.50% convertible senior subordinated notes approximate fair value. The fair value of the Notes approximated $97.2 million and $108.3 million at December 31, 2008 and December 31, 2009, respectively, based on their quoted market price. See Note 5 for additional discussion of the Notes.
Note 14 — New Accounting Pronouncements
In June 2009, the FASB issued guidance which requires additional disclosures about the transfer and derecognition of financial assets, eliminates the concept of qualifying special-purpose entities, creates more stringent conditions for reporting a transfer of a portion of a financial asset as a sale, clarifies other sale-accounting criteria, and changes the initial measurement of a transferor’s interest in transferred financial assets. This guidance is effective for fiscal years beginning after November 15, 2009. Our current off balance sheet arrangement in which a wholly-owned, bankruptcy-remote, special purpose subsidiary of CONMED Corporation sells an undivided percentage ownership interest in receivables to a bank under an accounts receivable sales agreement, will no longer be permitted to be accounted for as a sale and reduction in accounts receivable beginning in 2010. As a result, accounts receivable sold under the agreement (which aggregated $29.0 million at December 31, 2009) would be recorded as additional borrowings rather than as a reduction in accounts receivable. There will be no impact to the results of operations.
Note 15 — Business Acquisition
On January 9, 2008, we purchased our Italian distributor’s business for approximately $21.8 million in cash (the “Italy acquisition”). Under the terms of the acquisition agreement, we agreed to pay additional consideration in 2009 based upon the 2008 results of the acquired business.
The following table summarizes the estimated fair values of the assets acquired and liabilities assumed as a result of the Italy acquisition.
Cash $ 953 Inventory 3,444 Accounts receivable 19,701 Other assets 846 Customer relationships 9,479 ________ Total assets acquired 34,423 ________ Income taxes payable (2,443 ) Other current liabilities (9,658 ) ________ Total liabilities assumed (12,101 ) ________ Net assets acquired $ 22,322 ________ ________

A N N U A L R E P O R T 2 0 0 9 35
The unaudited pro forma statement of operations for the year ended December 31, 2007, assuming the Italy acquisition occurred as of January 1, 2007 is presented below. This pro forma statement of operations has been prepared for comparative purposes only and does not purport to be indicative of the results of operations which actually would have resulted had the Italy acquisition occurred on the dates indicated, or which may result in the future. 2007
Net sales $ 710,685 Net income $ 41,069 Net income per share: Basic $ 1.45 Diluted $ 1.42
Note 16 — Convertible senior subordinated notes
In May 2008, the FASB issued guidance which specifies that issuers of convertible debt instruments that permit or require the issuer to pay cash upon conversion should separately account for the liability and equity components in a manner that will reflect the entity’s nonconvertible debt borrowing rate when interest cost is recognized in subsequent periods. The Company was required to apply the guidance retrospectively to all past periods presented. We adopted this guidance on January 1, 2009 related to our 2.50% convertible senior subordinated notes due 2024 (“the Notes”).
Our effective borrowing rate for nonconvertible debt at the time of issuance of the Notes was estimated to be 6.67%, which resulted in $34.6 million of the $150.0 million aggregate principal amount of Notes issued, or $21.8 million after taxes, being attributable to equity. For the years ended December 31, 2007, 2008 and 2009, we have recorded interest expense related to the amortization of debt discount on the Notes of $4.6 million, $4.8 million and $4.1 million, respectively, at the effective interest rate of 6.67%. The debt discount on the Notes is being amortized through November 2011. For the years ended December 31, 2007, 2008 and 2009, we have recorded interest expense on the Notes of $3.8 million, $3.7 million and $2.9 million, respectively, at the contractual coupon rate of 2.50%.
The following table illustrates the effects of adopting the new guidance on each Consolidated Balance Sheet line item as of December 31, 2008:
As Originally As Effect Reported Adjusted of ChangeLong-term debt $ 196,190 $ 182,739 $ (13,451)Deferred income taxes 83,498 88,468 4,970Total liabilities 399,927 391,446 (8,481)Paid-in capital 292,251 313,830 21,579Retained earnings 327,471 314,373 (13,098)Total shareholders’ equity 531,734 540,215 8,481
The following tables illustrate the effects of adopting the new guidance on each Consolidated Statement of Operations and Consolidated Statement of Cash Flows for the years ended December 31, 2007 and 2008:
As Originally As Effect Reported Adjusted of ChangeConsolidated statement of operations for the year ended December 31, 2007:
Amortization of debt discount $ — $ 4,618 $ 4,618Income before income taxes 64,757 60,139 (4,618)Provision for income taxes 23,301 21,595 (1,706)Net income 41,456 38,544 (2,912)EPS:Basic $ 1.46 $ 1.36 $ (.10) Diluted 1.43 1.33 (.10)Consolidated statement of operations for the year ended December 31, 2008:
Gain on early extinguishment of debt $ 4,376 $ 1,947 $ (2,429)Amortization of debt discount — 4,823 4,823Income before income taxes 69,263 62,011 (7,252)Provision for income taxes 24,702 22,022 (2,680)Net income 44,561 39,989 (4,572)EPS:Basic $ 1.55 $ 1.39 $ (.16) Diluted 1.52 1.37 (.15)Consolidated statement of cash flow for the year ended December 31, 2007:
Net income $ 41,456 $ 38,544 $ (2,912)Amortization of debt discount — 4,618 4,618Deferred income taxes 16,714 15,008 (1,706)Consolidated statement of cash flow for the year ended December 31, 2008:
Net income $ 44,561 $ 39,989 $ (4,572)Amortization of debt discount — 4,823 4,823Deferred income taxes 18,984 16,304 (2,680)
Note 17 — Restructuring
During 2009, we completed the first phase of our operational restructuring plan which we had previously announced in the second quarter of 2008. The restructuring included the closure of two manufacturing facilities located in the Utica, New York area totaling approximately 200,000 square feet with manufacturing transferred into either our Corporate headquarters location in Utica, New York or into a newly constructed leased manufacturing facility in Chihuahua, Mexico. In addition, manufacturing previously done by a contract manufacturing facility in Juarez, Mexico was transferred in-house to the Chihuahua facility. Finally, certain domestic distribution activities were centralized in a new leased consolidated distribution center in Atlanta, Georgia. We believe our restructuring will reduce our cost base by consolidating our Utica, New York operations into a single facility and expanding our lower cost Mexican operations, as well as improve service to our customers by shipping orders from more centralized distribution centers. The closure of the two manufacturing facilities, consolidation of distribution activities and the first phase of transitioning manufacturing operations was substantially complete as of December 31, 2009.

36
C O N M E D C O R P O R AT I O N
During 2010, we plan to enter into the second phase of our restructuring plan which contemplates transferring additional production lines from Utica, New York to our manufacturing facility in Chihuahua, Mexico. We expect to incur $2.5 million in costs associated with the second phase of our restructuring plan.
In conjunction with our restructuring plan, we considered FASB guidance which requires that long-lived assets be tested for recoverability whenever events or changes in circumstances indicate that their carrying amount may not be recoverable. As a result of our restructuring, two manufacturing facilities located in the Utica, New York area were closed prior to the end of their previously estimated useful lives. We determined one facility did not have any value and therefore recorded a $0.5 million charge for the remaining net book value of the facility in the fourth quarter of 2009. We plan to sell or lease the second facility and have tested it for impairment under the guidance for long-lived assets to be held and used. We performed our impairment testing on the second facility by comparing future cash flows expected to be generated by this facility (undiscounted and without interest charges) against the carrying amount ($2.1 million as of December 31, 2009). Since future cash flows expected to be generated by the second facility exceed its carrying amount, we do not believe any impairment exists at this time. However, we cannot be certain an impairment charge will not be required in the future.
As of December 31, 2009, we have incurred $18.6 million (including $4.1 million and $14.5 million, in the years ended December 31, 2008 and 2009, respectively) in costs associated with our restructuring.
Approximately $14.3 million (including $2.5 million and $11.8 million in the years ended December 31, 2008 and 2009, respectively) of the total $18.6 million in restructuring costs have been charged to cost of goods sold. The $14.3 million charged to cost of goods sold includes $6.1 million in under utilization of production facilities (including $1.2 million and $4.9 million, in the years ended December 31, 2008 and 2009, respectively), $2.4 million in accelerated depreciation (including $0.3 million and $2.1 million, in the years ended December 31, 2008 and 2009, respectively), $2.1 million in severance
related charges (including $0.1 million and $2.0 million, in the years ended December 31, 2008 and 2009, respectively), and $3.7 million in other charges (including $0.9 million and $2.8 million, in the years ended December 31, 2008 and 2009, respectively).
The remaining $4.3 million (including $1.6 million and $2.7 million, in the years ended December 31, 2008 and 2009, respectively) in restructuring costs have been recorded in other expense and primarily include severance, lease and other charges related to the consolidation of our distribution centers.
As the second phase of our restructuring plan progresses, we will incur additional charges, including employee termination and other exit costs. Based on the criteria contained within FASB guidance, no accrual for such costs has been made at this time.
We estimate the total costs of the second phase of our restructuring plan will approximate $2.5 million during 2010, including $1.3 million related to employee termination costs and $1.2 million in other restructuring related activities. We expect these restructuring costs will be charged to cost of goods sold. The second phase of the restructuring plan impacts Corporate manufacturing facilities which support multiple reporting segments. As a result, costs associated with the second phase of our restructuring plan will be reflected in the Corporate line within our business segment reporting.
Note 18 — Subsequent Events
We evaluated subsequent events through February 25, 2010, the date the financial statements have been issued.

A N N U A L R E P O R T 2 0 0 9 37
2009First quarter During the first quarter of 2009, we recorded a charge of $3.4 million related to the restructuring of certain of our operations; $2.9 million of the charge is recorded in cost of goods sold and $0.5 million is recorded in other expense (income)– see Note 11 and Note 17.
During the first quarter of 2009, we elected to freeze benefit accruals under the defined benefit pension plan for United States employees, effective May 14, 2009. As a result, we recorded a net pension gain in other expense (income) of $1.9 million associated with the elimination of future benefit accruals under the pension plan – see Note 9 and Note 11.
During the first quarter of 2009, we repurchased and retired $9.9 million of the Notes for $7.8 million and recorded a gain on the early extinguishment of debt of $1.1 million net of the write-offs of $0.1 million in unamortized deferred financing costs and $1.0 million in unamortized debt discount – See Note 5.
Second quarter During the second quarter of 2009, we recorded a charge of $4.4 million related to the restructuring of certain of our operations; $3.7 million of the charge is recorded in cost of goods sold and $0.7 million is recorded in other expense (income) – see Note 11 and Note 17.
Third quarterDuring the third quarter of 2009, we recorded a charge of $3.3 million related to the restructuring of certain of our operations; $2.2 million of the charge is recorded in cost of goods sold and $1.1 million is recorded in other expense (income) – see Note 11 and Note 17.
During the third quarter of 2009, we recorded a charge of $6.0 million in other expense (income) related to the voluntary recall of certain model numbers of the PRO5 & PRO6 series battery handpieces and certain lots of the MC5057 Universal Cable used with certain of CONMED Linvatec’s powered handpieces – see Note 11.
During the third quarter of 2009, we recorded a charge of $0.3 million in other expense (income) related to the consolidation of the administrative offices of CONMED Endoscopic Technologies – see Note 11.
Fourth quarterDuring the fourth quarter of 2009, we recorded a charge of $3.4 million related to the restructuring of certain of our operations; $3.0 million of the charge is recorded in cost of goods sold and $0.4 million is recorded in other expense (income) – see Note 11 and Note 17.
During the fourth quarter of 2009, we recorded a charge of $4.6 million related to the consolidation of the administrative offices and operations of CONMED Endoscopic Technologies; $0.8 million of the charge is recorded in cost of goods sold and $3.8 million is recorded in other expense (income) – see Note 11.
Note 19 — Selected quarterly Financial Data (Unaudited)
Selected quarterly financial data for 2008 and 2009 are as follows: Three Months Ended2008 March June September DecemberNet sales $ 190,773 $ 192,755 $ 179,409 $ 179,246 Gross profit 97,764 100,890 94,688 89,039Net income 10,252 11,685 9,735 8,317
EPS: Basic $ .36 $ .41 $ .34 $ .28 Diluted .35 .40 .33 .28
2009 March June September DecemberNet sales $ 164,062 $ 164,569 $ 175,475 $ 190,633 Gross profit 76,352 77,312 87,636 96,032Net income 4,485 1,409 1,288 4,955
EPS: Basic $ .15 $ .05 $ .04 $ .17 Diluted .15 .05 .04 .17
Unusual Items Included In Selected quarterly Financial Data:
2008First quarter During the first quarter of 2008, we recorded a charge of $1.0 million to cost of goods sold related to the purchase accounting fair value adjustment for inventory acquired in connection with the purchase of our Italian distributor.
Second quarter There were no unusual items in the second quarter of 2008.
Third quarter During the third quarter of 2008, we recorded a charge of $0.7 million in other expense (income) related to the restructuring of certain of our operations – see Note 11 and Note 17.
Fourth quarterDuring the fourth quarter of 2008, we recorded a gain of $1.9 million on the early extinguishment of debt – see Note 5.
During the fourth quarter of 2008, we recorded a charge of $3.4 million related to the restructuring of certain of our operations; $2.5 million of the charge is recorded in cost of goods sold and $0.9 million is recorded in other expense (income) – see Note 11 and Note 17.

38
C O N M E D C O R P O R AT I O N
Board of Directors
EugeneR.Corasanti is Vice Chairman of the Company and Chairman of the Board of Directors. Mr. Corasanti also served as the Company’s Chief Executive Officer from its founding until 2006, as well as President and
Chief Operating Officer from its founding until August 1999. Prior to the founding of the Company, Mr. Corasanti was an independent public accountant. Mr. Corasanti holds a B.B.A. degree in Accounting from Niagara University. Eugene R. Corasanti’s son, Joseph J. Corasanti, is President and Chief Executive Officer and a Director of the Company.
JosephJ.Corasanti has served as President and Chief Executive Officer since January 1, 2007, having served as President and Chief Operating Officer from August 1999 through December 2006. Mr. Corasanti has been a
Director of the Company since May 1994. Mr. Corasanti is also on the Board of Directors of II-VI, Inc. He previously served as General Counsel and Vice President-Legal Affairs, and Executive Vice-President/General Manager of the Company. Prior to that time he was an Associate Attorney with the law firm of Morgan, Wenzel & McNicholas. Mr. Corasanti holds a B.A. degree in Political Science from Hobart College and a J.D. degree from Whittier College School of Law. Joseph J. Corasanti is the son of Eugene R. Corasanti, Vice Chairman and Chairman of the Board of Directors.
BruceF.Daniels has served as a Director of the Company since August 1992. Mr. Daniels is a retired executive. From August 1974 to June 1997, Mr. Daniels held various executive positions, including a position as
Controller with Chicago Pneumatic Tool Company. Mr. Daniels holds a B.S. degree in Business from Utica College of Syracuse University. Mr. Daniels is the Chairman of the Audit Committee, and also serves on the Compensation Committee.
JoAnnGolden joined the Board of Directors in May 2003. Ms. Golden is a certified public accountant and managing partner of the New Hartford, NY office of Dermody Burke and Brown, CPAs, LLC. Ms. Golden is on the
Board of Directors of the Bank of Utica. Ms. Golden is past President of the New York State Society of CPAs and the New York State Society’s Foundation for Accounting Education. She also served as Secretary and Vice President of the State Society and was a member of the governing Council of the American Institute of Certified Public Accountants, where she served on the Global Credential Survey Task Force in 2001. Ms. Golden holds a B.A. degree from the State University College at New Paltz, and a B.S. degree in Accounting from Utica College of Syracuse University. Ms. Golden serves on the Audit Committee.
StephenM.Mandia has served as a Director of the Company since July 2002. Mr. Mandia has served as Chairman of the Board of Directors of Sovena USA, formerly East Coast Olive Oil Corp., and now a subsidiary of
Sovena Group since January 1, 2010. He previously served as Chief Executive Officer of Sovena USA from 1991 to December 31, 2009. Mr. Mandia holds a B.S. degree from Bentley College, having also undertaken undergraduate studies at Richmond College in London. Mr. Mandia is the Chairman of the Corporate Governance and Nominating Committee, and also serves on the Compensation Committee.
StuartJ.Schwartz has served as a Director of the Company since May 1998. Dr. Schwartz is a retired physician. From 1969 to December 1997 he was engaged in private practice as a urologist. Dr. Schwartz holds a
B.A. degree from Cornell University and an M.D. degree from SUNY Upstate Medical College, Syracuse. Dr. Schwartz is the Chairman of the Compensation Committee, and also serves on the Corporate Governance and Nominating Committee.
MarkE.Tryniski has served as a Director of the Company since May 2007. He is the President and Chief Executive Officer of Community Bank System, Inc. (NYSE:CBU), where he served as Executive
Vice President and Chief Operating Officer from February 2004 through August 2006. From June 2003 through February 2004, Mr. Tryniski was the Chief Financial Officer. Prior to joining Community Bank in June 2003, Mr. Tryniski was a partner with PricewaterhouseCoopers LLP in Syracuse, New York. Mr. Tryniski also serves on the Board of Directors of the Independent Bankers Association of New York State. Mr. Tryniski holds a B.S. degree from the State University of New York at Oswego. Mr. Tryniski serves on the Audit Committee as well as the Corporate Governance and Nominating Committee.
A N N U A L R E P O R T 2 0 0 9 39
Executive Officers
JosephJ.Corasanti,Esq.President and CEO
WilliamW.AbrahamVice President – Business Development
HeatherL.Cohen,Esq.Vice President – Corporate Human Resources
JosephG.DarlingPresident – CONMED Linvatec
DanielS.Jonas,Esq.General Counsel and Vice President – Legal Affairs
GregoryR.JonesVice President – Corporate Regulatory Affairs
LukeA.PomilioVice President – Corporate Controller and Corporate General Manager
RobertD.Shallish,Jr.Vice President – Finance and Chief Financial Officer
Senior Officers
TerenceM.BergéTreasurer and Assistant Corporate Controller
AlexanderR.JonesVice President – Corporate Sales
DavidR.MurrayPresident – CONMED Electrosurgery
JohnJ.StottsVice President – CONMED Patient Care
MarkR.DonovanVice President, CONMED Endoscopic Technologies and Global Corporate Marketing
FrankR.WilliamsVice President – CONMED EndoSurgery
(As of April 2010)

40
C O N M E D C O R P O R AT I O N
Shareholder InformationInterested shareholders may obtain a copy of the Company’s Form 10-K without charge upon written request to:
Investor Relations Department CONMED Corporation 525 French Road Utica, NY 13502
Transfer Agent/Registrar Registrar and Transfer Company 10 Commerce Drive Cranford, NJ 07016
Stock
CONMED Corporation’s stock is traded on the NASDAq Global Select Stock Market with the symbol: CNMD
Independent Registered Public Accounting Firm PricewaterhouseCoopers LLP 677 Broadway Albany, NY 12207
General Counsel Daniel S. Jonas, Esq. 525 French Road Utica, NY 13502
Special Counsel Sullivan & Cromwell, LLP 125 Broad Street New York, NY 10004
Corporate OfficesCONMED Corporation 525 French Road Utica, NY 13502Phone (315) 797-8375 Fax (315) 797-0321 Customer Service 1-800-448-6506 email: [email protected] website: www.conmed.com
Ethics Policy Available at www.conmed.com
Operating SubsidiariesCONMED Electrosurgery CONMED Endoscopic Technologies CONMED Integrated Systems Canada CONMED Italia SrL CONMED Linvatec CONMED Linvatec Australia CONMED Linvatec Austria CONMED Linvatec Belgium CONMED Linvatec Biomaterials Oy CONMED Linvatec Canada CONMED Linvatec Deutschland CONMED Linvatec Europe CONMED Linvatec France CONMED Linvatec Korea CONMED Linvatec Nederland CONMED Linvatec Poland CONMED Linvatec Spain CONMED Linvatec U.K. CONMED Receivables Corporation Consolidated Medical Equipment Company S.de r.L. de C.V. (Mexico)

A N N U A L R E P O R T 2 0 0 9D E S I G N E D B Y R O M A N E L L I C O M M U N I C A T I O N S

©CONMED CORPORATION 4/10, 9M, Printed in the U.S.A.
525 French Road | Utica, NY 13502 | USA