2009 interim results - kentz - home interim results presentation 2009.pdf · 7. revenue by business...
TRANSCRIPT

2009 Interim Results
Kentz Corporation Limited

2
Operational Review
Dr Hugh O’Donnell, Chief Executive Officer

3
• Revenue for the first half of 2009 US$328.8m (H1 2008: US$328.6m)
• Profit before tax for the first half of 2009 US$18.5m (H1 2008: US$16.8m)
• Profit before tax margins of 5.6% (H1 2008: 5.1%)
• Cash at the end the first half of 2009 US$165.7m (FY 2008: US$154.4m)
• Backlog at the end of the first half of 2009 US$1.10bn (Dec 2008: US$1.00bn)
• EPS (basic and fully diluted) 11.09 US cents (H1 2008: 10.99 US cents)
• Interim dividend 2.0 US cents per share, payable in October 2009 (H1 2008 interim dividend 1.9 US cents)
Results highlights
9.9 %
7.4 %
9.7 %
0.9 %
0.5 %
5.3 %
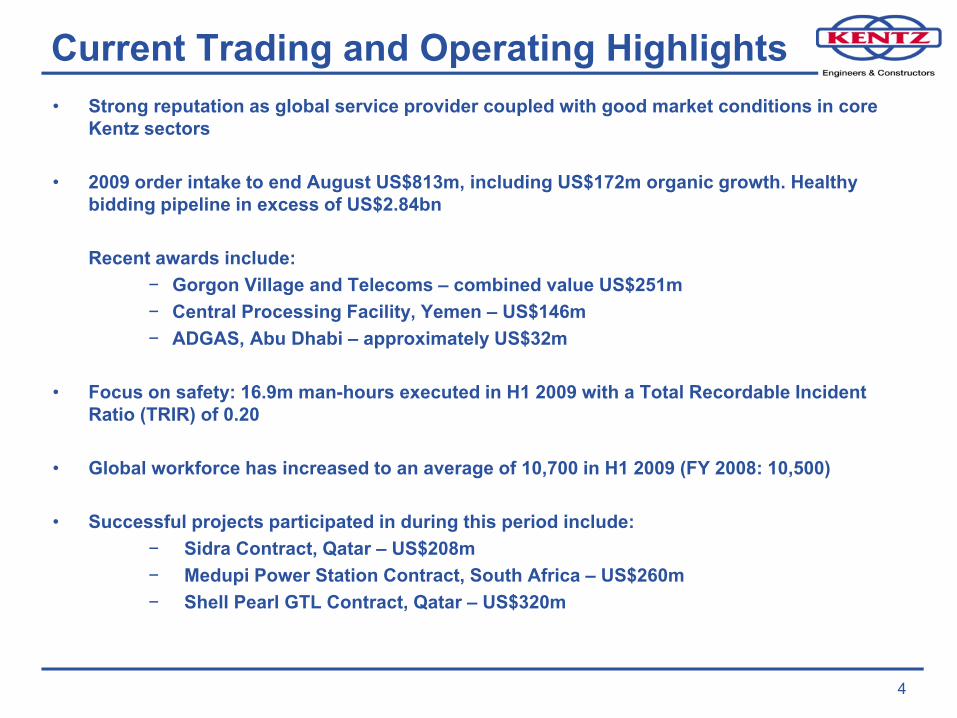
Current Trading and Operating Highlights• Strong reputation as global service provider coupled with good market conditions in core
Kentz sectors
• 2009 order intake to end August US$813m, including US$172m organic growth. Healthy bidding pipeline in excess of US$2.84bn
Recent awards include:− Gorgon Village and Telecoms – combined value US$251m− Central Processing Facility, Yemen – US$146m− ADGAS, Abu Dhabi – approximately US$32m
• Focus on safety: 16.9m man-hours executed in H1 2009 with a Total Recordable Incident Ratio (TRIR) of 0.20
• Global workforce has increased to an average of 10,700 in H1 2009 (FY 2008: 10,500)
• Successful projects participated in during this period include:− Sidra Contract, Qatar – US$208m− Medupi Power Station Contract, South Africa – US$260m− Shell Pearl GTL Contract, Qatar – US$320m
4

55
Company Highlights
• Strong backlog growth for the period, figure at end August 2009 is in excess of US$1.39bn
• H1 revenue has marginally increased, but stronger H2 revenue is anticipated
• PBT and PBT margin has increased for H1 2009
0
50
100
150
200
250
300
350
H1 2007 H1 2008 H1 2009
Backlog (US$m)
Up 57.6% for H1 2009
Revenue (US$m)
Marginally up for H1 2009
PBT (US$m)*
Up 9.9% for H1 2009
0
2
4
6
8
10
12
14
16
18
20
0
200
400
600
800
1000
1200
* H1 2008 results exclude non-recurring AIM listing costs of US$4.6m 5

6
Visibility of Future Work
End H1 2009 …3-6 months …6-12 months …12-18 months
Backlog US$1.10bn
Backlog to end Aug 2009
c.US$1.39bn
(Dec 08 US$1.00bn)
Letters of IntentAs of end Augusttrading position
LOIs and neworders received
c.US$100.0m
ProspectsAs of end Augusttrading position
Potential prospects
up to US$2.84bn
(Mar 09 US$2.15bn)
Strategic Prospects
As of end Augusttrading position
Potentialprospects
up to US$2.60bn
(Mar 09 US$3.13bn)
• Strong order intake in 2009 c.US$813m to end of August
• Revenue c.US$564m for 2010
• Revenue c.US$517m 2011 onwards

7
Revenue by Business Unit
Construction
Site wide Construction SolutionsStructural, Mechanical & Piping
Electrical & Instrumentation
Technical SupportServices
Pre-EPC award (FEED***)Integrated Project Management
CommissioningMaintenance & Turnaround
Offshore Services
*Engineering, Procurement and Construction ** Total Systems Integration *** Front End Engineering and Design
Revenue by Business UnitBased on H1 2008 US$328.6m
Revenue by Business UnitBased on H1 2009 US$328.8m
20%
51%
29%
Specialist EPC Construction Technical Support Services
38%
36%
26%
Specialist EPC Construction Technical Support Services
Specialist EPC*Onshore Modular Production Facilities
Turnkey Temporary FacilitiesTurnkey Utilities and Offsite Facilities
Turnkey Port FacilitiesSmall Capital Project SolutionsControls & Automation (TSI**)Telecommunications Systems
Power Projects & Services

8
Growth Profile
Business Unit Review
• H1 2009 total new awards andnatural growth = US$426m (Aug US$813m)
• Growth from existing contracts in excess of US$124m during H1 2009 (Aug US$172m)
• EPC projects account for 54% of backlog to August
0
200
400
600
800
1000
1200
1400
FY 2008 Revenue H1 2009 Revenue Backlog at Aug 31 Pipeline of Projects
Specialist EPC Construction Technical Support Services
9
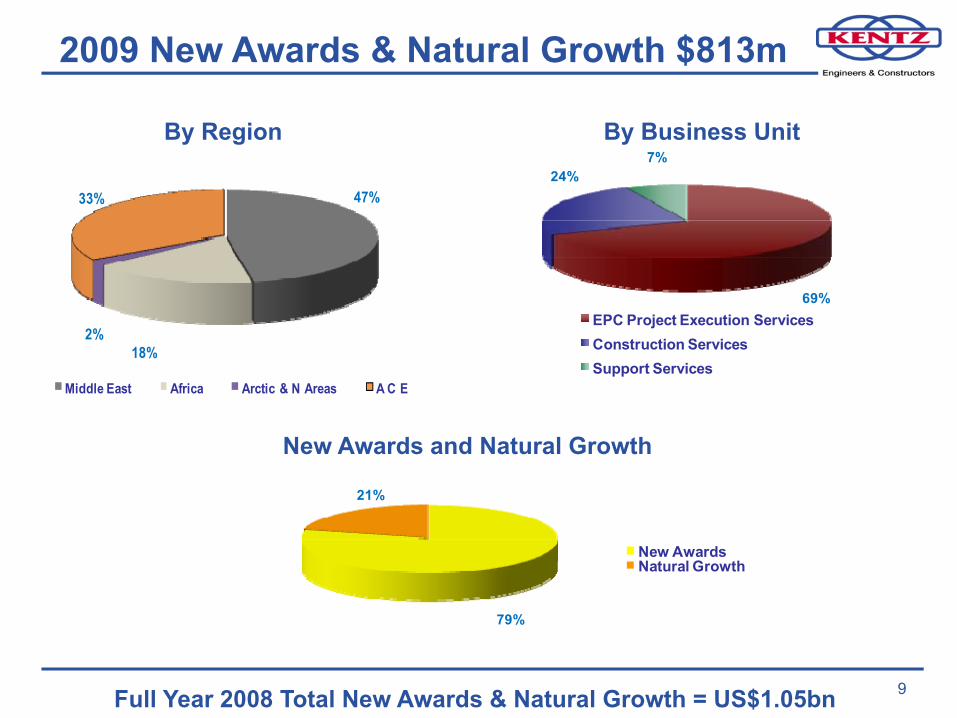
47%
18%2%
33%
Middle East Africa Arctic & N Areas A C E
New Awards and Natural Growth
2009 New Awards & Natural Growth $813m
69%
24%7%
EPC Project Execution ServicesConstruction ServicesSupport Services
By Region By Business Unit
79%
21%
New AwardsNatural Growth
Full Year 2008 Total New Awards & Natural Growth = US$1.05bn

1010
Industry Revenue Split
Strong demand for Kentz’s services across the sectors in which it operates
46%
36%
5%5% 8%
Oil & Gas Petrochemicals Mining & Minerals Power Others
Revenue by industryBased on H1 2008 US$328.6m
Revenue by industryBased on H1 2009 US$328.8m
51%
37%
7% 5%
Oil & Gas Petrochemicals Mining & Minerals Others

111111
Geographic Revenue and Backlog Split
70.5% 19.2% 5.8% 4.5%Geographic revenues as a percentage of Group Revenues - H109
↑ 4.8% ↑ 6.9% ↓ 51.1% ↑ 54.6%
0
50
100
150
200
250
Middle Eas t Africa Arctic Regionsand New Areas
Australas ia
H1 2007 Revenue
H1 2008 Revenue
H1 2009 Revenue
H1 2009 backlog by regionRevenue
US$
m
47%
33%
4%16%
Middle East Africa Arctic ACE
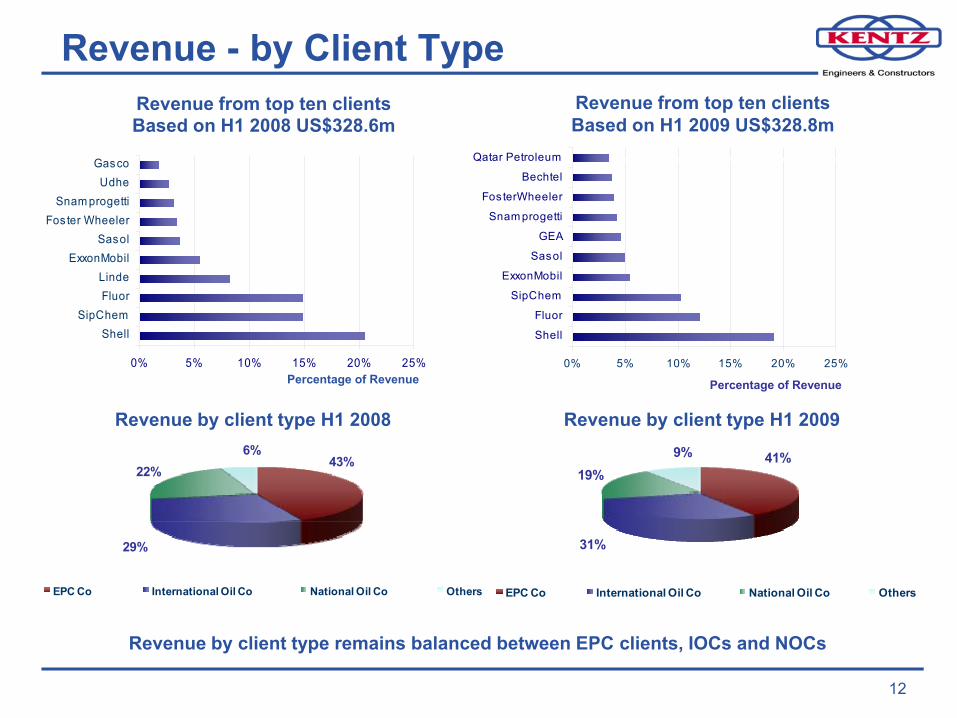
0% 5% 10% 15% 20% 25%
ShellSipChem
FluorLinde
ExxonMobilSasol
Fos ter WheelerSnam progetti
UdheGasco
41%
31%
19%9%
EPC Co International Oil Co National Oil Co Others
0% 5% 10% 15% 20% 25%
Shell
Fluor
SipChem
ExxonMobil
Sasol
GEA
Snam progetti
Fos terWheeler
Bechtel
Qatar Petroleum
12
Revenue - by Client Type
Revenue by client type H1 2009Revenue by client type H1 2008
Revenue by client type remains balanced between EPC clients, IOCs and NOCs
Revenue from top ten clients Based on H1 2008 US$328.6m
Revenue from top ten clients Based on H1 2009 US$328.8m
Percentage of Revenue Percentage of Revenue
43%
29%
22%6%
EPC Co International Oil Co National Oil Co Others
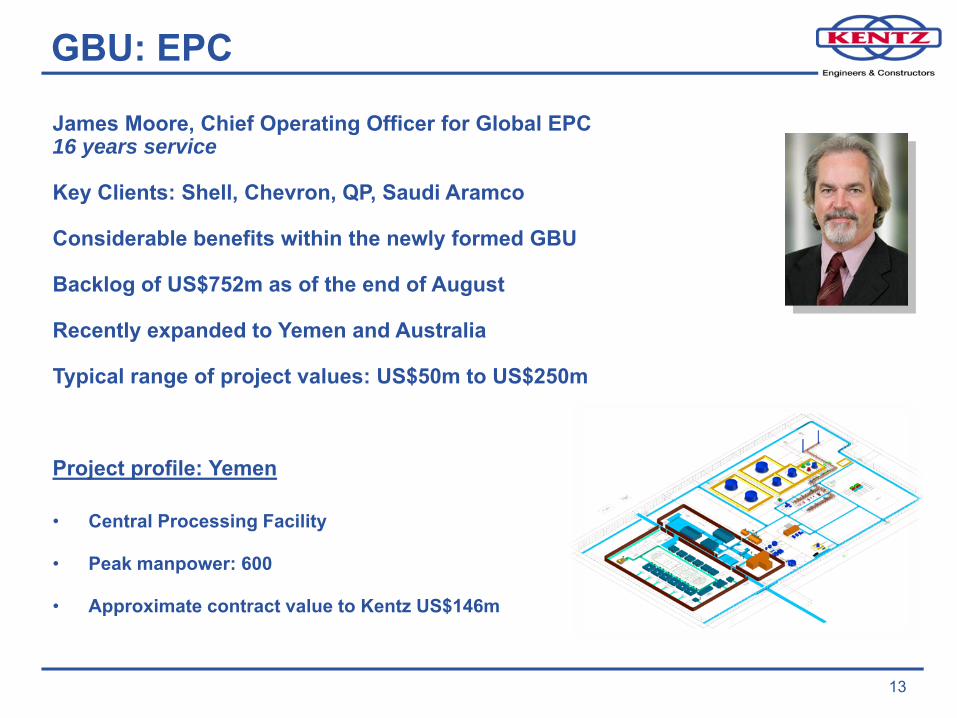
James Moore, Chief Operating Officer for Global EPC16 years service
Key Clients: Shell, Chevron, QP, Saudi Aramco
Considerable benefits within the newly formed GBU
Backlog of US$752m as of the end of August
Recently expanded to Yemen and Australia
Typical range of project values: US$50m to US$250m
Project profile: Yemen
• Central Processing Facility
• Peak manpower: 600
• Approximate contract value to Kentz US$146m
GBU: EPC
13

Eoin Hurley, Chief Operating Officer for Global Construction23 years service
Key Clients: Shell, Fluor, KBR, GEA
Demonstrated capacity for large scale resource projects
Revenues up 42% during the first half of the year
Typical range of project values: US$30m to US$260m
Project profile: South Africa
• Eskom Medupi Power Station
• Peak manpower: 450
• Approximate contract value to Kentz US$260m
GBU: Construction
14
Matimba Power Plant, South Africa

GBU: Technical Support Services
15
Michael Murphy, Chief Operating Officer for Global TSS19 years service
Key Clients: Shell, ExxonMobil, Sasol
Recently expanded into Indonesia and Italy
Growth of approximately 10% in the first half of 2009
New awards predominantly from remote based projects
Continued growth in TSS where Kentz is executing other GBU activity
Typical range of project values: US$3m to US$50m
Project profile: Malaysia
• Murphy Oil/Petronas Carigali
• Peak manpower: 120
• Approximate contract value to Kentz US$3m
Hess-Carogalli Cakerawala Field Shutdown, Malaysia
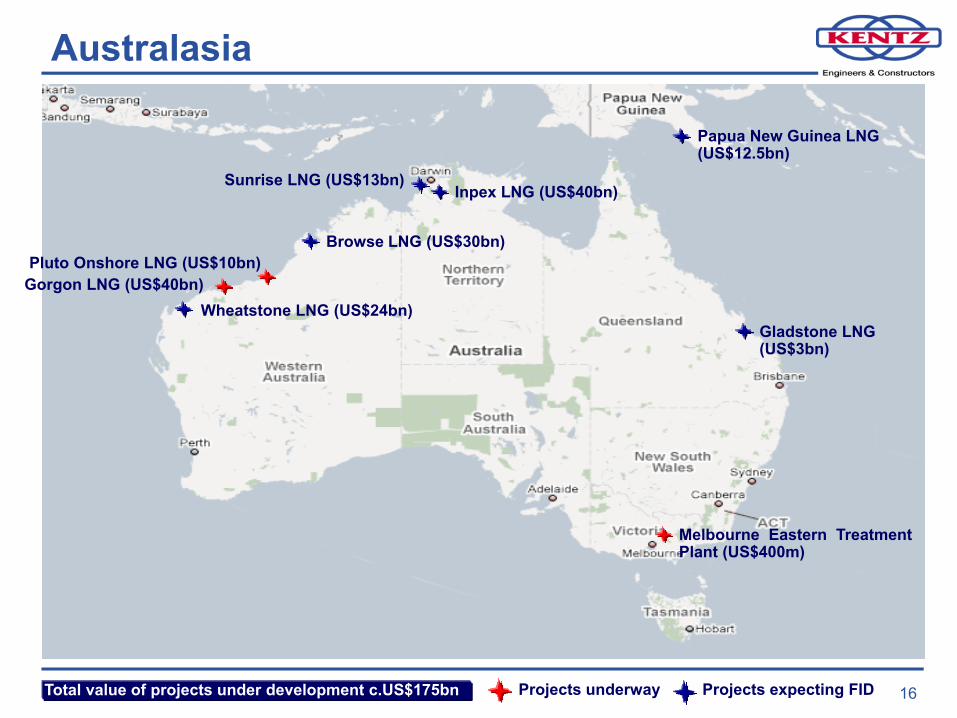
Gorgon LNG (US$40bn)
Australasia
Total value of projects under development c.US$175bn
Wheatstone LNG (US$24bn)
Pluto Onshore LNG (US$10bn)
Projects underway Projects expecting FID
Papua New Guinea LNG(US$12.5bn)
Browse LNG (US$30bn)
Sunrise LNG (US$13bn)Inpex LNG (US$40bn)
Gladstone LNG(US$3bn)
Melbourne Eastern TreatmentPlant (US$400m)
16
Kentz outlook for Australia
• It has been suggested that Gorgon could be the first step in kick-starting about AUD$200 billion of oil and gas projects on the drawing board in Australia
• Kentz is well placed to capitalise on these opportunities. Based in Western Australia for more than 20 years
• Kentz’s clients are leading the way – Chevron, ExxonMobil, Shell, Petronas and Woodside
• LNG shift from the Middle East to Australia
• Kentz’s key strengths include specialist EPC, remote construction and technical support services
• Australia supports modular builds project strategy
17

Gorgon
Joint venture between Australian subsidiaries of Chevron (Operator), ExxonMobil and Shell, estimated to be worth AUD$50bn
Development of the Greater Gorgon gas fields, located between 130km and 200km off the north-west coast of Western Australia
Fields estimated to contain around 40 trillion cubic feet of gas, Australia's largest-known gas resource
Kentz has been awarded two contracts:
– Telecoms EPC, worth AUD$150m
– Construction village, worth AUD$500m(value to Kentz is one third)
18Combined US$ value of Gorgon contracts awarded to Kentz to date: US$251m
Conceptual layout for new Gorgon Construction Village
19
Financial Review
Ed Power, Chief Financial Officer
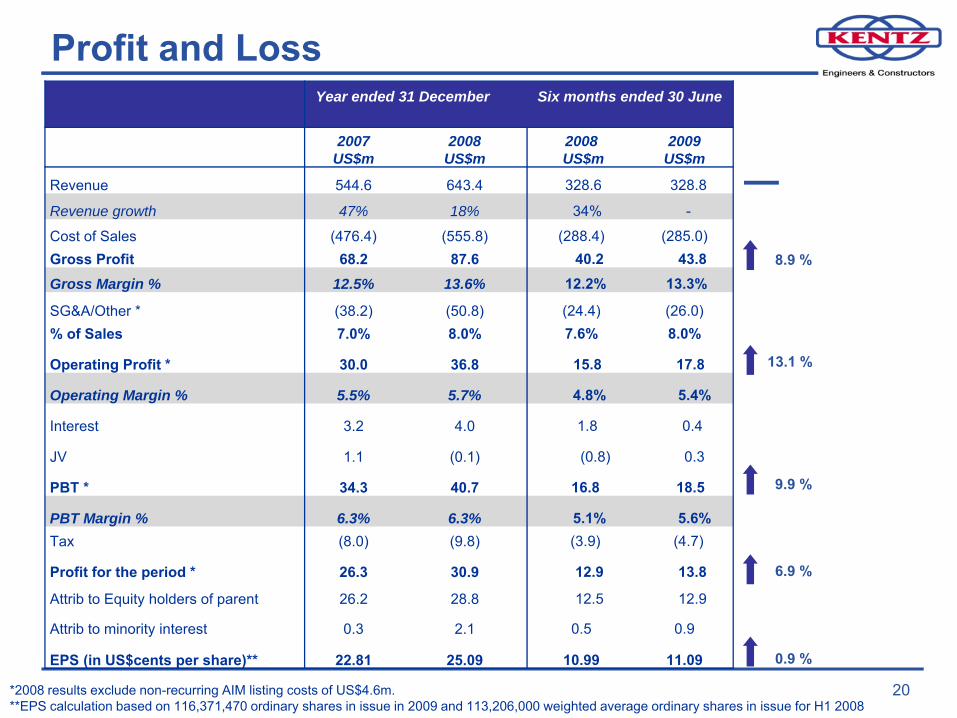
Profit and LossYear ended 31 December Six months ended 30 June
2007US$m
2008US$m
2008US$m
2009 US$m
Revenue 544.6 643.4 328.6 328.8
Revenue growth 47% 18% 34% -
Cost of Sales (476.4) (555.8) (288.4) (285.0)Gross Profit 68.2 87.6 40.2 43.8Gross Margin % 12.5% 13.6% 12.2% 13.3%
SG&A/Other * (38.2) (50.8) (24.4) (26.0)% of Sales 7.0% 8.0% 7.6% 8.0%
Operating Profit * 30.0 36.8 15.8 17.8
Operating Margin % 5.5% 5.7% 4.8% 5.4%
Interest 3.2 4.0 1.8 0.4
JV 1.1 (0.1) (0.8) 0.3
PBT * 34.3 40.7 16.8 18.5
PBT Margin % 6.3% 6.3% 5.1% 5.6%Tax (8.0) (9.8) (3.9) (4.7)
Profit for the period * 26.3 30.9 12.9 13.8
Attrib to Equity holders of parent 26.2 28.8 12.5 12.9
Attrib to minority interest 0.3 2.1 0.5 0.9
EPS (in US$cents per share)** 22.81 25.09 10.99 11.09
20*2008 results exclude non-recurring AIM listing costs of US$4.6m. **EPS calculation based on 116,371,470 ordinary shares in issue in 2009 and 113,206,000 weighted average ordinary shares in issue for H1 2008
8.9 %
13.1 %
9.9 %
6.9 %
0.9 %
―

As at 31 December As at 30 June
2007US$m
2008US$m
2008 US$m
2009 US$m
ASSETSNon-current assets 19.9 30.9 19.3 47.8Current assetsInventories 18.2 39.2 16.1 17.7
Trade and other receivables 111.5 87.5 116.0 146.3
Cash and cash equivalents 124.0 154.5 196.4 166.1
253.7 281.2 328.5 330.1
Total assets 273.6 312.1 347.8 377.9
LIABILITIESNon-current liabilities 12.4 19.2 17.1 21.5
Current liabilitiesTrade and other payables 197.4 176.6 227.5 227.6
Interest bearing loans and borrowings 1.1 2.1 1.9 3.3
Total liabilities 210.9 197.9 246.5 252.4
Net assets 62.7 114.2 101.3 125.5
Balance Sheet
21The directors have approved an interim dividend of US$2.0 cents per share (H1’08 US$1.9 cents)
Cash includes US$34.6m advance payments, a reduction of US$30.7m on the June ‘08 level of advances
Fixed assets up US$28.5m due to extra investments, mainly in Africa for Medupi Project
Growth in total assets mainly reflects increase in fixed assets
Current liabilities include advances from clients
Net assets up US$24.2m reflecting growth in retained earnings since June ‘08

Cashflow Analysis
22
When advances from clients are excluded, cash balances are up US$0.9m on June ’08 and up US$13.7m on December ’08 levels.
Other CashClient Advances Positive Flows Negative Flows
52.865.3
37.0 34.6
70.9
130.2
117.4 131.1
40.1
34.5
2.1
32.2
(2.8)
(29.1)
(14.1)
(16.1)
(4.8)
0
50
100
150
200
250
Dec-07 Operating Investing Financing Jun-08 Operating Investing Financing Dec-08 Operating Investing Financing Jun-09
US$
m

23
Conclusion and Outlook
24
Conclusion and Outlook
• Continued excellent organic growth– Current backlog increased in excess of 38% from FY 2008– PBT up 9.9% from H1 2008– Cash up 7.4% from FY 2008
• Development of Global Business Units to facilitate the sharing of expertise and resources across the world
• Margin enhancing acquisition in upstream oil and gas sector being pursued
• Middle East particularly well positioned with relatively lower production costs
• Global reach and flexibility continues to provide long term opportunity and demand for Kentz’s engineering and construction skills in our sectors
• Continued growth in the Middle East and Australasia – where the majority of onshore oil and gas projects are being developed – provides a positive outlook for Kentz

25
Appendices

Kentz Organisation Today
Board of Directors & Key Executives
Non-Executive Directors David Beldotti, Razali Abdul Rahman (Chairman), Hans Kraus, Hassan Abas, Brendan Lyons
Chief Executive OfficerHugh O’Donnell*
Group Project Services OfficerEamonn O’Hanlon
Chief Financial OfficerEd Power*
Regional ManagerAustralasia, Europe
& Caribbean Dave Ross
COO Technical Support Services
Business UnitMike Murphy
Group CommercialContract,
& Risk OfficerAdrian Griffin
* Executive Directors
COO Specialist EPC Business
UnitJames Moore
26
COO Construction Business Unit
Eoin Hurley

27
Oil and Gas Sector Positioning

29
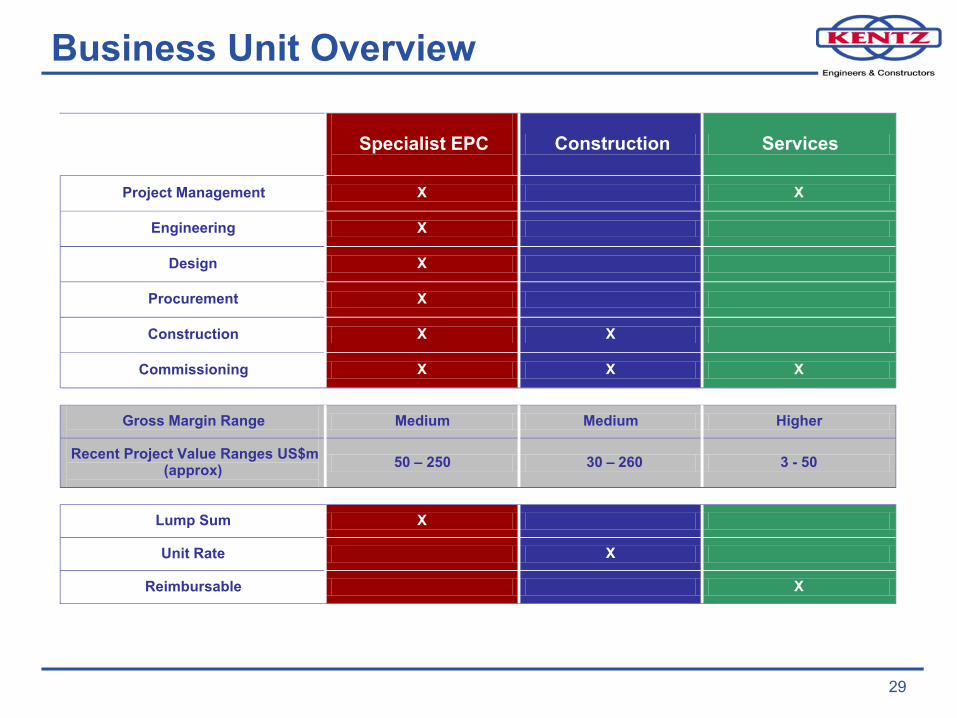
Business Unit Overview
Specialist EPC Construction Services
Project Management X X
Engineering X
Design X
Procurement X
Construction X X
Commissioning X X X
Gross Margin Range Medium Medium Higher
Recent Project Value Ranges US$m(approx) 50 – 250 30 – 260 3 - 50
Lump Sum X
Unit Rate X
Reimbursable X

30
Legal Disclaimer
This presentation is being given to you solely for your preliminary information on a confidential basis and neither it nor its contents may be reproduced, redistributedor passed on or disclosed, in whole or in part, to any other person. In particular, neither this presentation nor any copy thereof may be taken or transmitted ordistributed, directly or indirectly, into Canada, Japan, Australia, South Africa or the Republic of Ireland or to any resident thereof or into the United States or to a USPerson (as defined in Regulation S promulgated under the Securities Act of 1933 (as amended)). The distribution of this presentation in other jurisdictions may alsobe restricted by law and persons into to whose possession this presentation comes (or a copy hereof) should inform themselves about, and observe, any suchrestriction. Any failure to comply with these restrictions may constitute a violation of the laws of any such other jurisdiction.
For the purposes of United Kingdom legislation, this presentation has been directed only at and may only be communicated to (a) persons who have professionalexperience in matters relating to investments falling within article 19(1) of the Financial Services And Markets Act 2000 (Financial Promotion) Order 2005 (the"Order") or (b) high net worth entities falling within article 49(2)(a) to (d) of the Order or (c) other persons to whom it may lawfully be communicated (all such personstogether being referred to as "Relevant Persons"). Any person who is not a Relevant Person should not act or rely on this presentation or any of its contents andany investment or investment activity to which it relates will only be available to Relevant Persons. Any person who is unsure of their position should seekindependent advice.
The information contained in this presentation has not been independently verified and no representation or warranty, express or implied, is made as to, and noreliance should be placed on, the fairness, accuracy, completeness or correctness of the information or opinions contained herein. None of the Company,shareholders or any of their respective affiliates, advisers (including the global co-ordinators) or representatives shall have any liability whatsoever (in negligence orotherwise) for any loss howsoever arising from any use of this presentation or its contents or otherwise arising in connection with this presentation. Unless otherwisestated, all financial information contained herein is stated in accordance with international financial reporting standards. The forward-looking information containedherein has been prepared on the basis of a number of assumptions which may prove to be incorrect, and accordingly, actual results may vary. In any event, thevalue of investments can go up as well as down and past performance is not a guide to future returns.
This presentation does not constitute an offer or invitation or recommendation to purchase or subscribe for any investments and neither it nor any part of it shallform the basis of, or be relied upon in connection with, any contract or commitment or investment decision whatsoever. Any decision to purchase investments in theproposed offering should be made solely on the basis of information to be contained in the final Admission Document which will be published by the Company indue course in relation to such offering and which may contain information which is additional or different to the information contained in this presentation. Anyperson who participates in the proposed offering will be required to acknowledge in any agreement to be entered into that it has not relied on or been induced toenter into such agreement by this presentation or any of its contents. The information contained in this presentation is in draft form, is subject to updating andamending and may refer to events which have not yet taken place but which are expected to occur prior to the date on which the final Admission Document is
published.
Forward looking statements contained in this presentation regarding past trends or activities should not be taken as a representation that such trends or activitieswill continue in the future. The Company does not undertake any obligation to update or revise any forward-looking statements, whether as a result of newinformation, future events or otherwise. Undue reliance should not be placed on forward looking statements, which speak only as of the date of this presentation.