2009 pavement management study - · pdf filecondition index (pci) served as ... testing &...
TRANSCRIPT

2009 Pavement Management Study
Spencer, Massachusetts
Prepared for
Town of Spencer Office of Utilities & Facilities Robert McNeil III P.E. Superintendent
Prepared by
Fay, Spofford & Thorndike Engineers – Planners – Scientists 5 Burlington Woods Burlington, MA 01803 781-221-1000 fstinc.com June 2009

Fay, Spofford & Thorndike
Table of Contents i
Table of Contents
TABLES ........................................................................................................................................... II
FIGURES........................................................................................................................................III
1. INTRODUCTION .......................................................................................................................... 4
BACKGROUND........................................................................................................................................ 4 PAVEMENT MANAGEMENT CONCEPTS............................................................................................................ 5 STUDY APPROACH .................................................................................................................................. 6
2. METHODOLOGY ........................................................................................................................... 7
PAVEMENT MANAGEMENT SOFTWARE ........................................................................................................... 7 THE PAVEMENT CONDITION INDEX (PCI) DEFINED.......................................................................................... 8 THE FIVE TREATMENT REPAIR BANDS .......................................................................................................... 8 PRIORITY RANKING AND FUTURE PROJECTION ............................................................................................... 9
3. EXISTING CONDITIONS............................................................................................................ 11
ROAD MILEAGE AND CURRENT PAVEMENT CONDITION INDEX (PCI)....................................................................... 11 DISTRIBUTION OF PAVEMENT CONDITIONS .................................................................................................. 15 CURRENT ROADWAY BACKLOG ................................................................................................................. 16 CURRENT SIDEWALK, PEDESTRIAN RAMP, AND SIGN BACKLOG.......................................................................... 17
4. MODEL/PLANNING PROCESS.................................................................................................... 18
BUDGET ANALYSIS................................................................................................................................ 18 SCENARIO FINDINGS ............................................................................................................................. 19
Zero Budget.................................................................................................................................. 20 Historical Budget (Worst-First)........................................................................................................ 21 Historical Budget ........................................................................................................................... 22 Maintain Backlog Funding Scenario ................................................................................................. 23 Aggressive Funding Scenario .......................................................................................................... 24
5. CONCLUSION............................................................................................................................. 26
RECOMMENDED PLAN OF ACTION.............................................................................................................. 26 PAVEMENT MANAGEMENT SYSTEM MAINTENANCE .......................................................................................... 27
APPENDIX A. SPENCER’S ROADWAY BACKLOG B. COMPUTER RECOMMENDED 10 YEAR PAVEMENT MANAGEMENT PLAN C. REPAIR ALTERNATIVES AND UNIT COSTS D. GLOSSARY
Fay, Spofford & Thorndike
Tables ii
Tables
Table No. Description Page
1. (PCI) Treatment Band Ranges ....................................................... 8
2. Zero Budget ..........................................................................20
3. Historical Budget (Worst First)......................................................21
4. Historical Budget .........................................................................22
5. Maintain Backlog Funding Scenario ...............................................23
6. Aggressive Funding Scenario ........................................................24

Fay, Spofford & Thorndike
Figures iii
Figures
Figure No. Description Page
1. Pavement Deterioration Curve ....................................................... 5
2. PCI Distribution in Miles by Treatment Band ................................. 15
3. Dollar Backlog of Outstanding Repairs .......................................... 16
4. Summary of Roadway Funding Scenarios...................................... 25

Fay, Spofford & Thorndike
Introduction 4
1. Introduction
Background:
The Town of Spencer is located in the heart of Worcester County, west of Worcester, Massachusetts and ten minutes northeast of the junction of I-84 and I-90 in Sturbridge. A 110.7-mile roadway network serves a population of approximately
12,500 people. Spencer’s roadway network is comprised of approximately 5.3 state highway miles, 8.5 private miles and 96.9 public miles. The Town of Spencer, in October 2008, retained the firm of Fay, Spofford & Thorndike (FST) to develop and implement a Pavement Management System (PMS) for its public roadway miles. From the first meeting with Superintendent of Utilities and Facilities, Robert McNeil, and Highway Foreman, Eben Butler, it was clear that Spencer was committed to improving their roadway infrastructure to the greatest extent possible.
This comprehensive study was undertaken in order to develop an extensive roadway database describing actual pavement conditions and roadway characteristics in Spencer to better understand future roadway needs at various funding levels.
This report is designed to be a network level - planning tool and intended to provide a foundation for managing the Town’s roadway resources by combining technology, local knowledge, and professional engineering input. Before describing the roadway management study, scope and findings, an introduction to pavement management concepts and theory is offered.
Fay, Spofford & Thorndike
Introduction 5
Pavement Management Concepts:
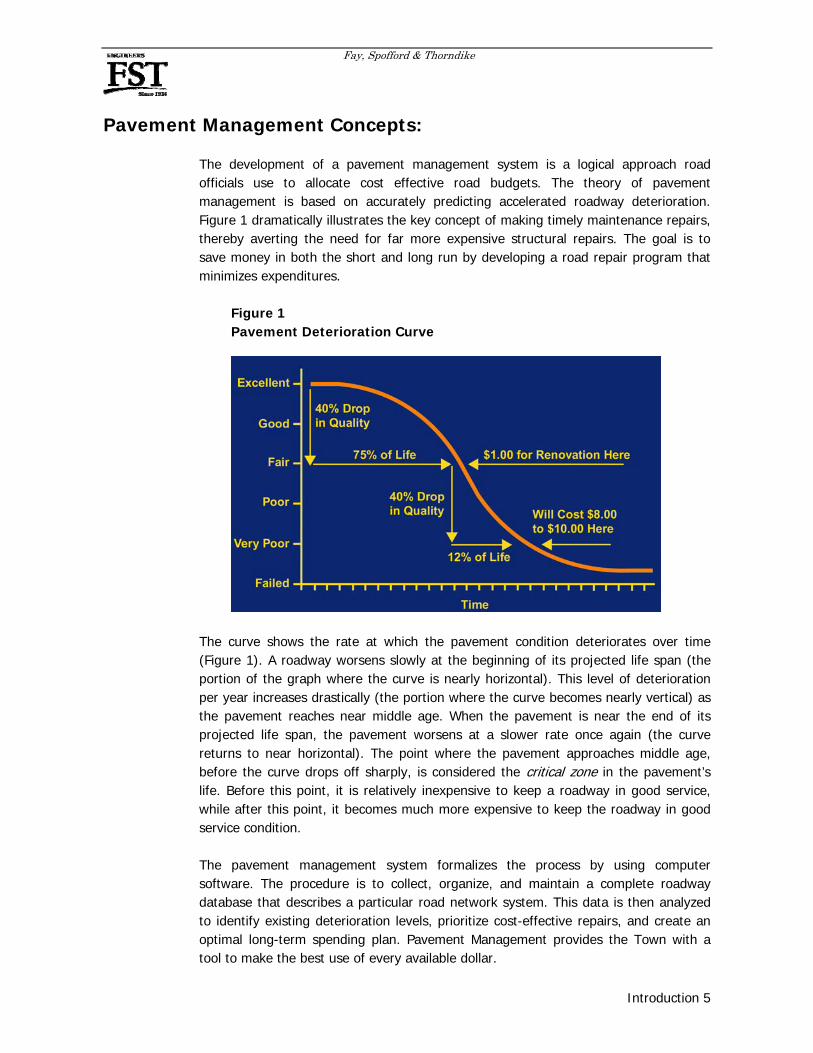
The development of a pavement management system is a logical approach road officials use to allocate cost effective road budgets. The theory of pavement management is based on accurately predicting accelerated roadway deterioration. Figure 1 dramatically illustrates the key concept of making timely maintenance repairs, thereby averting the need for far more expensive structural repairs. The goal is to save money in both the short and long run by developing a road repair program that minimizes expenditures.
Figure 1 Pavement Deterioration Curve
The curve shows the rate at which the pavement condition deteriorates over time (Figure 1). A roadway worsens slowly at the beginning of its projected life span (the portion of the graph where the curve is nearly horizontal). This level of deterioration per year increases drastically (the portion where the curve becomes nearly vertical) as the pavement reaches near middle age. When the pavement is near the end of its projected life span, the pavement worsens at a slower rate once again (the curve returns to near horizontal). The point where the pavement approaches middle age, before the curve drops off sharply, is considered the critical zone in the pavement’s life. Before this point, it is relatively inexpensive to keep a roadway in good service, while after this point, it becomes much more expensive to keep the roadway in good service condition.
The pavement management system formalizes the process by using computer software. The procedure is to collect, organize, and maintain a complete roadway database that describes a particular road network system. This data is then analyzed to identify existing deterioration levels, prioritize cost-effective repairs, and create an optimal long-term spending plan. Pavement Management provides the Town with a tool to make the best use of every available dollar.

Fay, Spofford & Thorndike
Introduction 6
Study Approach:
FST field engineers, using on-board notebook computers, conducted a Town-wide roadway inventory and assessment, which included a detailed evaluation of key distress indicators on the roadway surfaces, to build a comprehensive database. The process entailed breaking out pavement management segments, closely observing and recording individual pavement distresses, and evaluating roadway sufficiency, such as rideability and utility patch conditions.
Roadways were partitioned into “pavement manage-ment segments” whenever there was a change in pavement condition, surface type, width, one way status, or other distinguishing characteristics. The pavement manage-ment sections were then given a descriptive name
that would best allow someone in the office to identify the field location. Appendix A contains all the pavement management segments identified, and sorted in alphabetical order.
Beginning in November 2008, FST collected four primary types of field data in Spencer: 1. General roadway inventory data describing the beginning and end points
of pavement segments, width, length, and surface material type. 2. Pavement condition data, providing a snapshot description of pavement
surface conditions on the day of the survey—the severity and extent of specific pavement distresses, such as potholes, alligator cracking, transverse and longitudinal cracking, and rutting.
3. Roadway sufficiency scores for overall rideability, drainage, utility patches, traffic control, traffic safety, and roadside maintenance.
4. Sidewalk, pedestrian ramp, and sign inventory and general condition assessment.
Following data collection and field verification, system configuration meetings with the Office of Utilities and Facilities were held to gather information for subsequent computer analysis at various funding levels to be performed.

Fay, Spofford & Thorndike
Methodology 7
2. Methodology
Pavement Management Software:
Today’s computer management technology allows consolidation of multiple data for easy and efficient building, editing, sorting, and reporting. FST used Carte’graph Systems, Inc. - PAVEMENTview®Plus software for storing and analyzing Spencer's roadway data. The database was custom tailored to reflect Spencer's specific decision-making criteria for selecting roadway repair types for available and proposed budgets. Spencer’s Office of Utilities and Facilities and FST jointly developed system configuration parameters used in the analysis projections.
For analyzing Spencer’s roadway system, the Pavement Condition Index (PCI) served as the primary condition index to compare the roadway serviceability and performance. PCI is an American Society for Testing & Materials (ASTM) method used to quantify pavement condition that has been verified and adopted by American Public Works Association (APWA). For PCI calculation, the severity and extent of nine (9) major pavement distresses were re-
corded for each pavement management segment, and then the software used a weighted formula to calculate a PCI number. The nine distresses are: potholes or non-utility patching, alligator cracking, distortion, rutting, block cracking, transverse or longitudinal cracking, bleeding or polished aggregate, surface wear or raveling, and shoving, slippage or corrugations. Three pavement surface types were used to categorize Spencer’s road surfaces:
“Hot Mix Asphalt” or “bituminous concrete” roadway is typically engineered with a pavement structure designed to withstand predicted traffic load and volume. The roadway usually has a gravel base, an intermediate course, and a top surface wearing course.
“Surface Treated” roadways generally started as an oil and sand surface, and then were built up over time with a series of sand and

Fay, Spofford & Thorndike
Methodology 8
stone seals. Roads in this category include chip seals, micro-surfacing and Novachip.
“Gravel” roads having dirt or gravel unbound road surfaces.
The Pavement Condition Index (PCI) Defined:
Recording of actual field distresses calculate the PCI. A PCI was generated for each inventoried, surfaced, public roadway in Spencer using distress data. PCI is measured on a one hundred to zero scale, with one hundred representing a pavement in excellent condition and zero describing a pavement in extremely poor condition. Each type of observed pavement distress is assigned a deduct value based on the distress type, severity and extent.
More severe distress types, such as potholes, have higher “deduct points” than a lesser distress such as longitudinal cracking. A weighted sum of the deduct points is then subtracted from the perfect “one hundred” road in order to generate a PCI for each roadway. In general, base related (the pavement foundation) distresses are weighted more heavily than surface related distresses.
The Five Treatment Repair Bands:
FST’s pavement management software decision matrix uses five broad category ranges to group the calculated PCI numbers into five major repair bands. An individual road segment will fall into a particular band based on user defined criteria such as pavement type, functional classification, curb reveal, and sidewalk condition. Then each segment is assigned a repair alternative candidate with the prescribed treatment band. Table 1 presents the category ranges represented by the PCI bands.
Table 1 (PCI) Treatment Band Ranges1
DO NOTHING PCI Band #1 (100 - 88 PCI)
Excellent Condition - in need of no immediate maintenance.
ROUTINE MAINTENANCE PCI Band #2 (87 - 68 PCI)
Good Condition - may be in need of crack sealing or minor localized repair.
PREVENTIVE MAINTENANCE PCI Band #3 (67 - 47 PCI)
Fair Condition - pavement surface in need of surface sealing or thin overlay.
STRUCTURAL IMPROVEMENT PCI Band #4 (46 - 21 PCI)
Poor Condition - pavement structure in need of additional thickness to resist traffic loading.
BASE REHABILITATION PCI Band #5 (20 - 0 PCI)
Failure Condition - in need of full depth reconstruction/reclamation.
1 The PCI ranges given in this table are general averages. The actual treatment band threshold numbers depend on pavement surface type and functional classification.

Fay, Spofford & Thorndike
Methodology 9
1. When roads are in near perfect condition, the Do Nothing category (Band #1) prescribes no maintenance.
2. Routine Maintenance (Band #2) is regularly used on roads in reasonably
good condition to prevent deterioration from the normal effects of traffic and pavement age. This treatment category would include either crack sealing or local repair (pothole, depression, poorly constructed utility patch, etc.), or minor localized leveling.
3. Preventive Maintenance (Band #3) is a slightly greater response to more
pronounced signs of age and wear than that of Band #2. Not only would crack sealing, full-depth patching, and minor leveling be included, but also surface treatments such as chip seals, micro-surfacing, and thin overlays may apply on selected facilities and pavement types. A road in need of Preventive Maintenance is in the critical zone of the pavement deterioration curve (Figure 1). It is in this range of a pavement’s life cycle that the most cost-effective repairs can be made. Further deterioration warrants a significantly more costly response.
4. When the pavement deteriorates beyond the need for surface maintenance
applications, but the road base appears to be sound, Structural Improvement (Band #4) repairs are in order. They could include structural overlays, shim and overlay, cold planeing and overlay, and hot in-place recycling.
5. The Base Rehabilitation category (Band #5) represents roads that exhibit
weakened pavement foundation base layers. Complete reconstruction and full depth reclamation fall into this category. Quite often, project level pavement evaluation through field sampling and laboratory testing is used to evaluate the existing materials for possible recycling or reuse.
Priority Ranking and Future Projection:
After all pavement segment repairs are assigned, the software prioritizes needed system repairs based on the highest projected Network Priority Ranking (NPR). The NPR value uses variables representing functional classification, pavement type, PCI, and traffic volume. Although road repairs could be prioritized on “worst first” basis, FST and Spencer Office of Utilities and Facilities chose to maximize its available road funds by generating an NPR that favors cost-effective repairs that improve and/or maintain salvageable pavement segments. This would delay repair actions on those segments that require reconstruction or major rehabilitation; i.e., their condition cannot deteriorate much further. After the relatively good roads are "preserved", future repairs are then directed toward the poorer, heavily traveled roads.

Fay, Spofford & Thorndike
Methodology 10
In order to properly plan future repairs, the software utilizes several different de-terioration curves. These pavement per-
formance curves depict four (4) major cate-gories relative to functional classification (arterial roads in one curve, collector in one curve, local through roads in one curve and local dead-end roads in another curve); and three (3) fundamental pavement systems (a
curve for Hot Mix Asphalt pavements, a curve for surface treatment surfaces, and a different curve for gravel surfaces). When a road segment is evaluated as to whether it should be included in future repair programs, it deteriorates according to the applicable curve for the model duration, thereby accounting for the differential effects of traffic volume and pavement type.
Each plan year, the software prepares a future roadway condition projection, exhausts the assigned budget, and then produces an annual list of road segments to include in the repair program. The system also takes inflation into account for the time value of money. In these cases, a 4% inflation rate was used. Having explained the methodology built into the pavement management software, the next section describes the existing conditions in Spencer.

Fay, Spofford & Thorndike
Existing Conditions 11
3. Existing Conditions
Roadway Mileage and Current PCI:
Spencer has 157 streets that make up 96.9 public miles. This public roadway system is predominately hot mix asphalt (bituminous concrete) roadway surfaces. The mileage is comprised of 1.2 miles of arterials, 32.6 miles of collectors, 56.0 miles of locals, and 7.1 miles of dead ends.
FST identified 213 pavement management segments, and determined that the Town’s average road network PCI in the Spring of 2009 was 54, placing Spencer's typical road conditions in the middle of the Preventive Maintenance treatment band (PCI range from 67 to 47). This PCI average value generally represents a roadway in “fair” condition.
An average road condition in the Preventive Maintenance treatment band by definition means that considerable resources will be needed to sustain network wide road conditions. It is likely that while any proposed pavement management spending plan will strive to maximize the benefit of each dollar spent, without a pre-emptive strike the system will undoubtedly continue to lose roads from the routine and preventive maintenance category into the structural improvement and base rehabilitation bands. This very costly loss will present a challenge to Spencer officials if the Town wants to retain its roads in fair condition.
The following photographs illustrate examples of Spencer roadways that fall into each of the five treatment repair bands, and a representative average Town roadway condition. The photographs also show, for each treatment band, the location and the PCI value.

Fay, Spofford & Thorndike
Existing Conditions 12
Do Nothing PCI = 96
Wire Village Road from Pleasant Street to Gold Nugget Farm Road
Routine Maintenance PCI = 73
Paxton Road from 300’ S. of Wilson Road to 750’ N. of Wilson Road

Fay, Spofford & Thorndike
Existing Conditions 13
Preventive Maintenance PCI = 49 R. Jones Road from Ash Street to Kingsbury Road
Structural Improvement PCI = 25 Water Street from Valley Street to Main Street

Fay, Spofford & Thorndike
Existing Conditions 14
Base Rehabilitation PCI = 11 Ashview Drive from Ash Street to Cul-de-sac
Town Average Pavement Condition Index PCI = 54 Main Street from Sumner Street to 50’ E. of Pleasant Street

Fay, Spofford & Thorndike
Existing Conditions 15
Distribution of Pavement Conditions:
A categorization of the surveyed pavement segments show that 6% (5.9 miles) of the roadways fall into the "Do Nothing" band; 26% (25.1 miles) of the roads are in the "Routine Maintenance" band; 31% (29.8 miles) of the roads are in the "Preventive Maintenance" band; 23% (22.7 miles) of the roads are in need of "Structural Improvement"; and 14% (13.4 miles) of the pavement segments are in need of "Base Rehabilitation" (Figure 2). One quarter of the roadway network lies in the "Structural Improvement" band or “fair” condition, while the lowest mileage category for Spencer’s roads is the “Do Nothing” band. Appendix A contains the PCI values for each individual pavement segment.
Figure 2 PCI Distribution in Miles by Treatment Band
5.9
25.1
29.8
22.7
13.4
0.0
5.0
10.0
15.0
20.0
25.0
30.0
35.0
MIL
ES
Do Nothing 100 - 88 PCI
RoutineMaintenance 87 - 68 PCI
PreventiveMaintenance 67 - 47 PCI
StructuralImprovement 46 - 21 PCI
BaseRehabilitation 20 - 0 PCI
The actual system for each of the repair alternatives and unit costs can be found in Appendix C. For planning purposes, Base Rehabilitation type repairs approach the $50 per square yard range, structural overlay improvement costs are closer to $20 per square yard, preventive maintenance costs about $8 per square yard, and routine maintenance is in the $0.75 per square yard range.

Fay, Spofford & Thorndike
Existing Conditions 16
Current Roadway Backlog:
Backlog is defined as the cost of repairing all the roads within one year and bringing the average PCI to a near perfect 100. Backlog is a “snapshot” or relative measure of outstanding repair work. The backlog not only represents how far behind the Spencer roadway network is in terms of its present physical condition, but its cost value serves as a benchmark to measure the impact of various funding scenarios. The current backlog offers a basis for comparison to future and/or past year's backlog(s). Backlog dollars represent the pavement structure only, it does not include related repair cost for utilities, drainage, sidewalk, curbing, signals, signs, or pavement marking costs, unless specified within the activity (see Appendix C). As of Spring 2009, Spencer's backlog of pavement repair work totaled over $14,314,091. This cost estimate consists of $6,251,356 in base rehabilitation; $4,714,146 for structural improvement work; $3,097,775 in preventive maintenance, and $250,814 in routine maintenance. Figure 3 summarizes costs by treatment band. Note that the base rehabilitation category represents nearly 1/2 of the repair dollars though it accounts for less than 14% of the total road miles as shown in Figure 2.
Figure 3 Dollar Backlog of Outstanding Repairs
$-$250,814
$3,097,775
$4,714,146
$6,251,356
$0
$1,000,000
$2,000,000
$3,000,000
$4,000,000
$5,000,000
$6,000,000
$7,000,000
Do Nothing 100 - 88 PCI
RoutineMaintenance
87 - 68 PCI
PreventiveMaintenance 67 - 47 PCI
StructuralImprovement
46 - 21 PCI
BaseRehabilitation 20 - 0 PCI

Fay, Spofford & Thorndike
Existing Conditions 17
Current Sidewalk, Pedestrian Ramp, and Sign Backlog: $1,205,071
In addition to the pavement backlog, FST inventoried other right-of-way public infrastructure including the sidewalks, pedestrian ramps, and signs during our field assessment and have found the resulting backlog of repair work as follows: 2
2 FST did not perform any future financial models to sustain Spencer’s sidewalk, ramps, and signs backlog.
2009 Sidewalk Backlog = $880,371
$19,710
$860,661
CC - Cement Concrete
BC - Bit. Conc.
2009 Pedestrian Ramp Backlog = $206,800
$67,500 $31,500
$107,800
NONE/MISSINGBC-BITUMINOUS CONCRETECC-CEMENT CONCRETE
Sign Supports
$45,050
$9,275$0$0
$1,060
$265ACCEPTABLE
EXCELLENT
FAILED
OTHER
RUSTED
TWISTED
Signs
$4,750
$15,750
$500
$22,750
$10,750 $7,000$0$750 $0
ACCEPTABLE
BULLET HOLES
EXCELLENT
FAILED
OTHER
PEELING
RUSTED
TWISTED
VANDALIZED
2009 Sign and Support Backlog = $117,900

Fay, Spofford & Thorndike
Model/Planning Process 18
4. Model/Planning Process
Budget Analysis:
The analysis software of the pavement management system is where financial determinations and projections are made. Consideration is given to the required budget, by repair type, based on the supplied information from meetings with the Office of Utilities and Facilities and FST, for overall desired roadway network conditions. A regressive spending program occurs when insufficient funds are invested in road repairs, resulting in an ever-increasing repair backlog. An equilibrium program spends just enough money each year to keep the backlog stable. A progressive program provides sufficient improvement funds to result in a reduction of the backlog over time. Various scenarios were analyzed for Spencer to measure the effects of alternative funding levels, and to determine the funding needed to avoid regressive spending. The planning process determines the most beneficial improvement plan based on the dollars available for each repair type and other factors. Pavement management pulls together these components in its Network Priority Ranking (NPR) value in order to develop a cost-effective program. As previously stated, the NPR was configured to maximize roadway funds. In all of the following model projections (except the Historical Budget Worst-First), the power of the software was used to allocate funding amounts by best NPR value, based on the pavement management theory. Pavement management theory recognizes that roads deteriorate in an accelerated fashion after the first 75% of their service life and consequently, programs timely road expenditures to avert far more costly and widespread repairs. Appendix A contains a backlog report of the suggested segment repairs, the associated costs, PCI and NPR - as detailed in the Methodology section, the NPR number reflects the comparative merit of repairing one road section over another, in light of life cycle cost, traffic volume, and factors other than simply observed pavement distresses. This report has been ordered alphabetically. The balance of this section explains the results of Spencer’s scenario projections, and concludes with a long-term action plan based on the scenario findings.

Fay, Spofford & Thorndike
Model/Planning Process 19
Scenario Findings:
What follows is an overview of the budget/planning model results. Five budget/planning scenarios were modeled:
• Zero Budget • Historical Budget (Worst First) • Historical Budget • Maintain Backlog Funding Scenario • Aggressive Funding Scenario
After determining Spencer’s existing backlog of work, FST projected the network average pavement condition index and backlog at a zero annual appropriation rate for ten years; the expected historical appropriation rate for ten years with a priority on repairing the worst streets first; and the same historical allotment with a priority on repairing the best streets first; then a ten year scenario showing funding levels needed to maintain the current backlog; and finally, the impact of an aggressive ten year funding scenario.
All the scenarios accounted the “optimum” NPR with the exception of the Historical Budget (Worst First) where NPR focuses on repairing the worst segments first. The dollar amounts appropriated incorporate a 4.0% annual inflation rate. Therefore, where the annual roads program appropriation appears to remain the same, it in fact represents a net budget decrease due to the impact of inflation. It should be noted that Spencer’s annual roads program historically has only been funded by State Chapter 90 aid.
In the scenario specific summary tables that follow, each plan begins with the same network average PCI, then shows the new network average PCI at the end of each plan period. The tables also use the same amount of outstanding repair work (backlog) at the start of each plan period, so the first plan year backlog will appear the same for each of the scenarios. The successive years document the impact of the funding plan on comparison of road network average conditions and backlog.
Fay, Spofford & Thorndike
Model/Planning Process 20
Zero Budget:
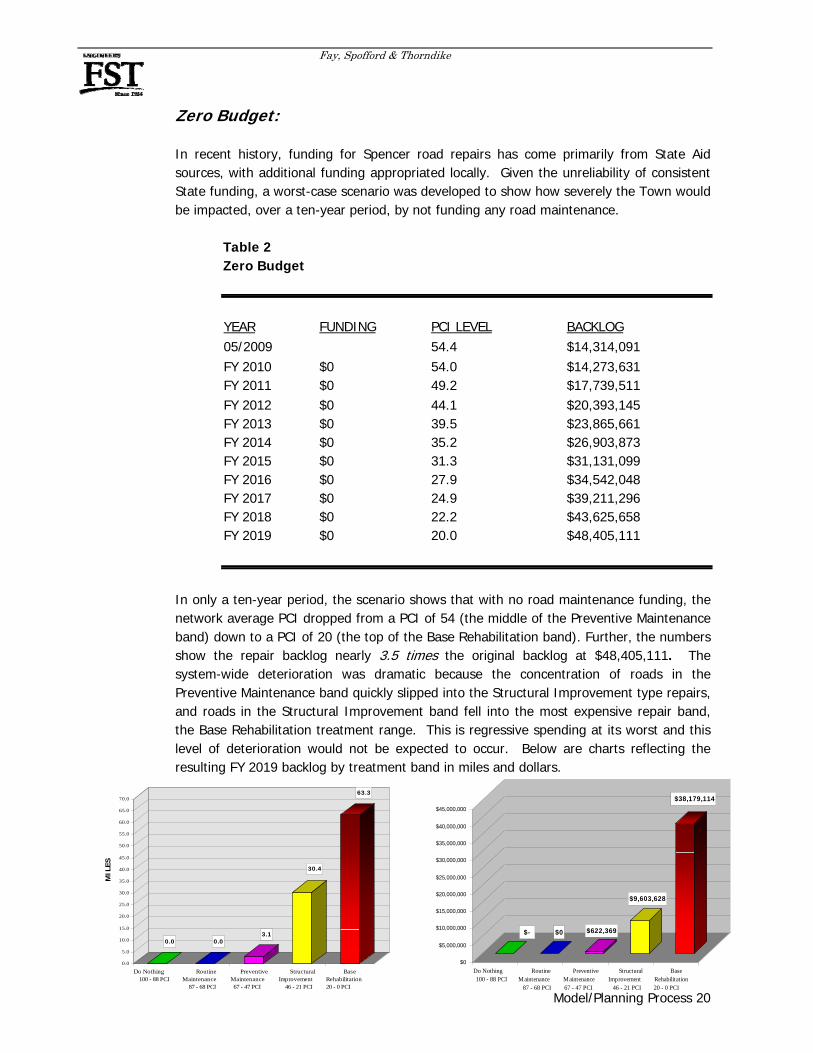
In recent history, funding for Spencer road repairs has come primarily from State Aid sources, with additional funding appropriated locally. Given the unreliability of consistent State funding, a worst-case scenario was developed to show how severely the Town would be impacted, over a ten-year period, by not funding any road maintenance.
Table 2 Zero Budget
YEAR FUNDING PCI LEVEL BACKLOG 05/2009 54.4 $14,314,091 FY 2010 $0 54.0 $14,273,631 FY 2011 $0 49.2 $17,739,511 FY 2012 $0 44.1 $20,393,145 FY 2013 $0 39.5 $23,865,661 FY 2014 $0 35.2 $26,903,873 FY 2015 $0 31.3 $31,131,099 FY 2016 $0 27.9 $34,542,048 FY 2017 $0 24.9 $39,211,296 FY 2018 $0 22.2 $43,625,658 FY 2019 $0 20.0 $48,405,111
In only a ten-year period, the scenario shows that with no road maintenance funding, the network average PCI dropped from a PCI of 54 (the middle of the Preventive Maintenance band) down to a PCI of 20 (the top of the Base Rehabilitation band). Further, the numbers show the repair backlog nearly 3.5 times the original backlog at $48,405,111. The system-wide deterioration was dramatic because the concentration of roads in the Preventive Maintenance band quickly slipped into the Structural Improvement type repairs, and roads in the Structural Improvement band fell into the most expensive repair band, the Base Rehabilitation treatment range. This is regressive spending at its worst and this level of deterioration would not be expected to occur. Below are charts reflecting the resulting FY 2019 backlog by treatment band in miles and dollars.
0.0 0.03.1
30.4
63.3
0.0
5.0
10.0
15.0
20.0
25.0
30.0
35.0
40.0
45.0
50.0
55.0
60.0
65.0
70.0
MIL
ES
Do Nothing 100 - 88 PCI
RoutineMaintenance
87 - 68 PCI
PreventiveMaintenance 67 - 47 PCI
StructuralImprovement
46 - 21 PCI
BaseRehabilitation 20 - 0 PCI
$- $0 $622,369
$9,603,628
$38,179,114
$0
$5,000,000
$10,000,000
$15,000,000
$20,000,000
$25,000,000
$30,000,000
$35,000,000
$40,000,000
$45,000,000
Do Nothing 100 - 88 PCI
RoutineMaintenance
87 - 68 PCI
PreventiveMaintenance 67 - 47 PCI
StructuralImprovement
46 - 21 PCI
BaseRehabilitation 20 - 0 PCI

Fay, Spofford & Thorndike
Model/Planning Process 21
Historical Budget (Worst First):
FST met with Spencer’s Utilities and Facilities officials to review historic funding levels. As confirmed by the Office, the current Spencer annual appropriation for roadway repairs is from the State Aid Chapter 90 program and limited local funding sources. The Historical Budget scenario based the five-year projection on the $394,000 funding level that the Town can rely on to maintain and repair its roads. The Historical Budget (Worst First) scenario prioritized the worst street segments first, since these represent most citizen complaints and repair requests.
Table 3 Historical Budget (Worst-First)
YEAR FUNDING PCI LEVEL BACKLOG 05/2009 54.4 $14,314,091 FY 2010 $394,000 55.4 $13,879,943 FY 2011 $394,000 51.3 $16,871,886 FY 2012 $394,000 47.4 $18,958,865 FY 2013 $394,000 44.0 $21,735,258 FY 2014 $394,000 40.8 $23,925,508 FY 2015 $394,000 38.0 $27,256,088 FY 2016 $394,000 35.6 $29,355,213 FY 2017 $394,000 33.5 $33,085,514 FY 2018 $394,000 31.8 $36,273,170 FY 2019 $394,000 30.3 $40,680,883
The network average PCI dropped from a PCI of 54 (the middle of the Preventive Maintenance band) down to a PCI of 30 (the middle of the Structural Improvement band). If this funding level remains unchanged, by the year 2019, the present backlog of $14,314,091 will have grown to $40,680,883 in the tenth year of the projection. This reflects a regressive spending program. Below are charts reflecting the resulting FY 2019 backlog by treatment band in miles and dollars.
6.5 5.12.9
27.8
54.6
0.0
5.0
10.0
15.0
20.0
25.0
30.0
35.0
40.0
45.0
50.0
55.0
60.0
65.0
MIL
ES
Do Nothing 100 - 88 PCI
RoutineMaintenance
87 - 68 PCI
PreventiveMaintenance 67 - 47 PCI
StructuralImprovement
46 - 21 PCI
BaseRehabilitation 20 - 0 PCI
$- $69,362 $580,063
$8,761,248
$31,270,210
$0
$5,000,000
$10,000,000
$15,000,000
$20,000,000
$25,000,000
$30,000,000
$35,000,000
$40,000,000
Do Nothing 100 - 88 PCI
RoutineMaintenance
87 - 68 PCI
PreventiveMaintenance 67 - 47 PCI
StructuralImprovement
46 - 21 PCI
BaseRehabilitation 20 - 0 PCI

Fay, Spofford & Thorndike
Model/Planning Process 22
Historical Budget:
The Historical Budget uses the same funding level as the previous scenario, except utilizing a Network Priority Ranking (NPR) that prioritizes “good” roads. By addressing the preventive maintenance type repairs, and deferring the “poorer” roads, the network average PCI slightly decreases to 46. More importantly, by simply changing repair strategy, at the end of this ten-year scenario, the Town will have saved over $7.0 million dollars (note: the backlog difference in year 2019) by adhering to the pavement management concept.
Table 4 Historical Budget
YEAR FUNDING PCI LEVEL BACKLOG 05/2009 54.4 $14,314,091 FY 2010 $394,000 57.9 $13,879,759 FY 2011 $394,000 55.2 $16,568,134 FY 2012 $394,000 52.8 $18,211,966 FY 2013 $394,000 50.4 $19,933,675 FY 2014 $394,000 48.7 $21,789,269 FY 2015 $394,000 47.9 $23,817,456 FY 2016 $394,000 46.9 $25,099,676 FY 2017 $394,000 46.5 $27,746,962 FY 2018 $394,000 46.0 $30,489,036 FY 2019 $394,000 45.8 $33,642,651
While this budget repesents regressive spending, the scenario illustrates the importance of not directing roadway funds towards the worst streets, but rather “preservation” maintenance repair types such as crack sealing and surface treatments. The following funding scenarios utilize the best-first approach, as seen here. Below are charts reflecting the resulting FY 2019 backlog by treatment band in miles and dollars.
31.8
1.3 0.0
7.9
55.8
0.0
5.0
10.0
15.0
20.0
25.0
30.0
35.0
40.0
45.0
50.0
55.0
60.0
65.0
MIL
ES
Do Nothing 100 - 88 PCI
RoutineMaintenance
87 - 68 PCI
PreventiveMaintenance 67 - 47 PCI
StructuralImprovement
46 - 21 PCI
BaseRehabilitation 20 - 0 PCI
$- $17,568 $0$1,959,539
$31,665,544
$0
$5,000,000
$10,000,000
$15,000,000
$20,000,000
$25,000,000
$30,000,000
$35,000,000
$40,000,000
Do Nothing 100 - 88 PCI
RoutineMaintenance
87 - 68 PCI
PreventiveMaintenance 67 - 47 PCI
StructuralImprovement
46 - 21 PCI
BaseRehabilitation 20 - 0 PCI

Fay, Spofford & Thorndike
Model/Planning Process 23
Maintain Backlog Funding Scenario:
Recognizing that an increase in local dollars will be needed to improve Town-wide road conditions, a scenario that would keep the backlog at today’s levels over a ten-year time period, was evaluated. This alternative would perform cost-effective repair work identified by existing conditions to maintain the current backlog. The work would be done over a ten-year period, costing $16,400,000 of which would require between $800,000 and $1,800,000 per year. By slowly chipping away at the backlog, the PCI increasing to 73 (at the bottom of the Routine Maintenance band), and the backlog of repair work increasing slightly to $14,897,530 in the year 2019, this funding program will place Spencer in an equilibrium spending program.
Table 5 Maintain Backlog Funding Scenario
YEAR FUNDING PCI LEVEL BACKLOG 05/2009 54.4 $14,314,091 FY 2010 $800,000 59.6 $13,473,859 FY 2011 $1,300,000 59.1 $14,995,369 FY 2012 $1,700,000 60.5 $15,150,496 FY 2013 $1,800,000 60.8 $14,885,738 FY 2014 $1,800,000 61.4 $14,625,484 FY 2015 $1,800,000 63.3 $14,325,010 FY 2016 $1,800,000 66.1 $13,532,269 FY 2017 $1,800,000 70.3 $13,283,485 FY 2018 $1,800,000 71.9 $13,994,913 FY 2019 $1,800,000 73.4 $14,897,530
Below are charts reflecting the resulting FY 2019 backlog by treatment band in miles and dollars.
64.8
1.0 0.01.7
29.4
0.0
5.0
10.0
15.0
20.0
25.0
30.0
35.0
40.0
45.0
50.0
55.0
60.0
65.0
70.0
MIL
ES
Do Nothing 100 - 88 PCI
RoutineMaintenance
87 - 68 PCI
PreventiveMaintenance 67 - 47 PCI
StructuralImprovement
46 - 21 PCI
BaseRehabilitation 20 - 0 PCI
$- $12,449 $0$396,494
$14,488,587
$0
$2,000,000
$4,000,000
$6,000,000
$8,000,000
$10,000,000
$12,000,000
$14,000,000
Do Nothing 100 - 88 PCI
RoutineMaintenance
87 - 68 PCI
PreventiveMaintenance 67 - 47 PCI
StructuralImprovement
46 - 21 PCI
BaseRehabilitation 20 - 0 PCI

Fay, Spofford & Thorndike
Model/Planning Process 24
Aggressive Funding Scenario:
In keeping with good pavement management practice, a funding scenario that would aggressively address the backlog was evaluated. The proposed scenario looks at spending a little over $14,000,000 over the next ten years. Starting with spending $2,500,000 for the first three years, $1,250,000 the next four years, and cutting the funding in half, once again, to a reasonable future funding level of $512,000 for the last three years. At the end of the ten-year projection, this funding level results in a substantial improvement in road network condition, with the PCI rising 30%, to 77, while the backlog decreases to $10,647,834.
Table 6 Aggressive Funding Scenario
YEAR FUNDING PCI LEVEL BACKLOG 05/2009 54.4 $14,314,091 FY 2010 $2,500,000 66.2 $11,773,931 FY 2011 $2,500,000 68.9 $11,368,123 FY 2012 $2,500,000 70.9 $ 9,952,134 FY 2013 $1,250,000 71.0 $ 9,604,384 FY 2014 $1,250,000 71.9 $ 9,591,895 FY 2015 $1,250,000 76.0 $ 9,794,835 FY 2016 $1,250,000 78.4 $ 9,367,885 FY 2017 $512,000 78.1 $ 9,700,851 FY 2018 $512,000 77.6 $ 9,829,176 FY 2019 $512,000 77.4 $10,647,834
By countering pavement deterioration aggressively in its early stages, at today’s costs, this scenario would allow the Town to implement a pro-active pavement maintenance program – making the necessary capital repairs while maintaining the streets in the maintenance categories simultaneously, and better managing Spencer’s future pavement backlog. This truly is a progressive funding program. Below are charts reflecting the resulting FY 2019 backlog by treatment band in miles and dollars.
65.6
8.4
0.02.0
21.2
0.0
5.0
10.0
15.0
20.0
25.0
30.0
35.0
40.0
45.0
50.0
55.0
60.0
65.0
70.0
MIL
ES
Do Nothing 100 - 88 PCI
RoutineMaintenance
87 - 68 PCI
PreventiveMaintenance 67 - 47 PCI
StructuralImprovement
46 - 21 PCI
BaseRehabilitation 20 - 0 PCI
$- $94,989 $0$367,176
$10,185,668
$0
$2,000,000
$4,000,000
$6,000,000
$8,000,000
$10,000,000
$12,000,000
Do Nothing 100 - 88 PCI
RoutineMaintenance
87 - 68 PCI
PreventiveMaintenance 67 - 47 PCI
StructuralImprovement
46 - 21 PCI
BaseRehabilitation 20 - 0 PCI

Fay, Spofford & Thorndike
Model/Planning Process 25
Figure 4
Summary of Roadway Funding Scenarios
PROJECTION YEAR
$48,405,111
$33,642,651
$40,680,883
$14,897,530
$10,647,834
$0
$10,000,000
$20,000,000
$30,000,000
$40,000,000
$50,000,000
NOW FY2010
FY2011
FY2012
FY2013
FY2014
FY2015
FY2016
FY2017
FY2018
FY2019
BA
CK
LOG
Zero Budget
Historical Budget
Historical Budget (Worst-First)
Maintain Backlog Funding
Aggressive Funding Program

Fay, Spofford & Thorndike
Conclusion 26
5. Conclusion
Recommended Plan of Action: The overall roadway network in the Town of Spencer is currently in fair condition. However, this study shows that future diligence will immediately be necessary to preserve and improve town-wide pavement conditions. The findings in this report illustrate current funding levels are severely low and will not sustain expected roadway deterioration. Future roadway funding levels need to be increased as soon as possible, as Spencer’s street network is on the brink of extensive town-wide roadway rehabilitation.
If pre-emptive action is not taken, the large mileage of streets currently in need of preventative maintenance will rapidly digress to poorer conditions that would subject the town to far more expensive roadway work. Today’s roadway network currently sits slightly below the “critical point” where the window of opportunity to perform cost-effective roadway repairs is presented. The town should strive to secure between $12,000,000 and $14,000,000 for the next ten years, to aggressively tackle its roadway backlog, as found in the Aggressive Funding Scenario, and gain better control of its rapidly deteriorating roadways. Also, the town should continue keeping abreast of the latest developments in pavement restoration technology that might offer a more cost-effective alternative to pavement maintenance or rehabilitation over the pavement's life cycle. It’s easy to forget that pavements are a community’s single largest asset. The Town has a major investment in its 96.9-mile roadway network. Simply considering the pavement surface alone, without water, sewer, drainage, curbing, or sidewalks assets, it would cost Spencer slightly over $69,000,000 in today’s dollars to completely replace the existing pavement infrastructure. Pavements are not perpetual, they’re one of Town’s fastest deteriorating assets, due to environmental effects, increased traffic loading, and utility cuts.
Bonding rates are at an all time low, and a viable alternative to investigate for additional roadway capital. Additional roadway funding will protect Spencer’s pavement assets, resulting in better overall roadway conditions, and satisfaction that taxpayer dollars have been well spent.

Fay, Spofford & Thorndike
Conclusion 27
Pavement Management System Maintenance:
Pavement management is a systematic process that needs the long-term commitment of Town decision-makers and support of practitioners to maintain the pavement management system. The Town of Spencer has purchased pavement management software to update the Town’s roadway database in the future. Standard management and upkeep of the database include the following practices:
• Post all annual pavement management segment improvements into the database. Both the pavement condition ratings and the repair history information should be entered.
• Re-inspect Arterial and Collector roadways annually; local roads every two (2) years; dead end and cul-de-sacs every three (3) years.
• Add any new roadways to the database as soon as the Town accepts them. Pavement and roadside data can be added as it becomes available.
• Update repair type unit costs and inflation rates annually, re-calculate applicable funding models and analyses.
• Implement a sound departmental quality control/assurance program, with particular focus on major pay items such as hot mix asphalt.
• Form a Pavement Management Committee. Members should include representatives from different Town departments and committees, and from both management and operational levels.
FST can support this proposed action plan using our transportation expertise and talents. In summary, the pavement management system should serve as a valuable tool to the Town of Spencer and to Spencer decision-makers in their pro-active approach to managing Spencer's roadways.

APPENDIX A

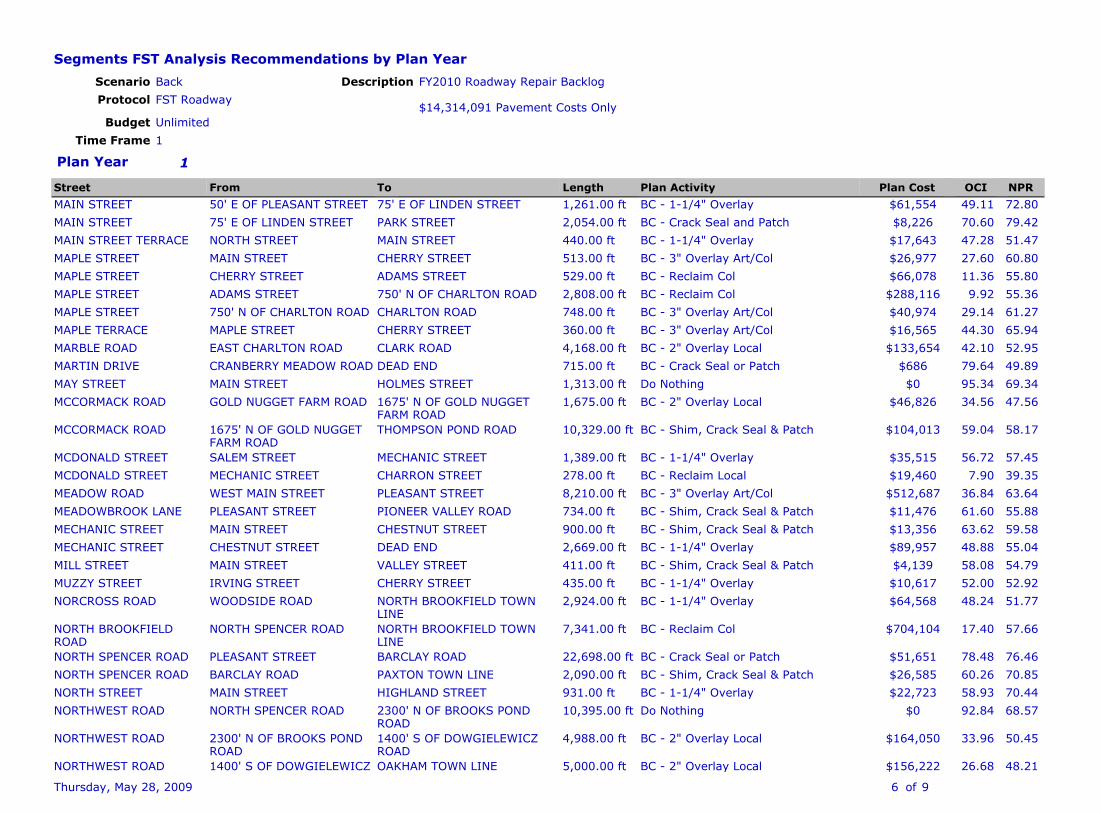
Segments FST Analysis Recommendations by Plan YearFilter (..\..\Model ID = "1")
Sort Segment ID\Description, Segment IDGroup By Plan Year
Working Set Filter <Not Applicable>
Segments FST Analysis Recommendations by Plan YearScenario BackProtocol FST Roadway
Budget Unlimited
Description
Time Frame 1
FY2010 Roadway Repair Backlog $14,314,091 Pavement Costs Only
Thursday, May 28, 2009 91 of
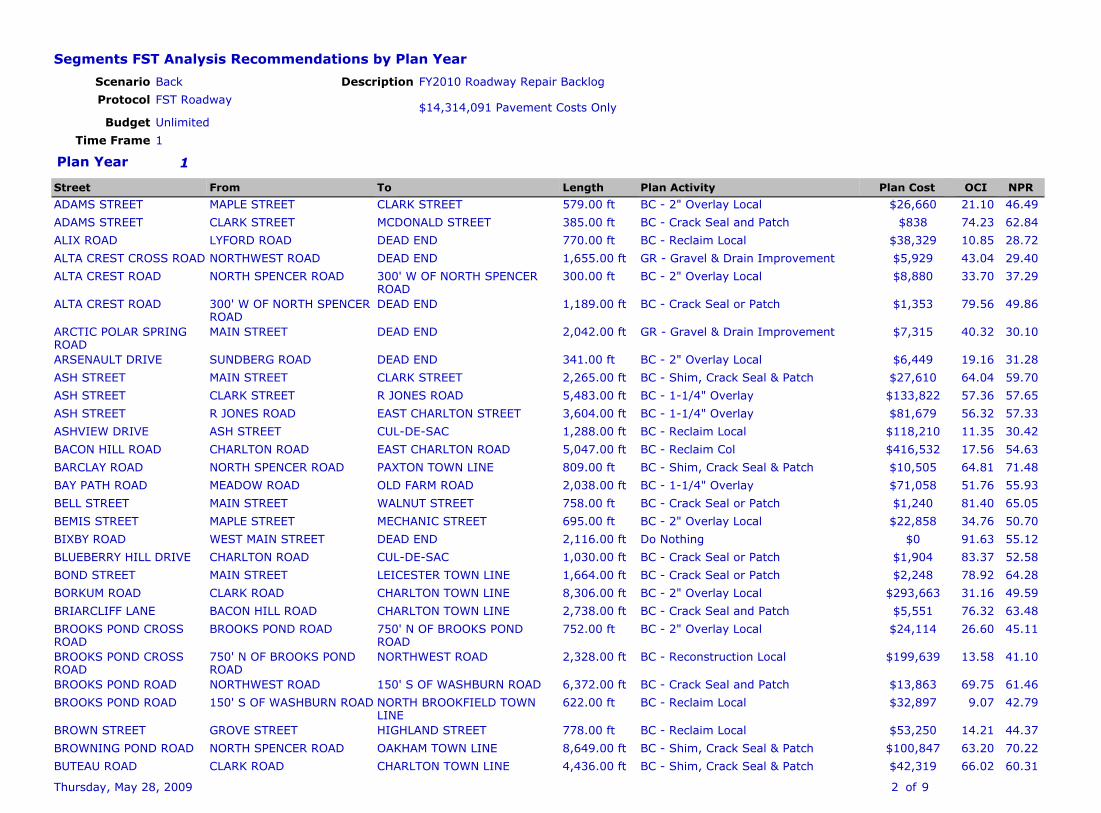
Plan Year 1Length Plan Activity Plan Cost NPRFrom ToStreet OCI
BC - 2" Overlay Local $26,660 21.10579.00 ftMAPLE STREET CLARK STREETADAMS STREET 46.49BC - Crack Seal and Patch $838 74.23385.00 ftCLARK STREET MCDONALD STREETADAMS STREET 62.84BC - Reclaim Local $38,329 10.85770.00 ftLYFORD ROAD DEAD ENDALIX ROAD 28.72GR - Gravel & Drain Improvement $5,929 43.041,655.00 ftNORTHWEST ROAD DEAD ENDALTA CREST CROSS ROAD 29.40BC - 2" Overlay Local $8,880 33.70300.00 ftNORTH SPENCER ROAD 300' W OF NORTH SPENCER
ROADALTA CREST ROAD 37.29
BC - Crack Seal or Patch $1,353 79.561,189.00 ft300' W OF NORTH SPENCERROAD
DEAD ENDALTA CREST ROAD 49.86GR - Gravel & Drain Improvement $7,315 40.322,042.00 ftMAIN STREET DEAD ENDARCTIC POLAR SPRING
ROAD30.10
BC - 2" Overlay Local $6,449 19.16341.00 ftSUNDBERG ROAD DEAD ENDARSENAULT DRIVE 31.28BC - Shim, Crack Seal & Patch $27,610 64.042,265.00 ftMAIN STREET CLARK STREETASH STREET 59.70BC - 1-1/4" Overlay $133,822 57.365,483.00 ftCLARK STREET R JONES ROADASH STREET 57.65BC - 1-1/4" Overlay $81,679 56.323,604.00 ftR JONES ROAD EAST CHARLTON STREETASH STREET 57.33BC - Reclaim Local $118,210 11.351,288.00 ftASH STREET CUL-DE-SACASHVIEW DRIVE 30.42BC - Reclaim Col $416,532 17.565,047.00 ftCHARLTON ROAD EAST CHARLTON ROADBACON HILL ROAD 54.63BC - Shim, Crack Seal & Patch $10,505 64.81809.00 ftNORTH SPENCER ROAD PAXTON TOWN LINEBARCLAY ROAD 71.48BC - 1-1/4" Overlay $71,058 51.762,038.00 ftMEADOW ROAD OLD FARM ROADBAY PATH ROAD 55.93BC - Crack Seal or Patch $1,240 81.40758.00 ftMAIN STREET WALNUT STREETBELL STREET 65.05BC - 2" Overlay Local $22,858 34.76695.00 ftMAPLE STREET MECHANIC STREETBEMIS STREET 50.70Do Nothing $0 91.632,116.00 ftWEST MAIN STREET DEAD ENDBIXBY ROAD 55.12BC - Crack Seal or Patch $1,904 83.371,030.00 ftCHARLTON ROAD CUL-DE-SACBLUEBERRY HILL DRIVE 52.58BC - Crack Seal or Patch $2,248 78.921,664.00 ftMAIN STREET LEICESTER TOWN LINEBOND STREET 64.28BC - 2" Overlay Local $293,663 31.168,306.00 ftCLARK ROAD CHARLTON TOWN LINEBORKUM ROAD 49.59BC - Crack Seal and Patch $5,551 76.322,738.00 ftBACON HILL ROAD CHARLTON TOWN LINEBRIARCLIFF LANE 63.48BC - 2" Overlay Local $24,114 26.60752.00 ftBROOKS POND ROAD 750' N OF BROOKS POND
ROADBROOKS POND CROSSROAD
45.11BC - Reconstruction Local $199,639 13.582,328.00 ft750' N OF BROOKS POND
ROADNORTHWEST ROADBROOKS POND CROSS
ROAD41.10
BC - Crack Seal and Patch $13,863 69.756,372.00 ftNORTHWEST ROAD 150' S OF WASHBURN ROADBROOKS POND ROAD 61.46BC - Reclaim Local $32,897 9.07622.00 ft150' S OF WASHBURN ROAD NORTH BROOKFIELD TOWN
LINEBROOKS POND ROAD 42.79
BC - Reclaim Local $53,250 14.21778.00 ftGROVE STREET HIGHLAND STREETBROWN STREET 44.37BC - Shim, Crack Seal & Patch $100,847 63.208,649.00 ftNORTH SPENCER ROAD OAKHAM TOWN LINEBROWNING POND ROAD 70.22
Segments FST Analysis Recommendations by Plan YearScenario BackProtocol FST Roadway
Budget Unlimited
Description
Time Frame 1
FY2010 Roadway Repair Backlog $14,314,091 Pavement Costs Only
BC - Shim, Crack Seal & Patch $42,319 66.024,436.00 ftCLARK ROAD CHARLTON TOWN LINEBUTEAU ROAD 60.31Thursday, May 28, 2009 92 of

Plan Year 1Length Plan Activity Plan Cost NPRFrom ToStreet OCIBC - Shim, Crack Seal & Patch $42,319 66.024,436.00 ftCLARK ROAD CHARLTON TOWN LINEBUTEAU ROAD 60.31
BC - 2" Overlay Local $14,029 26.32449.00 ftMAPLE STREET MECHANIC STREETCASEY STREET 45.02BC - Reclaim Col $461,290 16.864,055.00 ftMAPLE STREET EAST CHARLTON ROADCHARLTON ROAD 57.50BC - Reclaim Col $646,306 18.065,467.00 ftEAST CHARLTON ROAD SUNBERG ROADCHARLTON ROAD 57.86BC - Reclaim Col $577,147 18.384,882.00 ftSUNBERG ROAD CRANBERRY MEADOW ROADCHARLTON ROAD 57.96BC - 3" Overlay Art/Col $200,881 30.493,820.00 ftCRANBERRY MEADOW ROAD CHARLTON TOWN LINECHARLTON ROAD 61.69BC - Reclaim Local $46,343 10.57931.00 ftPROSPECT STREET DEAD ENDCHARRON STREET 30.18BC - Reclaim Local $48,269 9.97535.00 ftMECHANIC STREET MAPLE STREETCHERRY STREET 43.07BC - Crack Seal and Patch $3,466 68.281,298.00 ftMAPLE STREET MAY STREETCHERRY STREET 61.01BC - 1-1/4" Overlay $60,469 55.362,214.00 ftMAY STREET GREENVILLE STREETCHERRY STREET 57.03BC - 3" Overlay Art/Col $131,046 42.062,136.00 ftMAPLE STREET VALLEY STREETCHESTNUT STREET 65.25BC - 3" Overlay Art/Col $231,011 23.315,549.00 ftCLARK ROAD 150' W OF GREENVILLE STREETCHICKERING ROAD 57.94BC - Crack Seal or Patch $688 82.40450.00 ft150' W OF GREENVILLE
STREETLEICESTER TOWN LINECHICKERING ROAD 76.12
BC - 2" Overlay Local $35,418 22.80979.00 ftMAPLE STREET TEMPLE STREETCHURCH STREET 47.02BC - Reclaim Local $29,624 16.93414.00 ftTEMPLE STREET EARLEY STREETCHURCH STREET 45.21BC - Reclaim Local $267,540 9.784,410.00 ftEAST CHARLTON ROAD CHICKERING ROADCLARK ROAD 43.01BC - Crack Seal or Patch $10,429 81.656,111.00 ftCHICKERING ROAD LEICESTER TOWN LINECLARK ROAD 65.12BC - 2" Overlay Local $49,728 42.401,344.00 ftASH STREET ADAMS STREETCLARK STREET 53.05BC - 2" Overlay Local $11,544 18.39468.00 ftCLARK STREET DEAD ENDCLARK TERRACE 31.04BC - 1-1/4" Overlay $92,187 55.122,644.00 ftOAKLAND DRIVE COLLIER CIRCLECOLLIER CIRCLE 56.96BC - Crack Seal and Patch $2,359 72.201,446.00 ftSOUTH SPENCER ROAD DEAD ENDCONDON DRIVE 49.14BC - Crack Seal or Patch $6,848 81.554,377.00 ftNORTH SPENCER ROAD HASTINGS ROADCOONEY ROAD 65.09Do Nothing $0 87.30584.00 ftTREADWELL DRIVE CUL-DE-SACCORNFIELD ROAD 53.78BC - Crack Seal and Patch $1,888 70.45682.00 ftCHERRY STREET HOLMES STREETCOTTAGE STREET 61.68BC - Shim, Crack Seal & Patch $2,821 59.84273.00 ftLINCOLN STREET GRANT STREETCRAIG ROAD 55.34BC - Crack Seal and Patch $16,126 69.547,090.00 ftLYFORD ROAD JOLICOEUR ROADCRANBERRY MEADOW
ROAD61.40
BC - Crack Seal or Patch $6,156 77.683,267.00 ftJOLICOEUR ROAD 200' W OF BRIARCLIFF LANECRANBERRY MEADOWROAD
63.90BC - Crack Seal and Patch $2,091 76.68881.00 ft200' W OF BRIARCLIFF LANE 650' E OF BRIARCLIFF LANECRANBERRY MEADOW
ROAD63.59
BC - Crack Seal or Patch $2,465 78.161,507.00 ft650' E OF BRIARCLIFF LANE CHARLTON ROADCRANBERRY MEADOWROAD
64.05BC - Crack Seal or Patch $1,489 79.70997.00 ftWALNUT STREET SUMNER STREETCROWN STREET 64.52
Segments FST Analysis Recommendations by Plan YearScenario BackProtocol FST Roadway
Budget Unlimited
Description
Time Frame 1
FY2010 Roadway Repair Backlog $14,314,091 Pavement Costs Only
Thursday, May 28, 2009 93 of

Plan Year 1Length Plan Activity Plan Cost NPRFrom ToStreet OCI
BC - Reclaim Local $51,004 15.851,171.00 ftSOUTH SPENCER ROAD DEAD ENDDEPOT ROAD 31.80Do Nothing $0 90.32255.00 ftDONNELLY STREET 250' N OF DONNELLY STREETDONNELLY CROSS ROAD 67.79BC - Reconstruction Local $539,806 18.205,220.00 ft250' N OF DONNELLY
STREETLEICESTER TOWN LINEDONNELLY CROSS ROAD 45.60
BC - Shim, Crack Seal & Patch $19,365 59.601,975.00 ftMAIN STREET 250' N OF DONNELLY CROSSROAD
DONNELLY STREET 58.34BC - 2" Overlay Local $101,035 22.783,072.00 ft250' N OF DONNELLY
CROSS ROADPAXTON ROADDONNELLY STREET 47.01
BC - 1-1/4" Overlay $12,567 50.22865.00 ftNORTHWEST ROAD DEAD ENDDOWGIELEWICZ DRIVE 40.84BC - 2" Overlay Local $12,518 22.84525.00 ftHOWE RD DEAD ENDDUFAULT ROAD 43.95BC - 2" Overlay Local $13,892 32.88384.00 ftGROVE STREET HIGHLAND STREETDUGGAN STREET 47.04BC - 1-1/4" Overlay $12,125 53.28535.00 ftMAPLE STREET MECHANIC STREETDUSTIN STREET 56.39BC - 1-1/4" Overlay $13,818 54.08553.00 ftPLEASANT STREET WIRE VILLAGE ROADEAGLETON ROAD 53.56BC - Crack Seal or Patch $977 74.60808.00 ftCHESTNUT STREET DEAD ENDEARLEY STREET 49.88BC - 2" Overlay Local $166,788 44.744,057.00 ftCHARLTON ROAD G HENRY WILSON ROADEAST CHARLTON ROAD 53.77BC - Crack Seal or Patch $6,629 81.154,439.00 ftG HENRY WILSON ROAD CLARK ROADEAST CHARLTON ROAD 64.97BC - 2" Overlay Local $38,028 46.321,250.00 ftCLARK ROAD BACON HILL ROADEAST CHARLTON ROAD 54.25BC - 2" Overlay Local $177,386 34.766,164.00 ftBACON HILL ROAD CHARLTON TOWN LINEEAST CHARLTON ROAD 50.70BC - 2" Overlay Local $31,909 40.42924.00 ftMAIN STREET CHESTNUT STREETELM STREET 52.44BC - Reclaim Local $18,788 18.68366.00 ftMAIN STREET CROWN STREETEMMETT STREET 42.67BC - Crack Seal and Patch $2,857 69.121,313.00 ftSCHOOL STREET MEADOW ROADFOURTH AVENUE 61.27BC - 2" Overlay Local $26,722 39.45650.00 ftSCHOOL STREET SAMPSON STREETFRANKLIN STREET 49.06BC - Reclaim Local $445,998 10.546,993.00 ftEAST CHARLTON ROAD CHICKERING ROADG HENRY WILSON ROAD 43.24GR - Grade $1,512 81.60864.00 ftSOUTH SPENCER ROAD DEAD ENDGALE DRIVE 41.26BC - Crack Seal or Patch $6,963 81.704,896.00 ftCHARLTON ROAD CRANBERRY MEADOW ROADGAUTHIER ROAD 65.14BC - Crack Seal and Patch $10,331 75.544,975.00 ftHASTINGS ROAD PAXTON ROADGOLD NUGGET FARM
ROAD71.70
BC - 2" Mill & Overlay Local $76,264 32.961,884.00 ftPLEASANT STREET DEAD ENDGRANT STREET 50.14BC - Crack Seal or Patch $24,502 88.8815,662.00 ftMAIN STREET CHICKERING ROADGREENVILLE STREET 78.89BC - 1-1/4" Overlay $74,196 52.162,280.00 ftMAIN STREET HIGHLAND STREETGROVE STREET 56.05BC - Shim, Crack Seal & Patch $36,851 65.242,838.00 ftWILSON STREET 150' S OF WIRE VILLAGE ROADHASTINGS ROAD 60.07BC - 2" Overlay Local $75,645 28.152,359.00 ft150' S OF WIRE VILLAGE
ROAD300' S OF GOLD NUGGET FARMROAD
HASTINGS ROAD 48.66
Segments FST Analysis Recommendations by Plan YearScenario BackProtocol FST Roadway
Budget Unlimited
Description
Time Frame 1
FY2010 Roadway Repair Backlog $14,314,091 Pavement Costs Only
BC - Shim, Crack Seal & Patch $3,948 65.42382.00 ft300' S OF GOLD NUGGET 100' N OF GOLD NUGGET FARMHASTINGS ROAD 60.13
Thursday, May 28, 2009 94 of

Plan Year 1Length Plan Activity Plan Cost NPRFrom ToStreet OCIBC - Shim, Crack Seal & Patch $3,948 65.42382.00 ft
FARM ROAD ROADHASTINGS ROAD 60.13
BC - Crack Seal and Patch $17,114 71.788,653.00 ft100' N OF GOLD NUGGETFARM ROAD
NORTH SPENCER ROADHASTINGS ROAD 62.09BC - Crack Seal and Patch $1,974 76.381,210.00 ftCRANBERRY MEADOW ROAD JOLICOEUR ROADHEBERT ROAD 74.27BC - Crack Seal and Patch $3,679 69.511,958.00 ftJOLICOEUR ROAD SOUTH SPENCER ROADHEBERT ROAD 72.16BC - Shim, Crack Seal & Patch $23,121 62.541,745.00 ftMAIN STREET PLEASANT STREETHIGH STREET 59.24BC - Reclaim Local $94,883 18.621,564.00 ftLAKE STREET GROVE STREETHIGHLAND STREET 45.73BC - Shim, Crack Seal & Patch $21,883 67.581,588.00 ftGROVE STREET WILSON STREETHIGHLAND STREET 60.79BC - 2" Overlay Local $10,770 34.68354.00 ftASH STREET MAY STREETHOLMES STREET 47.59Do Nothing $0 95.34605.00 ftMAY STREET DALE STREETHOLMES STREET 69.34BC - Shim, Crack Seal & Patch $14,091 62.781,266.00 ftDONNELLY CROSS ROAD LEICESTER TOWN LINEHOWARD HURLEY ROAD 56.24BC - Shim, Crack Seal & Patch $69,813 63.746,755.00 ftLYFORD ROAD CHARLTON ROADHOWE ROAD / HOWE
POND RD59.61
BC - Crack Seal or Patch $2,813 84.761,978.00 ftCHARLTON ROAD EAST CHARLTON ROADI CAPEN ROAD 63.00Do Nothing $0 93.591,008.00 ftGREENVILLE STREET MUZZY STREETIRVING STREET 68.80BC - Shim, Crack Seal & Patch $16,894 64.761,226.00 ftMUZZY STREET MAY STREETIRVING STREET 59.93BC - 1-1/4" Overlay $41,095 55.851,861.00 ftCRANBERRY MEADOW ROAD HEBERT ROADJOLICOEUR ROAD 65.65Do Nothing $0 96.80358.00 ftPOPE STREET STARR STREETJONES STREET 66.71BC - 2" Overlay Local $135,851 31.084,348.00 ftGREENVILLE STREET (N) GREENVILLE STREET (S)KINGSBURY ROAD 49.56BC - 1-1/4" Overlay $74,852 52.723,578.00 ftNORTHWEST ROAD NORTH BROOKFIELD TOWN
LINEKITTREDGE ROAD 56.22
BC - 2" Mill & Overlay Local $20,604 34.60509.00 ftMAIN STREET RENE DRIVELAKE STREET 50.65BC - Crack Seal and Patch $2,937 74.091,449.00 ftRENE DRIVE DEAD ENDLAKE STREET 62.80BC - 2" Overlay Local $12,314 45.46384.00 ftMECHANIC STREET TEMPLE STREETLANGEVIN STREET 50.91BC - Reclaim Local $22,151 9.87445.00 ftTEMPLE STREET DEAD ENDLANGEVIN STREET 28.42GR - Grade $1,064 67.52608.00 ftWILLIAM CASEY ROAD DEAD ENDLEONARD ROAD 38.47BC - 1-1/4" Overlay $33,240 55.201,300.00 ftPLEASANT STREET WILSON STLINCOLN STREET 55.45BC - 2" Overlay Local $33,826 21.82935.00 ftWILSON STREET DEAD ENDLINCOLN STREET 33.64BC - 1-1/4" Overlay $20,246 57.20670.00 ftMAIN STREET CHERRY STREETLINDEN STREET 57.60BC - 2" Mill & Overlay Local $16,775 28.69353.00 ftELM STREET WALL STREETLLOYD DYER DRIVE 45.75BC - Crack Seal and Patch $959 76.84606.00 ftSOUTH SPENCER ROAD LYFORD ROADLYFORD CROSS ROAD 60.57BC - Shim, Crack Seal & Patch $49,552 61.204,065.00 ftSOUTH SPENCER ROAD HOWE ROADLYFORD ROAD 58.83BC - 1-1/4" Overlay $136,872 53.382,771.00 ftSUMNER STREET 50' E OF PLEASANT STREETMAIN STREET 74.12
Segments FST Analysis Recommendations by Plan YearScenario BackProtocol FST Roadway
Budget Unlimited
Description
Time Frame 1
FY2010 Roadway Repair Backlog $14,314,091 Pavement Costs Only
Thursday, May 28, 2009 95 of
Plan Year 1Length Plan Activity Plan Cost NPRFrom ToStreet OCI
BC - 1-1/4" Overlay $61,554 49.111,261.00 ft50' E OF PLEASANT STREET 75' E OF LINDEN STREETMAIN STREET 72.80BC - Crack Seal and Patch $8,226 70.602,054.00 ft75' E OF LINDEN STREET PARK STREETMAIN STREET 79.42BC - 1-1/4" Overlay $17,643 47.28440.00 ftNORTH STREET MAIN STREETMAIN STREET TERRACE 51.47BC - 3" Overlay Art/Col $26,977 27.60513.00 ftMAIN STREET CHERRY STREETMAPLE STREET 60.80BC - Reclaim Col $66,078 11.36529.00 ftCHERRY STREET ADAMS STREETMAPLE STREET 55.80BC - Reclaim Col $288,116 9.922,808.00 ftADAMS STREET 750' N OF CHARLTON ROADMAPLE STREET 55.36BC - 3" Overlay Art/Col $40,974 29.14748.00 ft750' N OF CHARLTON ROAD CHARLTON ROADMAPLE STREET 61.27BC - 3" Overlay Art/Col $16,565 44.30360.00 ftMAPLE STREET CHERRY STREETMAPLE TERRACE 65.94BC - 2" Overlay Local $133,654 42.104,168.00 ftEAST CHARLTON ROAD CLARK ROADMARBLE ROAD 52.95BC - Crack Seal or Patch $686 79.64715.00 ftCRANBERRY MEADOW ROAD DEAD ENDMARTIN DRIVE 49.89Do Nothing $0 95.341,313.00 ftMAIN STREET HOLMES STREETMAY STREET 69.34BC - 2" Overlay Local $46,826 34.561,675.00 ftGOLD NUGGET FARM ROAD 1675' N OF GOLD NUGGET
FARM ROADMCCORMACK ROAD 47.56
BC - Shim, Crack Seal & Patch $104,013 59.0410,329.00 ft1675' N OF GOLD NUGGETFARM ROAD
THOMPSON POND ROADMCCORMACK ROAD 58.17BC - 1-1/4" Overlay $35,515 56.721,389.00 ftSALEM STREET MECHANIC STREETMCDONALD STREET 57.45BC - Reclaim Local $19,460 7.90278.00 ftMECHANIC STREET CHARRON STREETMCDONALD STREET 39.35BC - 3" Overlay Art/Col $512,687 36.848,210.00 ftWEST MAIN STREET PLEASANT STREETMEADOW ROAD 63.64BC - Shim, Crack Seal & Patch $11,476 61.60734.00 ftPLEASANT STREET PIONEER VALLEY ROADMEADOWBROOK LANE 55.88BC - Shim, Crack Seal & Patch $13,356 63.62900.00 ftMAIN STREET CHESTNUT STREETMECHANIC STREET 59.58BC - 1-1/4" Overlay $89,957 48.882,669.00 ftCHESTNUT STREET DEAD ENDMECHANIC STREET 55.04BC - Shim, Crack Seal & Patch $4,139 58.08411.00 ftMAIN STREET VALLEY STREETMILL STREET 54.79BC - 1-1/4" Overlay $10,617 52.00435.00 ftIRVING STREET CHERRY STREETMUZZY STREET 52.92BC - 1-1/4" Overlay $64,568 48.242,924.00 ftWOODSIDE ROAD NORTH BROOKFIELD TOWN
LINENORCROSS ROAD 51.77
BC - Reclaim Col $704,104 17.407,341.00 ftNORTH SPENCER ROAD NORTH BROOKFIELD TOWNLINE
NORTH BROOKFIELDROAD
57.66BC - Crack Seal or Patch $51,651 78.4822,698.00 ftPLEASANT STREET BARCLAY ROADNORTH SPENCER ROAD 76.46BC - Shim, Crack Seal & Patch $26,585 60.262,090.00 ftBARCLAY ROAD PAXTON TOWN LINENORTH SPENCER ROAD 70.85BC - 1-1/4" Overlay $22,723 58.93931.00 ftMAIN STREET HIGHLAND STREETNORTH STREET 70.44Do Nothing $0 92.8410,395.00 ftNORTH SPENCER ROAD 2300' N OF BROOKS POND
ROADNORTHWEST ROAD 68.57
BC - 2" Overlay Local $164,050 33.964,988.00 ft2300' N OF BROOKS PONDROAD
1400' S OF DOWGIELEWICZROAD
NORTHWEST ROAD 50.45
Segments FST Analysis Recommendations by Plan YearScenario BackProtocol FST Roadway
Budget Unlimited
Description
Time Frame 1
FY2010 Roadway Repair Backlog $14,314,091 Pavement Costs Only
BC - 2" Overlay Local $156,222 26.685,000.00 ft1400' S OF DOWGIELEWICZ OAKHAM TOWN LINENORTHWEST ROAD 48.21Thursday, May 28, 2009 96 of

Plan Year 1Length Plan Activity Plan Cost NPRFrom ToStreet OCIBC - 2" Overlay Local $156,222 26.685,000.00 ft
ROADOAKHAM TOWN LINENORTHWEST ROAD 48.21
BC - 1-1/4" Overlay $41,329 48.881,270.00 ftSHERWOOOD DRIVE (S) SHERWOOOD DRIVE (N)NOTTINGHAM CIRCLE 55.04BC - Reclaim Local $27,767 0.73595.00 ftDONNELLY CROSS ROAD COLLIERS CIRCLEOAKLAND DRIVE 40.22BC - 1-1/4" Overlay $86,262 54.242,516.00 ftSMITHVILLE ROAD MEADOW ROADOLD FARM ROAD 56.69BC - Crack Seal and Patch $2,132 71.711,232.00 ftMEADOW ROAD (N) MEADOW ROAD (S)OLD MEADOW ROAD 58.99BC - 2" Overlay Local $66,008 31.161,115.00 ftMAIN STREET 300' E OF MEADOW ROADOLDE MAIN STREET 49.59BC - Shim, Crack Seal & Patch $5,224 65.90308.00 ft300' E OF MEADOW ROAD MEADOW ROADOLDE MAIN STREET 60.28BC - 1-1/4" Overlay $12,350 51.42462.00 ftTEMPLE STREET DEAD ENDPARENT STREET 41.21BC - Crack Seal or Patch $587 84.25550.00 ftMAIN STREET DEAD ENDPARK STREET 51.31Do Nothing $0 90.62267.00 ftPAXTON ROAD DEAD ENDPAXTON DRIVE 54.81BC - 3" Overlay Art/Col $89,818 35.601,708.00 ftMAIN STREET 300' S OF WILSON STREETPAXTON ROAD 62.49BC - Crack Seal and Patch $2,258 71.761,062.00 ft300' S OF WILSON STREET 750' N OF WILSON STREETPAXTON ROAD 73.62BC - 1-1/4" Overlay $128,204 48.294,694.00 ft750' N OF WILSON STREET LAKEVIEW STREETPAXTON ROAD 66.40BC - 3" Overlay Art/Col $224,589 32.715,000.00 ftLAKEVIEW STREET 5000' N OF LAKEVIEW STREETPAXTON ROAD 61.60BC - 3" Overlay Art/Col $256,261 44.305,198.00 ft5000' N OF LAKEVIEW
STREETTHOMPSON POND ROADPAXTON ROAD 65.17
BC - Reclaim Local $63,308 13.831,071.00 ftELM STREET VALLEY STREETPEARL STREET 44.26BC - Shim, Crack Seal & Patch $14,416 59.40850.00 ftSMITHVILLE ROAD CUL-DE-SACPIONEER VALLEY ROAD 45.20BC - 3" Mill & Overlay Art/Col $227,952 43.253,177.00 ftMAIN STREET 175' N OF SMITHVILLE ROADPLEASANT STREET 66.38BC - 3" Overlay Art/Col $92,349 38.351,561.00 ft175' N OF SMITHVILLE
ROADMEADOW ROADPLEASANT STREET 64.88
BC - Reclaim Local $18,993 3.37370.00 ftLANGEVIN STREET DEAD ENDPLEASANT VIEW ROAD 26.42BC - Crack Seal and Patch $756 76.44283.00 ftCLARK STREET MCDONALD STREETPOND STREET 60.44BC - Shim, Crack Seal & Patch $12,788 63.381,177.00 ftGROVE STREET BROWN STREETPOPE STREET 59.50BC - Reclaim Local $39,009 19.19643.00 ftNORTH STREET LAKE STREETPOWERS STREET 42.83BC - Reclaim Local $64,549 19.57988.00 ftMAPLE STREET TEMPLE STREETPROSPECT STREET 46.02BC - Reclaim Local $24,346 18.60423.00 ftPLEASANT STREET HIGH STREETPROUTY STREET 42.65BC - 2" Overlay Local $191,842 45.406,306.00 ftASH STREET KINGSBURY ROADR JONES ROAD 53.97Do Nothing $0 89.08685.00 ftGREENVILLE STREET LEICESTER TOWN LINERAWSON ROAD 76.64BC - 1-1/4" Overlay $15,326 50.52447.00 ftSHERRY LANE CUL-DE-SACROBIN ROAD 40.93BC - Crack Seal or Patch $891 77.28545.00 ftLACAIRE LANE DEAD ENDSALEM STREET 50.70BC - 2" Overlay Local $29,416 36.16688.00 ftMAIN STREET DEAD ENDSAMPSON STREET 36.51BC - 1-1/4" Overlay $90,500 53.442,781.00 ftMAIN STREET MEADOW ROADSCHOOL STREET 56.44
Segments FST Analysis Recommendations by Plan YearScenario BackProtocol FST Roadway
Budget Unlimited
Description
Time Frame 1
FY2010 Roadway Repair Backlog $14,314,091 Pavement Costs Only
Thursday, May 28, 2009 97 of

Plan Year 1Length Plan Activity Plan Cost NPRFrom ToStreet OCI
BC - 1-1/4" Overlay $44,203 50.401,247.00 ftEAST CHARLTON ROAD CUL-DE-SACSHERRY LANE 42.43BC - Shim, Crack Seal & Patch $37,887 56.462,553.00 ftTHOMPSON POND ROAD CUL-DE-SACSHERWOOD DRIVE 44.30BC - Shim, Crack Seal & Patch $27,811 66.142,691.00 ftNORTH SPENCER ROAD SMITHVILLE ROADSMITHVILLE CROSS ROAD 60.35BC - 2" Mill & Overlay Local $62,370 35.401,575.00 ftPLEASANT STREET MEADOW ROADSMITHVILLE ROAD 50.89BC - Crack Seal or Patch $1,812 83.80910.00 ftMEADOW ROAD 900' W OF MEADOW ROADSMITHVILLE ROAD 65.78BC - Shim, Crack Seal & Patch $46,862 62.664,019.00 ft900' W OF MEADOW ROAD 900' N OF LALIBERTE LANESMITHVILLE ROAD 59.28BC - Shim, Crack Seal & Patch $45,446 61.524,513.00 ft900' N OF LALIBERTE LANE EAST BROOKFIELD TOWN LINESMITHVILLE ROAD 58.93BC - 1-1/4" Overlay $419,702 52.7018,056.00 ftWEST MAIN STREET EAST BROOKFIELD TOWN LINESOUTH SPENCER ROAD 67.75BC - Shim, Crack Seal & Patch $8,414 61.04567.00 ftSCHOOL STREET SAMPSON STREETSOUTH STREET 58.78Do Nothing $0 85.80449.00 ftOAKLAND DRIVE CUL-DE-SACSPINNAKER DRIVE 53.32BC - 1-1/4" Overlay $30,229 56.721,020.00 ftMAIN STREET CHERRY STREETSPRING STREET 57.45Do Nothing $0 96.80607.00 ftGROVE STREET POPE STREETSTARR STREET 66.71BC - Crack Seal and Patch $1,377 68.95633.00 ftSCHOOL STREET CUL-DE-SACSULLIVAN STREET 46.60Do Nothing $0 95.081,151.00 ftMAIN STREET WATSON STREETSUMMIT STREET 69.26BC - 2" Overlay Local $7,943 21.26420.00 ftSUNDBERG ROAD DEAD ENDSUNDBERG DRIVE 31.93BC - 2" Overlay Local $93,735 34.803,353.00 ftCHARLTON ROAD GAUTHIER ROADSUNDBERG ROAD 47.63BC - Crack Seal or Patch $1,120 78.52750.00 ftGREENVILLE STREET 750' W OF GREENVILLE STREETSUNSET LANE 64.16Do Nothing $0 97.52557.00 ftGREENVILLE STREET DEAD ENDSUNSET LANE 70.01BC - 1-1/4" Overlay $54,305 54.002,225.00 ftCHESTNUT STREET LANGEVIN STREETTEMPLE STREET 56.62BC - Crack Seal or Patch $1,756 74.481,497.00 ftNORTH SPENCER ROAD DEAD ENDTERKANIAN DRIVE 49.84BC - Reclaim Col $743,480 20.587,246.00 ftNORTH SPENCER ROAD PAXTON TOWN LINETHOMPSON POND ROAD 57.10BC - Shim, Crack Seal & Patch $17,983 62.001,740.00 ftSOUTH SPENCER ROAD EAST BROOKFIELD TOWN LINETOM CASEY ROAD 56.00BC - Crack Seal or Patch $2,456 79.561,818.00 ftSMITHVILLE ROAD DEAD ENDTREADWELL DRIVE 51.40Do Nothing $0 91.87606.00 ftTREADWELL DRIVE CUL-DE-SACTREADWELL TERRACE 53.65BC - Crack Seal or Patch $435 75.40278.00 ftELM STREET 275' W OF ELM STREETVALLEY STREET 50.12BC - 2" Overlay Local $80,640 23.152,229.00 ft275' W OF ELM STREET DEAD ENDVALLEY STREET 32.51BC - Crack Seal and Patch $644 69.33296.00 ftCROWN STREET BELL STREETVERNON STREET 58.26BC - Crack Seal or Patch $799 78.92661.00 ftSCHOOL STREET FOURTH AVENUEVINE STREET 61.21BC - 2" Overlay Local $37,918 29.77854.00 ftMAIN STREET MECHANIC STREETWALL STREET 49.16BC - Crack Seal or Patch $606 84.00533.00 ftSCHOOL STREET CROWN STREETWALNUT STREET 62.77BC - 3" Mill & Overlay Art/Col $54,813 23.16939.00 ftVALLEY STREET MAIN STREETWATER STREET 59.43
Segments FST Analysis Recommendations by Plan YearScenario BackProtocol FST Roadway
Budget Unlimited
Description
Time Frame 1
FY2010 Roadway Repair Backlog $14,314,091 Pavement Costs Only
BC - Crack Seal and Patch $7,309 68.144,106.00 ftJOLICOEUR ROAD 1100' N OF CHARLTON TOWNWILLIAM CASEY ROAD 60.97Thursday, May 28, 2009 98 of
Plan Year 1Length Plan Activity Plan Cost NPRFrom ToStreet OCIBC - Crack Seal and Patch $7,309 68.144,106.00 ftJOLICOEUR ROAD
LINEWILLIAM CASEY ROAD 60.97
BC - 2" Overlay Local $32,560 29.561,100.00 ft1100' N OF CHARLTONTOWN LINE
CHARLTON TOWN LINEWILLIAM CASEY ROAD 49.10BC - 1-1/4" Overlay $154,405 50.406,813.00 ftLINCOLN STREET PAXTON ROADWILSON STREET 55.51Do Nothing $0 94.6510,050.00 ftPLEASANT STREET NUGGET FARM ROADWIRE VILLAGE ROAD 79.89BC - Reconstruction Local $84,141 17.841,112.00 ftWOODSIDE ROAD CUL-DE-SAC LOOPWOODSIDE DRIVE 30.87BC - Shim, Crack Seal & Patch $44,137 67.284,383.00 ftSMITHVILLE ROAD NORCROSS ROADWOODSIDE ROAD 60.70BC - 2" Overlay Local $48,128 29.381,582.00 ftNORCROSS ROAD NORTH BROOKFIELD ROADWOODSIDE ROAD 49.04
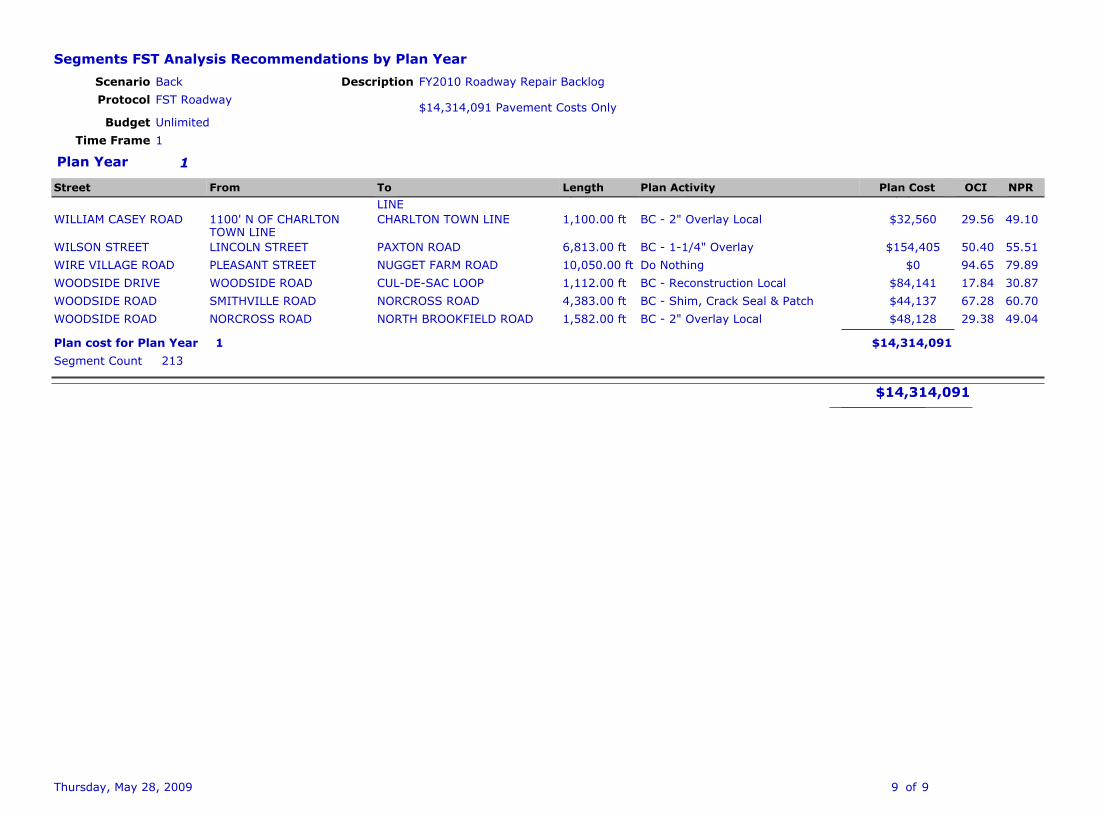
$14,314,091213Segment Count
Plan cost for Plan Year 1
Segments FST Analysis Recommendations by Plan YearScenario BackProtocol FST Roadway
Budget Unlimited
Description
Time Frame 1
FY2010 Roadway Repair Backlog $14,314,091 Pavement Costs Only
$14,314,091
Thursday, May 28, 2009 99 of

APPENDIX B

Segments FST Analysis Recommendations by ActivityFilter ((..\..\Model ID = "6") And (Plan Cost <> 0))
Sort Segment ID\Description, Segment IDGroup By Plan Year, Plan Activity
Working Set Filter <Not Applicable>
Segments FST Analysis Recommendations by ActivityScenario Prog1Protocol FST Roadway
Budget Aggressive
Description
Time Frame 10
Aggressive Scenario - Attack the Backlog up front at today's dollars. $2.5M for year 1 - 3$1.25M for year 4 -7$512k for year 8 -10
Thursday, May 28, 2009 171 of

Plan Year 1Length Plan Activity Plan Cost NPRFrom ToStreet OCI
BC - 1-1/4" Overlay $41,056 55.851861 ftCRANBERRY MEADOW ROAD HEBERT ROADJOLICOEUR ROAD 65.65BC - 1-1/4" Overlay $136,741 53.382771 ftSUMNER STREET 50' E OF PLEASANT STREETMAIN STREET 74.12BC - 1-1/4" Overlay $61,495 49.111261 ft50' E OF PLEASANT STREET 75' E OF LINDEN STREETMAIN STREET 72.80BC - 1-1/4" Overlay $22,701 58.93931 ftMAIN STREET HIGHLAND STREETNORTH STREET 70.44BC - 1-1/4" Overlay $128,081 48.294694 ft750' N OF WILSON STREET LAKEVIEW STREETPAXTON ROAD 66.40BC - 1-1/4" Overlay $419,300 52.7018056 ftWEST MAIN STREET EAST BROOKFIELD TOWN LINESOUTH SPENCER ROAD 67.75
6Segment Count $809,3745.6 milesBC - 3" Mill & Overlay Art/Col $227,639 43.253177 ftMAIN STREET 175' N OF SMITHVILLE ROADPLEASANT STREET 66.38
1Segment Count $227,6390.6 milesBC - 3" Overlay Art/Col $130,847 42.062136 ftMAPLE STREET VALLEY STREETCHESTNUT STREET 65.25BC - 3" Overlay Art/Col $16,540 44.30360 ftMAPLE STREET CHERRY STREETMAPLE TERRACE 65.94BC - 3" Overlay Art/Col $511,907 36.848210 ftWEST MAIN STREET PLEASANT STREETMEADOW ROAD 63.64BC - 3" Overlay Art/Col $89,681 35.601708 ftMAIN STREET 300' S OF WILSON STREETPAXTON ROAD 62.49BC - 3" Overlay Art/Col $255,872 44.305198 ft5000' N OF LAKEVIEW STREET THOMPSON POND ROADPAXTON ROAD 65.17BC - 3" Overlay Art/Col $92,208 38.351561 ft175' N OF SMITHVILLE ROAD MEADOW ROADPLEASANT STREET 64.88
6Segment Count $1,097,0553.6 milesBC - Crack Seal and Patch $838 74.23385 ftCLARK STREET MCDONALD STREETADAMS STREET 62.84BC - Crack Seal and Patch $5,551 76.322738 ftBACON HILL ROAD CHARLTON TOWN LINEBRIARCLIFF LANE 63.48BC - Crack Seal and Patch $13,863 69.756372 ftNORTHWEST ROAD 150' S OF WASHBURN ROADBROOKS POND ROAD 61.46BC - Crack Seal and Patch $3,466 68.281298 ftMAPLE STREET MAY STREETCHERRY STREET 61.01BC - Crack Seal and Patch $1,888 70.45682 ftCHERRY STREET HOLMES STREETCOTTAGE STREET 61.68BC - Crack Seal and Patch $16,126 69.547090 ftLYFORD ROAD JOLICOEUR ROADCRANBERRY MEADOW
ROAD61.40
BC - Crack Seal and Patch $2,091 76.68881 ft200' W OF BRIARCLIFF LANE 650' E OF BRIARCLIFF LANECRANBERRY MEADOWROAD
63.59BC - Crack Seal and Patch $2,857 69.121313 ftSCHOOL STREET MEADOW ROADFOURTH AVENUE 61.27BC - Crack Seal and Patch $10,331 75.544975 ftHASTINGS ROAD PAXTON ROADGOLD NUGGET FARM
ROAD71.70
BC - Crack Seal and Patch $17,114 71.788653 ft100' N OF GOLD NUGGET FARMROAD
NORTH SPENCER ROADHASTINGS ROAD 62.09BC - Crack Seal and Patch $1,974 76.381210 ftCRANBERRY MEADOW ROAD JOLICOEUR ROADHEBERT ROAD 74.27
Segments FST Analysis Recommendations by ActivityScenario Prog1Protocol FST Roadway
Budget Aggressive
Description
Time Frame 10
Aggressive Scenario - Attack the Backlog up front at today's dollars. $2.5M for year 1 - 3$1.25M for year 4 -7$512k for year 8 -10
Thursday, May 28, 2009 172 of

Plan Year 1Length Plan Activity Plan Cost NPRFrom ToStreet OCI
BC - Crack Seal and Patch $3,679 69.511958 ftJOLICOEUR ROAD SOUTH SPENCER ROADHEBERT ROAD 72.16BC - Crack Seal and Patch $2,937 74.091449 ftRENE DRIVE DEAD ENDLAKE STREET 62.80BC - Crack Seal and Patch $959 76.84606 ftSOUTH SPENCER ROAD LYFORD ROADLYFORD CROSS ROAD 60.57BC - Crack Seal and Patch $8,226 70.602054 ft75' E OF LINDEN STREET PARK STREETMAIN STREET 79.42BC - Crack Seal and Patch $2,258 71.761062 ft300' S OF WILSON STREET 750' N OF WILSON STREETPAXTON ROAD 73.62BC - Crack Seal and Patch $756 76.44283 ftCLARK STREET MCDONALD STREETPOND STREET 60.44
17Segment Count $94,9128.1 milesBC - Crack Seal or Patch $1,240 81.40758 ftMAIN STREET WALNUT STREETBELL STREET 65.05BC - Crack Seal or Patch $2,248 78.921664 ftMAIN STREET LEICESTER TOWN LINEBOND STREET 64.28BC - Crack Seal or Patch $688 82.40450 ft150' W OF GREENVILLE STREET LEICESTER TOWN LINECHICKERING ROAD 76.12BC - Crack Seal or Patch $10,429 81.656111 ftCHICKERING ROAD LEICESTER TOWN LINECLARK ROAD 65.12BC - Crack Seal or Patch $6,848 81.554377 ftNORTH SPENCER ROAD HASTINGS ROADCOONEY ROAD 65.09BC - Crack Seal or Patch $6,156 77.683267 ftJOLICOEUR ROAD 200' W OF BRIARCLIFF LANECRANBERRY MEADOW
ROAD63.90
BC - Crack Seal or Patch $2,465 78.161507 ft650' E OF BRIARCLIFF LANE CHARLTON ROADCRANBERRY MEADOWROAD
64.05BC - Crack Seal or Patch $1,489 79.70997 ftWALNUT STREET SUMNER STREETCROWN STREET 64.52BC - Crack Seal or Patch $6,629 81.154439 ftG HENRY WILSON ROAD CLARK ROADEAST CHARLTON ROAD 64.97BC - Crack Seal or Patch $6,963 81.704896 ftCHARLTON ROAD CRANBERRY MEADOW ROADGAUTHIER ROAD 65.14BC - Crack Seal or Patch $24,502 88.8815662 ftMAIN STREET CHICKERING ROADGREENVILLE STREET 78.89BC - Crack Seal or Patch $2,813 84.761978 ftCHARLTON ROAD EAST CHARLTON ROADI CAPEN ROAD 63.00BC - Crack Seal or Patch $51,651 78.4822698 ftPLEASANT STREET BARCLAY ROADNORTH SPENCER ROAD 76.46BC - Crack Seal or Patch $1,812 83.80910 ftMEADOW ROAD 900' W OF MEADOW ROADSMITHVILLE ROAD 65.78BC - Crack Seal or Patch $1,120 78.52750 ftGREENVILLE STREET 750' W OF GREENVILLE STREETSUNSET LANE 64.16BC - Crack Seal or Patch $799 78.92661 ftSCHOOL STREET FOURTH AVENUEVINE STREET 61.21BC - Crack Seal or Patch $606 84.00533 ftSCHOOL STREET CROWN STREETWALNUT STREET 62.77
17Segment Count $128,45913.6 milesBC - Shim, Crack Seal & Patch $10,439 64.81809 ftNORTH SPENCER ROAD PAXTON TOWN LINEBARCLAY ROAD 71.48BC - Shim, Crack Seal & Patch $100,213 63.208649 ftNORTH SPENCER ROAD OAKHAM TOWN LINEBROWNING POND ROAD 70.22BC - Shim, Crack Seal & Patch $26,418 60.262090 ftBARCLAY ROAD PAXTON TOWN LINENORTH SPENCER ROAD 70.85
Segments FST Analysis Recommendations by ActivityScenario Prog1Protocol FST Roadway
Budget Aggressive
Description
Time Frame 10
Aggressive Scenario - Attack the Backlog up front at today's dollars. $2.5M for year 1 - 3$1.25M for year 4 -7$512k for year 8 -10
Thursday, May 28, 2009 173 of

Plan Year 1Length Plan Activity Plan Cost NPRFrom ToStreet OCI
BC - Shim, Crack Seal & Patch $5,191 65.90308 ft300' E OF MEADOW ROAD MEADOW ROADOLDE MAIN STREET 60.284Segment Count $142,2602.2 miles
$2,499,69951Segment Count
Plan cost for Plan Year 1 33.8 miles
Segments FST Analysis Recommendations by ActivityScenario Prog1Protocol FST Roadway
Budget Aggressive
Description
Time Frame 10
Aggressive Scenario - Attack the Backlog up front at today's dollars. $2.5M for year 1 - 3$1.25M for year 4 -7$512k for year 8 -10
Thursday, May 28, 2009 174 of

Plan Year 2Length Plan Activity Plan Cost NPRFrom ToStreet OCI
BC - 1-1/4" Overlay $62,861 56.722265 ftMAIN STREET CLARK STREETASH STREET 57.45BC - 1-1/4" Overlay $6,424 51.84273 ftLINCOLN STREET GRANT STREETCRAIG ROAD 52.87BC - 1-1/4" Overlay $52,641 54.721745 ftMAIN STREET PLEASANT STREETHIGH STREET 56.84BC - 1-1/4" Overlay $158,945 56.326755 ftLYFORD ROAD CHARLTON ROADHOWE ROAD / HOWE
POND RD57.33
BC - 1-1/4" Overlay $38,464 57.681226 ftMUZZY STREET MAY STREETIRVING STREET 57.75BC - 1-1/4" Overlay $30,408 56.16900 ftMAIN STREET CHESTNUT STREETMECHANIC STREET 57.28BC - 1-1/4" Overlay $29,115 55.841177 ftGROVE STREET BROWN STREETPOPE STREET 57.18
7Segment Count $378,8582.7 milesBC - 3" Overlay Art/Col $208,623 27.323820 ftCRANBERRY MEADOW ROAD CHARLTON TOWN LINECHARLTON ROAD 60.71BC - 3" Overlay Art/Col $28,017 23.70513 ftMAIN STREET CHERRY STREETMAPLE STREET 59.60BC - 3" Overlay Art/Col $42,553 25.52748 ft750' N OF CHARLTON ROAD CHARLTON ROADMAPLE STREET 60.16BC - 3" Overlay Art/Col $233,244 29.715000 ftLAKEVIEW STREET 5000' N OF LAKEVIEW STREETPAXTON ROAD 60.68
4Segment Count $512,4371.9 milesBC - Crack Seal or Patch $411 86.32255 ftDONNELLY STREET 250' N OF DONNELLY STREETDONNELLY CROSS ROAD 66.56BC - Crack Seal or Patch $605 81.15550 ftMAIN STREET DEAD ENDPARK STREET 50.35BC - Crack Seal or Patch $980 85.81685 ftGREENVILLE STREET LEICESTER TOWN LINERAWSON ROAD 75.63
3Segment Count $1,9960.3 milesBC - Reclaim Col $667,876 16.535467 ftEAST CHARLTON ROAD SUNBERG ROADCHARLTON ROAD 57.39BC - Reclaim Col $596,410 16.694882 ftSUNBERG ROAD CRANBERRY MEADOW ROADCHARLTON ROAD 57.44BC - Reclaim Col $103,891 20.44939 ftVALLEY STREET MAIN STREETWATER STREET 58.60
3Segment Count $1,368,1772.1 milesBC - Shim, Crack Seal & Patch $43,739 59.364436 ftCLARK ROAD CHARLTON TOWN LINEBUTEAU ROAD 58.26BC - Shim, Crack Seal & Patch $38,088 58.322838 ftWILSON STREET 150' S OF WIRE VILLAGE ROADHASTINGS ROAD 57.94BC - Shim, Crack Seal & Patch $4,080 58.56382 ft300' S OF GOLD NUGGET FARM
ROAD100' N OF GOLD NUGGET FARMROAD
HASTINGS ROAD 58.02BC - Shim, Crack Seal & Patch $22,617 61.441588 ftGROVE STREET WILSON STREETHIGHLAND STREET 58.90BC - Shim, Crack Seal & Patch $11,810 65.181232 ftMEADOW ROAD (N) MEADOW ROAD (S)OLD MEADOW ROAD 56.98BC - Shim, Crack Seal & Patch $28,744 59.522691 ftNORTH SPENCER ROAD SMITHVILLE ROADSMITHVILLE CROSS ROAD 58.31
Segments FST Analysis Recommendations by ActivityScenario Prog1Protocol FST Roadway
Budget Aggressive
Description
Time Frame 10
Aggressive Scenario - Attack the Backlog up front at today's dollars. $2.5M for year 1 - 3$1.25M for year 4 -7$512k for year 8 -10
BC - Shim, Crack Seal & Patch $3,567 63.14296 ftCROWN STREET BELL STREETVERNON STREET 56.35Thursday, May 28, 2009 175 of

Plan Year 2Length Plan Activity Plan Cost NPRFrom ToStreet OCI
BC - Shim, Crack Seal & Patch $3,567 63.14296 ftCROWN STREET BELL STREETVERNON STREET 56.35BC - Shim, Crack Seal & Patch $40,485 62.124106 ftJOLICOEUR ROAD 1100' N OF CHARLTON TOWN LINEWILLIAM CASEY ROAD 59.11BC - Shim, Crack Seal & Patch $45,617 61.044383 ftSMITHVILLE ROAD NORCROSS ROADWOODSIDE ROAD 58.78
9Segment Count $238,7484.2 miles
$2,500,21526Segment Count
Plan cost for Plan Year 2 11.2 miles
Segments FST Analysis Recommendations by ActivityScenario Prog1Protocol FST Roadway
Budget Aggressive
Description
Time Frame 10
Aggressive Scenario - Attack the Backlog up front at today's dollars. $2.5M for year 1 - 3$1.25M for year 4 -7$512k for year 8 -10
Thursday, May 28, 2009 176 of

Plan Year 3Length Plan Activity Plan Cost NPRFrom ToStreet OCI
BC - 2" Overlay Local $157,089 46.884019 ft900' W OF MEADOW ROAD 900' N OF LALIBERTE LANESMITHVILLE ROAD 54.42BC - 2" Overlay Local $152,344 45.644513 ft900' N OF LALIBERTE LANE EAST BROOKFIELD TOWN LINESMITHVILLE ROAD 54.04BC - 2" Overlay Local $28,206 45.28567 ftSCHOOL STREET SAMPSON STREETSOUTH STREET 53.93
3Segment Count $337,6391.7 milesBC - Crack Seal and Patch $1,337 68.35545 ftLACAIRE LANE DEAD ENDSALEM STREET 47.95
1Segment Count $1,3370.1 milesBC - Crack Seal or Patch $1,254 79.64584 ftTREADWELL DRIVE CUL-DE-SACCORNFIELD ROAD 51.43BC - Crack Seal or Patch $2,009 86.121008 ftGREENVILLE STREET MUZZY STREETIRVING STREET 66.50BC - Crack Seal or Patch $17,533 85.1210395 ftNORTH SPENCER ROAD 2300' N OF BROOKS POND ROADNORTHWEST ROAD 66.19BC - Crack Seal or Patch $440 83.43267 ftPAXTON ROAD DEAD ENDPAXTON DRIVE 52.59BC - Crack Seal or Patch $1,033 78.44449 ftOAKLAND DRIVE CUL-DE-SACSPINNAKER DRIVE 51.06
5Segment Count $22,2692.4 milesBC - Reclaim Col $495,758 14.864055 ftMAPLE STREET EAST CHARLTON ROADCHARLTON ROAD 56.88BC - Reclaim Col $505,483 18.545549 ftCLARK ROAD 150' W OF GREENVILLE STREETCHICKERING ROAD 56.47BC - Reclaim Col $71,015 9.36529 ftCHERRY STREET ADAMS STREETMAPLE STREET 55.19BC - Reclaim Col $309,644 7.922808 ftADAMS STREET 750' N OF CHARLTON ROADMAPLE STREET 54.74BC - Reclaim Col $756,714 15.207341 ftNORTH SPENCER ROAD NORTH BROOKFIELD TOWN LINENORTH BROOKFIELD
ROAD56.98
5Segment Count $2,138,6153.8 miles
$2,499,86014Segment Count
Plan cost for Plan Year 3 8.1 miles
Segments FST Analysis Recommendations by ActivityScenario Prog1Protocol FST Roadway
Budget Aggressive
Description
Time Frame 10
Aggressive Scenario - Attack the Backlog up front at today's dollars. $2.5M for year 1 - 3$1.25M for year 4 -7$512k for year 8 -10
Thursday, May 28, 2009 177 of

Plan Year 4Length Plan Activity Plan Cost NPRFrom ToStreet OCI
BC - 2" Mill & Overlay Local $60,403 36.701389 ftSALEM STREET MECHANIC STREETMCDONALD STREET 51.29BC - 2" Mill & Overlay Local $51,413 36.701020 ftMAIN STREET CHERRY STREETSPRING STREET 51.29
2Segment Count $111,8160.5 milesBC - 2" Overlay Local $67,513 38.501975 ftMAIN STREET 250' N OF DONNELLY CROSS
ROADDONNELLY STREET 51.85
BC - 2" Overlay Local $32,188 37.00670 ftMAIN STREET CHERRY STREETLINDEN STREET 51.38BC - 2" Overlay Local $172,758 39.504065 ftSOUTH SPENCER ROAD HOWE ROADLYFORD ROAD 52.15
3Segment Count $272,4591.3 milesBC - Crack Seal and Patch $2,976 71.951030 ftCHARLTON ROAD CUL-DE-SACBLUEBERRY HILL DRIVE 49.06
1Segment Count $2,9760.2 milesBC - Crack Seal or Patch $3,809 81.632116 ftWEST MAIN STREET DEAD ENDBIXBY ROAD 52.04BC - Crack Seal or Patch $1,016 84.68605 ftMAY STREET DALE STREETHOLMES STREET 66.06BC - Crack Seal or Patch $573 87.60358 ftPOPE STREET STARR STREETJONES STREET 63.88BC - Crack Seal or Patch $2,626 84.681313 ftMAIN STREET HOLMES STREETMAY STREET 66.06BC - Crack Seal or Patch $1,093 87.60607 ftGROVE STREET POPE STREETSTARR STREET 63.88BC - Crack Seal or Patch $1,934 84.161151 ftMAIN STREET WATSON STREETSUMMIT STREET 65.90BC - Crack Seal or Patch $1,260 81.87606 ftTREADWELL DRIVE CUL-DE-SACTREADWELL TERRACE 50.58BC - Crack Seal or Patch $18,894 86.6510050 ftPLEASANT STREET NUGGET FARM ROADWIRE VILLAGE ROAD 77.43
8Segment Count $31,2053.2 milesBC - Reclaim Col $830,883 15.797246 ftNORTH SPENCER ROAD PAXTON TOWN LINETHOMPSON POND ROAD 55.63
1Segment Count $830,8831.4 miles
$1,249,33915Segment Count
Plan cost for Plan Year 4 6.5 miles
Segments FST Analysis Recommendations by ActivityScenario Prog1Protocol FST Roadway
Budget Aggressive
Description
Time Frame 10
Aggressive Scenario - Attack the Backlog up front at today's dollars. $2.5M for year 1 - 3$1.25M for year 4 -7$512k for year 8 -10
Thursday, May 28, 2009 178 of

Plan Year 5Length Plan Activity Plan Cost NPRFrom ToStreet OCI
BC - 2" Overlay Local $221,330 32.685483 ftCLARK STREET R JONES ROADASH STREET 50.06BC - 2" Overlay Local $135,090 32.163604 ftR JONES ROAD EAST CHARLTON STREETASH STREET 49.90BC - 2" Overlay Local $20,054 30.73535 ftMAPLE STREET MECHANIC STREETDUSTIN STREET 49.46BC - 2" Overlay Local $377,238 33.5210329 ft1675' N OF GOLD NUGGET FARM
ROADTHOMPSON POND ROADMCCORMACK ROAD 50.31
4Segment Count $753,7123.8 milesBC - Crack Seal or Patch $916 86.08557 ftGREENVILLE STREET DEAD ENDSUNSET LANE 66.49
1Segment Count $9160.1 milesBC - Reclaim Col $484,173 13.285047 ftCHARLTON ROAD EAST CHARLTON ROADBACON HILL ROAD 53.32
1Segment Count $484,1731.0 milesBC - Shim, Crack Seal & Patch $5,952 60.96715 ftCRANBERRY MEADOW ROAD DEAD ENDMARTIN DRIVE 44.14
1Segment Count $5,9520.1 miles
$1,244,7537Segment Count
Plan cost for Plan Year 5 5.0 miles
Segments FST Analysis Recommendations by ActivityScenario Prog1Protocol FST Roadway
Budget Aggressive
Description
Time Frame 10
Aggressive Scenario - Attack the Backlog up front at today's dollars. $2.5M for year 1 - 3$1.25M for year 4 -7$512k for year 8 -10
Thursday, May 28, 2009 179 of

Plan Year 6Length Plan Activity Plan Cost NPRFrom ToStreet OCI
BC - 1-1/4" Overlay $8,637 48.60278 ftELM STREET 275' W OF ELM STREETVALLEY STREET 41.881Segment Count $8,6370.1 miles
BC - 2" Mill & Overlay Local $158,670 28.092516 ftSMITHVILLE ROAD MEADOW ROADOLD FARM ROAD 48.64BC - 2" Mill & Overlay Local $166,464 27.722781 ftMAIN STREET MEADOW ROADSCHOOL STREET 48.53
2Segment Count $325,1351.0 milesBC - 2" Overlay Local $104,000 28.512214 ftMAY STREET GREENVILLE STREETCHERRY STREET 48.77BC - 2" Overlay Local $158,552 28.422644 ftOAKLAND DRIVE COLLIER CIRCLECOLLIER CIRCLE 48.74BC - 2" Overlay Local $46,224 24.161250 ftCLARK ROAD BACON HILL ROADEAST CHARLTON ROAD 47.43BC - 2" Overlay Local $128,736 27.363578 ftNORTHWEST ROAD NORTH BROOKFIELD TOWN LINEKITTREDGE ROAD 48.42BC - 2" Overlay Local $15,609 29.53411 ftMAIN STREET VALLEY STREETMILL STREET 46.01BC - 2" Overlay Local $93,398 28.002225 ftCHESTNUT STREET LANGEVIN STREETTEMPLE STREET 48.62
6Segment Count $546,5202.3 milesBC - Crack Seal or Patch $725 87.32385 ftCLARK STREET MCDONALD STREETADAMS STREET 66.87BC - Crack Seal or Patch $1,696 88.00809 ftNORTH SPENCER ROAD PAXTON TOWN LINEBARCLAY ROAD 78.62BC - Crack Seal or Patch $1,492 87.32758 ftMAIN STREET WALNUT STREETBELL STREET 66.87BC - Crack Seal or Patch $2,705 87.321664 ftMAIN STREET LEICESTER TOWN LINEBOND STREET 66.87BC - Crack Seal or Patch $4,802 87.322738 ftBACON HILL ROAD CHARLTON TOWN LINEBRIARCLIFF LANE 66.87BC - Crack Seal or Patch $11,994 87.326372 ftNORTHWEST ROAD 150' S OF WASHBURN ROADBROOKS POND ROAD 66.87BC - Crack Seal or Patch $16,279 88.008649 ftNORTH SPENCER ROAD OAKHAM TOWN LINEBROWNING POND ROAD 77.85BC - Crack Seal or Patch $2,998 87.321298 ftMAPLE STREET MAY STREETCHERRY STREET 66.87BC - Crack Seal or Patch $5,117 88.002136 ftMAPLE STREET VALLEY STREETCHESTNUT STREET 79.38BC - Crack Seal or Patch $828 88.00450 ft150' W OF GREENVILLE STREET LEICESTER TOWN LINECHICKERING ROAD 77.85BC - Crack Seal or Patch $12,548 87.326111 ftCHICKERING ROAD LEICESTER TOWN LINECLARK ROAD 66.87BC - Crack Seal or Patch $8,238 87.324377 ftNORTH SPENCER ROAD HASTINGS ROADCOONEY ROAD 66.87BC - Crack Seal or Patch $1,634 87.32682 ftCHERRY STREET HOLMES STREETCOTTAGE STREET 66.87BC - Crack Seal or Patch $13,952 87.327090 ftLYFORD ROAD JOLICOEUR ROADCRANBERRY MEADOW
ROAD66.87
BC - Crack Seal or Patch $7,407 87.323267 ftJOLICOEUR ROAD 200' W OF BRIARCLIFF LANECRANBERRY MEADOWROAD
66.87
Segments FST Analysis Recommendations by ActivityScenario Prog1Protocol FST Roadway
Budget Aggressive
Description
Time Frame 10
Aggressive Scenario - Attack the Backlog up front at today's dollars. $2.5M for year 1 - 3$1.25M for year 4 -7$512k for year 8 -10
BC - Crack Seal or Patch $1,809 87.32881 ft200' W OF BRIARCLIFF LANE 650' E OF BRIARCLIFF LANECRANBERRY MEADOW 66.87Thursday, May 28, 2009 1710 of

Plan Year 6Length Plan Activity Plan Cost NPRFrom ToStreet OCI
BC - Crack Seal or Patch $1,809 87.32881 ft200' W OF BRIARCLIFF LANE 650' E OF BRIARCLIFF LANEROAD
66.87BC - Crack Seal or Patch $2,965 87.321507 ft650' E OF BRIARCLIFF LANE CHARLTON ROADCRANBERRY MEADOW
ROAD66.87
BC - Crack Seal or Patch $1,791 87.32997 ftWALNUT STREET SUMNER STREETCROWN STREET 66.87BC - Crack Seal or Patch $7,975 87.324439 ftG HENRY WILSON ROAD CLARK ROADEAST CHARLTON ROAD 66.87BC - Crack Seal or Patch $2,471 87.321313 ftSCHOOL STREET MEADOW ROADFOURTH AVENUE 66.87BC - Crack Seal or Patch $8,378 87.324896 ftCHARLTON ROAD CRANBERRY MEADOW ROADGAUTHIER ROAD 66.87BC - Crack Seal or Patch $8,938 88.004975 ftHASTINGS ROAD PAXTON ROADGOLD NUGGET FARM
ROAD75.54
BC - Crack Seal or Patch $29,479 88.0015662 ftMAIN STREET CHICKERING ROADGREENVILLE STREET 78.62BC - Crack Seal or Patch $14,806 87.328653 ft100' N OF GOLD NUGGET FARM
ROADNORTH SPENCER ROADHASTINGS ROAD 66.87
BC - Crack Seal or Patch $1,708 88.001210 ftCRANBERRY MEADOW ROAD JOLICOEUR ROADHEBERT ROAD 77.85BC - Crack Seal or Patch $3,183 88.001958 ftJOLICOEUR ROAD SOUTH SPENCER ROADHEBERT ROAD 77.85BC - Crack Seal or Patch $3,385 87.321978 ftCHARLTON ROAD EAST CHARLTON ROADI CAPEN ROAD 63.79BC - Crack Seal or Patch $3,025 88.001861 ftCRANBERRY MEADOW ROAD HEBERT ROADJOLICOEUR ROAD 75.54BC - Crack Seal or Patch $2,541 87.321449 ftRENE DRIVE DEAD ENDLAKE STREET 66.87BC - Crack Seal or Patch $830 87.32606 ftSOUTH SPENCER ROAD LYFORD ROADLYFORD CROSS ROAD 63.79BC - Crack Seal or Patch $10,076 89.002771 ftSUMNER STREET 50' E OF PLEASANT STREETMAIN STREET 85.08BC - Crack Seal or Patch $4,531 89.001261 ft50' E OF PLEASANT STREET 75' E OF LINDEN STREETMAIN STREET 85.08BC - Crack Seal or Patch $7,117 89.002054 ft75' E OF LINDEN STREET PARK STREETMAIN STREET 85.08BC - Crack Seal or Patch $647 88.00360 ftMAPLE STREET CHERRY STREETMAPLE TERRACE 79.38BC - Crack Seal or Patch $20,019 88.008210 ftWEST MAIN STREET PLEASANT STREETMEADOW ROAD 79.38BC - Crack Seal or Patch $62,142 88.0022698 ftPLEASANT STREET BARCLAY ROADNORTH SPENCER ROAD 79.38BC - Crack Seal or Patch $4,291 88.002090 ftBARCLAY ROAD PAXTON TOWN LINENORTH SPENCER ROAD 79.38BC - Crack Seal or Patch $1,673 88.00931 ftMAIN STREET HIGHLAND STREETNORTH STREET 79.38BC - Crack Seal or Patch $843 87.32308 ft300' E OF MEADOW ROAD MEADOW ROADOLDE MAIN STREET 66.87BC - Crack Seal or Patch $3,507 88.001708 ftMAIN STREET 300' S OF WILSON STREETPAXTON ROAD 78.62BC - Crack Seal or Patch $1,953 88.001062 ft300' S OF WILSON STREET 750' N OF WILSON STREETPAXTON ROAD 78.62BC - Crack Seal or Patch $9,438 88.004694 ft750' N OF WILSON STREET LAKEVIEW STREETPAXTON ROAD 78.62BC - Crack Seal or Patch $10,006 88.005198 ft5000' N OF LAKEVIEW STREET THOMPSON POND ROADPAXTON ROAD 78.62
Segments FST Analysis Recommendations by ActivityScenario Prog1Protocol FST Roadway
Budget Aggressive
Description
Time Frame 10
Aggressive Scenario - Attack the Backlog up front at today's dollars. $2.5M for year 1 - 3$1.25M for year 4 -7$512k for year 8 -10
BC - Crack Seal or Patch $8,018 88.003177 ftMAIN STREET 175' N OF SMITHVILLE ROADPLEASANT STREET 80.15Thursday, May 28, 2009 1711 of

Plan Year 6Length Plan Activity Plan Cost NPRFrom ToStreet OCI
BC - Crack Seal or Patch $8,018 88.003177 ftMAIN STREET 175' N OF SMITHVILLE ROADPLEASANT STREET 80.15BC - Crack Seal or Patch $3,606 88.001561 ft175' N OF SMITHVILLE ROAD MEADOW ROADPLEASANT STREET 80.15BC - Crack Seal or Patch $654 87.32283 ftCLARK STREET MCDONALD STREETPOND STREET 63.79BC - Crack Seal or Patch $2,180 87.32910 ftMEADOW ROAD 900' W OF MEADOW ROADSMITHVILLE ROAD 66.87BC - Crack Seal or Patch $30,896 88.0018056 ftWEST MAIN STREET EAST BROOKFIELD TOWN LINESOUTH SPENCER ROAD 78.62BC - Crack Seal or Patch $1,348 87.32750 ftGREENVILLE STREET 750' W OF GREENVILLE STREETSUNSET LANE 66.87BC - Crack Seal or Patch $961 87.32661 ftSCHOOL STREET FOURTH AVENUEVINE STREET 63.79BC - Crack Seal or Patch $730 87.32533 ftSCHOOL STREET CROWN STREETWALNUT STREET 63.79
51Segment Count $370,33533.8 miles
$1,250,62760Segment Count
Plan cost for Plan Year 6 37.2 miles
Segments FST Analysis Recommendations by ActivityScenario Prog1Protocol FST Roadway
Budget Aggressive
Description
Time Frame 10
Aggressive Scenario - Attack the Backlog up front at today's dollars. $2.5M for year 1 - 3$1.25M for year 4 -7$512k for year 8 -10
Thursday, May 28, 2009 1712 of

Plan Year 7Length Plan Activity Plan Cost NPRFrom ToStreet OCI
BC - 2" Mill & Overlay Local $141,938 23.542280 ftMAIN STREET HIGHLAND STREETGROVE STREET 47.24BC - 2" Mill & Overlay Local $172,088 22.722669 ftCHESTNUT STREET DEAD ENDMECHANIC STREET 46.99BC - 2" Mill & Overlay Local $79,062 22.721270 ftSHERWOOOD DRIVE (S) SHERWOOOD DRIVE (N)NOTTINGHAM CIRCLE 46.99
3Segment Count $393,0871.2 milesBC - 2" Overlay Local $127,103 23.442038 ftMEADOW ROAD OLD FARM ROADBAY PATH ROAD 47.21BC - 2" Overlay Local $242,525 21.806306 ftASH STREET KINGSBURY ROADR JONES ROAD 46.71BC - 2" Overlay Local $276,188 23.106813 ftLINCOLN STREET PAXTON ROADWILSON STREET 47.11
3Segment Count $645,8162.9 milesBC - Crack Seal or Patch $4,631 87.322265 ftMAIN STREET CLARK STREETASH STREET 66.87BC - Crack Seal or Patch $7,098 87.324436 ftCLARK ROAD CHARLTON TOWN LINEBUTEAU ROAD 66.87BC - Crack Seal or Patch $8,149 88.003820 ftCRANBERRY MEADOW ROAD CHARLTON TOWN LINECHARLTON ROAD 79.38BC - Crack Seal or Patch $473 87.32273 ftLINCOLN STREET GRANT STREETCRAIG ROAD 63.79BC - Crack Seal or Patch $499 87.32255 ftDONNELLY STREET 250' N OF DONNELLY STREETDONNELLY CROSS ROAD 66.87BC - Crack Seal or Patch $6,181 87.322838 ftWILSON STREET 150' S OF WIRE VILLAGE ROADHASTINGS ROAD 66.87BC - Crack Seal or Patch $662 87.32382 ft300' S OF GOLD NUGGET FARM
ROAD100' N OF GOLD NUGGET FARMROAD
HASTINGS ROAD 66.87BC - Crack Seal or Patch $3,878 87.321745 ftMAIN STREET PLEASANT STREETHIGH STREET 66.87BC - Crack Seal or Patch $3,670 87.321588 ftGROVE STREET WILSON STREETHIGHLAND STREET 66.87BC - Crack Seal or Patch $11,709 87.326755 ftLYFORD ROAD CHARLTON ROADHOWE ROAD / HOWE
POND RD66.87
BC - Crack Seal or Patch $2,833 87.321226 ftMUZZY STREET MAY STREETIRVING STREET 66.87BC - Crack Seal or Patch $1,094 88.00513 ftMAIN STREET CHERRY STREETMAPLE STREET 79.38BC - Crack Seal or Patch $1,662 88.00748 ft750' N OF CHARLTON ROAD CHARLTON ROADMAPLE STREET 79.38BC - Crack Seal or Patch $2,240 87.32900 ftMAIN STREET CHESTNUT STREETMECHANIC STREET 66.87BC - Crack Seal or Patch $1,916 87.321232 ftMEADOW ROAD (N) MEADOW ROAD (S)OLD MEADOW ROAD 63.79BC - Crack Seal or Patch $9,111 88.005000 ftLAKEVIEW STREET 5000' N OF LAKEVIEW STREETPAXTON ROAD 78.62BC - Crack Seal or Patch $2,145 87.321177 ftGROVE STREET BROWN STREETPOPE STREET 66.87BC - Crack Seal or Patch $1,187 88.00685 ftGREENVILLE STREET LEICESTER TOWN LINERAWSON ROAD 76.31BC - Crack Seal or Patch $4,664 87.322691 ftNORTH SPENCER ROAD SMITHVILLE ROADSMITHVILLE CROSS ROAD 66.87BC - Crack Seal or Patch $579 87.32296 ftCROWN STREET BELL STREETVERNON STREET 63.79
Segments FST Analysis Recommendations by ActivityScenario Prog1Protocol FST Roadway
Budget Aggressive
Description
Time Frame 10
Aggressive Scenario - Attack the Backlog up front at today's dollars. $2.5M for year 1 - 3$1.25M for year 4 -7$512k for year 8 -10
Thursday, May 28, 2009 1713 of

Plan Year 7Length Plan Activity Plan Cost NPRFrom ToStreet OCI
BC - Crack Seal or Patch $6,570 87.324106 ftJOLICOEUR ROAD 1100' N OF CHARLTON TOWN LINEWILLIAM CASEY ROAD 66.87BC - Crack Seal or Patch $7,402 87.324383 ftSMITHVILLE ROAD NORCROSS ROADWOODSIDE ROAD 66.87
22Segment Count $88,3549.0 milesBC - Reclaim Local $118,910 20.801344 ftASH STREET ADAMS STREETCLARK STREET 46.40
1Segment Count $118,9100.3 miles
$1,246,16729Segment Count
Plan cost for Plan Year 7 13.3 miles
Segments FST Analysis Recommendations by ActivityScenario Prog1Protocol FST Roadway
Budget Aggressive
Description
Time Frame 10
Aggressive Scenario - Attack the Backlog up front at today's dollars. $2.5M for year 1 - 3$1.25M for year 4 -7$512k for year 8 -10
Thursday, May 28, 2009 1714 of
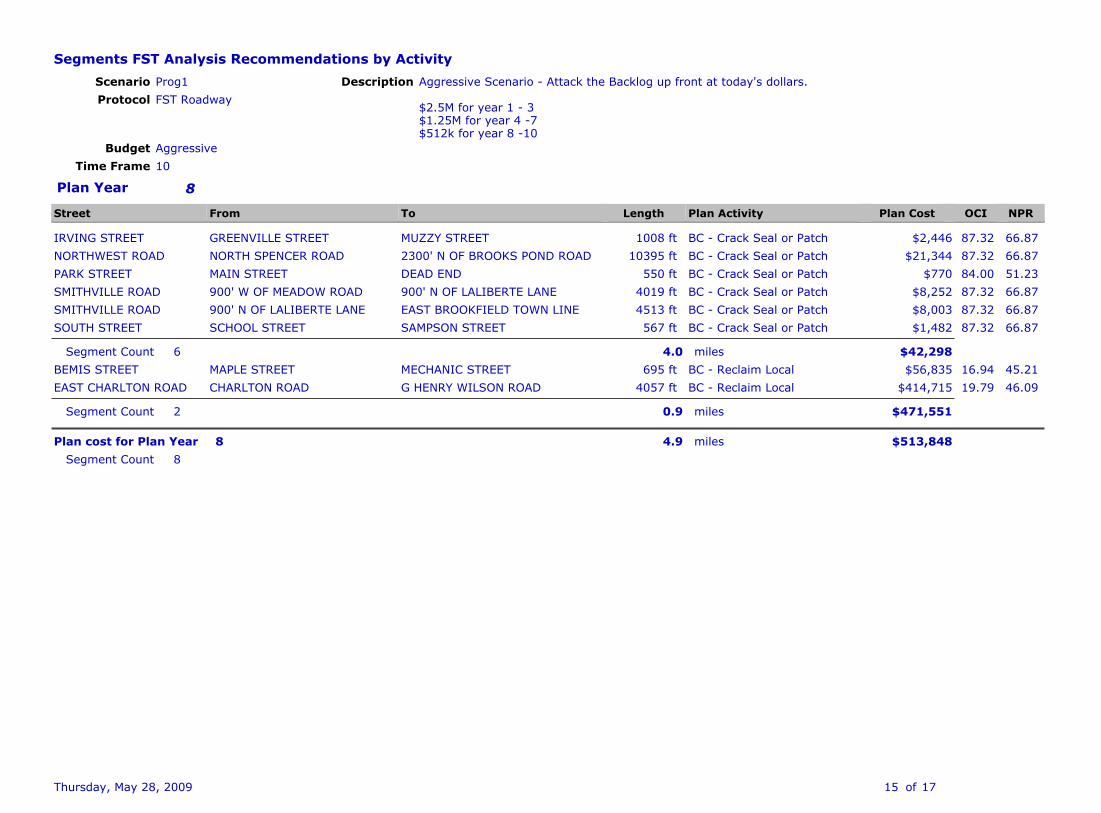
Plan Year 8Length Plan Activity Plan Cost NPRFrom ToStreet OCI
BC - Crack Seal or Patch $2,446 87.321008 ftGREENVILLE STREET MUZZY STREETIRVING STREET 66.87BC - Crack Seal or Patch $21,344 87.3210395 ftNORTH SPENCER ROAD 2300' N OF BROOKS POND ROADNORTHWEST ROAD 66.87BC - Crack Seal or Patch $770 84.00550 ftMAIN STREET DEAD ENDPARK STREET 51.23BC - Crack Seal or Patch $8,252 87.324019 ft900' W OF MEADOW ROAD 900' N OF LALIBERTE LANESMITHVILLE ROAD 66.87BC - Crack Seal or Patch $8,003 87.324513 ft900' N OF LALIBERTE LANE EAST BROOKFIELD TOWN LINESMITHVILLE ROAD 66.87BC - Crack Seal or Patch $1,482 87.32567 ftSCHOOL STREET SAMPSON STREETSOUTH STREET 66.87
6Segment Count $42,2984.0 milesBC - Reclaim Local $56,835 16.94695 ftMAPLE STREET MECHANIC STREETBEMIS STREET 45.21BC - Reclaim Local $414,715 19.794057 ftCHARLTON ROAD G HENRY WILSON ROADEAST CHARLTON ROAD 46.09
2Segment Count $471,5510.9 miles
$513,8488Segment Count
Plan cost for Plan Year 8 4.9 miles
Segments FST Analysis Recommendations by ActivityScenario Prog1Protocol FST Roadway
Budget Aggressive
Description
Time Frame 10
Aggressive Scenario - Attack the Backlog up front at today's dollars. $2.5M for year 1 - 3$1.25M for year 4 -7$512k for year 8 -10
Thursday, May 28, 2009 1715 of

Plan Year 9Length Plan Activity Plan Cost NPRFrom ToStreet OCI
BC - Crack Seal or Patch $14,005 88.005467 ftEAST CHARLTON ROAD SUNBERG ROADCHARLTON ROAD 79.38BC - Crack Seal or Patch $12,506 88.004882 ftSUNBERG ROAD CRANBERRY MEADOW ROADCHARLTON ROAD 79.38BC - Crack Seal or Patch $1,581 84.00584 ftTREADWELL DRIVE CUL-DE-SACCORNFIELD ROAD 52.77BC - Crack Seal or Patch $3,532 87.321975 ftMAIN STREET 250' N OF DONNELLY CROSS
ROADDONNELLY STREET 66.87
BC - Crack Seal or Patch $1,228 87.32605 ftMAY STREET DALE STREETHOLMES STREET 66.87BC - Crack Seal or Patch $692 87.32358 ftPOPE STREET STARR STREETJONES STREET 63.79BC - Crack Seal or Patch $1,684 87.32670 ftMAIN STREET CHERRY STREETLINDEN STREET 66.87BC - Crack Seal or Patch $9,038 87.324065 ftSOUTH SPENCER ROAD HOWE ROADLYFORD ROAD 66.87BC - Crack Seal or Patch $3,173 87.321313 ftMAIN STREET HOLMES STREETMAY STREET 66.87BC - Crack Seal or Patch $2,954 87.321389 ftSALEM STREET MECHANIC STREETMCDONALD STREET 66.87BC - Crack Seal or Patch $555 84.00267 ftPAXTON ROAD DEAD ENDPAXTON DRIVE 52.77BC - Crack Seal or Patch $1,212 84.00545 ftLACAIRE LANE DEAD ENDSALEM STREET 52.77BC - Crack Seal or Patch $1,302 84.00449 ftOAKLAND DRIVE CUL-DE-SACSPINNAKER DRIVE 52.77BC - Crack Seal or Patch $2,514 87.321020 ftMAIN STREET CHERRY STREETSPRING STREET 66.87BC - Crack Seal or Patch $1,320 87.32607 ftGROVE STREET POPE STREETSTARR STREET 63.79BC - Crack Seal or Patch $2,337 87.321151 ftMAIN STREET WATSON STREETSUMMIT STREET 66.87BC - Crack Seal or Patch $2,178 88.00939 ftVALLEY STREET MAIN STREETWATER STREET 79.38BC - Crack Seal or Patch $22,830 88.0010050 ftPLEASANT STREET NUGGET FARM ROADWIRE VILLAGE ROAD 77.85
18Segment Count $84,6416.9 milesBC - Reclaim Local $82,532 17.14924 ftMAIN STREET CHESTNUT STREETELM STREET 45.27BC - Reclaim Local $345,694 17.704168 ftEAST CHARLTON ROAD CLARK ROADMARBLE ROAD 45.45
2Segment Count $428,2261.0 miles
$512,86720Segment Count
Plan cost for Plan Year 9 7.8 miles
Segments FST Analysis Recommendations by ActivityScenario Prog1Protocol FST Roadway
Budget Aggressive
Description
Time Frame 10
Aggressive Scenario - Attack the Backlog up front at today's dollars. $2.5M for year 1 - 3$1.25M for year 4 -7$512k for year 8 -10
Thursday, May 28, 2009 1716 of

Plan Year 10Length Plan Activity Plan Cost NPRFrom ToStreet OCI
BC - Crack Seal or Patch $11,642 87.325483 ftCLARK STREET R JONES ROADASH STREET 66.87BC - Crack Seal or Patch $7,106 87.323604 ftR JONES ROAD EAST CHARLTON STREETASH STREET 66.87BC - Crack Seal or Patch $4,814 84.002116 ftWEST MAIN STREET DEAD ENDBIXBY ROAD 52.77BC - Crack Seal or Patch $2,708 84.001030 ftCHARLTON ROAD CUL-DE-SACBLUEBERRY HILL DRIVE 52.77BC - Crack Seal or Patch $10,455 88.004055 ftMAPLE STREET EAST CHARLTON ROADCHARLTON ROAD 79.38BC - Crack Seal or Patch $10,660 88.005549 ftCLARK ROAD 150' W OF GREENVILLE STREETCHICKERING ROAD 77.85BC - Crack Seal or Patch $1,055 87.32535 ftMAPLE STREET MECHANIC STREETDUSTIN STREET 66.87BC - Crack Seal or Patch $1,498 88.00529 ftCHERRY STREET ADAMS STREETMAPLE STREET 79.38BC - Crack Seal or Patch $6,530 88.002808 ftADAMS STREET 750' N OF CHARLTON ROADMAPLE STREET 79.38BC - Crack Seal or Patch $19,843 87.3210329 ft1675' N OF GOLD NUGGET FARM
ROADTHOMPSON POND ROADMCCORMACK ROAD 66.87
BC - Crack Seal or Patch $15,959 88.007341 ftNORTH SPENCER ROAD NORTH BROOKFIELD TOWN LINENORTH BROOKFIELDROAD
79.38BC - Crack Seal or Patch $1,126 87.32557 ftGREENVILLE STREET DEAD ENDSUNSET LANE 66.87BC - Crack Seal or Patch $1,593 84.00606 ftTREADWELL DRIVE CUL-DE-SACTREADWELL TERRACE 51.23
13Segment Count $94,9898.4 milesBC - Reclaim Local $23,886 14.45300 ftNORTH SPENCER ROAD 300' W OF NORTH SPENCER ROADALTA CREST ROAD 31.37BC - Reclaim Local $191,672 14.491884 ftPLEASANT STREET DEAD ENDGRANT STREET 44.46BC - Reclaim Local $51,784 14.90509 ftMAIN STREET RENE DRIVELAKE STREET 44.58BC - Reclaim Local $156,752 15.081575 ftPLEASANT STREET MEADOW ROADSMITHVILLE ROAD 44.64
4Segment Count $424,0940.8 miles
$519,08317Segment Count
Plan cost for Plan Year 10 9.2 miles
Segments FST Analysis Recommendations by ActivityScenario Prog1Protocol FST Roadway
Budget Aggressive
Description
Time Frame 10
Aggressive Scenario - Attack the Backlog up front at today's dollars. $2.5M for year 1 - 3$1.25M for year 4 -7$512k for year 8 -10
$14,036,459137.0 miles
Thursday, May 28, 2009 1717 of

APPENDIX C

Spencer's Repair Alternatives and Unit CostsActivity Description Unit Cost (SY)BC - Reconstruction Art Reclaim, 6" HMA, new base, remodel structures, police detail & line paint $55.09
BC - Reconstruction Col Reclaim, 6" HMA, new base, remodel structures, police detail & line paint $55.09
BC - Reconstruction Local Reclaim, 4" HMA, new base, remodel structures, police detail & line paint $44.93
BC - Reclaim Art Reclaim, 6" HMA, remodel structures, police detail & line paint $37.86
BC - Reclaim Col Reclaim, 6" HMA, remodel structures, police detail & line paint $37.86
BC - Reclaim Local Reclaim, 4" HMA, remodel structures, police detail & line paint $27.71
BC - 3" Mill & Overlay Art/Col 3" mill, 3" HMA, crackseal, tack, police detail & line paint $21.66
BC - 3" Overlay Art/Col 3" HMA, adjust structures, crackseal, patching, tack, police detail & line paint $19.51
CH - Chip Seal Double lift chip seal, patching, police detail & line paint $7.90
BC - 2" Mill & Overlay Local 2" mill, 2" HMA, crackseal, tack, police detail & line paint $15.67
BC - 2" Overlay Local 2" HMA, adjust structures, patching, crackseal, tack, police detail & line paint $14.65
BC - 1-1/4" Overlay Local 1-1/4" HMA, adjust structures, patching, crackseal, tack, police detail & line paint $10.35
BC - Novachip 3/4" Novachip, adjust structures, patching, crackseal, tack, police detail & line paint $8.86
BC - Microsurface Single lift of microsurfacing, patching, tack, police detail & line paint $7.57
BC - Hot in Place Recycling 1-1/4" heat scarification, add rejuvenator and compact $5.31
BC - Shim, Crack Seal & Patch 1" HMA, patch, crackseal, tack, police detail, & line paint $4.50
BC - Crack Seal & Patch Crackseal and surface patch $0.88
BC - Crack Seal or Patch Crackseal or skin patch $0.63
GR - Base Rehabilitation Remove and add stable gravel $4.50
GR - Gravel & Drain Improvement New gravel and drainage improvements $2.34
GR - New Gravel Add gravel, grade & compact $2.25
GR - Grade Grade and compact existing surface $0.99
Do Nothing Do nothing at this time $0.00
May, 2009 Page 1 of 1

APPENDIX D

Glossary of Terms
Glossary of Terms
DEDUCT POINTS: Points representing the penalty assessed for each identified distress used in the calculation of the Pavement Condition Index. Each distress has multiple severity and extent levels, with a specific number of points at each level. Deduct points may be modified for all nine pavement distress types. The deduct points are ultimately subtracted from a perfect pavement condition of 100. DETERIORATION RATE: a rate that predicts of the anticipated change in a roadway's condition over time. DISTRESS: a physical defect or deficiency on the pavement surface that can be observed and quantified through visual inspection of the pavement surface. Broad categories include surface cracking, base related cracking, patching, and surface wear. DRAINAGE CONDITION INDEX (DCI): an index derived from controlled measurements and evaluations of pavement surface drainage deficiencies and conditions. It is a serviceability rating es-tablished for determining the present stature or performance of the drainage features on a scale from 0 to 100, with 100 being excellent.
FUNCTIONAL CLASSIFICATION: Road functional classification places all streets and roads in the network into one of four general categories - arterial, collector, local, or dead end - according to ve-hicular volume, roadway geometry, and traffic characteristics. INFRASTRUCTURE MANAGEMENT SYSTEM (IMS): similar to a Pavement Management Sys-tem, has all the database attributes describing an infrastructure network such as water, wastewater or drainage system. This additional data to the management system database may include drainage features, utilities, traffic signs, pavement markings, sidewalks, pedestrian ramps and other road re-lated elements within the right of way. Because the roadway network system serves as a common location and identification system for roadside elements, the database can be comprehensively evaluated for infrastructure system wide planning and management. NETWORK LEVEL: an assessment of conditions and/or program needs across the entire roadway system encompassed by the pavement management study.

Glossary of Terms
NETWORK PRIORITY RANKING (NPR): a value computed by PAVEMENTview®Plus at the time it determines the most beneficial recommended repair for a particular pavement section. The Net-work Priority Ranking formula is: NPR = (.60 x PCI) + (.30 x Functional Class. Priority) + (.10 x Pavement Class. Priority)
Where NPR = Network Priority Ranking equals 60% Pavement Condition Index plus 30% Functional Classification Priority Rank plus 20% Pavement Classification Priority Rank. PAVEMENT CONDITION INDEX (PCI): an index derived from established measurements of pavement surface condition distress or deficiencies. It is a serviceability rating established under controlled conditions having a scale of 0 to 100, with 100 being excellent. PAVEMENT CLASSIFICATION: Pavement classification identifies the pavement material for streets and roads in the network. There are three categories: BC = Bituminous Concrete, CH = Chip Seal, and GR = Gravel. PAVEMENT MANAGEMENT (PM): is the effective and efficient directing of the various activities involved in providing and sustaining pavements in a condition acceptable to the traveling public at the lowest life-cycle cost. PAVEMENT MANAGEMENT SYSTEM (PMS): an established, documented procedure treating many or all of the Pavement Management activities in a systematic and coordinated manner. It con-sists of five essential elements structured to serve decision-making responsibilities at various man-agement levels. 1. Pavement surveys related to condition and serviceability; 2. Database containing all pavement-related information; 3. Analysis scheme; 4. Decision criteria; 5. Implementation procedures. PAVEMENT PERFORMANCE: the assessment of how well the pavement serves the user over time. The engineer often associates pavement condition with an arbitrary, but quantifiable, value re-lating to pavement roughness, pavement distress, or pavement strength. Performance is the meas-ured change of condition and/or serviceability over increments of time.
PREVENTIVE MAINTENANCE: activities performed at planned intervals to protect and seal the pavement. Generally these activities lead to pavement preservation. Seals are designed to provide one or more of the following benefits: 1. Prevent the intrusion of air and moisture; 2. Fill small cracks and voids; 3. Rejuvenate an oxidized binder; 4. Provide a new wearing surface.

Glossary of Terms
PROJECT LEVEL: a detailed assessment or identification of needs relative to a specific roadway, or a section thereof, as opposed to network level applications. It may include on site pavement testing, lab evaluation, life cycle cost analysis, and treatment recommendation for the particular pavement section. RECONSTRUCTION: the complete removal and replacement of a failed pavement, which might also involve widening, realignment, traffic control devices, safety hardware, and major base and drainage work.
REHABILITATION: any work needed to restore the pavement to a condition that will allow it to perform satisfactorily for several years. Rehabilitation also includes the work necessary to prepare the pavement for an overlay. The major activities involved in the rehabilitation process are: 1. Partial depth patching; 2. Full depth patching; 3. Joint and crack sealing. 4. Grouting and undersealing (filling voids); 5. Grinding and milling (removal of high spots in the pavement.); 6. Overlays. REPAIR STRATEGIES: PAVEMENTview®Plus represents repair strategies as a decision of user de-fined "if, then" statements used in the PAVEMENTview®Plus. The recommended repairs are based on five decision factors: Functional Classification, Surface Type, PCI range, curb reveal, and Side-walk Condition Index (SCI). These criteria input into the decision matrix represent the various condi-tions for each decision factor. REPAIR TYPES: the various choices of treatment available for providing a solution to a pavement deficiency or problem. The associated repair type cost is based on a locality's past experience. RIDEABILITY INDEX (RI): a measure of the smoothness of a pavement, (traveled surface) as perceived by the public traveling in a vehicle at a speed appropriate for the particular surface. It is a serviceability rating having a scale of 0 to 100, with 100 being excellent. A controlled measurement of longitudinal profile pavement surface condition distress or deficiencies can be made using a pro-filometer and can be correlated to a roughness scale. OVERALL CONDITION INDEX (OCI): an index derived from controlled measurements of pave-ment condition, rideability, drainage condition, safety, utility condition, traffic control, sidewalk con-dition, and roadside maintenance. An acceptable scale for roads and streets is 0 to 100, with 100 being excellent. ROADSIDE MAINTENANCE INDEX (RMI): an index derived from evaluations of required road-side maintenance activity levels, such as mowing, litter collection, overhanging branches, and sand residue from plowing operations. It is a rating established for determining the present status or rela-tive condition of the roadside maintenance, and is measured on a scale of 0 to 100, with 100 being excellent.

Glossary of Terms
ROUTINE MAINTENANCE: activities performed or steps taken to correct a specific pavement fail-ure or distress area. Routine maintenance usually addresses localized pavement defects and in-cludes activities such as: 1. Full depth patching - more than 2” deep, requiring saw cutting distressed area and removal of pavement and gravel base to a depth of 8”, followed by placement of new dense graded gravel base and hot mix asphalt in multiple layers; 2. Skin patching - less than 2” deep, typically no cutting required, placement of hot mix asphalt in 1 layer; 3. Crack sealing – sealing of surface cracks to prevent water intrusion SIDEWALK CONDITION INDEX (SCI): an index derived from controlled measurements and evaluations of sidewalk and/or walkway and/or pedestrian ramp deficiencies and conditions. It is a serviceability rating established for determining the present status or performance of sidewalks and pedestrian ramps, and is measured on a scale of 0 to 100, with 100 being excellent. STRUCTURAL IMPROVEMENT: activites performed when the pavement deteriorates beyond the need for preventive maintenance applications and the road base is structurally sound. Activites could include: 1. Thick Overlays; 2. Cold Planning and Overlay; 3. Hot in Place Recycling – Re-heating, scarifying, and adding rejuvenator to existing surface to a depth of 1-1/4” followed by an overlay. TRAFFIC CONTROL INDEX (TCI): an index derived from factors pertaining to traffic control measures such as traffic signs and signals, lighting, and other warning devices. It is a rating estab-lished for determining the performance of the roadway as it relates to traffic control, and is meas-ured on a scale of 0 to 100, with 100 being excellent. TRAFFIC SAFETY INDEX (TSI): an index derived from measurements and evaluations of stop-ping sight distance, horizontal and vertical curves, accident data, geometry and other factors which may affect the public safety while traveling on the roadway. It is a rating established for determin-ing the performance of the roadway as it relates to safety, and is measured on a scale of 0 to 100, with 100 being excellent. UTILITY CONDITION INDEX (UCI): an index derived from controlled measurements and evaluations of utility cuts/patches in the pavement surface area. It is a serviceability rating established for determining the present status or performance of the utility patch on a scale from 0 to 100, with 100 being excellent.