2009 pennsylvania youth survey - pa.gov
TRANSCRIPT

2009 Pennsylvania Youth Survey
Statewide Report
Conducted by Pennsylvania Commission on Crime and Delinquency

Statewide Report 2009 Pennsylvania Youth Survey

Statewide Report 2009 Pennsylvania Youth Survey
Table of Contents
Section 1: Summary of Results......................................................................................................1 Strengths to Build on .......................................................................................................... 1 Opportunities for Improvement ....................................................................................... 2
Section 2: Survey Methodology...................................................................................................3 Introduction......................................................................................................................... 3 The Survey Questionnaire ................................................................................................. 4 The Statewide Sample ...................................................................................................... 5 Exploring PAYS Results Online via SmartTrackTM .......................................................... 10 Demographic Profile of Surveyed Youth...................................................................... 10
Section 3: Alcohol, Tobacco and Other Drug Use ...................................................................13 Measurement ................................................................................................................... 13 Results Summary............................................................................................................... 13 Item-Level Results .............................................................................................................17
Section 4: Other Antisocial Behaviors .......................................................................................29 Introduction....................................................................................................................... 29 Results Summary............................................................................................................... 29 Item-Level Results .............................................................................................................31
Section 5: Special Topics ............................................................................................................35 Introduction....................................................................................................................... 35 Age of Onset of ATOD Use and Other Antisocial Behavior....................................... 35 Driving After Alcohol or Marijuana Use......................................................................... 36 Willingness to Try or Use ATODs ...................................................................................... 37 Gambling .......................................................................................................................... 37 Symptoms of Depression................................................................................................. 38 Violence and Drugs on School Property ...................................................................... 39 Bullying at School and Internet Safety.......................................................................... 39
Section 6: Risk and Protective Factors.......................................................................................41 Introduction....................................................................................................................... 41 Results Summary............................................................................................................... 43 Protective Factors ............................................................................................................ 46 Risk Factors ........................................................................................................................ 50
Appendix A: Additional Prevention Planning Data..................................................................61 Introduction....................................................................................................................... 61 Risk of Harm....................................................................................................................... 61 Disapproval of Drug Use ................................................................................................. 62 Social Norms ..................................................................................................................... 62 Parental Disapproval of Drug Use ................................................................................. 64

Statewide Report 2009 Pennsylvania Youth Survey
Frequency of Drug Use ................................................................................................... 64 Frequency of Bringing a Weapon to School............................................................... 66 Gang Involvement .......................................................................................................... 66
Appendix B: The 2009 PAYS Questionnaire ............................................................................. 69
Appendix C: Risk and Protective Factor Scale Construction Summary ............................... 83
Appendix D: Other Resources ................................................................................................... 97 Web Sites .......................................................................................................................... 97 Prevention Program Guides........................................................................................... 97 Prevention Planning ........................................................................................................ 97
References .................................................................................................................................. 99

Statewide Report 2009 Pennsylvania Youth Survey - 1 -
Section 1: Summary of Results
Strengths to Build on • Very few Pennsylvania students reported using illicit drugs other than marijuana and inhalants in the
past 30 days. For example, past-30-day prevalence rates for Ecstasy, cocaine and methamphetamine are 1.1%, 0.6% and 0.3%, respectively.
• Relatively few Pennsylvania students reported the nonmedical use of prescription drugs. Across the overall sample, past-30-day prevalence rates are 5.0% for pain relievers, 2.8% for stimulants and 1.9% for tranquilizers.
• Other antisocial behaviors with low prevalence rates include Attempting to Steal a Vehicle (1.7%), Bringing a Weapon to School (2.3%) and Being Arrested (4.3%).
• Less than 10% of the respondents reported a willingness to try or use cocaine, hallucinogens or inhalants.
• Relatively few Pennsylvania students (10.0%) reported gambling for money in the past 30 days. Even fewer, 3.8%, bet money using the internet in the past year.
• Only 3.0% of surveyed students reported having been threatened with a weapon on school property in the past year, and only 1.1% reported having been attacked with a weapon on school property in the past year.
• Majorities of respondents reported that smoking one or more packs of cigarettes per day (66.5%) and regular use of marijuana (63.0%) pose a “great risk” of harm.
• The percentage of students who believe it would be either “wrong” or “very wrong” to use marijuana is 79.8%, followed by cigarettes (77.3%) and drinking alcohol regularly (71.6%). Disapproval of other illicit drug use (“LSD, cocaine, amphetamines or another illegal drug”) was even higher, at 94.3%.
• Relatively few students reported that they would be seen as “cool” by their peers if they drank alcohol regularly (11.4%), smoked marijuana (10.3%) or smoked cigarettes (5.1%).
Section 1 Summary of Results

Statewide Report 2009 Pennsylvania Youth Survey - 2 -
• Large majorities of Pennsylvania students reported that their parents believe it is “very wrong” for them to smoke marijuana (85.6%), smoke cigarettes (80.6%) or drink alcohol regularly (73.5%).
Opportunities for Improvement • In grades 8, 10 and 12, alcohol is the most frequently used substance. Across the overall sample,
49.3% of Pennsylvania students reporting one or more occasions of use in their lifetimes and 25.5% reporting one or more occasions of use in the past 30 days.
• Binge drinking—defined as the consumption of five or more drinks in a row in the last two weeks—was reported by 13.6% of surveyed Pennsylvania students, making this dangerous behavior more common than past-30-day cigarette or marijuana use.
• Across the overall sample, 11.4% of Pennsylvania students reported past-30-day marijuana use and 11.0% reported past-30-day cigarette use.
• Sixth graders reported the highest rate of past-30-day use for inhalants (6.8%). Eighth and 10th graders reported rates of 8.2% and 5.5% for inhalant use, respectively. Compared to national findings, Pennsylvania 8th, 10th and 12th graders reported higher rates of past-30-day inhalant use.
• Nearly one out of ten Pennsylvania students (9.7%) reported Being Drunk or High at School in the past year, and about one out of 20 (5.2%) reported Selling Drugs in the past year.
• Across the seven other antisocial behaviors, Pennsylvania students reported the highest rates for Attacking Someone with Intent to Harm, with 9.5% having reported attacking “someone with the idea of seriously hurting them.”
• Excluding students who indicated that “I don’t drive,” 18.5% of 12th graders reported that they drove under the influence of marijuana, and 16.5% drove under the influence of alcohol.
• In contrast to the lower rates for other substance categories, a near majority of 8th graders (42.7%) and majorities of 10th and 12th graders (60.2% and 72.0%, respectively) reported a willingness to try or use alcohol.
• Across the overall sample, 22.5% of Pennsylvania students reported having “bet money or anything of value” on sporting events in the past year.
• Non-physical forms of bullying are the most prevalent. More than one half of Pennsylvania students (51.4%) reported that other students tell lies about them or spread false rumors, 43.0% have been called names or teased, and 32.5% have been left out of things on purpose.
• For physical bullying, 18.1% have been hit, kicked, pushed, or shoved in the past year and 20.7% have had other students take their money or damage their things.
• Across the overall sample, 18.3% of Pennsylvania students reported having “been threatened to be hit or beaten up on school property.”
• As with a number of other statewide health behavior surveys, many Pennsylvania students reported having symptoms of depression. Nearly one third (31.6%) reported feeling “depressed or sad most days” and 27.8% reported that “at times I think I am no good at all.”
• Only 26.2% of surveyed 12th graders assigned a “great risk” of harm to drinking alcohol regularly.

Statewide Report 2009 Pennsylvania Youth Survey - 3 -
Section 2: Survey Methodology
Introduction From 1989 through 1997, Pennsylvania conducted a biennial statewide survey of students regarding their use of alcohol, tobacco and other drugs. The Generation at Risk survey was administered to approximately 60,000 6th, 7th, 9th and 12th graders. The survey was an important tool for professionals and policy makers who dealt with substance abuse and related issues. Results from the study provided a benchmark of alcohol, tobacco, and drug use among young Pennsylvanians, and helped indicate whether prevention and treatment programs were achieving their intended results. The survey had been expanded over the years to include questions on a range of issues such as physical fighting, carrying weapons, gangs, drinking and driving, and attitudes about school.
Prior to conducting the planned 1999 survey, an advisory group representing the Pennsylvania Departments of Health, Education, and Public Welfare, and other state agencies including the Governor’s Policy Office, the Children’s Partnership, Juvenile Court Judges’ Commission and the Commission on Crime and Delinquency, suggested the survey be redesigned to include additional information on risk and protective factors associated with delinquency and substance abuse. This redesign effort resulted in the development of the Pennsylvania Youth Survey (PAYS).
Since 2001, the PAYS has been administered every two years, in the fall semester, to 6th, 8th, 10th and 12th grade public school students across the state. The 2009 PAYS was administered to more than 140,000 public school students in grades 6 through 12. Upon completion of the project, community-level reports will be issued to more than 300 schools, school districts, and counties. The validated statewide probability sample, which is the subject of this report, consists of 22,647 students in grades 6, 8, 10 and 12 from 110 schools.
The data gathered in the PAYS serve two primary needs. First, the survey results provide an important benchmark for alcohol, tobacco, and other drug (ATOD) use and delinquent behavior among young Pennsylvanians, and help indicate whether prevention and treatment programs are achieving their intended results. Second, the survey assesses risk factors that are related to these behaviors and the protective factors that guard against them. This information allows community leaders and school administrators to direct prevention resources to areas where they are likely to have the greatest impact.
Section 2 Survey Methodology

Statewide Report 2009 Pennsylvania Youth Survey - 4 -
The 2009 PAYS was sponsored by the Pennsylvania Commission on Crime and Delinquency (PCCD). The PCCD contracted with SmartTrack, Inc., to conduct the survey, which was administered in the fall of 2009.
The Survey Questionnaire The Communities That Care Youth Survey (CTCYS) was adopted as the basis for the PAYS. Based on the work of Dr. J. David Hawkins and Dr. Richard F. Catalano, the CTCYS is designed to identify the levels of risk factors related to problem behaviors such as ATOD use—and to identify the levels of protective factors that help guard against those behaviors. In addition to measuring risk and protective factors, the CTCYS also measures the actual prevalence of drug use, violence and other antisocial behaviors among surveyed students. Three articles (Pollard, Hawkins & Arthur, 1999; Arthur, Hawkins, Pollard, Catalano & Baglioni, 2002; Glaser, Van Horn, Arthur, Hawkins & Catalano, 2005) describe the CTCYS, its uses and its ongoing development.
As in previous years, two versions of the PAYS questionnaire were made available to Pennsylvania schools: the standard questionnaire and a version that does not include the items that make up the family domain risk and protective factors. The standard questionnaire, which is presented in Appendix B of this report, was used by 64.4% of the respondents in the statewide sample, while the non-family questionnaire was used by 35.6%.
Changes to the Questionnaire While the majority of the items contained in the 2009 PAYS questionnaire are identical to those contained in the 2007 questionnaire, a number of changes were introduced in this survey cycle.
■ Items from the 2007 questionnaire assessing the abuse of prescription drugs were replaced with six new questions designed to measure prevalence-of-use rates across the three prescription drug categories: pain relievers, stimulants and tranquilizers. These questions were taken from the latest version of the CTCYS.
■ The risk factor scale Laws and Norms Favorable to Handguns was dropped from the questionnaire. All other risk and protective factor scales from the 2007 questionnaire were retained in full.
■ The 2009 questionnaire includes six items addressing student experiences with gambling. Two of the six gambling questions—the past-12-months and past-30-days gambling for “money or anything of value” items—are identical to questions used on the 2005 and 2007 surveys. The sports betting, lottery ticket, and table gaming questions are similar to questions used in the 2007 survey. These changes were made in consultation with the Pennsylvania Department of Health.
■ Starting in 2009, the PAYS asked students a series of eight questions about bullying at school and internet safety.
■ The ordering of items throughout the questionnaire was changed so that data points most critical to the prevention planning process, including data needed for the Drug-Free Communities grant program, would be collected in the first sections of the survey. This change improves the response rate for these key items.
■ For some survey items, the layout of the question and ordering of the response options was changed in order to improve readability.

Statewide Report 2009 Pennsylvania Youth Survey - 5 -
It is important to note that some of these changes—particularly the reordering of the survey items, changes to question layout, and the reordering of some response options sets—has impacted the way students respond to the survey items. These effects are more pronounced for the items that constitute a number of the risk and protective factor scales. For this reason, risk and protective factor results from the 2009 PAYS will not be compared to results from previous administrations of the survey. Response patterns to other items, such as ATOD behavior questions, were less impacted by the survey redesign. While historical comparisons for these and other items will be made in this report, the impact of the questionnaire redesign on trend comparability should be taken into consideration.
The Statewide Sample Sample Design
The target population of the 2009 PAYS is 6th, 8th, 10th and 12th grade students enrolled in regular public schools across Pennsylvania. The survey’s original sample plan employed a two-stage stratified probability design. The first stage was the selection of schools. In the first sampling stage, schools were stratified by grade. Schools with small grade enrollment (less than 50 students) were combined with other schools prior to sampling. The second stage of sampling was to involve the random selection of classes within the sampled schools and grades.
Specialized sampling software, PCSample, was used to select a representative sample of public schools. The software is designed for stratified systematic sampling with random starts. To ensure a good distribution of schools by region and enrollment size, schools were sorted by region and in descending order of grade enrollment before sampling. Within a stratum, schools were selected with probability proportional to size, with size being the grade enrollment of the school. While most selected schools were only asked to survey one grade level, a few schools had two grade levels selected for participation in the statewide sample. The sample is designed to yield a self-weighting sample within strata so that every eligible student has an equal chance of selection. A self-weighting sample is desirable because it tends to improve the precision of the estimates.
Sample Size Sample size depends on the distribution of the variables to be measured, the desired precision of the estimates, and the statistical confidence desired. The level of precision is conveyed by providing the survey estimate plus or minus its margin of error.
The sample size also needs to be adjusted by a design effect to account for the stratified sample design of the PAYS. The design effect is the ratio of the variance of the estimate obtained from a complex sample design to the variance of the estimate obtained from a simple random sample of the same size. For a population size N, the sample size needed to achieve a ± d% margin of error for an estimated proportion p, given a design effect (deff) for p, is given by
NdeffNppNd
n1
)()1(1
96.1
12
+⎟⎟⎠
⎞⎜⎜⎝
⎛−
−⎟⎠⎞
⎜⎝⎛
= .
Sample sizes were computed to yield a 5.0% margin of error, within each grade level, for prevalence estimates of 50.0%. Assuming a design effect of 4.0, a sample size of approximately 1,500 completed questionnaires per stratum (grade) was needed to produce this level of statistical precision. With the second stage of the sample set at two classrooms (approximately 50 students) for each school, and the

Statewide Report 2009 Pennsylvania Youth Survey - 6 -
following assumptions about response rate incorporated into the model, approximately 78 schools would need to be recruited within each grade level.
■ Number of desired completed questionnaires per grade level ≈ 1,500
■ Number of sampled students needed per grade level (assuming a student response rate of 56%) ≈ 2,700
■ Number of sampled students wanted within each participating school = 50 (roughly two classes)
■ Number of desired participating schools per grade level (2700/50) = 54
■ Number of sampled schools needed per grade level (@ 70% response rate) = 78
Revision of the Sample Design As recruiters began to contact the sampled schools, the challenges associated with this survey of implementing a two-stage sample design became more apparent.
■ Unlike many large-scale, school-based survey projects, PAYS is administered in the fall semester rather than the spring semester. As a result, some schools are unable to provide class lists and other necessary information at an early enough stage in the survey planning process.
■ Sufficient resources were not available to train survey coordinators at the more than 300 sampled schools. Survey coordinators are needed to prepare the classroom-level sampling frame and select the participating classrooms.
■ Since 2001, a fundamental goal of the PAYS project has been to provide school districts and counties with local data for prevention planning. Since most districts require near-census levels of participation in order to generate representative data, classroom sampling is inappropriate for many participating districts. Most school districts participating in the PAYS requested the ability to survey full grade levels.
Faced with insufficient time and resources to coordinate a statewide, two-stage sample, and giving consideration to the data collection needs of individual counties and districts, it was decided that the first stage of the original sample design would be retained, but the second-stage classroom sampling would be replaced with a grade-level census. More specifically, the revised sampling model was a single-stage design with stratification by grade level, with the sampling unit defined as grade levels within schools. Schools were instructed to survey all students in the selected grade level.
It is important to note that the redesign of the sample did have an impact on respondent selection probabilities. Consequently, adjustments to these probabilities were incorporated into the weighting formula. It should also be noted that the number of schools in the sample is greater than what would have been specified if a single-stage design had been implemented from the beginning. The positive impact of this larger number of schools is a larger final sample size. The negative impact is that recruitment and administration support resources were spread more thinly.
The Sample Frame A list of all public schools with enrollment in the 6th, 8th, 10th or 12th grade, the four grade levels included in the statewide sample, was provided by the Pennsylvania Department of Education. These enrollment data were the starting point for the development of the sampling frame. Each record on the frame generally represents a school (some records represent school districts). The original frame contained 2,101 schools

Statewide Report 2009 Pennsylvania Youth Survey - 7 -
and 591,952 students enrolled in the four grade levels. The frame cleaning process involved the following tasks:
■ Remove 1,234 records with no enrollment in grades 6, 8, 10 and 12.
■ Remove 87 records that have school names “SD” (school district) and school number “0000” or “9999.” These records represent a school district collectively, and not individual schools.
■ Remove 18 special schools (cyber schools, distance learning schools, juvenile detention centers, adult education centers, special education, and alternative schools).
For purposes of developing the sampling frame, the sampling unit was defined as each unique grade-by-school combination. Therefore, separate school rosters were developed for the 6th, 8th, 10th and 12th grades. As a result, most schools were included in more than one roster. For example, a middle school would typically be included in both the 6th and 8th grade rosters.
Enrollment totals for the final sample frame are presented in Table 1.
Participation Participation rates were calculated separately for both schools and students as a ratio of the number participating divided by the number selected. A combined participation rate consists of the two separate school and student participation rates multiplied by each other.
School Participation: 309 school-grade combinations were included in the sample. Out of these, 117, or 37.9%, participated in the survey.
Student Participation: The 117 participating school-grade combinations had enrollments totaling 35,502 students. Out of these, 24,016, or 67.7%, returned scannable questionnaires or completed an online survey session for the appropriate grade levels. (Note: 110 schools were included in the sample, but seven of these had two grade levels included.)
Overall Participation: 37.9% * 67.7% = 25.6%
Given the nature of the PAYS, the level of student participation within surveyed schools, nearly 70%, is good. This is because it is impossible at most schools to conduct a full census of an individual grade level. Most schools select a single class period for survey administration. If 10th graders are being surveyed during the second period, the survey administration coordinator usually includes all classes during that period that have significant numbers of 10th graders. Most schools do not institute a process for surveying 10th graders who attend classes with predominantly 9th grade or 11th grade students. (Note that for the same reason, it is also impossible at most schools to construct an exhaustive grade-level sampling frame for a second-stage classroom selection.) In addition, most schools do not provide an alternative survey day for students who are absent on the day of survey administration.
The school participation rate, 37.9%, holds the most room for improvement. Ideally, more than 75% of sampled schools would elect to join the survey effort, which would both increase the sample size and reduce the risk of participation bias at the school level. Participation bias occurs if there is a systematic difference between the 37.9% of sampled schools that joined the survey effort and the 62.1% that did not. If such a difference exists and it is correlated with the way students respond to the survey, the results of the survey will less accurately reflect the state as a whole.

Statewide Report 2009 Pennsylvania Youth Survey - 8 -
Weighting A weight has been associated with each response record to reflect the likelihood of sampling each student and to reduce bias by compensating for differing patterns of nonresponse. The weight used for estimation is given by:
W = W1 * f1 * f2 * f3
W1 = The inverse of the probability of selecting the school/grade combination f1 = A school-level nonresponse adjustment factor calculated by school size category (small, medium,
large). The factor was calculated in terms of school enrollment instead of number of schools. f2 = A student-level nonresponse adjustment factor calculated by school f3 = A poststratification adjustment factor calculated by grade. With this factor applied, the distribution of
the sample across grade levels matches the grade distribution in the statewide enrollment figures.
Survey Validation Five strategies were used to assess the validity of the completed survey forms. The first two strategies eliminated students who appeared to exaggerate their drug use and other antisocial behavior. The third strategy eliminated students who reported use of a fictitious drug. The fourth strategy eliminated the surveys of students who repeatedly reported logically inconsistent patterns of drug use. The fifth strategy eliminated students who answered less than 25% of the questions on the survey.
■ In the first strategy, surveys from students who reported a combined average of four or more daily uses for illicit drugs other than marijuana were eliminated from the survey dataset. This strategy removes surveys that are not taken seriously.
■ The second strategy supplements the drug use exaggeration test by examining the frequency of four other antisocial behaviors: Attacking Someone with Intent to Harm, Attempting to Steal a Vehicle, Being Arrested, and Getting Suspended. Respondents who reported an unrealistically high frequency of these behaviors—more than 80 instances within the past year—were removed from the analysis.
■ In the third strategy, students were asked if they had used a fictitious drug, Derbisol, in the past 30 days or in their lifetimes. If students reported the use of Derbisol for either of these time periods, their surveys were not included in the analysis of the findings.
■ The fourth strategy was used to detect logical inconsistencies among responses to the drug-related questions. Students were identified as inconsistent responders in the following circumstances only: (1) if they were inconsistent on two or more of the following four drugs: alcohol, cigarettes, smokeless tobacco and marijuana; or (2) if they were inconsistent on two or more of the remaining drugs. An example of an inconsistent response would be if a student reported that he or she had used alcohol three to five times in the past 30 days but had never used alcohol in his or her lifetime.
■ For the fifth strategy, students who answered less than 25% of the questions on the survey were removed from the analysis. This test is used to identify students who did not take the survey seriously or were incapable of fully participating.
PAYS students were cooperative and produced a high percentage of valid surveys. All but 1,369 students (5.7% of 24,016) completed valid surveys. Of the 1,369 surveys identified and eliminated by one or more

Statewide Report 2009 Pennsylvania Youth Survey - 9 -
of the five strategies described above, 360 exaggerated drug use (strategy 1), 240 exaggerated other antisocial behavior (strategy 2), 696 reported the use of the fictitious drug (strategy 3), 601 responded in a logically inconsistent way (strategy 4) and 312 answered fewer than 25% of the questions on the survey (strategy 5). The elimination total produced by these five strategies equals more than 1,369 because a number of respondents were identified by more than one strategy.
The filtering out of these 1,369 records resulted in a revised total of 22,647 respondents.
Administration Survey administration procedures were the same as those used in previous waves of the PAYS and were standardized throughout the state. Following school or district commitment to participate, surveys were sent directly to the participating schools. Within the school, the survey booklets were distributed to individual classrooms that were eligible for participation. Each teacher received an appropriate number of booklets and collection envelopes. Students had one classroom period in which to complete the survey. In some schools, some or all of the student respondents completed the survey in a computer lab using an internet-based survey administration system. All together, 17.4% of the survey participants included in the statewide sample took the survey online. The contractor, SmartTrack, Inc., managed the online administration.
A passive consent procedure was used by most school districts for this survey administration. That is, students were given the consent notification and were asked to give it to their parents. It was then up to the parents to notify the school if they did not want their child to participate in the survey.
The teachers reviewed the instructions with their students and asked the students to complete the survey. The instructions informed the students that there were no right or wrong answers. The instructions also explained the proper way to mark the answers. Students were asked to complete the survey but were also told that participation is voluntary. Furthermore, students were told that they could skip any question that they were not comfortable answering. Both the teacher and the written instructions on the front of the survey form assured students that the survey was anonymous and confidential. Upon completion of the survey the survey collection envelopes were sealed and returned to SmartTrack, Inc., for processing.
Confidence Intervals The maximum 95% confidence intervals for grade-level estimates range from a low of ±2.4 percentage points for the 10th and 12th grade subsamples to a high of ±2.9 percentage points for the 8th grade subsample. Estimates for the overall sample have confidence intervals of ±1.3 percentage points.
These confidence intervals are for prevalence rates of 50%. For less prevalent behaviors, such as heroin use and taking a handgun to school, the confidence interval narrows substantially. Also note that the variance estimates used for these confidence interval calculations include a design effect of 4.0 to adjust for the complex design of the 2009 PAYS sample.

Statewide Report 2009 Pennsylvania Youth Survey - 10 -
Table 1. Confidence Intervals for Sample
Enrollment Sample
Grade Number Percentage Number Percentage Confidence
Interval 6th 131,228 22.6% 4,884 21.6% ±2.8%
7th -- -- -- -- --
8th 139,259 23.9% 4,406 19.5% ±2.9%
9th -- -- -- -- --
10th 159,711 27.5% 6,694 29.6% ±2.4%
11th -- -- -- -- --
12th 151,521 26.0% 6,663 29.4% ±2.4%
Totals 581,719 100.0% 22,647 100.0% ±1.3% Note: Rounding can produce totals that do not equal 100%. The distribution of the sample across grade levels is before the application of the weights.
Through this report survey results are presented for the overall sample, for individual grade levels, and for individual gender groups. Ethnic subsamples are not large enough, given the complex nature of the sample design, to support the analysis of results within individual ethnic groups.
Exploring PAYS Results Online via SmartTrackTM This report includes a detailed review of findings from each content area of the PAYS questionnaire. Some data users, however, may wish to go beyond these key metrics. In order to facilitate this process, the 2009 PAYS statewide results can be explored using the SmartTrackTM online data browsing system.
SmartTrack’s internet-based reporting tools allow for instant presentation of various reports, ranging from frequency distributions to crosstabulations. Data can be viewed in both table and graph formats (via Excel), and users can review results for any appropriate aggregation or subsample.
Here is an example of an Excel chart generated using SmartTrack. In this report, an educator is examining student perception of the risk associated with smoking cigarettes.
How much do you think people risk harming themselves (physically or in other ways) if they:
No risk Slight risk Moderate risk Great risk Skips Totals
Smoke one or more packs of cigarettes per day? 07.22% 05.60% 27.15% 59.23% 0.80% 100%
For more information on accessing PAYS results, or any other questions about SmartTrack, you can visit the website at www.thesmarttrack.com, email [email protected], or call (866) 714-8080.
Demographic Profile of Surveyed Youth The survey measures a variety of demographic characteristics. Table 2 shows selected characteristics of surveyed youth: sex, ethnicity and the primary language spoken at home. The primary language spoken at home refers to the primary language the student speaks at home (rather than what the parents speak at home). Please note that the data in Table 2 show the variable distributions before the statistical weights are applied.
A higher percentage of surveyed students were female (48.8% female versus 47.3% male). A majority of

Statewide Report 2009 Pennsylvania Youth Survey - 11 -
students identified themselves as White (72.5%). The largest minority group is Latino (7.9%), followed by African American (4.8%), Asian (2.8%) and American Indian (0.6%). Note that while the “Other/Multiple” category listed on all tables includes students who selected “Other” as their primary ethnicity, this category also includes those students who selected multiple ethnicities. Therefore, for example, students who reported both African American and Latino ethnicity would be classified in the “Other/Multiple” category for the purposes of this report.
Nearly all of the surveyed students (92.3%) reported English as the language they most often speak at home.
Table 2. Selected Demographic Characteristics of Surveyed Youth Number of Students Percentage of Students
Overall Valid Surveys 22,647 100.0%
Sex
Male 10,716 47.3%
Female 11,062 48.8%
Did not respond 869 3.8%
Ethnicity
White 16,426 72.5%
African American 1,082 4.8%
Latino 1,784 7.9%
American Indian 125 0.6%
Asian 634 2.8%
Other/Multiple 2,365 10.4%
Did not respond 231 1.0%
Primary Language Spoken at Home
English 20,902 92.3%
Spanish 974 4.3%
Other Language 579 2.6%
Did not respond 192 0.8% Note: Rounding can produce totals that do not equal 100%.


Statewide Report 2009 Pennsylvania Youth Survey - 13 -
Section 3: Alcohol, Tobacco and Other Drug Use
Measurement Alcohol, tobacco and other drug (ATOD) use is measured in the PAYS by a set of 36 questions. The questions are similar to those used in the Monitoring the Future study, a nationwide study of drug use by middle and high school students. Consequently, national data as well as data from other similar surveys can be easily compared to data from the PAYS.
Prevalence-of-use tables and graphs show the percentages of students who reported using ATODs. These results are presented for both lifetime and past-30-day prevalence of use periods. Lifetime prevalence of use (whether the student has ever used the drug) is a good measure of student experimentation. Past-30-day prevalence of use (whether the student has used the drug within the last month) is a good measure of current use. In addition to the standard lifetime and past-30-day prevalence rates for alcohol use, binge drinking behavior (defined as a report of five or more drinks in a row within the past two weeks) is also measured.
A multi-question indicator—“any illicit drug (other than marijuana)”—measures the use of one or more of the following drugs: inhalants, cocaine, crack cocaine, heroin, hallucinogens, methamphetamine, Ecstasy and steroids. The purpose of this drug combination rate is to provide prevention planners with an overall gauge of so-called “hard” drug use (Johnston, O’Malley, Bachman & Schulenberg, 2009a).
The survey also includes six questions designed to measure nonmedical use of prescription drugs. The questions cover three general categories of nonmedical prescription drug use: pain relievers, tranquilizers and stimulants.
Results Summary Overall Results
ATOD prevalence rates for the combined sample of 6th, 8th, 10th and 12th graders are presented in Graph 1, and in the overall results column of Tables 3 and 4. As these results show, Pennsylvania students recorded the highest lifetime prevalence-of-use rates for alcohol (49.3%), cigarettes (26.3%), marijuana (20.0%), smokeless tobacco (12.1%) and inhalants (11.5%). Other lifetime prevalence rates ranged from 0.6% for methamphetamine to 3.3% for hallucinogens. The rate of illicit drug use excluding marijuana is
Section 3 Alcohol, Tobacco and Other Drug Use

Statewide Report 2009 Pennsylvania Youth Survey - 14 -
summarized by the indicator “any illicit drug (other than marijuana),” with 14.7% of surveyed students reporting use of these drugs in their lifetimes.
Pennsylvania students reported the highest past-30-day prevalence-of-use rates for alcohol (25.5%), marijuana (11.4%), cigarettes (11.0%), smokeless tobacco (6.2%) and inhalants (5.9%). Other past-30-day prevalence rates ranged from 0.2% for heroin to 1.8% for hallucinogens. Overall, 8.1% of Pennsylvania students reported the use of any illicit drug (other than marijuana) in the past 30 days.
Graph 1. Overall Lifetime and Past-30-Day Prevalence of Alcohol, Tobacco and Other Drug Use
8%
1%
1%
0%
2%
0%
0%
1%
6%
11%
6%
11%
14%
26%
15%
1%
2%
1%
3%
1%
1%
2%
12%
20%
12%
26%
49%
0% 20% 40% 60% 80% 100%
Any Il licit Drug (Other than Marijuana)
Steroids
Ecstasy
Methamphetamine
Hallucinogens
Heroin
Crack Cocaine
Cocaine
Inhalants
Marijuana
Smokeless Tobacco
Cigarettes
Binge Drinking
Alcohol
30-Day Lifetime

Statewide Report 2009 Pennsylvania Youth Survey - 15 -
Grade-Level Results ATOD prevalence rates for individual grade levels are presented in Graph 2 and Tables 3 and 4. Typically, prevalence rates for the use of most substances increase as students enter higher grades. In many communities, however, inhalant use provides an exception to this pattern, often peaking during the late middle school or early high school years. This may be because inhalants are relatively easy for younger students to obtain. Past-30-day alcohol use in Pennsylvania ranges from a low of 5.1% among 6th graders to a high of 46.0% among 12th graders. Past-30-day marijuana use ranges from a low of 0.3% among 6th graders to a high of 23.7% among 12th graders. Past-30-day cigarette use ranges from a low of 0.9% among 6th graders to a high of 20.8% among 12th graders. Past-30-day inhalant use ranges from a low of 3.3% among 12th graders to a high of 8.2% among 8th graders.
Comparisons to National Results Comparing and contrasting findings from a state-level survey to relevant data from a national survey provides a valuable perspective on local data. In this report, national comparisons for ATOD use will be made to the 2009 Monitoring the Future study. The Monitoring the Future survey project, which provides prevalence-of-use information for ATODs from a nationally representative sample of 8th, 10th and 12th graders, is conducted annually by the Survey Research Center of the Institute for Social Research at the University of Michigan (see www.monitoringthefuture.org). For a review of the methodology of this study, please see Johnston et al. (2009a).
In addition to a complete report of prevalence-of-use rates for each surveyed grade, Tables 3 and 4 present national results from the Monitoring the Future study. Across the three comparison grades (8th, 10th and 12th), students in Pennsylvania reported lower average levels of lifetime marijuana, Ecstasy and cocaine use than their national counterparts. The largest grade-level differences in lifetime substance use were for marijuana in the 8th and 10th grades (9.8% and 25.1% versus 15.7% and 32.3% for Monitoring the Future) and alcohol in the 8th grade (45.0% versus 36.6% for Monitoring the Future).
For past-30-day ATOD use, students in Pennsylvania reported a higher average level of inhalant use than their national counterparts. The largest grade-level differences in past-30-day substance use were for marijuana in the 12th grade (23.7% versus 20.6% for Monitoring the Future) and inhalants in the 8th and 10th grades (8.2% and 5.5% versus 3.8% and 2.2% for Monitoring the Future).
Gender Differences Like many recent national and state-level youth health behavior surveys, the 2009 PAYS shows relatively little difference in ATOD prevalence rates between female and male students. The only substantial difference occurs for smokeless tobacco, with 10.1% of males reporting one or more uses in the past 30 days compared to 2.5% of females. Much smaller but noteworthy differences also appear for past-30-day alcohol use (26.1% among females versus 24.8% among males) and marijuana use (12.9% among males versus 9.9% among females).
Graph 2. Past-30-Day Use of Selected ATODs
51 0
7
17
7 58
31
14 14
6
46
2124
3
0
20
40
60
Alcohol Cigarettes Marijuana Inhalants
Per
cent
age
Use
6th 8th 10th 12th
Graph 2. Past-30-Day Use of Selected ATODs
0
20
40
60
6th 8th 10th 12th
Per
cent
age
Use
Alcohol Cigarettes Marijuana I nhalants

Statewide Report 2009 Pennsylvania Youth Survey - 16 -
This relative parity in past-30-day rates between the sexes represents a shift in the pattern of ATOD use. Fifteen years ago male students reported higher rates of use across a number of ATOD categories. It is important to note that the closing of the ATOD gender gap is primarily a reflection of declining rates of use among male students, compared to either stable or more slowly declining rates of use among female students.
Table 3. Lifetime Use of Alcohol, Tobacco and Other Drugs
Pennsylvania 2009 Monitoring the Future1
Female Male 6th 8th 10th 12th Overall 8th 10th 12th % % % % % % % % % %
Alcohol 51.5 47.3 20.8 45.0 56.7 70.0 49.3 36.6 59.1 72.3
Cigarettes 27.0 25.5 4.6 20.6 32.0 44.3 26.3 20.1 32.7 43.6
Smokeless Tobacco 5.6 19.1 2.5 8.8 14.2 21.4 12.1 9.6 15.2 16.3
Marijuana 18.9 21.3 0.6 9.8 25.1 41.1 20.0 15.7 32.3 42.0
Inhalants 12.0 11.0 10.2 13.9 12.2 9.7 11.5 14.9 12.3 9.5
Cocaine 1.5 2.2 0.0 0.5 1.8 4.8 1.9 2.6 4.6 6.0
Crack Cocaine 0.6 0.9 0.2 0.4 1.2 1.1 0.8 1.7 2.1 2.4
Heroin 0.6 0.7 0.1 0.2 0.9 1.4 0.7 1.3 1.5 1.2
Hallucinogens 2.4 4.3 0.1 1.0 3.7 8.0 3.3 3.0 6.1 7.4
Methamphetamine 0.5 0.7 0.2 0.2 0.7 1.1 0.6 1.6 2.8 2.4
Ecstasy 1.9 2.3 0.2 0.7 2.2 4.8 2.1 2.2 5.5 6.5
Steroids 0.5 1.3 0.6 0.7 1.1 1.0 0.8 1.3 1.3 2.2 Any Illicit Drug (Other than Marijuana) 14.1 15.4 10.5 15.0 15.4 17.2 14.7 -- -- --
Note: The symbol “--” indicates that data are not available because students were not surveyed, the drug was not included in the survey, or a comparable aggregate calculation was not available. Monitoring the Future data are only available for 8th, 10th and 12th graders.
1 Johnston et al. (2009b).

Statewide Report 2009 Pennsylvania Youth Survey - 17 -
Table 4. Past-30-Day Use of Alcohol, Tobacco and Other Drugs
Pennsylvania 2009 Monitoring the Future1
Female Male 6th 8th 10th 12th Overall 8th 10th 12th % % % % % % % % % %
Alcohol 26.1 24.8 5.1 17.2 30.5 46.0 25.5 14.9 30.4 43.5
Binge Drinking 13.6 13.8 1.2 7.5 15.7 27.6 13.6 7.8 17.5 25.2
Cigarettes 11.0 11.0 0.9 6.7 13.9 20.8 11.0 6.5 13.1 20.1
Smokeless Tobacco 2.5 10.1 0.6 4.7 7.6 10.9 6.2 3.7 6.5 8.4
Marijuana 9.9 12.9 0.3 5.4 14.2 23.7 11.4 6.5 15.9 20.6
Inhalants 6.0 5.8 6.8 8.2 5.5 3.3 5.9 3.8 2.2 1.2
Cocaine 0.4 0.7 0.1 0.2 0.6 1.2 0.6 0.8 0.9 1.3
Crack Cocaine 0.3 0.3 0.0 0.3 0.4 0.4 0.3 0.5 0.4 0.6
Heroin 0.2 0.3 0.0 0.2 0.2 0.5 0.2 0.4 0.4 0.4
Hallucinogens 1.2 2.4 0.1 0.8 2.3 3.5 1.8 0.9 1.4 1.6
Methamphetamine 0.2 0.3 0.0 0.1 0.5 0.4 0.3 0.5 0.6 0.5
Ecstasy 0.8 1.3 0.0 0.4 1.4 2.2 1.1 0.6 1.3 1.8
Steroids 0.2 1.0 0.5 0.3 0.7 0.8 0.6 0.4 0.5 1.0 Any Illicit Drug (Other than Marijuana) 7.3 9.0 7.3 9.3 8.1 7.6 8.1 -- -- --
Note: The symbol “--” indicates that data are not available because students were not surveyed, the drug was not included in the survey, or a comparable aggregate calculation was not available. Monitoring the Future data are only available for 8th, 10th and 12th graders.
1 Johnston et al. (2009b).
Item-Level Results Alcohol
Alcohol, including beer, wine and hard liquor, is the drug used most often by adolescents today. Findings from the Monitoring the Future study highlight the pervasiveness of alcohol in middle and high schools today. In comparison, cigarette use (the second most pervasive category of ATOD use) is only about half as prevalent as alcohol use. Given the national pattern, it is not surprising that alcohol is the most used drug among students in Pennsylvania.
Lifetime Use:
■ Lifetime prevalence of alcohol use ranges from a low of 20.8% for 6th graders to a high of 70.0% for 12th graders. Overall, 49.3% of Pennsylvania students have used alcohol at least once in their lifetimes.
■ Compared to national findings, Pennsylvania 8th graders reported a higher rate of lifetime alcohol use and 10th and 12th graders reported slightly lower rates of use.
■ Female students are more likely than male students (51.5% female versus 47.3% male) to have reported having had one or more drinks of alcohol in their lifetimes.
Alcohol Use
517
31
46
2621
4557
70
49
0
20
40
60
80
100
6 8 10 12 Overall
Per
cent
age
Use
30-Day Lifetime
Statewide Report 2009 Pennsylvania Youth Survey - 18 -
Past-30-Day Use:
■ Past-30-day prevalence of alcohol use ranges from a low of 5.1% for 6th graders to a high of 46.0% for 12th graders. Overall, 25.5% of Pennsylvania students have used alcohol at least once in the last 30 days.
■ Compared to national findings, Pennsylvania 8th and 12th graders reported slightly higher rates of past-30-day alcohol use and 10th graders reported a similar rate of use.
■ Female students are slightly more likely than male students (26.1% female versus 24.8% male) to report having used alcohol in the past 30 days.
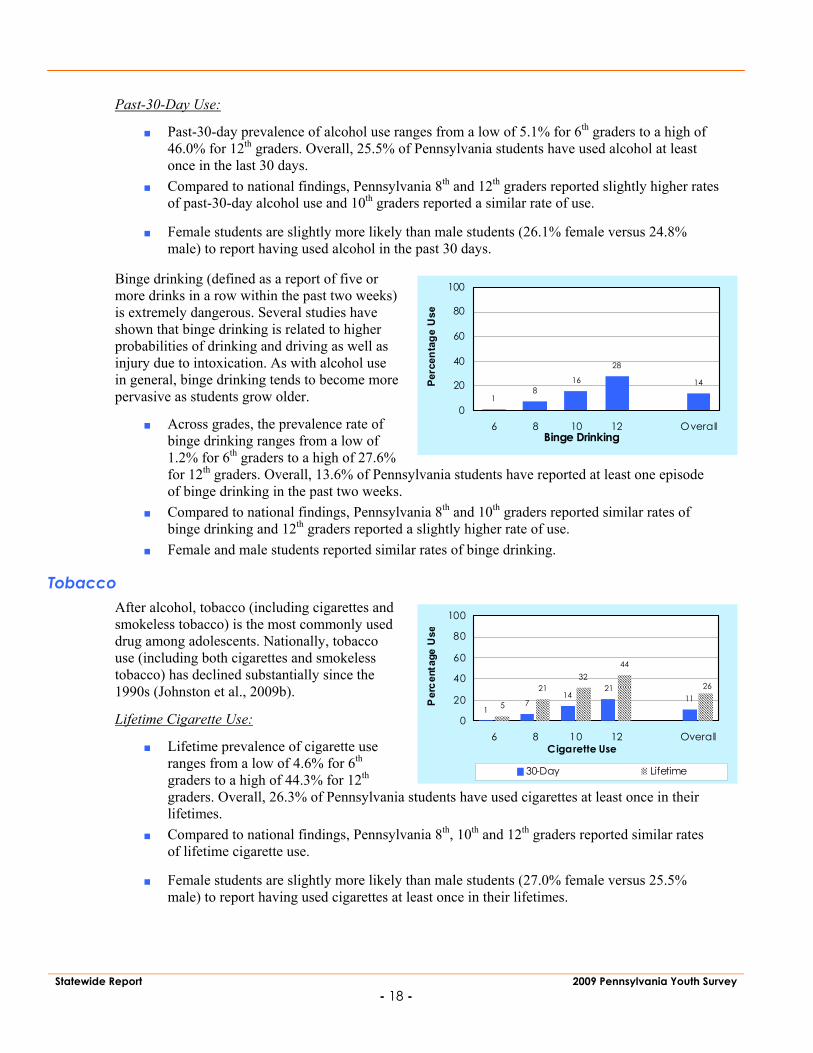
Binge drinking (defined as a report of five or more drinks in a row within the past two weeks) is extremely dangerous. Several studies have shown that binge drinking is related to higher probabilities of drinking and driving as well as injury due to intoxication. As with alcohol use in general, binge drinking tends to become more pervasive as students grow older.
■ Across grades, the prevalence rate of binge drinking ranges from a low of 1.2% for 6th graders to a high of 27.6% for 12th graders. Overall, 13.6% of Pennsylvania students have reported at least one episode of binge drinking in the past two weeks.
■ Compared to national findings, Pennsylvania 8th and 10th graders reported similar rates of binge drinking and 12th graders reported a slightly higher rate of use.
■ Female and male students reported similar rates of binge drinking.
Tobacco After alcohol, tobacco (including cigarettes and smokeless tobacco) is the most commonly used drug among adolescents. Nationally, tobacco use (including both cigarettes and smokeless tobacco) has declined substantially since the 1990s (Johnston et al., 2009b).
Lifetime Cigarette Use:
■ Lifetime prevalence of cigarette use ranges from a low of 4.6% for 6th graders to a high of 44.3% for 12th graders. Overall, 26.3% of Pennsylvania students have used cigarettes at least once in their lifetimes.
■ Compared to national findings, Pennsylvania 8th, 10th and 12th graders reported similar rates of lifetime cigarette use.
■ Female students are slightly more likely than male students (27.0% female versus 25.5% male) to report having used cigarettes at least once in their lifetimes.
Cigarette Use
17
1421
115
2132
44
26
0
20
40
60
80
100
6 8 10 12 Overall
Per
cent
age
Use
30-Day Lifetime
Binge Drinking
18
16
28
14
0
20
40
60
80
100
6 8 10 12 OverallPe
rcen
tage
Use

Statewide Report 2009 Pennsylvania Youth Survey - 19 -
Past-30-Day Cigarette Use:
■ Past-30-day prevalence of cigarette use ranges from a low of 0.9% for 6th graders to a high of 20.8% for 12th graders. Overall, 11.0% of Pennsylvania students have used cigarettes at least once in the last 30 days.
■ Compared to national findings, Pennsylvania 8th, 10th and 12th graders reported similar rates of past-30-day cigarette use.
■ Female and male students reported identical rates of past-30-day cigarette use.
Lifetime Smokeless Tobacco Use:
■ Lifetime prevalence of smokeless tobacco use ranges from a low of 2.5% for 6th graders to a high of 21.4% for 12th graders. Overall, 12.1% of Pennsylvania students have used smokeless tobacco at least once in their lifetimes.
■ Compared to national findings, Pennsylvania 8th and 10th graders reported similar rates of lifetime smokeless tobacco use and 12th graders reported a higher rate of use.
■ Not surprisingly, lifetime smokeless tobacco use was substantially higher among male students (19.1%) compared to female students (5.6%).
Past-30-Day Smokeless Tobacco Use:
■ Past-30-day prevalence of smokeless tobacco use ranges from a low of 0.6% for 6th graders to a high of 10.9% for 12th graders. Overall, 6.2% of Pennsylvania students have used smokeless tobacco at least once in the last 30 days.
■ Compared to national findings, Pennsylvania 8th and 10th graders reported similar rates of past-30-day smokeless tobacco use and 12th graders reported a slightly higher rate of use.
■ Not surprisingly, past-30-day smokeless tobacco use was substantially higher among male students (10.1%) compared to female students (2.5%).
Marijuana During the 1990s, there were notable changes in trends of marijuana use throughout the United States. Results from the Monitoring the Future study show increases in both lifetime and past-30-day prevalence rates through the early and mid 1990s (Johnston et al., 2009b). For 8th and 10th graders, the past-30-day rates more than doubled during this period. Since 1996 and 1997, when past-30-day marijuana use peaked, rates have declined.
Marijuana Use
05
14
24
11
1
10
25
41
20
0
20
40
60
6 8 10 12 Overall
Per
cent
age
Use
30-Day Lifetime
Smokeless Tobacco Use
1 5 8 11 639
1421
12
0
20
40
60
80
100
6 8 10 12 Overall
Per
cent
age
Use
30-Day Lifetime

Statewide Report 2009 Pennsylvania Youth Survey - 20 -
Lifetime Use:
■ Lifetime prevalence of marijuana use ranges from a low of 0.6% for 6th graders to a high of 41.1% for 12th graders. Overall, 20.0% of Pennsylvania students have used marijuana at least once in their lifetimes.
■ Compared to national findings, Pennsylvania 8th and 10th graders reported lower rates of lifetime marijuana use and 12th graders reported a similar rate of use.
■ Male students are more likely than female students (21.3% male versus 18.9% female) to have reported using marijuana at least once in their lifetimes.
Past-30-Day Use:
■ Past-30-day prevalence of marijuana use ranges from a low of 0.3% for 6th graders to a high of 23.7% for 12th graders. Overall, 11.4% of Pennsylvania students have used marijuana at least once in the last 30 days.
■ Compared to national findings, Pennsylvania 8th and 10th graders reported similar rates of past-30-day marijuana use and 12th graders reported a higher rate of use.
■ Male students are more likely than female students (12.9% male versus 9.9% female) to have reported using marijuana at least once in the past 30 days.
Inhalants Inhalant use is more prevalent with younger students, perhaps because inhalants are often the easiest drugs for them to obtain. The health consequences of inhalant use can be substantial, including brain damage and heart failure. Inhalant use was measured by the survey question “On how many occasions (if any) have you used inhalants (whippets, butane, paint thinner, or glue to sniff, etc.)?” Comparisons with the Monitoring the Future study (national results) should be made carefully because there are differences in survey questions for this class of drugs.
Lifetime Use:
■ Lifetime prevalence of inhalant use ranges from a low of 9.7% for 12th graders to a high of 13.9% for 8th graders. Overall, 11.5% of Pennsylvania students have used inhalants at least once in their lifetimes.
■ Compared to national findings, Pennsylvania 8th, 10th and 12th graders reported similar rates of lifetime inhalant use.
■ Female and male students reported similar rates of lifetime inhalant use.
Past-30-Day Use:
■ Past-30-day prevalence of inhalant use ranges from a low of 3.3% for 12th graders to a high of 8.2% for 8th graders. Overall, 5.9% of Pennsylvania students have used inhalants at least once in the last 30 days.
Inhalant Use
7 86
36
1014 12
10 12
0
10
20
30
40
6 8 10 12 Overall
Perc
enta
ge U
se
30-Day Lifetime

Statewide Report 2009 Pennsylvania Youth Survey - 21 -
■ Compared to national findings, Pennsylvania 8th, 10th and 12th graders reported higher rates of past-30-day inhalant use. In particular, 8.2% of Pennsylvania 8th graders reported past-30-day inhalant use compared to 3.8% of 8th graders from the national sample.
■ Female and male students reported similar rates of past-30-day inhalant use.
Other Illicit Drugs The PAYS also measures the prevalence of use for a variety of other drugs. This includes student use of the following: cocaine, crack cocaine, heroin, hallucinogens, methamphetamine, Ecstasy and steroids. The rates for prevalence of use of these other drugs are generally lower than the rates for alcohol, tobacco, marijuana and inhalants. Additionally, use of these other drugs tends to be concentrated in the upper grade levels.
Cocaine
Cocaine is a powerfully addictive stimulant that directly affects the brain. Users may develop tolerance and need more and more of the drug to feel the same effects. Cocaine use can cause a variety of physical problems, including chest pain, strokes, seizures and abnormal heart rhythm.
Lifetime Use:
■ Lifetime prevalence of cocaine use ranges from a low of 0.0% for 6th graders to a high of 4.8% for 12th graders. Overall, 1.9% of Pennsylvania students have used cocaine at least once in their lifetimes.
■ Compared to national findings, Pennsylvania 8th and 10th graders reported lower rates of lifetime cocaine use and 12th graders reported a similar rate of use.
■ Female and male students reported similar rates of lifetime cocaine use.
Past-30-Day Use:
■ Past-30-day prevalence of cocaine use ranges from a low of 0.1% for 6th graders to a high of 1.2% for 12th graders. Overall, 0.6% of Pennsylvania students have used cocaine at least once in the last 30 days.
■ Compared to national findings, 8th, 10th and 12th graders reported similar rates of past-30-day cocaine use.
■ Both female and male students reported very low rates of past-30-day cocaine use.
Crack Cocaine
“Crack” is the street name given to the freebase form of cocaine, which has been processed into a less expensive, smokeable drug. Because crack is smoked, the user experiences a very quick, intense, but short-term high. Smoking large quantities of crack can cause acute problems, including cough, shortness of breath, and severe chest pains.
Lifetime Use:
■ Lifetime prevalence of crack cocaine use ranges from a low of 0.2% for 6th graders to a high of 1.2% for 10th graders. Overall, 0.8% of Pennsylvania students have used crack cocaine at least once in their lifetimes.
■ Rates of crack cocaine use are very low, so differences between datasets tend to be small. With this caveat in place, it can be noted that the rates of lifetime crack cocaine use reported by Pennsylvania students are lower than those reported nationally.

Statewide Report 2009 Pennsylvania Youth Survey - 22 -
■ Both female and male students reported very low rates of lifetime crack cocaine use.
Past-30-Day Use:
■ Past-30-day prevalence of crack cocaine use ranges from a low of 0.0% for 6th graders to a high of 0.4% for 10th and 12th graders. Overall, 0.3% of Pennsylvania students have used crack cocaine at least once in the last 30 days.
■ Compared to national findings, 8th and 12th graders reported similar rates of past-30-day crack cocaine use and 10th graders reported the same rate of use.
■ Both female and male students reported very low rates of past-30-day crack cocaine use.
Heroin
Heroin is a highly addictive drug with rapid effects. Processed from morphine, heroin is usually injected, snorted or smoked. Physical dependence on the drug often develops among users. Long-term health problems caused by heroin use include collapsed veins, kidney or liver disease and bacterial infections.
Lifetime Use:
■ Lifetime prevalence of heroin use ranges from a low of 0.1% for 6th graders to a high of 1.4% for 12th graders. Overall, 0.7% of Pennsylvania students have used heroin at least once in their lifetimes.
■ Rates of heroin use are very low, so differences between datasets tend to be small. Not surprisingly, Pennsylvania students reported rates of lifetime use that are similar to national results.
■ Both female and male students reported very low rates of lifetime heroin use.
Past-30-Day Use:
■ Past-30-day prevalence of heroin use ranges from a low of 0.0% for 6th graders to a high of 0.5% for 12th graders. Overall, 0.2% of Pennsylvania students have used heroin at least once in the last 30 days.
■ As with lifetime rates, Pennsylvania students reported rates of past-30-day heroin use that are similar to national rates.
■ Both female and male students reported very low rates of past-30-day heroin use.
Hallucinogens
Hallucinogenic drugs can have short- and long-term effects on perception and mood. For instance, users of LSD, the most potent mood- and perception-altering drug, may have unpredictable experiences (known as “trips”) ranging from pleasant hallucinations to terrifying thoughts and feelings. LSD can also cause physical complications, including increased blood pressure and heart rate, dizziness, loss of appetite, nausea and numbness. For the purposes of the PAYS, hallucinogens were defined as “hallucinogens (acid, LSD, and ’shrooms).”
Lifetime Use:
■ Lifetime prevalence of hallucinogen use ranges from a low of 0.1% for 6th graders to a high of 8.0% for 12th graders. Overall, 3.3% of Pennsylvania students have used hallucinogens at least once in their lifetimes.
■ Compared to national findings, Pennsylvania 8th and 10th graders reported lower rates of lifetime hallucinogen use and 12th graders reported a similar rate of use.

Statewide Report 2009 Pennsylvania Youth Survey - 23 -
■ Male students are slightly more likely than female students (4.3% male versus 2.4% female) to have reported having used hallucinogens at least once in their lifetimes.
Past-30-Day Use:
■ Past-30-day prevalence of hallucinogen use ranges from a low of 0.1% for 6th graders to a high of 3.5% for 12th graders. Overall, 1.8% of Pennsylvania students have used hallucinogens at least once in the last 30 days.
■ Compared to national findings, Pennsylvania 8th and 10th graders reported similar rates of past-30-day hallucinogen use and 12th graders reported a higher rate of use.
■ Male students are slightly more likely than female students (2.4% male versus 1.2% female) to have reported having used hallucinogens in the past 30 days.
Methamphetamine
Methamphetamine is a highly addictive stimulant with effects similar to cocaine. Use of methamphetamine can cause physical and psychological problems, such as rapid or irregular heart rate, increased blood pressure, anxiety and insomnia.
Lifetime Use:
■ Lifetime prevalence of methamphetamine use ranges from a low of 0.2% for 6th and 8th graders to a high of 1.1% for 12th graders. Overall, 0.6% of Pennsylvania students have used methamphetamine at least once in their lifetimes.
■ Rates of methamphetamine use are very low, so differences between datasets tend to be small. With this caveat in place, it can be noted that the rates of lifetime methamphetamine use reported by Pennsylvania students are lower than those reported nationally.
■ Both female and male students reported very low rates of lifetime methamphetamine use.
Past-30-Day Use:
■ Past-30-day prevalence of methamphetamine use ranges from a low of 0.0% for 6th graders to a high of 0.5% for 10th graders. Overall, 0.3% of Pennsylvania students have used methamphetamine at least once in the last 30 days.
■ Rates of student past-30-day methamphetamine use are low nationally and in Pennsylvania. ■ Both female and male students reported very low rates of past-30-day methamphetamine use.
Ecstasy
Ecstasy (also known as MDMA) has both stimulant and hallucinogenic effects. After showing an increase in use nationwide from 1998 to 2001, use of Ecstasy appears to have declined in recent years, while the proportion of young people perceiving it as dangerous has increased (Johnston et al., 2009b).
Lifetime Use:
■ Lifetime prevalence of Ecstasy use ranges from a low of 0.2% for 6th graders to a high of 4.8% for 12th graders. Overall, 2.1% of Pennsylvania students have used Ecstasy at least once in their lifetimes.
■ Compared to national findings, 8th and 10th graders reported lower rates of lifetime Ecstasy use and 12th graders reported a similar rate.
■ Both female and male students reported low rates of lifetime Ecstasy use.

Statewide Report 2009 Pennsylvania Youth Survey - 24 -
Past-30-Day Use:
■ Past-30-day prevalence of Ecstasy use ranges from a low of 0.0% for 6th graders to a high of 2.2% for 12th graders. Overall, 1.1% of Pennsylvania students have used Ecstasy at least once in the last 30 days.
■ Both nationally and in Pennsylvania, students report very low rates of past-30-day Ecstasy use.
■ Both female and male students reported low rates of past-30-day Ecstasy use.
Steroids
The primary use for steroids in humans is to raise inadequate levels of testosterone. However, some athletes misuse the drug to “improve” their appearance or athletic performance. Improper use of steroids can prematurely stop the lengthening of bones as well as cause infertility and liver tumors.
Lifetime Use:
■ Lifetime prevalence of steroid use ranges from a low of 0.6% for 6th graders to a high of 1.1% for 10th graders. Overall, 0.8% of Pennsylvania students have used steroids at least once in their lifetimes.
■ Rates of student lifetime steroid use are very low nationally and in Pennsylvania.
■ Both female and male students reported very low rates of lifetime steroid use.
Past-30-Day Use:
■ Past-30-day prevalence of steroid use ranges from a low of 0.3% for 8th graders to a high of 0.8% for 12th graders. Overall, 0.6% of Pennsylvania students have used steroids at least once in the last 30 days.
■ Both nationally and in Pennsylvania, students report very low rates of past-30-day steroid use. ■ Both female and male students reported very low rates of past-30-day steroid use.
Any Illicit Drug (Other than Marijuana)
The final ATOD indicator reports on the use of any illicit drug other than marijuana. This drug combination rate—which includes use of one or more of the following drugs: inhalants, cocaine, crack cocaine, heroin, hallucinogens, methamphetamine, Ecstasy and steroids—provides prevention planners with an overall indicator of so-called “hard” drug use. Marijuana use is excluded from this index because the higher prevalence of marijuana use tends to obscure the presence or absence of the other drugs. In other words, an indicator of “Any Illicit Drug Use (Including Marijuana)” primarily measures marijuana use. Direct comparisons to Monitoring the Future results are not available for this measure.
Lifetime Use:
■ Lifetime prevalence of any illicit drug (other than marijuana) use ranges from a low of 10.5% for 6th graders to a high of 17.2% for 12th graders. Overall, 14.7% of Pennsylvania students have used any illicit drug (other than marijuana) at least once in their lifetimes.
Any Illicit Drug (Other than Mar ijuana) Use
79 8 8 8
1115 15 17
15
0
10
20
30
40
6 8 10 12 Overall
Perc
enta
ge U
se
30-Day Lifetime

Statewide Report 2009 Pennsylvania Youth Survey - 25 -
■ Male students are slightly more likely than female students (15.4% male versus 14.1% female) to have reported having used any illicit drug (other than marijuana) at least once in their lifetimes.
Past-30-Day Use:
■ Past-30-day prevalence of any illicit drug (other than marijuana) use ranges from a low of 7.3% for 6th graders to a high of 9.3% for 8th graders. Overall, 8.1% of Pennsylvania students have used any illicit drug (other than marijuana) at least once in the last 30 days.
■ Male students are slightly more likely than female students (9.0% male versus 7.3% female) to have reported having used any illicit drug (other than marijuana) at least once in the past 30 days.
Prescription Drugs In recent years the nonmedical use of prescription drugs has emerged as a major public health issue. Both the National Survey on Drug Use and Health (Substance Abuse and Mental Health Services Administration, 2003) and the Monitoring the Future study (Johnston et al., 2009a), two major sources of youth drug abuse prevalence data, have reported increases in the unauthorized use of prescription drugs. This trend is particularly troubling given the adverse health consequences related to prescription drug abuse, which include addiction, physical dependence and the possibility of overdose.
Despite these concerns, the research community is still in the early stages of developing survey methods that can accurately measure the prevalence of prescription drug abuse. If anonymity is ensured, most students will honestly and accurately report their use of alcohol, tobacco, marijuana and other easily recognized categories of illicit drugs. The measurement of prescription drug use, however, is more complex. There are many prescription medicines that are subject to abuse, making it impossible to present an exhaustive list. Also, respondents may have difficulty identifying the names of prescription drugs they have used, and they may have difficulty distinguishing between prescription and over-the-counter medications.
With these challenges in mind, the PAYS included six new questions designed to measure prevalence-of-use rates across the three prescription drug categories that, according to the National Institute on Drug Abuse, are among the most likely to be abused: pain relievers, stimulants and tranquilizers. Each question includes examples of some of the best known drugs within that category. Results for Pennsylvania are presented in Tables 5 and 6.
On how many occasions (if any) have you:
• Used prescription pain relievers, such as Vicodin®, OxyContin® or Tylox®, without a doctor’s orders, in your lifetime?
• Used prescription pain relievers, such as Vicodin®, OxyContin® or Tylox®, without a doctor’s orders, during the past 30 days?
• Used prescription tranquilizers, such as Xanax®, Valium® or Ambien®, without a doctor’s orders, in your lifetime?
• Used prescription tranquilizers, such as Xanax®, Valium® or Ambien®, without a doctor’s orders, during the past 30 days?
• Used prescription stimulants, such as Ritalin® or Adderall®, without a doctor’s orders, in your lifetime?

Statewide Report 2009 Pennsylvania Youth Survey - 26 -
• Used prescription stimulants, such as Ritalin® or Adderall®, without a doctor’s orders, during the past 30 days?
Pain Relievers
Lifetime Use:
■ Lifetime prevalence of prescription pain reliever use ranges from a low of 1.6% for 6th graders to a high of 14.8% for 12th graders. Overall, 7.4% of Pennsylvania students have used prescription pain relievers at least once in their lifetimes.
■ Female and male students reported similar rates of lifetime prescription pain reliever use.
Past-30-Day Use:
■ Past-30-day prevalence of prescription pain reliever use ranges from a low of 1.0% for 6th graders to a high of 8.7% for 12th graders. Overall, 5.0% of Pennsylvania students have used prescription pain relievers at least once in the last 30 days.
■ Female and male students reported similar rates of past-30-day prescription pain reliever use.
Tranquilizers
Lifetime Use:
■ Lifetime prevalence of tranquilizer use ranges from a low of 0.2% for 6th graders to a high of 8.4% for 12th graders. Overall, 3.2% of Pennsylvania students have used tranquilizers at least once in their lifetimes.
■ Female and male students reported similar rates of lifetime tranquilizer use.
Past-30-Day Use:
■ Past-30-day prevalence of tranquilizer use ranges from a low of 0.2% for 6th graders to a high of 4.2% for 12th graders. Overall, 1.9% of Pennsylvania students have used tranquilizers at least once in the last 30 days.
■ Female and male students reported similar rates of past-30-day tranquilizer use.
Stimulants
Lifetime Use:
■ Lifetime prevalence of stimulant use ranges from a low of 0.4% for 6th graders to a high of 10.1% for 12th graders. Overall, 4.2% of Pennsylvania students have used stimulants at least once in their lifetimes.
■ Female and male students reported similar rates of lifetime stimulant use.
Past-30-Day Use:
■ Past-30-day prevalence of stimulant use ranges from a low of 0.2% for 6th graders to a high of 6.0% for 12th graders. Overall, 2.8% of Pennsylvania students have used stimulants at least once in the last 30 days.
■ Female and male students reported similar rates of past-30-day stimulant use.

Statewide Report 2009 Pennsylvania Youth Survey - 27 -
Table 5. Lifetime Use of Prescription Drugs, Pennsylvania 2009
Female Male 6th 8th 10th 12th Overall % % % % % % % Pain Relievers 7.9 6.9 1.6 3.7 8.3 14.8 7.4 Tranquilizers 3.4 3.1 0.2 0.7 3.0 8.4 3.2 Stimulants 4.0 4.5 0.4 1.5 4.3 10.1 4.2
Note: The symbol “--” indicates that data are not available because students were not surveyed.
Table 6. Past-30-Day Use of Prescription Drugs, Pennsylvania 2009 Female Male 6th 8th 10th 12th Overall % % % % % % %
Pain Relievers 5.3 4.8 1.0 3.6 6.1 8.7 5.0 Tranquilizers 2.0 1.8 0.2 0.8 2.1 4.2 1.9 Stimulants 2.5 3.1 0.2 1.2 3.2 6.0 2.8
Note: The symbol “--” indicates that data are not available because students were not surveyed.


Statewide Report 2009 Pennsylvania Youth Survey - 29 -
Section 4: Other Antisocial Behaviors
Introduction The PAYS also measures a series of seven other problem, or antisocial, behaviors—that is, behaviors that run counter to established norms of good behavior.
■ Attacking Someone with Intent to Harm ■ Getting Suspended
■ Attempting to Steal a Vehicle ■ Selling Drugs
■ Being Arrested ■ Bringing a Weapon (Such as a Gun, Knife or Club) to School
■ Being Drunk or High at School
Measurement As with alcohol, tobacco and other drug use, prevalence tables and graphs are employed to illustrate the percentages of students who reported other antisocial behaviors. For the first six other antisocial behaviors, prevalence rates are presented for the incidence of behavior over the past 12 months. For Bringing a Weapon (Such as a Gun, Knife or Club) to School, prevalence rates are reported for the past 30 days. In addition, frequency data for Bringing a Weapon (Such as a Gun, Knife or Club) to School, illustrating the number of occasions that students reported bringing a weapon to school within the past 30 days, are presented in Appendix A.
Results Summary Overall Results
Other antisocial behavior prevalence rates for the combined sample of 6th, 8th, 10th and 12th graders are presented in Graph 3, and in the overall results column of Table 7. Across all grades, 9.7% of Pennsylvania students reported Being Drunk or High at School in the past year, making it the most prevalent of the seven behaviors in Pennsylvania. Attacking Someone with Intent to Harm is the second most prevalent antisocial behavior, with 9.5% of respondents reporting having attacked someone in the
Section 4 Other Antisocial Behaviors

Statewide Report 2009 Pennsylvania Youth Survey - 30 -
past year. Students in Pennsylvania reported very low levels of participation in the following antisocial behaviors: Being Arrested, Bringing a Weapon to School and Attempting to Steal a Vehicle.
Graph 3. Overall Prevalence of Other Antisocial Behaviors
2%
5%
8%
10%
4%
2%
10%
0% 5% 10% 15% 20%
Bringing a Weapon toSchool
Selling Drugs
Getting Suspended
Being Drunk or High atSchool
Being Arrested
Attempting to Steal aVehicle
Attacking Someone withIntent to Harm
Grade-Level Results Other antisocial behavior prevalence rates within individual grades are presented in Graph 4 and Table 7. In many communities, these behaviors reveal a complex pattern of changes across grades. Typically, reports of Being Drunk or High at School and Selling Drugs follow the ATOD model, with prevalence rates increasing through the upper grade levels. Pennsylvania students follow this pattern. In contrast, reports of Attacking Someone with Intent to Harm, Getting Suspended and Being Arrested often peak in the late middle school or early high school years. While this pattern holds among Pennsylvania students, the drop off in these behaviors among 12th grade students is only modest. Prevalence rates for Attempting to Steal a Vehicle and Bringing a Weapon (Such as a Gun, Knife or Club) to School are generally too low to allow meaningful comparisons across grade levels. Prevention planners in Pennsylvania should review the other antisocial behavior profiles within individual grades, with special attention toward behaviors that show a marked deviation from these patterns.
Graph 4. Prevalence of Selected Other Antisocial Behaviors, by Grade
62 1 1
107
52
11 126
3
11
17
63
0
20
40
Being Drunkor High at
School
BeingArrested
Bringing aWeapon to
School
Perc
enta
ge
6th 8th 10th 12th
Graph 4. Prevalence of Selected Other Antisocial Behaviors, by Grade
0
20
40
6th 8th 10th 12th
Perc
enta
ge
Attacking with Intent to Harm Being Drunk or High at School
Being Arrested Bringing a Weapon to School

Statewide Report 2009 Pennsylvania Youth Survey - 31 -
Gender Differences In contrast to ATOD use, female and male students reported notable differences in the prevalence of most of the other antisocial behaviors. For example, male students are more likely than female students to report Attacking Someone with Intent to Harm (11.8% versus 7.3%, respectively) and Getting Suspended (10.8% versus 5.7%, respectively).
Table 7. Prevalence of Other Antisocial Behaviors, Pennsylvania 2009 Female Male 6th 8th 10th 12th Overall % % % % % % %
Attacking Someone with Intent to Harm 7.3 11.8 5.8 10.3 10.8 10.5 9.5 Attempting to Steal a Vehicle 1.1 2.5 0.5 1.8 2.5 1.8 1.7 Being Arrested 2.9 5.8 0.6 4.6 5.8 5.5 4.3 Being Drunk or High at School 8.7 10.8 1.6 6.9 11.5 17.4 9.7 Getting Suspended 5.7 10.8 3.0 9.1 10.8 9.0 8.2 Selling Drugs 3.3 7.2 0.1 2.3 6.7 10.7 5.2 Bringing a Weapon to School 1.4 3.3 0.9 2.1 2.8 3.2 2.3 Average 4.3 7.4 1.8 5.3 7.3 8.3 5.8
Note: The symbol “--” indicates that data are not available because students were not surveyed.
Item-Level Results Attacking Someone with Intent to Harm
Attacking someone with intent to harm is measured by the question “How many times in the past year (12 months) have you attacked someone with the idea of seriously hurting them?” The question does not ask specifically about the use of a weapon; therefore, occurrences of physical fighting without weapons will be captured with this question.
■ Prevalence rates for Attacking Someone with Intent to Harm range from a low of 5.8% among 6th graders to a high of 10.8% among 10th graders.
■ Overall, 9.5% of Pennsylvania students reported having attacked someone with intent to harm in the past year.
■ Male students are more likely than female students (11.8% male versus 7.3% female) to report Attacking Someone with Intent to Harm in the past year.
Attacking Someone with Intent to Harm
610 11 11 10
0
10
20
30
6 8 10 12 Overall
Perc
enta
ge

Statewide Report 2009 Pennsylvania Youth Survey - 32 -
Attempting to Steal a Vehicle Vehicle theft is measured by the question “How many times in the past year (12 months) have you stolen or tried to steal a motor vehicle such as a car or motorcycle?”
■ Prevalence rates for Attempting to Steal a Vehicle range from a low of 0.5% among 6th graders to a high of 2.5% among 10th graders.
■ Overall, 1.7% of Pennsylvania students reported having attempted to steal a vehicle in the past year.
■ Both female and male students report very low rates for Attempting to Steal a Vehicle.
Being Arrested Any student experience with being arrested is measured by the question “How many times in the past year (12 months) have you been arrested?” Note that the question does not define “arrested.” Rather, it is left to the individual respondent to define. Some youths may define any contact with police as an arrest, while others may consider that only an official arrest justifies a positive answer to this question.
■ Prevalence rates for Being Arrested range from a low of 0.6% among 6th graders to a high of 5.8% among 10th graders.
■ Overall, 4.3% of Pennsylvania students reported having been arrested in the past year.
■ Male students are more likely than female students (5.8% male versus 2.9% female) to report Being Arrested in the past year.
Being Drunk or High at School Having been drunk or high at school is measured by the question “How many times in the past year (12 months) have you been drunk or high at school?”
■ Prevalence rates for Being Drunk or High at School range from a low of 1.6% among 6th graders to a high of 17.4% among 12th graders.
■ Overall, 9.7% of Pennsylvania students reported having been drunk or high at school in the past year.
■ Male students are more likely than female students (10.8% male versus 8.7% female) to report Being Drunk or High at School in the past year.
Being Drunk or High at School
2
712
17
10
0
10
20
30
6 8 10 12 Overall
Perc
enta
geBeing Arrested
15 6 6 4
0
10
20
30
6 8 10 12 Overall
Perc
enta
ge
Attempting to Steal a Vehicle
1 2 3 2 2
0
10
20
30
6 8 10 12 Overall
Perc
enta
ge

Statewide Report 2009 Pennsylvania Youth Survey - 33 -
Getting Suspended Suspension is measured by the question “How many times in the past year (12 months) have you been suspended from school?” Note that the question does not define “suspension.” Rather, it is left to the individual respondent to make that definition. School suspension rates vary substantially from district to district. Therefore, these rates should be interpreted by someone knowledgeable about local school suspension policy.
■ Prevalence rates for Getting Suspended range from a low of 3.0% among 6th graders to a high of 10.8% among 10th graders.
■ Overall, 8.2% of Pennsylvania students reported having been suspended in the past year.
■ Male students are more likely than female students (10.8% male versus 5.7% female) to report Getting Suspended in the past year.
Selling Drugs Selling drugs is measured by the question “How many times in the past year (12 months) have you sold illegal drugs?” Note that the question asks about, but does not define or specify, “illegal drugs.”
■ Prevalence rates for Selling Drugs range from a low of 0.1% among 6th graders to a high of 10.7% among 12th graders.
■ Overall, 5.2% of Pennsylvania students reported having sold drugs in the past year.
■ Male students are more likely than female students (7.2% male versus 3.3% female) to have report Selling Drugs in the past year.
Bringing a Weapon (Such as a Gun, Knife or Club) to School
Bringing a weapon (such as a gun, knife or club) to school is measured by the question “How many times in the past 30 days have you brought a weapon (such as a gun, knife or club) to school?”
■ Prevalence rates for Bringing a Weapon to School range from a low of 0.9% among 6th graders to a high of 3.2% among 12th graders.
■ Overall, 2.3% of Pennsylvania students reported having brought a weapon to school in the past 30 days.
■ Male students are more likely than female students (3.3% male versus 1.4% female) to report Bringing a Weapon to School in the past year.
Bringing a Weapon to School
1 2 3 3 2
0
10
20
30
6 8 10 12 Overall
Perc
enta
ge
Selling Drugs
02
711
5
0
10
20
30
6 8 10 12 OverallPe
rcen
tage
Getting Suspended
3
9 11 9 8
0
10
20
30
6 8 10 12 Overall
Perc
enta
ge


Statewide Report 2009 Pennsylvania Youth Survey - 35 -
Section 5: Special Topics
Introduction The PAYS included questions on the following special topics: age of onset of ATOD use and other antisocial behavior, driving under the influence of alcohol or marijuana, willingness to try or use ATODs, gambling, symptoms of depression, and the frequency of having been threatened or attacked at school.
Age of Onset of ATOD Use and Other Antisocial Behavior Using age-of-initiation data to coordinate the timing of prevention efforts can be an important tool for maximizing program effectiveness. For example, programs delivered after the majority of potential drug users have already initiated the behavior may have limited impact. Alternatively, very early intervention might prove less effective because it is not close enough to the critical initiation period.
Pennsylvania students were asked nine questions about the age at which they first used ATODs and participated in other antisocial behaviors. The topics covered include: trying alcohol (“more than a sip or two”), drinking alcohol regularly (“at least once or twice a month”), smoking cigarettes, smoking marijuana, being suspended from school, being arrested, carrying a handgun, attacking someone with intent to harm, and belonging to a gang. Results for Pennsylvania students are presented in Table 8.
The average age of onset is lower in the earlier grades than it is in the later ones. For example, 6th graders who have tried alcohol report an average age of onset of 10.4 years, while 12th graders report an average age of onset of 14.3 years. This should not be interpreted as indicating that the younger cohort is initiating substance use at an earlier age than the older cohort. Rather, the average age for each cohort increases as its members progress through school and more of them initiate experimentation with ATODs and engage in other antisocial behaviors. For this reason, the question “When do students first start using alcohol?” is best answered by examining the responses of students in the highest grade level surveyed because they can best reflect on their high school and/or middle school experiences and accurately report the age they first started using drugs or engaging in other antisocial behaviors.
As Table 8 shows, 12th grade Pennsylvania students reported the earliest age of onset for ATOD use for smoking cigarettes (13.9 years), followed by trying alcohol (14.3 years), smoking marijuana (14.7 years) and drinking alcohol regularly (15.6 years). Average age of onset among 12th graders for the other antisocial behaviors ranges from 13.2 years for carrying a handgun and attacking someone with
Section 5 Special Topics

Statewide Report 2009 Pennsylvania Youth Survey - 36 -
intent to harm to 14.6 years for being arrested. Not surprisingly, given that age of onset scores only include students who reported drug use or other antisocial behaviors, there were no substantial difference between females and males.
Table 8. Average Age of Onset of ATOD Use and Other Antisocial Behaviors, Pennsylvania 2009
Female Male 6th 8th 10th 12th Overall
Trying Alcohol 13.3 12.8 10.4 11.7 13.2 14.3 13.1
Drinking Alcohol Regularly 14.7 14.6 11.5 12.6 14.2 15.6 14.7
Smoking Cigarettes 13.1 12.9 10.6 11.7 12.9 13.9 13.0
Smoking Marijuana 14.3 13.9 11.8 12.4 13.7 14.7 14.1
Being Suspended from School 12.8 12.2 10.4 11.4 12.6 13.3 12.4
Being Arrested 13.8 13.3 10.4 11.9 13.4 14.6 13.5
Carrying a Handgun 12.0 12.1 10.6 11.5 12.5 13.2 12.1
Attacking Someone with Intent to Harm 12.4 11.9 10.5 11.4 12.3 13.2 12.1
Belonging to a Gang 12.4 12.3 10.6 11.7 13.0 13.4 12.3 Note: The symbol “--” indicates that data are not available because students were not surveyed.
Driving After Alcohol or Marijuana Use Driving a car requires clear thinking and good hand-eye coordination. Operating a vehicle after using alcohol or marijuana may impair driving skills, making the driver a hazard on any roadway. The impact of ATOD usage on automobile safety is assessed with two items: (1) “How often have you driven a car while or shortly after drinking?” and (2) “How often have you driven a car while or shortly after smoking pot?” Results for Pennsylvania students are presented in Table 9.
As expected, given the age requirement for obtaining a driver’s license, these rates increase dramatically once students reach the 12th grade. While only 0.5% of 6th graders, 1.9% of 8th graders and 3.2% of 10th graders reported the operation of a vehicle while under the influence of alcohol, 16.5% of high school seniors reported at least one drinking and driving incident. Results for driving after marijuana use show a similar pattern. Less than 1% of 6th graders, 1.2% of 8th graders and 4.7% of 10th graders report driving under the influence of marijuana, compared to 18.5% of 12th graders. It is important to note that the 12th grade rate for driving under the influence of marijuana is higher than the rate for driving under the influence of alcohol. Male students reported a higher rate than female students for both driving after alcohol use (6.9% versus 4.8%, respectively) and driving after marijuana use (7.9% versus 5.1%, respectively).
Table 9. Percentage of Youth Reporting Any Occasion of Driving Under the Influence, Pennsylvania 2009
Female Male 6th 8th 10th 12th Overall % % % % % % % Driving after Alcohol Use 4.8 6.9 0.5 1.9 3.2 16.5 5.8 Driving after Marijuana Use 5.1 7.9 0.1 1.2 4.7 18.5 6.5
Note: The symbol “--” indicates that data are not available because students were not surveyed.

Statewide Report 2009 Pennsylvania Youth Survey - 37 -
Willingness to Try or Use ATODs Along with perceptions of risk and level of disapproval (Bachman et al., 1988), willingness to try or use ATODs may be viewed as one of the attitudinal constructs that facilitates drug use. Pennsylvania students were questioned regarding their willingness to try or use alcohol, marijuana, cocaine, hallucinogens and inhalants. Results for Pennsylvania students are presented in Table 10.
Interest in alcohol use was by far the highest among the five substances. Overall, 49.6% of Pennsylvania students reported that they “would use it any chance I got,” “would like to try or use it” or “not sure whether or not I would use it.” Respondents reported the second highest willingness to try or use rate for marijuana (21.4%). Willingness to try hallucinogens (7.1%), inhalants (3.7%) and cocaine (3.3%) are substantially lower.
Overall, differences between male and female students’ willingness to try or use ATODs are minimal. The largest difference occurs for alcohol use, where 51.7% of female students reported a willingness to use compared to 47.5% of male students.
Table 10. Percentage of Youth Reporting Willingness to Try Selected ATODs, Pennsylvania 2009 Female Male 6th 8th 10th 12th Overall % % % % % % %
Alcohol 51.7 47.5 17.3 42.7 60.2 72.0 49.6 Marijuana 20.5 22.3 1.6 13.2 28.4 38.4 21.4 Cocaine 3.2 3.5 0.9 2.2 3.8 5.7 3.3 Hallucinogens 6.4 7.8 0.8 2.8 9.2 14.1 7.1 Inhalants 3.7 3.7 1.3 3.2 5.0 4.7 3.7
Note: The percentages reported in this table represent the percentage of students who indicated “would use it any chance I got,” “would like to try it or use it” or “not sure whether or not I would use it.” Students who indicated “probably wouldn’t use it” or “would never use it” were considered to be unwilling to try the substance. The symbol “--” indicates that data are not available because students were not surveyed.
Gambling The 2009 PAYS asks students a series of six questions about their experiences with gambling. These include past-12-month prevalence measures for: gambling for “money or anything of value,” betting “money or anything of value on sporting events,” buying “lottery tickets,” betting “money using the internet,” and betting “money or anything of value on table games like poker or other card games, dice, backgammon, or dominoes.” A question about gambling for “money or anything of value” in the past 30 days is also asked. Results for Pennsylvania students are presented in Table 11.
Please note that two of the six gambling questions—the past-12-months and past-30-days gambling for “money or anything of value” items—are identical to questions used on the 2005 and 2007 surveys. The sports betting, lottery ticket, and table gaming questions are similar to questions that were included in the 2007 survey.
Across the overall sample, 17.5% of Pennsylvania students have “gambled for money or anything of value” in the past year, and 10.0% have done so in the past 30 days. Interestingly, a higher number, 22.5%, reported having “bet money or anything of value” on sporting events in the past year, suggesting that young people interpret the terms “gambled” and “bet” in different ways. Table gaming (poker, cards, dice, etc.) was reported by 16.0%, lottery tickets were purchased by 14.5% and internet betting was reported by only 3.8%.
Gender differences in gambling are substantial. For example, 15.7% of male students reported gambling in the past 30 days, compared to just 4.7% of female students. The category with the smallest gender
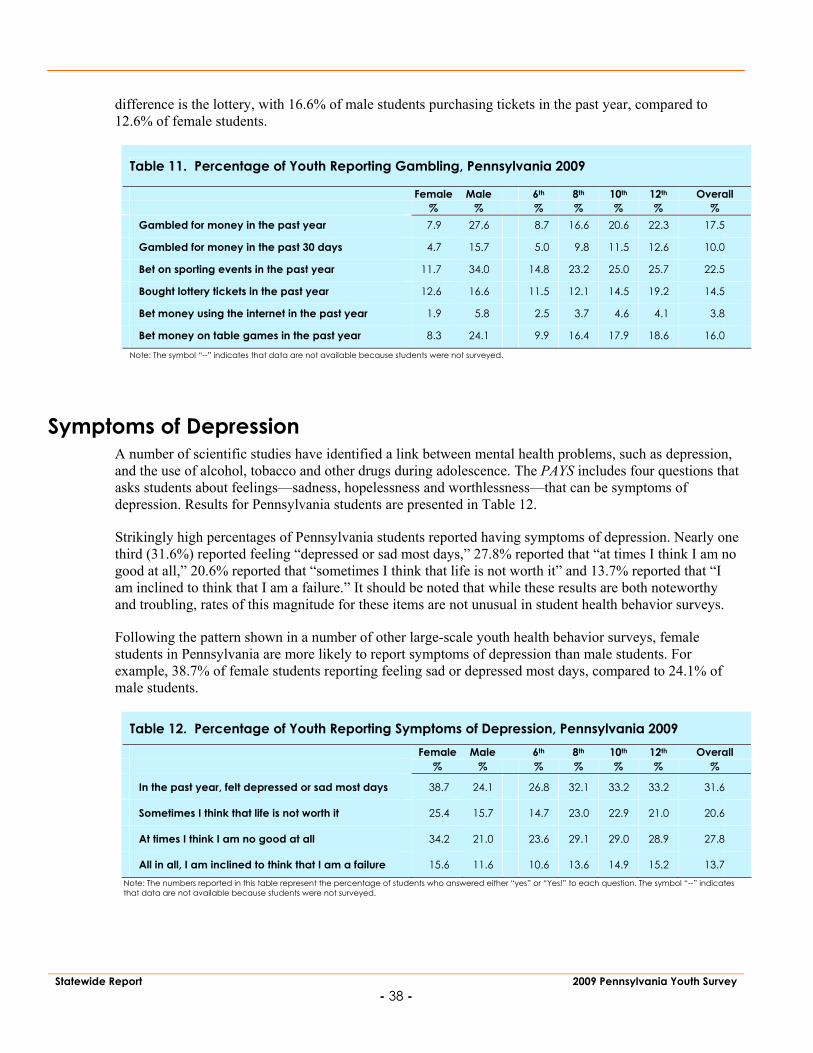
Statewide Report 2009 Pennsylvania Youth Survey - 38 -
difference is the lottery, with 16.6% of male students purchasing tickets in the past year, compared to 12.6% of female students.
Table 11. Percentage of Youth Reporting Gambling, Pennsylvania 2009
Female Male 6th 8th 10th 12th Overall % % % % % % % Gambled for money in the past year 7.9 27.6 8.7 16.6 20.6 22.3 17.5
Gambled for money in the past 30 days 4.7 15.7 5.0 9.8 11.5 12.6 10.0
Bet on sporting events in the past year 11.7 34.0 14.8 23.2 25.0 25.7 22.5
Bought lottery tickets in the past year 12.6 16.6 11.5 12.1 14.5 19.2 14.5
Bet money using the internet in the past year 1.9 5.8 2.5 3.7 4.6 4.1 3.8
Bet money on table games in the past year 8.3 24.1 9.9 16.4 17.9 18.6 16.0
Note: The symbol “--” indicates that data are not available because students were not surveyed.
Symptoms of Depression A number of scientific studies have identified a link between mental health problems, such as depression, and the use of alcohol, tobacco and other drugs during adolescence. The PAYS includes four questions that asks students about feelings—sadness, hopelessness and worthlessness—that can be symptoms of depression. Results for Pennsylvania students are presented in Table 12.
Strikingly high percentages of Pennsylvania students reported having symptoms of depression. Nearly one third (31.6%) reported feeling “depressed or sad most days,” 27.8% reported that “at times I think I am no good at all,” 20.6% reported that “sometimes I think that life is not worth it” and 13.7% reported that “I am inclined to think that I am a failure.” It should be noted that while these results are both noteworthy and troubling, rates of this magnitude for these items are not unusual in student health behavior surveys.
Following the pattern shown in a number of other large-scale youth health behavior surveys, female students in Pennsylvania are more likely to report symptoms of depression than male students. For example, 38.7% of female students reporting feeling sad or depressed most days, compared to 24.1% of male students.
Table 12. Percentage of Youth Reporting Symptoms of Depression, Pennsylvania 2009
Female Male 6th 8th 10th 12th Overall % % % % % % %
In the past year, felt depressed or sad most days 38.7 24.1 26.8 32.1 33.2 33.2 31.6
Sometimes I think that life is not worth it 25.4 15.7 14.7 23.0 22.9 21.0 20.6
At times I think I am no good at all 34.2 21.0 23.6 29.1 29.0 28.9 27.8
All in all, I am inclined to think that I am a failure 15.6 11.6 10.6 13.6 14.9 15.2 13.7 Note: The numbers reported in this table represent the percentage of students who answered either “yes” or “Yes!” to each question. The symbol “--” indicates that data are not available because students were not surveyed.

Statewide Report 2009 Pennsylvania Youth Survey - 39 -
Violence and Drugs on School Property Pennsylvania students were also surveyed regarding the frequency with which they have been threatened or attacked on school property within the past year, and whether they were offered, given, or sold illegal drugs on school property within the past year. Results for Pennsylvania students are presented in Table 13.
Of the four violence-related questions in this group, Pennsylvania students were most likely to report (18.3%) having “been threatened to be hit or beaten up” on school property. The rates for the other three violence items range from 7.2% for being attacked or beaten up to 1.1% for being attacked with a weapon. Slightly more than one in ten students, 12.3%, reported being offered, given, or sold drugs on school property in the past year.
Not surprisingly, differences between male and female students are pronounced on these measures. For example, male students are more likely than female students (22.2% versus 14.7%, respectively) to report having been threatened to be hit or beaten up, and more than twice as likely (9.9% versus 4.5%, respectively) to report having been attacked or beaten up.
Table 13. Percentage of Youth Reporting Violence or Drugs on School Property in the Past Year, Pennsylvania
Female Male 6th 8th 10th 12th Overall % % % % % % %
Threatened to be hit or beaten up 14.7 22.2 16.1 23.6 19.0 14.7 18.3
Attacked or beaten up 4.5 9.9 8.9 8.0 6.2 5.9 7.2
Threatened with a weapon 2.1 3.9 2.5 3.5 3.1 2.7 3.0
Attacked with a weapon 0.6 1.8 0.7 1.2 1.4 1.1 1.1
Been offered, given, or sold an illegal drug 10.7 13.9 1.5 8.2 17.2 20.1 12.3
Note: The symbol “--” indicates that data are not available because students were not surveyed.
Bullying at School and Internet Safety While bullying is not a new phenomenon, the growing awareness that bullying has serious consequences for both schools and students is new. Bullying behavior contributes to lower attendance rates, lower student achievement, low self-esteem and depression, as well as higher rates of both juvenile and adult crime (Banks, 1997). While the problem of bullying is receiving increased public attention, actual incidences of bullying often go undetected by both teachers and parents (Skiba and Fontanini, 2000). Adults often fail to both identify bullying incidences and understand the dynamics of the behavior. Without adequate training, adults may actually endorse the bullying behavior, either by sending children the message that bullying is “part of growing up” or by simply ignoring the behavior (U.S. Department of Education, 1998).
The most effective means of addressing bullying is through comprehensive, school-wide programs (Atlas and Pepler, 1998; Garrity et al., 1997; Skiba and Fontanini, 2000). A student survey is one of the most common methods for identifying a potential bullying problem in a school (Leff, Power, and Goldstein, 2004). Starting in 2009, the PAYS asked students a series of eight questions about bullying at school and internet safety. These include past-12-month prevalence measures for: (1) being “hit, kicked, pushed, shoved around, or locked indoors,” (2) being “called names, made fun of, or teased in a hurtful way,” (3) being “left out of things on purpose by other students,” (4) other students telling lies or spreading false

Statewide Report 2009 Pennsylvania Youth Survey - 40 -
rumors, (5) other students taking money or damaging your things, (6) other students threatening or forcing “you to do things you do not want to do,” (7) other students using “the internet or a cell phone to threaten or embarrass you,” and (8) someone on the internet trying “to get you to talk online about sex, look at sexual pictures, or do something else sexual when you did not want to.” Results for Pennsylvania students are presented in Table 14.
As the survey results show, non-physical forms of bullying are the most prevalent. More than one half of Pennsylvania students (51.4%) reported that other students tell lies about them or spread false rumors, 43.0% have been called names or teased, and 32.5% have been left out of things on purpose. For physical bullying, 18.1% have been hit, kicked, pushed, or shoved in the past year and 20.7% have had other students take their money or damage their things. Cyber bullying is less common, with 12.4% reporting having been sexually harassed on the internet and 10.1% reporting that other students have used “the internet or a cell phone to threaten or embarrass them."
The pattern of gender differences for this items set is interesting. Male students are more likely than female students to report physical forms of bullying. For example, 22.0% of male students reported having been hit, kicked, pushed, or shoved, compared to 14.3% of female students. In contrast, female students are more likely to report non-physical forms of bullying. For example, 36.2% of female students reported having been left out of things on purpose, compared to 28.5% of male students.
Table 14. Percentage of Youth Reporting Bullying at School or Sexual Harassment on the Internet in the Past Year, Pennsylvania 2009
Female Male 6th 8th 10th 12th Overall % % % % % % %
Been hit, kicked, pushed, or shoved around 14.3 22.0 23.2 24.5 16.5 9.5 18.1
Been called names, made fun of, or teased 44.7 41.5 45.5 49.5 43.0 34.9 43.0
Been left out of things on purpose 36.2 28.5 35.6 34.9 31.5 28.7 32.5
Other students telling lies or spreading false rumors 55.0 48.0 50.1 57.2 51.3 47.4 51.4
Other students taking money or damaging your things 19.0 22.4 20.4 23.0 21.2 18.1 20.7
Other students threatening or forcing you to do things 12.2 11.7 13.1 14.3 11.4 9.2 11.9
Other students using the internet or a cell phone to threaten or embarrass you 12.6 7.5 6.7 10.7 11.8 10.7 10.1
Sexual harassment on the internet 15.9 8.8 6.6 12.2 17.0 12.9 12.4
Note: The symbol “--” indicates that data are not available because students were not surveyed.

Statewide Report 2009 Pennsylvania Youth Survey - 41 -
Section 6: Risk and Protective Factors
Introduction Just as eating a high-fat diet is a risk factor for heart disease and getting regular exercise is a protective factor for heart disease and other health problems, there are factors that can help protect youth from, or put them at risk for, drug use and other problem behaviors.
Protective factors, also known as “assets,” are conditions that buffer children and youth from exposure to risk by either reducing the impact of the risks or changing the way that young people respond to risks. Protective factors identified through research include strong bonding to family, school, community and peers. These groups support the development of healthy behaviors for children by setting and communicating healthy beliefs and clear standards for children’s behavior. Young people are more likely to follow the standards for behavior set by these groups if the bonds are strong. Strong bonds are encouraged by providing young people with opportunities to make meaningful contributions, by teaching them the skills they need to be successful in these new opportunities, and by recognizing their contributions.
Risk factors are conditions that increase the likelihood of a young person becoming involved in drug use, delinquency, school dropout and/or violence. For example, children living in families with poor parental monitoring are more likely to become involved in these problems.
Research during the past 30 years supports the view that delinquency; alcohol, tobacco and other drug use; school achievement; and other important outcomes in adolescence are associated with specific characteristics in the student’s community, school and family environments, as well as with characteristics of the individual (Hawkins, Catalano & Miller, 1992). In fact, these characteristics have been shown to be more important in understanding these behaviors than ethnicity, income or family structure (Blum et al., 2000).
There is a substantial amount of research showing that adolescents’ exposure to a greater number of risk factors is associated with more drug use and delinquency. There is also evidence that exposure to a number of protective factors is associated with lower prevalence of these problem behaviors (Bry, McKeon & Pandina, 1982; Newcomb, Maddahian & Skager, 1987; Newcomb & Felix-Ortiz, 1992; Newcomb, 1995; Pollard et al., 1999).
Section 6 Risk and Protective Factors

Statewide Report 2009 Pennsylvania Youth Survey - 42 -
The analysis of risk and protective factors is the most powerful tool available for understanding what promotes both positive and negative adolescent behavior and for helping design successful prevention programs for young people. To promote positive development and prevent problem behavior, it is necessary to address the factors that predict these outcomes. By measuring these risk and protective factors, specific factors that are elevated should be prioritized in the community. This process also helps in selecting targeted tested-effective prevention programming shown to address those elevated factors and consequently provide the greatest likelihood for success.
This system of risk and protective factors is organized into a strategy that families can use to help children develop healthy behaviors—the Social Development Strategy (Hawkins, Catalano & Associates, 1992). The Social Development Strategy is a theoretical framework that organizes risk and protective factors for adolescent problem behavior prevention.
Measurement The Communities That Care Youth Survey, the survey upon which the PAYS was based, provides the most comprehensive measurement of risk and protective factors currently available for 6th to 12th graders. Risk and protective factors are measured by sets of survey items called scales. All together, the PAYS assesses 22 risk factor and nine protective factor scales across four domains: Community Domain, Family Domain, School Domain, and Peer and Individual Domain.
Risk and protective factor scales are scored against the Communities That Care normative database. Like the scoring systems used by many national testing programs—such as the SAT® and ACT™—this method generates percentile scores ranging from 0 to 100. A score of 50, which matches the normative median, indicates that 50% of the respondents in the normative sample reported a score that is lower than the average for Pennsylvania and 50% reported a score that is higher. Similarly, a score of 75 indicates that 75% of the normative sample reported a lower score and 25% reported a higher score. Because risk is associated with negative behavioral outcomes, it is better to have lower risk factor scale scores, not higher. Conversely, because protective factors are associated with better behavioral outcomes, it is better to have higher protective factor scale scores, not lower.
The Communities That Care normative database contains survey responses from over 280,000 students in grades 6 through 12. It compiled by combining the results of selected Communities That Care Youth Survey efforts conducted in 2000, 2001 and 2002. To enhance representativeness, statistical weights were applied to adjust the sample to exactly match the population of U.S. public school students on four key demographic variables: ethnicity, sex, socioeconomic status and urbanicity. Information on the U.S. public school student population was obtained from the Common Core of Data program at the U.S. Department of Education’s National Center for Education Statistics.
The risk and protective factor measurement and scoring model employed in the 2009 PAYS is nearly identical to the 2007 model, with the only difference being that the risk factor scale Laws and Norms Favorable to Handguns is not included in this year’s survey. Please note, however, that a number of changes to the model were introduced in 2007. Please see your 2007 report for a description of these changes. Also note that some school districts elected to administer a secondary version of the PAYS that excluded questions measuring risk and protective factors within the family. In these cases, scale scores for the Family Domain risk and protective factors are not available.
Questionnaire Changes and Risk and Protective Factor Scale Scores As discussed in Section 2 of this report, changes to the PAYS questionnaire—particularly the reordering of the survey items, changes to question layout, and the reordering of some response options sets—has impacted the way students respond to the survey items. These effects are more pronounced for the items that constitute a number of the risk and protective factor scales. The largest effects are for the Community

Statewide Report 2009 Pennsylvania Youth Survey - 43 -
Opportunities for Prosocial Involvement scale, which shows a substantial reduction compared to previous years, and the Community Disorganization scale, which shows a substantial increase. Analysis also indicates that other scales may have been impacted by the questionnaire changes, including School Rewards for Prosocial Involvement, Parental Attitudes Favorable toward Antisocial Behavior, and Low Perceived Risks of Drug Use. These questionnaire design effect should be taken into consideration when reviewing the risk and protective factor results for the 2009 PAYS.
Results Summary Overall Results
Overall risk and protective factor scale scores are presented in Graphs 5 and 6. These results provide a general description of the prevention needs of Pennsylvania 6th, 8th, 10th and 12th graders as a whole.
As Graph 5 shows, overall percentile scores across the nine protective factor scales range from a low of 37 to a high of 58, with an average score of 51, which is one point higher than the normative average of 50. The three lowest overall scores were for the following protective factor scales: Community Opportunities for Prosocial Involvement (37), Religiosity (45) and Family Opportunities for Prosocial Involvement (51). While policies that target any protective factor could potentially be an important resource for students in Pennsylvania, focusing prevention planning in these areas could be especially beneficial. Pennsylvania students reported the four highest overall scores for the following protective factor scales: Belief in the Moral Order (58), School Rewards for Prosocial Involvement (57), Family Attachment (55) and School Opportunities for Prosocial Involvement (55). The higher scores reported by students in these areas represent strengths that Pennsylvania can build on.
As Graph 6 shows, overall scores across the 22 risk factor scales range from a low of 39 to a high of 70, with an average score of 48, which is two points lower than the normative average of 50. The four highest risk factor scales are Community Disorganization (70), Parental Attitudes Favorable toward Antisocial Behavior (57), Perceived Availability of Drugs (53) and Perceived Availability of Handguns (53). Once again, while policies that target any risk factor could potentially be an important resource for students in Pennsylvania, directing prevention programming in these areas is likely to be especially beneficial. The three lowest risk factor scales are Early Initiation of Drug Use (39), Friends’ Use of Drugs (41) and Friends’ Delinquent Behavior (42). The lower scores reported by students in these areas represent strengths that Pennsylvania can build on.

Statewide Report 2009 Pennsylvania Youth Survey - 44 -
Graph 5. Overall Protective Factor Scale Scores
51
58
45
57
55
53
51
55
52
37
0 50 100
Average
Belief in the Moral Order
Religiosity
School Rewards for Prosocial Involvement
School Opportunities for Prosocial Involvement
Family Rewards for Prosocial Involvement
Family Opportunities for Prosocial Involvement
Family Attachment
Community Rewards for Prosocial Involvement
Community Opportunities for Prosocial Involvement
Graph 6. Overall Risk Factor Scale Scores
4844
3951
464647
414243
4843
5747
4452
475353
5247
7045
0 50 100
AverageSensation Seeking
Early Initiation of Drug UseLow Perceived Risks of Drug Use
Favorable Attitudes toward ATOD UseFavorable Attitudes toward Antisocial Behavior
Peer Rewards for Antisocial BehaviorFriends’ Use of Drugs
Friends’ Delinquent BehaviorRebelliousness
Lack of Commitment to SchoolPoor Academic Performance
Parental Attitudes Favorable toward Antisocial BehaviorParental Attitudes Favorable toward ATOD Use
Family History of Antisocial BehaviorFamily Conflict
Poor Family ManagementPerceived Availability of Handguns
Perceived Availability of Drugs Laws and Norms Favorable to Drug Use
Transitions and MobilityCommunity Disorganization
Low Neighborhood Attachment

Statewide Report 2009 Pennsylvania Youth Survey - 45 -
Grade-Level Results While overall scores provide a general picture of the risk and protective factor profile for Pennsylvania, they can mask problems within individual grades. Tables 15 and 16 present individual-grade data for risk and protective factor scale scores. This detailed information provides prevention planners with a snapshot revealing which risk and protective factor scales are of greatest concern by grade. It allows those prevention planners to focus on the most appropriate points in youth development for preventive intervention action—and to target their prevention efforts as precisely as possible.
For example, younger students tend to report different factors than older students as being the most elevated or suppressed. Pennsylvania 6th graders reported their four highest levels of risk for Community Disorganization (72), Perceived Availability of Handguns (59), Parental Attitudes Favorable toward Antisocial Behavior (56) and Perceived Availability of Drugs (54). Pennsylvania 12th graders reported their five highest levels of risk for Community Disorganization (69), Parental Attitudes Favorable toward Antisocial Behavior (61), Low Perceived Risks of Drug Use (57), Laws and Norms Favorable to Drug Use (55) and Peer Rewards for Antisocial Behavior (55).
Table 15. Protective Factor Scale Scores, Pennsylvania 2009 6th 8th 10th 12th Overall
Community Opportunities for Prosocial Involvement 33 38 38 40 37 Community Domain Community Rewards for Prosocial Involvement 50 51 53 52 52
Family Attachment 59 55 54 52 55
Family Opportunities for Prosocial Involvement 54 52 50 50 51 Family Domain
Family Rewards for Prosocial Involvement 56 52 53 51 53
School Opportunities for Prosocial Involvement 58 59 51 53 55 School Domain School Rewards for Prosocial Involvement 58 59 55 54 57
Religiosity 45 45 45 43 45 Peer and Individual Domain Belief in the Moral Order 62 59 57 55 58
Average 53 52 51 50 51

Statewide Report 2009 Pennsylvania Youth Survey - 46 -
Table 16. Risk Factor Scale Scores, Pennsylvania 2009
6th 8th 10th 12th Overall Low Neighborhood Attachment 42 45 47 45 45
Community Disorganization 72 70 69 69 70 Transitions and Mobility 41 49 51 47 47 Laws and Norms Favorable to Drug Use 50 52 52 55 52 Perceived Availability of Drugs 54 56 53 52 53
Community Domain
Perceived Availability of Handguns 59 58 53 47 53
Poor Family Management 44 47 50 48 47
Family Conflict 51 53 50 53 52
Family History of Antisocial Behavior 41 44 43 46 44 Parental Attitudes Favorable toward ATOD Use 45 46 47 49 47
Family Domain
Parental Attitudes Favorable toward Antisocial Behavior 56 54 57 61 57
Poor Academic Performance 42 44 43 44 43 School Domain Lack of Commitment to School 49 46 48 49 48
Rebelliousness 40 45 44 42 43
Friends’ Delinquent Behavior 40 42 43 44 42 Friends’ Use of Drugs 41 42 40 42 41 Peer Rewards for Antisocial Behavior 43 43 47 55 47 Favorable Attitudes toward Antisocial Behavior 46 45 46 48 46 Favorable Attitudes toward ATOD Use 43 46 47 48 46 Low Perceived Risks of Drug Use 45 49 55 57 51 Early Initiation of Drug Use 39 40 38 39 39
Peer and Individual Domain
Sensation Seeking 47 43 43 42 44
Average 47 48 48 49 48
Protective Factors Protective factors are characteristics that are known to decrease the likelihood that a student will engage in problem behaviors. For example, bonding to parents reduces the risk of an adolescent engaging in problem behaviors.
The Social Development Strategy organizes the research on protective factors. Protective factors can buffer young people from risks and promote positive youth development. To develop these healthy positive behaviors, young people must be immersed in environments that consistently communicate healthy beliefs and clear standards for behavior; that foster the development of strong bonds to members of their family, school and community; and that recognize the individual characteristics of each young person.

Statewide Report 2009 Pennsylvania Youth Survey - 47 -
Community Opportunities for Prosocial Involvement When young people become involved in their communities by participating in activities and organizations that foster healthy development, they are more likely to form connections with prosocial peers. Community involvement also provides the opportunity to bond with adult role models—such as neighbors, police, clergy and other community leaders—who can give moral guidance and emotional support. This protective factor is measured by survey items such as “Which of the following activities for people your age are available in your community: Sports teams, Scouting, Boys and girls clubs, 4-H clubs, Service Clubs?”
■ Overall, Pennsylvania students received a percentile score of 37 on the Community Opportunities for Prosocial Involvement scale, 13 points lower than the normative average of 50.
■ Across grade levels, percentile scores for Community Opportunities for Prosocial Involvement range from a low of 33 among 6th graders to a high of 40 among 12th graders.
Community Rewards for Prosocial Involvement Young people experience bonding as feeling valued and being seen as an asset. Students who feel recognized and rewarded by their community are less likely to engage in negative behaviors, because that recognition helps increase a student’s self-esteem and the feeling of bondedness to that community. Community Rewards for Prosocial Involvement is measured by such items as “There are people in my neighborhood who are proud of me when I do something well.”
■ Overall, Pennsylvania students received a percentile score of 52 on the Community Rewards for Prosocial Involvement scale, two points higher than the normative average of 50.
■ Across grade levels, percentile scores for Community Rewards for Prosocial Involvement range from a low of 50 among 6th graders to a high of 53 among 10th graders.
Community Opportunities for Prosocial Involvement
33 38 38 40 37
0
20
40
60
80
100
6 8 10 12 Overall
Community Rewards for Prosocial Involvement
50 51 53 52 52
0
20
40
60
80
100
6 8 10 12 Overall
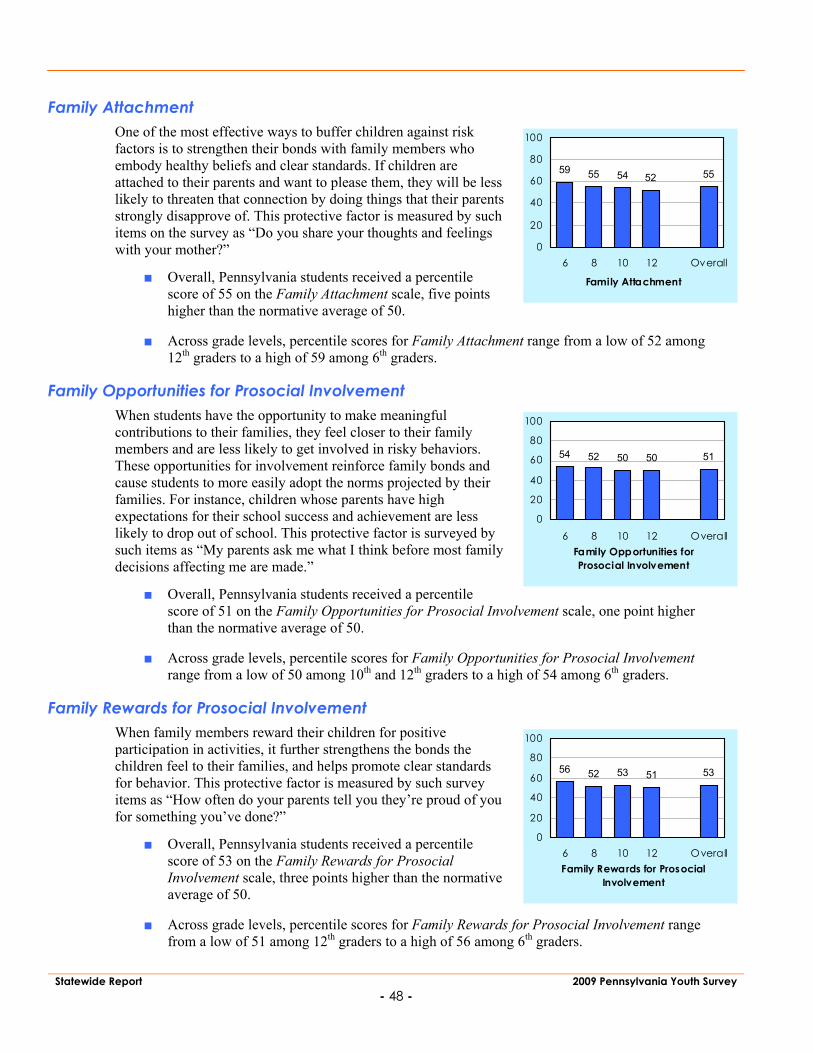
Statewide Report 2009 Pennsylvania Youth Survey - 48 -
Family Attachment One of the most effective ways to buffer children against risk factors is to strengthen their bonds with family members who embody healthy beliefs and clear standards. If children are attached to their parents and want to please them, they will be less likely to threaten that connection by doing things that their parents strongly disapprove of. This protective factor is measured by such items on the survey as “Do you share your thoughts and feelings with your mother?”
■ Overall, Pennsylvania students received a percentile score of 55 on the Family Attachment scale, five points higher than the normative average of 50.
■ Across grade levels, percentile scores for Family Attachment range from a low of 52 among 12th graders to a high of 59 among 6th graders.
Family Opportunities for Prosocial Involvement When students have the opportunity to make meaningful contributions to their families, they feel closer to their family members and are less likely to get involved in risky behaviors. These opportunities for involvement reinforce family bonds and cause students to more easily adopt the norms projected by their families. For instance, children whose parents have high expectations for their school success and achievement are less likely to drop out of school. This protective factor is surveyed by such items as “My parents ask me what I think before most family decisions affecting me are made.”
■ Overall, Pennsylvania students received a percentile score of 51 on the Family Opportunities for Prosocial Involvement scale, one point higher than the normative average of 50.
■ Across grade levels, percentile scores for Family Opportunities for Prosocial Involvement range from a low of 50 among 10th and 12th graders to a high of 54 among 6th graders.
Family Rewards for Prosocial Involvement When family members reward their children for positive participation in activities, it further strengthens the bonds the children feel to their families, and helps promote clear standards for behavior. This protective factor is measured by such survey items as “How often do your parents tell you they’re proud of you for something you’ve done?”
■ Overall, Pennsylvania students received a percentile score of 53 on the Family Rewards for Prosocial Involvement scale, three points higher than the normative average of 50.
■ Across grade levels, percentile scores for Family Rewards for Prosocial Involvement range from a low of 51 among 12th graders to a high of 56 among 6th graders.
Family Attachment
59 55 54 52 55
0
20
40
60
80
100
6 8 10 12 Overall
Family Opportunities for Prosocial Involvement
54 52 50 50 51
0
20
40
60
80
100
6 8 10 12 Overall
Family Rewards for Prosocial Involvement
56 52 53 51 53
0
20
40
60
80
100
6 8 10 12 Overall

Statewide Report 2009 Pennsylvania Youth Survey - 49 -
School Opportunities for Prosocial Involvement Giving students opportunities to participate in important activities at school helps to create a feeling of personal investment in their school. This results in greater bonding and adoption of the school’s standards of behavior, reducing the likelihood that they will become involved in problem behaviors. This protective factor is measured by survey items such as “In my school, students have lots of chances to help decide things like class activities and rules.”
■ Overall, Pennsylvania students received a percentile score of 55 on the School Opportunities for Prosocial Involvement scale, five points higher than the normative average of 50.
■ Across grade levels, percentile scores for School Opportunities for Prosocial Involvement range from a low of 51 among 10th graders to a high of 59 among 8th graders.
School Rewards for Prosocial Involvement Making students feel appreciated and rewarded for their involvement at school further strengthens school bonding, and helps to reduce the likelihood of their involvement in drug use and other problem behaviors. This protective factor is measured by such statements as “The school lets my parents know when I have done something well.”
■ Overall, Pennsylvania students received a percentile score of 57 on the School Rewards for Prosocial Involvement scale, seven points higher than the normative average of 50.
■ Across grade levels, percentile scores for School Rewards for Prosocial Involvement range from a low of 54 among 12th graders to a high of 59 among 8th graders.
Religiosity Religious institutions can help students develop firm prosocial beliefs. Students who have preconceived ideas about certain activities are less vulnerable to becoming involved with antisocial behaviors because they have already adopted a social norm against those activities. Religiosity is measured by the question “How often do you attend religious services or activities?”
■ Overall, Pennsylvania students received a percentile score of 45 on the Religiosity scale, five points lower than the normative average of 50.
■ Across grade levels, percentile scores for Religiosity range from a low of 43 among 12th graders to a high of 45 among 6th, 8th and 10th graders.
School Opportunities for Prosocial Involvement
58 5951 53 55
0
20
40
60
80
100
6 8 10 12 Overall
School Rewards for Prosocial Involvement
58 59 55 54 57
0
20
40
60
80
100
6 8 10 12 Overall
Religiosity
45 45 45 43 45
0
20
40
60
80
100
6 8 10 12 Overall

Statewide Report 2009 Pennsylvania Youth Survey - 50 -
Belief in the Moral Order When people feel bonded to society, they are more motivated to follow society’s standards and expectations. Therefore, it is important for families, schools and communities to have clearly stated policies on ATOD use. Young people who have developed a positive belief system, and a clear sense of right and wrong, are less likely to become involved in problem behaviors. For example, young people who believe that drug use is wrong might be protected against peer influences to use drugs. Belief in the Moral Order is measured by items on the survey such as “It is all right to beat up people if they start the fight.”
■ Overall, Pennsylvania students received a percentile score of 58 on the Belief in the Moral Order scale, eight points higher than the normative average of 50.
■ Across grade levels, percentile scores for Belief in the Moral Order range from a low of 55 among 12th graders to a high of 62 among 6th graders.
Risk Factors Risk factors are characteristics in the community, family, school and individual’s environments that are known to increase the likelihood that a student will engage in one or more problem behaviors. For example, a risk factor in the community environment is the existence of laws and norms favorable to drug use, which can affect the likelihood that a young person will try alcohol, tobacco or other drugs. In those communities where there is acceptance or tolerance of drug use, students are more likely to engage in alcohol, tobacco and other drug use.
Low Neighborhood Attachment Higher rates of drug problems, delinquency and violence occur in communities or neighborhoods where people feel little attachment to the community. Perhaps the most significant issue affecting community attachment is whether residents feel they can make a difference in their own lives. If the key players in the neighborhood—such as merchants, teachers, clergy, police and social services personnel—live outside the neighborhood, residents’ sense of commitment will be lower. This low sense of commitment may be reflected in lower rates of voter participation and parental involvement in schools.
The Low Neighborhood Attachment scale on the survey uses three items to measure the level of attachment that students feel to their neighborhoods. This risk factor is measured by items such as “I’d like to get out of my neighborhood” and “If I had to move, I would miss the neighborhood I now live in.”
■ Overall, Pennsylvania students received a percentile score of 45 on the Low Neighborhood Attachment scale, five points lower than the normative average of 50.
■ Across grade levels, percentile scores for Low Neighborhood Attachment range from a low of 42 among 6th graders to a high of 47 among 10th graders.
Belief in the Moral Order
62 59 57 55 58
0
20
40
60
80
100
6 8 10 12 Overall
Low Neighborhood Attachment
42 45 47 45 45
0
20
40
60
80
100
6 8 10 12 Overall

Statewide Report 2009 Pennsylvania Youth Survey - 51 -
Community Disorganization The Community Disorganization scale pertains to students’ feelings and perceptions regarding their communities and other external attributes. It is based on students’ responses to five items, four of which indicate a neighborhood in disarray (e.g., the existence of graffiti, abandoned buildings, fighting and drug selling). The fifth item is “I feel safe in my neighborhood.”
■ Overall, Pennsylvania students received a percentile score of 70 on the Community Disorganization scale, 20 points higher than the normative average of 50.
■ Across grade levels, percentile scores for Community Disorganization range from a low of 69 among 10th and 12th graders to a high of 72 among 6th graders.
Transitions and Mobility Even normal school transitions are associated with an increase in problem behaviors. When children move from elementary school to middle school or from middle school to high school, significant increases in the rates of drug use, school dropout and antisocial behavior may occur. This is thought to occur because by making a transition to a new environment, students no longer have the bonds they had in their old environment. Consequently, students may be less likely to become attached to their schools and neighborhoods, and do not develop the bonds that protect them from involvement in problem behaviors.
The Transitions and Mobility scale on the survey measures how often the student has changed homes or schools in the past year and since kindergarten. This risk factor is measured with items such as “How many times have you changed schools (including changing from elementary to middle and middle to high school) since kindergarten?” and “How many times have you changed homes since kindergarten?”
■ Overall, Pennsylvania students received a percentile score of 47 on the Transitions and Mobility scale, three points lower than the normative average of 50.
■ Across grade levels, percentile scores for Transitions and Mobility range from a low of 41 among 6th graders to a high of 51 among 10th graders.
Community Disorganization
72 70 69 69 70
0
20
40
60
80
100
6 8 10 12 Overall
Transitions and Mobility
4149 51 47 47
0
20
40
60
80
100
6 8 10 12 Overall

Statewide Report 2009 Pennsylvania Youth Survey - 52 -
Laws and Norms Favorable to Drug Use Students’ perceptions of the rules and regulations concerning alcohol, tobacco and other drug use that exist in their neighborhoods are also associated with problem behaviors in adolescence. Community norms—the attitudes and policies a community holds in relation to drug use and other antisocial behaviors—are communicated in a variety of ways: through laws and written policies, through informal social practices and through the expectations parents and other members of the community have of young people. When laws and community standards are favorable toward drug use, violence and/or other crime, or even when they are just unclear, young people are more likely to engage in negative behaviors (Bracht and Kingsbury, 1990).
An example of conflicting messages about drug use can be found in the acceptance of alcohol use as a social activity within the community. The beer gardens popular at street fairs and community festivals are in contrast to the “Just Say No” messages that schools and parents may be promoting. These conflicting and ambiguous messages are problematic in that they do not have the positive impact on preventing alcohol and other drug use that a clear, consistent, community-level, anti-drug message can have.
This risk factor is measured by six items on the survey, such as “How wrong would most adults in your neighborhood think it was for kids your age to drink alcohol?” and “If a kid smoked marijuana in your neighborhood, would he or she be caught by the police?”
■ Overall, Pennsylvania students received a percentile score of 52 on the Laws and Norms Favorable to Drug Use scale, two points higher than the normative average of 50.
■ Across grade levels, percentile scores for Laws and Norms Favorable to Drug Use range from a low of 50 among 6th graders to a high of 55 among 12th graders.
Perceived Availability of Drugs The perceived availability of drugs, alcohol and handguns in a community is directly related to the prevalence of delinquent behaviors. In schools where children believe that drugs are more available, a higher rate of drug use occurs.
The Perceived Availability of Drugs scale on the survey is designed to assess students’ feelings about how easily they can get alcohol, tobacco and other drugs. Elevation of this risk factor scale may indicate the need to make alcohol, tobacco and other drugs more difficult for students to acquire. For instance, a number of policy changes have been shown to reduce the availability of alcohol and cigarettes. Minimum-age requirements, taxation and responsible beverage service have all been shown to affect the perception of availability of alcohol.
This risk factor is measured by four items on the survey, such as “If you wanted to get some marijuana, how easy would it be for you to get some?”
■ Overall, Pennsylvania students received a percentile score of 53 on the Perceived Availability of Drugs scale, three points higher than the normative average of 50.
Laws and Norms Favorable to Drug Use
50 52 52 55 52
0
20
40
60
80
100
6 8 10 12 Overall
Perceived Availability of Drugs
54 56 53 52 53
0
20
40
60
80
100
6 8 10 12 Overall

Statewide Report 2009 Pennsylvania Youth Survey - 53 -
■ Across grade levels, percentile scores for Perceived Availability of Drugs range from a low of 52 among 12th graders to a high of 56 among 8th graders.
Perceived Availability of Handguns If students believe that it would be difficult to get a handgun, they are less likely to become involved with the unauthorized and unsupervised use of firearms. Perceived Availability of Handguns is measured by the question “If you wanted to get a handgun, how easy would it be for you to get one?”
■ Overall, Pennsylvania students received a percentile score of 53 on the Perceived Availability of Handguns scale, three points higher than the normative average of 50.
■ Across grade levels, percentile scores for Perceived Availability of Handguns range from a low of 47 among 12th graders to a high of 59 among 6th graders.
Poor Family Management The risk factor scale Poor Family Management measures two components of family life: “poor family supervision,” which is defined as parents failing to supervise and monitor their children, and “poor family discipline,” which is defined as parents failing to communicate clear expectations for behavior and giving excessively severe, harsh or inconsistent punishment. Children who experience poor family supervision and poor family discipline are at higher risk of developing problems with drug use, delinquency, violence and school dropout.
Sample items used to survey Poor Family Management include “Would your parents know if you did not come home on time?” and “My family has clear rules about alcohol and drug use.”
■ Overall, Pennsylvania students received a percentile score of 47 on the Poor Family Management scale, three points lower than the normative average of 50.
■ Across grade levels, percentile scores for Poor Family Management range from a low of 44 among 6th graders to a high of 50 among 10th graders.
Poor Family Management
44 47 50 48 47
0
20
40
60
80
100
6 8 10 12 Overall
Perceived Availabil ity of Handguns
59 58 53 47 53
0
20
40
60
80
100
6 8 10 12 Overall

Statewide Report 2009 Pennsylvania Youth Survey - 54 -
Family Conflict Bonding between family members, especially between children and their parents or guardians, is a key component in the development of positive social norms. High levels of family conflict interfere with the development of these bonds, and increase the likelihood that young people will engage in illegal drug use and other forms of delinquent behavior.
Family Conflict is measured by four items on the survey, such as “People in my family often insult or yell at each other.”
■ Overall, Pennsylvania students received a percentile score of 52 on the Family Conflict scale, two points higher than the normative average of 50.
■ Across grade levels, percentile scores for Family Conflict range from a low of 50 among 10th graders to a high of 53 among 8th and 12th graders.
Family History of Antisocial Behavior If children are raised in a family where a history of addiction to alcohol or other drugs exists, the risk of their having alcohol or other drug problems themselves increases. If children are born or raised in a family where criminal activity or behavior is normal, their risk for delinquency increases. Similarly, children who are born to a teenage mother are more likely to become teen parents, and children of dropouts are more likely to drop out of school themselves. Children whose parents engage in violent behavior inside or outside the home are at greater risk for exhibiting violent behavior themselves. Students’ perceptions of their families’ behavior and standards regarding drug use and other antisocial behaviors are measured by the survey. Family History of Antisocial Behavior is assessed by items such as “Has anyone in your family ever had a severe alcohol or drug problem?”
■ Overall, Pennsylvania students received a percentile score of 44 on the Family History of Antisocial Behavior scale, six points lower than the normative average of 50.
■ Across grade levels, percentile scores for Family History of Antisocial Behavior range from a low of 41 among 6th graders to a high of 46 among 12th graders.
Family Confl ict
51 53 50 53 52
0
20
40
60
80
100
6 8 10 12 Overall
Family History of Antisocial Behavior
41 44 43 46 44
0
20
40
60
80
100
6 8 10 12 Overall

Statewide Report 2009 Pennsylvania Youth Survey - 55 -
Parental Attitudes Favorable toward ATOD Use Students’ perceptions of their parents’ opinions about alcohol, tobacco and other drug use are an important risk factor. In families where parents use illegal drugs, are heavy users of alcohol or are tolerant of use by their children, children are more likely to become drug users in adolescence. Parental Attitudes Favorable toward ATOD Use is measured by survey items such as “How wrong do your parents feel it would be for you to smoke marijuana?”
■ Overall, Pennsylvania students received a percentile score of 47 on the Parental Attitudes Favorable toward ATOD Use scale, three points lower than the normative average of 50.
■ Across grade levels, percentile scores for Parental Attitudes Favorable toward ATOD Use range from a low of 45 among 6th graders to a high of 49 among 12th graders.
Parental Attitudes Favorable toward Antisocial Behavior Students’ perceptions of their parents’ opinions about antisocial behavior are also an important risk factor. Parental attitudes and behavior regarding crime and violence influence the attitudes and behavior of children. If parents approve of or excuse their children for breaking the law, then the children are more likely to develop problems with juvenile delinquency. Parental Attitudes Favorable toward Antisocial Behavior is measured by survey items such as “How wrong do your parents feel it would be for you to pick a fight with someone?”
■ Overall, Pennsylvania students received a percentile score of 57 on the Parental Attitudes Favorable toward Antisocial Behavior scale, seven points higher than the normative average of 50.
■ Across grade levels, percentile scores for Parental Attitudes Favorable toward Antisocial Behavior range from a low of 54 among 8th graders to a high of 61 among 12th graders.
Parental Attitudes Favorable toward ATOD Use
45 46 47 49 47
0
20
40
60
80
100
6 8 10 12 Overall
Parental Attitudes Favorable toward Antisocial Behavior
56 54 57 61 57
0
20
40
60
80
100
6 8 10 12 Overall

Statewide Report 2009 Pennsylvania Youth Survey - 56 -
Poor Academic Performance Beginning in the late elementary grades, poor academic performance increases the risk of drug use, delinquency, violence and school dropout. Children fail for many reasons, but it appears that the experience of failure increases the risk of these problem behaviors.
Poor Academic Performance—students’ feelings about their performance at school—is measured with two questions on the survey: “Putting them all together, what were your grades like last year?” and “Are your school grades better than the grades of most students in your class?” Elevated findings for this risk factor scale suggest that students believe that they have lower grades than would be expected, and they perceive they have below-average grades, compared to their peers.
■ Overall, Pennsylvania students received a percentile score of 43 on the Poor Academic Performance scale, seven points lower than the normative average of 50.
■ Across grade levels, percentile scores for Poor Academic Performance range from a low of 42 among 6th graders to a high of 44 among 8th and 12th graders.
Lack of Commitment to School Nine items on the survey assess Lack of Commitment to School—a student’s general feelings about his or her schooling. Survey items include “How important do you think the things you are learning in school are going to be for your later life?” and “Now, thinking back over the past year in school, how often did you enjoy being in school?” Elevated findings for this risk factor scale suggest that students feel less attached to, or connected with, their classes and school environments. Lack of commitment to school means the child has ceased to see the role of student as a positive one. Young people who have lost this commitment to school are at higher risk for a variety of problem behaviors.
■ Overall, Pennsylvania students received a percentile score of 48 on the Lack of Commitment to School scale, two points lower than the normative average of 50.
■ Across grade levels, percentile scores for Lack of Commitment to School range from a low of 46 among 8th graders to a high of 49 among 6th and 12th graders.
Poor Academic Performance
42 44 43 44 43
0
20
40
60
80
100
6 8 10 12 Overall
Lack of Commitment to School
49 46 48 49 48
0
20
40
60
80
100
6 8 10 12 Overall

Statewide Report 2009 Pennsylvania Youth Survey - 57 -
Rebelliousness The survey also assesses the number of young people who feel they are not part of society, who feel they are not bound by rules, and who don’t believe in trying to be successful or responsible. These students are at higher risk of drug use, delinquency and school dropout. Rebelliousness is measured by three items, such as “I ignore the rules that get in my way.”
■ Overall, Pennsylvania students received a percentile score of 43 on the Rebelliousness scale, seven points lower than the normative average of 50.
■ Across grade levels, percentile scores for Rebelliousness range from a low of 40 among 6th graders to a high of 45 among 8th graders.
Friends’ Delinquent Behavior Young people who associate with peers who engage in delinquent behavior are much more likely to engage in delinquent behavior themselves. This is one of the most consistent predictors identified by research. Even when young people come from well-managed families and do not experience other risk factors, spending time with peers who engage in delinquent behavior greatly increases the risk of their becoming involved in delinquent behavior. Friends’ Delinquent Behavior is measured by survey items such as “In the past year, how many of your four best friends have been suspended from school?”
■ Overall, Pennsylvania students received a percentile score of 42 on the Friends’ Delinquent Behavior scale, eight points lower than the normative average of 50.
■ Across grade levels, percentile scores for Friends’ Delinquent Behavior range from a low of 40 among 6th graders to a high of 44 among 12th graders.
Friends’ Use of Drugs Young people who associate with peers who engage in substance use are much more likely to engage in it themselves. This is one of the most consistent predictors identified by research. Even when young people come from well-managed families and do not experience other risk factors, spending time with peers who use drugs greatly increases a youth’s risk of becoming involved in such behavior. Friends’ Use of Drugs is measured by survey items such as “In the past year, how many of your best friends have used marijuana?”
■ Overall, Pennsylvania students received a percentile score of 41 on the Friends’ Use of Drugs scale, nine points lower than the normative average of 50.
■ Across grade levels, percentile scores for Friends’ Use of Drugs range from a low of 40 among 10th graders to a high of 42 among 8th and 12th graders.
Rebell iousness
40 45 44 42 43
0
20
40
60
80
100
6 8 10 12 Overall
Friends’ Delinquent Behavior
40 42 43 44 42
0
20
40
60
80
100
6 8 10 12 Overall
Friends’ Use of Drugs
41 42 40 42 41
0
20
40
60
80
100
6 8 10 12 Overall

Statewide Report 2009 Pennsylvania Youth Survey - 58 -
Peer Rewards for Antisocial Behavior Students’ perceptions of their peer groups’ social norms are also an important predictor of involvement in problem behavior. Any indication that students feel that they get positive feedback from their peers if they use alcohol, tobacco or other drugs, or if they get involved in delinquent behaviors, is important to note and understand. When young people believe that their peer groups are involved in antisocial behaviors, they are more likely to become involved in antisocial behaviors themselves. This risk factor is measured by items such as “What are the chances you would be seen as cool if you smoked marijuana?”
■ Overall, Pennsylvania students received a percentile score of 47 on the Peer Rewards for Antisocial Behavior scale, three points lower than the normative average of 50.
■ Across grade levels, percentile scores for Peer Rewards for Antisocial Behavior range from a low of 43 among 6th and 8th graders to a high of 55 among 12th graders.
Favorable Attitudes toward Antisocial Behavior During the elementary school years, children usually express anticrime and prosocial attitudes and have difficulty imagining why people commit crimes or drop out of school. However, in middle school, as others they know participate in such activities, their attitudes often shift toward greater acceptance of these behaviors. This acceptance places them at higher risk for these antisocial behaviors.
These attitudes are measured on the survey by items like “How wrong do you think it is for someone your age to pick a fight with someone?”
■ Overall, Pennsylvania students received a percentile score of 46 on the Favorable Attitudes toward Antisocial Behavior scale, four points lower than the normative average of 50.
■ Across grade levels, percentile scores for Favorable Attitudes toward Antisocial Behavior range from a low of 45 among 8th graders to a high of 48 among 12th graders.
Peer Rewards for Antisocial Behavior
43 43 4755
47
0
20
40
60
80
100
6 8 10 12 Overall
Favorable Attitudes toward Antisocial Behavior
46 45 46 48 46
0
20
40
60
80
100
6 8 10 12 Overall

Statewide Report 2009 Pennsylvania Youth Survey - 59 -
Favorable Attitudes toward ATOD Use During the elementary school years, children usually express anti-drug attitudes and have difficulty imagining why people use drugs. However, in middle school, as others they know participate in such activities, their attitudes often shift toward greater acceptance of these behaviors. This acceptance places them at higher risk. This risk factor scale, Favorable Attitudes toward ATOD Use, assesses risk by asking young people how wrong they think it is for someone their age to use drugs. Survey items used to measure this risk factor include “How wrong do you think it is for someone your age to drink beer, wine or hard liquor (for example, vodka, whiskey or gin) regularly?” An elevated score for this risk factor scale can indicate that students see little wrong with using drugs.
■ Overall, Pennsylvania students received a percentile score of 46 on the Favorable Attitudes toward ATOD Use scale, four points lower than the normative average of 50.
■ Across grade levels, percentile scores for Favorable Attitudes toward ATOD Use range from a low of 43 among 6th graders to a high of 48 among 12th graders.
Low Perceived Risks of Drug Use The perception of harm from drug use is related to both experimentation and regular use. The less harm that an adolescent perceives as the result of drug use, the more likely it is that he or she will use drugs. Low Perceived Risks of Drug Use is measured with four survey items, such as “How much do you think people risk harming themselves if they try marijuana once or twice?” An elevated score can indicate that students are not aware of, or do not comprehend, the possible harm resulting from drug use.
■ Overall, Pennsylvania students received a percentile score of 51 on the Low Perceived Risks of Drug Use scale, one point higher than the normative average of 50.
■ Across grade levels, percentile scores for Low Perceived Risks of Drug Use range from a low of 45 among 6th graders to a high of 57 among 12th graders.
Favorable Attitudes toward ATOD Use
43 46 47 48 46
0
20
40
60
80
100
6 8 10 12 Overall
Low Perceived Risks of Drug Use
45 49 55 57 51
0
20
40
60
80
100
6 8 10 12 Overall

Statewide Report 2009 Pennsylvania Youth Survey - 60 -
Early Initiation of Drug Use The initiation of alcohol, tobacco or other drug use at an early age is linked to a number of negative outcomes. The earlier that experimentation with drugs begins, the more likely it is that experimentation will become consistent, regular use. Early initiation may lead to the use of a greater range of drugs, as well as other problem behaviors. This scale is measured by survey items that ask when drug use began.
■ Overall, Pennsylvania students received a percentile score of 39 on the Early Initiation of Drug Use scale, 11 points lower than the normative average of 50.
■ Across grade levels, percentile scores for Early Initiation of Drug Use range from a low of 38 among 10th graders to a high of 40 among 8th graders.
Sensation Seeking Constitutional factors are individual characteristics that may have a biological or physiological basis. Constitutional factors that increase risk are often seen as sensation seeking, low harm avoidance and lack of impulse control. They appear to increase the risk of young people using drugs, engaging in delinquent behavior and/or committing violent acts. Sensation Seeking is measured by survey items such as “How many times have you done crazy things even if they are a little dangerous?”
■ Overall, Pennsylvania students received a percentile score of 44 on the Sensation Seeking scale, six points lower than the normative average of 50.
■ Across grade levels, percentile scores for Sensation Seeking range from a low of 42 among 12th graders to a high of 47 among 6th graders.
Early Initiation of Drug Use
39 40 38 39 39
0
20
40
60
80
100
6 8 10 12 Overall
Sensation Seeking
47 43 43 42 44
0
20
40
60
80
100
6 8 10 12 Overall

Statewide Report 2009 Pennsylvania Youth Survey - 61 -
Appendix A: Additional Prevention Planning Data
Introduction The following section presents detailed response data for survey items that may be of particular interest to prevention planners. Some of this information has already been presented earlier in this report in the form of several of the risk factor scale scores (see Section 5). These detailed response data have been provided to help communities form a more complete picture of the attitudes and behaviors held by the youth who were surveyed. It is helpful, however, to view this information within the context of the risk and protective factor framework covered earlier in this report.
Risk of Harm Perception of risk is an important determinant in the decision-making process young people go through when deciding whether or not to use alcohol, tobacco or other drugs (Bachman, Johnston, O’Malley & Humphrey, 1988). Data analysis across a range of Communities That Care Youth Survey communities shows a consistent negative correlation between perception of risk and the level of reported ATOD use. That is, generally when the perceived risk of harm is high, reported frequency of use is low. Evidence also suggests that perceptions of the risks and benefits associated with drug use sometimes serve as a leading indicator of future drug use patterns in a community (Bachman, Johnston, O’Malley & Humphrey, 1986). Table 16 presents prevalence rates for surveyed youth assigning “great risk” of harm to four drug use behaviors: regular use of alcohol (one or two drinks nearly every day), regular use of cigarettes (a pack or more daily), trying marijuana once or twice, and regular use of marijuana. These four survey items form the risk factor scale Low Perceived Risks of Drug Use.
The percentage of Pennsylvania students who assigned “great risk” of harm to smoking one or more packs of cigarettes per day was 66.5%, followed by regular use of marijuana (63.0%), near daily use of alcohol (30.1%) and trying marijuana once or twice (29.0%). Perceptions of harm associated with cigarette use are fairly consistent across grade levels. In contrast, perceptions of harm associated with marijuana use decline as students get older. For example, 83.2% of 6th graders reported a great risk of harm associated with regular marijuana use, compared to 43.2% of 12th graders. Perceptions of harm associated with near daily use of alcohol also declined with grade level, but not as rapidly. Female students are more likely than male students to describe ATOD use as harmful. For example, 70.1% of female students assigned “great risk” of harm to smoking one or more packs of cigarettes per day, compared to 62.6% of male students.
Appendix A Additional Prevention Planning Data

Statewide Report 2009 Pennsylvania Youth Survey - 62 -
Table 16. Percentage of Youth Who Reported Perception of “Great Risk” of Harm, Pennsylvania 2009
Female Male 6th 8th 10th 12th Overall % % % % % % %
Drinking Alcohol Regularly 33.0 27.0 40.3 30.2 25.2 26.2 30.1
Smoking Cigarettes Regularly 70.1 62.6 71.7 67.5 63.0 64.6 66.5
Trying Marijuana Once or Twice 29.7 28.5 46.0 36.1 21.5 15.4 29.0
Smoking Marijuana Regularly 67.7 58.3 83.2 74.5 54.9 43.2 63.0
Note: The symbol “--” indicates that data are not available because students were not surveyed.
Disapproval of Drug Use Personal approval or disapproval is another key attitudinal construct that influences drug use behavior (Bachman et al., 1988). Like risk of harm, disapproval is negatively correlated with the level of reported ATOD use across a range of Communities That Care Youth Survey communities. Personal disapproval was measured by asking surveyed youth how wrong it would be for someone their age to drink alcohol regularly, smoke cigarettes, smoke marijuana, or use other illicit drugs (“LSD, cocaine, amphetamines or another illegal drug”). The rates presented in Table 17 represent the percentages of surveyed youth who thought it would be “wrong” or “very wrong” to use each drug. These four survey items form the risk factor scale Favorable Attitudes toward ATOD Use.
The percentage of Pennsylvania students who disapprove of other illicit drug use was 94.3%, followed by smoking marijuana (79.8%), smoking cigarettes (77.3%) and drinking alcohol regularly (71.6%). While disapproval of other illicit drug use remains above the 90% level for all grades, the other three categories show substantial reductions as students get older. In particular, the percentage of students who disapprove of regular alcohol use declines from a high of 97.2% among 6th graders to a low of 49.2% among 12th graders. Female and male students reported similar rates of disapproval for cigarette, marijuana and other illicit drug use. For marijuana, female students reported a slightly higher rate of disapproval (81.9%) than male students (77.7%).
Table 17. Percentage of Youth Who Indicated Personal Disapproval of Drug Use, Pennsylvania 2009
Female Male 6th 8th 10th 12th Overall % % % % % % %
Drinking Alcohol Regularly 72.4 70.9 97.2 82.5 62.5 49.2 71.6
Smoking Cigarettes 77.9 76.7 97.3 86.7 72.1 56.8 77.3
Smoking Marijuana 81.9 77.7 98.4 89.0 73.1 62.3 79.8
Using Other Illicit Drugs 95.6 92.9 98.7 96.3 92.8 90.3 94.3
Note: The symbol “--” indicates that data are not available because students were not surveyed.
Social Norms In addition to students’ own attitudes, social norms—the written and unwritten rules and expectations about what constitutes desirable behavior—shape drug use choices. Since drug-related attitudes and behaviors are often acquired through peer group interactions, expectations of how one’s peer group might

Statewide Report 2009 Pennsylvania Youth Survey - 63 -
react have an especially strong impact on whether or not young people choose to use drugs. The data presented in Table 18 show the percentage of surveyed youth who said that there is a “pretty good” or “very good” chance that they would be seen as cool if they smoked cigarettes, drank alcohol regularly (once or twice a month) or smoked marijuana. These three survey items form part of the risk factor scale Peer Rewards for Antisocial Behavior.
Relatively few of the Pennsylvania students reported that drug use would be seen as cool. Only 11.4% of students felt that drinking alcohol would be seen as cool, 10.3% felt that smoking marijuana would be seen as cool and 5.1% felt that smoking cigarettes would be seen as cool. Peer approval of all three categories of ATOD use increases as students get older; however, this increase is much more rapid for alcohol and marijuana. For example, peer approval of alcohol use increases steadily from 1.4% among 6th graders to 22.2% among 12th graders. Female and male students reported similar rates of peer approval for alcohol and cigarette use. For marijuana use, approval is higher among male students than among female students (11.8% versus 8.8%, respectively).
Table 18. Percentage of Youth Who Indicated Peer Approval of Drug Use, Pennsylvania 2009 Female Male 6th 8th 10th 12th Overall % % % % % % %
Drinking Alcohol Regularly 11.0 11.8 1.4 6.7 13.5 22.2 11.4
Smoking Cigarettes 5.0 5.3 1.3 4.7 6.8 7.1 5.1
Smoking Marijuana 8.8 11.8 1.1 6.0 13.5 18.6 10.3
Note: The symbol “--” indicates that data are not available because students were not surveyed.
In addition to peer attitudes, social norms toward drug use were measured by asking how most neighborhood adults would view student alcohol, cigarette and marijuana use. Table 19 presents the percentage of surveyed youth who thought other adults would feel it was “wrong” or “very wrong” to use each drug. These three survey items form part of the risk factor scale Laws and Norms Favorable to Drug Use.
Across the overall sample, 86.0% of Pennsylvania students reported that neighborhood adults disapproved of smoking marijuana use, 76.5% reported that neighborhood adults disapprove of smoking cigarettes, and 74.8% reported that neighborhood adults disapprove of drinking alcohol. Younger students are more likely to believe that neighborhood adults disapprove of ATOD use. For example, neighborhood adult disapproval of alcohol use drops from 90.6% among 6th graders to 60.6% among 12th graders. In all three categories female students reported slightly higher rates of neighborhood adult disapproval, but the difference is always less than 3.0 percentage points.
Table 19. Percentage of Youth Who Indicated “Other Adults” Disapprove of Drug Use, Pennsylvania 2009
Female Male 6th 8th 10th 12th Overall % % % % % % %
Drinking Alcohol 76.0 73.5 90.6 80.5 70.1 60.6 74.8
Smoking Cigarettes 77.2 75.6 92.2 83.2 73.7 59.5 76.5
Smoking Marijuana 87.5 84.5 96.2 90.3 83.3 75.9 86.0
Note: The symbol “--” indicates that data are not available because students were not surveyed.

Statewide Report 2009 Pennsylvania Youth Survey - 64 -
Parental Disapproval of Drug Use Parental disapproval was measured by asking surveyed youth “how wrong do your parents feel it would be for you to” drink alcohol regularly, smoke cigarettes, and smoke marijuana. The rates presented in Table 20 represent the percentages of surveyed youth who reported that their parents feel it would be “very wrong” to use each drug. These three survey items form the risk factor scale Parental Attitudes Favorable toward ATOD Use.
Not surprisingly, most Pennsylvania students report that their parents disapprove of ATOD use. Across the overall sample, 85.6% reported that their parents believe smoking marijuana is “very wrong,” followed by 80.6% for smoking cigarettes and 73.5% for drinking alcohol regularly. As with other adult disapproval, the rates drop as students get older. For example, 93.1% of 6th graders reported parental disapproval of regular alcohol use, compared to 54.1%% of 12th graders. In all three categories females reported higher rates of parental disapproval, with the largest difference being 4.6 percentage points for smoking marijuana.
Table 20. Percentage of Youth Who Indicated Parental Disapproval of Drug Use, Pennsylvania 2009
Female Male 6th 8th 10th 12th Overall % % % % % % %
Drink Alcohol Regularly 75.6 71.3 93.1 81.9 68.3 54.1 73.5
Smoke Cigarettes 81.8 79.5 95.1 87.3 77.4 65.4 80.6
Smoke Marijuana 87.9 83.3 97.2 91.2 82.7 73.3 85.6
Note: The symbol “--” indicates that data are not available because students were not surveyed.
Frequency of Drug Use While the prevalence rates presented in Section 2 are useful for determining how many kids are currently using or have experimented with a drug, they give no indication of the frequency or intensity of use. A respondent who reports 1 or 2 occasions of use in the past 30 days is counted the same as one who reports 40 or more occasions of use, even though the level of use is drastically different. Tables 21 to 24 present the past-30-day frequency of use reported by surveyed youth for the following drugs: alcohol, cigarettes, marijuana, and inhalants.

Statewide Report 2009 Pennsylvania Youth Survey - 65 -
Table 21. Past-30-Day Frequency of Alcohol Use, Pennsylvania 2009 Female Male 6th 8th 10th 12th Overall % % % % % % %
0 occasions 73.9 75.2 94.9 82.8 69.5 54.0 74.5
1 or 2 occasions 17.1 15.2 4.4 11.9 19.8 26.6 16.1
3 to 5 occasions 5.2 5.0 0.5 2.9 5.5 10.8 5.1
6 to 9 occasions 2.1 2.3 0.1 1.0 2.7 4.8 2.2
10 to 19 occasions 1.1 1.3 0.1 0.6 1.7 2.4 1.2
20 to 39 occasions 0.3 0.4 0.0 0.3 0.3 0.6 0.3
40 or more occasions 0.3 0.6 0.0 0.5 0.4 0.8 0.5
Note: Rounding on the above table can produce totals that do not equal 100%. The symbol “--” indicates that data are not available because students were not surveyed.
Table 22. Past-30-Day Frequency of Cigarette Use, Pennsylvania 2009 Female Male 6th 8th 10th 12th Overall % % % % % % %
Not at all 89.0 89.0 99.1 93.3 86.1 79.2 89.0
Less than one cigarette per day 4.4 5.0 0.6 3.9 6.1 7.7 4.7
One to five cigarettes per day 3.8 2.9 0.2 2.0 4.8 6.2 3.4
About one-half pack per day 1.7 1.6 0.1 0.3 1.8 4.2 1.7
About one pack per day 0.6 0.9 0.0 0.2 0.6 2.1 0.8
About one and one-half packs per day 0.2 0.2 0.0 0.0 0.4 0.4 0.2
Two packs or more per day 0.1 0.3 0.0 0.2 0.3 0.3 0.2
Note: Rounding on the above table can produce totals that do not equal 100%. The symbol “--” indicates that data are not available because students were not surveyed.
Table 23. Past-30-Day Frequency of Marijuana Use, Pennsylvania 2009 Female Male 6th 8th 10th 12th Overall % % % % % % %
0 occasions 90.1 87.1 99.7 94.6 85.8 76.3 88.6
1 or 2 occasions 4.6 4.3 0.1 2.5 5.7 8.7 4.4
3 to 5 occasions 1.9 1.9 0.0 1.0 2.6 3.6 1.9
6 to 9 occasions 1.0 1.1 0.0 0.6 1.6 1.7 1.0
10 to 19 occasions 0.8 1.6 0.0 0.4 1.6 2.6 1.2
20 to 39 occasions 0.5 1.2 0.0 0.2 0.9 2.3 0.9
40 or more occasions 1.0 2.8 0.0 0.8 1.7 4.8 1.9
Note: Rounding on the above table can produce totals that do not equal 100%. The symbol “--” indicates that data are not available because students were not surveyed.

Statewide Report 2009 Pennsylvania Youth Survey - 66 -
Table 24. Past-30-Day Frequency of Inhalant Use, Pennsylvania 2009 Female Male 6th 8th 10th 12th Overall % % % % % % %
0 occasions 94.0 94.2 93.2 91.8 94.5 96.7 94.1
1 or 2 occasions 4.5 4.3 5.6 6.0 3.7 2.4 4.3
3 to 5 occasions 0.7 0.6 0.6 0.7 0.8 0.6 0.7
6 to 9 occasions 0.4 0.3 0.3 0.6 0.4 0.2 0.4
10 to 19 occasions 0.2 0.2 0.2 0.4 0.2 0.1 0.2
20 to 39 occasions 0.0 0.1 0.0 0.1 0.1 0.1 0.1
40 or more occasions 0.2 0.2 0.1 0.4 0.3 0.1 0.2
Note: Rounding on the above table can produce totals that do not equal 100%. The symbol “--” indicates that data are not available because students were not surveyed.
Frequency of Bringing a Weapon to School Table 25 presents the past-30-day frequency of bringing a weapon (such as a gun, knife or club) to school, reported by surveyed youth.
Table 25. Past-30-Day Frequency of Bringing a Weapon to School, Pennsylvania 2009 Female Male 6th 8th 10th 12th Overall % % % % % % %
Never 98.6 96.7 99.1 97.9 97.2 96.8 97.7
1 or 2 times 0.9 2.1 0.8 1.6 1.5 1.8 1.5
3 to 5 times 0.2 0.5 0.0 0.2 0.4 0.6 0.3
6 to 9 times 0.1 0.1 0.0 0.1 0.2 0.1 0.1
10 to 19 times 0.0 0.1 0.0 0.0 0.1 0.2 0.1
20 to 29 times 0.0 0.1 0.0 0.1 0.0 0.1 0.1
30 to 39 times 0.0 0.0 0.0 0.0 0.0 0.0 0.0
40+ times 0.2 0.4 0.0 0.1 0.6 0.4 0.3
Note: Rounding on the above table can produce totals that do not equal 100%. The symbol “--” indicates that data are not available because students were not surveyed.
Gang Involvement Gangs have long been associated with crime, violence and other antisocial behaviors. Evidence suggests that gangs contribute to antisocial behavior beyond simple association with delinquent peers. Table 26 presents the percentage of surveyed youth indicating gang involvement.
Only 5.7% of Pennsylvania students reported ever belonging to a gang, and 4.8% say they belonged to a gang with a name. The rate of gang involvement is much higher among male students, with 8.1% reporting having belonged to a gang, compared to 3.4% of female students, and 7.1% saying they belonged to a gang with a name, compared to 2.6% for female students.

Statewide Report 2009 Pennsylvania Youth Survey - 67 -
Table 26. Percentage of Youth Who Indicated Gang Involvement, Pennsylvania 2009 Female Male 6th 8th 10th 12th Overall % % % % % % %
Ever Belonged to a Gang 3.4 8.1 4.5 6.2 6.7 5.4 5.7
Belonged to a Gang with a Name 2.6 7.1 3.1 5.4 6.2 4.5 4.8
Note: The symbol “--” indicates that data are not available because students were not surveyed.


Statewide Report 2009 Pennsylvania Youth Survey - 69 -
Appendix B: The 2009 PAYS Questionnaire
Appendix B The 2009 PAYS Questionnaire

Statewide Report 2009 Pennsylvania Youth Survey - 70 -

Statewide Report 2009 Pennsylvania Youth Survey - 71 -

Statewide Report 2009 Pennsylvania Youth Survey - 72 -

Statewide Report 2009 Pennsylvania Youth Survey - 73 -

Statewide Report 2009 Pennsylvania Youth Survey - 74 -

Statewide Report 2009 Pennsylvania Youth Survey - 75 -

Statewide Report 2009 Pennsylvania Youth Survey - 76 -

Statewide Report 2009 Pennsylvania Youth Survey - 77 -

Statewide Report 2009 Pennsylvania Youth Survey - 78 -

Statewide Report 2009 Pennsylvania Youth Survey - 79 -

Statewide Report 2009 Pennsylvania Youth Survey - 80 -

Statewide Report 2009 Pennsylvania Youth Survey - 81 -


Statewide Report 2009 Pennsylvania Youth Survey - 83 -
Appendix C: Risk and Protective Factor Scale Construction Summary
Appendix C Risk and Protective Factor Scale Construction Summary

Statewide Report 2009 Pennsylvania Youth Survey - 84 -
Community Domain Scales RISK FACTORS
Low Neighborhood Attachment
Q109 I’d like to get out of my neighborhood.
Q102 I like my neighborhood.
Q100 If I had to move, I would miss the neighborhood I now live in.
Community Disorganization
Q103a How much do each of the following statements describe your neighborhood: crime and/or drug selling.
Q103b How much do each of the following statements describe your neighborhood: fights.
Q103c How much do each of the following statements describe your neighborhood: lots of empty or abandoned buildings.
Q103d How much do each of the following statements describe your neighborhood: lots of graffiti.
Q107 I feel safe in my neighborhood.
Transitions and Mobility
Q110 Have you changed homes in the past year?
Q104 How many times have you changed homes since kindergarten?
Q106 Have you changed schools (including changing from elementary to middle and middle to high school) in the past year?
CO
MM
UNITY
DO
MA
IN
Q108 How many times have you changed schools since kindergarten?

Statewide Report 2009 Pennsylvania Youth Survey - 85 -
RISK FACTORS, CONTINUED
Laws and Norms Favorable to Drug Use
Q33a How wrong would most adults (over 21) in your neighborhood think it was for kids your age: to use marijuana?
Q33b How wrong would most adults (over 21) in your neighborhood think it was for kids your age: to drink alcohol?
Q33c How wrong would most adults (over 21) in your neighborhood think it was for kids your age: to smoke cigarettes?
Q29 If a kid drank some beer, wine or hard liquor (for example, vodka, whiskey, or gin) in your neighborhood, would he or she be caught by the police?
Q27 If a kid smoked marijuana in your neighborhood, would he or she be caught by the police?
Perceived Availability of Drugs
Q25 If you wanted to get some beer, wine or hard liquor (for example, vodka, whiskey, or gin), how easy would it be for you to get some?
Q26 If you wanted to get some cigarettes, how easy would it be for you to get some?
Q32 If you wanted to get some marijuana, how easy would it be for you to get some?
Q28 If you wanted to get a drug like cocaine, LSD, or amphetamines, how easy would it be for you to get some?
Perceived Availability of Handguns
CO
MM
UNITY
DO
MA
IN
Q30 If you wanted to get a handgun, how easy would it be for you to get one?

Statewide Report 2009 Pennsylvania Youth Survey - 86 -
PROTECTIVE FACTORS
Community Rewards for Prosocial Involvement
Q101 My neighbors notice when I am doing a good job and let me know.
Q111 There are people in my neighborhood who encourage me to do my best.
Q105 There are people in my neighborhood who are proud of me when I do something well.
Community Opportunities for Prosocial Involvement
Q2912 Which of the following activities for people your age are available in your community: sports teams?
Q2913 Which of the following activities for people your age are available in your community: scouting?
Q2914 Which of the following activities for people your age are available in your community: boys and girls clubs?
Q2915 Which of the following activities for people your age are available in your community: 4-H clubs?
Q2916 Which of the following activities for people your age are available in your community: service clubs?
CO
MM
UNITY
DO
MA
IN
Q555 There are lots of adults in my neighborhood I could talk to about something important.

Statewide Report 2009 Pennsylvania Youth Survey - 87 -
Family Domain Scales RISK FACTORS
Poor Family Management
Q78 My parents ask if I’ve gotten my homework done.
Q80 Would your parents know if you did not come home on time?
Q79 When I am not at home, one of my parents knows where I am and whom I am with.
Q76 The rules in my family are clear.
Q83 My family has clear rules about alcohol and drug use.
Q82 If you drank some beer or wine or liquor (for example, vodka, whiskey, or gin) without your parents’ permission, would you be caught by your parents?
Q85 If you skipped school, would you be caught by your parents?
Q84 If you carried a handgun without your parents’ permission, would you be caught by your parents?
Family Conflict
Q2909 People in my family often insult or yell at each other.
Q2911 People in my family have serious arguments.
Q2910 We argue about the same things in my family over and over.
Parental Attitudes Favorable toward Antisocial Behavior
Q74d How wrong do your parents feel it would be for you to: steal anything worth more than $5?
Q74e How wrong do your parents feel it would be for you to: draw graffiti, or write things or draw pictures on buildings or other property (without the owner’s permission)?
FAM
ILY
DOM
AIN
Q74f How wrong do your parents feel it would be for you to: pick a fight with someone?

Statewide Report 2009 Pennsylvania Youth Survey - 88 -
RISK FACTORS, CONTINUED
Parental Attitudes Favorable toward ATOD Use
Q74a How wrong do your parents feel it would be for you to: drink beer, wine or hard liquor (for example, vodka, whiskey or gin) regularly?
Q74b How wrong do your parents feel it would be for you to: smoke cigarettes?
Q74c How wrong do your parents feel it would be for you to: smoke marijuana?
Family History of Antisocial Behavior
Q77 Has anyone in your family ever had a severe alcohol or drug problem?
Q75a Have any of your brothers or sisters ever: drunk beer, wine or hard liquor (for example, vodka, whiskey or gin)?
Q75b Have any of your brothers or sisters ever: smoked marijuana?
Q75c Have any of your brothers or sisters ever: smoked cigarettes?
Q75d Have any of your brothers or sisters ever: taken a handgun to school?
Q75e Have any of your brothers or sisters ever: been suspended or expelled from school?
Q34a About how many adults (over 21) have you known personally who in the past year have: used marijuana, crack, cocaine, or other drugs?
Q34b About how many adults (over 21) have you known personally who in the past year have: sold or dealt drugs?
Q34c About how many adults (over 21) have you known personally who in the past year have: done other things that could get them in trouble with the police, like stealing, selling stolen goods, mugging or assaulting others, etc?
FAM
ILY
DOM
AIN
Q34d About how many adults (over 21) have you known personally who in the past year have: gotten drunk or high?

Statewide Report 2009 Pennsylvania Youth Survey - 89 -
PROTECTIVE FACTORS
Family Attachment
Q87 Do you feel very close to your mother?
Q88 Do you share your thoughts and feelings with your mother?
Q97 Do you feel very close to your father?
Q92 Do you share your thoughts and feelings with your father?
Family Opportunities for Prosocial Involvement
Q99 My parents give me lots of chances to do fun things with them.
Q89 My parents ask me what I think before most family decisions affecting me are made.
Q96 If I had a personal problem, I could ask my mom or dad for help.
Family Rewards for Prosocial Involvement
Q86 My parents notice when I am doing a good job and let me know about it.
Q91 How often do your parents tell you they’re proud of you for something you’ve done?
Q93 Do you enjoy spending time with your mother?
FAM
ILY
DOM
AIN
Q94 Do you enjoy spending time with your father?

Statewide Report 2009 Pennsylvania Youth Survey - 90 -
School Domain Scales RISK FACTORS
Poor Academic Performance
Q13 Putting them all together, what were your grades like last year?
Q23 Are your school grades better than the grades of most students in your class?
Lack of Commitment to School
Q3681 How often do you feel that the schoolwork you are assigned is meaningful and important?
Q3682 How interesting are most of your courses to you?
Q3683 How important do you think the things you are learning in school are going to be for your later life?
Q3684 Now, thinking back over the past year in school, how often did you: Enjoy being in school?
Q3685 Now, thinking back over the past year in school, how often did you: Hate being in school?
Q3686 Now, thinking back over the past year in school, how often did you: Try to do your best work in school?
SCHO
OL
DOM
AIN
Q738 During the LAST FOUR WEEKS, how many whole days have you missed because you skipped or “cut”?

Statewide Report 2009 Pennsylvania Youth Survey - 91 -
PROTECTIVE FACTORS
School Opportunities for Prosocial Involvement
Q14 In my school, students have lots of chances to help decide things like class activities and rules.
Q17 There are lots of chances for students in my school to talk with a teacher one-on-one.
Q2891 Teachers ask me to work on special classroom projects.
Q2057 There are lots of chances for students in my school to get involved in sports, clubs, and other school activities outside of class.
Q3668 I have lots of chances to be part of class discussions or activities.
School Rewards for Prosocial Involvement
Q15 My teacher(s) notices when I am doing a good job and lets me know about it.
Q21 The school lets my parents know when I have done something well.
Q18 I feel safe at my school.
SCHO
OL
DOM
AIN
Q731 My teachers praise me when I work hard in school.

Statewide Report 2009 Pennsylvania Youth Survey - 92 -
Peer and Individual Domain Scales RISK FACTORS
Low Perceived Risks of Drug Use
Q3687 How much do you think people risk harming themselves (physically or in other ways) if they: smoke one or more packs of cigarettes per day?
Q3679 How much do you think people risk harming themselves (physically or in other ways) if they: try marijuana once or twice?
Q3688 How much do you think people risk harming themselves (physically or in other ways) if they: smoke marijuana regularly?
Q3680 How much do you think people risk harming themselves (physically or in other ways) if they: take one or two drinks of an alcoholic beverage (beer, wine, liquor) nearly every day?
Early Initiation of Drug Use
Q60a How old were you when you first: smoked marijuana?
Q60b How old were you when you first: smoked a cigarette, even just a puff?
Q60c How old were you when you first: had more than a sip or two of beer, wine or hard liquor (for example, vodka, whiskey, or gin)?
Q60d How old were you when you first: began drinking alcoholic beverages regularly, that is, at least once or twice a month?
Sensation Seeking
Q57a How many times have you done the following things? Done what feels good no matter what.
Q57b How many times have you done the following things? Done something dangerous because someone dared you to do it.
PEER
AN
D IN
DIVI
DUA
L DO
MA
IN
Q57c How many times have you done the following things? Done crazy things even if they are a little dangerous.

Statewide Report 2009 Pennsylvania Youth Survey - 93 -
RISK FACTORS, CONTINUED
Rebelliousness
Q55 I do the opposite of what people tell me, just to get them mad.
Q62 I ignore rules that get in my way.
Q73 I like to see how much I can get away with.
Friends’ Delinquent Behavior
Q65a Think of your four best friends (the friends you feel closest to). In the past year (12 months), how many of your best friends have been suspended from school?
Q65b Think of your four best friends (the friends you feel closest to). In the past year (12 months), how many of your best friends have carried a handgun?
Q65c Think of your four best friends (the friends you feel closest to). In the past year (12 months), how many of your best friends have sold illegal drugs?
Q65d Think of your four best friends (the friends you feel closest to). In the past year (12 months), how many of your best friends have stolen or tried to steal a motor vehicle such as a car or motorcycle?
Q65e Think of your four best friends (the friends you feel closest to). In the past year (12 months), how many of your best friends have been arrested?
PEER
AN
D IN
DIVI
DUA
L DO
MA
IN
Q65f Think of your four best friends (the friends you feel closest to). In the past year (12 months), how many of your best friends have dropped out of school?

Statewide Report 2009 Pennsylvania Youth Survey - 94 -
RISK FACTORS, CONTINUED
Friends’ Use of Drugs
Q58a Think of your four best friends (the friends you feel closest to). In the past year (12 months), how many of your best friends have smoked cigarettes?
Q58b Think of your four best friends (the friends you feel closest to). In the past year (12 months), how many of your best friends have tried beer, wine or hard liquor (for example, vodka, whiskey or gin) when their parents didn’t know about it?
Q58c Think of your four best friends (the friends you feel closest to). In the past year (12 months), how many of your best friends have used marijuana?
Q58d Think of your four best friends (the friends you feel closest to). In the past year (12 months), how many of your best friends have used LSD, cocaine, amphetamines, or other illegal drugs?
Peer Rewards for Antisocial Behavior
Q59a What are the chances you would be seen as cool if you smoked cigarettes?
Q59b What are the chances you would be seen as cool if you began drinking alcoholic beverages regularly, that is, at least once or twice a month?
Q59c What are the chances you would be seen as cool if you smoked marijuana?
PEER
AN
D IN
DIVI
DUA
L DO
MA
IN
Q59d What are the chances you would be seen as cool if you carried a handgun?

Statewide Report 2009 Pennsylvania Youth Survey - 95 -
RISK FACTORS, CONTINUED
Favorable Attitudes toward Antisocial Behavior
Q61a How wrong do you think it is for someone your age to take a handgun to school?
Q61b How wrong do you think it is for someone your age to steal anything worth more than $5?
Q61c How wrong do you think it is for someone your age to pick a fight with someone?
Q61d How wrong do you think it is for someone your age to attack someone with the idea of seriously hurting him or her?
Q61e How wrong do you think it is for someone your age to stay away from school all day when their parents think they are at school?
Favorable Attitudes toward ATOD Use
Q67a How wrong do you think it is for someone your age to drink beer, wine or hard liquor (for example, vodka, whiskey or gin) regularly?
Q67b How wrong do you think it is for someone your age to smoke cigarettes?
Q67c How wrong do you think it is for someone your age to smoke marijuana?
PEER
AN
D IN
DIVI
DUA
L DO
MA
IN
Q67d How wrong do you think it is for someone your age to use LSD, cocaine, amphetamines or another illegal drug?

Statewide Report 2009 Pennsylvania Youth Survey - 96 -
PROTECTIVE FACTORS
Religiosity
Q54 How often do you attend religious services or activities?
Belief in the Moral Order
Q56 I think it is okay to take something without asking, if you can get away with it.
Q72 I think sometimes it’s okay to cheat at school.
Q63 It is all right to beat up people if they start the fight.
PEER
AN
D IN
DIVI
DUA
L DO
MA
IN
Q64 It is important to be honest with your parents, even if they become upset or you get punished.

Statewide Report 2009 Pennsylvania Youth Survey - 97 -
Appendix D: Other Resources
Web Sites Office of National Drug Control Policy www.whitehousedrugpolicy.gov
National Clearinghouse for Alcohol and Drug Information www.ncadi.samhsa.gov
Substance Abuse and Mental Health Services Administration (SAMHSA) www.samhsa.gov
Monitoring the Future www.monitoringthefuture.org
National Institute on Drug Abuse (NIDA) www.nida.nih.gov and www.drugabuse.gov
National Institute on Alcohol Abuse and Alcoholism (NIAAA) www.niaaa.nih.gov
Social Development Research Group www.uwsrd.org/sdrg
Prevention Program Guides Center for Substance Abuse Prevention, Western Center for the Application of Prevention Technologies. (2004). Building a successful prevention program: list of all practices. [Data file]. Available at the University of Nevada Reno’s Web site, www.casat.unr.edu/bestpractices/alpha-list.php.
Center for the Study and Prevention of Violence, Institute of Behavioral Science. (2004). Blueprints for Violence Prevention. [Data file]. Available from the University of Colorado Boulder’s Web site, www.colorado.edu/cspv/blueprints.
Hawkins, J. D., & Catalano, R. F. (2004). Communities That Care Prevention Strategies Guide. [Data file]. Available from the SAMHSA Web site, www.preventionplatform.samhsa.gov.
U.S. Department of Health and Human Services, Substance Abuse and Mental Health Services Administration (SAMHSA). (2004). Model Programs list. [Data file]. Available from the SAMHSA Web site, www.nrepp.samhsa.gov.
Prevention Planning Hawkins, J. D., Catalano, R. F., & Associates. (1992). Communities that care: Action for drug abuse prevention (1st ed.). San Francisco: Jossey-Bass.
Appendix D Other Resources


Statewide Report 2009 Pennsylvania Youth Survey - 99 -
References Atlas, R. & Pepler D. (1998). Observations of bullying in the classroom. Journal of Educational Research, 92, 86-99.
Arthur, M. W., Hawkins, J. D., Pollard, J. A., Catalano, R. F., & Baglioni, A. J. (2002). Measuring risk and protective factors for substance use, delinquency, and other adolescent problem behaviors: The communities that care youth survey. Evaluation Review, 26, 575-601.
Bachman, J., Johnston, L., O’Malley, P., & Humphrey, R. (1986). Changes in marijuana use linked to changes in perceived risks and disapproval (Monitoring the Future Occasional Paper 19). Ann Arbor, MI: Institute for Social Research.
Bachman, J., Johnston, L., O’Malley, P., & Humphrey, R. (1988). Explaining the recent decline in marijuana use: Differentiating the effects of perceived risks, disapproval, and general lifestyle factors. Journal of Health and Social Behavior, 29, 92-112.
Banks, R. (1997). Bullying in schools. ERIC Digest [Online]. Available: www.ericdigests.org/1997-4/bullying.htm.
Blum, R. W., Beuhring, T., Shew, M. L., Bearinger, L. H., Sieving, R. E., & Resnick, M. D. (2000). The effects of race/ethnicity, income, and family structure on adolescent risk behaviors. American Journal of Public Health, 90, 1879-1884.
Bracht, N. & Kingsbury, L. (1990). Community organization principles in health promotion: A five-state model. In N. Bracht (Ed.), Health promotion at the community level (pp. 66-88). Beverly Hills, CA: Sage.
Bry, B. H., McKeon, P., & Pandina, R. J. (1982). Extent of drug use as a function of number of risk factors. Journal of Abnormal Psychology, 91, 273-279.
Everett, S. A., Ph.D., M.P.H., Giovino, G. A., Ph.D., Warren, C. W., Ph.D., Crossett, L., R.D.H., & Kann, L., Ph.D. (1998). Other substance use among high school students who use tobacco. Journal of Adolescent Health, 23, 289-296.
Garrity, C., Jens, K., Porter, W. W., Sager, N., & Short-Camilli, C. (1997). Bullyproofing your school: Creating a positive climate. Intervention in School and Clinic, 32, 235-243.
Glaser, R. R., Van Horn, M. L., Arthur, M. W., Hawkins, J. D., & Catalano, R. F. (2005). Measurement properties of the communities that care youth survey across demographic groups. Journal of Quantitative Criminology, 21, 73-102.
Hawkins, J. D., Catalano, R. F., & Associates. (1992). Communities that care: Action for drug abuse prevention (1st ed.). San Francisco: Jossey-Bass.
Hawkins, J. D., Catalano, R. F., & Miller, J. Y. (1992). Risk and protective factors for alcohol and other drug problems in adolescence and early adulthood: Implications for substance abuse prevention. Psychological Bulletin, 112, 64-105.
Johnston, L. D., O’Malley, P. M., Bachman, J. G., & Schulenberg, J. E. (2009a). Monitoring the Future national survey results on drug use, 1975-2008. Volume I: Secondary school students (NIH Publication No. 07-7402). Bethesda, MD: National Institute on Drug Abuse.
References

Statewide Report 2009 Pennsylvania Youth Survey - 100 -
Johnston, L. D., O'Malley, P. M., Bachman, J. G., & Schulenberg, J. E. (2009b). Teen marijuana use tilts up, while some drugs decline in use. University of Michigan News Service: Ann Arbor, MI. Retrieved 1/15/2010 from http://www.monitoringthefuture.org.
Leff, S. S, Power, T. J., & Goldstein, A. B. (2004). Outcome measures to assess the effectiveness of bullying-prevention programs in the schools. In D. L. Espelage & S. M. Swearer (Eds.) Bullying in American schools: A social-ecological perspective on prevention and intervention (pp. 269-294). Mahwah, NJ: Erlbaum.
Newcomb, M. D. (1995). Identifying high-risk youth: Prevalence and patterns of adolescent drug abuse. In E. Rahdert & D. Czechowicz (Eds.), Adolescent drug abuse: Clinical assessment and therapeutic interventions (NIDA Research Monograph, 156). Washington, DC: U.S. Department of Health and Human Services.
Newcomb, M. D. & Felix-Ortiz, M. (1992). Multiple protective and risk factors for drug use and abuse: Cross-sectional and prospective findings. Journal of Personality and Social Psychology, 51, 564-577.
Newcomb, M. D., Maddahian, E., & Skager, R. (1987). Substance abuse and psychosocial risk factors among teenagers: Associations with sex, age, ethnicity, and type of school. American Journal of Drug and Alcohol Abuse, 13, 413-433.
Pollard, J. A., Hawkins, J. D., & Arthur, M. W. (1999). Risk and protection: Are both necessary to understand diverse behavioral outcomes in adolescence? Social Work Research, 23, 145-158.
Skiba, R. & Fontanini, A. (2000). Bullying prevention: What works in preventing school violence. Safe and Responsive Schools Project Fact Sheet Series, Indiana Education Policy Center [Online]. Available: www.indiana.edu/~safeschl/SrsBullying.pdf.
Substance Abuse and Mental Health Services Administration. (2003). Results from the 2002 National Survey on Drug Use and Health: National Findings (Office of Applied Studies, NHSDA Series H-22, DHHS Publication No. SMA 03-3836). Rockville, MD.
U. S. Department of Education. (1998). Preventing bullying: A manual for schools and communities. [Online]. Available: www.eric.ed.gov/ERICDocs/data/ericdocs2sql/content_storage_01/0000019b/80/17/14/d5.pdf.
U.S. Department of Education, National Center for Education Statistics. (2004). The Common Core of Data (CCD). [Data file]. Available from National Center for Education Statistics Web site, http://nces.ed.gov/ccd.