2009 wei qiang, and david p. weliky membrane cholesterol
TRANSCRIPT

Subscriber access provided by MICHIGAN STATE UNIVERSITY | MSU LIBRARIES
Biochemistry is published by the American Chemical Society. 1155 SixteenthStreet N.W., Washington, DC 20036
Article
HIV Fusion Peptide and Its Cross-Linked Oligomers:Efficient Syntheses, Significance of the Trimer in Fusion
Activity, Correlation of # Strand Conformation withMembrane Cholesterol, and Proximity to Lipid Headgroups
†
Wei Qiang, and David P. WelikyBiochemistry, 2009, 48 (2), 289-301• DOI: 10.1021/bi8015668 • Publication Date (Web): 18 December 2008
Downloaded from http://pubs.acs.org on February 12, 2009
More About This Article
Additional resources and features associated with this article are available within the HTML version:
• Supporting Information• Access to high resolution figures• Links to articles and content related to this article• Copyright permission to reproduce figures and/or text from this article

HIV Fusion Peptide and Its Cross-Linked Oligomers: Efficient Syntheses,Significance of the Trimer in Fusion Activity, Correlation of � Strand Conformation
with Membrane Cholesterol, and Proximity to Lipid Headgroups†
Wei Qiang and David P. Weliky*
Department of Chemistry, Michigan State UniVersity, East Lansing, Michigan 48824
ReceiVed August 19, 2008; ReVised Manuscript ReceiVed NoVember 12, 2008
ABSTRACT: For enveloped viruses such as HIV, an ∼20-residue N-terminal fusion peptide domain in theenvelope protein binds to target cell membranes and plays a key role in fusion between the viral andcellular membranes during infection. The chemically synthesized HIV fusion peptide (HFP) catalyzesfusion between membrane vesicles and is a useful model system for understanding some aspects of HIVfusion. Previous studies have shown a common trimeric state for the envelope protein from several differentviruses, including HIV, and in this study, practical high-yield syntheses are reported for HFP monomer(HFPmn) and chemically cross-linked HFP dimer (HFPdm), trimer (HFPtr), and tetramer (HFPte). Thevesicle fusion rates per strand were ordered as follows: HFPmn < HFPdm < HFPtr ≈ HFPte. Thissuggested that HFPtr is the smallest catalytically efficient oligomer. Solid-state NMR measurements of13CO chemical shifts were carried out in constructs labeled at either Ala-6 or Ala-15. For all constructsassociated with cholesterol-containing membranes, the chemical shifts of both residues correlated with �strand conformation while association with membranes without cholesterol resulted in a mixture of helicaland � strand conformations. The dependence of fusion rate on oligomer size is independent of membranecholesterol content, so one interpretation of the data is fusion activity of both helical and � strandconformations. Membrane location may be a determinant of fusion activity, and for all constructs in bothconformations, a large fraction of the Ala-15 13CO groups were 5-6 Å from the 31P atoms in the lipidheadgroups, while the Ala-6 13CO groups were more distant.
Infection by the human immunodeficiency virus (HIV)1
begins with fusion between the viral and host cell membranesand leads to deposition of the viral nucleocapsid in thecytoplasm and viral replication (1, 2). The fusion process is
mediated by the HIV gp41 fusion protein which contains aregion inside HIV as well as a single-pass transmembranedomain. The ∼170-residue ectodomain of gp41 lies outsideHIV and is subdivided into a more C-terminal “solubleectodomain” and an ∼20-residue N-terminal fusion pep-tide (HFP) which is hydrophobic and fairly conserved.Peptides with the HFP sequence catalyze fusion betweenmembrane vesicles, and there is good correlation betweenthe mutation/fusion activity relationships of HFP-inducedvesicle fusion and gp41-induced membrane fusion (3-8).These data suggest that studies of HFP will provide informa-tion about HIV-target cell fusion.
High-resolution structural studies have been carried outon the soluble ectodomain of gp41 which begins ∼10residues C-terminal of the HFP. These structures revealedtrimeric oligomerization with the three N-termini in theproximity of each other (1, 2, 9-11). Trimeric oligomer-ization has also been observed in structures of fusion proteinsfrom other “class I” enveloped viruses, including influenzavirus (1, 2). These results have motivated study of oligomericviral fusion peptides, including a HFP construct formed bycross-linking three HFPs at their C-termini to form a cross-linked HFP trimer (HFPtr) (12-14). The HFPtr constructinduced vesicle fusion with a rate that was up to 40 timeshigher than the rate induced by non-cross-linked HFPmonomer (HFPmn) (13). The rates were compared at aconstant peptide strand:lipid molar ratio, i.e., 3 times less
† This work was supported by NIH Grant AI47153 to D.P.W.* To whom correspondence should be addressed: Department of
Chemistry, Michigan State University, East Lansing, MI 48824. E-mail:[email protected]. Phone: (517) 355-9715. Fax: (517) 353-1793.
1 Abbreviations: au, arbitrary units; d, dipolar coupling; DCM,dichloromethane; DIPEA, N,N-diisopropylethylamine; DMAP, 4-(di-methylamino)pyridine; DMF, N,N-dimethylformamide; DMPC, 1,2-dimyristoyl-sn-glycero-3-phosphocholine; [13C]DPPC, 1,2-dipalmitoyl-[1-13C]-sn-glycero-3-phosphocholine; DTPC, 1,2-di-O-tetradecyl-sn-glycero-3-phosphocholine; DTPG, 1,2-di-O-tetradecyl-sn-glycero-3-[phospho-rac-(1-glycerol)]; Fmoc, 9-fluorenylmethoxycarbonyl; HBTU,O-benzotriazole-N,N,N′,N′-tetramethyluronium hexafluorophosphate;HEPES, N-(2-hydroxyethyl)piperazine-N′-2-ethanesulfonic acid; HFP,HIV fusion peptide; HFPdm, HFP dimer; HFPmn, HFP monomer;HFPte, HFP tetramer; HFPtr, HFP trimer; HIV, human immunodefi-ciency virus; HMB, N-2-hydroxy-4-methoxybenzyl; HOBT, 1-hydroxy-benzotriazole; HPLC, high-performance liquid chromatography; LUVs,large unilamellar vesicles; MALDI-TOF, matrix-assisted laser desorp-tion ionization time of-flight; MAS, magic angle spinning; NMR,nuclear magnetic resonance; N-NBD-PE, N-(7-nitro-2,1,3-benzoxadia-zol-4-yl)phosphatidylethanolamine; N-Rh-PE, N-(lissamine rhodamineB sulfonyl)phosphatidylethanolamine; POPC, 1-palmitoyl-2-oleoyl-sn-glycero-3-phosphocholine; POPG, 1-palmitoyl-2-oleoyl-sn-glycero-3-[phospho-rac-(1-glycerol)]; PyAOP, 7-azabenzotriazol-1-yloxy tris(pyr-rolidino)phosphonium hexafluorophosphate; REDOR, rotational-echodouble-resonance; TFA, trifluoroacetic acid; TPPM, two-pulse phasemodulation.
Biochemistry 2009, 48, 289–301 289
10.1021/bi8015668 CCC: $40.75 2009 American Chemical SocietyPublished on Web 12/18/2008

HFPtr than HFPmn, and suggested that the oligomerictopology enforced by C-terminal cross-linking is functionallyimportant. The following questions remain. (1) Does thefusion rate per strand continue to increase for oligomerslarger than the trimer? (2) Is there a structural basis for theincreased fusion rate of cross-linked oligomers? This paperreports progress in answering both questions.
One experimental challenge in the study of cross-linkedHFP oligomers has been production of large quantities ofpure material. One synthetic route to HFPtr was cross-linkingbetween HFPmn with one non-native C-terminal cysteineand HFPmn with two non-native C-terminal cysteines, butthe major product was the HFP dimer (HFPdm) formed fromcross-linking between the HFPmn with one cysteine (12).An alternative approach was initial formation of a peptidescaffold with three lysines and amide bonds between theε-NH2 group of the first lysine and the COOH group of thesecond lysine and between the ε-NH2 group of the secondlysine and the COOH group of the third lysine (13). HFPtrwas then synthesized using standard 9-fluorenylmethoxy-carbonyl (Fmoc) chemistry and synchronous growth of thepeptide chains from the three main chain R-NH2 groups. Thisapproach was therefore direct synthesis of an ∼90-mer, andthe consequent yield was at best 5%. In addition, the finalproduct contained significant impurity HFPtr which wasnonseparable and which contained one additional lysine inone of the chains. This impurity was a consequence ofundesired intramolecular removal of the Fmoc protectinggroup on a Lys R-NH2 group by a free ε-NH2 group (15).
This paper provides greatly improved approaches tosyntheses of HFPmn, HFPdm, and HFPtr and a synthesis ofthe new HFP tetramer (HFPte). The residues in HFPmn andHFPdm which couple poorly to subsequent residues areidentified, and conditions for improving yields are described.A much purer and higher yielding HFPtr synthesis ispresented on the basis of cross-linking HFPmn and HFPdmwhich each contain a single cysteine. The paper alsodescribes efficient chromatographic separation of HFPmn,HFPdm, HFPtr, and HFPte and quantitative comparison ofthe rates of vesicle fusion induced by the four constructs.
A separate section of the paper describes comparativesolid-state nuclear magnetic resonance (NMR) structuralstudies of membrane-associated HFPmn, HFPdm, and HFPtr.In particular, the local conformations at the Ala-6 and Ala-15 residues were probed as well as the proximity of theseresidues to the lipid headgroups. These studies were moti-vated in part by hypotheses that the conformation andmembrane location of HFP are significant structural factorswhich impact fusion catalysis and which might thereforeexplain the increased fusion rates of cross-linked HFPoligomers (4, 16).
The HFP structural literature is complex and includesliquid-state NMR studies in detergent micelles. For HFP:detergent molar ratios of e0.01, there is agreement that theresidues between Ile-4 and Leu-12 form an uninterrupted Rhelix, and one study reports that the helix extends toMet-19 (17-21). A variety of biophysical techniques havebeen used to study the conformation of HFPmn associatedwith membranes (5, 22). Infrared spectra suggested that fora HFPmn:lipid ratio of 0.005 in membranes without cho-lesterol, a significant HFPmn fraction adopted helical struc-ture while nonhelical structure was favored at higher ratios
(23). In addition, helical structure was favored with nega-tively charged lipids, while � strand structure was preferredwith neutral lipids or with negatively charged lipids withbound Ca2+ (4, 16). For membranes which have the ap-proximate lipid headgroup and cholesterol composition ofhost cells of HIV, solid-state NMR studies have shown thatHFPmn adopts an uninterrupted � strand conformation fromVal-2 to Gly-16 with more disordered structure at Ala-21(24). Small � sheet aggregates of HFPmn are formed underthese conditions with predominant antiparallel alignment ofadjacent peptides and adjacent strand crossing near Phe-8and Leu-9. For this arrangement, most of the apolar 16-residue N-terminal region of HFPmn will form interpeptidehydrogen bonds which is biophysically reasonable becausethese residues are likely located in the membrane interiorwhere there is little water available for hydrogen bonding.There is much less information about the structure of HFPdmand HFPtr. In membranes without cholesterol, predominanthelical conformation was observed in HFPtr between Leu-7and Phe-11, while in host cell-like membranes, � strandconformation was observed for HFPdm at Phe-8 and forHFPtr at Leu-7 and Phe-8 (12-14).
There is not yet a consensus about the location of HFPmnin either micelles or membranes. Data from liquid-state NMRexperiments have supported either partial micelle insertionor micelle traversal with Ala-15 and Gly-16 at themicelle-solution boundary (17-19). Simulations of mem-brane-associated HFPmn have also been consistent witheitherpartialmembraneinsertionormembranetraversal(25,26).Fluorescence studies on membrane-associated HFP with theF8W mutation were consistent with a distance of ∼10 Åbetween the tryptophan indole group and the phosphoruslongitude (27, 28). Electron spin resonance experiments haveindicated that Met-19 is close to the membrane-waterinterface while Ala-1 is far from this interface (29).
Solid-state NMR has been applied to determine distancesbetween backbone 13CO nuclei in HFPmn and 31P nuclei inthe lipid headgroups (30). Because there was very littleinformation about the membrane location of HFPmn, theinitial experiments scanned the HFPmn backbone usingsamples with 13CO labeling at three sequential residues. A13CO-31P distance of 5-6 Å was observed for labelingbetween Ala-14 and Gly-16, while distances of >8 Å wereobserved for labeling between residues Gly-5 and Gly-13.The proximity of the Ala-14-Gly-16 region to headgroupsin both micelles and membranes is very interesting becausethe HFPmn conformation is predominantly helical in micellesand � strand in membranes. To date, there have been nostudies about the micelle or membrane locations of cross-linked HFP oligomers.
This solid-state NMR work uses HFPmn, HFPdm, andHFPtr which are labeled with 13CO at either Ala-6 or Ala-15 and examines samples in which there are both helicaland � strand local conformations. Because the 13CO chemicalshifts of helical and � strand Ala are well-resolved, the dataprovide information about the dependence of HFP membranelocation on conformation as well as residue position. To thebest of our knowledge, this is the first study of HFPmembrane location for which HFP conformation is explicitlyknown.
290 Biochemistry, Vol. 48, No. 2, 2009 Qiang and Weliky

MATERIALS AND METHODS
Materials. Resins and Fmoc-protected amino acids werepurchased from Peptides International (Louisville, KY). 13C-carboxy-labeled amino acids were obtained from CambridgeIsotope Laboratories (Andover, MA) and were Fmoc-protected using literature methods (31). Lipids were obtainedfrom Avanti (Alabaster, AL). Most other chemicals wereobtained from Sigma-Aldrich (Milwaukee, WI). The mostcommonly used aqueous buffer contained 5 mM N-(2-hydroxyethyl)piperazine-N′-2-ethanesulfonic acid (HEPES)at pH 7.0 with 0.01% (w/v) NaN3 preservative.
Peptide Synthesis. Table 1 displays the peptide constructs,and Figure 1 describes the synthetic schemes. Preloaded�-Ala Wang resin was often used because of its low levelof substitution of ∼0.2 mmol/g, and preloaded Gly Wangresin was also used. The non-native C-terminal lysines wereintroduced to increase the solubility of the peptides, and thenon-native tryptophan provided a chromophore for quanti-fication (13). The HFPmn constructs were made by linearsynthesis. The HFPdm construct was made by cysteine cross-linking of HFPmn(Cys), and the HFPdm(Cys) construct wasmade from a dimer scaffold which included a peptide bondformed between the cysteine carboxyl group and a lysineε-NH2 group. The HFPtr construct was made by cysteinecross-linking of HFPdm(Cys) and HFPmn(Cys/Gly), and theHFPte construct was made by cysteine cross-linking ofHFPdm(Cys).
Much of the synthesis was done manually in 5 mLpolypropylene columns from Pierce (Rockford, IL), andmixing was accomplished with a rotation stage. Resin
washing was done with N,N-dimethylformamide (DMF).Deprotection of the Fmoc group was done with two cyclesof 20% piperidine in 3 mL, and deprotection of the Mtt groupwas done with six cycles of 1% trifluoroacetic acid (TFA)in 3 mL of dichloromethane (DCM). The first step incoupling of an amino acid to the R-NH2 terminus of the resin-bound peptide was dissolution in 4 mL of DMF of 0.5 mmolof protected amino acid, 0.5 mmol of O-benzotriazole-N,N,N′,N′-tetramethyluronium hexafluorophosphate (HBTU),0.5 mmol of 1-hydroxybenzotriazole (HOBT), and 1.0 mmolof N,N-diisopropylethylamine (DIPEA). After activation for10 min, coupling was initiated by adding the amino acidsolution to the resin. After coupling, acetylation or “capping”of unreacted peptides on the resin was accomplished with a10 min reaction with a 3 mL solution containing aceticanhydride, pyridine, and DMF in a 2:1:3 volume ratio.
For HFPdm(Cys), the dimer scaffold was formed fromcoupling of the Cys COOH group to the ε-NH2 group of theresin-bound Lys, and this step began with dissolution in 4mL of DMF of 0.5 mmol of Fmoc-Cys(Trt), 0.5 mmol of7-azabenzotriazol-1-yloxy tris(pyrrolidino)phosphonium hexa-fluorophosphate (PyAOP), and 1.0 mmol of DIPEA. Theamino acid solution was transferred to the resin which hadbeen washed twice with DCM and once with DMF after Mttdeprotection. One key aspect of this procedure was mini-mization of the time that the resin was at nonacidic pH priorto addition of the amino acid solution. This minimum timesuppressed the undesired side reaction of deprotection of theLys Fmoc group by the Lys ε-NH2 group (13, 15).
For the HFPmn and HFPdm synthetic protocols, couplingat each residue was optimized by ninhydrin monitoring every2 h to detect free R-HN2 groups (32). This informationprovided the basis for longer coupling times and doublecouplings at particular residues. Further explanation of theoptimizations is provided in Results. Some of the HFPmn,HFPmn(Cys), and HFPmn(Cys/Gly) syntheses were con-ducted on an automated peptide synthesizer (ABI 431A,Applied Biosystems, Foster City, CA) using protocols similarto the ones described for manual synthesis. The automatedsynthesizer was also sometimes used for HFPdm(Cys)peptide elongation (Figure 1, step b).
Cross-linking reactions of HFPdm, HFPtr, and HFPte wereconducted open to the atmosphere at pH 8.4 and werestopped by ∼10-fold dilution with water and lyophilization.Further details are provided in the legend of Figure 1. Forthe NMR studies, single 13C-carbonyl (13CO) labels wereincorporated at either Ala-6 or Ala-15 in HFPmn, HFPdm,and HFPtr and the resultant peptides were denoted HFPmn-A6 or HFPmn-A15, respectively, etc.
Crude peptides were obtained by cleavage with a mixtureof TFA, thioanisole, ethanedithiol, and anisole in a 90:5:3:2volume ratio. The purification of crude peptides was com-pleted by a HPLC system (Dionex, Sunnyvale, CA) equippedwith a semipreparative C18 column (Vydac, Hesperia, CA).Buffer A was water with 0.1% TFA; buffer B was 90%acetonitrile, 10% water, and 0.1% TFA, and the gradient wasfrom 40 to 80% buffer B over 30 min. Peptide masses weremeasured with MALDI-TOF mass spectroscopy using aVoyager-DE STR biospectrometry workstation (AppliedBiosystems) and R-cyano-4-hydroxycinnamic acid matrix.Peptide synthetic yields were quantified using 280 nmabsorbance, and the extinction coefficients were 5700, 11600,
Table 1: Names and Sequences of the HIV Fusion Peptidesa
a The names of HFP samples labeled at 13CO groups of A6 and A15in the text are HFPmn-A6 and HFPmn-A15, respectively, etc. b A linebetween K and C denotes a peptide bond between the Cys CO groupand the Lys ε-NH group, and a line between two C residues denotes adisulfide bond.
Comparison of HIV Fusion Peptide Oligomers Biochemistry, Vol. 48, No. 2, 2009 291

17300, and 23200 cm-1 M-1 for HFPmn, HFPdm, HFPtr,and HFPte, respectively.
Lipid Mixing Induced by HFPs. Mixing of lipids betweenmembrane vesicles was monitored by a fluorescence assay(33). Two types of large unilamellar vesicles (LUVs) wereprepared. The “unlabeled LUVs” contained 1-palmitoyl-2-oleoyl-sn-glycero-3-phosphocholine (POPC) and 1-palmi-toyl-2-oleoyl-sn-glycero-3-[phospho-rac-(1-glycerol)] (POPG)in a 4:1 molar ratio. This composition approximately reflectedthe ratio of neutral to negatively charged lipids in membranesof host cells of HIV and correlated with the lipid compositionused in previous structural studies of viral fusion peptides(34, 35). The “labeled LUVs” contained 77 mol % POPC,19 mol % POPG, 2 mol % fluorescent lipid N-(7-nitro-2,1,3-benzoxadiazol-4-yl)phosphatidylethanolamine (N-NBD-PE),and 2 mol % quenching lipid N-(lissamine rhodamine Bsulfonyl)phosphatidylethanolamine (N-Rh-PE). HFP-inducedfusion was examined in a solution with an labeled:unlabeledvesicle ratio of 1:9 so that a labeled vesicle would likelyfuse with an unlabeled vesicle. The resultant lipid mixing
would yield a larger average distance between fluorescentand quenching lipids and increased fluorescence.
Preparation of LUVs began with dissolution of lipid inchloroform followed by removal of the chloroform withnitrogen gas and overnight vacuum pumping. The lipid filmwas suspended in 5 mM HEPES buffer, and the lipiddispersion was homogenized with 10 freeze-thaw cycles.LUVs were formed by extrusion through a filter with 100nm diameter pores (Avestin, Ottawa, ON).
Fluorescence was recorded on a stopped-flow fluorimeter(model SX.18MV-R, Applied Photophysics, Surrey, U.K.)using excitation and emission wavelengths of 465 and 530nm, respectively. For a single run, one syringe in thefluorimeter contained HFPmn, HFPdm, HFPtr, or HFPtedissolved at a concentration of 3.00, 1.50, 1.00, or 0.75 µMin HEPES buffer, respectively. A second syringe containedlabeled and unlabeled LUVs at a total lipid concentration of300 µM. At time zero, equal volumes of the two solutionswere mixed and fluorescence was recorded every second for
FIGURE 1: Synthetic schemes of HFPmn, HFPdm, HFPtr, and HFPte. FP ≡ AVGIGALFLGFLGAAGSTMGARS. A black circle representsa resin bead. Lines are drawn to clarify chemical functionalities. An arrow signifies a chemical reaction. Two arrows signify multiplesequential chemical reactions. All reactions were carried out at ambient temperature. The specific reactions are as follows. Reaction a isFmoc deprotection in 3 mL of 20% piperidine/DMF (v/v), at 15 min/cycle for two cycles. Reaction b is peptide synthesis with Fmocchemistry. For HFPmn syntheses, 2 h single couplings were used for each amino acid with the following exceptions: 4 h single couplingsfor Trp, Ser, and Arg residues; 6 h single couplings for the Leu-12 to Leu-7 residues; and double coupling with 3 h per coupling for the13CO-labeled residue. For the HFPdm(Cys) synthesis, 4 h single couplings were used for each amino acid with the following exceptions:8 h single couplings for Trp, Ser, and Arg residues and double couplings with 4 h per coupling for the 13CO-labeled residue and for theLeu-12 to Leu-7 residues. Reaction c is cleavage from the resin using a 4 mL solution containing TFA, thioanisole, ethanedithiol, andanisole in a 90:5:3:2 volume ratio. After reaction for 2.5 h, TFA was removed with nitrogen gas and peptide was precipitated with coldmethyl tert-butyl ether. Reaction d is coupling using PyAOP and DIPEA (1:2 molar ratio) in 4 mL of DMF with reaction times of 6 h forCys and a reaction time of 2 h for Lys. Reaction e is cross-linking in 5 mM DMAP (pH 8.4), open to the air. HFPdm or HFPte conditions:1 µmol of HFPmn(Cys) or HFPdm(Cys) in a 400 µL solution overnight. HFPtr conditions: 1 µmol of HFPmn(Cys) and 1.5 µmol ofHFPdm(Cys) in a 400 µL solution for 2.5 h. Reaction f is selective deprotection of Mtt in 3 mL of 1% TFA/DCM (v/v), with 6 min/cyclefor six cycles.
292 Biochemistry, Vol. 48, No. 2, 2009 Qiang and Weliky

200 s. The HFP concentrations were chosen so that the HFPstrand:lipid ratio was always 0.010.
Most reports of fluorescence-based lipid mixing havefocused on ∆Ffusogen, the net change in fluorescence after thefusogen is added to the vesicles. ∆Ffusogen is typicallycompared to ∆Fdetergent, the change caused by addition of adetergent which completely solubilizes the vesicles. Becauseof the very large average distance between fluorescent andquenching lipids in the solubilized vesicles, ∆Fdetergent is themaximum observable fluorescence change. The “percent lipidmixing” is typically defined as ∆Ffusogen/∆Fdetergent × 100.To provide some comparison between our stopped-flowfluorescence data and the lipid mixing literature, the raw dataat each time point, Fraw(t), were converted to normalized F(t):
F(t)) {[Fraw(t)-Finitial] ⁄ ∆Fmax} × 100 (1)
Finitial was a typical value of fluorescence at time zero, and∆Fmax was chosen to provide semiquantitative comparisonbetween F(t) and earlier studies of percent lipid mixinginduced by HFPs (12). A single value of Finitial and a singlevalue of ∆Fmax were used for all of the data.
At the end of the 200 s collection time, the fluorescencefrom HFPmn-induced lipid mixing was still appreciablyincreasing, and it was therefore difficult to fit these data toa buildup function. The fluorescence of the HFPdm, HFPtr,and HFPte constructs had leveled off, and these data fittedmuch better to the sum of two exponential buildup functionsthan to a single buildup function:
F(t))F0 +F1(1- e-k1t)+F2
(1- e-k2t) (2)
where F0, k1, F1, k2, and F2 were fitting parameters. The best-fit value of F0 was close to 0 because of the way F(t) wascalculated in eq 1. A convention was chosen that k1 > k2 sothat k1 and F1 were the rate constant and overall fluorescencechange, respectively, of the faster lipid mixing process andk2 and F2 were the rate constant and overall fluorescencechange, respectively, of the slow process.
Data were collected for each construct at 25, 30, 35, and40 °C, and each HFPdm, HFPtr, and HFPte data set wasfitted with eq 2. For each construct, the temperaturedependence of k1 was fitted to the Arrhenius equation ln k1
) ln A - Ea/RT, where R is the ideal gas constant, T is theabsolute temperature, and A and Ea are the pre-exponentialfactor and activation energy, respectively. Three independentruns were conducted for each construct and temperature.
Preparation of Solid-State NMR Samples. The membranelipids were 1,2-di-O-tetradecyl-sn-glycero-3-phosphocholine(DTPC) and 1,2-di-O-tetradecyl-sn-glycero-3-[phospho-rac-(1-glycerol)] (DTPG). For each HFP construct, one samplewas made with a 4:1 DTPC:DTPG or “PC:PG” ratio andthe other with an 8:2:5 DTPC:DTPG:cholesterol or “PC:PG:CHOL” ratio. The lipid:cholesterol ratio of PC:PG:CHOLcorrelated with the ratio found in membranes of cells infectedwith HIV (34, 35). DTPC and DTPG were used becausethey were ether-linked rather than ester-linked lipids and thuslacked natural abundance 13CO NMR signals. Spectralinterpretation was therefore simplified because the 13COregion of the NMR spectrum was dominated by the labeled13CO nucleus of the HFP. For membrane-associated HFPtr,a previous study showed that the Leu-7 13CO chemical shift
and presumably the Leu-7 local conformation were similarin membranes containing either ether-linked or ester-linkedlipids (14).
Each PC/PG sample contained 16 µmol of DTPC and 4µmol of DTPG, and each PC/PG/CHOL sample contained16 µmol of DTPC, 4 µmol of DTPG, and 10 µmol ofcholesterol. Sample preparation began with creation of LUVsin 2 mL of HEPES buffer using the protocol described inthe previous section. Either HFPmn (0.80 µmol), HFPdm(0.40 µmol), or HFPtr (0.27 µmol) was dissolved in 2 mLof HEPES buffer, and the HFP and vesicle solutions werethen mixed and gently vortexed together with a resulting HFPstrand:lipid ratio of 0.040 for all samples. The mixture wasrefrigerated overnight and ultracentrifuged at ∼150000g for5 h. Unbound HFPs do not pellet, and at least HFPmnbinding to membranes has been determined to be ap-proximately quantitative (13, 36). The membrane pellet withassociated bound HFP was transferred to a 4 mm diametermagic angle spinning (MAS) NMR rotor.
Solid-State NMR REDOR Experiments and Data Analysis.The evolution of 13CO magnetization under the effect of13CO-31P dipolar coupling was measured with solid-stateNMR rotational-echo double-resonance (REDOR) experi-ments. The REDOR pulse sequence contained in sequence(1) a 50 kHz 1H π/2 pulse, (2) 1 ms cross-polarization witha 52 kHz 1H field and a 58-69 kHz ramped 13C field, (3) adephasing period τ which contained ∼50 kHz 13C π and insome cases ∼60 kHz 31P π pulses with XY-8 phase cyclingon each channel, and (4) 13C detection (14, 37). Two-pulsephase modulation (TPPM) 1H decoupling with a 100 kHzRabi frequency was applied during the dephasing anddetection periods. For each sample and each τ, two spectrawere acquired. The dephasing period in the “S1” acquisitioncontained a 13C π pulse at the end of each rotor cycle exceptfor the last cycle and a 31P π pulse in the middle of eachcycle. There were no 31P π pulses in the “S0” acquisition.MAS averaged the 13C evolution due to 13C-31P dipolarcoupling to zero over each rotor period of the S0 acquisition,while the two π pulses in each rotor cycle of the S1
acquisition disrupted the averaging and resulted in a netdipolar coupling “d ” with consequent reduction of the 13Csignal. Determination of d was based on the difference of13C intensity between the S0 and S1 spectra. For a single13CO-31P spin pair, the 13CO-31P distance “r” in angstromsis related to d in hertz by the relationship r ) 23.05/d1/3.Further details are provided in the Supporting Information.
RESULTS
Peptide Synthesis. Table 1 summarizes the HFPmn,HFPdm, HFPtr, and HFPte constructs synthesized in thisstudy, and Figure 1 shows the synthetic schemes. A manualsynthesis was carried out on HFPmn, and the efficiency aftereach coupling was monitored with the ninhydrin test. A 2 hsingle coupling was not sufficient for the Ser, Arg, and Trpresidues or for the residues between Leu-12 and Leu-7, andthe optimized synthesis used longer coupling times or doublecoupling for these residues. Figure 2a displays the HPLCchromatogram of an optimized HFPmn synthesis. The massspectrum of the dominant fraction had an intense peak withan ion at m/z 3149 Da which was very close to the expectedvalue of m/z 3151 Da for HFPmn (cf. Figure 2b). The
Comparison of HIV Fusion Peptide Oligomers Biochemistry, Vol. 48, No. 2, 2009 293
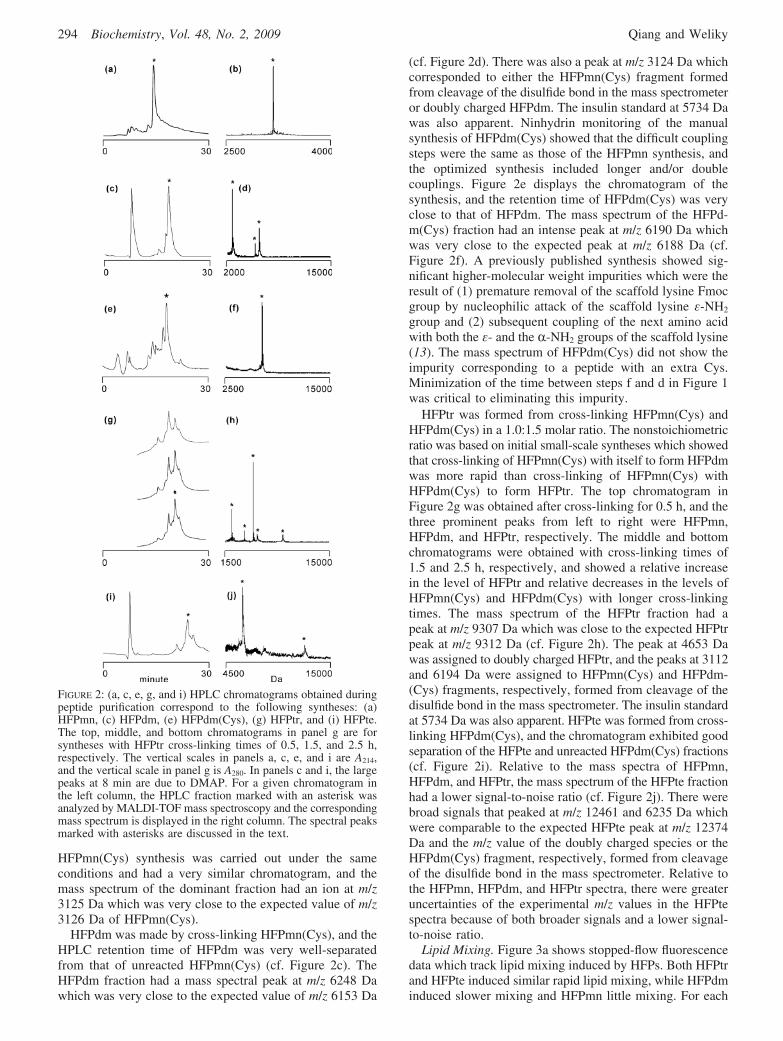
HFPmn(Cys) synthesis was carried out under the sameconditions and had a very similar chromatogram, and themass spectrum of the dominant fraction had an ion at m/z3125 Da which was very close to the expected value of m/z3126 Da of HFPmn(Cys).
HFPdm was made by cross-linking HFPmn(Cys), and theHPLC retention time of HFPdm was very well-separatedfrom that of unreacted HFPmn(Cys) (cf. Figure 2c). TheHFPdm fraction had a mass spectral peak at m/z 6248 Dawhich was very close to the expected value of m/z 6153 Da
(cf. Figure 2d). There was also a peak at m/z 3124 Da whichcorresponded to either the HFPmn(Cys) fragment formedfrom cleavage of the disulfide bond in the mass spectrometeror doubly charged HFPdm. The insulin standard at 5734 Dawas also apparent. Ninhydrin monitoring of the manualsynthesis of HFPdm(Cys) showed that the difficult couplingsteps were the same as those of the HFPmn synthesis, andthe optimized synthesis included longer and/or doublecouplings. Figure 2e displays the chromatogram of thesynthesis, and the retention time of HFPdm(Cys) was veryclose to that of HFPdm. The mass spectrum of the HFPd-m(Cys) fraction had an intense peak at m/z 6190 Da whichwas very close to the expected peak at m/z 6188 Da (cf.Figure 2f). A previously published synthesis showed sig-nificant higher-molecular weight impurities which were theresult of (1) premature removal of the scaffold lysine Fmocgroup by nucleophilic attack of the scaffold lysine ε-NH2
group and (2) subsequent coupling of the next amino acidwith both the ε- and the R-NH2 groups of the scaffold lysine(13). The mass spectrum of HFPdm(Cys) did not show theimpurity corresponding to a peptide with an extra Cys.Minimization of the time between steps f and d in Figure 1was critical to eliminating this impurity.
HFPtr was formed from cross-linking HFPmn(Cys) andHFPdm(Cys) in a 1.0:1.5 molar ratio. The nonstoichiometricratio was based on initial small-scale syntheses which showedthat cross-linking of HFPmn(Cys) with itself to form HFPdmwas more rapid than cross-linking of HFPmn(Cys) withHFPdm(Cys) to form HFPtr. The top chromatogram inFigure 2g was obtained after cross-linking for 0.5 h, and thethree prominent peaks from left to right were HFPmn,HFPdm, and HFPtr, respectively. The middle and bottomchromatograms were obtained with cross-linking times of1.5 and 2.5 h, respectively, and showed a relative increasein the level of HFPtr and relative decreases in the levels ofHFPmn(Cys) and HFPdm(Cys) with longer cross-linkingtimes. The mass spectrum of the HFPtr fraction had apeak at m/z 9307 Da which was close to the expected HFPtrpeak at m/z 9312 Da (cf. Figure 2h). The peak at 4653 Dawas assigned to doubly charged HFPtr, and the peaks at 3112and 6194 Da were assigned to HFPmn(Cys) and HFPdm-(Cys) fragments, respectively, formed from cleavage of thedisulfide bond in the mass spectrometer. The insulin standardat 5734 Da was also apparent. HFPte was formed from cross-linking HFPdm(Cys), and the chromatogram exhibited goodseparation of the HFPte and unreacted HFPdm(Cys) fractions(cf. Figure 2i). Relative to the mass spectra of HFPmn,HFPdm, and HFPtr, the mass spectrum of the HFPte fractionhad a lower signal-to-noise ratio (cf. Figure 2j). There werebroad signals that peaked at m/z 12461 and 6235 Da whichwere comparable to the expected HFPte peak at m/z 12374Da and the m/z value of the doubly charged species or theHFPdm(Cys) fragment, respectively, formed from cleavageof the disulfide bond in the mass spectrometer. Relative tothe HFPmn, HFPdm, and HFPtr spectra, there were greateruncertainties of the experimental m/z values in the HFPtespectra because of both broader signals and a lower signal-to-noise ratio.
Lipid Mixing. Figure 3a shows stopped-flow fluorescencedata which track lipid mixing induced by HFPs. Both HFPtrand HFPte induced similar rapid lipid mixing, while HFPdminduced slower mixing and HFPmn little mixing. For each
FIGURE 2: (a, c, e, g, and i) HPLC chromatograms obtained duringpeptide purification correspond to the following syntheses: (a)HFPmn, (c) HFPdm, (e) HFPdm(Cys), (g) HFPtr, and (i) HFPte.The top, middle, and bottom chromatograms in panel g are forsyntheses with HFPtr cross-linking times of 0.5, 1.5, and 2.5 h,respectively. The vertical scales in panels a, c, e, and i are A214,and the vertical scale in panel g is A280. In panels c and i, the largepeaks at 8 min are due to DMAP. For a given chromatogram inthe left column, the HPLC fraction marked with an asterisk wasanalyzed by MALDI-TOF mass spectroscopy and the correspondingmass spectrum is displayed in the right column. The spectral peaksmarked with asterisks are discussed in the text.
294 Biochemistry, Vol. 48, No. 2, 2009 Qiang and Weliky

construct, data were acquired at 25, 30, 35, and 40 °C, andthe HFPdm, HFPtr, and HFPte data could be fit well to abiexponential buildup function (cf. eq 2). The best-fitparameters of the 35 °C data are listed in Table 2, and theparameters for other temperatures are listed in the tables inthe Supporting Information. For each of the three constructs,k2 ≈ 0.1k1 and F1 ≈ F2. In addition, k1
tr/k1dm ≈ 2.5 and k1
te/k1
tr ≈ 1.3. Figure 3b displays Arrhenius plots for the k1 rateconstants, and the best-fit Ea values and ln A values are listedin Table 2. The values of Ea and ln A for HFPdm and HFPtrare comparable to those reported in a previous study (13).The data show that Ea
dm > Eatr > Ea
te and ln Adm > ln Atr >ln Ate. An increased number of strands in the oligomer istherefore correlated with a decreased ln A and Ea withconcomitant opposite effects on k1. The activation entropieswere calculated using the transition-state theory equation ∆Sq
) R[ln(Ah/kBT) - 2], where R is the ideal gas constant, h is
Planck’s constant, kB is Boltzmann’s constant, and T is theabsolute temperature (13). The resultant ∆Sq values were allnegative (∆Sqdm > ∆Sqtr > ∆Sqte), but we do not understandthe sign or trends of the ∆Sq values.
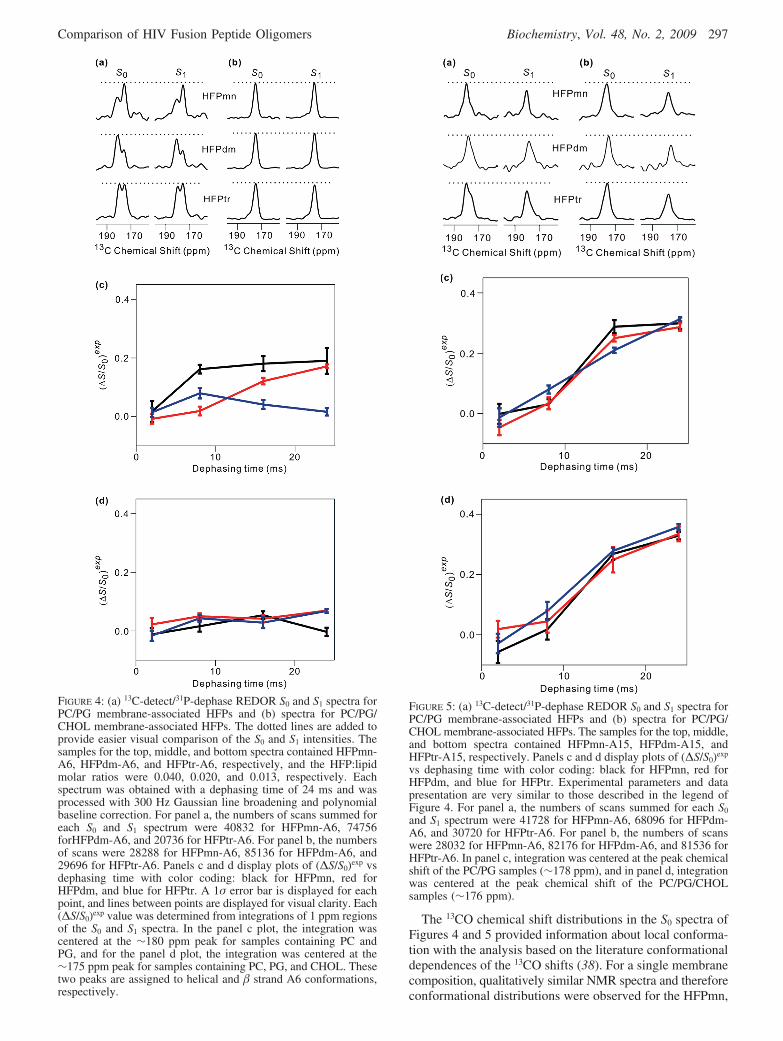
Solid-State NMR. Figure 4a displays the 13CO S0 and S1
REDOR spectra at τ ) 24 ms for the PC/PG membrane-associated HFP-A6 samples. The line shapes of the S0 spectradid not exhibit a strong dependence on dephasing time, andthe displayed spectra were therefore representative of the13CO shift distributions of the samples. The 13CO S0 signalhad an approximately three-fourths contribution from thelabeled Ala-6 and an approximately one-fourth naturalabundance contribution from the unlabeled residues. Becausethe latter contribution was due to ∼29 chemically distinct13CO groups, it would be a broad signal and therefore lessapparent than the sharper 13CO signals from the single labeledresidue. In each spectrum, there are two peaks with chemicalshifts of ∼180 and ∼175 ppm which likely have dominantcontributions from separate populations of helical and �strand Ala-6 conformations (38). This correlation of 13COchemical shift with conformation was previously confirmedwith backbone 13CO-15N distance measurements on HFPtr(14). For PC/PG/CHOL membrane-associated HFP-A6samples, the 175 ppm peak is dominant and is consistentwith a preference for � strand conformation in cholesterol-containing membranes (cf. Figure 4b). The correlation holdsfor all three constructs.
Figure 4c displays a plot of (∆S/S0)exp versus dephasingtime for the helical component of the PC/PG membrane-associated HFP-A6 samples, and Figure 4d displays thecorresponding plot for the PC/PG/CHOL samples in whichthe � strand conformation is dominant. In Figure 4d, (∆S/S0)exp ≈ 0 for all τ values and all constructs, and this wasalso true for the � strand component in the PC/PG samples(not shown). This result is consistent with Ala-6 13CO-31Pdistances greater than 8 Å. For the helical component ofHFPtr, (∆S/S0)exp ≈ 0 for all τ values; for HFPdm, therewas a small increase with an increase in τ, and for HFPmn,a larger increase which leveled off at 0.2 at large τ valueswas observed. These data support an Ala-6 membranelocation which is closest to the lipid 31P atoms in HFPmn,more distant in HFPdm, and most distant in HFPtr. For thehelical conformation, there may therefore be a positivecorrelation between the number of strands in the oligomerand the depth of membrane insertion. This variation inmembrane location may be one reason for the large differ-ences in fusion rates among the different constructs.
Figure 5 displays the 13CO S0 and S1 REDOR spectraat τ ) 24 ms for the (a) PC/PG membrane- and (b) PC/PG/CHOL membrane-associated HFP-A15 samples. In thePC/PG samples, the peak 13CO shift was ∼178 ppm, andat least for HFPtr, there was also a clear shoulder at ∼176ppm; in the PC/PG/CHOL samples, the peak 13CO shiftwas ∼176 ppm. These shifts generally correlate with amixture of helical and � strand conformations for Ala-15in PC/PG samples and predominant � strand conformationin PC/PG/CHOL samples. This result is consistent withthe Ala-6 data. The line widths of components ofindividual Ala-15 conformations are significantly broaderthan the corresponding components of Ala-6 conforma-tions, which is consistent with greater structural hetero-geneity at Ala-15 (cf. Figures 4b and 5b).
FIGURE 3: (a) Stopped-flow-monitored changes in lipid fluorescenceinduced by addition of different HFP constructs to an aqueoussolution containing membrane vesicles. Increased fluorescence isa result of mixing of lipids between different vesicles, and thismixing is one consequence of vesicle fusion. The lines are color-coded: black for HFPmn, red for HFPdm, blue for HFPtr, and greenfor HFPte. The total lipid concentration was 150 µM, and theHFPmn, HFPdm, HFPtr, and HFPte concentrations were 1.50, 0.75,0.50, and 0.37 µM, respectively, so that the peptide strand:lipidratio was 0.01. The data were collected at 25 °C; the vesiclecomposition was 4:1 POPC:POPG, and the initial vesicle diameterwas ∼100 nm. Additional data (not shown) were obtained forHFPdm, HFPtr, and HFPte at 30, 35, and 40 °C. Each data set foreach construct was analyzed as the sum of two exponential buildupfunctions. Panel b displays Arrhenius plots for the rate constantsof the fast buildup function: (0) HFPdm, (O) HFPtr, and (4) HFPte.The best-fit lines are also displayed and result in activation energiesof 41 ( 3, 26 ( 1, and 20 ( 1 kJ/mol, respectively.
Comparison of HIV Fusion Peptide Oligomers Biochemistry, Vol. 48, No. 2, 2009 295

Figure 5c displays the plot of (∆S/S0)exp versus τ for thePC/PG membrane-associated HFP-A15 samples, and Figure5d displays the corresponding plot for the PC/PG/CHOLmembrane-associated samples. The (∆S/S0)exp values werederived from 1 ppm integration windows at the peak shiftsand therefore reflect helical and � strand conformations inthe respective samples. For all constructs and all conforma-tions, there was a large increase in (∆S/S0)exp with an increasein τ and the (∆S/S0)exp values were generally much largerthan for the HFP-A6 samples. These data support a mem-brane location for Ala-15 which is much closer to the lipid31P atoms than is Ala-6.
QuantitatiVe Analysis of 13C-31P REDOR Data. A morequantitative analysis of the REDOR data was carried out forthe HFP-A15 samples. The analysis included approximateseparation of the natural abundance contribution from thelabeled contribution to (∆S/S0)exp, so that the resultant(∆S/S0)lab reflected the Ala-15 13CO-31P proximity. The(∆S/S0)lab/(∆S/S0)exp ratio varied with τ with a typical rangeof 0.9-1.2, so a plot of (∆S/S0)lab versus τ was similar tothe corresponding plot of (∆S/S0)exp versus τ. As inferredfrom panels c and d of Figure 5, there was a plateau valueof (∆S/S0)lab in each data set which was between 0.3 and0.4, and it was therefore considered that only a fraction f ofthe Ala-15 13CO groups had detectable d. This plateau effecthad also been observed in fitting 13CO-31P data of amembrane-associated antimicrobial peptide with a helicalconformation (37). The Supporting Information containsfurther information and details about the natural abundancecorrection, calculation of (∆S/S0)sim values as a function ofd, and fitting of (∆S/S0)lab to (∆S/S0)sim to determine best-fitd and f values.
Table 3 summarizes the best-fit d and f values for the threeconstructs in the two different compositions and conforma-tions. The calculation of (∆S/S0)sim as a function of d wasbased on a single nearby 31P nucleus. All of the d valueswere in the range of 60-90 Hz which correspond to13CO-31P distances in the 5-6 Å range, and all of the fvalues were in the range of 0.3-0.4. Because the HFP 13COgroup may be close to more than one lipid headgroup, fittingswere also done using simulations with one 13CO and two31P spins and resulted in best-fit 13CO-31P distances of 5-6Å, f values of 0.6-0.8, and an angle between the two13CO-31P vectors close to 180° (14, 39, 40). For this angle,(∆S/S0)sim ≈ 0.5 at long dephasing times. There is insufficientinformation to choose between the one- and two-31P spinmodels.
DISCUSSION
This work describes syntheses, fusion activities, conforma-tions, and membrane locations of four HFP constructs,including the HFPmn monomer and the HFdm, HFPtr, and
HFPte cross-linked oligomers that are dimeric, trimeric, andtetrameric, respectively. The putative oligomerization stateof HIV gp41 is a trimer, and motivations for our studiesincluded understanding the role of oligomerization in theHFP model system and providing insight into the role ofoligomerization in intact HIV-host cell fusion.
One result of this work is an improved synthesis of HFPtrand the synthesis of HFPte. The previous synthetic strategyfor HFPtr used a trimeric scaffold and simultaneous couplingof amino acids onto each chain of the scaffold (13). Thisapproach often led to synthetic failure because of therequirement for ∼180 successful deprotection and couplingreactions. In addition, use of a 4 h coupling time for allresidues did not consider inefficient coupling for residuesthat contained large side chains or side chain protectinggroups. This study increased the HFPtr yield and purity usingthe following modifications. (1) HFPtr was formed from acysteine cross-linking reaction between HFPmn(Cys) andHFPdm(Cys). Because HFPdm(Cys) was synthesized usinga dimeric scaffold, a successful synthesis required one-thirdfewer reactions than the earlier HFPtr synthesis. In addition,the purification of the cross-linking reaction was fairlystraightforward because of the separation of the HPLC peakscorresponding to HFPmn(Cys), HFPdm and HFPdm(Cys),HFPtr, and HFPte (cf. Figure 2g). (2) Ninhydrin monitoringof coupling reactions in the manual syntheses of HFPmn andHFPdm(Cys) showed that longer coupling times wererequired for the Trp, Ser, Arg, and Leu-12-Leu-7 residues.The new synthetic protocol used longer coupling times ordouble coupling at these residues. (3) The HFPdm(Cys)synthetic protocol was modified to minimize the timebetween the cleavage of the Mtt group of the Lys ε-NH2
group and the subsequent coupling to Cys. This modificationreduced the level of undesired deprotection of the Fmocgroup of the Lys R-NH2 group by the ε-NH2 group (15).
The lipid mixing at long times was ordered as follows:HFPmn < HFPdm < HFPtr ≈ HFPte (cf. Figure 3a). k1
HFPtr/k1
HFPdm ≈ 2.5, while k1HFPte/k1
HFPtr ≈ 1.3 (cf. Table 2), wherek1 is the rate constant of the fast component of lipid mixing.In addition, Ea
HFPdm - EaHFPtr ≈ 15 kJ/mol whereas Ea
HFPtr
- EaHFPte ≈ 6 kJ/mol. These data indicate (1) the fact that
cross-linking increases the rate and extent of HFP-inducedlipid mixing and decreases the activation energy and (2) theincrease in the level of lipid mixing per strand and decreasein activation energy with cross-linking levels off at HFPtr.It might be expected that oligomer folding would be moredifficult with an increasing number of monomer units, sothe putative trimeric oligomerization state of gp41 and otherclass I viral fusion proteins may be the optimal balancebetween higher catalytic efficiency and more difficult folding.We do not know why lipid mixing appears to be acombination of a fast (k1) and slow (k2) processes.
Table 2: Fitting Parameters for the Lipid Mixing Kinetics at 35 °Ca
construct k1 (×10-3 s-1) k2 (×10-3 s-1) F0 (au) F1 (au) F2 (au) Eab (kJ/mol) ln A ∆Sqc (J mol-1 K-1)
HFPdm 54.9 (0.3) 4.9 (0.2) 0.5 (0.1) 19.6 (0.3) 19.8 (0.1) 40.6 (3.4) 13.2 (1.2) -152HFPtr 139 (3) 17.3 (0.3) 0.9 (0.2) 50.1 (0.2) 50.0 (0.2) 25.8 (1.2) 8.0 (0.8) -195HFPte 185 (7) 20.7 (0.3) 0.9 (0.3) 49.8 (0.3) 50.1 (0.2) 20.1 (0.7) 6.2 (0.5) -210a Fitting uncertainties are given in parentheses. The variation of a parameter value from fitting data of different runs was less than the fitting
uncertainty of a single run. The k1, k2, F0, F1, and F2 were obtained using eq 2 in the text. b Ea and ln A were calculated using ln k1 ) ln A - Ea /RTand k1 values from temperatures between 25 and 40 °C. c ∆Sq was calculated using the relation ∆Sq ) R[ln(Ah/kBT) - 2].
296 Biochemistry, Vol. 48, No. 2, 2009 Qiang and Weliky
The 13CO chemical shift distributions in the S0 spectra ofFigures 4 and 5 provided information about local conforma-tion with the analysis based on the literature conformationaldependences of the 13CO shifts (38). For a single membranecomposition, qualitatively similar NMR spectra and thereforeconformational distributions were observed for the HFPmn,
FIGURE 4: (a) 13C-detect/31P-dephase REDOR S0 and S1 spectra forPC/PG membrane-associated HFPs and (b) spectra for PC/PG/CHOL membrane-associated HFPs. The dotted lines are added toprovide easier visual comparison of the S0 and S1 intensities. Thesamples for the top, middle, and bottom spectra contained HFPmn-A6, HFPdm-A6, and HFPtr-A6, respectively, and the HFP:lipidmolar ratios were 0.040, 0.020, and 0.013, respectively. Eachspectrum was obtained with a dephasing time of 24 ms and wasprocessed with 300 Hz Gaussian line broadening and polynomialbaseline correction. For panel a, the numbers of scans summed foreach S0 and S1 spectrum were 40832 for HFPmn-A6, 74756forHFPdm-A6, and 20736 for HFPtr-A6. For panel b, the numbersof scans were 28288 for HFPmn-A6, 85136 for HFPdm-A6, and29696 for HFPtr-A6. Panels c and d display plots of (∆S/S0)exp vsdephasing time with color coding: black for HFPmn, red forHFPdm, and blue for HFPtr. A 1σ error bar is displayed for eachpoint, and lines between points are displayed for visual clarity. Each(∆S/S0)exp value was determined from integrations of 1 ppm regionsof the S0 and S1 spectra. In the panel c plot, the integration wascentered at the ∼180 ppm peak for samples containing PC andPG, and for the panel d plot, the integration was centered at the∼175 ppm peak for samples containing PC, PG, and CHOL. Thesetwo peaks are assigned to helical and � strand A6 conformations,respectively.
FIGURE 5: (a) 13C-detect/31P-dephase REDOR S0 and S1 spectra forPC/PG membrane-associated HFPs and (b) spectra for PC/PG/CHOL membrane-associated HFPs. The samples for the top, middle,and bottom spectra contained HFPmn-A15, HFPdm-A15, andHFPtr-A15, respectively. Panels c and d display plots of (∆S/S0)exp
vs dephasing time with color coding: black for HFPmn, red forHFPdm, and blue for HFPtr. Experimental parameters and datapresentation are very similar to those described in the legend ofFigure 4. For panel a, the numbers of scans summed for each S0
and S1 spectrum were 41728 for HFPmn-A6, 68096 for HFPdm-A6, and 30720 for HFPtr-A6. For panel b, the numbers of scanswere 28032 for HFPmn-A6, 82176 for HFPdm-A6, and 81536 forHFPtr-A6. In panel c, integration was centered at the peak chemicalshift of the PC/PG samples (∼178 ppm), and in panel d, integrationwas centered at the peak chemical shift of the PC/PG/CHOLsamples (∼176 ppm).
Comparison of HIV Fusion Peptide Oligomers Biochemistry, Vol. 48, No. 2, 2009 297

HFPdm, and HFPtr constructs. It was therefore unlikely thatthe large variations in lipid mixing rates among the constructswere due to conformational differences.
The S0 spectra also provided specific information aboutthe populations of helical and � strand conformation at theAla-6 and Ala-15 residues. There is a significant literatureon the membrane-associated conformation of different HFPconstructs with reports of both helical and � strandconformations (2-5, 16, 22, 23). A higher HFP:lipid ratiois one factor which favors � strand conformation andcorrelates with formation of � sheet aggregates at higherpeptide concentrations in the membrane (23). All of the NMRsamples in this study had a peptide strand:lipid molar ratioof 0.04 but differed in the residue position of the labeled13CO group and in membrane cholesterol content. Consid-eration of membrane cholesterol may be important becausecholesterol makes up ∼30 mol % of host cell membranesand ∼45 mol % of HIV membranes (34, 35).
The effect of membrane cholesterol on conformation ismost clearly understood with the HFP-A6 S0 spectra (cf.Figure 4a,b). In PC/PG membranes, the spectra exhibited amixture of two signals with peak shifts of ∼180 and ∼175ppm which were assigned to populations of helical and �strand conformations, respectively (38). In PC/PG/CHOLmembranes, there were single peaks with a shift of ∼175ppm, i.e., predominant � strand conformation. Furtherevidence for correlation of the � strand conformation withthe 175 ppm shift is an earlier complete 13C chemical shiftassignment of residues 1-16 of HFPmn associated withcholesterol-containing membranes (24). The 13C shifts ofthese residues, including Ala-6, were consistent with � strandconformation.
For the HFP-A15 S0 spectra, the effects of membranecholesterol were more subtle (cf. Figure 5a,b). In PC/PGmembranes, there was a dominant peak at ∼178 ppm for allthree constructs, and at least for HFPtr, there was also a clearshoulder at ∼176 ppm. In PC/PG/CHOL membranes, therewere single peaks at ∼176 ppm. The 178 ppm signal wasassigned to the helical conformation in part on the basis ofthe 181.2 and 179.1 ppm 13CO shifts of Ala-6 and Ala-15,respectively, in detergent-associated HFPmn (17). Theseresidues were helical in the detergent structure, and the 2ppm difference in shifts correlated with the 2 ppm differencebetween the putative helical Ala-6 and Ala-15 shifts in PC/PG membranes. The 176 ppm shift in PC/PG/CHOLmembranes was assigned to the � strand conformation onthe basis of (1) literature chemical shifts, (2) the previouslydescribed work on uniformly labeled HFPmn, and (3) earlierwork showing specific antiparallel � strand registries for a
large fractionofHFPmninPC/PG/CHOLmembranes (24,38).In particular, this latter study demonstrated that an antiparallel� sheet was formed for residues Ala-1-Gly-16 with anadjacent strand crossing near Phe-8 and Leu-9. For theseregistries, Ala-6 was in the middle and Ala-15 was near theedge of the � sheets. The Ala-6 and Ala-15 residues wouldlikely be in more and less ordered environments, respectively,which generally correlated with narrower ∼3 ppm andbroader 4-5 ppm line widths observed for these residues inPC/PG/CHOL membranes. Our interpretation of the HFP-A15 spectra was thus similar to that of the HFP-A6 spectrawith helical and � strand populations in PC/PG membranesand predominant � strand conformation in PC/PG/CHOLmembranes.
One overall conclusion of the chemical shift analysis wasthat membrane cholesterol was associated with the � strandconformation of the HFP. Although this result had beenpreviously suggested by work from our group, this studyprovides much clearer evidence of this observation becausethe only difference between the PC/PG and PC/PG/CHOLmembranes was membrane cholesterol content. A similarcorrelation between membrane cholesterol and � strandconformation has been observed for the influenza virus fusionpeptide, so the correlation may be a general property offusion peptides (41, 42). Although the reasons for thestructural effect of membrane cholesterol are poorly under-stood, it is useful to consider the increased lateral molecularpacking density in cholesterol-containing membranes and thedifference in sizes of a putatively small monomeric HFP helixand a larger HFP � sheet aggregate (43). Relative to theaggregate, the small helix might experience a more positiveincrease in free energy of membrane insertion with a higherpacking density.
Spectra from other PC/PG samples with a peptide strand:lipid ratio of ≈0.04 (not shown) had populations of helicaland � strand chemical shifts that were similar to thosedisplayed in Figure 4a. The general observations based onmultiple samples were as follows. (1) The population ofhelical conformation was lower in HFPmn samples than inHFPdm and HFPtr samples (2) For all constructs, there wassome � strand population. The latter observation wasconsistent with earlier studies on HFPmn samples near thispeptide strand:lipid ratio (23, 42). For HFPmn, HFPdm, andHFPtr samples with PC/PG/CHOL membranes, there wasalways predominant � strand conformation (cf. Figure 4b).An earlier study showed that the � strand conformation wasalso formed in samples made by the different protocol ofinitial cosolubilization of HFPmn, lipids, and cholesterol inorganic solvent followed by removal of the solvent and thenhydration (44). Therefore, the � strand conformation in PC/PG/CHOL membranes is probably a thermodynamic equi-librium rather than a kinetically trapped structure.
For a particular construct, the lipid mixing rate wasapproximately independent of the absence or presence ofmembrane cholesterol (13). One interpretation of these datais that both the helical and � strand HFP conformationsinduce vesicle fusion, while an alternate interpretation is thatfusion is induced by unstructured HFP (45, 46). This transientHFP state would not be apparent in the NMR samples whichreflect the long-time end-state HFP structure. Experimentalsupport for the first interpretation is a HFPmn study which
Table 3: Best-Fit 13C-31P Dipolar Coupling (d) and FractionalMaximum Dephasing (f) Parameters for HFP-A15 Samplesa
PC/PG PC/PG/CHOL
d (Hz) f �2 d (Hz) f �2
HFPmn-A15 75 (8) 0.32 (0.02) 8.0 88 (7) 0.38 (0.03) 6.7HFPdm-A15 62 (4) 0.33 (0.02) 6.8 72 (8) 0.36 (0.03) 3.5HFPtr-A15 90 (6) 0.36 (0.01) 0.3 90 (3) 0.36 (0.01) 1.9
a Fitting values are presented with uncertainties in parentheses. The�2 values were calculated using eq S4 of the Supporting Information.The d values in hertz are related to distances (r) in angstroms unitsusing the relation r ) 23.05/d1/3. If r ) 5 Å, d ) 98 Hz, and if r ) 6Å, d ) 57 Hz.
298 Biochemistry, Vol. 48, No. 2, 2009 Qiang and Weliky

showed that the rates of membrane binding and secondarystructure formation were faster than the rate of lipid mixing(47).
As there were not large conformational variations amongthe HFPmn, HFPdm, and HFPtr constructs in a singlemembrane composition, HFP location in membranes wasconsidered as a factor to explain the significant differencesin fusion activities. In addition, detection of distinct signalsfor helical and � strand 13CO groups provided an opportunityto examine the dependence of membrane location onconformation. An earlier 13CO-31P REDOR study wascarried out on HFPmn constructs containing 13CO labels atthree sequential residues (30). For HFPmn labeled from Ala-14 to Gly-16 in either PC/PG or PC/PG/CHOL membranes,(∆S/S0)exp ≈ 0.3-0.4 with a dephasing time of 24 ms, while(∆S/S0)exp e 0.15 for HFPmn labeled from Gly-5 to Leu-7,from Phe-8 to Gly-10, or from Phe-11 to Gly-13. The overallconclusion was that the Ala-14-Gly-16 residues were closerto the lipid phosphate headgroups than were the Gly-5-Gly-13 residues. The singly 13CO labeled samples of this studywere consistent with these results and provided the followingadditional insights. (1) Ala-15 is closer to the phosphateheadgroups than Ala-6 is. (2) This proximity difference isobserved for both helical and � strand conformations. (3)This difference is observed for the HFPmn, HFPdm, andHFPtr constructs. These insights are supported by the smaller(∆S/S0)exp for all HFP-A6 constructs for both helical and �strand conformations and the larger (∆S/S0)exp for all HFP-A15 constructs for both helical and � strand conformations(cf. Figures 4 and 5). The proximity of the Ala-15 residueto the phosphate groups may be an intrinsic property of theHFP sequence. This is perhaps explained by Ala-15 beingat the junction of the more apolar N-terminal and the morepolar C-terminal regions of the sequence. These regionslikely have negative and positive free energies of membraneinsertion, respectively (48). For signal-to-noise reasons, theexperiments described in this paper were conducted at anominal temperature of -50 °C in which the PC/PGmembranes were in the gel phase and the PC/PG/CHOLmembranes were in a glass of the liquid-ordered phase (49).Although we do not have data in the more biologicallyrelevant higher-temperature liquid-crystalline and liquid-ordered phases, similar 13CO-31P REDOR studies have beencarried out for the influenza virus fusion peptide in the lower-temperature gel and higher-temperature liquid-crystallinephases, and similar (∆S/S0)exp values were obtained in bothphases (50).
There is general consistency between our results and earlierexperimental work on the location of HFPmn in membranesand micelles. Liquid-state NMR studies on helical HFPmnin detergent micelles showed that the Ala-15 residue wasclose to the detergent headgroups. In addition, the Ala-6residue was in the micellar interior and farther from theseheadgroups (17, 18). The membrane location of HFPmn witha F8W mutation has been examined by fluorescence, and itwas concluded that the Trp side chain was in the bilayerinterior and was 10-11 Å from the phosphate grouplongitude. Very similar locations were found in samples withHFPmn-F8W:lipid ratios of 0.0025 and 0.02 and for mem-branes with or without cholesterol (27, 28). These datagenerally correlate with the small (∆S/S0)exp of HFPmn-A6in PC/PG and PC/PG/CHOL membranes.
Computer simulations have yielded two distinct modelsof the membrane location of helical HFPmn (25, 26). Forthe “deep insertion” model, there was traversal of bothmembrane leaflets, while in the “shallow insertion” model,HFPmn was restricted to the outer leaflet. For the deepinsertion model, the Ala-6 and Ala-15 residues were ∼15and ∼5 Å, respectively, from the phosphorus longitude, whilein the shallow insertion model, they were ∼5 and ∼3 Å,respectively, from this longitude. Both models are consistentwith the experimentally observed proximity of Ala-15 to thephosphate groups. However, the non-zero (∆S/S0)exp valuesfor the helical Ala-6 peak in HFPmn and HFPdm sampleswere not consistent with 100% deep insertion. There maybe discrete populations of deeply and shallowly insertedhelical HFPs (21).
Table 3 shows that the best-fit d values for all HFP-A15samples were consistent with 5-6 Å 13CO-31P distances.Qualitative consideration of these distances and the van derWaals radii of HFP and the phosphate group suggests closecontact of the Ala-15 residue with the phosphate group. Thefittings also resulted in best-fit f values of 0.3-0.4 whichwere consistent with two populations of HFPs that differedin having Ala-15 close and far from the phosphate groups.For � sheet structure, these populations could be strands atthe edges and the middle of the sheet, respectively (24).
Although the data to date generally supported similarmembrane locations of HFPmn, HFPdm, and HFPtr, therewas some indication of differences in (∆S/S0)exp for thehelical peak in the HFP-A6 samples. In particular, Ala-6appeared to be closest to the phosphate groups in HFPmnfollowed by HFPdm and HFPtr which would correlate withshallowest membrane insertion for HFPmn and deeperinsertion for HFPdm and HFPtr. This suggests the intriguinghypothesis that the membrane insertion depth correlates withfusogenicity.
ACKNOWLEDGMENT
Mass spectra were recorded in the Michigan State Uni-versity Mass Spectroscopy Facility, and fluorescence spectrawere recorded in the laboratory of Dr. Honggao Yan.
SUPPORTING INFORMATION AVAILABLE
Detailed description of NMR experiments, analysis andlisting of values of (∆S/S0)exp, (∆S/S0)lab, and (∆S/S0)na forthe HFP-A15 samples, and detailed listing of the best-fitparameters for the lipid mixing data. This material isavailable free of charge via the Internet at http://pubs.acs.org.
REFERENCES
1. Eckert, D. M., and Kim, P. S. (2001) Mechanisms of viralmembrane fusion and its inhibition. Annu. ReV. Biochem. 70, 777–810.
2. White, J. M., Delos, S. E., Brecher, M., and Schornberg, K. (2008)Structures and mechanisms of viral membrane fusion proteins:Multiple variations on a common theme. Crit. ReV. Biochem. Mol.Biol. 43, 189–219.
3. Yang, J., Gabrys, C. M., and Weliky, D. P. (2001) Solid-statenuclear magnetic resonance evidence for an extended � strandconformation of the membrane-bound HIV-1 fusion peptide.Biochemistry 40, 8126–8137.
4. Pereira, F. B., Goni, F. M., Muga, A., and Nieva, J. L. (1997)Permeabilization and fusion of uncharged lipid vesicles inducedby the HIV-1 fusion peptide adopting an extended conformation:Dose and sequence effects. Biophys. J. 73, 1977–1986.
Comparison of HIV Fusion Peptide Oligomers Biochemistry, Vol. 48, No. 2, 2009 299

5. Durell, S. R., Martin, I., Ruysschaert, J. M., Shai, Y., andBlumenthal, R. (1997) What studies of fusion peptides tell us aboutviral envelope glycoprotein-mediated membrane fusion. Mol.Membr. Biol. 14, 97–112.
6. Pritsker, M., Rucker, J., Hoffman, T. L., Doms, R. W., and Shai,Y. (1999) Effect of nonpolar substitutions of the conserved Phe11in the fusion peptide of HIV-1 gp41 on its function, structure, andorganization in membranes. Biochemistry 38, 11359–11371.
7. Freed, E. O., Delwart, E. L., Buchschacher, G. L., Jr., andPanganiban, A. T. (1992) A mutation in the human immunodefi-ciency virus type 1 transmembrane glycoprotein gp41 dominantlyinterferes with fusion and infectivity. Proc. Natl. Acad. Sci. U.S.A.89, 70–74.
8. Delahunty, M. D., Rhee, I., Freed, E. O., and Bonifacino, J. S.(1996) Mutational analysis of the fusion peptide of the humanimmunodeficiency virus type 1: Identification of critical glycineresidues. Virology 218, 94–102.
9. Tan, K., Liu, J., Wang, J., Shen, S., and Lu, M. (1997) Atomicstructure of a thermostable subdomain of HIV-1 gp41. Proc. Natl.Acad. Sci. U.S.A. 94, 12303–12308.
10. Weissenhorn, W., Dessen, A., Harrison, S. C., Skehel, J. J., andWiley, D. C. (1997) Atomic structure of the ectodomain fromHIV-1 gp41. Nature 387, 426–430.
11. Caffrey, M., Cai, M., Kaufman, J., Stahl, S. J., Wingfield, P. T.,Covell, D. G., Gronenborn, A. M., and Clore, G. M. (1998) Three-dimensional solution structure of the 44 kDa ectodomain of SIVgp41. EMBO J. 17, 4572–4584.
12. Yang, R., Yang, J., and Weliky, D. P. (2003) Synthesis, enhancedfusogenicity, and solid state NMR measurements of cross-linkedHIV-1 fusion peptides. Biochemistry 42, 3527–3535.
13. Yang, R., Prorok, M., Castellino, F. J., and Weliky, D. P. (2004)A trimeric HIV-1 fusion peptide construct which does not self-associate in aqueous solution and which has 15-fold highermembrane fusion rate. J. Am. Chem. Soc. 126, 14722–14723.
14. Zheng, Z., Yang, R., Bodner, M. L., and Weliky, D. P. (2006)Conformational flexibility and strand arrangements of the membrane-associated HIV fusion peptide trimer probed by solid-state NMRspectroscopy. Biochemistry 45, 12960–12975.
15. Farrera-Sinfreu, J., Royo, M., and Albericio, F. (2002) Undesiredremoval of the Fmoc group by the free ε-amino function of a lysineresidue. Tetrahedron Lett. 43, 7813–7815.
16. Nieva, J. L., Nir, S., Muga, A., Goni, F. M., and Wilschut, J. (1994)Interaction of the HIV-1 fusion peptide with phospholipid vesicles:Different structural requirements for fusion and leakage. Biochem-istry 33, 3201–3209.
17. Jaroniec, C. P., Kaufman, J. D., Stahl, S. J., Viard, M., Blumenthal,R., Wingfield, P. T., and Bax, A. (2005) Structure and dynamicsof micelle-associated human immunodeficiency virus gp41 fusiondomain. Biochemistry 44, 16167–16180.
18. Chang, D. K., Cheng, S. F., and Chien, W. J. (1997) The amino-terminal fusion domain peptide of human immunodeficiency virustype 1 gp41 inserts into the sodium dodecyl sulfate micelleprimarily as a helix with a conserved glycine at the micelle-waterinterface. J. Virol. 71, 6593–6602.
19. Morris, K. F., Gao, X. F., and Wong, T. C. (2004) The interactionsof the HIV gp41 fusion peptides with zwitterionic membranemimics determined by NMR spectroscopy. Biochim. Biophys. Acta1667, 67–81.
20. Li, Y. L., and Tamm, L. K. (2007) Structure and plasticity of thehuman immunodeficiency virus gp41 fusion domain in lipidmicelles and bilayers. Biophys. J. 93, 876–885.
21. Gabrys, C. M., and Weliky, D. P. (2007) Chemical shift assignmentand structural plasticity of a HIV fusion peptide derivative indodecylphosphocholine micelles. Biochim. Biophys. Acta 1768,3225–3234.
22. Epand, R. M. (2003) Fusion peptides and the mechanism of viralfusion. Biochim. Biophys. Acta 1614, 116–121.
23. Rafalski, M., Lear, J. D., and DeGrado, W. F. (1990) Phospholipidinteractions of synthetic peptides representing the N-terminus ofHIV gp41. Biochemistry 29, 7917–7922.
24. Qiang, W., Bodner, M. L., and Weliky, D. P. (2008) Solid-stateNMR spectroscopy of human immunodeficiency virus fusionpeptides associated with host-cell-like membranes: 2D correlationspectra and distance measurements support a fully extendedconformation and models for specific antiparallel strand registries.J. Am. Chem. Soc. 130, 5459–5471.
25. Kamath, S., and Wong, T. C. (2002) Membrane structure of thehuman immunodeficiency virus gp41 fusion domain by moleculardynamics simulation. Biophys. J. 83, 135–143.
26. Maddox, M. W., and Longo, M. L. (2002) Conformationalpartitioning of the fusion peptide of HIV-1 gp41 and its structuralanalogs in bilayer membranes. Biophys. J. 83, 3088–3096.
27. Agirre, A., Flach, C., Goni, F. M., Mendelsohn, R., Valpuesta,J. M., Wu, F. J., and Nieva, J. L. (2000) Interactions of the HIV-1fusion peptide with large unilamellar vesicles and monolayers. Acryo-TEM and spectroscopic study. Biochim. Biophys. Acta 1467,153–164.
28. Haque, M. E., Koppaka, V., Axelsen, P. H., and Lentz, B. R. (2005)Properties and structures of the influenza and HIV fusion peptideson lipid membranes: Implications for a role in fusion. Biophys. J.89, 3183–3194.
29. Gordon, L. M., Curtain, C. C., Zhong, Y. C., Kirkpatrick, A.,Mobley, P. W., and Waring, A. J. (1992) The amino-terminalpeptide of HIV-1 glycoprotein 41 interacts with human erythrocytemembranes: Peptide conformation, orientation and aggregation.Biochim. Biophys. Acta 1139, 257–274.
30. Qiang, W., Yang, J., and Weliky, D. P. (2007) Solid-state nuclearmagnetic resonance measurements of HIV fusion peptide to lipiddistances reveal the intimate contact of � strand peptide withmembranes and the proximity of the Ala-14-Gly-16 region withlipid headgroups. Biochemistry 46, 4997–5008.
31. Lapatsanis, L., Milias, G., Froussios, K., and Kolovos, M. (1983)Synthesis of N-2,2,2-(trichloroethoxycarbonyl)-L-amino acids andN-(9-fluorenylmethoxycarbonyl)-L-amino acids involving succin-imidoxy anion as a leaving group in amino-acid protection.Synthesis 8, 671–673.
32. Kaiser, E., Colescott, R. L., Bossinger, C. D., and Cook, P. I. (1970)Color test for detection of free terminal amino groups in solid-phase synthesis of peptides. Anal. Biochem. 34, 595–598.
33. Struck, D. K., Hoekstra, D., and Pagano, R. E. (1981) Use ofresonance energy transfer to monitor membrane fusion. Biochem-istry 20, 4093–4099.
34. Aloia, R. C., Tian, H., and Jensen, F. C. (1993) Lipid compositionand fluidity of the human immunodeficiency virus envelope andhost cell plasma membranes. Proc. Natl. Acad. Sci. U.S.A. 90,5181–5185.
35. Brugger, B., Glass, B., Haberkant, P., Leibrecht, I., Wieland, F. T.,and Krasslich, H. G. (2006) The HIV lipidome: A raft with anunusual composition. Proc. Natl. Acad. Sci. U.S.A. 103, 2641–2646.
36. Yang, J., and Weliky, D. P. (2003) Solid state nuclear magneticresonance evidence for parallel and antiparallel strand arrangementsin the membrane-associated HIV-1 fusion peptide. Biochemistry42, 11879–11890.
37. Toke, O., Maloy, W. L., Kim, S. J., Blazyk, J., and Schaefer, J.(2004) Secondary structure and lipid contact of a peptide antibioticin phospholipid bilayers by REDOR. Biophys. J. 87, 662–674.
38. Zhang, H. Y., Neal, S., and Wishart, D. S. (2003) RefDB: Adatabase of uniformly referenced protein chemical shifts. J. Biomol.NMR 25, 173–195.
39. Bak, M., Rasmussen, J. T., and Nielsen, N. C. (2000) SIMPSON:A general simulation program for solid-state NMR spectroscopy.J. Magn. Reson. 147, 296–330.
40. Balbach, J. J., Ishii, Y., Antzutkin, O. N., Leapman, R. D., Rizzo,N. W., Dyda, F., Reed, J., and Tycko, R. (2000) Amyloid fibrilformation by A�16-22, a seven-residue fragment of the Alzheimer’s�-amyloid peptide, and structural characterization by solid stateNMR. Biochemistry 39, 13748–13759.
41. Yang, J., Parkanzky, P. D., Bodner, M. L., Duskin, C. G., andWeliky, D. P. (2002) Application of REDOR subtraction for filteredMAS observation of labeled backbone carbons of membrane-boundfusion peptides. J. Magn. Reson. 159, 101–110.
42. Wasniewski, C. M., Parkanzky, P. D., Bodner, M. L., and Weliky,D. P. (2004) Solid-state nuclear magnetic resonance studies of HIVand influenza fusion peptide orientations in membrane bilayersusing stacked glass plate samples. Chem. Phys. Lipids 132, 89–100.
43. Silvius, J. R. (2003) Role of cholesterol in lipid raft formation:Lessons from lipid model systems. Biochim. Biophys. Acta 1610,174–183.
44. Yang, J., Prorok, M., Castellino, F. J., and Weliky, D. P. (2004)Oligomeric � structure of the membrane-bound HIV-1 fusionpeptide formed from soluble monomers. Biophys. J. 87, 1951–1963.
45. Hofmann, M. W., Weise, K., Ollesch, J., Agrawal, P., Stalz, H.,Stelzer, W., Hulsbergen, F., de Groot, H., Gerwert, K., Reed, J.,and Langosch, D. (2004) De novo design of conformationally
300 Biochemistry, Vol. 48, No. 2, 2009 Qiang and Weliky

flexible transmembrane peptides driving membrane fusion. Proc.Natl. Acad. Sci. U.S.A. 101, 14776–14781.
46. Reichert, J., Grasnick, D., Afonin, S., Buerck, J., Wadhwani, P.,and Ulrich, A. S. (2007) A critical evaluation of the conformationalrequirements of fusogenic peptides in membranes. Eur. Biophys.J. 36, 405–413.
47. Buzon, V., Padros, E., and Cladera, J. (2005) Interaction of fusionpeptides from HIV gp41 with membranes: A time-resolvedmembrane binding, lipid mixing, and structural study. Biochemistry44, 13354–13364.
48. Hessa, T., Kim, H., Bihlmaier, K., Lundin, C., Boekel, J.,Andersson, H., Nilsson, I., White, S. H., and Heijne, G. (2005)Recognition of tranmembrane helices by the endoplasmic reticulumtranslocon. Nature 433, 377–381.
49. Bloom, M., Evans, E., and Mouritsen, O. G. (1991) Physicalproperties of the fluid lipid-bilayer component of cell membranes:A perspective. Q. ReV. Biophys. 24, 293–397.
50. Sun, Y., and Weliky, D. P. Unpublished experiments.
BI8015668
Comparison of HIV Fusion Peptide Oligomers Biochemistry, Vol. 48, No. 2, 2009 301

Supporting Information for “The HIV Fusion Peptide and its Cross-Linked Oligomers:
Efficient Syntheses, Significance of the Trimer in Fusion Activity, Correlation of β
Strand Conformation with Membrane Cholesterol, and Proximity to Lipid Headgroups”
by Wei Qiang and David P. Weliky
1. Solid-State NMR REDOR Experiments and Data Analysis
Experiments were done on a 9.4 T solid-state NMR spectrometer (Varian Infinity
Plus, Palo Alto, CA) equipped with a triple resonance MAS probe. The detection channel
was tuned to 13C at 100.8 MHz, the decoupling channel was tuned to 1H at 400.8 MHz,
and the third channel was tuned to 31P at 162.2 MHz. The 13C shifts were externally
referenced to the methylene resonance of adamantane at 40.5 ppm, 31P shifts were
referenced to 85% H3PO4 at 0 ppm, and the 13C and 31P transmitter chemical shifts were
156 and –16 ppm, respectively. The 13C referencing allows direct comparison with 13C
shift databases derived from liquid-state NMR assignments of proteins (1-3). Samples
were cooled with nitrogen gas at –50 oC to enhance signal and to prevent motional
averaging of the dipolar coupling. The HFP chemical shifts and presumably HFP
conformation are very similar in cooled and ambient temperature samples (4). The MAS
frequency was 8000 ± 2 Hz, and the recycle delay was 1 s.
The sample used for calibration of the REDOR parameters contained 0.8 μmol
unlabeled HFPmn and 20 μmol 1,2-dipalmitoyl[1-13C]-sn-glycero-3-phosphocholine
(DPPC-13C). The sample was prepared according to the protocol of the main text, the
13CO signal was dominated by the labeled nuclei, and the 13CO-31P distances were 5 – 6
Å (5). The 1H and 13C rf fields were initially calibrated with adamantane and the 13C
1

cross-polarization field was then adjusted to give the maximum 13CO signal of the
standard sample. The 31P π pulse length was set by minimization of the S1 signal in this
sample for τ = 24 ms and the 1H TPPM pulse length was set to give the maximum S0
signal. The parameter values were confirmed by determination of d from analysis of
REDOR data in the sample for τ between 1 and 19 ms. The best-fit d = 68 Hz
corresponded to the reasonable value r = 5.6 Å (6).
Each spectrum was processed with 300 Hz Gaussian line broadening and
polynomial baseline correction. Integration of the 13CO peak over a 1 ppm range in the S0
and S1 spectra yielded integrals which were denoted “S0exp” and “S1
exp”, respectively. The
dipolar coupling was assessed from variation of the normalized experimental dephasing
parameter (ΔS/S0)exp with τ where (ΔS/S0)exp = 1 – S1exp/S0
exp. The uncertainty in (ΔS/S0)exp,
σ exp, was determined from σS0, the root-mean-squared deviation of twelve integration
regions (1 ppm) in the S0 spectrum, and from the analogous quantity σS1 (7):
( ) ( )( )1
2 22 20 1
2
0
exp expS S
exp
exp
S S
S
σ σσ
⎡ ⎤ ⎡ ⎤× + ×⎢ ⎥ ⎢ ⎥⎣ ⎦ ⎣=0 ⎦ (Eq. S1)
The labeled HFP 13CO nucleus provided the dominant (~75%) contribution to
S0exp and S1
exp and a plot of (ΔS/S0)exp vs τ provided qualitative and semi-quantitative
information about the proximity of this 13CO nucleus to the 31P nuclei in the membrane.
The HFPmn-A15, HFPdm-A15, and HFPtr-A15 samples had large (ΔS/S0)exp and more
quantitative analysis was made for the dipolar coupling between the labeled 13CO nucleus
and the closest 31P nucleus. The analysis considered that S0exp had labeled (S0
lab) and
natural abundance (S0na) contributions and that S1
exp had analogous contributions. The
2

resultant (ΔS/S0)lab were directly compared to (ΔS/S0)sim calculated for dipolar coupling of
a single 13CO-31P spin pair:
0 0
0 0 0 0
Δ Δ1lab exp nana na
lab lab
S SS SS S S S
⎡ ⎤ ⎡⎛ ⎞ ⎛ ⎞ ⎛ ⎞ ⎛ ⎞ ⎛ ⎞⎢ ⎥ ⎢≈ + × − ×⎜ ⎟ ⎜ ⎟ ⎜ ⎟ ⎜ ⎟ ⎜ ⎟⎢ ⎥ ⎢⎝ ⎠ ⎝ ⎠ ⎝ ⎠ ⎝ ⎠ ⎝ ⎠⎣ ⎦ ⎣ 0
ΔSS
⎤⎥⎥⎦
(Eq. S2)
The 0
0
na
labS
S = 0.32 and was calculated as (fractional 13C natural abundance) × (total
number of residues – number of labeled residues)/(number of labeled residues).
Calculations of (ΔS/S0)na were based on previously determined (ΔS/S0)exp for membrane-
associated HFPmn samples which were triply 13CO labeled at three residues: Ala-1 to
Val-3, Gly-5 to Leu-7, Phe-8 to Gly-10, Phe-11 to Gly-13, or Ala-14 to Gly-16 (6). For a
particular membrane composition and value of τ, the (ΔS/S0)na was calculated as the
average of the corresponding (ΔS/S0)exp of the triply labeled samples. In PC:PG
membranes, (ΔS/S0)na = 0.024, 0.077, 0.143 and 0.197 for τ = 2, 8, 16 and 24 ms,
respectively, and in PC:PG:CHOL membranes, (ΔS/S0)na = 0.028, 0.051, 0.122 and 0.145
for τ = 2, 8, 16 and 24 ms, respectively. The ratios (ΔS/S0)lab/(ΔS/S0)exp typically varied
between 0.9 and 1.2 and the (ΔS/S0)lab were not strongly dependent on the value of
(ΔS/S0)na. Further derivation and details are provided in Section 2.
The σ lab were calculated with σ lab = (1 + S0na/S0
lab) × σ exp which neglected the
small contribution from the far-right term in Eq. S2. Simulations of the experimental data
were based on a single 13CO-31P spin pair model:
252
0 210
[ ( 2 )]1 [ ( 2 )] 216 1
sim
k
k
JS JS k
λλ=
⎧ ⎫⎛ ⎞Δ ⎪ ⎪= − + ×⎨ ⎬⎜ ⎟ −⎪ ⎪⎝ ⎠ ⎩ ⎭∑ (Eq. S3)
3

with λ = d × τ and Jk as the k th order Bessel function of the first kind (8). The samples
contained multiple 13CO-31P distances and couplings and these are approximated as a
single d and a single r in Eq. S3 (9-12).
At larger τ, the (ΔS/S0)exp and the (ΔS/S0)lab reached plateau values which were
significantly smaller than 1 while the (ΔS/S0)sim had plateau values of ~1. This
inconsistency was resolved using a model of two populations of membrane-associated
HFPs. The “f ” fraction represented the HFPs whose Ala-15 13COs were close to the lipid
31Ps with corresponding d ≠ 0 while the “1−f ” fraction represented the HFPs whose Ala-
15 13COs were far from the lipid 31Ps with corresponding d = 0. Fitting was done with an
array of values of d and f and the best-fit d corresponded to the minimum
χ 2(d, f ):
( )( )
2
0 022
1,
( )
lab sim
T i i
labi i
S Sf dS S
d fχσ=
⎡ ⎤⎧ ⎫⎛ ⎞ ⎛ ⎞Δ Δ⎪ ⎪⎢ ⎥− ×⎨ ⎬⎜ ⎟ ⎜ ⎟⎢ ⎥⎝ ⎠ ⎝ ⎠⎪ ⎪⎩ ⎭⎣= ∑ ⎦ (Eq. S4)
where T is the number of τ values. The uncertainties of d and f were calculated with the
χ 2 = χ 2min + 1 criterion (7).
2. (ΔS/S0)exp, (ΔS/S0)lab, and (ΔS/S0)na for the HFP-A15 Samples
The definition of (ΔS/S0)exp:
0 0 1 1 1
0 0 0 0 0 0
1exp lab na lab na lab na
lab na lab na lab na
S S S S S SSS S S S S S
⎛ ⎞ + − −Δ= = −⎜ ⎟ + +⎝ ⎠
1
0S−
+ (Eq. S5)
where exp ≡ experimental, lab ≡ labeled, and na ≡ natural abundance. Multiplication of
the left-most and right-most sides of Eq. S5 by (S0lab + S0
na)/S0lab is followed by algebraic
manipulation:
4

( )0
0 0 0
1exp lab nana
lab lab
SS S SS S S S
⎡ ⎤ Δ⎛ ⎞ ⎛ ⎞ ⎛ ⎞Δ Δ⎢ ⎥+ × = +⎜ ⎟ ⎜ ⎟ ⎜ ⎟⎢ ⎥⎝ ⎠ ⎝ ⎠ ⎝ ⎠⎣ ⎦ 0
(Eq. S6)
Multiplication of the right-most term by (S0na/S0
na) is followed by algebraic manipulation
to yield Eq. S2:
0 0
0 0 0 0
Δ Δ1lab exp nana na
lab lab
S SS SS S S S
⎡ ⎤ ⎡⎛ ⎞ ⎛ ⎞ ⎛ ⎞ ⎛ ⎞ ⎛ ⎞⎢ ⎥ ⎢= + × − ×⎜ ⎟ ⎜ ⎟ ⎜ ⎟ ⎜ ⎟ ⎜ ⎟⎢ ⎥ ⎢⎝ ⎠ ⎝ ⎠ ⎝ ⎠ ⎝ ⎠ ⎝ ⎠⎣ ⎦ ⎣ 0
ΔSS
⎤⎥⎥⎦
0 0
Δ1 32 0 32exp na
S. .S S
⎡ ⎤ ⎡⎛ ⎞ ⎛ ⎞⎢ ⎥ ⎢= × − ×⎜ ⎟ ⎜ ⎟⎢ ⎥ ⎢⎝ ⎠ ⎝ ⎠⎣ ⎦ ⎣
ΔS ⎤⎥⎥⎦
(Eq. S7)
where S0na/S0
lab = 0.32 was determined using the 13C natural abundance (0.011) and the
~1:29 ratio of labeled to unlabeled amino acids in each sample. The values of (ΔS/S0)na
were calculated using the average of the (ΔS/S0)exp values determined for HFPmn samples
which were 13CO labeled at three sequential residues, cf. Tables S1 and S2.
5

Table S1. (ΔS/S0)exp as a function of dephasing time in PC:PG membranes a,b,c
Dephasing time (ms) Peptide
HFPmn-1AVG HFPmn-5GAL HFPmn-8FLG HFPmn-11FLG HFPmn-14AAG 2 0.046 0.002 -0.030 0.030 0.002 8 0.052 0.080 -0.032 0.035 0.210
16 0.134 0.076 0.077 0.105 0.374 24 0.248 0.145 0.100 0.143 0.415
Table S2. (ΔS/S0)exp as a function of dephasing time in PC:PG:CHOL membranes a,b,c
Dephasing time (ms) Peptide
HFPmn-1AVG HFPmn-5GAL HFPmn-8FLG HFPmn-11FLG HFPmn-14AAG 2 0.048 0.012 0.025 0.038 0.013 8 0.049 0.047 -0.010 0.040 0.151
16 0.136 0.073 0.054 0.089 0.270 24 0.205 0.052 0.035 0.163 0.312
a “HFPmn–1AVG” was 13CO labeled at Ala-1, Val-2, and Gly-3, “HFPmn–5GAL” was 13CO labeled at Gly-5, Ala-6, and Leu-7, etc. b Data for the HFPmn-1AVG sample are from the present study while data for other samples are from earlier studies (6). c The typical uncertainty in each (ΔS/S0)exp value is ±0.01.
For each membrane composition and each τ :
1 5 8 110 0 0 0 0
0 5
exp exp exp exp exp
na14HFPmn AVG HFPmn GAL HFPmn FLG HFPmn FLG HFPmn AAG
S S S S SS S S S SS
S− − − −
⎛ ⎞ ⎛ ⎞ ⎛ ⎞ ⎛ ⎞ ⎛ ⎞Δ Δ Δ Δ Δ+ + + +⎜ ⎟ ⎜ ⎟ ⎜ ⎟ ⎜ ⎟ ⎜ ⎟⎛ ⎞Δ ⎝ ⎠ ⎝ ⎠ ⎝ ⎠ ⎝ ⎠ ⎝ ⎠=⎜ ⎟⎝ ⎠
−
(Eq. S8)
Table S3. (ΔS/S0)na values calculated using Eq. S8
Dephasing time (ms) PC:PG membranes PC:PG:CHOL membranes 2 0.024 0.028 8 0.077 0.051
16 0.143 0.122 24 0.197 0.145
6
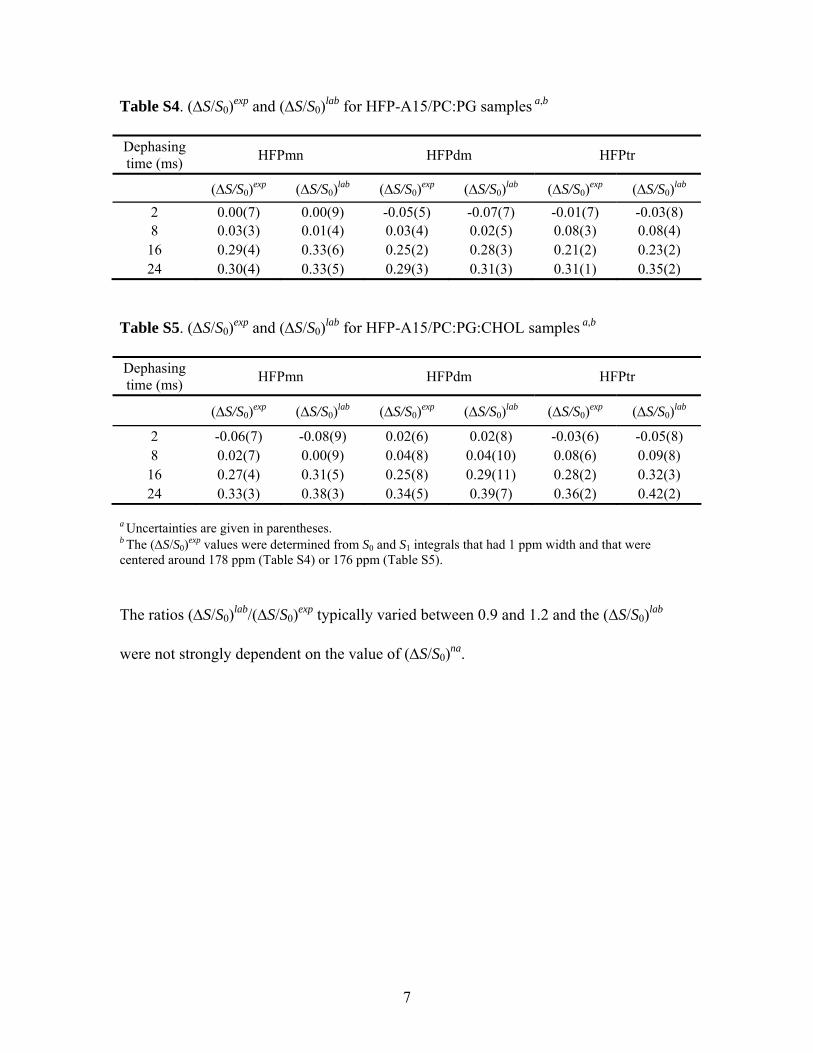
Table S4. (ΔS/S0)exp and (ΔS/S0)lab for HFP-A15/PC:PG samples a,b
Dephasing time (ms) HFPmn HFPdm HFPtr
(ΔS/S0)exp (ΔS/S0)lab (ΔS/S0)exp (ΔS/S0)lab (ΔS/S0)exp (ΔS/S0)lab 2 0.00(7) 0.00(9) -0.05(5) -0.07(7) -0.01(7) -0.03(8) 8 0.03(3) 0.01(4) 0.03(4) 0.02(5) 0.08(3) 0.08(4)
16 0.29(4) 0.33(6) 0.25(2) 0.28(3) 0.21(2) 0.23(2) 24 0.30(4) 0.33(5) 0.29(3) 0.31(3) 0.31(1) 0.35(2)
Table S5. (ΔS/S0)exp and (ΔS/S0)lab for HFP-A15/PC:PG:CHOL samples a,b
Dephasing time (ms) HFPmn HFPdm HFPtr
(ΔS/S0)exp (ΔS/S0)lab (ΔS/S0)exp (ΔS/S0)lab (ΔS/S0)exp (ΔS/S0)lab
2 -0.06(7) -0.08(9) 0.02(6) 0.02(8) -0.03(6) -0.05(8) 8 0.02(7) 0.00(9) 0.04(8) 0.04(10) 0.08(6) 0.09(8)
16 0.27(4) 0.31(5) 0.25(8) 0.29(11) 0.28(2) 0.32(3) 24 0.33(3) 0.38(3) 0.34(5) 0.39(7) 0.36(2) 0.42(2)
a Uncertainties are given in parentheses. b The (ΔS/S0)exp values were determined from S0 and S1 integrals that had 1 ppm width and that were centered around 178 ppm (Table S4) or 176 ppm (Table S5).
The ratios (ΔS/S0)lab/(ΔS/S0)exp typically varied between 0.9 and 1.2 and the (ΔS/S0)lab
were not strongly dependent on the value of (ΔS/S0)na.
7

Figure S1. Plot of (ΔS/S0)lab (lines showing error bars) and the best-fit (ΔS/S0)sim (circles)
vs dephasing time for the HFPtr-A15/PC:PG sample. The best-fit d and f used to
calculate (ΔS/S0)sim are listed in Table 3 in the main text and were calculated using Eq S4.
3. Fitting of the Lipid Mixing Data
0.4
0.2
0.0
0 10 20Dephasing time (ms)
ΔS
/S0
Table 2 in the main text lists the best-fit parameters for the normalized
fluorescence data F(t) vs t at 35 oC. Fitting at other temperatures was also done using
Eq. 2 in the main text which is reproduced here for clarity.
10 1 2( ) (1 ) (1 )k t k tF t F F e F e−= + − + − 2− (Eq. S9)
8

Table S6. Best-fit parameters for HFPdm a
Temp. (ºC) k1 (10-3 s-1) k2 (10-3 s-1) F0 (a.u.) F1 (a.u.) F2 (a.u.) 25 32.0(0.4) 3.5(0.4) 0.4(0.1) 18.9(1.1) 19.6(1.4) 30 42.0(0.4) 3.9(0.3) 0.3(0.1) 19.7(0.7) 19.5(0.6) 35 54.9(0.3) 4.9(0.2) 0.5(0.1) 19.6(0.3) 19.8(0.1) 40 69.9(0.5) 6.5(0.2) 0.7(0.1) 19.7(0.3) 19.8(0.3)
Table S7. Best-fit parameters for HFPtr a
Temp. (ºC) k1 (10-3 s-1) k2 (10-3 s-1) F0 (a.u.) F1 (a.u.) F2 (a.u.) 25 95.2(0.9) 11.6(0.1) 0.4(0.1) 50.1(1.1) 50.0(0.7) 30 116.3(2.7) 14.3(0.2) 0.7(0.1) 50.0(1.5) 49.9(1.1) 35 139(3) 17.3(0.3) 0.9(0.2) 50.1(0.2) 50.0(0.2) 40 156.2(4.7) 19.3(0.2) 0.9(0.2) 50.1(0.8) 49.9(0.7)
Table S8. Best-fit parameters for HFPte a Temp. (ºC) k1 (10-3 s-1) k2 (10-3 s-1) F0 (a.u.) F1 (a.u.) F2 (a.u.)
25 141(6) 12.4(0.1) 0.6(0.2) 50.0(0.7) 50.1(0.5) 30 164(6) 14.5(0.2) 0.6(0.3) 50.1(0.7) 50.0(0.4) 35 185(7) 20.7(0.3) 0.9(0.3) 49.8(0.3) 50.1(0.2) 40 208(8) 20.7(0.1) 1.1(0.3) 50.0(0.6) 50.0(0.5)
a Uncertainties are given in parentheses.
Figure S2. Plots of the normalized fluorescence F(t) (squares) and best-fitting (red curve)
vs time for HFPte at 25ºC.
9

4. References
(1) Zhang, H. Y., Neal, S., and Wishart, D. S. (2003) RefDB: A database of uniformly referenced protein chemical shifts. J. Biomol. NMR 25, 173-195.
(2) Morcombe, C. R., and Zilm, K. W. (2003) Chemical shift referencing in MAS solid state NMR. J. Magn. Reson. 162, 479-486.
(3) Igumenova, T. I., McDermott, A. E., Zilm, K. W., Martin, R. W., Paulson, E. K., and Wand, A. J. (2004) Assignments of carbon NMR resonances for microcrystalline ubiquitin. J. Am. Chem. Soc. 126, 6720-6727.
(4) Bodner, M. L., Gabrys, C. M., Parkanzky, P. D., Yang, J., Duskin, C. A., and Weliky, D. P. (2004) Temperature dependence and resonance assignment of 13C NMR spectra of selectively and uniformly labeled fusion peptides associated with membranes. Magn. Reson. Chem. 42, 187-194.
(5) Venable, R. M., Brooks, B. R., and Pastor, R. W. (2000) Molecular dynamics simulations of gel (LβI) phase lipid bilayers in constant pressure and constant surface area ensembles. J. Chem. Phys. 112, 4822-4832.
(6) Qiang, W., Yang, J., and Weliky, D. P. (2007) Solid-state nuclear magnetic resonance measurements of HIV fusion peptide to lipid distances reveal the intimate contact of beta strand peptide with membranes and the proximity of the Ala-14-Gly-16 region with lipid headgroups. Biochemistry 46, 4997-5008.
(7) Bevington, P. R., and Robinson, D. K. (1992) Data Reduction and Error Analysis for the Physical Sciences, 2nd ed., McGraw-Hill, Boston.
(8) Mueller, K. T. (1995) Analytical solutions for the time evolution of dipolar-dephasing NMR signals. J. Magn. Reson. Ser. A 113, 81-93.
(9) Yang, J., and Weliky, D. P. (2003) Solid state nuclear magnetic resonance evidence for parallel and antiparallel strand arrangements in the membrane-associated HIV-1 fusion peptide. Biochemistry 42, 11879-11890.
(10) Toke, O., Maloy, W. L., Kim, S. J., Blazyk, J., and Schaefer, J. (2004) Secondary structure and lipid contact of a peptide antibiotic in phospholipid bilayers by REDOR. Biophys. J. 87, 662-674.
(11) Raghunathan, V., Gibson, J. M., Goobes, G., Popham, J. M., Louie, E. A., Stayton, P. S., and Drobny, G. P. (2006) Homonuclear and heteronuclear NMR studies of a statherin fragment bound to hydroxyapatite crystals. J. Phys. Chem. B 110, 9324-9332.
(12) Doherty, T., Waring, A., and Hong, M. (2006) Membrane-bound conformation and topology of the antimicrobial peptide tachyplesin I by solid-state NMR. Biochemistry 45, 13323-13330.
10