200908 2019-2020 final ehs hs annual report
TRANSCRIPT

2019‐2020 EARLY HEAD START AND HEAD START ANNUAL REPORT
NEK‐CAP, INC. 2
From the Desk of Jeanette “Jet” Sperfslage, NEK-CAP, Inc. Director of Program Operations
The first disclaimer I need to make is this annual report will be much different than past Annual reports. COVID 19 changed the way we operated after March 15, 2020. This completed our first year of the five-year grant. It was our intention to work diligently to meet some of the program goal’s benchmarks, however, the best laid plans can be waylaid. The staff working for NEK-CAP, Inc. are some of the best people I have ever had the privilege of working with to make a difference in the lives of people in Northeast/North Central Kansas.
This report will provide an analysis and evaluation of the 2019-2020 Early Head Start and Head Start programmatic and fiscal information from the most recently concluded fiscal year. The Annual Report is a assembling of: program description; the total amount of public and private funds and budgetary expenditures; the results of the most recent review of the financial audit; the average monthly attendance (as a percentage of funded enrollment); the percentage of enrolled children receiving medical and dental exams, mental health services and early intervention services; information about family engagement activities and socializations; school readiness and child outcomes; self-assessment results; Health and Safety Review results; and upcoming changes for 2020-2021 school year for Early Head Start and Head Start.
NEK-CAP, Inc. Early Head Start and Head Start are dedicated to providing children with the skills to be ready to enter elementary school and succeed, even with the added challenge of doing so virtually. We are committed to empowering families to succeed in their role as parents and becoming economically secure. We are enthusiastic about working with the community and making America a better place to live!
On behalf of the Early Head Start and Head Start staff, please review this information to become familiar with our program and join us in giving children and their families many opportunities to improve their lifestyle.
Have a great year,
Jeanette “Jet” Sperfslage, LMSW, CCAP, NCRT
Director of Program Operations

2019‐2020 EARLY HEAD START AND HEAD START ANNUAL REPORT
NEK‐CAP, INC. 3
NEK-CAP, Inc. Vision
One by one all families and communities become self – reliant.
NEK-CAP, Inc. Mission
NEK-CAP, Inc. provides comprehensive education and social services to low-income community members through collaborative partnerships focused on promoting family development,
empowerment, and economic security.
Community Action Promise
"Community Action changes people's lives, embodies the spirit of hope, improves communities, and makes America a better place to live. We care about the entire community, and we are dedicated to
helping people help themselves and each other."
Early Head Start – Head Start Program Goals
Goal # 1. NEK-CAP, Inc. will be recognized as an agency that delivers exemplary comprehensive services to children, families, and the community.
Goal # 2. NEK-CAP Inc. EHS/HS will aspire to be an exemplary place of employment.
Goal # 3. NEK-CAP Inc. will utilize innovation to support dynamic growth.

2019‐2020 EARLY HEAD START AND HEAD START ANNUAL REPORT
NEK‐CAP, INC. 4
NEK-CAP, Inc. Early Head Start and Head Start Program Description For Program Year 2019-2020
NEK-CAP, Inc. provides Early Head Start and Head Start services to the nine counties pictured above. Atchison County Three extended day Head Start classrooms and three Early Head Start Child and Family Advocates. Brown County Two extended day classrooms one in Horton and the other in Hiawatha and two Early Head Start Child and Family Advocates. Doniphan County One Early Head Start Child and Family Advocate in Troy. Jackson County Three extended day Head Start classrooms and one Early Head Start Child and Family Advocate located in the Annie Laurie Johnson Center (only center owned by the program) in Holton. Jefferson County One extended day Head Start classroom in Meriden and one Early Head Start Child and Family Advocate located in Meriden.

2019‐2020 EARLY HEAD START AND HEAD START ANNUAL REPORT
NEK‐CAP, INC. 5
Leavenworth County Two-part day Head Start classrooms and two Early Head Start Child and Family Advocates located in Leavenworth. Marshall County One extended day Head Start classroom and one Early Head Start Child and Family Advocate located in Marysville. Nemaha County One-part day Head Start classroom in Seneca, opened one extended day classroom in Sabetha and one Early Head Start Child and Family Advocate located in Sabetha. Pottawatomie County One extended day Head Start classroom in Havensville and two Early Head Start Child and Family Advocates in Westmoreland. NEK-CAP, Inc. has three-part day Head Start classrooms (128 days for 3.5 hours) serving 51 children and eleven extended day Head Start classrooms (160 days for 1020 hours per program year) serving 204 children, totaling 255 Federal Head Start children. NEK-CAP, Inc. employs 14 Child and Family Advocates providing home base services in 9 counties, serving 160 Federal Early Head children.

2019‐2020 EARLY HEAD START AND HEAD START ANNUAL REPORT
NEK‐CAP, INC. 6
Head Start In the 2019-2020 Head Start program year; the program served 290 children in 253 families. The program owned 16 buses; 13 are used daily and three are backup buses. Head Start transported 173 children throughout the year. NEK-CAP, Inc. employees approximately 106 staff in Head Start with 16% or 17 staff being current or past Early Head Start/Head Start parents. The turnover in Head Start was 27 staff or 26% staff turnover. One teacher with an advanced degree in early childhood education; four of the 14 teachers and three assistant teachers have baccalaureate degrees in early childhood education or baccalaureate with field and coursework equivalent to an early childhood degree; three teachers and three assistant teachers have associate degrees in early childhood education or associate with field and coursework equivalent to an early childhood degree; one assistant teachers have Child Development Associate credential or a certification, credential or license meeting the requirements.
Head Start Child Demographics
Race American Indian or Alaska Native 13 Asian 1 Black or African American 24 Native Hawaiian or other Pacific Islander 1 White 199 Biracial/Multiracial 52 Ethnicity Hispanic or Latino origin 38
Non-Hispanic or Non-Latino origin 252
Head Start Family Information
# of families % of families Total number of families 253 The number of two-parent families 124 49% The number of single-parent families 129 51%
Families by Education level of Parents/Guardians
An advanced degree or baccalaureate degree 18 7%
An associate degree, vocational school, or some college 88 35% A high school graduate or GED 113 48% Less than high school graduate 34 14%

2019‐2020 EARLY HEAD START AND HEAD START ANNUAL REPORT
NEK‐CAP, INC. 7
Employment Status of Parents/ Guardians at enrollment Two Parent Both parents/guardians are employed 39 32% One parent/guardian is employed 70 56% Both parents/guardians are not working such as those that are as those that are unemployed, retired, or disabled 15 12% Single Parent The parent/guardian is employed 77 60% The parent/guardian is not working 51 40% The number of all families in which at least one parent/ guardian is a member of the United States military on active duty. 3 1%
Federal Assistance Programs Number of Families
at enrollment Number of Families
at End of Year Enrollment
Total number of families receiving any cash benefits or other services under the Federal Temporary Assistance for Needy
Families (TANF) program 5 6 Total number of families receiving Supplemental Security
Income (SSI) 17 17 Total number of families receiving services under the Special
Supplemental Nutrition Program for Women, Infants and Children (WIC) 142 131
Total number of families receiving services under the Supplemental Nutrition Assistance Program (SNAP) 115 114

2019‐2020 EARLY HEAD START AND HEAD START ANNUAL REPORT
NEK‐CAP, INC. 8
Early Head Start In the 2019-2020 Early Head Start program year; the program served 250 children, 30 pregnant women and 172 families. NEK-CAP, Inc. employees a total of 14 full time staff in the Early Head Start and shares seven managers/coordinators/assistants with Head Start; 36% or 5 staff being current or former Early Head Start or Head Start parents. Ten of the staff have baccalaureate degrees, including the supervisor and coordinator; three have associate degrees; three have a Child Development Associate Credential and one have high school/GED degrees.
Early Head Start Children and Pregnant Women Demographics
Race
American Indian or Alaska Native 13
Asian 0
Black or African American 20
Native Hawaiian or other Pacific Islander 2
White 183
Biracial/Multiracial 32
Ethnicity
Hispanic or Latino origin 27
Non-Hispanic or Non-Latino origin 223
Early Head Start Family Information
# of families % of families
Total number of families 172
The number of two-parent families 91 53%
The number of single-parent families 81 47%
Families by Education level of Parents/Guardians
An advanced degree or baccalaureate degree 9 5%
An associate degree, vocational school, or some college 52 30%
A high school graduate or GED 87 51%
Less than high school graduate 24 14%

2019‐2020 EARLY HEAD START AND HEAD START ANNUAL REPORT
NEK‐CAP, INC. 9
Employment Status of Parents/
Guardians
Two Parent
Both parents/guardians are employed 14 15%
One parent/guardian is employed 57 63% Both parents/guardians are not working
such as those that are unemployed, retired, or disabled 18 20%
Single Parent
The parent/guardian is employed 38 47%
The parent/guardian is not working 43 53% The number of all families in which at
least one parent/guardian is a member of the United States military on active duty 4 2%
Federal Assistance Programs Number of Families at enrollment
Number of Families at End of Year
Enrollment
Total number of families receiving any cash benefits or other services under the Federal Temporary Assistance for Needy
Families (TANF) program 9 9 Total number of families receiving Supplemental Security
Income (SSI) 19 17 Total number of families receiving services under the Special
Supplemental Nutrition Program for Women, Infants and Children (WIC) 138 127
Total number of families receiving services under the Supplemental Nutrition Assistance Program (SNAP) 101 95

2019‐2020 EARLY HEAD START AND HEAD START ANNUAL REPORT
NEK‐CAP, INC. 10
Fiscal Information for NEK-CAP, Inc. Early Head Start and Head Start Program
Federal Head Start/Early Head Start Grant 07CH7068/06 and 07CH011099/1
Statement of Revenues and Expenses Twelve Months Ended March 31, 2020
Because the program was in DRS and the NOGA is not out until July -3 months are under the old grant number and 9 months are under the new grant number
REVENUE Actual Budget Variance
(Over)/Under
Federal Revenue $ 1,080,905 $ 1,094,110 $ 13,205 Program Income (Additive Method**) - - -
In-Kind Contributions
335,507
273,528 (61,979) TOTAL REVENUE $ 1,416,412 $ 1,367,638 $ (48,774)
EXPENSES Personnel $ 542,719 $ 585,066 $ 42,347
Fringe Benefits
194,190
189,548 (4,642)
Travel
5,335
2,923 (2,412) Equipment - - -
Supplies
43,738
35,446 (8,292) Contractual - -
Other
153,345
120,565 (32,780)
Indirect Costs
141,579
160,562 18,983
In-Kind Expenses*
335,507
273,528 (61,979) TOTAL EXPENSES $ 1,416,412 $ 1,367,638 $ (48,774)

2019‐2020 EARLY HEAD START AND HEAD START ANNUAL REPORT
NEK‐CAP, INC. 11
REVENUE Actual Budget Variance
(Over)/Under
Federal Revenue 4,755,692
4,883,847 128,155
Program Income (Additive Method**) 14,856 - (14,856)
In-Kind Contributions 1,129,895
820,962 (308,933)
TOTAL REVENUE $ 5,900,443 $ 5,704,809 $ (195,634)
EXPENSES
Personnel 2,334,086
2,495,420 161,334
Fringe Benefits 745,518
698,398 (47,120)
Travel 34,420
39,696 5,276
Equipment 128,777
142,821 14,044
Supplies 402,726
285,148 (117,578)
Contractual - -
Other 533,351
535,521 2,170
Indirect Costs 591,669
686,843 95,174
In-Kind Expenses* 1,129,895
820,962 (308,933)
TOTAL EXPENSES $ 5,900,443 $ 5,704,809 $ (195,634)

2019‐2020 EARLY HEAD START AND HEAD START ANNUAL REPORT
NEK‐CAP, INC. 12
Northeast Kansas Community Action, Inc. Child and Adult Food Program Grant Statement of Revenues and Expenses
Program Years 2019 and 2020
REVENUE
Previous Six Month Period
10/1/2018-3/31/2019
Current Six Month Period
4/1/2019-9/30/2019
Total Twelve Month Period
10/1/2018-9/30/2019 Budget
Variance (Over)/Under
Federal Revenue $ 104,310 $ 33,714 $ 138,024 $170,000 $ 31,976
Unearned Federal Revenue (7,295) 7,295 - - -
-
TOTAL REVENUE $ 97,015 $ 41,009 $ 138,024 $170,000 $ 31,976
EXPENSES Personnel and Fringe Benefits $ 2,381 $ - $ 2,381 $ 16,652 $ 14,271 Supplies/Food Service Equipment Repair or Additions 94,153 41,009 135,162
149,894 14,732
Indirect Costs 481 - 481 3,454 2,973
TOTAL EXPENSES $ 97,015 $ 41,009 $ 138,024 $170,000 $ 31,976
REVENUE
Current Six Month Period
10/1/2019-3/31/2020 Budget
Variance (Over)/Under
Federal Revenue $ 117,302 $ 198,000 $ 80,698
Unearned Federal Revenue (28,702) - 28,702
TOTAL REVENUE $ 88,600 $ 198,000 $ 109,400
EXPENSES
Personnel and Fringe Benefits $ - $ - $ -
Supplies/Food Service Equipment Repair or Additions 88,600 198,000 109,400
Indirect Costs - - -
TOTAL EXPENSES $ 88,600 $ 198,000 $ 109,400

2019‐2020 EARLY HEAD START AND HEAD START ANNUAL REPORT
NEK‐CAP, INC. 13
NORTHEAST KANSAS COMMUNITY ACTION PROGRAM, INC.
USDA, FOOD AND NUTRITION SERVICE (TEAM NUTRITION GRANT) - 168KS1513503
STATEMENT OF REVENUES AND EXPENSES TEN MONTHS ENDED SEPTEMBER 29, 2019
REVENUE
Previous Six Month Period
12/1/2018-3/31/2019
Current Six
Month Period
4/1/2019-9/29/2019
Total Ten Month Period
12/1/2018-9/29/2019 Budget
Variance (Over)/Under
Federal Revenue $ 1,734 $ - $ 1,734 $ 1,734 $ -
Unearned Federal Revenue
(1,477)
1,477
-
- -
-
TOTAL REVENUE $ 257 $ 1,477 $ 1,734 $ 1,734 $ -
EXPENSES
Educational Supplies 257 1,477
1,734
- (1,734)
TOTAL EXPENSES $ 257 $ 1,477 $ 1,734 $ - $ (1,734)
2019‐2020 EARLY HEAD START AND HEAD START ANNUAL REPORT
NEK‐CAP, INC. 14
Audit Report April 1, 2019 – March 31, 2020
INDEPENDENT AUDITOR’S REPORT

2019‐2020 EARLY HEAD START AND HEAD START ANNUAL REPORT
NEK‐CAP, INC. 15

2019‐2020 EARLY HEAD START AND HEAD START ANNUAL REPORT
NEK‐CAP, INC. 16
Total Funded Enrollment and Attendance Head Start
Program year – September 1, 2019 – June 30, 2020 Due to COVID – Attendance ended in March
Center Enrollment Attendance Atchison – 3 classrooms 51 86%
84% 79%
North Brown 17 86% South Brown 17 85% Jackson – 3 classrooms 51 91%
80% 87%
Jefferson - Meriden 17 86% Leavenworth – 2 classrooms 34 84%
82% Marshall 17 93% Nemaha – Sabetha 17 80% Nemaha - Seneca 17 87% North Pottawatomie – Havensville 17 85%
Early Head Start Attendance Program Year – July 1, 2019 to June 30, 2020 Full year – Virtual after March due to COVID
Caseloads/County Attendance Atchison – Three staff 88%
89% 93%
South Brown 71% North Brown 68% Doniphan 92% Jackson 79% Jefferson 94% Leavenworth – Two staff 94%
74% Marshall 66% Nemaha – Sabetha 90% Pottawatomie – Westmoreland Two staff
64% 90%

2019‐2020 EARLY HEAD START AND HEAD START ANNUAL REPORT
NEK‐CAP, INC. 17
Nutrition NEK-CAP, Inc.’s CACFP/Nutrition Manager, Kathy Barrett, strives to educate staff about child nutrition. The program has cycle menus, saving time for the nutrition providers and supporting them in providing tasty meals rich in nutrients! During the program year 2019-2020, NEK-CAP, Inc. served:
Month Breakfast
Served 187 daily
Lunches Served
255 daily
Snack Served
170 daily
Monthly Reimbursement
Children with Meal Modifications
August 399 398 382 5,996 0 September 2,652 3,380 1,757 20,724 13 October 2,753 3,669 2,076 20,437 15 November 1,921 2,543 1,441 14,673 15 December 2,237 3,022 1,760 14,283 15 January 2,509 3,388 1,855 0 NO Data 15 February 2,177 3,004 1,588 19,380 19 March 2,789 3,761 2,085 9,380 19 April NO meals due to COVID May Total 15,283 16,805 13,291 $104,873 NA for this column
This is a total of 45,379 breakfast, lunch and snacks served to Head Start Children.
Additional Nutrition News
NEK-CAP, Inc. supports Backpack Buddies in their Leavenworth, South Brown and North Brown centers.

2019‐2020 EARLY HEAD START AND HEAD START ANNUAL REPORT
NEK‐CAP, INC. 18
Enrolled children receiving Medical and Dental Exams, Mental health services and Early Intervention Services
Program Year – July 1, 2019 – June 30, 2020
Number of Head Start Children Number of EHS Children Health Insurance at the end of enrollment
282 215
Medical Home at the end of enrollment
282 215
Up to date on a schedule of age appropriate preventive and primary health care
255 106
Immunizations up to date 163* 150* Dental home at the end of enrollment
315 188
Children who received preventive dental care
270 158
Mental Health services at the end of enrollment
244
2
Children receiving a referral for mental health services
0 3
Enrolled children with an IEP or IFSP
51 42
(Newly Enrolled) Number screened for educational/ developmental /sensory / behavior concerns since the last PIR
184 98
Number identified needing follow assessment
49 5
*Many children did not get a flu shot. It is recommended by the CDC. Also, COVID interrupted our services because health departments were only doing COVID related task… Prenatal Women Twenty-seven of the thirty pregnant women served by the program had some type of health insurance. Ninety-three percent of the pregnant women enrolled in the program received prenatal health care, 66% received postpartum health care 66% received mental health interventions/follow-up, 83% received substance abuse prevention, 17% received substance abuse treatment, 90% received prenatal education on fetal development and 87% received information on the benefits of breast feeding. Eight prenatal women were identified as medically high risk by a physician or health care provider. Eight of the 30 left the program before the birth of their child; 16 pregnant women received services at the time their child was born, and 16 children enrolled after they were born.

2019‐2020 EARLY HEAD START AND HEAD START ANNUAL REPORT
NEK‐CAP, INC. 19
Family Engagement Activities and Socializations
July 1, 2019 – June 30, 2020
NEK-CAP, Inc. Early Head Start and Head Start provides parents opportunities to be actively engaged in their child’s education. The whole family plays an important role in a child’s growth and development. Head Start Parent Engagement Activities, parent-teacher conferences, Early Head Start weekly home visits, socializations, working daily with their child at home, Parent Committees and Policy Council are ways parents can become engaged in the program. Family Development Advocates and Child and Family Advocates support parents in developing solid working relationships and work collaboratively to identify strengths and goals supporting families’ journey to self-reliance. Education staff members in each center inform parents about school readiness goals and support parents in completing “homework” with the children providing the program with non-federal share.
In Head Start, 69 father/father figures were involved in the family assessment; 72 father/father figures were involved in family goal setting; 96 were involved in their child’s development experience; 8 father/father figure was involved in program governance and 28 father/father figures attended parenting workshops. In Early Head Start, 43 father/father figures were involved in the family assessment; 51 father/father figures were involved in family goal setting; 57 father/father figures were involved in their child’s developmental experiences, such as weekly home visits, three father/father figure was involved in program governance and 18 fathers participated in parenting education workshops. 342 parents (duplicated count) attended Early Head Start socializations and 667 parents (duplicated count) attended Family Engagement Activities across the nine-county area.
Parent Gauge
Parent Gauge was completed during the 2019-2020 Program Year. Parent Gauge is a tool that was developed by NHSA to allow programs to take parents’ own words and concretely measure whether your efforts meet the needs of your families. Programs can use this tool to identify the needs of their families, the strengths of their Parent Family Community Engagement efforts, and areas for improvement. Below are a few areas in which the tool was used for Early Head Start and Head Start. This information displays the growth between the midyear and post interviews. 1 is the lowest score- with 5 being the highest
Early Head Start
The program does not have any data from Parent Gauge on Early Head Start.

2019‐2020 EARLY HEAD START AND HEAD START ANNUAL REPORT
NEK‐CAP, INC. 20
Head Start

2019‐2020 EARLY HEAD START AND HEAD START ANNUAL REPORT
NEK‐CAP, INC. 21
Volunteers
Volunteers are very important to our Early Head Start and Head Start program. There are several ways you can volunteer for the program, including classroom assistant, field trips, helping a child do homework and serving on Parent Committees and Policy Council. During the 2019-2020 year there were 665 volunteers supported Head Start and 275 volunteers support Early Head Start since the past Program Information Report year. NEK-CAP, Inc. appreciates our volunteers and the non-federal share (in-kind) they provide through volunteering their time, resources and monetary contribution to the program.
The total amount collected is
$ 1,449,017 – $194,921 below the actual amount needed of 1,643,939.
This was the first year that NEK-CAP, Inc. has had to request a waiver. Some of the decrease in federal non-share is that COVID took us out of the classrooms and the increase in funding we received for our extended day
locations.
Thank YOU! The program could not do this much without the dedication of our families and staff to ensure we have collected the in-kind needed for our grant! We are looking forward to the upcoming year and meeting our
match.
2019‐2020 EARLY HEAD START AND HEAD START ANNUAL REPORT
NEK‐CAP, INC. 22
School Readiness and Child Outcomes
September 1, 2019 – June 30, 2020
Submitted by Education Managers – Kim Lackey, Karla Winterscheidt
NEK-CAP, Inc.’s goal for all children and families is to demonstrate the characteristics and skills necessary for school success. We believe the child and the family need to be school ready to make a successful impact on the future. In this report, we lay the foundation for child outcomes and school readiness goals related to the child outcomes.
At NEK-CAP, Inc., the development of all children is monitored, and their progress evaluated using many different tools and techniques. Utilization of these tools enables our staff to identify possible developmental concerns at an early age. Education staff have been trained to use the Ages and Stages Questionnaire (ASQ) and the Ages and Stages Questionnaire-Social Emotional (ASQ-SE). Also, NEK-CAP, Inc. staff are trained to complete on-going health/dental screenings as well. NEK-CAP, Inc.’s primary ongoing assessment for children is Work Sampling Online for Head Start and the OUNCE for Early Head Start. This is an observation-based tool aligned with our curriculum, the Head Start Early Learning Framework, and the Kansas Early Learning Standards. Each child’s progress is assessed, and this information is then used for lesson planning, home visit discussion, and individual and classroom assessment. This tool tracks the child’s growth and development throughout the course of enrollment in the program(s). Data, as seen below, is aggregated and analyzed throughout the year, following each checkpoint period. Furthermore, the data analysis assists with guiding staff training and development, strategic planning, and classroom/home visitor assessment.
As children move through the natural sequence of developmental milestones, NEK-CAP, Inc. believes the role of our staff is to support families through this process. This support comes in the form of educational home visits, parent/teacher conferences, referrals, ongoing screenings and assessment, parent engagement opportunities, Family Team Support meetings and classroom education. NEK-CAP, Inc. education staff provides the individual child report to the parents to view the progress, any areas of concern, and this natural sequence of developmental. Thus, building on our belief of the parental role as the primary role in the child’s development, as well as, building a foundation for school readiness for the whole family. The parent/caregiver provides observations and assessment input for each checkpoint period and/or development screening.
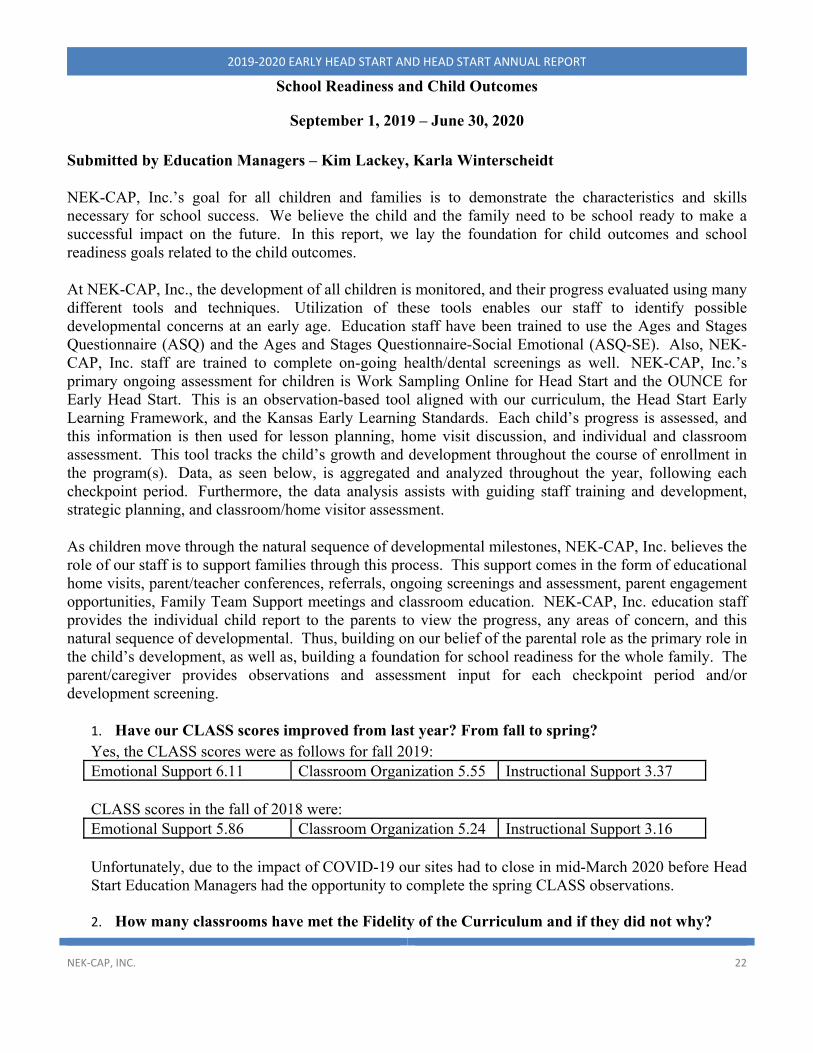
1. Have our CLASS scores improved from last year? From fall to spring? Yes, the CLASS scores were as follows for fall 2019: Emotional Support 6.11 Classroom Organization 5.55 Instructional Support 3.37 CLASS scores in the fall of 2018 were: Emotional Support 5.86 Classroom Organization 5.24 Instructional Support 3.16 Unfortunately, due to the impact of COVID-19 our sites had to close in mid-March 2020 before Head Start Education Managers had the opportunity to complete the spring CLASS observations.
2. How many classrooms have met the Fidelity of the Curriculum and if they did not why?

2019‐2020 EARLY HEAD START AND HEAD START ANNUAL REPORT
NEK‐CAP, INC. 23
Head Start Education Managers and Coordinators offered training regarding fidelity of the curriculum at the beginning of the school year in all the areas of The Creative Curriculum for Preschool Fidelity Tool that is utilized by the program. There are three parts to the fidelity tool and Head Start Education Managers utilized parts one and two only. Part three pertains to the Teaching Strategies GOLD assessment tool which the program no longer uses. Education Managers used the Physical Environment portion of the fidelity tool to assess classrooms after they were set up when staff returned to work to make sure the classroom environment was meeting fidelity standards before classes started in August and September. Education Managers offered feedback to staff throughout this time period and follow up visits to review any changes or answer questions. Education Managers did parts one and two of the fidelity tool for each classroom in the winter months and offered feedback and scores from fidelity check. There are three scoring categories, weak, moderate & strong range. Offering feedback and having discussions with teaching staff regarding what was observed helped deepen understanding and promotes change when needed. 3. What school readiness skills are the children meeting or exceeding and which are low? Have
we had training for the areas the program is low in? This is the second-year teachers utilized the Work Sampling Online assessment tool for measuring growth in five categories that includes Approaches Towards Learning, Social and Emotional Development, Perceptual, Motor and Physical Development, Language Development and Literacy and Cognition. The children are ranked three times a year in these areas as Not Yet, In Process or Proficient. The charts below show the percentages of children proficient in those areas for each checkpoint period. The chart for the three-year-old children showed the largest growth from fall to spring in Perceptual, Motor and Physical Development and the least amount of growth in the Cognition.
3-yr-old
Approaches Towards Learning
(creative arts expression)
Social & Emotional
Development
Perceptual, Motor & Physical
Development
Language Development & Literacy Knowledge
& Skills
Cognition (logic &
reasoning, mathematics,
science, social
studies)
Fall 3.4% 9.9% 6.9% 3.0% 2.88%
Winter 16.8% 22.1% 26.0% 13.35% 9.15%
Spring 38.5% 47.3% 48.8% % 25.4%
Growth Fall to Spring 35.1% 37.4% 41.9% 27.5% 22.52%
For the four-year-old children this chart below shows the children with the most growth in Language Development & Literacy and the least growth in with Cognition.
4-yr-old
Approaches Towards Learning (creative
arts expression)
Social & Emotional
Development
Perceptual, Motor & Physical
Development
Language Development & Literacy Knowledge
& Skills
Cognition (logic &
reasoning, mathematics,
science, social
studies)

2019‐2020 EARLY HEAD START AND HEAD START ANNUAL REPORT
NEK‐CAP, INC. 24
Fall 9.35% 10.3% 16.8% 9.8% 2.57%
Winter 25.7% 32.7% 43.9% 25.7% 12.13%
Spring 69.6% 68.2% 80.4% 68.25% 54.67%
Growth Fall to Spring 60.30% 57.9% 63.6% 68.45% 52.10%
Our Program was considering changing curriculum and piloted Frog Street 3’s and Pre-K in a few of our classrooms for the 2019-2020 school year. A Frog Street curriculum trainer was brought in to train those staff in its use. We received enthusiastic feedback from those staff and have decided to end our use of The Creative Curriculum for Preschool and to purchase the Frog Street 3’s and Pre-K curriculum for all of our classrooms for the 2020-2021 school year. Conscious Discipline is imbedded within the curriculum. Education Managers planned for in-person training to take place but again due to COVID-19 the in-person training was deferred, and virtual training was held over 3 separate days. This training was available for all site staff to take part in efforts to help staff gain a deeper understanding of how incorporating the practice of Conscious Discipline and curriculum as a whole rather than independent of each other will help to strengthen concept development for the children and curriculum fidelity overall with the goal of achieving higher outcomes for children.
Early Head Start
Are the children meeting or exceeding in areas of child development?
The Early Head Start program utilizes The Ounce Scale for the online child assessment tool. EHS Home Based staff input weekly observations and link the appropriate indicators each week. Each checkpoint period, staff finalize the indicators for the children that have aged out of an age range during that 3-month period.
The Ounce online tool has the capacity to split data based on the following age groups. Below is a list of age groups for the Early Head Start program.
Babies I- Birth to 4 months
Babies II- 4 months to 8 months
Babies III- 8 months to 12 months
Babies IV- 12 months to 18 months
Toddlers I- 18 months to 24 months
Toddlers II- 24 months to 30 months
Toddlers III- 30 months to 36 months
2019‐2020 EARLY HEAD START AND HEAD START ANNUAL REPORT
NEK‐CAP, INC. 25
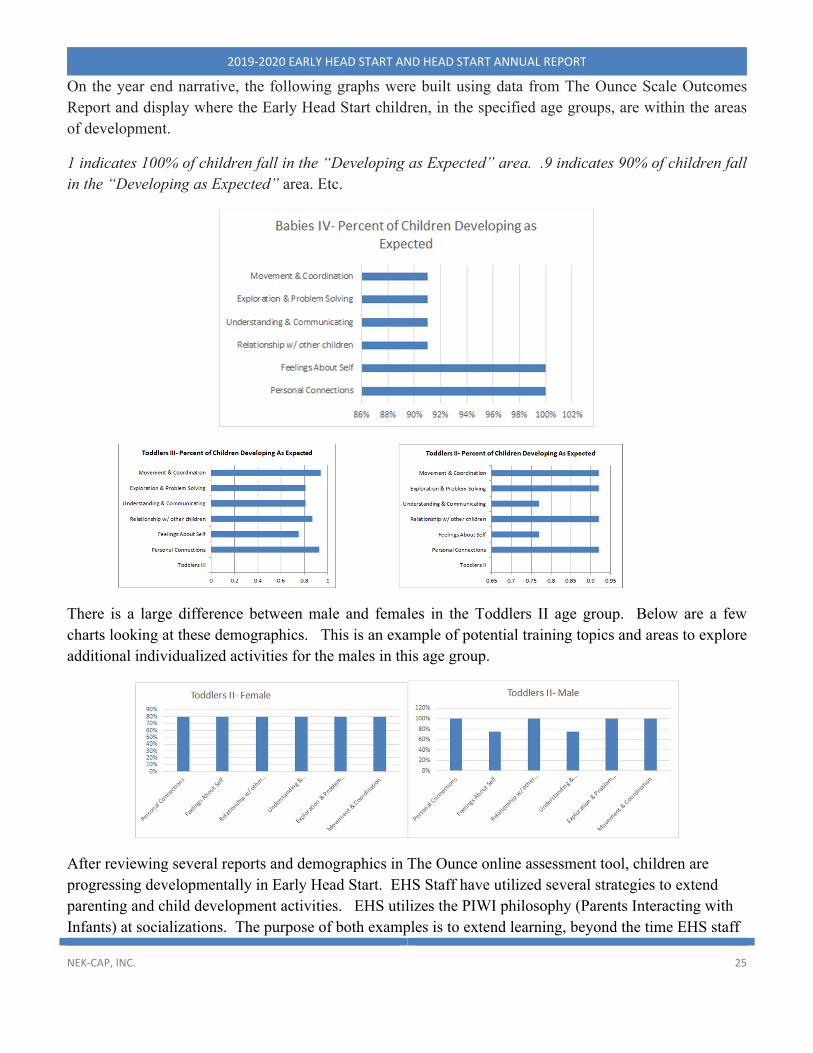
On the year end narrative, the following graphs were built using data from The Ounce Scale Outcomes Report and display where the Early Head Start children, in the specified age groups, are within the areas of development.
1 indicates 100% of children fall in the “Developing as Expected” area. .9 indicates 90% of children fall in the “Developing as Expected” area. Etc.
There is a large difference between male and females in the Toddlers II age group. Below are a few charts looking at these demographics. This is an example of potential training topics and areas to explore additional individualized activities for the males in this age group.
After reviewing several reports and demographics in The Ounce online assessment tool, children are progressing developmentally in Early Head Start. EHS Staff have utilized several strategies to extend parenting and child development activities. EHS utilizes the PIWI philosophy (Parents Interacting with Infants) at socializations. The purpose of both examples is to extend learning, beyond the time EHS staff

2019‐2020 EARLY HEAD START AND HEAD START ANNUAL REPORT
NEK‐CAP, INC. 26
is with the family, and create a more individualized approach. Out of the 125 socializations offered from July 2019 to March 2020, a total of 232 parents attended throughout the year.
Due to the COVID-19 pandemic, NEK-CAP, Inc. Early Head Start have not been able to provide face to face socialization opportunities. In response to the virtual atmosphere, staff provided parents with activities, supplies, and learning tools via a “knock and drop” setting. EHS staff then followed up with this during the weekly video call with the families. The program had several wonderful stories come out of the supplies provided to families. At the end of April, EHS had a total of 125 children up to date on their EPSDT schedule and 104 children up to date on their immunizations (to include the influenza vaccination). (April was chosen, due to the COVID-19 Pandemic) NEK-CAP, Inc. EHS had a total of 30 children with IFSPs, at the end of May 2020. Numerous success stories came through, despite the stressful times all families were in.
Additional EHS data and narrative:
The EHS Education Manager randomly chose 20 families enrolled since the beginning of the program year, 7/1/2019, and remained in the program throughout the whole 19-20 program year. Of the 20 families chosen, 14 increased in their self-sufficiency matrix scores- on an average increase of 4.21. The amount of families that increased their score is considerably higher from last year’s total of 8.
Four (4) families saw a decrease in the self-sufficiency score- for an average decrease of 3.5. This number is also considerably lower than last year’s average decrease of 4.25. Both are signs that our program and services and strategies provided have improved and families are working towards self-sufficiency.
The final two (2) families remained the same on their self-sufficiency scores.
In the data review, the correlation between the number of completed home visits and family outcomes was difficult to determine. Of the 20 families mentioned above, whom were enrolled throughout the whole program year, had a varying number of home visits. The number of home visits ranged from 22 to 46 visits last program year. However, there were only three (3) families that had 22, 23 and 27 visits, two of which saw a decrease in their self-sufficiency score. All other families received in the upper 30’s to 46 visits.
In conclusion, the data being recorded at this time displays that home visiting, when done in an individualized, wholistic approach will assist in sustaining and/or boosting self-sufficiency.

2019‐2020 EARLY HEAD START AND HEAD START ANNUAL REPORT
NEK‐CAP, INC. 27
CLASS
Classroom Assessment Scoring System
CLASS is a benchmark for Head Start classrooms in deciding the quality of each program across the nation. NEK-CAP, Inc. explains upon hire to staff and throughout the year - what CLASS is about including each domain and dimension. This tool is used in the Fall and Spring of the program year to show quality and growth in NEK-CAP, Inc.’s educational staff.
Head Start utilizes the CLASS Pre-k tool for observations twice a year to measure the interactions of the teachers with the children in the classrooms. After the observations, the CLASS scores discussed with the teaching staff being observed by classroom. CLASS can be used with staff for professional development in specific dimensions in which the educational staff needs or wants improvement. When all the classrooms have been observed in the Fall, Education Managers develop charts for each domain; Emotional Support, Classroom Organization and Instructional Support, with the scores of each of the domains and the letters representing each classroom. This is to help staff understand where their classroom falls in correlation with all NEK-CAP, Inc. classrooms on the chart. This provides the educational staff in each classroom with something to strive for before the next observation.

2019‐2020 EARLY HEAD START AND HEAD START ANNUAL REPORT
NEK‐CAP, INC. 28
In this table any of the grantees in the lowest 10% or below are put into the Designation Renewal System (DRS).
The program closed because of COVID so the managers were not able to do the spring observations so we really do not know if it would have changed or not.