2010 cpug con tobias lachmann check point troubleshooting
TRANSCRIPT

Check Point Troubleshooting“Oops! It’s not working!”

Introduction
Troubleshooting is more or less the same sinceyears
The great „How to use fw monitor” document is from 2003 – still valid!
Some minor changes to buffer size, command lineoptions
New kernel modules introduced with R70 and R71, but no information officially available
We have to stick with the old stuff

How to approach troubleshootingCollect information
What is the problem? What are the symptoms?Can the problem be replicated?Random occurence?Anything changed in the setup?User-related or machine-related?List systems that are part of the conversation

Bug or configuration problem?
Common configuration problems:
Firewall rule prevents trafficSmartDefense / IPS blade prevents trafficAntispoofingmisconfigured routingwrong encryption domainwrong username / password
How to approach troubleshooting
How to approach troubleshootingAny reference for problem or error message?
official documentationSecureKnowledgeCPUG forumCheck Point forumGoogle

fw ctl zdebug dropReplicate the problem and have a look at the gateway:
fw ctl zdebug drop
lists all dropped packets in realtimegives an explanation why the packet is dropped
fw_log_drop: Packet proto=6 81.63.88.122:2720 -> 212.1.52.64:445 dropped by fw_handle_first_packet Reason: Rulebase drop -rule 12;
Why is it called zdebug? Developed by Tamir Zegman.

Firewall statusCurrent connections?
fw tab –t connections –s
[Expert@firewallr70]# fw tab -t connections -sHOST NAME ID #VALS #PEAK #SLINKSlocalhost connections 8158 1 1 1
fw ctl pstat | grep Connections
[Expert@firewallr70]# fw ctl pstat | grep ConnectionsConcurrent Connections: 0% (1 out of 24900) - below low watermark

ClusterXL
Status information
fw hastat
HOST NUMBER HIGH AVAILABILITY STATE MACHINE STATUSlocalhost 2 stand-by OK
cphaprob state
Cluster Mode: New High Availability (Primary Up)
Number Unique Address Assigned Load State
1 192.168.55.202 100% Active2 (local) 192.168.55.201 0% Standby

ClusterXLDisplays ClusterXL Devices
cphaprob –ia list
Displays physical and cluster interfaces
cphaprob –a if
Statistics of ClusterXL sync
fw ctl pstatcphaprob syncstat
Reset statistics of ClusterXL sync
cphaprob –reset syncstat

LicensesLimited number of hosts?
fw lichosts
Count of used hosts
fw lichosts | wc –l
SecureClient licenses used
dtps lic

LicensesShow license
cplic print
Compare to SmartUpdate / SmartView Monitor output
Especially UTM products sometimes tend to mess up with licenses which can cause Antivirus, Antispamor URL filtering to stop working
You need to keep contracts updated!
Use evaluation licenses for testing!

Content scanning
Verify update process of Antivirus or URL filteringusing avsu_client command
avsu_client –app „URL Filtering“fetch_remote –fi
for fetching the index file (signatures up-to-date?)
avsu_client –app „URL Filtering“fetch_remote –fe <[email protected]> <password>
for fetching entitlement / signatures

fw monitorWhat is it?
fw monitor command triggers a Check Pointkernel module that is used to capture packets.
What makes it different?
Packet capture at multiple positions within the kernelmodule chain, both for inbound and outboundpackets. It doesn‘t work on Layer-2, so no MAC addresses are shown in the output.
fw monitor is available on all platforms.
fw monitorWhat makes it different?
filters packets using INSPECT code
sees packets „with the eyes of the gateway“
Shows flow of packets through the gateway
No Layer-2 information in capture files

fw monitor
IP Routing IP
VM
NIC
VM
NIC
TCP
App.
TCP
App.
post-inbound (I)
pre-inbound (i) post-outbound (O)
pre-outbound (o)

fw monitor[Expert@fw1]# fw monitor -e "accept (src=212.1.52.68 or
dst=212.1.52.68);"monitor: getting filter (from command line)monitor: compilingmonitorfilter:Compiled OK.monitor: loadingmonitor: monitoring (control-C to stop)eth3.7:i[52]: 212.1.56.233 -> 212.1.52.68 (TCP) len=52 id=18406TCP: 56661 -> 22 .S.... seq=b2f3509d ack=00000000eth3.7:I[52]: 212.1.56.233 -> 212.1.52.68 (TCP) len=52 id=18406TCP: 56661 -> 22 .S.... seq=b2f3509d ack=00000000eth0:o[52]: 212.1.56.233 -> 212.1.52.68 (TCP) len=52 id=18406TCP: 56661 -> 22 .S.... seq=b2f3509d ack=00000000eth0:O[52]: 212.1.56.233 -> 212.1.52.68 (TCP) len=52 id=18406TCP: 56661 -> 22 .S.... seq=b2f3509d ack=00000000eth0:i[52]: 212.1.52.68 -> 212.1.56.233 (TCP) len=52 id=0TCP: 22 -> 56661 .S..A. seq=68a919c9 ack=b2f3509eeth0:I[52]: 212.1.52.68 -> 212.1.56.233 (TCP) len=52 id=0TCP: 22 -> 56661 .S..A. seq=68a919c9 ack=b2f3509eeth3.7:o[52]: 212.1.52.68 -> 212.1.56.233 (TCP) len=52 id=0TCP: 22 -> 56661 .S..A. seq=68a919c9 ack=b2f3509eeth3.7:O[52]: 212.1.52.68 -> 212.1.56.233 (TCP) len=52 id=0TCP: 22 -> 56661 .S..A. seq=68a919c9 ack=b2f3509e

fw monitoreth3.7:O[52]: 212.1.52.68 -> 212.1.56.233 (TCP) len=52 id=0
TCP: 22 -> 56661 .S..A. seq=68a919c9 ack=b2f3509e

fw monitorfw monitor options overview
-u | s Shows UUID or SUUID for every packet-i write data to STDOUT-d | D debug / more debug output-e <expr> filter for expression (CLI mode)-f <file> read filter expression from file-l <len> limit length of captured packet-m <mask> which positions should be shown-x print raw packet data-o <file> write packet into file-p|x| <pos> insert fw monitor at specific chain position-p all insert fwmonitor between all kernel modules-ci <count> stop capture after count incoming packets-co <count> stop capture after count outgoing packets

fw monitor

fw monitor
fw monitor -e "accept [9:1]=1;“
Capture only ICMP packets

fw monitorCapture only packets from a special host
fw monitor -e "accept [12,b]=192.168.1.1;“
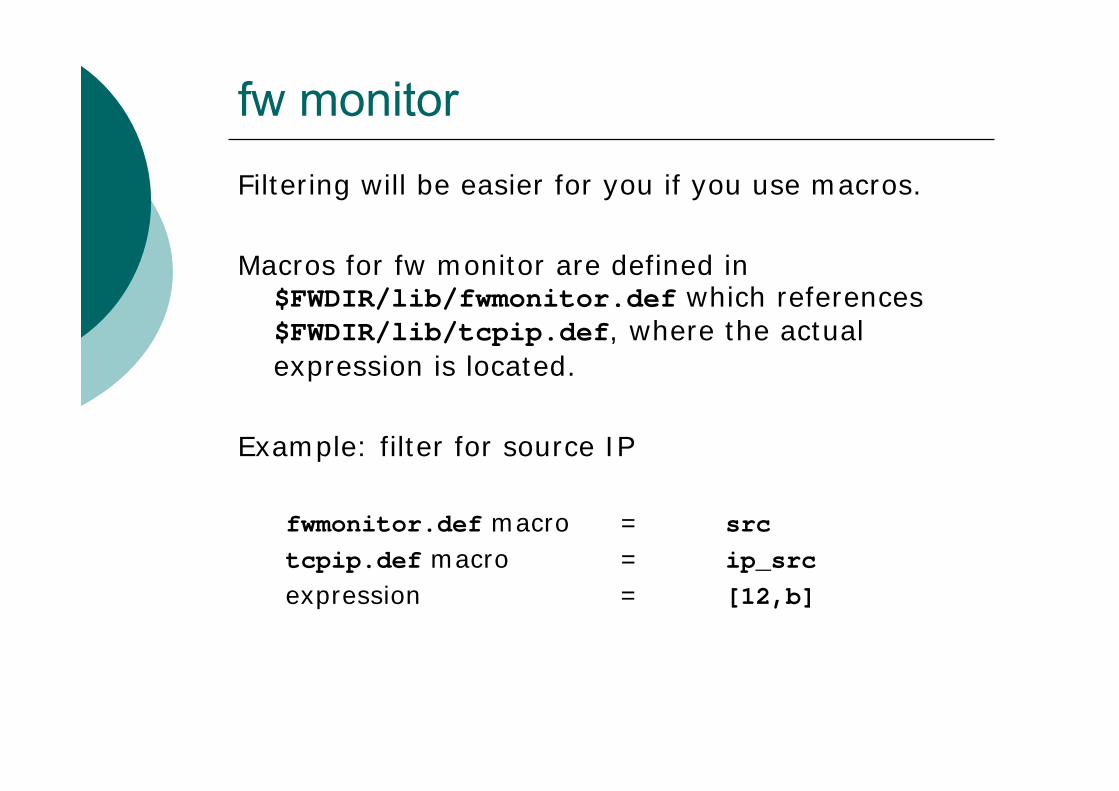
fw monitorFiltering will be easier for you if you use macros.
Macros for fw monitor are defined in $FWDIR/lib/fwmonitor.def which references$FWDIR/lib/tcpip.def, where the actualexpression is located.
Example: filter for source IP
fwmonitor.def macro = srctcpip.def macro = ip_srcexpression = [12,b]

fw monitorUse macros together with operators to add
complexity:
accept (src=x.x.x.x or dst=x.x.x.x)
accept ((src=x.x.x.x, dst=y.y.y.y) or(src=y.y.y.y, dst=x.x.x.x));
accept not (sport=22 or dport=22);
accept sport=21 and not (src=x.x.x.x);

fw monitorUse fw monitor to see if packets are translated
fw monitor -e „accept (src=212.1.56.151 or dst=212.1.56.151);“
eth0:i[48]: 212.1.56.151 -> 195.244.116.166 (TCP) len=48 id=27053eth0:I[48]: 212.1.56.151 -> 195.244.116.166 (TCP) len=48 id=27053eth1:o[48]: 212.1.56.151 -> 195.244.116.166 (TCP) len=48 id=27053eth1:O[48]: 212.1.56.151 -> 195.244.116.166 (TCP) len=48 id=27053
fw monitor -e „accept (src=212.1.56.151 or dst=212.1.56.151);“
eth0:i[48]: 212.1.56.151 -> 195.244.116.166 (TCP) len=48 id=31171eth0:I[48]: 212.1.56.151 -> 192.168.199.2 (TCP) len=48 id=31171eth1:o[48]: 212.1.56.151 -> 192.168.199.2 (TCP) len=48 id=31171eth1:O[48]: 212.1.56.151 -> 192.168.199.2 (TCP) len=48 id=31171

fw monitorCommon expressions for fw monitor
fw monitor –e „accept (src=x.x.x.x ordst=x.x.x.x);“
fw monitor –m iO –e „accept host(x.x.x.x);“
fw monitor –e „accept ((src=x.x.x.x, dst=y.y.y.y) or (src=y.y.y.y, dst=x.x.x.x));“
fw monitor –e „accept (ip_p=x);“
Combine with –o <file> for output into a file.
Inspect Code Generator: http://decock.org/ginspect/

fw monitorRead complex expressions from a filter file:
fw monitor –f <filename>
If you use macros in a filter file, make sure to include the appropriate definition file.
#include „fwmonitor.def“accept ((sport=22 or dport=22) and not(host(x.x.x.x));
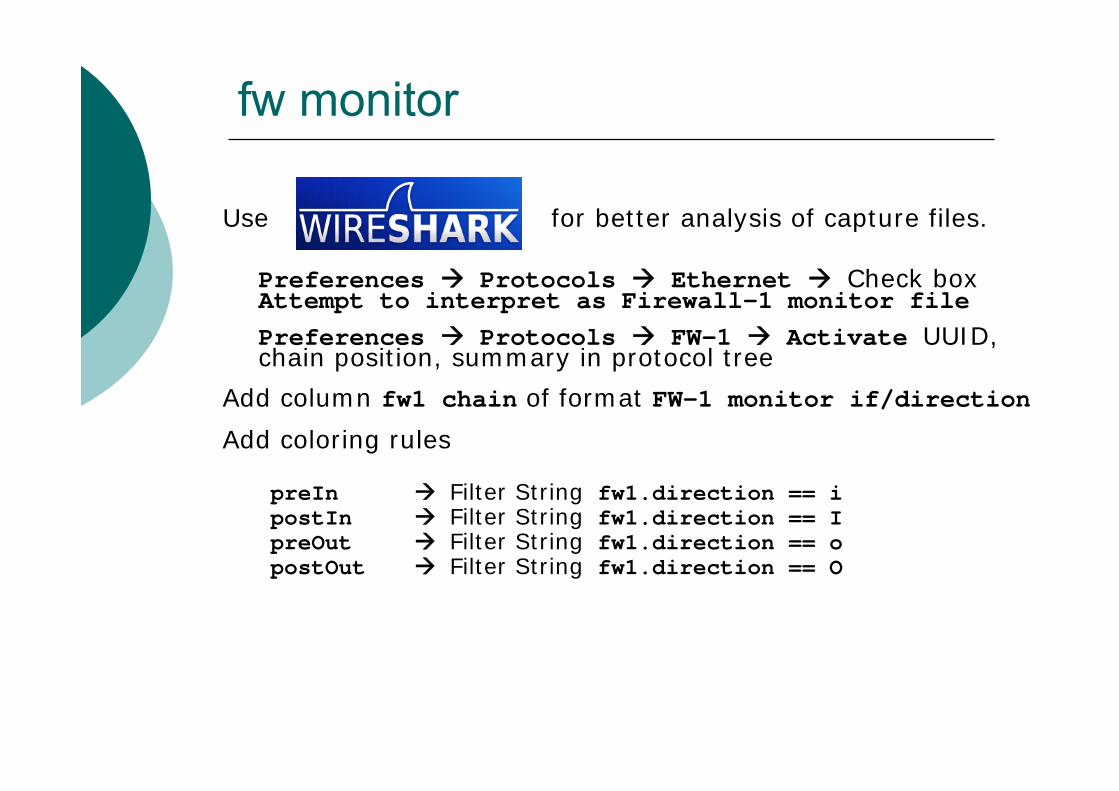
Use for better analysis of capture files.
Preferences Protocols Ethernet Check boxAttempt to interpret as Firewall-1 monitor filePreferences Protocols FW-1 Activate UUID, chain position, summary in protocol tree
Add column fw1 chain of format FW-1 monitor if/direction
Add coloring rules
preIn Filter String fw1.direction == ipostIn Filter String fw1.direction == IpreOut Filter String fw1.direction == opostOut Filter String fw1.direction == O
fw monitor

fw monitorOn UTM-1 Edge
Setup Tools Packet Sniffertwo modes: normal sniffer or fw monitor
On SecuRemote/SecureClient
srfw monitor –o <filename>

Troubleshooting UTM-1 EdgeAnalyse local policy
Run info fw rules on command lineor WebUI Setup Tools Command Line
Analyse NAT policy
Run info nat on command lineor WebUI Setup Tools Command line
Troubleshooting UTM-1 EdgeCreate diagnostics file
Log into WebUI
Setup Tools Diagnostics

Troubleshooting UTM-1 EdgeIs the SMS process running on SmartCenter?
ps –aux | grep sms
Is traffic reaching the SmartCenter?
fw monitor
libsw must be current, at least same version as latest firmware installed on a Edge.
Check /opt/CPEdgecmp-R71/libsw/version.txt
[Expert@fwm]# head -n1 version.txtlibsw built with version 8.1.21

Troubleshooting UTM-1 EdgeSofaware Management Server Console
http://<ip SmartCenter>:9283/
- restart SMS - reload SMS settings- force policy update- reboot- reset local (Edge) password- view status information

Troubleshooting UTM-1 Edge

Troubleshooting UTM-1 EdgeDebugging Sofaware Management Server
Edit $FWDIR/conf/sofaware/SWManagement.ini
Change in line containing LogPolicy1 the valueInfo to Debug
Smsstop
sms –confdir $FWDIR/conf/sofaware
Replicate the problem and watch for console output.
Terminate programm and restart SMS afterwards
smsstart

Troubleshooting UTM-1 EdgeConfiguration for Edge Devices on SPLAT under/opt/CPEdgecmp-R71/tmp
<name of Edge object>.pf ruleset<name of Edge object>.pfz compressed ruleset<name of Edge object>.topo topology for VPN<name of Edge object>.tpz compressed topology<name of Edge object>.p12 PKCS#12 certificate
Delete files. Install policy again to re-generate them.Make sure, that the files are compiled and the Edge
gets the latest version.

Opening a service requestSubmit info to Check Point TAC or your CCSP/CSP
provide contact infodescribe Check Point environmentlist used gateway hardwareprovide info about network topology and hardwaredescribe the problem / the symptoms in detailwhat kind of business impact has this problem
recommendation: get your supporter on the phoneand be available for remote sessions
use chat tool!

Opening a service request
Create compressed CPInfo diagnostic file
/opt/CPinfo-10/bin/cpinfo –z <filename>
Create compressed CPInfo diagnostic file including logs
/opt/CPinfo-10/bin/cpinfo –l –z <filename>
CPInfo files can be viewed using InfoView
Make sure to have the latest CPinfo build installed!Check sk30567 for instructions!

TAC organisation
Director TAC
INTL Support Escalations Diamond Services
3 Product TeamsHigh end
CoreVPN
Knowledge Center
3 Product TeamsHigh end
CoreVPN
Data SecurityEscalation
Secure Knowledge TechnicalPublications
Customer FocusProgrammers

TAC escalation
Support desk
Product team
Escalations
Customer focus programmer

TAC escalation path
http://www.checkpoint.com/services/contact/escalation.html

General debugging
kernel mode user mode
rtmmodsimmodvpntmodvpnmodfwmod
usbcore…
security serversmscpdfwdfwm
fw, VPN, FG-1, H323, BOA, WS, CPAS, CLUSTER, RTM, kiss, kissflow, multik, SFT, CI
…

kernel mode debugView kernel modules with fw ctl debug –h
kiss ??????kissflow ???????fw "Firewall Module"h323 "VoIP H.323 Module"multik "related to CoreXL"BOA "Malicious Code Protection Module"WS "SmartDefense Web Intelligence Module"CI „Content Inspection“CPAS "Active Streaming Module"VPN "VPN Module"RTM "SmartView Monitor Module"SFT ???????Cluster "ClusterXL Module"FG-1 "Floodgate-1 QoS Module"

kernel mode debug
Some examples for modules and options:
Module: fw
Options: error warning cookie crypt domain ex driver filter hold if install ioctl kbufld log machine memory misc packet q xlatexltrc conn synatk media align balancechain bridge tcpstr scv ndis packval syncipopt link nat cifs drop
Module: vpn
Options: driver err packet policy sas rdpclear cipher init sr comp xl counters mspicphwd ref vin cluster nat l2tp warn

kernel mode debugfw ctl debug
Allocation of a buffer for the debug logsfw ctl debug –buf [size in kb]
The main debug command
fw ctl debug –m <module> <option>
Writing the debug logs into a file
fw ctl kdebug –T –f –o <filename>
Stop debugging
fw ctl debug 0

kernel mode debugFilter debug, only lines with <strings> in it are
written to the output (best practice: error, failed)
fw ctl debug –d <strings>
Filter debug, only lines that don‘t contain <string> in it are written to the output
fw ctl debug –d ^<strings>
Can be combined
fw ctl debug –d error,failed,^packet
kernel mode debugStop debug messages when a certain string is
issued.
fw ctl debug –s <string>
Example:
fw ctl debug –s error

kernel mode debugExample: debugging ClusterXL
fw ctl debug –buf 32000fw ctl debug –m fw + conn drop packet ifsync
fw ctl debug –m cluster allfw ctl kdebug –T –f –o <filename>
Example: debugging Site to Site VPN
fw ctl debug -buf 32000 fw ctl debug -m VPN all fw ctl debug -m fw + conn drop ld xlatexltrc nat
fw ctl kdebug –T –f –o <filename>

kernel mode debugExample: debugging SIP
fw ctl debug –buf 32000fw ctl debug –m fw + conn drop vm sipfw ctl kdebug –T –f –o <filename>
Example: debugging VoIP
fw ctl debug -buf 32000 fw ctl debug -m fw + conn drop vmfw ctl debug –m h323 allfw ctl kdebug –T –f –o <filename>

kernel mode debugExample: debugging SmartDefense
fw ctl debug –buf 32000fw ctl debug –m fw + conn drop vm tcp-strspii
fw ctl kdebug –T –f –o <filename>
Example: debugging NAT
fw ctl debug -buf 32000 fw ctl debug -m fw + xlate xltrcfw ctl kdebug –T –f –o <filename>

kernel mode debugExample: debugging QoS
fw ctl debug –buf 32000fw ctl debug –m FG-1 allfw ctl kdebug –T –f –o <filename>
Example: debugging SmartView Monitor
fw ctl debug -buf 32000 fw ctl debug -m RTM allfw ctl kdebug –T –f –o <filename>

VPN debugBest practice before starting debug
Compare configuration on both endsoften Phase I / Phase II parameters are not equal
which causes the VPN to failtake special notice of networks and subnet maskscarefully compare Pre-Shared-Secrets
Have a close look at the logs in SmartView Tracker
Most informations can be found in the logs

VPN debugTo determine status of VPN tunnels, use menu based
vpn tunnelutil vpn tu
or SmartView Monitor
To shutdown all VPN operation, use
vpn drv off
To enable VPN again, use
vpn drv on
install policy

VPN debugVPN debugging events can be logged on the
gateway
vpn debug on
Debug output is written to $FWDIR/log/vpnd.elg
More details can be logged using the command
vpn debug on TDERROR_ALL_ALL=5
Turn off debugging with
vpn debug off
VPN debugIKE negotiations during VPN tunnel establishment
can be logged in ike.elg
On the gateway: vpn debug ikeon / vpn debug ikeoffDebug output is written to $FWDIR/log/ike.elg

VPN debugInitiate VPN and IKE debug together
vpn debug trunc
Disable VPN and IKE debug
vpn debug offvpn debug ikeoff
VPN debugCapture traffic using fw monitor
fw monitor –e „accept port(500) orport(4500);“ –o monitor.out
Output file is monitor.out, IKE payloads areencrypted.
Capture traffic using vpn debug
vpn debug mon
Output file is ikemonitor.snoop, IKE payloads are in clear.
Turn off with vpn debug moff.

VPN debugOn UTM-1 Edge appliance:
WebUI -> Reports -> Tunnels -> save IKE trace
Click Save IKE Trace, which creates ike.elg
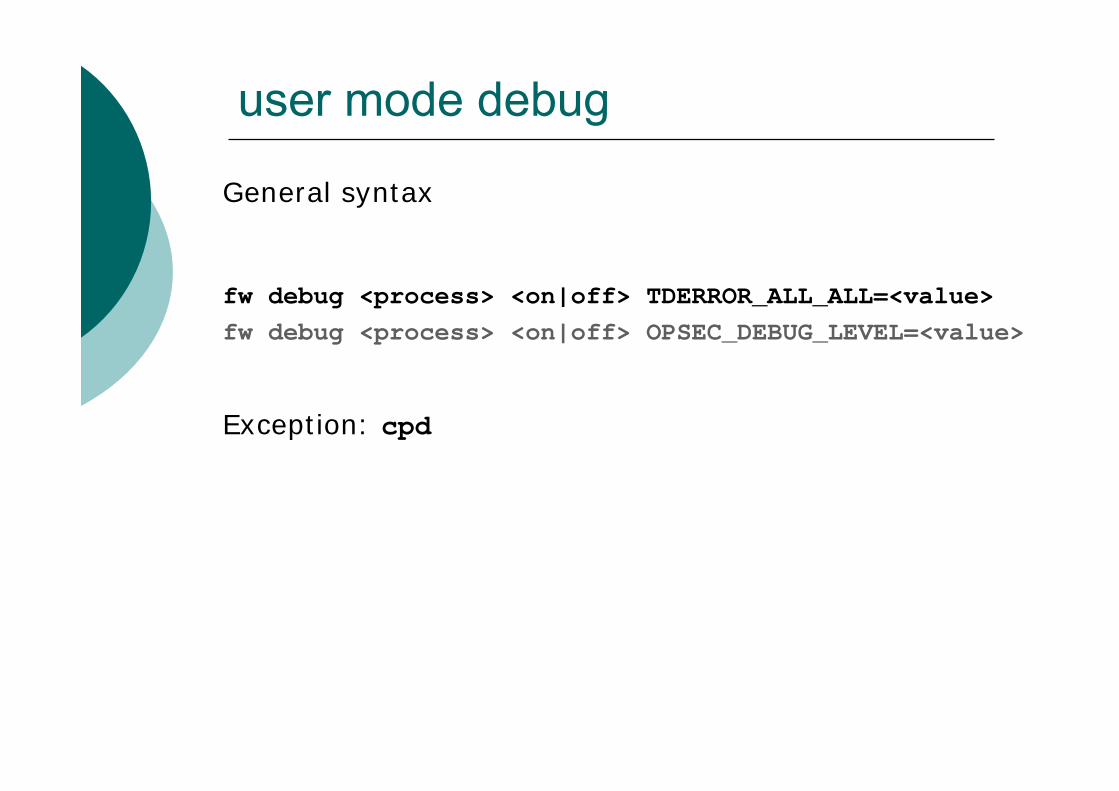
user mode debug
General syntax
fw debug <process> <on|off> TDERROR_ALL_ALL=<value>fw debug <process> <on|off> OPSEC_DEBUG_LEVEL=<value>
Exception: cpd

fwm debugFWM controls connections from the SmartConsole to
the SmartCenter server and is responsible forpolicy related functions
To debug fwm do the following
fw debug fwm on TDERROR_ALL_ALL=5fw debug fwm on OPSEC_DEBUG_LEVEL=9
To stop debug run
fw debug fwm off TDERROR_ALL_ALL=0fw debug fwm off OPSEC_DEBUG_LEVEL=0
Logs are written to $FWDIR/log/fwm.elg

fwm debug[FWM 11927 1981476992]@firewallr70[8 Sep 18:46:32]fwnetobj_getbysicname: table_chosen_get_with_param(eTABLE_NETWORK_OBJECTS,
is_obj_SIC_name,IP=212.1.56.233,CN=Gui_Client) returned NULL.
Login failed: 212.1.56.233 is not allowed for remotelogin
[FWM 11927 1981476992]@firewallr70[8 Sep 18:46:32] fwm_log: Login failed fromIP=212.1.56.233,CN=Gui_Client: Unauthorized clientWed Sep 8 18:46:32 2010 (GMT): reject clientIP=212.1.56.233,CN=Gui_Client
[FWM 11927 1981476992]@firewallr70[8 Sep 18:46:32] PM_policy_query: rule not found.
[FWM 11927 1981476992]@firewallr70[8 Sep 18:46:32] PM_policy_query:
finished successfully. 1st method = deny
IP not defined in $FWDIR/conf/gui-clients

fwm debug[FWM 11927 1981476992]@firewallr70[8 Sep 18:48:07]fwm_cpmi_auth_handler: authenticating admin admin by
Name and Password[FWM 11927 1981476992]@firewallr70[8 Sep 18:48:07]
Administrator admin found in fwm database[FWM 11927 1981476992]@firewallr70[8 Sep 18:48:07]CBinObjCommon::PackLogData: Field number:12, Data
offset:34, Type:eFtCstring, Value:Administratorfailed to log in: Wrong Password
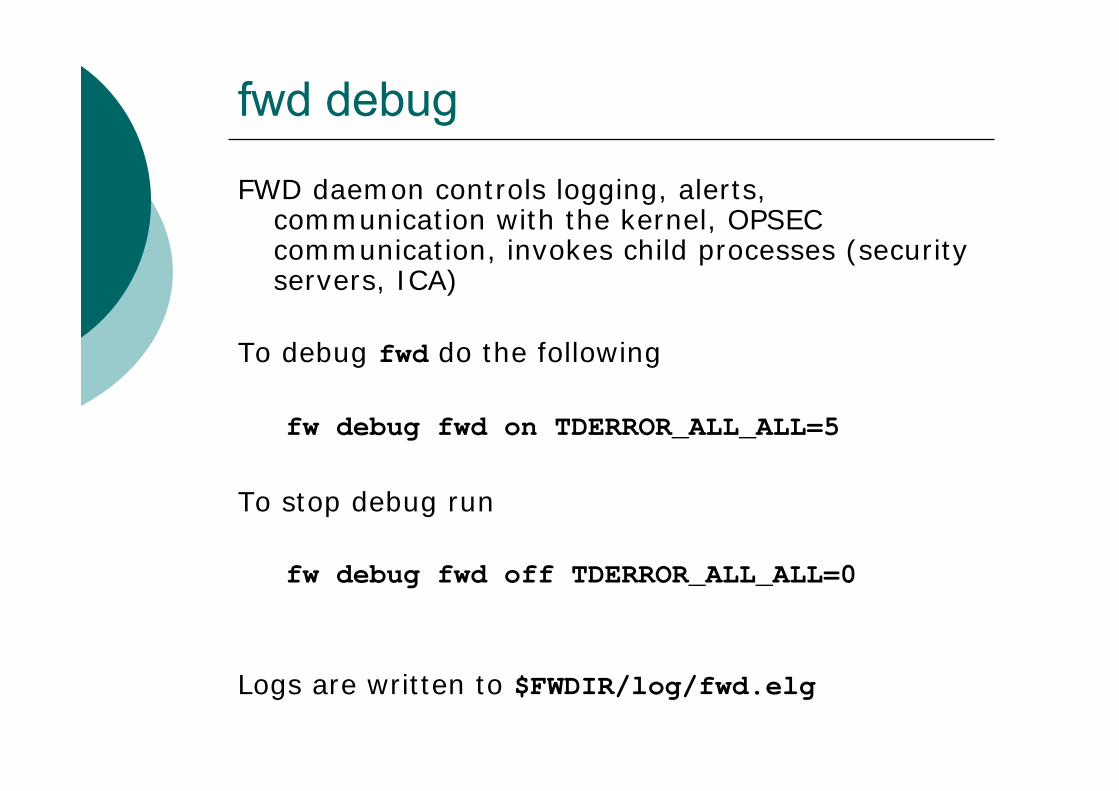
fwd debug
FWD daemon controls logging, alerts, communication with the kernel, OPSEC communication, invokes child processes (securityservers, ICA)
To debug fwd do the following
fw debug fwd on TDERROR_ALL_ALL=5
To stop debug run
fw debug fwd off TDERROR_ALL_ALL=0
Logs are written to $FWDIR/log/fwd.elg

Desktop log server debugTo debug dtls do the following
fw debug dtls on
To stop debug run
fw debug dtls off
Logs are written to $FWDIR/log/dtlsd.elg

Security servers debugSome examples for security servers:
FTP security server – in.aftpdTelnet security server – in.atelnetdHTTP security server – in.ahttpdSMTP security server – in.asmtpdClientAuth (900) – in.ahclientdClientAuth (259) – in.aclientdAntiSpam security server – in.msdURL filtering security server – in.aufpd

Security servers debugVerify that security server process exists. Check
$FWDIR/tmp for existing PID files.
Start debugging (example for FTP security server)
fw debug in.aftpd on FWAFTPD_LEVEL=3
Stop debugging
fw debug in.aftpd off FWAFTPD_LEVEL=3

cpd debugCPD controls SIC, Policy install
To debug cpd do the following
cpd_admin debug on TDERROR_ALL_ALL=5
To stop debug run
cpd_admin debug off TDERROR_ALL_ALL=0
Logs are written to $CPDIR/log/cpd.elg

Secure Platform debug
Sometimes it is useful to verify file integrity andversion against a test environment, for exampleafter installation of ad-hoc fixes or HFA.
Use md5sum for creating hashes.[Expert@fwm]# md5sum upgrade_importe6c6417cca9db098b94673dd420a4903 upgrade_import
Use cpvinfo for displaying version information.[Expert@fwm]# cpvinfo upgrade_import
Build Number = 730080036Major Release = NGXMinor Release = fli_up_gaRelease Number = 5.0.5Version Name = NGX

Secure Platform debugFor some problems with processes a core dump can
be usefull.
A core dump is a disk file that contains an image of the process‘s memory at the time of termination.
Core dumps are mainly used by Check Point R&D forfixing a specific problem.
Handling Core Fileshttp://downloads.checkpoint.com/dc/download.htm?ID=10479

Secure Platform debugTo enable core dumps do the following
ulimit –c unlimited
um_core enable
Reboot
Check that /etc/sysconfig/enable_cores existafter Reboot.
Dumps will be in /var/log/dump/usermode

Debugging GUI clientsDebug GUI clients
Dashboard fwpolicy.exe –d –o fwp_debug.txt
Tracker cplgv.exe –d –o cplgv_debug.txt
Monitor smartcons.exe –d –o smartcons_debug.txt
general syntax: <executable> -d –o <file_name>
Output is in specified directory or in
C:\Programme\CheckPoint\SmartConsole\R70\PROGRAM\data
if directory is omitted.

ResourcesSmartSPLAT from Çağdaş Ulucan
www.smartsplat.com

Resources

Resources

Resources

Resources

Resources

Resources
fw monitorhttp://www.checkpoint.com/techsupport/downloads/html/ethereal/fw_monitor_rev1_01.pdf
The CPinfo utility
https://supportcenter.checkpoint.com/supportcenter/portal?eventSubmit_doGoviewsolutiondetails=&solutionid=sk30567
Documents related to troubleshootinghttp://blog.lachmann.org/2010/09/documents-related-to-troubleshooting/

Questions?
