2010: designing a hydrogen community liberty … of waterloo.pdf · 2010: designing a hydrogen...
TRANSCRIPT
2010: DESIGNING A HYDROGEN COMMUNITY LIBERTY FUELS HYDROGEN CENTER UNIVERSITY OF WATERLOO MARCH 24, 2010
FACULTY ADVISOR: Dr. Michael Fowler
TEAM MEMBERS
Philip Chan Ryan Egli Slavi Grozev Gloria Lei Josh Lo
Andrea Murphy Mohamed Kahiye Yuri Kopylovski Abraham Soesilo Kathy Zheng Lu
ii
EXECUTIVE SUMMARY
The following document was created in response to a request for proposals from the National Hydrogen Association to create a plan for a hydrogen dispensing station to be located in Santa Monica, California. Enclosed within is a detailed design for the innovative Liberty hydrogen refueling center which is capable of servicing vehicles with operating pressures of 5,000 and 10,000 psi. The basis of this design is centralized hydrogen production via steam methane reforming. The facility is capable of producing 1,000 kg of high purity hydrogen per day from renewable biogas and landfill gas sources piped directly through natural gas pipelines. This process also allows all hydrogen produced and sold to be renewably sourced. The production facility is modular and can be expanded to produce up to 25,800 kg of hydrogen per day by adding more steam methane reformers. Several producers of biogas and landfill gas have been located within a 25-mile radius of Santa Monica, and are more than capable of supplying the required feedstock. One of the strengths of this station is its flexibility; it is scalable to allow for greater hydrogen production in order to meet increasing demand.
The document also identifies a number of potential hydrogen consumers within the Santa Monica area as well as several large scale consumers outside of the area. Customers include Wal-Mart, Vision Motor Corporation, and the City of Burbank, requiring a projected total of 589.75 kg of hydrogen per day, which can easily be met by the hydrogen production facility. All deliveries will be made via tractor-trailer.
In addition to the modular and expandable refueling station, the design includes an integrated tourist center and bicycle rental depot. The center is designed around the functional requirements of the hydrogen refueling station: tank and compressor storage and vehicular access, but also the desirable qualities of a tourist center: street front presence, pedestrian accessibility, and bicycle rental capability. Solar panels on the roof provide 23% of the power needed for all station equipment.
Safety is of paramount importance in any engineering design, and was thoroughly considered during the design of this station. As hydrogen fuel is still in its infancy, additional focus was placed on safety to ensure prevention of incidents that could negatively affect public perception of hydrogen.
Argonne’s GREET emissions model was used to determine the environmental impact of the design through a well-to-tank analysis and comparison to California reformulated gasoline production. A fuel cell vehicle powered by hydrogen from our production sources would reduce CO2 emissions by over 52% when compared to equivalent gasoline-powered light passenger cars.
Equipment, architectural, and operating costs are evaluated in this proposal and illustrate the feasibility of this project, with a dispensing price of $16.01 per kilogram of hydrogen without purchase subsidies or tax credits. The total turn-key cost for the fueling center is estimated at $4.04M USD.
In addition to the design aspect of this station, a marketing campaign was created in order to promote hydrogen as an alternative fuel source. The advertising campaign will focus on targeting those issues which people understand: safety, energy independence, and pollution. By targeting these issues, we will be able to portray an effective message. The campaign will also focus on safety, as it is a paramount issue and is one of the major strengths of the Liberty design.
A hydrogen economy may still be a distant goal, but it is an attainable one. This station represents a major step towards hydrogen acceptance and utilization in the Santa Monica area, and once operational, will begin the journey towards a sustainable future.
iii
CONTENTS
Executive Summary ....................................................................................................................................... ii Hydrogen Production Evaluation .................................................................................................................. 1
SMR Location ............................................................................................................................................. 1 Feed Gas Pre-treatment and Pre-reforming ............................................................................................. 2 Reformer ................................................................................................................................................... 3 Pressure Swing Adsorption, Compression, and Storage ........................................................................... 3 Hydrogen Distribution ............................................................................................................................... 3
Early Market Customer Identification ........................................................................................................... 4 Wal-Mart ................................................................................................................................................... 4 Vision Motor Corporation and City of Santa Monica ................................................................................ 5 Cell Phone Carriers .................................................................................................................................... 6 City of Burbank Bus ................................................................................................................................... 7
Hydrogen Station Technical Design .............................................................................................................. 7 Site Selection ............................................................................................................................................. 7 Structure .................................................................................................................................................... 8 Building Design .......................................................................................................................................... 8 Design Constraints and Assumptions ........................................................................................................ 9 Hydrogen Supply and Storage ................................................................................................................... 9 Compressors and Dispenser .................................................................................................................... 10 Hydrogen Management .......................................................................................................................... 11 Electrical Loading and Solar Panel Design ............................................................................................... 11 Safety Features Incorporated in Design .................................................................................................. 12
Safety Analysis ............................................................................................................................................ 17 Economic/Business Plan Analysis ............................................................................................................... 19
Architectural Costs .................................................................................................................................. 19 Capital Costs ............................................................................................................................................ 19 Operating Costs ....................................................................................................................................... 20 Selling Price, Vehicle Operating Costs ..................................................................................................... 20
Environmental Analysis ............................................................................................................................... 21 Hydrogen Production .............................................................................................................................. 21 Well-to-Tank Analysis .............................................................................................................................. 22 Environmental Production Impact .......................................................................................................... 23 Environmental Building Analysis ............................................................................................................. 23
Marketing and Education Plan .................................................................................................................... 24 Target ...................................................................................................................................................... 25 Challenges ............................................................................................................................................... 25 Implementation ....................................................................................................................................... 25
Appendices .................................................................................................................................................. 28 Appendix A: Architectural Cost Estimations ............................................................................................ 28 Appendix B: Failure Modes and Effects Analysis ........................................................... ................30
Appendix C: Station Costs ....................................................................................................................... 31 Appendix D: SMR Costs ........................................................................................................................... 32
References .................................................................................................................................................. 33
1
HYDROGEN PRODUCTION EVALUATION
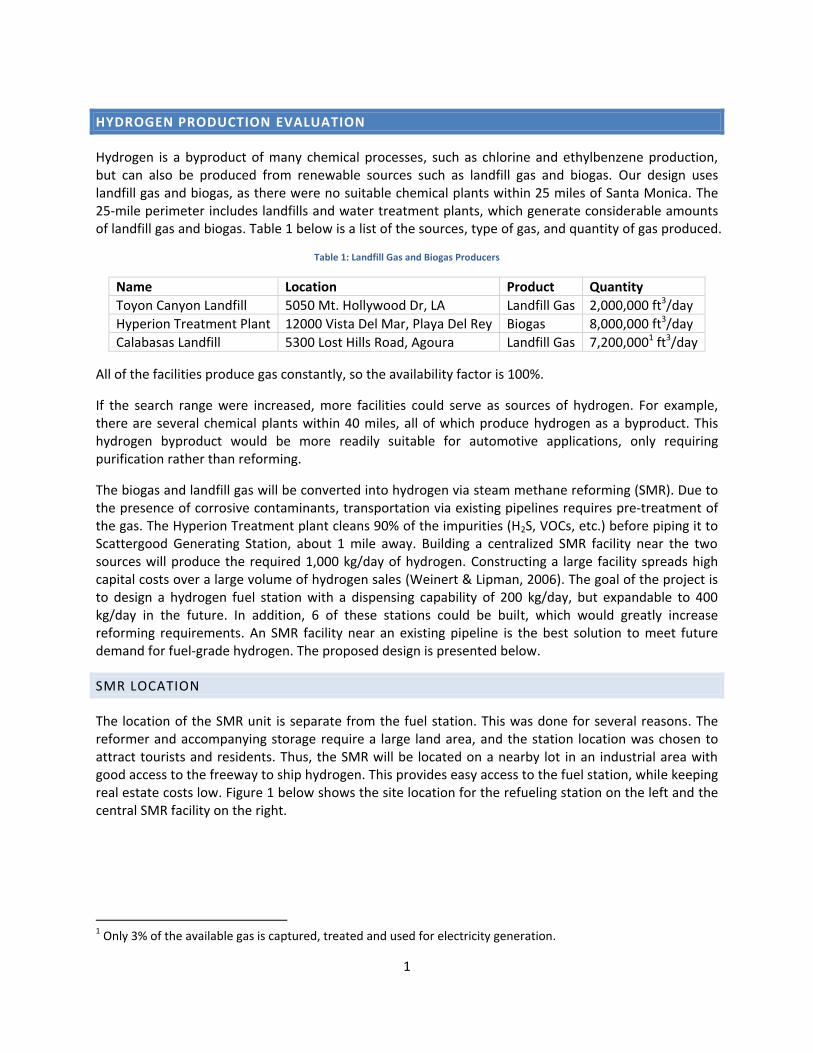
Hydrogen is a byproduct of many chemical processes, such as chlorine and ethylbenzene production, but can also be produced from renewable sources such as landfill gas and biogas. Our design uses landfill gas and biogas, as there were no suitable chemical plants within 25 miles of Santa Monica. The 25-mile perimeter includes landfills and water treatment plants, which generate considerable amounts of landfill gas and biogas. Table 1 below is a list of the sources, type of gas, and quantity of gas produced.
Table 1: Landfill Gas and Biogas Producers
Name Location Product Quantity
Toyon Canyon Landfill 5050 Mt. Hollywood Dr, LA Landfill Gas 2,000,000 ft3/day
Hyperion Treatment Plant 12000 Vista Del Mar, Playa Del Rey Biogas 8,000,000 ft3/day
Calabasas Landfill 5300 Lost Hills Road, Agoura Landfill Gas 7,200,0001 ft3/day
All of the facilities produce gas constantly, so the availability factor is 100%.
If the search range were increased, more facilities could serve as sources of hydrogen. For example, there are several chemical plants within 40 miles, all of which produce hydrogen as a byproduct. This hydrogen byproduct would be more readily suitable for automotive applications, only requiring purification rather than reforming.
The biogas and landfill gas will be converted into hydrogen via steam methane reforming (SMR). Due to the presence of corrosive contaminants, transportation via existing pipelines requires pre-treatment of the gas. The Hyperion Treatment plant cleans 90% of the impurities (H2S, VOCs, etc.) before piping it to Scattergood Generating Station, about 1 mile away. Building a centralized SMR facility near the two sources will produce the required 1,000 kg/day of hydrogen. Constructing a large facility spreads high capital costs over a large volume of hydrogen sales (Weinert & Lipman, 2006). The goal of the project is to design a hydrogen fuel station with a dispensing capability of 200 kg/day, but expandable to 400 kg/day in the future. In addition, 6 of these stations could be built, which would greatly increase reforming requirements. An SMR facility near an existing pipeline is the best solution to meet future demand for fuel-grade hydrogen. The proposed design is presented below.
SMR LOCATION
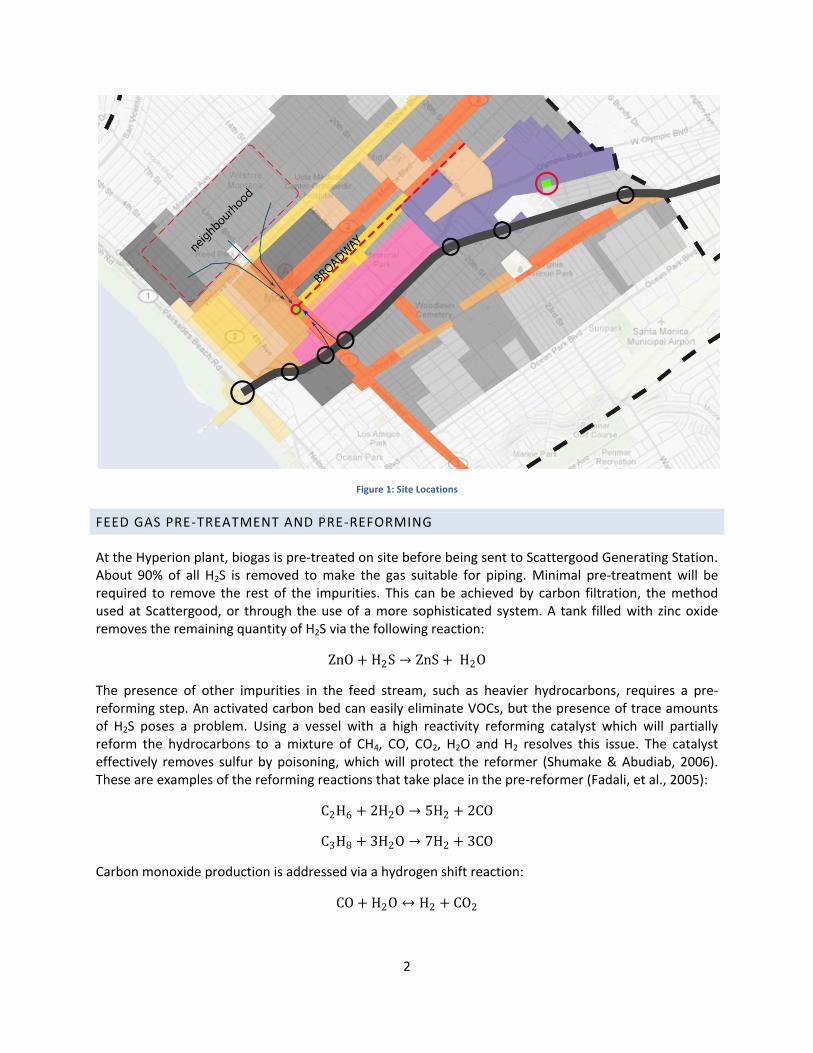
The location of the SMR unit is separate from the fuel station. This was done for several reasons. The reformer and accompanying storage require a large land area, and the station location was chosen to attract tourists and residents. Thus, the SMR will be located on a nearby lot in an industrial area with good access to the freeway to ship hydrogen. This provides easy access to the fuel station, while keeping real estate costs low. Figure 1 below shows the site location for the refueling station on the left and the central SMR facility on the right.
1 Only 3% of the available gas is captured, treated and used for electricity generation.
2
Figure 1: Site Locations
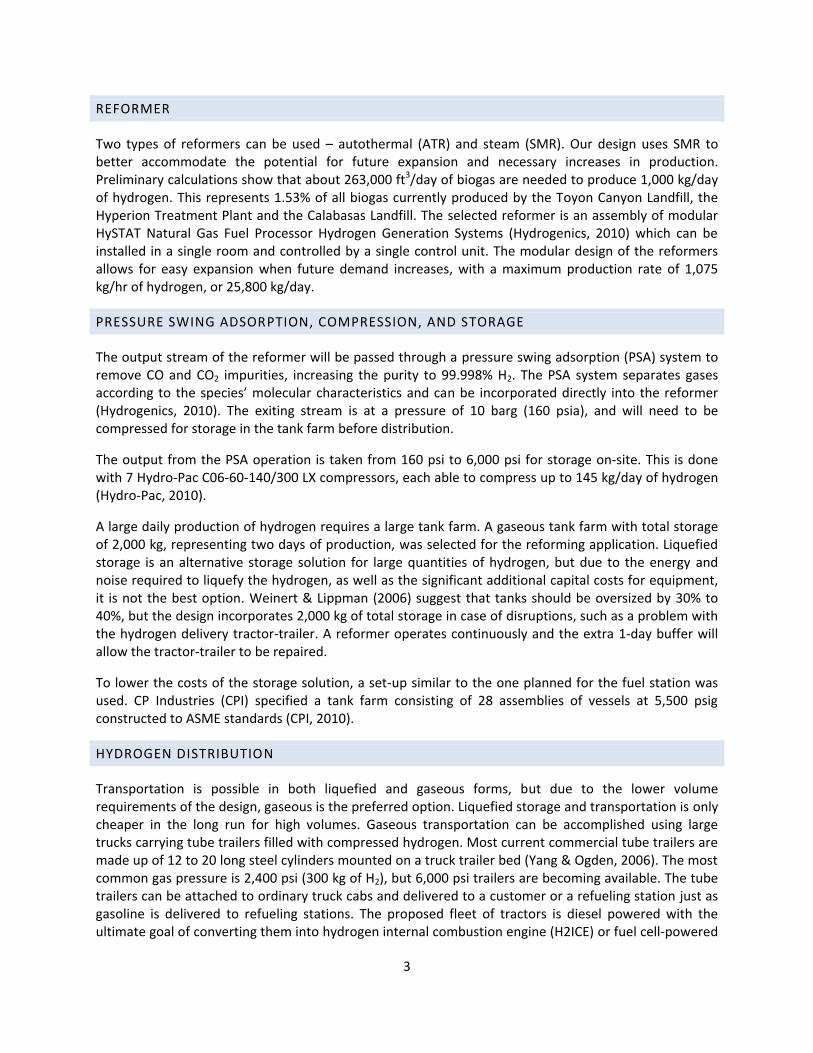
FEED GAS PRE-TREATMENT AND PRE-REFORMING
At the Hyperion plant, biogas is pre-treated on site before being sent to Scattergood Generating Station. About 90% of all H2S is removed to make the gas suitable for piping. Minimal pre-treatment will be required to remove the rest of the impurities. This can be achieved by carbon filtration, the method used at Scattergood, or through the use of a more sophisticated system. A tank filled with zinc oxide removes the remaining quantity of H2S via the following reaction:
ZnO + H2S → ZnS + H2O
The presence of other impurities in the feed stream, such as heavier hydrocarbons, requires a pre-reforming step. An activated carbon bed can easily eliminate VOCs, but the presence of trace amounts of H2S poses a problem. Using a vessel with a high reactivity reforming catalyst which will partially reform the hydrocarbons to a mixture of CH4, CO, CO2, H2O and H2 resolves this issue. The catalyst effectively removes sulfur by poisoning, which will protect the reformer (Shumake & Abudiab, 2006). These are examples of the reforming reactions that take place in the pre-reformer (Fadali, et al., 2005):
C2H6 + 2H2O → 5H2 + 2CO
C3H8 + 3H2O → 7H2 + 3CO
Carbon monoxide production is addressed via a hydrogen shift reaction:
CO + H2O ↔ H2 + CO2
3
REFORMER
Two types of reformers can be used – autothermal (ATR) and steam (SMR). Our design uses SMR to better accommodate the potential for future expansion and necessary increases in production. Preliminary calculations show that about 263,000 ft3/day of biogas are needed to produce 1,000 kg/day of hydrogen. This represents 1.53% of all biogas currently produced by the Toyon Canyon Landfill, the Hyperion Treatment Plant and the Calabasas Landfill. The selected reformer is an assembly of modular HySTAT Natural Gas Fuel Processor Hydrogen Generation Systems (Hydrogenics, 2010) which can be installed in a single room and controlled by a single control unit. The modular design of the reformers allows for easy expansion when future demand increases, with a maximum production rate of 1,075 kg/hr of hydrogen, or 25,800 kg/day.
PRESSURE SWING ADSORPTION, COMPRESSION, AND STORAGE
The output stream of the reformer will be passed through a pressure swing adsorption (PSA) system to remove CO and CO2 impurities, increasing the purity to 99.998% H2. The PSA system separates gases according to the species’ molecular characteristics and can be incorporated directly into the reformer (Hydrogenics, 2010). The exiting stream is at a pressure of 10 barg (160 psia), and will need to be compressed for storage in the tank farm before distribution.
The output from the PSA operation is taken from 160 psi to 6,000 psi for storage on-site. This is done with 7 Hydro-Pac C06-60-140/300 LX compressors, each able to compress up to 145 kg/day of hydrogen (Hydro-Pac, 2010).
A large daily production of hydrogen requires a large tank farm. A gaseous tank farm with total storage of 2,000 kg, representing two days of production, was selected for the reforming application. Liquefied storage is an alternative storage solution for large quantities of hydrogen, but due to the energy and noise required to liquefy the hydrogen, as well as the significant additional capital costs for equipment, it is not the best option. Weinert & Lippman (2006) suggest that tanks should be oversized by 30% to 40%, but the design incorporates 2,000 kg of total storage in case of disruptions, such as a problem with the hydrogen delivery tractor-trailer. A reformer operates continuously and the extra 1-day buffer will allow the tractor-trailer to be repaired.
To lower the costs of the storage solution, a set-up similar to the one planned for the fuel station was used. CP Industries (CPI) specified a tank farm consisting of 28 assemblies of vessels at 5,500 psig constructed to ASME standards (CPI, 2010).
HYDROGEN DISTRIBUTION
Transportation is possible in both liquefied and gaseous forms, but due to the lower volume requirements of the design, gaseous is the preferred option. Liquefied storage and transportation is only cheaper in the long run for high volumes. Gaseous transportation can be accomplished using large trucks carrying tube trailers filled with compressed hydrogen. Most current commercial tube trailers are made up of 12 to 20 long steel cylinders mounted on a truck trailer bed (Yang & Ogden, 2006). The most common gas pressure is 2,400 psi (300 kg of H2), but 6,000 psi trailers are becoming available. The tube trailers can be attached to ordinary truck cabs and delivered to a customer or a refueling station just as gasoline is delivered to refueling stations. The proposed fleet of tractors is diesel powered with the ultimate goal of converting them into hydrogen internal combustion engine (H2ICE) or fuel cell-powered
4
trucks. Diesel tractors were selected due to their availability, but as H2ICE and fuel cell vehicles become more affordable, the fleet can be easily replaced in the near future. The distribution will use a single tractor-trailer combination, which will operate in two 8-hour shifts per day. The number of tractor-trailers may be increased as demand increases.
With an initial dispensing requirement of 200 kg/day, the tractor-trailer will deliver hydrogen to the fuel station daily, during off-peak hours. The current tube trailer capacity is about 300 kg, but due to the characteristics of hydrogen being transferred, the trailer will not be completely emptied of hydrogen. Making an extra trip would also allow the buffer tanks to be refilled if the daily consumption exceeds 200 kg. When dispensing requirements increase to 400 kg/day, the same tractor-trailer can be used to deliver the required hydrogen three to four times daily. In the long run, we expect 6,000 psi tube trailers to become widely available, which will reduce the number of refueling trips made by the tractor-trailer, as each trip will carry more hydrogen.
EARLY MARKET CUSTOMER IDENTIFICATION
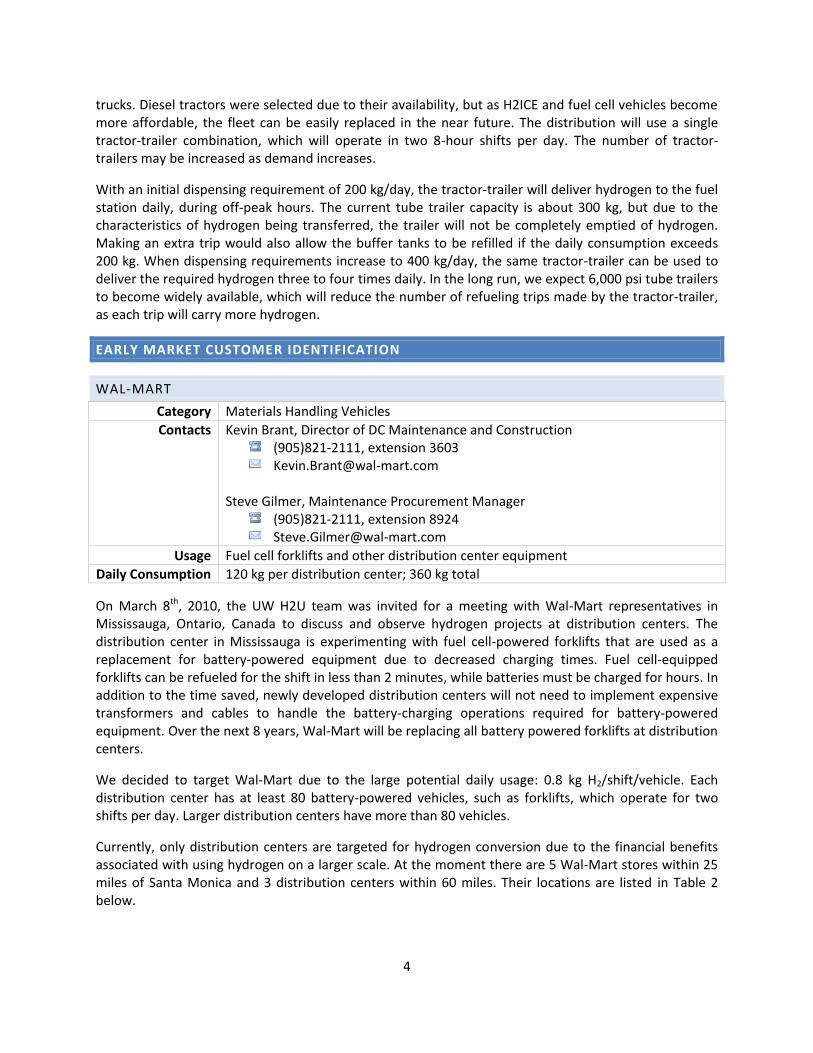
WAL-MART
Category Materials Handling Vehicles
Contacts Kevin Brant, Director of DC Maintenance and Construction (905)821-2111, extension 3603 [email protected]
Steve Gilmer, Maintenance Procurement Manager
(905)821-2111, extension 8924 [email protected]
Usage Fuel cell forklifts and other distribution center equipment
Daily Consumption 120 kg per distribution center; 360 kg total
On March 8th, 2010, the UW H2U team was invited for a meeting with Wal-Mart representatives in Mississauga, Ontario, Canada to discuss and observe hydrogen projects at distribution centers. The distribution center in Mississauga is experimenting with fuel cell-powered forklifts that are used as a replacement for battery-powered equipment due to decreased charging times. Fuel cell-equipped forklifts can be refueled for the shift in less than 2 minutes, while batteries must be charged for hours. In addition to the time saved, newly developed distribution centers will not need to implement expensive transformers and cables to handle the battery-charging operations required for battery-powered equipment. Over the next 8 years, Wal-Mart will be replacing all battery powered forklifts at distribution centers.
We decided to target Wal-Mart due to the large potential daily usage: 0.8 kg H2/shift/vehicle. Each distribution center has at least 80 battery-powered vehicles, such as forklifts, which operate for two shifts per day. Larger distribution centers have more than 80 vehicles.
Currently, only distribution centers are targeted for hydrogen conversion due to the financial benefits associated with using hydrogen on a larger scale. At the moment there are 5 Wal-Mart stores within 25 miles of Santa Monica and 3 distribution centers within 60 miles. Their locations are listed in Table 2 below.
5
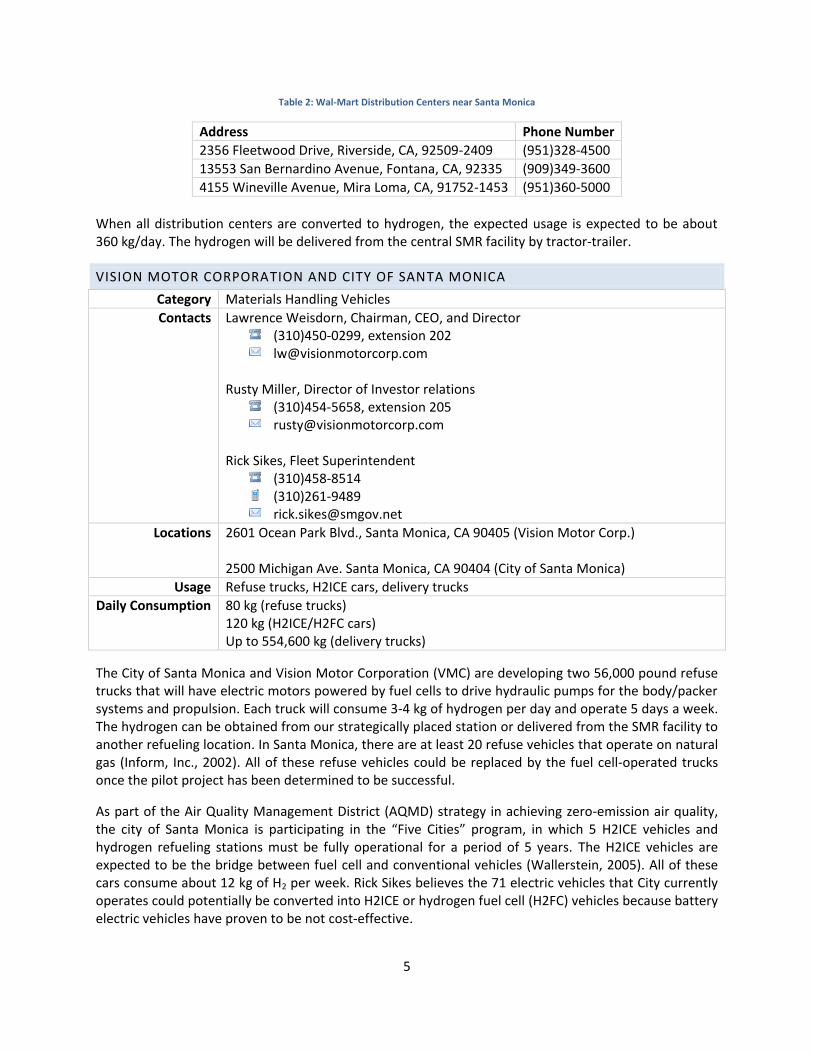
Table 2: Wal-Mart Distribution Centers near Santa Monica
Address Phone Number
2356 Fleetwood Drive, Riverside, CA, 92509-2409 (951)328-4500
13553 San Bernardino Avenue, Fontana, CA, 92335 (909)349-3600
4155 Wineville Avenue, Mira Loma, CA, 91752-1453 (951)360-5000
When all distribution centers are converted to hydrogen, the expected usage is expected to be about 360 kg/day. The hydrogen will be delivered from the central SMR facility by tractor-trailer.
VISION MOTOR CORPORATION AND CITY OF SANTA MONICA
Category Materials Handling Vehicles
Contacts Lawrence Weisdorn, Chairman, CEO, and Director (310)450-0299, extension 202 [email protected]
Rusty Miller, Director of Investor relations
(310)454-5658, extension 205 [email protected]
Rick Sikes, Fleet Superintendent
(310)458-8514 (310)261-9489 [email protected]
Locations 2601 Ocean Park Blvd., Santa Monica, CA 90405 (Vision Motor Corp.) 2500 Michigan Ave. Santa Monica, CA 90404 (City of Santa Monica)
Usage Refuse trucks, H2ICE cars, delivery trucks
Daily Consumption 80 kg (refuse trucks) 120 kg (H2ICE/H2FC cars) Up to 554,600 kg (delivery trucks)
The City of Santa Monica and Vision Motor Corporation (VMC) are developing two 56,000 pound refuse trucks that will have electric motors powered by fuel cells to drive hydraulic pumps for the body/packer systems and propulsion. Each truck will consume 3-4 kg of hydrogen per day and operate 5 days a week. The hydrogen can be obtained from our strategically placed station or delivered from the SMR facility to another refueling location. In Santa Monica, there are at least 20 refuse vehicles that operate on natural gas (Inform, Inc., 2002). All of these refuse vehicles could be replaced by the fuel cell-operated trucks once the pilot project has been determined to be successful.
As part of the Air Quality Management District (AQMD) strategy in achieving zero-emission air quality, the city of Santa Monica is participating in the “Five Cities” program, in which 5 H2ICE vehicles and hydrogen refueling stations must be fully operational for a period of 5 years. The H2ICE vehicles are expected to be the bridge between fuel cell and conventional vehicles (Wallerstein, 2005). All of these cars consume about 12 kg of H2 per week. Rick Sikes believes the 71 electric vehicles that City currently operates could potentially be converted into H2ICE or hydrogen fuel cell (H2FC) vehicles because battery electric vehicles have proven to be not cost-effective.
6
Aside from the solid waste vehicles, Vision Motor Corporation is also currently working to reach agreements with the Ports of Los Angeles and Long Beach, which are located within a 25 mile radius of Santa Monica, to replace 16,800 diesel trucks with their heavy-duty fuel cell trucks over the next 4 years. These fuel cell trucks will consume approximately 33 kg of hydrogen per day and offer 35-50% cost savings per mile basis compared to diesel or natural gas trucks (Vision Motor Corporation, 2010). The hydrogen supply for both organizations will be delivered via tractor-trailers with capacity of 300 kg of hydrogen each.
CELL PHONE CARRIERS
Category Stationary Back-Up Power
Contact Matthew Stevens, Partner, CrossChasm (519)404-5987 [email protected]
Usage Backup power for cell phone towers
Daily Consumption 0.75 kg
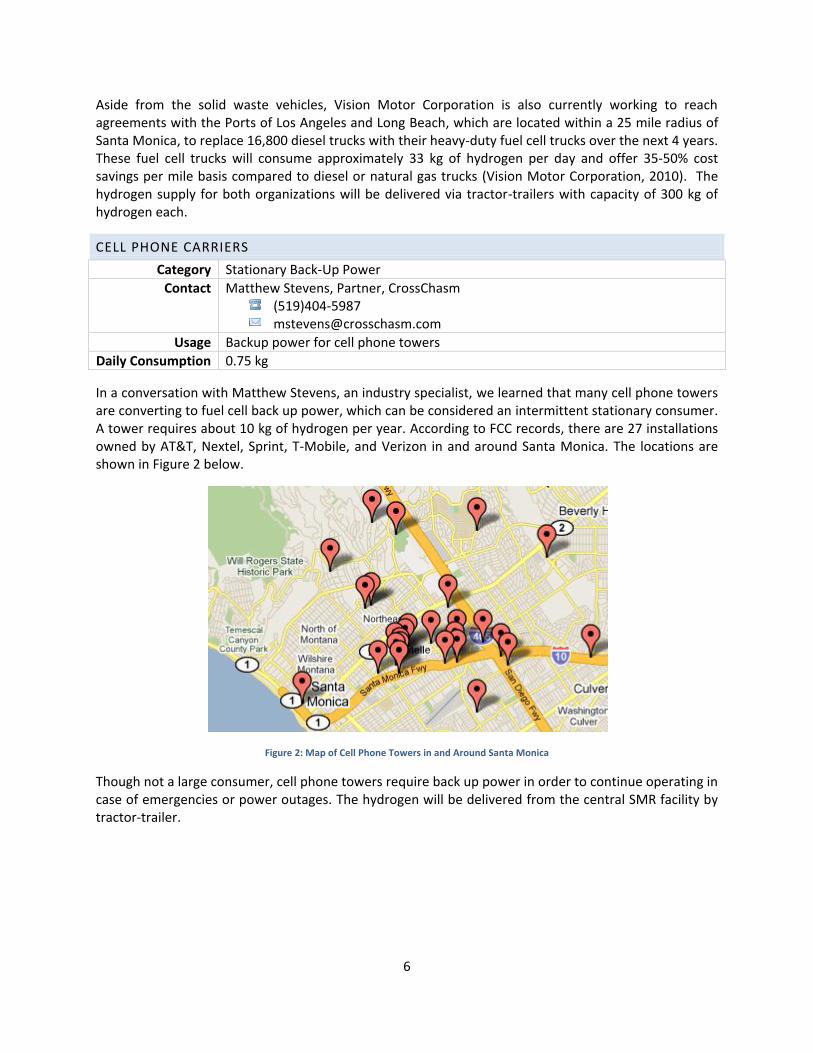
In a conversation with Matthew Stevens, an industry specialist, we learned that many cell phone towers are converting to fuel cell back up power, which can be considered an intermittent stationary consumer. A tower requires about 10 kg of hydrogen per year. According to FCC records, there are 27 installations owned by AT&T, Nextel, Sprint, T-Mobile, and Verizon in and around Santa Monica. The locations are shown in Figure 2 below.
Figure 2: Map of Cell Phone Towers in and Around Santa Monica
Though not a large consumer, cell phone towers require back up power in order to continue operating in case of emergencies or power outages. The hydrogen will be delivered from the central SMR facility by tractor-trailer.
7
CITY OF BURBANK BUS
Category Portable Power
Contacts Ari Omessi, Assistant Public Works Director, City of Burbank (818)238-3808 [email protected]
Johnathan Frank, Administrative Officer, City of Burbank
(818)238-5318 [email protected]
Usage Hybrid fuel cell bus
Daily Consumption >29 kg
The City of Burbank saw its first fuel cell bus delivered on March 22nd, 2010. The city is currently constructing an inside-the-fence steam methane reforming hydrogen station, which should be able to produce 60 to 109 kg of hydrogen per day when fully operational. Until the reformer goes online, the city gets its hydrogen delivered on site. The city plans to make the steam methane reforming station open to the public in an effort to contribute to hydrogen infrastructure.
Due to delay of the fuel cell bus delivery, the city was not able to give exact numbers on the hydrogen usage or the frequency of the bus usage, but stated that it plans for the bus to take over certain existing routes. The Transit authority suggested that if the testing goes as planned, more buses will be added to the fleet in the future. This turns Burbank Bus into a potential consumer because of the amount of hydrogen that fuel cell-powered buses would require and the relatively low amount of hydrogen their steam methane reformer installation can produce. We expect once testing is under way, other transit authorities will follow suit, creating increased demand for hydrogen which can be satisfied by our SMR installations. The hydrogen will be delivered from the central SMR facility by tractor-trailer.
HYDROGEN STATION TECHNICAL DESIGN
SITE SELECTION
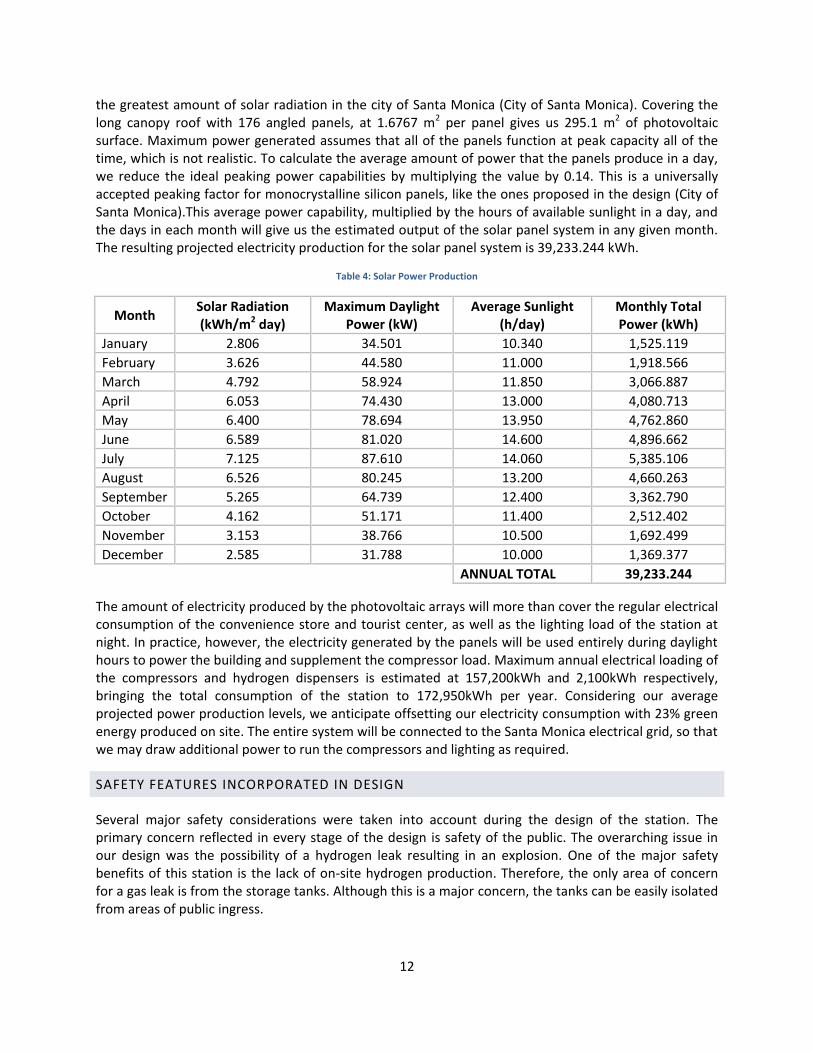
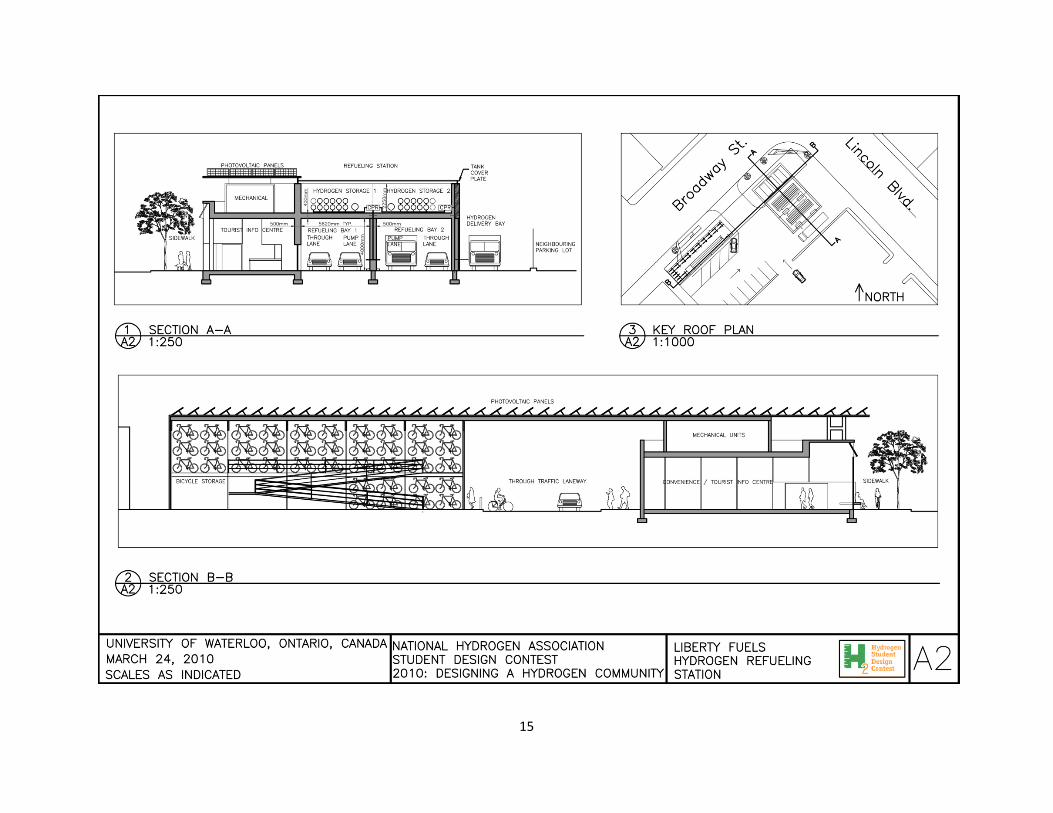
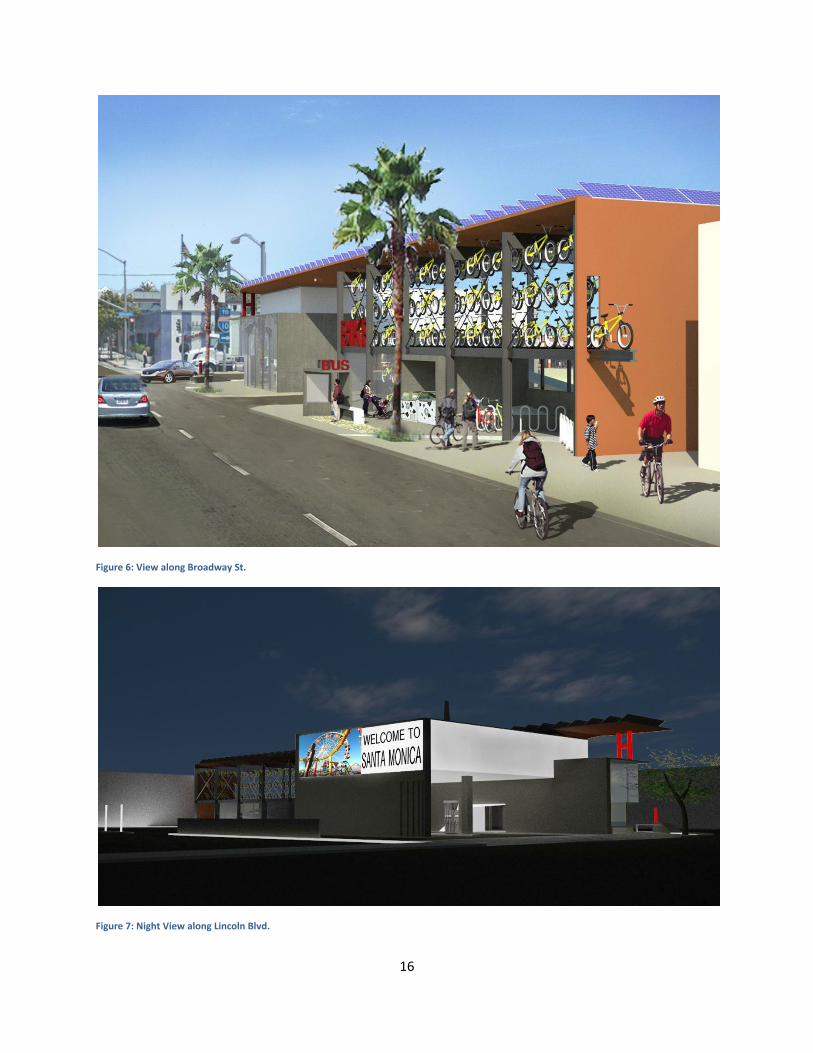
The refueling station will be located at the intersection of Lincoln Boulevard and Broadway Street in downtown Santa Monica, California. Broadway is currently a pedestrian commercial strip, which is often traveled northeast to southwest, heading towards the beach. Lincoln Boulevard is one of several arteries in the city which connect the northwest residential areas with the Santa Monica freeway, passing through a commercial district. Our tourist and bicycle rental center will attract the pedestrian and bicycle traffic along Broadway and act as a hub to connect this traffic to the vehicular traffic traveling along Lincoln Boulevard. This site is accessible to commuters, but also integrates a community zone so, unlike a common gas station, the site is a place to linger and not just a place to stop, refuel, and leave. By encouraging bicycle and pedestrian travel, our facility goes beyond simply replacing gasoline with hydrogen, and encourages people to get out of their cars to enjoy Santa Monica at a slower pace, under their own power.
8
STRUCTURE
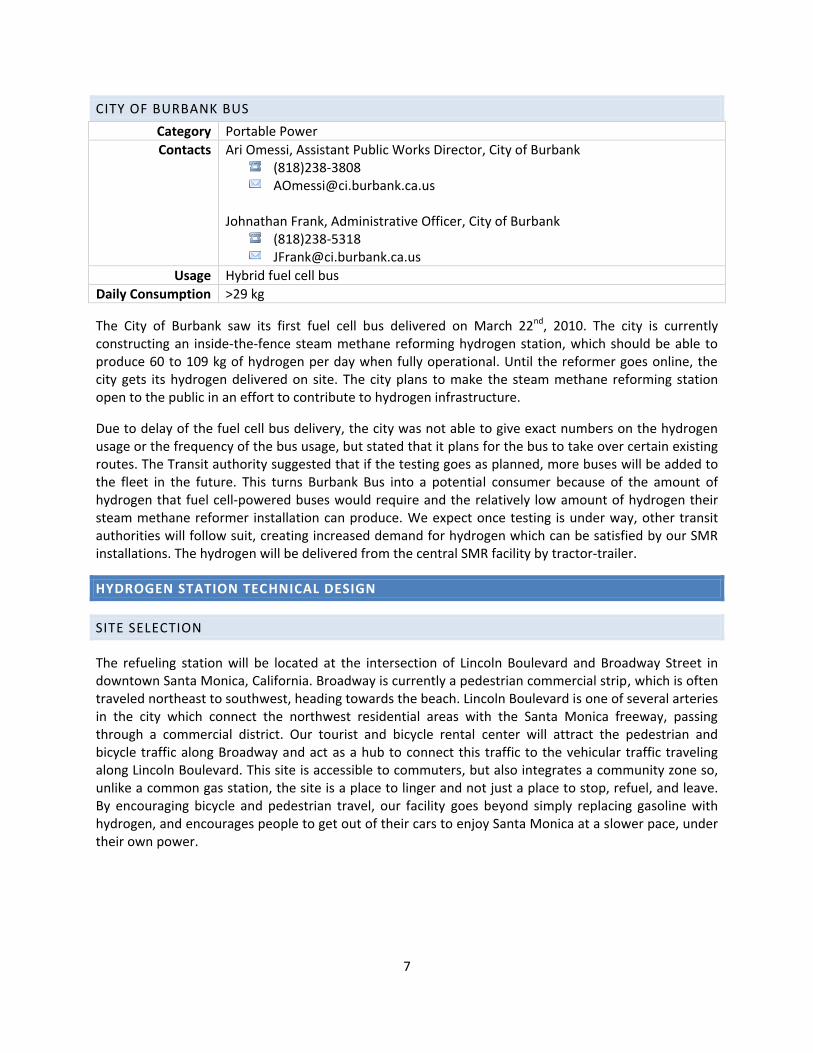
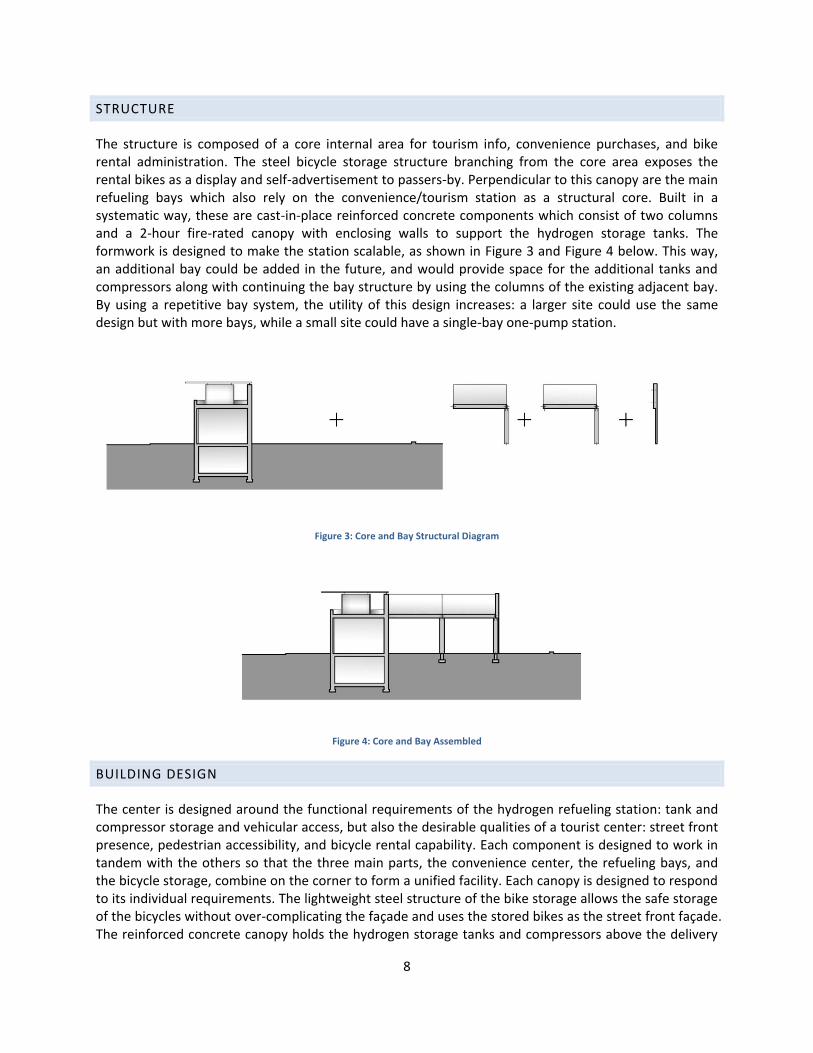
The structure is composed of a core internal area for tourism info, convenience purchases, and bike rental administration. The steel bicycle storage structure branching from the core area exposes the rental bikes as a display and self-advertisement to passers-by. Perpendicular to this canopy are the main refueling bays which also rely on the convenience/tourism station as a structural core. Built in a systematic way, these are cast-in-place reinforced concrete components which consist of two columns and a 2-hour fire-rated canopy with enclosing walls to support the hydrogen storage tanks. The formwork is designed to make the station scalable, as shown in Figure 3 and Figure 4 below. This way, an additional bay could be added in the future, and would provide space for the additional tanks and compressors along with continuing the bay structure by using the columns of the existing adjacent bay. By using a repetitive bay system, the utility of this design increases: a larger site could use the same design but with more bays, while a small site could have a single-bay one-pump station.
Figure 3: Core and Bay Structural Diagram
Figure 4: Core and Bay Assembled
BUILDING DESIGN
The center is designed around the functional requirements of the hydrogen refueling station: tank and compressor storage and vehicular access, but also the desirable qualities of a tourist center: street front presence, pedestrian accessibility, and bicycle rental capability. Each component is designed to work in tandem with the others so that the three main parts, the convenience center, the refueling bays, and the bicycle storage, combine on the corner to form a unified facility. Each canopy is designed to respond to its individual requirements. The lightweight steel structure of the bike storage allows the safe storage of the bicycles without over-complicating the façade and uses the stored bikes as the street front façade. The reinforced concrete canopy holds the hydrogen storage tanks and compressors above the delivery
9
pumps in the bays. The construction of these bays is strictly governed by the safety regulations requiring blast protection surrounding tanks and compressors. Thus the concrete slab and walls, being the most efficient solution, were used in the design. The tank placement is chiefly a response to the scalability of the design: a site with a set area of ground-level storage will not be as easily expanded as this canopy design. For every new pump and bay that is installed, the area for tank storage is proportionally increased, providing the storage needed to supply the new pump. The presence of the station on the corner is strengthened by the pedestrian and bicycle traffic concentrated on Broadway, and the vehicular access located on Lincoln Ave, the arterial street. The steel bicycle storage canopy and the reinforced concrete hydrogen storage canopy meet at the tourism center core, which ties the entire facility together with a glazed storefront entrance facing the main intersection.
DESIGN CONSTRAINTS AND ASSUMPTIONS
The sizing of station components was performed with constraints similar to the ones put forth in a 2006 report by the Institute of Transportation Studies at the University of California, Davis (Weinert & Lipman, 2006). The report suggests that the equipment should be sized to fuel 40% of its daily expected vehicles over a 3 hour peak period, with two peak periods during the day – one in the morning and one in the late afternoon. The station opens at 6 AM and closes at 9 PM.
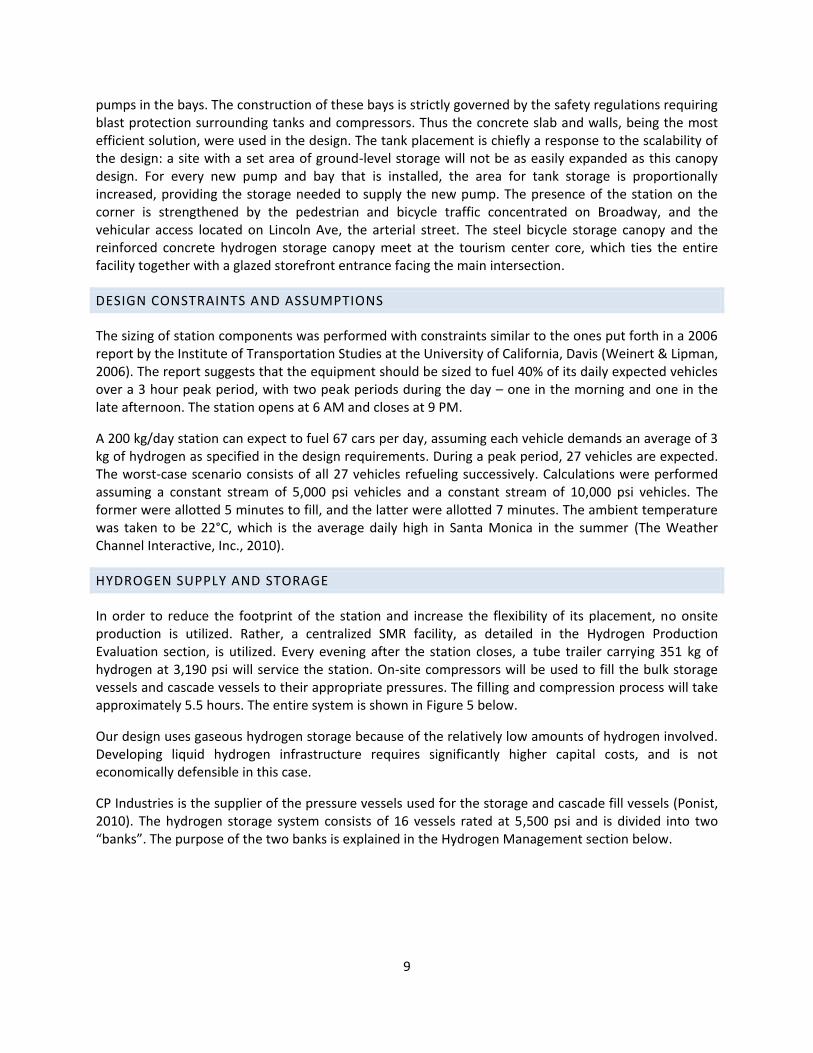
A 200 kg/day station can expect to fuel 67 cars per day, assuming each vehicle demands an average of 3 kg of hydrogen as specified in the design requirements. During a peak period, 27 vehicles are expected. The worst-case scenario consists of all 27 vehicles refueling successively. Calculations were performed assuming a constant stream of 5,000 psi vehicles and a constant stream of 10,000 psi vehicles. The former were allotted 5 minutes to fill, and the latter were allotted 7 minutes. The ambient temperature was taken to be 22°C, which is the average daily high in Santa Monica in the summer (The Weather Channel Interactive, Inc., 2010).
HYDROGEN SUPPLY AND STORAGE
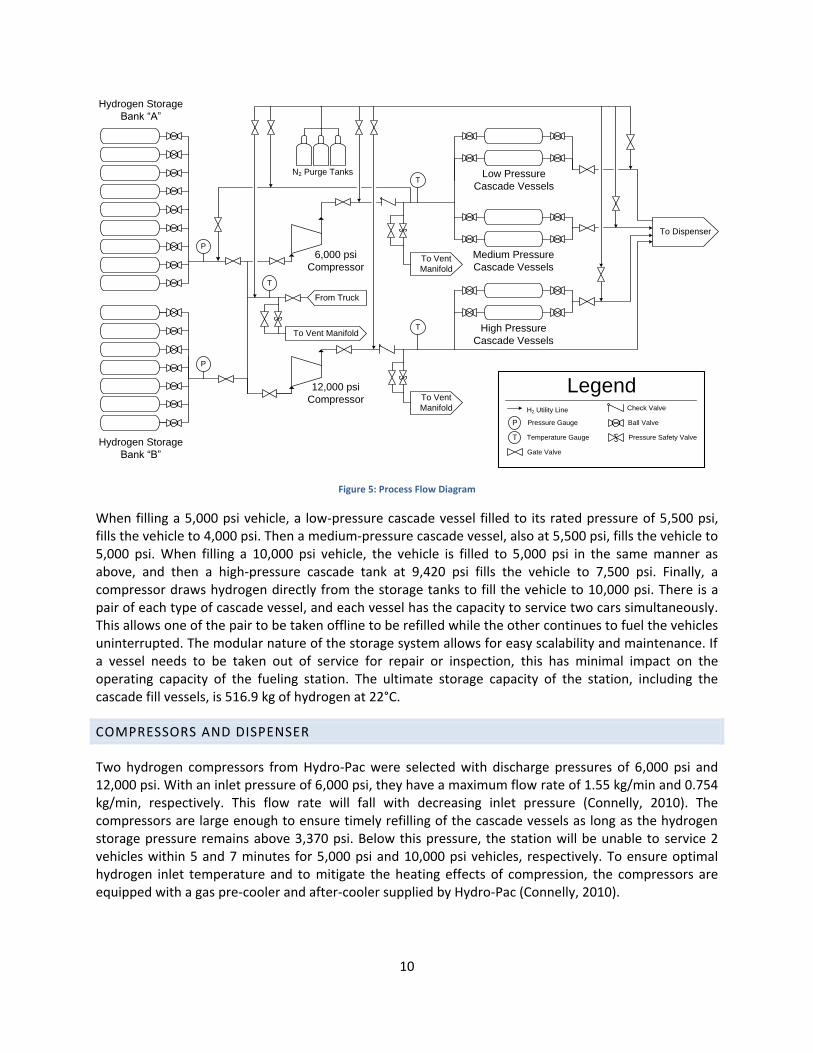
In order to reduce the footprint of the station and increase the flexibility of its placement, no onsite production is utilized. Rather, a centralized SMR facility, as detailed in the Hydrogen Production Evaluation section, is utilized. Every evening after the station closes, a tube trailer carrying 351 kg of hydrogen at 3,190 psi will service the station. On-site compressors will be used to fill the bulk storage vessels and cascade vessels to their appropriate pressures. The filling and compression process will take approximately 5.5 hours. The entire system is shown in Figure 5 below.
Our design uses gaseous hydrogen storage because of the relatively low amounts of hydrogen involved. Developing liquid hydrogen infrastructure requires significantly higher capital costs, and is not economically defensible in this case.
CP Industries is the supplier of the pressure vessels used for the storage and cascade fill vessels (Ponist, 2010). The hydrogen storage system consists of 16 vessels rated at 5,500 psi and is divided into two “banks”. The purpose of the two banks is explained in the Hydrogen Management section below.
10
Figure 5: Process Flow Diagram
When filling a 5,000 psi vehicle, a low-pressure cascade vessel filled to its rated pressure of 5,500 psi, fills the vehicle to 4,000 psi. Then a medium-pressure cascade vessel, also at 5,500 psi, fills the vehicle to 5,000 psi. When filling a 10,000 psi vehicle, the vehicle is filled to 5,000 psi in the same manner as above, and then a high-pressure cascade tank at 9,420 psi fills the vehicle to 7,500 psi. Finally, a compressor draws hydrogen directly from the storage tanks to fill the vehicle to 10,000 psi. There is a pair of each type of cascade vessel, and each vessel has the capacity to service two cars simultaneously. This allows one of the pair to be taken offline to be refilled while the other continues to fuel the vehicles uninterrupted. The modular nature of the storage system allows for easy scalability and maintenance. If a vessel needs to be taken out of service for repair or inspection, this has minimal impact on the operating capacity of the fueling station. The ultimate storage capacity of the station, including the cascade fill vessels, is 516.9 kg of hydrogen at 22°C.
COMPRESSORS AND DISPENSER
Two hydrogen compressors from Hydro-Pac were selected with discharge pressures of 6,000 psi and 12,000 psi. With an inlet pressure of 6,000 psi, they have a maximum flow rate of 1.55 kg/min and 0.754 kg/min, respectively. This flow rate will fall with decreasing inlet pressure (Connelly, 2010). The compressors are large enough to ensure timely refilling of the cascade vessels as long as the hydrogen storage pressure remains above 3,370 psi. Below this pressure, the station will be unable to service 2 vehicles within 5 and 7 minutes for 5,000 psi and 10,000 psi vehicles, respectively. To ensure optimal hydrogen inlet temperature and to mitigate the heating effects of compression, the compressors are equipped with a gas pre-cooler and after-cooler supplied by Hydro-Pac (Connelly, 2010).
To Vent Manifold
P
P
T
T
T
LegendH2 Utility Line
P Pressure Gauge
T Temperature Gauge
N2 Purge Tanks
Gate Valve
Check Valve
Ball Valve
Pressure Safety Valve
12,000 psi
Compressor
6,000 psi
Compressor
Low Pressure
Cascade Vessels
High Pressure
Cascade Vessels
Medium Pressure
Cascade Vessels
Hydrogen Storage
Bank “A”
To Dispenser
From Truck
Hydrogen Storage
Bank “B”
To Vent
Manifold
To Vent
Manifold
11
Dual nozzle dispensers are available from FTI International Group Inc., which can dispense hydrogen at 5,000 psi and 10,000 psi (You, 2010). Each unit can fuel one vehicle at a time, so two dispenser units will be required. The unit can accept pressures as high as 6,500 psi on the lower side and 13,500 psi on the high side with a maximum flow rate of 20 kg/min. An internal gas detection system will trigger alarms at 20% and 40% of the lower explosive limit, and ASME-approved pressure relief valves are included on the fill lines to protect the vehicle from excessive pressure. A static grounding cable is also included.
HYDROGEN MANAGEMENT
Since the fueling station does not produce hydrogen onsite, the station storage system must be large enough to dispense 200 kg/day of hydrogen while maintaining a high enough pressure so that the compressors can refill the cascade vessels in time. In order to meet peak demand, calculations show that the pressure in the storage must not fall below 3,370 psi. During morning peak demand, hydrogen is drawn from both storage banks shown in Figure 5 above, and storage pressure falls. In the afternoon, when hydrogen demand is low, hydrogen from storage bank B is transferred to bank A, filling it to capacity. Bank A, if it starts off full, will not require support from bank B to meet the peak afternoon demand. Without this reorganizing of hydrogen stock, 9 additional storage tanks would be required to maintain storage pressure above 3,370 psi. This reduction comes at the cost of extra compressor duty, but greatly reduces the capital cost of the storage system and increases the ratio of dispensable hydrogen to total stored hydrogen. As the station is scaled to higher capacities, or if the demand profile changes, this system will need to be re-configured for optimal performance. However, in general, some form of hydrogen management during the day will allow the station to have smaller compressors and fewer storage vessels.
ELECTRICAL LOADING AND SOLAR PANEL DESIGN
The annual electrical loading of the hydrogen refueling station was estimated 13,650 kWh. This was based on 2003 EIA census data (US Energy Information Administration, 2006) which states that buildings with a 1,001-5,000 square foot enclosed area consume an average of 12.4 kWh/ft2 annually. The occupied zone of our facility is only 72 square meters, resulting in an estimated load of 9,600 kWh per year. This number, however, would be insufficient to represent the extensive lighting load of a refueling station, mostly in the exterior zones. These exterior lighting loads were calculated with the knowledge that lighting alone will account for 21% of the energy load of a commercial facility (US Energy Information Administration, 2009). Our estimated loading assumed that an area with only a lighting load would be roughly 21% of the annual average for a small commercial building of equal size to our refueling bays (144 m2 x 0.21 x 133.3 kWh/m2 = 4,031 kWh). Therefore, we have added both the loading of the service building and the extensive outdoor lighting to project an annual electricity load of 13,650 kWh.
The solar arrays located on the longer canopy in the design are expected to carry this annual load thanks to the abundance of solar radiation on our site in California. A site adjacent to the ocean, such as Santa Monica, is ideal for a photovoltaic installation because the sea breeze from the west will reduce cloud coverage and increase efficiency of the system (City of Santa Monica). Table 4 below shows the monthly averages for solar radiation on a horizontal surface on our site (National Renewable Energy Laboratory, 1996). The average angle of incidence for direct sunlight throughout the year is roughly 34 degrees, which is equal to the latitude of Santa Monica. The panels are rotated to face southwest, which is parallel to the orientation of the canopy on which they are mounted, but also the angle which receives
12
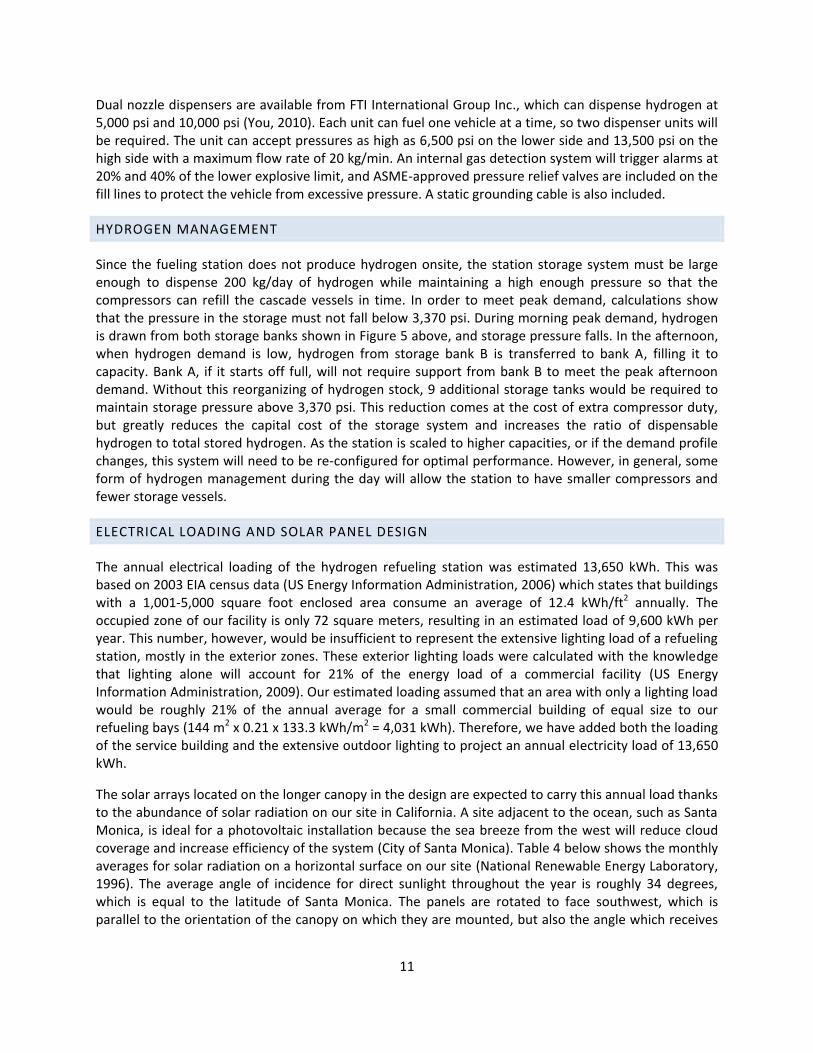
the greatest amount of solar radiation in the city of Santa Monica (City of Santa Monica). Covering the long canopy roof with 176 angled panels, at 1.6767 m2 per panel gives us 295.1 m2 of photovoltaic surface. Maximum power generated assumes that all of the panels function at peak capacity all of the time, which is not realistic. To calculate the average amount of power that the panels produce in a day, we reduce the ideal peaking power capabilities by multiplying the value by 0.14. This is a universally accepted peaking factor for monocrystalline silicon panels, like the ones proposed in the design (City of Santa Monica).This average power capability, multiplied by the hours of available sunlight in a day, and the days in each month will give us the estimated output of the solar panel system in any given month. The resulting projected electricity production for the solar panel system is 39,233.244 kWh.
Table 4: Solar Power Production
Month Solar Radiation (kWh/m2 day)
Maximum Daylight Power (kW)
Average Sunlight (h/day)
Monthly Total Power (kWh)
January 2.806 34.501 10.340 1,525.119
February 3.626 44.580 11.000 1,918.566
March 4.792 58.924 11.850 3,066.887
April 6.053 74.430 13.000 4,080.713
May 6.400 78.694 13.950 4,762.860
June 6.589 81.020 14.600 4,896.662
July 7.125 87.610 14.060 5,385.106
August 6.526 80.245 13.200 4,660.263
September 5.265 64.739 12.400 3,362.790
October 4.162 51.171 11.400 2,512.402
November 3.153 38.766 10.500 1,692.499
December 2.585 31.788 10.000 1,369.377
ANNUAL TOTAL 39,233.244
The amount of electricity produced by the photovoltaic arrays will more than cover the regular electrical consumption of the convenience store and tourist center, as well as the lighting load of the station at night. In practice, however, the electricity generated by the panels will be used entirely during daylight hours to power the building and supplement the compressor load. Maximum annual electrical loading of the compressors and hydrogen dispensers is estimated at 157,200kWh and 2,100kWh respectively, bringing the total consumption of the station to 172,950kWh per year. Considering our average projected power production levels, we anticipate offsetting our electricity consumption with 23% green energy produced on site. The entire system will be connected to the Santa Monica electrical grid, so that we may draw additional power to run the compressors and lighting as required.
SAFETY FEATURES INCORPORATED IN DESIGN
Several major safety considerations were taken into account during the design of the station. The primary concern reflected in every stage of the design is safety of the public. The overarching issue in our design was the possibility of a hydrogen leak resulting in an explosion. One of the major safety benefits of this station is the lack of on-site hydrogen production. Therefore, the only area of concern for a gas leak is from the storage tanks. Although this is a major concern, the tanks can be easily isolated from areas of public ingress.

13
When released to the atmosphere, hydrogen naturally floats upwards and diffuses into the atmosphere. For public safety, the hydrogen storage tanks were located on top of the structure. This ensures that if there is a leak, the hydrogen will float upwards, away from any pedestrian or vehicle traffic. In the unlikely event of combustion, the bulk of the fuel has been removed from high traffic areas. In addition, to ensure that any explosion does not damage the structure or the surrounding area, the design integrates 2.25 meter high concrete walls around the hydrogen fuel tank storage. These walls are fireproofed to two hours in order to adhere to code (National Fire Protection Association, 1999). This area also houses all compression equipment to ensure that only the dispenser is open to customers. This minimizes the exposure that the customer has to the system, thereby reducing the potential danger of an incident. Additionally, pressure safety valves have been fitted onto each tank. These valves are connected to pressure relief headers which will siphon any hydrogen leak farther upwards to mitigate the possibility of an accidental combustion causing a chain reaction in other tanks. The area will be fitted with hydrogen leak detectors and temperature sensors in order to allow personnel to identify fire risks, as hydrogen fires are nearly invisible in daylight.
Another concern is accidental static discharge occurring during normal operation. In order to avoid this, all buildings and apparatus are electrically grounded, and all service personnel will be thoroughly trained in hydrogen safety procedures. In addition, access to the storage area will be limited to service personnel in order to limit unauthorized access and deliberate acts of vandalism. This will be coupled with a strict inspection and maintenance schedule to ensure that none of the process equipment falls into disrepair.
The station will also include a process control system. This system has been designed to promote safety in case of a leak. For full details of the system, refer to Figure 5: Process Flow on page 10. The control system will measure process variables such as temperature, pressure, and flow rates. It will also be connected to hydrogen leak detectors and temperature sensors, in order to better monitor the process. This system will be capable of detecting leaks and taking steps in order to mitigate damage. This includes purging hydrogen lines with inert nitrogen, and automatic controls on emergency shutoff valves that can stop the flow of hydrogen into the distribution lines.
SITE PLAN
14
15
16
Figure 6: View along Broadway St.
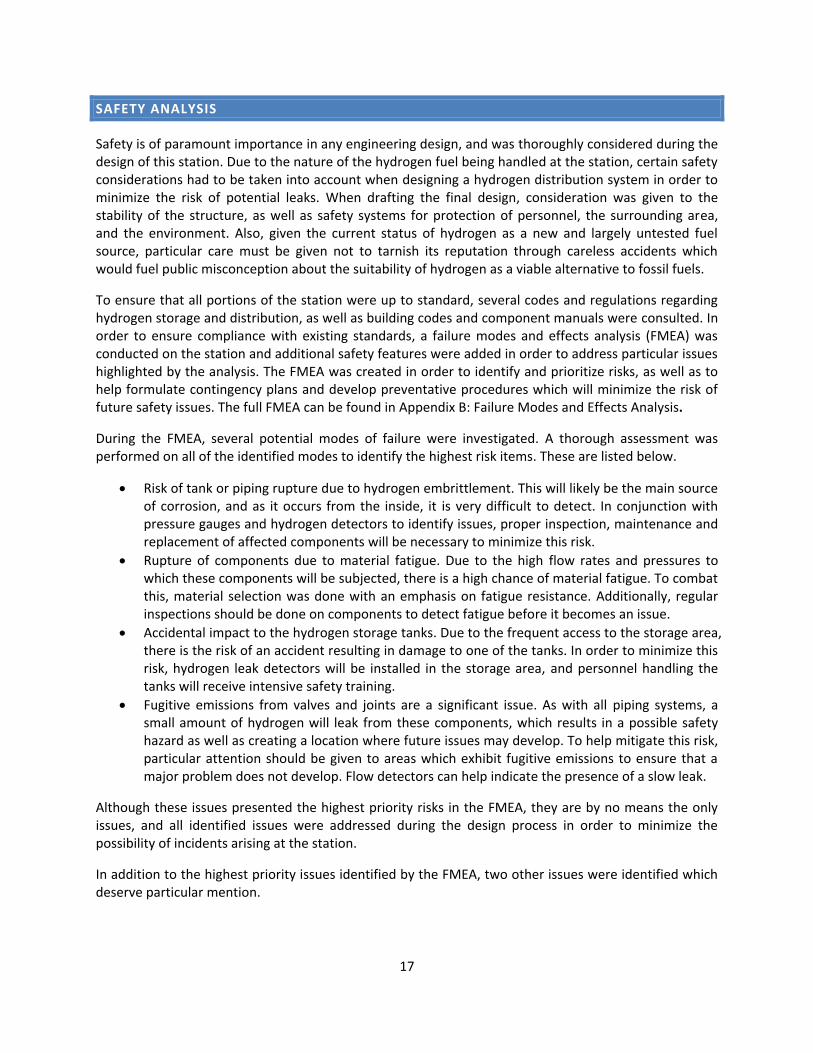
Figure 7: Night View along Lincoln Blvd.
17
SAFETY ANALYSIS
Safety is of paramount importance in any engineering design, and was thoroughly considered during the design of this station. Due to the nature of the hydrogen fuel being handled at the station, certain safety considerations had to be taken into account when designing a hydrogen distribution system in order to minimize the risk of potential leaks. When drafting the final design, consideration was given to the stability of the structure, as well as safety systems for protection of personnel, the surrounding area, and the environment. Also, given the current status of hydrogen as a new and largely untested fuel source, particular care must be given not to tarnish its reputation through careless accidents which would fuel public misconception about the suitability of hydrogen as a viable alternative to fossil fuels.
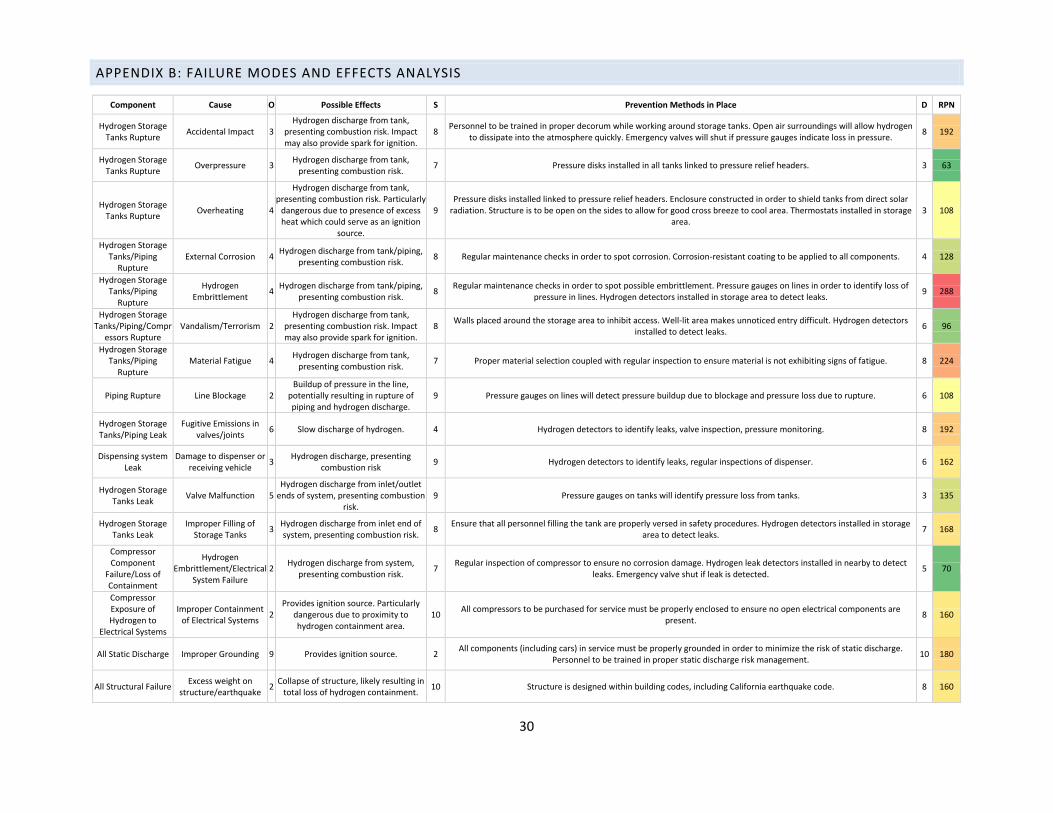
To ensure that all portions of the station were up to standard, several codes and regulations regarding hydrogen storage and distribution, as well as building codes and component manuals were consulted. In order to ensure compliance with existing standards, a failure modes and effects analysis (FMEA) was conducted on the station and additional safety features were added in order to address particular issues highlighted by the analysis. The FMEA was created in order to identify and prioritize risks, as well as to help formulate contingency plans and develop preventative procedures which will minimize the risk of future safety issues. The full FMEA can be found in Appendix B: Failure Modes and Effects Analysis.
During the FMEA, several potential modes of failure were investigated. A thorough assessment was performed on all of the identified modes to identify the highest risk items. These are listed below.
Risk of tank or piping rupture due to hydrogen embrittlement. This will likely be the main source of corrosion, and as it occurs from the inside, it is very difficult to detect. In conjunction with pressure gauges and hydrogen detectors to identify issues, proper inspection, maintenance and replacement of affected components will be necessary to minimize this risk.
Rupture of components due to material fatigue. Due to the high flow rates and pressures to which these components will be subjected, there is a high chance of material fatigue. To combat this, material selection was done with an emphasis on fatigue resistance. Additionally, regular inspections should be done on components to detect fatigue before it becomes an issue.
Accidental impact to the hydrogen storage tanks. Due to the frequent access to the storage area, there is the risk of an accident resulting in damage to one of the tanks. In order to minimize this risk, hydrogen leak detectors will be installed in the storage area, and personnel handling the tanks will receive intensive safety training.
Fugitive emissions from valves and joints are a significant issue. As with all piping systems, a small amount of hydrogen will leak from these components, which results in a possible safety hazard as well as creating a location where future issues may develop. To help mitigate this risk, particular attention should be given to areas which exhibit fugitive emissions to ensure that a major problem does not develop. Flow detectors can help indicate the presence of a slow leak.
Although these issues presented the highest priority risks in the FMEA, they are by no means the only issues, and all identified issues were addressed during the design process in order to minimize the possibility of incidents arising at the station.
In addition to the highest priority issues identified by the FMEA, two other issues were identified which deserve particular mention.

18
Vandalism and terrorism. Although there are several measures that can be taken to restrict access to the hydrogen storage area, there is little that can be done in a cost-effective way to prevent a direct, intentional attack on the station. To combat this, arrangements should be made with local law enforcement to provide additional deterrent to would-be vandals.
Santa Monica is located along the San Andreas Fault, in an earthquake zone. Although the station was designed to meet California earthquake specifications, the possibility of a catastrophic earthquake destroying the station and igniting the hydrogen contained therein cannot be ruled out nor prevented.
In order to combat all risks and ensure safety, a number of general safety measures were implemented in the design in order to address all of the safety issues outlined in the FMEA. These measures are listed below.
The hydrogen storage tanks will be housed on the top of the service station, which is 4.4 metres above ground level. This will ensure that ground level traffic will not be affected in the case of a hydrogen containment loss or explosion.
A 2.25 metre high blast wall rated at 2-hour fire resistance will be installed around the storage area. This will prevent accidental combustion from affecting areas adjacent to the station, as well as providing a physical barrier to any unauthorized ingress to the storage area.
A canopy will be installed above the hydrogen storage area to protect the tanks from direct solar radiation, which will help keep them from overheating.
15-foot ventilation stacks will be attached to each of the pressure safety valves installed on the hydrogen storage tanks. This will allow any overpressure to be vented safely above the station, where it will dissipate into the atmosphere.
Thermostats and fire detectors will be installed in the storage area to ensure that any ignition is detected, as hydrogen fires are nearly invisible.
Hydrogen detectors will be installed in the storage areas, along pipelines, and near dispensers to promptly identify leaks.
Pressure gauges will be installed on every tank and pipeline to identify any hydrogen leaks via loss of pressure in the line.
All outdoor equipment will be given a corrosion resistant coating to protect against external sources of corrosion.
Regular inspections of the components will be undertaken to ensure that the station is in good working order and to spot issues before they become problems.
A controller will be linked to all pressure gauges, hydrogen detectors and thermostats to allow for remote emergency shutoffs in the event of a leak.
All components in this station, including cars, will be properly grounded before the system is put to use. This will limit sources of ignition.
Smoking will be prohibited within 25 feet of any hydrogen storage unit or dispenser.
By taking all of the issues outlined in the FMEA into account, the station was designed with a ‘safety-first’ approach, which will help mitigate the potential for accidents in the future. In addition, by modifying the station to particularly address the identified priority issues, the result was an innovative and meticulous design. In practical terms, this translates to a safe hydrogen fuelling station.
19
ECONOMIC/BUSINESS PLAN ANALYSIS
ARCHITECTURAL COSTS
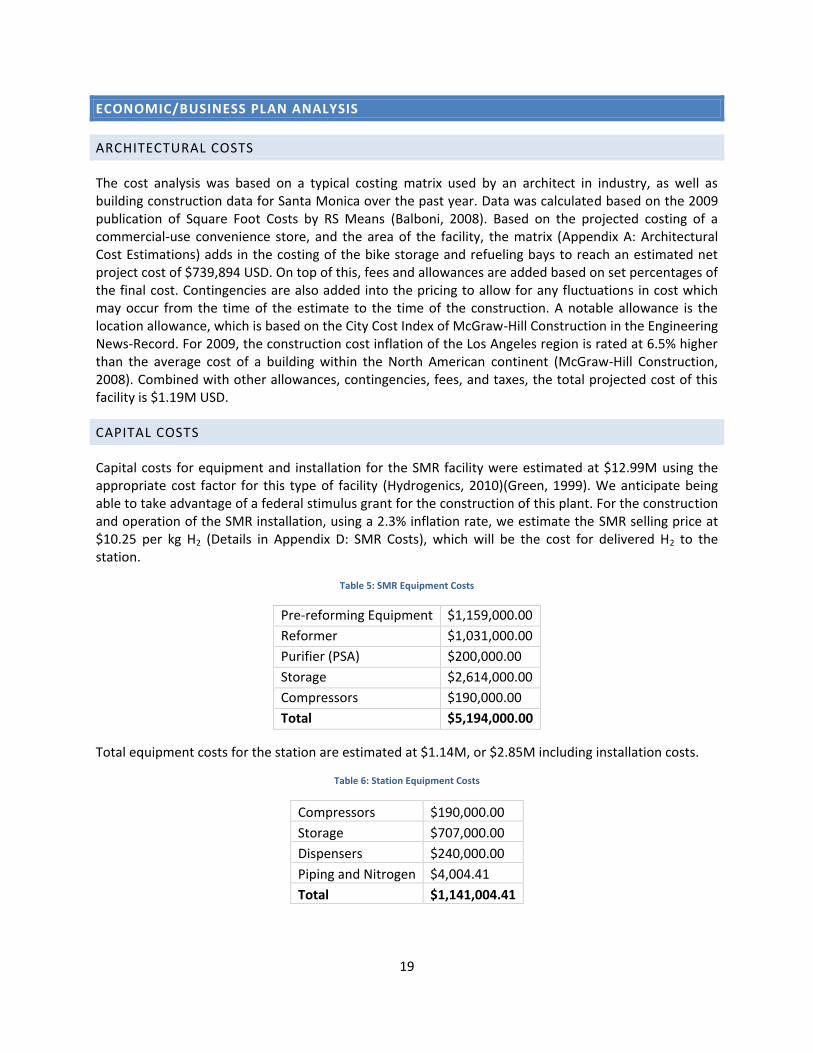
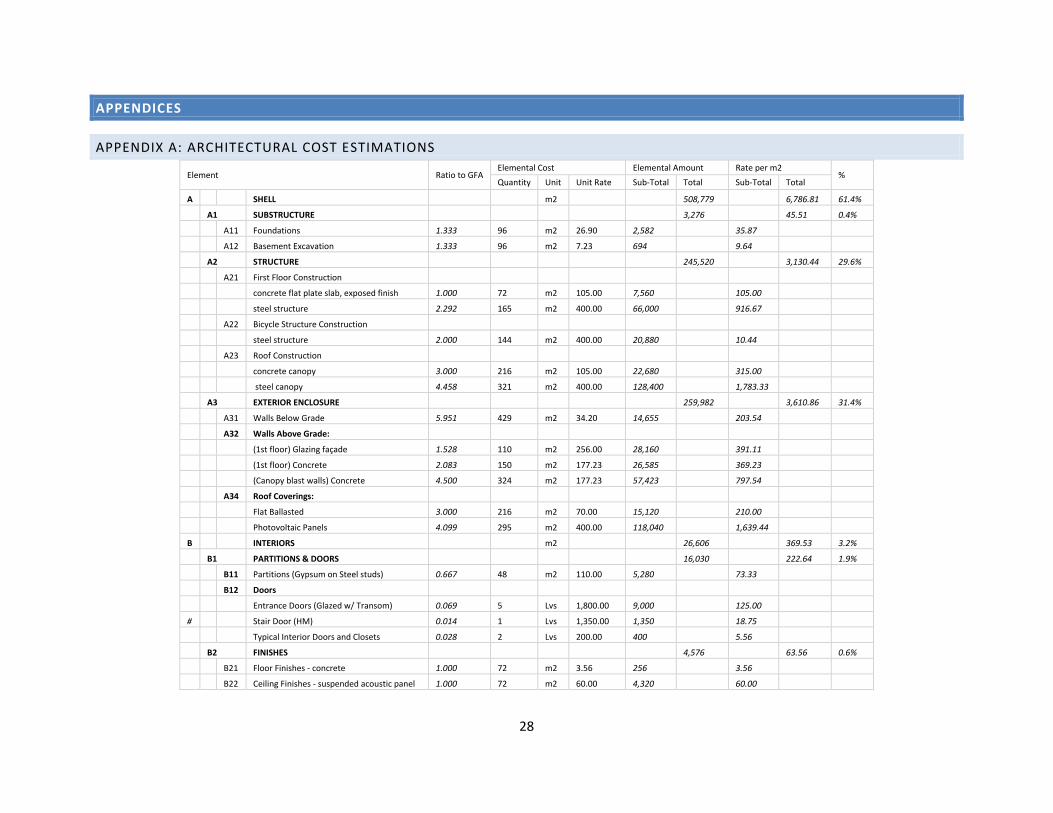
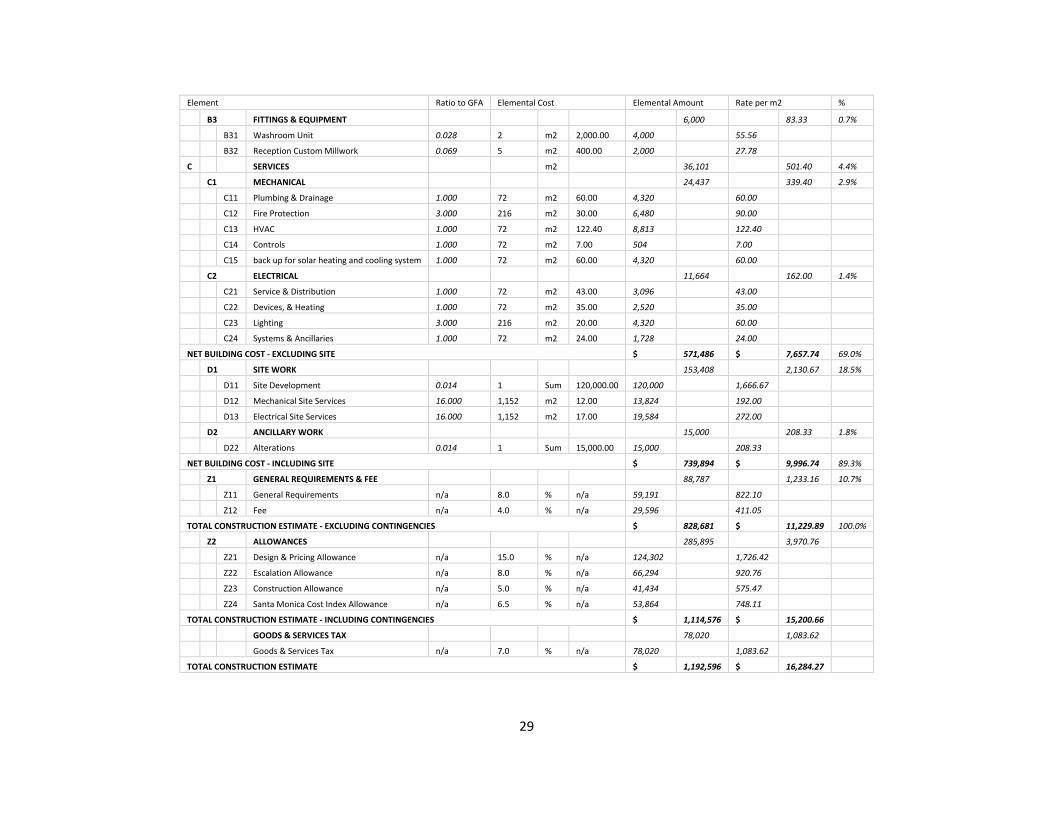
The cost analysis was based on a typical costing matrix used by an architect in industry, as well as building construction data for Santa Monica over the past year. Data was calculated based on the 2009 publication of Square Foot Costs by RS Means (Balboni, 2008). Based on the projected costing of a commercial-use convenience store, and the area of the facility, the matrix (Appendix A: Architectural Cost Estimations) adds in the costing of the bike storage and refueling bays to reach an estimated net project cost of $739,894 USD. On top of this, fees and allowances are added based on set percentages of the final cost. Contingencies are also added into the pricing to allow for any fluctuations in cost which may occur from the time of the estimate to the time of the construction. A notable allowance is the location allowance, which is based on the City Cost Index of McGraw-Hill Construction in the Engineering News-Record. For 2009, the construction cost inflation of the Los Angeles region is rated at 6.5% higher than the average cost of a building within the North American continent (McGraw-Hill Construction, 2008). Combined with other allowances, contingencies, fees, and taxes, the total projected cost of this facility is $1.19M USD.
CAPITAL COSTS
Capital costs for equipment and installation for the SMR facility were estimated at $12.99M using the appropriate cost factor for this type of facility (Hydrogenics, 2010)(Green, 1999). We anticipate being able to take advantage of a federal stimulus grant for the construction of this plant. For the construction and operation of the SMR installation, using a 2.3% inflation rate, we estimate the SMR selling price at $10.25 per kg H2 (Details in Appendix D: SMR Costs), which will be the cost for delivered H2 to the station.
Table 5: SMR Equipment Costs
Pre-reforming Equipment $1,159,000.00
Reformer $1,031,000.00
Purifier (PSA) $200,000.00
Storage $2,614,000.00
Compressors $190,000.00
Total $5,194,000.00
Total equipment costs for the station are estimated at $1.14M, or $2.85M including installation costs.
Table 6: Station Equipment Costs
Compressors $190,000.00
Storage $707,000.00
Dispensers $240,000.00
Piping and Nitrogen $4,004.41
Total $1,141,004.41
20
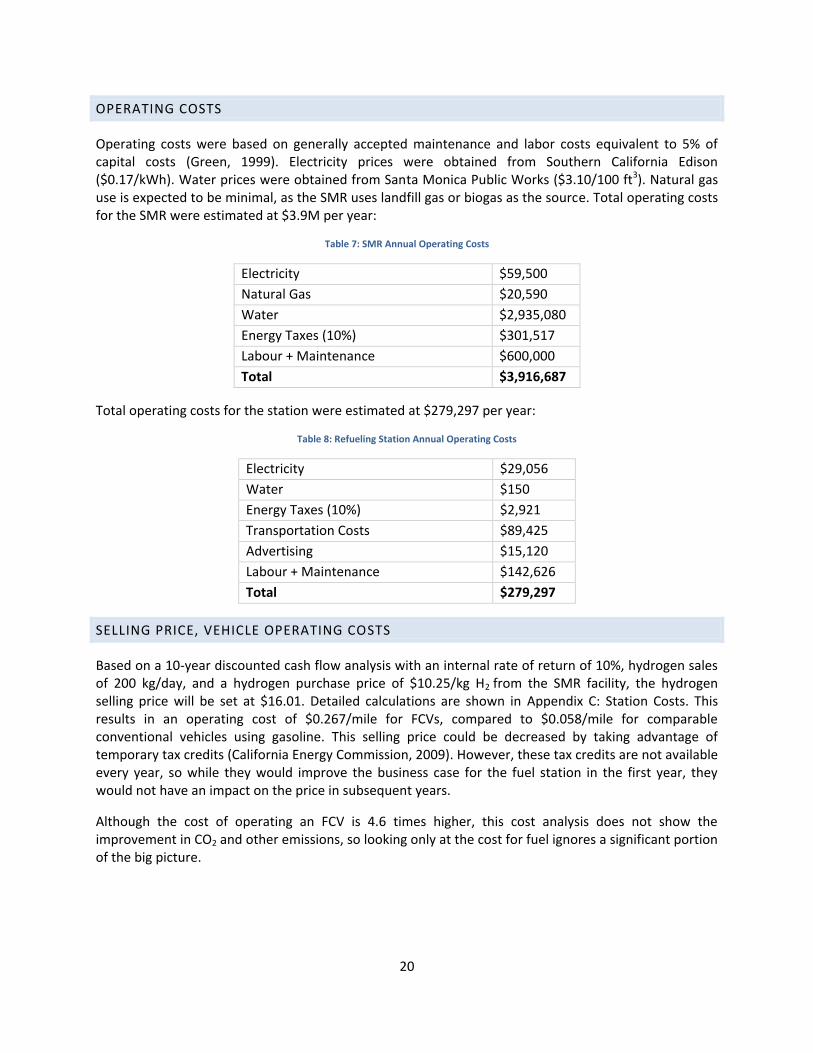
OPERATING COSTS
Operating costs were based on generally accepted maintenance and labor costs equivalent to 5% of capital costs (Green, 1999). Electricity prices were obtained from Southern California Edison ($0.17/kWh). Water prices were obtained from Santa Monica Public Works ($3.10/100 ft3). Natural gas use is expected to be minimal, as the SMR uses landfill gas or biogas as the source. Total operating costs for the SMR were estimated at $3.9M per year:
Table 7: SMR Annual Operating Costs
Electricity $59,500
Natural Gas $20,590
Water $2,935,080
Energy Taxes (10%) $301,517
Labour + Maintenance $600,000
Total $3,916,687
Total operating costs for the station were estimated at $279,297 per year:
Table 8: Refueling Station Annual Operating Costs
Electricity $29,056
Water $150
Energy Taxes (10%) $2,921
Transportation Costs $89,425
Advertising $15,120
Labour + Maintenance $142,626
Total $279,297
SELLING PRICE, VEHICLE OPERATING COSTS
Based on a 10-year discounted cash flow analysis with an internal rate of return of 10%, hydrogen sales of 200 kg/day, and a hydrogen purchase price of $10.25/kg H2 from the SMR facility, the hydrogen selling price will be set at $16.01. Detailed calculations are shown in Appendix C: Station Costs. This results in an operating cost of $0.267/mile for FCVs, compared to $0.058/mile for comparable conventional vehicles using gasoline. This selling price could be decreased by taking advantage of temporary tax credits (California Energy Commission, 2009). However, these tax credits are not available every year, so while they would improve the business case for the fuel station in the first year, they would not have an impact on the price in subsequent years.
Although the cost of operating an FCV is 4.6 times higher, this cost analysis does not show the improvement in CO2 and other emissions, so looking only at the cost for fuel ignores a significant portion of the big picture.
21
ENVIRONMENTAL ANALYSIS
In this section, an energy balance for all major components of the system is analyzed. A well-to-tank energy and emission analysis of the hydrogen production pathway described above is compared to a conventional gasoline production pathway in terms of CO2 emissions. This environmental analysis focuses specifically on the well-to-tank analysis for the hydrogen production process in terms of CO2 emissions and energy requirements using the GREET model.
HYDROGEN PRODUCTION
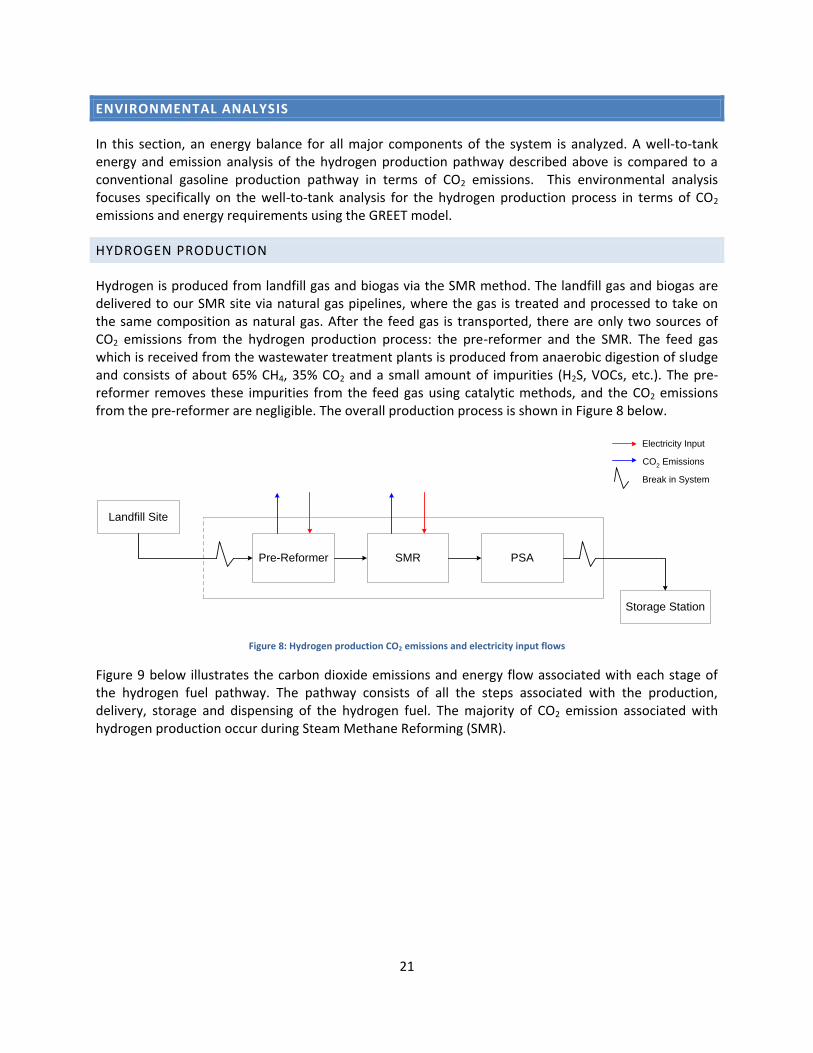
Hydrogen is produced from landfill gas and biogas via the SMR method. The landfill gas and biogas are delivered to our SMR site via natural gas pipelines, where the gas is treated and processed to take on the same composition as natural gas. After the feed gas is transported, there are only two sources of CO2 emissions from the hydrogen production process: the pre-reformer and the SMR. The feed gas which is received from the wastewater treatment plants is produced from anaerobic digestion of sludge and consists of about 65% CH4, 35% CO2 and a small amount of impurities (H2S, VOCs, etc.). The pre-reformer removes these impurities from the feed gas using catalytic methods, and the CO2 emissions from the pre-reformer are negligible. The overall production process is shown in Figure 8 below.
Landfill Site
Pre-Reformer SMR PSA
Storage Station
Electricity Input
CO2 Emissions
Break in System
Figure 8: Hydrogen production CO2 emissions and electricity input flows
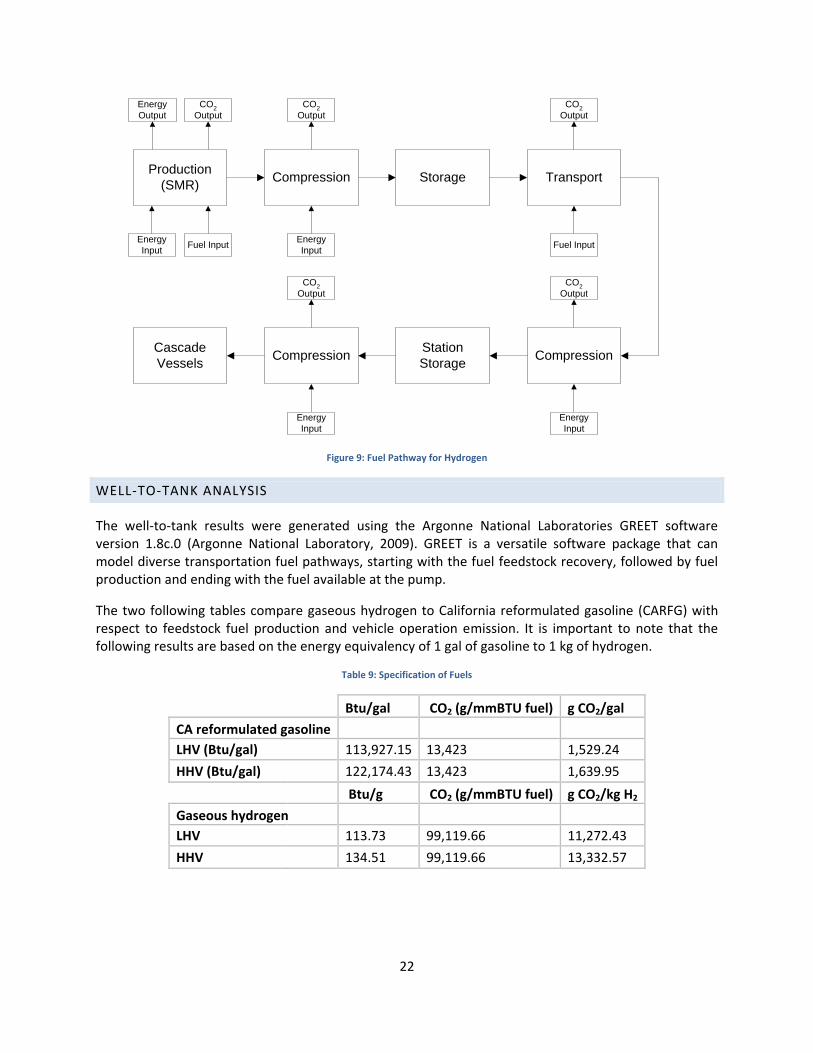
Figure 9 below illustrates the carbon dioxide emissions and energy flow associated with each stage of the hydrogen fuel pathway. The pathway consists of all the steps associated with the production, delivery, storage and dispensing of the hydrogen fuel. The majority of CO2 emission associated with hydrogen production occur during Steam Methane Reforming (SMR).
22
Production
(SMR)
Energy
Input
Energy
Output
CO2
Output
Compression
Energy
Input
Storage Transport
Fuel Input
Compression
Energy
Input
Station
StorageCompression
Cascade
Vessels
CO2
Output
Fuel Input
CO2
Output
CO2
Output
CO2
Output
Energy
Input
Figure 9: Fuel Pathway for Hydrogen
WELL-TO-TANK ANALYSIS
The well-to-tank results were generated using the Argonne National Laboratories GREET software version 1.8c.0 (Argonne National Laboratory, 2009). GREET is a versatile software package that can model diverse transportation fuel pathways, starting with the fuel feedstock recovery, followed by fuel production and ending with the fuel available at the pump.
The two following tables compare gaseous hydrogen to California reformulated gasoline (CARFG) with respect to feedstock fuel production and vehicle operation emission. It is important to note that the following results are based on the energy equivalency of 1 gal of gasoline to 1 kg of hydrogen.
Table 9: Specification of Fuels
Btu/gal CO2 (g/mmBTU fuel) g CO2/gal
CA reformulated gasoline
LHV (Btu/gal) 113,927.15 13,423 1,529.24
HHV (Btu/gal) 122,174.43 13,423 1,639.95
Btu/g CO2 (g/mmBTU fuel) g CO2/kg H2
Gaseous hydrogen
LHV
113.73 99,119.66 11,272.43
HHV 134.51 99,119.66 13,332.57
23
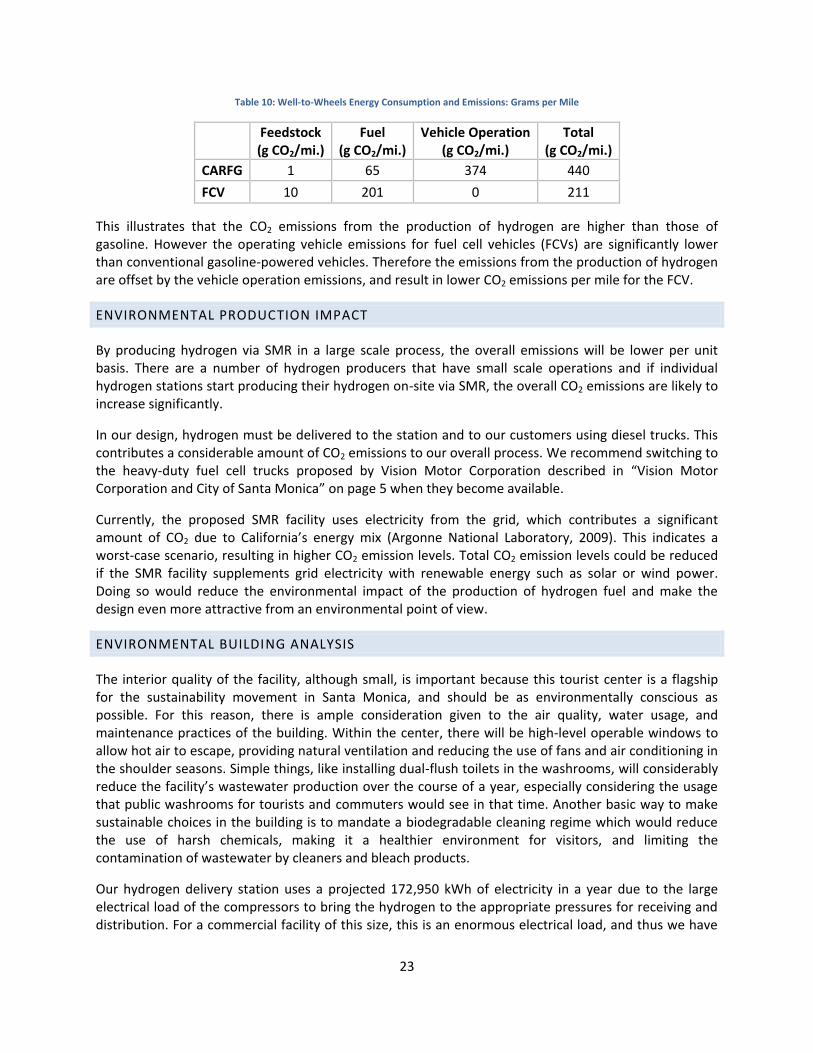
Table 10: Well-to-Wheels Energy Consumption and Emissions: Grams per Mile
Feedstock (g CO2/mi.)
Fuel (g CO2/mi.)
Vehicle Operation (g CO2/mi.)
Total (g CO2/mi.)
CARFG 1 65 374 440
FCV 10 201 0 211
This illustrates that the CO2 emissions from the production of hydrogen are higher than those of gasoline. However the operating vehicle emissions for fuel cell vehicles (FCVs) are significantly lower than conventional gasoline-powered vehicles. Therefore the emissions from the production of hydrogen are offset by the vehicle operation emissions, and result in lower CO2 emissions per mile for the FCV.
ENVIRONMENTAL PRODUCTION IMPACT
By producing hydrogen via SMR in a large scale process, the overall emissions will be lower per unit basis. There are a number of hydrogen producers that have small scale operations and if individual hydrogen stations start producing their hydrogen on-site via SMR, the overall CO2 emissions are likely to increase significantly.
In our design, hydrogen must be delivered to the station and to our customers using diesel trucks. This contributes a considerable amount of CO2 emissions to our overall process. We recommend switching to the heavy-duty fuel cell trucks proposed by Vision Motor Corporation described in “Vision Motor Corporation and City of Santa Monica” on page 5 when they become available.
Currently, the proposed SMR facility uses electricity from the grid, which contributes a significant amount of CO2 due to California’s energy mix (Argonne National Laboratory, 2009). This indicates a worst-case scenario, resulting in higher CO2 emission levels. Total CO2 emission levels could be reduced if the SMR facility supplements grid electricity with renewable energy such as solar or wind power. Doing so would reduce the environmental impact of the production of hydrogen fuel and make the design even more attractive from an environmental point of view.
ENVIRONMENTAL BUILDING ANALYSIS
The interior quality of the facility, although small, is important because this tourist center is a flagship for the sustainability movement in Santa Monica, and should be as environmentally conscious as possible. For this reason, there is ample consideration given to the air quality, water usage, and maintenance practices of the building. Within the center, there will be high-level operable windows to allow hot air to escape, providing natural ventilation and reducing the use of fans and air conditioning in the shoulder seasons. Simple things, like installing dual-flush toilets in the washrooms, will considerably reduce the facility’s wastewater production over the course of a year, especially considering the usage that public washrooms for tourists and commuters would see in that time. Another basic way to make sustainable choices in the building is to mandate a biodegradable cleaning regime which would reduce the use of harsh chemicals, making it a healthier environment for visitors, and limiting the contamination of wastewater by cleaners and bleach products.
Our hydrogen delivery station uses a projected 172,950 kWh of electricity in a year due to the large electrical load of the compressors to bring the hydrogen to the appropriate pressures for receiving and distribution. For a commercial facility of this size, this is an enormous electrical load, and thus we have
24
offset our energy use by including extensive solar panel arrays on one canopy. Although the solar production does not cover our electrical loading during hours of darkness, it represents 23% of our total electricity use. This also ensures that during daylight we would be able to produce as much electricity as we use since the majority of the electricity used by the compressors would be required at night, when electricity is off-peak. This effort to generate electricity on site is another way that this station would be a forerunner of sustainable facilities in Santa Monica, setting an example of what commercial and industrial services can do to offset their energy bills.
By building the station on an existing parking lot, we are not increasing the amount of paved surface in the already over-paved city. Raising the density of an urban location, especially at the current terminus of the popular Boardwalk pedestrian path, will increase tourist traffic going through that neighborhood towards the beach. Stores and commercial buildings would enjoy the extension of the pedestrian route farther down Broadway, and the addition of the bicycle rental will allow for even farther distribution of tourists beyond the typical Venice Beach neighborhood. Santa Monica’s tourism would be able to expand to a larger radius than the current pedestrian realm if a more cycle-friendly neighborhood were encouraged, starting with this station.
MARKETING AND EDUCATION PLAN
Hydrogen power is still a very new alternative to fossil fuels. Although the energy it provides is renewable, cheap, and clean, there is reluctance to adopt hydrogen power. A substantial portion of this reluctance stems from the natural tendency to reject change. However, a significant factor still remains; ignorance of the benefits of hydrogen power and a hydrogen economy. To combat these effects, the advertising campaign will focus entirely on targeting those issues which people do understand: safety, energy independence, and pollution. By targeting these issues, we will be able to communicate with a large audience. Through a mixture of information and advertisement, we hope to create an effective campaign that will be able to help sway public opinion towards the implementation of hydrogen power and hydrogen distribution stations.
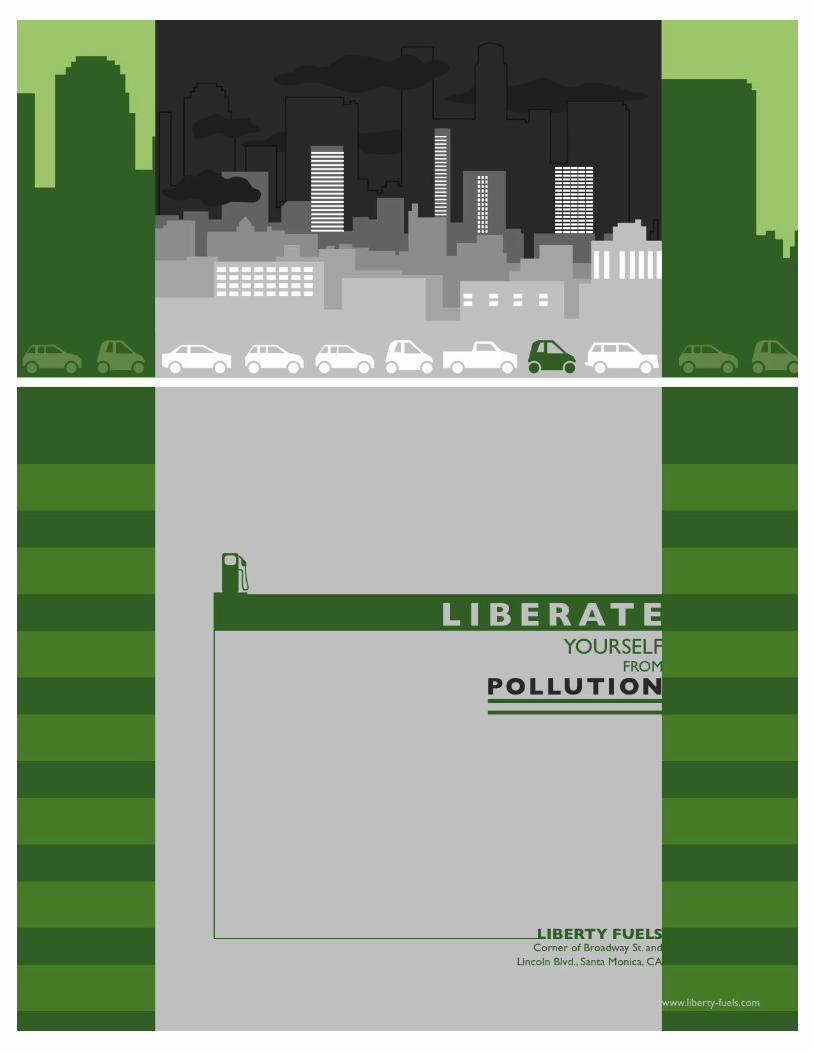
To this end, the message we want to portray for Liberty Fuels is simple and clear: Hydrogen is a clean, safe, sustainable alternative to fossil fuels - it will liberate America from its dependence on foreign oil. The issues caused by fossil fuels and the unreliable nature of their supply have had their impact upon public opinion regarding foreign oil dependence. Through the use of hydrogen fuel, people can power their lives with a domestically produced fuel source and avoid this issue. Better yet, it will help bolster the American economy; providing multitudes of jobs, directing revenue internally instead of abroad, and laying the foundations for a new industry which will help breathe new life into the American automobile industry. These are concerns of American consumers today. Consumers who are looking for alternatives to current energy sources which will help them escape ever-rising gasoline prices at the pump. Our message appeals to the American consumer looking for cleaner air, energy independence, and ultimately a cheaper way to drive their car.
This hydrogen refueling station, coupled with the tourism and convenience center, would be a leader among current fuel distribution stations. The proposed facility would fit effortlessly within the existing sustainability movement in Santa Monica, and should quickly become a template for what a refueling station should be in the future. By removing the constraints of a typical gas station, and embracing the community and tourism market, this station would attract more attention than a standalone refueling facility. This additional attention will generate interest in hydrogen technologies through educating
25
tourists about the station, and would ultimately provide self-promotional opportunities that would be unheard of in a traditional gas station.
TARGET
The target audience of this campaign will be the general public. Although it is imperative that we appeal to potential hydrogen vehicle owners, the main objective is to sway public opinion. In this regard, hydrogen sells itself on emissions and energy independence. These selling points must be well-publicized. In order to do that, hydrogen vehicle producers, hydrogen suppliers, and hydrogen distributors must create a flood of information in order to highlight the advantages of this new energy source. Advertisements in newspapers, on television and radio, and particularly over the internet must be made to get the idea of hydrogen fuel into people’s minds.
Right now, many people have heard of hydrogen fuel, but don’t fully understand it. To them, it is a distant solution. The present objective is to convince the public of hydrogen’s viability now, and of the benefits to switching over today.
Acceptance of the actual hydrogen station by the community is essential as well. In order to appeal to the community of Santa Monica, advertisements should also focus on the bicycle rental and tourist center which will provide valuable services to pedestrians and tourists, respectively. By advertising the bicycle rental, more people will start to use this service. Since all bicycles will carry the Liberty Fuels logo, this will provide more publicity for the station. It will also help to reinforce the eco-friendly image that is crucial to the campaign.
CHALLENGES
As mentioned above, hydrogen sells itself on emissions and energy dependence. However, the main issue is safety. If people are not comfortable with hydrogen distribution stations in their communities, these projects will have a more difficult time succeeding. This advertising campaign has to convince the majority of the public across all demographics and age groups that hydrogen energy is safe and reliable. Helping the public understand the facts of hydrogen distribution is crucial. To this end, much of our advertisement campaign should be focused on why hydrogen is safe, and how Liberty’s design addresses safety concerns. This also underlines why safe designs are paramount to successful market performance, and why the Liberty Fuels design’s focus on safety is so important to communities and investors.
IMPLEMENTATION
Implementation of this marketing plan will fall mainly upon the mediums mentioned above: newspapers, radio, television, and online. Through use of these media, several advertisements can be made:
The advent of viral videos presents a unique opportunity for advertisement. By using videos on sites like YouTube, Liberty Fuels can provide an entertaining and informative advertisement that catches attention and is not long enough to bore the audience. Also, it can provide a link to Liberty’s website (www.liberty-fuels.com) in order to encourage people to read about hydrogen fuels and Liberty’s safety-focused design.
It is possible that Santa Monica will implement hydrogen fuel cell powered buses in the near future. If this is the case, advertisements can target the fact that these buses are powered by

26
hydrogen. Placards on the side of buses stating ‘I refuel with Liberty’ could be used to advertise the station, as well as advertisements on bus stops. Pedestrians who use the stations and buses will be influenced by these when purchasing their next vehicle, and drivers will see these on their way to and from work every day, which give hydrogen more visibility.
Efforts should be made to integrate advertisements for Liberty Fuels with the existing ad campaigns for Santa Monica. In travel agencies around the world, Santa Monica is advertised through brochures and posters. An effort should be made to make hydrogen power part of these advertisements, and to publicize the role played by Liberty Fuels in making this a reality.
Another method of advertisement would be to provide information sessions in schools to increase youth awareness of hydrogen fuel. This group will be the customers of tomorrow, and their older siblings are the leading edge of this market today. With the right advertising, this demographic could be Gen-H. In addition, many parents will become interested in what their children are learning and may look into it themselves. This provides another major route for reaching the public and informing them about the benefits of hydrogen power.
We estimate the total costs of the marketing campaign at $15,120 per year, to produce and distribute brochures, target bus advertisements, and place advertisements in newspapers.
28
APPENDICES
APPENDIX A: ARCHITECTURAL COST ESTIMATIONS
Element Ratio to GFA Elemental Cost Elemental Amount Rate per m2
% Quantity Unit Unit Rate Sub-Total Total Sub-Total Total
A SHELL m2 508,779 6,786.81 61.4%
A1 SUBSTRUCTURE 3,276 45.51 0.4%
A11 Foundations 1.333 96 m2 26.90 2,582 35.87
A12 Basement Excavation 1.333 96 m2 7.23 694 9.64
A2 STRUCTURE 245,520 3,130.44 29.6%
A21 First Floor Construction
concrete flat plate slab, exposed finish 1.000 72 m2 105.00 7,560 105.00
steel structure 2.292 165 m2 400.00 66,000 916.67
A22 Bicycle Structure Construction
steel structure 2.000 144 m2 400.00 20,880 10.44
A23 Roof Construction
concrete canopy 3.000 216 m2 105.00 22,680 315.00
steel canopy 4.458 321 m2 400.00 128,400 1,783.33
A3 EXTERIOR ENCLOSURE 259,982 3,610.86 31.4%
A31 Walls Below Grade 5.951 429 m2 34.20 14,655 203.54
A32 Walls Above Grade:
(1st floor) Glazing façade 1.528 110 m2 256.00 28,160 391.11
(1st floor) Concrete 2.083 150 m2 177.23 26,585 369.23
(Canopy blast walls) Concrete 4.500 324 m2 177.23 57,423 797.54
A34 Roof Coverings:
Flat Ballasted 3.000 216 m2 70.00 15,120 210.00
Photovoltaic Panels 4.099 295 m2 400.00 118,040 1,639.44
B INTERIORS m2 26,606 369.53 3.2%
B1 PARTITIONS & DOORS 16,030 222.64 1.9%
B11 Partitions (Gypsum on Steel studs) 0.667 48 m2 110.00 5,280 73.33
B12 Doors
Entrance Doors (Glazed w/ Transom) 0.069 5 Lvs 1,800.00 9,000 125.00
#
Stair Door (HM) 0.014 1 Lvs 1,350.00 1,350 18.75
Typical Interior Doors and Closets 0.028 2 Lvs 200.00 400 5.56
B2 FINISHES 4,576 63.56 0.6%
B21 Floor Finishes - concrete 1.000 72 m2 3.56 256 3.56
B22 Ceiling Finishes - suspended acoustic panel 1.000 72 m2 60.00 4,320 60.00
29
Element Ratio to GFA Elemental Cost Elemental Amount Rate per m2 %
B3 FITTINGS & EQUIPMENT 6,000 83.33 0.7%
B31 Washroom Unit 0.028 2 m2 2,000.00 4,000 55.56
B32 Reception Custom Millwork 0.069 5 m2 400.00 2,000 27.78
C SERVICES m2 36,101 501.40 4.4%
C1 MECHANICAL 24,437 339.40 2.9%
C11 Plumbing & Drainage 1.000 72 m2 60.00 4,320 60.00
C12 Fire Protection 3.000 216 m2 30.00 6,480 90.00
C13 HVAC 1.000 72 m2 122.40 8,813 122.40
C14 Controls 1.000 72 m2 7.00 504 7.00
C15 back up for solar heating and cooling system 1.000 72 m2 60.00 4,320 60.00
C2 ELECTRICAL 11,664 162.00 1.4%
C21 Service & Distribution 1.000 72 m2 43.00 3,096 43.00
C22 Devices, & Heating 1.000 72 m2 35.00 2,520 35.00
C23 Lighting 3.000 216 m2 20.00 4,320 60.00
C24 Systems & Ancillaries 1.000 72 m2 24.00 1,728 24.00
NET BUILDING COST - EXCLUDING SITE $ 571,486 $ 7,657.74 69.0%
D1 SITE WORK 153,408 2,130.67 18.5%
D11 Site Development 0.014 1 Sum 120,000.00 120,000 1,666.67
D12 Mechanical Site Services 16.000 1,152 m2 12.00 13,824 192.00
D13 Electrical Site Services 16.000 1,152 m2 17.00 19,584 272.00
D2 ANCILLARY WORK 15,000 208.33 1.8%
D22 Alterations 0.014 1 Sum 15,000.00 15,000 208.33
NET BUILDING COST - INCLUDING SITE $ 739,894 $ 9,996.74 89.3%
Z1 GENERAL REQUIREMENTS & FEE 88,787 1,233.16 10.7%
Z11 General Requirements n/a 8.0 % n/a 59,191 822.10
Z12 Fee n/a 4.0 % n/a 29,596 411.05
TOTAL CONSTRUCTION ESTIMATE - EXCLUDING CONTINGENCIES $ 828,681 $ 11,229.89 100.0%
Z2 ALLOWANCES 285,895 3,970.76
Z21 Design & Pricing Allowance n/a 15.0 % n/a 124,302 1,726.42
Z22 Escalation Allowance n/a 8.0 % n/a 66,294 920.76
Z23 Construction Allowance n/a 5.0 % n/a 41,434 575.47
Z24 Santa Monica Cost Index Allowance n/a 6.5 % n/a 53,864 748.11
TOTAL CONSTRUCTION ESTIMATE - INCLUDING CONTINGENCIES $ 1,114,576 $ 15,200.66
GOODS & SERVICES TAX 78,020 1,083.62
Goods & Services Tax n/a 7.0 % n/a 78,020 1,083.62
TOTAL CONSTRUCTION ESTIMATE $ 1,192,596 $ 16,284.27
APPENDIX B: FAILURE MODES AND EFFECTS ANALYSIS
30
Component Cause O Possible Effects S Prevention Methods in Place D RPN
Hydrogen Storage Tanks Rupture
Accidental Impact 3 Hydrogen discharge from tank,
presenting combustion risk. Impact may also provide spark for ignition.
8 Personnel to be trained in proper decorum while working around storage tanks. Open air surroundings will allow hydrogen
to dissipate into the atmosphere quickly. Emergency valves will shut if pressure gauges indicate loss in pressure. 8 192
Hydrogen Storage Tanks Rupture
Overpressure 3 Hydrogen discharge from tank,
presenting combustion risk. 7 Pressure disks installed in all tanks linked to pressure relief headers. 3 63
Hydrogen Storage Tanks Rupture
Overheating 4
Hydrogen discharge from tank, presenting combustion risk. Particularly
dangerous due to presence of excess heat which could serve as an ignition
source.
9 Pressure disks installed linked to pressure relief headers. Enclosure constructed in order to shield tanks from direct solar
radiation. Structure is to be open on the sides to allow for good cross breeze to cool area. Thermostats installed in storage area.
3 108
Hydrogen Storage Tanks/Piping
Rupture External Corrosion 4
Hydrogen discharge from tank/piping, presenting combustion risk.
8 Regular maintenance checks in order to spot corrosion. Corrosion-resistant coating to be applied to all components. 4 128
Hydrogen Storage Tanks/Piping
Rupture
Hydrogen Embrittlement
4 Hydrogen discharge from tank/piping,
presenting combustion risk. 8
Regular maintenance checks in order to spot possible embrittlement. Pressure gauges on lines in order to identify loss of pressure in lines. Hydrogen detectors installed in storage area to detect leaks.
9 288
Hydrogen Storage Tanks/Piping/Compr
essors Rupture Vandalism/Terrorism 2
Hydrogen discharge from tank, presenting combustion risk. Impact may also provide spark for ignition.
8 Walls placed around the storage area to inhibit access. Well-lit area makes unnoticed entry difficult. Hydrogen detectors
installed to detect leaks. 6 96
Hydrogen Storage Tanks/Piping
Rupture Material Fatigue 4
Hydrogen discharge from tank, presenting combustion risk.
7 Proper material selection coupled with regular inspection to ensure material is not exhibiting signs of fatigue. 8 224
Piping Rupture Line Blockage 2 Buildup of pressure in the line,
potentially resulting in rupture of piping and hydrogen discharge.
9 Pressure gauges on lines will detect pressure buildup due to blockage and pressure loss due to rupture. 6 108
Hydrogen Storage Tanks/Piping Leak
Fugitive Emissions in valves/joints
6 Slow discharge of hydrogen. 4 Hydrogen detectors to identify leaks, valve inspection, pressure monitoring. 8 192
Dispensing system Leak
Damage to dispenser or receiving vehicle
3 Hydrogen discharge, presenting
combustion risk 9 Hydrogen detectors to identify leaks, regular inspections of dispenser. 6 162
Hydrogen Storage Tanks Leak
Valve Malfunction 5 Hydrogen discharge from inlet/outlet
ends of system, presenting combustion risk.
9 Pressure gauges on tanks will identify pressure loss from tanks. 3 135
Hydrogen Storage Tanks Leak
Improper Filling of Storage Tanks
3 Hydrogen discharge from inlet end of system, presenting combustion risk.
8 Ensure that all personnel filling the tank are properly versed in safety procedures. Hydrogen detectors installed in storage
area to detect leaks. 7 168
Compressor Component
Failure/Loss of Containment
Hydrogen Embrittlement/Electrical
System Failure 2
Hydrogen discharge from system, presenting combustion risk.
7 Regular inspection of compressor to ensure no corrosion damage. Hydrogen leak detectors installed in nearby to detect
leaks. Emergency valve shut if leak is detected. 5 70
Compressor Exposure of Hydrogen to
Electrical Systems
Improper Containment of Electrical Systems
2 Provides ignition source. Particularly
dangerous due to proximity to hydrogen containment area.
10 All compressors to be purchased for service must be properly enclosed to ensure no open electrical components are
present. 8 160
All Static Discharge Improper Grounding 9 Provides ignition source. 2 All components (including cars) in service must be properly grounded in order to minimize the risk of static discharge.
Personnel to be trained in proper static discharge risk management. 10 180
All Structural Failure Excess weight on
structure/earthquake 2
Collapse of structure, likely resulting in total loss of hydrogen containment.
10 Structure is designed within building codes, including California earthquake code. 8 160
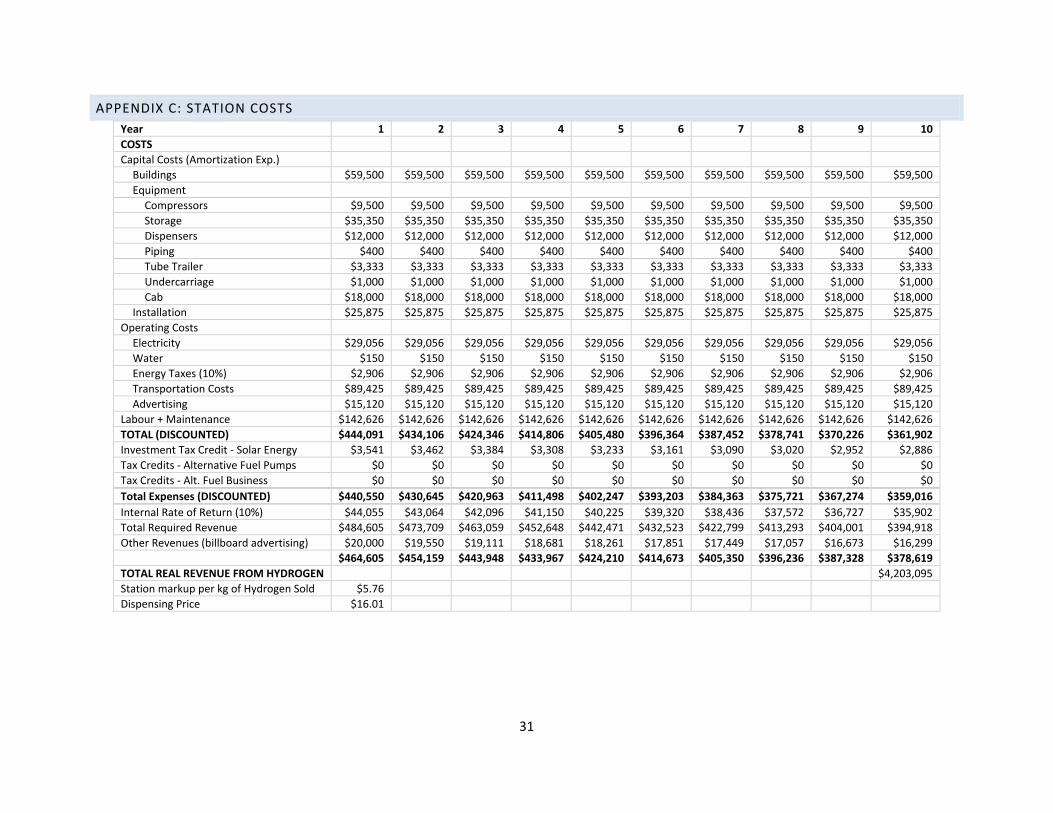
31
APPENDIX C: STATION COSTS
Year 1 2 3 4 5 6 7 8 9 10
COSTS Capital Costs (Amortization Exp.) Buildings $59,500 $59,500 $59,500 $59,500 $59,500 $59,500 $59,500 $59,500 $59,500 $59,500
Equipment Compressors $9,500 $9,500 $9,500 $9,500 $9,500 $9,500 $9,500 $9,500 $9,500 $9,500
Storage $35,350 $35,350 $35,350 $35,350 $35,350 $35,350 $35,350 $35,350 $35,350 $35,350
Dispensers $12,000 $12,000 $12,000 $12,000 $12,000 $12,000 $12,000 $12,000 $12,000 $12,000
Piping $400 $400 $400 $400 $400 $400 $400 $400 $400 $400
Tube Trailer $3,333 $3,333 $3,333 $3,333 $3,333 $3,333 $3,333 $3,333 $3,333 $3,333
Undercarriage $1,000 $1,000 $1,000 $1,000 $1,000 $1,000 $1,000 $1,000 $1,000 $1,000
Cab $18,000 $18,000 $18,000 $18,000 $18,000 $18,000 $18,000 $18,000 $18,000 $18,000
Installation $25,875 $25,875 $25,875 $25,875 $25,875 $25,875 $25,875 $25,875 $25,875 $25,875
Operating Costs Electricity $29,056 $29,056 $29,056 $29,056 $29,056 $29,056 $29,056 $29,056 $29,056 $29,056
Water $150 $150 $150 $150 $150 $150 $150 $150 $150 $150
Energy Taxes (10%) $2,906 $2,906 $2,906 $2,906 $2,906 $2,906 $2,906 $2,906 $2,906 $2,906
Transportation Costs $89,425 $89,425 $89,425 $89,425 $89,425 $89,425 $89,425 $89,425 $89,425 $89,425
Advertising $15,120 $15,120 $15,120 $15,120 $15,120 $15,120 $15,120 $15,120 $15,120 $15,120
Labour + Maintenance $142,626 $142,626 $142,626 $142,626 $142,626 $142,626 $142,626 $142,626 $142,626 $142,626
TOTAL (DISCOUNTED) $444,091 $434,106 $424,346 $414,806 $405,480 $396,364 $387,452 $378,741 $370,226 $361,902
Investment Tax Credit - Solar Energy $3,541 $3,462 $3,384 $3,308 $3,233 $3,161 $3,090 $3,020 $2,952 $2,886
Tax Credits - Alternative Fuel Pumps $0 $0 $0 $0 $0 $0 $0 $0 $0 $0
Tax Credits - Alt. Fuel Business $0 $0 $0 $0 $0 $0 $0 $0 $0 $0
Total Expenses (DISCOUNTED) $440,550 $430,645 $420,963 $411,498 $402,247 $393,203 $384,363 $375,721 $367,274 $359,016
Internal Rate of Return (10%) $44,055 $43,064 $42,096 $41,150 $40,225 $39,320 $38,436 $37,572 $36,727 $35,902
Total Required Revenue $484,605 $473,709 $463,059 $452,648 $442,471 $432,523 $422,799 $413,293 $404,001 $394,918
Other Revenues (billboard advertising) $20,000 $19,550 $19,111 $18,681 $18,261 $17,851 $17,449 $17,057 $16,673 $16,299
$464,605 $454,159 $443,948 $433,967 $424,210 $414,673 $405,350 $396,236 $387,328 $378,619
TOTAL REAL REVENUE FROM HYDROGEN
$4,203,095
Station markup per kg of Hydrogen Sold $5.76 Dispensing Price $16.01
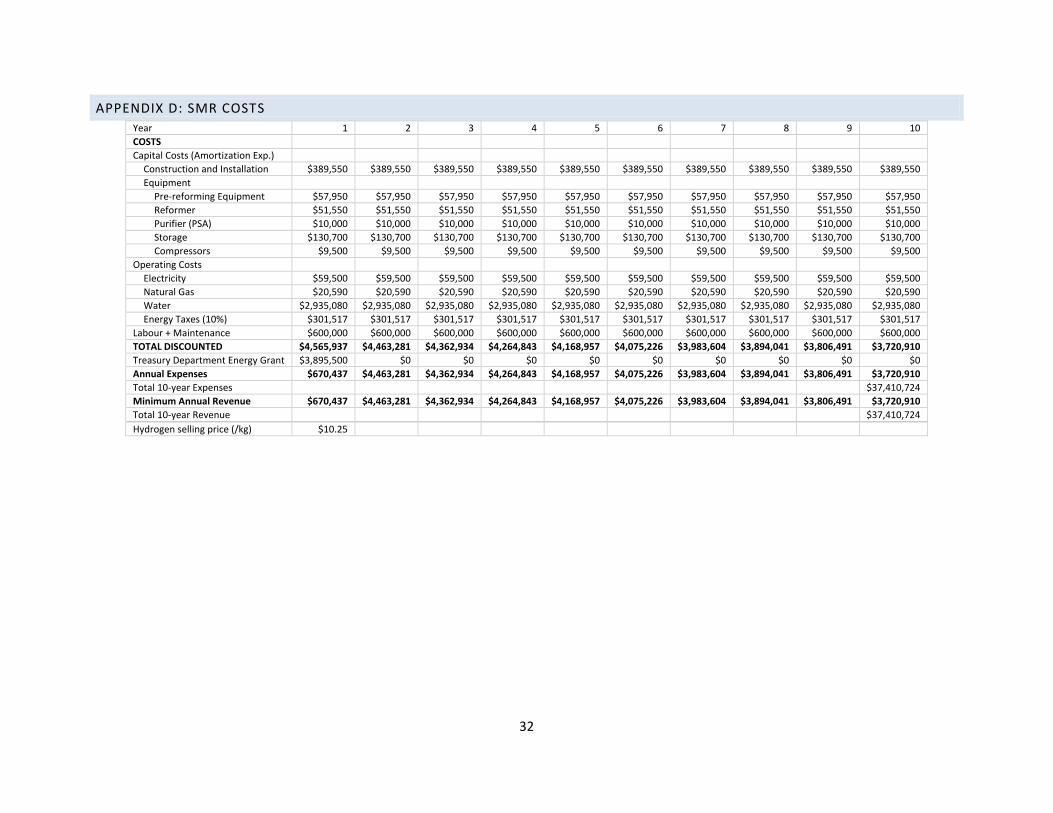
32
APPENDIX D: SMR COSTS
Year 1 2 3 4 5 6 7 8 9 10
COSTS Capital Costs (Amortization Exp.) Construction and Installation $389,550 $389,550 $389,550 $389,550 $389,550 $389,550 $389,550 $389,550 $389,550 $389,550
Equipment Pre-reforming Equipment $57,950 $57,950 $57,950 $57,950 $57,950 $57,950 $57,950 $57,950 $57,950 $57,950
Reformer $51,550 $51,550 $51,550 $51,550 $51,550 $51,550 $51,550 $51,550 $51,550 $51,550
Purifier (PSA) $10,000 $10,000 $10,000 $10,000 $10,000 $10,000 $10,000 $10,000 $10,000 $10,000
Storage $130,700 $130,700 $130,700 $130,700 $130,700 $130,700 $130,700 $130,700 $130,700 $130,700
Compressors $9,500 $9,500 $9,500 $9,500 $9,500 $9,500 $9,500 $9,500 $9,500 $9,500
Operating Costs Electricity $59,500 $59,500 $59,500 $59,500 $59,500 $59,500 $59,500 $59,500 $59,500 $59,500
Natural Gas $20,590 $20,590 $20,590 $20,590 $20,590 $20,590 $20,590 $20,590 $20,590 $20,590
Water $2,935,080 $2,935,080 $2,935,080 $2,935,080 $2,935,080 $2,935,080 $2,935,080 $2,935,080 $2,935,080 $2,935,080
Energy Taxes (10%) $301,517 $301,517 $301,517 $301,517 $301,517 $301,517 $301,517 $301,517 $301,517 $301,517
Labour + Maintenance $600,000 $600,000 $600,000 $600,000 $600,000 $600,000 $600,000 $600,000 $600,000 $600,000
TOTAL DISCOUNTED $4,565,937 $4,463,281 $4,362,934 $4,264,843 $4,168,957 $4,075,226 $3,983,604 $3,894,041 $3,806,491 $3,720,910
Treasury Department Energy Grant $3,895,500 $0 $0 $0 $0 $0 $0 $0 $0 $0
Annual Expenses $670,437 $4,463,281 $4,362,934 $4,264,843 $4,168,957 $4,075,226 $3,983,604 $3,894,041 $3,806,491 $3,720,910
Total 10-year Expenses
$37,410,724
Minimum Annual Revenue $670,437 $4,463,281 $4,362,934 $4,264,843 $4,168,957 $4,075,226 $3,983,604 $3,894,041 $3,806,491 $3,720,910
Total 10-year Revenue
$37,410,724
Hydrogen selling price (/kg) $10.25
33
REFERENCES
Argonne National Laboratory. (2009, March 23). The Greenhouse Gases, Regulated Emissions, and Energy Use in Transportation (GREET) Model. Retrieved March 23, 2010, from Transportation Technology R&D Center: http://www.transportation.anl.gov/modeling_simulation/GREET/index.html
Argus Group. (2009, May 29). Hydrogen Leak Detector for Vehicle Fuel Cell Applications. Retrieved March 21, 2010, from Fuel Cell Detection Sensors: http://fuelcellsensor.com/
Astronomical Applications Department. (n.d.). Sun or Moon Rise/Set Table for One Year. Retrieved March 19, 2010, from Astronomical Applications Department of the US Naval Observatory: http://aa.usno.navy.mil/cgi-bin/aa_rstablew.pl
Balboni, B. (2008). Square Foot Costs 30th Ed. Kingston, MA: R.S. Means Company.
California Building Standards Commission. (2007). 2007 California Building Code.
California Energy Commission. (2010, March 18). Energy-Related Programs. Retrieved March 24, 2010, from California Economic Recovery: http://www.energy.ca.gov/recovery/
California Energy Commission. (2009, June 9). Energy-related tax credits and financial incentives. Retrieved March 24, 2010, from California Economic Recovery Energy-Related Programs: http://www.energy.ca.gov/recovery/documents/TAX_CREDITS.PDF
City of Santa Monica. (n.d.). Photovoltaic Electricity. Retrieved March 19, 2010, from Office of Sustainability and the Environment: http://www.smgov.net/Departments/OSE/Categories/Green_Building/Guidelines/Electrical_Systems/Photovoltaic_Electricity.aspx
City of Santa Monica. (2010, March 9). Utility Users Tax. Retrieved March 24, 2010, from City of Santa Monica Finance: http://www01.smgov.net/finance/treasury/Taxes.htm#UUT
Compressed Gas Association. (2005). CGA G-5.4: Standard for Hydrogen Piping Systems at Consumer Locations.
Compressed Gas Association. (2004). CGA G-5.5: Standard for Hydrogen Venting in Consumer Locations.
Compressed Gas Association. (2007). CGA G-5.8: Standard for High Pressure Hydrogen Piping in Consumer Locations.
Connelly, T. (2010, March 18). Conversation with Hydro-Pac.
County of Los Angeles. (2009, December 15). LA County SolarMap. Retrieved March 19, 2010, from http://solarmap.lacounty.gov/
Fadali, H., Icyk, B., Leung, S., Patel, A., Graff, G., Lomonanowski, B., et al. (2005). YES Hydrogen Power Park Design Proposal. University of Waterloo.
Glaser, J. P. (2004). Leading Through Collaboration: Guiding Groups to Productive Solutions. Thousand Oaks, CA: Corwin Press.
34
Green, D. W. (1999). Perry's Chemical Engineers' Handbook. New York: McGraw-Hill.
Hydrogenics. (2010, February 16). HySTAT Hydrogen Station Brochure.
Inform, Inc. (2002, November 6). New Study on Greener Garbage Trucks. Retrieved March 23, 2010, from INFORM - Press Release Archive: http://www.informinc.org/pr_ggt.php
International Code Council. (2009). International Fire Code.
International Code Council. (2009). International Fuel Gas Code.
Landau, C. R. (2008, December 23). Optimum Orientation of Solar Panels. Retrieved March 19, 2010, from MACS Lab Incorporated: http://www.macslab.com/optsolar.html
McGraw-Hill Construction. (2008, November 1). ENR - City Cost Index - Los Angeles. Retrieved March 23, 2010, from Engineering News-Record: http://enr.ecnext.com/coms2/article_fecosu0811-LosAngeles
McMaster-Carr. (2009). Retrieved March 19, 2010, from McMaster-Carr Catalog: http://www.mcmaster.com/
National Fire Protection Association. (1999). NFPA 50A: Standard for Gaseous Hydrogen Systems at Consumer Sites.
National Fire Protection Association. (2010). NFPA 55: Compressed Gases and Cryogenic Fluids Code.
National Renewable Energy Laboratory. (1996, April 25). Solar Radiation and Illuminance Data for Los Angeles 1961-1990. Retrieved March 19, 2010, from The Solar Radiation Data Manual for Buildings: http://rredc.nrel.gov/solar/old_data/nsrdb/bluebook/data/23174.SBF
National Renewable Energy Laboratory. (2007, September 27). WEST Associates Data. Retrieved March 19, 2010, from Renewable Resource Data Center: http://rredc.nrel.gov/solar/old_data/wa/
Pandey, K. (2010). Billboard Advertising Costs. Retrieved March 24, 2010, from Buzzle: http://www.buzzle.com/articles/billboard-advertising-costs.html
Ponist, M. (2010, March 5). Quote from CPI.
Santa Monica Public Works. (2009, July 1). Non-Residential Water Rates. Retrieved March 24, 2010, from Water Resources: http://www.smgov.net/Departments/PublicWorks/ContentWater.aspx?id=7741
Santa Monica Rent Control Board Administration. (2009, May 7). Annual General Adjustment. Retrieved March 24, 2010, from City of Santa Monica: http://www.smgov.net/uploadedFiles/Departments/Rent_Control/Reports/GA_Reports/GA_report_2009.pdf
Shumake, G., & Abudiab, T. (2006). Operation Hydrogen. Hydrocarbon Engineering.
Solar Santa Monica. (2009, July 20). Retrieved March 19, 2010, from Solar Santa Monica: http://www.solarsantamonica.com/
Solar Santa Monica. (2009, May 18). Solar Estimation Table. Retrieved March 19, 2010, from Solar Santa Monica: http://www.solarsantamonica.com/documents/SolarEstimaitionTable.pdf
35
SolarWorld AG. (n.d.). Sunmodule. Retrieved March 19, 2010, from SolarWorld USA: http://www.solarworld-usa.com/Sunmodule.182.0.html
Southern California Edison. (2008, March 12). Rate Schedule GS-1. Retrieved March 24, 2010, from Southern California Edison: http://www.sce.com/NR/rdonlyres/E794B1A6-FD9F-42D6-92A8-00C3410691D5/0/081212_General_Service_1.pdf
The Weather Channel Interactive, Inc. (2010). Average Weather for Santa Monica, CA. Retrieved March 23, 2010, from The Weather Channel: http://www.weather.com/weather/wxclimatology/monthly/graph/USCA1024
US Energy Information Administration. (2010, January). Average Monthly Bill by Census Division and State 2008. Retrieved March 19, 2010, from US Energy Information Administration Independent Statistics and Analysis: http://www.eia.doe.gov/cneaf/electricity/esr/table5.html
US Energy Information Administration. (2006, December). Electricity Consumption and Conditional Energy Intensity by Census Division for All Buildings, 2003: Part 2. Retrieved March 19, 2010, from Commercial Buildings Energy Consumption Survey: http://www.eia.doe.gov/emeu/cbecs/cbecs2003/detailed_tables_2003/2003set15/2003pdf/set15.pdf
US Energy Information Administration. (2009, May 4). Overview of Commercial Buildings, 2003. Retrieved March 19, 2010, from Commercial Buildings Energy Consumption Survey: http://www.eia.doe.gov/emeu/cbecs/cbecs2003/overview1.html
Vision Motor Corporation. (2010, January 19). Vision Industries Corp. Outlook. Retrieved March 23, 2010, from Vision Motor Corporation: http://www.visionmotorcorp.com/Vision%20Corporate.pdf
Wallerstein, B. R. (2005, October 7). Board Meeting Date: October 7, 2005 Agenda no. 5. Retrieved March 23, 2010, from South Coast Air Quality Management District: http://www.aqmd.gov/hb/2005/05105a.html
Weinert, J., & Lipman, T. (2006). An Assessment of the Near-Term Costs of Hydrogen Refueling Stations and Station Components. Institute of Transportation Studies, University of California, Davis.
Yang, C., & Ogden, J. (2006). Determining the lowest-cost hydrogen delivery mode. International Journal of Hydrogen Energy , 268-286.
You, Y. (2010, March 15). FTI International Group Inc. Quote.
Additionally, the following references would have been useful but were not accessible due to cost:
BSR/CSA HV 4.1: Standard for Hydrogen Systems.
BSR/CSA HV 4.2: Standard for Hoses for Hydrogen Vehicles and Dispensing Systems.
BSR/CSA HV 4.5: Standard for Sequencing Hydrogen Dispensing Systems.
BSR/CSA HV 4.6: Standard for Manually Operated High Pressure Valves for Hydrogen Dispensing Systems.
BSR/CSA HV 4.7: Standard for Automatically Operated High Pressure Valves for Hydrogen Dispensing Systems.
36
BSR/CSA HV 4.8: Standard for Compressors for Use in Hydrogen Fuelling Stations.
ASME B31.1 (2001): Standard for Power Piping.
ASME B31.3 (2002): Standard for Process Piping.
ASME B31.8 (2003): Standard for Gas Transmission and Distribution Piping Systems.
ASME B31.8S (2001/2002): Managing System Integrity of Gas Pipelines.
ASME B31.9 (1996): Standard for Building Services Piping.
ASME B31G (1991): Manual for Determining Remaining Strength of Corroded Pipelines.
This document uses the free famfamfam silk icons from http://www.famfamfam.com/lab/icons/silk/.