2010 global history re ft equating and scaling tech … · examination in global history and...
TRANSCRIPT
New York State Regents Examination in Global History and Geography
2010 Field Test Analysis, Equating Procedure, and Scaling of
Operational Test Forms
Technical Report
Prepared for the New York State Education Department by Pearson
August 2011

Copyright
Developed and published under contract with the New York State Education Department by Pearson. Copyright © 2010 by the New York State Education Department. Secure Materials. All rights reserved. No part of this document may be reproduced or transmitted by any means. Use of these materials is expressly limited to the New York State Education Department.

Prepared for NYSED by Pearson i
Table of Contents
Table of Contents................................................................................................... i
List of Tables ........................................................................................................ ii
Section I: Introduction ...........................................................................................1 Purpose ....................................................................................................................................... 1
Section II: Field Test Analysis...............................................................................1 File Merging and Data Clean-up ................................................................................................. 2 Classical Analysis........................................................................................................................ 2
Item Difficulty .......................................................................................................................... 3 Point-Biserial Correlation ........................................................................................................ 3 Test Reliability......................................................................................................................... 5 Scoring Reliability ................................................................................................................... 6 Inter-rater Agreement.............................................................................................................. 7 Scaffold Questions and Essay Item Means and Standard Deviations ................................. 11 Intra-class Correlation........................................................................................................... 12 Weighted Kappa ................................................................................................................... 12
Item Response Theory (IRT) Statistics ..................................................................................... 12 Item Calibration..................................................................................................................... 13 Item Fit Evaluation ................................................................................................................ 14
Differential Item Functioning (DIF) Statistics............................................................................. 15
Section III: Equating Procedure ..........................................................................17 Equivalent-Group Equating Design........................................................................................... 17 Common-Item Equating Design ................................................................................................ 18
Section IV: Scaling of Operational Test Forms ...................................................20
References .........................................................................................................22
Appendix A: Classical Item Analysis ...................................................................23
Appendix B: Partial Credit Model Item Analysis..................................................42
Appendix C: DIF Statistics ..................................................................................61
Appendix D: Operational Test Maps ...................................................................72
Appendix E: Scoring Tables................................................................................82

Prepared for NYSED by Pearson ii
List of Tables Table 1. Need/Resource Capacity Category Definitions ....................................1 Table 2. Classical Item Analysis ........................................................................4 Table 3. Test and Scoring Reliability..................................................................6 Table 4. Point Differences Between First and Second Reads ...........................8 Table 5. First and Second Read Descriptive Statistics and Agreement ...........10 Table 6. Partial Credit Model Item Analysis .....................................................15 Table 7. Initial Mean Abilities and Equating Constants ....................................18 Table 8. Incomplete Data Matrix Structure.......................................................19 Table 9. Number of Anchor Items Not Meeting Stability Criteria......................19 Table 10. Classical Item Analysis ......................................................................24 Table 11. Partial Credit Model Item Analysis .....................................................43 Table 12. DIF Statistics......................................................................................62 Table 13. Operational Test Map for January 2010.............................................73 Table 14. Operational Test Map for June 2010..................................................76 Table 15. Operational Test Map for August 2010 ..............................................79 Table 16. Scoring Table for January 2010 .........................................................83 Table 17. Scoring Table for June 2010 ..............................................................84 Table 18. Scoring Table for August 2010...........................................................85

Prepared for NYSED by Pearson 1
Section I: Introduction
Purpose The purpose of this report is to document the psychometric work on the
New York State Regents Examination in Global History and Geography for 2010. Specifically, contained within this report are procedures for and results of field test analysis, equating, and scaling of operational test forms. Because of a change in vendor mid-year, the field test equating was conducted by Pearson while the scaling was conducted by the previous vendor. Information on test development can be found in the test design and development report for the New York State Regents Examination in Global History and Geography.
Section II: Field Test Analysis
In May 2010, field testing was conducted for the New York State Regents Examination in Global History and Geography to better understand the psychometric quality of the items. The results of this testing are used to help determine which items will be selected for use on operational tests.
Target student samples for participation in this testing were selected such that
each would represent the student population expected to take the operational test. The Need/Resource Capacity Categories were used as variables in the sampling plan. See Table 1 for the seven Need/Resource Capacity Categories and their definitions. Table 1. Need/Resource Capacity Category Definitions
Need/Resource Capacity (N/RC) Category Definition
High N/RC Districts: New York City New York City
Large Cities Buffalo, Rochester, Syracuse, Yonkers
Urban-Suburban Districts at or above 70th percentile on the index with at least 100 students per square mile or enrollment greater than 2500
Rural All districts at or above the 70th percentile with fewer than 50 students per square mile or enrollment of less than 2500
Average N/RC Districts All districts between the 20th and 70th percentiles on the index
Low N/RC Districts All districts below the 20th percentile on the index
Charter Schools Each charter school is a district

Prepared for NYSED by Pearson 2
The data collected from field testing were scored by two entities. The multiple-choice items were scored by the New York State Education Department and the scaffold questions and essay items were scored by Measurement Incorporated. Therefore, it was necessary to combine data files for data analysis. Both classical and item response theory analyses were conducted using the data to evaluate the quality of the test items.
File Merging and Data Clean-up
Field test forms 712–719 contained multiple-choice and scaffold questions and essay item types. Response data were contained in two separate files. The multiple-choice data file contained 15,450 student records and the scaffold questions and essay data file contained 14,165 student records. To combine the two files, the multiple-choice file served as the base file and scaffold questions and essay records were merged to the multiple-choice records using unique test booklet numbers. For multiple-choice records that did not have corresponding scaffold questions and essay records, scaffold questions and essay items were treated as non-attempted and scored as 0. After the exclusion rules were applied, the resulting field test data file contained 15,277 records.
Field test forms 701–711 only contained multiple-choice questions. Therefore, no
matching of data was necessary and the data file contained 8,998 records. Multiple-choice response data were then compared to the answer key. All item
responses not matching the answer key were assigned scores of 0. The responses matching the answer key were assigned scores of 1. With respect to the scaffold questions and essay items, scores from 0 to the maximum point value available for each tested item were kept while out of range values were assigned scores of 0. For IRT calibrations, blanks (i.e., missing data) were assigned scores of 0 to be consistent with how operational test items are scored.
The final data file contained both the scored and unscored student responses.
Unscored data were used to calculate the percentage of students who selected the various answer choices for the multiple-choice items or the percentage of students who received the range of possible raw score points for the scaffold questions and essay items. Thus, the frequency of students leaving items blank can be calculated. The scored data were used for all other analyses.
Classical Analysis
Classical Test Theory is based on the assumption that an observed test score x is composed of both true score t and error score e. This assumption is expressed as follows:
x = t + e

Prepared for NYSED by Pearson 3
In other words, error is associated with measuring a student’s true score. For example, the choice of test items or the administration conditions may influence student responses, making a student’s observed score higher or lower than the student’s true score. The error is considered random. After repeated administrations, the mean of the error scores is virtually zero. Thus, a student’s observed score is expected to equal his or her true score. This expectation is expressed as follows:
E(x) = t
Using a Classical Test Theory framework, field test data can be analyzed to provide information about the quality of test items. Item difficulties, point-biserial correlations, reliability estimates, and various statistics related to rater agreement have been calculated and are summarized in the following section.
Item Difficulty
Item difficulty is an indication of student performance on a specific item. Because this examination contains polytomous items, item means are not appropriate for comparing difficulty across items. Instead weighted item means were calculated by dividing an item’s mean by the maximum points possible for that item.
For multiple-choice items, the item difficulty is the proportion of students who
answer an item correctly. If 90% of the student responses to a multiple-choice item are correct, then this item is considered easier than a multiple-choice item with correct responses by 30% of the students.
Point-Biserial Correlation The point-biserial correlation is another classical statistic that can be used to
evaluate items. For multiple-choice items, it is the correlation between students’ performance on a given item (correct or incorrect) and overall performance scores. This statistic is used to evaluate how well an item identifies students who understand the concept being measured and can be generalized for scaffold questions and essay items. The possible range for the point-biserial correlation is -1 to 1, with higher values being more desirable.
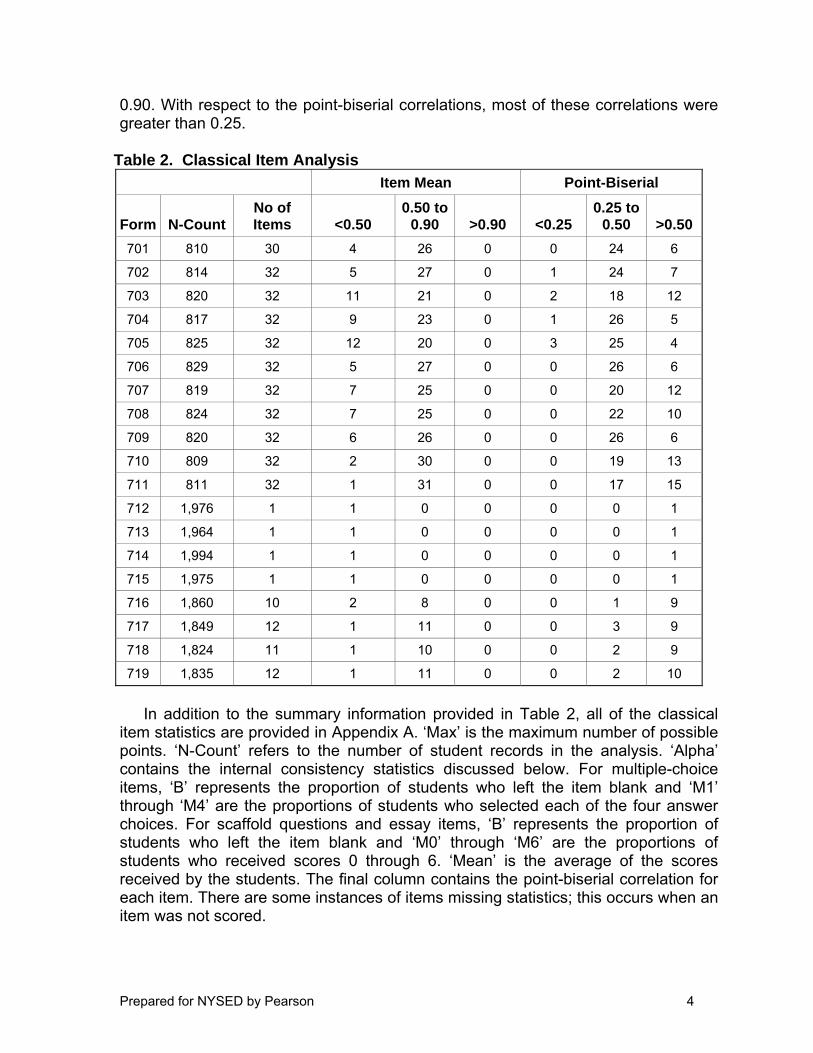
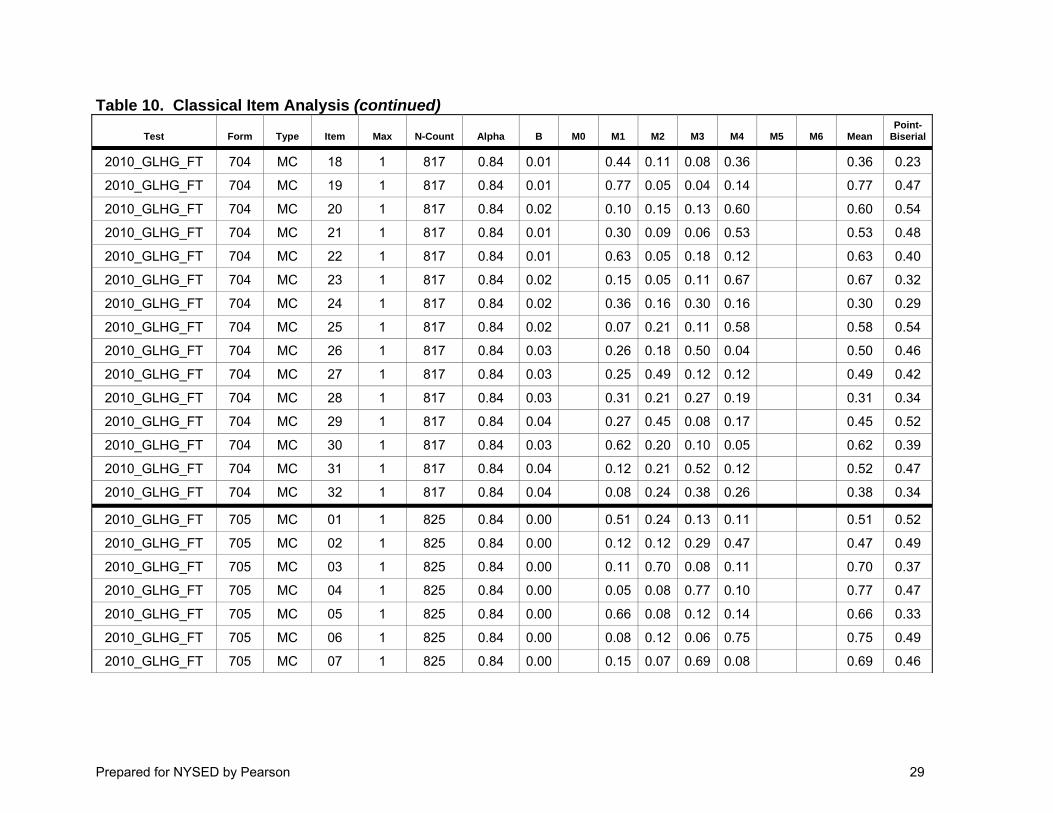
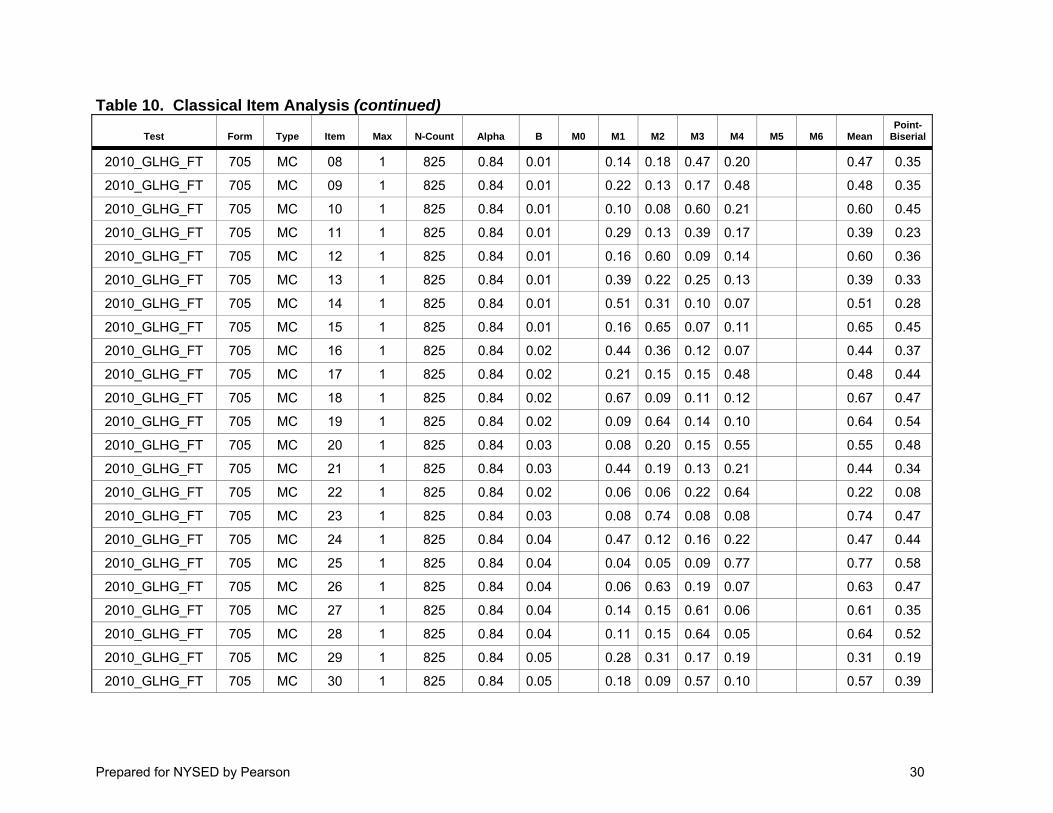
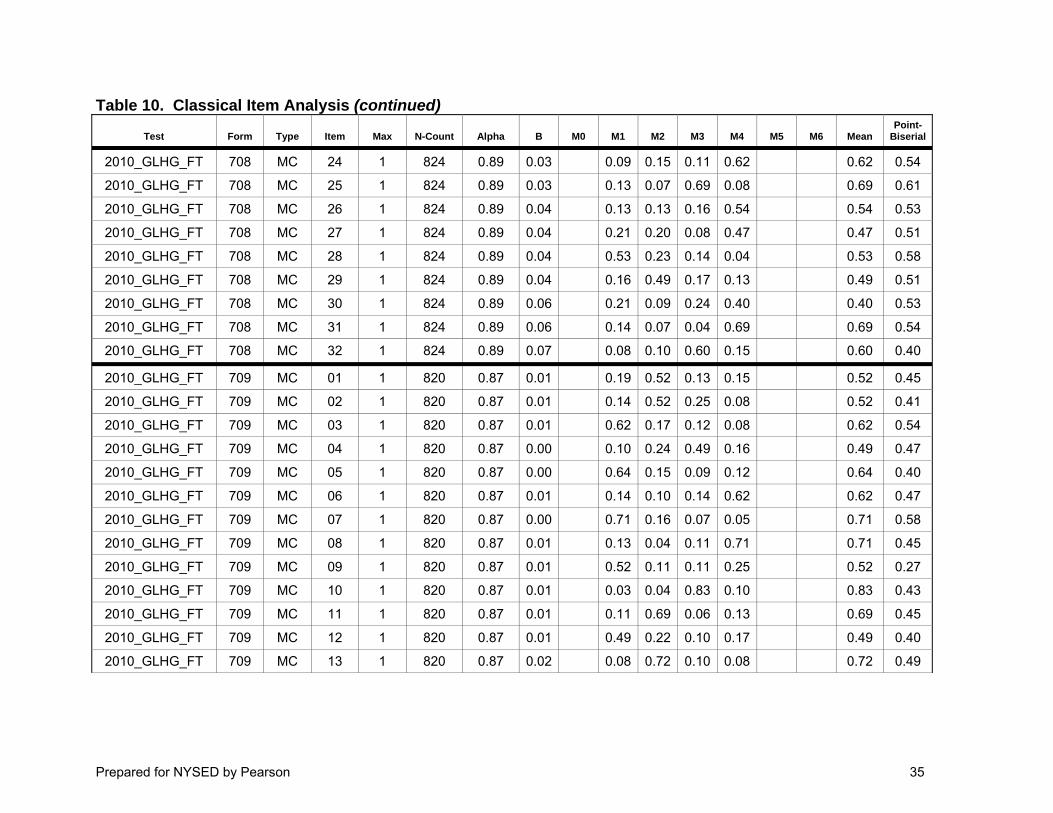
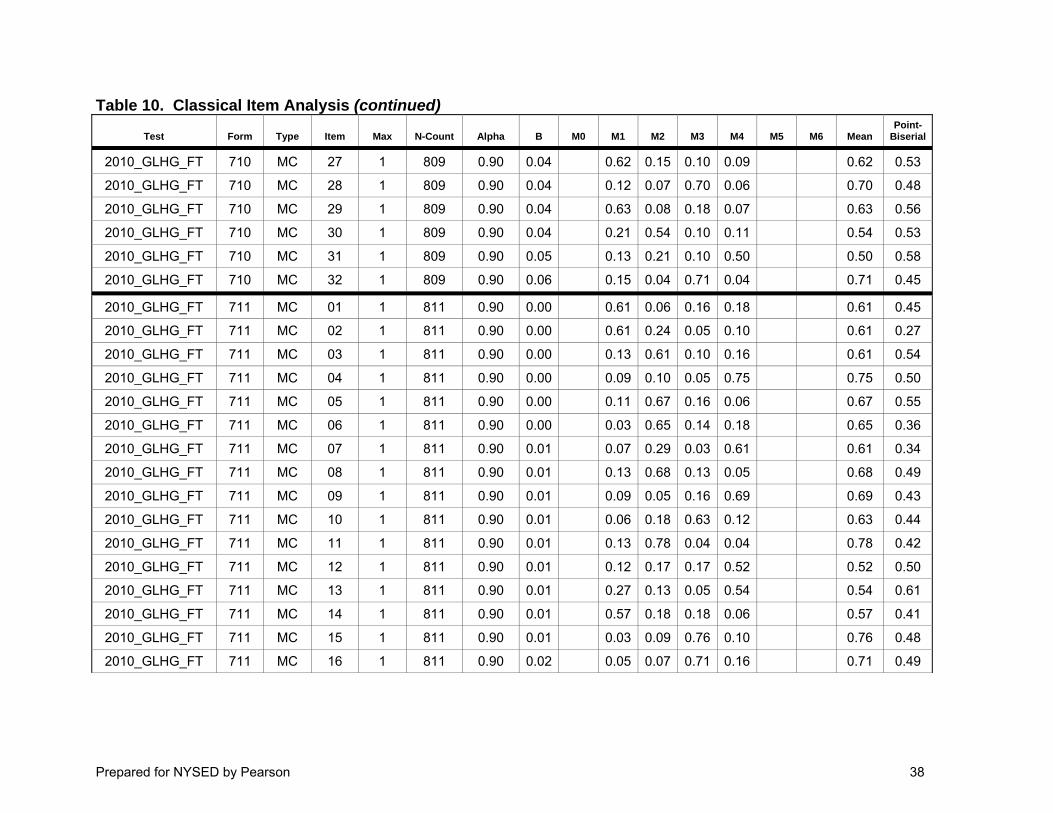
Table 2 presents a summary of the classical item analysis for each of the field
test forms. The first three columns identify the form number, the number of students who took each form, and the number of items on each field test form. The remaining columns are divided into two sections (i.e., item difficulty and point-biserial correlations). Recall that for scaffold questions and essay items, item means were divided by the maximum number of points possible in order to place them in the same metric as the multiple-choice items. For all items, item difficulties were below
Prepared for NYSED by Pearson 4
0.90. With respect to the point-biserial correlations, most of these correlations were greater than 0.25.
Table 2. Classical Item Analysis Item Mean Point-Biserial
Form N-Count No of Items <0.50
0.50 to 0.90 >0.90 <0.25
0.25 to 0.50 >0.50
701 810 30 4 26 0 0 24 6
702 814 32 5 27 0 1 24 7
703 820 32 11 21 0 2 18 12
704 817 32 9 23 0 1 26 5
705 825 32 12 20 0 3 25 4
706 829 32 5 27 0 0 26 6
707 819 32 7 25 0 0 20 12
708 824 32 7 25 0 0 22 10
709 820 32 6 26 0 0 26 6
710 809 32 2 30 0 0 19 13
711 811 32 1 31 0 0 17 15
712 1,976 1 1 0 0 0 0 1
713 1,964 1 1 0 0 0 0 1
714 1,994 1 1 0 0 0 0 1
715 1,975 1 1 0 0 0 0 1
716 1,860 10 2 8 0 0 1 9
717 1,849 12 1 11 0 0 3 9
718 1,824 11 1 10 0 0 2 9
719 1,835 12 1 11 0 0 2 10
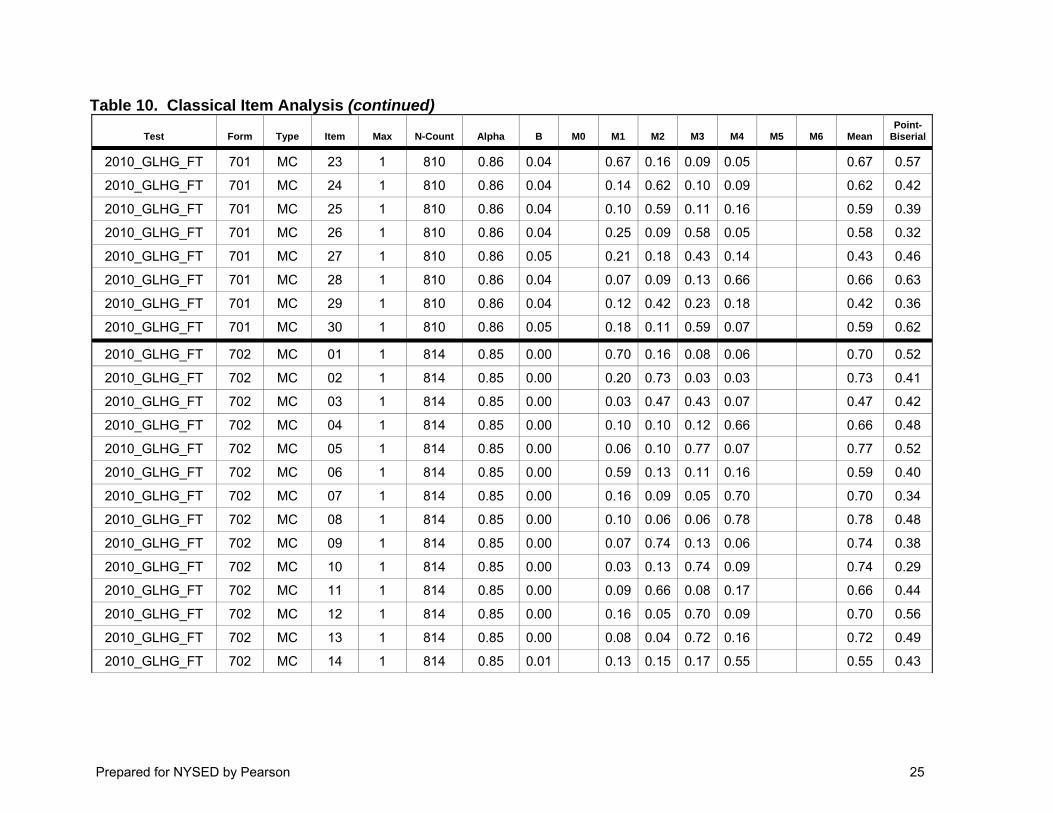
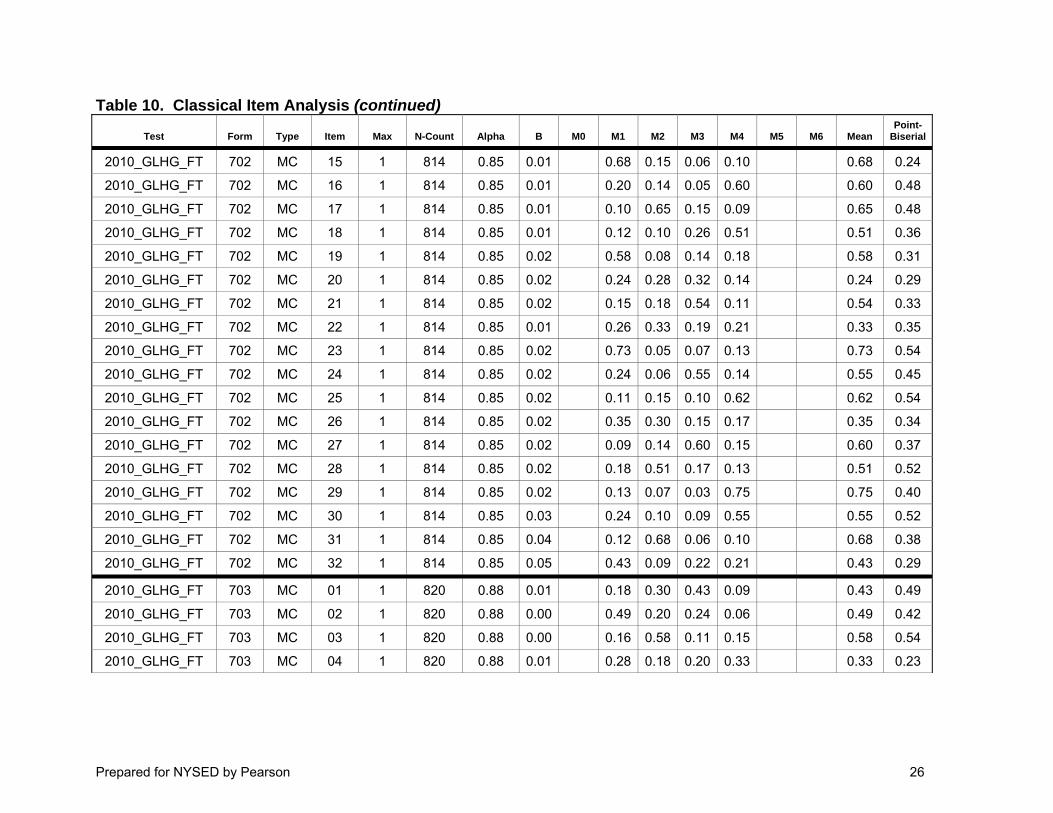
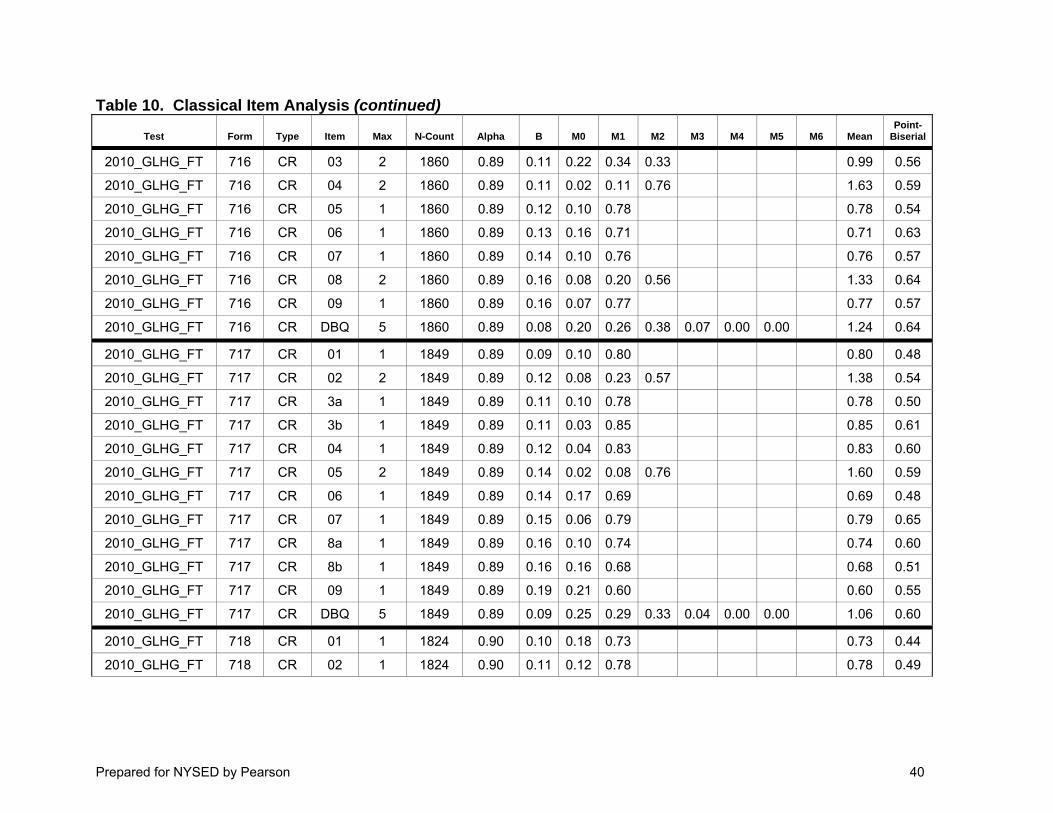
In addition to the summary information provided in Table 2, all of the classical
item statistics are provided in Appendix A. ‘Max’ is the maximum number of possible points. ‘N-Count’ refers to the number of student records in the analysis. ‘Alpha’ contains the internal consistency statistics discussed below. For multiple-choice items, ‘B’ represents the proportion of students who left the item blank and ‘M1’ through ‘M4’ are the proportions of students who selected each of the four answer choices. For scaffold questions and essay items, ‘B’ represents the proportion of students who left the item blank and ‘M0’ through ‘M6’ are the proportions of students who received scores 0 through 6. ‘Mean’ is the average of the scores received by the students. The final column contains the point-biserial correlation for each item. There are some instances of items missing statistics; this occurs when an item was not scored.

Prepared for NYSED by Pearson 5
Test Reliability Classical analysis can also be used to measure the reliability of the test.
Reliability is the consistency of the results obtained from a measurement with respect to time or among items or subjects that constitute a test. As such, test reliability can be estimated in a variety of ways. Internal consistency indices are a measure of how consistently examinees respond to items within a test. Two factors influence estimates of internal consistency: test length and homogeneity of items. In general the more items on the examination, the higher the reliability, and the more similar the items are, the higher the reliability.
Cronbach's α (alpha) (Cronbach, 1951) has an important use as a measure of the internal consistency of a test. This formula is the extension of an earlier version, the Kuder-Richardson Formula 20 (KR-20), which is the equivalent for dichotomous items.
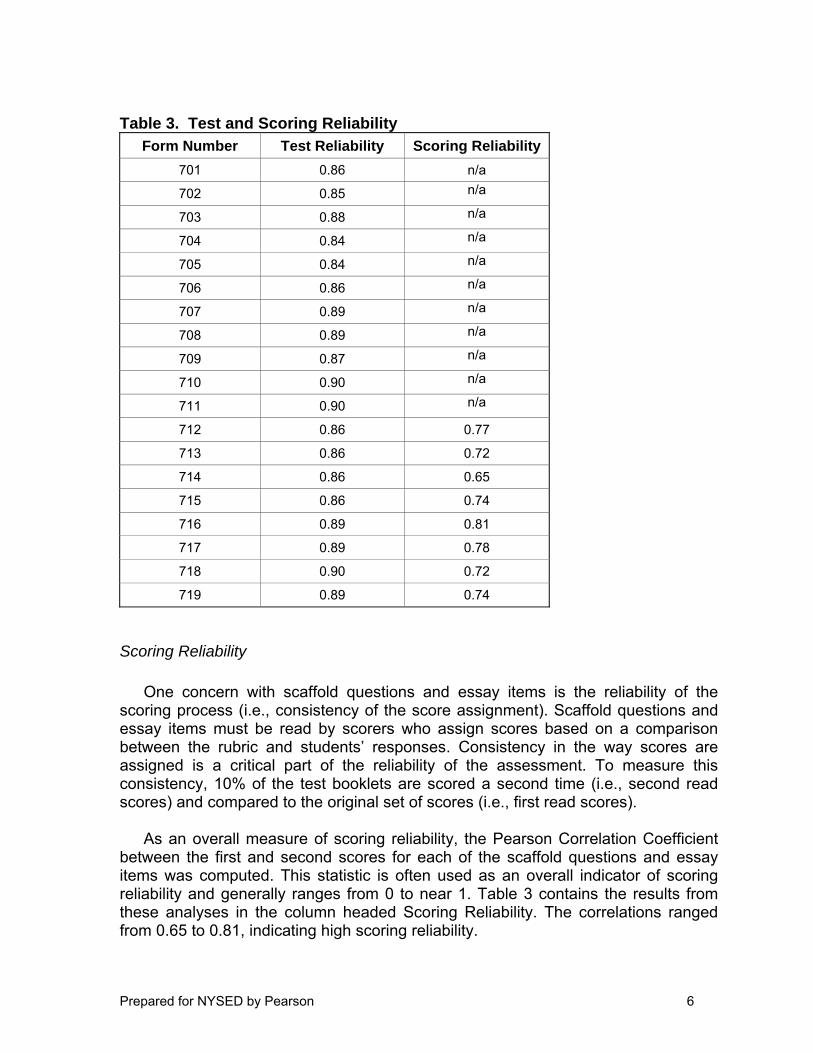
Table 3 contains the internal consistency statistics for all of the field test forms. These statistics ranged from 0.84 to 0.90 and are based solely on the items in the individual field test forms. It is expected that these statistics associated with the operational tests would be greater because there are more items on the operational test forms.
Prepared for NYSED by Pearson 6
Table 3. Test and Scoring Reliability
Form Number Test Reliability Scoring Reliability701 0.86 n/a
702 0.85 n/a
703 0.88 n/a
704 0.84 n/a
705 0.84 n/a
706 0.86 n/a
707 0.89 n/a
708 0.89 n/a
709 0.87 n/a
710 0.90 n/a
711 0.90 n/a
712 0.86 0.77
713 0.86 0.72
714 0.86 0.65
715 0.86 0.74
716 0.89 0.81
717 0.89 0.78
718 0.90 0.72
719 0.89 0.74
Scoring Reliability One concern with scaffold questions and essay items is the reliability of the
scoring process (i.e., consistency of the score assignment). Scaffold questions and essay items must be read by scorers who assign scores based on a comparison between the rubric and students’ responses. Consistency in the way scores are assigned is a critical part of the reliability of the assessment. To measure this consistency, 10% of the test booklets are scored a second time (i.e., second read scores) and compared to the original set of scores (i.e., first read scores).
As an overall measure of scoring reliability, the Pearson Correlation Coefficient
between the first and second scores for each of the scaffold questions and essay items was computed. This statistic is often used as an overall indicator of scoring reliability and generally ranges from 0 to near 1. Table 3 contains the results from these analyses in the column headed Scoring Reliability. The correlations ranged from 0.65 to 0.81, indicating high scoring reliability.

Prepared for NYSED by Pearson 7
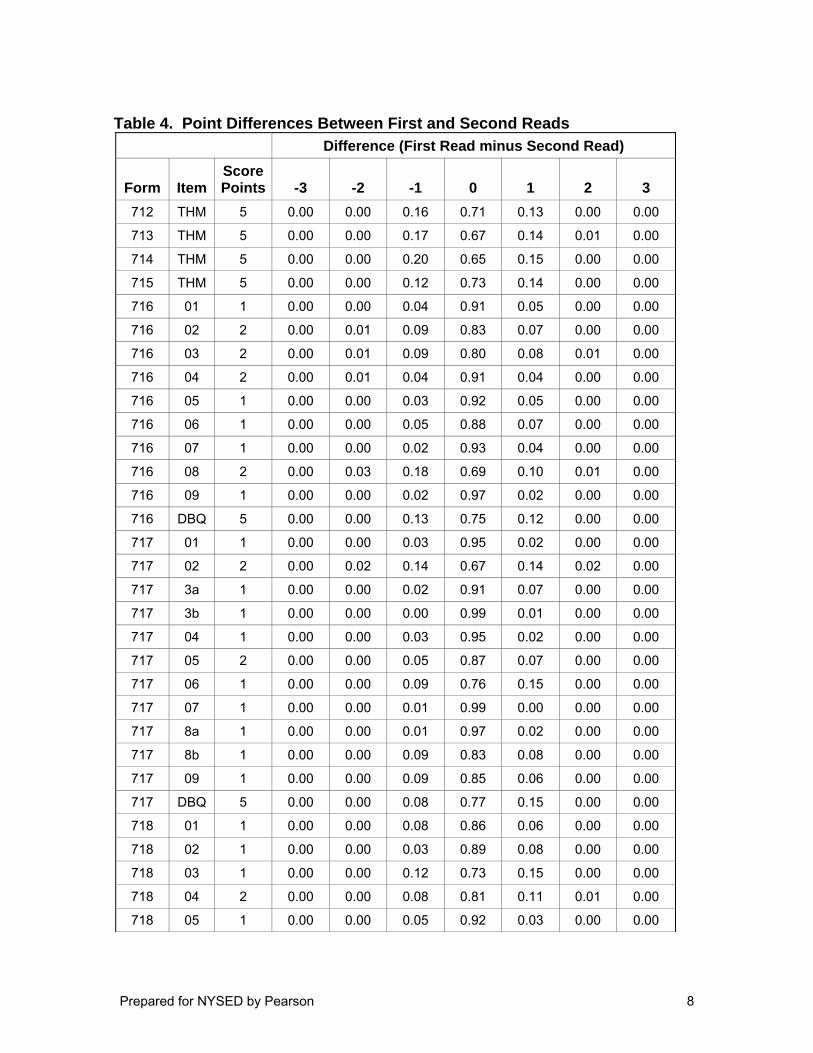
Inter-rater Agreement For each scaffold question and essay item, the difference between the first and
second reads was computed. When examining inter-rater agreement statistics, it should be kept in mind that the maximum number of points per item varies as shown in the ‘Score Points’ column of the following tables.
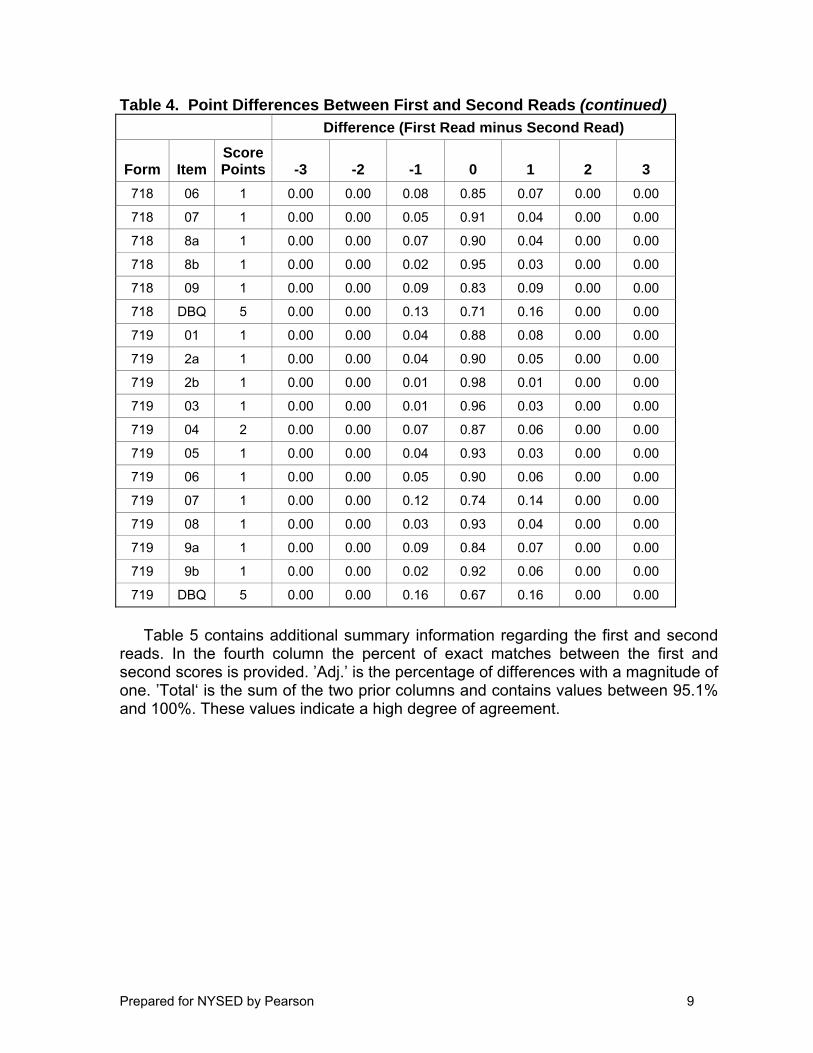
Table 4 contains the proportion of occurrence of these differences for each item.
There were no instances of the first read and second read differing by more than 2.
Prepared for NYSED by Pearson 8
Table 4. Point Differences Between First and Second Reads
Difference (First Read minus Second Read)
Form Item Score Points -3 -2 -1 0 1 2 3
712 THM 5 0.00 0.00 0.16 0.71 0.13 0.00 0.00
713 THM 5 0.00 0.00 0.17 0.67 0.14 0.01 0.00
714 THM 5 0.00 0.00 0.20 0.65 0.15 0.00 0.00
715 THM 5 0.00 0.00 0.12 0.73 0.14 0.00 0.00
716 01 1 0.00 0.00 0.04 0.91 0.05 0.00 0.00
716 02 2 0.00 0.01 0.09 0.83 0.07 0.00 0.00
716 03 2 0.00 0.01 0.09 0.80 0.08 0.01 0.00
716 04 2 0.00 0.01 0.04 0.91 0.04 0.00 0.00
716 05 1 0.00 0.00 0.03 0.92 0.05 0.00 0.00
716 06 1 0.00 0.00 0.05 0.88 0.07 0.00 0.00
716 07 1 0.00 0.00 0.02 0.93 0.04 0.00 0.00
716 08 2 0.00 0.03 0.18 0.69 0.10 0.01 0.00
716 09 1 0.00 0.00 0.02 0.97 0.02 0.00 0.00
716 DBQ 5 0.00 0.00 0.13 0.75 0.12 0.00 0.00
717 01 1 0.00 0.00 0.03 0.95 0.02 0.00 0.00
717 02 2 0.00 0.02 0.14 0.67 0.14 0.02 0.00
717 3a 1 0.00 0.00 0.02 0.91 0.07 0.00 0.00
717 3b 1 0.00 0.00 0.00 0.99 0.01 0.00 0.00
717 04 1 0.00 0.00 0.03 0.95 0.02 0.00 0.00
717 05 2 0.00 0.00 0.05 0.87 0.07 0.00 0.00
717 06 1 0.00 0.00 0.09 0.76 0.15 0.00 0.00
717 07 1 0.00 0.00 0.01 0.99 0.00 0.00 0.00
717 8a 1 0.00 0.00 0.01 0.97 0.02 0.00 0.00
717 8b 1 0.00 0.00 0.09 0.83 0.08 0.00 0.00
717 09 1 0.00 0.00 0.09 0.85 0.06 0.00 0.00
717 DBQ 5 0.00 0.00 0.08 0.77 0.15 0.00 0.00
718 01 1 0.00 0.00 0.08 0.86 0.06 0.00 0.00
718 02 1 0.00 0.00 0.03 0.89 0.08 0.00 0.00
718 03 1 0.00 0.00 0.12 0.73 0.15 0.00 0.00
718 04 2 0.00 0.00 0.08 0.81 0.11 0.01 0.00
718 05 1 0.00 0.00 0.05 0.92 0.03 0.00 0.00
Prepared for NYSED by Pearson 9
Table 4. Point Differences Between First and Second Reads (continued) Difference (First Read minus Second Read)
Form Item Score Points -3 -2 -1 0 1 2 3
718 06 1 0.00 0.00 0.08 0.85 0.07 0.00 0.00
718 07 1 0.00 0.00 0.05 0.91 0.04 0.00 0.00
718 8a 1 0.00 0.00 0.07 0.90 0.04 0.00 0.00
718 8b 1 0.00 0.00 0.02 0.95 0.03 0.00 0.00
718 09 1 0.00 0.00 0.09 0.83 0.09 0.00 0.00
718 DBQ 5 0.00 0.00 0.13 0.71 0.16 0.00 0.00
719 01 1 0.00 0.00 0.04 0.88 0.08 0.00 0.00
719 2a 1 0.00 0.00 0.04 0.90 0.05 0.00 0.00
719 2b 1 0.00 0.00 0.01 0.98 0.01 0.00 0.00
719 03 1 0.00 0.00 0.01 0.96 0.03 0.00 0.00
719 04 2 0.00 0.00 0.07 0.87 0.06 0.00 0.00
719 05 1 0.00 0.00 0.04 0.93 0.03 0.00 0.00
719 06 1 0.00 0.00 0.05 0.90 0.06 0.00 0.00
719 07 1 0.00 0.00 0.12 0.74 0.14 0.00 0.00
719 08 1 0.00 0.00 0.03 0.93 0.04 0.00 0.00
719 9a 1 0.00 0.00 0.09 0.84 0.07 0.00 0.00
719 9b 1 0.00 0.00 0.02 0.92 0.06 0.00 0.00
719 DBQ 5 0.00 0.00 0.16 0.67 0.16 0.00 0.00
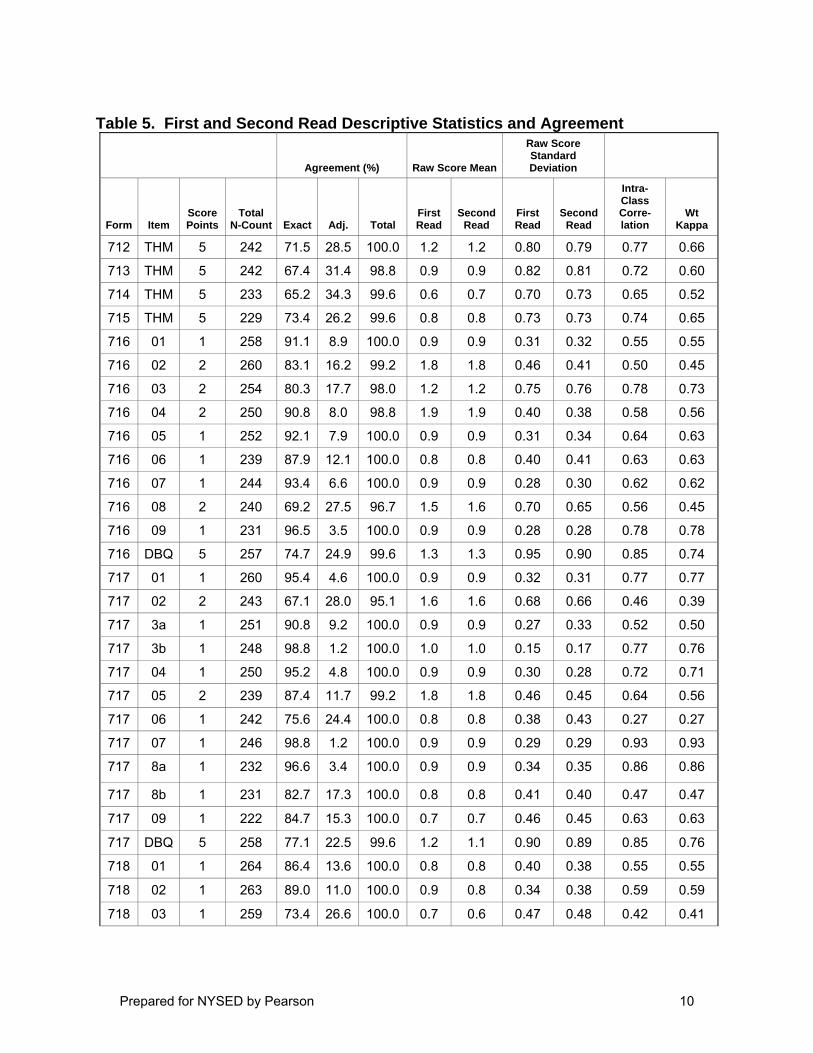
Table 5 contains additional summary information regarding the first and second
reads. In the fourth column the percent of exact matches between the first and second scores is provided. ’Adj.’ is the percentage of differences with a magnitude of one. ’Total‘ is the sum of the two prior columns and contains values between 95.1% and 100%. These values indicate a high degree of agreement.
Prepared for NYSED by Pearson 10
Table 5. First and Second Read Descriptive Statistics and Agreement
Agreement (%) Raw Score Mean
Raw Score Standard Deviation
Form Item Score Points
Total N-Count Exact Adj. Total
First Read
Second Read
First Read
Second Read
Intra-Class Corre-lation
Wt Kappa
712 THM 5 242 71.5 28.5 100.0 1.2 1.2 0.80 0.79 0.77 0.66
713 THM 5 242 67.4 31.4 98.8 0.9 0.9 0.82 0.81 0.72 0.60
714 THM 5 233 65.2 34.3 99.6 0.6 0.7 0.70 0.73 0.65 0.52
715 THM 5 229 73.4 26.2 99.6 0.8 0.8 0.73 0.73 0.74 0.65
716 01 1 258 91.1 8.9 100.0 0.9 0.9 0.31 0.32 0.55 0.55
716 02 2 260 83.1 16.2 99.2 1.8 1.8 0.46 0.41 0.50 0.45
716 03 2 254 80.3 17.7 98.0 1.2 1.2 0.75 0.76 0.78 0.73
716 04 2 250 90.8 8.0 98.8 1.9 1.9 0.40 0.38 0.58 0.56
716 05 1 252 92.1 7.9 100.0 0.9 0.9 0.31 0.34 0.64 0.63
716 06 1 239 87.9 12.1 100.0 0.8 0.8 0.40 0.41 0.63 0.63
716 07 1 244 93.4 6.6 100.0 0.9 0.9 0.28 0.30 0.62 0.62
716 08 2 240 69.2 27.5 96.7 1.5 1.6 0.70 0.65 0.56 0.45
716 09 1 231 96.5 3.5 100.0 0.9 0.9 0.28 0.28 0.78 0.78
716 DBQ 5 257 74.7 24.9 99.6 1.3 1.3 0.95 0.90 0.85 0.74
717 01 1 260 95.4 4.6 100.0 0.9 0.9 0.32 0.31 0.77 0.77
717 02 2 243 67.1 28.0 95.1 1.6 1.6 0.68 0.66 0.46 0.39
717 3a 1 251 90.8 9.2 100.0 0.9 0.9 0.27 0.33 0.52 0.50
717 3b 1 248 98.8 1.2 100.0 1.0 1.0 0.15 0.17 0.77 0.76
717 04 1 250 95.2 4.8 100.0 0.9 0.9 0.30 0.28 0.72 0.71
717 05 2 239 87.4 11.7 99.2 1.8 1.8 0.46 0.45 0.64 0.56
717 06 1 242 75.6 24.4 100.0 0.8 0.8 0.38 0.43 0.27 0.27
717 07 1 246 98.8 1.2 100.0 0.9 0.9 0.29 0.29 0.93 0.93
717 8a 1 232 96.6 3.4 100.0 0.9 0.9 0.34 0.35 0.86 0.86
717 8b 1 231 82.7 17.3 100.0 0.8 0.8 0.41 0.40 0.47 0.47
717 09 1 222 84.7 15.3 100.0 0.7 0.7 0.46 0.45 0.63 0.63
717 DBQ 5 258 77.1 22.5 99.6 1.2 1.1 0.90 0.89 0.85 0.76
718 01 1 264 86.4 13.6 100.0 0.8 0.8 0.40 0.38 0.55 0.55
718 02 1 263 89.0 11.0 100.0 0.9 0.8 0.34 0.38 0.59 0.59
718 03 1 259 73.4 26.6 100.0 0.7 0.6 0.47 0.48 0.42 0.41
Prepared for NYSED by Pearson 11
Table 5. First and Second Read Descriptive Statistics and Agreement (continued)
Agreement (%) Raw Score Mean
Raw Score Standard Deviation
Form Item Score Points
Total N-Count Exact Adj. Total
First Read
Second Read
First Read
Second Read
Intra-Class Corre-lation
Wt Kappa
718 04 2 256 80.9 18.4 99.2 1.7 1.7 0.50 0.55 0.61 0.55
718 05 1 251 91.6 8.4 100.0 0.9 0.9 0.33 0.30 0.57 0.57
718 06 1 239 84.9 15.1 100.0 0.7 0.7 0.45 0.44 0.62 0.62
718 07 1 247 91.5 8.5 100.0 0.9 0.9 0.27 0.25 0.39 0.39
718 8a 1 228 89.9 10.1 100.0 0.9 0.9 0.32 0.28 0.44 0.43
718 8b 1 227 95.2 4.8 100.0 1.0 1.0 0.20 0.21 0.40 0.40
718 09 1 231 82.7 17.3 100.0 0.8 0.8 0.37 0.37 0.36 0.36
718 DBQ 5 266 71.4 28.6 100.0 1.2 1.2 0.82 0.83 0.79 0.68
719 01 1 252 88.5 11.5 100.0 0.9 0.8 0.31 0.36 0.51 0.50
719 2a 1 249 90.4 9.6 100.0 0.9 0.9 0.31 0.32 0.52 0.52
719 2b 1 250 98.0 2.0 100.0 1.0 1.0 0.18 0.19 0.70 0.70
719 03 1 252 96.0 4.0 100.0 1.0 0.9 0.20 0.24 0.60 0.59
719 04 2 246 86.6 13.0 99.6 1.5 1.5 0.71 0.70 0.85 0.79
719 05 1 238 92.9 7.1 100.0 0.9 0.9 0.32 0.31 0.64 0.64
719 06 1 235 89.8 10.2 100.0 0.9 0.8 0.35 0.36 0.60 0.60
719 07 1 242 74.4 25.6 100.0 0.7 0.7 0.46 0.47 0.41 0.41
719 08 1 232 93.1 6.9 100.0 0.9 0.8 0.35 0.37 0.73 0.73
719 9a 1 238 84.0 16.0 100.0 0.8 0.8 0.40 0.39 0.48 0.48
719 9b 1 238 91.6 8.4 100.0 0.9 0.9 0.30 0.35 0.62 0.61
719 DBQ 5 262 67.2 32.4 99.6 1.1 1.1 0.87 0.87 0.77 0.65 * Adj. = difference of one
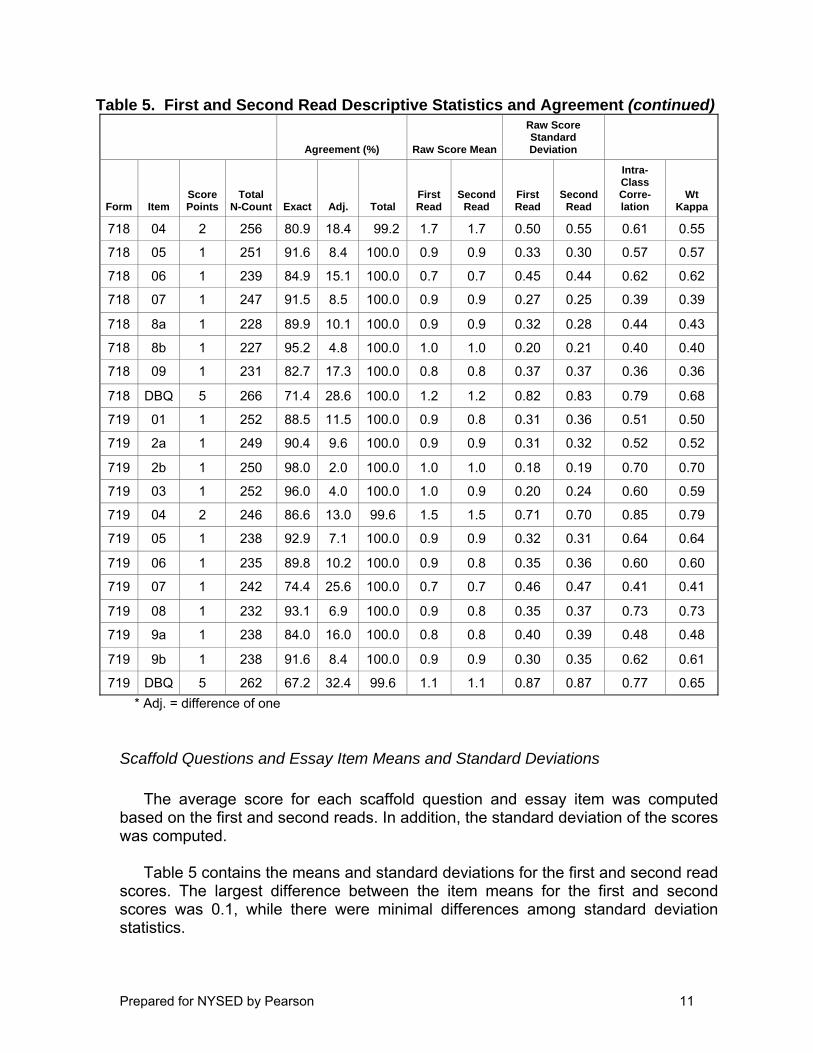
Scaffold Questions and Essay Item Means and Standard Deviations The average score for each scaffold question and essay item was computed
based on the first and second reads. In addition, the standard deviation of the scores was computed.
Table 5 contains the means and standard deviations for the first and second read
scores. The largest difference between the item means for the first and second scores was 0.1, while there were minimal differences among standard deviation statistics.

Prepared for NYSED by Pearson 12
Intra-class Correlation
The intra-class correlation was computed for each item. This correlation is an estimate of the reliability of scoring based on an average of the first and second reads. Correlations greater than 0.60 are considered very strong because they explain more than one-third of the variance in scores. More than half of the items had intra-class correlations greater than 0.60 (See Table 5).
Weighted Kappa Weighted Kappa (Cohen, 1968) was calculated for each item based on the first
and second reads. This statistic produces an estimate of the reliability of the score classifications relative to what would be expected to occur by chance.
Weighted Kappa is an estimate of the reliability of the score classifications. That is, the Kappa statistic is a measure of reproducibility for categorical data. Guidelines for the evaluation of this statistic are:
• k > 0.75 denotes excellent reproducibility • 0.4 < k < 0.75 denotes good reproducibility • 0 < k < 0.4 denotes marginal reproducibility
The results found in Table 5 show a high degree of consistency between the first and second reads. The Weighted Kappa statistics ranged from 0.27 to 0.93, which in all but five cases indicates good to excellent reproducibility.
Based on the scoring reliability analyses, there is strong evidence that the
scoring of the scaffold questions and essay items was performed in a highly reliable manner.
Item Response Theory (IRT) Statistics
As discussed above, the item mean is a statistic used to evaluate item difficulty. However, many different test forms are used during field testing and different samples of students are responding to these items. The average ability of the different samples of students varies and a direct comparison of item means across test forms may lead to inaccurate interpretations. Therefore, Item Response Theory (IRT) was also used to evaluate item difficulty.
Specifically, the Rasch Partial Credit Model (PCM) (Masters, 1982) was used.
With use of this model, the difficulty of items and the ability of examinees are placed on the same metric. Thus, the difficulty of an item and the ability of a person can be meaningfully compared across field test forms. Also, the use of this model provides greater flexibility in situations where different samples or test forms are used because the parameters generated are generally not considered to be sample
Prepared for NYSED by Pearson 13
dependent or test dependent. A description of this model, results of item calibration, and item fit evaluation are below.
The PCM provides an overall difficulty estimate for each item. Specifically for
scaffold questions and essay items when there are several points possible, individual estimates of difficulty for each of the possible score points are also calculated (i.e., step values). Each step value represents the difficulty of a student receiving a particular score point given that they have already received the prior score point. For example, if a 3-point item had step values of -1.0, 1.0, and 0.0, one could say that it is relatively easy to obtain a score of 1. However, it is much more difficult to obtain a 2 given the student has the ability to score a 1 because the difference in difficulty between a 1 and a 2 is much greater than the difference between a 0 and a 1. Also, the difference between a 2 and a 3 is not as great as the difference between a 1 and a 2. Thus, with this example, a small step is needed to go from a 0 to a 1, a large step is needed to move from a 1 to a 2, and a moderate step is needed to proceed from a 2 to a 3.
Item Calibration As discussed above, the use of Rasch item difficulty statistics provides an
advantage over the use of classical item means because they can be compared across test forms. Different samples of students responded to the various test forms. Although the samples were selected to be similar with respect to student ability, there are differences. By equating the test forms (See the Equating Procedure section below), the Rasch item difficulties account for those differences and these statistics can be compared across test forms.
Rasch item difficulty values generally range from -3.00 to +3.00. An item with a
Rasch difficulty greater than +2.0 is considered very difficult and should be examined carefully. If the item is measuring an important concept that students are having difficulty with, then the item can be useful. However, if the item is measuring a trivial concept or is written in a confusing manner, then it may not be appropriate to use on an operational test form. Likewise, any item with a Rasch difficulty less than -2.0 is considered very easy and usually provides little information regarding student achievement. The vast majority of test items should range between -2.0 and +2.0. This range represents approximately two standard deviations around the average difficulty of 0. Thus, one would expect that, based on chance, roughly 5% of the items will fall outside of that range and therefore, these are items that should be closely examined for content.

Prepared for NYSED by Pearson 14
Item Fit Evaluation The INFIT statistic is used to determine whether items are functioning in a way
that is congruent with the assumptions of the Rasch model. Under these assumptions, how a student will respond to an item depends on the proficiency of the student and the difficulty of the item, both of which are on the same measurement scale. If an item is as difficult as a student is able, the student will have a 50% chance of getting the item correct. If a student is more able than an item is difficult, under the assumptions of the Rasch model, that student has a greater than 50% chance of correctly answering the item. On the other hand, if the item is more difficult than the student is able, he or she has a less than 50% chance of correctly responding to the item. Rasch fit statistics estimate the extent to which an item is functioning in this predicted manner. Items showing a poor fit with the Rasch model typically have values outside the range of 0.7 to 1.3.
Table 6 contains a summary of the Partial Credit Model item analysis for each of
the field test forms. The first column lists the form numbers. The next two columns list the number of students who participated and the number of items on each field test form. The remaining columns are divided into two sections. The first section pertains to the Rasch item difficulties while the second pertains to the INFIT statistics. All but three of the items fell within the moderate -2.0 to +2.0 difficulty range and only three items had an INFIT statistic outside the typical range.

Prepared for NYSED by Pearson 15
Table 6. Partial Credit Model Item Analysis
Rasch INFIT
Form N-Count No. of Items <-2.0
-2.0 to 2.0 >2.0 <-0.70
-0.70 to 1.30 >1.30
701 810 30 0 30 0 0 30 0
702 814 32 0 32 0 0 32 0
703 820 32 0 32 0 0 31 1
704 817 32 0 32 0 0 32 0
705 825 32 0 32 0 0 32 0
706 829 32 0 32 0 0 32 0
707 819 32 0 32 0 0 32 0
708 824 32 0 32 0 0 32 0
709 820 32 0 32 0 0 32 0
710 809 32 0 32 0 0 32 0
711 811 32 0 32 0 0 30 2
712 1976 1 0 1 0 0 1 0
713 1964 1 0 0 1 0 1 0
714 1994 1 0 0 1 0 1 0
715 1975 1 0 0 1 0 1 0
716 1860 10 0 10 0 0 10 0
717 1849 12 0 12 0 0 12 0
718 1824 11 0 11 0 0 11 0
719 1835 12 0 12 0 0 12 0 * A complete listing of all Partial Credit Model item analysis results is presented in Appendix B.
All of the individual IRT item statistics are provided in Appendix B. The column titled RID contains the Rasch item difficulty statistics. S1–S6 contain the step values for the scaffold questions and essay items. Finally, INFIT contains the INFIT statistic for each item.
Differential Item Functioning (DIF) Statistics
Statistical procedures are employed to observe whether, on the basis of data, there exists the possibility of unfair treatment of different populations. DIF statistics are used to identify items for which members of a focal group have a different probability of getting the items correct than members of a reference group after the groups have been matched on ability level on the test.
Prepared for NYSED by Pearson 16
For the multiple-choice items, the Mantel-Haenszel Delta (MHD) DIF statistics were computed (Dorans & Holland, 1992) to classify test items in three levels of DIF for each comparison: negligible DIF (A), moderate DIF (B), and large DIF (C). An item was flagged if it exhibited a B or C category of DIF using the following rules derived from National Assessment of Educational Progress (NAEP) guidelines (Allen, Carlson, & Zalanak, 1999):
• MHD not significantly different from 0 (based on alpha = 0.05) or |MHD| < 1.0 are classified as A.
• MHD significantly different from 0 and {|MHD| ≥ 1.0 and < 1.5} or
MHD not significantly different from 0 and |MHD| ≥ 1.0 are classified as B.
• |MHD| ≥ 1.5 and significantly different from 0 are classified as C.
For the scaffold questions and essay items, the effect size of the standardized mean difference (SMD) was used to flag DIF. The SMD reflects the size of the differences in performance on scaffold questions and essay items between student groups matched on the total score. It is the difference between the unweighted item mean of the focal group and the weighted item mean of the reference group. The weights applied to the reference group are applied so that the weighted number of reference group students is the same as in the focal group (within the same ability group). The SMD is divided by the total group item standard deviation to get a measure of the effect size (ES) for the SMD. The SMD effect size groups each item into one of three categories: negligible DIF (AA), moderate DIF (BB), and large DIF (CC). Only categories BB and CC were flagged in the results.
• Probability is > 0.05 or if |ES| is ≤ 0.17, classified as AA.
• Probability is > 0.05 and if 0.17 < |ES| ≤ 0.25, classified as BB.
• Probability is > 0.05 and if |ES| is > 0.25, classified as CC.
Although DIF statistics are typically conducted by gender and ethnicity, the low n-counts for ethnic subgroups did not allow for these statistics to be meaningful. The n-counts for gender allowed for comparisons to be made, but were still somewhat low, so resulting statistics should be interpreted with caution.
The DIF statistics for gender are shown in Appendix C. Flagging of items
appears in the ‘DIF Category’ column and if an item is flagged, the ‘Favored Group’ column indicates which gender is favored.
Prepared for NYSED by Pearson 17
Section III: Equating Procedure
The 2010 field test administration for the New York State Regents Examination in Global History and Geography consisted of 18 field test forms numbered 702–719 and one anchor form labeled 701. The field test forms can be grouped into three sets. Forms 701–711 consisted of multiple-choice items only. Forms 712–715 contained the multiple-choice anchor items (form 731) and a thematic essay. Forms 716-719 contained the multiple-choice anchor items, scaffold questions, and a DBQ essay. All students participating in the field test were administered one of the 19 test forms. The test forms 701–711 were spiraled within the classroom so that the groups of students taking each form were equivalent. A complete listing of these field test forms is provided in Appendix A, containing the number of items, item type (e.g., multiple-choice, scaffold question, essay), and the maximum points for each item.
The field test forms were equated using two different equating designs. Forms
702–711 were equated to the anchor form 701 using the equivalent-groups design. Forms 701 and 712–719 were equated using the common-items design.
Equivalent-Group Equating Design
The anchor form (form 701) was equated to the item bank using a common-item equating design. The anchor item difficulty parameters were fixed to their 2009 item bank values. This places the item difficulty estimates and the ability estimates of the students taking the anchor form onto the item bank scale. After the anchor form was placed onto the bank scale, the average mean ability estimates was computed using ability estimates of non-extreme students. This value was then used to equate field test forms 702–711 as well as updating the item parameters for the anchor forms.
As part of the anchor item equating, an item-stability check was performed. After
fixing all of the items to their 2009 bank values, any item with a displacement value with a magnitude greater than 0.30 was no longer fixed and the test form was reanalyzed. If more than one item had a displacement value with a magnitude greater than 0.30, then the item with the largest displacement was freed and the test form was reanalyzed. In a stepwise fashion, this procedure was repeated until all remaining fixed anchor items had displacements with magnitudes less than or equal to 0.30.
Applying the anchor item-stability check to the anchor form resulted in three
items having a displacement value with a magnitude greater than 0.30. This indicates a strong level of stability in the items used on the anchor forms.
The equated mean ability estimate for form 701 was 0.53. This value was used
as the target mean ability for the remainder of the equating process.

Prepared for NYSED by Pearson 18
After the anchor form was equated and the target mean was computed, the field test forms 702–711 were equated using the equivalent groups design. The first step was to calibrate each form separately where all the item parameters were free to estimate (without constraint). From those initial calibrations, the mean ability estimates for each field test form were obtained. The second step was to determine the equating constant for each form by subtracting the mean ability for a given field test form from the target mean ability calculated from the anchor form (i.e., form 701). The respective equating constant was then added to each of the item parameters on a given form. If the resulting mean of the ability estimates for those students did not equal that of the target mean, then the procedure was repeated until the mean abilities for each of the field test forms equaled the target mean ability. Table 7 shows the mean abilities and constants used for the equating.
Table 7. Initial Mean Abilities and Equating Constants
Form Number Mean Ability Constant 702 0.55 -0.02
703 0.31 0.21
704 0.38 0.15
705 0.27 0.26
706 0.70 -0.18
707 0.54 -0.01
708 0.62 -0.09
709 0.60 -0.07
710 0.95 -0.41
711 0.71 -0.18
Common-Item Equating Design
The remaining field test forms (712–719) were equated to the item bank using a common-item equating design. Each field test form was administered with the anchor form. The field test data were arranged in an incomplete data matrix so that the anchor items were in each data line along with the unique items for each field test form. Items not appearing on the field test form are left blank and treated as not administered when item parameters are calibrated. The entire data set was then calibrated using WINSTEPS and applying the Partial Credit Model. In this calibration, the anchor items were fixed to their 2009 bank values. This places all of the item parameters on the bank scale.
Prepared for NYSED by Pearson 19
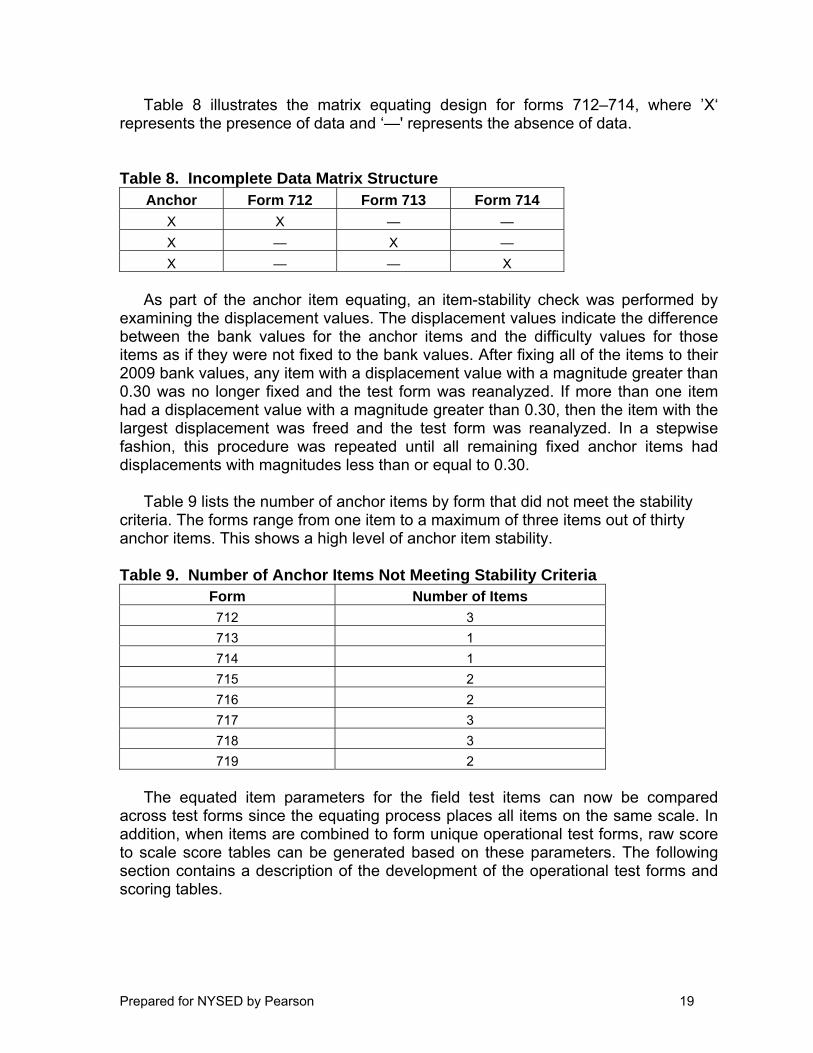
Table 8 illustrates the matrix equating design for forms 712–714, where ’X‘ represents the presence of data and ‘—' represents the absence of data. Table 8. Incomplete Data Matrix Structure
Anchor Form 712 Form 713 Form 714 X X — — X — X — X — — X
As part of the anchor item equating, an item-stability check was performed by
examining the displacement values. The displacement values indicate the difference between the bank values for the anchor items and the difficulty values for those items as if they were not fixed to the bank values. After fixing all of the items to their 2009 bank values, any item with a displacement value with a magnitude greater than 0.30 was no longer fixed and the test form was reanalyzed. If more than one item had a displacement value with a magnitude greater than 0.30, then the item with the largest displacement was freed and the test form was reanalyzed. In a stepwise fashion, this procedure was repeated until all remaining fixed anchor items had displacements with magnitudes less than or equal to 0.30.
Table 9 lists the number of anchor items by form that did not meet the stability
criteria. The forms range from one item to a maximum of three items out of thirty anchor items. This shows a high level of anchor item stability. Table 9. Number of Anchor Items Not Meeting Stability Criteria
Form Number of Items 712 3 713 1 714 1 715 2 716 2 717 3 718 3 719 2
The equated item parameters for the field test items can now be compared
across test forms since the equating process places all items on the same scale. In addition, when items are combined to form unique operational test forms, raw score to scale score tables can be generated based on these parameters. The following section contains a description of the development of the operational test forms and scoring tables.

Prepared for NYSED by Pearson 20
Section IV: Scaling of Operational Test Forms
Operational test items are selected based on content coverage and statistical quality. The sets of items on each operational test conform to the coverage suggested by content experts. These expert judgments are based on the learning standards established by the New York State Education Department. With respect to statistical quality, classical and Rasch statistics are examined to determine how well items function. Also, items are selected such that they range in difficulty in order to measure students across ability levels. Appendix D contains the 2010 operational test maps with content information regarding each item included on the January 2010, June 2010, and August 2010 operational test forms.
In order to limit wide fluctuations of raw scores that correspond to scale scores of
65 and 85 across administrations, the average Rasch item difficulty for the operational test is considered. For this examination, an average Rasch difficulty of approximately 1.955 is used as a target for each administration. In most cases, meeting this target will provide raw scores of similar magnitude to other forms. However, differences with these scores also occur due to the distribution of the Rasch item difficulty parameters.
Scoring tables display the relationship between raw scores on the operational
test and assigned scale scores. Appendix E contains the scoring tables used for January, June, and August 2010 operational test forms. Four steps are taken in order to produce these tables and resulting conversion charts.
The first step is to develop a raw score (i.e., number of points on the test form) to
theta (i.e., student ability) to scale score relationship for the baseline operational test form. This relationship is determined when standards are set and then used for every administration moving forward until the standards are revisited. The baseline form was determined by the New York State Education Department to be June 2004. The raw score to theta relationship from that examination was used and then scale scores are calculated based on the raw score cuts according to the following formula:
p(x) = m3x3 + m2x2 + m1x + m0
The raw score of zero was assigned a scale score of zero and the maximum raw
score was assigned a scale score of 100. The raw scores corresponding to the scale scores of 65 and 85 were also fixed. The polynomial relationship shown above was then used to assign all scale scores to the remaining raw scores. The resulting values for m1 – m3 are the transformation constants used to produce the final raw score to scale score table.
The second step is to develop a raw score to theta relationship for the new
operational test form using the field test equated PCM item parameters. This is
Prepared for NYSED by Pearson 21
accomplished by doing a calibration where all items are anchored to their field test parameters. One modification that is made is that for 5-point items, a constant based on existing bank values is used in place of the field test parameters. The number of points on the test form (i.e., raw score) expected across student ability levels is based on the difficulty of the items on the form. Thus, given a particular student ability level (i.e., theta), if the points are more difficult to earn on the new test than the points on the June 2004 test, the number of points expected of this student on the new test will be less than the number of points expected of this student on the baseline form.
The third step is to use linear interpolation to determine the raw score to theta to
scale score relationship for the new test. The theta values associated with scale scores of 65 and 85 on the baseline form are used along with the raw score to theta relationship developed in the previous step. In other words, the baseline 65 and 85 theta values are used as reference points and linear interpolation assigns the other scale scores.
Finally, a conversion chart is created based on the scoring table generated in the third step. Scale scores are rounded to the nearest whole number in all cases except for 0, 65, 85, and 100. A raw score of zero is assigned a scale score of zero. The maximum raw score is assigned a scale score of 100. With respect to 65 and 85 scale scores, the raw scores with scale scores of 65 or 85 after rounding are assigned those values.
Prepared for NYSED by Pearson 22
References Allen, N.L., Carlson, J.E., and Zalanak, C.A. 1999. The NAEP 1996 Technical
Report. Washington, DC: National Center for Education Statistics. Cohen, J. 1968. Weighted kappa: Nominal scale agreement with provision for scaled
disagreement or partial credit. Psychological Bulletin, 70, 213–20. Cronbach, L.J. 1951. Coefficient alpha and the internal structure of tests.
Psychometrika, 16(3), 297–334. Dorans, N.J. and Holland, P.W. 1992. DIF Detection and Description: Mantel–
Haenszel and Standardization. In Differential Item Functioning: Theory and Practice, edited by P. W. Holland & H. Wainer, 35–66. Hillsdale, NJ: Erlbaum.
Masters, G.N. 1982. A Rasch model for partial credit scoring. Psychometrika, 47,
149–174.
Prepared for NYSED by Pearson 23
Appendix A: Classical Item Analysis

Prepared for NYSED by Pearson 24
Table 10. Classical Item Analysis
Test Form Type Item Max N-Count Alpha B M0 M1 M2 M3 M4 M5 M6 Mean Point-
Biserial
2010_GLHG_FT 701 MC 01 1 810 0.86 0.00 0.06 0.03 0.08 0.82 0.82 0.48
2010_GLHG_FT 701 MC 02 1 810 0.86 0.00 0.72 0.12 0.07 0.08 0.72 0.43
2010_GLHG_FT 701 MC 03 1 810 0.86 0.00 0.12 0.05 0.19 0.64 0.64 0.45
2010_GLHG_FT 701 MC 04 1 810 0.86 0.00 0.20 0.21 0.47 0.12 0.47 0.48
2010_GLHG_FT 701 MC 05 1 810 0.86 0.01 0.51 0.22 0.12 0.15 0.51 0.33
2010_GLHG_FT 701 MC 06 1 810 0.86 0.00 0.09 0.65 0.21 0.04 0.65 0.33
2010_GLHG_FT 701 MC 07 1 810 0.86 0.01 0.16 0.13 0.61 0.09 0.61 0.39
2010_GLHG_FT 701 MC 08 1 810 0.86 0.01 0.17 0.09 0.16 0.57 0.57 0.29
2010_GLHG_FT 701 MC 09 1 810 0.86 0.01 0.03 0.04 0.87 0.05 0.87 0.44
2010_GLHG_FT 701 MC 10 1 810 0.86 0.01 0.17 0.69 0.09 0.05 0.69 0.49
2010_GLHG_FT 701 MC 11 1 810 0.86 0.01 0.08 0.17 0.17 0.57 0.57 0.53
2010_GLHG_FT 701 MC 12 1 810 0.86 0.01 0.81 0.06 0.04 0.08 0.81 0.45
2010_GLHG_FT 701 MC 13 1 810 0.86 0.01 0.09 0.53 0.21 0.17 0.53 0.47
2010_GLHG_FT 701 MC 14 1 810 0.86 0.01 0.52 0.13 0.17 0.18 0.52 0.39
2010_GLHG_FT 701 MC 15 1 810 0.86 0.01 0.14 0.08 0.74 0.04 0.74 0.48
2010_GLHG_FT 701 MC 16 1 810 0.86 0.01 0.60 0.19 0.13 0.06 0.60 0.38
2010_GLHG_FT 701 MC 17 1 810 0.86 0.02 0.14 0.55 0.24 0.06 0.55 0.47
2010_GLHG_FT 701 MC 18 1 810 0.86 0.03 0.08 0.15 0.05 0.69 0.69 0.52
2010_GLHG_FT 701 MC 19 1 810 0.86 0.02 0.14 0.15 0.10 0.60 0.60 0.52
2010_GLHG_FT 701 MC 20 1 810 0.86 0.02 0.15 0.47 0.12 0.23 0.47 0.38
2010_GLHG_FT 701 MC 21 1 810 0.86 0.02 0.59 0.13 0.11 0.14 0.59 0.48
2010_GLHG_FT 701 MC 22 1 810 0.86 0.03 0.15 0.05 0.72 0.06 0.72 0.46
Prepared for NYSED by Pearson 25
Table 10. Classical Item Analysis (continued)
Test Form Type Item Max N-Count Alpha B M0 M1 M2 M3 M4 M5 M6 Mean Point-
Biserial
2010_GLHG_FT 701 MC 23 1 810 0.86 0.04 0.67 0.16 0.09 0.05 0.67 0.57
2010_GLHG_FT 701 MC 24 1 810 0.86 0.04 0.14 0.62 0.10 0.09 0.62 0.42
2010_GLHG_FT 701 MC 25 1 810 0.86 0.04 0.10 0.59 0.11 0.16 0.59 0.39
2010_GLHG_FT 701 MC 26 1 810 0.86 0.04 0.25 0.09 0.58 0.05 0.58 0.32
2010_GLHG_FT 701 MC 27 1 810 0.86 0.05 0.21 0.18 0.43 0.14 0.43 0.46
2010_GLHG_FT 701 MC 28 1 810 0.86 0.04 0.07 0.09 0.13 0.66 0.66 0.63
2010_GLHG_FT 701 MC 29 1 810 0.86 0.04 0.12 0.42 0.23 0.18 0.42 0.36
2010_GLHG_FT 701 MC 30 1 810 0.86 0.05 0.18 0.11 0.59 0.07 0.59 0.62
2010_GLHG_FT 702 MC 01 1 814 0.85 0.00 0.70 0.16 0.08 0.06 0.70 0.52
2010_GLHG_FT 702 MC 02 1 814 0.85 0.00 0.20 0.73 0.03 0.03 0.73 0.41
2010_GLHG_FT 702 MC 03 1 814 0.85 0.00 0.03 0.47 0.43 0.07 0.47 0.42
2010_GLHG_FT 702 MC 04 1 814 0.85 0.00 0.10 0.10 0.12 0.66 0.66 0.48
2010_GLHG_FT 702 MC 05 1 814 0.85 0.00 0.06 0.10 0.77 0.07 0.77 0.52
2010_GLHG_FT 702 MC 06 1 814 0.85 0.00 0.59 0.13 0.11 0.16 0.59 0.40
2010_GLHG_FT 702 MC 07 1 814 0.85 0.00 0.16 0.09 0.05 0.70 0.70 0.34
2010_GLHG_FT 702 MC 08 1 814 0.85 0.00 0.10 0.06 0.06 0.78 0.78 0.48
2010_GLHG_FT 702 MC 09 1 814 0.85 0.00 0.07 0.74 0.13 0.06 0.74 0.38
2010_GLHG_FT 702 MC 10 1 814 0.85 0.00 0.03 0.13 0.74 0.09 0.74 0.29
2010_GLHG_FT 702 MC 11 1 814 0.85 0.00 0.09 0.66 0.08 0.17 0.66 0.44
2010_GLHG_FT 702 MC 12 1 814 0.85 0.00 0.16 0.05 0.70 0.09 0.70 0.56
2010_GLHG_FT 702 MC 13 1 814 0.85 0.00 0.08 0.04 0.72 0.16 0.72 0.49
2010_GLHG_FT 702 MC 14 1 814 0.85 0.01 0.13 0.15 0.17 0.55 0.55 0.43
Prepared for NYSED by Pearson 26
Table 10. Classical Item Analysis (continued)
Test Form Type Item Max N-Count Alpha B M0 M1 M2 M3 M4 M5 M6 Mean Point-
Biserial
2010_GLHG_FT 702 MC 15 1 814 0.85 0.01 0.68 0.15 0.06 0.10 0.68 0.24
2010_GLHG_FT 702 MC 16 1 814 0.85 0.01 0.20 0.14 0.05 0.60 0.60 0.48
2010_GLHG_FT 702 MC 17 1 814 0.85 0.01 0.10 0.65 0.15 0.09 0.65 0.48
2010_GLHG_FT 702 MC 18 1 814 0.85 0.01 0.12 0.10 0.26 0.51 0.51 0.36
2010_GLHG_FT 702 MC 19 1 814 0.85 0.02 0.58 0.08 0.14 0.18 0.58 0.31
2010_GLHG_FT 702 MC 20 1 814 0.85 0.02 0.24 0.28 0.32 0.14 0.24 0.29
2010_GLHG_FT 702 MC 21 1 814 0.85 0.02 0.15 0.18 0.54 0.11 0.54 0.33
2010_GLHG_FT 702 MC 22 1 814 0.85 0.01 0.26 0.33 0.19 0.21 0.33 0.35
2010_GLHG_FT 702 MC 23 1 814 0.85 0.02 0.73 0.05 0.07 0.13 0.73 0.54
2010_GLHG_FT 702 MC 24 1 814 0.85 0.02 0.24 0.06 0.55 0.14 0.55 0.45
2010_GLHG_FT 702 MC 25 1 814 0.85 0.02 0.11 0.15 0.10 0.62 0.62 0.54
2010_GLHG_FT 702 MC 26 1 814 0.85 0.02 0.35 0.30 0.15 0.17 0.35 0.34
2010_GLHG_FT 702 MC 27 1 814 0.85 0.02 0.09 0.14 0.60 0.15 0.60 0.37
2010_GLHG_FT 702 MC 28 1 814 0.85 0.02 0.18 0.51 0.17 0.13 0.51 0.52
2010_GLHG_FT 702 MC 29 1 814 0.85 0.02 0.13 0.07 0.03 0.75 0.75 0.40
2010_GLHG_FT 702 MC 30 1 814 0.85 0.03 0.24 0.10 0.09 0.55 0.55 0.52
2010_GLHG_FT 702 MC 31 1 814 0.85 0.04 0.12 0.68 0.06 0.10 0.68 0.38
2010_GLHG_FT 702 MC 32 1 814 0.85 0.05 0.43 0.09 0.22 0.21 0.43 0.29
2010_GLHG_FT 703 MC 01 1 820 0.88 0.01 0.18 0.30 0.43 0.09 0.43 0.49
2010_GLHG_FT 703 MC 02 1 820 0.88 0.00 0.49 0.20 0.24 0.06 0.49 0.42
2010_GLHG_FT 703 MC 03 1 820 0.88 0.00 0.16 0.58 0.11 0.15 0.58 0.54
2010_GLHG_FT 703 MC 04 1 820 0.88 0.01 0.28 0.18 0.20 0.33 0.33 0.23

Prepared for NYSED by Pearson 27
Table 10. Classical Item Analysis (continued)
Test Form Type Item Max N-Count Alpha B M0 M1 M2 M3 M4 M5 M6 Mean Point-
Biserial
2010_GLHG_FT 703 MC 05 1 820 0.88 0.00 0.59 0.06 0.25 0.09 0.59 0.42
2010_GLHG_FT 703 MC 06 1 820 0.88 0.00 0.67 0.07 0.13 0.13 0.67 0.53
2010_GLHG_FT 703 MC 07 1 820 0.88 0.00 0.08 0.22 0.40 0.29 0.40 0.32
2010_GLHG_FT 703 MC 08 1 820 0.88 0.01 0.47 0.18 0.13 0.21 0.47 0.34
2010_GLHG_FT 703 MC 09 1 820 0.88 0.01 0.11 0.09 0.11 0.68 0.68 0.57
2010_GLHG_FT 703 MC 10 1 820 0.88 0.00 0.61 0.10 0.25 0.03 0.25 0.43
2010_GLHG_FT 703 MC 11 1 820 0.88 0.01 0.21 0.39 0.07 0.32 0.39 0.36
2010_GLHG_FT 703 MC 12 1 820 0.88 0.01 0.21 0.12 0.51 0.15 0.51 0.45
2010_GLHG_FT 703 MC 13 1 820 0.88 0.01 0.05 0.64 0.16 0.14 0.64 0.42
2010_GLHG_FT 703 MC 14 1 820 0.88 0.01 0.59 0.16 0.18 0.06 0.59 0.54
2010_GLHG_FT 703 MC 15 1 820 0.88 0.01 0.09 0.10 0.11 0.70 0.70 0.53
2010_GLHG_FT 703 MC 16 1 820 0.88 0.01 0.17 0.18 0.55 0.08 0.55 0.54
2010_GLHG_FT 703 MC 17 1 820 0.88 0.01 0.23 0.18 0.47 0.10 0.47 0.45
2010_GLHG_FT 703 MC 18 1 820 0.88 0.01 0.06 0.05 0.11 0.76 0.76 0.41
2010_GLHG_FT 703 MC 19 1 820 0.88 0.02 0.21 0.15 0.47 0.16 0.47 0.35
2010_GLHG_FT 703 MC 20 1 820 0.88 0.02 0.35 0.24 0.14 0.25 0.35 0.19
2010_GLHG_FT 703 MC 21 1 820 0.88 0.02 0.18 0.57 0.17 0.06 0.57 0.46
2010_GLHG_FT 703 MC 22 1 820 0.88 0.02 0.15 0.22 0.53 0.09 0.53 0.47
2010_GLHG_FT 703 MC 23 1 820 0.88 0.03 0.57 0.15 0.14 0.11 0.57 0.46
2010_GLHG_FT 703 MC 24 1 820 0.88 0.03 0.09 0.21 0.08 0.58 0.58 0.57
2010_GLHG_FT 703 MC 25 1 820 0.88 0.03 0.14 0.63 0.06 0.14 0.63 0.46
2010_GLHG_FT 703 MC 26 1 820 0.88 0.03 0.04 0.75 0.14 0.04 0.75 0.53
2010_GLHG_FT 703 MC 27 1 820 0.88 0.04 0.07 0.09 0.25 0.55 0.55 0.44

Prepared for NYSED by Pearson 28
Table 10. Classical Item Analysis (continued)
Test Form Type Item Max N-Count Alpha B M0 M1 M2 M3 M4 M5 M6 Mean Point-
Biserial
2010_GLHG_FT 703 MC 28 1 820 0.88 0.04 0.73 0.09 0.08 0.06 0.73 0.53
2010_GLHG_FT 703 MC 29 1 820 0.88 0.04 0.04 0.06 0.06 0.80 0.80 0.51
2010_GLHG_FT 703 MC 30 1 820 0.88 0.05 0.11 0.67 0.08 0.10 0.67 0.51
2010_GLHG_FT 703 MC 31 1 820 0.88 0.05 0.63 0.12 0.09 0.11 0.63 0.62
2010_GLHG_FT 703 MC 32 1 820 0.88 0.06 0.24 0.11 0.48 0.11 0.48 0.47
2010_GLHG_FT 704 MC 01 1 817 0.84 0.00 0.16 0.72 0.08 0.04 0.72 0.38
2010_GLHG_FT 704 MC 02 1 817 0.84 0.00 0.29 0.06 0.60 0.04 0.60 0.33
2010_GLHG_FT 704 MC 03 1 817 0.84 0.00 0.59 0.20 0.05 0.16 0.59 0.36
2010_GLHG_FT 704 MC 04 1 817 0.84 0.00 0.72 0.08 0.05 0.15 0.72 0.34
2010_GLHG_FT 704 MC 05 1 817 0.84 0.01 0.02 0.20 0.15 0.62 0.62 0.55
2010_GLHG_FT 704 MC 06 1 817 0.84 0.00 0.07 0.25 0.65 0.03 0.65 0.41
2010_GLHG_FT 704 MC 07 1 817 0.84 0.00 0.04 0.70 0.13 0.13 0.70 0.47
2010_GLHG_FT 704 MC 08 1 817 0.84 0.00 0.46 0.12 0.35 0.07 0.46 0.42
2010_GLHG_FT 704 MC 09 1 817 0.84 0.00 0.05 0.16 0.67 0.12 0.67 0.34
2010_GLHG_FT 704 MC 10 1 817 0.84 0.01 0.06 0.16 0.06 0.72 0.72 0.42
2010_GLHG_FT 704 MC 11 1 817 0.84 0.00 0.71 0.17 0.05 0.06 0.71 0.49
2010_GLHG_FT 704 MC 12 1 817 0.84 0.01 0.23 0.40 0.29 0.07 0.40 0.52
2010_GLHG_FT 704 MC 13 1 817 0.84 0.01 0.08 0.10 0.73 0.08 0.73 0.49
2010_GLHG_FT 704 MC 14 1 817 0.84 0.00 0.08 0.50 0.13 0.29 0.50 0.34
2010_GLHG_FT 704 MC 15 1 817 0.84 0.01 0.59 0.10 0.10 0.19 0.59 0.34
2010_GLHG_FT 704 MC 16 1 817 0.84 0.01 0.15 0.65 0.17 0.01 0.65 0.47
2010_GLHG_FT 704 MC 17 1 817 0.84 0.01 0.49 0.15 0.20 0.15 0.49 0.33
Prepared for NYSED by Pearson 29
Table 10. Classical Item Analysis (continued)
Test Form Type Item Max N-Count Alpha B M0 M1 M2 M3 M4 M5 M6 Mean Point-
Biserial
2010_GLHG_FT 704 MC 18 1 817 0.84 0.01 0.44 0.11 0.08 0.36 0.36 0.23
2010_GLHG_FT 704 MC 19 1 817 0.84 0.01 0.77 0.05 0.04 0.14 0.77 0.47
2010_GLHG_FT 704 MC 20 1 817 0.84 0.02 0.10 0.15 0.13 0.60 0.60 0.54
2010_GLHG_FT 704 MC 21 1 817 0.84 0.01 0.30 0.09 0.06 0.53 0.53 0.48
2010_GLHG_FT 704 MC 22 1 817 0.84 0.01 0.63 0.05 0.18 0.12 0.63 0.40
2010_GLHG_FT 704 MC 23 1 817 0.84 0.02 0.15 0.05 0.11 0.67 0.67 0.32
2010_GLHG_FT 704 MC 24 1 817 0.84 0.02 0.36 0.16 0.30 0.16 0.30 0.29
2010_GLHG_FT 704 MC 25 1 817 0.84 0.02 0.07 0.21 0.11 0.58 0.58 0.54
2010_GLHG_FT 704 MC 26 1 817 0.84 0.03 0.26 0.18 0.50 0.04 0.50 0.46
2010_GLHG_FT 704 MC 27 1 817 0.84 0.03 0.25 0.49 0.12 0.12 0.49 0.42
2010_GLHG_FT 704 MC 28 1 817 0.84 0.03 0.31 0.21 0.27 0.19 0.31 0.34
2010_GLHG_FT 704 MC 29 1 817 0.84 0.04 0.27 0.45 0.08 0.17 0.45 0.52
2010_GLHG_FT 704 MC 30 1 817 0.84 0.03 0.62 0.20 0.10 0.05 0.62 0.39
2010_GLHG_FT 704 MC 31 1 817 0.84 0.04 0.12 0.21 0.52 0.12 0.52 0.47
2010_GLHG_FT 704 MC 32 1 817 0.84 0.04 0.08 0.24 0.38 0.26 0.38 0.34
2010_GLHG_FT 705 MC 01 1 825 0.84 0.00 0.51 0.24 0.13 0.11 0.51 0.52
2010_GLHG_FT 705 MC 02 1 825 0.84 0.00 0.12 0.12 0.29 0.47 0.47 0.49
2010_GLHG_FT 705 MC 03 1 825 0.84 0.00 0.11 0.70 0.08 0.11 0.70 0.37
2010_GLHG_FT 705 MC 04 1 825 0.84 0.00 0.05 0.08 0.77 0.10 0.77 0.47
2010_GLHG_FT 705 MC 05 1 825 0.84 0.00 0.66 0.08 0.12 0.14 0.66 0.33
2010_GLHG_FT 705 MC 06 1 825 0.84 0.00 0.08 0.12 0.06 0.75 0.75 0.49
2010_GLHG_FT 705 MC 07 1 825 0.84 0.00 0.15 0.07 0.69 0.08 0.69 0.46
Prepared for NYSED by Pearson 30
Table 10. Classical Item Analysis (continued)
Test Form Type Item Max N-Count Alpha B M0 M1 M2 M3 M4 M5 M6 Mean Point-
Biserial
2010_GLHG_FT 705 MC 08 1 825 0.84 0.01 0.14 0.18 0.47 0.20 0.47 0.35
2010_GLHG_FT 705 MC 09 1 825 0.84 0.01 0.22 0.13 0.17 0.48 0.48 0.35
2010_GLHG_FT 705 MC 10 1 825 0.84 0.01 0.10 0.08 0.60 0.21 0.60 0.45
2010_GLHG_FT 705 MC 11 1 825 0.84 0.01 0.29 0.13 0.39 0.17 0.39 0.23
2010_GLHG_FT 705 MC 12 1 825 0.84 0.01 0.16 0.60 0.09 0.14 0.60 0.36
2010_GLHG_FT 705 MC 13 1 825 0.84 0.01 0.39 0.22 0.25 0.13 0.39 0.33
2010_GLHG_FT 705 MC 14 1 825 0.84 0.01 0.51 0.31 0.10 0.07 0.51 0.28
2010_GLHG_FT 705 MC 15 1 825 0.84 0.01 0.16 0.65 0.07 0.11 0.65 0.45
2010_GLHG_FT 705 MC 16 1 825 0.84 0.02 0.44 0.36 0.12 0.07 0.44 0.37
2010_GLHG_FT 705 MC 17 1 825 0.84 0.02 0.21 0.15 0.15 0.48 0.48 0.44
2010_GLHG_FT 705 MC 18 1 825 0.84 0.02 0.67 0.09 0.11 0.12 0.67 0.47
2010_GLHG_FT 705 MC 19 1 825 0.84 0.02 0.09 0.64 0.14 0.10 0.64 0.54
2010_GLHG_FT 705 MC 20 1 825 0.84 0.03 0.08 0.20 0.15 0.55 0.55 0.48
2010_GLHG_FT 705 MC 21 1 825 0.84 0.03 0.44 0.19 0.13 0.21 0.44 0.34
2010_GLHG_FT 705 MC 22 1 825 0.84 0.02 0.06 0.06 0.22 0.64 0.22 0.08
2010_GLHG_FT 705 MC 23 1 825 0.84 0.03 0.08 0.74 0.08 0.08 0.74 0.47
2010_GLHG_FT 705 MC 24 1 825 0.84 0.04 0.47 0.12 0.16 0.22 0.47 0.44
2010_GLHG_FT 705 MC 25 1 825 0.84 0.04 0.04 0.05 0.09 0.77 0.77 0.58
2010_GLHG_FT 705 MC 26 1 825 0.84 0.04 0.06 0.63 0.19 0.07 0.63 0.47
2010_GLHG_FT 705 MC 27 1 825 0.84 0.04 0.14 0.15 0.61 0.06 0.61 0.35
2010_GLHG_FT 705 MC 28 1 825 0.84 0.04 0.11 0.15 0.64 0.05 0.64 0.52
2010_GLHG_FT 705 MC 29 1 825 0.84 0.05 0.28 0.31 0.17 0.19 0.31 0.19
2010_GLHG_FT 705 MC 30 1 825 0.84 0.05 0.18 0.09 0.57 0.10 0.57 0.39

Prepared for NYSED by Pearson 31
Table 10. Classical Item Analysis (continued)
Test Form Type Item Max N-Count Alpha B M0 M1 M2 M3 M4 M5 M6 Mean Point-
Biserial
2010_GLHG_FT 705 MC 31 1 825 0.84 0.06 0.14 0.21 0.05 0.54 0.54 0.50
2010_GLHG_FT 705 MC 32 1 825 0.84 0.07 0.07 0.32 0.36 0.19 0.36 0.46
2010_GLHG_FT 706 MC 01 1 829 0.86 0.00 0.17 0.05 0.70 0.08 0.70 0.45
2010_GLHG_FT 706 MC 02 1 829 0.86 0.00 0.27 0.05 0.08 0.60 0.60 0.46
2010_GLHG_FT 706 MC 03 1 829 0.86 0.00 0.08 0.03 0.55 0.34 0.55 0.44
2010_GLHG_FT 706 MC 04 1 829 0.86 0.00 0.14 0.75 0.07 0.04 0.75 0.46
2010_GLHG_FT 706 MC 05 1 829 0.86 0.00 0.12 0.04 0.05 0.79 0.79 0.45
2010_GLHG_FT 706 MC 06 1 829 0.86 0.00 0.12 0.78 0.05 0.05 0.78 0.41
2010_GLHG_FT 706 MC 07 1 829 0.86 0.00 0.72 0.08 0.15 0.04 0.72 0.40
2010_GLHG_FT 706 MC 08 1 829 0.86 0.00 0.17 0.72 0.07 0.04 0.72 0.50
2010_GLHG_FT 706 MC 09 1 829 0.86 0.00 0.45 0.26 0.22 0.06 0.45 0.36
2010_GLHG_FT 706 MC 10 1 829 0.86 0.00 0.08 0.17 0.70 0.04 0.70 0.27
2010_GLHG_FT 706 MC 11 1 829 0.86 0.00 0.61 0.09 0.21 0.09 0.61 0.55
2010_GLHG_FT 706 MC 12 1 829 0.86 0.00 0.12 0.67 0.14 0.07 0.67 0.37
2010_GLHG_FT 706 MC 13 1 829 0.86 0.01 0.75 0.11 0.03 0.10 0.75 0.27
2010_GLHG_FT 706 MC 14 1 829 0.86 0.00 0.07 0.06 0.08 0.79 0.79 0.51
2010_GLHG_FT 706 MC 15 1 829 0.86 0.01 0.26 0.11 0.21 0.41 0.41 0.36
2010_GLHG_FT 706 MC 16 1 829 0.86 0.01 0.65 0.10 0.19 0.05 0.65 0.43
2010_GLHG_FT 706 MC 17 1 829 0.86 0.01 0.06 0.15 0.62 0.16 0.62 0.42
2010_GLHG_FT 706 MC 18 1 829 0.86 0.01 0.12 0.10 0.05 0.71 0.71 0.51
2010_GLHG_FT 706 MC 19 1 829 0.86 0.01 0.10 0.08 0.78 0.04 0.78 0.55
2010_GLHG_FT 706 MC 20 1 829 0.86 0.01 0.68 0.14 0.11 0.06 0.68 0.53

Prepared for NYSED by Pearson 32
Table 10. Classical Item Analysis (continued)
Test Form Type Item Max N-Count Alpha B M0 M1 M2 M3 M4 M5 M6 Mean Point-
Biserial
2010_GLHG_FT 706 MC 21 1 829 0.86 0.01 0.38 0.55 0.03 0.03 0.55 0.47
2010_GLHG_FT 706 MC 22 1 829 0.86 0.01 0.31 0.14 0.12 0.42 0.42 0.40
2010_GLHG_FT 706 MC 23 1 829 0.86 0.01 0.08 0.10 0.73 0.07 0.73 0.46
2010_GLHG_FT 706 MC 24 1 829 0.86 0.01 0.61 0.18 0.10 0.10 0.61 0.52
2010_GLHG_FT 706 MC 25 1 829 0.86 0.02 0.22 0.47 0.22 0.08 0.47 0.38
2010_GLHG_FT 706 MC 26 1 829 0.86 0.02 0.56 0.10 0.20 0.12 0.56 0.45
2010_GLHG_FT 706 MC 27 1 829 0.86 0.02 0.13 0.09 0.68 0.08 0.68 0.48
2010_GLHG_FT 706 MC 28 1 829 0.86 0.02 0.21 0.60 0.11 0.06 0.60 0.36
2010_GLHG_FT 706 MC 29 1 829 0.86 0.02 0.54 0.29 0.10 0.06 0.54 0.50
2010_GLHG_FT 706 MC 30 1 829 0.86 0.03 0.05 0.20 0.05 0.66 0.66 0.44
2010_GLHG_FT 706 MC 31 1 829 0.86 0.03 0.61 0.06 0.26 0.04 0.61 0.37
2010_GLHG_FT 706 MC 32 1 829 0.86 0.04 0.16 0.13 0.44 0.22 0.44 0.40
2010_GLHG_FT 707 MC 01 1 819 0.89 0.00 0.26 0.10 0.05 0.58 0.58 0.44
2010_GLHG_FT 707 MC 02 1 819 0.89 0.00 0.23 0.07 0.53 0.16 0.53 0.46
2010_GLHG_FT 707 MC 03 1 819 0.89 0.00 0.77 0.05 0.07 0.10 0.77 0.56
2010_GLHG_FT 707 MC 04 1 819 0.89 0.00 0.12 0.70 0.08 0.09 0.70 0.45
2010_GLHG_FT 707 MC 05 1 819 0.89 0.00 0.56 0.05 0.30 0.09 0.56 0.31
2010_GLHG_FT 707 MC 06 1 819 0.89 0.00 0.14 0.51 0.20 0.15 0.51 0.47
2010_GLHG_FT 707 MC 07 1 819 0.89 0.01 0.16 0.15 0.04 0.65 0.65 0.59
2010_GLHG_FT 707 MC 08 1 819 0.89 0.00 0.76 0.11 0.09 0.05 0.76 0.41
2010_GLHG_FT 707 MC 09 1 819 0.89 0.01 0.13 0.77 0.08 0.02 0.77 0.45
2010_GLHG_FT 707 MC 10 1 819 0.89 0.01 0.06 0.31 0.55 0.07 0.55 0.45

Prepared for NYSED by Pearson 33
Table 10. Classical Item Analysis (continued)
Test Form Type Item Max N-Count Alpha B M0 M1 M2 M3 M4 M5 M6 Mean Point-
Biserial
2010_GLHG_FT 707 MC 11 1 819 0.89 0.01 0.08 0.10 0.72 0.09 0.72 0.54
2010_GLHG_FT 707 MC 12 1 819 0.89 0.00 0.07 0.74 0.07 0.11 0.74 0.54
2010_GLHG_FT 707 MC 13 1 819 0.89 0.00 0.15 0.69 0.12 0.04 0.69 0.44
2010_GLHG_FT 707 MC 14 1 819 0.89 0.01 0.07 0.06 0.16 0.69 0.69 0.53
2010_GLHG_FT 707 MC 15 1 819 0.89 0.02 0.11 0.59 0.18 0.10 0.59 0.41
2010_GLHG_FT 707 MC 16 1 819 0.89 0.01 0.10 0.31 0.48 0.10 0.48 0.43
2010_GLHG_FT 707 MC 17 1 819 0.89 0.01 0.26 0.26 0.07 0.40 0.40 0.42
2010_GLHG_FT 707 MC 18 1 819 0.89 0.02 0.05 0.11 0.78 0.05 0.78 0.47
2010_GLHG_FT 707 MC 19 1 819 0.89 0.03 0.34 0.26 0.14 0.23 0.34 0.27
2010_GLHG_FT 707 MC 20 1 819 0.89 0.02 0.12 0.66 0.08 0.12 0.66 0.45
2010_GLHG_FT 707 MC 21 1 819 0.89 0.02 0.16 0.22 0.16 0.44 0.44 0.48
2010_GLHG_FT 707 MC 22 1 819 0.89 0.02 0.52 0.06 0.28 0.11 0.52 0.55
2010_GLHG_FT 707 MC 23 1 819 0.89 0.03 0.09 0.61 0.07 0.20 0.61 0.53
2010_GLHG_FT 707 MC 24 1 819 0.89 0.03 0.11 0.06 0.66 0.14 0.66 0.50
2010_GLHG_FT 707 MC 25 1 819 0.89 0.03 0.13 0.11 0.65 0.08 0.65 0.51
2010_GLHG_FT 707 MC 26 1 819 0.89 0.04 0.65 0.11 0.13 0.07 0.65 0.59
2010_GLHG_FT 707 MC 27 1 819 0.89 0.04 0.06 0.07 0.11 0.72 0.72 0.60
2010_GLHG_FT 707 MC 28 1 819 0.89 0.05 0.24 0.45 0.15 0.12 0.45 0.47
2010_GLHG_FT 707 MC 29 1 819 0.89 0.05 0.16 0.11 0.21 0.46 0.46 0.54
2010_GLHG_FT 707 MC 30 1 819 0.89 0.05 0.11 0.12 0.17 0.55 0.55 0.55
2010_GLHG_FT 707 MC 31 1 819 0.89 0.06 0.12 0.28 0.37 0.16 0.37 0.37
2010_GLHG_FT 707 MC 32 1 819 0.89 0.09 0.08 0.60 0.20 0.04 0.60 0.45

Prepared for NYSED by Pearson 34
Table 10. Classical Item Analysis (continued)
Test Form Type Item Max N-Count Alpha B M0 M1 M2 M3 M4 M5 M6 Mean Point-
Biserial
2010_GLHG_FT 708 MC 01 1 824 0.89 0.00 0.02 0.86 0.08 0.03 0.86 0.36
2010_GLHG_FT 708 MC 02 1 824 0.89 0.00 0.09 0.06 0.09 0.76 0.76 0.57
2010_GLHG_FT 708 MC 03 1 824 0.89 0.01 0.05 0.11 0.80 0.03 0.80 0.40
2010_GLHG_FT 708 MC 04 1 824 0.89 0.00 0.05 0.64 0.03 0.27 0.64 0.49
2010_GLHG_FT 708 MC 05 1 824 0.89 0.01 0.17 0.43 0.15 0.25 0.43 0.43
2010_GLHG_FT 708 MC 06 1 824 0.89 0.00 0.29 0.06 0.55 0.10 0.55 0.41
2010_GLHG_FT 708 MC 07 1 824 0.89 0.01 0.03 0.69 0.23 0.05 0.69 0.50
2010_GLHG_FT 708 MC 08 1 824 0.89 0.00 0.66 0.06 0.08 0.19 0.66 0.43
2010_GLHG_FT 708 MC 09 1 824 0.89 0.00 0.19 0.58 0.18 0.04 0.58 0.41
2010_GLHG_FT 708 MC 10 1 824 0.89 0.01 0.49 0.20 0.21 0.08 0.49 0.40
2010_GLHG_FT 708 MC 11 1 824 0.89 0.00 0.08 0.07 0.05 0.80 0.80 0.46
2010_GLHG_FT 708 MC 12 1 824 0.89 0.00 0.05 0.18 0.10 0.66 0.66 0.49
2010_GLHG_FT 708 MC 13 1 824 0.89 0.01 0.61 0.14 0.13 0.11 0.61 0.43
2010_GLHG_FT 708 MC 14 1 824 0.89 0.01 0.08 0.06 0.63 0.22 0.63 0.48
2010_GLHG_FT 708 MC 15 1 824 0.89 0.01 0.12 0.11 0.68 0.08 0.68 0.49
2010_GLHG_FT 708 MC 16 1 824 0.89 0.01 0.15 0.66 0.05 0.13 0.66 0.43
2010_GLHG_FT 708 MC 17 1 824 0.89 0.01 0.16 0.16 0.48 0.18 0.48 0.38
2010_GLHG_FT 708 MC 18 1 824 0.89 0.01 0.67 0.11 0.10 0.10 0.67 0.41
2010_GLHG_FT 708 MC 19 1 824 0.89 0.02 0.06 0.25 0.58 0.10 0.58 0.49
2010_GLHG_FT 708 MC 20 1 824 0.89 0.02 0.09 0.15 0.13 0.61 0.61 0.50
2010_GLHG_FT 708 MC 21 1 824 0.89 0.03 0.19 0.19 0.18 0.41 0.41 0.36
2010_GLHG_FT 708 MC 22 1 824 0.89 0.03 0.60 0.18 0.12 0.07 0.60 0.50
2010_GLHG_FT 708 MC 23 1 824 0.89 0.03 0.20 0.63 0.07 0.07 0.63 0.59
Prepared for NYSED by Pearson 35
Table 10. Classical Item Analysis (continued)
Test Form Type Item Max N-Count Alpha B M0 M1 M2 M3 M4 M5 M6 Mean Point-
Biserial
2010_GLHG_FT 708 MC 24 1 824 0.89 0.03 0.09 0.15 0.11 0.62 0.62 0.54
2010_GLHG_FT 708 MC 25 1 824 0.89 0.03 0.13 0.07 0.69 0.08 0.69 0.61
2010_GLHG_FT 708 MC 26 1 824 0.89 0.04 0.13 0.13 0.16 0.54 0.54 0.53
2010_GLHG_FT 708 MC 27 1 824 0.89 0.04 0.21 0.20 0.08 0.47 0.47 0.51
2010_GLHG_FT 708 MC 28 1 824 0.89 0.04 0.53 0.23 0.14 0.04 0.53 0.58
2010_GLHG_FT 708 MC 29 1 824 0.89 0.04 0.16 0.49 0.17 0.13 0.49 0.51
2010_GLHG_FT 708 MC 30 1 824 0.89 0.06 0.21 0.09 0.24 0.40 0.40 0.53
2010_GLHG_FT 708 MC 31 1 824 0.89 0.06 0.14 0.07 0.04 0.69 0.69 0.54
2010_GLHG_FT 708 MC 32 1 824 0.89 0.07 0.08 0.10 0.60 0.15 0.60 0.40
2010_GLHG_FT 709 MC 01 1 820 0.87 0.01 0.19 0.52 0.13 0.15 0.52 0.45
2010_GLHG_FT 709 MC 02 1 820 0.87 0.01 0.14 0.52 0.25 0.08 0.52 0.41
2010_GLHG_FT 709 MC 03 1 820 0.87 0.01 0.62 0.17 0.12 0.08 0.62 0.54
2010_GLHG_FT 709 MC 04 1 820 0.87 0.00 0.10 0.24 0.49 0.16 0.49 0.47
2010_GLHG_FT 709 MC 05 1 820 0.87 0.00 0.64 0.15 0.09 0.12 0.64 0.40
2010_GLHG_FT 709 MC 06 1 820 0.87 0.01 0.14 0.10 0.14 0.62 0.62 0.47
2010_GLHG_FT 709 MC 07 1 820 0.87 0.00 0.71 0.16 0.07 0.05 0.71 0.58
2010_GLHG_FT 709 MC 08 1 820 0.87 0.01 0.13 0.04 0.11 0.71 0.71 0.45
2010_GLHG_FT 709 MC 09 1 820 0.87 0.01 0.52 0.11 0.11 0.25 0.52 0.27
2010_GLHG_FT 709 MC 10 1 820 0.87 0.01 0.03 0.04 0.83 0.10 0.83 0.43
2010_GLHG_FT 709 MC 11 1 820 0.87 0.01 0.11 0.69 0.06 0.13 0.69 0.45
2010_GLHG_FT 709 MC 12 1 820 0.87 0.01 0.49 0.22 0.10 0.17 0.49 0.40
2010_GLHG_FT 709 MC 13 1 820 0.87 0.02 0.08 0.72 0.10 0.08 0.72 0.49

Prepared for NYSED by Pearson 36
Table 10. Classical Item Analysis (continued)
Test Form Type Item Max N-Count Alpha B M0 M1 M2 M3 M4 M5 M6 Mean Point-
Biserial
2010_GLHG_FT 709 MC 14 1 820 0.87 0.02 0.07 0.13 0.67 0.11 0.67 0.44
2010_GLHG_FT 709 MC 15 1 820 0.87 0.02 0.23 0.57 0.14 0.05 0.57 0.47
2010_GLHG_FT 709 MC 16 1 820 0.87 0.02 0.08 0.08 0.80 0.02 0.80 0.45
2010_GLHG_FT 709 MC 17 1 820 0.87 0.02 0.05 0.05 0.07 0.81 0.81 0.47
2010_GLHG_FT 709 MC 18 1 820 0.87 0.02 0.42 0.16 0.21 0.19 0.42 0.29
2010_GLHG_FT 709 MC 19 1 820 0.87 0.02 0.13 0.68 0.04 0.12 0.68 0.46
2010_GLHG_FT 709 MC 20 1 820 0.87 0.03 0.60 0.07 0.05 0.26 0.60 0.38
2010_GLHG_FT 709 MC 21 1 820 0.87 0.03 0.11 0.70 0.10 0.05 0.70 0.48
2010_GLHG_FT 709 MC 22 1 820 0.87 0.03 0.53 0.17 0.22 0.05 0.53 0.34
2010_GLHG_FT 709 MC 23 1 820 0.87 0.03 0.11 0.19 0.14 0.53 0.53 0.43
2010_GLHG_FT 709 MC 24 1 820 0.87 0.03 0.08 0.06 0.12 0.70 0.70 0.56
2010_GLHG_FT 709 MC 25 1 820 0.87 0.03 0.53 0.05 0.11 0.27 0.53 0.56
2010_GLHG_FT 709 MC 26 1 820 0.87 0.04 0.15 0.10 0.18 0.54 0.54 0.45
2010_GLHG_FT 709 MC 27 1 820 0.87 0.05 0.11 0.63 0.17 0.05 0.63 0.55
2010_GLHG_FT 709 MC 28 1 820 0.87 0.04 0.08 0.06 0.70 0.12 0.70 0.40
2010_GLHG_FT 709 MC 29 1 820 0.87 0.05 0.17 0.47 0.25 0.07 0.47 0.31
2010_GLHG_FT 709 MC 30 1 820 0.87 0.06 0.14 0.11 0.48 0.21 0.48 0.42
2010_GLHG_FT 709 MC 31 1 820 0.87 0.06 0.13 0.21 0.49 0.12 0.49 0.50
2010_GLHG_FT 709 MC 32 1 820 0.87 0.06 0.07 0.71 0.10 0.06 0.71 0.58
2010_GLHG_FT 710 MC 01 1 809 0.90 0.00 0.08 0.17 0.15 0.60 0.60 0.36
2010_GLHG_FT 710 MC 02 1 809 0.90 0.00 0.07 0.63 0.07 0.23 0.63 0.55
2010_GLHG_FT 710 MC 03 1 809 0.90 0.00 0.03 0.11 0.05 0.80 0.80 0.50

Prepared for NYSED by Pearson 37
Table 10. Classical Item Analysis (continued)
Test Form Type Item Max N-Count Alpha B M0 M1 M2 M3 M4 M5 M6 Mean Point-
Biserial
2010_GLHG_FT 710 MC 04 1 809 0.90 0.00 0.04 0.17 0.03 0.77 0.77 0.49
2010_GLHG_FT 710 MC 05 1 809 0.90 0.00 0.82 0.12 0.03 0.02 0.82 0.47
2010_GLHG_FT 710 MC 06 1 809 0.90 0.01 0.14 0.77 0.05 0.04 0.77 0.56
2010_GLHG_FT 710 MC 07 1 809 0.90 0.01 0.12 0.15 0.70 0.02 0.70 0.41
2010_GLHG_FT 710 MC 08 1 809 0.90 0.01 0.10 0.21 0.55 0.13 0.55 0.46
2010_GLHG_FT 710 MC 09 1 809 0.90 0.01 0.05 0.63 0.20 0.10 0.63 0.50
2010_GLHG_FT 710 MC 10 1 809 0.90 0.01 0.67 0.13 0.05 0.13 0.67 0.58
2010_GLHG_FT 710 MC 11 1 809 0.90 0.01 0.13 0.78 0.03 0.05 0.78 0.37
2010_GLHG_FT 710 MC 12 1 809 0.90 0.01 0.01 0.09 0.85 0.04 0.85 0.40
2010_GLHG_FT 710 MC 13 1 809 0.90 0.02 0.24 0.64 0.04 0.07 0.64 0.52
2010_GLHG_FT 710 MC 14 1 809 0.90 0.01 0.83 0.05 0.09 0.01 0.83 0.50
2010_GLHG_FT 710 MC 15 1 809 0.90 0.02 0.14 0.14 0.21 0.49 0.49 0.45
2010_GLHG_FT 710 MC 16 1 809 0.90 0.02 0.13 0.62 0.17 0.07 0.62 0.48
2010_GLHG_FT 710 MC 17 1 809 0.90 0.02 0.42 0.22 0.20 0.14 0.42 0.36
2010_GLHG_FT 710 MC 18 1 809 0.90 0.02 0.05 0.08 0.75 0.10 0.75 0.49
2010_GLHG_FT 710 MC 19 1 809 0.90 0.02 0.12 0.74 0.05 0.07 0.74 0.46
2010_GLHG_FT 710 MC 20 1 809 0.90 0.02 0.07 0.06 0.08 0.76 0.76 0.55
2010_GLHG_FT 710 MC 21 1 809 0.90 0.03 0.21 0.14 0.59 0.03 0.59 0.36
2010_GLHG_FT 710 MC 22 1 809 0.90 0.03 0.17 0.56 0.11 0.12 0.56 0.54
2010_GLHG_FT 710 MC 23 1 809 0.90 0.03 0.74 0.05 0.08 0.11 0.74 0.51
2010_GLHG_FT 710 MC 24 1 809 0.90 0.03 0.11 0.08 0.63 0.15 0.63 0.58
2010_GLHG_FT 710 MC 25 1 809 0.90 0.03 0.05 0.04 0.08 0.80 0.80 0.52
2010_GLHG_FT 710 MC 26 1 809 0.90 0.04 0.08 0.75 0.09 0.04 0.75 0.50
Prepared for NYSED by Pearson 38
Table 10. Classical Item Analysis (continued)
Test Form Type Item Max N-Count Alpha B M0 M1 M2 M3 M4 M5 M6 Mean Point-
Biserial
2010_GLHG_FT 710 MC 27 1 809 0.90 0.04 0.62 0.15 0.10 0.09 0.62 0.53
2010_GLHG_FT 710 MC 28 1 809 0.90 0.04 0.12 0.07 0.70 0.06 0.70 0.48
2010_GLHG_FT 710 MC 29 1 809 0.90 0.04 0.63 0.08 0.18 0.07 0.63 0.56
2010_GLHG_FT 710 MC 30 1 809 0.90 0.04 0.21 0.54 0.10 0.11 0.54 0.53
2010_GLHG_FT 710 MC 31 1 809 0.90 0.05 0.13 0.21 0.10 0.50 0.50 0.58
2010_GLHG_FT 710 MC 32 1 809 0.90 0.06 0.15 0.04 0.71 0.04 0.71 0.45
2010_GLHG_FT 711 MC 01 1 811 0.90 0.00 0.61 0.06 0.16 0.18 0.61 0.45
2010_GLHG_FT 711 MC 02 1 811 0.90 0.00 0.61 0.24 0.05 0.10 0.61 0.27
2010_GLHG_FT 711 MC 03 1 811 0.90 0.00 0.13 0.61 0.10 0.16 0.61 0.54
2010_GLHG_FT 711 MC 04 1 811 0.90 0.00 0.09 0.10 0.05 0.75 0.75 0.50
2010_GLHG_FT 711 MC 05 1 811 0.90 0.00 0.11 0.67 0.16 0.06 0.67 0.55
2010_GLHG_FT 711 MC 06 1 811 0.90 0.00 0.03 0.65 0.14 0.18 0.65 0.36
2010_GLHG_FT 711 MC 07 1 811 0.90 0.01 0.07 0.29 0.03 0.61 0.61 0.34
2010_GLHG_FT 711 MC 08 1 811 0.90 0.01 0.13 0.68 0.13 0.05 0.68 0.49
2010_GLHG_FT 711 MC 09 1 811 0.90 0.01 0.09 0.05 0.16 0.69 0.69 0.43
2010_GLHG_FT 711 MC 10 1 811 0.90 0.01 0.06 0.18 0.63 0.12 0.63 0.44
2010_GLHG_FT 711 MC 11 1 811 0.90 0.01 0.13 0.78 0.04 0.04 0.78 0.42
2010_GLHG_FT 711 MC 12 1 811 0.90 0.01 0.12 0.17 0.17 0.52 0.52 0.50
2010_GLHG_FT 711 MC 13 1 811 0.90 0.01 0.27 0.13 0.05 0.54 0.54 0.61
2010_GLHG_FT 711 MC 14 1 811 0.90 0.01 0.57 0.18 0.18 0.06 0.57 0.41
2010_GLHG_FT 711 MC 15 1 811 0.90 0.01 0.03 0.09 0.76 0.10 0.76 0.48
2010_GLHG_FT 711 MC 16 1 811 0.90 0.02 0.05 0.07 0.71 0.16 0.71 0.49

Prepared for NYSED by Pearson 39
Table 10. Classical Item Analysis (continued)
Test Form Type Item Max N-Count Alpha B M0 M1 M2 M3 M4 M5 M6 Mean Point-
Biserial
2010_GLHG_FT 711 MC 17 1 811 0.90 0.03 0.07 0.12 0.64 0.14 0.64 0.44
2010_GLHG_FT 711 MC 18 1 811 0.90 0.03 0.16 0.11 0.16 0.55 0.55 0.52
2010_GLHG_FT 711 MC 19 1 811 0.90 0.03 0.39 0.37 0.15 0.06 0.37 0.27
2010_GLHG_FT 711 MC 20 1 811 0.90 0.03 0.05 0.05 0.83 0.03 0.83 0.51
2010_GLHG_FT 711 MC 21 1 811 0.90 0.04 0.64 0.18 0.09 0.06 0.64 0.62
2010_GLHG_FT 711 MC 22 1 811 0.90 0.04 0.07 0.30 0.55 0.05 0.55 0.40
2010_GLHG_FT 711 MC 23 1 811 0.90 0.04 0.65 0.11 0.09 0.11 0.65 0.62
2010_GLHG_FT 711 MC 24 1 811 0.90 0.04 0.08 0.63 0.19 0.06 0.63 0.52
2010_GLHG_FT 711 MC 25 1 811 0.90 0.04 0.17 0.63 0.10 0.06 0.63 0.56
2010_GLHG_FT 711 MC 26 1 811 0.90 0.05 0.15 0.09 0.08 0.63 0.63 0.62
2010_GLHG_FT 711 MC 27 1 811 0.90 0.05 0.15 0.13 0.60 0.07 0.60 0.60
2010_GLHG_FT 711 MC 28 1 811 0.90 0.05 0.04 0.07 0.04 0.79 0.79 0.63
2010_GLHG_FT 711 MC 29 1 811 0.90 0.05 0.15 0.72 0.05 0.03 0.72 0.53
2010_GLHG_FT 711 MC 30 1 811 0.90 0.05 0.16 0.11 0.09 0.59 0.59 0.55
2010_GLHG_FT 711 MC 31 1 811 0.90 0.07 0.57 0.18 0.11 0.07 0.57 0.61
2010_GLHG_FT 711 MC 32 1 811 0.90 0.08 0.50 0.11 0.14 0.18 0.50 0.44
2010_GLHG_FT 712 CR THM 5 1976 0.86 0.23 0.16 0.37 0.19 0.06 0.00 0.00 0.92 0.54
2010_GLHG_FT 713 CR THM 5 1964 0.86 0.20 0.24 0.37 0.16 0.03 0.00 0.00 0.78 0.57
2010_GLHG_FT 714 CR THM 5 1994 0.86 0.23 0.38 0.31 0.08 0.01 0.00 0.00 0.48 0.53
2010_GLHG_FT 715 CR THM 5 1975 0.86 0.21 0.25 0.38 0.15 0.01 0.00 0.00 0.71 0.55
2010_GLHG_FT 716 CR 01 1 1860 0.89 0.09 0.09 0.82 0.82 0.50
2010_GLHG_FT 716 CR 02 2 1860 0.89 0.10 0.03 0.15 0.72 1.59 0.59
Prepared for NYSED by Pearson 40
Table 10. Classical Item Analysis (continued)
Test Form Type Item Max N-Count Alpha B M0 M1 M2 M3 M4 M5 M6 Mean Point-
Biserial
2010_GLHG_FT 716 CR 03 2 1860 0.89 0.11 0.22 0.34 0.33 0.99 0.56
2010_GLHG_FT 716 CR 04 2 1860 0.89 0.11 0.02 0.11 0.76 1.63 0.59
2010_GLHG_FT 716 CR 05 1 1860 0.89 0.12 0.10 0.78 0.78 0.54
2010_GLHG_FT 716 CR 06 1 1860 0.89 0.13 0.16 0.71 0.71 0.63
2010_GLHG_FT 716 CR 07 1 1860 0.89 0.14 0.10 0.76 0.76 0.57
2010_GLHG_FT 716 CR 08 2 1860 0.89 0.16 0.08 0.20 0.56 1.33 0.64
2010_GLHG_FT 716 CR 09 1 1860 0.89 0.16 0.07 0.77 0.77 0.57
2010_GLHG_FT 716 CR DBQ 5 1860 0.89 0.08 0.20 0.26 0.38 0.07 0.00 0.00 1.24 0.64
2010_GLHG_FT 717 CR 01 1 1849 0.89 0.09 0.10 0.80 0.80 0.48
2010_GLHG_FT 717 CR 02 2 1849 0.89 0.12 0.08 0.23 0.57 1.38 0.54
2010_GLHG_FT 717 CR 3a 1 1849 0.89 0.11 0.10 0.78 0.78 0.50
2010_GLHG_FT 717 CR 3b 1 1849 0.89 0.11 0.03 0.85 0.85 0.61
2010_GLHG_FT 717 CR 04 1 1849 0.89 0.12 0.04 0.83 0.83 0.60
2010_GLHG_FT 717 CR 05 2 1849 0.89 0.14 0.02 0.08 0.76 1.60 0.59
2010_GLHG_FT 717 CR 06 1 1849 0.89 0.14 0.17 0.69 0.69 0.48
2010_GLHG_FT 717 CR 07 1 1849 0.89 0.15 0.06 0.79 0.79 0.65
2010_GLHG_FT 717 CR 8a 1 1849 0.89 0.16 0.10 0.74 0.74 0.60
2010_GLHG_FT 717 CR 8b 1 1849 0.89 0.16 0.16 0.68 0.68 0.51
2010_GLHG_FT 717 CR 09 1 1849 0.89 0.19 0.21 0.60 0.60 0.55
2010_GLHG_FT 717 CR DBQ 5 1849 0.89 0.09 0.25 0.29 0.33 0.04 0.00 0.00 1.06 0.60
2010_GLHG_FT 718 CR 01 1 1824 0.90 0.10 0.18 0.73 0.73 0.44
2010_GLHG_FT 718 CR 02 1 1824 0.90 0.11 0.12 0.78 0.78 0.49

Prepared for NYSED by Pearson 41
Table 10. Classical Item Analysis (continued)
Test Form Type Item Max N-Count Alpha B M0 M1 M2 M3 M4 M5 M6 Mean Point-
Biserial
2010_GLHG_FT 718 CR 03 1 1824 0.90 0.13 0.32 0.55 0.55 0.52
2010_GLHG_FT 718 CR 04 2 1824 0.90 0.12 0.05 0.18 0.65 1.49 0.57
2010_GLHG_FT 718 CR 05 1 1824 0.90 0.15 0.11 0.74 0.74 0.61
2010_GLHG_FT 718 CR 06 1 1824 0.90 0.16 0.22 0.62 0.62 0.54
2010_GLHG_FT 718 CR 07 1 1824 0.90 0.17 0.06 0.77 0.77 0.63
2010_GLHG_FT 718 CR 8a 1 1824 0.90 0.17 0.09 0.74 0.74 0.61
2010_GLHG_FT 718 CR 8b 1 1824 0.90 0.17 0.05 0.78 0.78 0.58
2010_GLHG_FT 718 CR 09 1 1824 0.90 0.20 0.12 0.68 0.68 0.58
2010_GLHG_FT 718 CR DBQ 5 1824 0.90 0.09 0.23 0.36 0.28 0.04 0.00 0.00 1.03 0.65
2010_GLHG_FT 719 CR 01 1 1835 0.89 0.09 0.12 0.78 0.78 0.52
2010_GLHG_FT 719 CR 2a 1 1835 0.89 0.11 0.11 0.78 0.78 0.52
2010_GLHG_FT 719 CR 2b 1 1835 0.89 0.10 0.03 0.87 0.87 0.58
2010_GLHG_FT 719 CR 03 1 1835 0.89 0.11 0.06 0.83 0.83 0.51
2010_GLHG_FT 719 CR 04 2 1835 0.89 0.13 0.11 0.21 0.55 1.31 0.61
2010_GLHG_FT 719 CR 05 1 1835 0.89 0.14 0.10 0.76 0.76 0.55
2010_GLHG_FT 719 CR 06 1 1835 0.89 0.15 0.13 0.72 0.72 0.51
2010_GLHG_FT 719 CR 07 1 1835 0.89 0.17 0.30 0.53 0.53 0.48
2010_GLHG_FT 719 CR 08 1 1835 0.89 0.15 0.14 0.71 0.71 0.59
2010_GLHG_FT 719 CR 9a 1 1835 0.89 0.16 0.18 0.66 0.66 0.48
2010_GLHG_FT 719 CR 9b 1 1835 0.89 0.17 0.10 0.73 0.73 0.56
2010_GLHG_FT 719 CR DBQ 5 1835 0.89 0.10 0.25 0.35 0.26 0.04 0.00 0.00 0.99 0.64
Prepared for NYSED by Pearson 42
Appendix B: Partial Credit Model Item Analysis
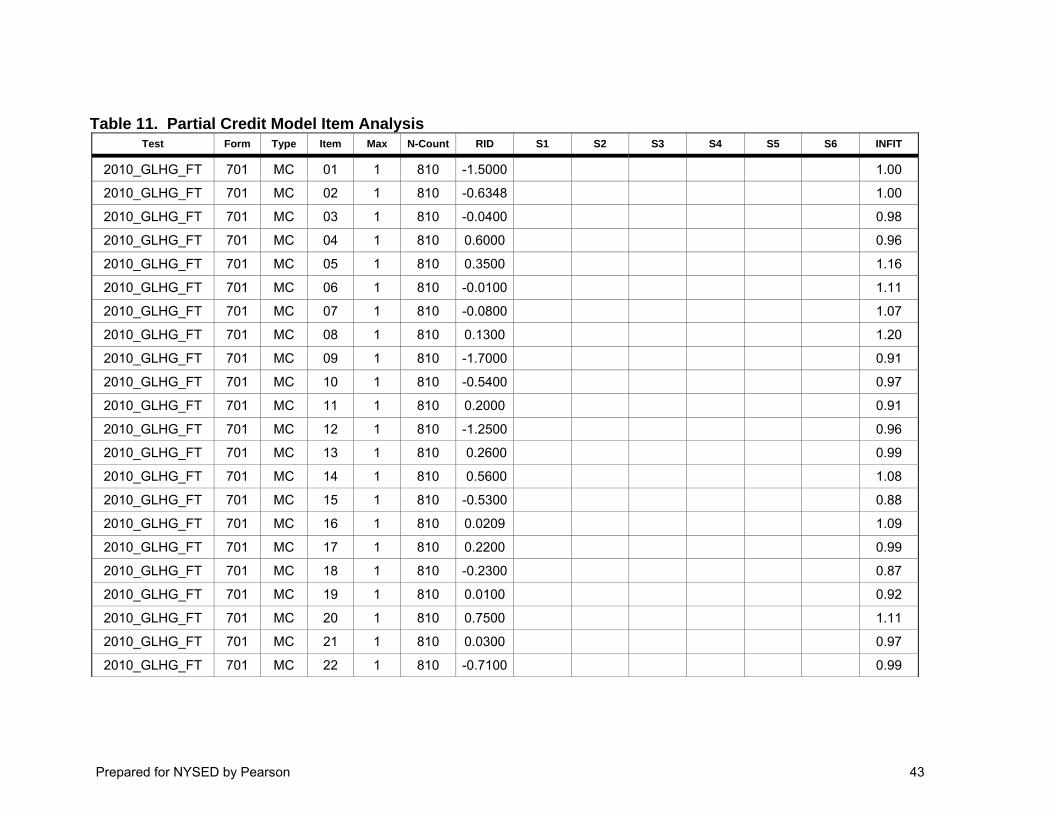
Prepared for NYSED by Pearson 43
Table 11. Partial Credit Model Item Analysis
Test Form Type Item Max N-Count RID S1 S2 S3 S4 S5 S6 INFIT
2010_GLHG_FT 701 MC 01 1 810 -1.5000 1.00
2010_GLHG_FT 701 MC 02 1 810 -0.6348 1.00
2010_GLHG_FT 701 MC 03 1 810 -0.0400 0.98
2010_GLHG_FT 701 MC 04 1 810 0.6000 0.96
2010_GLHG_FT 701 MC 05 1 810 0.3500 1.16
2010_GLHG_FT 701 MC 06 1 810 -0.0100 1.11
2010_GLHG_FT 701 MC 07 1 810 -0.0800 1.07
2010_GLHG_FT 701 MC 08 1 810 0.1300 1.20
2010_GLHG_FT 701 MC 09 1 810 -1.7000 0.91
2010_GLHG_FT 701 MC 10 1 810 -0.5400 0.97
2010_GLHG_FT 701 MC 11 1 810 0.2000 0.91
2010_GLHG_FT 701 MC 12 1 810 -1.2500 0.96
2010_GLHG_FT 701 MC 13 1 810 0.2600 0.99
2010_GLHG_FT 701 MC 14 1 810 0.5600 1.08
2010_GLHG_FT 701 MC 15 1 810 -0.5300 0.88
2010_GLHG_FT 701 MC 16 1 810 0.0209 1.09
2010_GLHG_FT 701 MC 17 1 810 0.2200 0.99
2010_GLHG_FT 701 MC 18 1 810 -0.2300 0.87
2010_GLHG_FT 701 MC 19 1 810 0.0100 0.92
2010_GLHG_FT 701 MC 20 1 810 0.7500 1.11
2010_GLHG_FT 701 MC 21 1 810 0.0300 0.97
2010_GLHG_FT 701 MC 22 1 810 -0.7100 0.99
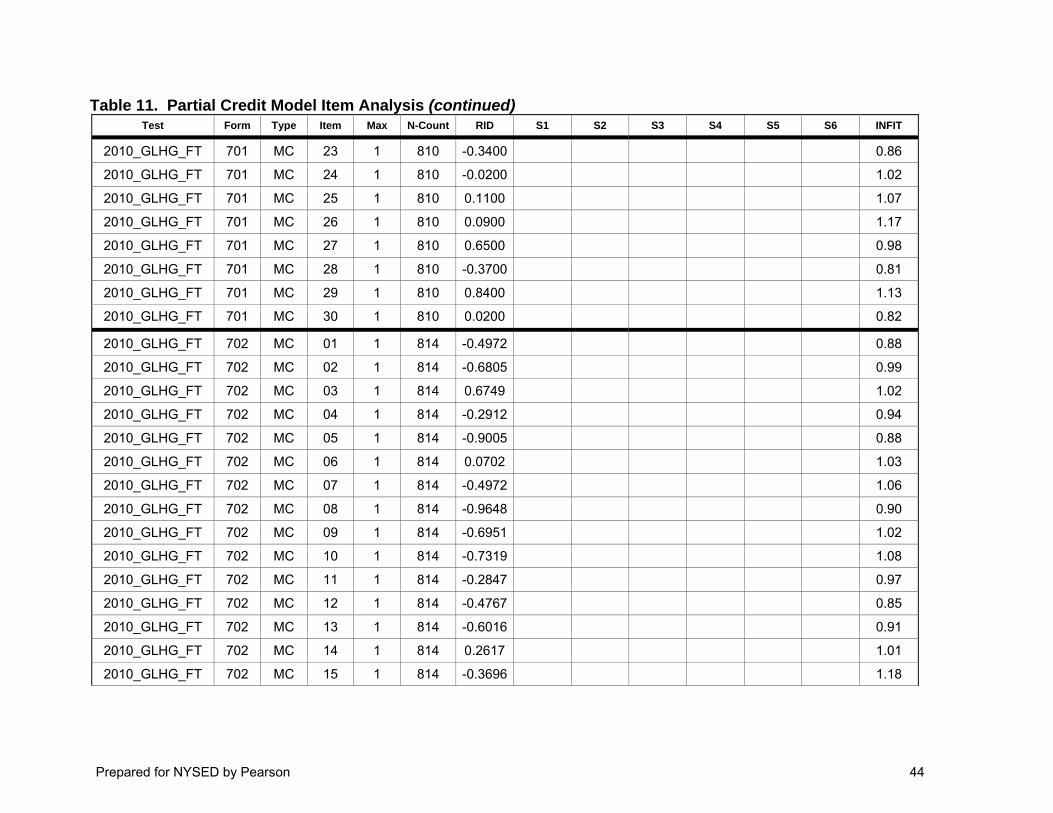
Prepared for NYSED by Pearson 44
Table 11. Partial Credit Model Item Analysis (continued) Test Form Type Item Max N-Count RID S1 S2 S3 S4 S5 S6 INFIT
2010_GLHG_FT 701 MC 23 1 810 -0.3400 0.86
2010_GLHG_FT 701 MC 24 1 810 -0.0200 1.02
2010_GLHG_FT 701 MC 25 1 810 0.1100 1.07
2010_GLHG_FT 701 MC 26 1 810 0.0900 1.17
2010_GLHG_FT 701 MC 27 1 810 0.6500 0.98
2010_GLHG_FT 701 MC 28 1 810 -0.3700 0.81
2010_GLHG_FT 701 MC 29 1 810 0.8400 1.13
2010_GLHG_FT 701 MC 30 1 810 0.0200 0.82
2010_GLHG_FT 702 MC 01 1 814 -0.4972 0.88
2010_GLHG_FT 702 MC 02 1 814 -0.6805 0.99
2010_GLHG_FT 702 MC 03 1 814 0.6749 1.02
2010_GLHG_FT 702 MC 04 1 814 -0.2912 0.94
2010_GLHG_FT 702 MC 05 1 814 -0.9005 0.88
2010_GLHG_FT 702 MC 06 1 814 0.0702 1.03
2010_GLHG_FT 702 MC 07 1 814 -0.4972 1.06
2010_GLHG_FT 702 MC 08 1 814 -0.9648 0.90
2010_GLHG_FT 702 MC 09 1 814 -0.6951 1.02
2010_GLHG_FT 702 MC 10 1 814 -0.7319 1.08
2010_GLHG_FT 702 MC 11 1 814 -0.2847 0.97
2010_GLHG_FT 702 MC 12 1 814 -0.4767 0.85
2010_GLHG_FT 702 MC 13 1 814 -0.6016 0.91
2010_GLHG_FT 702 MC 14 1 814 0.2617 1.01
2010_GLHG_FT 702 MC 15 1 814 -0.3696 1.18

Prepared for NYSED by Pearson 45
Table 11. Partial Credit Model Item Analysis (continued) Test Form Type Item Max N-Count RID S1 S2 S3 S4 S5 S6 INFIT
2010_GLHG_FT 702 MC 16 1 814 0.0217 0.95
2010_GLHG_FT 702 MC 17 1 814 -0.2270 0.94
2010_GLHG_FT 702 MC 18 1 814 0.4566 1.08
2010_GLHG_FT 702 MC 19 1 814 0.1364 1.13
2010_GLHG_FT 702 MC 20 1 814 1.9258 1.11
2010_GLHG_FT 702 MC 21 1 814 0.3150 1.11
2010_GLHG_FT 702 MC 22 1 814 1.3841 1.04
2010_GLHG_FT 702 MC 23 1 814 -0.6515 0.86
2010_GLHG_FT 702 MC 24 1 814 0.2972 0.98
2010_GLHG_FT 702 MC 25 1 814 -0.0641 0.88
2010_GLHG_FT 702 MC 26 1 814 1.2458 1.07
2010_GLHG_FT 702 MC 27 1 814 0.0581 1.07
2010_GLHG_FT 702 MC 28 1 814 0.4860 0.90
2010_GLHG_FT 702 MC 29 1 814 -0.7468 0.99
2010_GLHG_FT 702 MC 30 1 814 0.2795 0.91
2010_GLHG_FT 702 MC 31 1 814 -0.3894 1.04
2010_GLHG_FT 702 MC 32 1 814 0.8360 1.16
2010_GLHG_FT 703 MC 01 1 820 0.8657 0.96
2010_GLHG_FT 703 MC 02 1 820 0.5395 1.05
2010_GLHG_FT 703 MC 03 1 820 0.1185 0.91
2010_GLHG_FT 703 MC 04 1 820 1.3737 1.28
2010_GLHG_FT 703 MC 05 1 820 0.0319 1.06
2010_GLHG_FT 703 MC 06 1 820 -0.3785 0.91
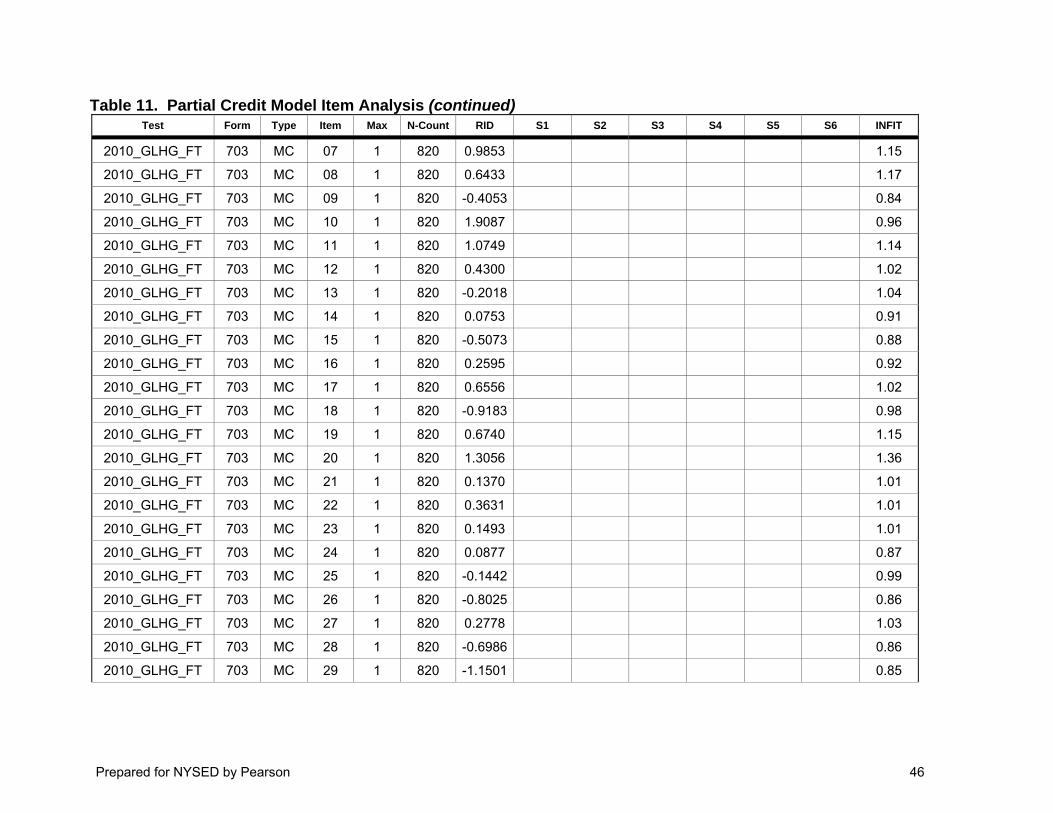
Prepared for NYSED by Pearson 46
Table 11. Partial Credit Model Item Analysis (continued) Test Form Type Item Max N-Count RID S1 S2 S3 S4 S5 S6 INFIT
2010_GLHG_FT 703 MC 07 1 820 0.9853 1.15
2010_GLHG_FT 703 MC 08 1 820 0.6433 1.17
2010_GLHG_FT 703 MC 09 1 820 -0.4053 0.84
2010_GLHG_FT 703 MC 10 1 820 1.9087 0.96
2010_GLHG_FT 703 MC 11 1 820 1.0749 1.14
2010_GLHG_FT 703 MC 12 1 820 0.4300 1.02
2010_GLHG_FT 703 MC 13 1 820 -0.2018 1.04
2010_GLHG_FT 703 MC 14 1 820 0.0753 0.91
2010_GLHG_FT 703 MC 15 1 820 -0.5073 0.88
2010_GLHG_FT 703 MC 16 1 820 0.2595 0.92
2010_GLHG_FT 703 MC 17 1 820 0.6556 1.02
2010_GLHG_FT 703 MC 18 1 820 -0.9183 0.98
2010_GLHG_FT 703 MC 19 1 820 0.6740 1.15
2010_GLHG_FT 703 MC 20 1 820 1.3056 1.36
2010_GLHG_FT 703 MC 21 1 820 0.1370 1.01
2010_GLHG_FT 703 MC 22 1 820 0.3631 1.01
2010_GLHG_FT 703 MC 23 1 820 0.1493 1.01
2010_GLHG_FT 703 MC 24 1 820 0.0877 0.87
2010_GLHG_FT 703 MC 25 1 820 -0.1442 0.99
2010_GLHG_FT 703 MC 26 1 820 -0.8025 0.86
2010_GLHG_FT 703 MC 27 1 820 0.2778 1.03
2010_GLHG_FT 703 MC 28 1 820 -0.6986 0.86
2010_GLHG_FT 703 MC 29 1 820 -1.1501 0.85
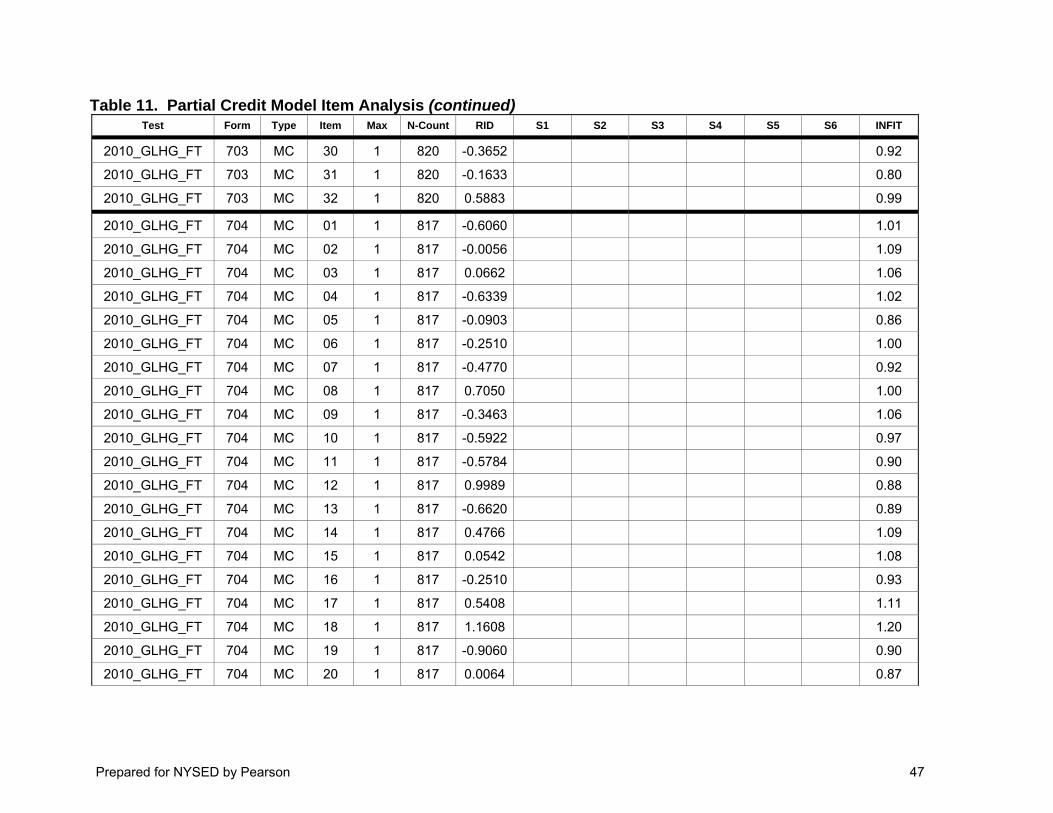
Prepared for NYSED by Pearson 47
Table 11. Partial Credit Model Item Analysis (continued) Test Form Type Item Max N-Count RID S1 S2 S3 S4 S5 S6 INFIT
2010_GLHG_FT 703 MC 30 1 820 -0.3652 0.92
2010_GLHG_FT 703 MC 31 1 820 -0.1633 0.80
2010_GLHG_FT 703 MC 32 1 820 0.5883 0.99
2010_GLHG_FT 704 MC 01 1 817 -0.6060 1.01
2010_GLHG_FT 704 MC 02 1 817 -0.0056 1.09
2010_GLHG_FT 704 MC 03 1 817 0.0662 1.06
2010_GLHG_FT 704 MC 04 1 817 -0.6339 1.02
2010_GLHG_FT 704 MC 05 1 817 -0.0903 0.86
2010_GLHG_FT 704 MC 06 1 817 -0.2510 1.00
2010_GLHG_FT 704 MC 07 1 817 -0.4770 0.92
2010_GLHG_FT 704 MC 08 1 817 0.7050 1.00
2010_GLHG_FT 704 MC 09 1 817 -0.3463 1.06
2010_GLHG_FT 704 MC 10 1 817 -0.5922 0.97
2010_GLHG_FT 704 MC 11 1 817 -0.5784 0.90
2010_GLHG_FT 704 MC 12 1 817 0.9989 0.88
2010_GLHG_FT 704 MC 13 1 817 -0.6620 0.89
2010_GLHG_FT 704 MC 14 1 817 0.4766 1.09
2010_GLHG_FT 704 MC 15 1 817 0.0542 1.08
2010_GLHG_FT 704 MC 16 1 817 -0.2510 0.93
2010_GLHG_FT 704 MC 17 1 817 0.5408 1.11
2010_GLHG_FT 704 MC 18 1 817 1.1608 1.20
2010_GLHG_FT 704 MC 19 1 817 -0.9060 0.90
2010_GLHG_FT 704 MC 20 1 817 0.0064 0.87

Prepared for NYSED by Pearson 48
Table 11. Partial Credit Model Item Analysis (continued) Test Form Type Item Max N-Count RID S1 S2 S3 S4 S5 S6 INFIT
2010_GLHG_FT 704 MC 21 1 817 0.3543 0.95
2010_GLHG_FT 704 MC 22 1 817 -0.1453 1.01
2010_GLHG_FT 704 MC 23 1 817 -0.3591 1.07
2010_GLHG_FT 704 MC 24 1 817 1.5049 1.10
2010_GLHG_FT 704 MC 25 1 817 0.1018 0.87
2010_GLHG_FT 704 MC 26 1 817 0.4825 0.97
2010_GLHG_FT 704 MC 27 1 817 0.5642 1.02
2010_GLHG_FT 704 MC 28 1 817 1.4772 1.05
2010_GLHG_FT 704 MC 29 1 817 0.7404 0.90
2010_GLHG_FT 704 MC 30 1 817 -0.0660 1.03
2010_GLHG_FT 704 MC 31 1 817 0.4125 0.95
2010_GLHG_FT 704 MC 32 1 817 1.0854 1.09
2010_GLHG_FT 705 MC 01 1 825 0.4561 0.90
2010_GLHG_FT 705 MC 02 1 825 0.6731 0.92
2010_GLHG_FT 705 MC 03 1 825 -0.4471 1.03
2010_GLHG_FT 705 MC 04 1 825 -0.8677 0.92
2010_GLHG_FT 705 MC 05 1 825 -0.2346 1.08
2010_GLHG_FT 705 MC 06 1 825 -0.7396 0.89
2010_GLHG_FT 705 MC 07 1 825 -0.4405 0.94
2010_GLHG_FT 705 MC 08 1 825 0.6445 1.07
2010_GLHG_FT 705 MC 09 1 825 0.6102 1.06
2010_GLHG_FT 705 MC 10 1 825 0.0686 0.96
2010_GLHG_FT 705 MC 11 1 825 1.0334 1.16

Prepared for NYSED by Pearson 49
Table 11. Partial Credit Model Item Analysis (continued) Test Form Type Item Max N-Count RID S1 S2 S3 S4 S5 S6 INFIT
2010_GLHG_FT 705 MC 12 1 825 0.0391 1.06
2010_GLHG_FT 705 MC 13 1 825 1.0275 1.05
2010_GLHG_FT 705 MC 14 1 825 0.4847 1.15
2010_GLHG_FT 705 MC 15 1 825 -0.2034 0.96
2010_GLHG_FT 705 MC 16 1 825 0.7995 1.04
2010_GLHG_FT 705 MC 17 1 825 0.6045 0.98
2010_GLHG_FT 705 MC 18 1 825 -0.3041 0.94
2010_GLHG_FT 705 MC 19 1 825 -0.1601 0.87
2010_GLHG_FT 705 MC 20 1 825 0.3014 0.94
2010_GLHG_FT 705 MC 21 1 825 0.7880 1.08
2010_GLHG_FT 705 MC 22 1 825 1.9923 1.27
2010_GLHG_FT 705 MC 23 1 825 -0.6743 0.92
2010_GLHG_FT 705 MC 24 1 825 0.6846 0.97
2010_GLHG_FT 705 MC 25 1 825 -0.8911 0.79
2010_GLHG_FT 705 MC 26 1 825 -0.1111 0.94
2010_GLHG_FT 705 MC 27 1 825 -0.0026 1.06
2010_GLHG_FT 705 MC 28 1 825 -0.1663 0.89
2010_GLHG_FT 705 MC 29 1 825 1.4551 1.19
2010_GLHG_FT 705 MC 30 1 825 0.2090 1.03
2010_GLHG_FT 705 MC 31 1 825 0.3417 0.91
2010_GLHG_FT 705 MC 32 1 825 1.2146 0.91
2010_GLHG_FT 706 MC 01 1 829 -0.5024 0.97
2010_GLHG_FT 706 MC 02 1 829 0.0344 0.98
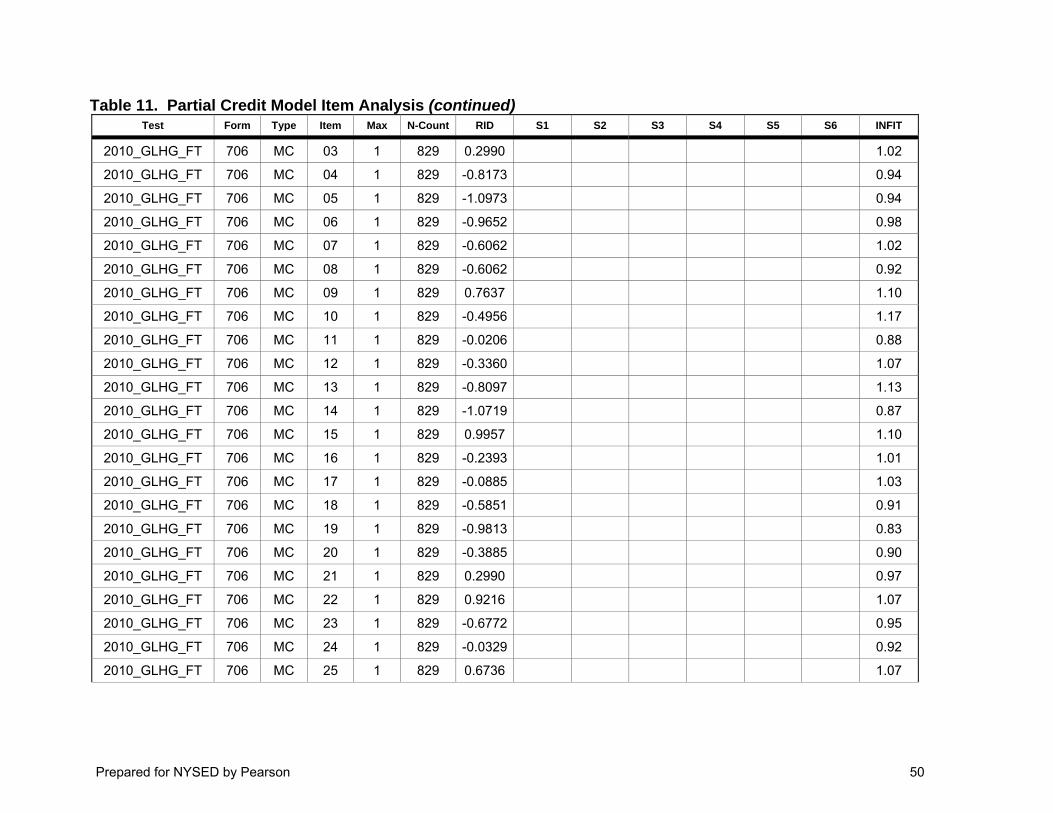
Prepared for NYSED by Pearson 50
Table 11. Partial Credit Model Item Analysis (continued) Test Form Type Item Max N-Count RID S1 S2 S3 S4 S5 S6 INFIT
2010_GLHG_FT 706 MC 03 1 829 0.2990 1.02
2010_GLHG_FT 706 MC 04 1 829 -0.8173 0.94
2010_GLHG_FT 706 MC 05 1 829 -1.0973 0.94
2010_GLHG_FT 706 MC 06 1 829 -0.9652 0.98
2010_GLHG_FT 706 MC 07 1 829 -0.6062 1.02
2010_GLHG_FT 706 MC 08 1 829 -0.6062 0.92
2010_GLHG_FT 706 MC 09 1 829 0.7637 1.10
2010_GLHG_FT 706 MC 10 1 829 -0.4956 1.17
2010_GLHG_FT 706 MC 11 1 829 -0.0206 0.88
2010_GLHG_FT 706 MC 12 1 829 -0.3360 1.07
2010_GLHG_FT 706 MC 13 1 829 -0.8097 1.13
2010_GLHG_FT 706 MC 14 1 829 -1.0719 0.87
2010_GLHG_FT 706 MC 15 1 829 0.9957 1.10
2010_GLHG_FT 706 MC 16 1 829 -0.2393 1.01
2010_GLHG_FT 706 MC 17 1 829 -0.0885 1.03
2010_GLHG_FT 706 MC 18 1 829 -0.5851 0.91
2010_GLHG_FT 706 MC 19 1 829 -0.9813 0.83
2010_GLHG_FT 706 MC 20 1 829 -0.3885 0.90
2010_GLHG_FT 706 MC 21 1 829 0.2990 0.97
2010_GLHG_FT 706 MC 22 1 829 0.9216 1.07
2010_GLHG_FT 706 MC 23 1 829 -0.6772 0.95
2010_GLHG_FT 706 MC 24 1 829 -0.0329 0.92
2010_GLHG_FT 706 MC 25 1 829 0.6736 1.07

Prepared for NYSED by Pearson 51
Table 11. Partial Credit Model Item Analysis (continued) Test Form Type Item Max N-Count RID S1 S2 S3 S4 S5 S6 INFIT
2010_GLHG_FT 706 MC 26 1 829 0.2094 1.01
2010_GLHG_FT 706 MC 27 1 829 -0.3753 0.95
2010_GLHG_FT 706 MC 28 1 829 0.0344 1.11
2010_GLHG_FT 706 MC 29 1 829 0.3287 0.94
2010_GLHG_FT 706 MC 30 1 829 -0.3036 0.99
2010_GLHG_FT 706 MC 31 1 829 -0.0022 1.09
2010_GLHG_FT 706 MC 32 1 829 0.8301 1.05
2010_GLHG_FT 707 MC 01 1 819 0.1182 1.07
2010_GLHG_FT 707 MC 02 1 819 0.3522 1.04
2010_GLHG_FT 707 MC 03 1 819 -0.9718 0.84
2010_GLHG_FT 707 MC 04 1 819 -0.5367 1.02
2010_GLHG_FT 707 MC 05 1 819 0.2007 1.24
2010_GLHG_FT 707 MC 06 1 819 0.4905 1.03
2010_GLHG_FT 707 MC 07 1 819 -0.2870 0.85
2010_GLHG_FT 707 MC 08 1 819 -0.8987 1.03
2010_GLHG_FT 707 MC 09 1 819 -0.9966 0.99
2010_GLHG_FT 707 MC 10 1 819 0.2829 1.06
2010_GLHG_FT 707 MC 11 1 819 -0.6604 0.89
2010_GLHG_FT 707 MC 12 1 819 -0.7965 0.88
2010_GLHG_FT 707 MC 13 1 819 -0.4941 1.03
2010_GLHG_FT 707 MC 14 1 819 -0.5153 0.92
2010_GLHG_FT 707 MC 15 1 819 0.0286 1.10
2010_GLHG_FT 707 MC 16 1 819 0.6354 1.08
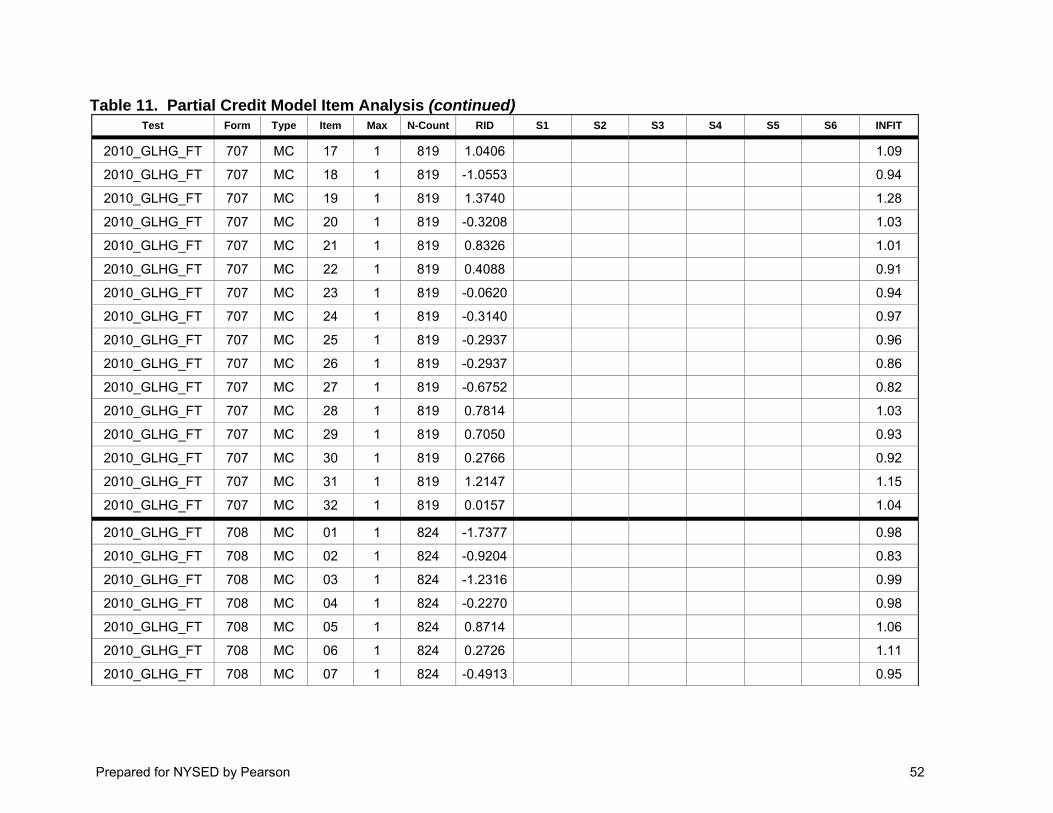
Prepared for NYSED by Pearson 52
Table 11. Partial Credit Model Item Analysis (continued) Test Form Type Item Max N-Count RID S1 S2 S3 S4 S5 S6 INFIT
2010_GLHG_FT 707 MC 17 1 819 1.0406 1.09
2010_GLHG_FT 707 MC 18 1 819 -1.0553 0.94
2010_GLHG_FT 707 MC 19 1 819 1.3740 1.28
2010_GLHG_FT 707 MC 20 1 819 -0.3208 1.03
2010_GLHG_FT 707 MC 21 1 819 0.8326 1.01
2010_GLHG_FT 707 MC 22 1 819 0.4088 0.91
2010_GLHG_FT 707 MC 23 1 819 -0.0620 0.94
2010_GLHG_FT 707 MC 24 1 819 -0.3140 0.97
2010_GLHG_FT 707 MC 25 1 819 -0.2937 0.96
2010_GLHG_FT 707 MC 26 1 819 -0.2937 0.86
2010_GLHG_FT 707 MC 27 1 819 -0.6752 0.82
2010_GLHG_FT 707 MC 28 1 819 0.7814 1.03
2010_GLHG_FT 707 MC 29 1 819 0.7050 0.93
2010_GLHG_FT 707 MC 30 1 819 0.2766 0.92
2010_GLHG_FT 707 MC 31 1 819 1.2147 1.15
2010_GLHG_FT 707 MC 32 1 819 0.0157 1.04
2010_GLHG_FT 708 MC 01 1 824 -1.7377 0.98
2010_GLHG_FT 708 MC 02 1 824 -0.9204 0.83
2010_GLHG_FT 708 MC 03 1 824 -1.2316 0.99
2010_GLHG_FT 708 MC 04 1 824 -0.2270 0.98
2010_GLHG_FT 708 MC 05 1 824 0.8714 1.06
2010_GLHG_FT 708 MC 06 1 824 0.2726 1.11
2010_GLHG_FT 708 MC 07 1 824 -0.4913 0.95

Prepared for NYSED by Pearson 53
Table 11. Partial Credit Model Item Analysis (continued) Test Form Type Item Max N-Count RID S1 S2 S3 S4 S5 S6 INFIT
2010_GLHG_FT 708 MC 08 1 824 -0.3472 1.05
2010_GLHG_FT 708 MC 09 1 824 0.0897 1.10
2010_GLHG_FT 708 MC 10 1 824 0.5421 1.14
2010_GLHG_FT 708 MC 11 1 824 -1.2048 0.92
2010_GLHG_FT 708 MC 12 1 824 -0.3337 0.98
2010_GLHG_FT 708 MC 13 1 824 -0.0381 1.08
2010_GLHG_FT 708 MC 14 1 824 -0.1744 1.00
2010_GLHG_FT 708 MC 15 1 824 -0.4496 0.98
2010_GLHG_FT 708 MC 16 1 824 -0.3405 1.05
2010_GLHG_FT 708 MC 17 1 824 0.5923 1.14
2010_GLHG_FT 708 MC 18 1 824 -0.4084 1.07
2010_GLHG_FT 708 MC 19 1 824 0.1150 1.00
2010_GLHG_FT 708 MC 20 1 824 -0.0638 0.98
2010_GLHG_FT 708 MC 21 1 824 0.9682 1.19
2010_GLHG_FT 708 MC 22 1 824 -0.0124 0.98
2010_GLHG_FT 708 MC 23 1 824 -0.1482 0.87
2010_GLHG_FT 708 MC 24 1 824 -0.1221 0.93
2010_GLHG_FT 708 MC 25 1 824 -0.5263 0.82
2010_GLHG_FT 708 MC 26 1 824 0.2977 0.96
2010_GLHG_FT 708 MC 27 1 824 0.6426 0.98
2010_GLHG_FT 708 MC 28 1 824 0.3353 0.88
2010_GLHG_FT 708 MC 29 1 824 0.5546 0.97
2010_GLHG_FT 708 MC 30 1 824 1.0269 0.93

Prepared for NYSED by Pearson 54
Table 11. Partial Credit Model Item Analysis (continued) Test Form Type Item Max N-Count RID S1 S2 S3 S4 S5 S6 INFIT
2010_GLHG_FT 708 MC 31 1 824 -0.4774 0.91
2010_GLHG_FT 708 MC 32 1 824 -0.0188 1.11
2010_GLHG_FT 709 MC 01 1 820 0.4184 1.01
2010_GLHG_FT 709 MC 02 1 820 0.4304 1.05
2010_GLHG_FT 709 MC 03 1 820 -0.0980 0.90
2010_GLHG_FT 709 MC 04 1 820 0.5869 0.97
2010_GLHG_FT 709 MC 05 1 820 -0.1619 1.06
2010_GLHG_FT 709 MC 06 1 820 -0.0600 0.98
2010_GLHG_FT 709 MC 07 1 820 -0.5876 0.86
2010_GLHG_FT 709 MC 08 1 820 -0.5590 1.00
2010_GLHG_FT 709 MC 09 1 820 0.4425 1.22
2010_GLHG_FT 709 MC 10 1 820 -1.3569 0.96
2010_GLHG_FT 709 MC 11 1 820 -0.4403 0.99
2010_GLHG_FT 709 MC 12 1 820 0.5749 1.06
2010_GLHG_FT 709 MC 13 1 820 -0.6091 0.94
2010_GLHG_FT 709 MC 14 1 820 -0.3188 1.00
2010_GLHG_FT 709 MC 15 1 820 0.2003 0.98
2010_GLHG_FT 709 MC 16 1 820 -1.1594 0.92
2010_GLHG_FT 709 MC 17 1 820 -1.2047 0.90
2010_GLHG_FT 709 MC 18 1 820 0.9025 1.20
2010_GLHG_FT 709 MC 19 1 820 -0.4130 0.98
2010_GLHG_FT 709 MC 20 1 820 0.0402 1.09
2010_GLHG_FT 709 MC 21 1 820 -0.5237 0.96
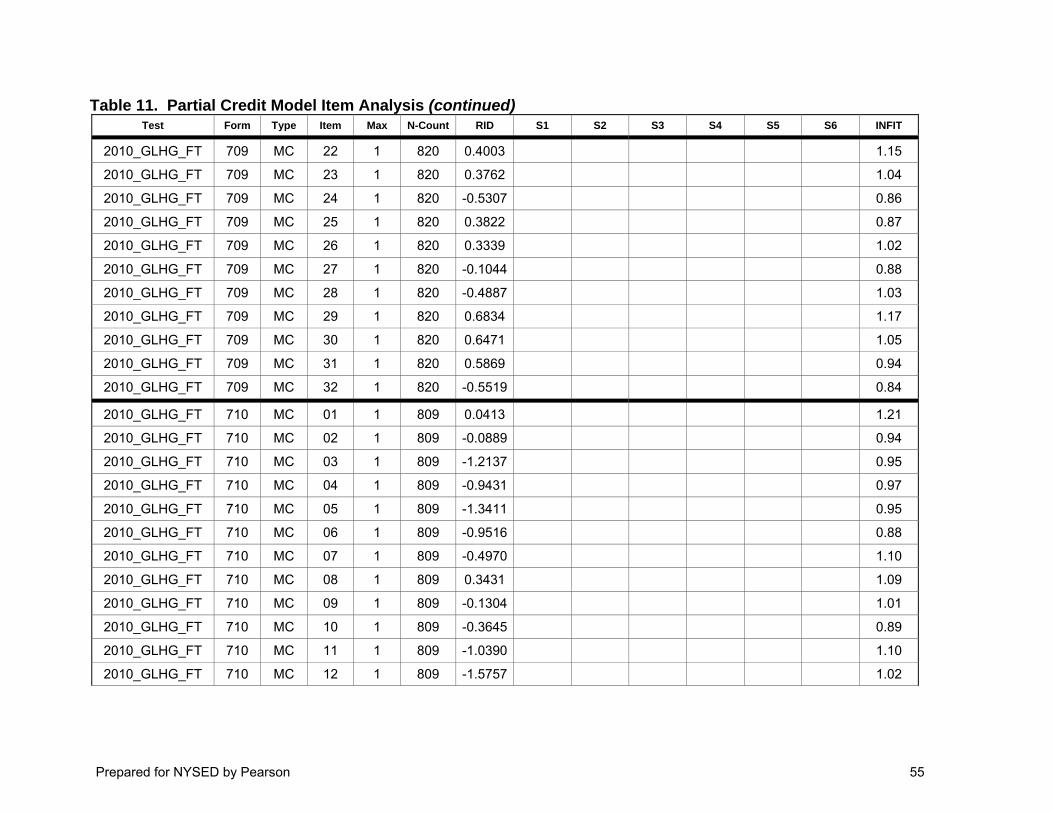
Prepared for NYSED by Pearson 55
Table 11. Partial Credit Model Item Analysis (continued) Test Form Type Item Max N-Count RID S1 S2 S3 S4 S5 S6 INFIT
2010_GLHG_FT 709 MC 22 1 820 0.4003 1.15
2010_GLHG_FT 709 MC 23 1 820 0.3762 1.04
2010_GLHG_FT 709 MC 24 1 820 -0.5307 0.86
2010_GLHG_FT 709 MC 25 1 820 0.3822 0.87
2010_GLHG_FT 709 MC 26 1 820 0.3339 1.02
2010_GLHG_FT 709 MC 27 1 820 -0.1044 0.88
2010_GLHG_FT 709 MC 28 1 820 -0.4887 1.03
2010_GLHG_FT 709 MC 29 1 820 0.6834 1.17
2010_GLHG_FT 709 MC 30 1 820 0.6471 1.05
2010_GLHG_FT 709 MC 31 1 820 0.5869 0.94
2010_GLHG_FT 709 MC 32 1 820 -0.5519 0.84
2010_GLHG_FT 710 MC 01 1 809 0.0413 1.21
2010_GLHG_FT 710 MC 02 1 809 -0.0889 0.94
2010_GLHG_FT 710 MC 03 1 809 -1.2137 0.95
2010_GLHG_FT 710 MC 04 1 809 -0.9431 0.97
2010_GLHG_FT 710 MC 05 1 809 -1.3411 0.95
2010_GLHG_FT 710 MC 06 1 809 -0.9516 0.88
2010_GLHG_FT 710 MC 07 1 809 -0.4970 1.10
2010_GLHG_FT 710 MC 08 1 809 0.3431 1.09
2010_GLHG_FT 710 MC 09 1 809 -0.1304 1.01
2010_GLHG_FT 710 MC 10 1 809 -0.3645 0.89
2010_GLHG_FT 710 MC 11 1 809 -1.0390 1.10
2010_GLHG_FT 710 MC 12 1 809 -1.5757 1.02
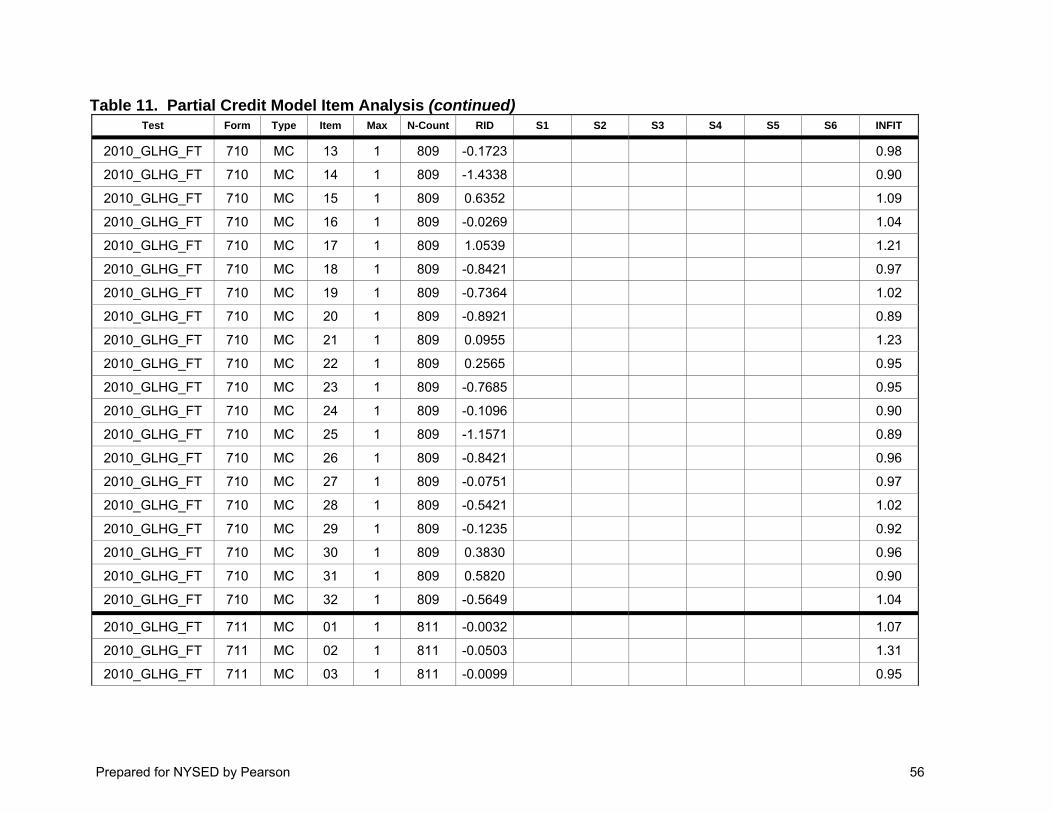
Prepared for NYSED by Pearson 56
Table 11. Partial Credit Model Item Analysis (continued) Test Form Type Item Max N-Count RID S1 S2 S3 S4 S5 S6 INFIT
2010_GLHG_FT 710 MC 13 1 809 -0.1723 0.98
2010_GLHG_FT 710 MC 14 1 809 -1.4338 0.90
2010_GLHG_FT 710 MC 15 1 809 0.6352 1.09
2010_GLHG_FT 710 MC 16 1 809 -0.0269 1.04
2010_GLHG_FT 710 MC 17 1 809 1.0539 1.21
2010_GLHG_FT 710 MC 18 1 809 -0.8421 0.97
2010_GLHG_FT 710 MC 19 1 809 -0.7364 1.02
2010_GLHG_FT 710 MC 20 1 809 -0.8921 0.89
2010_GLHG_FT 710 MC 21 1 809 0.0955 1.23
2010_GLHG_FT 710 MC 22 1 809 0.2565 0.95
2010_GLHG_FT 710 MC 23 1 809 -0.7685 0.95
2010_GLHG_FT 710 MC 24 1 809 -0.1096 0.90
2010_GLHG_FT 710 MC 25 1 809 -1.1571 0.89
2010_GLHG_FT 710 MC 26 1 809 -0.8421 0.96
2010_GLHG_FT 710 MC 27 1 809 -0.0751 0.97
2010_GLHG_FT 710 MC 28 1 809 -0.5421 1.02
2010_GLHG_FT 710 MC 29 1 809 -0.1235 0.92
2010_GLHG_FT 710 MC 30 1 809 0.3830 0.96
2010_GLHG_FT 710 MC 31 1 809 0.5820 0.90
2010_GLHG_FT 710 MC 32 1 809 -0.5649 1.04
2010_GLHG_FT 711 MC 01 1 811 -0.0032 1.07
2010_GLHG_FT 711 MC 02 1 811 -0.0503 1.31
2010_GLHG_FT 711 MC 03 1 811 -0.0099 0.95

Prepared for NYSED by Pearson 57
Table 11. Partial Credit Model Item Analysis (continued) Test Form Type Item Max N-Count RID S1 S2 S3 S4 S5 S6 INFIT
2010_GLHG_FT 711 MC 04 1 811 -0.8331 0.95
2010_GLHG_FT 711 MC 05 1 811 -0.3468 0.93
2010_GLHG_FT 711 MC 06 1 811 -0.2557 1.18
2010_GLHG_FT 711 MC 07 1 811 -0.0099 1.23
2010_GLHG_FT 711 MC 08 1 811 -0.4468 0.99
2010_GLHG_FT 711 MC 09 1 811 -0.4757 1.06
2010_GLHG_FT 711 MC 10 1 811 -0.1113 1.08
2010_GLHG_FT 711 MC 11 1 811 -1.0234 1.02
2010_GLHG_FT 711 MC 12 1 811 0.4460 1.02
2010_GLHG_FT 711 MC 13 1 811 0.3739 0.86
2010_GLHG_FT 711 MC 14 1 811 0.2030 1.15
2010_GLHG_FT 711 MC 15 1 811 -0.9474 0.97
2010_GLHG_FT 711 MC 16 1 811 -0.5712 0.98
2010_GLHG_FT 711 MC 17 1 811 -0.2141 1.07
2010_GLHG_FT 711 MC 18 1 811 0.3017 1.00
2010_GLHG_FT 711 MC 19 1 811 1.2941 1.32
2010_GLHG_FT 711 MC 20 1 811 -1.4223 0.85
2010_GLHG_FT 711 MC 21 1 811 -0.2210 0.84
2010_GLHG_FT 711 MC 22 1 811 0.3214 1.17
2010_GLHG_FT 711 MC 23 1 811 -0.2487 0.83
2010_GLHG_FT 711 MC 24 1 811 -0.1249 0.97
2010_GLHG_FT 711 MC 25 1 811 -0.1317 0.91
2010_GLHG_FT 711 MC 26 1 811 -0.1591 0.83

Prepared for NYSED by Pearson 58
Table 11. Partial Credit Model Item Analysis (continued) Test Form Type Item Max N-Count RID S1 S2 S3 S4 S5 S6 INFIT
2010_GLHG_FT 711 MC 27 1 811 0.0102 0.86
2010_GLHG_FT 711 MC 28 1 811 -1.1551 0.76
2010_GLHG_FT 711 MC 29 1 811 -0.6767 0.92
2010_GLHG_FT 711 MC 30 1 811 0.1036 0.95
2010_GLHG_FT 711 MC 31 1 811 0.2030 0.86
2010_GLHG_FT 711 MC 32 1 811 0.5575 1.11
2010_GLHG_FT 712 CR THM 5 1976 1.5810 -1.3435 -0.0136 1.3571 1.13
2010_GLHG_FT 713 CR THM 5 1964 2.0284 -1.5135 -0.0730 1.5865 1.01
2010_GLHG_FT 714 CR THM 5 1994 3.0557 -1.8218 -0.1836 2.0054 0.99
2010_GLHG_FT 715 CR THM 5 1975 2.4997 -1.9738 -0.3237 2.2975 1.04
2010_GLHG_FT 716 CR 01 1 1860 -1.1950 0.88
2010_GLHG_FT 716 CR 02 2 1860 -0.6744 0.2878 -0.2878 0.90
2010_GLHG_FT 716 CR 03 2 1860 0.6574 -0.4114 0.4114 1.05
2010_GLHG_FT 716 CR 04 2 1860 -0.7573 0.5926 -0.5926 0.89
2010_GLHG_FT 716 CR 05 1 1860 -0.9021 0.85
2010_GLHG_FT 716 CR 06 1 1860 -0.4252 0.78
2010_GLHG_FT 716 CR 07 1 1860 -0.7656 0.83
2010_GLHG_FT 716 CR 08 2 1860 -0.0351 0.2043 -0.2043 0.92
2010_GLHG_FT 716 CR 09 1 1860 -0.8401 0.82
2010_GLHG_FT 716 CR DBQ 5 1860 1.2733 -1.0802 -0.8527 1.9328 0.98
2010_GLHG_FT 717 CR 01 1 1849 -1.0276 0.91
2010_GLHG_FT 717 CR 02 2 1849 -0.1494 0.0192 -0.0192 1.09
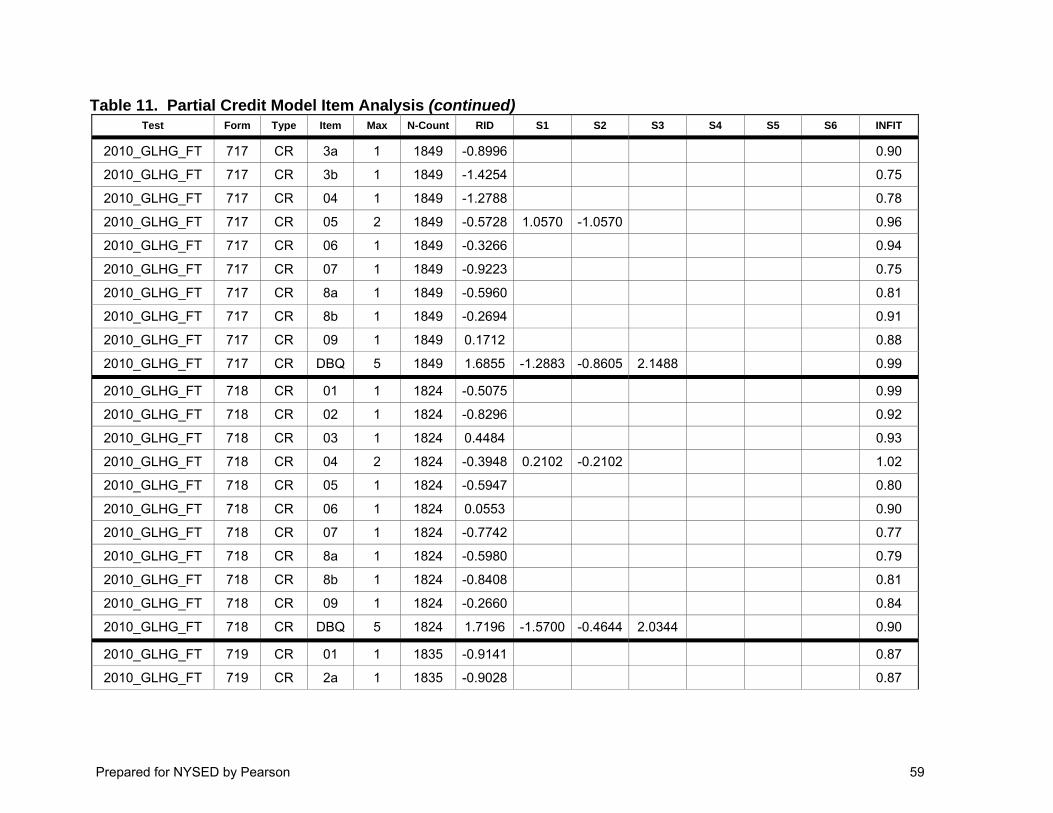
Prepared for NYSED by Pearson 59
Table 11. Partial Credit Model Item Analysis (continued) Test Form Type Item Max N-Count RID S1 S2 S3 S4 S5 S6 INFIT
2010_GLHG_FT 717 CR 3a 1 1849 -0.8996 0.90
2010_GLHG_FT 717 CR 3b 1 1849 -1.4254 0.75
2010_GLHG_FT 717 CR 04 1 1849 -1.2788 0.78
2010_GLHG_FT 717 CR 05 2 1849 -0.5728 1.0570 -1.0570 0.96
2010_GLHG_FT 717 CR 06 1 1849 -0.3266 0.94
2010_GLHG_FT 717 CR 07 1 1849 -0.9223 0.75
2010_GLHG_FT 717 CR 8a 1 1849 -0.5960 0.81
2010_GLHG_FT 717 CR 8b 1 1849 -0.2694 0.91
2010_GLHG_FT 717 CR 09 1 1849 0.1712 0.88
2010_GLHG_FT 717 CR DBQ 5 1849 1.6855 -1.2883 -0.8605 2.1488 0.99
2010_GLHG_FT 718 CR 01 1 1824 -0.5075 0.99
2010_GLHG_FT 718 CR 02 1 1824 -0.8296 0.92
2010_GLHG_FT 718 CR 03 1 1824 0.4484 0.93
2010_GLHG_FT 718 CR 04 2 1824 -0.3948 0.2102 -0.2102 1.02
2010_GLHG_FT 718 CR 05 1 1824 -0.5947 0.80
2010_GLHG_FT 718 CR 06 1 1824 0.0553 0.90
2010_GLHG_FT 718 CR 07 1 1824 -0.7742 0.77
2010_GLHG_FT 718 CR 8a 1 1824 -0.5980 0.79
2010_GLHG_FT 718 CR 8b 1 1824 -0.8408 0.81
2010_GLHG_FT 718 CR 09 1 1824 -0.2660 0.84
2010_GLHG_FT 718 CR DBQ 5 1824 1.7196 -1.5700 -0.4644 2.0344 0.90
2010_GLHG_FT 719 CR 01 1 1835 -0.9141 0.87
2010_GLHG_FT 719 CR 2a 1 1835 -0.9028 0.87

Prepared for NYSED by Pearson 60
Table 11. Partial Credit Model Item Analysis (continued) Test Form Type Item Max N-Count RID S1 S2 S3 S4 S5 S6 INFIT
2010_GLHG_FT 719 CR 2b 1 1835 -1.5796 0.78
2010_GLHG_FT 719 CR 03 1 1835 -1.2583 0.85
2010_GLHG_FT 719 CR 04 2 1835 -0.0020 0.1841 -0.1841 0.99
2010_GLHG_FT 719 CR 05 1 1835 -0.7674 0.85
2010_GLHG_FT 719 CR 06 1 1835 -0.5264 0.90
2010_GLHG_FT 719 CR 07 1 1835 0.4800 0.96
2010_GLHG_FT 719 CR 08 1 1835 -0.4336 0.83
2010_GLHG_FT 719 CR 9a 1 1835 -0.1611 0.95
2010_GLHG_FT 719 CR 9b 1 1835 -0.5525 0.85
2010_GLHG_FT 719 CR DBQ 5 1835 1.7124 -1.4361 -0.4597 1.8958 0.89
Prepared for NYSED by Pearson 61
Appendix C: DIF Statistics
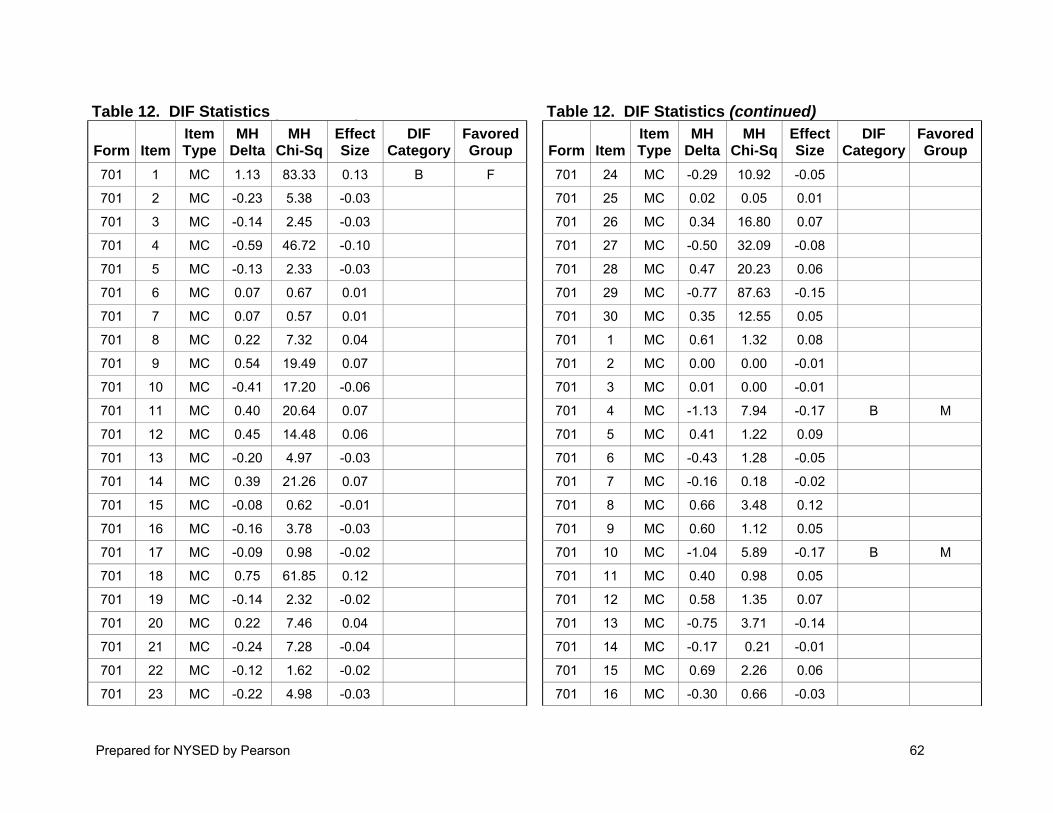
Prepared for NYSED by Pearson 62
Table 12. DIF Statistics (continued)
Form Item Item Type
MH Delta
MH Chi-Sq
Effect Size
DIF Category
Favored Group
701 1 MC 1.13 83.33 0.13 B F
701 2 MC -0.23 5.38 -0.03
701 3 MC -0.14 2.45 -0.03
701 4 MC -0.59 46.72 -0.10
701 5 MC -0.13 2.33 -0.03
701 6 MC 0.07 0.67 0.01
701 7 MC 0.07 0.57 0.01
701 8 MC 0.22 7.32 0.04
701 9 MC 0.54 19.49 0.07
701 10 MC -0.41 17.20 -0.06
701 11 MC 0.40 20.64 0.07
701 12 MC 0.45 14.48 0.06
701 13 MC -0.20 4.97 -0.03
701 14 MC 0.39 21.26 0.07
701 15 MC -0.08 0.62 -0.01
701 16 MC -0.16 3.78 -0.03
701 17 MC -0.09 0.98 -0.02
701 18 MC 0.75 61.85 0.12
701 19 MC -0.14 2.32 -0.02
701 20 MC 0.22 7.46 0.04
701 21 MC -0.24 7.28 -0.04
701 22 MC -0.12 1.62 -0.02
701 23 MC -0.22 4.98 -0.03
Table 12. DIF Statistics (continued)
Form Item Item Type
MH Delta
MH Chi-Sq
Effect Size
DIF Category
Favored Group
701 24 MC -0.29 10.92 -0.05
701 25 MC 0.02 0.05 0.01
701 26 MC 0.34 16.80 0.07
701 27 MC -0.50 32.09 -0.08
701 28 MC 0.47 20.23 0.06
701 29 MC -0.77 87.63 -0.15
701 30 MC 0.35 12.55 0.05
701 1 MC 0.61 1.32 0.08
701 2 MC 0.00 0.00 -0.01
701 3 MC 0.01 0.00 -0.01
701 4 MC -1.13 7.94 -0.17 B M
701 5 MC 0.41 1.22 0.09
701 6 MC -0.43 1.28 -0.05
701 7 MC -0.16 0.18 -0.02
701 8 MC 0.66 3.48 0.12
701 9 MC 0.60 1.12 0.05
701 10 MC -1.04 5.89 -0.17 B M
701 11 MC 0.40 0.98 0.05
701 12 MC 0.58 1.35 0.07
701 13 MC -0.75 3.71 -0.14
701 14 MC -0.17 0.21 -0.01
701 15 MC 0.69 2.26 0.06
701 16 MC -0.30 0.66 -0.03
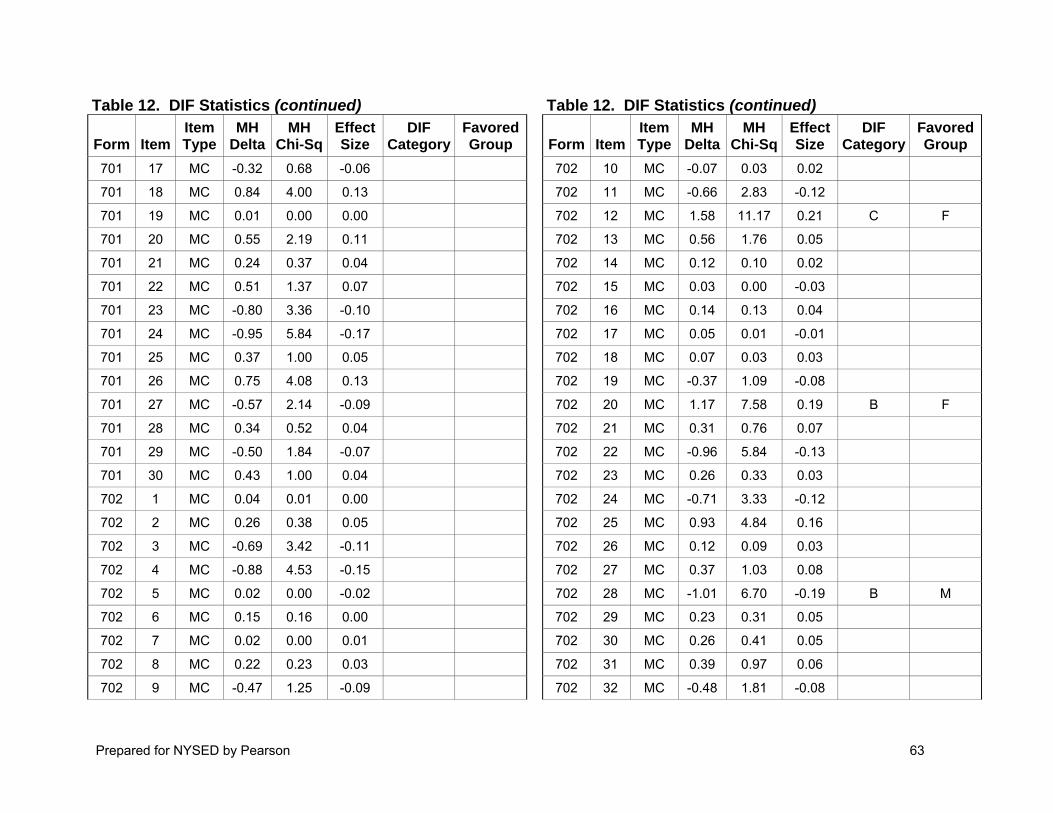
Prepared for NYSED by Pearson 63
Table 12. DIF Statistics (continued)
Form Item Item Type
MH Delta
MH Chi-Sq
Effect Size
DIF Category
Favored Group
701 17 MC -0.32 0.68 -0.06
701 18 MC 0.84 4.00 0.13
701 19 MC 0.01 0.00 0.00
701 20 MC 0.55 2.19 0.11
701 21 MC 0.24 0.37 0.04
701 22 MC 0.51 1.37 0.07
701 23 MC -0.80 3.36 -0.10
701 24 MC -0.95 5.84 -0.17
701 25 MC 0.37 1.00 0.05
701 26 MC 0.75 4.08 0.13
701 27 MC -0.57 2.14 -0.09
701 28 MC 0.34 0.52 0.04
701 29 MC -0.50 1.84 -0.07
701 30 MC 0.43 1.00 0.04
702 1 MC 0.04 0.01 0.00
702 2 MC 0.26 0.38 0.05
702 3 MC -0.69 3.42 -0.11
702 4 MC -0.88 4.53 -0.15
702 5 MC 0.02 0.00 -0.02
702 6 MC 0.15 0.16 0.00
702 7 MC 0.02 0.00 0.01
702 8 MC 0.22 0.23 0.03
702 9 MC -0.47 1.25 -0.09
Table 12. DIF Statistics (continued)
Form Item Item Type
MH Delta
MH Chi-Sq
Effect Size
DIF Category
Favored Group
702 10 MC -0.07 0.03 0.02
702 11 MC -0.66 2.83 -0.12
702 12 MC 1.58 11.17 0.21 C F
702 13 MC 0.56 1.76 0.05
702 14 MC 0.12 0.10 0.02
702 15 MC 0.03 0.00 -0.03
702 16 MC 0.14 0.13 0.04
702 17 MC 0.05 0.01 -0.01
702 18 MC 0.07 0.03 0.03
702 19 MC -0.37 1.09 -0.08
702 20 MC 1.17 7.58 0.19 B F
702 21 MC 0.31 0.76 0.07
702 22 MC -0.96 5.84 -0.13
702 23 MC 0.26 0.33 0.03
702 24 MC -0.71 3.33 -0.12
702 25 MC 0.93 4.84 0.16
702 26 MC 0.12 0.09 0.03
702 27 MC 0.37 1.03 0.08
702 28 MC -1.01 6.70 -0.19 B M
702 29 MC 0.23 0.31 0.05
702 30 MC 0.26 0.41 0.05
702 31 MC 0.39 0.97 0.06
702 32 MC -0.48 1.81 -0.08
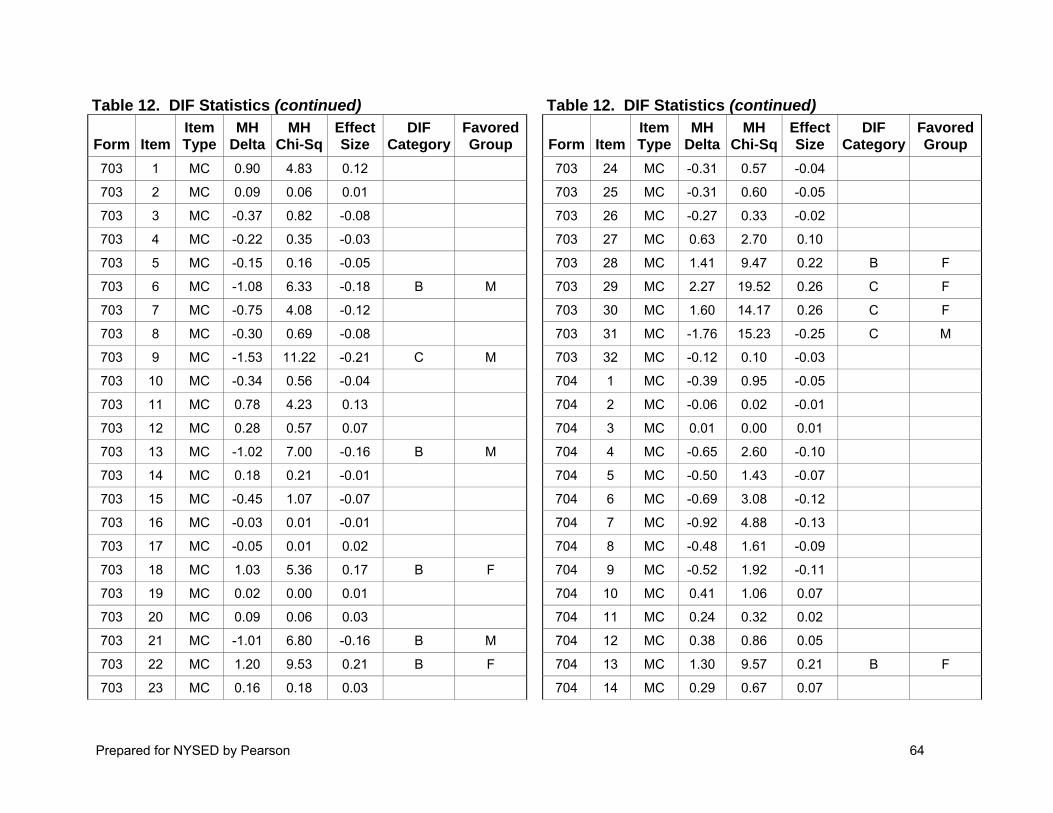
Prepared for NYSED by Pearson 64
Table 12. DIF Statistics (continued)
Form Item Item Type
MH Delta
MH Chi-Sq
Effect Size
DIF Category
Favored Group
703 1 MC 0.90 4.83 0.12
703 2 MC 0.09 0.06 0.01
703 3 MC -0.37 0.82 -0.08
703 4 MC -0.22 0.35 -0.03
703 5 MC -0.15 0.16 -0.05
703 6 MC -1.08 6.33 -0.18 B M
703 7 MC -0.75 4.08 -0.12
703 8 MC -0.30 0.69 -0.08
703 9 MC -1.53 11.22 -0.21 C M
703 10 MC -0.34 0.56 -0.04
703 11 MC 0.78 4.23 0.13
703 12 MC 0.28 0.57 0.07
703 13 MC -1.02 7.00 -0.16 B M
703 14 MC 0.18 0.21 -0.01
703 15 MC -0.45 1.07 -0.07
703 16 MC -0.03 0.01 -0.01
703 17 MC -0.05 0.01 0.02
703 18 MC 1.03 5.36 0.17 B F
703 19 MC 0.02 0.00 0.01
703 20 MC 0.09 0.06 0.03
703 21 MC -1.01 6.80 -0.16 B M
703 22 MC 1.20 9.53 0.21 B F
703 23 MC 0.16 0.18 0.03
Table 12. DIF Statistics (continued)
Form Item Item Type
MH Delta
MH Chi-Sq
Effect Size
DIF Category
Favored Group
703 24 MC -0.31 0.57 -0.04
703 25 MC -0.31 0.60 -0.05
703 26 MC -0.27 0.33 -0.02
703 27 MC 0.63 2.70 0.10
703 28 MC 1.41 9.47 0.22 B F
703 29 MC 2.27 19.52 0.26 C F
703 30 MC 1.60 14.17 0.26 C F
703 31 MC -1.76 15.23 -0.25 C M
703 32 MC -0.12 0.10 -0.03
704 1 MC -0.39 0.95 -0.05
704 2 MC -0.06 0.02 -0.01
704 3 MC 0.01 0.00 0.01
704 4 MC -0.65 2.60 -0.10
704 5 MC -0.50 1.43 -0.07
704 6 MC -0.69 3.08 -0.12
704 7 MC -0.92 4.88 -0.13
704 8 MC -0.48 1.61 -0.09
704 9 MC -0.52 1.92 -0.11
704 10 MC 0.41 1.06 0.07
704 11 MC 0.24 0.32 0.02
704 12 MC 0.38 0.86 0.05
704 13 MC 1.30 9.57 0.21 B F
704 14 MC 0.29 0.67 0.07
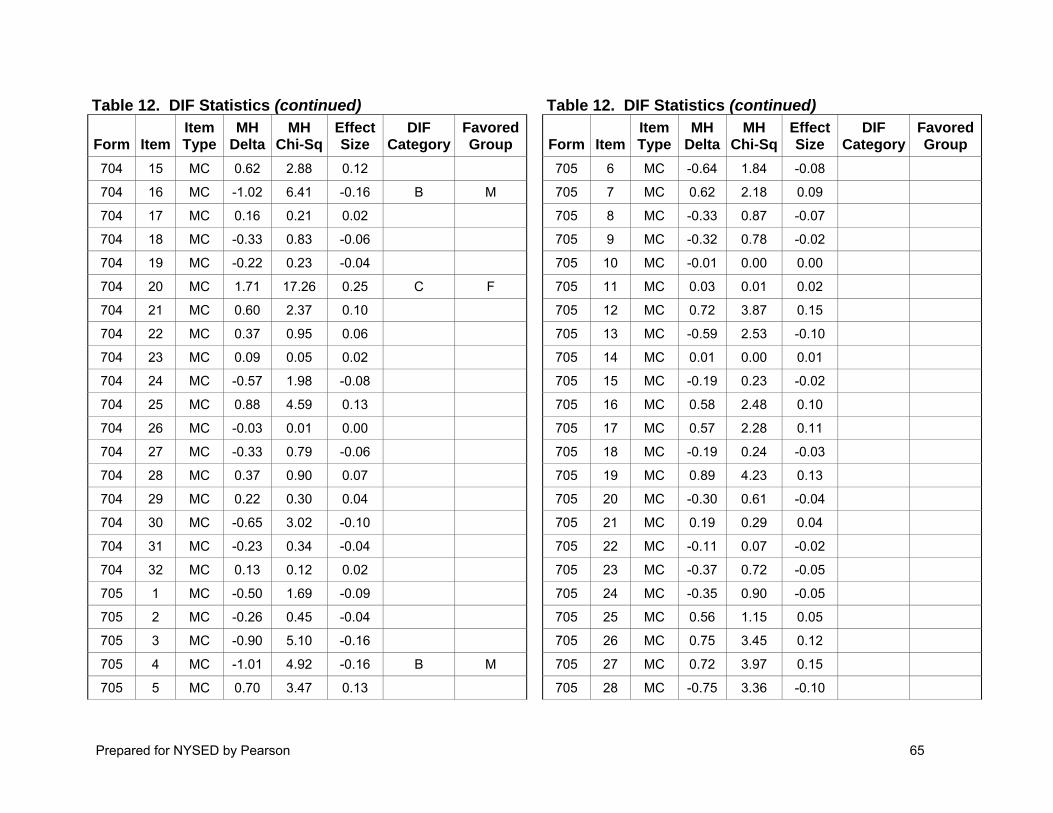
Prepared for NYSED by Pearson 65
Table 12. DIF Statistics (continued)
Form Item Item Type
MH Delta
MH Chi-Sq
Effect Size
DIF Category
Favored Group
704 15 MC 0.62 2.88 0.12
704 16 MC -1.02 6.41 -0.16 B M
704 17 MC 0.16 0.21 0.02
704 18 MC -0.33 0.83 -0.06
704 19 MC -0.22 0.23 -0.04
704 20 MC 1.71 17.26 0.25 C F
704 21 MC 0.60 2.37 0.10
704 22 MC 0.37 0.95 0.06
704 23 MC 0.09 0.05 0.02
704 24 MC -0.57 1.98 -0.08
704 25 MC 0.88 4.59 0.13
704 26 MC -0.03 0.01 0.00
704 27 MC -0.33 0.79 -0.06
704 28 MC 0.37 0.90 0.07
704 29 MC 0.22 0.30 0.04
704 30 MC -0.65 3.02 -0.10
704 31 MC -0.23 0.34 -0.04
704 32 MC 0.13 0.12 0.02
705 1 MC -0.50 1.69 -0.09
705 2 MC -0.26 0.45 -0.04
705 3 MC -0.90 5.10 -0.16
705 4 MC -1.01 4.92 -0.16 B M
705 5 MC 0.70 3.47 0.13
Table 12. DIF Statistics (continued)
Form Item Item Type
MH Delta
MH Chi-Sq
Effect Size
DIF Category
Favored Group
705 6 MC -0.64 1.84 -0.08
705 7 MC 0.62 2.18 0.09
705 8 MC -0.33 0.87 -0.07
705 9 MC -0.32 0.78 -0.02
705 10 MC -0.01 0.00 0.00
705 11 MC 0.03 0.01 0.02
705 12 MC 0.72 3.87 0.15
705 13 MC -0.59 2.53 -0.10
705 14 MC 0.01 0.00 0.01
705 15 MC -0.19 0.23 -0.02
705 16 MC 0.58 2.48 0.10
705 17 MC 0.57 2.28 0.11
705 18 MC -0.19 0.24 -0.03
705 19 MC 0.89 4.23 0.13
705 20 MC -0.30 0.61 -0.04
705 21 MC 0.19 0.29 0.04
705 22 MC -0.11 0.07 -0.02
705 23 MC -0.37 0.72 -0.05
705 24 MC -0.35 0.90 -0.05
705 25 MC 0.56 1.15 0.05
705 26 MC 0.75 3.45 0.12
705 27 MC 0.72 3.97 0.15
705 28 MC -0.75 3.36 -0.10

Prepared for NYSED by Pearson 66
Table 12. DIF Statistics (continued)
Form Item Item Type
MH Delta
MH Chi-Sq
Effect Size
DIF Category
Favored Group
705 29 MC 0.28 0.52 0.07
705 30 MC 0.31 0.72 0.06
705 31 MC 0.21 0.30 0.05
705 32 MC -0.77 3.57 -0.11
706 1 MC -0.74 3.05 -0.15
706 2 MC 0.43 1.20 0.07
706 3 MC -0.23 0.35 -0.06
706 4 MC -0.12 0.07 -0.03
706 5 MC 0.61 1.65 0.09
706 6 MC -0.09 0.04 0.00
706 7 MC 0.47 1.31 0.08
706 8 MC 0.90 4.05 0.16
706 9 MC -1.17 9.98 -0.21 B M
706 10 MC 0.29 0.57 0.05
706 11 MC -0.59 1.83 -0.04
706 12 MC -0.80 4.09 -0.13
706 13 MC -1.10 6.89 -0.17 B M
706 14 MC 0.21 0.18 0.05
706 15 MC 0.33 0.78 0.08
706 16 MC 0.94 5.68 0.13
706 17 MC 0.25 0.40 0.07
706 18 MC 0.24 0.30 0.04
706 19 MC 0.11 0.05 0.02
Table 12. DIF Statistics (continued)
Form Item Item Type
MH Delta
MH Chi-Sq
Effect Size
DIF Category
Favored Group
706 20 MC -1.22 7.99 -0.17 B M
706 21 MC -1.36 11.92 -0.23 B M
706 22 MC 0.23 0.40 0.04
706 23 MC 1.21 7.53 0.16 B F
706 24 MC 1.26 9.07 0.19 B F
706 25 MC -0.17 0.20 -0.03
706 26 MC -0.55 2.07 -0.08
706 27 MC 0.01 0.00 -0.03
706 28 MC 0.50 1.76 0.10
706 29 MC 0.47 1.37 0.11
706 30 MC 0.12 0.10 0.02
706 31 MC 0.01 0.00 0.01
706 32 MC 0.04 0.01 -0.01
707 1 MC 0.28 0.53 0.06
707 2 MC -0.90 5.53 -0.15
707 3 MC -0.85 3.00 -0.10
707 4 MC -0.79 3.58 -0.12
707 5 MC 0.46 1.67 0.10
707 6 MC -0.64 2.93 -0.12
707 7 MC -0.20 0.20 -0.03
707 8 MC 0.67 2.35 0.12
707 9 MC -1.09 5.87 -0.17 B M
707 10 MC -1.08 8.02 -0.20 B M

Prepared for NYSED by Pearson 67
Table 12. DIF Statistics (continued)
Form Item Item Type
MH Delta
MH Chi-Sq
Effect Size
DIF Category
Favored Group
707 11 MC 0.04 0.01 0.00
707 12 MC -0.63 1.75 -0.09
707 13 MC 0.20 0.24 0.05
707 14 MC 0.75 3.07 0.12
707 15 MC 0.60 2.53 0.12
707 16 MC -0.27 0.49 -0.05
707 17 MC -0.03 0.01 0.01
707 18 MC 1.19 6.57 0.18 B F
707 19 MC -0.08 0.04 -0.02
707 20 MC 1.06 6.83 0.18 B F
707 21 MC -0.62 2.56 -0.09
707 22 MC 0.54 1.76 0.08
707 23 MC 0.09 0.05 0.02
707 24 MC -0.17 0.18 -0.03
707 25 MC 0.39 0.92 0.05
707 26 MC -0.21 0.24 -0.03
707 27 MC 0.13 0.08 0.01
707 28 MC -0.04 0.01 -0.02
707 29 MC 0.13 0.10 0.03
707 30 MC -0.59 2.09 -0.10
707 31 MC 1.01 6.94 0.18 B F
707 32 MC 0.41 1.12 0.09
708 1 MC 1.09 4.26 0.15 B F
Table 12. DIF Statistics (continued)
Form Item Item Type
MH Delta
MH Chi-Sq
Effect Size
DIF Category
Favored Group
708 2 MC -1.16 5.35 -0.15 B M
708 3 MC -0.70 2.30 -0.11
708 4 MC 0.39 0.96 0.07
708 5 MC -0.09 0.06 -0.03
708 6 MC 0.12 0.11 0.03
708 7 MC 0.42 0.99 0.07
708 8 MC 0.19 0.24 0.05
708 9 MC -0.22 0.35 -0.05
708 10 MC 0.21 0.33 0.04
708 11 MC 1.34 8.51 0.20 B F
708 12 MC -0.45 1.20 -0.07
708 13 MC 0.04 0.01 0.00
708 14 MC -0.45 1.29 -0.08
708 15 MC 0.11 0.06 0.01
708 16 MC -0.15 0.15 -0.03
708 17 MC -0.85 5.36 -0.15
708 18 MC -0.07 0.03 -0.03
708 19 MC -0.67 2.97 -0.10
708 20 MC 0.40 1.04 0.08
708 21 MC 0.08 0.04 0.02
708 22 MC 0.49 1.53 0.07
708 23 MC -0.13 0.09 -0.02
708 24 MC 0.31 0.52 0.05
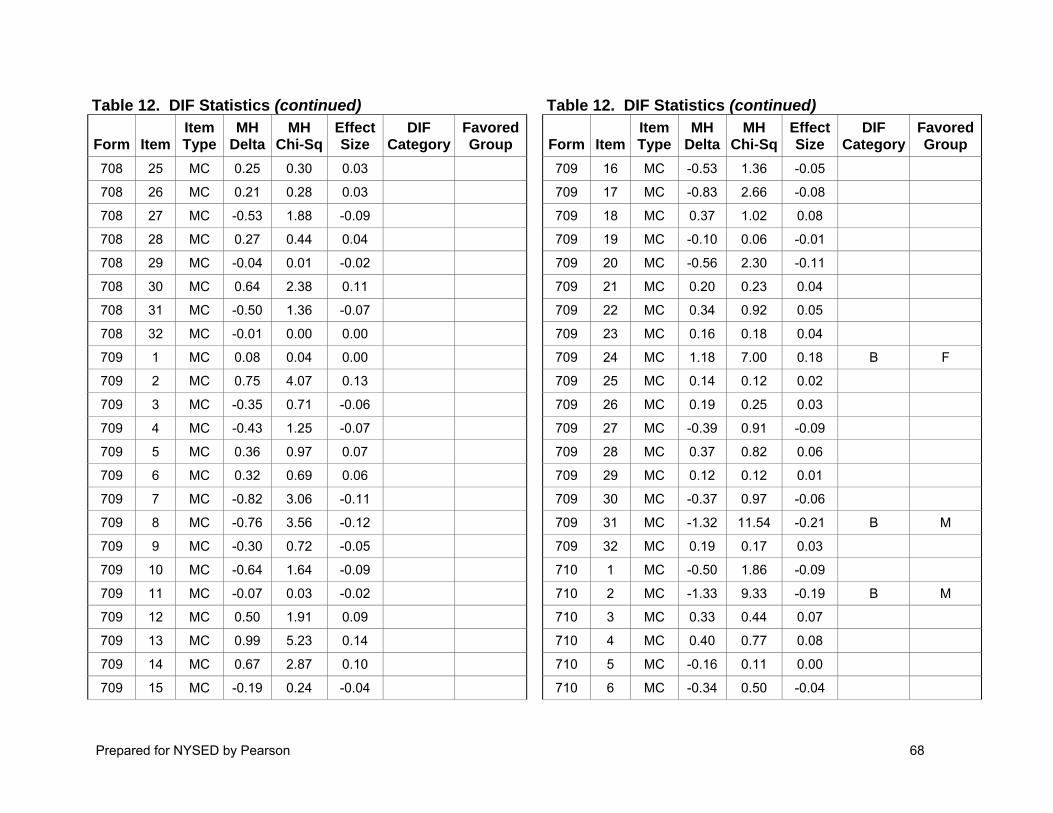
Prepared for NYSED by Pearson 68
Table 12. DIF Statistics (continued)
Form Item Item Type
MH Delta
MH Chi-Sq
Effect Size
DIF Category
Favored Group
708 25 MC 0.25 0.30 0.03
708 26 MC 0.21 0.28 0.03
708 27 MC -0.53 1.88 -0.09
708 28 MC 0.27 0.44 0.04
708 29 MC -0.04 0.01 -0.02
708 30 MC 0.64 2.38 0.11
708 31 MC -0.50 1.36 -0.07
708 32 MC -0.01 0.00 0.00
709 1 MC 0.08 0.04 0.00
709 2 MC 0.75 4.07 0.13
709 3 MC -0.35 0.71 -0.06
709 4 MC -0.43 1.25 -0.07
709 5 MC 0.36 0.97 0.07
709 6 MC 0.32 0.69 0.06
709 7 MC -0.82 3.06 -0.11
709 8 MC -0.76 3.56 -0.12
709 9 MC -0.30 0.72 -0.05
709 10 MC -0.64 1.64 -0.09
709 11 MC -0.07 0.03 -0.02
709 12 MC 0.50 1.91 0.09
709 13 MC 0.99 5.23 0.14
709 14 MC 0.67 2.87 0.10
709 15 MC -0.19 0.24 -0.04
Table 12. DIF Statistics (continued)
Form Item Item Type
MH Delta
MH Chi-Sq
Effect Size
DIF Category
Favored Group
709 16 MC -0.53 1.36 -0.05
709 17 MC -0.83 2.66 -0.08
709 18 MC 0.37 1.02 0.08
709 19 MC -0.10 0.06 -0.01
709 20 MC -0.56 2.30 -0.11
709 21 MC 0.20 0.23 0.04
709 22 MC 0.34 0.92 0.05
709 23 MC 0.16 0.18 0.04
709 24 MC 1.18 7.00 0.18 B F
709 25 MC 0.14 0.12 0.02
709 26 MC 0.19 0.25 0.03
709 27 MC -0.39 0.91 -0.09
709 28 MC 0.37 0.82 0.06
709 29 MC 0.12 0.12 0.01
709 30 MC -0.37 0.97 -0.06
709 31 MC -1.32 11.54 -0.21 B M
709 32 MC 0.19 0.17 0.03
710 1 MC -0.50 1.86 -0.09
710 2 MC -1.33 9.33 -0.19 B M
710 3 MC 0.33 0.44 0.07
710 4 MC 0.40 0.77 0.08
710 5 MC -0.16 0.11 0.00
710 6 MC -0.34 0.50 -0.04
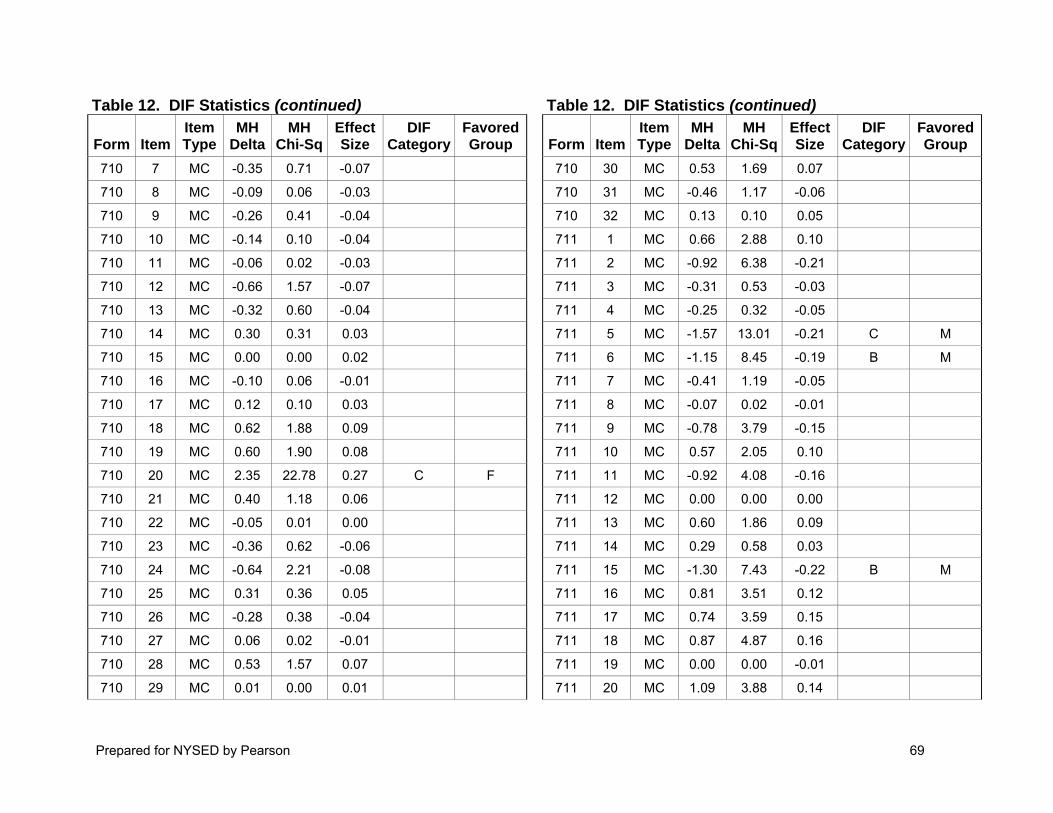
Prepared for NYSED by Pearson 69
Table 12. DIF Statistics (continued)
Form Item Item Type
MH Delta
MH Chi-Sq
Effect Size
DIF Category
Favored Group
710 7 MC -0.35 0.71 -0.07
710 8 MC -0.09 0.06 -0.03
710 9 MC -0.26 0.41 -0.04
710 10 MC -0.14 0.10 -0.04
710 11 MC -0.06 0.02 -0.03
710 12 MC -0.66 1.57 -0.07
710 13 MC -0.32 0.60 -0.04
710 14 MC 0.30 0.31 0.03
710 15 MC 0.00 0.00 0.02
710 16 MC -0.10 0.06 -0.01
710 17 MC 0.12 0.10 0.03
710 18 MC 0.62 1.88 0.09
710 19 MC 0.60 1.90 0.08
710 20 MC 2.35 22.78 0.27 C F
710 21 MC 0.40 1.18 0.06
710 22 MC -0.05 0.01 0.00
710 23 MC -0.36 0.62 -0.06
710 24 MC -0.64 2.21 -0.08
710 25 MC 0.31 0.36 0.05
710 26 MC -0.28 0.38 -0.04
710 27 MC 0.06 0.02 -0.01
710 28 MC 0.53 1.57 0.07
710 29 MC 0.01 0.00 0.01
Table 12. DIF Statistics (continued)
Form Item Item Type
MH Delta
MH Chi-Sq
Effect Size
DIF Category
Favored Group
710 30 MC 0.53 1.69 0.07
710 31 MC -0.46 1.17 -0.06
710 32 MC 0.13 0.10 0.05
711 1 MC 0.66 2.88 0.10
711 2 MC -0.92 6.38 -0.21
711 3 MC -0.31 0.53 -0.03
711 4 MC -0.25 0.32 -0.05
711 5 MC -1.57 13.01 -0.21 C M
711 6 MC -1.15 8.45 -0.19 B M
711 7 MC -0.41 1.19 -0.05
711 8 MC -0.07 0.02 -0.01
711 9 MC -0.78 3.79 -0.15
711 10 MC 0.57 2.05 0.10
711 11 MC -0.92 4.08 -0.16
711 12 MC 0.00 0.00 0.00
711 13 MC 0.60 1.86 0.09
711 14 MC 0.29 0.58 0.03
711 15 MC -1.30 7.43 -0.22 B M
711 16 MC 0.81 3.51 0.12
711 17 MC 0.74 3.59 0.15
711 18 MC 0.87 4.87 0.16
711 19 MC 0.00 0.00 -0.01
711 20 MC 1.09 3.88 0.14

Prepared for NYSED by Pearson 70
Table 12. DIF Statistics (continued)
Form Item Item Type
MH Delta
MH Chi-Sq
Effect Size
DIF Category
Favored Group
711 21 MC 1.31 8.41 0.19 B F
711 22 MC 0.05 0.02 0.00
711 23 MC 0.39 0.76 0.05
711 24 MC 0.68 2.60 0.11
711 25 MC 0.73 2.88 0.11
711 26 MC -0.09 0.04 0.00
711 27 MC -0.09 0.04 0.00
711 28 MC 0.95 2.64 0.10
711 29 MC -1.14 6.23 -0.20 B M
711 30 MC 0.55 1.87 0.13
711 31 MC -0.39 0.81 -0.07
711 32 MC -0.20 0.28 -0.07
712 THM OE 23.46 0.20 BB F
713 THM OE 7.55 0.12
714 THM OE 10.40 0.13
715 THM OE 0.04 0.01
716 01 OE 2.04 0.07
716 02 OE 14.48 0.18 BB F
716 03 OE 8.13 0.13
716 04 OE 21.84 0.21 BB F
716 05 OE 5.31 0.10
716 06 OE 0.01 0.01
716 07 OE 5.24 0.10
Table 12. DIF Statistics (continued)
Form Item Item Type
MH Delta
MH Chi-Sq
Effect Size
DIF Category
Favored Group
716 08 OE 13.45 0.17
716 09 OE 4.83 0.10
716 DBQ OE 15.50 0.17 BB F
717 01 OE 10.73 0.16
717 02 OE 15.61 0.19 BB F
717 3a OE 9.51 0.15
717 3b OE 8.20 0.15
717 04 OE 26.62 0.24 BB F
717 05 OE 12.07 0.17
717 06 OE 13.07 0.17
717 07 OE 5.79 0.11
717 8a OE 8.21 0.13
717 8b OE 18.06 0.19 BB F
717 09 OE 21.37 0.21 BB F
717 DBQ OE 33.96 0.25 BB F
718 01 OE 3.23 0.08
718 02 OE 0.00 0.00
718 03 OE 3.24 0.08
718 04 OE 5.16 0.11
718 05 OE 3.02 0.08
718 06 OE 2.94 0.07
718 07 OE 6.54 0.11
718 8a OE 1.75 0.05

Prepared for NYSED by Pearson 71
Table 12. DIF Statistics (continued)
Form Item Item Type
MH Delta
MH Chi-Sq
Effect Size
DIF Category
Favored Group
718 8b OE 0.27 0.03
718 09 OE 3.31 0.09
718 DBQ OE 34.04 0.25 CC F
719 01 OE 9.18 0.13
719 2a OE 17.90 0.19 BB F
719 2b OE 23.91 0.22 BB F
719 03 OE 13.96 0.17
719 04 OE 28.21 0.24 BB F
Table 12. DIF Statistics (continued)
Form Item Item Type
MH Delta
MH Chi-Sq
Effect Size
DIF Category
Favored Group
719 05 OE 31.31 0.26 CC F
719 06 OE 23.56 0.23 BB F
719 07 OE 8.41 0.12
719 08 OE 0.52 0.05
719 9a OE 16.64 0.19 BB F
719 9b OE 23.11 0.22 BB F
719 DBQ OE 22.51 0.20 BB F
*DIF Category meanings: A/AA=negligible, B/BB=moderate, C/CC=large
Prepared for NYSED by Pearson 72
Appendix D: Operational Test Maps
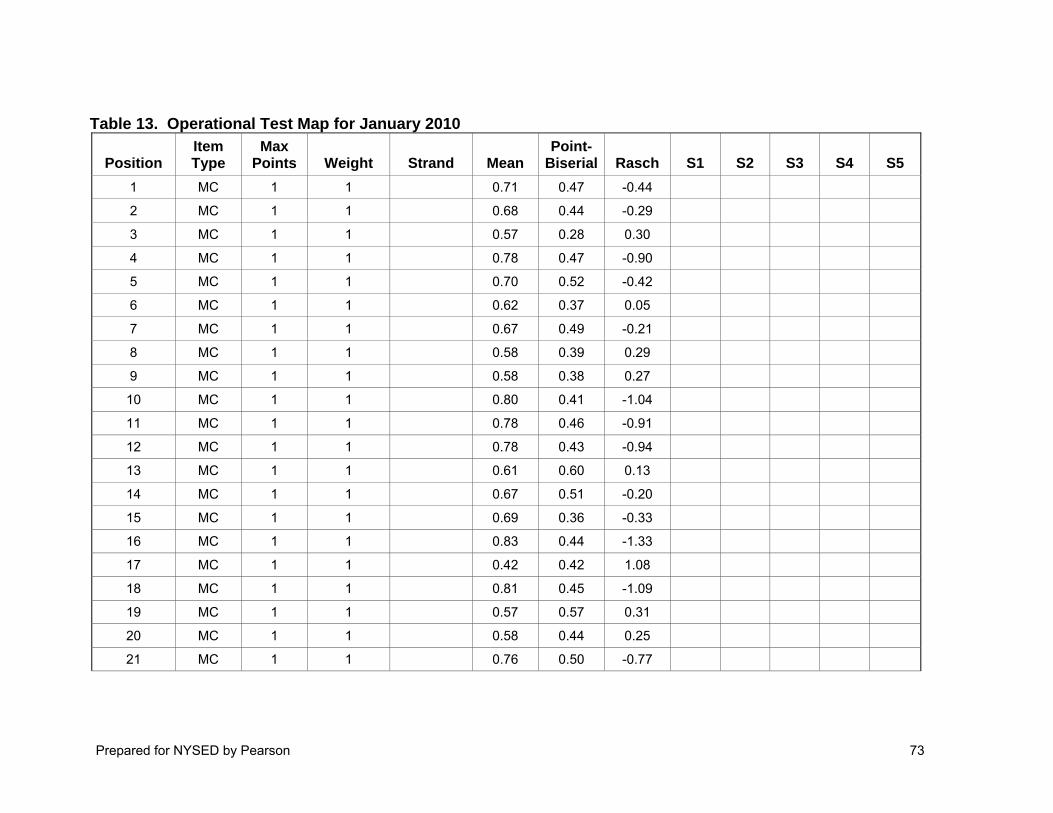
Prepared for NYSED by Pearson 73
Table 13. Operational Test Map for January 2010
Position Item Type
Max Points Weight Strand Mean
Point-Biserial Rasch S1 S2 S3 S4 S5
1 MC 1 1 0.71 0.47 -0.44
2 MC 1 1 0.68 0.44 -0.29
3 MC 1 1 0.57 0.28 0.30
4 MC 1 1 0.78 0.47 -0.90
5 MC 1 1 0.70 0.52 -0.42
6 MC 1 1 0.62 0.37 0.05
7 MC 1 1 0.67 0.49 -0.21
8 MC 1 1 0.58 0.39 0.29
9 MC 1 1 0.58 0.38 0.27
10 MC 1 1 0.80 0.41 -1.04
11 MC 1 1 0.78 0.46 -0.91
12 MC 1 1 0.78 0.43 -0.94
13 MC 1 1 0.61 0.60 0.13
14 MC 1 1 0.67 0.51 -0.20
15 MC 1 1 0.69 0.36 -0.33
16 MC 1 1 0.83 0.44 -1.33
17 MC 1 1 0.42 0.42 1.08
18 MC 1 1 0.81 0.45 -1.09
19 MC 1 1 0.57 0.57 0.31
20 MC 1 1 0.58 0.44 0.25
21 MC 1 1 0.76 0.50 -0.77
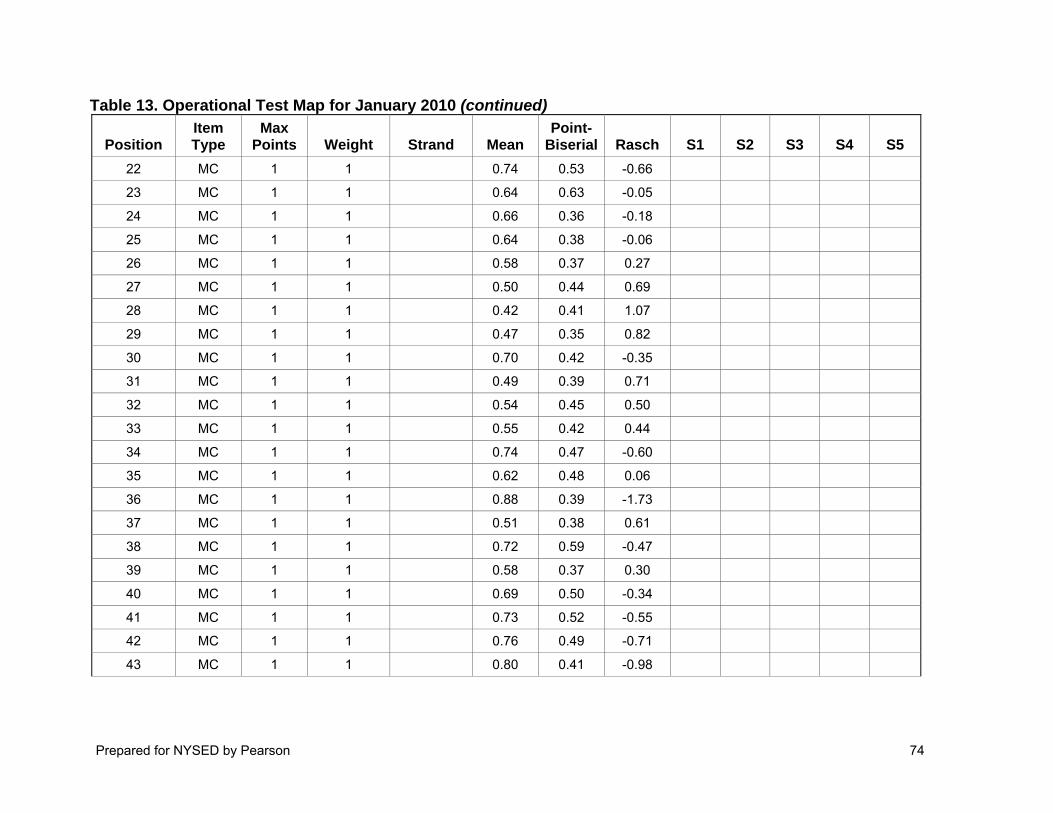
Prepared for NYSED by Pearson 74
Table 13. Operational Test Map for January 2010 (continued)
Position Item Type
Max Points Weight Strand Mean
Point-Biserial Rasch S1 S2 S3 S4 S5
22 MC 1 1 0.74 0.53 -0.66
23 MC 1 1 0.64 0.63 -0.05
24 MC 1 1 0.66 0.36 -0.18
25 MC 1 1 0.64 0.38 -0.06
26 MC 1 1 0.58 0.37 0.27
27 MC 1 1 0.50 0.44 0.69
28 MC 1 1 0.42 0.41 1.07
29 MC 1 1 0.47 0.35 0.82
30 MC 1 1 0.70 0.42 -0.35
31 MC 1 1 0.49 0.39 0.71
32 MC 1 1 0.54 0.45 0.50
33 MC 1 1 0.55 0.42 0.44
34 MC 1 1 0.74 0.47 -0.60
35 MC 1 1 0.62 0.48 0.06
36 MC 1 1 0.88 0.39 -1.73
37 MC 1 1 0.51 0.38 0.61
38 MC 1 1 0.72 0.59 -0.47
39 MC 1 1 0.58 0.37 0.30
40 MC 1 1 0.69 0.50 -0.34
41 MC 1 1 0.73 0.52 -0.55
42 MC 1 1 0.76 0.49 -0.71
43 MC 1 1 0.80 0.41 -0.98
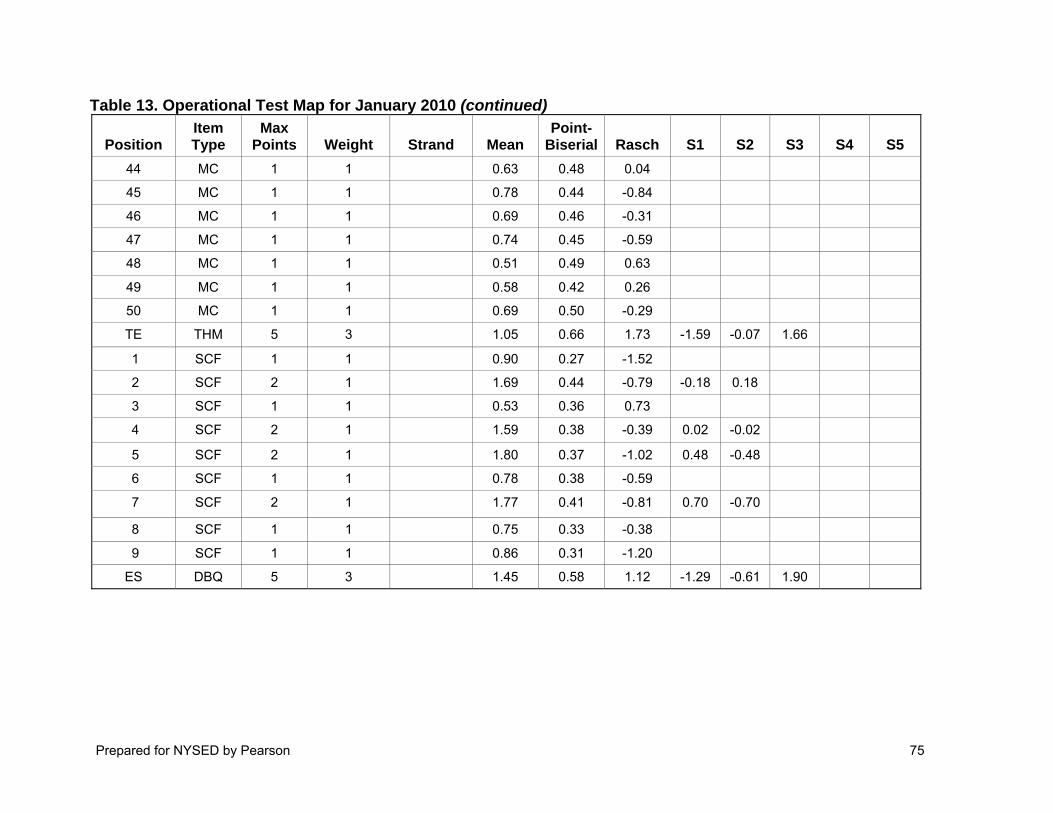
Prepared for NYSED by Pearson 75
Table 13. Operational Test Map for January 2010 (continued)
Position Item Type
Max Points Weight Strand Mean
Point-Biserial Rasch S1 S2 S3 S4 S5
44 MC 1 1 0.63 0.48 0.04
45 MC 1 1 0.78 0.44 -0.84
46 MC 1 1 0.69 0.46 -0.31
47 MC 1 1 0.74 0.45 -0.59
48 MC 1 1 0.51 0.49 0.63
49 MC 1 1 0.58 0.42 0.26
50 MC 1 1 0.69 0.50 -0.29
TE THM 5 3 1.05 0.66 1.73 -1.59 -0.07 1.66
1 SCF 1 1 0.90 0.27 -1.52
2 SCF 2 1 1.69 0.44 -0.79 -0.18 0.18
3 SCF 1 1 0.53 0.36 0.73
4 SCF 2 1 1.59 0.38 -0.39 0.02 -0.02
5 SCF 2 1 1.80 0.37 -1.02 0.48 -0.48
6 SCF 1 1 0.78 0.38 -0.59
7 SCF 2 1 1.77 0.41 -0.81 0.70 -0.70
8 SCF 1 1 0.75 0.33 -0.38
9 SCF 1 1 0.86 0.31 -1.20
ES DBQ 5 3 1.45 0.58 1.12 -1.29 -0.61 1.90

Prepared for NYSED by Pearson 76
Table 14. Operational Test Map for June 2010
Position Item Type
Max Points Weight Strand Mean
Point-Biserial Rasch S1 S2 S3 S4 S5
1 MC 1 1 2 0.63 0.44 0.03
2 MC 1 1 3 0.77 0.40 -0.81
3 MC 1 1 2 0.51 0.35 0.61
4 MC 1 1 3 0.71 0.40 -0.43
5 MC 1 1 2 0.82 0.45 -1.18
6 MC 1 1 3 0.66 0.40 -0.15
7 MC 1 1 2 0.51 0.37 0.62
8 MC 1 1 3 0.72 0.33 -0.51
9 MC 1 1 2 0.71 0.46 -0.42
10 MC 1 1 3 0.68 0.40 -0.24
11 MC 1 1 4 0.65 0.39 -0.09
12 MC 1 1 2 0.70 0.40 -0.34
13 MC 1 1 3 0.81 0.47 -1.11
14 MC 1 1 2 0.50 0.42 0.65
15 MC 1 1 3 0.49 0.46 0.65
16 MC 1 1 4 0.61 0.41 0.12
17 MC 1 1 5 0.75 0.52 -0.68
18 MC 1 1 2 0.74 0.49 -0.62
19 MC 1 1 5 0.56 0.51 0.37
20 MC 1 1 2 0.60 0.45 0.17
21 MC 1 1 4 0.68 0.48 -0.23
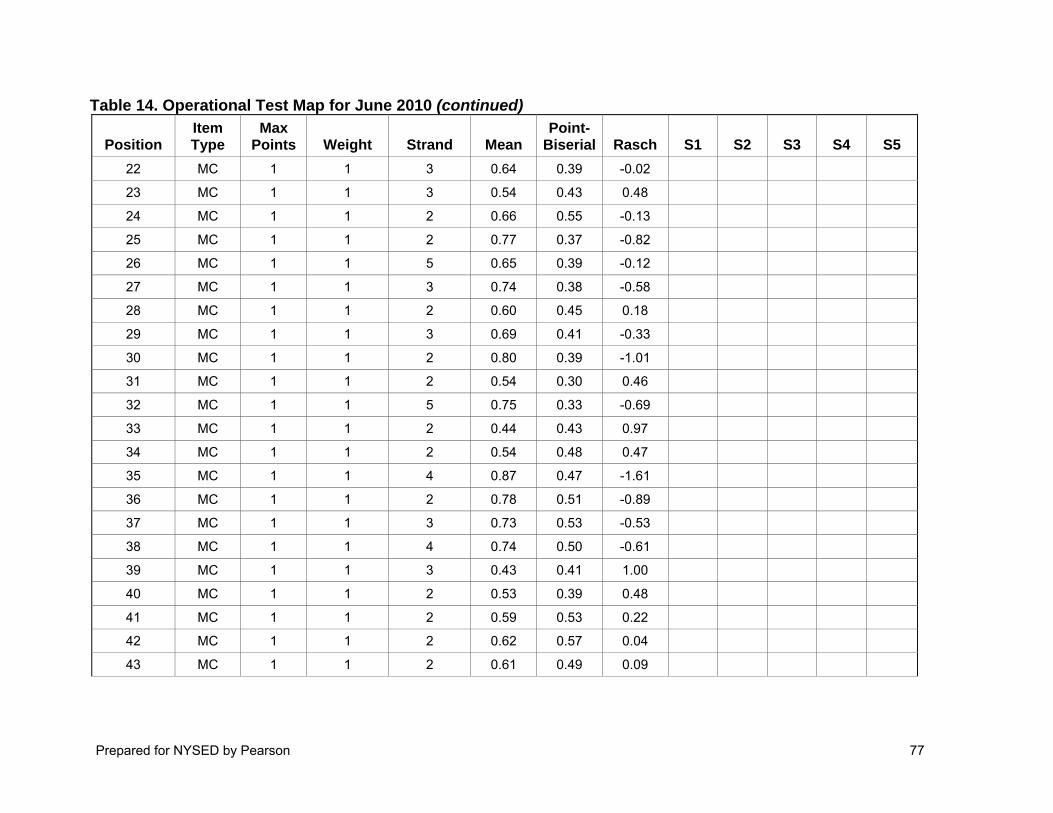
Prepared for NYSED by Pearson 77
Table 14. Operational Test Map for June 2010 (continued)
Position Item Type
Max Points Weight Strand Mean
Point-Biserial Rasch S1 S2 S3 S4 S5
22 MC 1 1 3 0.64 0.39 -0.02
23 MC 1 1 3 0.54 0.43 0.48
24 MC 1 1 2 0.66 0.55 -0.13
25 MC 1 1 2 0.77 0.37 -0.82
26 MC 1 1 5 0.65 0.39 -0.12
27 MC 1 1 3 0.74 0.38 -0.58
28 MC 1 1 2 0.60 0.45 0.18
29 MC 1 1 3 0.69 0.41 -0.33
30 MC 1 1 2 0.80 0.39 -1.01
31 MC 1 1 2 0.54 0.30 0.46
32 MC 1 1 5 0.75 0.33 -0.69
33 MC 1 1 2 0.44 0.43 0.97
34 MC 1 1 2 0.54 0.48 0.47
35 MC 1 1 4 0.87 0.47 -1.61
36 MC 1 1 2 0.78 0.51 -0.89
37 MC 1 1 3 0.73 0.53 -0.53
38 MC 1 1 4 0.74 0.50 -0.61
39 MC 1 1 3 0.43 0.41 1.00
40 MC 1 1 2 0.53 0.39 0.48
41 MC 1 1 2 0.59 0.53 0.22
42 MC 1 1 2 0.62 0.57 0.04
43 MC 1 1 2 0.61 0.49 0.09

Prepared for NYSED by Pearson 78
Table 14. Operational Test Map for June 2010 (continued)
Position Item Type
Max Points Weight Strand Mean
Point-Biserial Rasch S1 S2 S3 S4 S5
44 MC 1 1 3 0.48 0.47 0.73
45 MC 1 1 4 0.57 0.39 0.30
46 MC 1 1 3 0.79 0.47 -0.90
47 MC 1 1 2 0.69 0.48 -0.32
48 MC 1 1 2 0.43 0.27 1.00
49 MC 1 1 4 0.60 0.50 0.18
50 MC 1 1 2 0.64 0.33 -0.07
TE TE 5 3 1.24 0.66 2.74 -2.89 -1.53 -0.08 4.50
1 SCF 1 1 0.87 0.30 -1.31
2a SCF 1 1 0.95 0.30 -2.35
2b SCF 1 1 0.97 0.25 -2.75
3 SCF 1 1 0.80 0.33 -0.68
4 SCF 1 1 0.65 0.31 0.18
5 SCF 1 1 0.62 0.39 0.28
6a SCF 1 1 0.91 0.27 -1.78
6b SCF 2 1 1.63 0.39 -0.61 -0.21 0.21
7 SCF 1 1 0.69 0.31 -0.03
8 SCF 1 1 0.48 0.31 0.98
9 SCF 2 1 1.66 0.46 -0.50 0.52 -0.52
ES 5 3 1.60 0.55 2.60 -2.62 -2.50 -0.32 5.44
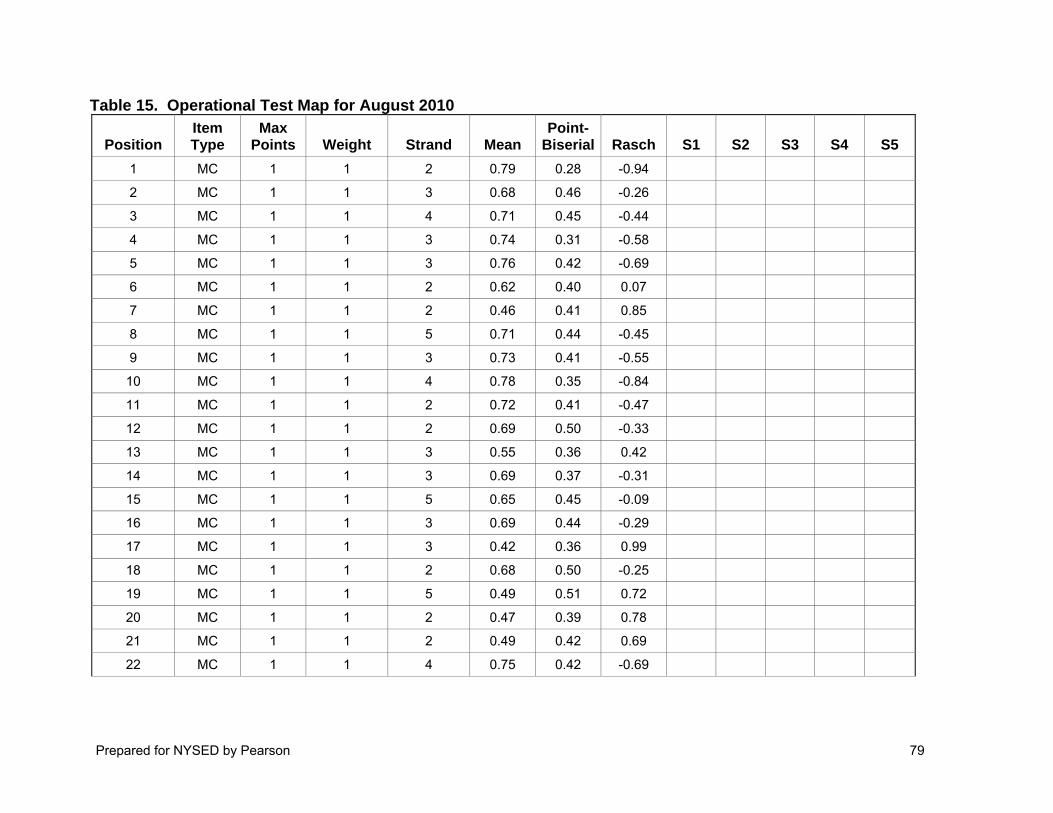
Prepared for NYSED by Pearson 79
Table 15. Operational Test Map for August 2010
Position Item Type
Max Points Weight Strand Mean
Point-Biserial Rasch S1 S2 S3 S4 S5
1 MC 1 1 2 0.79 0.28 -0.94
2 MC 1 1 3 0.68 0.46 -0.26
3 MC 1 1 4 0.71 0.45 -0.44
4 MC 1 1 3 0.74 0.31 -0.58
5 MC 1 1 3 0.76 0.42 -0.69
6 MC 1 1 2 0.62 0.40 0.07
7 MC 1 1 2 0.46 0.41 0.85
8 MC 1 1 5 0.71 0.44 -0.45
9 MC 1 1 3 0.73 0.41 -0.55
10 MC 1 1 4 0.78 0.35 -0.84
11 MC 1 1 2 0.72 0.41 -0.47
12 MC 1 1 2 0.69 0.50 -0.33
13 MC 1 1 3 0.55 0.36 0.42
14 MC 1 1 3 0.69 0.37 -0.31
15 MC 1 1 5 0.65 0.45 -0.09
16 MC 1 1 3 0.69 0.44 -0.29
17 MC 1 1 3 0.42 0.36 0.99
18 MC 1 1 2 0.68 0.50 -0.25
19 MC 1 1 5 0.49 0.51 0.72
20 MC 1 1 2 0.47 0.39 0.78
21 MC 1 1 2 0.49 0.42 0.69
22 MC 1 1 4 0.75 0.42 -0.69
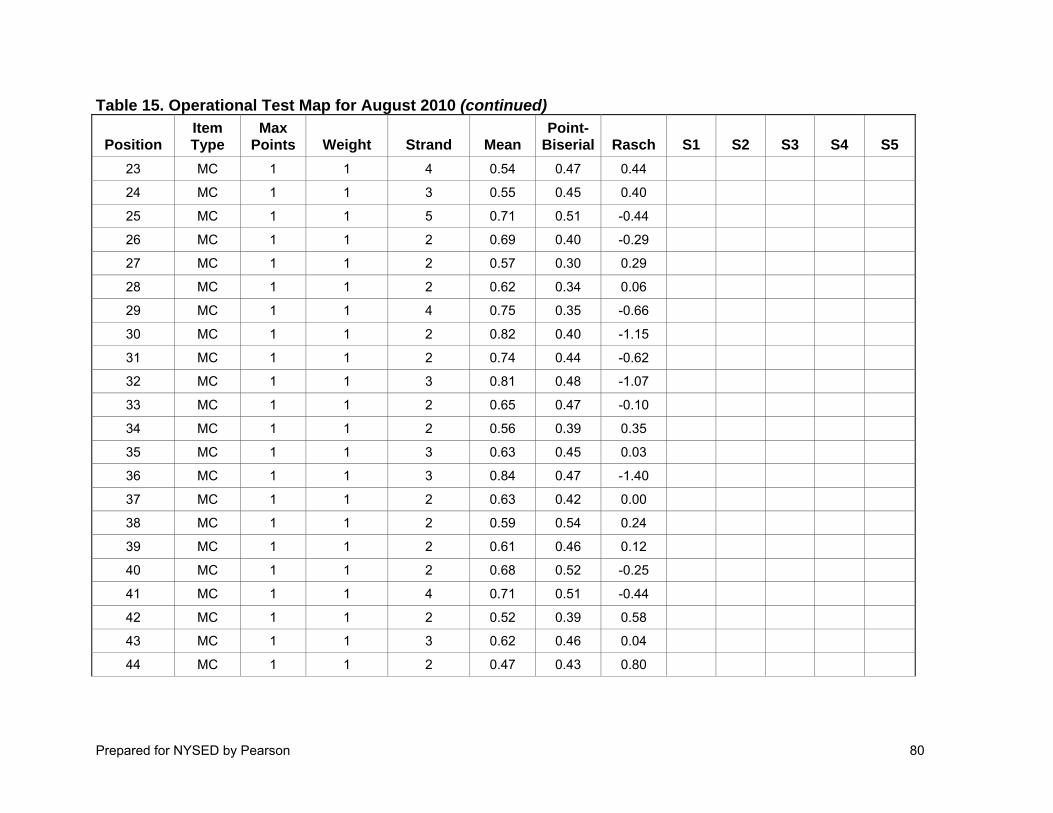
Prepared for NYSED by Pearson 80
Table 15. Operational Test Map for August 2010 (continued)
Position Item Type
Max Points Weight Strand Mean
Point-Biserial Rasch S1 S2 S3 S4 S5
23 MC 1 1 4 0.54 0.47 0.44
24 MC 1 1 3 0.55 0.45 0.40
25 MC 1 1 5 0.71 0.51 -0.44
26 MC 1 1 2 0.69 0.40 -0.29
27 MC 1 1 2 0.57 0.30 0.29
28 MC 1 1 2 0.62 0.34 0.06
29 MC 1 1 4 0.75 0.35 -0.66
30 MC 1 1 2 0.82 0.40 -1.15
31 MC 1 1 2 0.74 0.44 -0.62
32 MC 1 1 3 0.81 0.48 -1.07
33 MC 1 1 2 0.65 0.47 -0.10
34 MC 1 1 2 0.56 0.39 0.35
35 MC 1 1 3 0.63 0.45 0.03
36 MC 1 1 3 0.84 0.47 -1.40
37 MC 1 1 2 0.63 0.42 0.00
38 MC 1 1 2 0.59 0.54 0.24
39 MC 1 1 2 0.61 0.46 0.12
40 MC 1 1 2 0.68 0.52 -0.25
41 MC 1 1 4 0.71 0.51 -0.44
42 MC 1 1 2 0.52 0.39 0.58
43 MC 1 1 3 0.62 0.46 0.04
44 MC 1 1 2 0.47 0.43 0.80
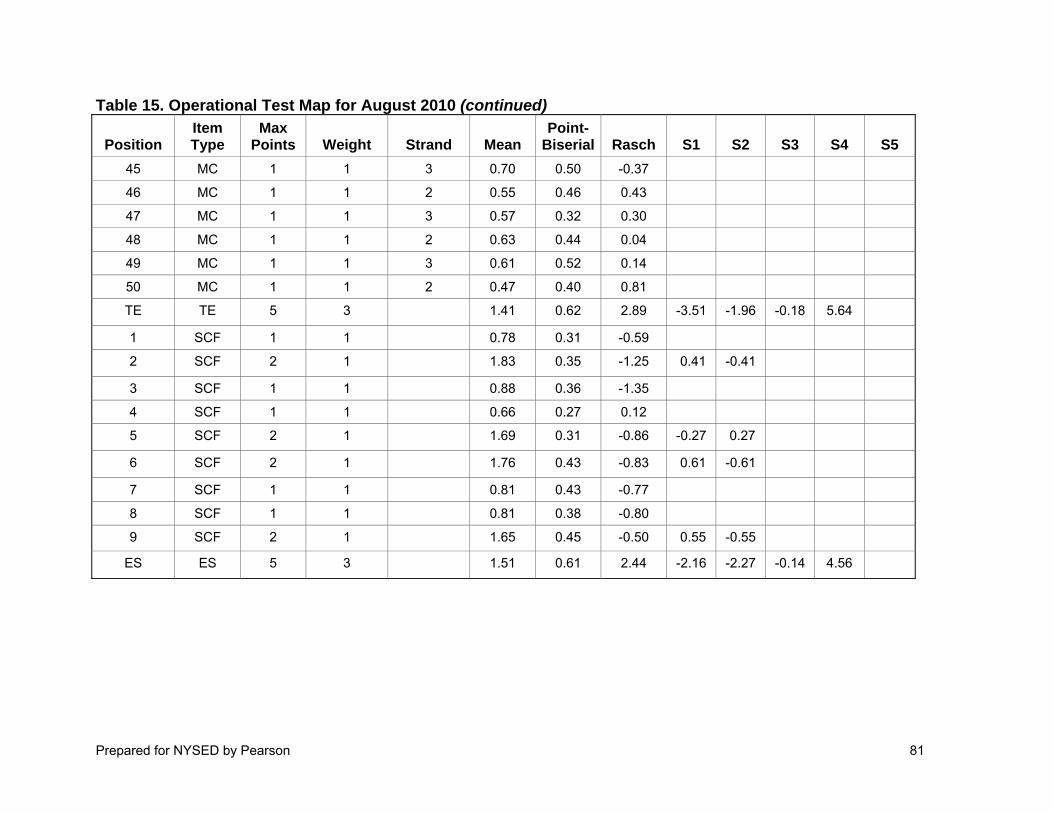
Prepared for NYSED by Pearson 81
Table 15. Operational Test Map for August 2010 (continued)
Position Item Type
Max Points Weight Strand Mean
Point-Biserial Rasch S1 S2 S3 S4 S5
45 MC 1 1 3 0.70 0.50 -0.37
46 MC 1 1 2 0.55 0.46 0.43
47 MC 1 1 3 0.57 0.32 0.30
48 MC 1 1 2 0.63 0.44 0.04
49 MC 1 1 3 0.61 0.52 0.14
50 MC 1 1 2 0.47 0.40 0.81
TE TE 5 3 1.41 0.62 2.89 -3.51 -1.96 -0.18 5.64
1 SCF 1 1 0.78 0.31 -0.59
2 SCF 2 1 1.83 0.35 -1.25 0.41 -0.41
3 SCF 1 1 0.88 0.36 -1.35
4 SCF 1 1 0.66 0.27 0.12
5 SCF 2 1 1.69 0.31 -0.86 -0.27 0.27
6 SCF 2 1 1.76 0.43 -0.83 0.61 -0.61
7 SCF 1 1 0.81 0.43 -0.77
8 SCF 1 1 0.81 0.38 -0.80
9 SCF 2 1 1.65 0.45 -0.50 0.55 -0.55
ES ES 5 3 1.51 0.61 2.44 -2.16 -2.27 -0.14 4.56
Prepared for NYSED by Pearson 82
Appendix E: Scoring Tables
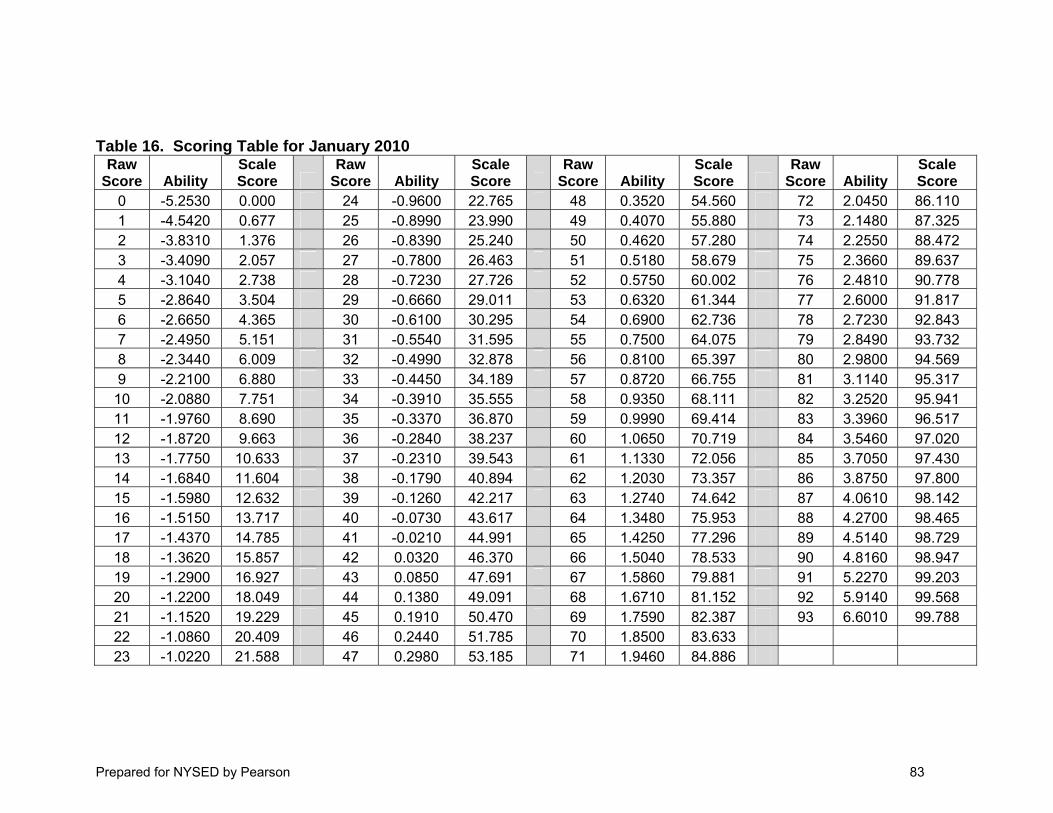
Prepared for NYSED by Pearson 83
Table 16. Scoring Table for January 2010
Raw Score Ability
Scale Score
Raw Score Ability
Scale Score
Raw Score Ability
Scale Score
Raw Score Ability
Scale Score
0 -5.2530 0.000 24 -0.9600 22.765 48 0.3520 54.560 72 2.0450 86.110 1 -4.5420 0.677 25 -0.8990 23.990 49 0.4070 55.880 73 2.1480 87.325 2 -3.8310 1.376 26 -0.8390 25.240 50 0.4620 57.280 74 2.2550 88.472 3 -3.4090 2.057 27 -0.7800 26.463 51 0.5180 58.679 75 2.3660 89.637 4 -3.1040 2.738 28 -0.7230 27.726 52 0.5750 60.002 76 2.4810 90.778 5 -2.8640 3.504 29 -0.6660 29.011 53 0.6320 61.344 77 2.6000 91.817 6 -2.6650 4.365 30 -0.6100 30.295 54 0.6900 62.736 78 2.7230 92.843 7 -2.4950 5.151 31 -0.5540 31.595 55 0.7500 64.075 79 2.8490 93.732 8 -2.3440 6.009 32 -0.4990 32.878 56 0.8100 65.397 80 2.9800 94.569 9 -2.2100 6.880 33 -0.4450 34.189 57 0.8720 66.755 81 3.1140 95.317
10 -2.0880 7.751 34 -0.3910 35.555 58 0.9350 68.111 82 3.2520 95.941 11 -1.9760 8.690 35 -0.3370 36.870 59 0.9990 69.414 83 3.3960 96.517 12 -1.8720 9.663 36 -0.2840 38.237 60 1.0650 70.719 84 3.5460 97.020 13 -1.7750 10.633 37 -0.2310 39.543 61 1.1330 72.056 85 3.7050 97.430 14 -1.6840 11.604 38 -0.1790 40.894 62 1.2030 73.357 86 3.8750 97.800 15 -1.5980 12.632 39 -0.1260 42.217 63 1.2740 74.642 87 4.0610 98.142 16 -1.5150 13.717 40 -0.0730 43.617 64 1.3480 75.953 88 4.2700 98.465 17 -1.4370 14.785 41 -0.0210 44.991 65 1.4250 77.296 89 4.5140 98.729 18 -1.3620 15.857 42 0.0320 46.370 66 1.5040 78.533 90 4.8160 98.947 19 -1.2900 16.927 43 0.0850 47.691 67 1.5860 79.881 91 5.2270 99.203 20 -1.2200 18.049 44 0.1380 49.091 68 1.6710 81.152 92 5.9140 99.568 21 -1.1520 19.229 45 0.1910 50.470 69 1.7590 82.387 93 6.6010 99.788 22 -1.0860 20.409 46 0.2440 51.785 70 1.8500 83.633 23 -1.0220 21.588 47 0.2980 53.185 71 1.9460 84.886
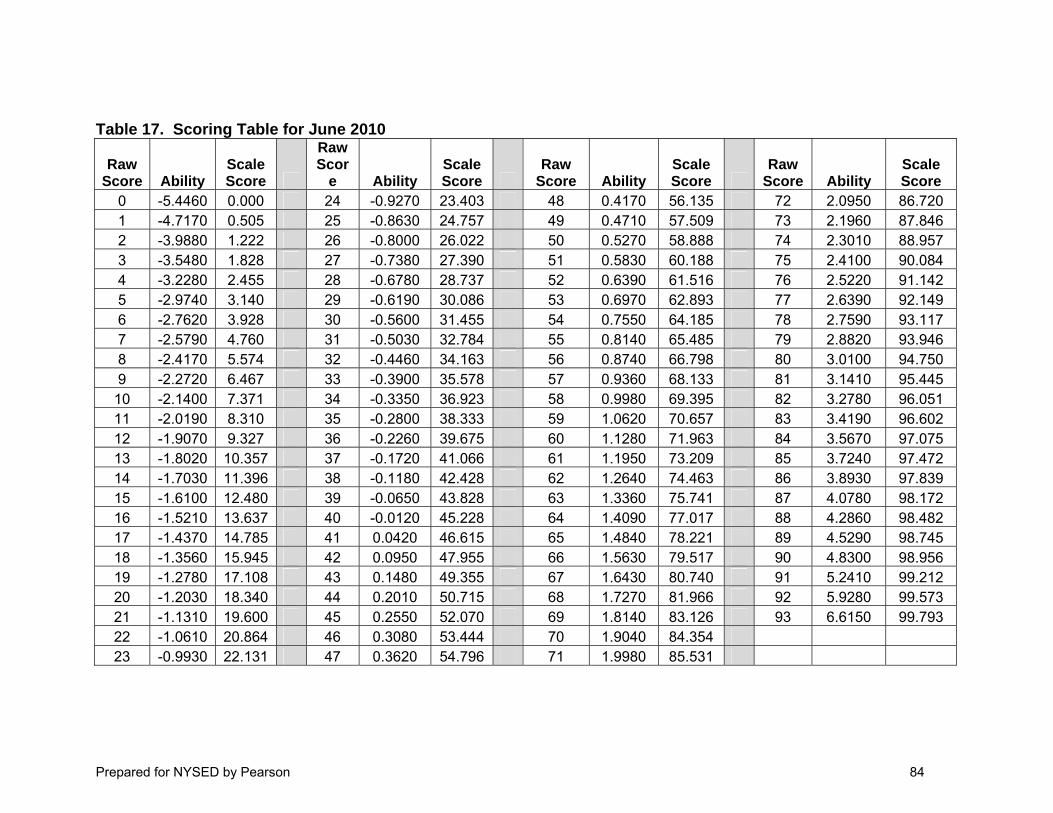
Prepared for NYSED by Pearson 84
Table 17. Scoring Table for June 2010
Raw Score Ability
Scale Score
Raw Scor
e Ability Scale Score
Raw Score Ability
Scale Score
Raw Score Ability
Scale Score
0 -5.4460 0.000 24 -0.9270 23.403 48 0.4170 56.135 72 2.0950 86.720 1 -4.7170 0.505 25 -0.8630 24.757 49 0.4710 57.509 73 2.1960 87.846 2 -3.9880 1.222 26 -0.8000 26.022 50 0.5270 58.888 74 2.3010 88.957 3 -3.5480 1.828 27 -0.7380 27.390 51 0.5830 60.188 75 2.4100 90.084 4 -3.2280 2.455 28 -0.6780 28.737 52 0.6390 61.516 76 2.5220 91.142 5 -2.9740 3.140 29 -0.6190 30.086 53 0.6970 62.893 77 2.6390 92.149 6 -2.7620 3.928 30 -0.5600 31.455 54 0.7550 64.185 78 2.7590 93.117 7 -2.5790 4.760 31 -0.5030 32.784 55 0.8140 65.485 79 2.8820 93.946 8 -2.4170 5.574 32 -0.4460 34.163 56 0.8740 66.798 80 3.0100 94.750 9 -2.2720 6.467 33 -0.3900 35.578 57 0.9360 68.133 81 3.1410 95.445
10 -2.1400 7.371 34 -0.3350 36.923 58 0.9980 69.395 82 3.2780 96.051 11 -2.0190 8.310 35 -0.2800 38.333 59 1.0620 70.657 83 3.4190 96.602 12 -1.9070 9.327 36 -0.2260 39.675 60 1.1280 71.963 84 3.5670 97.075 13 -1.8020 10.357 37 -0.1720 41.066 61 1.1950 73.209 85 3.7240 97.472 14 -1.7030 11.396 38 -0.1180 42.428 62 1.2640 74.463 86 3.8930 97.839 15 -1.6100 12.480 39 -0.0650 43.828 63 1.3360 75.741 87 4.0780 98.172 16 -1.5210 13.637 40 -0.0120 45.228 64 1.4090 77.017 88 4.2860 98.482 17 -1.4370 14.785 41 0.0420 46.615 65 1.4840 78.221 89 4.5290 98.745 18 -1.3560 15.945 42 0.0950 47.955 66 1.5630 79.517 90 4.8300 98.956 19 -1.2780 17.108 43 0.1480 49.355 67 1.6430 80.740 91 5.2410 99.212 20 -1.2030 18.340 44 0.2010 50.715 68 1.7270 81.966 92 5.9280 99.573 21 -1.1310 19.600 45 0.2550 52.070 69 1.8140 83.126 93 6.6150 99.793 22 -1.0610 20.864 46 0.3080 53.444 70 1.9040 84.354 23 -0.9930 22.131 47 0.3620 54.796 71 1.9980 85.531
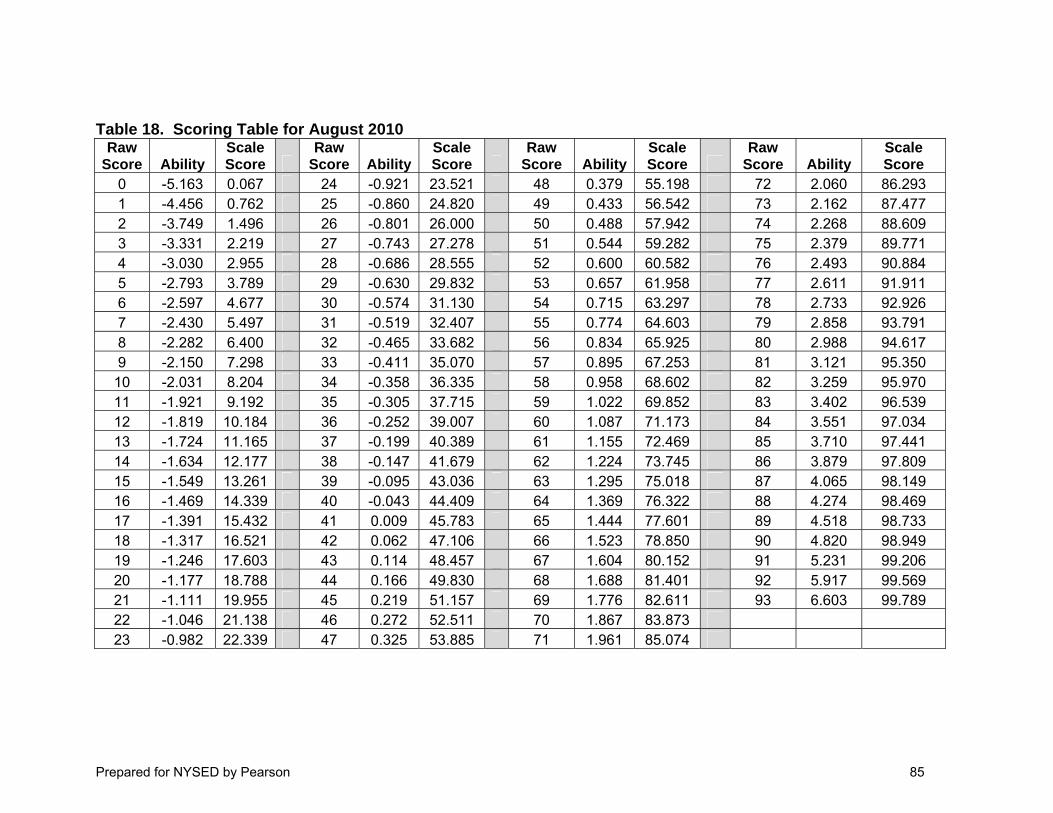
Prepared for NYSED by Pearson 85
Table 18. Scoring Table for August 2010 Raw
Score Ability Scale Score
Raw Score Ability
Scale Score
Raw Score Ability
Scale Score
Raw Score Ability
Scale Score
0 -5.163 0.067 24 -0.921 23.521 48 0.379 55.198 72 2.060 86.293 1 -4.456 0.762 25 -0.860 24.820 49 0.433 56.542 73 2.162 87.477 2 -3.749 1.496 26 -0.801 26.000 50 0.488 57.942 74 2.268 88.609 3 -3.331 2.219 27 -0.743 27.278 51 0.544 59.282 75 2.379 89.771 4 -3.030 2.955 28 -0.686 28.555 52 0.600 60.582 76 2.493 90.884 5 -2.793 3.789 29 -0.630 29.832 53 0.657 61.958 77 2.611 91.911 6 -2.597 4.677 30 -0.574 31.130 54 0.715 63.297 78 2.733 92.926 7 -2.430 5.497 31 -0.519 32.407 55 0.774 64.603 79 2.858 93.791 8 -2.282 6.400 32 -0.465 33.682 56 0.834 65.925 80 2.988 94.617 9 -2.150 7.298 33 -0.411 35.070 57 0.895 67.253 81 3.121 95.350
10 -2.031 8.204 34 -0.358 36.335 58 0.958 68.602 82 3.259 95.970 11 -1.921 9.192 35 -0.305 37.715 59 1.022 69.852 83 3.402 96.539 12 -1.819 10.184 36 -0.252 39.007 60 1.087 71.173 84 3.551 97.034 13 -1.724 11.165 37 -0.199 40.389 61 1.155 72.469 85 3.710 97.441 14 -1.634 12.177 38 -0.147 41.679 62 1.224 73.745 86 3.879 97.809 15 -1.549 13.261 39 -0.095 43.036 63 1.295 75.018 87 4.065 98.149 16 -1.469 14.339 40 -0.043 44.409 64 1.369 76.322 88 4.274 98.469 17 -1.391 15.432 41 0.009 45.783 65 1.444 77.601 89 4.518 98.733 18 -1.317 16.521 42 0.062 47.106 66 1.523 78.850 90 4.820 98.949 19 -1.246 17.603 43 0.114 48.457 67 1.604 80.152 91 5.231 99.206 20 -1.177 18.788 44 0.166 49.830 68 1.688 81.401 92 5.917 99.569 21 -1.111 19.955 45 0.219 51.157 69 1.776 82.611 93 6.603 99.789 22 -1.046 21.138 46 0.272 52.511 70 1.867 83.873 23 -0.982 22.339 47 0.325 53.885 71 1.961 85.074