2010 mass spectrometric analysis of proteins of the
TRANSCRIPT
University of WollongongResearch Online
University of Wollongong Thesis Collection University of Wollongong Thesis Collections
2010
Mass spectrometric analysis of proteins of thebacterial replisomeLinda L. JessopUniversity of Wollongong
Research Online is the open access institutional repository for theUniversity of Wollongong. For further information contact the UOWLibrary: [email protected]
Recommended CitationJessop, Linda L., Mass spectrometric analysis of proteins of the bacterial replisome, Doctor of Philosophy thesis, School of Chemistry,University of Wollongong, 2010. http://ro.uow.edu.au/theses/3323
i
Mass Spectrometric Analysis of Proteins of the
Bacterial Replisome
A thesis submitted in (partial) fulfilment of the
requirements for the award of the degree
Doctor of Philosophy
from
The University of Wollongong
by
Linda L. Jessop, B. Biotechnology (Hons)
School of Chemistry
June 2010
i
DECLARATION
I, Linda L. Jessop, declare that this thesis, submitted in partial fulfilment of the
requirements for the award of Doctor of Philosophy, in the School of Chemistry,
University of Wollongong, is wholly my own work unless otherwise referenced or
acknowledged. The document has not been submitted for qualifications at any other
academic institution.
Linda Louise Jessop
18th June, 2010

ii
ACKNOWLEDGEMENTS
I would like to thank the following people for their continuing support and tireless
efforts throughout the last four years.
To my supervisor Jenny Beck, thank you for all your guidance, support, encouragement
and your reassurance that I could get through this. You truly rose above and beyond
the call of duty on every occasion and ensured you made time for me and all of your
students. Thank you also to Nick Dixon for all your help and guidance.
A big thank you to Thitima and Ben C for their mass spec troubleshooting, for all the
times the instruments were giving me trouble! Thank you also to Boban for all his
assistance, a real expert on the replisome proteins and I will not forget your great
sense of humour.
To the mass spec group, especially my fellow dungeon buddies Karina and Jane. There
have been many ups and downs and it would not have been the same without any of
you (and the much needed coffee breaks), thanks for your friendship and support.
Thank you also to my family for your love and support, despite not quite
understanding what my research is about. Last, but definitely not least, thank you to
Simon for always being there for me and believing in me.
iii
PUBLICATIONS
Park A. Y., Jergic S., Politis A., Ruotolo B. T., Hirshberg D., Jessop L. L., Beck J. L., Barsky
D., O'Donnell M., Dixon N. E. and Robinson, C. V. (2010). A Single Subunit Directs the
Assembly of the Escherichia coli DNA Sliding Clamp Loader. Structure, 18: 285-292.
For this work, the candidate (Jessop), developed conditions for nanoESI-MS analysis of
, , - and . This represents a portion of the work described in Chapter 5 of this thesis. More extensive experiments on the assembly of the entire clamp loader were carried out by Park and others.
MANUSCRIPTS IN PREPARATION
Jessop L. L., Urathamakul T., Jergic S., Dixon N. E. and Beck J. L. A Substantial Change in
the ESI-MS Response Factor is Observed when the Subunit of DNA Polymerase III
Binds . To be submitted to J. Am. Soc. Mass Spectrom.
Almost all the work reported here was carried out by the candidate (Jessop). Urathamakul repeated one hydrogen/deuterium exchange measurement. Jergic and Dixon supplied the proteins. Beck supervised the project.
Park A. Y., Mitic N., Jessop L. L., Urathamakul T., Beck J. L., Carr P. D., Ollis D. L., Hanson
G. R. Schenk G. and Dixon N. E. Assembly of the Binuclear Metallocenter in the
Proofreading () Subunit of Escherichia coli DNA Polymerase III.
All of the mass spectrometry experiments in this manuscript were carried out by the candidate (Jessop). This represents the work described in Chapter 4 that showed the
simultaneous presence of TMP-promoted specific binding of metals to 186. Urathamakul carried out preliminary experiments. Beck supervised the project. Other authors were involved in protein expression, X-ray crystallography and electronic paramagnetic resonance studies.

iv
ABSTRACT
Electrospray ionisation mass spectrometry (ESI-MS) was used to investigate non-
covalent interactions of E. coli DNA polymerase III (Pol III) protein subunits with metal
ions, ligands and other Pol III proteins. Nanospray (nano) ESI-MS was used to examine
the interaction between (polymerase) and a recombinant version of the 16 kDa C-
terminal domain of (C16, a clamp loader protein) which retains the binding site.
Firstly, C16 and various C16 mutants and truncations were titrated into samples
containing a constant amount of . Based on the nanoESI mass spectra, the relative
order of binding affinity towards was: C16 > C16[I618T] C16[L635P] >
C16[D636G] C16[F631I] > C16[S617P] > C16[L627P] > C167 > C1611 C14.
This is in agreement with the binding order determined in previous work by surface
plasmon resonance (SPR; BiacoreTM). The differences in binding affinities were not
evident when the complexes were subjected to collision-induced dissociation (CID).
The peaks in nanoESI mass spectra from ions corresponding to and the -C16
complex were broad and it was not possible to determine values for dissociation
constants (KD) by comparing the relative abundances of ions from and the -C16
complex. One explanation for this is that the response factor for the complex was
greater than that for alone and suggests a conformational change on binding.
Hydrogen/deuterium exchange (HDX) experiments were challenging because was
not stable at the low pH required to quench exchange of amide protons. Consequently,
exchange of all protons was measured by ‘direct’ HDX. The results of two sets of
experiments suggested that a greater number of protons exchanged in the complex
than for the sum of that observed for the individual binding partners, consistent with a
conformational change of on binding. This is likely to occur during the normal

v
functioning of the replisome as participates in many protein-protein complexes that
involve interactions with the clamp loader and hand off to the sliding clamp which
tethers as part of the polymerase core to its template DNA.
ESI-MS can detect binding between metal ions and proteins. In some cases, complexes
that may not be representative of complexes that are relevant in vivo may be detected
since positively charged metal ions may bind non-specifically to acidic groups on the
protein. The binding of metal ions to the N-terminal domain of the Pol III exonuclease
subunit, 186, and the effect of the inhibitor, thymidine-5-monophosphate (TMP), and
its binding partner, , were investigated. The affinity of the metals for 186 decreased
in the order: Fe2+ > Dy3+ > Mn2+ Zn2+> Mg2+ Cu2+. In the absence of TMP, the
stoichiometry of binding for the metal ion that supports the greatest enzymatic
activity, Mn2+, and also for Zn2+ which bound with similar affinity as judged by the ESI
mass spectra, was not clear. In contrast, it was clear that two Fe2+ ions and one Dy3+
ion bound. When TMP was added to samples containing 186 in the presence of metal
ions, enzyme-metal complexes in which two Mn2+, Zn2+ or Fe2+ ions were bound in
addition to TMP were observed. The observation of a favoured metal ion-binding
stoichiometry supports the hypothesis that a biologically relevant active site had been
reconstituted; the binding of TMP to 186 facilitated the binding of two metal ions,
which is necessary for the activity of . The above experiments were also performed
using the 186- complex. The presence of (no TMP) did not potentiate the
formation of complexes containing two metal ions and had only a small effect on the
hydrolytic activity of the metalloenzyme.
vi
ESI ion mobility mass spectrometry (IM-MS) was used to collect information on the
collision cross sections (CCS) of a range of proteins. In IM-MS, the ‘drift time’ (or arrival
time distribution, ATD) of an analyte depends not only on its mass and charge but also
on its shape, which may be reflected in the CCS. For this, the travelling wave IM-MS
instrument known as the Synapt HDMSTM was used. This instrument has only recently
become commercially available. Since drift times obtained using this instrument are
not directly related to CCS, drift times of proteins of known CCS must be determined
under the same conditions as those used to determine the drift time of the protein of
unknown CCS. As this is a relatively new technique, the CCS values of Pol III proteins
from the clamp loader subassembly were compared with those determined by our
collaborators at the University of Cambridge (group of Professor C. V. Robinson). The
CCS values determined for , , 1, 2, 3, 4, 2-, 3- and 3-- were 2805, 2694,
2994, 4958, 6443, 8060, 6294, 8071 and 9197 Å2, respectively. These values were in
agreement to within 10% of those determined at Cambridge, showing that the method
is sufficiently robust to enable comparisons across independent laboratories of CCS of
proteins/complexes that are challenging to prepare. In addition, CCS values were
determined for some commercially available proteins, C16 and a very large
protein complex, rubisco (ribulose-1,5-bisphosphate carboxylase oxygenase). CCS
values of cytochrome c, myoglobin and lysozyme determined here were also within
10% of the literature values, further validating this method. The CCS values of , C16,
-C16 and rubisco were consistent with their molecular weights. Finally, the two
literature CCS calibration methods were applied to all the proteins described in this
chapter. The values determined by the two methods were in good agreement.

vii
ABBREVIATIONS
A280 absorbance at 280 nm
AAS atomic absorption spectroscopy
AES atomic emission spectroscopy
AIMS aspiration ion mobility spectrometry
AMP-PNP , -imidoadenosine-5-triphosphate
ATD arrival time distribution
ATP adenosine 5-triphosphate
bp base pair
BSA bovine serum albumin
CaM calmodulin
CCS collision cross section ()
CID collision-induced dissociation
Da Dalton
DC direct current
DMS differential-mobility spectrometry
DNA deoxyribonucleic acid
dsDNA double-stranded DNA
DTT D,L-Dithiothreitol
EDTA ethylenediaminetetraacetic acid
EM electron microscopy
ESI electrospray ionisation
EPR electron paramagnetic resonance
FTICR Fourier transform ion-cyclotron resonance
h hour
HDX hydrogen/deuterium exchange
ICP inductively coupled plasma
IM ion mobility
kcat enzyme turnover number (time-1)
KD dissociation constant
KDapp apparent dissociation constant
KM Michaelis constant
viii
MALDI matrix assisted laser desorption ionisation
mbar millibar
min minute
ml millilitre
Mr molecular mass
ms millisecond
MS mass spectrometry
MWCO molecular weight cut-off
m/z mass-to-charge ratio
nano nanospray
NH amide hydrogen
NH4OAc ammonium acetate
NMR nuclear magnetic resonance
nNOS neuronal nitric oxide synthase
nt nucleotide
oriC origin of replication
PAGE polyacrylamide gel electrophoresis
PAP purple acid phosphatase
PCNA proliferating cell nuclear antigen
PCR polymerase chain reaction
PDB Protein Data Bank
pNP p-nitrophenol
Pol I E. coli DNA Polymerase I
Pol III E. coli DNA Polymerase III
Q-TOF quadrupole time-of-flight
RF radio frequency
RFC replication factor C
RNA ribonucleic acid
RSD relative standard deviation
s second
SPR surface plasmon resonance
ssDNA single-stranded DNA
SSB ssDNA binding protein
ix
t time
C16x C16 mutant or truncation
tD drift time
Th Thompson
TMP thymidine-5-monophosphate
TOF time-of-flight
TRAP trp RNA binding attenuation protein
Tris tris(hydroxymethyl)aminomethane
TWIMS travelling wave ion mobility spectrometry
UV ultraviolet
V volt
x
TABLE OF CONTENTS
DECLARATION.................................................................................................................................i
ACKNOWLEDGEMENTS..................................................................................................................ii
PUBLICATIONS..............................................................................................................................iii
ABSTRACT.....................................................................................................................................iv
ABBREVIATIONS...........................................................................................................................vii
TABLE OF CONTENTS.....................................................................................................................x
CHAPTER 1 GENERAL INTRODUCTION .................................................................................. 1
1.1 DNA REPLICATION ............................................................................................................. 2
1.1.1 DNA POLYMERASES IN E. COLI .....................................................................................................3
1.1.2 CHROMOSOME REPLICATION IN E. COLI .........................................................................................5
1.1.3 E. COLI DNA POLYMERASE III ......................................................................................................7
1.1.4 STOICHIOMETRY OF POL III SUBUNITS ........................................................................................ 18
1.2 TECHNIQUES FOR INVESTIGATING PROTEIN-PROTEIN INTERACTIONS ............................................. 18
1.2.1 BIOLOGICAL MASS SPECTROMETRY ............................................................................................ 23
1.3 SCOPE OF THIS THESIS ....................................................................................................... 30
CHAPTER 2 MATERIALS & METHODS .................................................................................. 32
2.1 MATERIALS .................................................................................................................... 32
2.1.1 REAGENTS ............................................................................................................................. 32
2.1.2 CONSUMABLES ....................................................................................................................... 32
2.1.3 PROTEINS .............................................................................................................................. 33
2.2 METHODS ...................................................................................................................... 34
2.2.1 PROTEIN BUFFER EXCHANGE VIA DIALYSIS .................................................................................. 34
xi
2.2.2 PROTEIN BUFFER EXCHANGE VIA CENTRIFUGAL FILTER TUBES ........................................................ 35
2.2.3 DETERMINATION OF PROTEIN CONCENTRATION ........................................................................... 35
2.2.4 -C16 TITRATION EXPERIMENTS ............................................................................................. 36
2.2.5 TREATMENT OF 186 WITH METAL IONS .................................................................................... 36
2.2.6 TREATMENT OF 186 WITH METAL IONS, TMP AND/OR ........................................................... 37
2.2.7 SPECTROPHOTOMETRIC ASSAYS OF 186 .............................................................................. 37
2.2.8 PREPARATION OF PROTEINS AND SUB-COMPLEXES OF THE CLAMP LOADER ...................................... 38
2.2.9 HYDROGEN/DEUTERIUM EXCHANGE (HDX) OF C16 ............................................................. 39
2.2.10 PREPARATION OF PROTEINS FOR IM-MS .................................................................................. 40
2.2.11 PREPARATION OF GOLD COATED CAPILLARIES FOR NANOESI-MS ................................................. 41
2.2.12 MASS SPECTROMETRY CONDITIONS ......................................................................................... 41
2.2.13 COLLISION-INDUCED DISSOCIATION (CID) OF -C16 ................................................................ 43
2.2.14 ION MOBILITY – MASS SPECTROMETRY (IM-MS) CONDITIONS .................................................... 44
2.2.15 EXTRACTING DRIFT TIMES FROM ION MOLBILITY MASS SPECTRA .................................................. 45
2.2.16 CREATING COLLISION CROSS SECTION CALIBRATIONS .................................................................. 45
2.2.17 STRUCTURE VISUALISATION .................................................................................................... 48
CHAPTER 3 THE ALPHA-TAU INTERACTION ......................................................................... 49
3.1 INTRODUCTION ............................................................................................................... 49
3.1.1 MEASURING DISSOCIATION CONSTANTS OF BIOLOGICAL COMPLEXES USING ESI-MS ......................... 52
3.1.2 HYDROGEN/DEUTERIUM EXCHANGE (HDX) ................................................................................ 56
3.2 SCOPE OF THIS CHAPTER .................................................................................................... 59
3.3 RESULTS AND DISCUSSION.................................................................................................. 59
3.3.1 NANOESI-MS OF C16 ........................................................................................................... 59
3.3.2 CONDITIONS FOR NANOESI-MS OF -C16 ................................................................................ 61
3.3.3 COMPARISON OF THE INTERACTIONS OF C16 MUTANTS/TRUNCATIONS WITH .............................. 64
3.3.4 INVESTIGATING THE STABILITY OF -C16X COMPLEXES ................................................................ 72
xii
3.3.5 DETERMINATION OF DISSOCIATION CONSTANTS .......................................................................... 86
3.3.6 HYDROGEN/DEUTERIUM EXCHANGE (HDX) ................................................................................ 91
3.3.7 DETECTION OF C16 DIMER ...................................................................................................... 99
3.4 SUMMARY AND FUTURE DIRECTIONS .................................................................................. 104
CHAPTER 4 INTERACTIONS BETWEEN EPSILON, THETA AND METAL IONS .......................... 109
4.1 INTRODUCTION ............................................................................................................. 109
4.1.1 METALLOENZYMES ................................................................................................................ 109
4.1.2 EPSILON () FROM E. COLI POL III ............................................................................................ 111
4.1.3 TECHNIQUES FOR INVESTIGATING METALLOPROTEINS ................................................................. 114
4.2 SCOPE OF THIS CHAPTER .................................................................................................. 115
4.3 RESULTS AND DISCUSSION................................................................................................ 117
4.3.1 PRELIMINARY EXPERIMENTS ................................................................................................... 117
4.3.2 OBTAINING ESI MASS SPECTRA OF 186.................................................................................. 119
4.3.3 TITRATIONS OF METAL IONS INTO 186 ................................................................................... 121
4.3.4 ADDITION OF THE SUBSTRATE MIMIC/INHIBITOR, TMP, TO 186 ................................................ 132
4.3.5 ADDITION OF METAL IONS TO THE 186-TMP COMPLEX ............................................................ 135
4.3.6 EFFECT OF ADDING TO 186, TMP AND METAL IONS.............................................................. 146
4.3.7 EFFECTS OF THE DIFFERENT METAL IONS ON THE ACTIVITIES OF 186 AND 186- ........................ 156
4.4 SUMMARY AND FUTURE DIRECTIONS .................................................................................. 161
CHAPTER 5 DETERMINATION OF COLLISION CROSS SECTIONS OF PROTEINS AND ASSEMBLIES
USING TRAVELLING WAVE ION MOBILITY MS ................................................................... 164
5.1 INTRODUCTION ............................................................................................................. 164
5.1.1 EARLY IM-MS INSTRUMENTS ................................................................................................. 164
5.1.2 MODERN IM-MS INSTRUMENTS ............................................................................................. 166
xiii
5.2 SCOPE OF THIS CHAPTER .................................................................................................. 172
5.3 RESULTS AND DISCUSSION................................................................................................ 174
5.3.1 NANOESI-MS ANALYSIS OF AND FROM THE E. COLI CLAMP LOADER COMPLEX ........................ 174
5.3.2 NANOESI-MS ANALYSIS OF FROM THE E. COLI CLAMP LOADER COMPLEX ................................... 184
5.3.3 ASSEMBLY OF THE MINIMAL CLAMP LOADER COMPLEX (3--) ................................................. 188
5.3.4 NANOESI-MS ANALYSIS OF A TRUNCATION OF (1-400) ............................................................ 193
5.3.5 IM-MS ANALYSIS OF CLAMP LOADER PROTEINS/COMPLEXES ...................................................... 194
5.3.6 CCS DETERMINATION OF CLAMP LOADER PROTEINS .................................................................. 199
5.3.7 CCS DETERMINATION OF COMMERCIAL PROTEINS ..................................................................... 202
5.3.8 CCS DETERMINATION OF C16 AND RUBISCO ..................................................................... 202
5.3.9 COMPARISON OF RUOTOLO ET AL. [143] AND SMITH ET AL. [150] CALIBRATIONS .......................... 204
5.3.10 SUMMARY OF ALL CCS VALUES DETERMINED IN THIS CHAPTER ................................................. 205
5.4 SUMMARY AND FUTURE DIRECTIONS .................................................................................. 205
CHAPTER 6 CONCLUDING REMARKS ................................................................................ 209
CHAPTER 7 REFERENCES .................................................................................................. 214
Chapter 1 General Introduction
1
Chapter 1 General Introduction
Replication of genomic DNA (deoxyribonucleic acid) is an essential process in all
organisms. Through replication, the instructions for life are copied and passed onto
daughter cells. In all organisms the replication process occurs in three stages:
initiation, elongation and termination [1]. Each of these stages requires the co-
operation and interaction of cofactors (e.g. metal ions and nucleotides) and
macromolecules (proteins and DNA) to ensure replication is a highly processive1 and
efficient process. For an organism to successfully carry out replication of the
chromosome, at least three activities are required: (i) DNA polymerisation, (ii)
clamping the DNA template to the polymerase, and (iii) harnessing the energy of
adenosine 5-triphosphate (ATP) hydrolysis to various physical processes required for
replication (e.g. loading the clamp onto DNA or unwinding the double helix) [2].
The proteins involved in these processes in Escherichia coli have been extensively
studied and some of the structures of individual subunits and several protein-protein
complexes are known from nuclear magnetic resonance (NMR) and X-ray
crystallographic studies [3, 4]. In spite of this, the precise stoichiometry (i.e. number of
protein subunits), the requirements for metal cofactors, the protein-protein and
protein-DNA contact points, and the dynamics of assembly and disassembly of the
molecular machinery during replication are not fully elucidated. In this thesis, an
overview of the current understanding of E. coli replication is presented and the utility
1 Replication is processive when the DNA polymerase does not dissociate from the substrate (DNA
template) after the addition of each nucleotide.
Chapter 1 General Introduction
2
of electrospray ionisation (ESI) mass spectrometry (MS) as a tool for gaining further
insight into some aspects of replication is described. The application of ESI-MS used in
the study of replication proteins highlights the advantages and disadvantages of the
technique that will inform future work on other systems. Furthermore, during the
course of this project the first travelling wave ion mobility (IM) mass spectrometer
became commercially available. As this is a new technique, some of the E. coli
replisome proteins were analysed by IM-MS to compare their collision cross sections
with those determined by our collaborators.
1.1 DNA Replication
Replication is a complex process, and numerous tasks must be performed by many
interacting proteins in order to completely copy the chromosome of an organism.
Some of the tasks necessary for DNA replication, independent of whether the
organism is prokaryotic or eukaryotic, include: (i) unwinding double-stranded (ds) DNA
at an origin and stabilising the resulting single-stranded (ss) DNA; (ii) recruiting an RNA
(ribonucleic acid) primer to DNA; (iii) elongation of the primer with nucleotides
(catalysed by a DNA polymerase); (iv) ensuring the polymerase remains bound to the
DNA as polymerisation proceeds, and (v) proofreading activity to ensure mismatched
bases are corrected [1]. Many replication proteins in lower organisms such as bacteria
have analogues with similar functions and mechanisms in higher organisms. For
example, in E. coli the complex that attaches the β2 ring (clamp) onto DNA is known as
the clamp loader (2---) [5]. The analogous complex in eukaryotes is known as
replication factor C (RFC) which also consists of five subunits (RFC 1-5) and loads the
proliferating cell nuclear antigen (PCNA) clamp (analogous to β2 in E. coli) onto DNA at

Chapter 1 General Introduction
3
the replication fork [6, 7]. Insights gained from the study of prokaryotic replication can
be used to gain understanding of eukaryotic replication.
1.1.1 DNA Polymerases in E. coli
Five DNA polymerases are present in E. coli cells: the DNA polymerases I, II, III, IV and V
(Pol I, II, IV and V, respectively). Arthur Kornberg first discovered DNA polymerase
(now known as Pol I) in the 1950s [8]. This discovery was crucial to the developing field
of molecular biology, since it provided the first clue as to how cells replicate. Soon
after this initial work, several observations suggested that Pol I could not be the
primary E. coli polymerase responsible for replicating the chromosome. Firstly, Pol I
can only polymerise DNA at a maximum rate of 20 nucleotides per second (nt/s). In
contrast, in vivo replication proceeds at around 1000 nt/s [9, 10]. Secondly, Pol I is a
relatively abundant protein, with an estimated 400 molecules per cell. This is a very
large number for a polymerase primarily involved in chromosome replication
considering there are less than 10 replication forks per cell at any one time [11].
Further work also revealed aspects of the Pol I mechanism that were not consistent
with the requirements for rapid, efficient DNA replication. Firstly, to maintain
efficiency, primary polymerases are only capable of extending DNA in the 5 3
direction and require a primer to initiate this synthesis (the primary polymerase cannot
initiate synthesis on its own). These two factors allow the enzyme to be highly
processive. In contrast to this behaviour, Pol I is capable of extending DNA in both the
3 5 and 5 3 directions and has the ability to initiate DNA synthesis without the
aid of a primer [12]. Secondly, Pol I is distributive (rather than processive), dissociating
Chapter 1 General Introduction
4
from the DNA after synthesising only 10-50 nucleotides [10]. Another major difference
between Pol I and a primary replicase is that the latter uses energy in the form of ATP
in order to securely clamp onto DNA. Finally, mutants lacking Pol I activity are still able
to carry out DNA replication [13], but are not capable of repairing DNA, suggesting that
Pol I may have a role in maintaining the fidelity of DNA produced by replication.
The polymerases were named for their order of discovery and when each was
discovered by observation of its polymerase activity, their roles in the cell were initially
unknown. Pol II and Pol V are induced during the SOS response to DNA damage and
are involved in DNA repair [14, 15]. Pol IV is a relatively low fidelity polymerase that is
able to pass over DNA damage and temporarily substitute for high fidelity polymerases
[16].
Identification of the primary replication polymerase proved to be more difficult as
there are only 10-20 molecules of the primary polymerase per cell [17, 18]. The
polymerase was discovered during investigations of temperature-sensitive mutants of
the dnaE gene of E. coli which were deficient to various extents in replication [19].
Further studies showed that dnaE encodes alpha (), the subunit of Pol III bearing
polymerase activity [19]. This subunit makes up part of the Pol III ‘core’ and has
properties consistent with those of a primary polymerase. Pol III is able to polymerise
over 750 nucleotides per second in vitro, consistent with the rate of E. coli replication
fork movement [10]. It is also highly processive, capable of extending DNA thousands
of nucleotides long without dissociating from the replication fork [20].
Chapter 1 General Introduction
5
Although Pol III is the major replication polymerase of E. coli, Pol I also plays an
important supporting role in replication. The single subunit Pol I (103 kDa) can extend
DNA in both directions and has nick translation activity. That means it can remove RNA
primers using its exonuclease activity and replace them with deoxyribonucleotides
using its polymerase activity [21].
Whilst the function of all polymerases is highly conserved throughout all organisms,
there are five structural families (based on crystal structures and/or amino acid
sequences) in which all polymerases can be classified. These five families are: (i) the
Pol A family (includes Pol I), (ii) the Pol B family (includes all eukaryotic and phage T4
replication polymerases), (iii) Pol (mammalian polymerase not structurally related to
previous families), (iv) Pol III, and (v) the family that includes reverse transcriptases,
RNA-dependent DNA polymerases and telomerase [11]. This thesis focuses on Pol III
from E. coli.
1.1.2 Chromosome Replication in E. coli
The double-stranded E. coli chromosome is circular and contains a single origin of
replication (oriC). Once replication is initiated, proteins are recruited to oriC where the
copying of DNA proceeds in two directions via two replication forks until one of several
termination (Ter) sequences (located opposite oriC) is reached (Figure 1.1 (a)).
The E. coli chromosome, with a length of 4.6 x 10⁶ base pairs (bp), requires only 40
minutes to be fully replicated under optimal conditions [9]. This high turnover number
means that the polymerase enzyme complex is highly efficient. Several enzymatic
Chapter 1 General Introduction
6
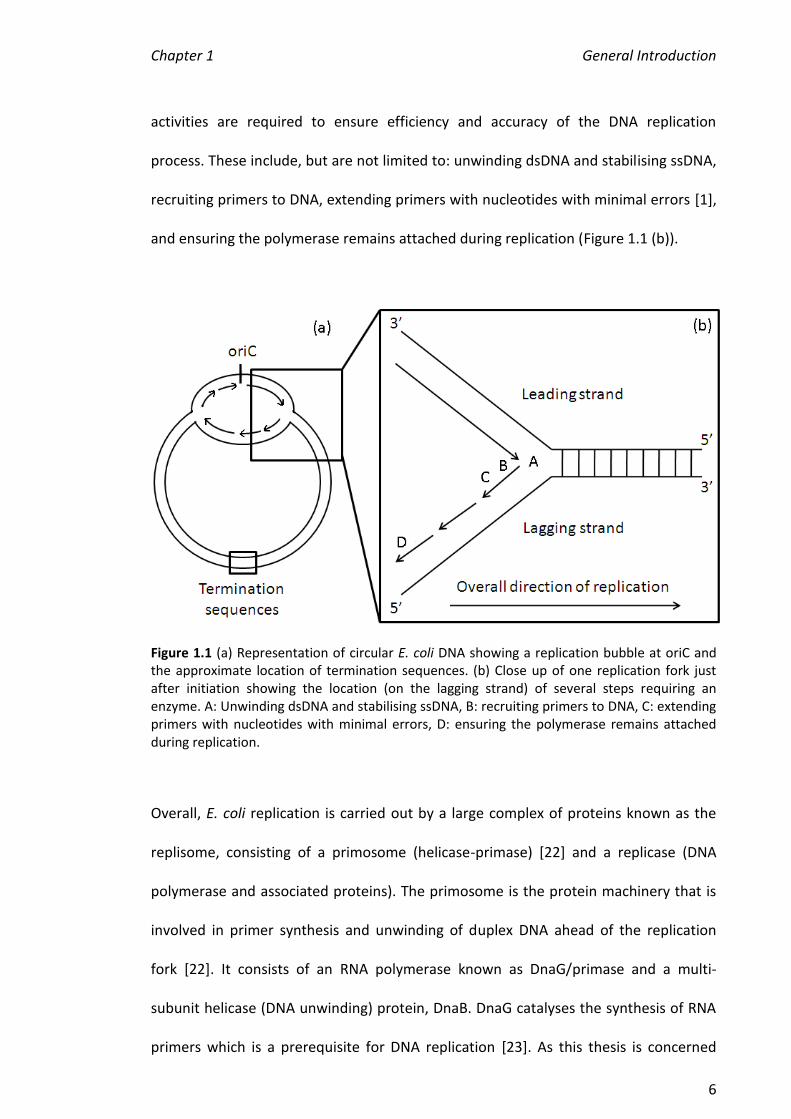
activities are required to ensure efficiency and accuracy of the DNA replication
process. These include, but are not limited to: unwinding dsDNA and stabilising ssDNA,
recruiting primers to DNA, extending primers with nucleotides with minimal errors [1],
and ensuring the polymerase remains attached during replication (Figure 1.1 (b)).
Figure 1.1 (a) Representation of circular E. coli DNA showing a replication bubble at oriC and the approximate location of termination sequences. (b) Close up of one replication fork just after initiation showing the location (on the lagging strand) of several steps requiring an enzyme. A: Unwinding dsDNA and stabilising ssDNA, B: recruiting primers to DNA, C: extending primers with nucleotides with minimal errors, D: ensuring the polymerase remains attached during replication.
Overall, E. coli replication is carried out by a large complex of proteins known as the
replisome, consisting of a primosome (helicase-primase) [22] and a replicase (DNA
polymerase and associated proteins). The primosome is the protein machinery that is
involved in primer synthesis and unwinding of duplex DNA ahead of the replication
fork [22]. It consists of an RNA polymerase known as DnaG/primase and a multi-
subunit helicase (DNA unwinding) protein, DnaB. DnaG catalyses the synthesis of RNA
primers which is a prerequisite for DNA replication [23]. As this thesis is concerned
Chapter 1 General Introduction
7
with the replicase, discussed in more detail below, the primosome will not be
discussed further. The components of the primosome, DNA primase and DNA helicase
have been reviewed elsewhere [24, 25].
1.1.3 E. coli DNA Polymerase III
Along with the primosome, the other main component of the replisome is the
replicase (Figure 1.2 (a)). The primary replicative polymerase in E. coli cells is the large
enzymatic assembly known as the DNA polymerase III holoenzyme (Pol III). It contains
ten different subunits, designated alpha (), epsilon (), theta (), gamma (), tau (),
delta (), delta prime (), chi (), psi () and beta (), which together form an
incredibly processive, efficient and high fidelity enzyme [3]. The complete
stoichiometry of functional Pol III is thought to be (--)2-(2-----)-(2)2 [3, 26].
Subassemblies of Pol III have been isolated [5, 18] and carry out discrete activities
important in replication.
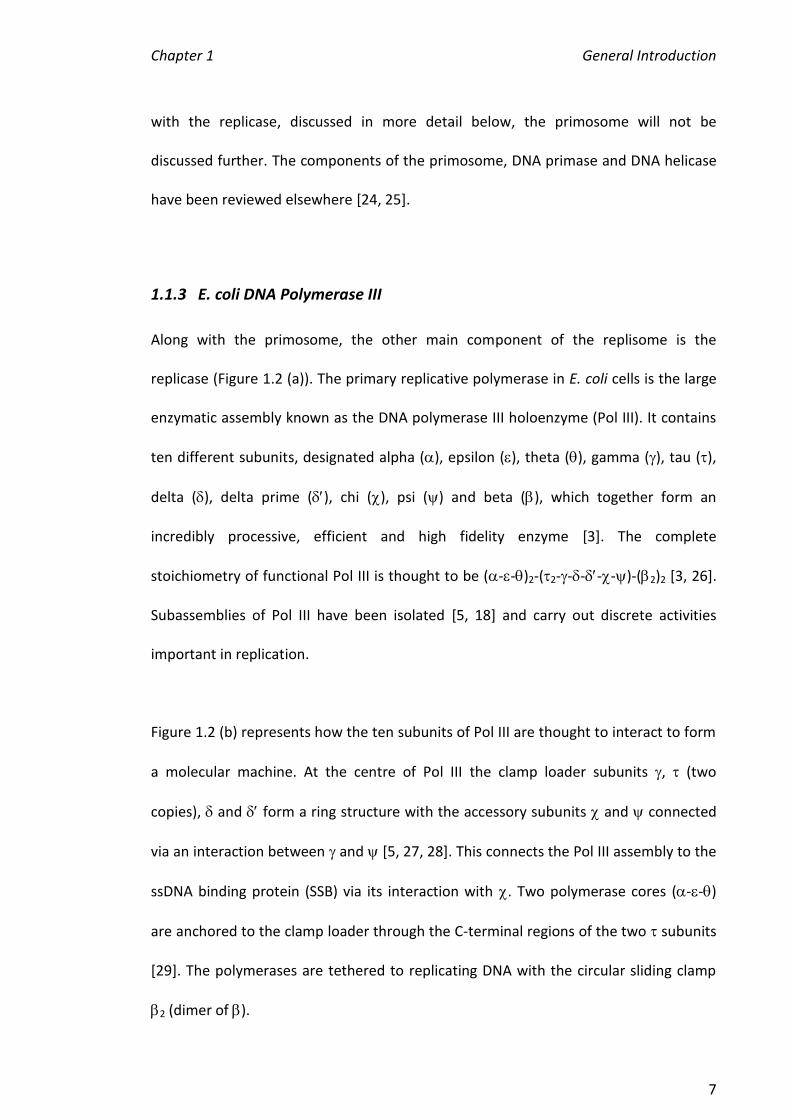
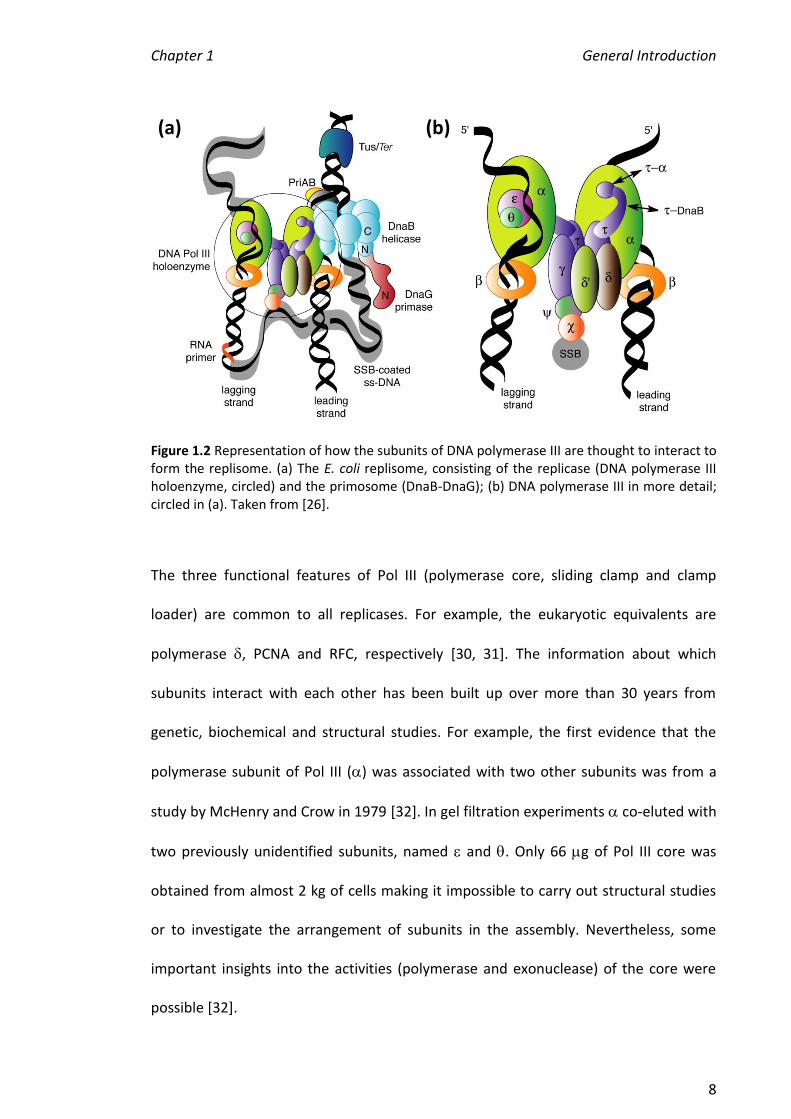
Figure 1.2 (b) represents how the ten subunits of Pol III are thought to interact to form
a molecular machine. At the centre of Pol III the clamp loader subunits , (two
copies), and form a ring structure with the accessory subunits and connected
via an interaction between and [5, 27, 28]. This connects the Pol III assembly to the
ssDNA binding protein (SSB) via its interaction with . Two polymerase cores (--)
are anchored to the clamp loader through the C-terminal regions of the two subunits
[29]. The polymerases are tethered to replicating DNA with the circular sliding clamp
2 (dimer of ).
Chapter 1 General Introduction
8
Figure 1.2 Representation of how the subunits of DNA polymerase III are thought to interact to form the replisome. (a) The E. coli replisome, consisting of the replicase (DNA polymerase III holoenzyme, circled) and the primosome (DnaB-DnaG); (b) DNA polymerase III in more detail; circled in (a). Taken from [26].
The three functional features of Pol III (polymerase core, sliding clamp and clamp
loader) are common to all replicases. For example, the eukaryotic equivalents are
polymerase , PCNA and RFC, respectively [30, 31]. The information about which
subunits interact with each other has been built up over more than 30 years from
genetic, biochemical and structural studies. For example, the first evidence that the
polymerase subunit of Pol III () was associated with two other subunits was from a
study by McHenry and Crow in 1979 [32]. In gel filtration experiments co-eluted with
two previously unidentified subunits, named and . Only 66 g of Pol III core was
obtained from almost 2 kg of cells making it impossible to carry out structural studies
or to investigate the arrangement of subunits in the assembly. Nevertheless, some
important insights into the activities (polymerase and exonuclease) of the core were
possible [32].
(a) (b)
Chapter 1 General Introduction
9
Recombinant techniques can be used in order to overproduce, purify and subsequently
study each protein individually or in a complex with one or more binding partners [33].
The ability to obtain large amounts of purified proteins has facilitated studies on the
assembly and dynamics of the replisome. In early work, Kim and McHenry constructed
an artificial operon containing the usually distinct dnaE, dnaQ and holE genes
(encoding , and , respectively) to produce , - and -- in vivo [34]. More
recently, partial structures of subunits from the Pol III core have been solved by X-ray
crystallography and NMR spectroscopy [35, 36]. The structures complement existing
knowledge but also reveal further information. For example, the NMR structure of
complexed to the N-terminal domain of revealed that helix 1 in contains a
hydrophobic surface, important for the interaction with . Previous studies were
consistent with this information [35, 37]. Most of the individual protein subunits of the
subassemblies have discrete functions in replication, however, they can only perform
to their full potential when associated together as a complex. The various
subassemblies of Pol III and their activities are described below and summarised in
Table 1.1.
1.1.3.1 Polymerase core (--)
Pol III contains two polymerase core subassemblies, each made up of the subunits ,
and . The subunit is the polymerase enzyme which catalyses the 5 3 synthesis of
DNA [18]. It also binds to the 2 sliding clamp and to the C-terminal domain of . The
subunit is a 3 5 exonuclease, providing important proofreading activity to the
complex [38], and is discussed below and in more detail in Chapter 4. The subunit
has no known enzyme activity but may play an important structural role in stabilising

Chapter 1 General Introduction
10
Table 1.1 The molecular masses, genes and functions of the subunits that make up the E. coli DNA polymerase III holoenzyme.
Sub-assembly
Subunit Mass, kDa (total residues)
Structures solved
Gene Function(s)
Polymerase core
alpha
130 (1160)
(1-917) [36] dnaE DNA polymerase (catalyses DNA synthesis). Together
with and comprises the ‘core’ of Pol III.
epsilon
28 (243)
186 (1-186) [4]
186- [35, 37]
dnaQ Proofreading 3' 5' exonuclease.
theta
8.8 (76)
[39, 40] holE Stabilises , allowing it to interact with .
Sliding clamp
beta
41 (366)
2 [41]
-2 [42]
dnaN Surrounds DNA and tethers it to the polymerase, giving it processivity.
Clamp loader
tau
71 (643)
C14 (499-625) [43]
dnaX Dimerises the two polymerase cores, activates DnaB helicase activity.
gamma
48 (431)
1-243 [44]
1-373* [45]
dnaX Binds ATP, acting as the motor in clamp loading.
delta
39 (343)
* [45]
- [42]
holA Binds to 2, acting as a wrench in clamp loading.
' delta prime
37 (334)
[46]
* [45]
holB Stimulates ATPase of complex for clamp loading and acts as a stator.
chi
17 (147)
- [47] holC Binds to ssDNA binding protein (SSB) to remove primase from primer.
psi
15 (137)
- [47]
holD Bridge between and .
*Structure solved for , and as part of the clamp loader (3)
Chapter 1 General Introduction
11
the subunit via an association with the N-terminal domain of the enzyme [48, 49]. In
vitro, is intrinsically unstable and the addition of in vitro or co-expression of the two
proteins in E. coli stabilises [49].
The fidelity of DNA replication depends on the activity of the proofreader, , as it
corrects any mismatched base pairs the polymerase has inserted [50]. Epsilon
preferentially removes mismatched bases at the 3 terminus assisted by the higher
propensity for melting at mismatched DNA compared to correctly matched bases [51].
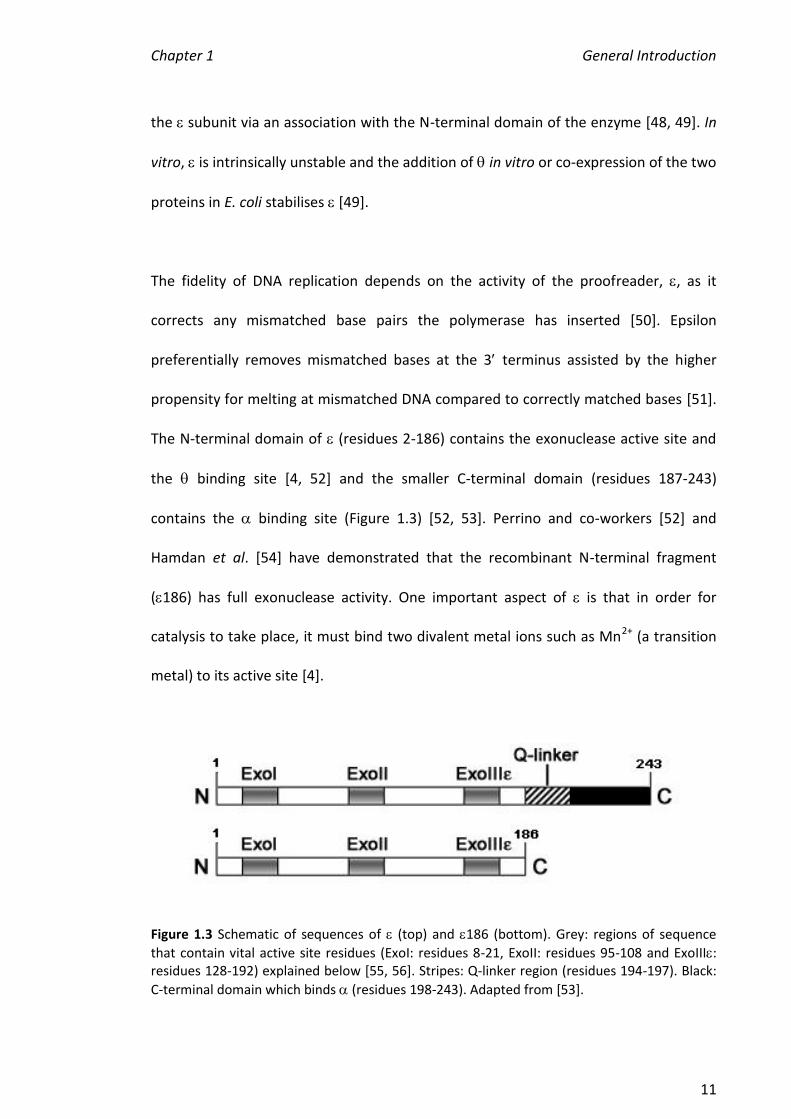
The N-terminal domain of (residues 2-186) contains the exonuclease active site and
the binding site [4, 52] and the smaller C-terminal domain (residues 187-243)
contains the binding site (Figure 1.3) [52, 53]. Perrino and co-workers [52] and
Hamdan et al. [54] have demonstrated that the recombinant N-terminal fragment
(186) has full exonuclease activity. One important aspect of is that in order for
catalysis to take place, it must bind two divalent metal ions such as Mn2+ (a transition
metal) to its active site [4].
Figure 1.3 Schematic of sequences of (top) and 186 (bottom). Grey: regions of sequence
that contain vital active site residues (ExoI: residues 8-21, ExoII: residues 95-108 and ExoIII: residues 128-192) explained below [55, 56]. Stripes: Q-linker region (residues 194-197). Black:
C-terminal domain which binds (residues 198-243). Adapted from [53].
Chapter 1 General Introduction
12
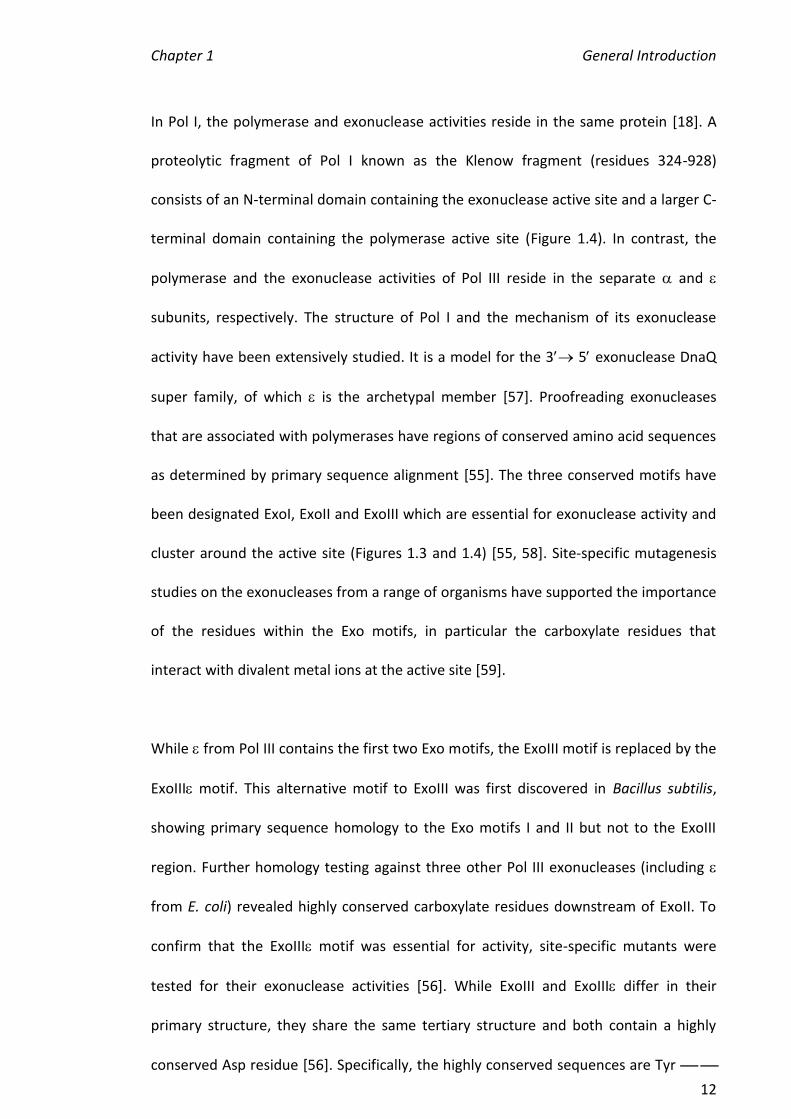
In Pol I, the polymerase and exonuclease activities reside in the same protein [18]. A
proteolytic fragment of Pol I known as the Klenow fragment (residues 324-928)
consists of an N-terminal domain containing the exonuclease active site and a larger C-
terminal domain containing the polymerase active site (Figure 1.4). In contrast, the
polymerase and the exonuclease activities of Pol III reside in the separate and
subunits, respectively. The structure of Pol I and the mechanism of its exonuclease
activity have been extensively studied. It is a model for the 3 5 exonuclease DnaQ
super family, of which is the archetypal member [57]. Proofreading exonucleases
that are associated with polymerases have regions of conserved amino acid sequences
as determined by primary sequence alignment [55]. The three conserved motifs have
been designated ExoI, ExoII and ExoIII which are essential for exonuclease activity and
cluster around the active site (Figures 1.3 and 1.4) [55, 58]. Site-specific mutagenesis
studies on the exonucleases from a range of organisms have supported the importance
of the residues within the Exo motifs, in particular the carboxylate residues that
interact with divalent metal ions at the active site [59].
While from Pol III contains the first two Exo motifs, the ExoIII motif is replaced by the
ExoIII motif. This alternative motif to ExoIII was first discovered in Bacillus subtilis,
showing primary sequence homology to the Exo motifs I and II but not to the ExoIII
region. Further homology testing against three other Pol III exonucleases (including
from E. coli) revealed highly conserved carboxylate residues downstream of ExoII. To
confirm that the ExoIII motif was essential for activity, site-specific mutants were
tested for their exonuclease activities [56]. While ExoIII and ExoIII differ in their
primary structure, they share the same tertiary structure and both contain a highly
conserved Asp residue [56]. Specifically, the highly conserved sequences are Tyr
Chapter 1 General Introduction
13
Figure 1.4 Structure of the Klenow fragment of DNA polymerase I (residues 324-928). The polymerase region is coloured grey while the exonuclease region is coloured blue with the ExoI, ExoII and ExoIII motifs shown in green [55]. PDB code 1KFD, adapted from [60].
Asp (where each dash represents any amino acid) and His Ala Asp for the
ExoIII and ExoIII motifs, respectively [4, 59]. Pol III has higher activity (against the 5-
p-nitrophenyl ester of thymidine-5-monophosphate; pNP-TMP) compared to the Pol I
exonuclease (measured against 3' end-labelled DNA fragments [61]) and Dixon and co-
workers have suggested that this is due to histidine being a more effective base than
tyrosine at low pH [4]. Extensive alignments involving one hundred and forty-eight 3
5 exonucleases have revealed that the ExoIII motif is present in all Gram positive
bacteria2 [60].
2 B. subtilis is Gram positive while E. coli is Gram negative.
Chapter 1 General Introduction
14
1.1.3.2 Sliding Clamp (2) and Clamp Loader (2---)
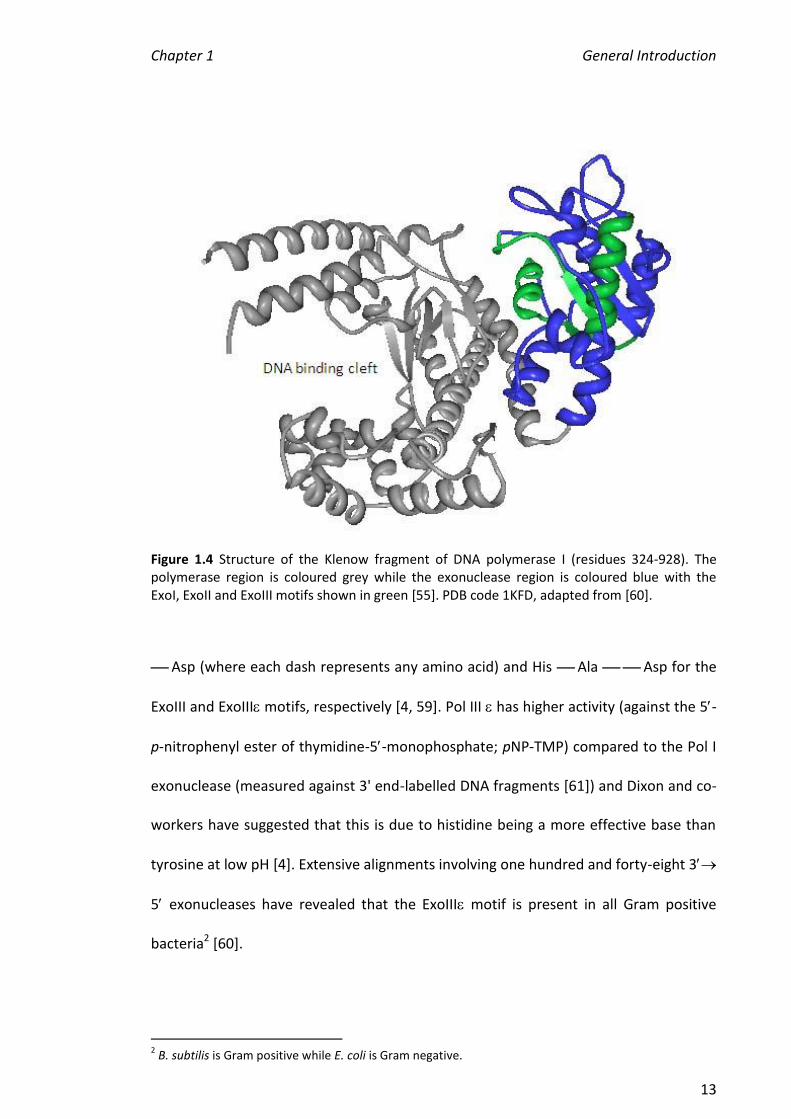
Another component of the holoenzyme is the subunit which exists as a ring-shaped
dimer (2) and surrounds the DNA template acting as a mobile clamp, holding the
polymerase to the DNA [2]. The X-ray crystal structure of 2 surrounding a DNA
molecule is shown in Figure 1.5. As the polymerase core travels along the DNA
template strand, the interaction with the sliding clamp allows the binding of DNA and
addition of nucleotides at the polymerase binding site without dissociating from the
DNA template. Without the 2 clamp, replication would be relatively inefficient. Whilst
the leading strand only requires one 2 sliding clamp for the duration of replication,
discontinuous lagging strand replication requires a new 2 sliding clamp to be loaded
after each Okazaki fragment is synthesised [62]. As the lagging strand polymerase is
adding nucleotides to an Okazaki fragment, the clamp loader places another 2 clamp
at the next primer. Once the Okazaki fragment is complete, the polymerase releases
the original clamp and interacts with the next clamp to synthesise the next fragment
[62].
Figure 1.5 Dimer of the E. coli Pol III subunit (red and yellow) surrounding a DNA template (light blue). The image was generated from X-ray crystallographic data of Kong et al. [41]. (a)
View through the centre of the 2 ring (ribbons); (b) View showing DNA threading through the
2 ring (spacefill). Taken from [41].
(a) (b)
Chapter 1 General Introduction
15
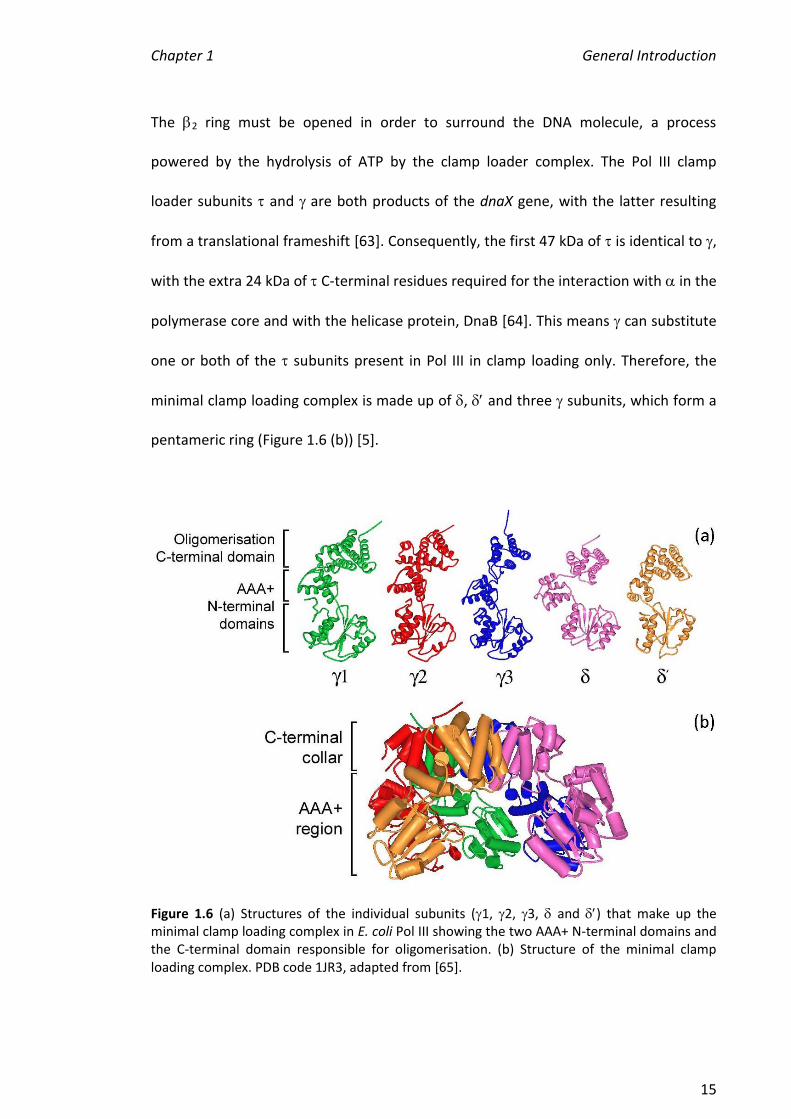
The 2 ring must be opened in order to surround the DNA molecule, a process
powered by the hydrolysis of ATP by the clamp loader complex. The Pol III clamp
loader subunits and are both products of the dnaX gene, with the latter resulting
from a translational frameshift [63]. Consequently, the first 47 kDa of is identical to ,
with the extra 24 kDa of C-terminal residues required for the interaction with in the
polymerase core and with the helicase protein, DnaB [64]. This means can substitute
one or both of the subunits present in Pol III in clamp loading only. Therefore, the
minimal clamp loading complex is made up of , and three subunits, which form a
pentameric ring (Figure 1.6 (b)) [5].
Figure 1.6 (a) Structures of the individual subunits (1, 2, 3, and ) that make up the minimal clamp loading complex in E. coli Pol III showing the two AAA+ N-terminal domains and the C-terminal domain responsible for oligomerisation. (b) Structure of the minimal clamp loading complex. PDB code 1JR3, adapted from [65].
Chapter 1 General Introduction
16
All prokaryotic and eukaryotic clamp loader subunits are members of the AAA+
(ATPases associated with many cellular activities) family, containing an ATP-binding
domain (AAA+ domain) around 200–250 amino-acids long [66]. AAA+ proteins usually
form hexamers, with the binding of ATP initiating a conformational change, however,
the E. coli clamp loader contains a gap instead of the sixth subunit [65]. Each E. coli
clamp loader subunit consists of two AAA+ N-terminal domains [67] and a C-terminal
domain which contains all the inter-subunit contact points (Figure 1.6 (a)) [65]. The
eukaryote clamp loading complex, RFC has a similar structure [31]. Within the clamp
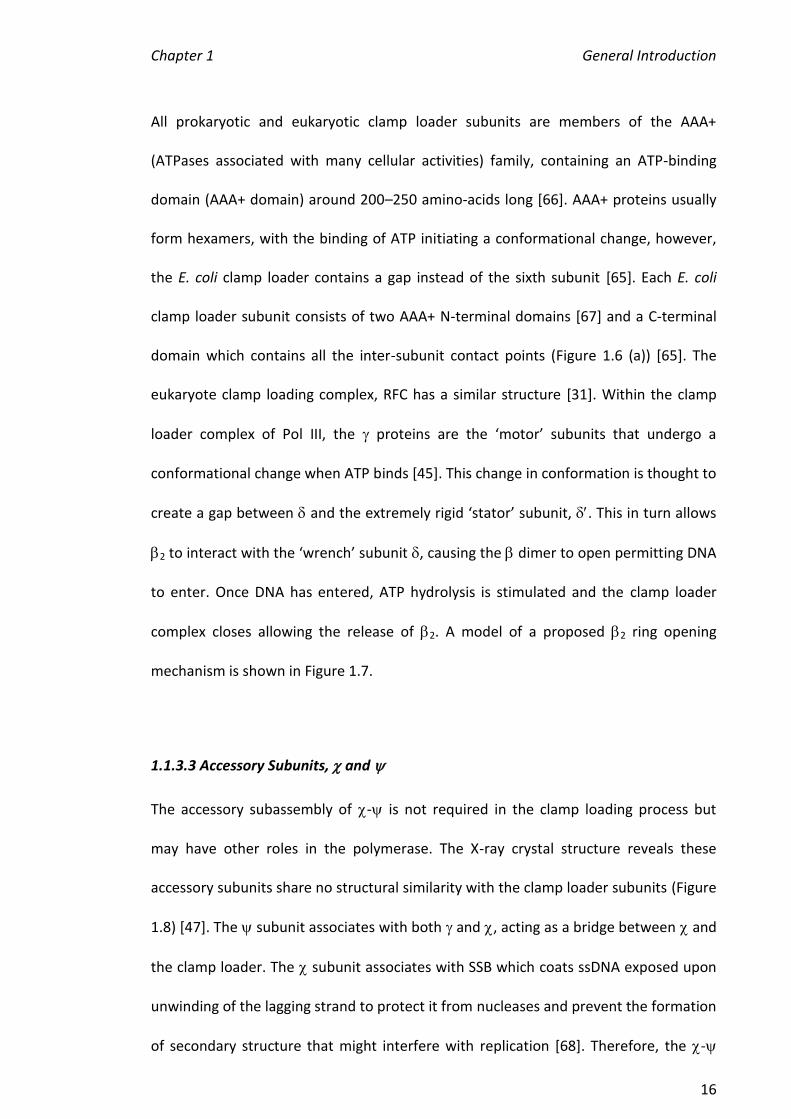
loader complex of Pol III, the proteins are the ‘motor’ subunits that undergo a
conformational change when ATP binds [45]. This change in conformation is thought to
create a gap between and the extremely rigid ‘stator’ subunit, . This in turn allows
2 to interact with the ‘wrench’ subunit , causing the dimer to open permitting DNA
to enter. Once DNA has entered, ATP hydrolysis is stimulated and the clamp loader
complex closes allowing the release of 2. A model of a proposed 2 ring opening
mechanism is shown in Figure 1.7.
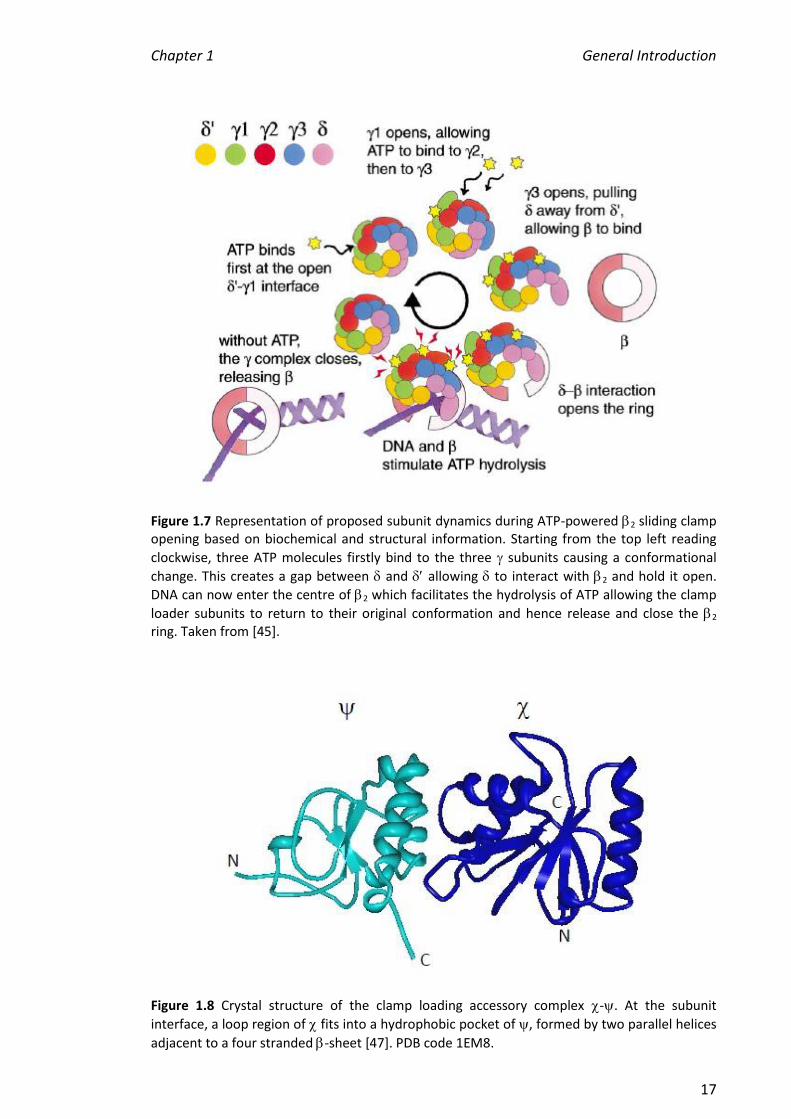
1.1.3.3 Accessory Subunits, and
The accessory subassembly of - is not required in the clamp loading process but
may have other roles in the polymerase. The X-ray crystal structure reveals these
accessory subunits share no structural similarity with the clamp loader subunits (Figure
1.8) [47]. The subunit associates with both and , acting as a bridge between and
the clamp loader. The subunit associates with SSB which coats ssDNA exposed upon
unwinding of the lagging strand to protect it from nucleases and prevent the formation
of secondary structure that might interfere with replication [68]. Therefore, the -
Chapter 1 General Introduction
17
Figure 1.7 Representation of proposed subunit dynamics during ATP-powered 2 sliding clamp opening based on biochemical and structural information. Starting from the top left reading
clockwise, three ATP molecules firstly bind to the three subunits causing a conformational
change. This creates a gap between and allowing to interact with 2 and hold it open.
DNA can now enter the centre of 2 which facilitates the hydrolysis of ATP allowing the clamp
loader subunits to return to their original conformation and hence release and close the 2 ring. Taken from [45].
Figure 1.8 Crystal structure of the clamp loading accessory complex -. At the subunit
interface, a loop region of fits into a hydrophobic pocket of , formed by two parallel helices
adjacent to a four stranded -sheet [47]. PDB code 1EM8.
Chapter 1 General Introduction
18
subassembly plays a vital role during the synthesis of Okazaki fragments (lagging
strand replication) in which some ssDNA is exposed. It has been found that SSB binds
to with a much higher affinity when SSB is also bound to DNA [69].
1.1.4 Stoichiometry of Pol III Subunits
In order to characterise the subunits and subassemblies that make up the E. coli
replisome, the subunits must first be isolated. Individual subunits can be purified from
cell lysates of bacterial strains engineered to overproduce the protein of interest [18].
Subassemblies of Pol III have been prepared by adding purified subunits together and
gel filtration can be used to screen and isolate the resulting complex, with detection
often carried out by native polyacrylamide gel electrophoresis (PAGE) [5]. A
disadvantage of this method is that precise stoichiometries cannot always be
determined. For example, the presence or absence of a small subunit (e.g. 15 kDa) in a
large complex of 100 kDa might be ambiguous using PAGE or gel filtration.
A full understanding of the mechanism of the replisome in DNA synthesis requires
knowledge of the molecular detail of interactions between the subunits, their
stoichiometry, and how these interactions change in space and time. Some insights
may be gained by studying functional subassemblies of the replisome.
1.2 Techniques for Investigating Protein-Protein Interactions
Nearly every cellular process requires the interaction between one or more proteins so
it is important to have a range of techniques for investigating protein-protein
interactions [70]. The simplest form of a multi-subunit complex contains multiple
Chapter 1 General Introduction
19
copies of the one protein, for example, equine alcohol dehydrogenase which exists as
a homodimer [71]. More complicated multi-subunit complexes contain many different
subunits such as the ATP synthase [72], the ribosome [73], the proteasome [74] and
the eukaryotic replisome [22, 33, 75]. These are often referred to as molecular
machines as they are made up of highly co-ordinated moving parts that are powered
by conversion of chemical energy (e.g. ATP hydrolysis) [76]. Furthermore, many
transient associations can occur between individual proteins or those within a
complex, providing another level of complexity to studying these interactions.
There are many techniques available for studying protein-protein interactions,
however, there is no one method that can reveal all there is to know about an
interaction between two binding partners. Rather, multiple techniques are used to
reveal different aspects of the interaction in order to understand it as a whole. The
techniques range from the classic methods of analytical ultracentrifugation and gel
filtration, to structure elucidation methods such as NMR spectroscopy and X-ray
crystallography, to more recently applied technologies such as surface plasmon
resonance (SPR) and mass spectrometry. A suite of other methods is also available,
including chemical cross-linking [77], fluorescence resonance energy transfer [78],
electron microscopy (EM) [79] and isothermal titration calorimetry [80], but these
techniques will not be described here.
One of the first techniques for studying protein-protein reactions was analytical
ultracentrifugation, originally used for the molecular mass determination of proteins
[81]. The late 1990s saw a great improvement in the instrumentation and analysis
techniques used for analytical ultracentrifugation, making it more applicable to the
Chapter 1 General Introduction
20
study of protein-protein interactions [82]. The innovations included a more user-
friendly interface, computer control of parameters and the acquisition of digital data,
which enabled simple and fast data analysis with the help of more sophisticated
computers [83]. When investigating stable interactions, analytical ultracentrifugation
can be used to physically separate the different non-covalent complexes that form and
then characterise them [84]. This is mainly performed using the sedimentation velocity
technique in which a centrifugal force fractionates the complexes as a function of their
mass, shape and density differences [84]. Sedimentation co-efficients and molar
masses can then be estimated from the resulting time-dependent gradients. In a study
of E. coli ATP synthase, analytical ultracentrifugation experiments confirmed that the
stoichiometry of the b and subunits was b2 [85]. In these experiments, an aromatic
amino acid-free version of b (bST34-156) was used as difficulties were initially
encountered when interpreting data where wild-type b was used.
Another long-standing method used to investigate protein-protein interactions is gel
filtration, also known as size-exclusion chromatography [86]. A typical gel filtration
column contains a porous cross-linked gel (stationary phase) which separates
macromolecules on the basis of size once a running buffer is added (mobile phase).
Proteins larger than the pores by-pass the gel so elute first, while smaller proteins lag
behind as they travel through the pores. A detector monitors the eluent for the
presence of protein and is recorded as an ‘elution profile’. Although gel filtration plays
an important role in purifying proteins from lower molecular weight contaminants, it
can also be used to study protein self-association and interactions between dissimilar
proteins. In a typical gel filtration experiment, a protein and its binding partner(s) are
applied to the column in a small volume and the elution profile of the complex(es) are
Chapter 1 General Introduction
21
compared to the elution profiles of the individual proteins. If a complex has formed, it
will elute before the individual protein [70]. In a study of eukaryotic replisome
components by Podust and co-workers, gel filtration experiments showed that once
clamp loading or Pol holoenzyme assembly occurred, PCNA remained bound to DNA
while RFC dissociated [87].
Obtaining structures of multi-protein complexes adds another level of difficulty to
structural determination using X-ray crystallography and NMR spectroscopy.
Nevertheless, the structures for a small number (compared to structures of single
proteins) of multi-protein complexes have been determined using these methods.
Using X-ray crystallography, Lowe et al. determined the structure of the 673 kDa
proteasome complex from Thermoplasma acidophilum, an archaeabacterium [88]. The
X-ray structure revealed that the proteasome consists of four stacked rings creating an
overall barrel shape. The two inner and two outer rings consist of seven subunits and
seven subunits, respectively, making the stoichiometry of the proteasome 7777
[88]. NMR spectroscopy has been used to gain insight into the structure of the large,
54 subunit ribosome from E. coli (~2.3 MDa, including 3 RNA molecules), known as the
70S ribosome [89]. Christodoulou and co-workers found that the C-terminal domains
of the ribosome stalk proteins L7/L12 were very flexible but were stabilised when
bound to elongation factor G, complementing EM studies [89].
Although they both generate high resolution structural data, the main limitation of
both X-ray crystallography and NMR spectroscopy is that large quantities (milligram
scale) of protein are required [90]. Furthermore, in the former method it is often
difficult to crystallise large protein complexes, while NMR experiments may lead to
Chapter 1 General Introduction
22
denaturation of proteins as they are often carried out over a substantial time period at
room temperature [91]. While the examples discussed above show that these
problems were not encountered (or were encountered then solved), there are
additional limitations. X-ray crystallography only provides a static snapshot of protein
structure [92] and NMR structures are an average generated from all structures
present at one particular time, although it has the advantage of being able to monitor
dynamic interactions and identify amino acids involved in protein interactions [91, 92].
SPR is a relatively new technology for the study of protein-protein interactions, with
the first commercial instrument (BiacoreTM) introduced in 1990 [93]. In this method, a
solution containing the analyte (usually the largest binding partner) is flowed through a
cell containing ligand which is immobilised onto the surface of a gold plated sensor
chip [70]. Polarised light is directed onto this chip which is reflected onto a diode array
(the detector) [94]. This is monitored continuously so that when the analyte binds to
the immobilised ligand, the resulting change in the refractive index of light can be
observed in real time. Data are presented in the form of a ‘sensorgram’ which shows
the on rate (when the analyte is flowing over the ligand, allowing them to associate)
and the off rate (dissociation of the complex when buffer is flowing over the ligand). In
an SPR study of the eukaryotic ribosomal proteins P1 and P2 it was found that both
bound specifically to elongation factor 2, with affinity for P1 the highest, increasing
two to four-fold when the proteins were phosphorylated [95].
Advances in mass spectrometry over the last twenty years now allow this technique to
be used to detect and analyse very large molecules and non-covalent complexes of
large molecules such as those in the DNA polymerase III holoenzyme. The use of soft
Chapter 1 General Introduction
23
ionisation processes in mass spectrometry, such as ESI-MS, in the study of protein-
protein interactions has provided biological chemists with another technique. ESI-MS is
described in more detail in the following section.
1.2.1 Biological Mass Spectrometry
Mass spectrometric analysis requires ionisation of molecules, mass analysis and
detection of ions and although the first mass spectrometry experiments were
conducted over a century ago [96], it wasn’t until the 1980s that the development of
biomolecular MS occurred. One of the milestones of this field was the development of
the ESI and matrix-assisted laser desorption ionisation (MALDI) methods of ionisation.
These were vital as they permitted larger biomolecules such as proteins and DNA to
enter the gas phase intact in order to enable their analysis using MS. Sources
employing these ionisation methods have been coupled with various mass analysers
including quadrupole or triple quadrupole and ion trap [97] (especially for ESI), time-
of-flight (MALDI and ESI) and combinations of these (e.g. quadrupole and time-of-flight
for both ESI and MALDI) [98-100].
Leading to the development of MALDI in 1981, Liu et al. obtained the first mass spectra
of nucleotides, nucleosides, and peptides using matrix associated desorption ionisation
[101]. Several years later, in 1988, Karas and Hillenkamp described the MS of proteins
in excess of 10 kDa using ultraviolet laser desorption, now known as MALDI [102]. In
MALDI analysis, samples are spotted onto a target plate together with a ‘matrix’. The
matrix is usually an aromatic organic acid and when a laser is targeted at the sample,
the matrix absorbs the photon energy that is imparted to the analyte, resulting in
Chapter 1 General Introduction
24
ionisation and desorption from the target plate. In these first experiments, mass
spectra of chicken egg white lysozyme (14.3 kDa), bovine -lactoglobulin A (18.3 kDa),
porcine trypsin (23.5 kDa), and bovine albumin (67 kDa) were obtained. The process of
MALDI and its applications in analysis of biomolecules have been reviewed elsewhere
[99, 103].
The same decade saw the coupling of ESI to MS by Fenn and co-workers [104]. Their
mass spectrometer coupled an ESI ion source to a quadrupole mass analyser with a
mass range up to m/z 1500. In ESI-MS, an aqueous sample of analyte flows through a
capillary and is dispersed using high voltage [105]. This creates droplets at atmospheric
pressure which gain excess positive or negative charges. The droplets gradually
evaporate, with the assistance of a desolvation gas, such as nitrogen, until they
become gas phase ions. These ions are then detected and analysed by the mass
spectrometer. Although an important achievement, the ESI-MS of large polyethylene
glycol oligomers up to 17.5 kDa did not initiate enthusiasm in other disciplines such as
in the biochemistry/molecular biology community [105]. Later, the successful analysis
of the proteins insulin (5.7 kDa), cytochrome c (12.2 kDa), lysozyme (14.3 kDa),
myoglobin (17 kDa), trypsin inhibitor (20.1 kDa), -chymotrypsinogen A (25.5 kDa),
carbonic anhydrase II (29 kDa) and alcohol dehydrogenase (40 kDa) showed real
promise for ESI-MS and the ‘electrospray revolution’ commenced [105, 106].
Shortly after the work of Fenn and co-workers was published, MS was mainly applied
to the determination of accurate masses of proteins and DNA and for sequencing [107-
110]; an excellent review on the topic by Smith et al. [111] is available. In 1991 ESI-MS
was utilised for the detection of complexes of biomolecules held together by non-

Chapter 1 General Introduction
25
covalent interactions. The first published study of this was by Ganem et al. who
obtained mass spectra of the immunosuppressive binding protein, human FKBP, in
non-covalent complexes with the immunosuppressive agents FK506 and rapamycin
using a triple quadrupole instrument [112]. Also in 1991, Katta and Chait acquired the
first mass spectra of native myoglobin (containing a non-covalently bound haem
group), an improvement on previous studies in which only spectra of denatured,
haem-free myoglobin were obtained [113].
Since the start of the 1990s, a plethora of papers utilising ESI-MS to investigate non-
covalent complexes has been published. These include drug-DNA, protein-DNA,
protein-protein and protein-metal interactions, to name a few. A recurring question
has been whether the behaviour (e.g. stoichiometry, binding affinity, structure) of
these macromolecules in the gas phase is comparable to what occurs in solution, with
most of the more recent studies validating ESI-MS results with other biophysical
methods [114]. As an example, ESI-MS was used in our laboratory to study the
association between the Tus protein and the Ter DNA sequences it binds to in order to
stop replication in E. coli cells [115]. This interaction was previously studied using X-ray
crystallography [116] and SPR [117]. ESI-MS experiments showed that Tus bound
tightly only to specific dsDNA sequences. Further, the binding of wild-type Tus and Tus
mutants to dsDNA followed the same relative order of binding affinity determined in
SPR experiments [118].
An example of a protein-metal complex studied by ESI-MS is the complex formed
between calmodulin (CaM) and calcium. As its name suggests, CaM modulates the
activities of a range of enzymes in response to calcium concentration in eukaryotic
Chapter 1 General Introduction
26
cells [119]. In a study using a mass spectrometer containing a quadrupole mass
analyser with an m/z range up to 3000, up to four Ca2+ ions were found to bind
specifically to CaM, indicating four high affinity binding sites [120, 121], in agreement
with the X-ray crystal structure of calmodulin [122]. Interestingly, when similar
experiments were performed with magnesium, CaM only bound up to two Mg2+ ions,
with the authors suggesting this metal binds to auxiliary sites on the protein.
Furthermore, Shirran et al. investigated the binding of CaM-Ca(II) complexes to the
enzyme neuronal nitric oxide synthase (nNOS) using a Q-TOF instrument [123]. This
enzyme produces nitric oxide which is important in cellular signalling. In solutions
containing nNOS, CaM and Ca2+, ESI-MS mass spectra showed that nNOS bound
exclusively to CaM-Ca(II)4, rather than to CaM with fewer Ca2+ ions. Many more
examples of protein-metal studies using ESI-MS are described in a review by Loo [90].
Haas and Plow used ESI-MS to investigate the protein-protein interaction between the
and subunits of integrin and the effect of adding a divalent cation [124]. Integrins
are a family of receptors that facilitate communication between cells. The and
subunits form a heterodimer with each subunit containing three domains (the
extracellular, transmembrane and cytoplasmic tail regions). In the study, recombinant
versions of the cytoplasmic tails of both and were used. Using a triple quadrupole
ESI mass spectrometer, it was found that these tails interacted in a 1:1 ratio. Mass
spectra also revealed that but not , contains a cation binding site, and that the
heterodimer they form also binds to a cation in a 1:1:1 ratio. Since the advent of ESI-
MS, there have been a number of reviews on its application to the investigation of
non-covalent biomolecular complexes [90, 92, 125, 126].
Chapter 1 General Introduction
27
More recently, large molecular machines such as the ribosome and GroEL have been
successfully transferred intact into the gas phase [127, 128]. Ribosomes are complexes
of protein and RNA that translate RNA into proteins. In bacteria, the complex is known
as the 70S ribosome (>2 MDa), made up of the 30S and 50S subassemblies. Rostom
and co-workers obtained ESI mass spectra of the intact 70S ribosome in the presence
of Mg2+ and found that when the metal ion concentration was decreased, it
dissociated into its 30S and 50S components [127]. Collision-induced dissociation (CID)
was used to further dissociate the ribosome in order to identify weakly bound subunits
and successively dismantle the complex. CID is usually the second step in a tandem MS
experiment with the first step being the selection and isolation of ions at a defined
m/z. In CID, the selected ions are accelerated into a gas-filled chamber where some of
the kinetic energy (from collisions with neutral gas molecules) translates into internal
energy to give dissociation products [92, 129]. The molecular chaperone from E. coli,
GroEL, forms an 800 kDa tetradecameric complex which has also been studied using
ESI-MS [128]. Prior to this study it was thought that GroEL could only bind one
substrate at a time. While this was the case with the model substrate rubisco, it was
found that two subunits of gp23, a native substrate, bound to GroEL. CID then revealed
that these are the stoichiometries required to stabilise the complex since GroEL-gp23
dissociated more readily than GroEL-rubisco or GroEL-(gp23)2 [128].
1.2.1.1 Design of ESI-MS Experiments
To determine accurate masses, proteins are typically dissolved in solutions containing
acid (to assist protonation) and organic solvents (to assist evaporation of solvent).
Clearly these conditions will promote dissociation of non-covalent complexes. In order
Chapter 1 General Introduction
28
for such complexes to remain intact for analysis, care has to be taken both in solution
and instrumental conditions. Therefore ESI-MS of non-covalent complexes is carried
out in solutions containing volatile salts such as ammonium acetate or ammonium
bicarbonate solution usually at near-neutral pH, in the absence of organic solvents
[90]. Furthermore, gentle conditions for ionisation must be employed. For example, for
the mass determination of a protein or DNA, high temperatures (e.g. 150C) are often
used to encourage evaporation of solvent. Under these conditions, dsDNA and other
non-covalent complexes may dissociate, so the temperature of the ionisation source of
the mass spectrometer must be decreased, often to 40-60C [118]. These solution and
instrument conditions represent a compromise between the use of traditional buffers
that might be used for biochemical characterisation of non-covalent complexes of
biomolecules and the best ESI-MS conditions for obtaining accurate masses. This
presents a challenge for researchers in this field, since in many cases solution
conditions determined for maintaining the activity of an enzyme or the structure of a
protein-protein complex often include ethylenediaminetetraacetic acid (EDTA, for
chelating adventitious metal ions), dithiothreitol (DTT, for maintaining any free thiol
group of cysteine residues in reduced form), glycerol (for stability) and sodium chloride
(to maintain stability and solubility).
1.2.1.2 Advantages of ESI Mass Spectrometry
ESI-MS has some advantages over other methods for investigating protein-protein
interactions. Firstly, ESI-MS is rapid and results can be viewed in real time which is not
the case for any of the methods described above except for SPR [130]. ESI-MS can be
used to determine the stoichiometry of interacting components, such as those in a
Chapter 1 General Introduction
29
multi-protein complex or between a protein and nucleic acid, as reviewed in [131]. The
homogeneity of subassemblies in a solution can also be verified in an ESI-MS
experiment. This is often not possible using analytical ultracentrifugation, gel filtration,
NMR spectroscopy, X-ray crystallography or SPR since minor components of mixtures
might not be able to be detected using these techniques. ESI-MS is particularly
important for complexes that have proven difficult to crystallise for structural studies.
While the X-ray crystal structure has been solved for the N-terminal domain of DnaB,
the structural elucidation of the (DnaB)6-(DnaC)6 complex via X-ray crystallography has
so far met with failure, as the proteins have not been able to be crystallised. ESI mass
spectra, however, have been successfully acquired for (DnaB)6-(DnaC)6 [132].
1.2.1.3 Nanospray ESI-MS (nanoESI-MS)
The nanoESI source offers several analytical advantages over conventional ESI. Whilst
conventional ESI utilises a syringe for introducing sample into the mass spectrometer,
nanoESI utilises a small glass capillary tube, drawn to a fine tip (~1 m inner diameter)
[133]. These capillaries are then sputter-coated with a conductive material, for
example gold [134]. The smaller orifice in turn leads to a smaller initial droplet size (<
200 nm) compared to ~1 m from conventional ESI. This means that droplets
containing the analyte are smaller, assisting desolvation and therefore potentially
producing greater peak resolution in the mass spectrum. The extremely low flow rates
(~30 nL/min) are dictated by forces from the electric fields when voltage (~1.5 V) is
applied to the metal-coated capillary, negating the need for solvent pumps [133, 134].
The flow is usually initiated by a small amount of back pressure. Contamination is
avoided in nanoESI-MS as the capillaries are only used once. The greatest advantage of
Chapter 1 General Introduction
30
nanoESI-MS is that it requires small sample volumes (< 10 l, compared with > 100 l
for conventional ESI-MS), important in experiments where large sample quantities are
not available. If the sample is spraying well, one sample can last up to 10 minutes
allowing for multi-faceted experiments such as acquiring a conventional spectrum then
changing the instrumental conditions in order to obtain CID spectra. Despite these
analytical advantages, nanoESI-MS has some limitations including more frequent
blocking of the spray tip as a result of the small orifice and differences in tip
morphology (the tip of the pulled glass capillaries is cut off manually using tweezers)
that may result in diminished reproducibility of the spectra (e.g. relative intensities of
different charge states) [135].
1.3 Scope of this Thesis
The research outlined in this thesis provides a platform for determining precise
stoichiometries and for studying stabilities and the order of assembly of functional
subassemblies of the E. coli replisome, in particular, those of Pol III by ESI-MS. This is
important to enable a fundamental understanding of how biological molecular
machines work. Further, a complete understanding of bacterial replication may lead to
new targets for antibiotics. In this laboratory, there is a long-standing project aimed at
understanding the stoichiometry and dynamics of the E. coli replisome and assessing
the applicability of ESI-MS for studying non-covalent interactions of biological
molecules. The Pol III complexes chosen for this study reveal some important insights
into the strengths and weaknesses of ESI-MS for investigating non-covalent
biomolecular complexes. The content of each chapter of this thesis is presented in
overview below.
Chapter 1 General Introduction
31
The interaction between and using nanoESI-MS is investigated in Chapter 3. This
has been performed using a recombinant form of known as C16 that binds . As
suggested by its name, C16 contains the ~16 kDa C-terminal of . A series of
experiments was carried out in which C16 was titrated with , including a range of
C16 mutants and truncations in order to determine their relative binding affinities.
Further investigations were carried out using CID and hydrogen/deuterium exchange
(HDX) to compare the conformation and stabilities of the complexes.
The focus of Chapter 4 is , the exonuclease subunit of Pol III, investigated using the
recombinant N-terminal domain (186) which retains activity and the binding site. In
particular, the binding of a variety of metal ions and the substrate mimic, TMP, were
explored using ESI-MS. Spectrophotometric assays were also performed confirming the
findings of the ESI-MS results. Additionally the effect of on metal-binding by 186
was explored.
In Chapter 5, travelling wave ion mobility (TWIMS) mass spectrometry was used to
determine the collision cross sections (CCS) of subunits of the Pol III replisome,
commercially available proteins and the large protein complex rubisco. As a prelude to
this, the assembly of the clamp loader complex was investigated using nanoESI-MS.
The creation of a calibration curve is discussed as CCS values cannot be directly
correlated to the drift time of proteins using this instrument (required for the analysis
of large protein complexes). The CCS values determined here were carried out in
parallel with measurements conducted by the research group of Professor C. Robinson
at the University of Cambridge. Since the application of TWIMS is relatively new, it was
of interest to compare the CCS measurements from two independent laboratories.
Chapter 2 Materials and Methods
32
Chapter 2 Materials & Methods
2.1 Materials
2.1.1 Reagents
MilliQTM water from Millipore (Bedford, USA) was used in all experiments. All materials
were of the highest grade commercially available. Ammonium acetate (NH4OAc), acetic
acid (AcOH), acetonitrile, formic acid, methanol (HPLC grade), sodium chloride and
zinc(II) acetate were from Ajax Finechem (Seven Hills, Australia). Thymidine-5-
monophosphate (TMP), the 5-p-nitrophenyl ester of TMP (pNP-TMP), , -
imidoadenosine-5-triphosphate (AMP-PNP), magnesium(II) acetate, manganese(II)
acetate, copper(II) acetate, dysprosium(III) acetate, iron(II) acetate and NaCl were
purchased from Sigma-Aldrich (St Louis, USA). Ammonia and isopropanol were
obtained from Asia Pacific Specialty Chemicals Ltd (Seven Hills, Australia). Iron(II)
ammonium sulfate [(NH4)2SO4·FeSO4·6H2O] was purchased from BDH Chemical and
Analytical Reagents (UK). Tris (tris(hydroxymethyl)aminomethane) hydrochloride was
from ICN Biomedicals (now MP Biomedicals; Aurora, USA). Deuterium oxide (D2O) was
purchased from Novachem (Collingwood, Australia).
2.1.2 Consumables
Biomax Ultrafree centrifugal filter tubes (5 kDa molecular weight cut-off; MWCO) were
from Millipore (Bedford, USA). Dialysis tubing (10 kDa MWCO) was purchased from
Crown Scientific (Moorebank, Australia). Borosilicate glass capillaries with an internal
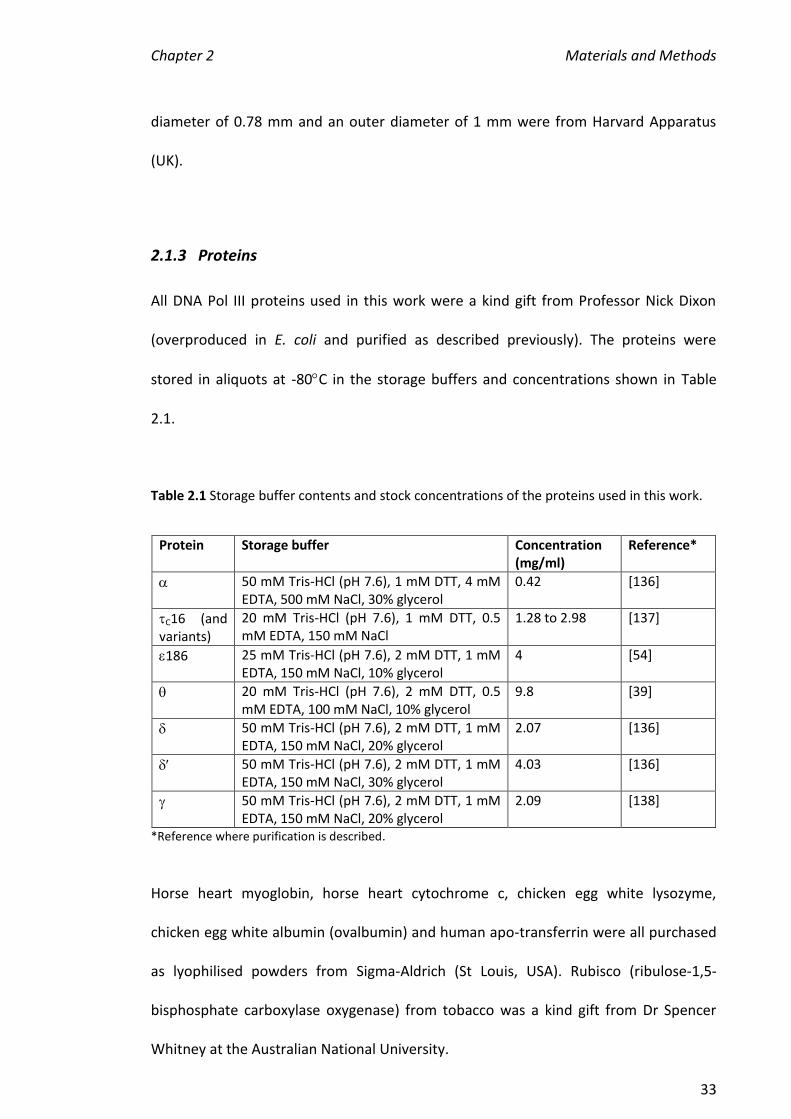
Chapter 2 Materials and Methods
33
diameter of 0.78 mm and an outer diameter of 1 mm were from Harvard Apparatus
(UK).
2.1.3 Proteins
All DNA Pol III proteins used in this work were a kind gift from Professor Nick Dixon
(overproduced in E. coli and purified as described previously). The proteins were
stored in aliquots at -80C in the storage buffers and concentrations shown in Table
2.1.
Table 2.1 Storage buffer contents and stock concentrations of the proteins used in this work.
Protein Storage buffer Concentration (mg/ml)
Reference*
50 mM Tris-HCl (pH 7.6), 1 mM DTT, 4 mM EDTA, 500 mM NaCl, 30% glycerol
0.42 [136]
C16 (and variants)
20 mM Tris-HCl (pH 7.6), 1 mM DTT, 0.5 mM EDTA, 150 mM NaCl
1.28 to 2.98 [137]
186 25 mM Tris-HCl (pH 7.6), 2 mM DTT, 1 mM EDTA, 150 mM NaCl, 10% glycerol
4 [54]
20 mM Tris-HCl (pH 7.6), 2 mM DTT, 0.5 mM EDTA, 100 mM NaCl, 10% glycerol
9.8 [39]
50 mM Tris-HCl (pH 7.6), 2 mM DTT, 1 mM EDTA, 150 mM NaCl, 20% glycerol
2.07 [136]
50 mM Tris-HCl (pH 7.6), 2 mM DTT, 1 mM EDTA, 150 mM NaCl, 30% glycerol
4.03 [136]
50 mM Tris-HCl (pH 7.6), 2 mM DTT, 1 mM EDTA, 150 mM NaCl, 20% glycerol
2.09 [138]
*Reference where purification is described.
Horse heart myoglobin, horse heart cytochrome c, chicken egg white lysozyme,
chicken egg white albumin (ovalbumin) and human apo-transferrin were all purchased
as lyophilised powders from Sigma-Aldrich (St Louis, USA). Rubisco (ribulose-1,5-
bisphosphate carboxylase oxygenase) from tobacco was a kind gift from Dr Spencer
Whitney at the Australian National University.

Chapter 2 Materials and Methods
34
2.2 Methods
2.2.1 Protein Buffer Exchange via Dialysis
In order to transfer the proteins into a solution compatible with ESI-MS analysis, an
aliquot of protein stock (Table 2.2), diluted with the appropriate concentration of
NH4OAc to 300 µl, was injected into 10 kDa MWCO dialysis tubing. The diluted protein
was dialysed against the same concentration of NH4OAc (4 x 2 L) at 4C. On the day of
ESI-MS analysis, each dialysed protein was transferred into an Eppendorf tube and
stored on ice. Table 2.2 summarises the NH4OAc concentrations and volumes of stock
proteins used for each dialysis.
Table 2.2 Protein volumes and solutions used for ESI-MS analysis. The NH4OAc solution was
added to an aliquot of protein stock to a volume of 300 l (dialysis) or 400 l (centrifugal ultrafiltration).
Protein Protein stock
concentration (M)
Protein stock
volume (l)
NH4OAc concentration (M)
pH
4 250 0.2 7.2
C14 1100 2 0.2 7.2
C167 350 5 0.2 7.2
C1611 23 40 0.2 7.2
C16 143 9 0.2 7.2
C16[S617P] 77 16 0.2 7.2
C16[I618T] 97 13 0.2 7.2
C16[L627P] 98 13 0.2 7.2
C16[F631I] 84 15 0.2 7.2
C16[L635P] 79 16 0.2 7.2
C16[D636G] 181 7 0.2 7.2
186 971 100 0.1 8.0
1107 30 0.1 8.0
44 120 0.5 6.9
53.5 40 1.0 6.9
109.2 20 0.5 6.9

Chapter 2 Materials and Methods
35
2.2.2 Protein Buffer Exchange via Centrifugal Filter Tubes
Biomax Ultrafree centrifugal filter tubes (50 kDa MWCO) were occasionally used
instead of dialysis in order to transfer proteins into the appropriate solution. This
method has the advantage that it is more rapid than dialysis (< 1 hour compared to 1
day using dialysis). A disadvantage of using the Biomax tubes is that they are expensive
and in some cases, precipitation or loss of protein, possibly due to adsorption to the
tubes, was observed using these devices. For example, when the subunit of Pol III
was prepared using this method, the nanoESI mass spectra were highly variable, often
giving poor or no signal, whereas dialysis of produced more consistent spectra.
The centrifugal filter tubes were filled with 400 l of NH4OAc solution then centrifuged
at 10000 x g for 10 min (until the remaining volume was ~50 l) at 4C. This washing
step was repeated twice. An aliquot of protein (the same as for dialysis; Table 2.2) was
added and diluted with NH4OAc solution to 400 l and centrifuged as outlined for the
washing step. This was repeated twice but without further addition of protein. Lastly,
the concentrated protein solution was diluted to ~300 l with NH4OAc solution.
2.2.3 Determination of Protein Concentration
The concentrations of the dialysed and centrifuged proteins were calculated by
determining their absorbance at 280 nm using a PharmaSpec UV-1700 UV-Visible
spectrophotometer (Shimadzu, Japan). The molar absorption coefficients at 280 nm
used in this work are shown in Table 2.3.
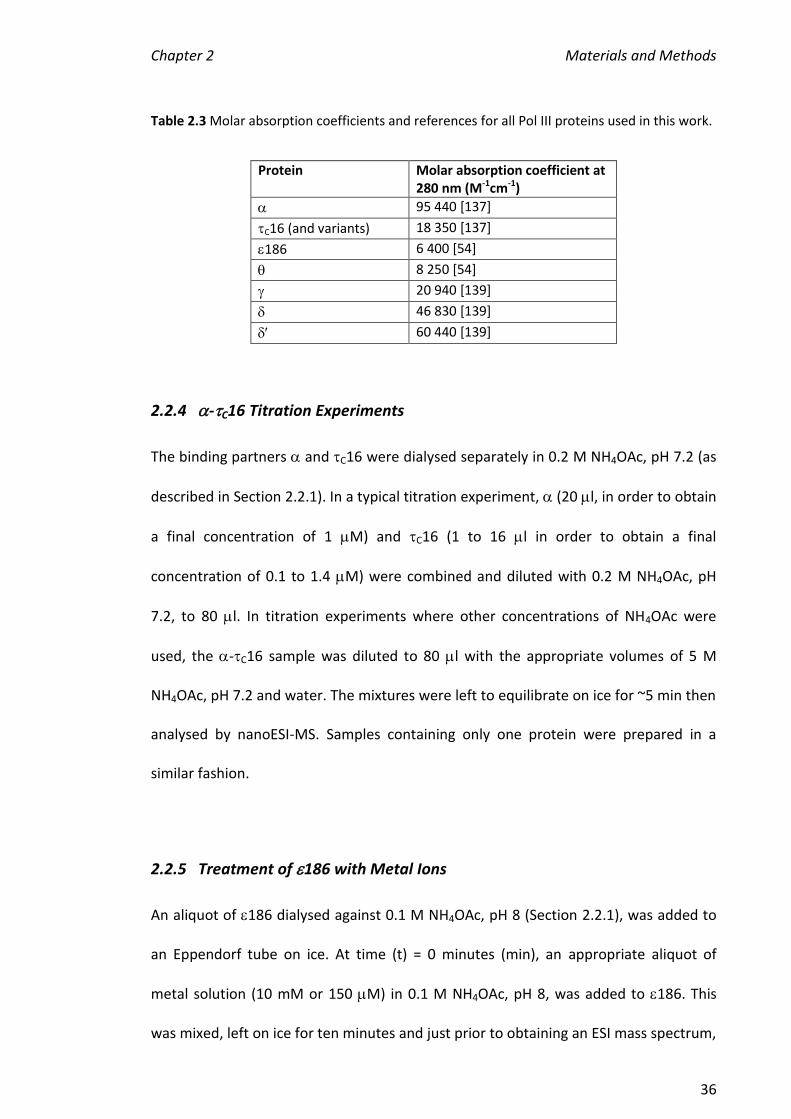
Chapter 2 Materials and Methods
36
Table 2.3 Molar absorption coefficients and references for all Pol III proteins used in this work.
Protein Molar absorption coefficient at 280 nm (M-1cm-1)
95 440 [137]
C16 (and variants) 18 350 [137]
186 6 400 [54]
8 250 [54]
20 940 [139]
46 830 [139]
60 440 [139]
2.2.4 -C16 Titration Experiments
The binding partners and C16 were dialysed separately in 0.2 M NH4OAc, pH 7.2 (as
described in Section 2.2.1). In a typical titration experiment, (20 l, in order to obtain
a final concentration of 1 M) and C16 (1 to 16 l in order to obtain a final
concentration of 0.1 to 1.4 M) were combined and diluted with 0.2 M NH4OAc, pH
7.2, to 80 l. In titration experiments where other concentrations of NH4OAc were
used, the -C16 sample was diluted to 80 l with the appropriate volumes of 5 M
NH4OAc, pH 7.2 and water. The mixtures were left to equilibrate on ice for ~5 min then
analysed by nanoESI-MS. Samples containing only one protein were prepared in a
similar fashion.
2.2.5 Treatment of 186 with Metal Ions
An aliquot of 186 dialysed against 0.1 M NH4OAc, pH 8 (Section 2.2.1), was added to
an Eppendorf tube on ice. At time (t) = 0 minutes (min), an appropriate aliquot of
metal solution (10 mM or 150 M) in 0.1 M NH4OAc, pH 8, was added to 186. This
was mixed, left on ice for ten minutes and just prior to obtaining an ESI mass spectrum,
Chapter 2 Materials and Methods
37
an aliquot (to make the final volume 200 l) of 0.1 M NH4OAc, pH 8 was added. This
gave a final 186 concentration of 2 M with the metal ion in 2 to 100-fold molar
excess. Each 186-metal solution was analysed by ESI-MS as described in Section
2.2.12. To ensure all metal ions were removed between each ESI-MS analysis, the
tubing used for introduction of the sample into the mass spectrometer was washed
with ~300 l 2% acetic acid solution followed by ~600 l water at 60 l/min after each
mass spectrum was acquired.
2.2.6 Treatment of 186 with Metal Ions, TMP and/or
For 186 samples where metal ions and/or TMP were added, the procedure above
(Section 2.2.5) was followed with the following exceptions. At t = 0 min an aliquot of
100 M TMP (in 0.1 M NH4OAc, pH 8) was added to 186 to give final TMP and 186
concentrations of 80 M and 2 M, respectively. At t = 5 min an aliquot of metal ion
stock solution was added so that the metal ions were in 2 to 100 molar excess over
186. For samples containing metal ions and 186-θ, 186 was first added to an aliquot
of θ in an equimolar ratio at t = 0 min (since θ stabilises 186), with the metal added at
t = 5 min and acquisition of an ESI mass spectrum occurring at t = 10 min. When TMP
was added to an identical 186-θ mixture it was done so at t = 5 min with metal
addition at t = 10 and spectrum acquisition at t = 15 min.
2.2.7 Spectrophotometric Assays of 186
The exonuclease activity assays described here continue from experiments performed
in our laboratory [140], with the general conditions for the assay developed previously
Chapter 2 Materials and Methods
38
[54]. In the previous work, the enzymatic activities of , 186 and 186- were
investigated in the presence of Mn2+ (and Mg2+ for 186 only) [54] and the activity of
186 was investigated by treatment with Mn2+, Zn2+ and Dy3+ [140]. In this thesis, the
activities of 186 and 186- in the presence of Mn2+, Zn2+, Dy3+ Mg2+, Cu2+ and Fe2+
were investigated.
The enzymatic activities of the enzymes were measured spectrophotometrically by
monitoring the production of p-nitrophenol, a product from the hydrolysis of pNP-TMP
at 420 nm at 25C using a Cary 500 Scan UV-Vis-NIR spectrophotometer (Varian,
Mulgrave, Australia) in 1 cm pathlength quartz cuvettes [54]. Typical assay mixtures
contained 3 mM pNP-TMP (15 µl of 200 mM stock in 50 mM Tris-HCl, pH 8.0, 150 mM
NaCl), 0.5 mM metal ion (5 µl of 100 mM stock in 50 mM Tris-HCl, pH 8.0, 150 mM
NaCl), with the remaining volume made up with 50 mM Tris-HCl buffer, pH 8.0, 50 mM
NaCl) to a total volume of 1 ml. Reactions were initiated with the addition of 186 or
186- (typically 4 l of 25 M stock, to give a final enzyme concentration of 0.1 M)
and quickly mixed with a bent plastic rod. The increase in A420 was then followed for
several minutes. Slopes of A420 curves versus time were used to determine initial rates
of reaction (v0). The molar absorption coefficient for p-nitrophenol at pH 8.0 (12950 M-
1cm-1 [54]) was used to calculate rates of pNP-TMP hydrolysis. Hanes-Woolf plots were
constructed from which kcat and KM values were calculated [141].
2.2.8 Preparation of Proteins and Sub-Complexes of the Clamp Loader
For accurate mass determination, , and were dialysed against 0.1% formic acid
and mass spectra were acquired as described in Section 2.2.12. For the nanoESI-MS
Chapter 2 Materials and Methods
39
analysis of , and in non-denaturing conditions, each subunit was dialysed
separately as described in Section 2.2.1 and stored on ice. As some precipitation
occurred in the sample it was centrifuged for 2 min at 10000 x g at 4C before
analysis. To prepare samples for mass spectrometric analysis, an aliquot of dialysed
protein was added to the appropriate NH4OAc solution to give 2-4 M protein in a
total volume of 40 l. If a mixture of proteins was to be analysed then an aliquot of
each protein was added and stored at room temperature (22C) for 15 minutes prior
to analysis.
2.2.9 Hydrogen/Deuterium Exchange (HDX) of C16
2.2.9.1 Direct HDX
The and C16 proteins were dialysed separately as described in Section 2.2.1. An
aliquot (625 l) of 5 M NH4OAc was diluted to 15 ml with 99.9% D2O whilst flushing
with nitrogen to prepare a solution containing 0.2 M NH4OAc (~96% D2O). The pH was
adjusted with ammonia solution in D2O giving an uncorrected pH meter reading of 7.2
[142]. A nanoESI mass spectrum was obtained of each protein (Section 2.2.4) before
they were concentrated down to < 50 l using Biomax centrifugal ultrafiltration tubes
(Section 2.2.2). For samples containing both and C16, both proteins were mixed and
concentrated together at a molar ratio of 1:0.75 as judged by UV spectroscopy (Table
2.3). The concentrated proteins in 0.2 M NH4OAc and D2O were equilibrated at room
temperature (22C) or on ice (0C). At time = 0, 280 l 0.2 M NH4OAc in D2O was
added to the concentrated protein sample (typically 30-50 l) and mixed immediately
(giving a ~ 1 M protein solution), then stored in a 1 ml syringe at the same
Chapter 2 Materials and Methods
40
temperature. At various time points, 4 l of the deuterated protein was transferred
into a nanocapillary tube and immediately introduced into the mass spectrometer for
analysis. CID experiments were carried out as described in Section 2.2.13, with the
collision energy typically set at 20 V.
2.2.9.2 Quenched HDX
Firstly and C16 were prepared using dialysis, as described in Section 2.2.1, using
double the volume of protein stock typically used in Table 2.2. Each protein solution
was then concentrated to 30 l in separate Biomax centrifugal ultrafiltration tubes
(Section 2.2.2). At time = 0, an aliquot of protein (< 10 l, to make a final concentration
of ~4 M) was diluted to 100 l with 0.2 M NH4OAc in D2O and equilibrated on ice in a
100 l syringe. In control samples (no exchange with deuterium), this aliquot of
protein was diluted with 0.2 M NH4OAc instead of D2O. Aliquots of quenching solution
(H2O:methanol:formic acid; 90:9:1); typically ~7 l (to make a total of 10 l once the
protein in D2O was added) were pipetted into Eppendorf tubes and allowed to
equilibrate on ice. At various time points, an aliquot of the deuterated protein solution
(typically ~3 l, to give a final concentration of ~1 M) was quenched by addition to
the ice cold Eppendorf tube containing ~7 l quenching solution and nanoESI-MS was
performed immediately.
2.2.10 Preparation of Proteins for IM-MS
Proteins from Pol III were prepared as described in Section 2.2.8 (clamp loader
proteins) and Section 2.2.4 ( and C16). Rubisco stock (100 l of 60 mg/ml in 40 mM
Chapter 2 Materials and Methods
41
Tris-HCl, pH 8, 20 % glycerol) was dialysed against 0.5 M NH4OAc, pH 8.0 and a ~10 M
sample in the same solution was prepared for analysis. Commercially-obtained
proteins (myoglobin, cytochrome c, lysozyme, ovalbumin and transferrin) were
prepared on the day of analysis by weighing out an appropriate mass in order to create
~ 1.5 ml of 100 M protein stock solution in 0.05 M NH4OAc. Protein samples were
then stored on ice. Native commercial protein samples were prepared at a
concentration of 10 M by the addition of 10 l (100 M protein stock) to 90 l 0.05 M
NH4OAc. Similarly, calibration samples contained 10 M concentrations of either
myoglobin or cytochrome c in a 49:49:2 solution of MeOH:H2O:AcOH [143].
2.2.11 Preparation of Gold Coated Capillaries for nanoESI-MS
Borosilicate glass capillaries were pulled to a fine tip using a P-97 Flaming/Brown
micropipette puller from the Sutter Instrument Co, USA. The following settings were
used: P (500), heat (610), velocity (15) and time (50). These capillaries were then
adhered to a Petri dish and sputter-coated with gold using an Emnitech K500X sputter
coater. This process used a vacuum of 1 x 10⁻¹ mbar and a current of 55 mA for 2 min.
2.2.12 Mass Spectrometry Conditions
All mass spectra described in this thesis were acquired in positive mode, using a
Waters ESI Q-TOF UltimaTM (Manchester, UK) mass spectrometer with extended m/z
range in the quadrupole to 32000 [144] or a Waters ESI Synapt HDMSTM (Manchester,
UK) ion mobility mass spectrometer [145]. A schematic of the Q-TOF UltimaTM is shown
in Figure 2.1 and the Synapt HDMSTM is discussed in more detail in Chapter 5.
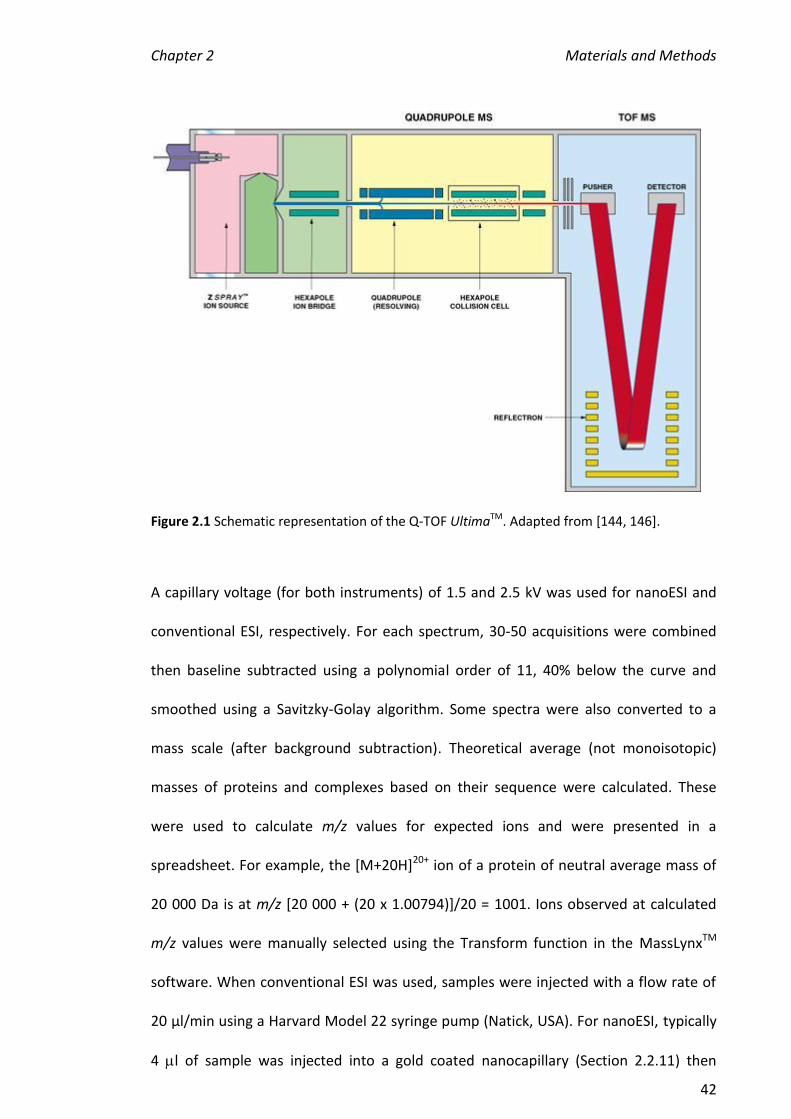
Chapter 2 Materials and Methods
42
Figure 2.1 Schematic representation of the Q-TOF UltimaTM. Adapted from [144, 146].
A capillary voltage (for both instruments) of 1.5 and 2.5 kV was used for nanoESI and
conventional ESI, respectively. For each spectrum, 30-50 acquisitions were combined
then baseline subtracted using a polynomial order of 11, 40% below the curve and
smoothed using a Savitzky-Golay algorithm. Some spectra were also converted to a
mass scale (after background subtraction). Theoretical average (not monoisotopic)
masses of proteins and complexes based on their sequence were calculated. These
were used to calculate m/z values for expected ions and were presented in a
spreadsheet. For example, the [M+20H]20+ ion of a protein of neutral average mass of
20 000 Da is at m/z [20 000 + (20 x 1.00794)]/20 = 1001. Ions observed at calculated
m/z values were manually selected using the Transform function in the MassLynxTM
software. When conventional ESI was used, samples were injected with a flow rate of
20 µl/min using a Harvard Model 22 syringe pump (Natick, USA). For nanoESI, typically
4 l of sample was injected into a gold coated nanocapillary (Section 2.2.11) then
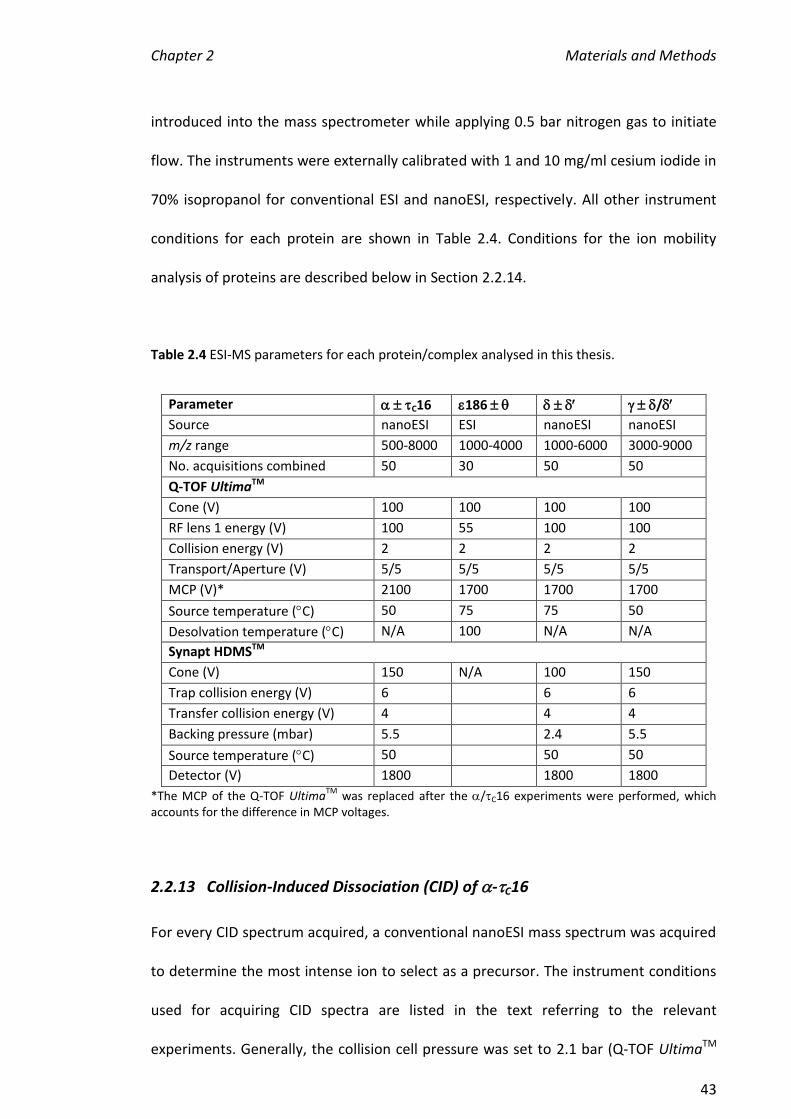
Chapter 2 Materials and Methods
43
introduced into the mass spectrometer while applying 0.5 bar nitrogen gas to initiate
flow. The instruments were externally calibrated with 1 and 10 mg/ml cesium iodide in
70% isopropanol for conventional ESI and nanoESI, respectively. All other instrument
conditions for each protein are shown in Table 2.4. Conditions for the ion mobility
analysis of proteins are described below in Section 2.2.14.
Table 2.4 ESI-MS parameters for each protein/complex analysed in this thesis.
Parameter C16 186 /
Source nanoESI ESI nanoESI nanoESI
m/z range 500-8000 1000-4000 1000-6000 3000-9000
No. acquisitions combined 50 30 50 50
Q-TOF UltimaTM
Cone (V) 100 100 100 100
RF lens 1 energy (V) 100 55 100 100
Collision energy (V) 2 2 2 2
Transport/Aperture (V) 5/5 5/5 5/5 5/5
MCP (V)* 2100 1700 1700 1700
Source temperature (C) 50 75 75 50
Desolvation temperature (C) N/A 100 N/A N/A
Synapt HDMSTM
Cone (V) 150 N/A 100 150
Trap collision energy (V) 6 6 6
Transfer collision energy (V) 4 4 4
Backing pressure (mbar) 5.5 2.4 5.5
Source temperature (C) 50 50 50
Detector (V) 1800 1800 1800
*The MCP of the Q-TOF UltimaTM
was replaced after the /C16 experiments were performed, which accounts for the difference in MCP voltages.
2.2.13 Collision-Induced Dissociation (CID) of -C16
For every CID spectrum acquired, a conventional nanoESI mass spectrum was acquired
to determine the most intense ion to select as a precursor. The instrument conditions
used for acquiring CID spectra are listed in the text referring to the relevant
experiments. Generally, the collision cell pressure was set to 2.1 bar (Q-TOF UltimaTM
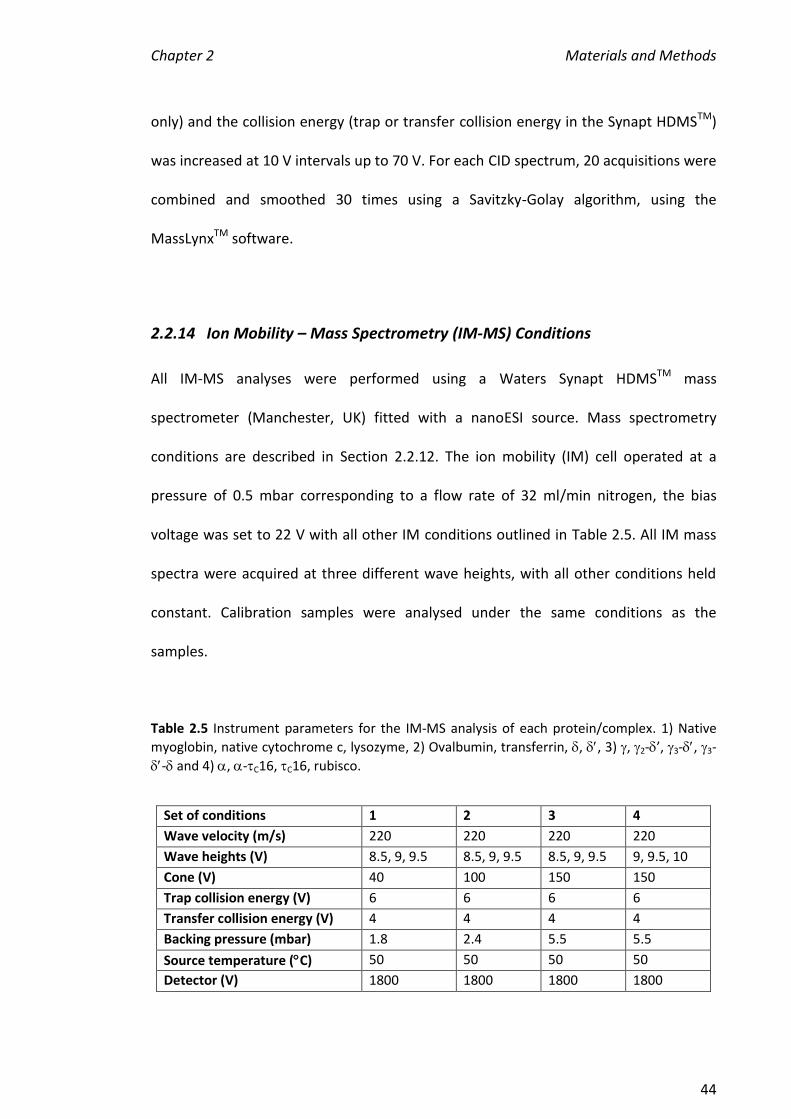
Chapter 2 Materials and Methods
44
only) and the collision energy (trap or transfer collision energy in the Synapt HDMSTM)
was increased at 10 V intervals up to 70 V. For each CID spectrum, 20 acquisitions were
combined and smoothed 30 times using a Savitzky-Golay algorithm, using the
MassLynxTM software.
2.2.14 Ion Mobility – Mass Spectrometry (IM-MS) Conditions
All IM-MS analyses were performed using a Waters Synapt HDMSTM mass
spectrometer (Manchester, UK) fitted with a nanoESI source. Mass spectrometry
conditions are described in Section 2.2.12. The ion mobility (IM) cell operated at a
pressure of 0.5 mbar corresponding to a flow rate of 32 ml/min nitrogen, the bias
voltage was set to 22 V with all other IM conditions outlined in Table 2.5. All IM mass
spectra were acquired at three different wave heights, with all other conditions held
constant. Calibration samples were analysed under the same conditions as the
samples.
Table 2.5 Instrument parameters for the IM-MS analysis of each protein/complex. 1) Native
myoglobin, native cytochrome c, lysozyme, 2) Ovalbumin, transferrin, , , 3) , 2-’, 3-, 3-
- and 4) , -C16, C16, rubisco.
Set of conditions 1 2 3 4
Wave velocity (m/s) 220 220 220 220
Wave heights (V) 8.5, 9, 9.5 8.5, 9, 9.5 8.5, 9, 9.5 9, 9.5, 10
Cone (V) 40 100 150 150
Trap collision energy (V) 6 6 6 6
Transfer collision energy (V) 4 4 4 4
Backing pressure (mbar) 1.8 2.4 5.5 5.5
Source temperature (C) 50 50 50 50
Detector (V) 1800 1800 1800 1800
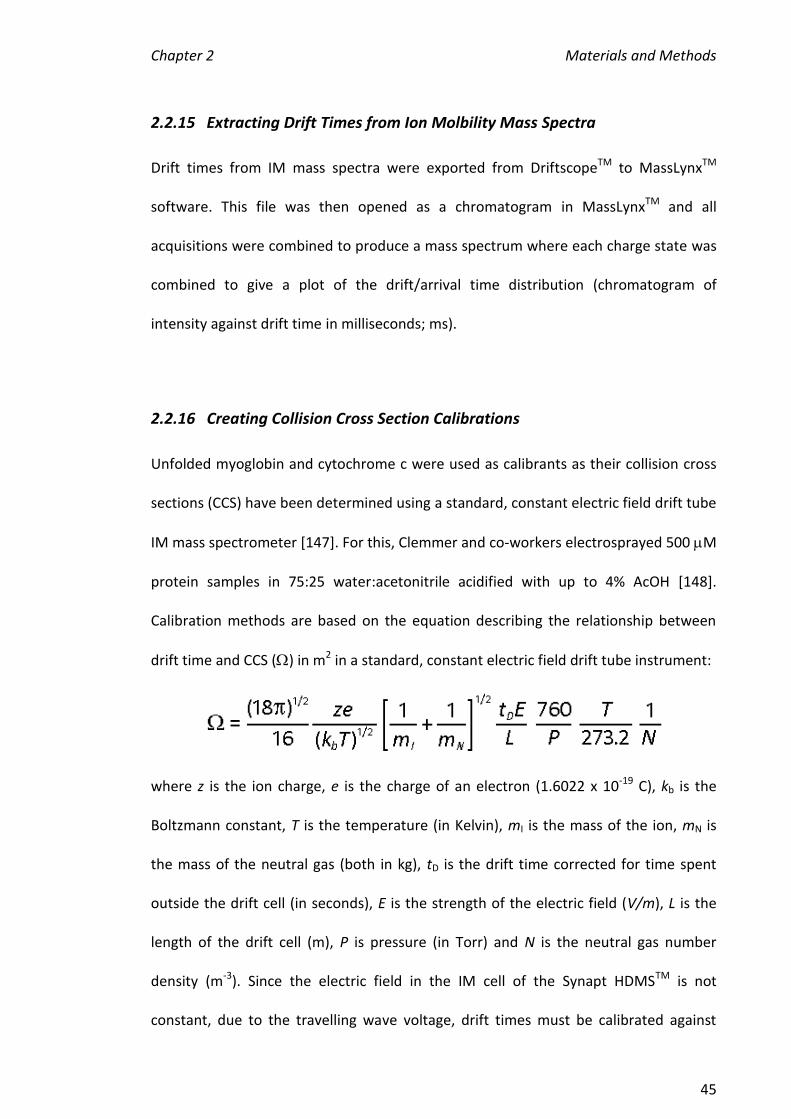
Chapter 2 Materials and Methods
45
2.2.15 Extracting Drift Times from Ion Molbility Mass Spectra
Drift times from IM mass spectra were exported from DriftscopeTM to MassLynxTM
software. This file was then opened as a chromatogram in MassLynxTM and all
acquisitions were combined to produce a mass spectrum where each charge state was
combined to give a plot of the drift/arrival time distribution (chromatogram of
intensity against drift time in milliseconds; ms).
2.2.16 Creating Collision Cross Section Calibrations
Unfolded myoglobin and cytochrome c were used as calibrants as their collision cross
sections (CCS) have been determined using a standard, constant electric field drift tube
IM mass spectrometer [147]. For this, Clemmer and co-workers electrosprayed 500 M
protein samples in 75:25 water:acetonitrile acidified with up to 4% AcOH [148].
Calibration methods are based on the equation describing the relationship between
drift time and CCS () in m2 in a standard, constant electric field drift tube instrument:
where z is the ion charge, e is the charge of an electron (1.6022 x 10⁻¹⁹ C), kb is the
Boltzmann constant, T is the temperature (in Kelvin), mI is the mass of the ion, mN is
the mass of the neutral gas (both in kg), tD is the drift time corrected for time spent
outside the drift cell (in seconds), E is the strength of the electric field (V/m), L is the
length of the drift cell (m), P is pressure (in Torr) and N is the neutral gas number
density (m-3). Since the electric field in the IM cell of the Synapt HDMSTM is not
constant, due to the travelling wave voltage, drift times must be calibrated against
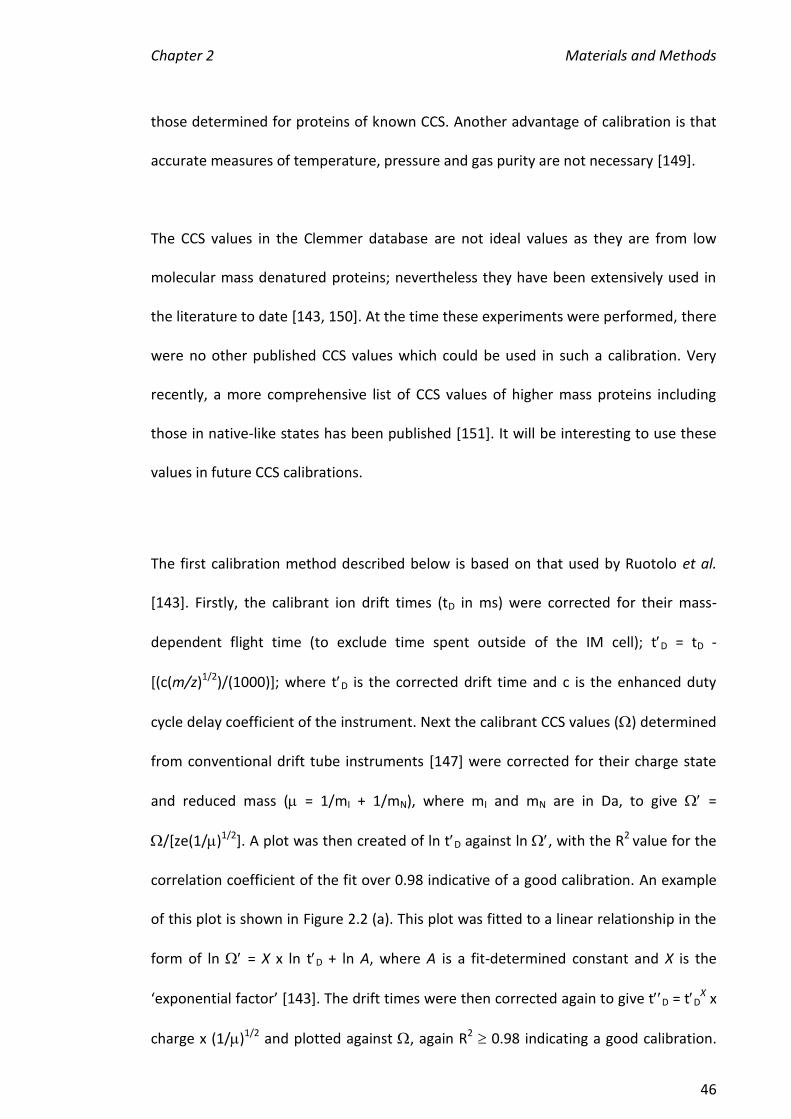
Chapter 2 Materials and Methods
46
those determined for proteins of known CCS. Another advantage of calibration is that
accurate measures of temperature, pressure and gas purity are not necessary [149].
The CCS values in the Clemmer database are not ideal values as they are from low
molecular mass denatured proteins; nevertheless they have been extensively used in
the literature to date [143, 150]. At the time these experiments were performed, there
were no other published CCS values which could be used in such a calibration. Very
recently, a more comprehensive list of CCS values of higher mass proteins including
those in native-like states has been published [151]. It will be interesting to use these
values in future CCS calibrations.
The first calibration method described below is based on that used by Ruotolo et al.
[143]. Firstly, the calibrant ion drift times (tD in ms) were corrected for their mass-
dependent flight time (to exclude time spent outside of the IM cell); tD = tD -
[(c(m/z)1/2)/(1000)]; where tD is the corrected drift time and c is the enhanced duty
cycle delay coefficient of the instrument. Next the calibrant CCS values () determined
from conventional drift tube instruments [147] were corrected for their charge state
and reduced mass ( = 1/mI + 1/mN), where mI and mN are in Da, to give =
/[ze(1/)1/2]. A plot was then created of ln tD against ln , with the R2 value for the
correlation coefficient of the fit over 0.98 indicative of a good calibration. An example
of this plot is shown in Figure 2.2 (a). This plot was fitted to a linear relationship in the
form of ln = X x ln tD + ln A, where A is a fit-determined constant and X is the
‘exponential factor’ [143]. The drift times were then corrected again to give tD = tDX x
charge x (1/)1/2 and plotted against , again R2 0.98 indicating a good calibration.
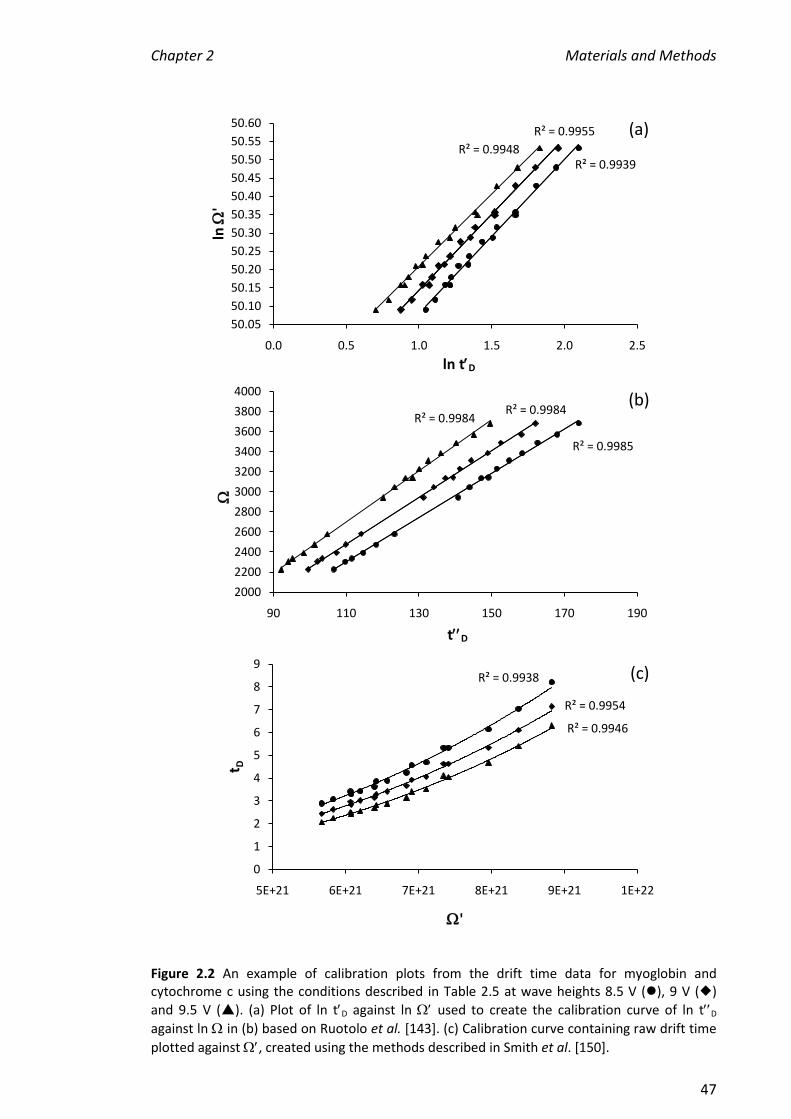
Chapter 2 Materials and Methods
47
Figure 2.2 An example of calibration plots from the drift time data for myoglobin and cytochrome c using the conditions described in Table 2.5 at wave heights 8.5 V (), 9 V ()
and 9.5 V (). (a) Plot of ln tD against ln used to create the calibration curve of ln tD
against ln in (b) based on Ruotolo et al. [143]. (c) Calibration curve containing raw drift time
plotted against , created using the methods described in Smith et al. [150].
R² = 0.9955
R² = 0.9939R² = 0.9948
50.05
50.10
50.15
50.20
50.25
50.30
50.35
50.40
50.45
50.50
50.55
50.60
0.0 0.5 1.0 1.5 2.0 2.5
ln
'
R² = 0.9984
R² = 0.9985
R² = 0.9984
2000
2200
2400
2600
2800
3000
3200
3400
3600
3800
4000
90 110 130 150 170 190
R² = 0.9954
R² = 0.9938
R² = 0.9946
0
1
2
3
4
5
6
7
8
9
5E+21 6E+21 7E+21 8E+21 9E+21 1E+22
t D
'
(a)
(b)
(c)
ln tD
tD

Chapter 2 Materials and Methods
48
The calibration curve, such as that shown in Figure 2.2 (b), was used to determine the
CCS values from the drift times of the ‘unknown’ proteins. In the second calibration,
based on that described in Smith et al. [150], only one calibration curve was
constructed, containing the raw drift times of the calibrant ions plotted against (as
above), fitted to the y = AxB relationship. An example is shown in Figure 2.2 (c), using
the same drift time data as the calibration described above. A separate calibration
curve was prepared for each wave height and each set of instrument conditions and
was only used to calculate CCS if R2 0.98. The final CCS (in Å2) determined for each
protein/complex was calculated by averaging values from at least two replicates of
three wave heights (Table 2.5).
2.2.17 Structure Visualisation
Visualisation of structures was performed using Protein Workshop software [152].
Protein structures were downloaded from the Research Collaboratory for Structural
Bioinformatics Protein Data Bank (PDB) [153]. Unless otherwise stated, the structures
are coloured so that the N-terminus is blue and the C-terminus is red.

Chapter 3 The - Interaction
49
Chapter 3 The Alpha-Tau Interaction
3.1 Introduction
Protein-protein interactions are important throughout replication, and this chapter
focuses on the interaction between the and subunits of Pol III. Within the core, is
the polymerase subunit, catalysing the addition of nucleotides to newly formed DNA,
and connects the exonuclease ( subunit; discussed further in Chapter 4) to Pol III,
ensuring polymerisation errors are corrected. The subunits, in addition to being the
‘motor’ subunits of the clamp loader, link two polymerase cores, allowing the
coordination of leading and lagging strand synthesis [154].
The subunit consists of many domains including a PHP (polymerase and histidinol
phosphatase) N-terminal domain [155], an internal -binding domain [156] and a C-
terminal domain which contains an oligonucleotide-binding fold [157], and
competitively binds to and 2 (the sliding clamp) at the extreme C-terminus [158].
Recently, the partial structure of (residues 1-917 of 1160) has been determined
(Figure 3.1) [36]. This structure, however, does not include the C-terminus where the
binding region lies. The location of the binding site at the C-terminal end of is
supported by a study published by Kim and McHenry, who used SPR to probe the
binding of to a range of mutants that had been immobilised on a sensor chip [159].
They found that if up to 542 residues were deleted from the N- terminus, maintained
a tight interaction with , but that binding was prevented when 48 residues were
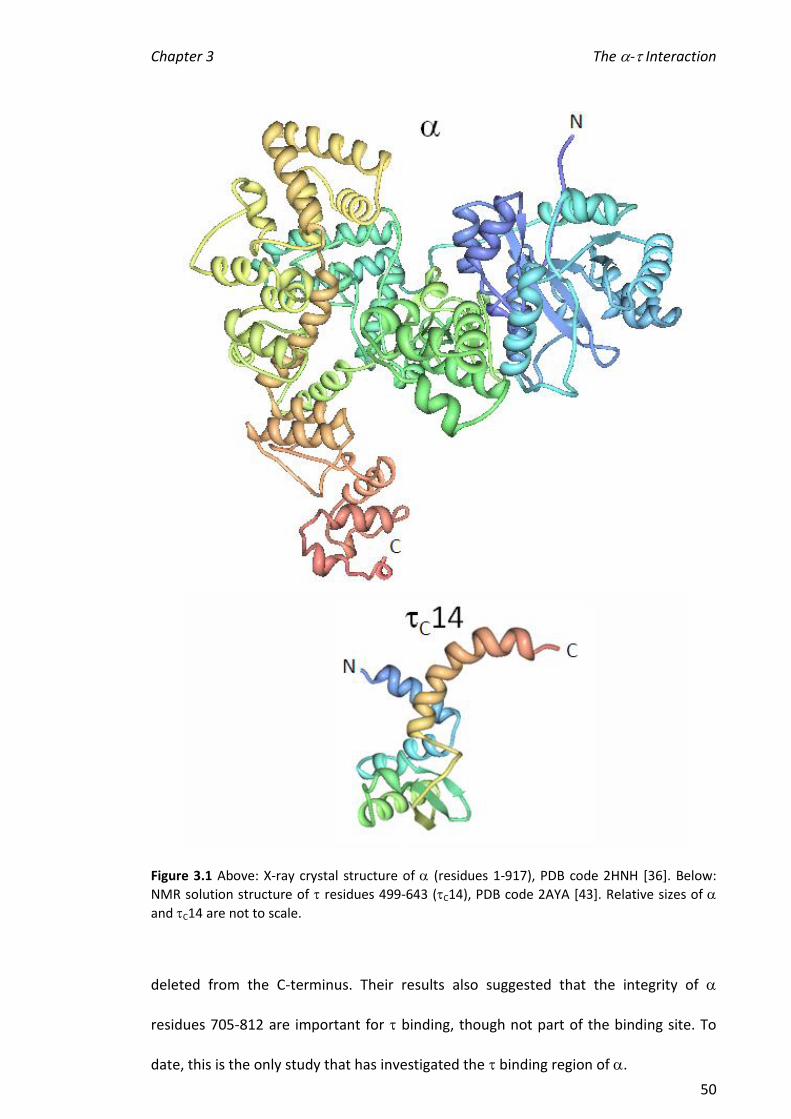
Chapter 3 The - Interaction
50
Figure 3.1 Above: X-ray crystal structure of (residues 1-917), PDB code 2HNH [36]. Below:
NMR solution structure of residues 499-643 (C14), PDB code 2AYA [43]. Relative sizes of
and C14 are not to scale.
deleted from the C-terminus. Their results also suggested that the integrity of
residues 705-812 are important for binding, though not part of the binding site. To
date, this is the only study that has investigated the binding region of .
Chapter 3 The - Interaction
51
The subunit (643 residues) contains five domains. The N-terminal domains I-III
constitute the subunit which was described in Section 1.1.3 [160]. The regions unique
to are Domain IV (residues 413-496) which binds to the DnaB helicase and Domain V
(residues 497-643) which binds to (Figure 3.2) [64, 160]. Domain V (residues 499-
643) has been overproduced by recombinant techniques in our laboratory and is
referred to here as C16 as it contains the ~16 kDa C-terminus of [137]. The NMR
solution structure has been recently solved for C16 (Figure 3.1), however, the
structure of the final 18 C-terminal residues (625-643) of C16 were not able to be
determined suggesting they are intrinsically unstructured [43]. Interestingly, C16, and
not C14 (structured C16 residues 499-625), is able to bind to , as shown in previous
work in our laboratory [137]. This study also suggested that the usually flexible region
of (the C-terminal residues lacking in C14) becomes structured upon binding to .
This work included an SPR study of the interactions of a series of C16 mutants with .
The single-point mutants were L627P, L635P, S617P, I618T, F631I and D636G (Figure
3.2) [137]. Truncations of C16 were also prepared: C167, C1611 and C1618
(C14), in which the C-terminal 7, 11 and 18 residues were deleted, respectively. These
mutants and truncations of C16 were also used in the current work to compare
binding affinities measured by nanoESI-MS with those measured by SPR.
In this chapter, relative affinities of all the variants of C16 binding to were
investigated by titrations analysed by nanoESI-MS. In addition, hydrogen/deuterium
exchange was employed in order to observe levels of solvent protection in native and
complexed subunits.
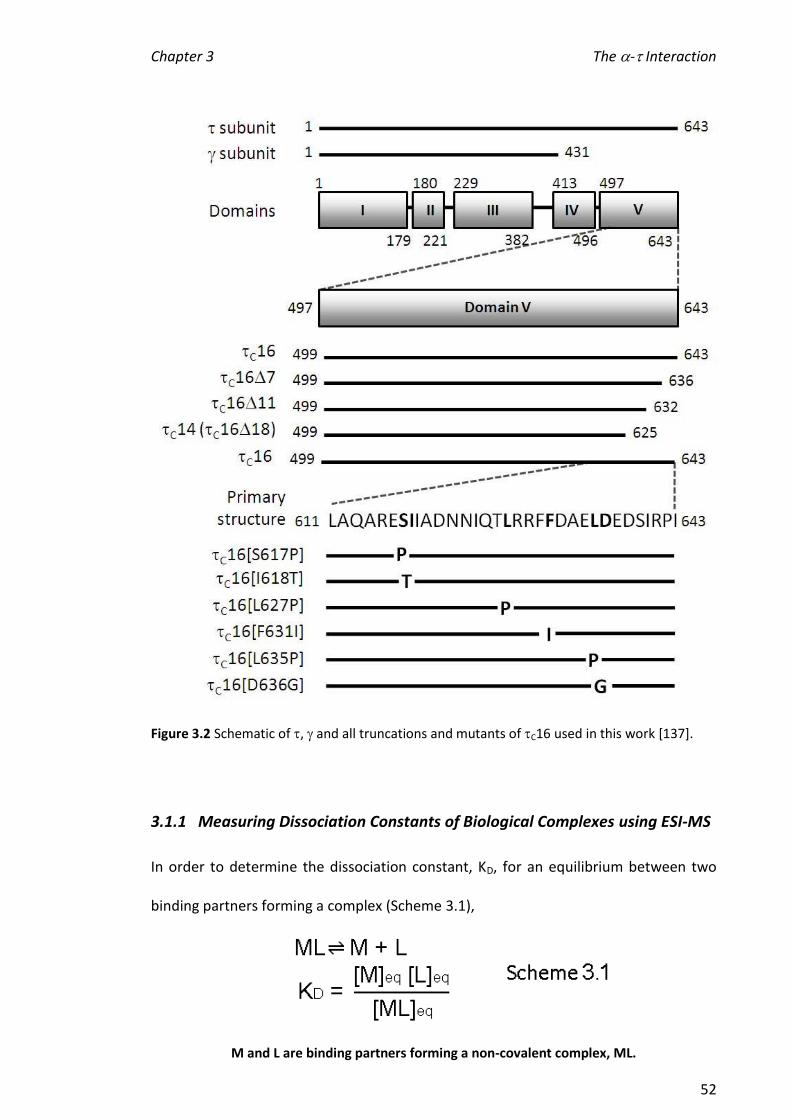
Chapter 3 The - Interaction
52
Figure 3.2 Schematic of , and all truncations and mutants of C16 used in this work [137].
3.1.1 Measuring Dissociation Constants of Biological Complexes using ESI-MS
In order to determine the dissociation constant, KD, for an equilibrium between two
binding partners forming a complex (Scheme 3.1),
M and L are binding partners forming a non-covalent complex, ML.
Chapter 3 The - Interaction
53
the equilibrium concentrations of at least one of the binding partners and the complex
must be measured or surmised.
ESI-MS is increasingly applied to the analysis of non-covalent complexes. From early
work that showed that the non-covalent complex of folded myoglobin bound to heme
could be detected by ESI-MS [113], the applications have increased to include analysis
of metalloproteins, ligand-DNA, protein-DNA, ligand-protein and protein-protein
complexes [118, 161-163]. In contrast to many solution methods, the stoichiometry of
a complex is readily determined using MS. Therefore values of KD calculated from ESI-
MS can be determined for a specific complex while solution-based methods are often
the average of multiple dissociation constants [164]. Other advantages of ESI-MS
include its sensitivity and that it is amenable to high-throughput analysis that has
application in screening the binding of drug leads to drug targets (e.g. protein or DNA)
[165].
There has been much discussion about whether distributions of non-covalent
complexes and free binding partners detected in the gas phase are representative of
the distributions present in solution. Linked with these discussions are those about the
possibility of non-specific complexes forming in the electrospray source and the
maintenance of solution conformations and oligomeric associations of
biomacromolecules (proteins and nucleic acids) in vacuo. These issues have been
raised as ESI mass spectra of biomolecules and their non-covalent interactions require
solution conditions which balance the requirements of the electrospray process
Chapter 3 The - Interaction
54
(evaporation of solvent, charging of the biomolecule) with the preservation of native
structure [114].
ESI can potentially perturb equilibria as a result of: pH changes, collision-induced or
thermal dissociation, an increase in the concentrations of free binding partners during
evaporation in the source, enhancement of electrostatic over hydrophobic interactions
in the gas phase, and differences in the amount of charge on complexes in solution
compared to the gas phase. These issues have been discussed previously (e.g. [161,
166-168], and contribute to the ‘response factor’ for a particular non-covalent complex
compared to the free binding partners. This includes the relative ionisation efficiencies
of each species in the solution. The complications mentioned above have meant that
determination of binding constants by ESI-MS is still not widely accepted [161]. In early
work, there were several demonstrations that specific non-covalent complexes could
be detected by ESI-MS. In a study investigating protein-peptide interactions, Loo et al.
found that ESI-MS of a sample containing the Src SH2 protein with a mixture of
phosphopeptides primarily detected one particular protein-phosphopeptide complex,
correlating with what was found in solution studies [169]. Cheng and co-workers
investigated the interaction between the Gene V dimer (single-stranded binding
protein from bacteriophage f1) and DNA by ESI-MS [170]. They found that one Gene V
dimer bound to d(pT)13 and two Gene V dimers bound to d(pT)18, consistent with
solution binding stoichiometry where one dimer binds for every ~8 bases. These and
later studies, e.g. [171], have contributed to some general rules for minimising non-
specific interactions as a result of clustering effects during electrospray ionisation
including the use of relatively low concentrations of analyte (M range).
Chapter 3 The - Interaction
55
As a result, more recent studies have been able to focus on more than just
stoichiometries, including the determination of binding constants using ESI-MS. For
example, Gao and co-workers found a correlation between binding constants for the
interaction of a series of peptides with carbonic anhydrase II determined using a
solution-based fluorescence binding assay and those calculated by gas-phase MS
methods [172]. Recently, Mather and co-workers [161] compared two solution
methods (SPR and circular dichroism) with two gas-phase methods (ESI-MS titration
and MALDI) for the determination of binding affinities of the protein-ligand complex
CaM-melittin. All four methods enabled measurement of a dissociation constant (KD)
within reasonable agreement of the literature value, with ESI-MS titration the method
of choice for several reasons. Analysis (and sample preparation) using ESI-MS is rapid,
relatively easy to perform and consumes modest amounts of sample. The other three
methods were more laborious in the preparation and analysis and consumed greater
quantities of sample. One consideration when using this method is that the KD can’t be
measured if either the bound or free species are below the detection limits of the mass
spectrometer. Additionally, the sensitivity of the mass spectrometer is important as it
is difficult to obtain mass spectra of protein complexes below a concentration of 1 M
[118].
The biological relevance of non-covalent complexes involving proteins detected by ESI-
MS can be addressed by comparing the relative binding affinities of wild-type and
mutant proteins. Previously, the relative order of binding affinities of a specific DNA
sequence (Ter) for a DNA-binding protein, Tus, and mutant proteins where there was a
single amino acid substitution were shown to be in agreement with the relative order
of binding affinities determined in SPR experiments [118]. In these experiments, the
Chapter 3 The - Interaction
56
response factors of the free Tus protein and the Tus-Ter complex were compared. This
was possible because the A173T Tus mutant (replacement of an uncharged alanine
with uncharged threonine) has a much lower binding affinity for Ter than wild-type Tus
as judged by ESI-MS and other techniques. It was possible to apply a range of
conditions under which A173T Tus and wild-type Tus were present with Ter in the
same solution and ESI mass spectra only showed the wild-type Tus-Ter complex and
free A173T Tus. The relative concentrations of the Tus-Ter complex and A173T Tus
were changed keeping the total concentration of protein constant and determining the
relative intensities of ions of the free A173T Tus and the complex (in effect, using
A173T Tus as an internal standard). The response factors of A173T Tus and Tus-Ter
were the same within experimental error enabling estimation of dissociation constants
for the protein-DNA complexes.
An example of a study where there was a difference in response factors was published
by Gabelica and co-workers [168]. They investigated a drug-DNA complex and
cyclodextrin complexes with α,ω-alkanecarboxylic acids and found that the relative
intensities of the latter complex did not reflect concentrations in solution. In order to
overcome this they established a MS method of determining a response factor for a
1:1 complex in which the concentration of each reactant was calculated precisely to
ensure minimal error.
3.1.2 Hydrogen/Deuterium Exchange (HDX)
HDX is a powerful tool for investigating protein dynamics, conformation and
interactions. In this process, an aqueous solution of a protein (or complex) is
Chapter 3 The - Interaction
57
introduced into a buffered deuterium oxide (D2O) solution. The deuterium atoms then
exchange with labile hydrogen atoms within the protein(s) and can be analysed
according to the increase in mass of the protein since deuterium atoms are twice as
heavy as hydrogen atoms [173]. There are three types of hydrogen atoms within a
protein in regards to their ability to undergo HDX. The hydrogen atoms covalently
bound to carbon do not exchange. Those on the side chains exchange very rapidly. The
hydrogen atoms of the amide nitrogens (NH) on the protein backbone also exchange,
but this exchange can be substantially slowed at low pH (~2). The HDX rate also
depends on the extent of folding within a protein as hydrogen atoms within the
hydrophobic core and those participating in hydrogen bonding or salt bridges are
inaccessible to the solvent and therefore less labile to exchange [174].
Traditionally, the HDX of proteins was analysed by NMR spectroscopy [175, 176];
however, the advent of ESI in the late 1980s meant that it was possible to analyse
deuterated proteins using MS, with methods being improved ever since. While MS and
NMR HDX are complementary techniques there are several advantages to using MS for
some applications. Firstly, NMR HDX requires a relatively large protein concentration
(in the millimolar range) which can in some cases be difficult to obtain and cause some
proteins to aggregate. Additionally, it is quite difficult to interpret NMR data on large
proteins < 50 kDa, though progress is being made [177, 178]. Ionisation differences are
not important in analysis of HDX by MS as MS is used simply as a tool to detect the
mass (in the form of m/z) which can be achieved with high accuracy [179].
The first reported use of HDX monitored by MS was by Katta and Chait in 1991 [174].
They performed HDX on a simple peptide (bradykinin) and the small, tightly-folded
Chapter 3 The - Interaction
58
protein, bovine ubiquitin. MS was successfully used to observe the masses of the
deuterated species with levels of deuteration corresponding to the structural
characteristics of the proteins determined by other methods. Over the years, larger,
more complicated proteins have been studied using HDX-MS. For example, the multi-
protein complexes of GroEL (800 kDa), a molecular chaperone and the hormone insulin
have been investigated using HDX-MS [180, 181].
HDX of the binding of the molecular chaperone GroEL to bovine -lactalbumin was
carried out by Robinson et al. [180]. In this case, deuterated -lactalbumin and non-
deuterated GroEL were added together to form a complex in D2O then diluted into
H2O, with the increase in mass (relative to non-deuterated protein) corresponding to
the number of deuterons protected within the complex. ESI-MS revealed that native -
lactalbumin was more protected from the solvent compared to when bound to GroEL.
It was also found that there was substantial solvent protection of GroEL subunits,
indicating large areas for subunit interfaces. This is not surprising considering GroEL is
made up of two stacked tetradecamers. In an HDX study of insulin, Chitta et al. found
that human, porcine and bovine insulins self-associate into hexamers to similar extents
while Lispro [182], an FDA approved analog of insulin, has a lower propensity to self-
associate [181]. This is important to the mechanism of this fast-acting recombinant
insulin as only the monomeric form of insulin binds to cell receptors. Several insulin
mutants were also studied using these methods and showed a range of different
oligomerisation equilibrium constants. An excellent review by Suchanova and Tuma
contains further details of the applications of HDX on the folding and assembly of large
protein complexes [183].
Chapter 3 The - Interaction
59
3.2 Scope of this Chapter
In this chapter, the interaction between and C16 was investigated using a range of
mass spectrometric methods. More specifically, C16 and C16 mutants/truncations
(Figure 3.2) were titrated into and analysed by nanoESI-MS to obtain relative binding
affinities to gain a further understanding of the residues involved in binding. These
relative binding affinities were compared to the SPR results previously determined in
the laboratory of our collaborators [137]. Using nanoESI-MS, it was not possible to
determine values of KD by comparing the relative amounts of free and -C16
complex as judged by the nanoESI mass spectra. The results led to the hypothesis that
the response factor for the complex was significantly greater than for alone. It was
proposed that this may be a result of a substantial conformational change of when it
binds C16. This proposal was investigated by carrying out HDX experiments on , C16
and -C16 and comparing the number of exchanged protons. The collision cross
sections (CCS) of and -C16 were determined to test whether the proposed
conformational change in -C16 caused this complex to deviate significantly from a
plot of CCS against molecular mass.
3.3 Results and Discussion
3.3.1 NanoESI-MS of C16
The C16 subunit was dialysed against 0.1% formic acid and analysed using nanoESI-MS
to determine its molecular mass (Figure 3.3 (a)). The mass determined here was
16525.2 2 Da, in agreement with the calculated mass (Mr = 16523.7 Da). There was a
bimodal distribution of ions, with the more folded species centred around the
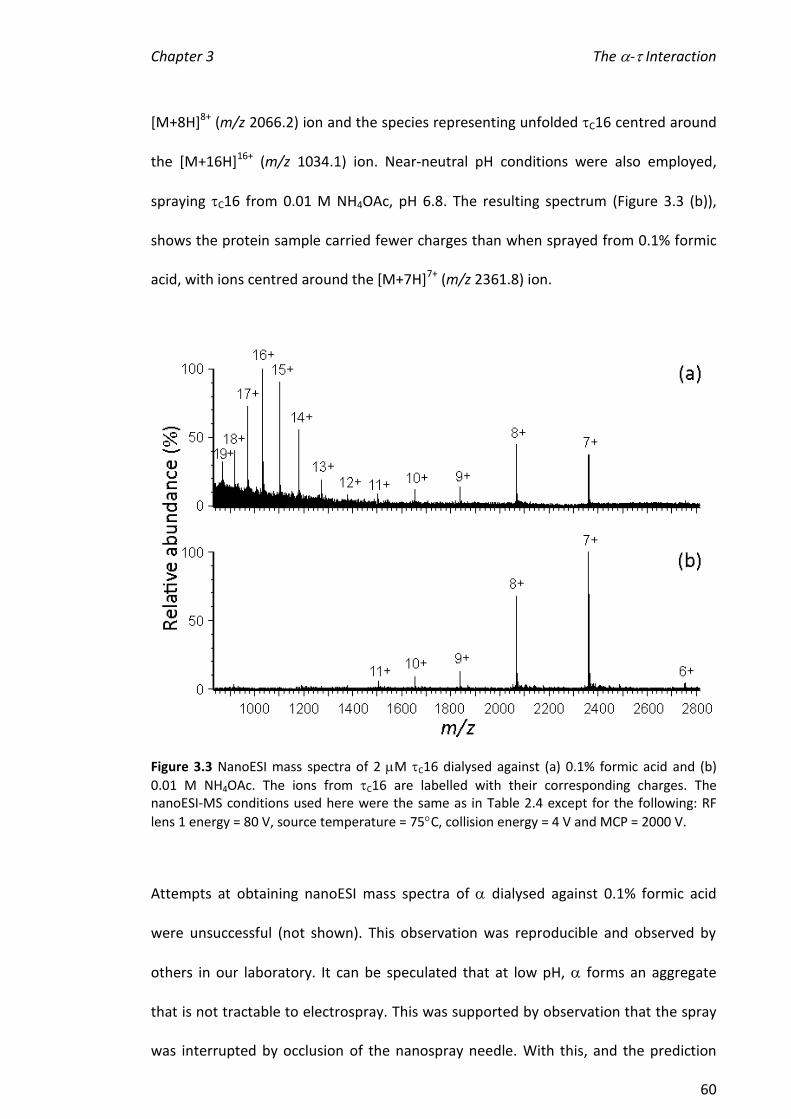
Chapter 3 The - Interaction
60
[M+8H]8+ (m/z 2066.2) ion and the species representing unfolded C16 centred around
the [M+16H]16+ (m/z 1034.1) ion. Near-neutral pH conditions were also employed,
spraying C16 from 0.01 M NH4OAc, pH 6.8. The resulting spectrum (Figure 3.3 (b)),
shows the protein sample carried fewer charges than when sprayed from 0.1% formic
acid, with ions centred around the [M+7H]7+ (m/z 2361.8) ion.
Figure 3.3 NanoESI mass spectra of 2 M C16 dialysed against (a) 0.1% formic acid and (b)
0.01 M NH4OAc. The ions from C16 are labelled with their corresponding charges. The nanoESI-MS conditions used here were the same as in Table 2.4 except for the following: RF
lens 1 energy = 80 V, source temperature = 75C, collision energy = 4 V and MCP = 2000 V.
Attempts at obtaining nanoESI mass spectra of dialysed against 0.1% formic acid
were unsuccessful (not shown). This observation was reproducible and observed by
others in our laboratory. It can be speculated that at low pH, forms an aggregate
that is not tractable to electrospray. This was supported by observation that the spray
was interrupted by occlusion of the nanospray needle. With this, and the prediction

Chapter 3 The - Interaction
61
that the large subunit (~130 kDa) would have a lower response factor than the much
smaller C16 subunit (~16 kDa), nanoESI-MS conditions for were optimised in parallel
with those for -C16, described below.
3.3.2 Conditions for nanoESI-MS of -C16
This work continued from the first mass spectrum obtained of the -C16 complex (1:1
in 0.01 M NH4OAc, pH 7.2) using conventional ESI-MS in our laboratory (Figure 3.4 (a),
acquired by M. Blayney). This spectrum contains one series of ions at the m/z values of
1504.4, 1654.1, 1839.8, 2067.0 and 2362.1 which correspond to the [M+11H]11+ to
[M+7H]7+ charge states of C16, respectively, and another series of ions at m/z values
of 5047.9, 5228.3, 5421.1, 5630.3 and 5854.7, which correspond to the [M+29H]29+ to
[M+25H]25+ charge states of the -C16 complex, respectively (calculated values, m/z
5051.4, 5230.9, 5425.1, 5633.4 and 5859.2). The ions from free C16 are at least ten-
fold more abundant than the ions from the -C16 complex, despite the proteins being
present in solution in equimolar amounts. Additionally, many adducts were associated
with each -C16 ion (appearing as broad peaks in the spectra here but seen as
separate resolved peaks when a smaller m/z range is viewed; not shown). These are
most likely due to adventitious Na+ or K+ ions and possible incomplete desolvation of
the -C16 ions under the experimental conditions. Similar observations have been
made by other researchers in the field [127]. Adducts with anions such as chloride
have not been described in protein mass spectra. As a consequence, efforts were
directed towards obtaining higher quality spectra of -C16 by changing instrument
and solution conditions.
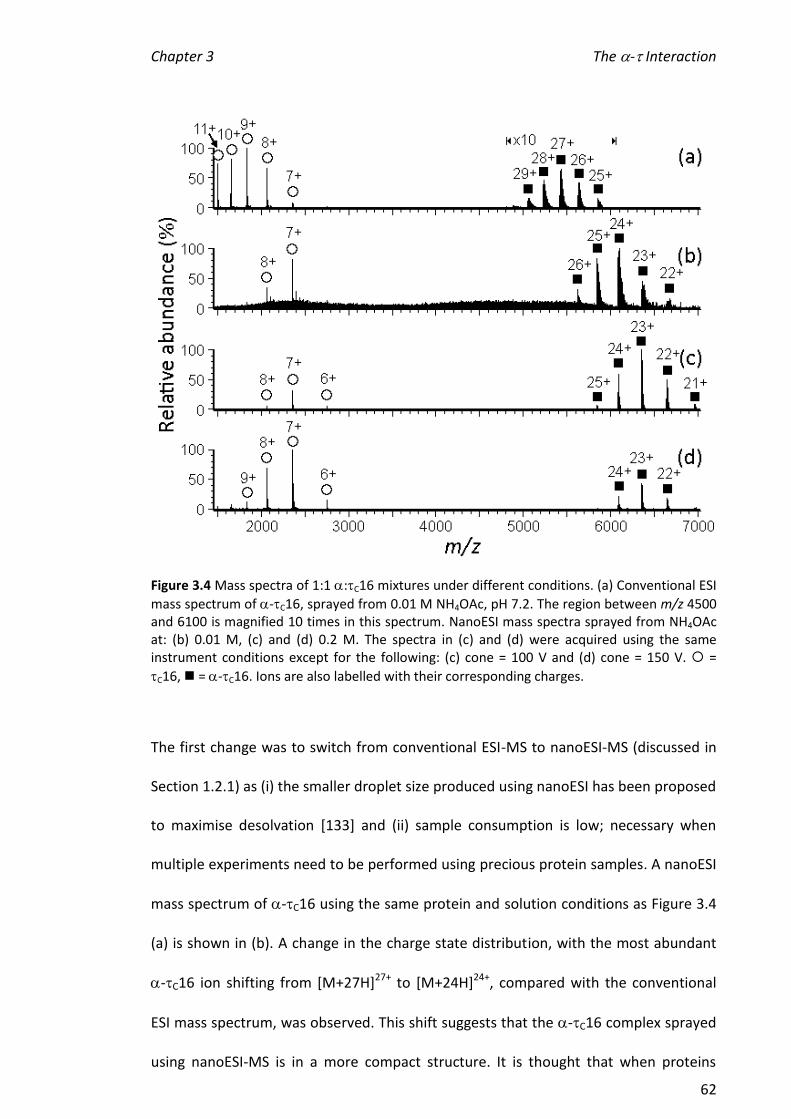
Chapter 3 The - Interaction
62
Figure 3.4 Mass spectra of 1:1 :C16 mixtures under different conditions. (a) Conventional ESI
mass spectrum of -C16, sprayed from 0.01 M NH4OAc, pH 7.2. The region between m/z 4500 and 6100 is magnified 10 times in this spectrum. NanoESI mass spectra sprayed from NH4OAc at: (b) 0.01 M, (c) and (d) 0.2 M. The spectra in (c) and (d) were acquired using the same instrument conditions except for the following: (c) cone = 100 V and (d) cone = 150 V. =
C16, = -C16. Ions are also labelled with their corresponding charges.
The first change was to switch from conventional ESI-MS to nanoESI-MS (discussed in
Section 1.2.1) as (i) the smaller droplet size produced using nanoESI has been proposed
to maximise desolvation [133] and (ii) sample consumption is low; necessary when
multiple experiments need to be performed using precious protein samples. A nanoESI
mass spectrum of -C16 using the same protein and solution conditions as Figure 3.4
(a) is shown in (b). A change in the charge state distribution, with the most abundant
-C16 ion shifting from [M+27H]27+ to [M+24H]24+, compared with the conventional
ESI mass spectrum, was observed. This shift suggests that the -C16 complex sprayed
using nanoESI-MS is in a more compact structure. It is thought that when proteins

Chapter 3 The - Interaction
63
unfold, a greater number of ionisable residues are exposed to the surface of
electrospray droplets, increasing the charge that the ionised molecule can ‘collect’,
hence shifting the charge distribution to lower m/z in the mass spectrum [184-186].
The shift to higher m/z (lower number of charges) suggests that the protein was more
folded under these conditions, consistent with the abundance of ions from free C16.
In the nanoESI mass spectrum here, the most abundant ion from C16 was [M+7H]7+;
whereas in the ESI mass spectrum, [M+9H]9+ was the most abundant C16 ion (Figure
3.4 (a)). Lower charges are desirable because in these experiments, the aim was to
investigate the interactions of and C16 under conditions where the proteins were in
their native, folded conformation.
Jecklin et al. have recently published a study which compares conventional ESI- and
nanoESI-MS by investigating non-covalent complexes of chicken egg white lysozyme
and three different ligands [187]. They found that dissociation constants calculated
from ESI mass spectra were higher (complexes bound less tightly) than those
calculated from nanoESI mass spectra. This was attributed to the higher source
temperature required (90C for ESI compared to 50C for nanoESI) for the observation
of non-covalent complexes of lysozyme-ligand complexes in the mass spectra [187].
Note the source temperature used for the acquisition of -C16 using nanoESI-MS was
50C. While the use of nanoESI-MS represented an improvement in the quality of the
spectra, peak widths of ions from the -C16 complex were still broad. Therefore,
different solvent conditions were tested.
The quality of -C16 spectra improved greatly when it was sprayed from 0.2 M
NH4OAc, pH 7.2, as shown in Figure 3.4 (c), where the [M+25H]25+ to [M+21H]21+ ions

Chapter 3 The - Interaction
64
of -C16 were observed in high abundance with few adducts, and the [M+8H]8+ to
[M+6H]6+ ions of C16 were observed in low abundance. Hernandez and co-workers
also observed an improvement in the quality of mass spectra of alcohol
dehydrogenase when the NH4OAc concentration was increased [188]. Instrument
conditions were also varied for further optimisation of nanoESI mass spectra of -C16.
For example, when the cone voltage was increased from 100 V to 150 V (Figure 3.4 (c)
and (d), respectively), the abundance of ions from the complex decreased relative to
ions from C16, which tended to carry a greater number of charges (note the increase
in the [M+8H]8+ ion from Figure 3.4 (c) to (d)). This suggests that dissociated C16 was
unfolded to some extent [188]. This effect will be revisited below where CID results are
discussed. A cone voltage of 100 V along with other conditions shown in Table 2.4
were chosen for further -C16 experiments. The NH4OAc concentration selected (0.2
M) was a compromise between obtaining relatively narrow peaks and maintaining the
integrity of the complex. If the salt concentration is too high it can interfere with
electrostatic interactions that may be important to the protein-protein interaction, but
if it is too low, non-specific binding can occur [118, 164]. The effect of NH4OAc
concentration on the integrity of the complex is investigated in more detail in Section
3.3.4.
3.3.3 Comparison of the Interactions of C16 Mutants/Truncations with
There is discussion in the literature as to whether dissociation constants determined
by ESI (or nanoESI) -MS reflect the solution behaviour of complexes [161, 187, 189,
190]. Previously, the relative order of binding affinity of the replication termination
protein, Tus and point mutants for its DNA recognition sequence as judged by ESI-MS
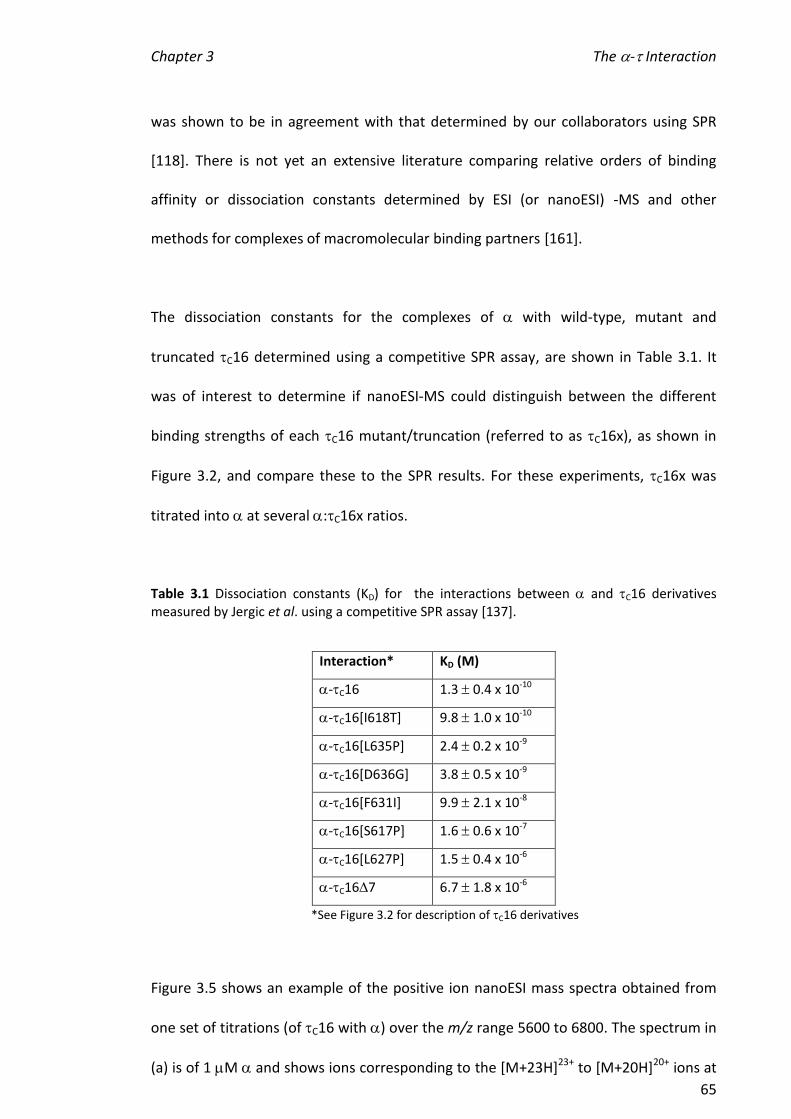
Chapter 3 The - Interaction
65
was shown to be in agreement with that determined by our collaborators using SPR
[118]. There is not yet an extensive literature comparing relative orders of binding
affinity or dissociation constants determined by ESI (or nanoESI) -MS and other
methods for complexes of macromolecular binding partners [161].
The dissociation constants for the complexes of with wild-type, mutant and
truncated C16 determined using a competitive SPR assay, are shown in Table 3.1. It
was of interest to determine if nanoESI-MS could distinguish between the different
binding strengths of each C16 mutant/truncation (referred to as C16x), as shown in
Figure 3.2, and compare these to the SPR results. For these experiments, C16x was
titrated into at several :C16x ratios.
Table 3.1 Dissociation constants (KD) for the interactions between and C16 derivatives measured by Jergic et al. using a competitive SPR assay [137].
Interaction* KD (M)
-C16 1.3 0.4 x 10⁻¹⁰
-C16[I618T] 9.8 1.0 x 10⁻¹⁰
-C16[L635P] 2.4 0.2 x 10⁻⁹
-C16[D636G] 3.8 0.5 x 10⁻⁹
-C16[F631I] 9.9 2.1 x 10⁻⁸
-C16[S617P] 1.6 0.6 x 10⁻⁷
-C16[L627P] 1.5 0.4 x 10⁻⁶
-C167 6.7 1.8 x 10⁻⁶
*See Figure 3.2 for description of C16 derivatives
Figure 3.5 shows an example of the positive ion nanoESI mass spectra obtained from
one set of titrations (of C16 with ) over the m/z range 5600 to 6800. The spectrum in
(a) is of 1 M and shows ions corresponding to the [M+23H]23+ to [M+20H]20+ ions at
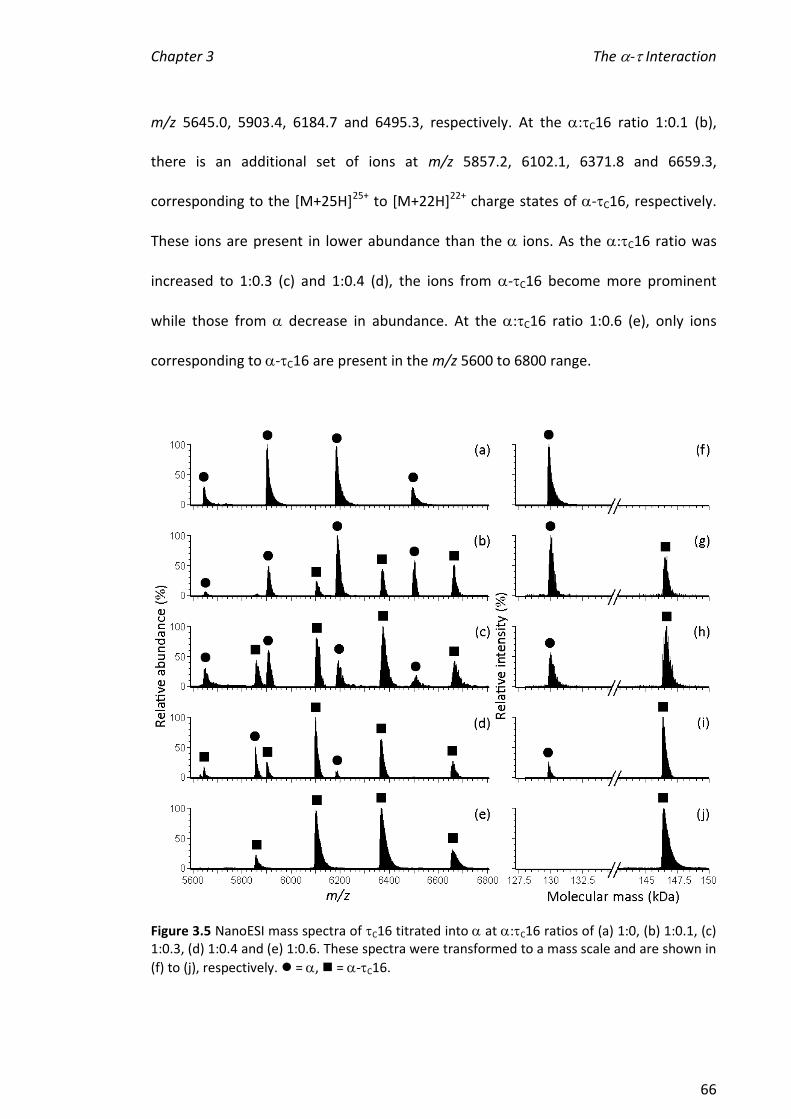
Chapter 3 The - Interaction
66
m/z 5645.0, 5903.4, 6184.7 and 6495.3, respectively. At the :C16 ratio 1:0.1 (b),
there is an additional set of ions at m/z 5857.2, 6102.1, 6371.8 and 6659.3,
corresponding to the [M+25H]25+ to [M+22H]22+ charge states of -C16, respectively.
These ions are present in lower abundance than the ions. As the :C16 ratio was
increased to 1:0.3 (c) and 1:0.4 (d), the ions from -C16 become more prominent
while those from decrease in abundance. At the :C16 ratio 1:0.6 (e), only ions
corresponding to -C16 are present in the m/z 5600 to 6800 range.
Figure 3.5 NanoESI mass spectra of C16 titrated into at :C16 ratios of (a) 1:0, (b) 1:0.1, (c) 1:0.3, (d) 1:0.4 and (e) 1:0.6. These spectra were transformed to a mass scale and are shown in
(f) to (j), respectively. = , = -C16.

Chapter 3 The - Interaction
67
The spectra in Figure 3.5 (a) to (e) were transformed to a mass scale, as shown in
spectra (f) to (i), respectively. They show, at a glance the appearance of -C16 as the
concentration of C16 was increased. Figure 3.6 shows the m/z range 1000 to 7500 for
these experiments, showing ions from free C16. These ions are only present in low
abundance in the spectra obtained when the :C16 ratios were 1:0.1 (a) and 1:0.4 (c),
and suggest there was some dissociation in the mass spectrometer. It is not clear why
no free C16 is present in Figure 3.6 (b) or (d) but this may be an effect of variation
between nanocapillaries.
Figure 3.6 NanoESI mass spectra of the extended m/z range (1000 to 7500) of Figure 3.5 (b) to
(e) shown here in (a) to (d), respectively. = C16, = , = -C16. The ions from C16 are also labelled with their corresponding charges.
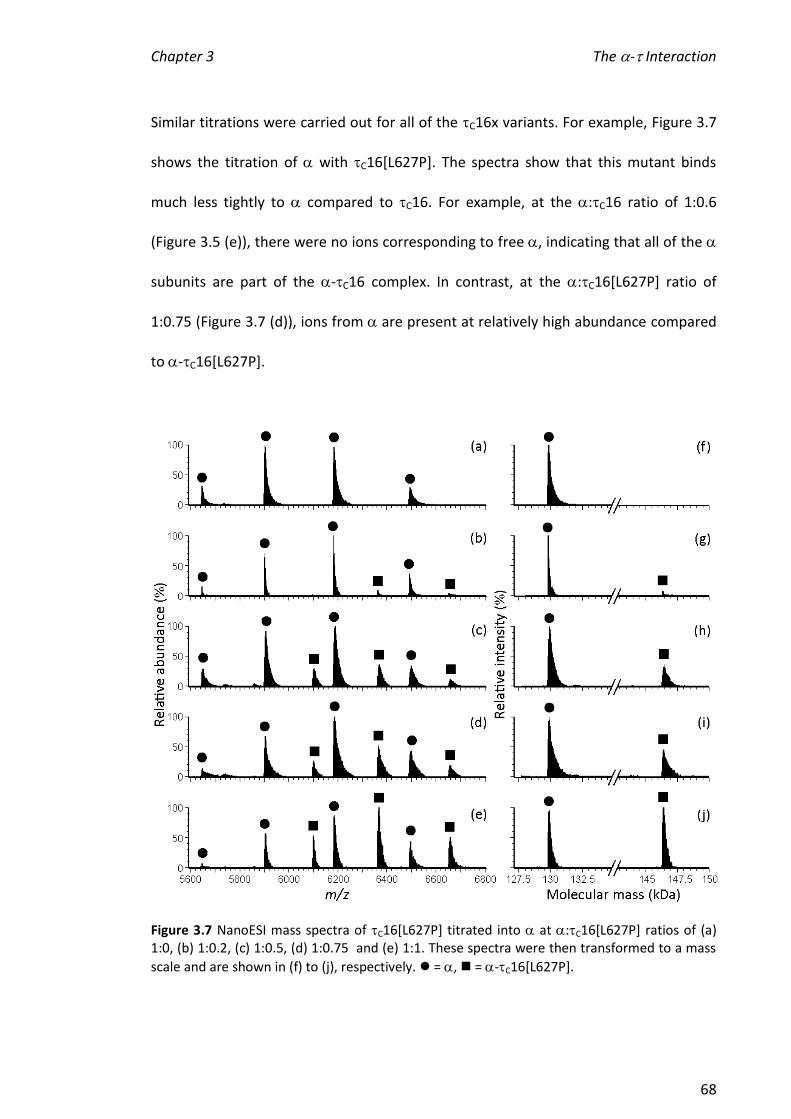
Chapter 3 The - Interaction
68
Similar titrations were carried out for all of the C16x variants. For example, Figure 3.7
shows the titration of with C16[L627P]. The spectra show that this mutant binds
much less tightly to compared to C16. For example, at the :C16 ratio of 1:0.6
(Figure 3.5 (e)), there were no ions corresponding to free , indicating that all of the
subunits are part of the -C16 complex. In contrast, at the :C16[L627P] ratio of
1:0.75 (Figure 3.7 (d)), ions from are present at relatively high abundance compared
to -C16[L627P].
Figure 3.7 NanoESI mass spectra of C16[L627P] titrated into at :C16[L627P] ratios of (a) 1:0, (b) 1:0.2, (c) 1:0.5, (d) 1:0.75 and (e) 1:1. These spectra were then transformed to a mass
scale and are shown in (f) to (j), respectively. = , = -C16[L627P].
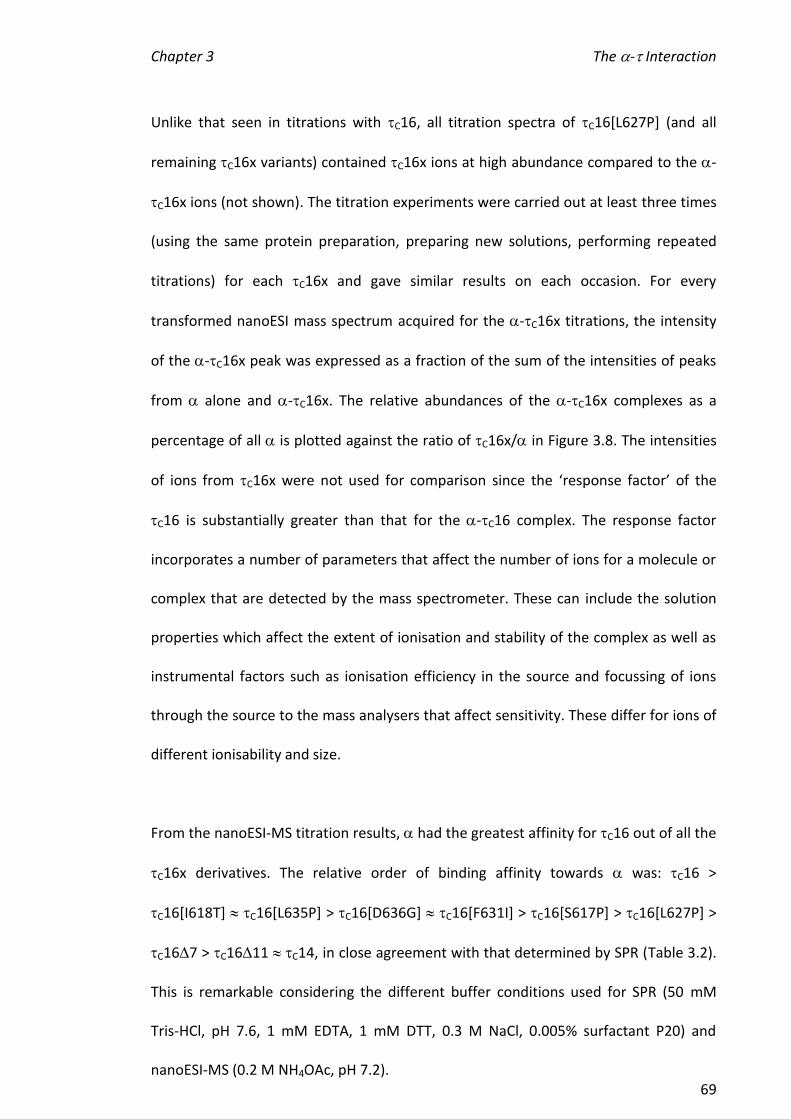
Chapter 3 The - Interaction
69
Unlike that seen in titrations with C16, all titration spectra of C16[L627P] (and all
remaining C16x variants) contained C16x ions at high abundance compared to the -
C16x ions (not shown). The titration experiments were carried out at least three times
(using the same protein preparation, preparing new solutions, performing repeated
titrations) for each C16x and gave similar results on each occasion. For every
transformed nanoESI mass spectrum acquired for the -C16x titrations, the intensity
of the -C16x peak was expressed as a fraction of the sum of the intensities of peaks
from alone and -C16x. The relative abundances of the -C16x complexes as a
percentage of all is plotted against the ratio of C16x/ in Figure 3.8. The intensities
of ions from C16x were not used for comparison since the ‘response factor’ of the
C16 is substantially greater than that for the -C16 complex. The response factor
incorporates a number of parameters that affect the number of ions for a molecule or
complex that are detected by the mass spectrometer. These can include the solution
properties which affect the extent of ionisation and stability of the complex as well as
instrumental factors such as ionisation efficiency in the source and focussing of ions
through the source to the mass analysers that affect sensitivity. These differ for ions of
different ionisability and size.
From the nanoESI-MS titration results, had the greatest affinity for C16 out of all the
C16x derivatives. The relative order of binding affinity towards was: C16 >
C16[I618T] C16[L635P] > C16[D636G] C16[F631I] > C16[S617P] > C16[L627P] >
C167 > C1611 C14, in close agreement with that determined by SPR (Table 3.2).
This is remarkable considering the different buffer conditions used for SPR (50 mM
Tris-HCl, pH 7.6, 1 mM EDTA, 1 mM DTT, 0.3 M NaCl, 0.005% surfactant P20) and
nanoESI-MS (0.2 M NH4OAc, pH 7.2).
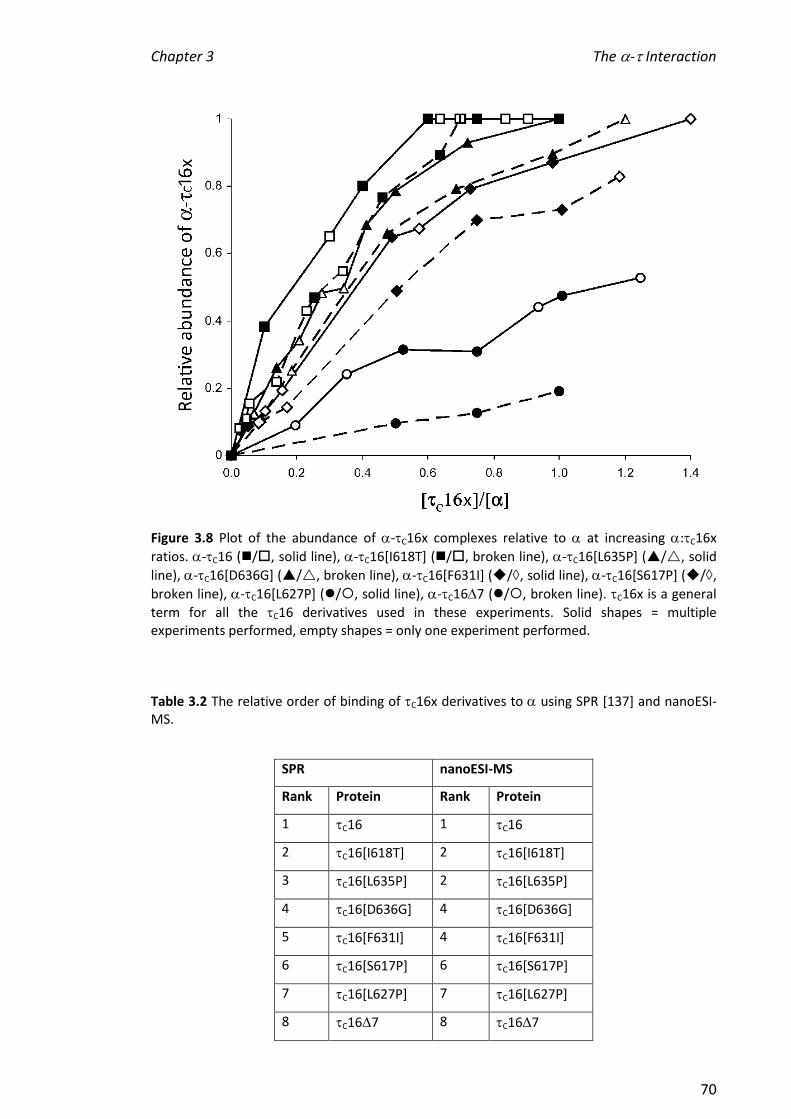
Chapter 3 The - Interaction
70
Figure 3.8 Plot of the abundance of -C16x complexes relative to at increasing :C16x
ratios. -C16 (/, solid line), -C16[I618T] (/, broken line), -C16[L635P] (/, solid
line), -C16[D636G] (/, broken line), -C16[F631I] (/, solid line), -C16[S617P] (/,
broken line), -C16[L627P] (/, solid line), -C167 (/, broken line). C16x is a general
term for all the C16 derivatives used in these experiments. Solid shapes = multiple experiments performed, empty shapes = only one experiment performed.
Table 3.2 The relative order of binding of C16x derivatives to using SPR [137] and nanoESI-MS.
SPR nanoESI-MS
Rank Protein Rank Protein
1 C16 1 C16
2 C16[I618T] 2 C16[I618T]
3 C16[L635P] 2 C16[L635P]
4 C16[D636G] 4 C16[D636G]
5 C16[F631I] 4 C16[F631I]
6 C16[S617P] 6 C16[S617P]
7 C16[L627P] 7 C16[L627P]
8 C167 8 C167
Chapter 3 The - Interaction
71
More specifically, using nanoESI-MS it was observed that became saturated with
C16 (as indicated by the absence of ions in the mass spectra) at an apparent :C16
ratio of only 1:0.6 (with the C16 mutants I618T, L635P, D636G and F631I saturating
at the :C16x ratios 1:0.7, 1:1, 1:1.2 and 1:1.4, respectively). Since the stoichiometry
of -C16 is 1:1, it appears that the relative amount of -C16 complex is being
overestimated, possibly due to small errors in the calculation of protein concentration
(e.g. an underestimation of C16 concentration). The same values for 280 for each of
the proteins were used here as in the SPR study [137]. It is also possible that the
response factor for -C16 is substantially greater than for alone and that small
amounts of free were not observable when -C16 was abundant. At the ratios
investigated, no saturation of was observed for C16[S617P], C16[L627P] or C167,
with -C16x complexes reaching the relative intensities of 0.73, 0.47 and 0.19,
respectively, at an :C16x ratio of 1:1. Several titrations of C1611 and C14 were
performed but no complex with was detected under any conditions with either
protein (not shown). Similarly, SPR was not able to detect a stable complex between
and C1611 or C14 and in the same study, gel filtration was unable to detect these
complexes or any complex involving and C167 [137].
The SPR study and other observations [43, 137, 160] suggest there are multiple
components contributing to the - interaction since: (i) all the C16 point mutants
retained at least some affinity towards , (ii) the C16 truncations C167, C1611 and
C14 showed significantly impaired binding to and (iii) there was no interaction
observed between and a peptide consisting of the C-terminal 32 residues of . The
structure of C14 (Figure 3.1) reveals that Domain V (Figure 3.2) is structured from
Chapter 3 The - Interaction
72
residues 507 to 617 and unstructured between residues 618 and 625 [43]. The further
18 residues that make up the C-terminus of C16 are also unstructured. This
unstructured region is predicted to become structured upon interacting with ; more
specifically, helix 6 of C14 is extended, and a new -helix (7) is formed, separated by a
turn [137]. The SPR and nanoESI-MS results are consistent with this structure
prediction. For example, the I618T mutation had a modest effect on -C16 binding,
while the S617P mutation had a more pronounced effect. This is consistent with the
proline residue (replacing Ser617) disrupting an -helix at the C-terminus of C16,
which is thought to interact with [137]. Additionally, while C16[L635P] had a modest
effect on binding, C16[L627P] had the largest effect (out of all the C16 mutants)
towards binding, consistent with the locations of residues 627 and 635 being within
and at the end of proposed helix 7, respectively [137]. All of the residues in C16
subjected to the point mutations described in this work are either highly conserved or
adjacent to a highly conserved residue [43], implying they are important in binding.
3.3.4 Investigating the Stability of -C16x Complexes
In observations of equilibria by any method, experimental conditions must be carefully
defined. The method for detection of a complex and free binding partners can perturb
the equilibrium itself and each method may be associated with artefacts. For example,
associations detected by SPR might be hindered if the interaction site of an
immobilised binding partner is too close to the surface of an SPR chip. In recent years
there have been numerous reports discussing the determination of binding affinities
by ESI-MS [161, 166, 167, 191-193]. In some cases, the gas phase behaviour has been
reported to be in good agreement with solution experiments. For example, the
Chapter 3 The - Interaction
73
differences in G of dissociation for protein-protein complexes of the RNase,
barnase, with various mutants of its non-covalently-bound inhibitor, barstar, were in
remarkable agreement with those measured by solution methods [191]. While
titration of non-covalent binding partners examined by nano-ESI or ESI-MS has yielded
useful results, not only must the relative response factors of at least one binding
partner be similar to that of the complex to allow comparison, but the dynamic range
must be such that the dissociation of the complex can be observed under the
experimental conditions. Where these conditions are not fully satisfied, the binding
interaction can be brought within the dynamic range by altering solution conditions;
e.g. by increasing the ionic strength to weaken a strong binding interaction [118]. In
addition, methods have been described that avoid assumptions concerning response
factors; for example, by detecting unbound ligand in experiments in which a ligand of
unknown binding affinity was in competition with a reference ligand of known binding
affinity [193]. In the latter example, the binding of small molecules to proteins was
investigated. In order for this method to be useful, the reference and test ligands must
still have dissociation constants that are sufficiently similar to enable comparison.
Therefore, the stabilities of the -C16x complexes and their behaviour under various
experimental conditions were investigated further by: (i) investigating the effect of
NH4OAc concentration, and (ii) determining the effect of increasing collision energy on
the integrity of the complex using CID. The C16 truncations were not investigated
further as C167 bound to with very low affinity and there was no detectable
interaction between and C1611 or C14.
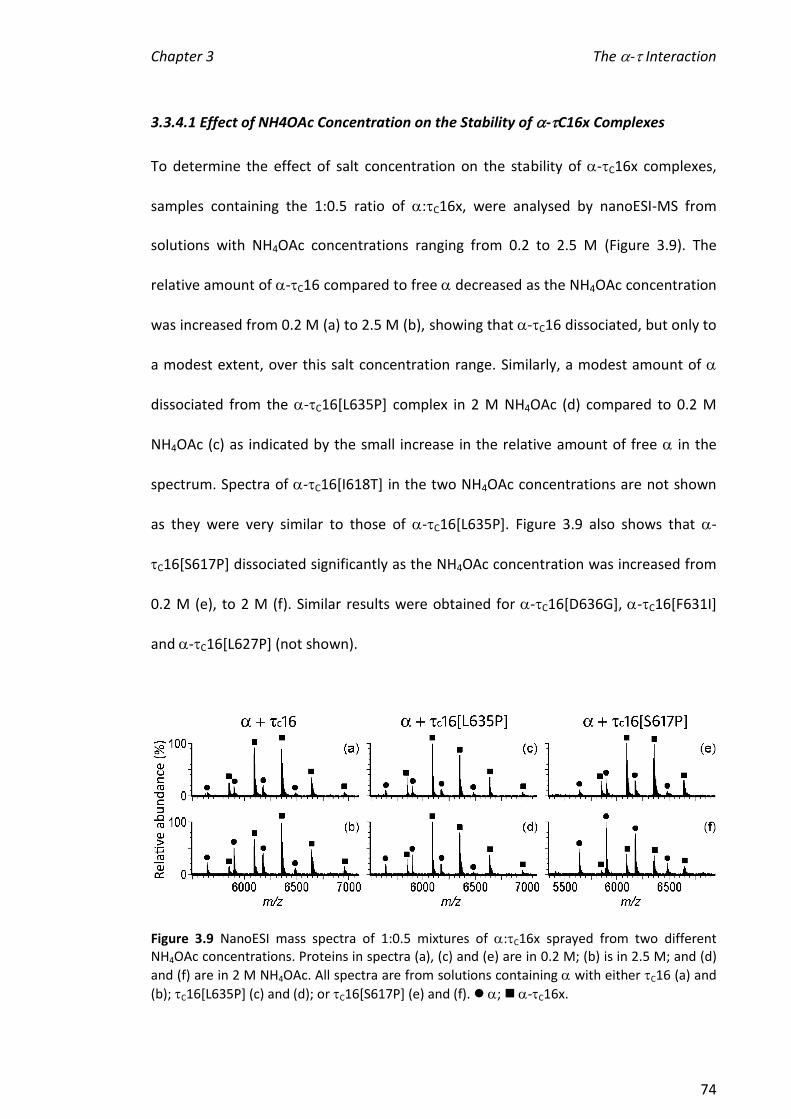
Chapter 3 The - Interaction
74
3.3.4.1 Effect of NH4OAc Concentration on the Stability of -C16x Complexes
To determine the effect of salt concentration on the stability of -C16x complexes,
samples containing the 1:0.5 ratio of :C16x, were analysed by nanoESI-MS from
solutions with NH4OAc concentrations ranging from 0.2 to 2.5 M (Figure 3.9). The
relative amount of -C16 compared to free decreased as the NH4OAc concentration
was increased from 0.2 M (a) to 2.5 M (b), showing that -C16 dissociated, but only to
a modest extent, over this salt concentration range. Similarly, a modest amount of
dissociated from the -C16[L635P] complex in 2 M NH4OAc (d) compared to 0.2 M
NH4OAc (c) as indicated by the small increase in the relative amount of free in the
spectrum. Spectra of -C16[I618T] in the two NH4OAc concentrations are not shown
as they were very similar to those of -C16[L635P]. Figure 3.9 also shows that -
C16[S617P] dissociated significantly as the NH4OAc concentration was increased from
0.2 M (e), to 2 M (f). Similar results were obtained for -C16[D636G], -C16[F631I]
and -C16[L627P] (not shown).
Figure 3.9 NanoESI mass spectra of 1:0.5 mixtures of :C16x sprayed from two different NH4OAc concentrations. Proteins in spectra (a), (c) and (e) are in 0.2 M; (b) is in 2.5 M; and (d)
and (f) are in 2 M NH4OAc. All spectra are from solutions containing with either C16 (a) and
(b); C16[L635P] (c) and (d); or C16[S617P] (e) and (f). ; -C16x.

Chapter 3 The - Interaction
75
A plot of the relative intensities of -C16x against NH4OAc concentration is shown in
Figure 3.10. The abundances of -C16, -C16[I618T] and -C16[L635P] complexes
were relatively stable throughout the 0.2 to 2.5 M NH4OAc concentration range. In
contrast, the abundances of -C16[D636G], -C16[S617P], -C16[F631I] and -
C16[L627P] decreased relative to when 1 M NH4OAc was reached, and remained at
these abundances up to 2 or 2.5 M NH4OAc. Additionally, it was observed that
absolute ion intensities in the mass spectra decreased with increasing NH4OAc
concentration in the stable -C16x complexes. Even after several attempts, no spectra
could be acquired for -C16[L635P], -C16[S617P] and -C16[F631I] in 2.5 M
NH4OAc due to inadequate signal. At this NH4OAc concentration, ions from were also
not observed. At the higher NH4OAc concentrations it was also more difficult to obtain
a consistent electrospray from the nanocapillary, indicating precipitation of the
proteins which affected their detection and complicated the study of the effect of ionic
strength on the stabilities of the complexes. This suggests that these mutant proteins
have a lower stability at high salt concentration.
3.3.4.2 Collision-Induced Dissociation (CID) of -C16x Complexes
CID is an activation method commonly used to dissociate multi-protein complexes
[194]. In CID, an electric potential is used to accelerate ions to a high kinetic energy
through the vacuum of the mass spectrometer. In a Q-TOF instrument an ion may be
selected by the quadrupole to be subjected to CID by collision with an inert gas (e.g.
argon) in the collision cell (see Figure 2.1). This kinetic energy is converted to internal
energy which results in either the fragmentation of the molecular ion or the
dissociation of a non-covalent complex [195, 196]. CID has been used to determine the

Chapter 3 The - Interaction
76
Figure 3.10 Plot of the abundance of -C16x complexes relative to at a fixed :C16x ratio
(1:0.5), at increasing NH4OAc concentrations. -C16 (, solid line), -C16[I618T] (, broken
line), -C16[L635P] (, solid line), -C16[D636G] (, broken line), -C16[F631I] (, solid
line), -C16[S617P] (, broken line), -C16[L627P] (, solid line), -C167 (, broken line). These results are from one experiment; some points were repeated on other occasions and were in agreement.
relative stabilities of a variety of protein complexes including the four-subunit GINS
complex [197] and the ribosome [198]. In the CID study of the stability of GINS, the
Psf2 subunit readily dissociated while the remaining three subunits remained as a
complex. This suggested Psf2 has the least inter-subunit contact points, locating it at
one of the ends of the horseshoe-shaped GINS complex, confirmed by EM [197].
In this work, instrument conditions were first established to perform CID experiments
on the -C16 complex using the Q-TOF UltimaTM instrument. For these experiments
the most abundant ion from -C16 (in this case, [M+23H]23+at m/z 6371.2) was
selected as a precursor for CID. The inset spectra in Figure 3.11 show the effect of
0.0
0.1
0.2
0.3
0.4
0.5
0.6
0.7
0.8
0.9
0.0 0.5 1.0 1.5 2.0 2.5 3.0
Re
lati
ve a
bu
nd
ance
of
-C1
6x
NH4OAc concentration (M)
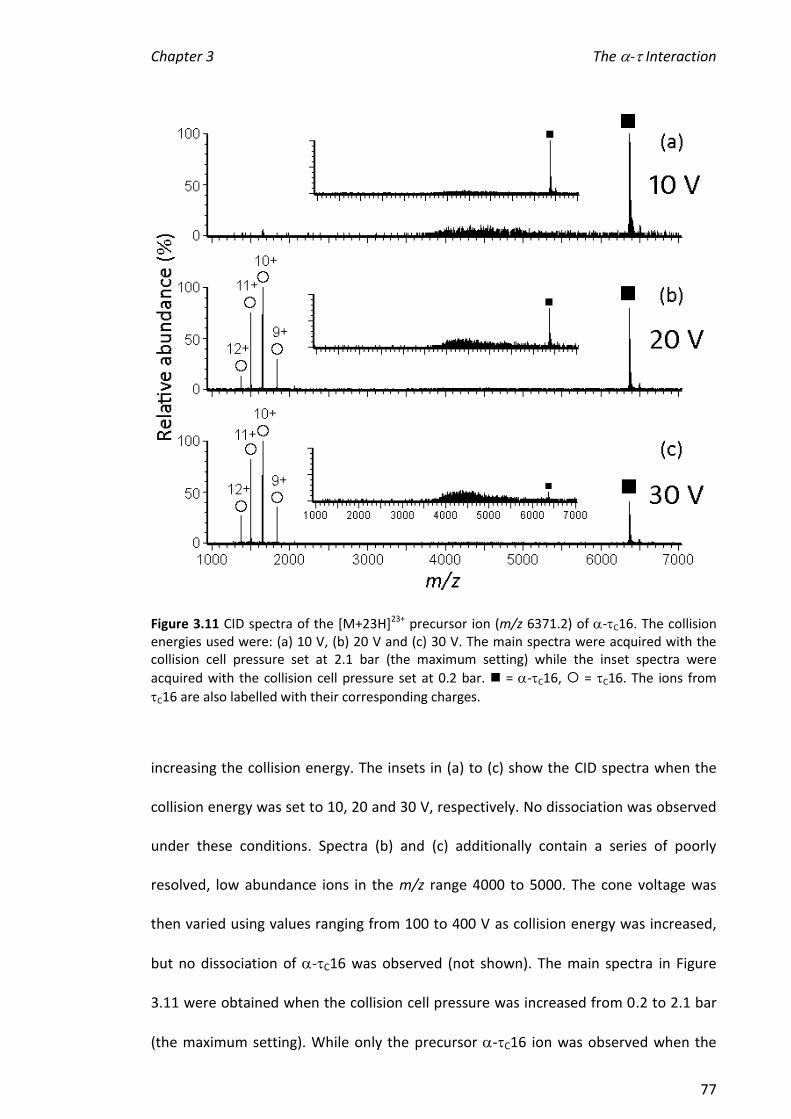
Chapter 3 The - Interaction
77
Figure 3.11 CID spectra of the [M+23H]23+ precursor ion (m/z 6371.2) of -C16. The collision energies used were: (a) 10 V, (b) 20 V and (c) 30 V. The main spectra were acquired with the collision cell pressure set at 2.1 bar (the maximum setting) while the inset spectra were
acquired with the collision cell pressure set at 0.2 bar. = -C16, = C16. The ions from
C16 are also labelled with their corresponding charges.
increasing the collision energy. The insets in (a) to (c) show the CID spectra when the
collision energy was set to 10, 20 and 30 V, respectively. No dissociation was observed
under these conditions. Spectra (b) and (c) additionally contain a series of poorly
resolved, low abundance ions in the m/z range 4000 to 5000. The cone voltage was
then varied using values ranging from 100 to 400 V as collision energy was increased,
but no dissociation of -C16 was observed (not shown). The main spectra in Figure
3.11 were obtained when the collision cell pressure was increased from 0.2 to 2.1 bar
(the maximum setting). While only the precursor -C16 ion was observed when the

Chapter 3 The - Interaction
78
collision energy was set to 10 V (a), at a collision energy of 20 V (b) there was an
additional series of ions present in high abundance in the m/z range 1000 to 2000.
These ions were at m/z 1837.9, 1654.1, 1504.3 and 1379.0, corresponding to the
[M+12H]12+ to [M+9H]9+ ions of C16, indicating C16 (Mr = 16523.7 Da [137]) had
dissociated from -C16. When the collision energy was increased to 30 V (c), the
spectrum resembled that when the collision energy was 20 V (b), except that the
precursor ion was of lower relative abundance compared with the product ions from
C16. Additional instrument conditions were then optimised such as collision energy,
transport, aperture, cone, and RF, with Table 3.3 showing those established for
obtaining optimal CID spectra of -C16.
Table 3.3 Optimal instrument (Q-TOF UltimaTM) conditions for obtaining CID spectra of -C16.
Parameter Value
Collision cell pressure 2.1 bar
Collision energy 20 V
Cone 100 V
RF lens 1 energy 100 V
Transport 5 V
Aperture 5 V
MCP 2100 V
CID experiments in which each of the three most abundant ions of -C16 were
selected as precursors were carried out to determine if they exhibited similar
dissociation behaviour under the optimised instrumental conditions described above.
Figure 3.12 (a) shows a nanoESI mass spectrum of -C16, with the ions [M+22H]22+
(m/z 6667.1), [M+23H]23+ (m/z 6381.8), and [M+24H]24+ (m/z 6111.2). It should be
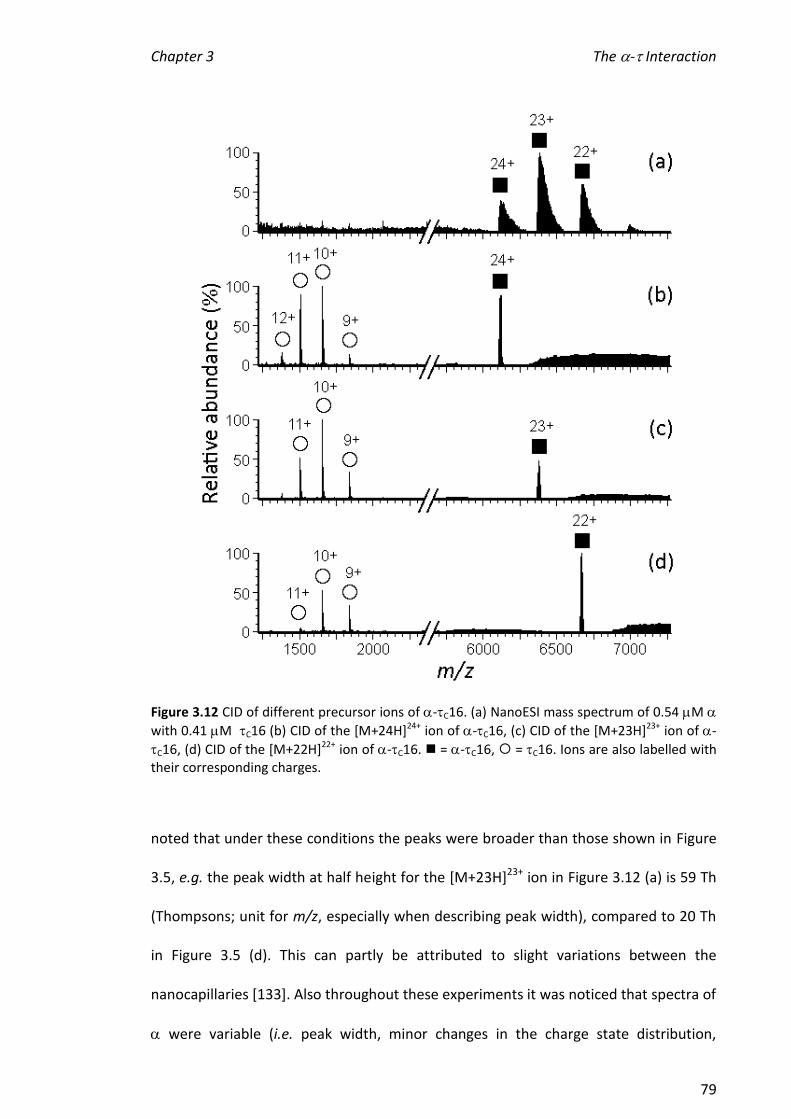
Chapter 3 The - Interaction
79
Figure 3.12 CID of different precursor ions of -C16. (a) NanoESI mass spectrum of 0.54 M
with 0.41 M C16 (b) CID of the [M+24H]24+ ion of -C16, (c) CID of the [M+23H]23+ ion of -
C16, (d) CID of the [M+22H]22+ ion of -C16. = -C16, = C16. Ions are also labelled with their corresponding charges.
noted that under these conditions the peaks were broader than those shown in Figure
3.5, e.g. the peak width at half height for the [M+23H]23+ ion in Figure 3.12 (a) is 59 Th
(Thompsons; unit for m/z, especially when describing peak width), compared to 20 Th
in Figure 3.5 (d). This can partly be attributed to slight variations between the
nanocapillaries [133]. Also throughout these experiments it was noticed that spectra of
were variable (i.e. peak width, minor changes in the charge state distribution,
Chapter 3 The - Interaction
80
ionisation) from day to day even when the same batch and instrument/solution
conditions were used. Nevertheless, the conclusions able to be reached from
experiments were consistent. For example, the same relative order of binding affinity
for with C16x was observed regardless of the peak widths observed for and -
C16x complexes. To ensure this, most experiments discussed here were performed at
least three times.
The spectra in Figure 3.12 (b), (c) and (d) were obtained when the respective
[M+24H]24+, [M+23H]23+ and [M+22H]22+ -C16 ions were selected for CID. Some
dissociation of the -C16 complex occurred as indicated by the presence of C16 ions
in the m/z range 1000 to 2000. Specifically, the ions at m/z 1381.2, 1506.5, 1656.1 and
1839.8 correspond to the [M+12H]12+ to [M+9H]9+ ions of C16, respectively. These ions
appeared as a single charge envelope. NanoESI mass spectra of C16 alone sprayed
from NH4OAc solutions produced ions carrying predominantly fewer charges: [M+8H]8+
and [M+7H]7+ at m/z 2065.9 and 2361.5, respectively (Figure 3.3 (b)). This supports
that in the CID experiments, the C16 that dissociated from the complex was at least
partially unfolded. It has previously been observed that when monomer subunits are
dissociated in CID experiments from oligomeric assemblies that the monomer carries a
‘disproportionately large share of the charge’ [199]. In the current experiments where
the C16 product was observed, the corresponding free , however, was not detected.
For example, in the complex where the major ion carried 23 positive charges, the most
abundant ion from the product C16 carried 11 positive charges ([C16+11H]11+), with
[C16+12H]12+ present at a slightly lower abundance. This means that most of the
dissociated would carry 12 (23-11) charges and appear in the CID mass spectrum at
m/z 10827.7. In these experiments data were collected only to m/z 8000. In some
Chapter 3 The - Interaction
81
recent experiments, other researchers in our laboratory studying interactions of with
other replisome proteins ( and ) have observed ions from dissociated from protein
complexes at values of m/z greater than 9000 (Beck and Dixon, unpublished results).
Table 3.4 shows the relative abundances of C16 products ions expressed a percentage
of the total abundance of all C16 product ions.
Table 3.4 Relative abundances of C16 product ions. The numbers are the relative intensities of each product ion expressed as a percentage of the sum of the intensities of all
product ions from C16 in the CID mass spectrum. ND = Not detected. Ions present in abundance greater than 35% are in bold.
Precursor ion
of -C16
Product ions (C16)
[M+13H]13+ [M+12H]12+ [M+11H]11+ [M+10H]10+
[M+24H]24+ 6 41 48 5
[M+23H]23+ 2 26 54 18
[M+22H]22+ ND 4 58 38
There is evidence in other spectra that some C16 dissociated from the complex in the
mass spectrometer. For example when the complex was sprayed from 0.01 M NH4OAc,
the relative abundance of ions from -C16 was lower and the [M+11H]11+ to [M+7H]7+
ions from C16 were observed (Figure 3.4 (a)). Furthermore, when the cone voltage
was increased the charge envelope also shifted to lower m/z (higher charge),
suggesting some dissociation and unfolding of C16 occurred in the ionisation source
(Figure 3.4 (d)).
In order to determine whether the different binding affinities of the C16 mutants for
could be distinguished using CID, a series of experiments was performed on complexes
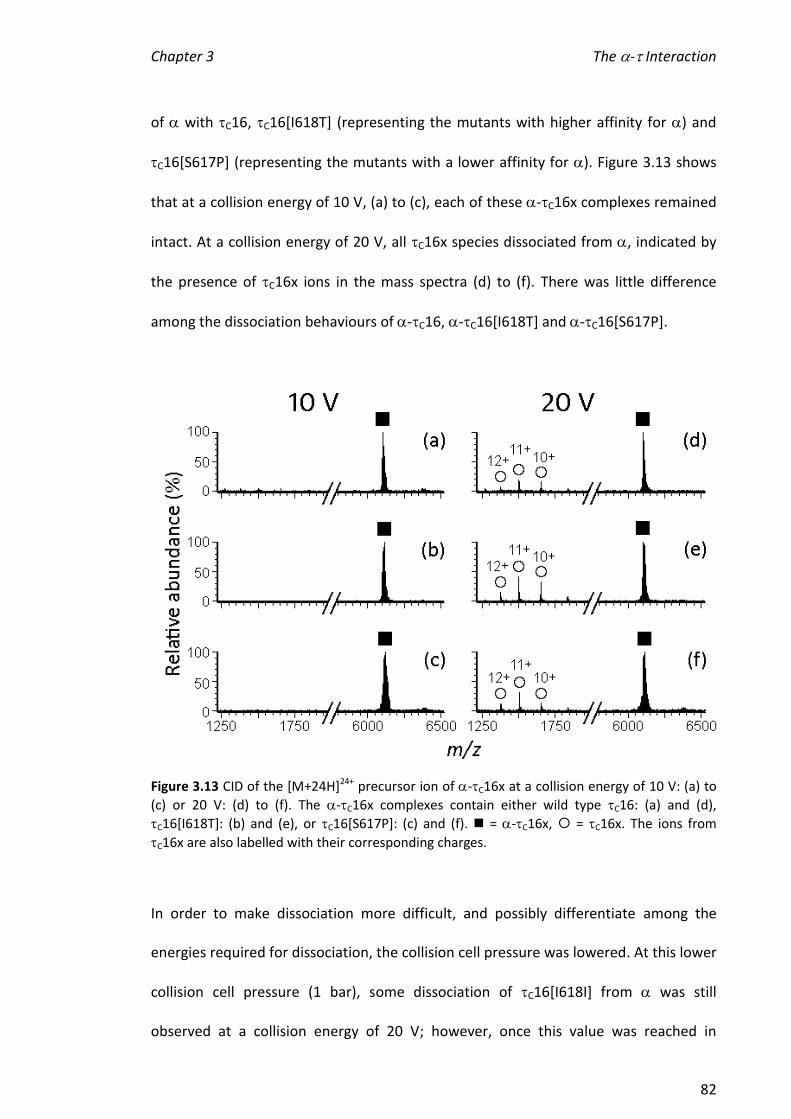
Chapter 3 The - Interaction
82
of with C16, C16[I618T] (representing the mutants with higher affinity for ) and
C16[S617P] (representing the mutants with a lower affinity for ). Figure 3.13 shows
that at a collision energy of 10 V, (a) to (c), each of these -C16x complexes remained
intact. At a collision energy of 20 V, all C16x species dissociated from , indicated by
the presence of C16x ions in the mass spectra (d) to (f). There was little difference
among the dissociation behaviours of -C16, -C16[I618T] and -C16[S617P].
Figure 3.13 CID of the [M+24H]24+ precursor ion of -C16x at a collision energy of 10 V: (a) to
(c) or 20 V: (d) to (f). The -C16x complexes contain either wild type C16: (a) and (d),
C16[I618T]: (b) and (e), or C16[S617P]: (c) and (f). = -C16x, = C16x. The ions from
C16x are also labelled with their corresponding charges.
In order to make dissociation more difficult, and possibly differentiate among the
energies required for dissociation, the collision cell pressure was lowered. At this lower
collision cell pressure (1 bar), some dissociation of C16[I618I] from was still
observed at a collision energy of 20 V; however, once this value was reached in
Chapter 3 The - Interaction
83
samples containing -C16[S617P], the signal-to-noise ratio decreased substantially
giving rise to poor quality spectra (not shown). At a collision energy of 30 V the signal-
to-noise ratio was substantially lower so even if C16[S617P] was dissociating to its
individual subunits, the product ions were not detected owing to their low abundance.
CID experiments were also carried out using a Synapt HDMSTM instrument to
determine if results were similar to those obtained using the Q-TOF UltimaTM.
Consistent with the CID experiments performed using the latter instrument, Figure
3.14 shows that the same trap collision energy was required to dissociate C16,
C16[I618I] and C16[S617P] from complexes with (~60 V). The cone voltage was
then lowered from 200 V to 50 V (see Table 2.4 for standard conditions for obtaining
mass spectra of -C16 using this instrument) with results again showing that the three
C16x variants dissociated from at a trap collision energy of ~60 V (not shown). CID
was also performed by increasing the transfer collision energy with both C16[I618I]
and C16[S617P] dissociating from at a transfer collision energy of ~70 V (not
shown). Spectra where the transfer collision energy was increased were of low quality
with the signal-to-noise ratio decreasing with increased transfer collision energy,
precluding further investigation.
Since altering instrumental parameters had not enabled discrimination among -C16x
complexes using CID, solution conditions were altered by changing the NH4OAc
concentration (the above experiments were carried out using 0.2 M NH4OAc). Only
one C16 mutant was investigated (D636G), to conserve time and samples. It was
envisaged more mutants would be investigated if positive results were obtained.

Chapter 3 The - Interaction
84
Figure 3.14 CID of the [M+24H]24+ precursor ion of -C16x at a trap collision energy of 45 V: (a)
to (c) or 60 V: (d) to (f). The -C16x complexes contain either wild type C16: (a) and (d),
C16[S617P]: (b) and (e), or C16[S617P]: (c) and (f). = -C16x, = C16x. The ions from
C16x are also labelled with their corresponding charges.
Figure 3.15 shows CID experiments performed on the -C16 and -C16[D636G]
complexes sprayed from 0.2, 0.5 and 1 M NH4OAc. Both C16 and C16[D636G]
dissociated from the complex with when they were sprayed from 0.2 and 0.5 M
NH4OAc, at a trap collision energy of ~60 V (Figure 3.15 (a), (b) and (d), (e),
respectively). The CID spectra of -C16x complexes in 1 M NH4OAc, collision energy 60
V (Figure 3.15 (c) and (f)), contained no C16x ions, indicating no dissociation took
place. It was also noticed that there was a substantial decrease in the signal-to-noise
ratio of CID spectra of -C16x complexes in 1 M NH4OAc. Higher collision energies
were applied to these samples but the -C16x ion was lost at values over 70 V (not
shown). Several attempts were made at obtaining higher quality CID spectra including
changing the position of the nanocapillary, preparing new nanocapillaries and
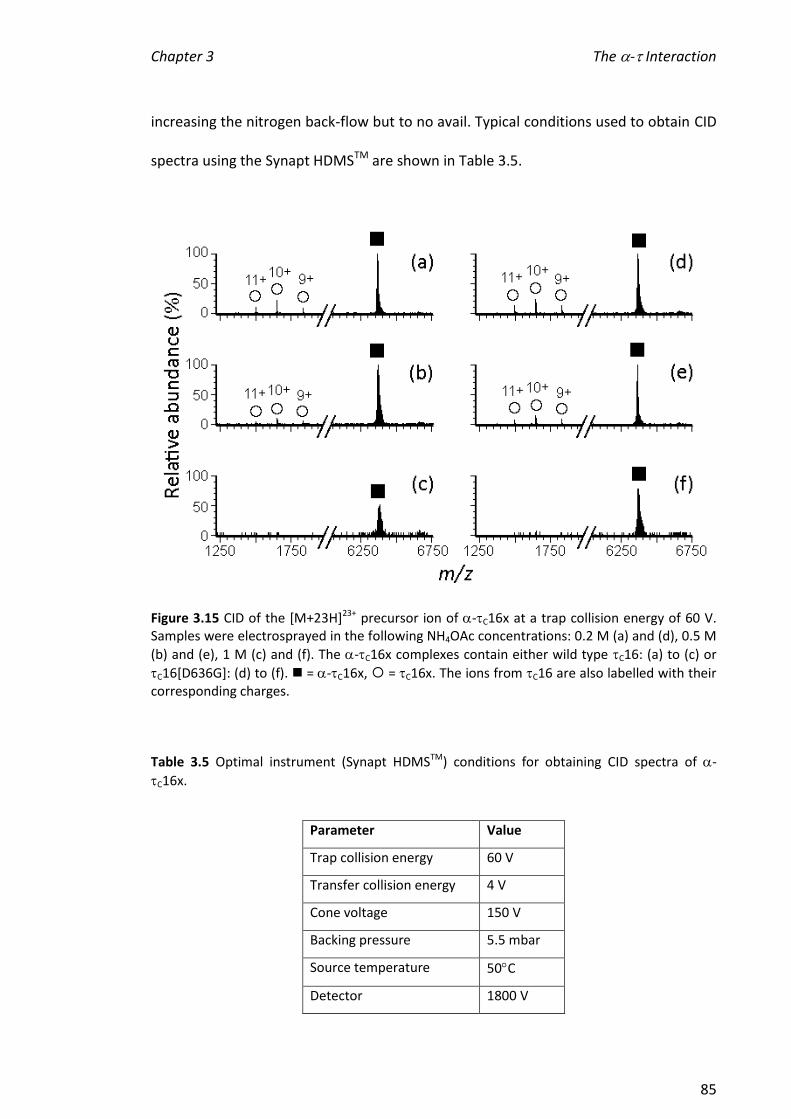
Chapter 3 The - Interaction
85
increasing the nitrogen back-flow but to no avail. Typical conditions used to obtain CID
spectra using the Synapt HDMSTM are shown in Table 3.5.
Figure 3.15 CID of the [M+23H]23+ precursor ion of -C16x at a trap collision energy of 60 V. Samples were electrosprayed in the following NH4OAc concentrations: 0.2 M (a) and (d), 0.5 M
(b) and (e), 1 M (c) and (f). The -C16x complexes contain either wild type C16: (a) to (c) or
C16[D636G]: (d) to (f). = -C16x, = C16x. The ions from C16 are also labelled with their corresponding charges.
Table 3.5 Optimal instrument (Synapt HDMSTM) conditions for obtaining CID spectra of -
C16x.
Parameter Value
Trap collision energy 60 V
Transfer collision energy 4 V
Cone voltage 150 V
Backing pressure 5.5 mbar
Source temperature 50C
Detector 1800 V
Chapter 3 The - Interaction
86
One notable difference between CID spectra acquired using the Q-TOF UltimaTM and
the Synapt HDMSTM was that the latter gave consistently higher signal-to-noise ratios.
One reason for this could be in the control of the flow of nitrogen gas that ‘pushes’ the
liquid out of the nanocapillary in order to initiate the electrospray process. The Q-TOF
UltimaTM is fitted with a manual dial whereas the Synapt HDMSTM has computerised
control over the nitrogen flow.
It is interesting that the -C16x complexes appeared to be more stable to CID when
they were sprayed from 1 M NH4OAc. This may be due to reorganisation of the non-
covalent interaction holding the complex together (at the greater ionic strength) or
compaction of the complex such that it does not encounter as many argon atoms in
the collision cell. The latter proposal suggests a substantial change in size in response
to ionic strength. In order to test this, the ion mobilities of and -C16 were
compared in 0.2 M and 1 M NH4OAc using the travelling wave ion mobility cell of the
Synapt HDMSTM. These results are described in Chapter 5 of this thesis (Section 5.3.8).
3.3.5 Determination of Dissociation Constants
The results from the titration experiments (Figure 3.8) were used in an attempt to
determine dissociation constants for the binding of with C16 and the mutants. At
first glance, it might be expected that the response factor of and the -C16
complexes would be comparable given that the binding of the C16 proteins causes a
relatively small change in mass such that a single set of mass spectrometry conditions
allow for ready detection of both [118, 167]. Therefore, attempts were made to
determine dissociation constants (KD) using the relative abundances of these two
Chapter 3 The - Interaction
87
species. In contrast, C16 is a small protein (Mr = 16524 Da), and has a greater response
factor (is readily ionised and detected). The mixture in which C16[F631I]/ was 0.5
can be used as an example of the calculation of dissociation constants from first
principles (Table 3.6). The absolute intensities of and -C16 complex were 17.5 and
32.2, respectively ( represented 17.5/(17.5 + 32.2) = 0.35 of all a present in the
mixture and -C16 complex represented 0.65 of all present in the mixture). The
total initial concentration of was 1.11 μM which gives an equilibrium concentration
of 0.35 x 1.11 μM = 0.39 μM for as judged by the nanoESI mass spectra. The
concentration of -C16 complex in the equilibrium mixture was therefore 0.72 μM. In
order to calculate KD the equilibrium concentration of free C16 must be inferred. The
equilibrium concentration of free C16 is its initial concentration less the concentration
of the complex. The initial concentration of C16 was 0.55 μM. Since the apparent
concentration of the complex, as judged from the relative intensities of and -C16,
was greater than this (0.72 μM), a value of KD cannot be calculated from the data. This
discrepancy was encountered for all titration mixtures for C16 and the mutants and
was also evident when areas under the peaks, rather than intensities (discussed
below), were used to determine relative abundances. These experiments were
reproduced on several occasions using different preparations of and C16.
Calculation of relative amounts of binding partners can be complicated by the widths
of the peaks corresponding to the different ions. For example, the peak width at half-
height of the ion at m/z 6099.1 corresponding to the [M+24H]24+ ion from the -C16
complex in Figure 3.5 (e) is 12 Th. The minimum peak width in spectra from high
molecular mass complexes is expected to be limited by the presence of isotopes given
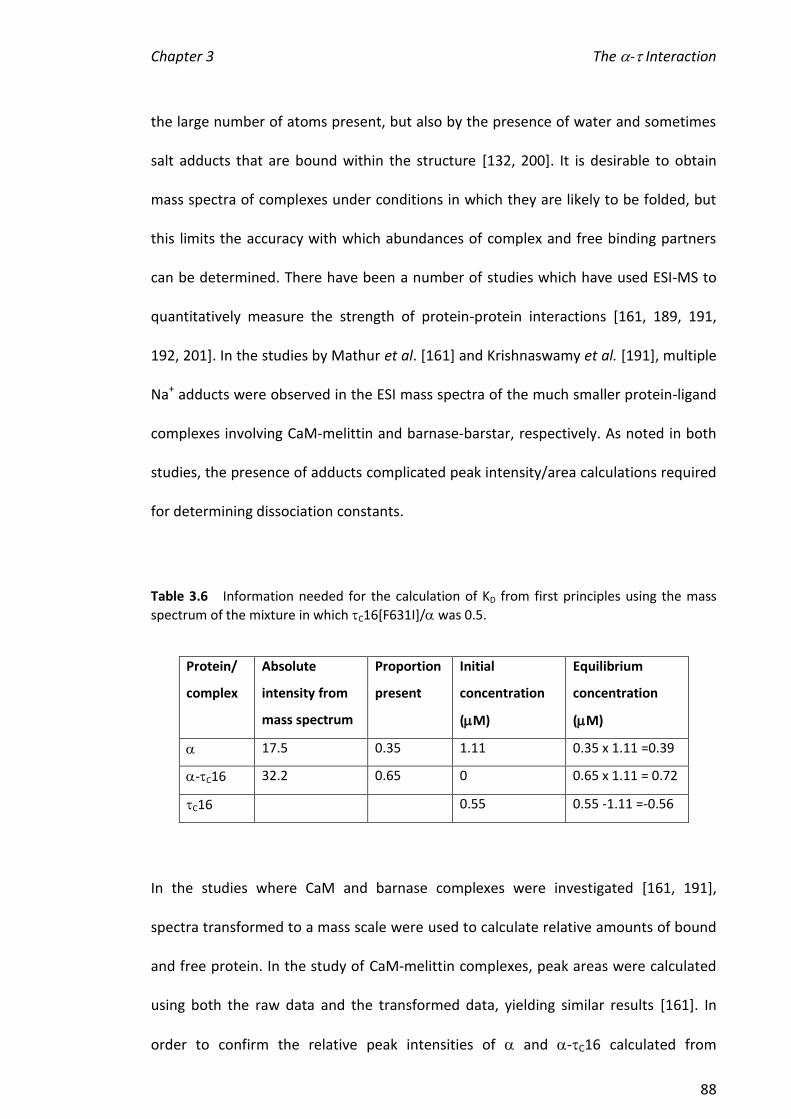
Chapter 3 The - Interaction
88
the large number of atoms present, but also by the presence of water and sometimes
salt adducts that are bound within the structure [132, 200]. It is desirable to obtain
mass spectra of complexes under conditions in which they are likely to be folded, but
this limits the accuracy with which abundances of complex and free binding partners
can be determined. There have been a number of studies which have used ESI-MS to
quantitatively measure the strength of protein-protein interactions [161, 189, 191,
192, 201]. In the studies by Mathur et al. [161] and Krishnaswamy et al. [191], multiple
Na+ adducts were observed in the ESI mass spectra of the much smaller protein-ligand
complexes involving CaM-melittin and barnase-barstar, respectively. As noted in both
studies, the presence of adducts complicated peak intensity/area calculations required
for determining dissociation constants.
Table 3.6 Information needed for the calculation of KD from first principles using the mass
spectrum of the mixture in which C16[F631I]/ was 0.5.
Protein/
complex
Absolute
intensity from
mass spectrum
Proportion
present
Initial
concentration
(M)
Equilibrium
concentration
(M)
17.5 0.35 1.11 0.35 x 1.11 =0.39
-C16 32.2 0.65 0 0.65 x 1.11 = 0.72
C16 0.55 0.55 -1.11 =-0.56
In the studies where CaM and barnase complexes were investigated [161, 191],
spectra transformed to a mass scale were used to calculate relative amounts of bound
and free protein. In the study of CaM-melittin complexes, peak areas were calculated
using both the raw data and the transformed data, yielding similar results [161]. In
order to confirm the relative peak intensities of and -C16 calculated from

Chapter 3 The - Interaction
89
transformed spectra were consistent with the smoothed raw data, the spectra shown
in Figure 3.5 (b) to (d) were examined. Table 3.7 shows a comparison of the relative
abundances of -C16 complexes as a fraction of all present in each spectrum
calculated from adding the peak intensities of separate charge states (smoothed) and
those calculated using intensities from the transformed spectra from the results shown
in Figure 3.5. Additionally, the relative amounts of and -C16 were calculated by
determining the areas under different ions in the spectra, rather than peak intensities;
this is shown in the column ‘centred by peak area’ in Table 3.7. The values calculated
from each method correlate well with each other, providing confidence in the
calculations.
Table 3.7 Relative abundances of the -C16 complex calculated in different ways from the same spectra from Figure 3.5 (b), (c) and (d).
Spectrum
(Figure 3.5)
Smoothed Transformed Centred by
peak area
(b) 0.41 0.38 0.36
(c) 0.64 0.65 0.70
(d) 0.83 0.80 0.82
All spectra were combined, subtracted, and smoothed as described in Section 2.2.12 before determination of relative abundances.
The inability to determine values for dissociation constants involving the -C16x
complexes suggests that the response factor of the complexes was substantially
increased over that for free . It is unlikely that there is a substantial error in
determination of the concentration of since the free C16 observed in mass spectra
of titration mixtures of with C16 generally increased as might be expected as the
ratio of C16 to increased above one. In addition, the same method for determining
Chapter 3 The - Interaction
90
protein concentration was used in the SPR experiments [137]. It is possible that the
proposed increase in response factor resulted from a change in the conformation of
in the complex that had a direct effect on the ionisation efficiency (e.g. a change in the
positioning of charges towards the surface of the electrospray droplet) or on the
stability of in solution that enabled a greater percentage of to be transferred from
the solution to the gas phase when it was in the complex.
Conformational changes as a result of a protein interacting with another biomolecule
are not uncommon, including components of replisomes from other organisms. In a
study by Wing et al. the structure of full-length Thermus aquaticus bound to a
primer-DNA template was determined and compared to the (partial) structure of E.
coli [36], as they are presumed to be analogous [202]. It was found that when bound
to DNA, the thumb, finger and -binding domains of T. aquaticus had shifted relative
to the unbound structure [203], creating a binding pocket for an incoming nucleotide
and a more compact overall structure. The C-terminal domain (the location of the
binding site in E. coli ) of T. aquaticus had also moved with the shifting of the
adjacent -binding domain, positioning its oligonucleotide binding fold to bind to
down-stream ssDNA.
One of the roles of the - interaction is the cycling of during discontinuous lagging
strand replication. There is strong evidence suggesting that acts as a ‘processivity
switch’, controlling when associates and dissociates from the clamp protein, 2
[204]. Leu et al. showed that a recombinant, C-terminal ~24 kDa fragment of
(Domains IV and V) can bind to DNA and inferred that can sense the type of DNA
bound at the replication fork (i.e. primer-template or dsDNA). On primed DNA, loses
Chapter 3 The - Interaction
91
affinity for , allowing 2 to bind. Once the replicating section of ssDNA is fully
complemented with nucleotides (and only a nick remains), the affinity of for is
restored so 2 is disengaged from [158]. Together with the findings by Wing et al.
showing that a change in conformation takes place in the binding domain of when
primer-DNA was bound [202], it is likely that the processivity switch is dependent on a
conformational change.
Since a conformational change of is likely to be important to its function in vivo and
since the results reported here were consistent with a conformational change of in
its complex with C16, experiments using nanoESI-MS as the major technique were
carried out in an attempt to confirm the proposed change in conformation.
3.3.6 Hydrogen/Deuterium Exchange (HDX)
The conformations of and -C16 were probed in HDX experiments. HDX is a method
used to follow protein unfolding and to measure the extent of contact of protein
binding partners [175, 205, 206] (see Section 3.1.2). When a protein (or complex) is
equilibrated with D2O, exposed amide nitrogens of peptide bonds and exposed, readily
exchangeable protons on amide amino acid side chains exchange with deuterons. This
process can be analysed by MS or NMR spectroscopy [142, 207, 208]. Two methods of
HDX assessed by MS were used in order to probe structural changes occurring when
C16 and form a complex. In direct HDX, all of the exposed exchangeable protons not
involved in H-bonding networks are detected and there is an opportunity for back
exchange (protons replacing deuterons) to occur. In quenched HDX, acidification to pH
~2 at 0C decreases the rate of back exchange on the amide nitrogens by ~105 fold, but
Chapter 3 The - Interaction
92
results in protonation of the side chains (which exchange rapidly under the conditions).
In this method only deuteration of the amide nitrogens is detected.
In this work HDX was carried out by diluting an aliquot of protein into D2O at time = 0.
The uptake of deuterium into the protein(s) was then monitored by the acquisition of
mass spectra at various time points. Since a deuterium atom has a mass of 2 Da, 1 Da
higher than a hydrogen atom, an increase in mass of 1 Da indicates one deuteron has
exchanged with one proton within the protein.
3.3.6.1 Direct HDX
Initially, proteins were treated with D2O at 22C. The final percentage of D2O in these
experiments was 93%. The concentration of D2O could not be made greater since
was unstable at the high concentrations that would be required for this. Mass spectra
of C16 incubated with D2O revealed that 125 deuterons were incorporated into the
protein after 2 min and approximately 165 deuterons were incorporated into the
protein after 10, 15 and 30 min (Figure 3.16 (a)). When was incubated with D2O, 751
deuterons exchanged after 2 min and between 1015 and 1031 deuterons exchanged
after 10, 15 and 30 min (Figure 3.16 (b)). The sum of deuterons exchanged for and
C16 separately was therefore 876 after 2 min and 1180 after 30 min. When the -C16
complex was incubated with D2O, 1104 deuterons had exchanged after 2 min, and
1456 had exchanged after 30 min. Figure 3.17 shows an example of the mass spectra
acquired before D2O addition and 30 minutes after D2O was added.
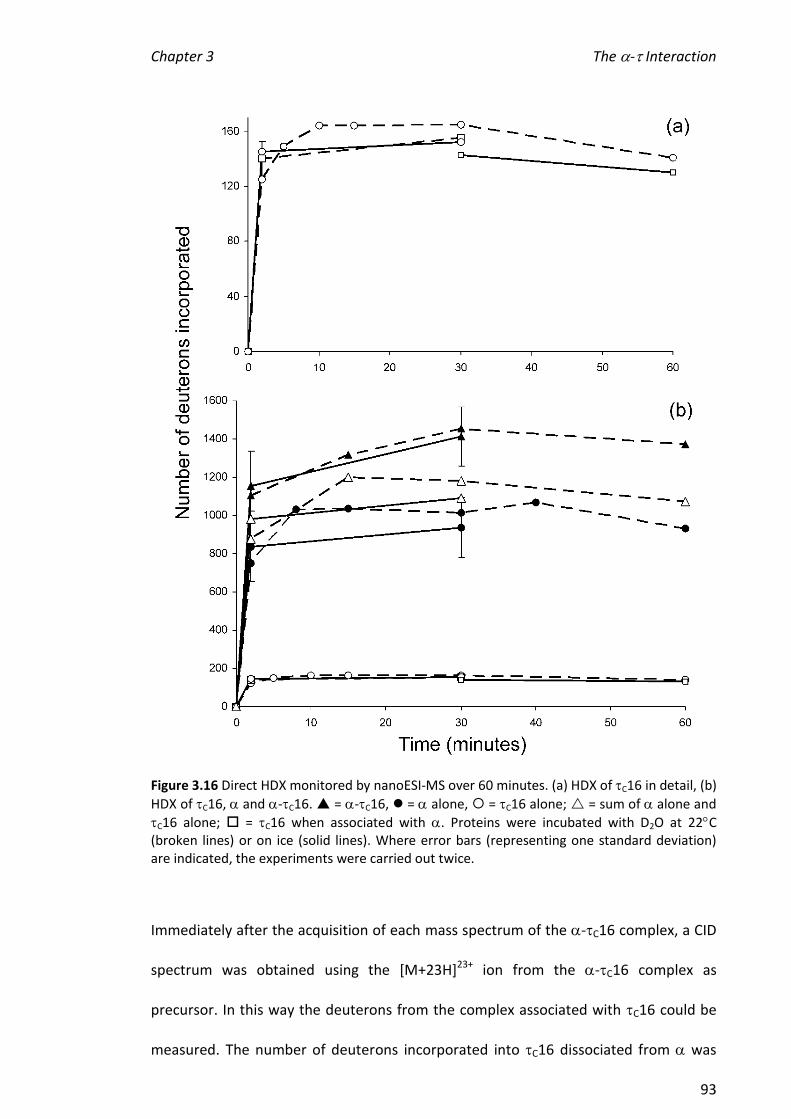
Chapter 3 The - Interaction
93
Figure 3.16 Direct HDX monitored by nanoESI-MS over 60 minutes. (a) HDX of C16 in detail, (b)
HDX of C16, and -C16. = -C16, = alone, = C16 alone; = sum of alone and
C16 alone; = C16 when associated with . Proteins were incubated with D2O at 22C (broken lines) or on ice (solid lines). Where error bars (representing one standard deviation) are indicated, the experiments were carried out twice.
Immediately after the acquisition of each mass spectrum of the -C16 complex, a CID
spectrum was obtained using the [M+23H]23+ ion from the -C16 complex as
precursor. In this way the deuterons from the complex associated with C16 could be
measured. The number of deuterons incorporated into C16 dissociated from was
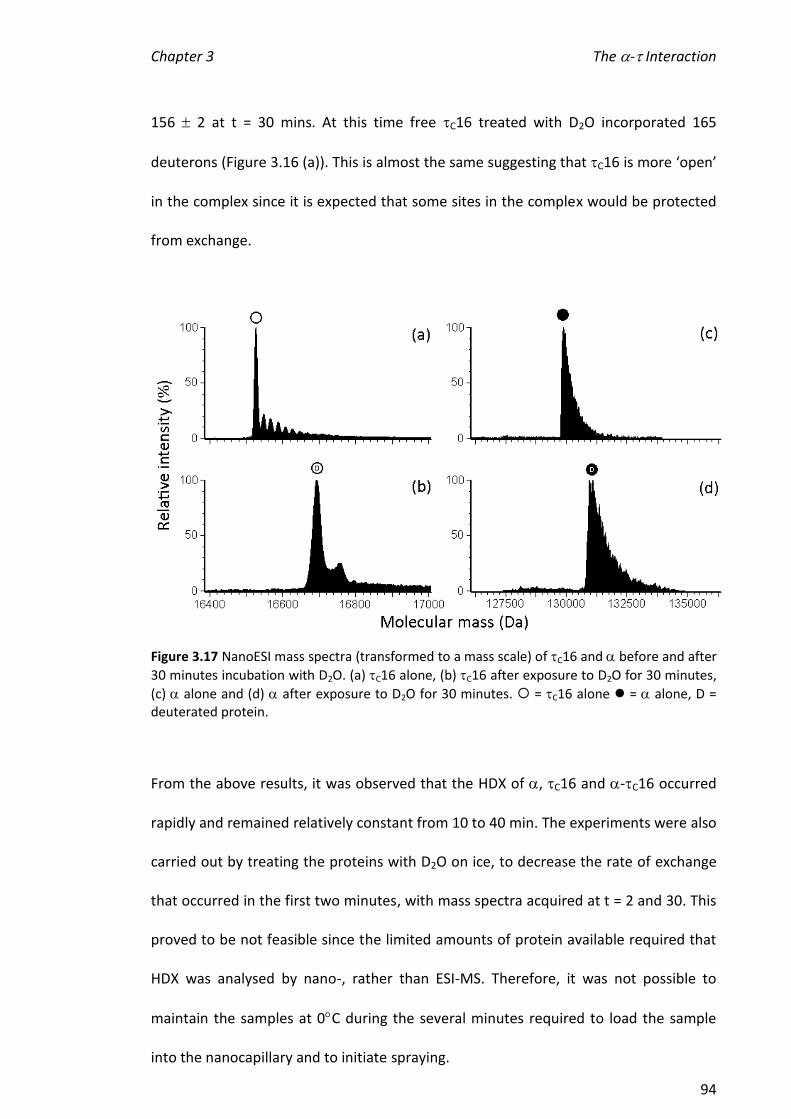
Chapter 3 The - Interaction
94
156 2 at t = 30 mins. At this time free C16 treated with D2O incorporated 165
deuterons (Figure 3.16 (a)). This is almost the same suggesting that C16 is more ‘open’
in the complex since it is expected that some sites in the complex would be protected
from exchange.
Figure 3.17 NanoESI mass spectra (transformed to a mass scale) of C16 and before and after
30 minutes incubation with D2O. (a) C16 alone, (b) C16 after exposure to D2O for 30 minutes,
(c) alone and (d) after exposure to D2O for 30 minutes. = C16 alone = alone, D = deuterated protein.
From the above results, it was observed that the HDX of , C16 and -C16 occurred
rapidly and remained relatively constant from 10 to 40 min. The experiments were also
carried out by treating the proteins with D2O on ice, to decrease the rate of exchange
that occurred in the first two minutes, with mass spectra acquired at t = 2 and 30. This
proved to be not feasible since the limited amounts of protein available required that
HDX was analysed by nano-, rather than ESI-MS. Therefore, it was not possible to
maintain the samples at 0C during the several minutes required to load the sample
into the nanocapillary and to initiate spraying.
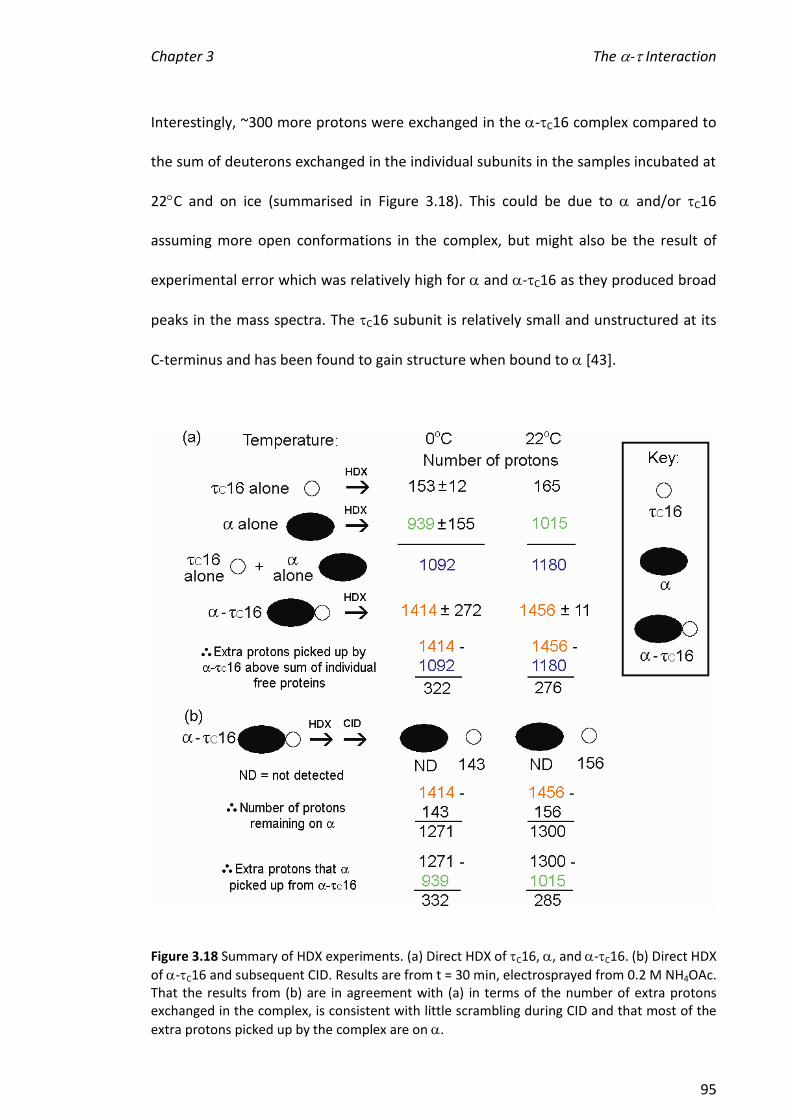
Chapter 3 The - Interaction
95
Interestingly, ~300 more protons were exchanged in the -C16 complex compared to
the sum of deuterons exchanged in the individual subunits in the samples incubated at
22C and on ice (summarised in Figure 3.18). This could be due to and/or C16
assuming more open conformations in the complex, but might also be the result of
experimental error which was relatively high for and -C16 as they produced broad
peaks in the mass spectra. The C16 subunit is relatively small and unstructured at its
C-terminus and has been found to gain structure when bound to [43].
Figure 3.18 Summary of HDX experiments. (a) Direct HDX of C16, , and -C16. (b) Direct HDX
of -C16 and subsequent CID. Results are from t = 30 min, electrosprayed from 0.2 M NH4OAc. That the results from (b) are in agreement with (a) in terms of the number of extra protons exchanged in the complex, is consistent with little scrambling during CID and that most of the
extra protons picked up by the complex are on .
Chapter 3 The - Interaction
96
Intramolecular deuterium scrambling is known to occur during the CID of deuterated
individual proteins [209, 210], however, recent evidence has shown that this is not the
case when non-covalent complexes are subjected to the same treatment [211-213].
Using direct HDX-MS and CID, Hodkinson et al. showed that more protons were
protected within 2-microglobulin when it was bound to the major histocompatibility
complex class 1, compared to the individual protein [211]. These results were
consistent with the X-ray crystal structure of the non-covalent complex, indicating
scrambling was not an issue here.
In order to probe whether scrambling might be significant in CID of -C16, a series of
experiments was set up in which deuterated -C16 complex was dissociated by
subjecting the [M+23H]23+ precursor ion to a range of collision energies, from 20 to 60
V. The number of deuterons associated with C16 increased with the length of time the
-C16 complex was exposed to D2O at 22C, up to 70 minutes (Figure 3.19). The
collision energy voltage had little effect on the number of deuterons exchanged. For
example, after -C16 was exposed to D2O for 40 minutes and CID performed using
collision energies of 20, 25 and 30 V, a similar number of deuterons had exchanged
(166, 164 and 168, respectively, in three separate experiments). This suggests that if
scrambling occurred at all it did not increase with collision energy under the conditions
used here.
3.3.6.2 Quenched HDX
When HDX was quenched by acidification, analysis was problematic since is not
readily electrosprayed under these conditions (see Section 3.3.1). Nevertheless, some
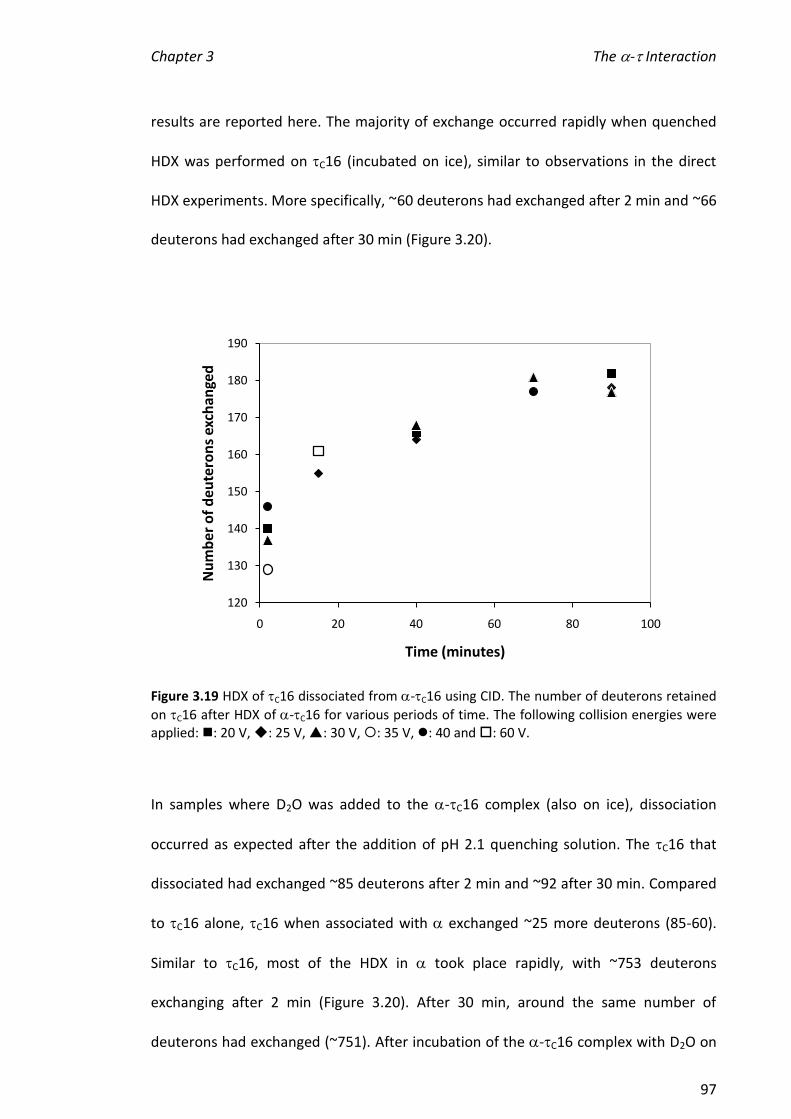
Chapter 3 The - Interaction
97
results are reported here. The majority of exchange occurred rapidly when quenched
HDX was performed on C16 (incubated on ice), similar to observations in the direct
HDX experiments. More specifically, ~60 deuterons had exchanged after 2 min and ~66
deuterons had exchanged after 30 min (Figure 3.20).
Figure 3.19 HDX of C16 dissociated from -C16 using CID. The number of deuterons retained
on C16 after HDX of -C16 for various periods of time. The following collision energies were applied: : 20 V, : 25 V, : 30 V, : 35 V, : 40 and : 60 V.
In samples where D2O was added to the -C16 complex (also on ice), dissociation
occurred as expected after the addition of pH 2.1 quenching solution. The C16 that
dissociated had exchanged ~85 deuterons after 2 min and ~92 after 30 min. Compared
to C16 alone, C16 when associated with exchanged ~25 more deuterons (85-60).
Similar to C16, most of the HDX in took place rapidly, with ~753 deuterons
exchanging after 2 min (Figure 3.20). After 30 min, around the same number of
deuterons had exchanged (~751). After incubation of the -C16 complex with D2O on
120
130
140
150
160
170
180
190
0 20 40 60 80 100
Nu
mb
er o
f d
eute
ron
s ex
chan
ged
Time (minutes)
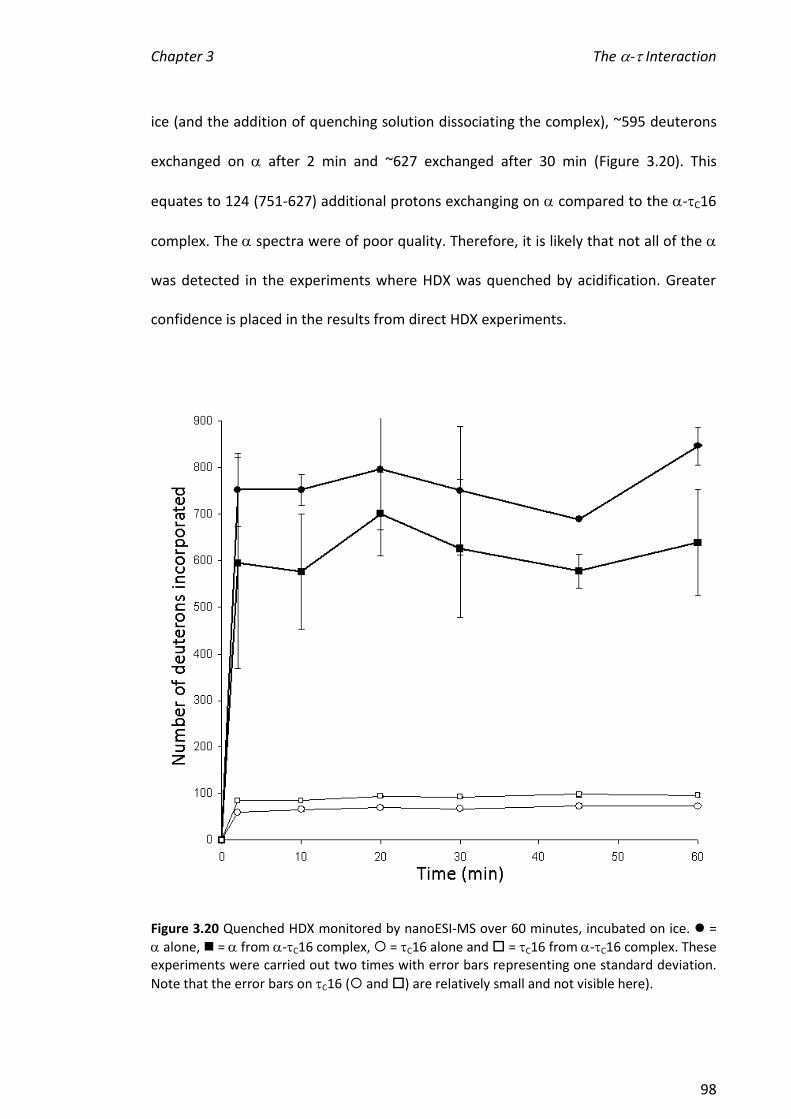
Chapter 3 The - Interaction
98
ice (and the addition of quenching solution dissociating the complex), ~595 deuterons
exchanged on after 2 min and ~627 exchanged after 30 min (Figure 3.20). This
equates to 124 (751-627) additional protons exchanging on compared to the -C16
complex. The spectra were of poor quality. Therefore, it is likely that not all of the
was detected in the experiments where HDX was quenched by acidification. Greater
confidence is placed in the results from direct HDX experiments.
Figure 3.20 Quenched HDX monitored by nanoESI-MS over 60 minutes, incubated on ice. =
alone, = from -C16 complex, = C16 alone and = C16 from -C16 complex. These experiments were carried out two times with error bars representing one standard deviation.
Note that the error bars on C16 ( and ) are relatively small and not visible here).

Chapter 3 The - Interaction
99
The direct HDX results are consistent with the proposal that a substantial
conformational change of occurs when it binds C16 (or ). This is difficult to confirm
by other methods. For example, this complex is large for NMR experiments ( is ~130
kDa). There is no crystal structure for the C-terminal end of that binds , most likely
since that region is unstructured when not involved in protein-protein interactions. It
has recently been recognised that highly flexible regions of proteins have important
roles in protein-protein interactions and molecular recognition in general [214].
Furthermore, - (or -C16) have resisted crystallisation attempts.
The results from CID experiments (Figure 3.15) are consistent with an effect of ionic
strength on the shape of (smaller cross-section at higher salt concentration). In the
recent HDX experiments (Urathamakul and Beck, unpublished results), the extent of
HDX of and -C16 was greatly reduced in 1 M compared to 0.2 M NH4OAc as
reported here. These observations will be revisited in Chapter 5 (Section 5.3.8).
3.3.7 Detection of C16 Dimer
In some experiments where spectra of the α-C16 complex and C16 were acquired
(three occasions out of at least fifty), unexpected ions in C16 spectra were observed
as shown in Figure 3.21 (a). In addition to the usual [M+11H]11+to [M+6H]6+ ions of
C16, ions at m/z 2207.8, 2548.2, 2760.1, 3011.4, 3312.0, corresponding to the
[M+17H]17+ to [M+10H]10+ ions of (C16)2+60 Da were present. For example, the
calculated m/z for the [M+15H]15+ ion of (C16)2 is 2204.2 and that for (C16)2+60 Da is
2208.2. Since the dimer was only observed when the moiety corresponding to a mass
of 60 Da was present, the ions at m/z 2066.4 and 2361.6 most likely belong to the
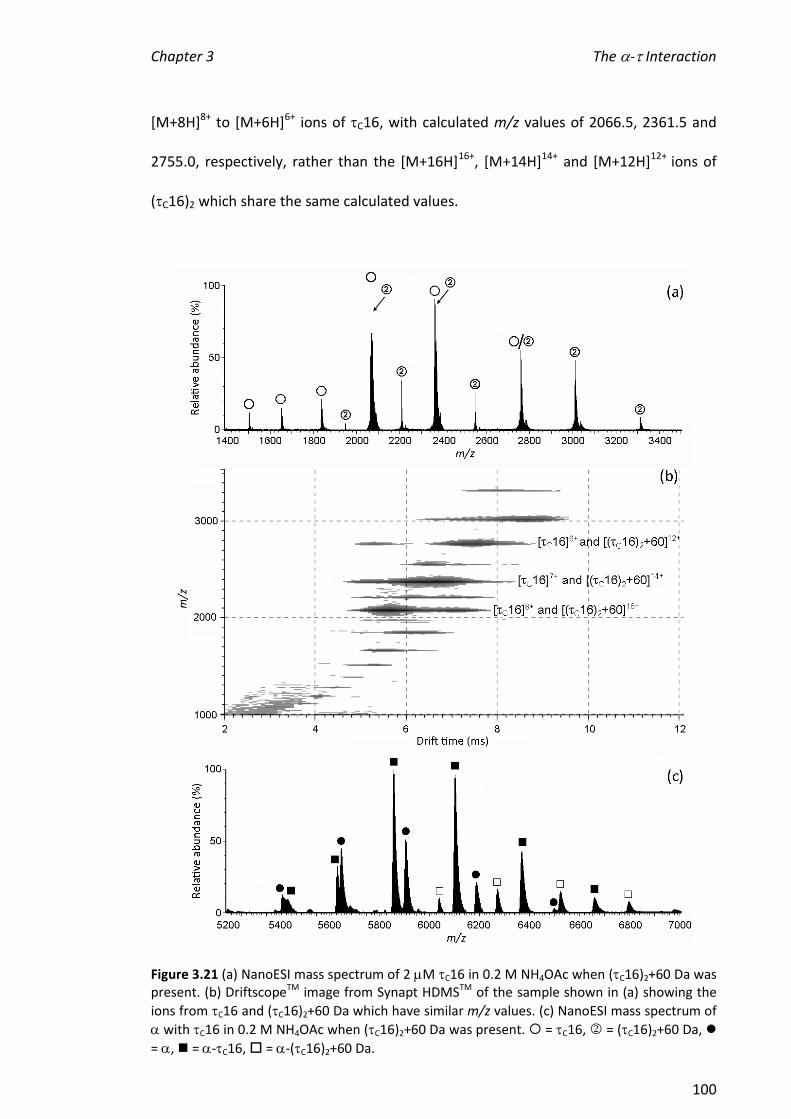
Chapter 3 The - Interaction
100
[M+8H]8+ to [M+6H]6+ ions of C16, with calculated m/z values of 2066.5, 2361.5 and
2755.0, respectively, rather than the [M+16H]16+, [M+14H]14+ and [M+12H]12+ ions of
(C16)2 which share the same calculated values.
Figure 3.21 (a) NanoESI mass spectrum of 2 M C16 in 0.2 M NH4OAc when (C16)2+60 Da was present. (b) DriftscopeTM image from Synapt HDMSTM of the sample shown in (a) showing the
ions from C16 and (C16)2+60 Da which have similar m/z values. (c) NanoESI mass spectrum of
with C16 in 0.2 M NH4OAc when (C16)2+60 Da was present. = C16, = (C16)2+60 Da,
= , = -C16, = -(C16)2+60 Da.
Chapter 3 The - Interaction
101
While the [M+8H]8+ to [M+6H]6+ ions of C16 and the [M+16H]16+, [M+14H]14+ and
[M+12H]12+ ions of (C16)2+60 Da appear in the spectrum in Figure 3.21 (a), they are
not readily distinguished as a result of the scale of this Figure. In order to clarify the
species present, the ion mobilities of the protein subunits in the sample were analysed
using the travelling wave ion mobility cell of the Synapt HDMSTM. The DriftscopeTM
image in Figure 3.21 (b) shows the arrival time distributions of the C16 and (C16)2+60
Da ions, showing that two conformations or oligomeric assemblies are present for the
m/z values that are similar between the two species.
Figure 3.21 (c) shows the spectrum obtained when was added to this sample of C16
containing (C16)2+60 Da. As expected, the most abundant ions observed correspond
to -C16, with some ions from alone in lower abundance. In addition there were
some unexpected ions at m/z 6039.3, 6272.0, 6525.2 and 6797.1, which gave an
experimental mass of 163035 37 Da (by manually selecting ions, see Section 2.2.12),
corresponding to -C162+68 Da. Given the broadness of these ions, a greater error is
introduced into the mass calculation. The calculated m/z values for -C162+60 Da are
6039.1, 6271.3, 6522.1 and 6793.8.
The observation of as a dimer is not in disagreement with its position in the
replisome. Within Pol III, is present as a dimer, but the dimer interface has been
shown in the X-ray crystal structure to be on the section (Domain III) of the protein
[45]. This portion of the protein is not present in the 16 kDa C-terminal domain of
used here. The results observed here suggest the possibility for involvement of a metal
ion that assists in dimerisation but that interacts with the C-terminus of of . It is not
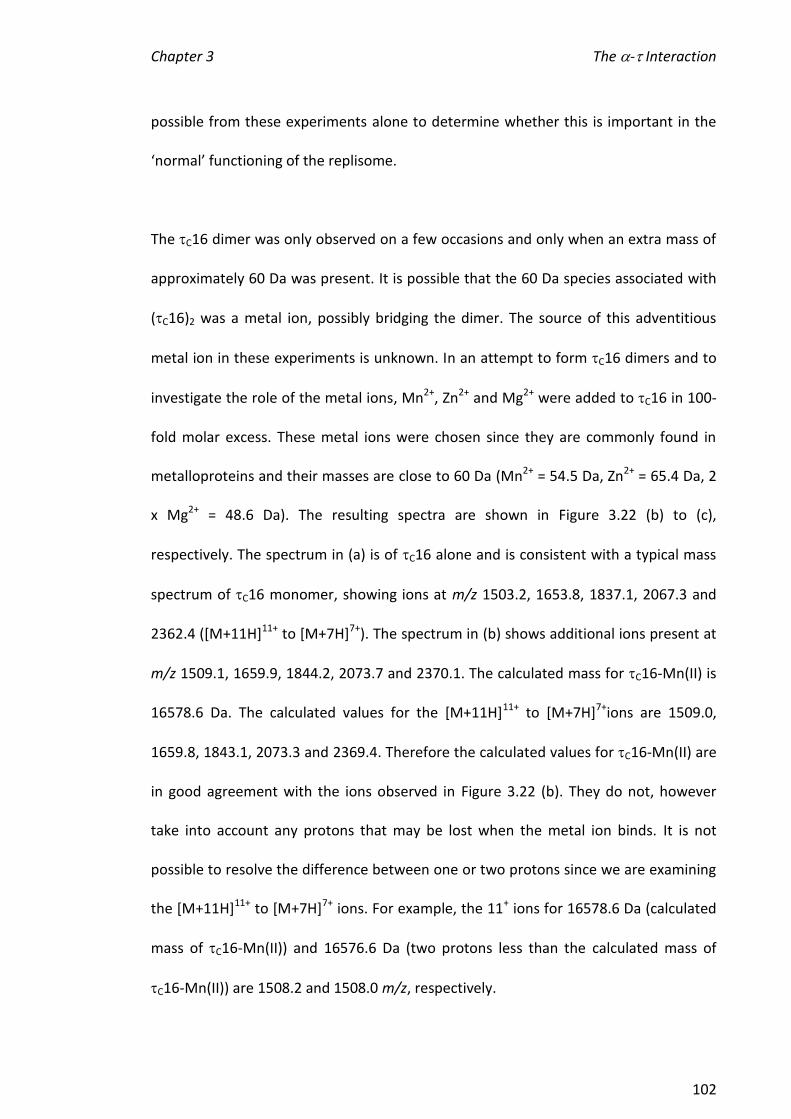
Chapter 3 The - Interaction
102
possible from these experiments alone to determine whether this is important in the
‘normal’ functioning of the replisome.
The C16 dimer was only observed on a few occasions and only when an extra mass of
approximately 60 Da was present. It is possible that the 60 Da species associated with
(C16)2 was a metal ion, possibly bridging the dimer. The source of this adventitious
metal ion in these experiments is unknown. In an attempt to form C16 dimers and to
investigate the role of the metal ions, Mn2+, Zn2+ and Mg2+ were added to C16 in 100-
fold molar excess. These metal ions were chosen since they are commonly found in
metalloproteins and their masses are close to 60 Da (Mn2+ = 54.5 Da, Zn2+ = 65.4 Da, 2
x Mg2+ = 48.6 Da). The resulting spectra are shown in Figure 3.22 (b) to (c),
respectively. The spectrum in (a) is of C16 alone and is consistent with a typical mass
spectrum of C16 monomer, showing ions at m/z 1503.2, 1653.8, 1837.1, 2067.3 and
2362.4 ([M+11H]11+ to [M+7H]7+). The spectrum in (b) shows additional ions present at
m/z 1509.1, 1659.9, 1844.2, 2073.7 and 2370.1. The calculated mass for C16-Mn(II) is
16578.6 Da. The calculated values for the [M+11H]11+ to [M+7H]7+ions are 1509.0,
1659.8, 1843.1, 2073.3 and 2369.4. Therefore the calculated values for C16-Mn(II) are
in good agreement with the ions observed in Figure 3.22 (b). They do not, however
take into account any protons that may be lost when the metal ion binds. It is not
possible to resolve the difference between one or two protons since we are examining
the [M+11H]11+ to [M+7H]7+ ions. For example, the 11+ ions for 16578.6 Da (calculated
mass of C16-Mn(II)) and 16576.6 Da (two protons less than the calculated mass of
C16-Mn(II)) are 1508.2 and 1508.0 m/z, respectively.
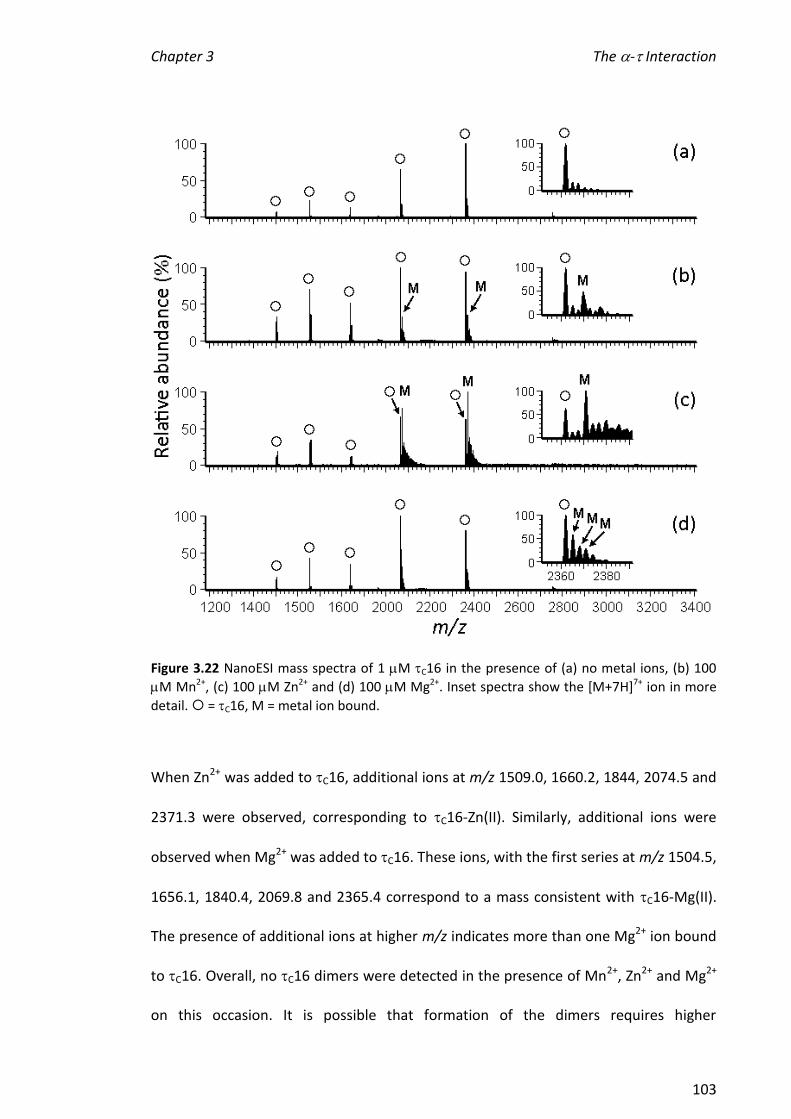
Chapter 3 The - Interaction
103
Figure 3.22 NanoESI mass spectra of 1 M C16 in the presence of (a) no metal ions, (b) 100
M Mn2+, (c) 100 M Zn2+ and (d) 100 M Mg2+. Inset spectra show the [M+7H]7+ ion in more
detail. = C16, M = metal ion bound.
When Zn2+ was added to C16, additional ions at m/z 1509.0, 1660.2, 1844, 2074.5 and
2371.3 were observed, corresponding to C16-Zn(II). Similarly, additional ions were
observed when Mg2+ was added to C16. These ions, with the first series at m/z 1504.5,
1656.1, 1840.4, 2069.8 and 2365.4 correspond to a mass consistent with C16-Mg(II).
The presence of additional ions at higher m/z indicates more than one Mg2+ ion bound
to C16. Overall, no C16 dimers were detected in the presence of Mn2+, Zn2+ and Mg2+
on this occasion. It is possible that formation of the dimers requires higher

Chapter 3 The - Interaction
104
concentrations of C16 (only 1 M here) or that the adventitious metal ion was Cu2+ or
some other metal, not tested in these experiments.
3.4 Summary and Future Directions
Positive ion nanoESI mass spectra of , C16 and the -C16 complex showed that the
predominant ions formed during the electrospray process were the [M+22H]22+,
[M+7H]7+ and [M+23H]23+ ions, respectively. The maximum charge on the ions
observed for each of these proteins/complexes under conditions where they were
expected to be folded was 23+ (Figure 3.6), 9+ (Figure 3.3) and 26+ (Figure 3.6). The
maximum charge (ZR) that can be carried by a folded protein by considering it as a
charged sphere is given by:
ZR = 0.0778 MW (where MW is the molecular weight of the protein) [215]
According to this equation, the estimated maximum number of charges that can be
accommodated by , C16 and the -C16 complex are: 28+, 10+ and 29+. Our
observations are in reasonable agreement with this. Throughout the experiments
described in this Chapter it was often challenging to acquire mass spectra of and
peaks from ions were relatively broad. The charge envelope of ions observed was
relatively small with 3-4 ions observed in the spectra. This suggests that under the
conditions there was very little unfolding of . It cannot be ruled out, however, that a
small amount of unfolding occurred. To overcome this problem when selecting peaks
to use with the Transform software, the ‘average’ ion was selected as long as it was
consistent with the calculated m/z of the ion.
Chapter 3 The - Interaction
105
NanoESI-MS was used to determine the relative binding affinities of different C16
point mutants and truncations towards . The relative order of binding affinities was
consistent with that determined by SPR [137]. This is quite remarkable considering the
different buffers that were used and that the interaction involves multiple
determinants. Dissociation constants were not able to be determined and it was
proposed that one contributing factor was a substantial change in the response factor
of when in a complex with C16. Differences in the binding of the C16 mutant
proteins to were investigated by changing the concentration of NH4OAc. It was
found that the -C16, -C16[I618T] and -C16[L635P] complexes were only
dissociated to a modest extent as the concentration of NH4OAc increased from 0.2 to 2
or 2.5 M. The abundances of the other complexes decreased in the order -
C16[D636G] < -C16[S617P] < -C16[F631I] < -C16[L627P] in the nanoESI mass
spectra, relative to at the highest NH4OAc concentration tested. CID of the various -
C16x complexes enabled dissociation of the complexes but could not discriminate
among the binding of the different C16 protein mutants to .
Hydrogen/deuterium exchange (HDX) experiments were carried out to determine the
number of protons exchanged with time for C16 alone, alone and the -C16
complex. Generally, it would be expected that formation of the -C16 complex might
preclude some protons at the interface from exchanging with solvent. If these protons
were previously exposed to solvent on the individual subunits, then the number of
protons that would be exchanged in the complex would be fewer than for the sum of
the deuterons exchanged for the individual binding partners. The results showed that
more protons exchanged in the complex than for the sum of C16 alone and alone,
suggesting a substantial change in conformation of one or both of the proteins. When
Chapter 3 The - Interaction
106
the -C16 complex was subjected to CID, the number of deuterons on C16 was
similar to that observed when C16 alone was subjected to HDX. This supported the
hypothesis that the extra protons exchanged for the complex above what was
observed for the sum of the individual binding partners were exchanged in .
It is a challenging task to prove that a conformational change occurs in when C16 (or
) binds to give a complex with a mass of 146 kDa. Since ESI ion mobility mass
spectrometry has become available commercially through release of the Synapt
HDMS™ (with a TWIMS mobility cell), ion mobility mass spectrometry which depends
not only on the mass and charge of the protein, but also on its shape, may enable this
conformational change to be detected. For example, if the change is substantial and it
is resolvable by TWIMS, the CCS of or -C16 might deviate significantly from the
linearity of plots of CCS against molecular mass. This possibility is investigated further
in Chapter 5.
An X-ray crystal structure of the -C16 complex is not yet available. The HDX
experiments reported here suggest that a conformational change occurs on binding. It
should be noted, however, that these are difficult experiments. This is, in part, because
some preparations of the subunit were not ‘well-behaved’. For example, the
purification procedure needs to be carried out with haste to avoid proteolysis that
occurs even in experienced hands and where proteolysis inhibitors are included during
the purification. Additionally, it was not possible to determine the mass of this protein
by nanoESI-MS in the presence of formic acid. Under these conditions, the spectra
were of poor quality with low signal to noise ratios and broad peaks. This behaviour at
low pH is problematical for HDX experiments. HDX procedures in which back exchange
Chapter 3 The - Interaction
107
was quenched at low pH were difficult, due to ‘loss’ of . This also puts constraints on
experiments in which the aim is to determine the interaction interface of and C16.
In these experiments, HDX of the complex is allowed to occur, followed by quenching.
Proteolytic cleavage by pepsin (with a low pH optimum) then allows determination of
the peptides from the proteins which have undergone exchange [179].
In order to confirm the observations made here that a greater number of deuterons
were exchanged in the complex than for the sum of the individual binding partners,
the ‘reverse’ experiment [216] will be carried out. That is, each subunit will be
subjected individually to deuterium exchange, the complex will then be prepared from
these samples and the complex will be allowed to exchange back into water. The
number of deuterons that exchange for protons in this second exchange step will
correspond to the extra exchangeable sites (if any) that were exposed when the
complex formed. This experiment requires high concentrations of so that small
volumes of protein can be used to maintain the deuterons at a high percentage in the
first exchange step and a high percentage of protons in the second exchange step.
Given the low availability of for this work and the observation that precipitated at
high concentrations, this confirmatory experiment is also challenging, but is planned
for future work in the laboratory.
These experiments were carried out as part of an investigation into the conditions
under which ESI-MS (and nanoESI-MS) can be applied to study biomolecular
complexes. Furthermore, this was part of a project aimed at understanding the
assembly and dynamics of the E. coli replisome. The nanoESI-MS data reported here
confirm the complexity of the interaction of the C-terminus of (subunit of the clamp
Chapter 3 The - Interaction
108
loader) and (polymerase subunit) and are in agreement with SPR data [137]. Future
experiments will involve addition of other replisomal subunits, metal ions that
modulate activity, and DNA. For example, can a complex of with full-length be
prepared in the absence of other clamp loader subunits? Complexes of the 2 sliding
clamp have recently been prepared in our laboratory and have been shown to bind
simultaneously to and (Blayney and Beck, unpublished results). That is, the clamp
and clamp loader can bind at the same time to ; the clamp loader does not have to
dissociate as the clamp (or at least the subunit) is bound. Experiments are planned to
build a functional replisome by addition of other subunits including others of the
polymerase core ( and ). In some experiments in this thesis, there was evidence that
C16 dimerised by binding to a metal ion. It is unclear if this is relevant in vivo, but
future experiments will involve investigation of a range of metal ions in the presence
of higher concentrations of C16, and other clamp loader subunits.
Chapter 4 Interactions between , , and Metal Ions
109
Chapter 4 Interactions between Epsilon, Theta and Metal Ions
4.1 Introduction
4.1.1 Metalloenzymes
Metalloproteins take part in many important biochemical processes [216]. They have
roles in structure (e.g. calcium in osteopontin), redox processes (e.g. iron in
cytochromes), transportation of oxygen (e.g. iron in haemoglobin), signal transduction
(e.g. calcium in CaM) and enzymatic activity (e.g. zinc in carbonic anhydrase). Some
proteins such as ATPases are only loosely associated with a metal ion cofactor
(magnesium) whereas others are intrinsically part of the metalloprotein structure [217,
218].
Within the group of enzymatic metalloproteins, many are involved in hydrolysis
reactions [217]. In particular, there are many enzymes involved in the hydrolysis of
phosphate ester (phosphatases), phosphate diester (nucleases) and phosphoric
anhydride (ATPases) groups. Phosphatases and nucleases that catalyse the cleavage of
phosphate ester bonds are an important class of enzymes, essential in all organisms. In
order to catalyse hydrolysis reactions, these enzymes utilise functional groups of
amino acids and/or exploit the Lewis acidity of metal ion(s) at their active sites [217].
Many of these enzymes require two metal ions bound to their active site in close
proximity (binuclear centres) in order to be active. It is generally believed that the
phosphorus atom opposite the leaving group of the substrate undergoes nucleophilic
attack, ultimately resulting in stereochemical inversion of the phosphorus [219].
Chapter 4 Interactions between , , and Metal Ions
110
The subunit of E. coli Pol III is an exonuclease; i.e. it hydrolyses phosphate diester
groups of mismatched oligonucleotides. X-ray structures of the exonuclease domain of
(186) show that it is a binuclear metallohydrolase [4]. Some other examples of
metallohydrolases include the intracellular purple acid phosphatase (PAP) containing
an Fe3+Fe2+ centre in mammals and a Fe3+Zn2+ or Fe3+Mn2+ centre in plants [220, 221],
and aminopeptidase, which is involved in protein degradation and amino acid
metabolism with a Zn2+Zn2+ active site [222]. Electron paramagnetic resonance (EPR)
spectra and the pH dependence of the activity of PAP suggest that the nucleophile
responsible for attacking the phosphate group is a hydroxide ion bound to Fe3+ [223].
X-ray structures of red kidney bean PAP revealed that the distance between the Fe3+
and the Zn2+ at the active site is 3.26 Å [224].
Similarly to , the exonuclease active site of Pol I requires two metal ions bound for
activity. Unlike Pol III, however, the polymerase and the exonuclease active sites of Pol
I reside on the same polypeptide (Figure 1.4), although they are spatially separated by
~ 33 Å, allowing them to work independently [225]. The structure and biochemistry of
the Pol I exonuclease has been studied extensively [225-227]. Crystal structures of
product- (e.g. dTMP [228]) bound and substrate- (e.g. ssDNA [229]) bound forms of the
protein have been solved and reveal a two metal ion binding site, with a distance of ~ 4
Å between the two metal ions [230, 231]. The proposed catalytic mechanism, requiring
two metal ions, involves orientation of the phosphate group of the substrate in the
active site by metal ion A (MeA), Glu357 and Tyr497. The MeB activated nucleophile
(effectively hydroxide) then attacks the phosphate which generates a pentacoordinate
transition state, stabilised by both metal ions. Finally, the negative charge on the
oxygen is stabilised by MeB, facilitating it to leave the phosphate. The native metal ion
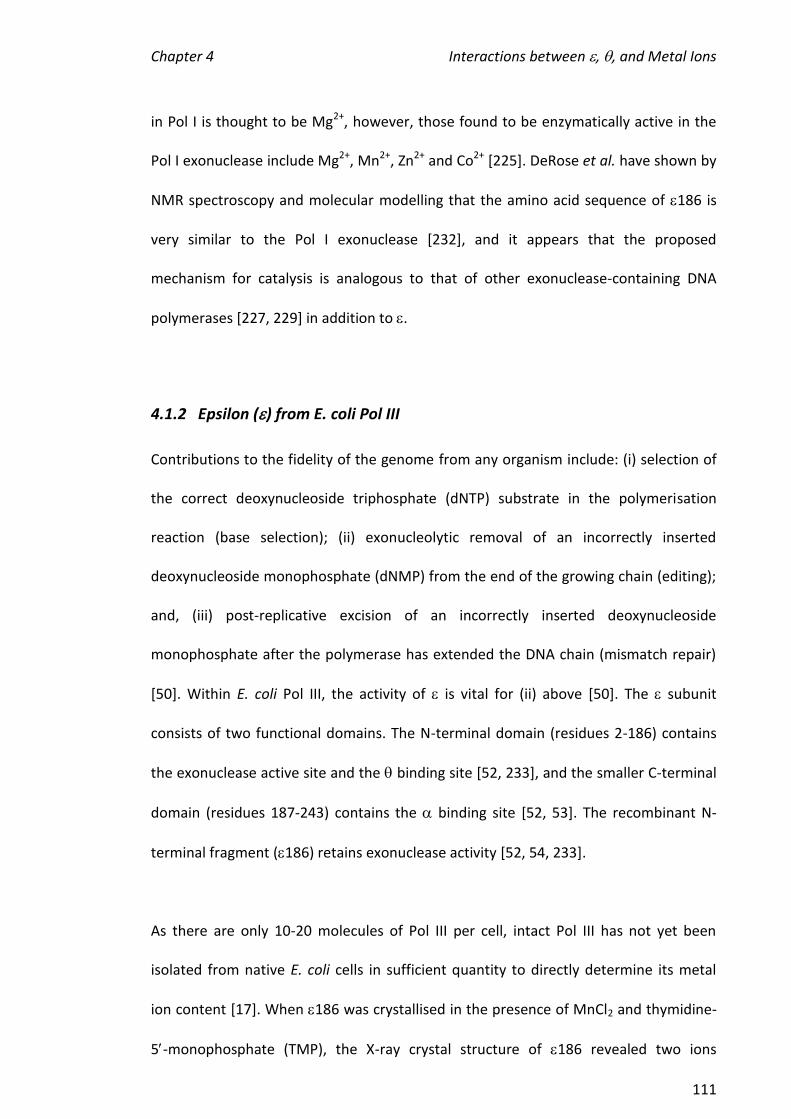
Chapter 4 Interactions between , , and Metal Ions
111
in Pol I is thought to be Mg2+, however, those found to be enzymatically active in the
Pol I exonuclease include Mg2+, Mn2+, Zn2+ and Co2+ [225]. DeRose et al. have shown by
NMR spectroscopy and molecular modelling that the amino acid sequence of 186 is
very similar to the Pol I exonuclease [232], and it appears that the proposed
mechanism for catalysis is analogous to that of other exonuclease-containing DNA
polymerases [227, 229] in addition to .
4.1.2 Epsilon () from E. coli Pol III
Contributions to the fidelity of the genome from any organism include: (i) selection of
the correct deoxynucleoside triphosphate (dNTP) substrate in the polymerisation
reaction (base selection); (ii) exonucleolytic removal of an incorrectly inserted
deoxynucleoside monophosphate (dNMP) from the end of the growing chain (editing);
and, (iii) post-replicative excision of an incorrectly inserted deoxynucleoside
monophosphate after the polymerase has extended the DNA chain (mismatch repair)
[50]. Within E. coli Pol III, the activity of is vital for (ii) above [50]. The subunit
consists of two functional domains. The N-terminal domain (residues 2-186) contains
the exonuclease active site and the binding site [52, 233], and the smaller C-terminal
domain (residues 187-243) contains the binding site [52, 53]. The recombinant N-
terminal fragment (186) retains exonuclease activity [52, 54, 233].
As there are only 10-20 molecules of Pol III per cell, intact Pol III has not yet been
isolated from native E. coli cells in sufficient quantity to directly determine its metal
ion content [17]. When 186 was crystallised in the presence of MnCl2 and thymidine-
5-monophosphate (TMP), the X-ray crystal structure of 186 revealed two ions
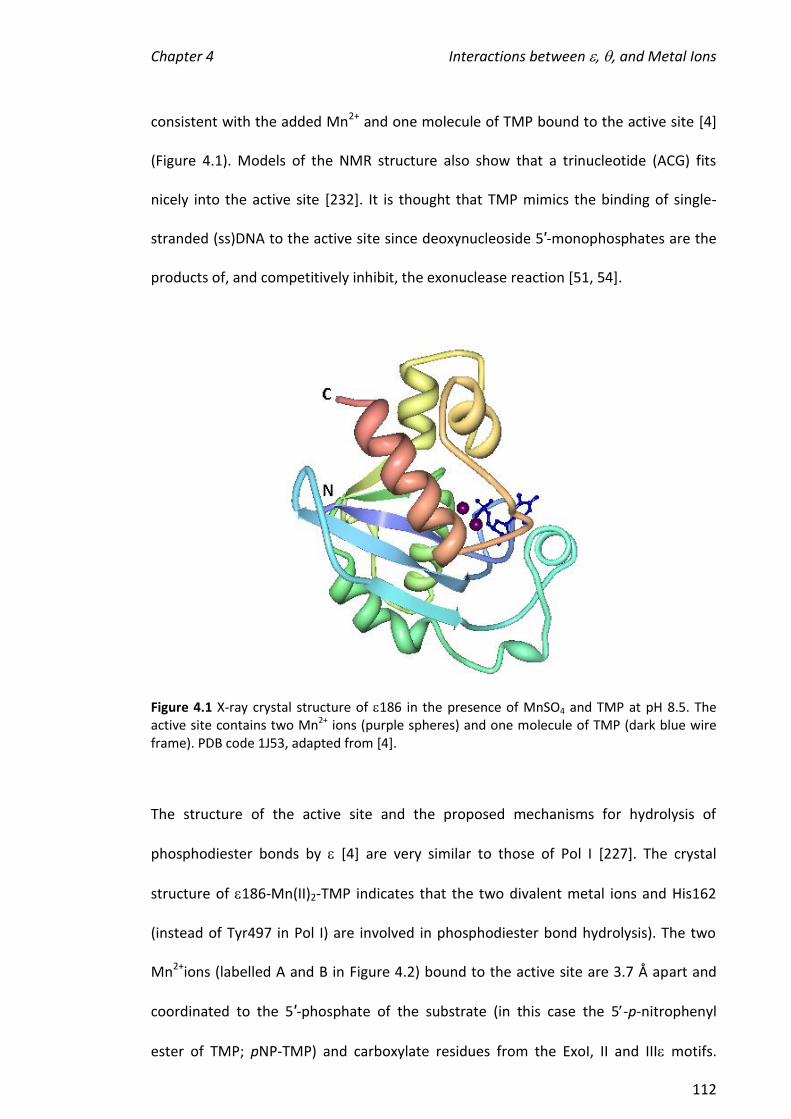
Chapter 4 Interactions between , , and Metal Ions
112
consistent with the added Mn2+ and one molecule of TMP bound to the active site [4]
(Figure 4.1). Models of the NMR structure also show that a trinucleotide (ACG) fits
nicely into the active site [232]. It is thought that TMP mimics the binding of single-
stranded (ss)DNA to the active site since deoxynucleoside 5′-monophosphates are the
products of, and competitively inhibit, the exonuclease reaction [51, 54].
Figure 4.1 X-ray crystal structure of 186 in the presence of MnSO4 and TMP at pH 8.5. The active site contains two Mn2+ ions (purple spheres) and one molecule of TMP (dark blue wire frame). PDB code 1J53, adapted from [4].
The structure of the active site and the proposed mechanisms for hydrolysis of
phosphodiester bonds by [4] are very similar to those of Pol I [227]. The crystal
structure of 186-Mn(II)2-TMP indicates that the two divalent metal ions and His162
(instead of Tyr497 in Pol I) are involved in phosphodiester bond hydrolysis). The two
Mn2+ions (labelled A and B in Figure 4.2) bound to the active site are 3.7 Å apart and
coordinated to the 5′-phosphate of the substrate (in this case the 5-p-nitrophenyl
ester of TMP; pNP-TMP) and carboxylate residues from the ExoI, II and III motifs.
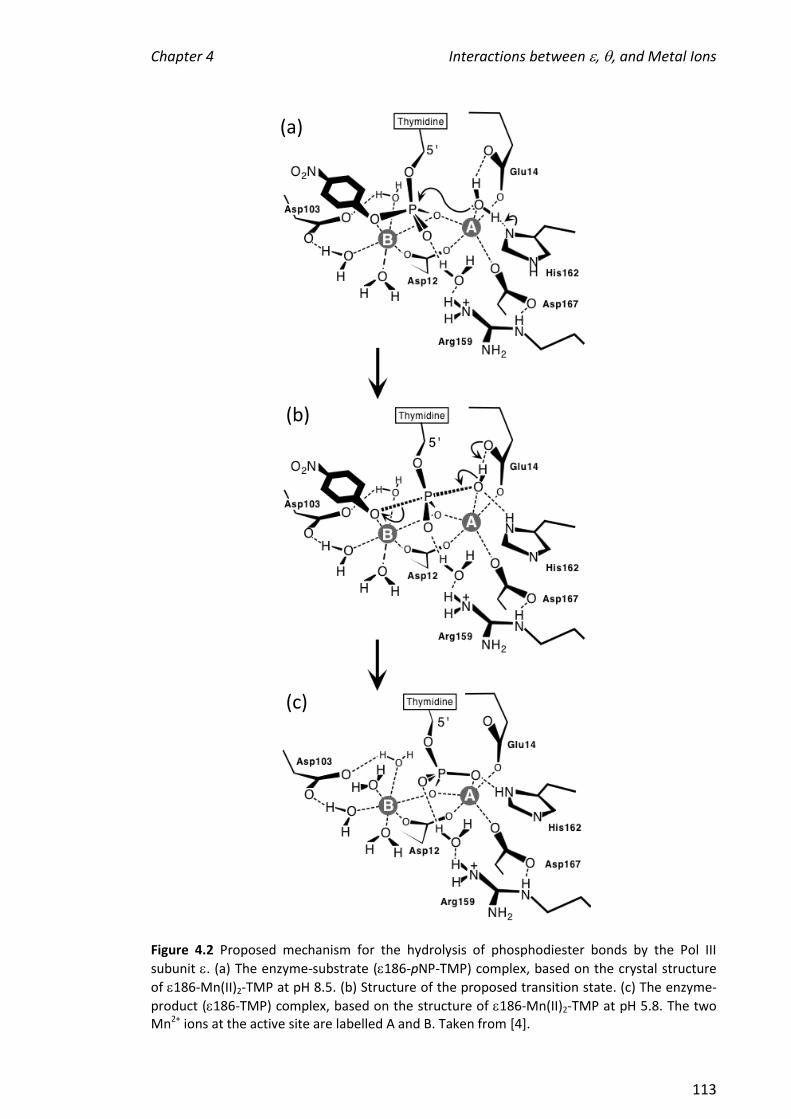
Chapter 4 Interactions between , , and Metal Ions
113
Figure 4.2 Proposed mechanism for the hydrolysis of phosphodiester bonds by the Pol III
subunit . (a) The enzyme-substrate (186-pNP-TMP) complex, based on the crystal structure
of 186-Mn(II)2-TMP at pH 8.5. (b) Structure of the proposed transition state. (c) The enzyme-
product (186-TMP) complex, based on the structure of 186-Mn(II)2-TMP at pH 5.8. The two Mn2+ ions at the active site are labelled A and B. Taken from [4].
(a)
(b)
(c)
Chapter 4 Interactions between , , and Metal Ions
114
The inner Mn2+ (MnA) ion is also coordinated to Glu14 and Asp167. The authors of this
work suggested that the mechanism is as follows. The P-O bond is polarised by both
metal ions, causing orientation of the phosphate group, allowing in-line attack by the
MnA-coordinated hydroxide ion. The basic His162 residue generates the hydroxide ion
by deprotonating a water molecule. The MnB ion is then coordinated to the 3-oxygen
of the ester in a five-coordinate phosphorane intermediate (or transition state),
assisting in labilising the bond to the 3-OH group. This reaction mechanism is
consistent with quantum mechanics/molecular mechanics calculations by Cisneros et
al. [234].
4.1.3 Techniques for Investigating Metalloproteins
Structural methods such as X-ray crystallography and NMR spectroscopy are useful for
locating the metal ion binding site of metalloproteins [216]. Methods commonly used
to analyse the metal content/identity of proteins include inductively coupled plasma
(ICP) [235], atomic absorption spectroscopy (AAS) [236], atomic emission spectroscopy
(AES) [237], EPR [238] and fluorescence spectroscopy [239]. ICP, AAS and AES are
excellent at determining the average metal content of biological samples, and EPR and
fluorescence spectroscopy can be used to obtain equilibrium data on protein-metal ion
binding. EPR can also be used to determine the oxidation state of metal ions and to
identify their extent of interaction in a binuclear centre [216]. The direct mass
measurement ability of MS, however, makes this a useful tool in determining
stoichiometries of protein-metal complexes.
Chapter 4 Interactions between , , and Metal Ions
115
Mass spectrometry, in particular ESI-MS, can be used to perform three main types of
experiments on metalloproteins: (i) direct observation and characterisation of protein-
metal interactions, (ii) metalloprotein dynamics, and (iii) investigations of
metalloprotein function [216]. The stoichiometry of a metalloprotein can be
determined by acquisition of an ESI mass spectrum of the apo- and the holo- protein,
with the shift in m/z revealing the mass difference and therefore the number of metal
ion(s) bound to the protein. For example, Veenstra and co-workers confirmed that the
rat brain protein calbindin D28K contains four Ca2+ binding sites using ESI-MS [240].
They were also able to narrow the location of the binding sites down to ‘EF hand’
domains using mutant forms of the protein. The dynamics of metalloproteins can be
probed using ESI-MS since the charge-state pattern in a mass spectrum can reveal the
extent to which a protein is folded (folded proteins contain fewer charges than their
unfolded counterparts, as discussed in Section 3.3.2), and a shift in mass can
determine if this is related to metal binding. For example, a study of bovine carbonic
anhydrase 2 revealed that pH dependant conformational states were coupled to Zn2+
release and uptake [241]. Finally, functional studies aim to determine properties
conferred on a metalloprotein when the metal is bound as opposed to when it is
present as the apoprotein. For example, the repressor metalloprotein NikR from E. coli
is a fully functional tetramer in its apo- or holo-form but can only form a stable
interaction with its dsDNA substrate when it is associated with Ni2+ [242].
4.2 Scope of this Chapter
Our laboratory has previously used ESI-MS to study the hydrophobic interaction
between 186 and θ [243]. The 186 protein has been used in the previous and current

Chapter 4 Interactions between , , and Metal Ions
116
work as it is more thermally stable than full-length and retains the metal ion and
binding sites. It is known that and 186 are more active in the presence of Mn2+,
compared to Mg2+ [54, 234], and in this chapter the complexes of 186 with these
metal ions, along with Zn2+, Fe2+, Cu2+ and Dy3+ were investigated. The cofactors are
common to other phosphoryl-transfer enzymes such as alkaline phosphatase (Zn2+)
[244] and PAP (Fe3+, Mn2+, Zn2+) [220] and Dy3+ has previously been used in NMR
experiments aimed at determining aspects of the structure of 186 [35]. The binding of
the metal ions to 186 was investigated to determine the utility of ESI-MS in
investigating the stoichiometry of binding and to determine the effect of the addition
of TMP, a mimic of its natural substrate, ssDNA (Figure 4.3).
O
O
CH2
PO
O
O-
CH2O
O
PO
O
O-
CH2
Base
Base
OBase
O
O
P
O
OO
OCH2
O
P
OH
OO
OH
Base
NH
NH
O
O
(a) (b)
(c)
Figure 4.3 Structural similarities between the natural substrate of (ssDNA) and the substrate
mimic (TMP) used in this work. (a) Structure of ssDNA showing three nucleotides from 5 to 3 (top to bottom). The bases can be adenine, guanine, cytosine or thymine. (b) Structure of a TMP molecule where the base is thymine. (c) Structure of the base thymine.
Chapter 4 Interactions between , , and Metal Ions
117
Furthermore, the binding stoichiometry observed by ESI-MS was compared against the
activity of 186 in the presence of metal ions in assays where the substrate was pNP-
TMP. The effect of adding θ was also investigated, as it is a binding partner of which
has no known enzyme activity [48], but is thought to stabilise [49]. Various studies
have shown that the effect of on the in vitro activity of and 186 is modest, with
some disagreement as to whether there is a stimulatory or inhibitory effect. Studwell-
Vaughan and O'Donnell found that had a modest three-fold stimulation on the
excision of a mismatched T-G basepair by [48] and Taft-Benz and Schaaper showed,
using yeast two- and three-hybrid assays, that θ could counteract the instability of
dnaQ mutants that were originally unable to bind to [49]. Lehtinen and Perrino
showed that the addition of to had little measurable effect on the exonuclease
activity using 32P labelled partial duplex DNA as substrate [245], while Hamdan et al.
measured a small inhibitory effect of on activity [54]. The 186- complex had a KM
and kcat for pNP-TMP hydrolysis (pH 8.0) of 1.51 mM and 215 min-1, respectively. The
corresponding values for 186 were 1.08 mM and 293 min-1. These values are
measured again here in the presence of various metal ions.
4.3 Results and Discussion
4.3.1 Preliminary Experiments
The work described in this chapter continues from preliminary experiments performed
in our laboratory. Initially, conditions were developed for obtaining ESI mass spectra of
186, and 186-θ *50+. Given that the crystal structure of 186 showed that two Mn2+
ions were bound to its active site (where MnSO4 was added to crystallisation mixtures)
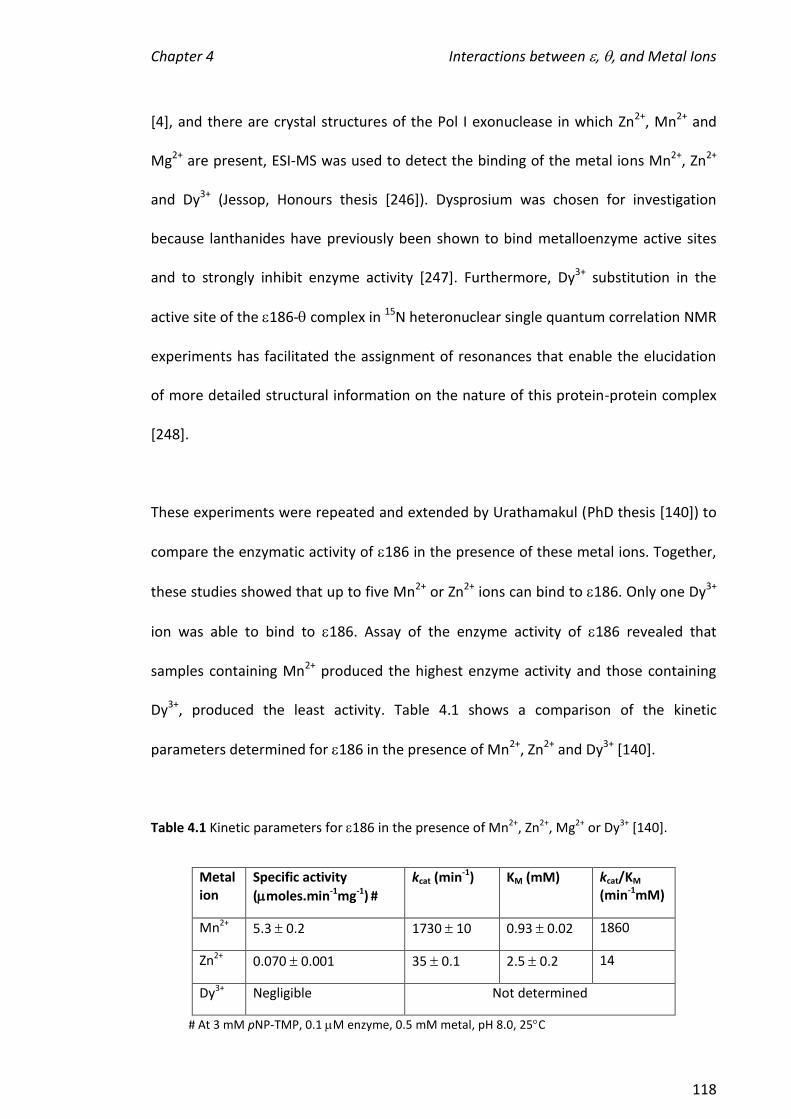
Chapter 4 Interactions between , , and Metal Ions
118
[4], and there are crystal structures of the Pol I exonuclease in which Zn2+, Mn2+ and
Mg2+ are present, ESI-MS was used to detect the binding of the metal ions Mn2+, Zn2+
and Dy3+ (Jessop, Honours thesis [246]). Dysprosium was chosen for investigation
because lanthanides have previously been shown to bind metalloenzyme active sites
and to strongly inhibit enzyme activity [247]. Furthermore, Dy3+ substitution in the
active site of the 186- complex in 15N heteronuclear single quantum correlation NMR
experiments has facilitated the assignment of resonances that enable the elucidation
of more detailed structural information on the nature of this protein-protein complex
[248].
These experiments were repeated and extended by Urathamakul (PhD thesis [140]) to
compare the enzymatic activity of 186 in the presence of these metal ions. Together,
these studies showed that up to five Mn2+ or Zn2+ ions can bind to 186. Only one Dy3+
ion was able to bind to 186. Assay of the enzyme activity of 186 revealed that
samples containing Mn2+ produced the highest enzyme activity and those containing
Dy3+, produced the least activity. Table 4.1 shows a comparison of the kinetic
parameters determined for 186 in the presence of Mn2+, Zn2+ and Dy3+ [140].
Table 4.1 Kinetic parameters for 186 in the presence of Mn2+, Zn2+, Mg2+ or Dy3+ [140].
Metal ion
Specific activity
(moles.min-1mg-1) #
kcat (min-1) KM (mM) kcat/KM
(min-1mM)
Mn2+ 5.3 0.2 1730 10 0.93 0.02 1860
Zn2+ 0.070 0.001 35 0.1 2.5 0.2 14
Dy3+ Negligible Not determined
# At 3 mM pNP-TMP, 0.1 M enzyme, 0.5 mM metal, pH 8.0, 25C
Chapter 4 Interactions between , , and Metal Ions
119
This is the first time that Michalis-Menten kinetic parameters were determined for
186 in the presence of Zn2+. The KM value shown in Table 4.1 when Mn2+ was present
was very similar to that determined in previous work (0.93 here cf. 1.08 mM [54]). The
kcat differed substantially (1730 here cf. 293 min-1 [54]). This may be the result of
different buffers used in the two experiments.
4.3.2 Obtaining ESI Mass Spectra of 186
Conditions were previously established in our laboratory for the acquisition of mass
spectra of 186 [243], confirming the thermal instability of 186. Consequently in this
work, before each set of experiments was performed, a mass spectrum of 186 (2 M)
was acquired. The acquisition of high quality spectra confirmed that 186 had
remained in solution during the preparation (dialysis) procedure. Figure 4.4 (a) shows a
typical ESI mass spectrum of 186 containing ions corresponding to the [M+8H]8+,
[M+9H]9+ and [M+10H]10+ ions of 186 at m/z 2574.6, 2288.6 and 2059.9, respectively.
This was particularly important to confirm since is not a stable protein [49, 52] and it
was observed that 186 became unfolded after extended amounts of time in NH4OAc
as shown in Figure 4.4 (b). Further, in some experiments, metal ions were bound to the
protein (see also Section 4.3.3) and were traced to the syringe used for sample
injection. It was important to ensure that no metal ions were present prior to
experiments aimed at testing metal ion binding to 186. It was found that rinsing the
sample tubing with 2% AcOH then water, described in Section 2.2.5, prevented adduct
formation in the spectra. Figure 4.4 (c) shows the mass spectrum in (a) transformed to
a mass scale. Here, the single peak at 20589 2 Da corresponds to the calculated mass
of 186 (Mr = 20586.9 Da), based on the amino acid sequence [52]. The very low
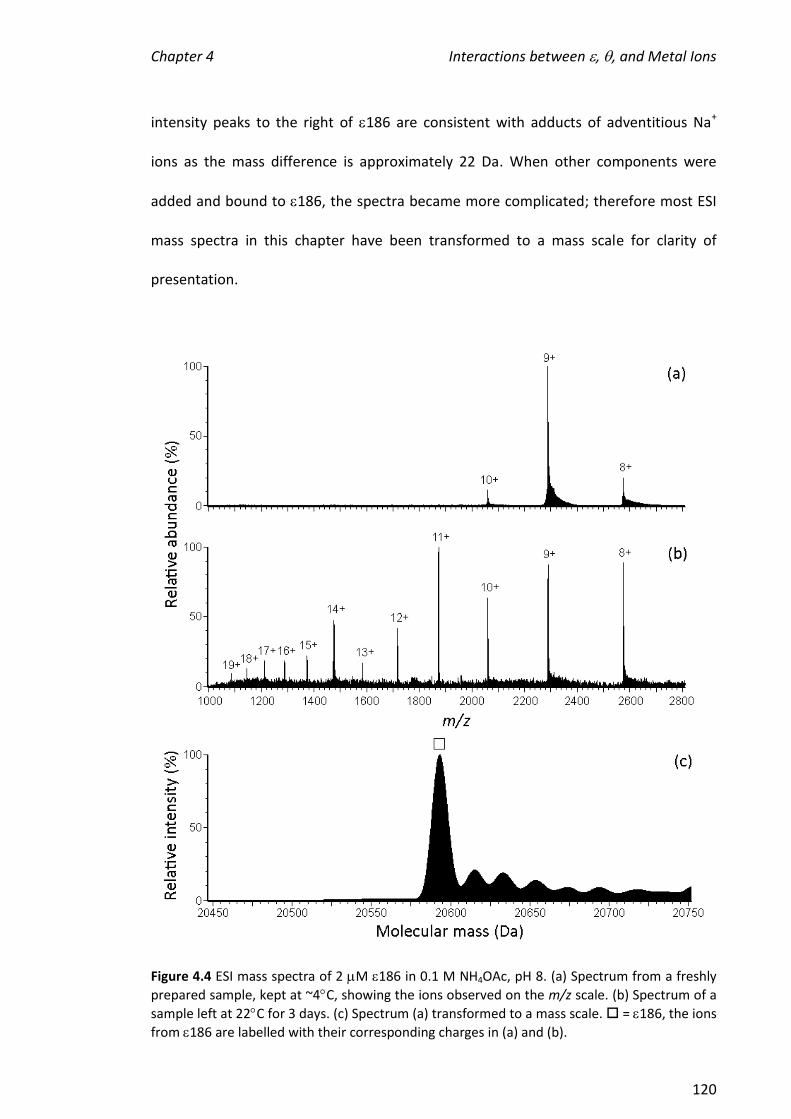
Chapter 4 Interactions between , , and Metal Ions
120
intensity peaks to the right of 186 are consistent with adducts of adventitious Na+
ions as the mass difference is approximately 22 Da. When other components were
added and bound to 186, the spectra became more complicated; therefore most ESI
mass spectra in this chapter have been transformed to a mass scale for clarity of
presentation.
Figure 4.4 ESI mass spectra of 2 M 186 in 0.1 M NH4OAc, pH 8. (a) Spectrum from a freshly
prepared sample, kept at ~4C, showing the ions observed on the m/z scale. (b) Spectrum of a
sample left at 22C for 3 days. (c) Spectrum (a) transformed to a mass scale. = 186, the ions
from 186 are labelled with their corresponding charges in (a) and (b).
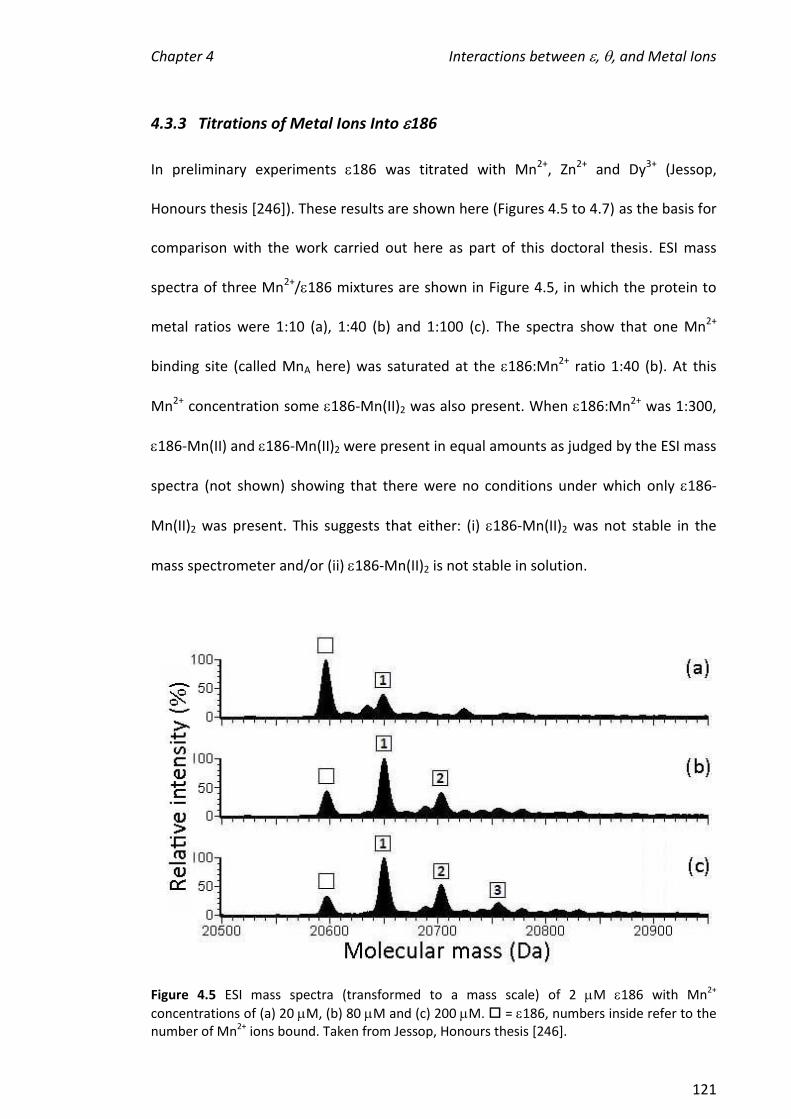
Chapter 4 Interactions between , , and Metal Ions
121
4.3.3 Titrations of Metal Ions Into 186
In preliminary experiments 186 was titrated with Mn2+, Zn2+ and Dy3+ (Jessop,
Honours thesis [246]). These results are shown here (Figures 4.5 to 4.7) as the basis for
comparison with the work carried out here as part of this doctoral thesis. ESI mass
spectra of three Mn2+/186 mixtures are shown in Figure 4.5, in which the protein to
metal ratios were 1:10 (a), 1:40 (b) and 1:100 (c). The spectra show that one Mn2+
binding site (called MnA here) was saturated at the 186:Mn2+ ratio 1:40 (b). At this
Mn2+ concentration some 186-Mn(II)2 was also present. When 186:Mn2+ was 1:300,
186-Mn(II) and 186-Mn(II)2 were present in equal amounts as judged by the ESI mass
spectra (not shown) showing that there were no conditions under which only 186-
Mn(II)2 was present. This suggests that either: (i) 186-Mn(II)2 was not stable in the
mass spectrometer and/or (ii) 186-Mn(II)2 is not stable in solution.
Figure 4.5 ESI mass spectra (transformed to a mass scale) of 2 M 186 with Mn2+
concentrations of (a) 20 M, (b) 80 M and (c) 200 M. = 186, numbers inside refer to the number of Mn2+ ions bound. Taken from Jessop, Honours thesis [246].
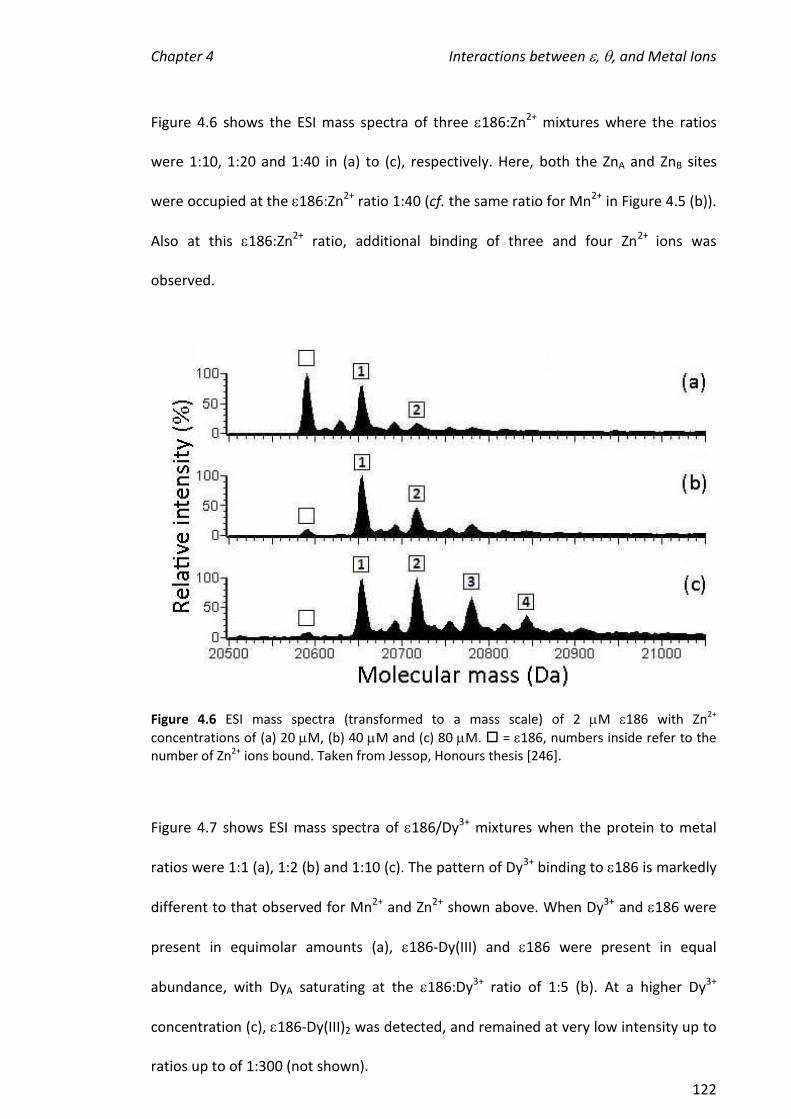
Chapter 4 Interactions between , , and Metal Ions
122
Figure 4.6 shows the ESI mass spectra of three 186:Zn2+ mixtures where the ratios
were 1:10, 1:20 and 1:40 in (a) to (c), respectively. Here, both the ZnA and ZnB sites
were occupied at the 186:Zn2+ ratio 1:40 (cf. the same ratio for Mn2+ in Figure 4.5 (b)).
Also at this 186:Zn2+ ratio, additional binding of three and four Zn2+ ions was
observed.
Figure 4.6 ESI mass spectra (transformed to a mass scale) of 2 M 186 with Zn2+
concentrations of (a) 20 M, (b) 40 M and (c) 80 M. = 186, numbers inside refer to the number of Zn2+ ions bound. Taken from Jessop, Honours thesis [246].
Figure 4.7 shows ESI mass spectra of 186/Dy3+ mixtures when the protein to metal
ratios were 1:1 (a), 1:2 (b) and 1:10 (c). The pattern of Dy3+ binding to 186 is markedly
different to that observed for Mn2+ and Zn2+ shown above. When Dy3+ and 186 were
present in equimolar amounts (a), 186-Dy(III) and 186 were present in equal
abundance, with DyA saturating at the 186:Dy3+ ratio of 1:5 (b). At a higher Dy3+
concentration (c), 186-Dy(III)2 was detected, and remained at very low intensity up to
ratios up to of 1:300 (not shown).
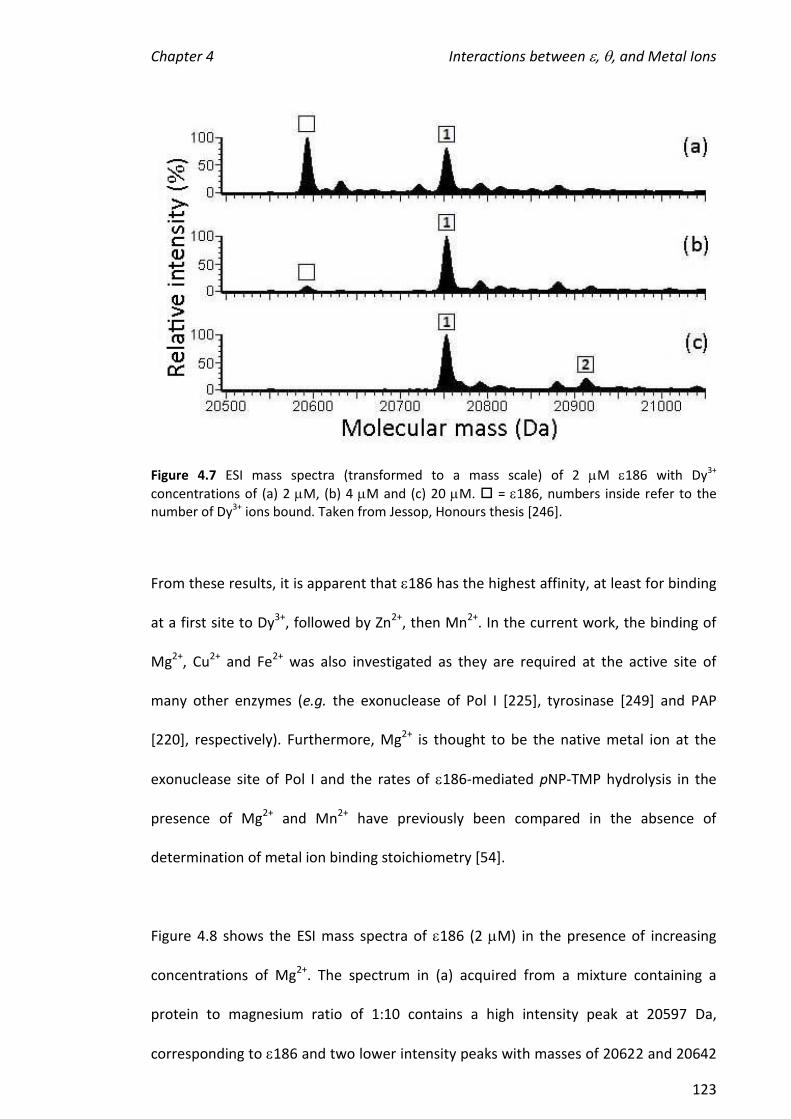
Chapter 4 Interactions between , , and Metal Ions
123
Figure 4.7 ESI mass spectra (transformed to a mass scale) of 2 M 186 with Dy3+
concentrations of (a) 2 M, (b) 4 M and (c) 20 M. = 186, numbers inside refer to the number of Dy3+ ions bound. Taken from Jessop, Honours thesis [246].
From these results, it is apparent that 186 has the highest affinity, at least for binding
at a first site to Dy3+, followed by Zn2+, then Mn2+. In the current work, the binding of
Mg2+, Cu2+ and Fe2+ was also investigated as they are required at the active site of
many other enzymes (e.g. the exonuclease of Pol I [225], tyrosinase [249] and PAP
[220], respectively). Furthermore, Mg2+ is thought to be the native metal ion at the
exonuclease site of Pol I and the rates of 186-mediated pNP-TMP hydrolysis in the
presence of Mg2+ and Mn2+ have previously been compared in the absence of
determination of metal ion binding stoichiometry [54].
Figure 4.8 shows the ESI mass spectra of 186 (2 M) in the presence of increasing
concentrations of Mg2+. The spectrum in (a) acquired from a mixture containing a
protein to magnesium ratio of 1:10 contains a high intensity peak at 20597 Da,
corresponding to 186 and two lower intensity peaks with masses of 20622 and 20642
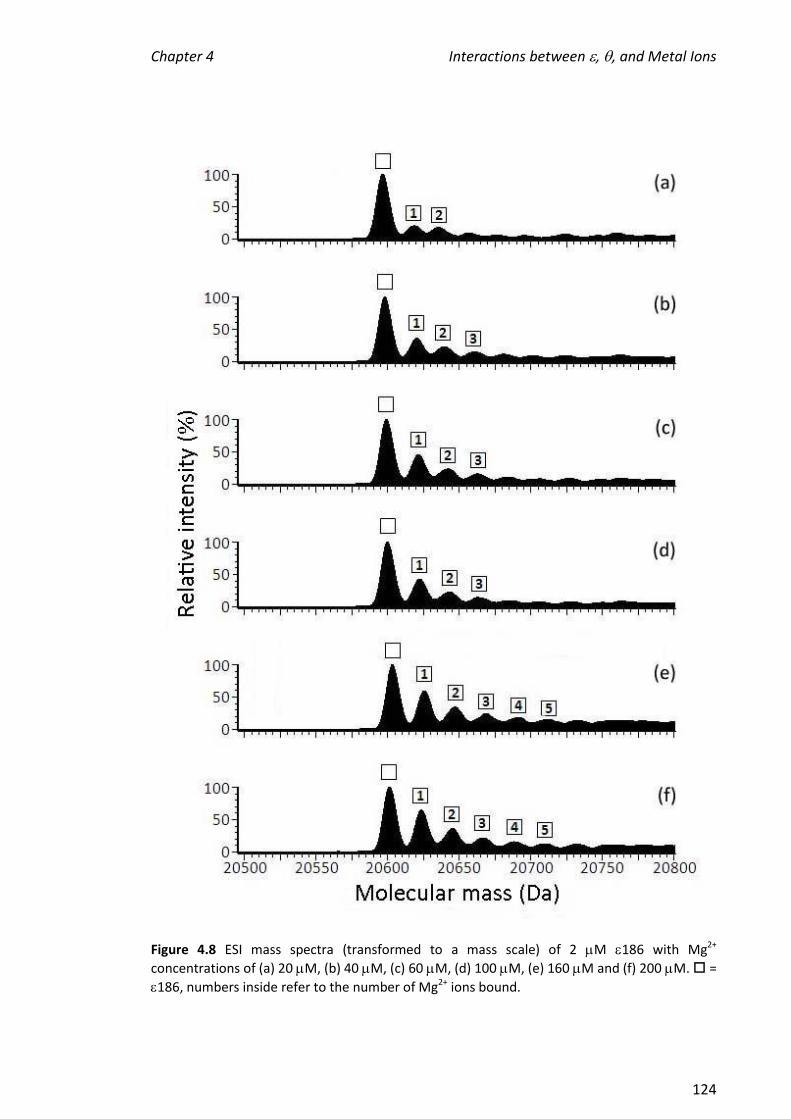
Chapter 4 Interactions between , , and Metal Ions
124
Figure 4.8 ESI mass spectra (transformed to a mass scale) of 2 M 186 with Mg2+
concentrations of (a) 20 M, (b) 40 M, (c) 60 M, (d) 100 M, (e) 160 M and (f) 200 M. =
186, numbers inside refer to the number of Mg2+ ions bound.
Chapter 4 Interactions between , , and Metal Ions
125
Da. Note that the peaks are broad in all the mass spectra presented on a mass scale in
this chapter. The mass at the centre of the peak for 186 alone is 20597 Da. The
calculated mass for 186 is 20587 Da. The broadness of the peak arises from errors in
the m/z values for ions selected by the transform software, but also from the
broadness of peaks from ions themselves. This is because under native conditions,
water and salts are retained in the structure. The leading edge of the peak for 186
alone (lower m/z side) corresponds to the calculated mass for 186. The peaks at
masses higher than 186 in Figure 4.8 (a) correspond to 186 bound to one and two
Mg2+ ions, 186-Mg(II) and 186-Mg(II)2, respectively. The appearance of 186-Mg(II)3
(20662 Da) occurs in the 1:20 186:Mn2+ mixture (b), that of 186-Mg(II)4 (20683 Da)
occurs at 1:80 (e), as does 186-Mg(II)5 (20708 Da) in (f). At this high Mg2+
concentration (200 M) there was little change in the metal binding, with 186
remaining as the predominant peak in the spectrum. This indicates that not even one
of the metal ion binding sites has become saturated with Mg2+ implying 186 has a low
affinity towards magnesium. It is possible that Mg2+ binds non-specifically to 186
(remote from the native metal-ion binding site) and these electrostatic interactions are
encouraged in the ESI source [250].
Figure 4.9 shows the ESI mass spectra of 186 (2 M) in the presence of increasing
concentrations of Cu2+. The spectrum in (a) with protein to metal ratio of 1:2 contains a
high intensity peak, corresponding to 186. The spectrum also contains two lower
intensity peaks with masses of 20663 and 20729 Da, corresponding to 186 bound to
one and two Cu2+ ions (63.5 Da), respectively. Note that as a result of the broadness of
these peaks and the low signal-to-noise ratio, there is substantial error in the masses
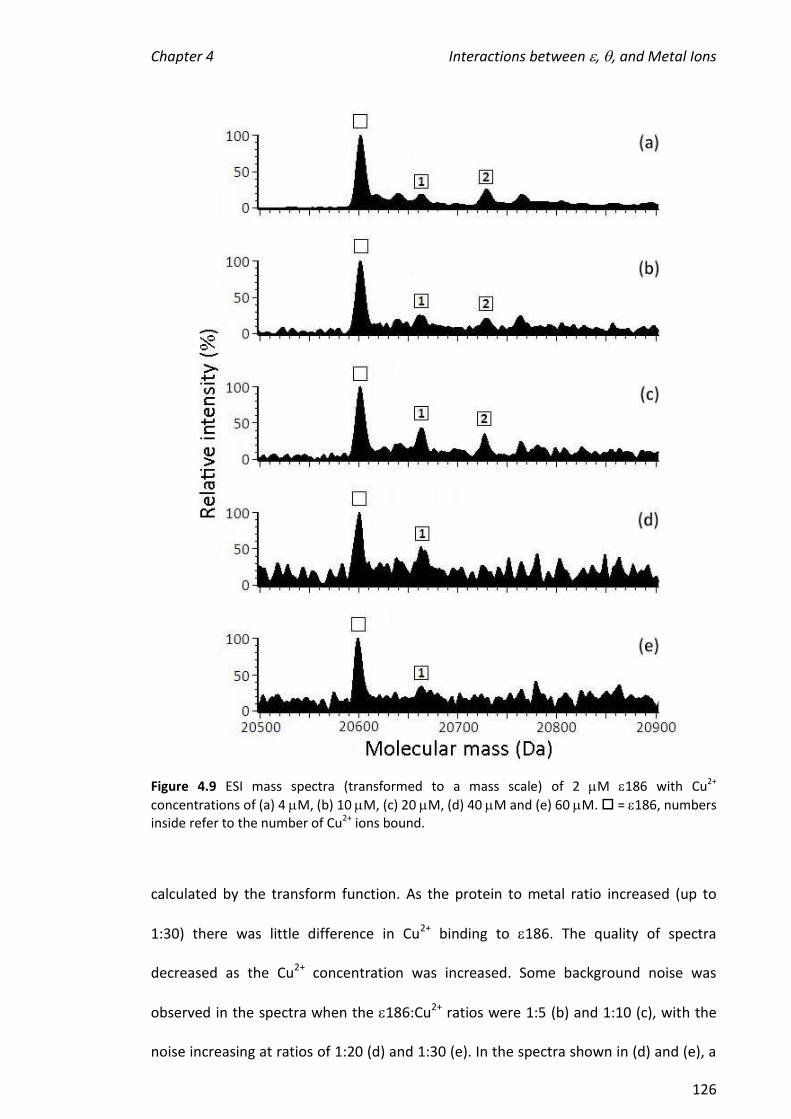
Chapter 4 Interactions between , , and Metal Ions
126
Figure 4.9 ESI mass spectra (transformed to a mass scale) of 2 M 186 with Cu2+
concentrations of (a) 4 M, (b) 10 M, (c) 20 M, (d) 40 M and (e) 60 M. = 186, numbers inside refer to the number of Cu2+ ions bound.
calculated by the transform function. As the protein to metal ratio increased (up to
1:30) there was little difference in Cu2+ binding to 186. The quality of spectra
decreased as the Cu2+ concentration was increased. Some background noise was
observed in the spectra when the 186:Cu2+ ratios were 1:5 (b) and 1:10 (c), with the
noise increasing at ratios of 1:20 (d) and 1:30 (e). In the spectra shown in (d) and (e), a
Chapter 4 Interactions between , , and Metal Ions
127
distinct 186-Cu(II)2 peak was not observed. Mass spectra of 186 in the presence of
higher copper concentrations were acquired but were of poor quality due to the low
signal-to-noise ratio (not shown). Although the same Cu2+ concentrations were not
able to be reached compared with Mg2+, 186 appears to have a lower affinity for Cu2+
than Mg2+. For example, in the spectrum where the protein to copper ratio is 1:30 (e),
186 predominates with a small amount of 186-Cu(II), while in the spectrum at the
protein to magnesium ratio of 1:30 in Figure 4.8 (c), 186 was the most abundant with
small amounts of 186 bound to one, two and three Mg2+ ions. This binding of Cu2+ at
additional sites may reflect non-specific binding at acidic residues.
On closer inspection of the spectra of solutions containing 186 and copper, it was
observed that the ion intensity of the 186 peak decreased as the Cu2+ concentration
increased, as shown in Figure 4.10. A possible explanation for this is that the Cu2+ was
binding non-specifically to the protein and consequently precipitating or aggregating it
to a form that was not readily amenable to electrospray. A number of studies have also
found that other proteins precipitate in the presence of high copper concentrations
[251, 252]. In a study investigating different chelating agents, Lee et al. found that
when titrated into bovine serum albumin (BSA), copper precipitated the BSA at protein
to metal ratios around 1:6. The results with 186 and copper were quite similar
(assuming the decrease in ion intensity of 186 correlates with precipitation) with a
substantial drop in the ion count of 186 when the protein to copper ratio is 1:5 (10
M copper).

Chapter 4 Interactions between , , and Metal Ions
128
Figure 4.10 Average ion count for 186 from ESI mass spectra of 2 M 186 with increasing concentrations of Cu2+ (measured twice for each Cu2+ concentration).
Further evidence that copper was adversely affecting the native structure of 186 in
some way is evidenced by comparing the ions observed in the mass spectra of
solutions containing 186 in the presence and absence of Cu2+. For example, Figure
4.11 (a) shows the typical charge state series of 186, from [M+10H]10+ to [M+8H]8+
which was retained upon binding of the other metal ions (Mn2+, Mg2+, Dy3+, Zn2+ and
Fe2+) investigated in this study. The spectrum of 186 in (b) however, where 20 M
Cu2+ is present, shows a wider range of charge states, from [M+18H]18+ to [M+8H]8+,
indicating 186 has become at least partially unfolded. This phenomenon has been
discussed in Section 3.3.2 and in the references [184-186].
Figure 4.12 shows the ESI mass spectra of 186 in the presence of increasing
concentrations of Fe2+. The mass spectra acquired for the protein to metal ratios of
1:5, 1:10, 1:20, 1:40 and 1:100 are shown in (a) to (e), respectively. At the lowest Fe2+
0
50
100
150
200
250
300
350
0 10 20 30 40 50 60
Ave
rage
ion
co
un
t o
f 1
86
Copper concentration (M)
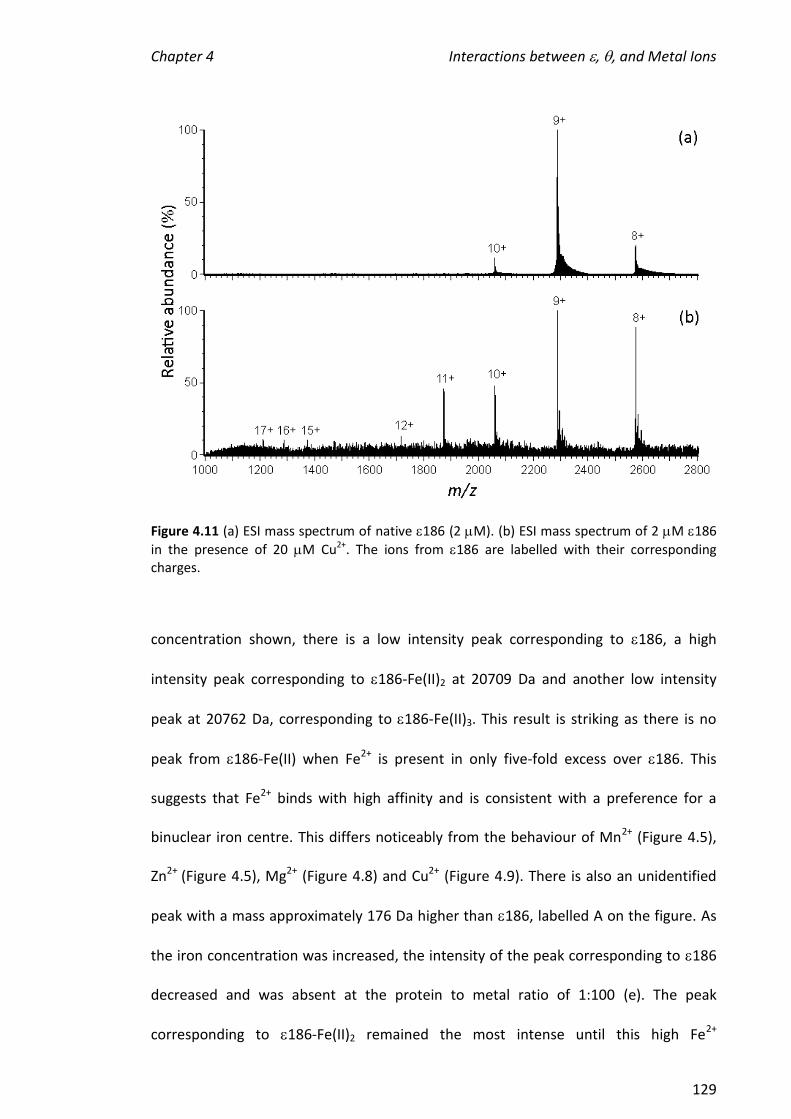
Chapter 4 Interactions between , , and Metal Ions
129
Figure 4.11 (a) ESI mass spectrum of native 186 (2 M). (b) ESI mass spectrum of 2 M 186
in the presence of 20 M Cu2+. The ions from 186 are labelled with their corresponding charges.
concentration shown, there is a low intensity peak corresponding to 186, a high
intensity peak corresponding to 186-Fe(II)2 at 20709 Da and another low intensity
peak at 20762 Da, corresponding to 186-Fe(II)3. This result is striking as there is no
peak from 186-Fe(II) when Fe2+ is present in only five-fold excess over 186. This
suggests that Fe2+ binds with high affinity and is consistent with a preference for a
binuclear iron centre. This differs noticeably from the behaviour of Mn2+ (Figure 4.5),
Zn2+ (Figure 4.5), Mg2+ (Figure 4.8) and Cu2+ (Figure 4.9). There is also an unidentified
peak with a mass approximately 176 Da higher than 186, labelled A on the figure. As
the iron concentration was increased, the intensity of the peak corresponding to 186
decreased and was absent at the protein to metal ratio of 1:100 (e). The peak
corresponding to 186-Fe(II)2 remained the most intense until this high Fe2+
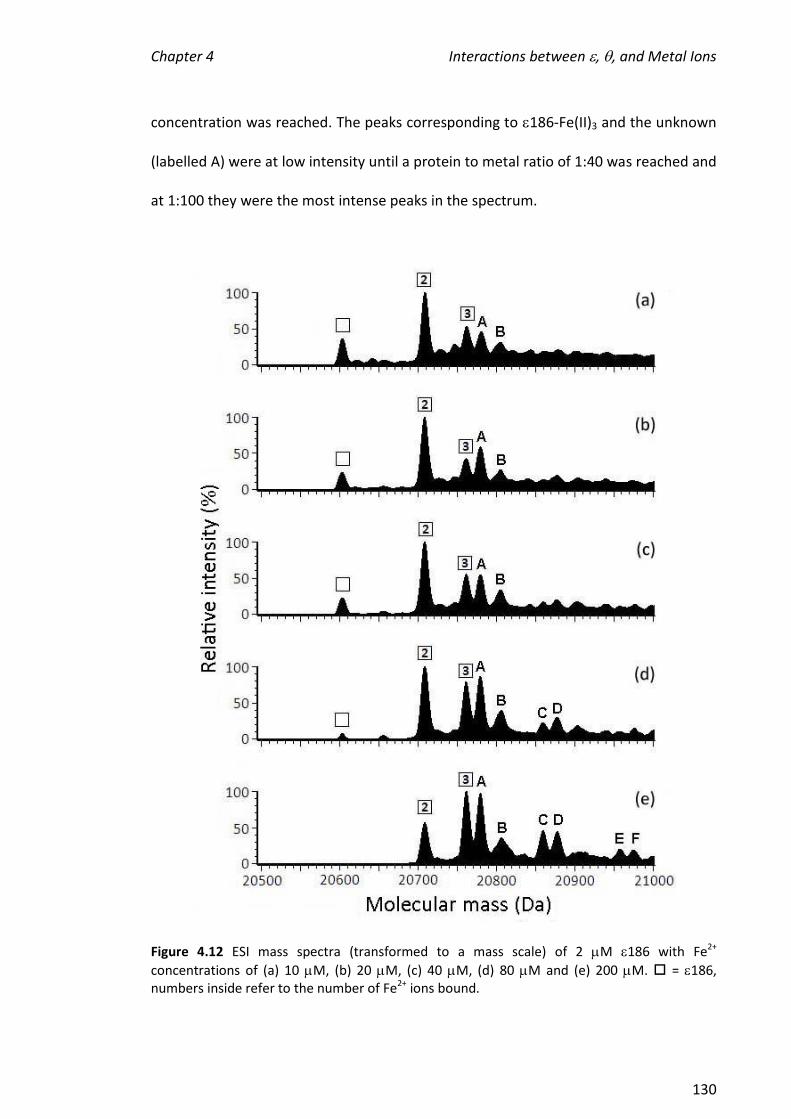
Chapter 4 Interactions between , , and Metal Ions
130
concentration was reached. The peaks corresponding to 186-Fe(II)3 and the unknown
(labelled A) were at low intensity until a protein to metal ratio of 1:40 was reached and
at 1:100 they were the most intense peaks in the spectrum.
Figure 4.12 ESI mass spectra (transformed to a mass scale) of 2 M 186 with Fe2+
concentrations of (a) 10 M, (b) 20 M, (c) 40 M, (d) 80 M and (e) 200 M. = 186, numbers inside refer to the number of Fe2+ ions bound.
Chapter 4 Interactions between , , and Metal Ions
131
In these experiments, freshly prepared ferrous ammonium sulfate was used as the
source of Fe2+. Other peaks that increased in intensity with increasing ferrous
ammonium sulfate concentration are labelled B to F on the spectra in Figure 4.12.
Peaks C and E differ from each other in mass by approximately 98 Da. The mass of a
sulfate ion is 96 Da. This is in reasonable agreement given the broadness of the peak.
The difference between the 186-Fe(II)3 peak and A, the peaks C and D and the peaks E
and F is approximately 18 Da which corresponds to an ammonium ion. Therefore, the
peaks that appear at the higher ferrous ammonium sulfate concentration possibly
correspond to binding of Fe2+ with and without sulfate and possibly, ammonium. As
sulfate is negatively charged there is a possibility it could bind to positive amino acids
on the protein. This was the case in a crystallographic study of 186 where high
concentrations of MnSO4 were used (N. Dixon, personal communication). The crystal
structure revealed that SO42- bound near the DNA binding site, forming stable H-bonds
to Arg159, Asp146, Leu144 and water molecules. Nevertheless, it is clear that 186 has
a high affinity for Fe2+ as the two binding sites are mostly occupied even at a low Fe2+
concentration. The peak corresponding to 186-Fe(II)2 is not complicated by additional
sulfate suggesting the coordination sites of Fe2+ are fully occupied and this is a specific
complex. While iron was added to the mixture as ferrous ammonium sulfate, it is not
possible to conclude that the two iron ions bound at the active site were both present
as ferrous ions. Given the propensity of iron to oxidise [253], it is possible that one or
both ions were present as Fe3+. The presence of two iron atoms, Fe(II)-Fe(III), in the
active form and Fe(III)-Fe(III) in the inactive form, occurs at the active site of other
phosphoryl transfer enzymes, such as the purple acid phosphatases [254]. The binding
of Fe3+ in the absence of sulfate, was investigated by addition of iron acetate to 186.
No binding was observed in solutions containing up to 200 M Fe2+ (not shown). This
Chapter 4 Interactions between , , and Metal Ions
132
result does not rule out that Fe3+ binds to the protein since, as expected, some
precipitation of Fe3+ was observed during these experiments.
Figure 4.13 shows a summary of the binding behaviour of 186 towards the various
metal ions investigated in this thesis, at one metal ion concentration (80 M), with the
exception of Cu2+ (60 M) since the quality of the spectra deteriorated at higher
concentrations. The results described above suggest that 186 has little affinity
towards Mg2+ and Cu2+ and although some metal ion binding occurs, it is most likely
due to non-specific interactions. Interestingly, two Fe2+ ions appear to bind specifically
to 186 even at the low protein to metal ratio 1:5. In comparison, the first metal ion
binding site of 186 was saturated at 1:40 for 186:Mn2+, 1:20 for 186:Zn2+ and 1:5 for
186:Dy3+ [140]. The second metal ion binding site did not reach saturation with Mn2+
and Zn2+ (at protein to metal ratios up to 1:80), while negligible 186-Dy(III)2 was
observed. It is not surprising that two Mn2+, Zn2+ or Fe2+ ions fit into the active site of
186 as they have similar ionic radii (89, 88 and 77 pm, respectively [255]). These
results also suggest that only one Dy3+ ion can bind tightly to 186, most likely because
of its large size (ionic radius of 105.2 pm) compared to the aforementioned metal ions.
Lanthanide ions are commonly used to probe two-metal ion binding sites within
proteins in NMR experiments (including 186- [248]) as they have favourable
magnetic properties [256, 257].
4.3.4 Addition of the Substrate Mimic/Inhibitor, TMP, to 186
TMP is a nucleotide product of the exonuclease activity of . It binds tightly to [4] and
the X-ray crystal structure of 186 (in a buffer containing MnSO4 and TMP) showed
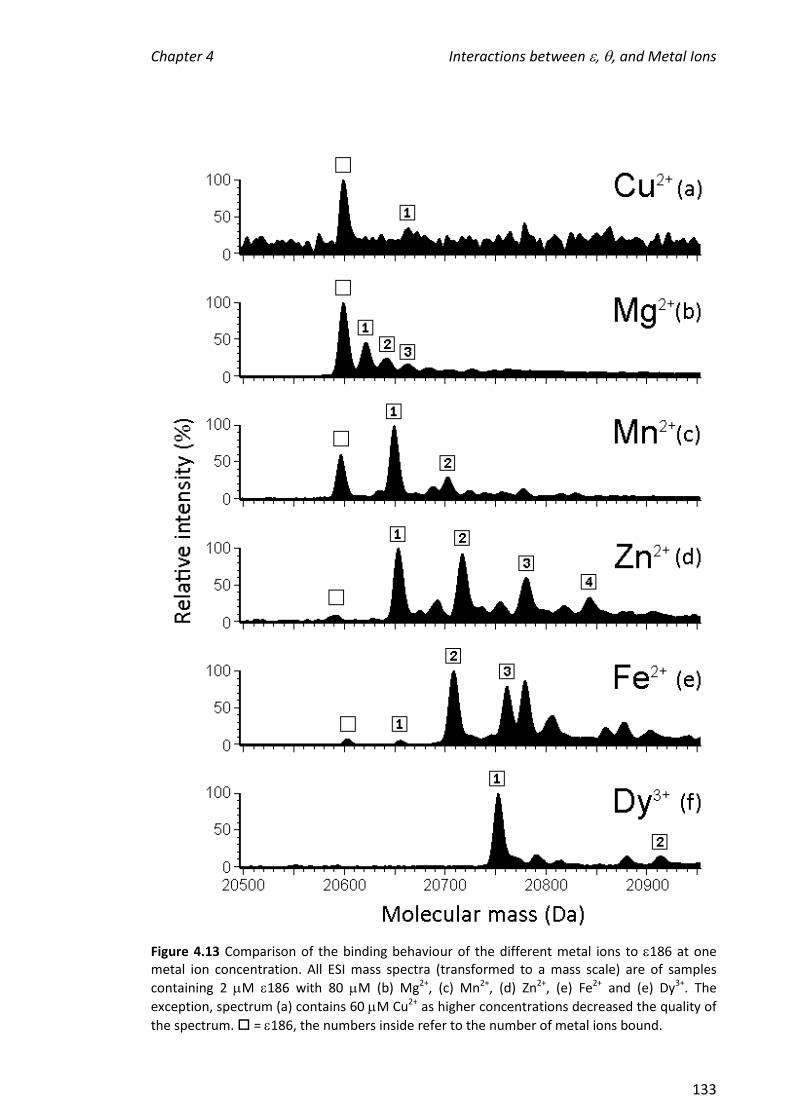
Chapter 4 Interactions between , , and Metal Ions
133
Figure 4.13 Comparison of the binding behaviour of the different metal ions to 186 at one metal ion concentration. All ESI mass spectra (transformed to a mass scale) are of samples
containing 2 M 186 with 80 M (b) Mg2+, (c) Mn2+, (d) Zn2+, (e) Fe2+ and (e) Dy3+. The
exception, spectrum (a) contains 60 M Cu2+ as higher concentrations decreased the quality of
the spectrum. = 186, the numbers inside refer to the number of metal ions bound.
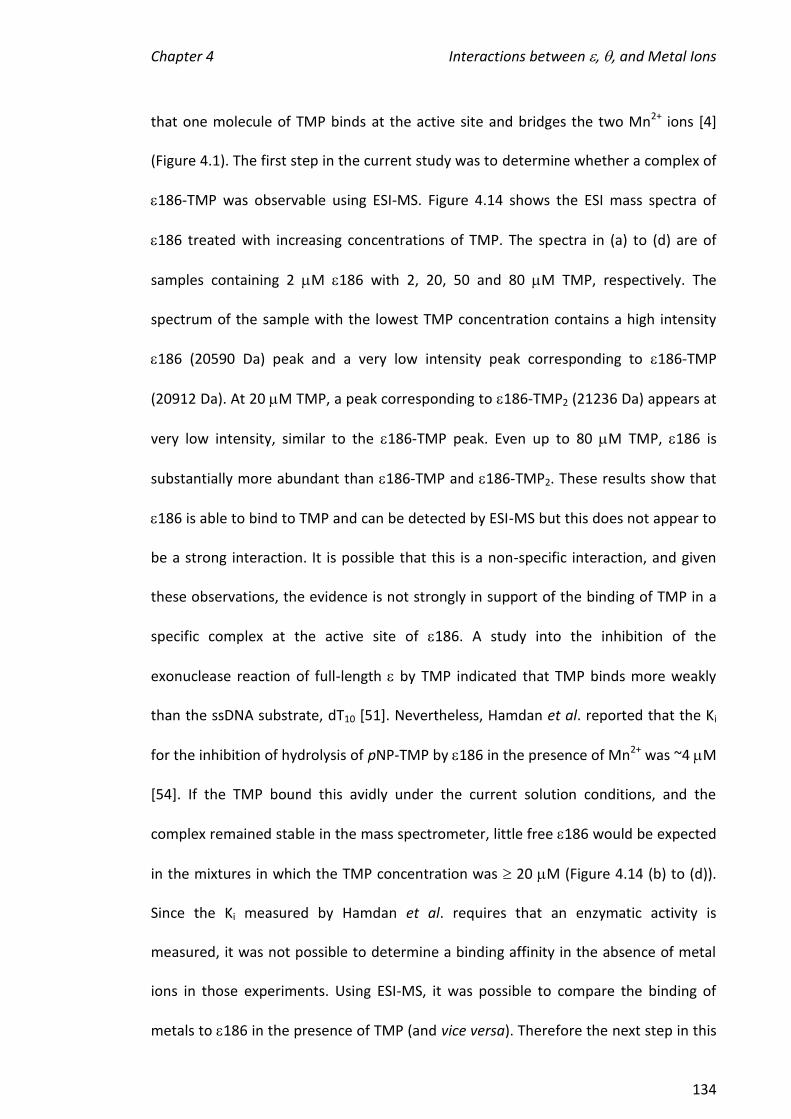
Chapter 4 Interactions between , , and Metal Ions
134
that one molecule of TMP binds at the active site and bridges the two Mn2+ ions [4]
(Figure 4.1). The first step in the current study was to determine whether a complex of
186-TMP was observable using ESI-MS. Figure 4.14 shows the ESI mass spectra of
186 treated with increasing concentrations of TMP. The spectra in (a) to (d) are of
samples containing 2 M 186 with 2, 20, 50 and 80 M TMP, respectively. The
spectrum of the sample with the lowest TMP concentration contains a high intensity
186 (20590 Da) peak and a very low intensity peak corresponding to 186-TMP
(20912 Da). At 20 M TMP, a peak corresponding to 186-TMP2 (21236 Da) appears at
very low intensity, similar to the 186-TMP peak. Even up to 80 M TMP, 186 is
substantially more abundant than 186-TMP and 186-TMP2. These results show that
186 is able to bind to TMP and can be detected by ESI-MS but this does not appear to
be a strong interaction. It is possible that this is a non-specific interaction, and given
these observations, the evidence is not strongly in support of the binding of TMP in a
specific complex at the active site of 186. A study into the inhibition of the
exonuclease reaction of full-length by TMP indicated that TMP binds more weakly
than the ssDNA substrate, dT10 [51]. Nevertheless, Hamdan et al. reported that the Ki
for the inhibition of hydrolysis of pNP-TMP by 186 in the presence of Mn2+ was ~4 M
[54]. If the TMP bound this avidly under the current solution conditions, and the
complex remained stable in the mass spectrometer, little free 186 would be expected
in the mixtures in which the TMP concentration was 20 M (Figure 4.14 (b) to (d)).
Since the Ki measured by Hamdan et al. requires that an enzymatic activity is
measured, it was not possible to determine a binding affinity in the absence of metal
ions in those experiments. Using ESI-MS, it was possible to compare the binding of
metals to 186 in the presence of TMP (and vice versa). Therefore the next step in this
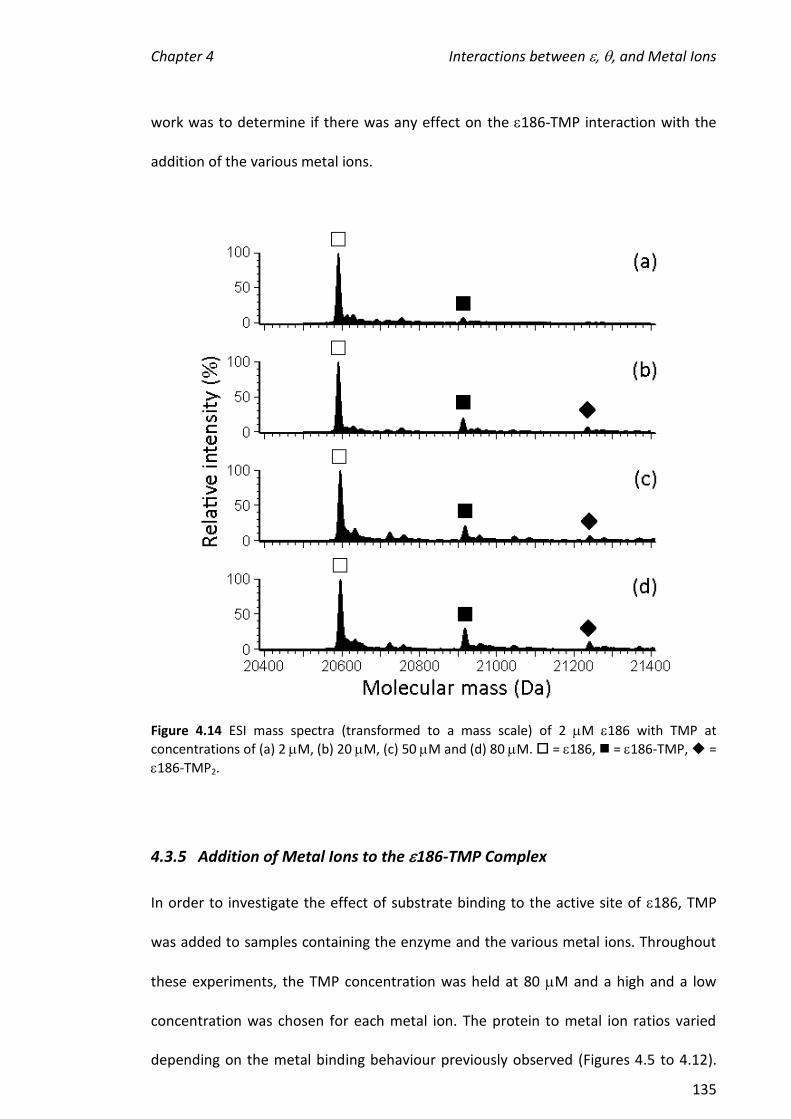
Chapter 4 Interactions between , , and Metal Ions
135
work was to determine if there was any effect on the 186-TMP interaction with the
addition of the various metal ions.
Figure 4.14 ESI mass spectra (transformed to a mass scale) of 2 M 186 with TMP at
concentrations of (a) 2 M, (b) 20 M, (c) 50 M and (d) 80 M. = 186, = 186-TMP, =
186-TMP2.
4.3.5 Addition of Metal Ions to the 186-TMP Complex
In order to investigate the effect of substrate binding to the active site of 186, TMP
was added to samples containing the enzyme and the various metal ions. Throughout
these experiments, the TMP concentration was held at 80 M and a high and a low
concentration was chosen for each metal ion. The protein to metal ion ratios varied
depending on the metal binding behaviour previously observed (Figures 4.5 to 4.12).

Chapter 4 Interactions between , , and Metal Ions
136
For example, a mass spectrum of a mixture containing 2 M 186 with 2 M Dy3+
(186:Dy3+, 1:1) contains 186 and 186-Dy(III) in approximately the same abundance,
while at Dy3+ concentrations over 10 M (186:Dy3+ > 1:5), the predominant species
was 186-Dy(III), with 186 at very low intensity [140]. For this reason, the two
186:Dy3+ ratios chosen for the TMP experiments were 1:1 and 1:10. The protein to
metal ratios chosen for the other metal ions were 1:20 and 1:50 (Mn2+), 1:20 and 1:30
(Zn2+), 1:20 and 1:100 (Mg2+), 1:2 and 1:10 (Cu2+) and 1:20 and 1:40 (Fe2+).
Figure 4.15 shows the ESI mass spectra of samples containing 186 (2 M), TMP (80
M) and either (a) 40 M Mg2+ or (b) 200 M Mg2+. There is little difference between
the two spectra except that at the higher metal concentration the metal-protein
complexes are present in slightly greater abundance. At both Mg2+ concentrations the
most intense peak is at 20597 Da, corresponding to 186. Also observed in both
spectra are relatively low intensity peaks at 20623 Da (186-Mg(II)) and 20643 Da
(186-Mg(II)2). These peaks double in intensity at 200 M Mg2+ but do not reach the
same intensity of the 186 peak. Furthermore, at the high Mg2+ concentration a low
intensity peak corresponding to 186-Mg(II)3 appears at 20668 Da. In both spectra, an
additional series of low intensity peaks is observed over the mass range 20900 to
21000 Da that were not observed in mass spectra of mixtures not containing TMP.
These peaks are consistent with the masses of 186-TMP (20924 Da), 186-TMP-Mg(II)
(20946 Da), 186-TMP-Mg(II)2 (20963 Da) and at 200 M Mg, a peak from 186-TMP-
Mg(II)3 (20990 Da) is present. The peaks corresponding to 186-TMP and 186-TMP-
metal complexes are less intense than peaks from 186 and 186-metal complexes at
both metal ion concentrations. Molecular dynamics simulations on the X-ray structure
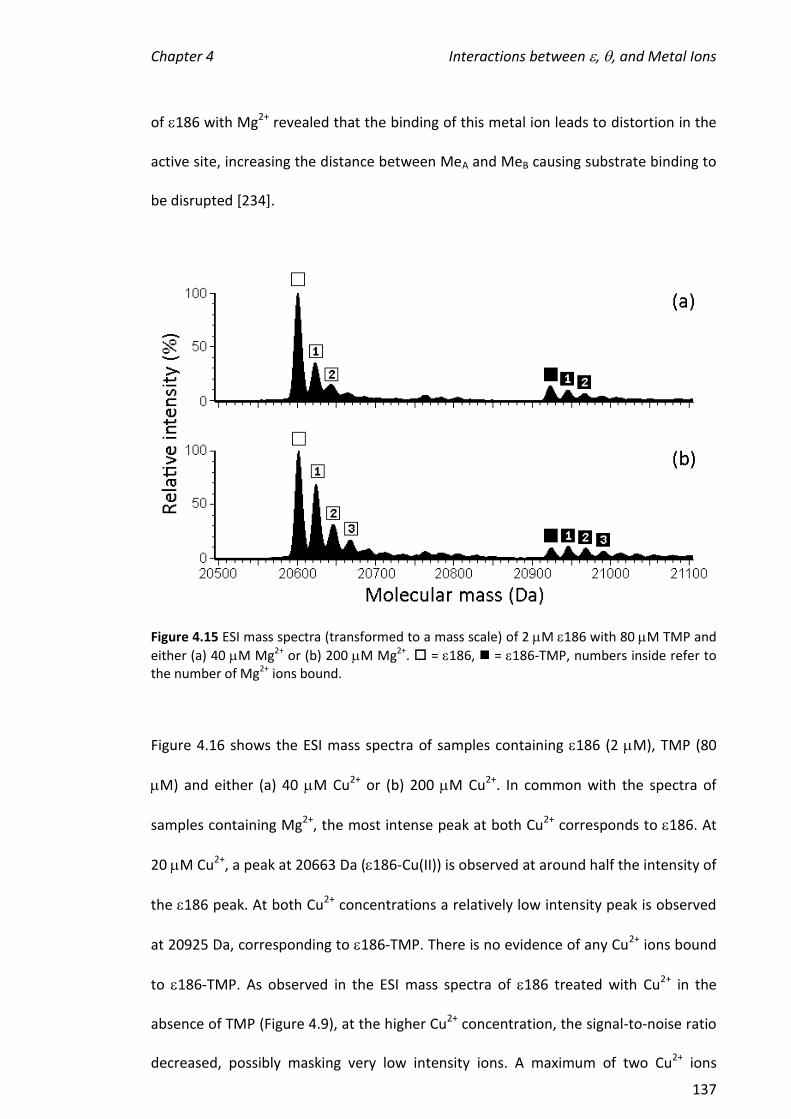
Chapter 4 Interactions between , , and Metal Ions
137
of 186 with Mg2+ revealed that the binding of this metal ion leads to distortion in the
active site, increasing the distance between MeA and MeB causing substrate binding to
be disrupted [234].
Figure 4.15 ESI mass spectra (transformed to a mass scale) of 2 M 186 with 80 M TMP and
either (a) 40 M Mg2+ or (b) 200 M Mg2+. = 186, = 186-TMP, numbers inside refer to the number of Mg2+ ions bound.
Figure 4.16 shows the ESI mass spectra of samples containing 186 (2 M), TMP (80
M) and either (a) 40 M Cu2+ or (b) 200 M Cu2+. In common with the spectra of
samples containing Mg2+, the most intense peak at both Cu2+ corresponds to 186. At
20 M Cu2+, a peak at 20663 Da (186-Cu(II)) is observed at around half the intensity of
the 186 peak. At both Cu2+ concentrations a relatively low intensity peak is observed
at 20925 Da, corresponding to 186-TMP. There is no evidence of any Cu2+ ions bound
to 186-TMP. As observed in the ESI mass spectra of 186 treated with Cu2+ in the
absence of TMP (Figure 4.9), at the higher Cu2+ concentration, the signal-to-noise ratio
decreased, possibly masking very low intensity ions. A maximum of two Cu2+ ions
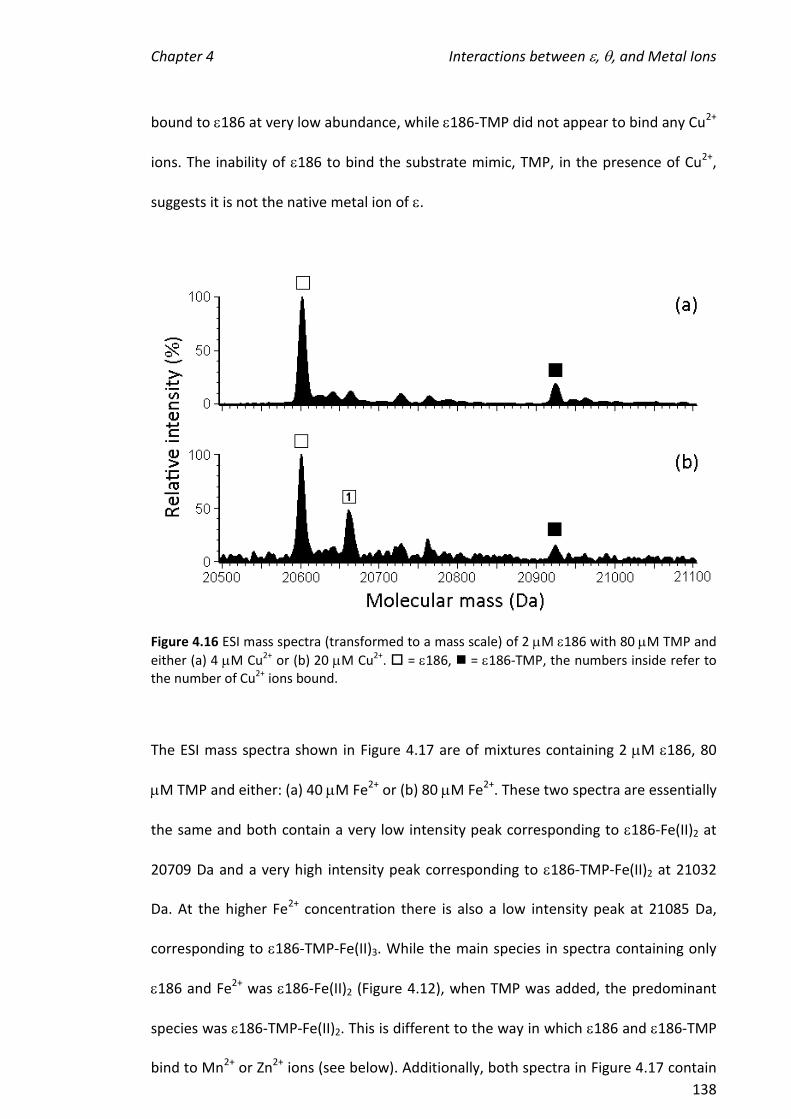
Chapter 4 Interactions between , , and Metal Ions
138
bound to 186 at very low abundance, while 186-TMP did not appear to bind any Cu2+
ions. The inability of 186 to bind the substrate mimic, TMP, in the presence of Cu2+,
suggests it is not the native metal ion of .
Figure 4.16 ESI mass spectra (transformed to a mass scale) of 2 M 186 with 80 M TMP and
either (a) 4 M Cu2+ or (b) 20 M Cu2+. = 186, = 186-TMP, the numbers inside refer to the number of Cu2+ ions bound.
The ESI mass spectra shown in Figure 4.17 are of mixtures containing 2 M 186, 80
M TMP and either: (a) 40 M Fe2+ or (b) 80 M Fe2+. These two spectra are essentially
the same and both contain a very low intensity peak corresponding to 186-Fe(II)2 at
20709 Da and a very high intensity peak corresponding to 186-TMP-Fe(II)2 at 21032
Da. At the higher Fe2+ concentration there is also a low intensity peak at 21085 Da,
corresponding to 186-TMP-Fe(II)3. While the main species in spectra containing only
186 and Fe2+ was 186-Fe(II)2 (Figure 4.12), when TMP was added, the predominant
species was 186-TMP-Fe(II)2. This is different to the way in which 186 and 186-TMP
bind to Mn2+ or Zn2+ ions (see below). Additionally, both spectra in Figure 4.17 contain
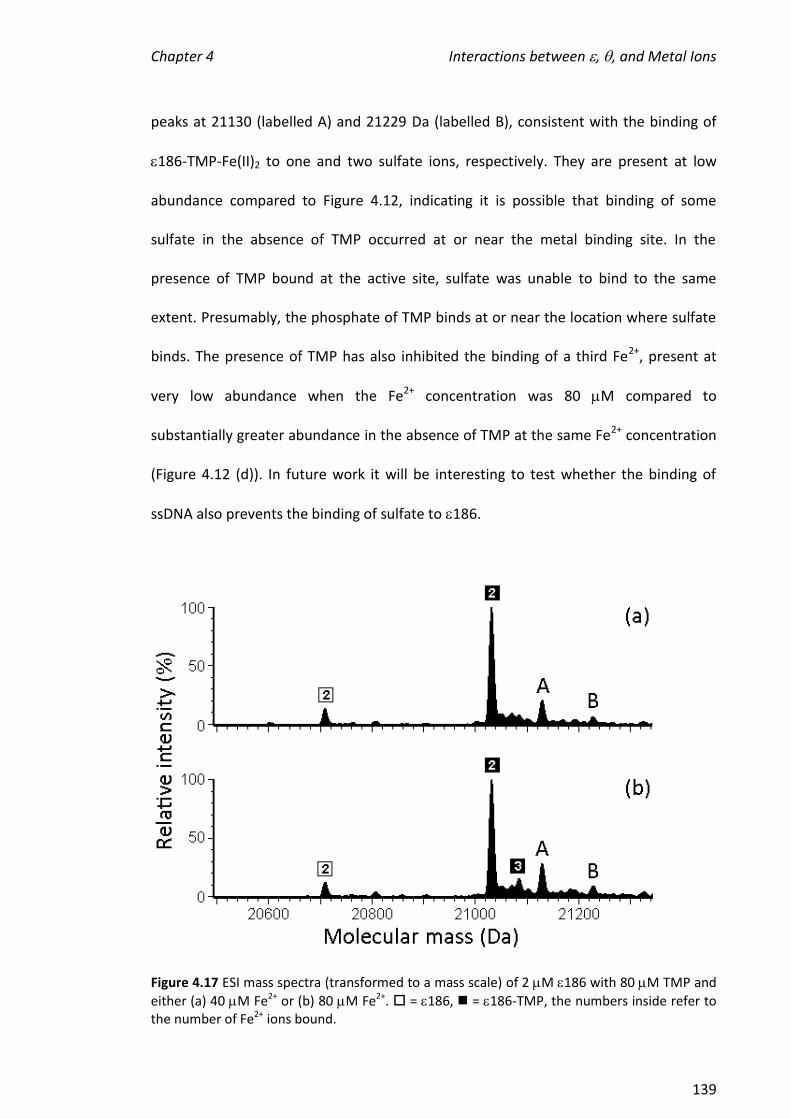
Chapter 4 Interactions between , , and Metal Ions
139
peaks at 21130 (labelled A) and 21229 Da (labelled B), consistent with the binding of
186-TMP-Fe(II)2 to one and two sulfate ions, respectively. They are present at low
abundance compared to Figure 4.12, indicating it is possible that binding of some
sulfate in the absence of TMP occurred at or near the metal binding site. In the
presence of TMP bound at the active site, sulfate was unable to bind to the same
extent. Presumably, the phosphate of TMP binds at or near the location where sulfate
binds. The presence of TMP has also inhibited the binding of a third Fe2+, present at
very low abundance when the Fe2+ concentration was 80 M compared to
substantially greater abundance in the absence of TMP at the same Fe2+ concentration
(Figure 4.12 (d)). In future work it will be interesting to test whether the binding of
ssDNA also prevents the binding of sulfate to 186.
Figure 4.17 ESI mass spectra (transformed to a mass scale) of 2 M 186 with 80 M TMP and
either (a) 40 M Fe2+ or (b) 80 M Fe2+. = 186, = 186-TMP, the numbers inside refer to the number of Fe2+ ions bound.

Chapter 4 Interactions between , , and Metal Ions
140
Figure 4.18 shows ESI mass spectra of samples containing 2 M 186, 80 M TMP and
either (a) 2 M Dy3+ or (b) 20 M Dy3+. Both spectra contain a peak corresponding to
186 and a peak corresponding to 186 bound to one Dy3+ ion (162.5 Da), with a total
mass of 20756 Da at relatively high intensity. Also observed in both spectra is a low
intensity peak at 20918 Da which corresponds to either 186-TMP or 186-Dy(III)2, as
TMP and Dy(III)2 have similar masses (322 and 325 Da, respectively). It seems more
likely that the peak corresponds to 186-TMP as no 186-Dy(III)2 peak has previously
been observed (except at very low intensity at very high Dy3+ concentrations), and
186-TMP has been observed in most spectra where TMP has been added to 186.
Furthermore, a low intensity peak corresponding to 186-TMP-Dy(III) (21081 Da) is
present in both spectra. The main difference between the spectra of the solutions
containing the two Dy3+ concentrations is the relative intensities between the proteins
and the metal-bound proteins. At 2 M Dy3+, both 186 and 186-TMP are present at
slightly greater abundance than their equivalents bound to one Dy3+ ion, while at 20
M, the holoproteins are present in greater abundance than the apoproteins.
Compared to spectra of 186 and Dy3+ in the absence of TMP (Figure 4.7), the binding
of 186 to Dy3+ is nearly identical to the spectra where TMP was added here (Figure
4.18). This is not surprising since, as noted above, one lanthanide ion usually binds to a
two-metal ion binding site. These results suggest that the binding of Dy3+ hinders the
binding of TMP at the active site. This was also observed in the exonuclease site of Pol I
where one Eu3+ ion bound where two divalent metal ions usually bind [258]. This
caused significant conformational changes to the exonuclease of Pol I, most likely due
to the large size and high (3+) charge of Eu3+, rendering the enzyme inactive. It should
also be noted that the lanthanide ions ions may potentially have a higher coordination
number than the transition metal ions and involve a greater number of donor groups
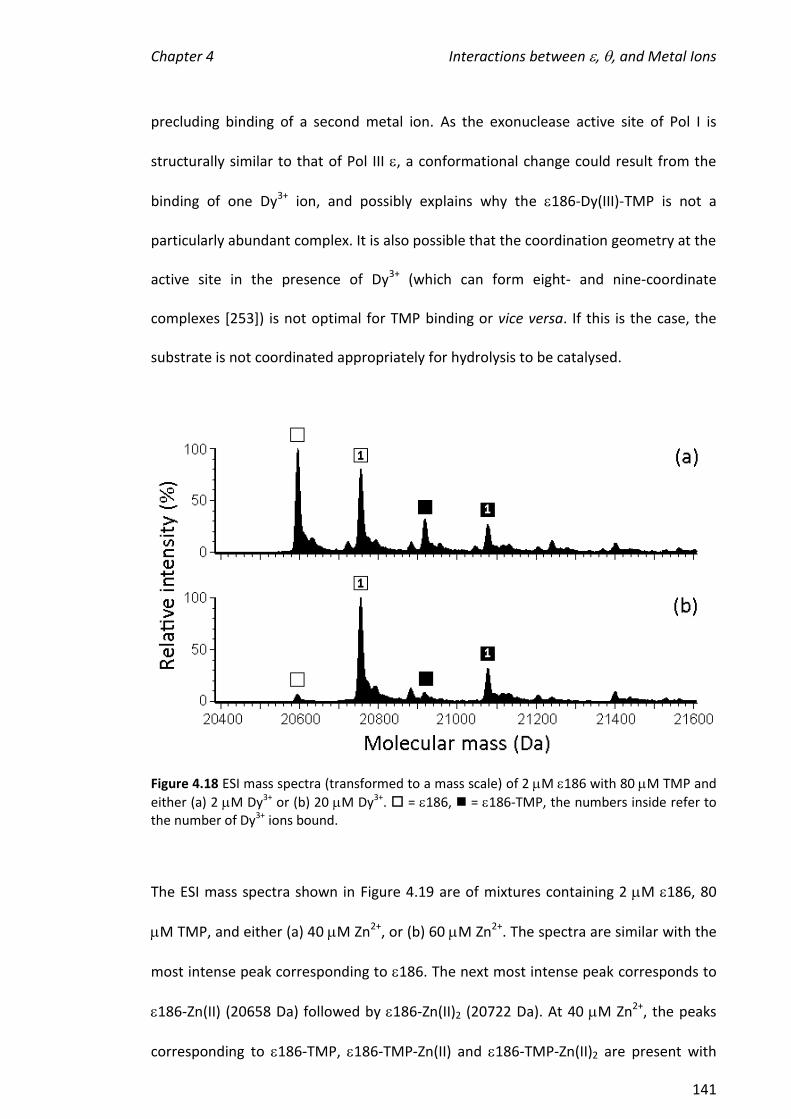
Chapter 4 Interactions between , , and Metal Ions
141
precluding binding of a second metal ion. As the exonuclease active site of Pol I is
structurally similar to that of Pol III , a conformational change could result from the
binding of one Dy3+ ion, and possibly explains why the 186-Dy(III)-TMP is not a
particularly abundant complex. It is also possible that the coordination geometry at the
active site in the presence of Dy3+ (which can form eight- and nine-coordinate
complexes [253]) is not optimal for TMP binding or vice versa. If this is the case, the
substrate is not coordinated appropriately for hydrolysis to be catalysed.
Figure 4.18 ESI mass spectra (transformed to a mass scale) of 2 M 186 with 80 M TMP and
either (a) 2 M Dy3+ or (b) 20 M Dy3+. = 186, = 186-TMP, the numbers inside refer to the number of Dy3+ ions bound.
The ESI mass spectra shown in Figure 4.19 are of mixtures containing 2 M 186, 80
M TMP, and either (a) 40 M Zn2+, or (b) 60 M Zn2+. The spectra are similar with the
most intense peak corresponding to 186. The next most intense peak corresponds to
186-Zn(II) (20658 Da) followed by 186-Zn(II)2 (20722 Da). At 40 M Zn2+, the peaks
corresponding to 186-TMP, 186-TMP-Zn(II) and 186-TMP-Zn(II)2 are present with
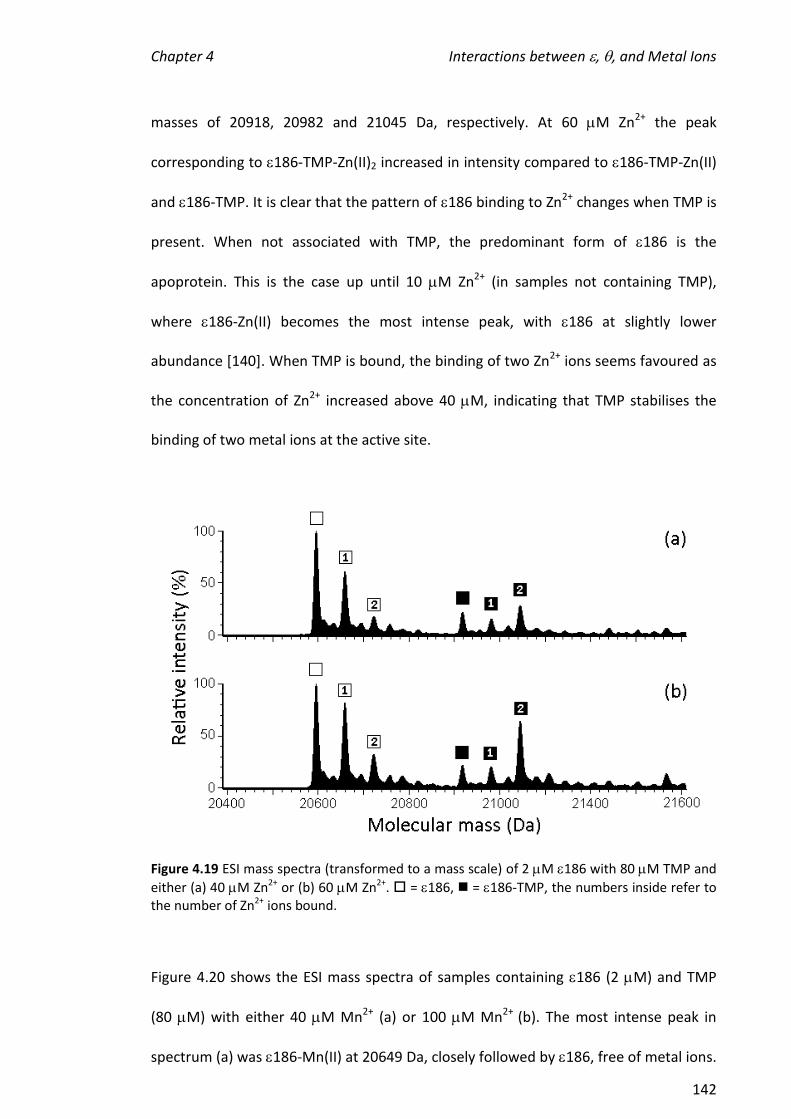
Chapter 4 Interactions between , , and Metal Ions
142
masses of 20918, 20982 and 21045 Da, respectively. At 60 M Zn2+ the peak
corresponding to 186-TMP-Zn(II)2 increased in intensity compared to 186-TMP-Zn(II)
and 186-TMP. It is clear that the pattern of 186 binding to Zn2+ changes when TMP is
present. When not associated with TMP, the predominant form of 186 is the
apoprotein. This is the case up until 10 M Zn2+ (in samples not containing TMP),
where 186-Zn(II) becomes the most intense peak, with 186 at slightly lower
abundance [140]. When TMP is bound, the binding of two Zn2+ ions seems favoured as
the concentration of Zn2+ increased above 40 M, indicating that TMP stabilises the
binding of two metal ions at the active site.
Figure 4.19 ESI mass spectra (transformed to a mass scale) of 2 M 186 with 80 M TMP and
either (a) 40 M Zn2+ or (b) 60 M Zn2+. = 186, = 186-TMP, the numbers inside refer to the number of Zn2+ ions bound.
Figure 4.20 shows the ESI mass spectra of samples containing 186 (2 M) and TMP
(80 M) with either 40 M Mn2+ (a) or 100 M Mn2+ (b). The most intense peak in
spectrum (a) was 186-Mn(II) at 20649 Da, closely followed by 186, free of metal ions.
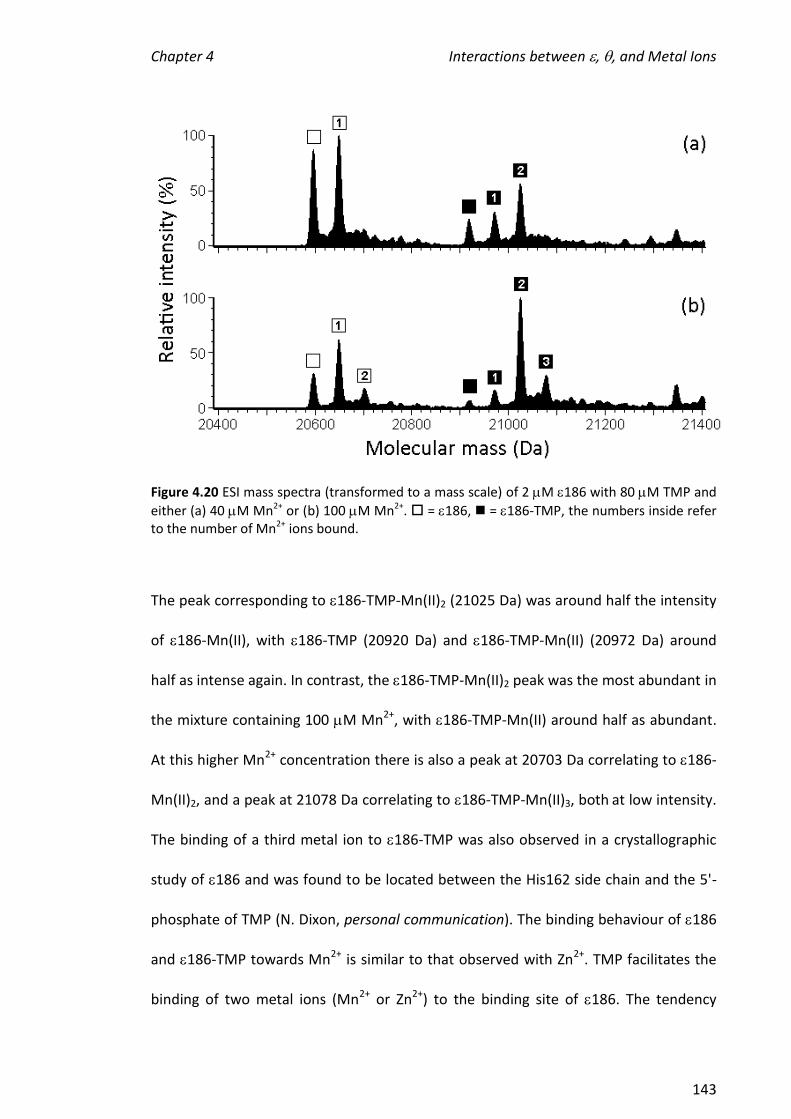
Chapter 4 Interactions between , , and Metal Ions
143
Figure 4.20 ESI mass spectra (transformed to a mass scale) of 2 M 186 with 80 M TMP and
either (a) 40 M Mn2+ or (b) 100 M Mn2+. = 186, = 186-TMP, the numbers inside refer to the number of Mn2+ ions bound.
The peak corresponding to 186-TMP-Mn(II)2 (21025 Da) was around half the intensity
of 186-Mn(II), with 186-TMP (20920 Da) and 186-TMP-Mn(II) (20972 Da) around
half as intense again. In contrast, the 186-TMP-Mn(II)2 peak was the most abundant in
the mixture containing 100 M Mn2+, with 186-TMP-Mn(II) around half as abundant.
At this higher Mn2+ concentration there is also a peak at 20703 Da correlating to 186-
Mn(II)2, and a peak at 21078 Da correlating to 186-TMP-Mn(II)3, both at low intensity.
The binding of a third metal ion to 186-TMP was also observed in a crystallographic
study of 186 and was found to be located between the His162 side chain and the 5'-
phosphate of TMP (N. Dixon, personal communication). The binding behaviour of 186
and 186-TMP towards Mn2+ is similar to that observed with Zn2+. TMP facilitates the
binding of two metal ions (Mn2+ or Zn2+) to the binding site of 186. The tendency
Chapter 4 Interactions between , , and Metal Ions
144
towards binding two Mn2+ ions was not observed in mass spectra of 186 and Mn2+ in
the absence of TMP (Figure 4.5).
The presence of TMP enhances the binding of two Mn2+, Zn2+ and Fe2+ ions, in
agreement with an EPR spectroscopy study of 186 in the laboratory of our
collaborators (G. Schenk, personal communication). This study showed that the affinity
of 186 toward MnA increased ten-fold, and the MnB site became fully occupied, at
high Mn2+ concentrations (KD ~400 M) in the presence of TMP. The exonuclease of
Pol I also contains one tight and one weak metal ion (Mn2+) binding site, with the
affinity of the weak site increasing one hundred-fold upon the addition of TMP [238].
X-ray crystal structures of the 186 active site show that the two Mn2+ ions are in
essentially the same position in the absence and presence of TMP (G. Schenk, personal
communication). This implies that rather than the metal ions changing the structure of
the active site, the substrate allows for the binding of a second metal ion. The
combination of these results strongly support the hypothesis that a two metal ion
centre is only formed in the presence of TMP (or substrate analogue), and by analogy,
an ssDNA substrate (G. Schenk, personal communication). Therefore the enzyme
remains inactive until it is bound to substrate. These observations suggest a possible
regulatory mechanism of enzyme activity within Pol III in which an active enzyme is
not formed until substrate binds and assists the binding of a second metal ion forming
a catalytically-competent complex.
During replication, DNA is intermittently transferred between the polymerase and
exonuclease sites of Pol III [259]. It has been proposed that replication occurs
efficiently as these sites compete for the 3 end of the DNA primer, with polymerase
Chapter 4 Interactions between , , and Metal Ions
145
activity favoured when the nascent DNA contains the correct base-pairing and
therefore the correct secondary structure. Incorrect nucleotide insertion causes
melting of the dsDNA, causing the resulting ssDNA to move into the exonuclease site.
In order to achieve an optimal rate of excision, the section of ssDNA most likely
consists of at least three nucleotides [51]. Subsequently, the substrate at the active
site of facilitates the binding of a second metal ion which allows hydrolysis to take
place. This is again similar to Pol I where the usually weak binding of a second metal
ion is tightened by TMP creating the active form of the enzyme [238].
The results indicating that two metal ions bound to 186 enhance substrate (or TMP)
binding, are consistent with observations of the E. coli regulatory repressor protein,
NikR [242]. Mass spectrometry revealed that NikR remains in its native tetrameric
state both in the absence and presence of its metal cofactor, Ni2+ [216]. Similarly, ESI-
MS data suggest there is little difference between the folded state of 186 and its
metal bound form (indicated by the protein displaying the same charge state
distribution such as that shown in Figure 4.4 (a) in the presence or absence of metal
ions). Additionally, when dsDNA substrate is added to NikR, only the nickel-containing
protein binds to the DNA with high affinity, as revealed by the different intensities of
each complex in the mass spectra. These results obtained using ESI-MS correlate well
with the in vivo role of NikR, which is to stop the expression of the proteins responsible
for nickel uptake in the E. coli cell. In the structure of 186-Mn(II)2-TMP, the TMP
molecule binds at the two metal ion binding site of 186. In contrast, the Ni2+ binding
sites on NikR, located in the C-terminal domain, are separate to the DNA binding site at
the N-terminus [242]. An example where a nucleotide and metal ions bind at the same
site of an enzyme is the dimer protein, kinase G (PKG2) [260]. Using ESI-MS, it was
Chapter 4 Interactions between , , and Metal Ions
146
found that PKG2 binds weakly to the non-hydrolysable ATP analog, AMP-PNP (,-
imidoadenosine triphosphate) even when the concentration of the nucleotide was in
ten-fold excess over the protein concentration. When Mn2+ was added to the sample,
the predominant species in the ESI mass spectrum was PKG2-(AMP-PNP-Mn(II)2)2, in
agreement with crystal structures of protein kinases showing that two divalent metal
ions are required for ATP binding [260].
The above experiments have shown the effect of adding metal ions and the substrate
mimic TMP to 186. In Pol III, binds to the subunit (amongst others). The effect the
binding of to 186 on metal and TMP binding is described below.
4.3.6 Effect of Adding to 186, TMP and Metal Ions
The subunit of Pol III has no known enzymatic function but it is known to stabilise
[49]. It was therefore of interest to determine whether addition of changes the metal
binding behaviour of 186 in the presence and absence of TMP. In preliminary
experiments [246] when was added to mixtures containing 186, TMP and metal ions
(Mn2+, Zn2+ and Dy3+), an additional adduct peak was observed with a mass
corresponding to + ~15 Da. It is unlikely that the origin of this contaminant is due to
the presence of a protein mutant in which there were amino acid substitution(s) since
the clones of the overproducing strain had been sequenced (N. Dixon, personal
communication). It is possible that the extra mass is the result of oxidation of a
methionine residue of (which contains three methionine residues), corresponding to
an additional mass of 16 Da. Previously, methionine-containing peptides have been
oxidised under some experimental conditions in electrospray sources [261]. It is
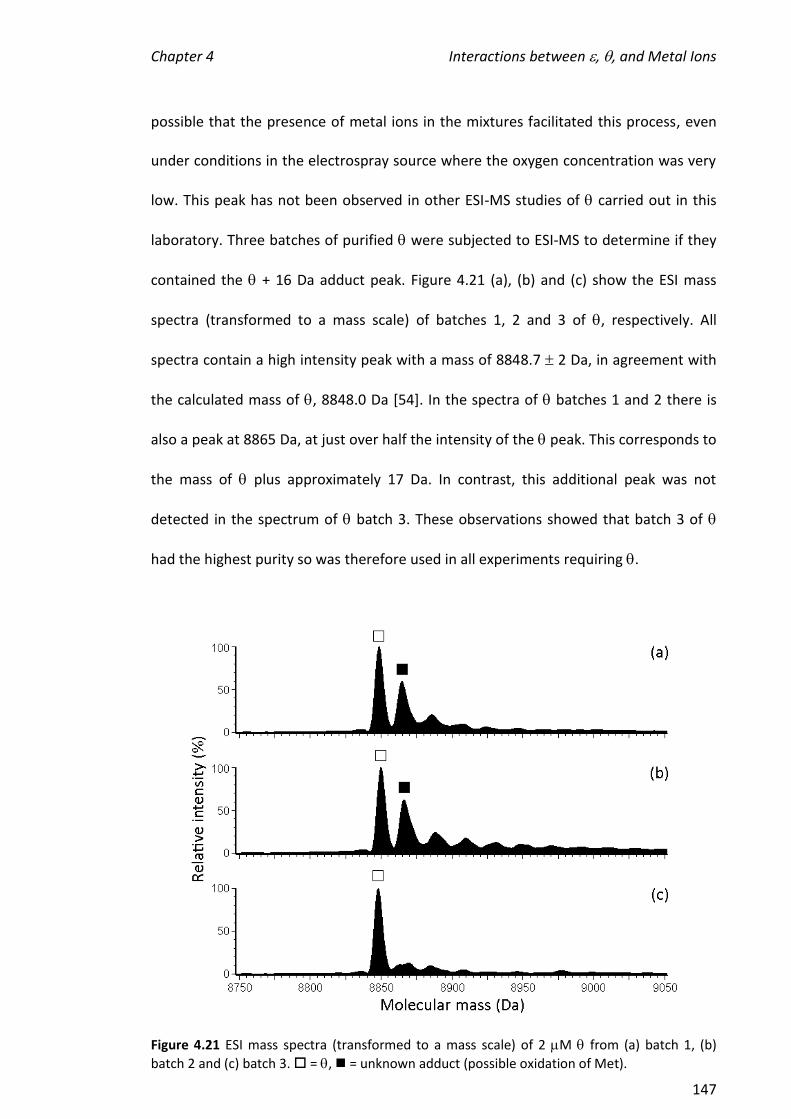
Chapter 4 Interactions between , , and Metal Ions
147
possible that the presence of metal ions in the mixtures facilitated this process, even
under conditions in the electrospray source where the oxygen concentration was very
low. This peak has not been observed in other ESI-MS studies of carried out in this
laboratory. Three batches of purified were subjected to ESI-MS to determine if they
contained the + 16 Da adduct peak. Figure 4.21 (a), (b) and (c) show the ESI mass
spectra (transformed to a mass scale) of batches 1, 2 and 3 of , respectively. All
spectra contain a high intensity peak with a mass of 8848.7 2 Da, in agreement with
the calculated mass of , 8848.0 Da [54]. In the spectra of batches 1 and 2 there is
also a peak at 8865 Da, at just over half the intensity of the peak. This corresponds to
the mass of plus approximately 17 Da. In contrast, this additional peak was not
detected in the spectrum of batch 3. These observations showed that batch 3 of
had the highest purity so was therefore used in all experiments requiring .
Figure 4.21 ESI mass spectra (transformed to a mass scale) of 2 M from (a) batch 1, (b)
batch 2 and (c) batch 3. = , = unknown adduct (possible oxidation of Met).
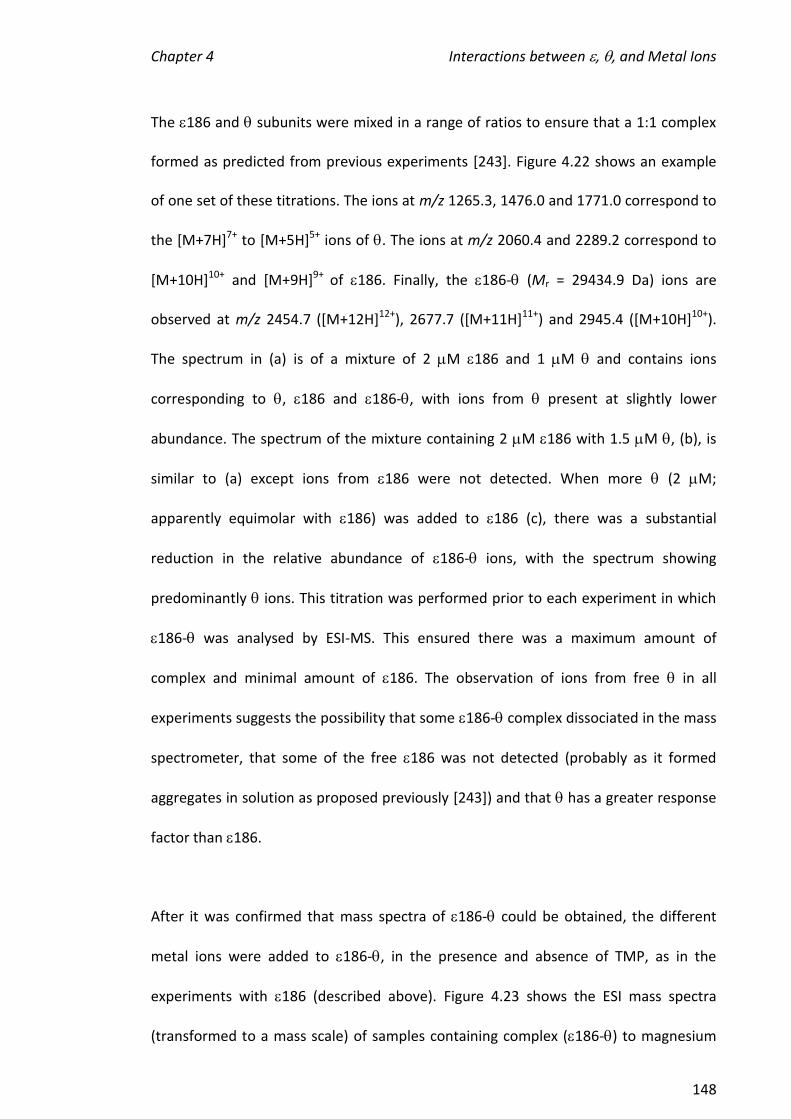
Chapter 4 Interactions between , , and Metal Ions
148
The 186 and subunits were mixed in a range of ratios to ensure that a 1:1 complex
formed as predicted from previous experiments [243]. Figure 4.22 shows an example
of one set of these titrations. The ions at m/z 1265.3, 1476.0 and 1771.0 correspond to
the [M+7H]7+ to [M+5H]5+ ions of . The ions at m/z 2060.4 and 2289.2 correspond to
[M+10H]10+ and [M+9H]9+ of 186. Finally, the 186- (Mr = 29434.9 Da) ions are
observed at m/z 2454.7 ([M+12H]12+), 2677.7 ([M+11H]11+) and 2945.4 ([M+10H]10+).
The spectrum in (a) is of a mixture of 2 M 186 and 1 M and contains ions
corresponding to , 186 and 186-, with ions from present at slightly lower
abundance. The spectrum of the mixture containing 2 M 186 with 1.5 M , (b), is
similar to (a) except ions from 186 were not detected. When more (2 M;
apparently equimolar with 186) was added to 186 (c), there was a substantial
reduction in the relative abundance of 186- ions, with the spectrum showing
predominantly ions. This titration was performed prior to each experiment in which
186- was analysed by ESI-MS. This ensured there was a maximum amount of
complex and minimal amount of 186. The observation of ions from free in all
experiments suggests the possibility that some 186- complex dissociated in the mass
spectrometer, that some of the free 186 was not detected (probably as it formed
aggregates in solution as proposed previously [243]) and that has a greater response
factor than 186.
After it was confirmed that mass spectra of 186- could be obtained, the different
metal ions were added to 186-, in the presence and absence of TMP, as in the
experiments with 186 (described above). Figure 4.23 shows the ESI mass spectra
(transformed to a mass scale) of samples containing complex (186-) to magnesium
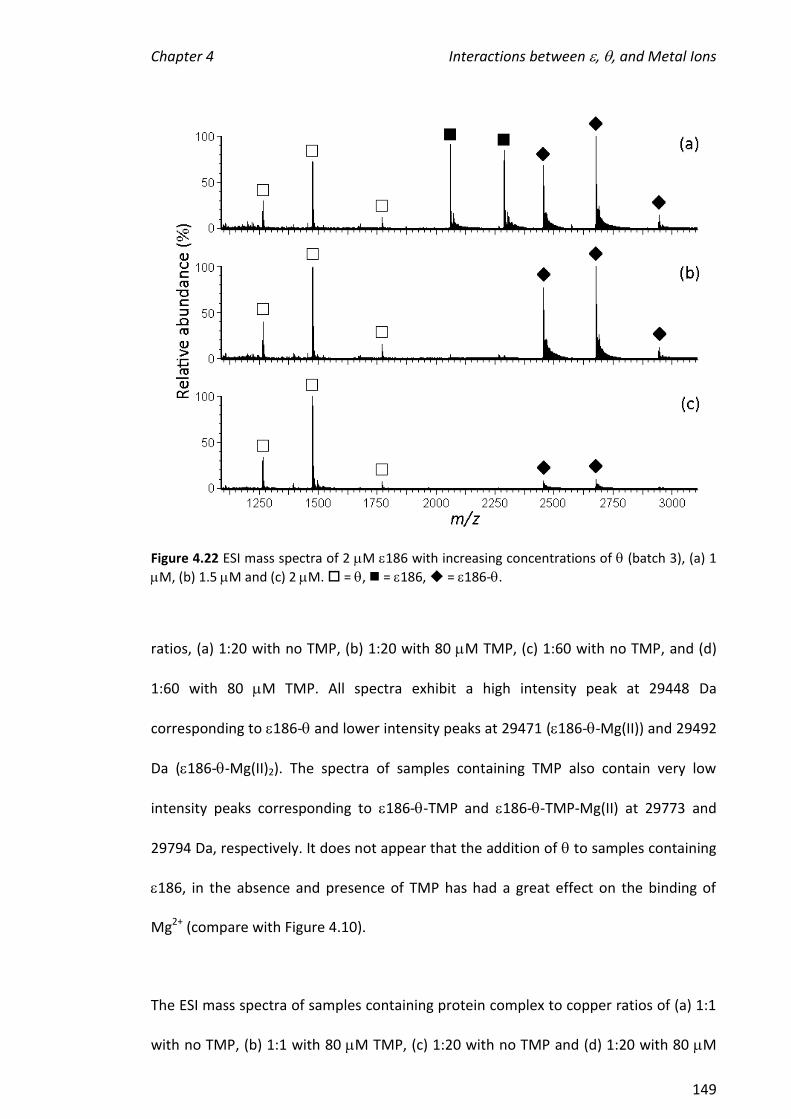
Chapter 4 Interactions between , , and Metal Ions
149
Figure 4.22 ESI mass spectra of 2 M 186 with increasing concentrations of (batch 3), (a) 1
M, (b) 1.5 M and (c) 2 M. = , = 186, = 186-.
ratios, (a) 1:20 with no TMP, (b) 1:20 with 80 M TMP, (c) 1:60 with no TMP, and (d)
1:60 with 80 M TMP. All spectra exhibit a high intensity peak at 29448 Da
corresponding to 186- and lower intensity peaks at 29471 (186--Mg(II)) and 29492
Da (186--Mg(II)2). The spectra of samples containing TMP also contain very low
intensity peaks corresponding to 186--TMP and 186--TMP-Mg(II) at 29773 and
29794 Da, respectively. It does not appear that the addition of to samples containing
186, in the absence and presence of TMP has had a great effect on the binding of
Mg2+ (compare with Figure 4.10).
The ESI mass spectra of samples containing protein complex to copper ratios of (a) 1:1
with no TMP, (b) 1:1 with 80 M TMP, (c) 1:20 with no TMP and (d) 1:20 with 80 M
Chapter 4 Interactions between , , and Metal Ions
150
Figure 4.23 ESI mass spectra (transformed to a mass scale) of 186- (3 M) with (a) 60 M
Mg2+, (b) 60 M Mg2+ and 80 M TMP, (c) 180 M Mg2+, (d) 180 M Mg2+ and 80 M TMP. =
186-, = 186--TMP, the numbers inside refer to the number of Mg2+ ions bound.
TMP are shown in Figure 4.24. All spectra contain a peak at high intensity which
corresponds to 186- at 29449 Da. Spectra (c) and (d) at the higher Cu2+
concentration contain a peak at 29509 Da (186--Cu(II)) at around half the intensity of
186- and a slightly lower intensity peak at 29570 Da (186--Cu(II)2). Spectra (b) and
(d) containing TMP also contain a very low intensity peak at 29772 Da corresponding
to 186--TMP. Inspection of the ESI mass spectrum of the mixture containing the
186-:Cu2+ ratio of 1:20, shows that some 186--Cu(II)2 was present (b), while in the
absence of , no 186-Cu(II)2 was observed (Figure 4.9 (d)). This indicates the binding
of to 186 slightly increased the affinity of the protein for Cu2+. Interestingly, the
quality of the former spectrum is good with a high signal-to-noise ratio; this was not
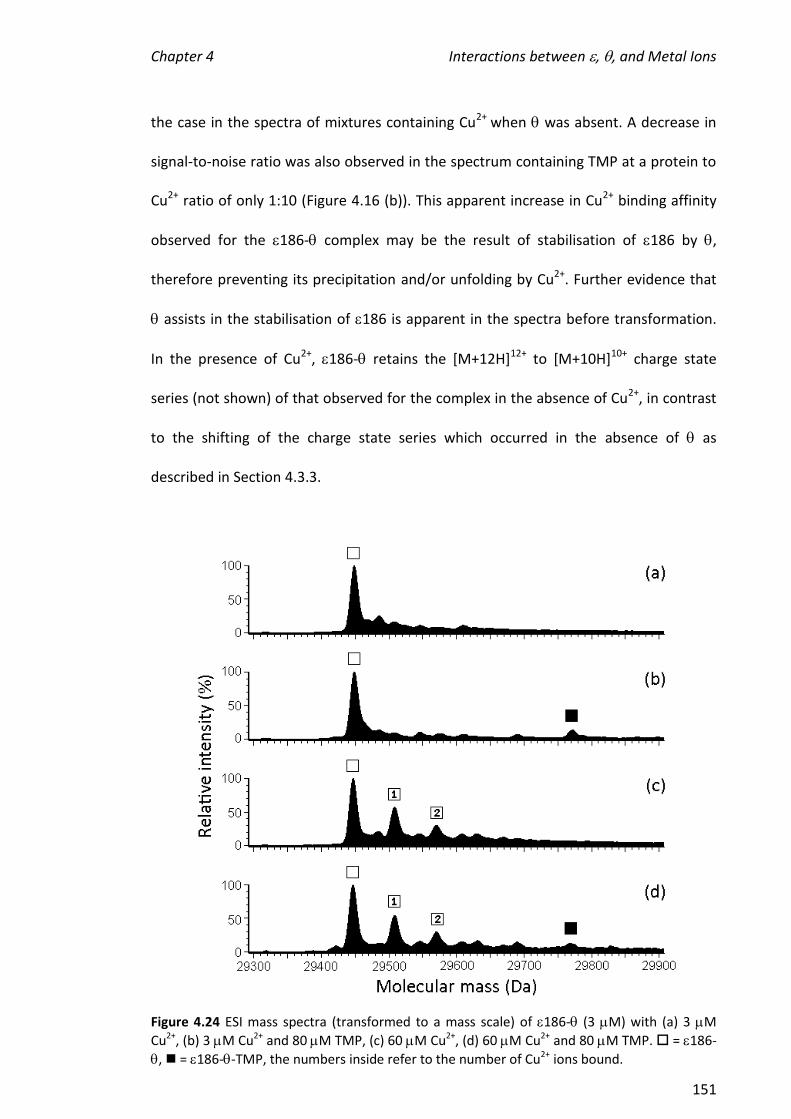
Chapter 4 Interactions between , , and Metal Ions
151
the case in the spectra of mixtures containing Cu2+ when was absent. A decrease in
signal-to-noise ratio was also observed in the spectrum containing TMP at a protein to
Cu2+ ratio of only 1:10 (Figure 4.16 (b)). This apparent increase in Cu2+ binding affinity
observed for the 186- complex may be the result of stabilisation of 186 by ,
therefore preventing its precipitation and/or unfolding by Cu2+. Further evidence that
assists in the stabilisation of 186 is apparent in the spectra before transformation.
In the presence of Cu2+, 186- retains the [M+12H]12+ to [M+10H]10+ charge state
series (not shown) of that observed for the complex in the absence of Cu2+, in contrast
to the shifting of the charge state series which occurred in the absence of as
described in Section 4.3.3.
Figure 4.24 ESI mass spectra (transformed to a mass scale) of 186- (3 M) with (a) 3 M
Cu2+, (b) 3 M Cu2+ and 80 M TMP, (c) 60 M Cu2+, (d) 60 M Cu2+ and 80 M TMP. = 186-
, = 186--TMP, the numbers inside refer to the number of Cu2+ ions bound.

Chapter 4 Interactions between , , and Metal Ions
152
The ESI mass spectra of samples containing 186- to iron ratios of (a) 1:20 with no
TMP, (b) 1:20 with 80 M TMP, (c) 1:40 with no TMP and (d) 1:40 with 80 M TMP are
shown in Figure 4.25. All spectra contain a high intensity peak at 29448 Da,
corresponding to 186- and low intensity peaks at 29546 and 29751 Da
corresponding to 186--Fe(II)2 and 186--Fe(II)2 bound to three sulfate ions (B),
respectively. In the spectra where no TMP has been added there is a peak at 29644 Da
which corresponds to 186--Fe(II)2 bound to two sulfate ions (labelled B).
Interestingly, this complex does not form in the presence of TMP but the complex
containing three sulfate ions remains. This suggests that the TMP and the sulfate are
competing for the same site. This is not unexpected considering the similar nature of
sulfate and the phosphate group of TMP. When TMP is added, a peak is observed at
29770 Da which corresponds to 186--TMP and only at the higher Fe2+ concentration,
a peak at 29869 Da (186--TMP-Fe(II)2) is observed at low intensity. These results are
very different to those where was absent, where the predominant species was the
protein bound to two Fe2+ ions. This could indicate the Fe2+ ions were bound to 186
non-specifically and/or the binding of to 186 obstructed entry to the active site,
possibly due to a conformational change. These results suggest Fe2+ is not a
physiologically relevant metal ion in the - complex.
Figure 4.26 shows the ESI mass spectra of mixtures containing complex (186-) to
dysprosium ratios, (a) 1:1 with no TMP, (b) 1:1 with 80 M TMP, (c) 1:5 with no TMP
and (d) 1:5 with 80 M TMP. All spectra have a peak at 29448 Da corresponding to
186- which is at high intensity and a peak at 29608 Da corresponding to 186--
Dy(III) at relatively high intensity except in (d). In spectra (b) and (d), which contain
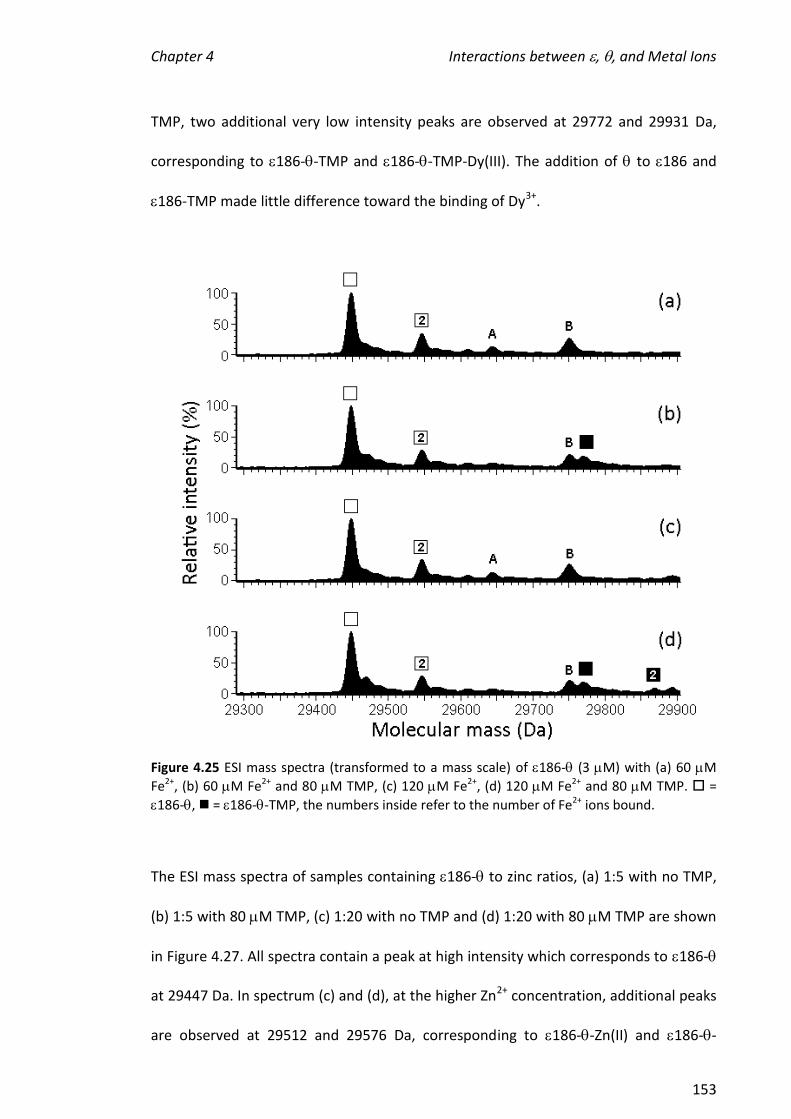
Chapter 4 Interactions between , , and Metal Ions
153
TMP, two additional very low intensity peaks are observed at 29772 and 29931 Da,
corresponding to 186--TMP and 186--TMP-Dy(III). The addition of to 186 and
186-TMP made little difference toward the binding of Dy3+.
Figure 4.25 ESI mass spectra (transformed to a mass scale) of 186- (3 M) with (a) 60 M
Fe2+, (b) 60 M Fe2+ and 80 M TMP, (c) 120 M Fe2+, (d) 120 M Fe2+ and 80 M TMP. =
186-, = 186--TMP, the numbers inside refer to the number of Fe2+ ions bound.
The ESI mass spectra of samples containing 186- to zinc ratios, (a) 1:5 with no TMP,
(b) 1:5 with 80 M TMP, (c) 1:20 with no TMP and (d) 1:20 with 80 M TMP are shown
in Figure 4.27. All spectra contain a peak at high intensity which corresponds to 186-
at 29447 Da. In spectrum (c) and (d), at the higher Zn2+ concentration, additional peaks
are observed at 29512 and 29576 Da, corresponding to 186--Zn(II) and 186--
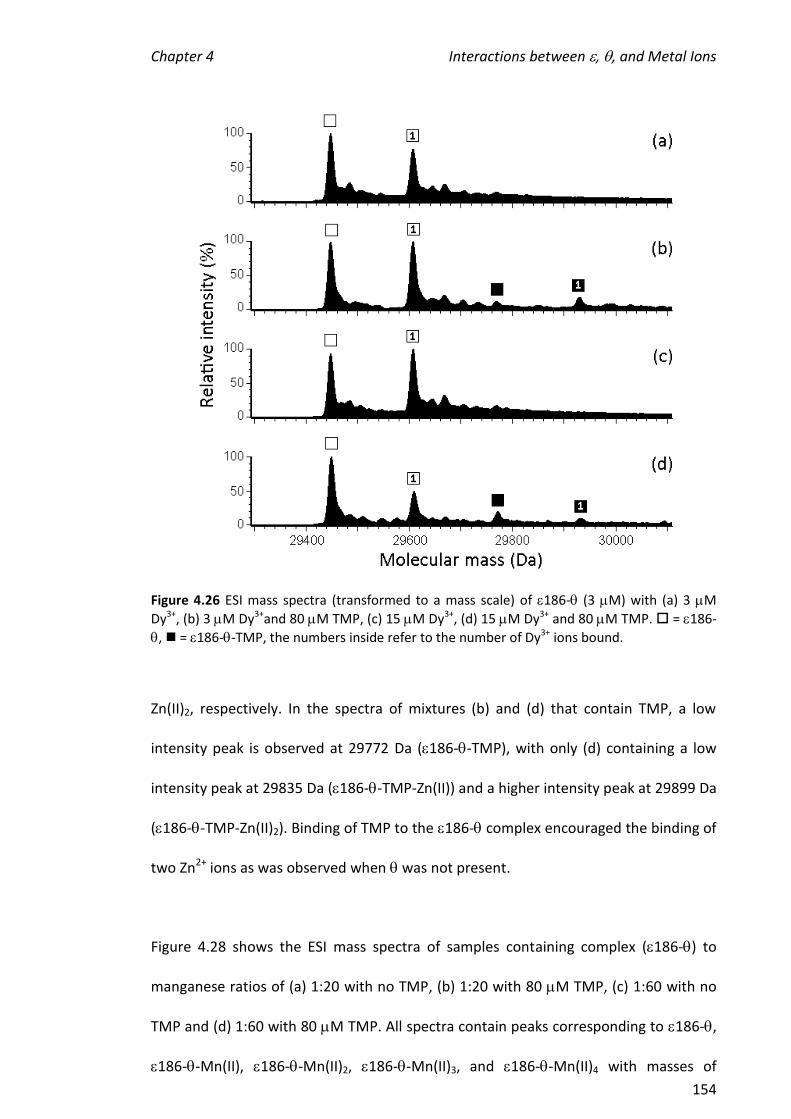
Chapter 4 Interactions between , , and Metal Ions
154
Figure 4.26 ESI mass spectra (transformed to a mass scale) of 186- (3 M) with (a) 3 M
Dy3+, (b) 3 M Dy3+and 80 M TMP, (c) 15 M Dy3+, (d) 15 M Dy3+ and 80 M TMP. = 186-
, = 186--TMP, the numbers inside refer to the number of Dy3+ ions bound.
Zn(II)2, respectively. In the spectra of mixtures (b) and (d) that contain TMP, a low
intensity peak is observed at 29772 Da (186--TMP), with only (d) containing a low
intensity peak at 29835 Da (186--TMP-Zn(II)) and a higher intensity peak at 29899 Da
(186--TMP-Zn(II)2). Binding of TMP to the 186- complex encouraged the binding of
two Zn2+ ions as was observed when was not present.
Figure 4.28 shows the ESI mass spectra of samples containing complex (186-) to
manganese ratios of (a) 1:20 with no TMP, (b) 1:20 with 80 M TMP, (c) 1:60 with no
TMP and (d) 1:60 with 80 M TMP. All spectra contain peaks corresponding to 186-,
186--Mn(II), 186--Mn(II)2, 186--Mn(II)3, and 186--Mn(II)4 with masses of

Chapter 4 Interactions between , , and Metal Ions
155
29445, 29498, 29551, 29605 and 29658 Da, respectively. In spectra where TMP was
present at the higher Mn2+ concentration, the binding of two Mn2+ ions (186--
Mn(II)2-TMP) was favoured. Similar to when Zn2+ was present, there is little difference
in the binding of Mn2+ to 186-TMP compared to 186--TMP.
Figure 4.27 ESI mass spectra (transformed to a mass scale) of 186- (3 M) with (a) 15 M
Zn2+, (b) 15 M Zn2+ and 80 M TMP, (c) 60 M Zn2+, (d) 60 M Zn2+ and 80 M TMP. =
186-, = 186--TMP, the numbers inside refer to the number of Zn2+ ions bound.
The binding studies discussed above have established that 186 and 186- can bind to
all the metal ions tested but not at equal affinities. Furthermore, the formation of a
two metal ion-protein complex containing Fe2+ is favoured in the absence of TMP, and
that containing Mn2+ and Zn2+ is favoured in the presence of the substrate mimic TMP.
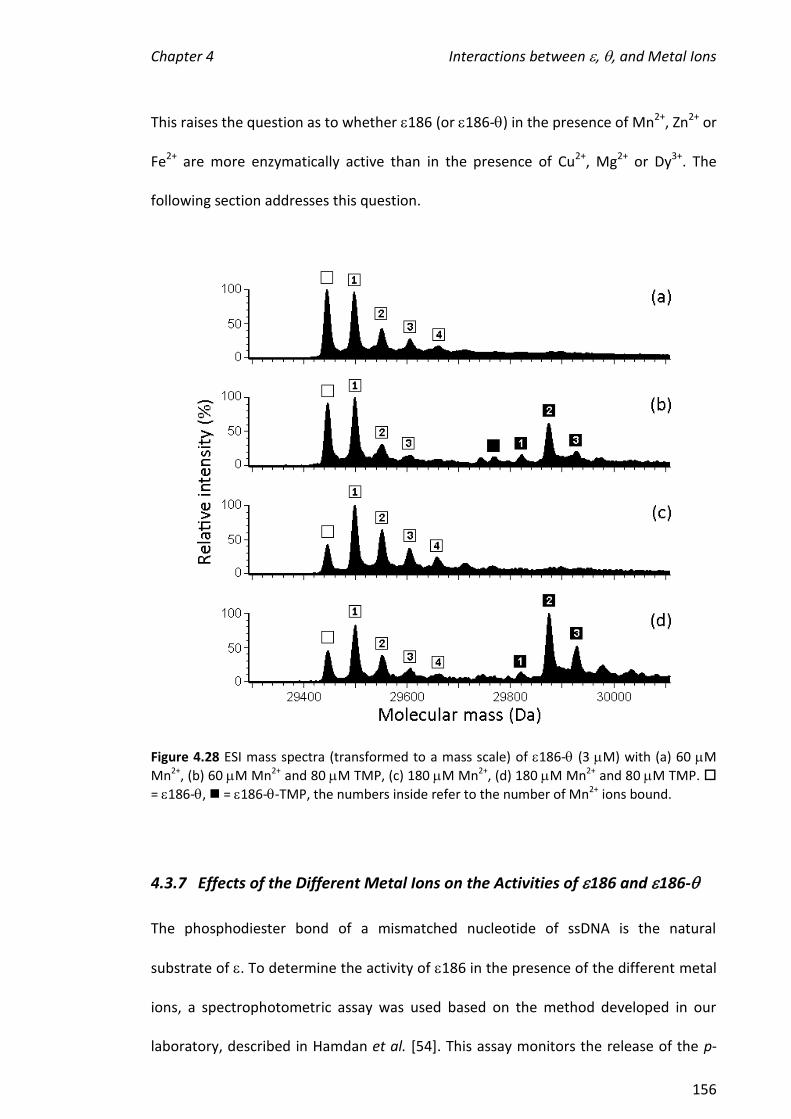
Chapter 4 Interactions between , , and Metal Ions
156
This raises the question as to whether 186 (or 186-) in the presence of Mn2+, Zn2+ or
Fe2+ are more enzymatically active than in the presence of Cu2+, Mg2+ or Dy3+. The
following section addresses this question.
Figure 4.28 ESI mass spectra (transformed to a mass scale) of 186- (3 M) with (a) 60 M
Mn2+, (b) 60 M Mn2+ and 80 M TMP, (c) 180 M Mn2+, (d) 180 M Mn2+ and 80 M TMP.
= 186-, = 186--TMP, the numbers inside refer to the number of Mn2+ ions bound.
4.3.7 Effects of the Different Metal Ions on the Activities of 186 and 186-
The phosphodiester bond of a mismatched nucleotide of ssDNA is the natural
substrate of . To determine the activity of 186 in the presence of the different metal
ions, a spectrophotometric assay was used based on the method developed in our
laboratory, described in Hamdan et al. [54]. This assay monitors the release of the p-

Chapter 4 Interactions between , , and Metal Ions
157
nitrophenolate ion from pNP-TMP. Previously in our laboratory, the activity of 186 in
the presence of Mn2+, Zn2+ and Dy3+ was determined [140, 246]. While the original
assay mixtures contained DTT [54], those containing Zn2+ or Dy3+ [140] formed a
precipitate upon the addition of DTT, so all assays were performed here in the absence
of DTT. In the current work, the activity of 186 has been investigated further by the
addition of the metal ions Mg2+, Cu2+ and Fe2+, and the binding partner, for
comparison to the ESI-MS results. The change in A420 with time for the hydrolysis of
pNP-TMP by 186 or 186- in the presence of 0.5 mM Mn2+, Zn2+, Mg2+ or Fe2+ is
shown in Figure 4.29 (a). From this assay profile it is clear that the rate of hydrolysis for
the enzyme containing Mn2+ is much higher than the other metal ions tested here.
Rates of hydrolysis are similar for 186 and 186- in the presence of the same metal
ion except the activity of the Mn2+ enzyme appears to have decreased slightly in the
presence of , with the kcat of 186- lower than that for 186, as was previously
observed by Hamdan et al. [54]. Assays in the presence of Cu2+ or Dy3+ are not shown
as the activity was similar to hydrolysis of pNP-TMP in the absence of enzyme.
The catalytic parameters for the 186 and 186- catalysed hydrolysis in the presence
of 0.5 mM Mn2+, Zn2+, Mg2+ and Fe2+ were determined by examining the effect of
changing the substrate concentration. The initial velocity (v0) for the hydrolysis of pNP-
TMP was determined by measuring the rate of change at A420. These rates were linear
for the first 2 to 3 minutes then significantly decreased due to inhibition by TMP, a
reaction product, also observed in Hamdan et al. [54]. Assays containing 186 and
Mn2+ exhibited the highest specific activity under these experimental conditions (5.3
0.2 mol min-1 mg-1), at least 17-fold higher than when Fe2+, Zn2+, Mg2+, Cu2+ or Dy3+
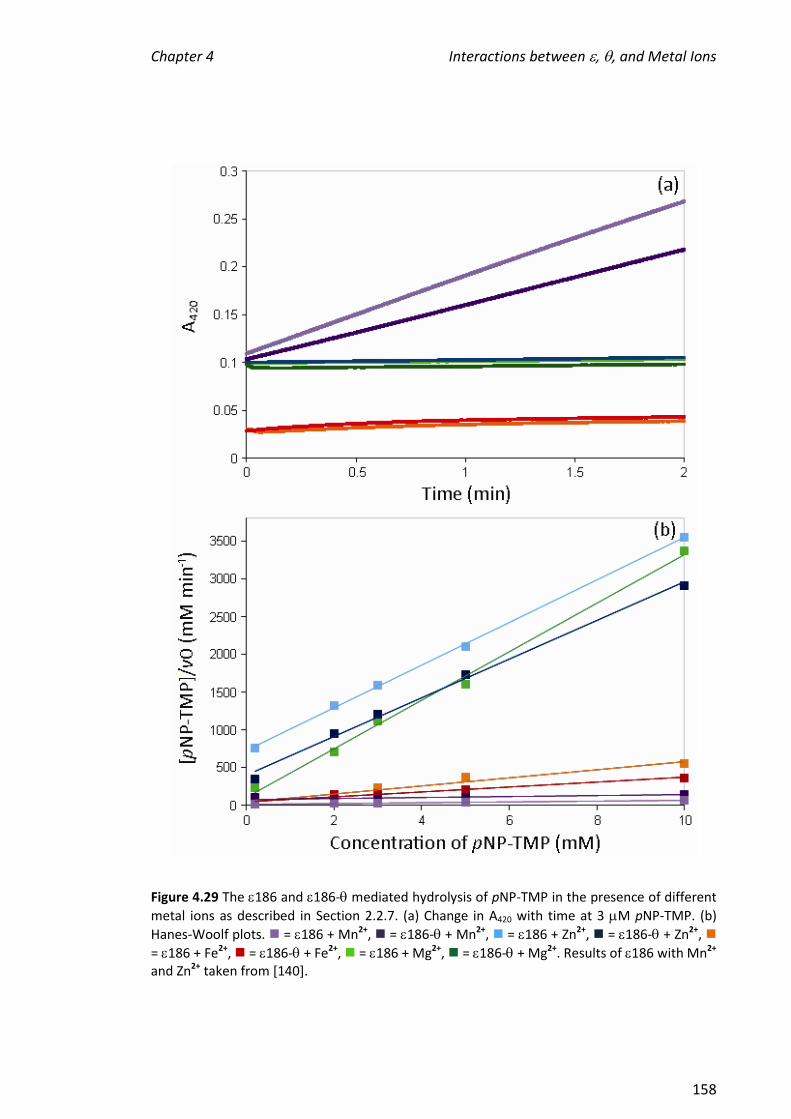
Chapter 4 Interactions between , , and Metal Ions
158
Figure 4.29 The 186 and 186- mediated hydrolysis of pNP-TMP in the presence of different
metal ions as described in Section 2.2.7. (a) Change in A420 with time at 3 M pNP-TMP. (b)
Hanes-Woolf plots. = 186 + Mn2+, = 186- + Mn2+, = 186 + Zn2+, = 186- + Zn2+,
= 186 + Fe2+, = 186- + Fe2+, = 186 + Mg2+, = 186- + Mg2+. Results of 186 with Mn2+ and Zn2+ taken from [140].
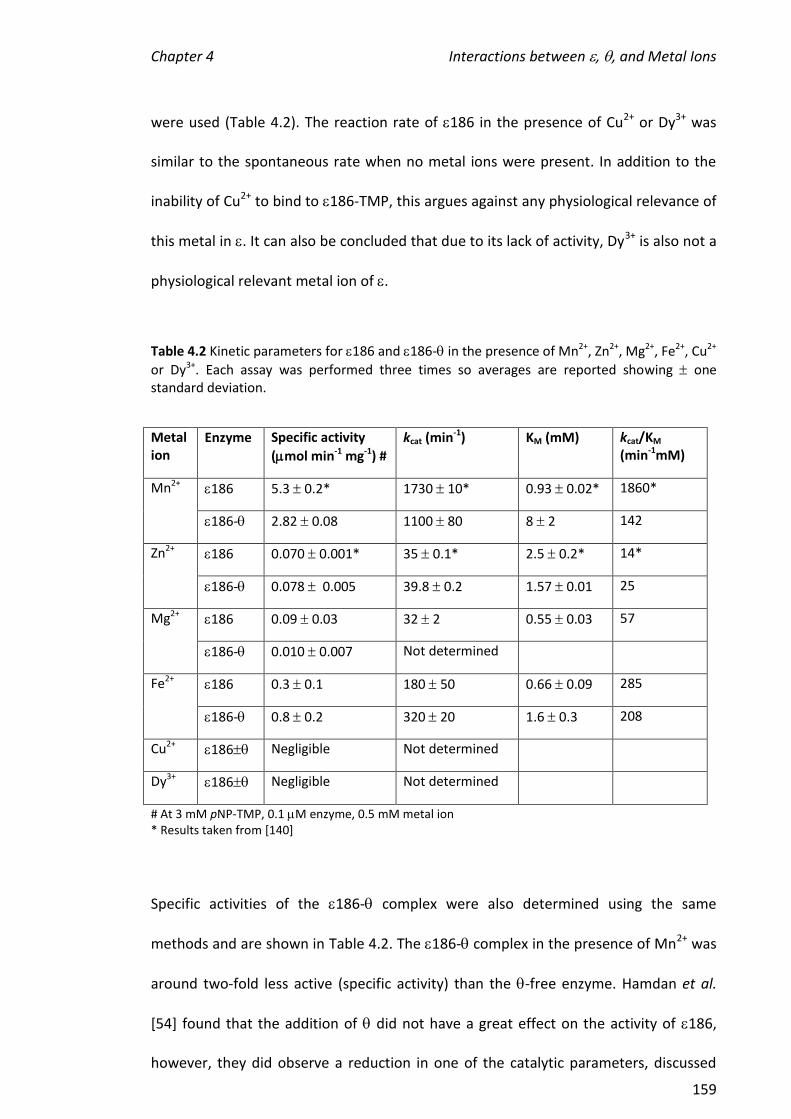
Chapter 4 Interactions between , , and Metal Ions
159
were used (Table 4.2). The reaction rate of 186 in the presence of Cu2+ or Dy3+ was
similar to the spontaneous rate when no metal ions were present. In addition to the
inability of Cu2+ to bind to 186-TMP, this argues against any physiological relevance of
this metal in . It can also be concluded that due to its lack of activity, Dy3+ is also not a
physiological relevant metal ion of .
Table 4.2 Kinetic parameters for 186 and 186- in the presence of Mn2+, Zn2+, Mg2+, Fe2+, Cu2+
or Dy3+. Each assay was performed three times so averages are reported showing one standard deviation.
Metal ion
Enzyme Specific activity
(mol min-1 mg-1) #
kcat (min-1) KM (mM) kcat/KM
(min-1mM)
Mn2+ 186 5.3 0.2* 1730 10* 0.93 0.02* 1860*
186- 2.82 0.08 1100 80 8 2 142
Zn2+ 186 0.070 0.001* 35 0.1* 2.5 0.2* 14*
186- 0.078 0.005 39.8 0.2 1.57 0.01 25
Mg2+ 186 0.09 0.03 32 2 0.55 0.03 57
186- 0.010 0.007 Not determined
Fe2+ 186 0.3 0.1 180 50 0.66 0.09 285
186- 0.8 0.2 320 20 1.6 0.3 208
Cu2+ 186 Negligible Not determined
Dy3+ 186 Negligible Not determined
# At 3 mM pNP-TMP, 0.1 M enzyme, 0.5 mM metal ion * Results taken from [140]
Specific activities of the 186- complex were also determined using the same
methods and are shown in Table 4.2. The 186- complex in the presence of Mn2+ was
around two-fold less active (specific activity) than the -free enzyme. Hamdan et al.
[54] found that the addition of did not have a great effect on the activity of 186,
however, they did observe a reduction in one of the catalytic parameters, discussed
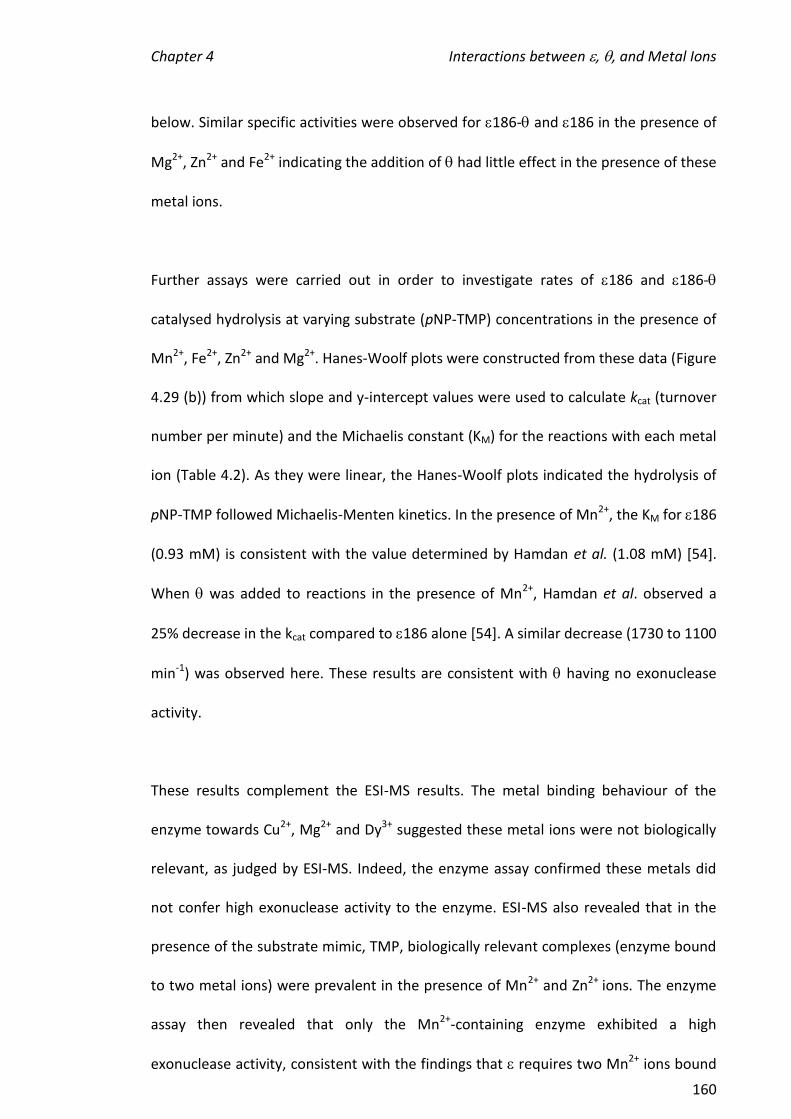
Chapter 4 Interactions between , , and Metal Ions
160
below. Similar specific activities were observed for 186- and 186 in the presence of
Mg2+, Zn2+ and Fe2+ indicating the addition of had little effect in the presence of these
metal ions.
Further assays were carried out in order to investigate rates of 186 and 186-
catalysed hydrolysis at varying substrate (pNP-TMP) concentrations in the presence of
Mn2+, Fe2+, Zn2+ and Mg2+. Hanes-Woolf plots were constructed from these data (Figure
4.29 (b)) from which slope and y-intercept values were used to calculate kcat (turnover
number per minute) and the Michaelis constant (KM) for the reactions with each metal
ion (Table 4.2). As they were linear, the Hanes-Woolf plots indicated the hydrolysis of
pNP-TMP followed Michaelis-Menten kinetics. In the presence of Mn2+, the KM for 186
(0.93 mM) is consistent with the value determined by Hamdan et al. (1.08 mM) [54].
When was added to reactions in the presence of Mn2+, Hamdan et al. observed a
25% decrease in the kcat compared to 186 alone [54]. A similar decrease (1730 to 1100
min-1) was observed here. These results are consistent with having no exonuclease
activity.
These results complement the ESI-MS results. The metal binding behaviour of the
enzyme towards Cu2+, Mg2+ and Dy3+ suggested these metal ions were not biologically
relevant, as judged by ESI-MS. Indeed, the enzyme assay confirmed these metals did
not confer high exonuclease activity to the enzyme. ESI-MS also revealed that in the
presence of the substrate mimic, TMP, biologically relevant complexes (enzyme bound
to two metal ions) were prevalent in the presence of Mn2+ and Zn2+ ions. The enzyme
assay then revealed that only the Mn2+-containing enzyme exhibited a high
exonuclease activity, consistent with the findings that requires two Mn2+ ions bound
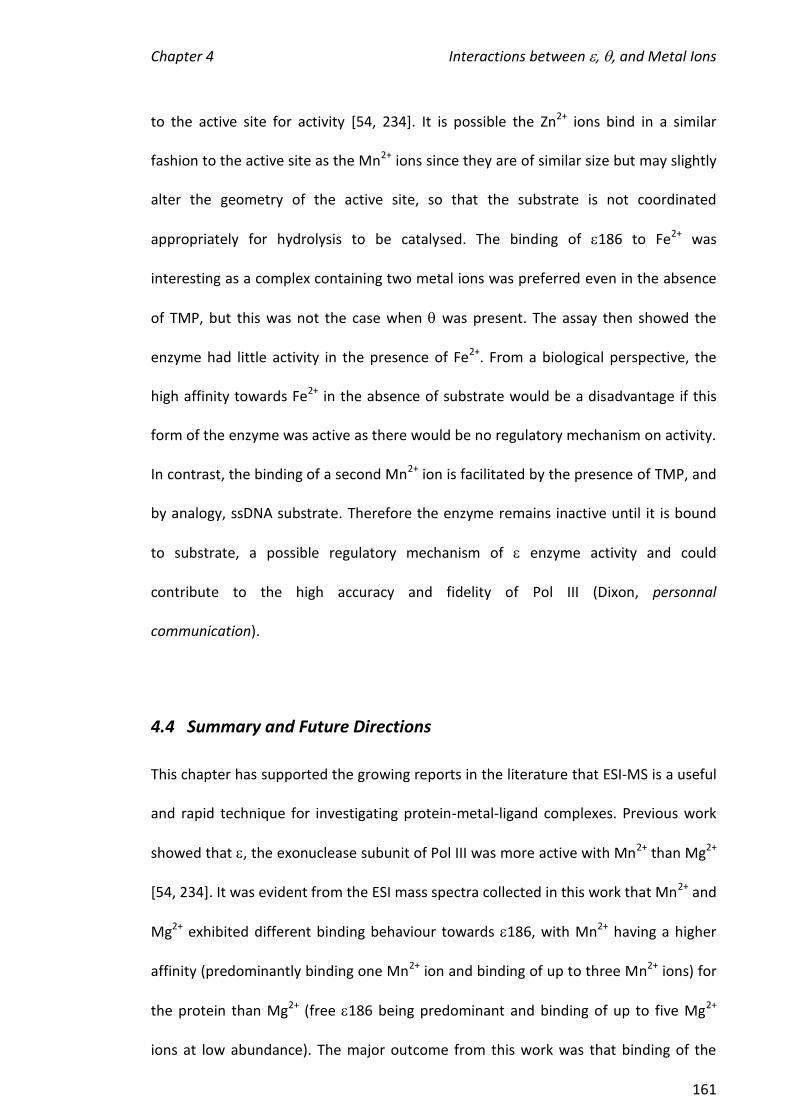
Chapter 4 Interactions between , , and Metal Ions
161
to the active site for activity [54, 234]. It is possible the Zn2+ ions bind in a similar
fashion to the active site as the Mn2+ ions since they are of similar size but may slightly
alter the geometry of the active site, so that the substrate is not coordinated
appropriately for hydrolysis to be catalysed. The binding of 186 to Fe2+ was
interesting as a complex containing two metal ions was preferred even in the absence
of TMP, but this was not the case when was present. The assay then showed the
enzyme had little activity in the presence of Fe2+. From a biological perspective, the
high affinity towards Fe2+ in the absence of substrate would be a disadvantage if this
form of the enzyme was active as there would be no regulatory mechanism on activity.
In contrast, the binding of a second Mn2+ ion is facilitated by the presence of TMP, and
by analogy, ssDNA substrate. Therefore the enzyme remains inactive until it is bound
to substrate, a possible regulatory mechanism of enzyme activity and could
contribute to the high accuracy and fidelity of Pol III (Dixon, personnal
communication).
4.4 Summary and Future Directions
This chapter has supported the growing reports in the literature that ESI-MS is a useful
and rapid technique for investigating protein-metal-ligand complexes. Previous work
showed that , the exonuclease subunit of Pol III was more active with Mn2+ than Mg2+
[54, 234]. It was evident from the ESI mass spectra collected in this work that Mn2+ and
Mg2+ exhibited different binding behaviour towards 186, with Mn2+ having a higher
affinity (predominantly binding one Mn2+ ion and binding of up to three Mn2+ ions) for
the protein than Mg2+ (free 186 being predominant and binding of up to five Mg2+
ions at low abundance). The major outcome from this work was that binding of the
Chapter 4 Interactions between , , and Metal Ions
162
substrate mimic, TMP, caused the binding of two Mn2+ ions to be favoured and that
these metals ions facilitated the binding of TMP. This was also observed for the 186-
complex. This observation provides confidence that the complexes observed by ESI-MS
represent complexes found in solution.
The behaviour observed for the binding of Zn2+ to 186 was similar to what was
observed for Mn2+ (predominantly one Zn2+ ion bound and up to four Zn2+ ions bound).
In contrast, 186 showed a high affinity for Fe2+, predominantly binding to two Fe2+
ions, even at low metal concentrations and in the absence of TMP. Spectra containing
186 with Fe2+ also showed up to three Fe2+ ions bound to the protein at higher metal
concentrations and additional adducts most likely corresponding to ammonium and
sulfate ions. It is not surprising that sulfate binds to 186 considering the active site is a
nucleotide-binding site. It is likely that sulfate can occupy the phosphate-binding
region. This could be tested in competition experiments where ammonium sulfate is in
competition with TMP. It is likely, however, that TMP will bind more tightly since it has
additional interactions (e.g. the thymidine moiety) with 186 beyond those only
involving the phosphate group.
Some experiments were then performed using iron acetate but minimal Fe2+ binding
was observed, possibly due to the precipitation/oxidation of the iron. The conditions
under which a two iron enzyme can be made and its activity will be investigated
further especially in view of the occurrence of enzymes with binuclear iron centres
including the purple phosphatases and ribonucleotide reductase. In the case of the
former class of proteins, the iron centre can be reconstituted by treatment with Fe2+ in
the presence of a mild reducing agent such as mercaptoethanol or ascorbate [262].
Chapter 4 Interactions between , , and Metal Ions
163
The presence of TMP had little effect on the binding of 186 to Cu2+ or Dy3+ but
facilitated the formation of complexes containing two Zn2+ ions, similar to that
observed in the presence of Mn2+. In samples containing Fe2+, the presence of TMP
greatly inhibited the formation of complexes containing three Fe2+ ions and the
formation of ammonium and sulfate adducts. In the absence of metal ions, TMP was
found to have a low affinity towards 186 (and 186-). The addition of had little
effect on the metal binding behaviour towards the enzyme, consistent with previous
work; apart from preventing Cu2+ precipitation and an unexpected result with Fe2+. The
186- complex exhibited minimal binding to Fe2+ despite the prevalence of 186-
Fe(II)2 in the absence of . This could indicate this metal bound to 186 non-specifically
at a location other than the active site such that the binding interfered with the 186-
interaction, either directly or as a result of a conformational change and will be
investigated in more detail in future work. X-ray crystal structures of 186-Mn(II)2
complexes have been determined in our laboratory and it will be of interest to
determine the crystal structure in the presence of Fe2+. The conditions for preparation
of 186-Fe(II)2 will be guided by the ESI-MS experiments. The enzyme activity assay
confirmed that Mn2+ supported enzyme activity to a greater extent than Zn2+ and Fe2+.

Chapter 5 CCS Determination of Proteins by IM-MS
164
Chapter 5 Determination of Collision Cross Sections of Proteins
and Assemblies using Travelling Wave Ion Mobility MS
5.1 Introduction
Ion mobility mass spectrometry (IM-MS) is the coupling of ion mobility (IM)
separations with mass spectrometry (MS). Four different types of IM spectrometry are
commonly coupled to mass spectrometry: (i) drift time ion mobility spectrometry (the
first, and most commonly used form of IM spectrometry) [263], (ii) differential-
mobility spectrometry (DMS) [264], also known as field-asymmetric waveform ion
mobility spectrometry, (iii) aspiration ion mobility spectrometry (AIMS) [265] and (iv)
travelling wave ion mobility spectrometry (TWIMS) [145].
5.1.1 Early IM-MS Instruments
Traditional IM-MS instruments measure the ‘drift time’ of an ion travelling through a
drift tube, driven through a buffer gas using a uniform electric field [266]. They can be
used to determine the collision cross section (CCS) of an analyte (see Section 2.2.16).
The drift time (the ion mobility) depends on an ion’s mass, charge, size and shape, and
the CCS corresponds to the area of an ion that encounters inert gas molecules. The
first IM-MS instrument consisted of a low field drift cell coupled to a magnetic sector
mass spectrometer and was used to study ion mobilities and ion molecule reactions in
gases [267]. Magnetic sector mass analysers were, however, quickly replaced with
time-of-flight (TOF) and quadrupole mass spectrometers [268]. Low pressures (~0.1 to
Chapter 5 CCS Determination of Proteins by IM-MS
165
10 mbar) were typically used in the early years of IM-MS; however, in the 1970s, a
commercial IM-MS instrument was available which operated at ambient pressure. In
most IM-MS instruments used during the 1970s and 1980s ions were introduced at
ambient pressure [269, 270].
Drift time instruments are also capable of utilising reduced pressures for the
introduction of ions, typically housing the IM cell within the MS vacuum region, with
the pressure inside the IM cell set to a few millibar [267, 271, 272]. This ensures ions
are efficiently transferred from the IM cell to the MS region. An alternate
configuration, situating the IM cell before the MS region, allows for the CCS
determination of mass-selected ions [273, 274]. IM instruments utilising ambient
pressure have been traditionally used as portable analytical devices independent of a
mass spectrometer, which can separate and detect trace amounts of drugs, explosives
and chemical warfare agents; and as a detector for gas and liquid chromatography
[275-278]. Higher resolution and greater separation is achieved when IM is combined
with mass spectrometry but this combination also comes with a disadvantage. As there
is inefficient transfer of ions from ambient pressure through to the mass spectrometer
vacuum, periodic small pulses of ions need to be introduced into the drift region,
creating a duty cycle which decreases the sensitivity of the instrument [279-281].
DMS [264] and AIMS [265] alleviate the duty cycle problem by continuously
introducing ions into the spectrometer. In DMS, the ions are passed between two
cylindrical or flat parallel electrodes. The buffer gas then flows perpendicularly to the
direction of the electric field which is alternated between the two electrodes allowing
the ions to move in two directions [282]. The instrument separates ions according to
Chapter 5 CCS Determination of Proteins by IM-MS
166
the difference in mobilities between the two fields as one direction contains an electric
field twice as strong but half the duration of that in the opposite direction. AIMS also
utilises a perpendicular gas flow relative to the electric field direction [283], with ions
introduced into an electric field generated by a series of segmented electrodes. Ions
eventually collide with one of these electrodes and the distance they travel allows for
the measurement of their ion mobility. An advantage of the presence of two sets of
opposing segmented electrodes means that both positive and negative ions can be
measured simultaneously as they move in opposite directions. Both DMS and AIMS
instruments operate under ambient atmospheric pressure conditions. Common uses
for these types of IM instruments are environmental analysis, proteomics and as an
analytical tool for detecting explosives, drugs and toxic compounds [282, 283].
5.1.2 Modern IM-MS Instruments
Just as the availability of soft ionisation techniques such as ESI and MALDI enabled
important advantages in the analysis of biomolecules, this also led to the improvement
of IM-MS instrumentation, paving the way for the analysis of large biomolecules using
IM-MS. During the mid-1990s, the first IM-MS instrument used to obtain IM data of a
native protein utilised an ESI source, a conventional drift tube and a quadrupole mass
spectrometer [284]. With this instrument, Clemmer and co-workers obtained IM
information on different conformers of cytochrome c and were able to directly
calculate CCS values from the experimental drift times. While this provided powerful
information that has implications concerning folding pathways in proteins, the
sensitivity of this instrument was relatively low due to the low duty cycle resulting
from the discontinuous method of ion injection.
Chapter 5 CCS Determination of Proteins by IM-MS
167
Around the same time, the Bowers research group added a MALDI source to an
instrument they had previously modified [285], incorporating an MS region preceding
the drift cell to enable the mass-selection of ions (introduced at low pressures) before
the IM stage [286]. With this instrument they were able to perform drift time
measurements on polyethylene glycol polymers up to 19 units long (their previous
instrument contained an electron/chemical ionisation source, not compatible with
large molecules). Around the same time, Cox et al. [287] introduced an IM region to a
triple quadrupole mass spectrometer, fitted with an ESI source. In this instrument, the
second quadrupole was replaced with an RF octapole. By changing the pressure in this
IM region they were able to change the mobilities of several proteins (e.g. myoglobin,
cytochrome c and trypsinogen), as evidenced by the presence of different conformers
in the mass spectra. These innovations have paved the way for the IM investigation of
a variety of biomolecules including proteins, peptides, nucleic acids and carbohydrates.
Today, several commercial instruments are available which typically contain an IM
component (drift time, DMS or TWIMS) coupled to a range of MS devices such as TOF,
quadrupole, ion trap or Fourier transform ion-cyclotron resonance (FTICR). One
instrument not associated with a mass spectrometer is known as GEMMA (gas phase
electrophoretic mobility macromolecule analyser) [288, 289]. This instrument contains
an ESI source, a neutralising chamber (which creates primarily neutral and singly
charged molecules), a DMS analyser and a condensation particle counter. This
instrument is not connected to an MS analyser; instead, mass measurements are
based on a simple model relating molecular weight to the diameter of a sphere and
effective density. The singly charged proteins are separated according to their
mobilities through air, which are then converted to electrophoretic mobility diameters.
Chapter 5 CCS Determination of Proteins by IM-MS
168
As with all forms of IM, electrophoretic mobility depends on the charge and shape of
the molecule. While the resolving power of the device is relatively low, Loo et al. [290]
were able to study the 690 kDa 20S proteasome complex. They found that diameter
calculations obtained from the GEMMA analysis of the 7-ring and the full 20S
proteasome from Methanosarcina thermophila were similar to those determined from
crystal structures.
Of the IM instruments that are connected to MS, ion trap and FTICR mass
spectrometers are typically coupled to DMS instruments [268]. Ion trap instruments
have applications in performing MSn analyses on mobility-selected ions and are useful
for the separation of isomers from mixtures [291], while FTICR instruments have been
useful for the analysis of protein and organic polymer conformers separated by IM
[268, 292]. IM instruments coupled to quadrupole mass spectrometers such as the
chiral IM-quadrupole-MS instrument are useful for targeted isomeric and isobaric
separations [280]. Although a continuous stream of ions is produced from an ESI
source, the drift tube used means the ion gate is only open for 1% of the duty cycle,
reducing the sensitivity. This can be overcome by coupling the quadrupole to a DMS
[293] or AIMS [294] device.
The coupling of a drift time IM cell to a TOF mass spectrometer was first described by
McAfee and co-workers [271, 295] and allowed for the analysis of whole cell cultures
[296] and mixtures of peptides from protein digests [297]. A relatively new version of
an IM-TOF-MS system is commercially available from Waters and is known as the
Synapt HDMSTM (high definition mass spectrometry) [145, 190, 266]. The IM
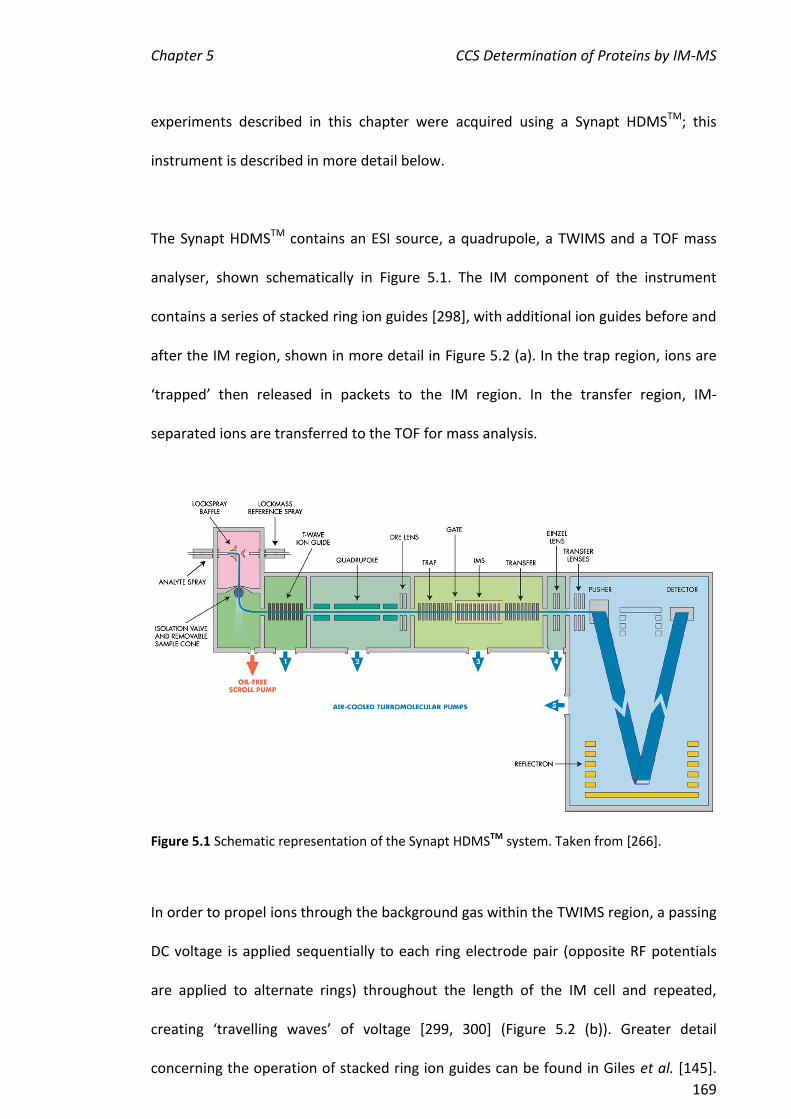
Chapter 5 CCS Determination of Proteins by IM-MS
169
experiments described in this chapter were acquired using a Synapt HDMSTM; this
instrument is described in more detail below.
The Synapt HDMSTM contains an ESI source, a quadrupole, a TWIMS and a TOF mass
analyser, shown schematically in Figure 5.1. The IM component of the instrument
contains a series of stacked ring ion guides [298], with additional ion guides before and
after the IM region, shown in more detail in Figure 5.2 (a). In the trap region, ions are
‘trapped’ then released in packets to the IM region. In the transfer region, IM-
separated ions are transferred to the TOF for mass analysis.
Figure 5.1 Schematic representation of the Synapt HDMSTM system. Taken from [266].
In order to propel ions through the background gas within the TWIMS region, a passing
DC voltage is applied sequentially to each ring electrode pair (opposite RF potentials
are applied to alternate rings) throughout the length of the IM cell and repeated,
creating ‘travelling waves’ of voltage [299, 300] (Figure 5.2 (b)). Greater detail
concerning the operation of stacked ring ion guides can be found in Giles et al. [145].
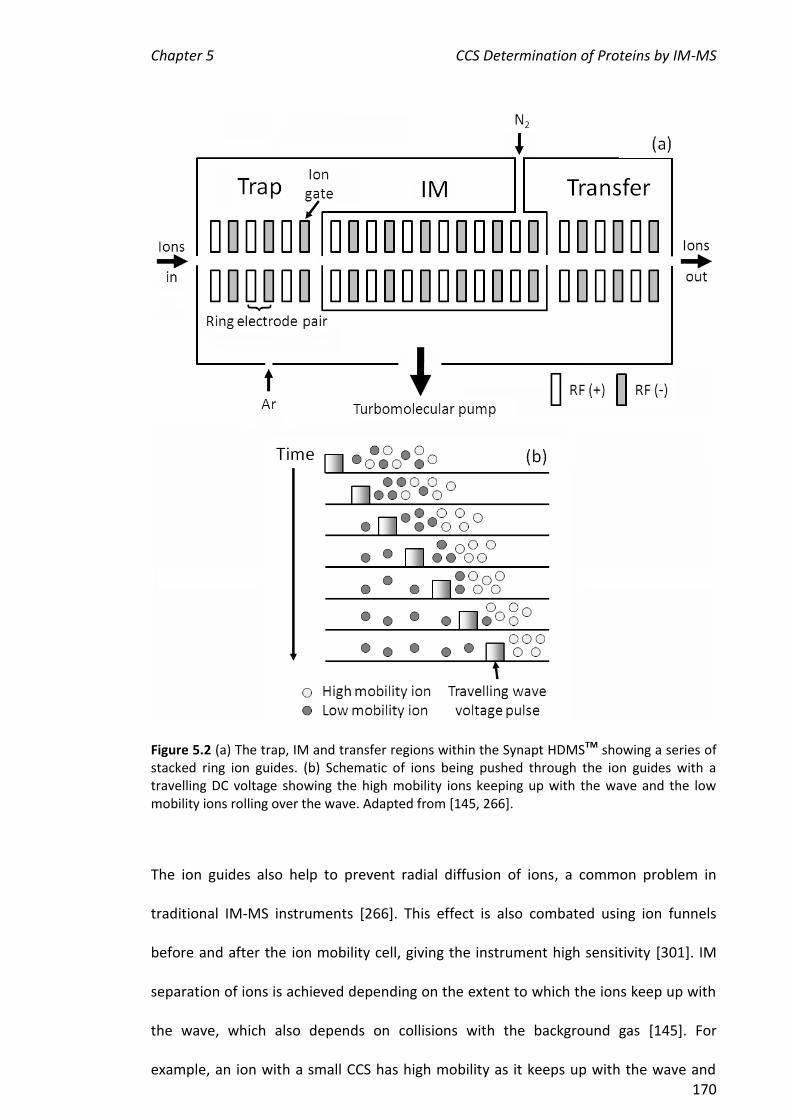
Chapter 5 CCS Determination of Proteins by IM-MS
170
Figure 5.2 (a) The trap, IM and transfer regions within the Synapt HDMSTM showing a series of stacked ring ion guides. (b) Schematic of ions being pushed through the ion guides with a travelling DC voltage showing the high mobility ions keeping up with the wave and the low mobility ions rolling over the wave. Adapted from [145, 266].
The ion guides also help to prevent radial diffusion of ions, a common problem in
traditional IM-MS instruments [266]. This effect is also combated using ion funnels
before and after the ion mobility cell, giving the instrument high sensitivity [301]. IM
separation of ions is achieved depending on the extent to which the ions keep up with
the wave, which also depends on collisions with the background gas [145]. For
example, an ion with a small CCS has high mobility as it keeps up with the wave and
Chapter 5 CCS Determination of Proteins by IM-MS
171
hence traverses the IM region in a short period. In contrast, an ion with a larger CCS
has lower mobility as it experiences more collisions with the surrounding gas
molecules leading it to roll back over the top of some waves, giving it a longer drift
time. The TOF analyser is capable of acquiring mass spectra on a sufficiently short time
scale to enable the collection of IM data on the millisecond scale [266]. This is not
possible for ion trap and quadrupole mass analysers.
Of all of the IM techniques, only drift time IM enables the direct determination of CCS.
It is difficult to collect IM information on large biomolecules using these instruments,
however, despite their low sensitivity and poor duty cycles, progress is being made
[151]. The TWIMS method combined with ESI and a TOF detector is suitable for
analysis of large proteins and has been used by Robinson and co-workers who
investigated conformations of the trp RNA binding attenuation protein (TRAP) which
forms an 11-membered ring from its 8 kDa monomers [190]. They used a modified Q-
TOF mass spectrometer [145] as a forerunner to the Synapt HDMSTM instrument. While
IM-TOF-MS instruments containing a MALDI source are also available [302], they are
mainly used for the analysis of peptides and lipids and for tissue imaging [303] and will
not be discussed here.
The mobility of an ion and its relationship to CCS is well understood in conventional
drift time IM-MS [304, 305]. This is because the electric field is constant. In TWIMS,
however, the electric potential varies with time and with the length of the drift tube
[150]. As drift times determined from IM instruments employing TWIMS are not simply
related to CCS, a calibration must be performed using proteins with CCS values
determined in traditional drift time instruments. In the study of the TRAP protein
Chapter 5 CCS Determination of Proteins by IM-MS
172
assembly, CCS values were calculated from a calibration using cytochrome c. Here,
experimentally determined CCS values were compared with those determined using X-
ray crystallography and model structures. It was found that the [M+19H]19+ ion of TRAP
had a similar CCS to that determined from the X-ray structure and CCS values of the
higher charge states, indicating more compact structures, correlated well with those
determined using models. This study also showed that TRAP was stabilised when
tryptophan was added, as revealed by the larger CCS of the [M+20H]20+ ion compared
to the apoprotein. CCS values increased when RNA was added in addition to
tryptophan, in agreement with RNA binding to the outside of the ring structure [190].
Since this study was carried out, determinations of CCS using TWIMS have improved
e.g. using multiple calibrant proteins and acquiring these under denaturing conditions
to give a larger range of CCS values, with recent advances by the Robinson and
Ashcroft groups [143, 150]. The calibration curves are constructed using CCS values
determined by a drift time instrument coupled to a quadrupole mass analyser with an
ESI source [148] and are available on the internet (Clemmer Collision Cross Section
Database [147]). The use of these calibration methods described by Ruotolo et al.
[143] and Smith et al. [150], will be investigated in this chapter.
5.2 Scope of this Chapter
It is only recently that the Synapt HDMSTM TWIMS mass spectrometer has become
commercially available and has been applied to the CCS determination of large
biomolecules. CCS values for E. coli clamp loader proteins (Section 1.1.3) in two
independent, but collaborative laboratories were determined. Prior to IM analysis, it is
Chapter 5 CCS Determination of Proteins by IM-MS
173
essential that conditions for the nanoESI-MS of the protein/complex in question are
established. Therefore, optimisation experiments were carried out and discussed
where appropriate throughout this chapter. The proteins for which values of CCS were
determined in this chapter were subunits from the E. coli replisome, commercially
available proteins and the 536 kDa, sixteen subunit, tobacco rubisco. Additionally,
literature experimental CCS values were compared with those determined in this
chapter to investigate the reproducibility of the instrument across the two
laboratories.
Preliminary experiments involved the mass spectrometric analysis of individual
proteins and monitoring the assembly of the clamp loader complex, conducted in
parallel with our collaborators in the Robinson group at the University of Cambridge
(now at the University of Oxford). Final CCS results were compared across laboratories
for , , , 2, 3, 4, 2-, 3- and 3--. Results discussed in this chapter are from
the University of Wollongong Beck laboratory and have been compared or extended
by the Robinson group as stated. This chapter also describes a comparison of two
different CCS determinations. The commercially available, well studied proteins
investigated were myoglobin, cytochrome c, lysozyme, ovalbumin and transferrin, with
CCS values of the first three proteins determined previously [150]. The CCS of the large
multisubunit protein, rubisco, was also determined. This is of interest as it is much
larger than the calibrant ions used and there are few published studies on the
limitations of the CCS calibration curves. Finally, since the results reported in Chapter 3
suggest a substantial conformation change of when it binds to C16, the CCS of and
-C16 were determined.
Chapter 5 CCS Determination of Proteins by IM-MS
174
5.3 Results and Discussion
5.3.1 NanoESI-MS Analysis of and from the E. coli Clamp Loader Complex
As this was the first time nanoESI mass spectra were to be acquired of the and
subunits in our laboratory, the first step was to confirm their masses by dialysing them
against 0.1% formic acid. The masses of and determined from this method were
38704.9 0.5 and 36938.0 1.0 Da, respectively, in agreement with the masses
calculated from their amino acid sequences (38703.3 and 36896.1 Da, respectively).
Next, both subunits were dialysed against 0.2 M NH4OAc, pH 7.2, in order to obtain
mass spectra of the proteins in their native states. After the dialysis of , however,
some precipitate was observed so the sample was briefly centrifuged (as described in
Section 2.2.8) before determination of protein concentration. Initial instrument
conditions employed here were those described in Table 2.4 (Q-TOF UltimaTM). Mass
spectra of and were successfully obtained using these conditions (Figure 5.3 (a)
and (b)). The mass spectrum of shows ions at m/z 2978.7, 3226.8, 3520.1 and 3871.9
([M+13H]13+ to [M+10H]10+) and that of shows ions at m/z 2847.7, 3084.9, 3365.2
and 3701.6 ([M+13H]13+ to [M+10H]10+).
The next step was to determine if a complex of and could be detected in the mass
spectrometer so nanoESI mass spectra were acquired over a greater m/z range (2750
to 5000). Figure 5.4 shows the nanoESI mass spectra of alone (a), alone (b) and an
equimolar mixture of the two proteins (c). The - and - homodimers were
observed in the spectra of (a) and (b), respectively. Ions from - were observed at
m/z 4303.1, 4555.8 and 4844.3 ([M+18H]18+ to [M+16H]16+) and ions from - were
observed at m/z 4113.4, 4355.1 and 4626.7 ([M+18H]18+ to [M+16H]16+). In both
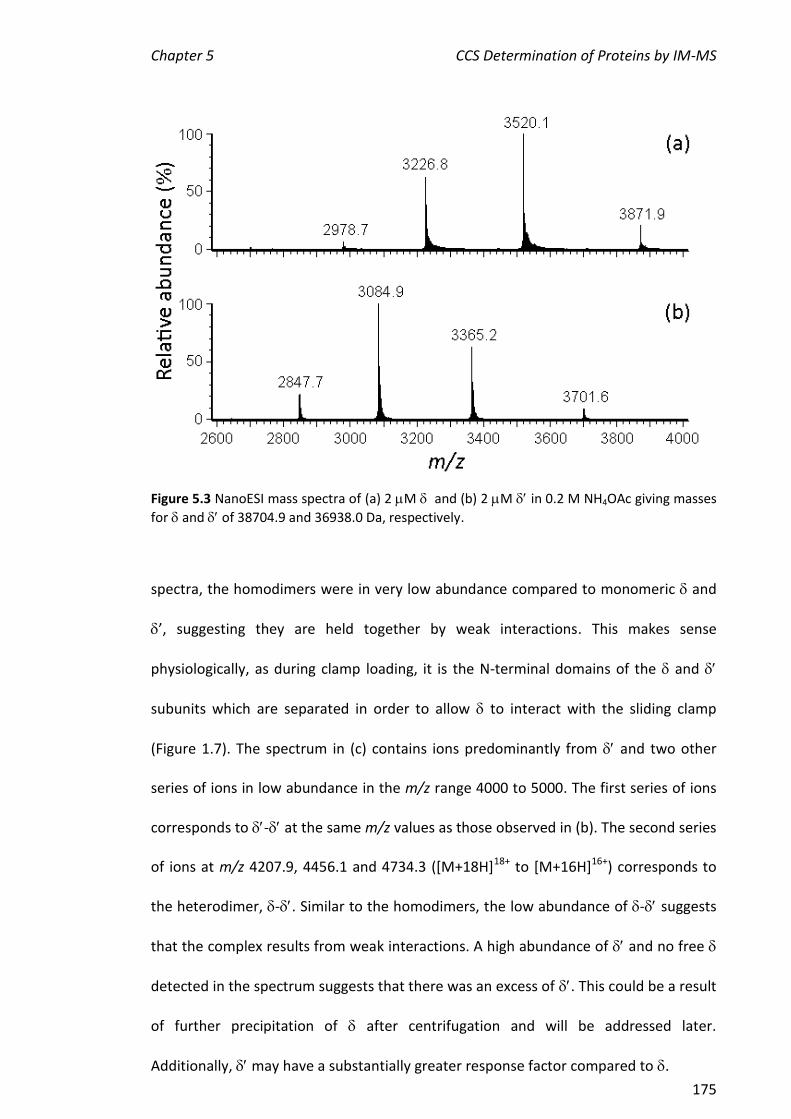
Chapter 5 CCS Determination of Proteins by IM-MS
175
Figure 5.3 NanoESI mass spectra of (a) 2 M and (b) 2 M in 0.2 M NH4OAc giving masses
for and of 38704.9 and 36938.0 Da, respectively.
spectra, the homodimers were in very low abundance compared to monomeric and
’, suggesting they are held together by weak interactions. This makes sense
physiologically, as during clamp loading, it is the N-terminal domains of the and
subunits which are separated in order to allow to interact with the sliding clamp
(Figure 1.7). The spectrum in (c) contains ions predominantly from and two other
series of ions in low abundance in the m/z range 4000 to 5000. The first series of ions
corresponds to - at the same m/z values as those observed in (b). The second series
of ions at m/z 4207.9, 4456.1 and 4734.3 ([M+18H]18+ to [M+16H]16+) corresponds to
the heterodimer, -. Similar to the homodimers, the low abundance of - suggests
that the complex results from weak interactions. A high abundance of and no free
detected in the spectrum suggests that there was an excess of . This could be a result
of further precipitation of after centrifugation and will be addressed later.
Additionally, may have a substantially greater response factor compared to .

Chapter 5 CCS Determination of Proteins by IM-MS
176
Figure 5.4 NanoESI mass spectra of (a) 2 M , (b) 2 M , (c) 2 M with 2 M in 0.2 M
NH4OAc. The m/z region between 4000 and 5000 is magnified 24 times in all spectra. = ,
= , = -, / = homodimer of relevant protein.
To investigate the possible different response factors of and , the absolute
intensities of and from nanoESI mass spectra were determined. Protein solutions
analysed in this way contained protein concentrations of 1, 2, 3, 4 and 4.7 M, as
shown in Figure 5.5. NanoESI mass spectra were acquired immediately after each
sample was prepared. The result showed that the intensity of increased with
increasing concentration as expected but the intensities of were inconsistent,
reflecting that there was some precipitation in the stock sample (4.7 M), especially
at the higher protein concentrations.
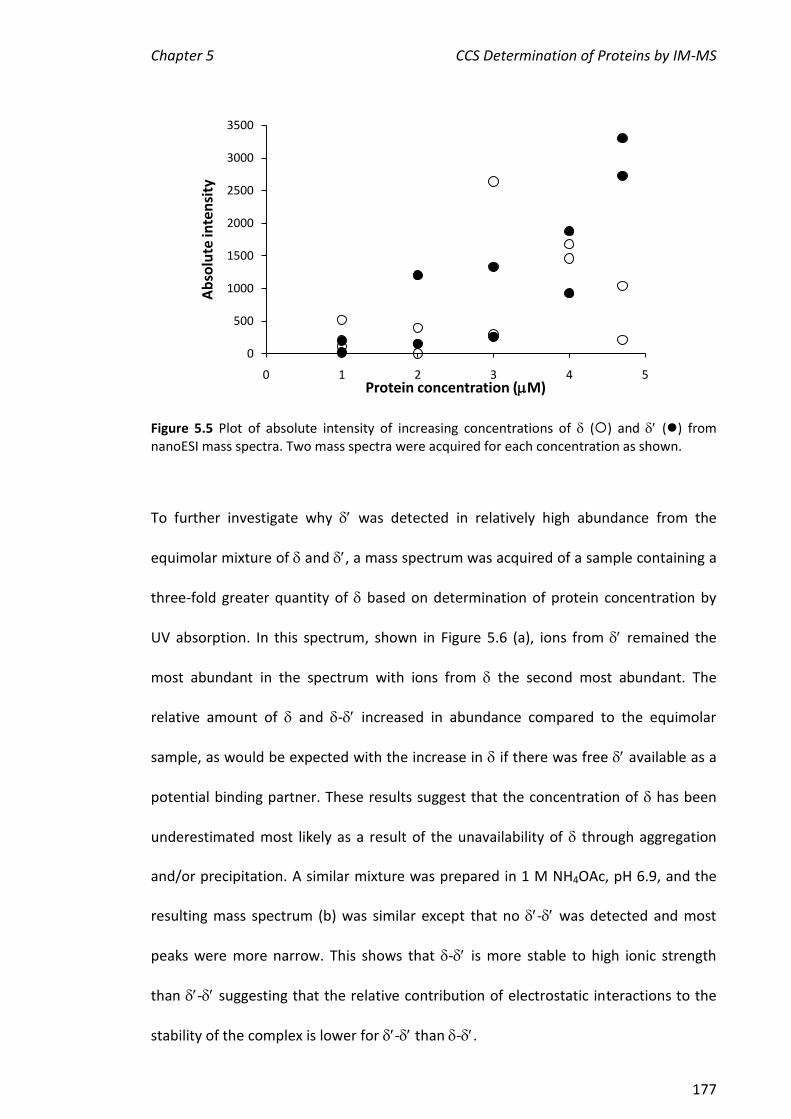
Chapter 5 CCS Determination of Proteins by IM-MS
177
Figure 5.5 Plot of absolute intensity of increasing concentrations of () and () from nanoESI mass spectra. Two mass spectra were acquired for each concentration as shown.
To further investigate why was detected in relatively high abundance from the
equimolar mixture of and , a mass spectrum was acquired of a sample containing a
three-fold greater quantity of based on determination of protein concentration by
UV absorption. In this spectrum, shown in Figure 5.6 (a), ions from remained the
most abundant in the spectrum with ions from the second most abundant. The
relative amount of and - increased in abundance compared to the equimolar
sample, as would be expected with the increase in if there was free available as a
potential binding partner. These results suggest that the concentration of has been
underestimated most likely as a result of the unavailability of through aggregation
and/or precipitation. A similar mixture was prepared in 1 M NH4OAc, pH 6.9, and the
resulting mass spectrum (b) was similar except that no - was detected and most
peaks were more narrow. This shows that - is more stable to high ionic strength
than - suggesting that the relative contribution of electrostatic interactions to the
stability of the complex is lower for - than -.
0
500
1000
1500
2000
2500
3000
3500
0 1 2 3 4 5
Ab
solu
te in
ten
sity
Protein concentration (M)
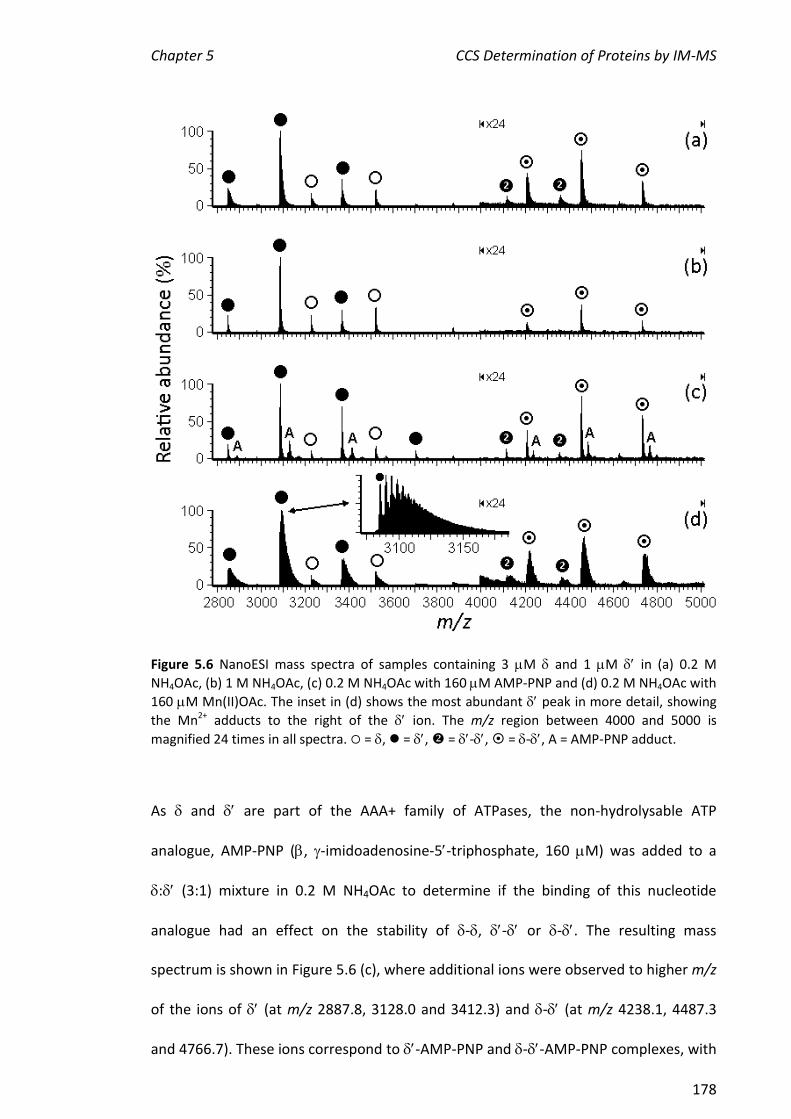
Chapter 5 CCS Determination of Proteins by IM-MS
178
Figure 5.6 NanoESI mass spectra of samples containing 3 M and 1 M in (a) 0.2 M
NH4OAc, (b) 1 M NH4OAc, (c) 0.2 M NH4OAc with 160 M AMP-PNP and (d) 0.2 M NH4OAc with
160 M Mn(II)OAc. The inset in (d) shows the most abundant peak in more detail, showing
the Mn2+ adducts to the right of the ion. The m/z region between 4000 and 5000 is
magnified 24 times in all spectra. = , = , = -, = -, A = AMP-PNP adduct.
As and are part of the AAA+ family of ATPases, the non-hydrolysable ATP
analogue, AMP-PNP (, -imidoadenosine-5-triphosphate, 160 M) was added to a
: (3:1) mixture in 0.2 M NH4OAc to determine if the binding of this nucleotide
analogue had an effect on the stability of -, - or -. The resulting mass
spectrum is shown in Figure 5.6 (c), where additional ions were observed to higher m/z
of the ions of (at m/z 2887.8, 3128.0 and 3412.3) and - (at m/z 4238.1, 4487.3
and 4766.7). These ions correspond to -AMP-PNP and --AMP-PNP complexes, with
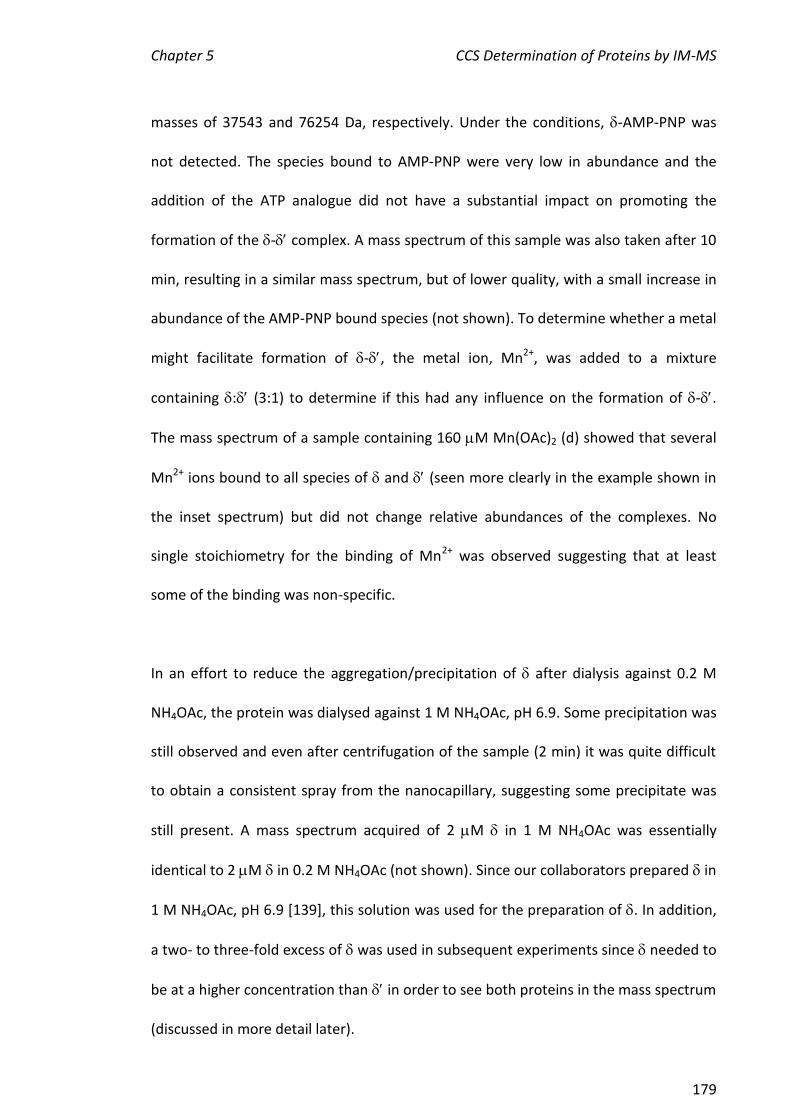
Chapter 5 CCS Determination of Proteins by IM-MS
179
masses of 37543 and 76254 Da, respectively. Under the conditions, -AMP-PNP was
not detected. The species bound to AMP-PNP were very low in abundance and the
addition of the ATP analogue did not have a substantial impact on promoting the
formation of the - complex. A mass spectrum of this sample was also taken after 10
min, resulting in a similar mass spectrum, but of lower quality, with a small increase in
abundance of the AMP-PNP bound species (not shown). To determine whether a metal
might facilitate formation of -, the metal ion, Mn2+, was added to a mixture
containing : (3:1) to determine if this had any influence on the formation of -.
The mass spectrum of a sample containing 160 M Mn(OAc)2 (d) showed that several
Mn2+ ions bound to all species of and (seen more clearly in the example shown in
the inset spectrum) but did not change relative abundances of the complexes. No
single stoichiometry for the binding of Mn2+ was observed suggesting that at least
some of the binding was non-specific.
In an effort to reduce the aggregation/precipitation of after dialysis against 0.2 M
NH4OAc, the protein was dialysed against 1 M NH4OAc, pH 6.9. Some precipitation was
still observed and even after centrifugation of the sample (2 min) it was quite difficult
to obtain a consistent spray from the nanocapillary, suggesting some precipitate was
still present. A mass spectrum acquired of 2 M in 1 M NH4OAc was essentially
identical to 2 M in 0.2 M NH4OAc (not shown). Since our collaborators prepared in
1 M NH4OAc, pH 6.9 [139], this solution was used for the preparation of . In addition,
a two- to three-fold excess of was used in subsequent experiments since needed to
be at a higher concentration than in order to see both proteins in the mass spectrum
(discussed in more detail later).

Chapter 5 CCS Determination of Proteins by IM-MS
180
Soon after these experiments were performed (using a Q-TOF UltimaTM), an IM-MS
instrument (Synapt HDMSTM) was commissioned in our laboratory. Therefore it was of
interest to acquire mass spectra of and using the Synapt HDMSTM to optimise
conditions so that IM mass spectra of and could be obtained. A sample containing
3 M and 1 M was analysed using a cone voltage of 100 V and a backing pressure
of 1.8 mbar (other conditions are outlined in Section 2.2.12). The nanoESI mass
spectrum is shown in Figure 5.7 (a). Similar to the experiments performed on the Q-
TOF UltimaTM, the most abundant ions in the spectra correspond to , with next
most abundant and - the least abundant, although at slightly greater relative
abundance than what was observed in Figure 5.6 (a). This sample was analysed again,
using a backing pressure of 2.4 mbar, with all other conditions kept constant (b). This
spectrum contains the same ions as (a) but with smaller peak widths at half height and
the relative abundance of increased compared to (a), suggesting that the loss of in
solution was not the only factor affecting its low abundance in the previous spectra.
Next, a sample containing less (2 M and 1 M ) was analysed using a backing
pressure of 2.4 mbar and several different cone voltages ranging from 60 to 150 V. As
there were only subtle differences between most of the spectra acquired, only those
using cone voltages of 60 and 100 V are shown in Figure 5.7 (c) and (d), respectively. In
both spectra, is the most abundant ion and the abundance of has decreased in
comparison to the 3:1 (:) sample in (b). The - complex has also decreased in
relative abundance compared to (b) and the - complex is present in the 2:1 (:)
sample ((c) and (d)) but not the 3:1 (:) sample ((a) and (b)). The only difference
between the two cone voltages applied to the 2:1 (:) sample is that there was a
decrease in peak width for ions of the - and - complexes at the higher cone
voltage (100 V). Therefore, the optimal backing pressure, cone voltage and apparent
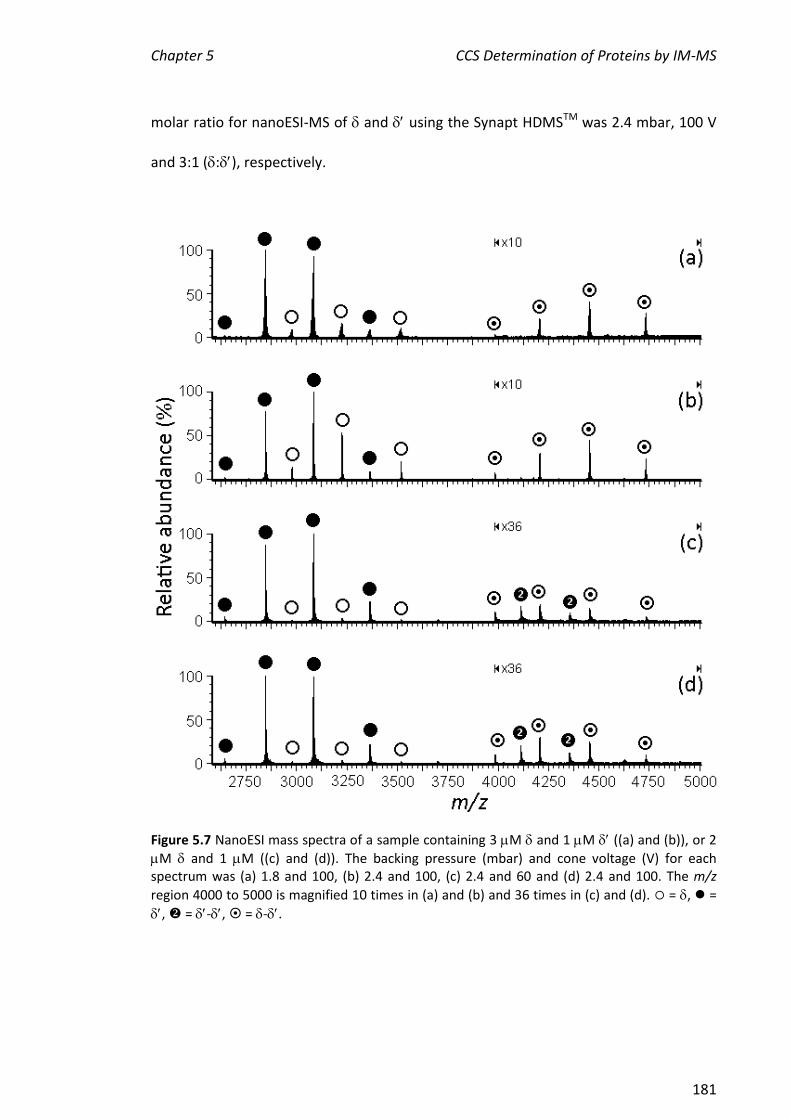
Chapter 5 CCS Determination of Proteins by IM-MS
181
molar ratio for nanoESI-MS of and using the Synapt HDMSTM was 2.4 mbar, 100 V
and 3:1 (:), respectively.
Figure 5.7 NanoESI mass spectra of a sample containing 3 M and 1 M ((a) and (b)), or 2
M and 1 M ((c) and (d)). The backing pressure (mbar) and cone voltage (V) for each spectrum was (a) 1.8 and 100, (b) 2.4 and 100, (c) 2.4 and 60 and (d) 2.4 and 100. The m/z
region 4000 to 5000 is magnified 10 times in (a) and (b) and 36 times in (c) and (d). = , =
, = -, = -.
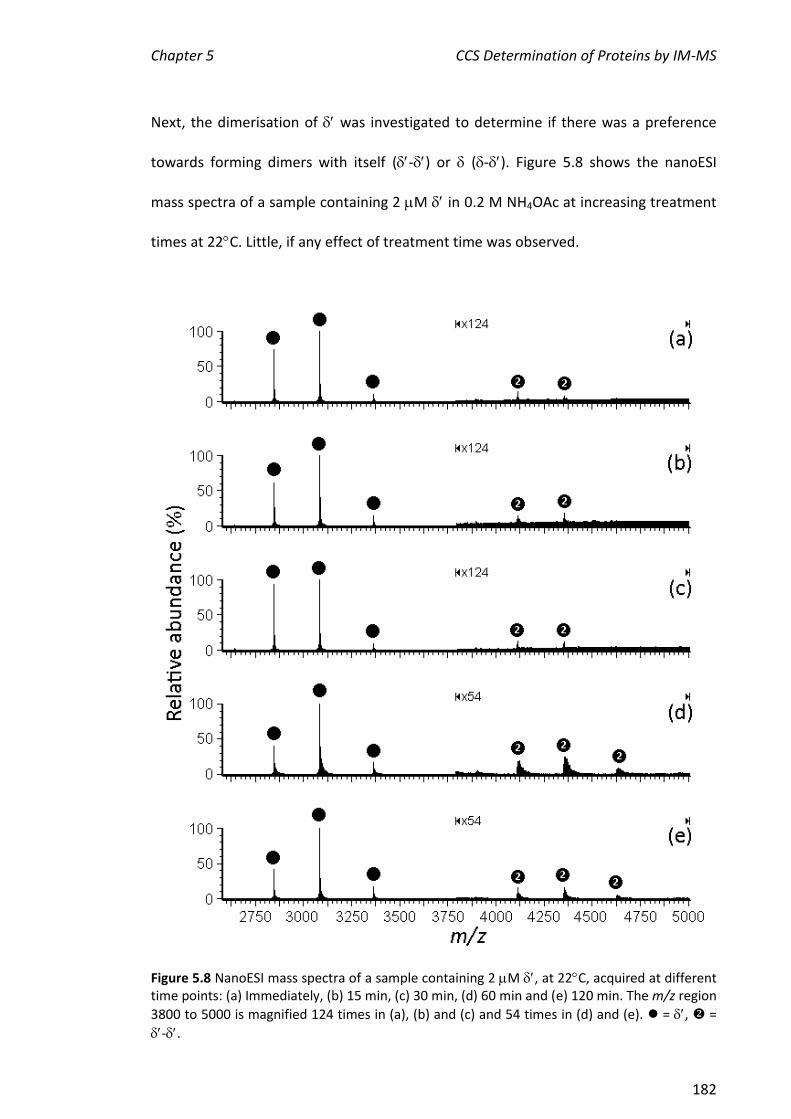
Chapter 5 CCS Determination of Proteins by IM-MS
182
Next, the dimerisation of was investigated to determine if there was a preference
towards forming dimers with itself (-) or (-). Figure 5.8 shows the nanoESI
mass spectra of a sample containing 2 M in 0.2 M NH4OAc at increasing treatment
times at 22C. Little, if any effect of treatment time was observed.
Figure 5.8 NanoESI mass spectra of a sample containing 2 M , at 22C, acquired at different time points: (a) Immediately, (b) 15 min, (c) 30 min, (d) 60 min and (e) 120 min. The m/z region
3800 to 5000 is magnified 124 times in (a), (b) and (c) and 54 times in (d) and (e). = , =
-.
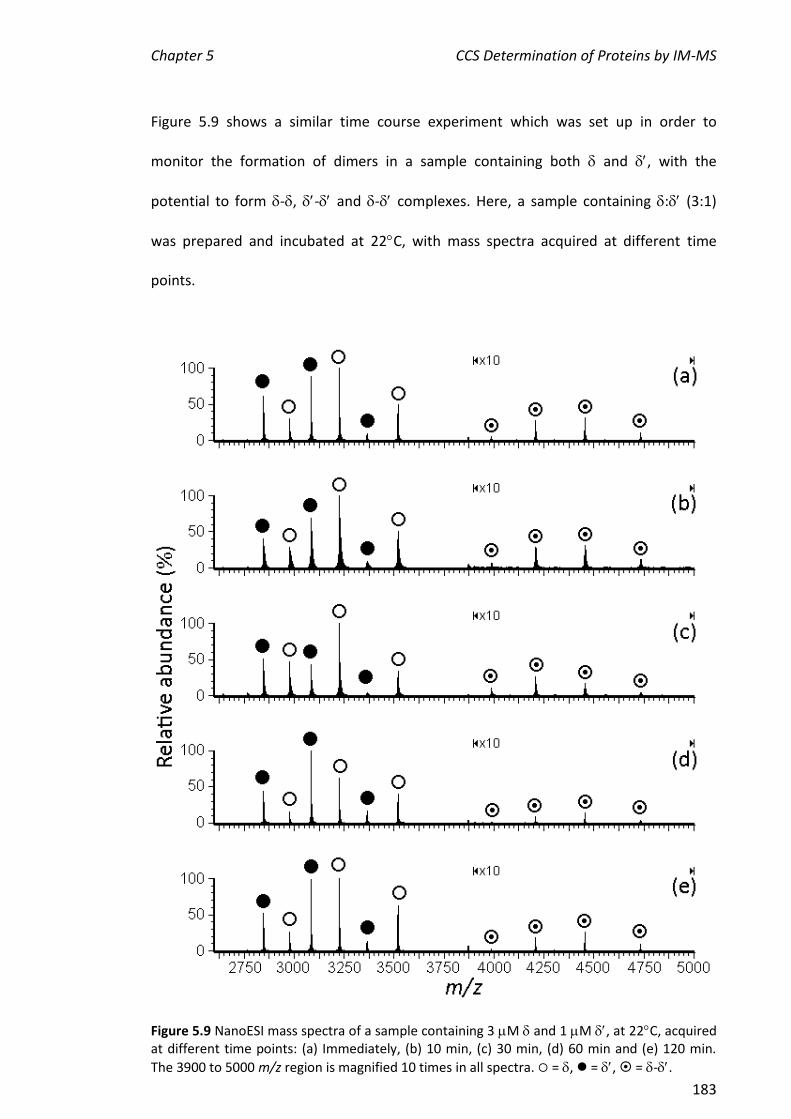
Chapter 5 CCS Determination of Proteins by IM-MS
183
Figure 5.9 shows a similar time course experiment which was set up in order to
monitor the formation of dimers in a sample containing both and , with the
potential to form -, - and - complexes. Here, a sample containing : (3:1)
was prepared and incubated at 22C, with mass spectra acquired at different time
points.
Figure 5.9 NanoESI mass spectra of a sample containing 3 M and 1 M , at 22C, acquired at different time points: (a) Immediately, (b) 10 min, (c) 30 min, (d) 60 min and (e) 120 min.
The 3900 to 5000 m/z region is magnified 10 times in all spectra. = , = , = -.

Chapter 5 CCS Determination of Proteins by IM-MS
184
Figure 5.9 (a) shows the mass spectrum taken immediately after sample preparation.
Ions from and were observed in the spectrum in high abundance, and - was
present in low abundance. No other combination of / dimers were observed.
Spectra acquired after 10 min (b), 30 min (c), 60 min (d) and 120 min (e) show that
there was no change in the distribution or composition of dimers within the time
frame measured, suggesting that an equilibrium between and is reached
immediately and is not disrupted under the experimental conditions. These results
imply that has a higher affinity towards than itself, and in the presence of both
proteins there was a tendency towards the formation of - in preference to - or -
. This corresponds to the stoichiometry of these subunits in the clamp loader, where
one of each subunit is present.
5.3.2 NanoESI-MS Analysis of from the E. coli Clamp Loader Complex
A nanoESI mass spectrum of dialysed against 0.1% formic acid was acquired to
confirm the molecular mass of the protein. The mass determined using the transform
algorithm from the MassLynxTM software was 47491.2 12 Da, in reasonable
agreement with the calculated mass, 47503 Da. The error is relatively large here
because the ions were broad and there was some evidence of proteolysis of the
sample. Attempts were then made at acquiring mass spectra of native from 0.2 M
NH4OAc, using conditions employed for and (Table 2.4), but no ions from were
detected (not shown). Therefore the cone voltage was increased from 100 to 150 V,
resulting in a poor quality spectrum shown in Figure 5.10 (a). When the backing
pressure was increased from 3 to 5.5 mbar, four oligomeric states of were detected
as shown in (b). The ions at m/z 3391.9, 3653.2 and 3958.1 correspond to the
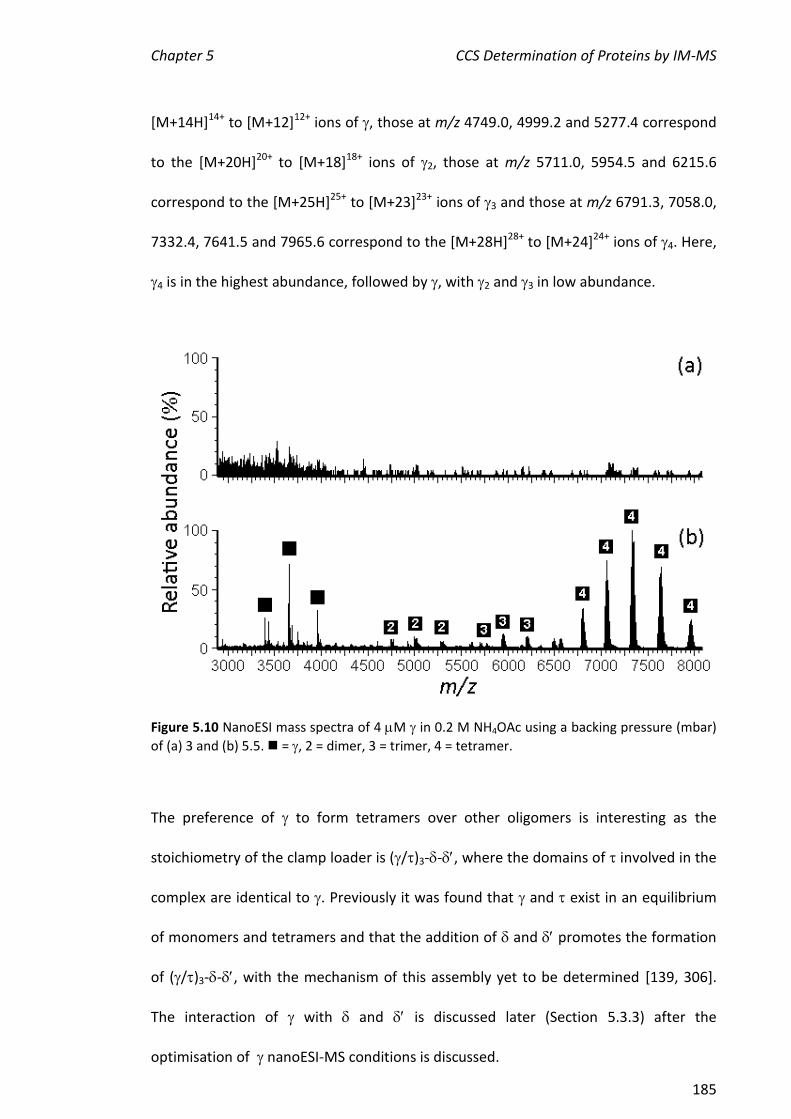
Chapter 5 CCS Determination of Proteins by IM-MS
185
[M+14H]14+ to [M+12]12+ ions of , those at m/z 4749.0, 4999.2 and 5277.4 correspond
to the [M+20H]20+ to [M+18]18+ ions of 2, those at m/z 5711.0, 5954.5 and 6215.6
correspond to the [M+25H]25+ to [M+23]23+ ions of 3 and those at m/z 6791.3, 7058.0,
7332.4, 7641.5 and 7965.6 correspond to the [M+28H]28+ to [M+24]24+ ions of 4. Here,
4 is in the highest abundance, followed by , with 2 and 3 in low abundance.
Figure 5.10 NanoESI mass spectra of 4 M in 0.2 M NH4OAc using a backing pressure (mbar)
of (a) 3 and (b) 5.5. = , 2 = dimer, 3 = trimer, 4 = tetramer.
The preference of to form tetramers over other oligomers is interesting as the
stoichiometry of the clamp loader is (/)3--, where the domains of involved in the
complex are identical to . Previously it was found that and exist in an equilibrium
of monomers and tetramers and that the addition of and promotes the formation
of (/)3--, with the mechanism of this assembly yet to be determined [139, 306].
The interaction of with and is discussed later (Section 5.3.3) after the
optimisation of nanoESI-MS conditions is discussed.
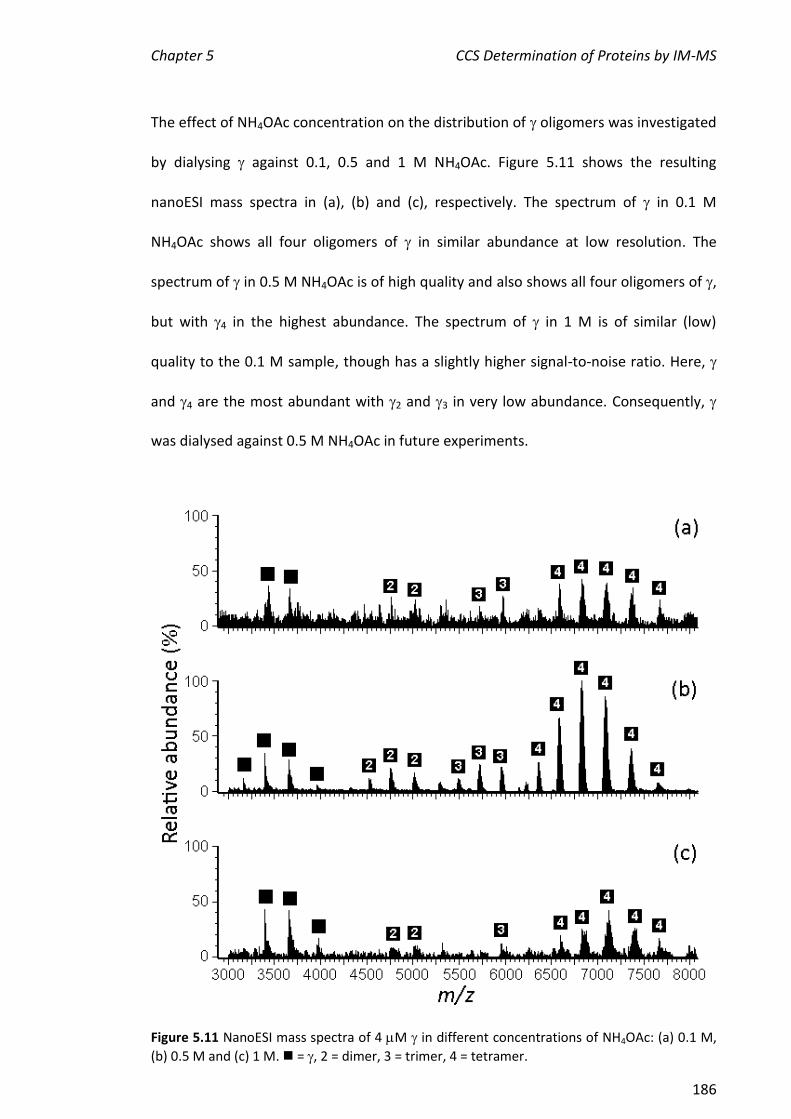
Chapter 5 CCS Determination of Proteins by IM-MS
186
The effect of NH4OAc concentration on the distribution of oligomers was investigated
by dialysing against 0.1, 0.5 and 1 M NH4OAc. Figure 5.11 shows the resulting
nanoESI mass spectra in (a), (b) and (c), respectively. The spectrum of in 0.1 M
NH4OAc shows all four oligomers of in similar abundance at low resolution. The
spectrum of in 0.5 M NH4OAc is of high quality and also shows all four oligomers of ,
but with 4 in the highest abundance. The spectrum of in 1 M is of similar (low)
quality to the 0.1 M sample, though has a slightly higher signal-to-noise ratio. Here,
and 4 are the most abundant with 2 and 3 in very low abundance. Consequently,
was dialysed against 0.5 M NH4OAc in future experiments.
Figure 5.11 NanoESI mass spectra of 4 M in different concentrations of NH4OAc: (a) 0.1 M,
(b) 0.5 M and (c) 1 M. = , 2 = dimer, 3 = trimer, 4 = tetramer.

Chapter 5 CCS Determination of Proteins by IM-MS
187
Figure 5.12 shows the effect of the concentration of in 0.5 M NH4OAc on the
distribution of oligomers. The nanoESI mass spectra are of at concentrations of 2 M
(a), 4 M (b) and 10 M (c). At 2 M, the monomer was the most abundant, with 2,
3 and 4 in low abundance. In contrast, when was present at 4 M, the most
abundant ions were from 4, with , 2 and 3 in low abundance. The distribution of
oligomers at 10 M is similar to that at 4 M, therefore, future experiments were
performed using 4 M .
Figure 5.12 NanoESI mass spectra of different concentrations of in 0.5 M NH4OAc: (a) 2 M,
(b) 4 M and (c) 10 M. = , 2 = dimer, 3 = trimer, 4 = tetramer.

Chapter 5 CCS Determination of Proteins by IM-MS
188
Under the optimised conditions described above, exists predominantly as a tetramer.
These conditions were used as the starting point for studies on the assembly of the
clamp loader carried out by our collaborators (Robinson and co-workers). These
researchers investigated the oligomeric states of and found that 4 was the
predominant oligomeric form of , appearing alongside smaller amounts of 3, 2 and
[139]. Robinson and co-workers also analysed an equimolar mixture of and and
found that immediately after mixing, every tetramer combination (4, 3-, 2-2, -3
and 4) was present in statistical distribution and this distribution remained constant
over time [139].
5.3.3 Assembly of the Minimal Clamp Loader Complex (3--)
In this section, the subunits of the minimal clamp loader (, and ) were added one
at a time in order to monitor the assembly of the 3-- complex using mass
spectrometry. As the interaction between and has already been investigated
(Section 5.3.1), these subunits were mixed with individually and together. Figure 5.13
(a) shows the mass spectrum of a sample containing : (4:1), treated together at 22C
for 15 min. The spectrum contains ions from ([M+12H]12+ to [M+10H]10+),
([M+14H]14+ to [M+12H]12+), 2 ([M+20H]20+ to [M+18H]18+), 3 (M+25H]25+ to
[M+23H]23+) and 4 ([M+29H]29+ to [M+24H]24+). No complexes involving and were
detected, with the distribution of oligomers identical to that in the absence of (b),
indicating that did not influence the formation of oligomers. This sample was then
stored at 4C overnight, with another mass spectrum acquired the next day. This was
essentially identical to the spectrum in (a) (not shown). A spectrum of : (1:1) was
also acquired and contained at high abundance and 4 at very low abundance, again
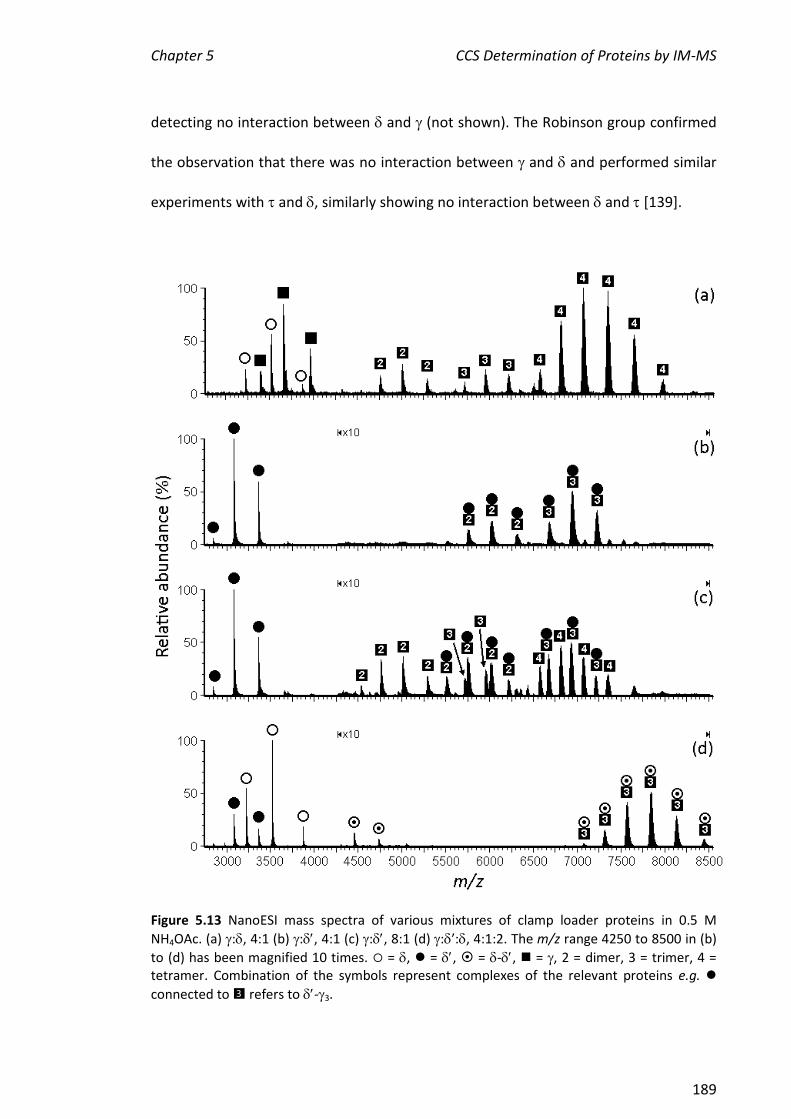
Chapter 5 CCS Determination of Proteins by IM-MS
189
detecting no interaction between and (not shown). The Robinson group confirmed
the observation that there was no interaction between and and performed similar
experiments with and , similarly showing no interaction between and [139].
Figure 5.13 NanoESI mass spectra of various mixtures of clamp loader proteins in 0.5 M
NH4OAc. (a) :, 4:1 (b) :, 4:1 (c) :, 8:1 (d) :’:, 4:1:2. The m/z range 4250 to 8500 in (b)
to (d) has been magnified 10 times. = , = , = -, = , 2 = dimer, 3 = trimer, 4 = tetramer. Combination of the symbols represent complexes of the relevant proteins e.g.
connected to refers to -3.
3
Chapter 5 CCS Determination of Proteins by IM-MS
190
Next, a nanoESI mass spectrum of a sample containing : at a molar ratio of 4:1 was
acquired. In spectrum (b) (Figure 5.13), ions from , [M+13H]13+ to [M+11H]11+, were
the most abundant, with two more series of ions observed in the m/z range 5000 to
8000. The first of these contains ions at m/z 5753.1, 6031.8 and 6319.3, corresponding
to the [M+23H]23+ to [M+21H]21+ ions of 2-. The second series contains ions at m/z
6686.7, 6944.2 and 7228.0, corresponding to the [M+27H]27+ to [M+25H]25+ ions of 3-
. Therefore, in contrast with , has altered the distribution of oligomers. In the
presence of , the equilibrium of has shifted from an abundance of monomers and
tetramers, to in the form of only dimers and trimers (associated with ). This, in
addition to the absence of 4-, suggests 4 is disrupted when binds, yielding stable
complexes (2- and 3-) that are possible intermediates in the assembly of the
clamp loader complex.
The absence of monomers suggests that sequesters free and holds it in a
conformation that encourages additional to bind. The absence of - indicates that
has a higher affinity towards than itself, consistent with results in Section 5.3.1
suggesting the - interaction is weak. This sample was stored at 4C overnight, with
another mass spectrum acquired the next day and was essentially identical to the
spectrum in (b) (not shown). The results were confirmed by the Robinson group [139],
allowing both laboratories to continue with the IM-MS analysis of these complexes (2-
and 3-). The Robinson group also analysed a sample containing and and the
resulting mass spectrum contained ions from , -, 2- and 3- [139]. Similar to
the way affected assembly of oligomers, encouraged oligomers to form (in
association with ) with no 4- in the spectrum. These results suggest that , and
Chapter 5 CCS Determination of Proteins by IM-MS
191
not , facilitates the breaking of / tetramers and the formation of stable complexes
of smaller / oligomers, a major step in organising the assembly of the clamp loader
complex.
Before attempting to assemble the minimal clamp loader, the reason for the high
abundance of ions from when was present in four-fold excess (Figure 5.13 (b)) was
examined. This is likely due to a higher response factor of monomeric compared
with the complexes. Therefore a mass spectrum was acquired of a sample containing
: (8:1). In this spectrum, shown in Figure 5.13 (c), remained the most abundant
species despite containing an eight-fold molar excess of , a two-fold increase
compared to (b). Ions corresponding to 2- and 3- were again observed, in addition
to 2, 3, and 4. This is consistent with having a relatively high response factor under
the experimental conditions. The ions from have a small peak width at half height
(e.g. 3 Th for [M+12H]12+) compared to, for example, that of 3- (e.g. 37 Th for
[M+26H]26+). This occurs as larger proteins and complexes can retain water and salt
during the ionisation process as they become trapped in the folded structure [127,
132].
Finally, the assembly of the minimal clamp loader complex was attempted by adding
to and . A mass spectrum of this mixture at a molar ratio of 4:1:2 (::), is shown
in Figure 5.13 (d). In the spectrum (and that taken of the sample after storage at 4C
overnight, not shown), is the most abundant, with the next most abundant, with
two other series of ions present. Of these, the most abundant contains ions at m/z
7315.6, 7568.9, 7841.3, 8135.0 and 8450.2 corresponding to the [M+30H]30+ to
Chapter 5 CCS Determination of Proteins by IM-MS
192
[M+26H]26+ ions of 3--, the minimal clamp loading complex. The other ion series
corresponds to - present in very low abundance. Interestingly, there are no ions
corresponding to 2--, 2- or 3- in the m/z range 5000 to 8000, showing that
exists exclusively as a trimer (bound to -) in the presence of and . Our
collaborators also analysed a mixture containing with and and the resulting mass
spectrum contained one series of ions in the high m/z region (5000 to 9000),
corresponding to 3--. The results are analogous to the results reported here
indicating and are involved in similar assembly pathways in formation of the clamp
loader complex [139]. This is not surprising considering the domains (I to III) within
the pentameric ring of the clamp loader (Figure 1.2) are identical to as they are
produced from the same gene, dnaX [63]. Taken together, these results suggest that
has two important roles in the assembly of the clamp loader. First, it competes with
one of the subunits of (/)4, stabilising smaller / oligomers and secondly, it
facilitates a proposed conformational change in / [45] which allows to bind and
further stabilise the (/)3- complex, completing the five-membered ring required for
clamp loading [139].
As described above (Section 1.1.3), any combination of (/)3 bound to - results in a
complex that is capable of loading the 2 sliding clamp onto DNA; however, at least
two copies of are required to create a functional replisome. This is because only ,
not , can bind to , tethering the polymerase core subassembly (--) to the
replisome, in which one core, and one subunit, are required per DNA strand (leading
and lagging). Our collaborators therefore explored the addition of 4 to samples
containing 3--. Soon after this addition, 3--, 4 and 3-- were observed in the
Chapter 5 CCS Determination of Proteins by IM-MS
193
mass spectrum, with the latter complex most likely resulting from the interaction of 4
with free - [139]. Subunit exchange reached equilibrium after 24 hours in which all
four variants of the clamp loader (3--, 2---, -2-- and 3--) were present
in the spectrum. This occurred over a much longer time period than a sample of and
which reached an equilibrium showing assemblies of 4, 3-, 2-2, -3 and 4
immediately. It was concluded that all variations of (/)3-- are likely to be formed in
vivo, with only 3-- and 2--- becoming part of functional replisome complexes
[139]. This is because they contain at least two subunits, enabling them to associate
with at least two polymerase cores, essential for normal E. coli replication. Therefore,
the structure and function of each complex facilitates the correct stoichiometry of /
in the clamp loader complex.
5.3.4 NanoESI-MS Analysis of a Truncation of (1-400)
Since the oligomerisation domain of is situated at its C-terminus [45], a truncation of
was prepared in our laboratory by Dr S. Jergic. This truncation contains the first 400
residues out of its total of 431 residues and is called 1-400. Mass spectra of 1-400 were
acquired under the same conditions as wild type (4 M protein in 0.5 M NH4OAc;
Figure 5.14 (a) and (b), respectively). The spectrum of 1-400 shows four series of ions
which correspond to populations of monomers at m/z 3396.7 and 3678.2 ([M+13H]13+
and [M+12H]12+), dimers at m/z 4650.1 and 4906.7 ([M+20H]20+ and [M+19H]19+),
trimers at m/z 5520.2, 5758.9 and 6021.4 ([M+24H]24+ to [M+22H]22+) and tetramers at
m/z 639.8, 6544.5, 6798.2, 7071.4, 7366.0 and 7685.2 ([M+30H]30+ to [M+25H]25+). The
predominant oligomer is the tetramer of 1-400, similar to the distribution of wild type
oligomers.

Chapter 5 CCS Determination of Proteins by IM-MS
194
Figure 5.14 NanoESI mass spectra of (a) 4 M 1-400 and (b) 4 M in 0.5 M NH4OAc. = 1-400,
= , 2 = dimer, 3 = trimer, 4 = tetramer.
As the truncation 1-400 retains the ability to form tetramers, this suggests the main
oligomerisation determinants do not lie on the extreme C-terminal 31 amino acids.
Similarly, the crystal structure of 3-- was determined using a truncation of
(residues 1-373) showing that this shorter version of (1-373) was still capable of
forming intersubunit connections with , and other 1-373 subunits. Furthermore, this
study revealed that the intersubunit interface between the C-terminal domains of
these proteins is extensive, e.g. the interaction between two 1-373 subunits covers
~900 Å2 [45].
5.3.5 IM-MS Analysis of Clamp Loader Proteins/Complexes
Since determination of CCS using TWIMS is relatively new, it is important to show that
the methods applied in different laboratories provide consistent results. This is
particularly important for challenging samples such as the clamp loader proteins and
Chapter 5 CCS Determination of Proteins by IM-MS
195
assemblies. Conditions for determining CCS of these proteins using TWIMS were
determined independently across the two collaborative groups (University of
Wollongong and University of Cambridge).
Before drift times were calibrated, optimal conditions were established in order to
obtain consistent, narrow drift/arrival time distributions (ATD) of and its oligomers.
The conditions used for nanoESI-MS analysis (Table 2.4) were used as a starting point
for the IM-MS analysis. In some cases, the conditions required to obtain useful IM
mass spectra resulted in a decrease in sensitivity. The established nanoESI-MS
instrument parameters allowed ions from to be detected when IM mode was
enabled. The IM conditions were then optimised to ensure that a single, Gaussian ATD
‘peak’ was obtained for most of the charge states in the mass spectrum. This involved
varying the wave height and wave velocity (of the travelling wave). A range of wave
velocities (140-300 m/s) and wave heights (3-12 V) were tested and it was found that a
wave velocity of 220 m/s and wave heights between 7 and 9 V were ideal for the IM-
MS analysis of . An example of poor conditions (wave velocity 250 m/s and wave
height 5 V) and suitable conditions (220 m/s and 9 V) for the determination of drift
time is shown in Figure 5.15. The DriftscopeTM image (plot of m/z against drift time) at
wave velocity 250 m/s and wave height 5 V (a), shows that the ions are traversing the
drift cell too slowly as they are not detected within 200 pushes in the TOF mass
analyser. As a consequence, the ions continue to be detected in the next experiment,
shown by ions detected at lower drift times (within the first 50 out of 200 ‘bins’). This
is also evident in the plots of ATD of the four most abundant 4 ions shown in (b), in
particular, the drift times of the [M+26H]26+ and [M+27H]27+ ions. This plot is also of
poor quality as the ATD peaks are broad and do not exhibit a Gaussian distribution. In
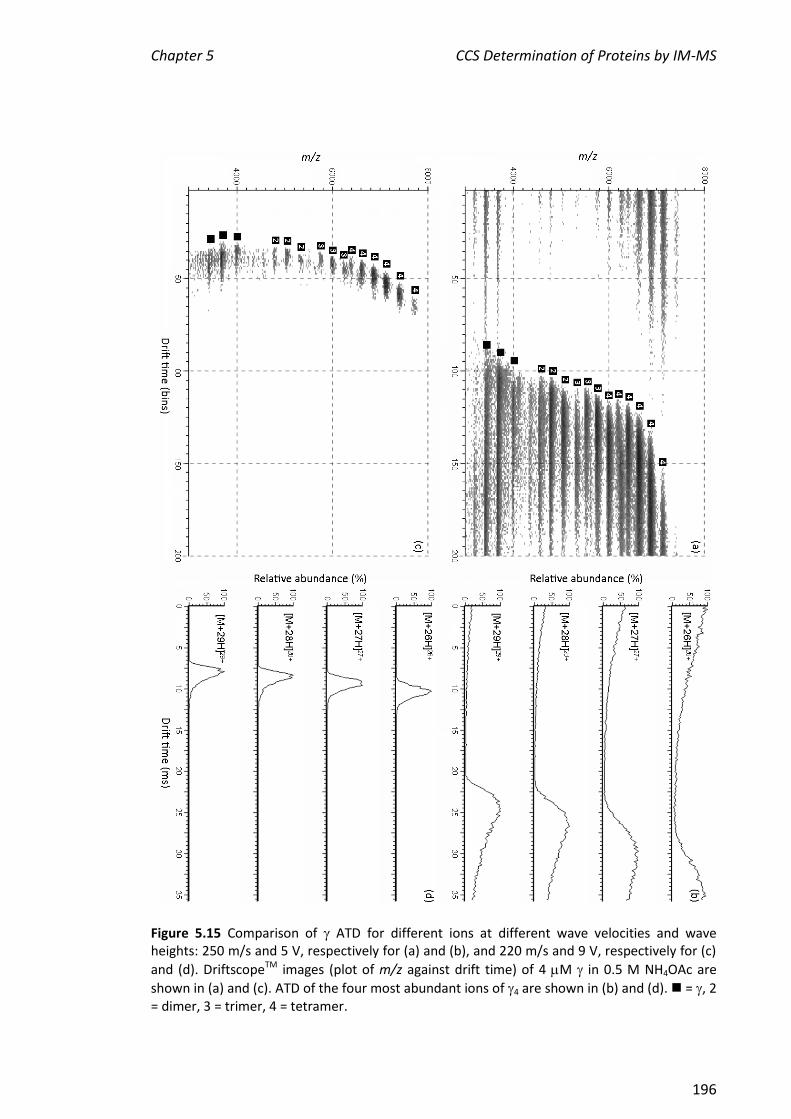
Chapter 5 CCS Determination of Proteins by IM-MS
196
Figure 5.15 Comparison of ATD for different ions at different wave velocities and wave heights: 250 m/s and 5 V, respectively for (a) and (b), and 220 m/s and 9 V, respectively for (c)
and (d). DriftscopeTM images (plot of m/z against drift time) of 4 M in 0.5 M NH4OAc are
shown in (a) and (c). ATD of the four most abundant ions of 4 are shown in (b) and (d). = , 2 = dimer, 3 = trimer, 4 = tetramer.
Chapter 5 CCS Determination of Proteins by IM-MS
197
contrast, the ions detected in DriftscopeTM (c), at wave velocity 220 m/s and wave
height 9 V, exhibit drift times within the 200 bins. These are optimal conditions since
the ATD, for example, of 4 in (d), exhibit narrow peaks in a Gaussian distribution,
important as the centre of this ATD peak is the raw drift time used to determine CCS.
Other instrumental conditions were optimised whilst monitoring the centre and peak
width at half height of the ATD. Ruotolo et al. suggest that the cone, bias and trap
collision voltages should be decreased until the centre of the ATD peak (drift time)
does not change by more than 3% [143]. Higher voltages can assist in the transmission
of ions; however, if these values are too high they can cause gas-phase unfolding of
the protein, leading to an overestimation of the CCS. For each set of voltages tested,
IM mass spectra of 4 M were acquired at a wave velocity of 220 m/s and wave
heights of 7 and 9 V. Representative drift times obtained when the wave height was 7
V are shown in Table 5.1. Firstly the cone voltage was decreased to 120 then 100 V.
Under these two sets of conditions all drift times remained within 3% of those
obtained using a cone voltage of 150 V. The cone voltage was then increased to 200 V
where the resulting drift times were over 3% higher than when 150 V was used. With
the cone again set to 150 V, the bias voltage was decreased from 22 V to 10 V, with the
resulting drift times within 3% of each other. With the bias voltage set back to 22 V,
the trap collision voltage was increased (from 6 to 40 V) and the resulting drift times
were outside the 3% margin. It was also observed that the quality of the ATD
decreased, with broad peaks and a low signal-to-noise ratio at the higher trap collision
energy. For example, the ATD peaks for the [M+28H]28+ ion of 4 at both wave heights
(7 and 9 V) were ~4 and ~2 ms wide, for the trap collision energies of 6 and 40 V,
respectively. Therefore, a cone voltage of 150 V, a bias voltage of 22 V and a trap
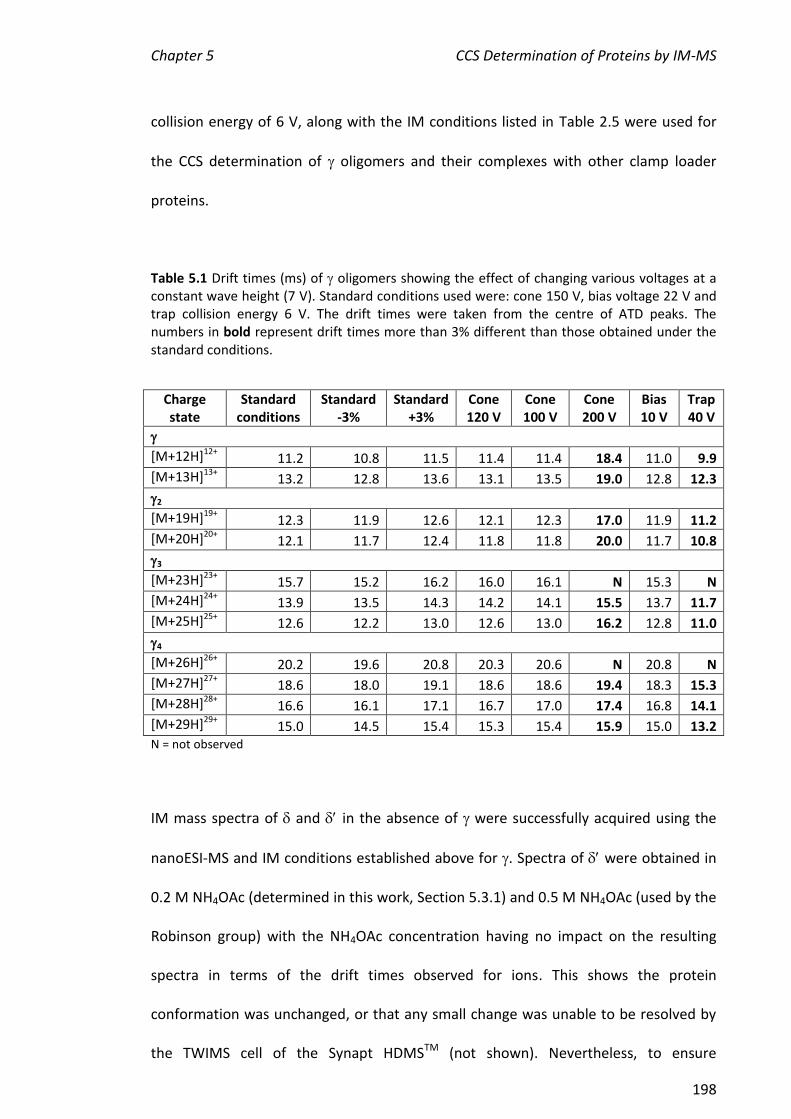
Chapter 5 CCS Determination of Proteins by IM-MS
198
collision energy of 6 V, along with the IM conditions listed in Table 2.5 were used for
the CCS determination of oligomers and their complexes with other clamp loader
proteins.
Table 5.1 Drift times (ms) of oligomers showing the effect of changing various voltages at a constant wave height (7 V). Standard conditions used were: cone 150 V, bias voltage 22 V and trap collision energy 6 V. The drift times were taken from the centre of ATD peaks. The numbers in bold represent drift times more than 3% different than those obtained under the standard conditions.
Charge state
Standard conditions
Standard -3%
Standard +3%
Cone 120 V
Cone 100 V
Cone 200 V
Bias 10 V
Trap 40 V
[M+12H]12+ 11.2 10.8 11.5 11.4 11.4 18.4 11.0 9.9
[M+13H]13+ 13.2 12.8 13.6 13.1 13.5 19.0 12.8 12.3
2
[M+19H]19+ 12.3 11.9 12.6 12.1 12.3 17.0 11.9 11.2
[M+20H]20+ 12.1 11.7 12.4 11.8 11.8 20.0 11.7 10.8
3
[M+23H]23+ 15.7 15.2 16.2 16.0 16.1 N 15.3 N
[M+24H]24+ 13.9 13.5 14.3 14.2 14.1 15.5 13.7 11.7
[M+25H]25+ 12.6 12.2 13.0 12.6 13.0 16.2 12.8 11.0
4
[M+26H]26+ 20.2 19.6 20.8 20.3 20.6 N 20.8 N
[M+27H]27+ 18.6 18.0 19.1 18.6 18.6 19.4 18.3 15.3
[M+28H]28+ 16.6 16.1 17.1 16.7 17.0 17.4 16.8 14.1
[M+29H]29+ 15.0 14.5 15.4 15.3 15.4 15.9 15.0 13.2 N = not observed
IM mass spectra of and in the absence of were successfully acquired using the
nanoESI-MS and IM conditions established above for . Spectra of were obtained in
0.2 M NH4OAc (determined in this work, Section 5.3.1) and 0.5 M NH4OAc (used by the
Robinson group) with the NH4OAc concentration having no impact on the resulting
spectra in terms of the drift times observed for ions. This shows the protein
conformation was unchanged, or that any small change was unable to be resolved by
the TWIMS cell of the Synapt HDMSTM (not shown). Nevertheless, to ensure
Chapter 5 CCS Determination of Proteins by IM-MS
199
consistency across the laboratories, was prepared and analysed in 0.5 M NH4OAc,
pH 6.9 in the following experiments aimed at estimation of CCS.
5.3.6 CCS Determination of Clamp Loader Proteins
CCS values of clamp loader proteins/complexes were determined using the instrument
conditions described above and the calibration method and evaluation of CCS
described by Ruotolo et al. [143] (Section 2.2.16) and are shown in Table 5.2. For
comparison, CCS values determined by our collaborators (Robinson and co-workers)
are also listed in the table. The CCS values determined in this research under optimised
conditions were within at least 10% of those determined in the Cambridge laboratory.
In both laboratories, the drift times of all calibrant ions were determined under
instrument conditions optimised for each ‘unknown’ protein, not necessarily identical
between laboratories. This is important as it shows that the best conditions
determined independently by the two laboratories resulted in estimation of CCS for
the unknowns that were in agreement. These results validate the methods developed
for the calibration and use of the Synapt HDMSTM instrument for their role in
determining the CCS of large biomolecular complexes. Similarly, in a study by Leary et
al. [307], there was a high correlation between CCS values of eukaryotic initiation
factors determined by two independent laboratories.
Table 5.2 also shows the effect of increasing the cone and trap collision voltages and
altering the wave velocity on CCS of some of the clamp loader proteins. As predicted
by the > 3% change in drift times, CCS values increased when the cone was increased
from 150 to 200 V and when the wave velocity was changed from 220 to 300 m/s. For
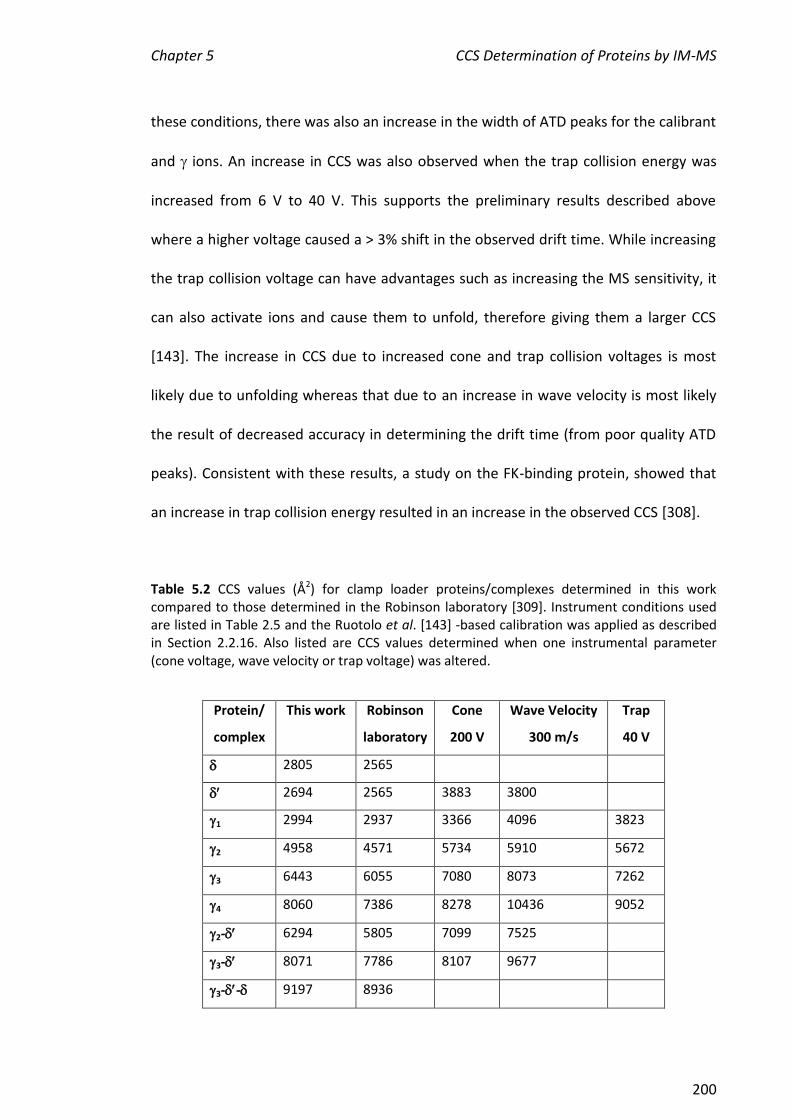
Chapter 5 CCS Determination of Proteins by IM-MS
200
these conditions, there was also an increase in the width of ATD peaks for the calibrant
and ions. An increase in CCS was also observed when the trap collision energy was
increased from 6 V to 40 V. This supports the preliminary results described above
where a higher voltage caused a > 3% shift in the observed drift time. While increasing
the trap collision voltage can have advantages such as increasing the MS sensitivity, it
can also activate ions and cause them to unfold, therefore giving them a larger CCS
[143]. The increase in CCS due to increased cone and trap collision voltages is most
likely due to unfolding whereas that due to an increase in wave velocity is most likely
the result of decreased accuracy in determining the drift time (from poor quality ATD
peaks). Consistent with these results, a study on the FK-binding protein, showed that
an increase in trap collision energy resulted in an increase in the observed CCS [308].
Table 5.2 CCS values (Å2) for clamp loader proteins/complexes determined in this work compared to those determined in the Robinson laboratory [309]. Instrument conditions used are listed in Table 2.5 and the Ruotolo et al. [143] -based calibration was applied as described in Section 2.2.16. Also listed are CCS values determined when one instrumental parameter (cone voltage, wave velocity or trap voltage) was altered.
Protein/
complex
This work Robinson
laboratory
Cone
200 V
Wave Velocity
300 m/s
Trap
40 V
2805 2565
2694 2565 3883 3800
1 2994 2937 3366 4096 3823
2 4958 4571 5734 5910 5672
3 6443 6055 7080 8073 7262
4 8060 7386 8278 10436 9052
2- 6294 5805 7099 7525
3- 8071 7786 8107 9677
3-- 9197 8936
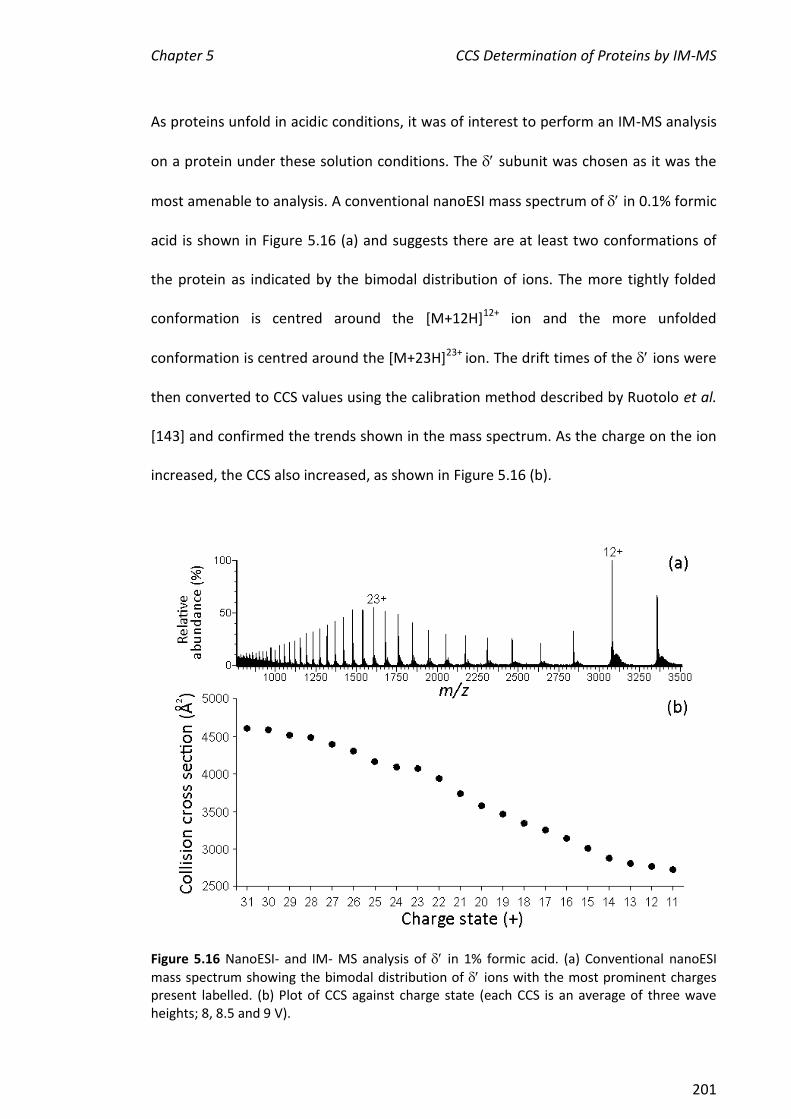
Chapter 5 CCS Determination of Proteins by IM-MS
201
As proteins unfold in acidic conditions, it was of interest to perform an IM-MS analysis
on a protein under these solution conditions. The subunit was chosen as it was the
most amenable to analysis. A conventional nanoESI mass spectrum of in 0.1% formic
acid is shown in Figure 5.16 (a) and suggests there are at least two conformations of
the protein as indicated by the bimodal distribution of ions. The more tightly folded
conformation is centred around the [M+12H]12+ ion and the more unfolded
conformation is centred around the [M+23H]23+ ion. The drift times of the ions were
then converted to CCS values using the calibration method described by Ruotolo et al.
[143] and confirmed the trends shown in the mass spectrum. As the charge on the ion
increased, the CCS also increased, as shown in Figure 5.16 (b).
Figure 5.16 NanoESI- and IM- MS analysis of in 1% formic acid. (a) Conventional nanoESI
mass spectrum showing the bimodal distribution of ions with the most prominent charges present labelled. (b) Plot of CCS against charge state (each CCS is an average of three wave heights; 8, 8.5 and 9 V).
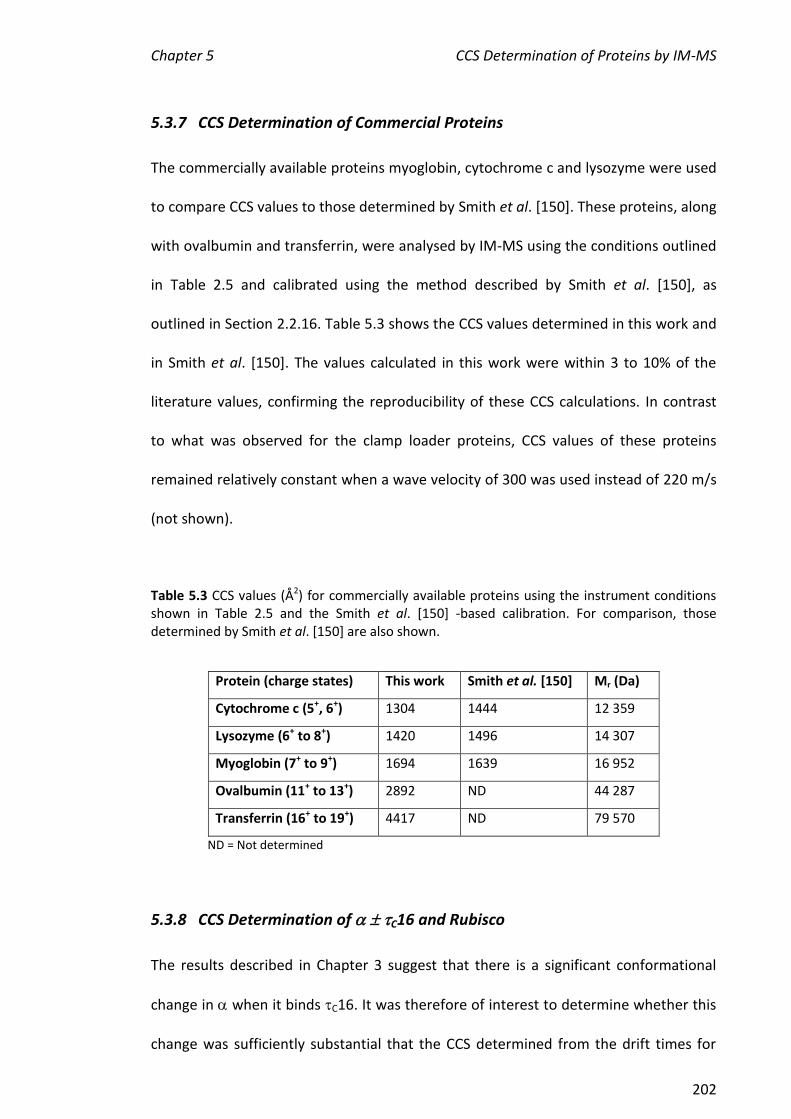
Chapter 5 CCS Determination of Proteins by IM-MS
202
5.3.7 CCS Determination of Commercial Proteins
The commercially available proteins myoglobin, cytochrome c and lysozyme were used
to compare CCS values to those determined by Smith et al. [150]. These proteins, along
with ovalbumin and transferrin, were analysed by IM-MS using the conditions outlined
in Table 2.5 and calibrated using the method described by Smith et al. [150], as
outlined in Section 2.2.16. Table 5.3 shows the CCS values determined in this work and
in Smith et al. [150]. The values calculated in this work were within 3 to 10% of the
literature values, confirming the reproducibility of these CCS calculations. In contrast
to what was observed for the clamp loader proteins, CCS values of these proteins
remained relatively constant when a wave velocity of 300 was used instead of 220 m/s
(not shown).
Table 5.3 CCS values (Å2) for commercially available proteins using the instrument conditions shown in Table 2.5 and the Smith et al. [150] -based calibration. For comparison, those determined by Smith et al. [150] are also shown.
Protein (charge states) This work Smith et al. [150] Mr (Da)
Cytochrome c (5+, 6+) 1304 1444 12 359
Lysozyme (6+ to 8+) 1420 1496 14 307
Myoglobin (7+ to 9+) 1694 1639 16 952
Ovalbumin (11+ to 13+) 2892 ND 44 287
Transferrin (16+ to 19+) 4417 ND 79 570
ND = Not determined
5.3.8 CCS Determination of C16 and Rubisco
The results described in Chapter 3 suggest that there is a significant conformational
change in when it binds C16. It was therefore of interest to determine whether this
change was sufficiently substantial that the CCS determined from the drift times for
Chapter 5 CCS Determination of Proteins by IM-MS
203
either and -C16 might deviate significantly from the curve of CCS against molecular
mass. Furthermore, values of CCS for these proteins have not yet been determined to
the best of our knowledge. Another protein complex yet to be investigated using this
technique is tobacco rubisco. This protein is a large complex (536 kDa) consisting of
eight small and eight large subunits. The limits on the molecular mass and hence CCS
values of calibrant proteins determined using traditional drift tube IM instruments
means that extrapolation of calibration curves is required to determine CCS of large
proteins [143, 150, 190, 310]. For example, the greatest value of CCS from myoglobin
in denaturing conditions is 3815 Å2 for the m/z 772 ([M+22H]22+) ion [147]. Ruotolo et
al. used an extrapolated calibration curve to determine the CCS of the TRAP protein
complex and found that results were consistent with CCS values predicted using
molecular modelling [190]. Given that rubisco is analysed routinely in our laboratory
(Blayney and Beck, unpublished results), it will serve as a useful high mass ‘standard’.
Initial attempts at acquiring IM-MS spectra of C16 were successful using the optimal
conditions for acquiring conventional nanoESI mass spectra as described in Chapter 3
but were unsuccessful for or -C16. Similar to the conditions developed for IM-MS
of , IM mass spectra were acquired for and -C16 when the backing pressure was
increased from 1.8 to 5.5 mbar, with all other conditions outlined in Table 2.5. Using
the calibration method described by Ruotolo et al. [143], the values of CCS for C16,
and -C16 were 2155, 6121 and 6797 Å2, respectively. Both and -C16 have CCS
values in accordance with their molecular weights, as shown in a plot of molecular
weight against experimentally determined CCS (Figure 5.17, described later). This
indicates that a significant conformational change between bound and unbound has
not been detected using this method. This observation means that if the proposed

Chapter 5 CCS Determination of Proteins by IM-MS
204
conformational change occurred it was not of sufficient magnitude to translate into a
change in CCS that could be distinguished by the TWIMS cell or that the change in
conformation on average, resulted in a macromolecule with a similar CCS. Rubisco was
analysed under the same IM conditions (Table 2.5). Using the Ruotolo et al. [143]
calibration method, the CCS of rubisco was found to be 19828 Å2. The linearity of the
plot in Figure 5.17 (b) when rubisco is included (out to a mass of 536 kDa) gives
confidence in extrapolation of CCS values beyond the molecular masses of standard
proteins.
The CCS of and the -C16 complex were also determined in 1 M NH4OAc in order to
establish if this method could detect a conformational change relative to the protein(s)
in 0.2 M NH4OAc as speculated in Chapter 3. No significant change in CCS for or -
C16 was observed between the two NH4OAc concentrations (Table 5.4), suggesting
that if a change in shape occurred, it was not resolvable using the TWIMS cell.
Table 5.4 CCS values (Å2) of C16 in 0.2 M and 1 M NH4OAc.
Protein/s
(charge states)
Concentration of NH4OAc
0.2 M 1 M
(20+ to 22+) 6217 138 6411 177
-C16 (22+ to 24+) 6868 155 6991 163
*Average of three wave heights (9, 9.5, 10 V) one standard deviation
5.3.9 Comparison of Ruotolo et al. [143] and Smith et al. [150] Calibrations
The two literature CCS calibration methods [143, 150] are quite similar (see Section
2.2.16), with the former method being more complex. The main difference between
Chapter 5 CCS Determination of Proteins by IM-MS
205
them is that the Ruotolo et al. [143] method involves the creation of two linear plots,
whereas the Smith et al. [150] method involves the construction of a single plot
following a power trendline (y = AxB; see Section 2.2.16). For this reason, it was of
interest to compare CCS values calculated using both methods, using identical data.
These CCS values are listed in Table 5.5, along with experimental and theoretical values
from [150] and [309]. Most values are within 10% of each other showing that similar
results are obtained using both calibration methods.
5.3.10 Summary of All CCS Values Determined in This Chapter
Figure 5.17 shows a plot of CCS against molecular mass of all the proteins investigated
in this chapter. These experimentally determined CCS values correlate well (R2 = 0.99)
and are consistent with the trend shown in Ruotolo et al. [143], further validating
these results. Interestingly, the extremely large protein complex, rubisco, lies on this
line, despite having a CCS approximately five-fold greater than the largest calibrant ion.
5.4 Summary and Future Directions
Experimental conditions were determined here for the assembly of the clamp loader
complex of Pol III. These conditions formed the basis for more extensive studies
carried out in collaboration with the Robinson group at Cambridge University (now at
Oxford) [139]. The nanoESI-MS analysis of clamp loader proteins and complexes
facilitated their analysis by IM-MS, allowing the determination of drift times for the
complexes using the TWIMS cell of the recently released Synapt HDMS™. It is difficult
to directly determine CCS from drift time of large biomolecules using a TWIMS cell
since the electric field is not constant, though progress is being made [151].
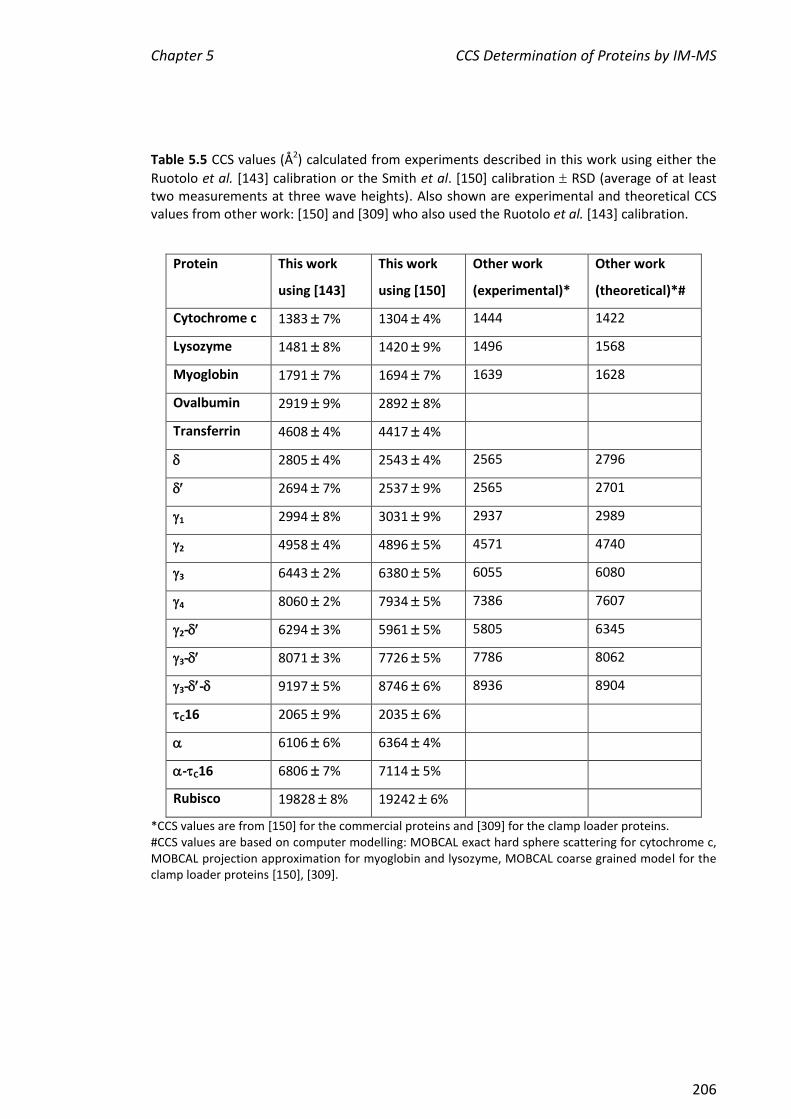
Chapter 5 CCS Determination of Proteins by IM-MS
206
Table 5.5 CCS values (Å2) calculated from experiments described in this work using either the
Ruotolo et al. [143] calibration or the Smith et al. [150] calibration RSD (average of at least two measurements at three wave heights). Also shown are experimental and theoretical CCS values from other work: [150] and [309] who also used the Ruotolo et al. [143] calibration.
Protein This work
using [143]
This work
using [150]
Other work
(experimental)*
Other work
(theoretical)*#
Cytochrome c 1383 7% 1304 4% 1444 1422
Lysozyme 1481 8% 1420 9% 1496 1568
Myoglobin 1791 7% 1694 7% 1639 1628
Ovalbumin 2919 9% 2892 8%
Transferrin 4608 4% 4417 4%
2805 4% 2543 4% 2565 2796
2694 7% 2537 9% 2565 2701
1 2994 8% 3031 9% 2937 2989
2 4958 4% 4896 5% 4571 4740
3 6443 2% 6380 5% 6055 6080
4 8060 2% 7934 5% 7386 7607
2- 6294 3% 5961 5% 5805 6345
3- 8071 3% 7726 5% 7786 8062
3-- 9197 5% 8746 6% 8936 8904
C16 2065 9% 2035 6%
6106 6% 6364 4%
-C16 6806 7% 7114 5%
Rubisco 19828 8% 19242 6%
*CCS values are from [150] for the commercial proteins and [309] for the clamp loader proteins. #CCS values are based on computer modelling: MOBCAL exact hard sphere scattering for cytochrome c, MOBCAL projection approximation for myoglobin and lysozyme, MOBCAL coarse grained model for the clamp loader proteins [150], [309].
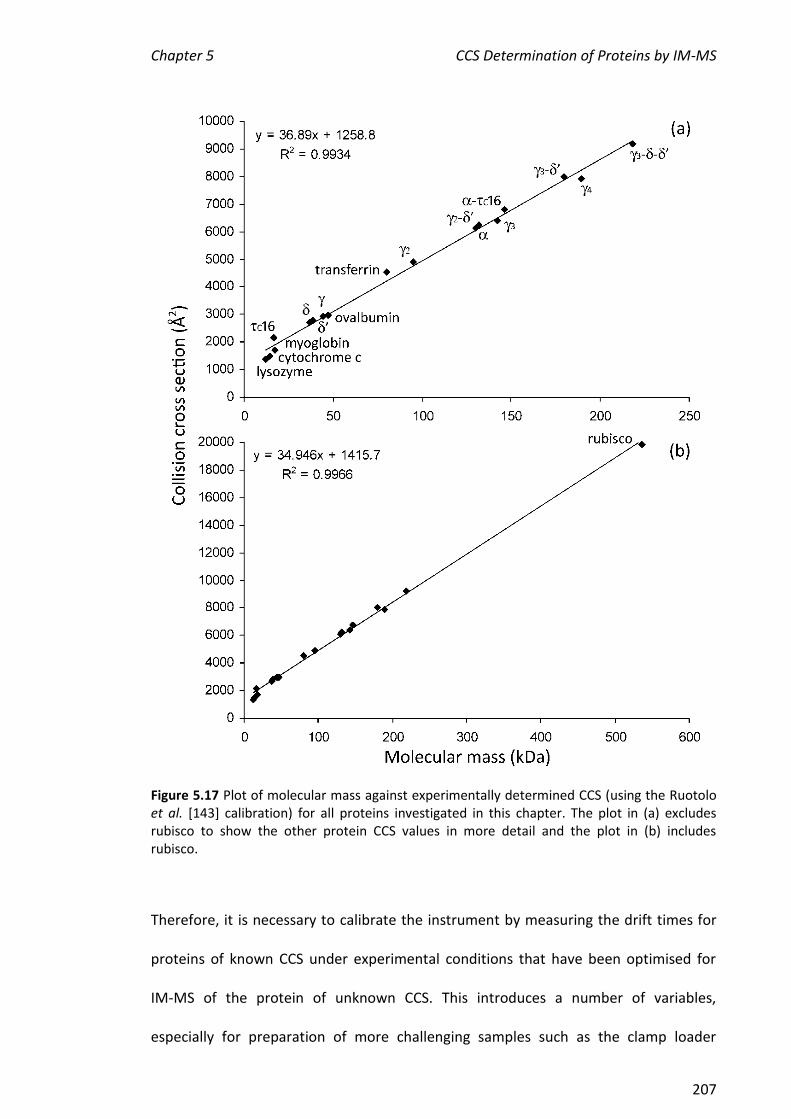
Chapter 5 CCS Determination of Proteins by IM-MS
207
Figure 5.17 Plot of molecular mass against experimentally determined CCS (using the Ruotolo et al. [143] calibration) for all proteins investigated in this chapter. The plot in (a) excludes rubisco to show the other protein CCS values in more detail and the plot in (b) includes rubisco.
Therefore, it is necessary to calibrate the instrument by measuring the drift times for
proteins of known CCS under experimental conditions that have been optimised for
IM-MS of the protein of unknown CCS. This introduces a number of variables,
especially for preparation of more challenging samples such as the clamp loader
Chapter 5 CCS Determination of Proteins by IM-MS
208
subunits which oligomerise to different extents and their subassemblies. This method
was tested by determining its reproducibility within our laboratory and by comparison
with independent results from the Robinson group. The CCS values agreed to within
10%.
Values of CCS were also determined for some commercially available proteins,
C16 and the large protein complex, rubisco. For all proteins, two calibration methods,
based on Ruotolo et al. [143] and Smith et al. [150], were used to determine CCS
values. The CCS values determined by these methods were within ~10% of each other
and the available literature values. In the future, the computer modelling program
MOBCAL, which can predict CCS values of proteins, will be applied in our laboratory to
enable more extensive CCS investigations. It should be noted that the comparison
between crystal structures and those obtained using MOBCAL should be performed
using caution and interpreted carefully. For example, this would allow us to compare
predicted CCS values for transferrin, ovalbumin, rubisco and C16 proteins with the
experimental CCS values determined in this chapter.
While conventional mass spectrometry can provide relative information on the
conformation of a protein/complex, ion mobility mass spectrometry has the capacity
of taking this several steps further by allowing the determination of three-dimensional
structure (CCS).
Chapter 6 Concluding Remarks
209
Chapter 6 Concluding Remarks
This thesis covers two broad goals: the first was to further our understanding of certain
interactions that occur within the primary replicative machinery of E. coli, known as
the DNA polymerase III holoenzyme; the second was to confirm/explore the
capabilities of mass spectrometry including a relatively new MS technique (travelling
wave ion mobility) in the investigation of biomolecules and their interactions.
In Chapter 3, nanoESI-MS was used to determine the relative binding affinities of
different C16 point mutants and truncations towards . The relative order of binding
affinities was consistent with that determined by SPR [137]. This is quite remarkable
considering the different buffers that were used and that the interaction involves
multiple determinants. Dissociation constants were not able to be determined and it is
proposed that one contributing factor was a substantial change in the response factor
of when present in a complex with C16. CID of the various -C16x complexes
enabled dissociation of the complexes but could not discriminate among the binding of
the different C16 protein mutants to .
The experiments carried out here are challenging given the high mass of the complexes
(~156 kDa) and the nature of the subunit itself. When high mass biomolecules are
analysed by mass spectrometry, the peak width of the ions observed is increased as
the contributions of different isotopes becomes significant. This, in combination with
the resolution available at high mass [311, 312], sets a limit on the resolution that is
Chapter 6 Concluding Remarks
210
available. Additionally, in order to investigate complexes under conditions where they
are likely to maintain a native fold, it is not advantageous to optimise mass spectra so
that peak widths of ions are at their minimum. In routine experiments aimed at
determining the accurate mass of a protein, desolvation temperatures in the ion
source are high and organic solvents may be included (to enhance desolvation);
solutions are acidified to assist in ionisation. These conditions minimise the peak width
of the ions, but are clearly not optimal for analysis of non-covalent biomolecular
complexes. The compromise between obtaining the best resolution (includes
consideration of peak width for ions) and maintaining native structure is an important
issue. It is likely there will be some complexes where it will not be possible to maintain
a native fold under conditions where useful mass spectra can be acquired. In the case
of and its complexes, peaks from ions were quite broad. While this suggests that
water, for example, was included in the structure (but not resolved as individual water
molecules) and provides some confidence that the fold of the protein is maintained, it
limits the ability to investigate the binding of small ligands (e.g. individual metal ions)
to . In addition, is not stable for extended periods of time in ammonium acetate
solutions. This is in contrast to other proteins studied in our laboratory such as β2, the
sliding clamp of DNA polymerase III, which gave high quality nanoESI mass spectra
even after several days in ammonium acetate and maintained its fold as supported by
CD spectroscopy (personal communication, M. J. Blayney and J. L. Beck).
The work performed in Chapter 4 (ESI-MS of 186, , TMP and metal ions) supports the
growing reports in the literature that ESI-MS is a useful and rapid technique for
investigating protein-metal-ligand complexes. The results showed that different
patterns of binding can be observed in the mass spectra, e.g. whether one, two, or a
Chapter 6 Concluding Remarks
211
greater number of metal ions are bound to the protein. Since there are sites on the
surfaces of proteins that may bind metal ions (e.g. acidic residues, Glu and Asp), the
‘specificity’ of the observed binding can be called into question. In this case, specific
binding means that the metals were bound at the active site. It is common practice in
the metalloenzyme research community to investigate the structure and activity of
metalloenzymes in the presence of different metal ions. These experiments are carried
out by addition of an excess of the metal ion under question. When full activity is
regained it is assumed that the active site has been reconstituted, but it is also possible
that non-specifically and relatively weakly bound metal ions are also present. It is not
possible using ESI-MS alone to show that the metals were bound at the active site;
however, the increase in the binding of Mn2+ observed by ESI-MS as Mn2+ was added
to 186 correlated with increased nuclease activity. The most important observation
made in the work presented in this Chapter was that the substrate mimic, TMP,
facilitated the binding of two metal ions (rather than one) to the protein (Mn2+, Zn2+
and Fe2+). Since the active site is known to be a binuclear centre, this strongly supports,
but does not prove, that at least in the presence of TMP, the natural metal ion binding
site was reconstituted. This observation provides confidence that the complexes
observed by ESI-MS, at least for this system, represent complexes found in solution.
Prior to this work, the clamp loader complex had not been extensively investigated
using mass spectrometry. As described in Chapter 5, experimental conditions were
determined for the assembly of the clamp loader complex of Pol III. These conditions
formed the basis for more extensive studies carried out in collaboration with the
Robinson group at Cambridge University (now at Oxford) [139]. Part of this work
involved comparisons of CCS of clamp loader assemblies determined in our laboratory
Chapter 6 Concluding Remarks
212
from CCS of the same assemblies measured in the Robinson laboratory [139], using the
recently released Synapt™ HDMS™ which contains a travelling wave ion mobility cell.
The Robinson group is a pioneering group of research in this area. It is not appropriate
to directly determine CCS values from drift time measurements using this type of
mobility cell since the electric field is not constant. Therefore, it is necessary to
calibrate the instrument by measuring the drift times for proteins of known CCS under
experimental conditions that have been optimised for TWIMS of the protein of
unknown CCS. This introduces a number of variables, especially for preparation of
more challenging samples such as the clamp loader subunits which oligomerise to
different extents, and their subassemblies. This method was tested by determining its
reproducibility within our laboratory and by comparison with independent results from
the Robinson group. The CCS values agreed to ≤10%. It is not possible at this early
stage of the application of this technique to state unequivocally whether this is
reasonable agreement. At present, calibration curves are based on CCS of denatured
‘standard’ proteins for which CCS has been measured in a drift tube ion mobility mass
spectrometer (electric field is constant so that drift time is proportional to CCS) [147].
While the conditions for denaturation have been reported, this represents a possible
source of variation among laboratories if these conditions are not meticulously
applied. Furthermore, the CCS range for the standard proteins used in the literature
(up to 3815Å2 [143]) is not sufficient to include the CCS of the largest biomolecular
assemblies. The application of TWIMS to determine CCS will therefore benefit from
development in computational methods to compare the CCS of structures determined
from X-ray crystallography with those determined in ion mobility experiments.
Chapter 6 Concluding Remarks
213
In 2010, the application of ESI-MS of non-covalent biomolecular complexes has
developed to a point where it is one of a suite of techniques that can be used to
determine the stoichiometries and probe the dynamics of these systems. Despite the
advances in the last ten years, these applications must be practiced by researchers
who are well-informed about the advantages and limitations of the technique. This
includes knowledge of the behaviour of the binding partners under different solution
conditions and finding ESI conditions that maintain the complex in its native form.

Chapter 7 References
214
Chapter 7 References
1. Marians, K.J., Annu. Rev. Biochem, 1992. 61: 673-715. 2. Jeruzalmi, D., M. O'Donnell, and J. Kuriyan, Curr. Opin. Struct. Biol., 2002. 12: 217-224. 3. McHenry, C.S., Mol. Microbiol., 2003. 49: 1157-1165. 4. Hamdan, S., P.D. Carr, S.E. Brown, D.L. Ollis, and N.E. Dixon, Structure, 2002. 10: 535-546. 5. Onrust, R., J. Finkelstein, V. Naktinis, J. Turner, L. Fang, and M. O'Donnell, J. Biol. Chem., 1995.
270: 13348-13357. 6. Tsurimoto, T., T. Melendy, and B. Stillman, Nature, 1990. 346: 534. 7. Stillman, B., Cell, 1994. 78: 725-728. 8. Kornberg, A., The Harvey Lectures, 1957-1959. 53: 83-112. 9. Kohara, Y., K. Akiyama, and K. Isono, Cell, 1987. 50: 495-508. 10. Studwell, P.S. and M. O'Donnell, J. Biol. Chem., 1990. 265: 1171-1178. 11. Steitz, T.A., J. Biol. Chem., 1999. 274: 17395-17398. 12. Mizrahi, V., P. Benkovic, and S.J. Benkovic, Proc. Natl. Acad. Sci. USA, 1986. 83: 5769-5773. 13. DeLucia, P. and J. Cairns, Nature, 1969. 224: 1164-1166. 14. Kornberg, T. and M.L. Gefter, Biochem. Biophys. Res. Commun., 1970. 40: 1348-1355. 15. Moses, R.E. and C.C. Richardson, Biochem. Biophys. Res. Commun., 1970. 41: 1557-1565. 16. Napolitano, R., R. Janel-Bintz, J. Wagner, and R.P.P. Fuchs, EMBO J., 2000. 19: 6259-6265. 17. Wu, Y.H., M.A. Franden, J.R. Hawker, and C.S. McHenry, J. Biol. Chem., 1984. 259: 12117-12122. 18. Maki, H. and A. Kornberg, J. Biol. Chem., 1985. 260: 12987-2992. 19. Siegel, E.C. and K.K. Vaccaro, Mutat. Res., Fundam. Mol. Mech. Mutag., 1978. 50: 9-17. 20. Kelman, Z. and M. O'Donnell, Curr. Opin. Genet. Dev., 1994. 4: 185-195. 21. Joyce, C.M. and T.A. Steitz, Annu. Rev. Biochem, 1994. 63: 777-822. 22. Benkovic, S.J., A.M. Valentine, and F. Salinas, Annu. Rev. Biochem, 2001. 70: 181-208. 23. Arai, K. and A. Kornberg, Proc. Natl. Acad. Sci. USA, 1979. 76: 4308-4312. 24. Frick, D.N. and C.C. Richardson, Annu. Rev. Biochem, 2001. 70: 39-80. 25. Patel, S.S. and K.M. Picha, Annu. Rev. Biochem, 2000. 69: 651-697. 26. Schaeffer, P., M. Headlam, and N.E. Dixon, IUBMB Life, 2004. 57: 5-12. 27. O'Donnell, M., D. Jeruzalmi, and J. Kuriyan, Curr. Biol., 2001. 11: R935-R946. 28. Xiao, H., Z. Dong, and M. O'Donnell, J. Biol. Chem., 1993. 268: 11779-11784. 29. McHenry, C.S., J. Biol. Chem., 1982. 257: 2657-2663. 30. Prelich, G., C.K. Tan, M. Kostura, M.B. Mathews, A.G. So, K.M. Downey, and B. Stillman, Nature,
1987. 326: 517-520. 31. Tsurimoto, T. and B. Stillman, Molecular Cell Biology, 1989. 9: 609-619. 32. McHenry, C.S. and W. Crow, J. Biol. Chem., 1979. 254: 1748-1753. 33. Kelman, Z. and M. O'Donnell, Annu. Rev. Biochem, 1995. 64: 171-200. 34. Kim, D.R. and C.S. McHenry, J. Biol. Chem., 1996. 271: 20681-20689. 35. Keniry, M.A., A.Y. Park, E.A. Owen, S.M. Hamdan, G. Pintacuda, G. Otting, and N.E. Dixon, J.
Bacteriol., 2006. 188: 4464-4473. 36. Lamers, M.H., R.E. Georgescu, S.G. Lee, M. O'Donnell, and J. Kuriyan, Cell, 2006. 126: 881-892. 37. DeRose, E.F., T. Darden, S. Harvey, S. Gabel, F.W. Perrino, R.M. Schaaper, and R.E. London,
Biochemistry, 2003. 42: 3635-3644. 38. Scheuermann, R., S. Tam, P.M. Burgers, C. Lu, and H. Echols, Proc. Natl. Acad. Sci. USA, 1983.
80: 7085-7089. 39. Keniry, M.A., H.A. Berthon, J. Yang, C.S. Miles, and N.E. Dixon, Protein Sci., 2000. 9: 721-733. 40. Mueller, G.A., T.W. Kirby, E.F. DeRose, D. Li, R.M. Schaaper, and R.E. London, J. Bacteriol., 2005.
187: 7081-7089. 41. Kong, X.P., R. Onrust, M. O'Donnell, and J. Kuriyan, Cell, 1992. 69: 425-437. 42. Jeruzalmi, D., O. Yurieva, Y.X. Zhao, M. Young, J. Stewart, M. Hingorani, M. O'Donnell, and J.
Kuriyan, Cell, 2001. 106: 417-428. 43. Su, X.-C., S. Jergic, M.A. Keniry, N.E. Dixon, and G. Otting, Nucl. Acids Res., 2007. 35: 2825-2832. 44. Podobnik, M., T.F. Weitze, M. O'Donnell, and J. Kuriyan, Structure, 2003. 11: 253-263.
Chapter 7 References
215
45. Jeruzalmi, D., M. O'Donnell, and J. Kuriyan, Cell, 2001. 106: 429-441. 46. Guenther, B., R. Onrust, A. Sali, M. Odonnell, and J. Kuriyan, Cell, 1997. 91: 335-345. 47. Gulbis, J.M., S.L. Kazmirski, J. Finkelstein, Z. Kelman, M. O'Donnell, and J. Kuriyan, Eur. J.
Biochem., 2004. 271: 439-449. 48. Studwell-Vaughan, P.S. and M. O'Donnell, J. Biol. Chem., 1993. 268: 11785-11791. 49. Taft-Benz, S.A. and R.M. Schaaper, J. Bacteriol., 2004. 186: 2774-2780. 50. Echols, H. and M.F. Goodman, Annu. Rev. Biochem, 1991. 60: 477-511. 51. Miller, H. and F.W. Perrino, Biochemistry, 1996. 35: 12919-12925. 52. Perrino, F.W., S. Harvey, and S.M. McNeill, Biochemistry, 1999. 38: 16001-16009. 53. Taft-Benz, S.A. and R.M. Schaaper, J. Bacteriol., 1999. 181: 2963-2965. 54. Hamdan, S., E.M. Bulloch, P.R. Thompson, J.L. Beck, J.Y. Yang, J.A. Crowther, P.E. Lilley, P.D.
Carr, D.L. Ollis, S.E. Brown, and N.E. Dixon, Biochemistry, 2002. 41: 5266-5275. 55. Bernad, A., L. Blanco, J. Lázaro, G. Martín, and M. Salas, Cell, 1989. 59: 219-228. 56. Barnes, M.H., P. Spacciapoli, D.H. Li, and N.C. Brown, Gene, 1995. 165: 45-50. 57. Viswanathan, M., A. Lanjun, and S.T. Lovett, J. Biol. Chem., 1999. 274: 30094-30100. 58. Blanco, L., A. Bernad, and M. Salas, Gene, 1992. 112: 139-144. 59. Taft-Benz, S.A. and R.M. Schaaper, Nucl. Acids Res., 1998. 26: 4005-4011. 60. Moser, M.J., W.R. Holley, A. Chatterjee, and I.S. Mian, Nucl. Acids Res., 1997. 25: 5110-5118. 61. Derbyshire, V., N.D.F. Grindley, and C.M. Joyce, EMBO J., 1991. 10: 17-24. 62. Stukenberg, P.T., J. Turner, and M. O'Donnell, Cell, 1994. 78: 877-887. 63. Tsuchihashi, Z. and A. Kornberg, Proc. Natl. Acad. Sci. USA, 1990. 87: 2516-2520. 64. Gao, D.X. and C.S. McHenry, J. Biol. Chem., 2001. 276: 4441-4446. 65. O'Donnell, M. and J. Kuriyan, Curr. Opin. Struct. Biol., 2006. 16: 35-41. 66. Hanson, P.I. and S.W. Whiteheart, Nat. Rev. Mol. Cell Biol., 2005. 6: 519-529. 67. Neuwald, A.F., L. Aravind, J.L. Spouge, and E.V. Koonin, Genome Res., 1999. 9: 27-43. 68. Witte, G., C. Urbanke, and U. Curth, Nucl. Acids Res., 2003. 31: 4434-4440. 69. Glover, B.P. and C.S. McHenry, J. Biol. Chem., 1998. 273: 23476-23484. 70. Phizicky, E.M. and S. Fields, Microbiol. Rev., 1995. 59: 94-123. 71. Ramaswamy, S., H. Eklund, and B.V. Plapp, Biochemistry, 2002. 33: 5230-5237. 72. Boyer, P.D., Annu. Rev. Biochem, 2003. 66: 717-749. 73. Green, R. and H.F. Noller, Annu. Rev. Biochem, 2003. 66: 679-716. 74. Bochtler, M., L. Ditzel, M. Groll, C. Hartmann, and R. Huber, Annu. Rev. Biophys. Biomol. Struct.,
2003. 28: 295-317. 75. O'Donnell, M., J. Biol. Chem., 2006. 281: 10653-10656. 76. Alberts, B., Cell, 1998. 92: 291-294. 77. Kluger, R. and A. Alagic, Bioorg. Chem., 2004. 32: 451-472. 78. Periasamy, A., J. Biomed. Opt., 2001. 6: 287-291. 79. Aebi, U., W.E. Fowler, E.L. Buhle, and P.R. Smith, J. Ultrastruct. Res., 1984. 88: 143-176. 80. Pierce, M.M., C.S. Raman, and B.T. Nall, Methods, 1999. 19: 213-221. 81. Eisenberg, H., Biophys. Chem., 2000. 88: 1-9. 82. Cole, J. and J. Hansen, Biomol. Tech., 1999. 10: 163-176. 83. Hansen, J.C., J. Lebowitz, and B. Demeler, Biochemistry, 1994. 33: 13155-13163. 84. Howlett, G.J., A.P. Minton, and G. Rivas, Curr. Opin. Chem. Biol., 2006. 10: 430-436. 85. Dunn, S.D. and J. Chandler, J. Biol. Chem., 1998. 273: 8646-8651. 86. Winzor, D.J., J. Mol. Recognit., 2000. 13: 279-298. 87. Podust, V.N., N. Tiwari, S. Stephan, and E. Fanning, J. Biol. Chem., 1998. 273: 31992-31999. 88. Lowe, J., D. Stock, B. Jap, P. Zwickl, W. Baumeiser, and R. Huber, Science, 1995. 268: 533-537. 89. Christodoulou, J., G. Larsson, P. Fucini, S.R. Connell, T.A. Pertinhez, C.L. Hanson, C. Redfield,
K.H. Nierhaus, C.V. Robinson, J. Schleucher, and C.M. Dobson, Proc. Natl. Acad. Sci. USA, 2004. 101: 10949-10954.
90. Loo, J.A., Mass Spectrom. Rev., 1997. 16: 1-23. 91. Russell, R.B., F. Alber, P. Aloy, F.P. Davis, D. Korkin, M. Pichaud, M. Topf, and A. Sali, Curr. Opin.
Struct. Biol., 2004. 14: 313-324. 92. Sharon, M. and C.V. Robinson, Annu. Rev. Biochem, 2007. 76: 167-193. 93. Myszka, D.G., Curr. Opin. Biotechnol., 1997. 8: 50-57. 94. Malmqvist, M., Nature, 1993. 361: 186-187. 95. Bargis-Surgey, P., J.-P. Lavergne, P. Gonzalo, C. Vard, O. Filhol-Cochet, and J.-P. Reboud, Eur. J.
Biochem., 1999. 262: 606-611. 96. Thomson, J.J., Proc. R. Soc. Lond. A, 1913. 89: 1-20.

Chapter 7 References
216
97. Douglas, D.J., A.J. Frank, and D.M. Mao, Mass Spectrom. Rev., 2005. 24: 1-29. 98. Griffiths, W.J., A.P. Jonsson, S.Y. Liu, D.K. Rai, and Y.Q. Wang, Biochem. J, 2001. 355: 545-561. 99. El-Aneed, A., A. Cohen, and J. Banoub, Appl. Spectrosc. Rev., 2009. 44: 210 - 230. 100. Heck, A.J.R. and R.H.H. van den Heuvel, Mass Spectrom. Rev., 2004. 23: 368-389. 101. Liu, L.K., K.L. Busch, and R.G. Cooks, Anal. Chem., 1981. 53: 109-113. 102. Karas, M. and F. Hillenkamp, Anal. Chem., 1988. 60: 2299-2301. 103. Dreisewerd, K., Chem. Rev., 2003. 103: 395-426. 104. Wong, S.F., C.K. Meng, and J.B. Fenn, J. Phys. Chem., 1988. 92: 546-550. 105. Fenn, J.B., M. Mann, C.K. Meng, S.F. Wong, and C.M. Whitehouse, Science, 1989. 246: 64-70. 106. Fenn, J., J Biomol Tech., 2002. 13: 101-118. 107. Laramee, J.A., B. Arbogast, and M.L. Deinzer, Anal. Chem., 1989. 61: 2154-2160. 108. McLafferty, F.W., Acc. Chem. Res., 1980. 13: 33-39. 109. Biemann, K. and H.A. Scoble, Science, 1987. 237: 992-998. 110. Orlando, R., C. Murphy, C. Fenselau, G. Hansen, and R.J. Cotter, Anal. Chem., 1990. 62: 125-129. 111. Smith, R.D., J.A. Loo, C.G. Edmonds, C.J. Barinaga, and H.R. Udseth, Anal. Chem., 1990. 62: 882-
899. 112. Ganem, B., Y.T. Li, and J.D. Henion, J. Am. Chem. Soc., 1991. 113: 6294-6296. 113. Katta, V. and B.T. Chait, J. Am. Chem. Soc., 1991. 113: 8534-8535. 114. Loo, J.A., Int. J. Mass spectrom., 2000. 200: 175-186. 115. Hill, T.M., Annu. Rev. Microbiol., 1992. 46: 603-633. 116. Kamada, K., T. Horiuchi, K. Ohsumi, N. Shimamoto, and K. Morikawa, Nature, 1996. 383: 598-
603. 117. Neylon, C., S.E. Brown, A.V. Kralicek, C.S. Miles, C.A. Love, and N.E. Dixon, Biochemistry, 2000.
39: 11989-11999. 118. Kapur, A., J.L. Beck, S.E. Brown, N.E. Dixon, and M.M. Sheil, Protein Sci., 2002. 11: 147-157. 119. Vaneldik, L.J., J.G. Zendegui, D.R. Marshak, and D.M. Watterson, Int. Rev. Cytol., 1982. 77: 1-61. 120. Lafitte, D., J.P. Capony, G. Grassy, J. Haiech, and B. Calas, Biochemistry, 1995. 34: 13825-13832. 121. Cox, J.A., M. Comte, A. Malnoe, D. Burger, and E.A. Stein, Met. Ions Biol. Syst., 1984. 17: 215-
273. 122. Kretsinger, R.H., S.E. Rudnick, and L.J. Weissman, J. Inorg. Biochem., 1986. 28: 289-302. 123. Shirran, S., P. Garnaud, S. Daff, D. McMillan, and P. Barran, J. R. Soc. Interface, 2005. 2: 465-476. 124. Haas, T.A. and E.F. Plow, J. Biol. Chem., 1996. 271: 6017-6026. 125. Hofstadler, S.A. and K.A. Sannes-Lowery, Nat. Rev. Drug Discov., 2006. 5: 585-595. 126. Beck, J.L., M.L. Colgrave, S.F. Ralph, and M.M. Sheil, Mass Spectrom. Rev., 2001. 20: 61-87. 127. Rostom, A.A., P. Fucini, D.R. Benjamin, R. Juenemann, K.H. Nierhaus, F.U. Hartl, C.M. Dobson,
and C.V. Robinson, Proc. Natl. Acad. Sci. USA, 2000. 97: 5185-5190. 128. van Duijn, E., D.A. Simmons, R.H.H. van den Heuvel, P.J. Bakkes, H. van Heerikhuizen, R.M.A.
Heeren, C.V. Robinson, S.M. van der Vies, and A.J.R. Heck, J. Am. Chem. Soc., 2006. 128: 4694-4702.
129. Lekha, S. and A.V. Dietrich, J. Mass Spectrom., 2004. 39: 1091-1112. 130. Sobott, F. and C.V. Robinson, Curr. Opin. Struct. Biol., 2002. 12: 729-734. 131. Hanson, C.L. and C.V. Robinson, J. Biol. Chem., 2004. 279: 24907-24910. 132. Watt, S.J., T. Urathamakul, P.M. Schaeffer, N.K. Williams, M.M. Sheil, N.E. Dixon, and J.L. Beck,
Rapid Commun. Mass Spectrom., 2007. 21: 132-140. 133. Wilm, M. and M. Mann, Anal. Chem., 1996. 68: 1-8. 134. Karas, M., U. Bahr, and T. Dulcks, Fresenius J. Anal. Chem., 2000. 366: 669-676. 135. Manisali, I., D.D.Y. Chen, and B.B. Schneider, TrAC, Trends Anal. Chem., 2006. 25: 243-256. 136. Wijffels, G., B.P. Dalrymple, P. Prosselkov, K. Kongsuwan, V.C. Epa, P.E. Lilley, S. Jergic, J.
Buchardt, S.E. Brown, P.F. Alewood, P.A. Jennings, and N.E. Dixon, Biochemistry, 2004. 43: 5661-5671.
137. Jergic, S., K. Ozawa, N.K. Williams, X.-C. Su, D.D. Scott, S.M. Hamdan, J.A. Crowther, G. Otting, and N.E. Dixon, Nucl. Acids Res., 2007. 35: 2813-2824.
138. Ozawa, K., S. Jergic, J.A. Crowther, P.R. Thompson, G. Wijffels, G. Otting, and N.E. Dixon, J. Biomol. NMR, 2005. 32: 235-241.
139. Park, A.Y., S. Jergic, A. Politis, B.T. Ruotolo, D. Hirshberg, L.L. Jessop, J.L. Beck, D. Barsky, M. O'Donnell, N.E. Dixon, and C.V. Robinson, Structure, 2010. 18: 285-292.
140. Urathamakul, T., PhD Thesis, in Department of Chemistry. 2006, University of Wollongong. 141. Fersht, A., Enzyme Structure and Mechanism. 1977, Reading and San Francisco: W. H. Freeman
and Co.
Chapter 7 References
217
142. Williams, N.K., E. Liepinsh, S.J. Watt, P. Prosselkov, J.M. Matthews, P. Attard, J.L. Beck, N.E. Dixon, and G. Otting, J. Mol. Biol., 2005. 346: 1095-1108.
143. Ruotolo, B.T., J.L.P. Benesch, A.M. Sandercock, S.-J. Hyung, and C.V. Robinson, Nature Protocols, 2008. 3: 1139-1152.
144. Sobott, F., H. Hernandez, M.G. McCammon, M.A. Tito, and C.V. Robinson, Anal. Chem., 2002. 74: 1402-1407.
145. Giles, K., S. Pringle, K. Worthington, D. Little, J.L. Wildgoose, and R. Bateman, Rapid Commun. Mass Spectrom., 2004. 18: 2401-2414.
146. Perkel, J.M., The Scientist, 2001. 15: 31. 147. Clemmer, D.E. Clemmer Collision Cross-section Database. [cited; Available from:
http://www.indiana.edu/~clemmer/Research/cross%20section%20database/Proteins/protein_cs.htm.
148. Shelimov, K.B., D.E. Clemmer, R.R. Hudgins, and M.F. Jarrold, J. Am. Chem. Soc., 1997. 119: 2240-2248.
149. Ruotolo, B.T. and D.H. Russell, J. Phys. Chem. B, 2004. 108: 15321-15331. 150. Smith, D.P., T.W. Knapman, I. Campuzano, R.W. Malham, J.T. Berryman, S.E. Radford, and A.E.
Ashcroft, Eur. J. Mass Spectrom., 2009. 15: 113-130. 151. Bush, M.F., Z. Hall, K. Giles, J. Hoyes, C.V. Robinson, and B.T. Ruotolo, Anal. Chem., 2010. 82:
9557-9565. 152. Moreland, J.L., A. Gramada, O.V. Buzko, Q. Zhang, and P.E. Bourne, BMC Bioinformatics, 2005.
6: 7. 153. Berman, H.M., J. Westbrook, Z. Feng, G. Gilliland, T.N. Bhat, H. Weissig, I.N. Shindyalov, and P.E.
Bourne, Nucl. Acids Res., 2000. 28: 235-242. 154. Studwell-Vaughan, P.S. and M. ODonnell, J. Biol. Chem., 1991. 266: 19833-19841. 155. Aravind, L. and E.V. Koonin, Nucl. Acids Res., 1998. 26: 3746-3752. 156. Dohrmann, P.R. and C.S. McHenry, J. Mol. Biol., 2005. 350: 228-239. 157. Murzin, A.G., EMBO J., 1993. 12: 861-867. 158. Lopez de Saro, F.L., R.E. Georgescu, and M. O'Donnell, Proc. Natl. Acad. Sci. USA, 2003. 100:
14689-14694. 159. Kim, D.R. and C.S. McHenry, J. Biol. Chem., 1996. 271: 20690-20698. 160. Gao, D. and C.S. McHenry, J. Biol. Chem., 2001. 276: 4433-4440. 161. Mathur, S., M. Badertscher, M. Scott, and R. Zenobi, PCCP, 2007. 9: 6187-6198. 162. Kaddis, C.S., S.H. Lomeli, S. Yin, B. Berhane, M.I. Apostol, V.A. Kickhoefer, L.H. Rome, and J.A.
Loo, J. Am. Soc. Mass. Spectrom., 2007. 18: 1206-1216. 163. Pierce, S.E., R. Kieltyka, H.F. Sleiman, and J.S. Brodbelt, Biopolymers, 2009. 91: 233-243. 164. Sannes-Lowery, K.A., R.H. Griffey, and S.A. Hofstadler, Anal. Biochem., 2000. 280: 264-271. 165. Annis, D.A., E. Nickbarg, X. Yang, M.R. Ziebell, and C.E. Whitehurst, Curr. Opin. Chem. Biol.,
2007. 11: 518-526. 166. Hossain, B.M., D.A. Simmons, and L. Konermann, Can. J. Chem.-Rev. Can. Chim., 2005. 83: 1953-
1960. 167. Peschke, M., U.H. Verkerk, and P. Kebarle, J. Am. Soc. Mass. Spectrom., 2004. 15: 1424-1434. 168. Gabelica, V., N. Galic, F. Rosu, C. Houssier, and E. De Pauw, J. Mass Spectrom., 2003. 38: 491-
501. 169. Loo, J.A., P.F. Hu, P. McConnell, W.T. Mueller, T.K. Sawyer, and V. Thanabal, J. Am. Soc. Mass.
Spectrom., 1997. 8: 234-243. 170. Cheng, X.H., A.C. Harms, P.N. Goudreau, T.C. Terwilliger, and R.D. Smith, Proc. Natl. Acad. Sci.
USA, 1996. 93: 7022-7027. 171. Wang, W.J., E.N. Kitova, and J.S. Klassen, Anal. Chem., 2003. 75: 4945-4955. 172. Gao, J., X. Cheng, R. Chen, G.B. Sigal, J.E. Bruce, B.L. Schwartz, S.A. Hofstadler, G.A. Anderson,
R.D. Smith, and G.M. Whitesides, J. Med. Chem., 1996. 39: 1949-1955. 173. Molday, R.S., S.W. Englander, and R.G. Kallen, Biochemistry, 2002. 11: 150-158. 174. Katta, V. and B.T. Chait, Rapid Commun. Mass Spectrom., 1991. 5: 214-217. 175. Tsutsui, Y. and P.L. Wintrode, Curr. Med. Chem., 2007. 14: 2344-2358. 176. Dyson, H.J. and P.E. Wright, Chem. Rev., 2004. 104: 3607-3622. 177. Sprangers, R. and L.E. Kay, Nature, 2007. 445: 618-622. 178. Fiaux, J., E.B. Bertelsen, A.L. Horwich, and K. Wuthrich, Nature, 2002. 418: 207-211. 179. Zhu, M.M., R. Chitta, and M.L. Gross, Int. J. Mass spectrom., 2005. 240: 213-220. 180. Robinson, C.V., M. Gross, S.J. Eyles, J.J. Ewbank, M. Mayhew, F.U. Hartl, C.M. Dobson, and S.E.
Radford, Nature, 1994. 372: 646-651.
Chapter 7 References
218
181. Chitta, R.K., D.L. Rempel, M.A. Grayson, E.E. Remsen, and M.L. Gross, J. Am. Soc. Mass. Spectrom., 2006. 17: 1526-1534.
182. Holleman, F. and J.B.L. Hoekstra, New Engl. J. Med., 1997. 337: 176-183. 183. Suchanova, B. and R. Tuma, Microb. Cell. Fact., 2008. 7: 20. 184. Chowdhury, S.K., V. Katta, and B.T. Chait, J. Am. Chem. Soc., 1990. 112: 9012-9013. 185. Gumerov, D.R., A. Dobo, and I.A. Kaltashov, Eur. J. Mass Spectrom., 2002. 8: 123-129. 186. Watt, S.J., M.M. Sheil, J.L. Beck, P. Prosselkov, G. Otting, and N.E. Dixon, J. Am. Soc. Mass.
Spectrom., 2007. 18: 1605-1611. 187. Jecklin, M.C., D. Touboul, C. Bovet, A. Wortmann, and R. Zenobi, J. Am. Soc. Mass. Spectrom.,
2008. 19: 332-343. 188. Hernandez, H. and C.V. Robinson, Nature Protocols, 2007. 2: 715-712. 189. Daniel, J.M., S.D. Friess, S. Rajagopalan, S. Wendt, and R. Zenobi, Int. J. Mass spectrom., 2002.
216: 1-27. 190. Ruotolo, B.T., K. Giles, I. Campuzano, A.M. Sandercock, R.H. Bateman, and C.V. Robinson,
Science, 2005. 310: 1658-1661. 191. Krishnaswamy, S.R., E.R. Williams, and J.F. Kirsch, Protein Sci., 2006. 15: 1465-1475. 192. Daniel, J.ü.M., G. McCombie, S. Wendt, and R. Zenobi, J. Am. Soc. Mass. Spectrom., 2003. 14:
442-448. 193. Wortmann, A., M.C. Jecklin, D. Touboul, M. Badertscher, and R. Zenobi, J. Mass Spectrom.,
2008. 43: 600-608. 194. Benesch, J.L.P., J. Am. Soc. Mass. Spectrom., 2009. 20: 341-348. 195. Jennings, K.R., Int. J. Mass spectrom., 2000. 200: 479-493. 196. Anil, K.S. and H.F. Jean, J. Mass Spectrom., 2000. 35: 1069-1090. 197. Boskovic, J., J. Coloma, T. Aparicio, M. Zhou, C.V. Robinson, J. Mendez, and G. Montoya, Embo
Reports, 2007. 8: 678-684. 198. Hanson, C.L., P. Fucini, L.L. Ilag, K.H. Nierhaus, and C.V. Robinson, J. Biol. Chem., 2003. 278:
1259-1267. 199. Light-Wahl, K.J., B.L. Schwartz, and R.D. Smith, J. Am. Chem. Soc., 1994. 116: 5271-5278. 200. McKay, A.R., B.T. Ruotolo, L.L. Ilag, and C.V. Robinson, J. Am. Chem. Soc., 2006. 128: 11433-
11442. 201. Tjernberg, A., S. Carno, F. Oliv, K. Benkestock, P.-O. Edlund, W.J. Griffiths, and D. Hallen, Anal.
Chem., 2004. 76: 4325-4331. 202. Wing, R.A., S. Bailey, and T.A. Steitz, J. Mol. Biol., 2008. 382: 859-869. 203. Bailey, S., R.A. Wing, and T.A. Steitz, Cell, 2006. 126: 893-904. 204. Leu, F.P., R. Georgescu, and M. O'Donnell, Mol. Cell, 2003. 11: 315-327. 205. Miranker, A., C.V. Robinson, S.E. Radford, R.T. Aplin, and C.M. Dobson, Science, 1993. 262: 896-
900. 206. Woodward, C., I. Simon, and E. Tuchsen, Mol. Cell. Biochem., 1982. 48: 135-160. 207. Smith, D.L., Y.Z. Deng, and Z.Q. Zhang, J. Mass Spectrom., 1997. 32: 135-146. 208. Arrington, C.B., L.M. Teesch, and A.D. Robertson, J. Mol. Biol., 1999. 285: 1265-1275. 209. Hoerner, J.K., H. Xiao, A. Dobo, and I.A. Kaltashov, J. Am. Chem. Soc., 2004. 126: 7709-7717. 210. Ferguson, P.L., J.X. Pan, D.J. Wilson, B. Dempsey, G. Lajoie, B. Shilton, and L. Konermann, Anal.
Chem., 2007. 79: 153-160. 211. Hodkinson, J.P., T.R. Jahn, S.E. Radford, and A.E. Ashcroft, J. Am. Soc. Mass. Spectrom., 2009.
20: 278-286. 212. Hossain, B.M. and L. Konermann, Anal. Chem., 2006. 78: 1613-1619. 213. Dumoulin, M., A.M. Last, A. Desmyter, K. Decanniere, D. Canet, G. Larsson, A. Spencer, D.B.
Archer, J. Sasse, S. Muyldermans, L. Wyns, C. Redfield, A. Matagne, C.V. Robinson, and C.M. Dobson, Nature, 2003. 424: 783-788.
214. Dosztanyi, Z., B. Meszaros, and I. Simon, Brief. Bioinform. 11: 225-243. 215. de la Mora, J.F., Anal. Chim. Acta, 2000. 406: 93-104. 216. Kaltashov, I.A., M.X. Zhang, S.J. Eyles, and R.R. Abzalimov, Anal. Bioanal. Chem., 2006. 386: 472-
481. 217. Wilcox, D.E., Chem. Rev., 1996. 96: 2435-2458. 218. Vallee, B.L. and R.J.P. Williams, Proc. Natl. Acad. Sci. USA, 1968. 59: 498-505. 219. Knowles, J.R., Annu. Rev. Biochem, 1980. 49: 877-919. 220. Beck, J.L., L.A. McConachie, A.C. Summors, W.N. Arnold, J. DeJersey, and B. Zerner, Biochim.
Biophys. Acta, 1986. 869: 61-68.
Chapter 7 References
219
221. Schenk, G., Y.B. Ge, L.E. Carrington, C.J. Wynne, I.R. Searle, B.J. Carroll, S. Hamilton, and J. de Jersey, Arch. Biochem. Biophys., 1999. 370: 183-189.
222. Taylor, A., Trends Biochem. Sci, 1993. 18: 167-172. 223. Dietrich, M., D. Munstermann, H. Suerbaum, and H. Witzel, Eur. J. Biochem., 1991. 1999: 105-
113. 224. Klabunde, T., N. Strater, R. Frohlich, H. Witzel, and B. Krebs, J. Mol. Biol., 1996. 259: 737-748. 225. Han, H., J.M. Rifkind, and A.S. Mildvan, Biochemistry, 1991. 30: 11104-11108. 226. Curley, J.F., C.M. Joyce, and J.A. Piccirilli, J. Am. Chem. Soc., 1997. 119: 12691-12692. 227. Brautigam, C.A. and T.A. Steitz, J. Mol. Biol., 1998. 277: 363-377. 228. Ollis, D.L., F. Brick, R. Hamlin, N.G. Xuong, and T.A. Steitz, Nature, 1985. 313: 762-766. 229. Beese, L. and T.A. Steitz, EMBO J., 1991. 10: 25-33. 230. Derbyshire, V., P.S. Freemont, M.R. Sanderson, L. Beese, J.M. Friedman, C.M. Joyce, and T.A.
Steitz, Science, 1988. 240: 199-201. 231. Freemont, P.S., J.M. Friedman, L.S. Beese, M.R. Sanderson, and T.A. Steitz, Proc. Natl. Acad. Sci.
USA, 1988. 85: 8924-8928. 232. DeRose, E.F., D. Li, T. Darden, S. Harvey, and F.W. Perrino, Biochemistry, 2002. 41: 94-110. 233. Hamdan, S., S.E. Brown, P.R. Thompson, J.Y. Yang, P.D. Carr, D.L. Ollis, G. Otting, and N.E. Dixon,
J. Struct. Biol., 2000. 131: 164-169. 234. Cisneros, G.A., L. Perera, R.M. Schaaper, L.C. Pedersen, R.E. London, L.G. Pedersen, and T.A.
Darden, J. Am. Chem. Soc., 2009. 131: 1550-1556. 235. Brouwers, E.E.M., M. Tibben, H. Rosing, J.H.M. Schellens, and J.H. Beijnen, Mass Spectrom.
Rev., 2008. 27: 67-100. 236. Szpunar, J. and R. Lobinski, Pure Appl. Chem., 1999. 71: 899-918. 237. Manley, S.A., S. Byrns, A. Lyon, P. Brown, and J. Gailer, J. Biol. Inorg. Chem., 2009. 14: 61-74. 238. Mullen, G.P., E.H. Serpersu, L.J. Ferrin, L.A. Loeb, and A.S. Mildvan, J. Biol. Chem., 1990. 265:
14327-14334. 239. Conlan, L.H. and C.M. Dupureur, Biochemistry, 2002. 41: 1335-1342. 240. Veenstra, T.D., K.L. Johnson, A.J. Tomlinson, S. Naylor, and R. Kumar, Biochemistry, 1997. 36:
3535-3542. 241. Nabuchi, Y., N. Murao, Y. Asoh, and M. Takayama, Anal. Chem., 2007. 79: 8342-8349. 242. Chivers, P.T. and R.T. Sauer, Chem. Biol., 2002. 9: 1141-1148. 243. Gupta, R., S.M. Hamdan, N.E. Dixon, M.M. Sheil, and J.L. Beck, Protein Sci., 2004. 13: 2878-
2887. 244. Coleman, J.E., Annu. Rev. Biophys. Biomol. Struct., 1992. 21: 441-483. 245. Lehtinen, D.A. and F.W. Perrino, Biochem. J, 2004. 384: 337-348. 246. Jessop, L., Honours Thesis, in Department of Chemistry. 2005, University of Wollongong. 247. Perry, J.J.P., S.M. Yannone, L.G. Holden, C. Hitomi, A. Asaithamby, S. Han, P.K. Cooper, D.J.
Chen, and J.A. Tainer, Nat. Struct. Mol. Biol., 2006. 13: 414-422. 248. Pintacuda, G., M.A. Keniry, T. Huber, A.Y. Park, N.E. Dixon, and G. Otting, J. Am. Chem. Soc.,
2004. 126: 2963-2970. 249. Klabunde, T., C. Eicken, J.C. Sacchettini, and B. Krebs, Nat. Struct. Biol., 1998. 5: 1084-1090. 250. Smith, R.D. and K.J. Light-Wahl, Biol. Mass Spectrom., 1993. 22: 493-501. 251. Lee, V.E., J.M. Schulman, E.I. Stiefel, and C.C. Lee, J. Inorg. Biochem., 2007. 101: 1707-1718. 252. Sparks, D.L., R. Friedland, S. Petanceska, B.G. Schreurs, J. Shi, G. Perry, M.A. Smith, A. Sharma,
S. DeRosa, C. Ziolkowski, and G. Stankovic, J. Nutr. Health Aging, 2006. 10: 247-254. 253. Cotton, F.A. and G. Wilkinson, Advanced Inorganic Chemistry. 1988, New York: John Wiley &
Sons. 254. Beck, J.L., J. Dejersey, B. Zerner, M.P. Hendrich, and P.G. Debrunner, J. Am. Chem. Soc., 1988.
110: 3317-3318. 255. Weast, C. and M.J. Astle, CRC Handbook of Chemistry and Physics. Vol. 63. 1982-1983, Boca
Raton. 256. Messori, L. and M. Piccioli, J. Inorg. Biochem., 1991. 42: 185-190. 257. Frey, M.W., S.T. Frey, W.D. Horrocks, B.F. Kaboord, and S.J. Benkovic, Chem. Biol., 1996. 3: 393-
403. 258. Brautigam, C.A., K. Aschheim, and T.A. Steitz, Chem. Biol., 1999. 6: 901-908. 259. Kunkel, T.A. and K. Bebenek, Annu. Rev. Biochem, 2000. 69: 497-529. 260. Pinkse, M.W.H., A.J.R. Heck, K. Rumpel, and F. Pullen, J. Am. Soc. Mass. Spectrom., 2004. 15:
1392-1399.
Chapter 7 References
220
261. Geleva, N.A., S.W. Esch, T.D. Williams, L.M. Markille, and T.C. Squier, J. Am. Soc. Mass. Spectrom., 2005. 16: 1470-1780.
262. Beck, J.L., D.T. Keough, J. Dejersey, and B. Zerner, Biochim. Biophys. Acta, 1984. 791: 357-363. 263. Cohen, M.J. and F.W. Karasek, J. Chromatogr. Sci., 1970. 8: 330. 264. Buryakov, I.A., E.V. Krylov, E.G. Nazarov, and U.K. Rasulev, Int. J. Mass Spectrom. Ion Processes,
1993. 128: 143-148. 265. Sacristan, E. and A.A. Solis, IEEE Trans. Instrum. Meas., 1998. 47: 769-775. 266. Pringle, S.D., K. Giles, J.L. Wildgoose, J.P. Williams, S.E. Slade, K. Thalassinos, R.H. Bateman, M.T.
Bowers, and J.H. Scrivens, Int. J. Mass spectrom., 2007. 261: 1-12. 267. McDaniel, E., D. Martin, and W. Barnes, Rev. Sci. Instrum., 1962. 33: 2-7. 268. Kanu, A.B., P. Dwivedi, M. Tam, L. Matz, and H.H. Hill, J. Mass Spectrom., 2008. 43: 1-22. 269. Karasek, F.W., S.H. Kim, and H.H. Hill, Anal. Chem., 1976. 48: 1133-1137. 270. Shumate, C., R.H. Stlouis, and H.H. Hill, J. Chromatogr., 1986. 373: 141-173. 271. McAfee, K.B., D. Sipler, and D. Edelson, Physical Review, 1967. 160: 130-135. 272. Moseley, J.T., R.M. Snuggs, D.W. Martin, and E.W. McDaniel, Physical Review, 1969. 178: 240-
248. 273. Rusyniak, M., Y. Ibrahim, E. Alsharaeh, M. Meot-Ner, and M.S. El-Shall, J. Phys. Chem. A, 2003.
107: 7656-7666. 274. Creaser, C.S., M. Benyezzar, J.R. Griffiths, and J.W. Stygall, Anal. Chem., 2000. 72: 2724-2729. 275. Karasek, F.W., H.H. Hill, and S.H. Kim, J. Chromatogr., 1976. 117: 327-336. 276. Creaser, C.S., J.R. Griffiths, C.J. Bramwell, S. Noreen, C.A. Hill, and C.L.P. Thomas, Analyst, 2004.
129: 984-994. 277. Borsdorf, H. and G.A. Eiceman, Appl. Spectrosc. Rev., 2006. 41: 323-375. 278. Ewing, R.G., D.A. Atkinson, G.A. Eiceman, and G.J. Ewing, Talanta, 2001. 54: 515-529. 279. Collins, D.C. and M.L. Lee, Anal. Bioanal. Chem., 2002. 372: 66-73. 280. Wu, C., W.F. Siems, G.R. Asbury, and H.H. Hill, Anal. Chem., 1998. 70: 4929-4938. 281. Clowers, B.H., W.F. Siems, H.H. Hill, and S.M. Massick, Anal. Chem., 2006. 78: 44-51. 282. Guevremont, R., J. Chromatogr. A, 2004. 1058: 3-19. 283. Zimmermann, S., N. Abel, W. Baether, and S. Barth, Sens. Actuator B-Chem., 2007. 125: 428-
434. 284. Clemmer, D.E., R.R. Hudgins, and M.F. Jarrold, J. Am. Chem. Soc., 1995. 117: 10141-10142. 285. Kemper, P.R. and M.T. Bowers, J. Am. Soc. Mass. Spectrom., 1990. 1: 197-207. 286. von Helden, G., T. Wyttenbach, and M.T. Bowers, Int. J. Mass Spectrom. Ion Processes, 1995.
146-147: 349-364. 287. Cox, K.A., R.K. Julian, R.G. Cooks, and R.E. Kaiser, J. Am. Soc. Mass. Spectrom., 1994. 5: 127-136. 288. Bacher, G., W.W. Szymanski, S.L. Kaufman, P. Zollner, D. Blaas, and G. Allmaier, J. Mass
Spectrom., 2001. 36: 1038-1052. 289. Kaufman, S.L., J. Aerosol Sci, 1998. 29: 537-552. 290. Loo, J.A., B. Berhane, C.S. Kaddis, K.M. Wooding, Y.M. Xie, S.L. Kaufman, and I.V.
Chernushevich, J. Am. Soc. Mass. Spectrom., 2005. 16: 998-1008. 291. Clowers, B.H. and H.H. Hill, Anal. Chem., 2005. 77: 5877-5885. 292. Robinson, E.W. and E.R. Williams, J. Am. Soc. Mass. Spectrom., 2005. 16: 1427-1437. 293. Purves, R.W., R. Guevremont, S. Day, C.W. Pipich, and M.S. Matyjaszczyk, Rev. Sci. Instrum.,
1998. 69: 4094-4105. 294. Adamov, A., J. Viidanoja, E. Karpanoja, H. Paakkanen, R. Ketola, R. Kostiainen, A. Sysoev, and T.
Kotiaho, Rev. Sci. Instrum., 2007. 78: 044101. 295. McKnight, L.G., K.B. McAfee, and D.P. Sipler, Physical Review, 1967. 164: 62. 296. Dwivedi, P., P. Wu, S.J. Klopsch, G.J. Puzon, L. Xun, and H.H. Hill, Metabolomics, 2008. 4: 63-80. 297. Kindy, J.M., J.A. Taraszka, F.E. Regnier, and D.E. Clemmer, Anal. Chem., 2002. 74: 950-958. 298. Gerlich, D., Adv. Chem. Phys., 1992. 82: 1-176. 299. Thalassinos, K., S.E. Slade, K.R. Jennings, J.H. Scrivens, K. Giles, J. Wildgoose, J. Hoyes, R.H.
Bateman, and M.T. Bowers, Int. J. Mass spectrom., 2004. 236: 55-63. 300. Javahery, G. and B. Thomson, J. Am. Soc. Mass. Spectrom., 1997. 8: 697-702. 301. Tang, K., A.A. Shvartsburg, H.N. Lee, D.C. Prior, M.A. Buschbach, F.M. Li, A.V. Tolmachev, G.A.
Anderson, and R.D. Smith, Anal. Chem., 2005. 77: 3330-3339. 302. Woods, A.S., M. Ugarov, S.N. Jackson, T. Egan, H.Y.J. Wang, K.K. Murray, and J.A. Schultz, J.
Proteome Res., 2006. 5: 1484-1487. 303. McLean, J.A., W.B. Ridenour, and R.M. Caprioli, J. Mass Spectrom., 2007. 42: 1099-1105.
Chapter 7 References
221
304. Mason, E.A. and E.W. McDaniel, Transport properties of ions in gases. 1988, New York, USA: John Wiley and Sons.
305. Revercomb, H.E. and E.A. Mason, Anal. Chem., 1975. 47: 970-983. 306. Pritchard, A.E. and C.S. McHenry, J. Biol. Chem., 2001. 276: 35217-35222. 307. Leary, J.A., M.R. Schenauer, R. Stefanescu, A. Andaya, B.T. Ruotolo, C.V. Robinson, K.
Thalassinos, J.H. Scrivens, M. Sokabe, and J.W.B. Hershey, J. Am. Soc. Mass. Spectrom., 2009. 20: 1699-1706.
308. Hopper, J.T.S. and N.J. Oldham, J. Am. Soc. Mass. Spectrom., 2009. 20: 1851-1858. 309. Politis, A., A.Y. Park, S.J. Hyung, D. Barsky, B.T. Ruotolo, and C.V. Robinson, PLoS One, 2010. 5:
11. 310. Uetrecht, C., C. Versluis, N.R. Watts, P.T. Wingfield, A.C. Steven, and A.J.R. Heck, Angew. Chem.-
Int. Edit., 2008. 47: 6247-6251. 311. Leslie, A.D. and D.A. Volmer, Spectroscopy, 2007. 22: 32-39. 312. Washington University, S.L. Time-of-Flight Mass Spectrometry Resolution and Mass
Measurement Accuracy. [cited; Available from: http://msr.dom.wustl.edu/Research/MALDI_TOF_Mass_Spec_and_Proteomics/Time-of-Flight_Mass_Spectrometry_Resolution_and_Mass_Measurement_Accuracy.htm.