2010 may roadshow presentation - achmea ipo pzu 29 april: pricing and allocation first day of...
TRANSCRIPT

WWW.EUREKO.COM
EUREKO PRESENTATION
May 2010

2
WWW.EUREKO.COM
Contents
1. Eureko Group
2. Strategy
3. Financial Review
4. Closing remarks

3
WWW.EUREKO.COM
Eureko in 2009
Solid profit supported by a better operational performance, PZU settlement and stabilisation of financial markets
Strong financial position as a result of reduced balance sheet risks, solid profit and support from shareholders
Announced measures on operational efficiency and cost reduction well on track
Business strategy sharpened
4
WWW.EUREKO.COM
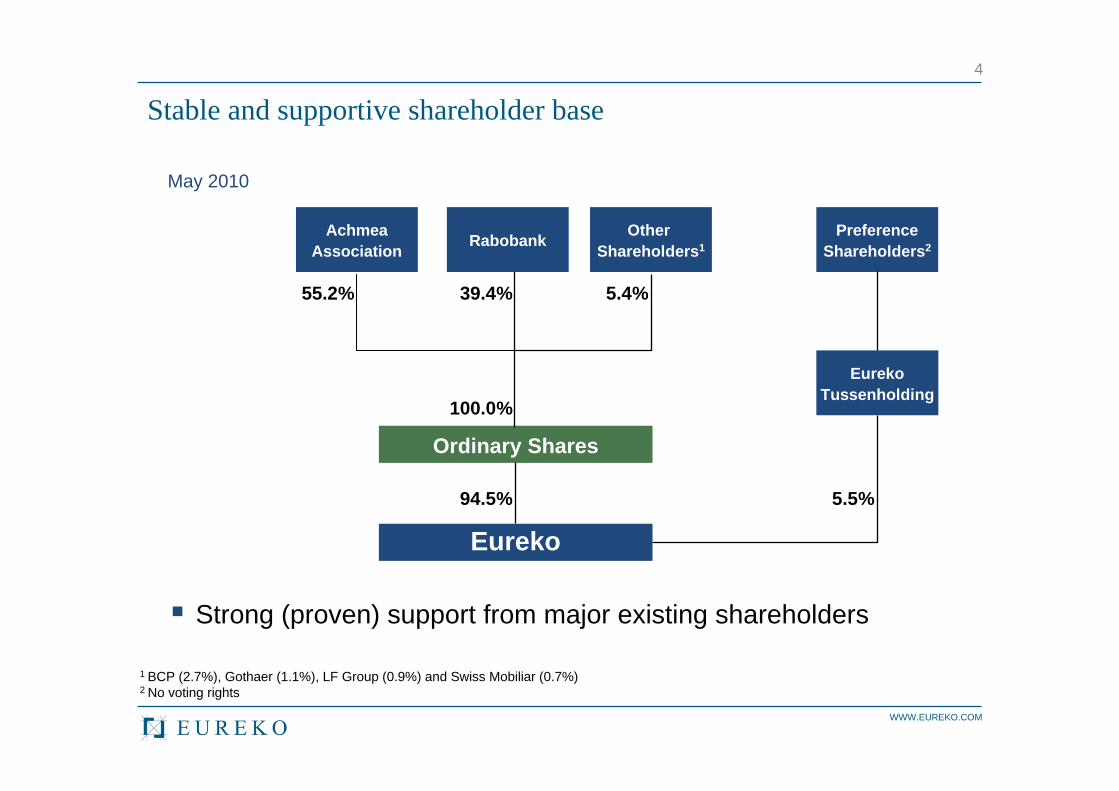
55.2%
100.0%
39.4%
Other Shareholders1
EurekoTussenholding
AchmeaAssociation
PreferenceShareholders2
Ordinary Shares
1 BCP (2.7%), Gothaer (1.1%), LF Group (0.9%) and Swiss Mobiliar (0.7%)2 No voting rights
Eureko
Stable and supportive shareholder base
94.5% 5.5%
5.4%
May 2010
Rabobank
Strong (proven) support from major existing shareholders

5
WWW.EUREKO.COM
1 Eureko has the right to acquire another 35% mid 2010 to mid 2012. Garanti Emeklilik ve Hayat A.S. is a Life insurance company.
EUREKO
F&C Asset Management
(UK) 10%
PZU(Poland)
13%
Main Associates
Interamerican(Greece)
100%
Union(Slovakia)
98%
Interamerican(Bulgaria)
100%
Eureko Asiguari(Romania)
100%
Friends First(Ireland)
100%
Eureko Sigorta A.S.(Turkey)
80%
Garanti Emeklilik A.S.1
(Turkey) 15%
Achmea (Benelux)
100%
Eureko group companies
Developing Operations
Market share
Non-Life: 20%Health: 29%Life: 12%
Contributions€18,321 mln
Market shareLife: 7%
Contributions€238 mln
#2 in the market with leading positions in Non-Life, Health and Life
Contributions€439 mln
Oranta(Russia)
100%
Market shareNon-Life: 5%Health: 2%
Contributions€250 mln
Market shareNon-Life: 3% Health: 6%
Contributions€216 mln

6
WWW.EUREKO.COM
IPO PZU
29 April: pricing and allocation
First day of trading after IPO: 14 May 2010
IPO valuation of PZU: PLN 27 billion
We sold 20% of our shares of which 10% via Kappa S.A. and 10% direct
Estimated cash flow for Eureko approx. €1.6 billion; of which €700 million to H1 2010 profit
Group Solvency increased with 25% as a results of the IPO
After the planned IPO Eureko will continue to hold 13% in PZU

7
WWW.EUREKO.COM
Contents
1. Eureko Group
2. Strategy
3. Financial Review
4. Closing remarks

8
WWW.EUREKO.COM
Achmea market positions in the Netherlands
Achmea ASR Allianz Delta Lloyd
ING
ING SNS incl.AXA/ZL
Achmea ASR Delta Lloyd
Achmea UVIT CZ Group incl.Delta Lloyd
Menzis Fries-land
Aegon ING Delta Lloyd
SNS incl.AXA/ZL
Achmea
Achmea APG +Cordares
PGGM ING +AZL
MN Services
ASR ING Achmea AegonDelta Lloyd
Arbo Unie Achmea ArboNedMaetis
KLM

9
WWW.EUREKO.COM
Market expectations in the Netherlands (1)Non-Life
0
5
10
15
20
25
2007 2008 2009 2010 2011 20120%
5%
10%
15%
20%
25%
Health1
0
10
20
30
40
50
2007 2008 2009 2010 2011 20120%5%10%15%20%25%30%35%
Mar
ket
size
Market share
Mar
ket
size M
arket share
Mar
ket
size
Market share
1 Market share 2009 adjusted for impact from lower contributions received from the Dutch state (ZvF), mainly related to prior years (-€739 mln)
Income
0
5
10
15
20
25
2007 2008 2009 2010 2011 20120%
5%
10%
15%
20%
25%
Mar
ket
size
Non-LifeThe market for Non-Life products is expectedto remain fairly stable. Main growth is expected in direct channel.Due to operational excellence more competitive products will be introduced to the market. This will allow Achmea to generate growth above market levels.
Health The market is expected to grow as a result of increasing health care expenses, inflation and increased longevity of the population. Achmea is assumed to be able to sustain its market share of around 30% (in 2009 some 4.8 mln insured).
Income protectionThe income market is expected to shrink from 2009 through 2012 as a result of the current economic circumstances. Achmea’s market share is expected to be around 20%.
Market share
€ bln
€ bln
€ bln

10
WWW.EUREKO.COM
Individual Life
0
5
10
15
20
25
2007 2008 2009 2010 2011 20120%
5%
10%
15%
20%
25%
Market expectations in the Netherlands (2)
Pension2
0
5
10
15
20
25
2007 2008 2009 2010 2011 20120%
5%
10%
15%
20%
25%
Mar
ket
size
Market share
Mar
ket
size
Market share
2 Market share 2009 is excluding the impact from the merger of pension funds SPI/SPAP (+€1.1bln)
Pension Insurance The Pension market is expected to show limited growth from 2009 through to 2012.We expect to be able to increase our market share through additional focus on the SME market.
Individual Life insuranceRegulatory changes, transparency and banks as supplier of Life products have and will continue to fundamentally change the Life market. For the years 2010 till 2012 a steady decline of the market is expected, due to the decline of the mortgage related products and lower pricing of term insurance products.Achmea is expected to be able to retain a market share of around 11%.
€ bln
€ bln

11
WWW.EUREKO.COM
All improvement programmes in the “house of initiatives”
Short term profitability improvement
Mid term improvement initiatives
Long term strategic choices
Focus on:Cost cutting program
Focus on:SENSComplexity reduction in products, processes and ITIntegration back offices
Focus on:Market segments:
Non-LifeHealthIncome Protectionin direct and banking channel Strengthen relationship with social partners
Most trusted insurer
The customer is key in “Achmea unburdens”
Revitalise cooperative identity
Development of professional skills

12
WWW.EUREKO.COM
ASR ING Achmea
Strategic choices for the Dutch portfolio
53%
61%
34%
22%
13%
17%
0% 20%
40%
60%
80%
100%
P&C
Ind. Life
Bank Direct Broker

13
WWW.EUREKO.COM
Commercial cooperation with Rabobank
The commercial partnership is developing well and will be intensifiedInterpolis share1 in Rabobank insurance products:
97% of retail customers96% of private banking customers84% for SMEs59% for large corporate clients
Gross written premiums in Non-life went up 3%; more than market averageSale of life products suffers from Banksparen, focus is now on term insurance productsCloser cooperation between Rabobank Corporate Clients and Achmea Corporate ClientsBoth Rabobank and Interpolis invest in forward integration of Interpolis in Rabobank distribution channel (Interpolis 2010)
1Market share of 2009 not available yet.

14
WWW.EUREKO.COM
Perspective on Dutch consolidation
We expect that the Dutch Government will reduce its position in financial institutions in the coming years.
We will follow all developments closely.
Eureko is only interested in portfolios if they fit our core proposition, this should however, not result in additional complexity of the Group.

15
WWW.EUREKO.COM
Strategic choices for the International portfolio
Other aspects international strategy We consider to exercise the call option for 35% of Garanti Emeklilik and we expect Garanti to exercise its put option for Eureko Sigorta in 2010 (20% of the shares).
Focus in short term will not be on international expansion but on developing sound operations in our core activities.

16
WWW.EUREKO.COM
Contents
1. Eureko Group
2. Strategy
3. Financial Review
4. Closing remarks

17
WWW.EUREKO.COM
150%
197%
7,451
3,664
19,306
-2,620
-2,118
2008
+54%pts251%Solvency Insurance activities
-10%3,284Operational expenses
+2%19,645Gross written premiums
n.m.1,507Profit before tax
n.m.1,381Net profit
+66% pts216%Solvency Group level
10,127
2009Key figures (in € mln) Change
Total capital +36%
After challenging year, strong recovery of net profit to €1.4 billion.
Profit before tax €1.5 billion, including PZU settlement of €1,238 million and the effect of financial markets.
Gross written premiums up slightly.
Operating expenses -10%.
Solvency insurance activities improved to 251%.
Solid profit strengthened by PZU settlement
18
WWW.EUREKO.COM
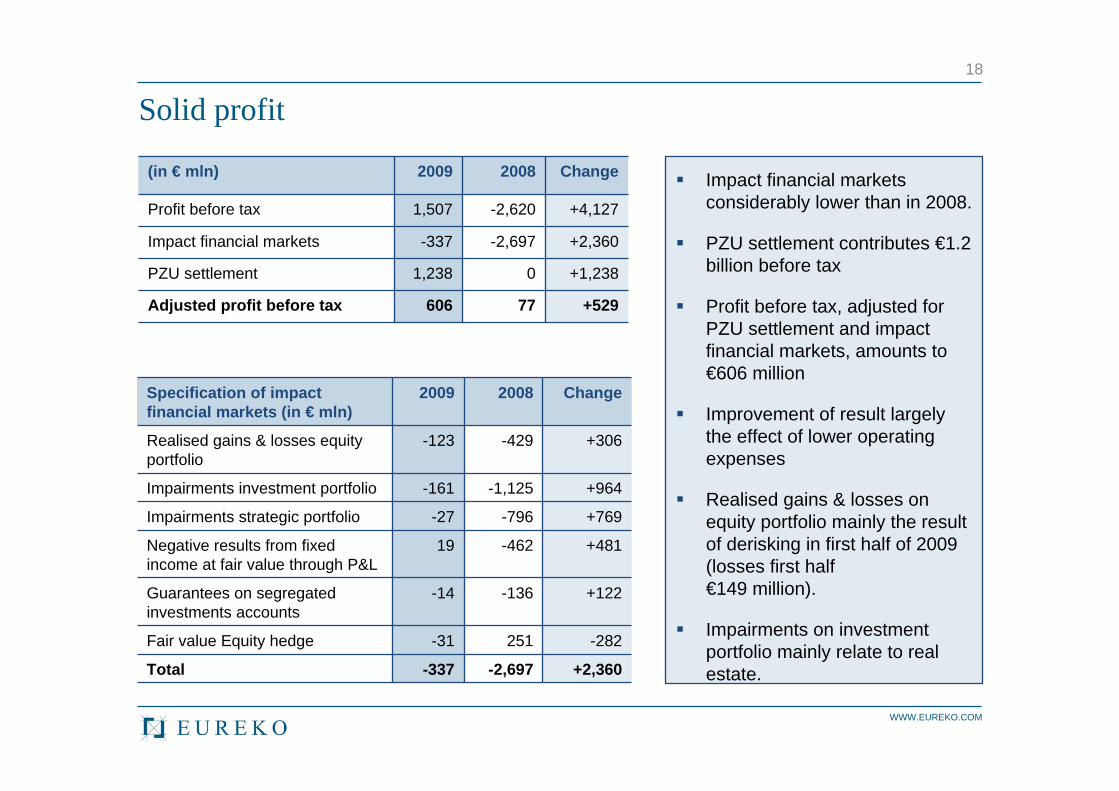
-2,697
251
-136
-462
-796
-1,125
-429
2008
+2,360-337Total
-31
-14
19
-27
-161
-123
2009
+964Impairments investment portfolio
Specification of impact financial markets (in € mln)
Change
Realised gains & losses equity portfolio
+306
Impairments strategic portfolio +769
Negative results from fixed income at fair value through P&L
+481
Guarantees on segregated investments accounts
+122
Fair value Equity hedge -282
Solid profit
Impact financial markets considerably lower than in 2008.
PZU settlement contributes €1.2 billion before tax
Profit before tax, adjusted for PZU settlement and impact financial markets, amounts to €606 million
Improvement of result largely the effect of lower operating expenses
Realised gains & losses on equity portfolio mainly the result of derisking in first half of 2009 (losses first half €149 million).
Impairments on investment portfolio mainly relate to real estate.
77
0
-2,697
-2,620
2008
606
1,238
-337
1,507
2009
+2,360Impact financial markets
(in € mln) Change
Profit before tax +4,127
PZU settlement +1,238
Adjusted profit before tax +529
19
WWW.EUREKO.COM
0
4
8
12
16
20
2009 2008
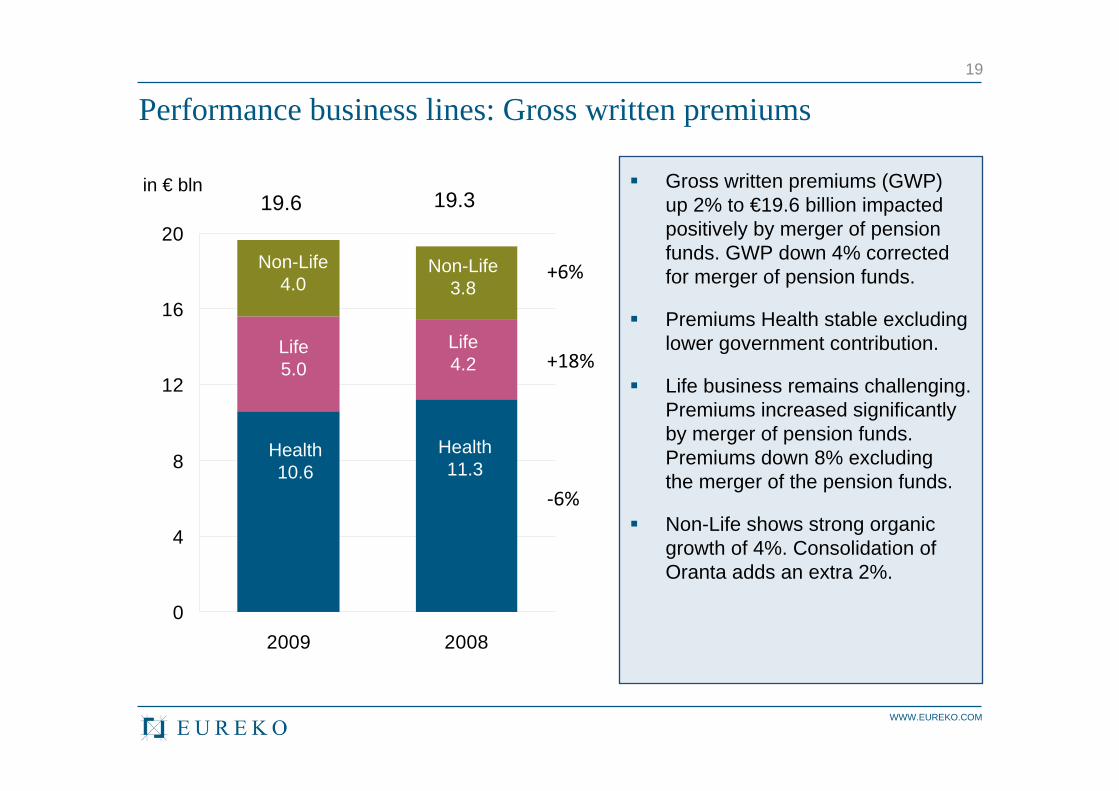
Gross written premiums (GWP) up 2% to €19.6 billion impacted positively by merger of pension funds. GWP down 4% corrected for merger of pension funds.
Premiums Health stable excluding lower government contribution.
Life business remains challenging. Premiums increased significantly by merger of pension funds. Premiums down 8% excluding the merger of the pension funds.
Non-Life shows strong organic growth of 4%. Consolidation of Oranta adds an extra 2%.
Performance business lines: Gross written premiums
Non-Life4.0
Life5.0
Health10.6
+6%
+18%
‐6%
in € bln
Non-Life3.8
Life4.2
Health11.3
19.319.6
20
WWW.EUREKO.COM
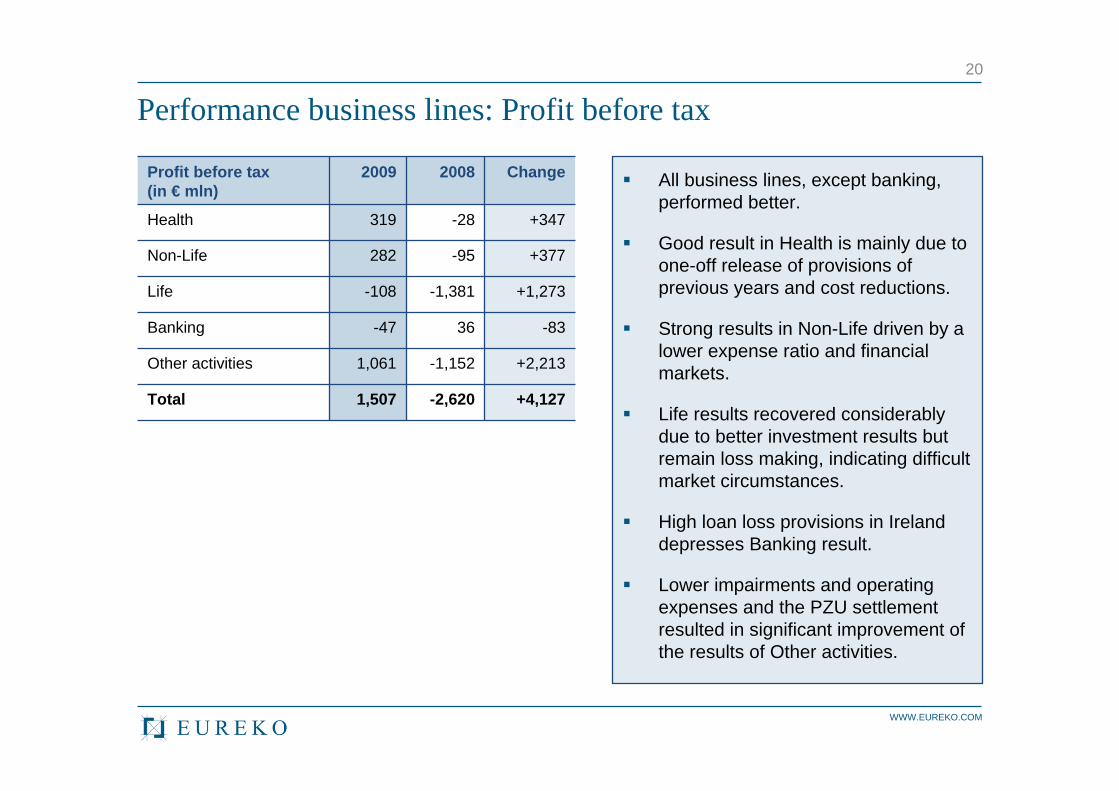
Performance business lines: Profit before tax
-2,620
-1,152
36
-1,381
-95
-28
2008
+1,273-108Life
1,507
1,061
-47
282
319
2009Profit before tax (in € mln)
Change
Health +347
Non-Life +377
Banking -83
Other activities +2,213
Total +4,127
All business lines, except banking, performed better.
Good result in Health is mainly due to one-off release of provisions of previous years and cost reductions.
Strong results in Non-Life driven by a lower expense ratio and financial markets.
Life results recovered considerably due to better investment results but remain loss making, indicating difficult market circumstances.
High loan loss provisions in Ireland depresses Banking result.
Lower impairments and operating expenses and the PZU settlement resulted in significant improvement of the results of Other activities.

21
WWW.EUREKO.COM
3,657
3,284
3,664 8 69
121
183
15
3,000
3,200
3,400
3,600
3,800
Operating expenses down €380 million to €3,284 million.
Structural cost reductions €183 million; target of €100 million cost reduction in 2009 more than achieved.
Lower sales resulted in lower acquisition expenses (- €69 million).
One-offs include delayed project costs and lower marketing & procurement costs.
Operational expenses down 10%, cost reduction target 2009 achieved
in € mln
2008
2009
Structural cost
reductions
Divestments/
investments
Labour agreement
Acquisition costsOne-offs
Baseline cost level

22
WWW.EUREKO.COM
1%1%3%3%4%
10%
78%
Fixed income Deposits/cash Real estate DerivativesEquity Alternatives Other
Derisked considerably: a conservative portfolio
76%
4%
5%
5%
7%2% 1%
Fixed income Deposits/cash Real estate DerivativesEquity Alternatives Other
End 2008 End 2009
Equity reducedListed Real Estate divestedCash increase mainly due to PZU settlement

23
WWW.EUREKO.COM
Fixed income switch to AAA
4%1%4%
12%
11%
68%
AAA AA A BBB <BBB NR
80%
5%
6%
5% 1% 3%
AAA AA A BBB <BBB NR
End 2009End 2008
64%
14%
10%
2%8% 1%1%
Government Bond CreditLoans Asset Backed Sec.Covered Bonds Convertibles High yield
By instrument
Subordinated bank debt reducedAAA Governments expandedPIGS exposure small

24
WWW.EUREKO.COM
5,000
6,000
7,000
8,000
9,000
10,000
11,000 Own equity position up 36%.
Net profit and capital increase main contributors.
Recovery of financial markets resulted in revaluations of € 760 million on the investment portfolio.
Dividend of €585 million will beproposed to the Annual General Meeting or €1.43 per share.
Solvency insurance entities up 54%pts to 251% (based on swap curve). Group Solvency solid at 216%.
Strong recovery capital and solvency position
Dividend 2008 and
coupon payments
hybrid capital
in € mln
2008
2009
Issue Share
Capital
Net Profit
RevaluationOther
7,451
1,028
1,381 -10610,127
-387760
0

25
WWW.EUREKO.COM
Liquidity: debt position holding decreasing
21.8%22.8%
34.0%36.3%
0%
5%
10%
15%
20%
25%
30%
35%
40%
31-12-08 30-06-09 31-12-09 31-12-10
Debt leverage Max.
In 2009, we lowered our debt position considerably by €520 mln to €867 mln.
In combination with the improved equity position this resulted in an improvement of debt leverage from 36.4% to 22.8%.
No double leverage at year-end 2009.

26
WWW.EUREKO.COM
Eureko’s preparations for Solvency II
Because of a strong capital position and relatively low risk profile, the stress test (CEIOPS) on 30 June 2009 numbers showed that Eureko’s solvency levels would remain significantly above 100% in all scenarios.
However, linked to the financial crisis, CEIOPS has overreacted in its proposals resulting in a significant increase of capital requirements not in accordance with the real risk.
Those higher capital requirements may have significant consequences:Investments of insurers in corporate credits will decrease.Health insurance premiums may increase significantly if the specifics of the Dutch health care system are not taken into account.
Eureko actively participates in discussions on the development of Solvency II implementing measures and guidelines.
Eureko aims at using (partial) internal models.
Preliminary calculations for Eureko Group per end of 2009 show that even with the proposed higher charges compared to QIS4 and not taking into account the risk mitigating characteristics of the basic health insurance system, Eureko will be able to meet Solvency II capital requirements (own funds/group SCR ~125%).

27
WWW.EUREKO.COM
Insurer Financial Strength Rating: A+ (negative outlook)
Holding Counterparty Credit Rating: A- (negative outlook)
Strong credit ratings
S&P has confirmed its ratings on 31st March 2010
StrengthsStrong competitive position in all business lines in the Dutch marketStrong financial management evidenced by:
very strong capitalisation in amount and quality strong and well diversified investment profile and asset-liability management strong liquidity profile based on substantial marketable and near-cash instruments
Strong financial flexibility
WeaknessesUnderperforming life and pensions businesses, particularly in the NetherlandsHigh geographic concentration in the Netherlands

28
WWW.EUREKO.COM
Contents
1. Eureko Group
2. Strategy
3. Financial Review
4. Closing remarks

29
WWW.EUREKO.COM
Closing remarks
We emerged strongly from crisis in financial marketsSolid profit of €1.4 billion Strong capital position of more than €10 billionStructural cost reduction of €183 million
We will push through announced measuresProgrammes on operational efficiency and cost reductionReduce complexity in products, processes and IT
The necessary conditions are in placeBusiness strategy is sharpenedCooperative identity is strengthened

30
WWW.EUREKO.COM
Key investment highlights
Strong capital base with surplus of economic capital (251% solvency insurance activities)
Stable rating; no downgrade in past 5 years
Stable and supportive shareholders’ base, 39.4%1 owned by Rabobank (AAA-rated)
# 1 insurance group in the Netherlands
Multi-distribution strategy in Dutch market with #1 positions in direct writing and banc assurance
Balance sheet largely immunised for equity markets; more than 90% of fixed income portfolio rated A or above
1As a percentage of total ordinary shares
31
WWW.EUREKO.COM
Maarten MesDirector Capital Management Group Balance Sheet ManagementCapital Management & Investor Relations+31 (0)30 693 7263
Sandra van GilsManager Investor RelationsGroup Balance Sheet ManagementCapital Management & Investor Relations +31 (0)30 693 7051
Email: [email protected]: www.eureko.com
For further information, please contact:
Contact details

32
WWW.EUREKO.COM
Disclaimer
This document contains certain forward-looking statements with respect to certain plans and objectives of the Company and its subsidiaries (together the “Group”) and to the Group’s current expectations relating to its future financial condition and performance. The Group may also make forward-looking statements in other written materials. In addition, the Group’s senior management may make forward-looking statements orally to analysts, investors, representatives of the media and others. In particular, among other statements, certain statements with regard to management objectives, trends in results of operations and revenuesare forward-looking in nature. These forward-looking statements are based on management’s current views, estimates and assumptions about these future events. By their nature, forward-looking statements are subject to certain risks and uncertainty that may cause the Group’s actual results to differ materially from those set forth in the Group’s forward-looking statements.The Company undertakes no obligation to update the forward-looking statement contained in this presentation or any other forward-looking statement made in any form by the Group.
The information contained herein is not an offer of securities for sale in the United States of America or any other country. Eureko B.V. has not registered and will not register any securities under the U.S. Securities Act of 1933, as amended, and securities may not be offered, sold or delivered in the United States of America absent registration or an exemption from registration.