2010 network assessment - united states environmental … · a network assessment includes (1)...
TRANSCRIPT

2010 Ambient Air Monitoring
Network Assessment
July 2010
VENTURA COUNTY AIR POLLUTION CONTROL DISTRICT

Page i
TABLE OF CONTENTS Executive Summary................................................................................................ 1
1.0 Introduction....................................................................................................... 3
2.0 Regional Description ........................................................................................ 5
2.1 Physical Setting .................................................................................... 5
2.2 Population ............................................................................................. 6
2.3 Topography and Climate ...................................................................... 7
2.3.1 Weather Patterns .................................................................. 7
3.0 Overview of Air Monitoring Network ................................................................ 9
3.1 Program Budget and Staffing ............................................................. 13
4.0 Current and Historical Air Quality Conditions ................................................ 15
4.1 Ozone ................................................................................................. 15
4.2 Particulate Matter – 2.5 microns (PM2.5) ............................................ 16
4.3 Particulate Matter – 10 microns (PM10)............................................... 17
4.4 Other Pollutants .................................................................................. 18
5.0 Network Analysis ........................................................................................... 19
5.1 Area and Population Served .............................................................. 19
5.2 Ozone .................................................................................................. 21
5.2.1 Analysis of Ozone Network ................................................. 23
5.3 PM2.5 ................................................................................................... 23
5.3.1 Analysis of PM2.5 Network .................................................. 25
5.4 PM10 .................................................................................................. 25
5.4.1 Analysis of PM10 Network ................................................... 27

Page ii
This page intentionally left blank

Page iii
LIST OF TABLES
Table 1: Ventura County Population, 2000 and 2009 ............................................ 3
Table 2: Air Monitoring Stations, Region Served and Pollutants Monitored ......... 9
Table 3: Pollutants Monitored and Monitoring Objectives.................................... 10
Table 4: Air Monitoring Regions – Area and Population Served ........................ 16
Table 5: Distance Between Air Monitoring Sites, in Miles.................................... 18
Table 6: Historical Ozone Data, 2000- 2009 ........................................................ 19
Table 7: Relative Rankings of Ozone Monitors.................................................... 19
Table 8: Correlation Matrix of Ozone Monitors, 2005 - 2008............................... 20
Table 9: Historical PM2.5 Data............................................................................... 21
Table 10: Relative Rankings of PM2.5 Monitors.................................................... 21
Table 11: Correlation Matrix of PM2.5 Monitors, 2005 - 2008............................... 22
Table 12: Historical PM10 Data ............................................................................. 23
Table 13: Relative Rankings of PM10 Monitors .................................................... 23
Table 14: Correlation Matrix of PM10 Monitors, 2005 - 2008 ............................... 23
Table 15: Historical Ozone and Oxidant Monitoring Locations............................ 26
Table 16: Historical Network Reductions ............................................................. 27
Table 17: Days Exceeding Federal Ozone Standard (0.075 PPM) ..................... 28
Table 18: PM2.5 Annual Mean ............................................................................... 29
Table 19: PM2.5 Highest 24-Hour Average ........................................................... 30
Table 20: PM10 Highest 24-Hour Average ............................................................ 31

Page iv
This page intentionally left blank
Page v
LIST OF FIGURES
Figure 1: Ventura County APCD Air Monitoring Stations...................................... 8
Figure 2: Days Exceeding Federal Ozone Standard........................................... 13
Figure 3: Annual PM2.5 Design Values ................................................................ 14
Figure 4: El Rio 8-Hour Ozone Design Values.................................................... 32
Figure 5: El Rio PM2.5 Annual Design Values ..................................................... 32
Figure 6: El Rio PM2.5 24-Hour Design Values.................................................... 33
Figure 7: El Rio PM10 Highest 24-Hour Average.................................................. 33
Figure 8: Ojai 8-Hour Ozone Design Values........................................................ 34
Figure 9: Ojai PM10 Highest 24-Hour Average ..................................................... 34
Figure 10: Piru 8-Hour Ozone Design Values...................................................... 35
Figure 11: Piru PM2.5 Annual Design Values........................................................ 35
Figure 12: Piru PM2.5 24-Hour Design Values...................................................... 36
Figure 13: Simi Valley 8-Hour Ozone Design Values .......................................... 37
Figure 14: Simi Valley PM2.5 Annual Design Values............................................ 37
Figure 15: Simi Valley PM2.5 24-Hour Design Values .......................................... 38
Figure 16: Simi Valley PM10 Highest 24-Hour Average ....................................... 38
Figure 17: Thousand Oaks 8-Hour Ozone Design Values................................... 39
Figure 18: Thousand Oaks PM2.5 Annual Design Values .................................... 39
Figure 19: 20 PM2.5 24-Hour Design Values ........................................................ 40
Figure 20: Ventura-Emma Wood 8-Hour Ozone Design Values ......................... 41

Page vi
This page intentionally left blank

Page vii
LIST OF APPENDICES
Appendix A: Historical Air Monitoring in Ventura County.................................... 26
1.0 Ozone and Oxidant Monitoring........................................................... 26
2.0 2004 Network Reductions ................................................................. 27
Appendix B: Historical Air Quality Data ............................................................... 28
Appendix C: El Rio Monitoring Station ................................................................ 32
Appendix E: Ojai Monitoring Station.................................................................... 34
Appendix D: Piru Monitoring Station ................................................................... 35
Appendix F: Simi Valley Monitoring Station ........................................................ 37
Appendix G: Thousand Oaks Monitoring Station ................................................ 39
Appendix H: Ventura - Emma Wood Monitoring Station..................................... 41

Page viii
This page intentionally left blank

Page ix
ACRONYMS AQS: ...........Air Quality System BAM ...........Beta Attenuation Mass Monitor CARB ..........California Air Resources Board CFR ............Code of Federal Regulations CMSA .........Consolidated Metropolitan Statistical Area CO ..............Carbon Monoxide District: .........Ventura County Air Pollution Control District EPA ............U. S. Environmental Protection Agency FEM ............Federal Equivalent Method FRM ...........Federal Reference Method NAAQS ........National Ambient Air Quality Standards NMHC .........Non-Methane Hydrocarbons NO2 ............Nitrogen Dioxide O3 ..............Ozone PAMS .........Photochemical Assessment Monitoring Systems PM................Particulate Matter PM2.5 ...........Particulates less than or equal to 2.5 microns in size PM10 ............Particulates less than or equal to 10 microns in size SIP .............State Implementation Plan SLAMS: ......State and Local Air Monitoring Stations SO2 ............Sulfur Dioxide VCAPCD: .....Ventura County Air Pollution Control District

Page x
This page intentionally left blank

Ventura County APCD 2010 Ambient Air Monitoring Network Assessment
Page 1
EXECUTIVE SUMMARY Purpose The purpose of this Ambient Air Monitoring Network Assessment is to assess the status of the Ventura County Air Pollution Control District’s (District) ambient air monitoring network with respect to the following: (1) Whether the network is sufficient to meet the goals and objectives of the District; (2) Whether the network provides adequate air quality information for the residents of the County; (3) Whether the District’s resources could be better utilized by removing monitors from service or repositioning monitors, and; (4) Whether any gaps in the network exist that could be corrected by the addition of new monitors. Background This document is prepared in part to fulfill the new requirements specified in the revised Monitoring Regulations Part 58. The Ventura County Air Pollution Control District’s air monitoring network was evaluated to determine if it meets the District’s monitoring objectives. Considerations were given to: population and geographical coverage; air quality trends; parameters monitored, attainment classification and emissions inventory. Findings Ventura County is well served by the District’s ozone, PM2.5 and PM10 air monitoring efforts. The District’s air monitoring network provides air quality coverage to the vast majority of the population and inhabited areas of the County. The monitors in the network exceed the minimum number of monitors required by federal regulations. There are potentially some monitoring parameters which should be further reviewed and prioritized for consolidation. Those parameters are: Ozone: The Ventura - Emma Wood monitoring site includes an ozone monitor, is a Type 1 PAMS site, and collects meteorological data; as such, this site could be considered the District’s lowest value site; it monitors only ozone, is a Type 1 PAMS site, and meteorological data is collected. Monitored ozone values are less than the federal ozone standard; the site’s current ozone design value is approximately 89 percent of the federal standard. Therefore, the District could consider removal of this monitoring site; however, federal regulations allow removal of a monitor if it has a probability of less than 10 percent of exceeding 80 percent of the applicable NAAQS. Several exceptions apply to this threshold, which the District should explore. The region of the County served by the Ventura - Emma Wood ozone monitor may be adequately served by the El Rio monitoring site.

Ventura County APCD 2010 Ambient Air Monitoring Network Assessment
Page 2
PM2.5: Of the four FRM PM2.5 monitors operating in the County, either the Thousand Oaks or Piru monitors might be a candidate for removal. In addition to giving consideration to removal of individual FRM PM2.5 monitors, the District should give strong consideration to replacing all of the FRM and continuous PM2.5 monitors with federal equivalent method (FEM) PM2.5 monitors. This would allow the District to eliminate up to four FRM PM2.5 monitors (however, there may be requirements to site a colocated FRM with an FEM). PM10: Consideration could be given to removing either the El Rio or Simi Valley PM10 monitor. Future monitoring requirements such as the addition of a near-roadway NO2 monitor and possibly an SO2 monitor make it important that the District look for opportunities to streamline its monitoring operations, while continuing to provide adequate and sufficient air quality data to the public.

Ventura County APCD 2010 Ambient Air Monitoring Network Assessment
Page 3
1.0 Introduction
The Ventura County Air Pollution Control District’s Network Assessment Plan is an examination and evaluation of the District’s network of air pollution monitoring stations. This assessment is required by Title 40, Code of Federal Regulations, Part 58.10(d) (40 CFR 58.10(d)). The requirement to submit an assessment of the air pollution monitoring system is provided for in §58.10, (d) which states: “The State, or where applicable local, agency shall perform and submit to the EPA Regional Administrator an assessment of the air quality surveillance system every 5 years to determine, at a minimum, if the network meets the monitoring objectives defined in appendix D to this part, whether new sites are needed, whether existing sites are no longer needed and can be terminated, and where new technologies are appropriate for incorporation in the ambient air monitoring network. The network assessment must consider the ability of existing and proposed sites to support air quality characterization for areas with relatively high populations of susceptible individuals (e.g., children with asthma), and, for any sites that are being proposed for discontinuance, the effect on data users other than the agency itself, such as nearby States and Tribes or health effects studies. For PM2.5, the assessment also must identify needed changes to population-oriented sites. The State, or where applicable local, agency must submit a copy of this 5-year assessment, along with a revised annual network plan to the Regional Administrator. The first assessment is due July 1, 2010.” A network assessment includes (1) re-evaluation of the objectives and budget for air monitoring, (2) evaluation of a network’s effectiveness and efficiency relative to its objectives and costs, and (3) development of recommendations for network reconfigurations and improvements.

Ventura County APCD 2010 Ambient Air Monitoring Network Assessment
Page 4
This page intentionally left blank

Ventura County APCD 2010 Ambient Air Monitoring Network Assessment
Page 5
2.0 Regional Description
2.1. Physical Setting
Ventura County is located along the southern portion of the central California coast between Santa Barbara and Los Angeles Counties. Its diverse topography is characterized by mountain ranges to the north, two major river valleys (the Santa Clara, which trends east-west, and the Ventura, which trends roughly north-south), and the Oxnard Plain to the south and west.
The “north half” of the county is mountainous and sparsely populated. The “south half” includes the populated areas where the Ventura County Air Pollution Control District has established its air monitoring network. The south half of the County includes the Oxnard Plain, the Ventura Coastal area and four inland valleys: the Simi Valley, the Conejo Valley, the Santa Clara River Valley, and the Ojai Valley. These areas are described in more detail in Section 3. The approximate land area of Ventura County is 1,832 square miles; with the Los Padres National Forest comprising approximately 964 square miles. Generally, steep hills border the inland valleys. Bluffs dominate the coastline north of the mouth of the Ventura River, while the coastline south of the Ventura River to Point Mugu is near sea level. The Santa Monica Mountains rise above the Oxnard Plain and continue east into Los Angeles County. The south half of the County has ten incorporated cities and includes both urban and agricultural areas. Outside of the urban and agricultural areas, the countryside is dominated by sage brush, chaparral scrub, and oak forest plant communities typical of a Mediterranean climate. These generally cover the lower hillsides and southern exposures of higher slopes, while conifer forests typically occur in deep valleys and on the northern slopes of higher elevations. Agriculture is the dominant non-urban activity in the Oxnard Plain and Santa Clara River Valley, along much of the river valleys, and on the neighboring hillsides.1
1 Ventura County Air Pollution Control District, PM2.5 Monitoring Network Plane, June 1998.

Ventura County APCD 2010 Ambient Air Monitoring Network Assessment
Page 6
2.2. Population
The 2000 Census lists the population for Ventura County as 753,197 persons. According to Census Bureau estimates the County population in 2009 totaled 836,080 persons2. The overwhelming majority of the population resides in the southern portion of the County. In 2009 approximately 88 percent of the County’s population resided in one of the County’s ten cities. In 2000 there were approximately 752 residents in the north-half of the County. Overall population growth in the County between 2000 and 2009 was 11 percent. Population growth, by city, between 2000 and 2009 ranged from one percent in Port Hueneme to 18 percent in Moorpark.
Table 1: Ventura County Population, 2000 and 2009
Population
City 2000 % of
2000 Total 2009 % of
2009 Total %
Growth
Camarillo 57,084 7.6 66,149 7.9 16%
Fillmore 13,643 1.8 15,639 1.9 15%
Moorpark 31,415 4.2 37,086 4.4 18%
Ojai 7,862 1.0 8,157 1.0 4%
Oxnard 170,358 22.6 197,067 23.6 16%
Port Hueneme 21,845 2.9 22,171 2.7 1%
San Buenaventura 100,916 13.4 108,787 13.0 8%
Santa Paula 28,598 3.8 29,725 3.6 4%
Simi Valley 111,351 14.8 125,814 15.0 13%
Thousand Oaks 117,005 15.5 128,564 15.4 10%
Balance of County 93,120 12.4 96,921 11.6 4%
County Total 753,197 836,080 11%
2 U.S. Census Bureau, http://factfinder.census.gov/

Ventura County APCD 2010 Ambient Air Monitoring Network Assessment
Page 7
2.3. Topography and Climate
The majority of the population resides in the southern half of the County – the District has focused its air monitoring efforts there. The south half of the county is divided into six air basins: Ventura Coastal, Oxnard Plain, Ojai Valley, Santa Clara River Valley, Simi Valley, and the Conejo Valley). The climate of the coastal shore region is dominated by the cool moist Pacific Ocean. The inland coastal plain is also affected by the proximity of the ocean, but as the distance from the ocean increases so does the heating affects of the land mass. The Ojai Valley is a bowl shape, surrounded by mountains, and has a warm dry climate. There is only one pathway for the flow of air to enter or exit the valley. The shape of the valley prevents the escape of pollutants that are produced in the valley as well as transported in. The Santa Clara River Valley allows the transport of air pollutants to and from the Santa Clarita Valley in Los Angeles County. The Simi Valley is horse shoe shaped with the open end to the west. The sea breeze flows in from the west during the afternoon bringing in air pollutants which are combined with those produced locally. The Simi Valley is also adjacent to the Los Angeles basin and does see transport of air pollutants in the mornings and afternoons when winds are light and easterly. The mountains around Simi trap the air pollutants and the inversion limits mixing aiding the production of ozone. The Conejo Valley is a west to east valley with the western edge raised above the coastal plain and the eastern end narrows toward the Los Angeles air basin. The topographical shape of the valley and the wind patterns limit the amount of trapping of air pollutants.
2.3.1. Weather Patterns The weather of the south half of the County is primarily controlled by the differences in the thermal mass of the land and of the Pacific Ocean. The ocean remains relatively constant and slow to change temperature (55F-65F), while the land mass varies daily and seasonally in temperature (30F-110F). Diurnal wind patterns consist of light night to morning winds and the afternoon sea breeze. The late evening to morning winds are a light drainage flow wind from the northeast or east. As the evening air cools, it flows toward the ocean. From mid to late

Ventura County APCD 2010 Ambient Air Monitoring Network Assessment
Page 8
morning the sea breeze begins its push from the ocean to the land. Afternoon sea breeze winds from the west to southwest are a steady 5-15 mph. The sea breeze continues through the afternoon into the early evening. The early summer months have a typical weather pattern of low clouds and fog along the coast and inland during the night and morning hours, with afternoons becoming sunny. The mid to late summer season typically sees the establishment of the semi-permanent subtropical high pressure area that positions itself in the eastern Pacific and/or over southern California. When the high pressure area sets up it is the basis for the occurrence of high temperatures and high ozone concentrations. The winter storm season runs from late October to late March. Santa Ana wind season occurs from late September to mid May. Santa Ana winds are dry strong northeasterly winds. The Santa Ana winds typically follow on the heels of winter type weather systems. During these times the air is very mixed or unstable, not allowing the formation or trapping of air pollutants.

Ventura County APCD 2010 Ambient Air Monitoring Network Assessment
Page 9
3.0 Overview of Air Monitoring Network
The Ventura County Air Quality Control District operates six air monitoring sites and one upper air profiler within Ventura County. The District’s monitoring network has been designed to provide ozone, PM2.5 and PM10 monitoring coverage to the majority of the inhabited regions of the County. The District has conducted air monitoring for ozone or oxidants in Ventura County since 1963. The District’s present-day air monitoring network is designed to provide air monitoring coverage to those areas with a majority of the residents of Ventura County. Locations of the District’s monitoring sites are shown Figure 1 (page 8). The air monitoring network serves the following areas of Ventura County: Conejo Valley – an inland area, which includes the city of Thousand Oaks and the communities of Westlake Village and Newbury Park, covering 75 square miles and home to 138,000 people. The area is surrounded by foothills and low-lying mountains. The eastern edge of the Conejo Valley is the border between Ventura and Los Angeles Counties. There are no major stationary sources in its boundaries. The area is impacted primarily by mobile sources. This area is served by the District’s monitoring station at Thousand Oaks High School, Moorpark Road, in Thousand Oaks. Ojai Valley – an inland area including the City of Ojai and the communities of Oak View, and Meiners Oaks, which covers 102 square miles and is home to 30,000 people. The Ojai Valley is surrounded by mountain ranges. There is one major stationary source3 on the southeastern edge of the region; however, it may be influenced by oil production
3 For the purpose of this report a major stationary source is considered to be a facility that has been issued a federal Part 70 operating permit (also referred to as a Title V permit).

Ventura County APCD 2010 Ambient Air Monitoring Network Assessment
Page 10
activities occurring to the south, in the Ventura Coastal area. The area is impacted primarily by mobile sources. The Ojai Valley is served by the District’s monitoring station at the County fire station, Ojai Avenue, in Ojai. Oxnard Coastal Plain – a broad coastal area from the Pacific Ocean to several inland valleys, covering 286 square miles and has a population of 190,000 people. The Oxnard Coastal Plain area is a relatively flat plain area with foothills and mountains at its northern border. The Oxnard Coastal Plain is home to considerable agricultural activities. Emission sources within the area include several of the County’s major stationary sources, including natural gas-fired cogeneration facilities, several oil and gas production and processing facilities, and a paper products manufacturer. Its air quality is influenced by emission sources in the Ventura Coastal area that include a deepwater port, two natural gas-fired electric generating units, two naval bases, and several natural gas-fired cogeneration facilities. The area is impacted by marine shipping operations occurring off of the County’s coast and mobile sources. This area is served by the District’s monitoring station at Rio Mesa High School, Central Avenue, in Oxnard. Santa Clara River Valley – an inland area, covering 204 square miles and home to 49,000 people. The Valley is surrounded by foothills and low-lying mountains. The eastern edge of the Santa Clara River Valley is the border between Ventura and Los Angeles Counties. The area is also home to considerable agricultural activities. There are oil production and processing activities occurring throughout the Valley. There are two major stationary sources in its boundaries. The area is impacted primarily by mobile sources. This area is served by the District’s monitoring station on Pacific Avenue, in Piru. Simi Valley – an inland area, which covers the cities of Simi Valley and Moorpark, is 142 square miles and is home to 148,000 people. The Valley is surrounded by foothills and low-lying mountains. The eastern edge of the Simi Valley is the border between Ventura and Los Angeles Counties. There are two major stationary sources in its boundaries. The area is impacted primarily by mobile sources. This area is served by the District’s monitoring station at Simi Valley High School, on Cochran Street, in Simi Valley. Ventura Coastal - a coastal area, which covers 119 square miles and has a population of 197,000 people. The Ventura Coastal monitoring area represents an area that borders the Pacific Ocean, with Santa Barbara County to the west. This area encompasses the city of Port Hueneme and portions of the cities of Ventura and Oxnard. Some agricultural activities occur in the Ventura Coastal area. Emission sources within the area include a deepwater port and a number of the County’s major stationary sources, including two natural gas-fired electric generating units, two naval bases and several natural gas-fired cogeneration facilities. In addition to stationary sources, the area is impacted by mobile sources and marine shipping operations

Ventura County APCD 2010 Ambient Air Monitoring Network Assessment
Page 11
occurring off of the County’s coast. This area is served by the District’s monitoring station at the Emma Wood State Park group campground, west of Ventura.
Figure 1: Ventura County APCD Air Monitoring Stations Table 2 lists the pollutants or parameters currently measured at each site and the assigned Air Quality System (AQS) identification number for each monitoring site. The table also identifies the respective air monitoring region served by the monitoring station.

Ventura County APCD 2010 Ambient Air Monitoring Network Assessment
Page 12
Table 2: Air Monitoring Stations, Region Served and Pollutants Monitored
Site Name and Region Served AQS ID Parameters Monitored
El Rio – Rio Mesa School #2
Region: Oxnard Coastal Plain 061113001
NO2, Ozone, Total NMHC, PM10, BAM
PM2.5, FRM PM2.5, VOCs, carbonyls,
Meteorology
Ojai – Ojai Avenue
Region: Ojai Valley 061111004
Ozone, BAM PM2.5, PM10,
Meteorology
Piru – Pacific Avenue
Region: Santa Clara River Valley 061110009
Ozone, BAM PM2.5, FRM PM2.5,
Meteorology
Simi Valley – Cochran Street
Region: Simi Valley 061112002
Ozone, NO2, Total NMHC, PM10, BAM
PM2.5, FRM PM2.5 Toxics (Cr6+,
aldehydes, total metals), VOCs,
speciated PM2.5, Meteorology
Simi Valley Upper Air Profiler 061110008 Meteorology only
Thousand Oaks – Moorpark Road
Region: Conejo Valley 061110007
Ozone, BAM PM2.5, FRM PM2.5,
Meteorology
Ventura – Emma Wood State Beach
Region: Ventura Coastal 061112003 Ozone, VOCs, Meteorology
Notes:
1) BAM PM2.5 – continuous/hourly PM2.5 2) FRM PM2.5 – Federal Reference Method, 24 hour filer samples every 3 or 6 days 3) Total NMHC - non-methane hydrocarbons

Ventura County APCD 2010 Ambient Air Monitoring Network Assessment
Page 13
Table 3: Pollutants Monitored and Monitoring Objectives
Monitoring Objectives and Spatial Scale
Pollutant Monitoring
Site Highest
Concentration Population Background Spatial Scale
El Rio ü Urban
Ojai ü Urban
Piru ü Urban
Simi Valley
ü Urban
Thousand Oaks
ü Urban
Ozo
ne
Ventura - Emma Wood
ü Urban
El Rio ü Urban
NO
2
Simi Valley
ü Urban
El Rio ü Neighborhood
Piru ü Neighborhood
Simi Valley
ü Neighborhood PM
2.5
Thousand Oaks
ü Neighborhood
El Rio ü Neighborhood
Ojai ü Urban
PM
10
Simi Valley
ü Neighborhood
3.1. Program Budget and Staffing
The FY 2010 budget for the District’s Air Monitoring Division is approximately $1,672,810. Of this amount approximately $1,144,600 is for salaries and benefits and $268,210 is for services and supplies. The District has also allocated $260,000 for fixed asset items. Funding for the Division comes from the District’s general fund, federal

Ventura County APCD 2010 Ambient Air Monitoring Network Assessment
Page 14
grants, state subvention and contract revenue. In future years the Division will need additional fixed assets funds to replace the District’s upper air profiler, for installation of a near-roadway NO2 monitor, for the possible installation of an SO2 monitor, and for minor to major upgrades and repairs to some air monitoring shelters. The Air Monitoring Division includes the following staffing:
1. One supervising instrument technician and two instrument technicians whose primary functions are to operate the air monitoring network;
2. One supervising meteorologist and one meteorologist who are responsible for providing daily air quality forecasts, agricultural burn forecasts and providing assistance in maintaining and operating the District’s five Beta Attenuation Mass Monitors (BAM) PM2.5 monitors and the District’s upper air profiler. The meteorologists also assist the instrument technicians with PM monitor set up and recovery and air quality instrumentation tasks;
3. One supervising chemist and one chemist who are primarily responsible for operating, maintaining and conducting data analysis for the District’s PAMS program;
4. One supervising air quality specialist and one air quality specialist who are responsible for operating the District’s PM2.5 filter weighing program and data input into EPA’s Air Quality System (AQS).

Ventura County APCD 2010 Ambient Air Monitoring Network Assessment
Page 15
4.0 Current and Historical Air Quality Conditions
For over 30 years the Ventura County APCD has developed numerous air quality attainment and management plans, rules and regulations to reduce emissions of ozone precursors - reactive organic compounds (ROC) and oxides of nitrogen (NOx) – as well as particulate matter (PM). Historical trends for ozone and PM show a continued improvement in the County’s air quality. Previous air monitoring in the County has shown that ambient levels of carbon monoxide (CO) and sulfur dioxide (SO2) are significantly below federal air quality standards. This section presents County-wide air quality data and trends; air quality data and trends for each individual air monitoring station are shown in the Appendices.
4.1. Ozone
Ventura County is a severe nonattainment area for ozone. The District monitors for ozone at all six of its air monitoring stations. The current federal ozone standard is an 8-hour average of 0.075 parts per million (ppm), which has been exceeded at various monitoring sites in Ventura County. The federal ozone standard is exceeded most frequently at Simi Valley, followed by Ojai and Piru. El Rio and Ventura-Emma Wood exceed the federal ozone standard infrequently and record similar levels of ozone. The District’s continuous ozone data is provided to EPA’s AIRNow website. The number of monitors in the District’s ozone monitoring network exceeds the federal requirements. County-wide ozone design values and days exceeding the standard have continued to decline in spite of increasing population and vehicle miles in the County. Ozone trends for each air monitoring site are shown in the Appendices.
Ventura County Ozone Design Values
0.05
0.07
0.09
0.11
0.13
0.15
0.17
1980
1983
1986
1989
1992
1995
1998
2001
2004
2007
Year
Ozo
ne
in P
arts
Mill
ion
Countyw ide 8-Hour Ozone Design ValuesFederal 8-Hour Ozone Standard

Ventura County APCD 2010 Ambient Air Monitoring Network Assessment
Page 16
Days Exceeding Federal Ozone Standard (0.075 PPM)
020
406080
100
120140160
180200
1980
1983
1986
1989
1992
1995
1998
2001
2004
2007
Year
Day
s of
Ove
r Fe
dera
l Sta
ndar
d
Countywide Days Over Standard
Figure 2: Days Exceeding Federal Ozone Standard
4.2. Particulate Matter – 2.5 microns (PM2.5)
The District operates Federal Reference Method (FRM) monitors for PM2.5 at four of its air monitoring sites – El Rio, Piru, Simi Valley and Thousand Oaks. The District began its PM2.5 monitoring program in 1999 with the installation of monitors at the El Rio and Thousand Oaks sites; PM2.5 monitors were added at Simi Valley and Piru in 2000. The County is in attainment of both federal PM2.5 standards - the annual arithmetic mean of 15 micrograms per cubic meter (µg/m3) and the 24-hour standard of 35 µg/m3. Historical PM2.5 values for each air monitoring site are shown in the Appendices. The number of monitors in the District’s PM2.5 monitoring network exceeds the federal requirements. In addition to monitoring PM2.5 using the Federal Reference Method, the District also operates continuous PM2.5 monitors (beta attenuation mass monitors, or BAMs) at all of its sites except Ventura-Emma Wood. The continuous
Ventura County 24-Hour PM2.5 Design Values
20
25
30
35
40
45
2001
2002
2003
2004
2005
2006
2007
2008
Year
PM
2.5,
mic
rog
ram
s/cu
bic
met
er Federal PM2.5 24-Hour Design ValueFederal PM2.5 24-Hour Standard

Ventura County APCD 2010 Ambient Air Monitoring Network Assessment
Page 17
PM2.5 data is provided to EPA’s AIRNow website.
Ventura County Annual PM2.5 Design Values
5
7
9
11
13
15
17
19
2001
2002
2003
2004
2005
2006
2007
2008
Year
PM
2.5,
mic
rog
ram
s/cu
bic
met
erFederal PM2.5 Annual Design ValueFederal PM2.5 Annual Standard
Figure 3: Annual PM2.5 Design Values
4.3. Particulate Matter – 10 microns (PM10)
The District operates Federal Reference Method (monitors) for PM10 at three of its air monitoring sites – El Rio, Ojai and Simi Valley. The federal 24-Hour standard for PM10 is 150 µg/m3, not to be exceeded more than once per year on average over 3 years. The District began its PM10 monitoring program in 1988 with monitors in El Rio and Simi Valley; the Ojai Valley PM10 monitor was added in 1996. The County is in attainment with the federal PM10 standard. Historical PM10 values for each air monitoring site are shown in the Appendices.
County-Wide PM10Highest 24-Hour Average
40
90
140
190
240
290
1988
1990
1992
1994
1996
1998
2000
2002
2004
2006
2008
Year
PM
10, µ
g/cu
bic
met
er
Highest 24-Hour AverageStandard - 150 mg/m3
Ventura County APCD 2010 Ambient Air Monitoring Network Assessment
Page 18
4.4. Other Pollutants
In addition to monitoring for ozone, PM2.5 and PM10, the District also monitors for non-methane hydrocarbons, VOCs, carbonyls, Toxics (Cr6+, total metals and aldehydes), NO2 and speciated PM2.5

Ventura County APCD 2010 Ambient Air Monitoring Network Assessment
Page 19
5.0 Network Analysis
The District’s network of ozone, PM2.5 and PM10 air monitors was evaluated using several different methods: a ranking based upon air quality data and monitor-to-monitor correlation. In some cases consideration was given to the value of the air monitor or air monitoring site in the District’s overall monitoring goals.
Monitor Ranking: Monitors are ranked against one another based on comparisons of the pollutant they measure. Monitors that have higher concentrations, design values, frequency of exceedances, etc. are ranked higher than monitors that have low concentrations, design values or frequency of exceedances.
Monitor-to-Monitor Correlation: Using diagnostic tools provided by EPA, monitors were compared to each other to determine if concentrations correlate temporally. According to EPA, monitors with concentrations that correlate well (e.g., r2 greater than 0.75) with concentrations at another monitor may be redundant. Conversely, a monitor with concentrations that do not correlate with other nearby monitors may be unique and have more value for spatial monitoring objectives4.
The Ojai Valley has a unique topography in that it is a bowl shape, surrounded by mountains, and has a warm dry climate. There is only one pathway for the flow of air to enter or exit the valley. The shape of the valley prevents the escape of pollutants that are produced in the valley as well as transported in. For these reasons, it is the District’s opinion that ozone, PM10 and continuous PM2.5 monitoring should continue in the Ojai Valley.
5.1. Area and Population Served
Each of the District’s air monitoring sites has at a minimum an ozone monitor. Instrumentation at monitoring other sites includes FRM PM2.5 monitors, continuous PM2.5 monitors (BAMs), PM10 monitors and monitors for hydrocarbons, carbon monoxide (CO) and oxides of nitrogen (NOx). The District has located each of its air monitoring sites in relation to specific geographic areas of the County, depending upon each area’s population, topography and meteorology. Because the north-half of the County is mountainous and sparsely populated, no air monitoring sites have been located in that area. As shown previously in Table 1 (page 3), the County’s growth rate between 2000 and 2009 has been approximately 11 percent. Growth between individual cities has ranged from one percent to 18 percent, while the approximate growth between the District’s air monitoring regions has ranged from four percent (Ojai Valley) to 14 percent (Simi Valley). Because the District has designed its network with consideration given to the distinct geographic, topographic and meteorological areas of
4 U.S. Environmental Protection Agency, Ambient Air Monitoring Network Assessment Guidance, EPA-454/D-07-001, February 2007.

Ventura County APCD 2010 Ambient Air Monitoring Network Assessment
Page 20
the County, the areas and population served by the District’s air monitoring vary greatly. Table 4, below, displays the area and population served by each of its air monitoring sites; area and population for each air monitoring site are based upon data from the 2000 Census. District staff evaluated EPA’s “area served” assessment tool for use in this assessment, however due to the large area that the county’s north-half encompasses and the unique topography of the monitoring regions, it was not feasible to use for this assessment. Table 5 displays the distance (in miles) between each pair of air monitoring sites.
Table 4: Air Monitoring Regions - Area and Population Served
Site Name and Region Served AQS ID
Area Served
(Sq. Miles)
Population
Served
Population
Density
(Pop./Sq. Mi)
El Rio – Rio Mesa School #2 Region: Oxnard Coastal Plain
061113001 286 190,000 664
Ojai – Ojai Avenue Region: Ojai Valley
061111004 102 30,000 294
Piru – Pacific Avenue
Region: Santa Clara River Valley 061110009 204 49,000 240
Simi Valley – Cochran Street
Region: Simi Valley 061112002 142 148,000 1,042
Thousand Oaks – Moorpark Road
Region: Conejo Valley 061110007 75 138,000 1,840
Ventura – Emma Wood State Beach
Region: Ventura Coastal 061112003 119 197,000 1,655

Ventura County APCD 2010 Ambient Air Monitoring Network Assessment
Page 21
Table 5: Distance Between Air Monitoring Sites, in Miles
Monitor Site Thousand
Oaks Piru Ojai Simi
Valley
Ventura - Emma Wood El Rio
Thousand Oaks 1
Piru 22 1
Ojai 42 39 1
Simi Valley 19 18 54 1
Ventura - Emma Wood 42 48 20 58 1
El Rio 26 35 23 42 16 1
5.2. Ozone
The first evaluation was to rank the District’s ozone monitors using data from 2000 through 2009. Rankings were evaluated for four factors; the number of days the federal ozone standard was exceeded at each site, each site’s peak eight-hour ozone reading, each site’s ozone design value and the percent each site is to the federal ozone standard. Each station was ranked one (1) through six (6), with one being the highest value. From this analysis, the ozone monitor at Simi Valley serves the area with the most severe ozone problem in the County, followed by the monitor at the Ojai monitoring site. Although the rankings of the District’s ozone monitors show that the El Rio monitor scores the lowest values in the County, it is one of the District’s highest value monitoring sites. The El Rio site is the District’s PAMS (Photochemical Assessment Monitoring Stations) Type 2 site. The El Rio site also monitors for NO2, non-methane hydrocarbons, carbonyls and VOCs and is a part of the District’s PM2.5 and PM10 monitoring network. The Ventura - Emma Wood site on the other hand is the District’s lowest value site: it monitors for ozone, collects meteorological data and is a PAMS Type 1 site, which is not required by EPA’s air monitoring regulations (although the District has committed to operate it as a part of an alternative program). Federal regulations require that Ventura County have at a minimum two ozone monitors5; the District’s air monitoring network exceeds this criteria.
5 40 CFR Part 58, Appendix D, Section 4.1

Ventura County APCD 2010 Ambient Air Monitoring Network Assessment
Page 22
Table 6: Historical Ozone Data, 2000- 2009
Ozone Monitor
Ave. Days/Yr. Exceeding Standard
Peak 8-Hour Value, PPM
Ozone Design
Value, PPM
Percent of Federal
Standard
Simi Valley 33.6 0.101 0.093 125%
Ojai 25.3 0.099 0.089 119%
Piru 20.1 0.094 0.084 113%
Thousand Oaks 8.6 0.088 0.081 108%
Ventura - Emma Wood 1.0 0.075 0.067 89%
El Rio 0.2 0.073 0.065 86%
Table 7: Relative Rankings of Ozone Monitors
Ozone Monitor
Days Exceeding Standard
Peak 8-Hour Value
Ozone Design Value
Percent of Federal
Standard
Simi Valley 1 1 1 1
Ojai 2 2 2 2
Piru 3 3 3 3
Thousand Oaks 4 4 4 4
Ventura - Emma Wood 5 5 5 5
El Rio 6 6 6 6
The ozone monitor-to-monitor correlation matrix was used to develop a correlation between each pair of the District’s ozone monitors, based upon data from 2005 through 2008. From this analysis, the ozone monitor pairs of Ventura-Emma Wood/El Rio, Ojai/Piru and Piru/Simi Valley have the highest correlations, indicating each pair’s possible redundancy. A number of monitor pairs have low correlations, indicating each pair’s uniqueness to one another.

Ventura County APCD 2010 Ambient Air Monitoring Network Assessment
Page 23
Table 8: Correlation Matrix of Ozone Monitors, 2005 - 2008
Ozone Monitor Thousand
Oaks Piru Ojai Simi
Valley
Ventura - Emma Wood El Rio
Thousand Oaks 1
Piru 0.56 1
Ojai 0.40 0.77 1
Simi Valley 0.56 0.76 0.64 1
Ventura - Emma Wood 0.16 0.04 0.03 0.04 1
El Rio 0.43 0.18 0.11 0.16 0.69 1
5.2.1. Analysis of Ozone Network
Because the Ojai monitoring site is located in an area that is geographically and meteorologically distinct from the rest of the County, District staff believes the Ojai site should not considered for removal. Furthermore, the Ojai monitoring station serves a small geographical area with a small population, thus the addition of another ozone monitor in the Ojai Valley is not warranted. The Simi Valley, Thousand Oaks and Piru monitoring sites all exceed the federal ozone standard. The Ventura - Emma Wood and El Rio ozone monitors are District’s only monitors that are in attainment with the federal ozone standard. The Ventura - Emma Wood monitor records slightly higher values, and has a higher design value than the El Rio monitor. The two sites are approximately 16 miles apart (see Table 5). The El Rio monitor is located at a high-value site that is the District’s PAMS Type 2 site, and monitors for PM2.5 (FRM and continuous), PM10, non-methane hydrocarbons and carbonyls. The Ventura - Emma Wood is the District’s lowest value site in that it monitors only for ozone and is the District’s PAMS Type 1 site. In light of this, it appears that the Ventura - Emma Wood ozone monitor is the only monitor that may be considered for removal.
5.3. PM2.5
The District’s PM2.5 monitoring network consists of four sites using FRM PM2.5 monitors and five sites using continuous (BAM) PM2.5 monitors. The sites using FRM PM2.5 monitors were ranked according to five different PM2.5 values – annual average, annual design value, 98th percentile ranking and 24-hour design value. Data from 2000 through 2009 was used; however, some monitors did not have sufficient history to perform averaging periods until after 2000 (El Rio, Piru and Simi Valley in particular). Each

Ventura County APCD 2010 Ambient Air Monitoring Network Assessment
Page 24
station was ranked one (1) through four (4), with one being the highest value. Tables 8 and 9 present the data and rankings of each PM2.5 monitor. This analysis shows the PM2.5 monitor at Simi Valley serves the area with the most severe PM2.5 problem in the County, followed by the monitors at Thousand Oaks, El Rio and Piru. It should be noted that all monitors meet the federal 24-hour and annual arithmetic mean PM2.5 standards. Federal regulations require that Ventura County have at a minimum one PM2.5 monitor6; the District’s air monitoring network exceeds this criteria.
It should be noted that at all four of the District’s FRM PM2.5 monitoring sites, plus the Ojai monitoring site, the District operates continuous (BAM) PM2.5 monitors. The continuous monitors are used to provide the public with real-time PM2.5 air quality data.
Table 9: Historical PM2.5 Data
PM2.5 Monitor
Annual Average,
µg/m3
Annual Design Value, µg/m3
% of Annual Design Value
98th Percentile,
µg/m3
24-Hour Design Value, µg/m3
Simi Valley 12.5 12.4 82% 33.2 34
Thousand Oaks 11.6 11.7 78% 29.7 29
El Rio 11.3 11.2 74% 26.3 27
Piru 10.2 10.0 67% 22.2 22
Table 10: Relative Rankings of PM2.5 Monitors
PM2.5 Monitor Annual
Average
Annual Design Value
98th Percentile
24-Hour Design Value
Simi Valley 1 1 1 1
Thousand Oaks 2 2 2 2
El Rio 3 3 3 3
Piru 4 4 4 4
The monitor-to-monitor correlation matrix was used to develop correlations between each pair of the District’s PM2.5 monitors, based upon data from 2005 through 2008. From this analysis, the PM2.5 monitor pair of Simi Valley/Piru has a correlation of 0.72, which is approaching EPA’s criteria (a correlation of 0.75) for the pair’s possible
6 40 CFR Part 58, Appendix D, Section 4.7

Ventura County APCD 2010 Ambient Air Monitoring Network Assessment
Page 25
redundancy; the Simi Valley/Thousand Oaks monitor pair has a correlation of 0.764, indicating a possible redundancy, according to EPA’s criteria.
Table 11: Correlation Matrix of PM2.5 Monitors, 2005 - 2008
PM2.5 Monitor Thousand
Oaks Piru Simi
Valley El Rio
Thousand Oaks 1
Piru .653 1
Simi Valley .764 .724 1
El Rio .593 .550 .511 1
5.3.1. Analysis of PM2.5 Network
The Thousand Oaks, Piru and El Rio sites all have annual design values less than 80 percent of the federal standard. The Simi Valley/Thousand Oaks and Simi Valley/Piru monitor pairs have correlations of .764 and .724, respectively. The Piru monitor ranks lowest among the four monitors, with El Rio ranking third lowest. This analysis would indicate that either the Thousand Oaks or Piru PM2.5 monitor might be candidates for removal. In addition to giving consideration to removal of individual FRM PM2.5 monitors the District will be giving strong consideration to replacing all of the FRM and continuous PM2.5 monitors with federal equivalent method (FEM) PM2.5 monitors.
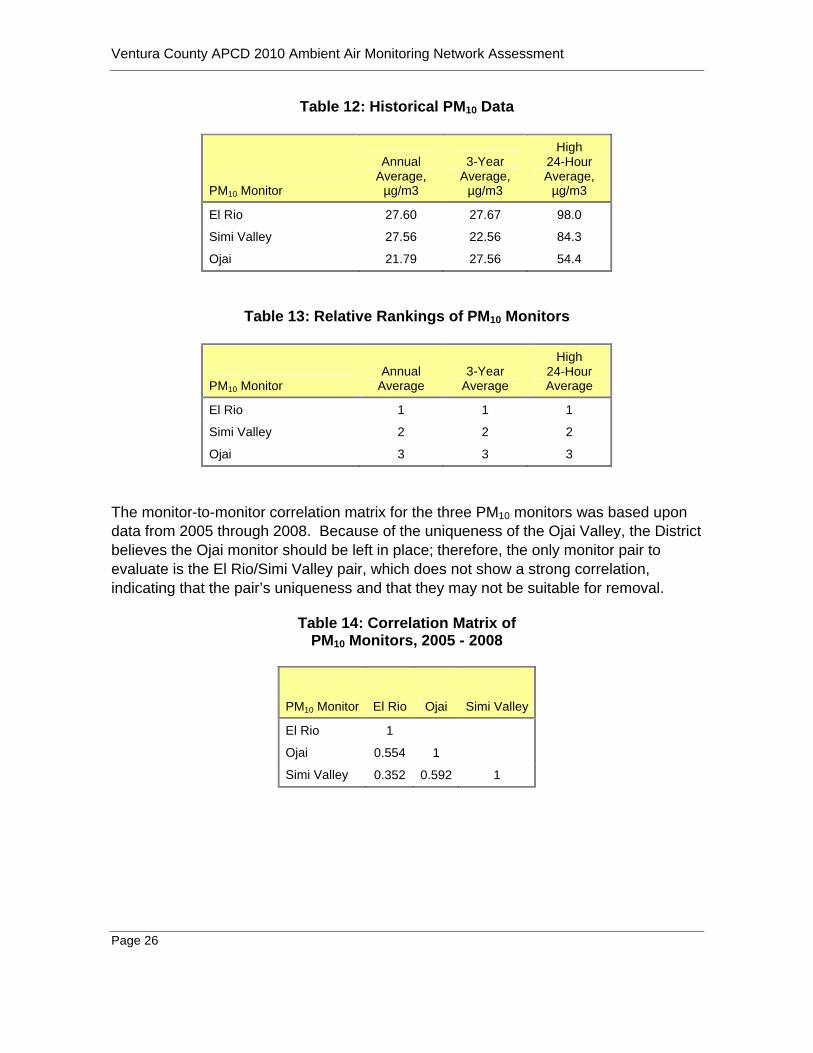
5.4. PM10
The District’s PM10 monitors were ranked using three different values – annual average, three-year average and the highest 24-hour average. Data from 2000 through 2009 was used. Each station was ranked one (1) through three (3), with one being the highest value. Tables 11 and 12 present the data and rankings of each PM10 monitor. The rankings show the monitor at El Rio serves the area with the most severe PM10 problem in the County, followed by Simi Valley and Ojai. Federal regulations require that Ventura County have at a minimum one to two PM10 monitors7; the District’s air monitoring network exceeds this criteria.
7 40 CFR Part 58, Appendix D, Section 4.6
Ventura County APCD 2010 Ambient Air Monitoring Network Assessment
Page 26
Table 12: Historical PM10 Data
PM10 Monitor
Annual Average,
µg/m3
3-Year Average,
µg/m3
High 24-Hour Average,
µg/m3
El Rio 27.60 27.67 98.0
Simi Valley 27.56 22.56 84.3
Ojai 21.79 27.56 54.4
Table 13: Relative Rankings of PM10 Monitors
PM10 Monitor Annual
Average 3-Year
Average
High 24-Hour Average
El Rio 1 1 1
Simi Valley 2 2 2
Ojai 3 3 3
The monitor-to-monitor correlation matrix for the three PM10 monitors was based upon data from 2005 through 2008. Because of the uniqueness of the Ojai Valley, the District believes the Ojai monitor should be left in place; therefore, the only monitor pair to evaluate is the El Rio/Simi Valley pair, which does not show a strong correlation, indicating that the pair’s uniqueness and that they may not be suitable for removal.
Table 14: Correlation Matrix of PM10 Monitors, 2005 - 2008
PM10 Monitor El Rio Ojai Simi Valley
El Rio 1
Ojai 0.554 1
Simi Valley 0.352 0.592 1

Ventura County APCD 2010 Ambient Air Monitoring Network Assessment
Page 27
5.4.1. Analysis of PM10 Network
Although the El Rio/Simi Valley pair of monitors does not have a high correlation, both monitors are less than 65 percent of the federal annual PM10 standard. All three monitors show occasional spikes in excess of the federal PM10 standard; these spikes are caused by smoke from wildfires within the County; the most recent spike of 246 µg/m3 (occurring in 2007) was flagged as an exceptional event and submitted to the California Air Resources Board for review and submittal to EPA. Federal regulations require that the District maintain one to two PM10 monitors; because the District exceeds the minimum monitoring requirements and the El Rio and Simi Valley pair of monitors have recorded less than the federal standard, either one of these monitors could be a candidate for removal. In the future, the District should consider the use of FEM PM10
monitors as that technology develops.

Ventura County APCD 2010 Ambient Air Monitoring Network Assessment
Page 28
This page intentionally left blank

Ventura County APCD 2010 Ambient Air Monitoring Network Assessment
Page 29
APPENDICES

Ventura County APCD 2010 Ambient Air Monitoring Network Assessment
Page 30
This page intentionally left blank

Ventura County APCD 2010 Ambient Air Monitoring Network Assessment
Page 31
APPENDIX A: HISTORICAL AIR MONITORING IN VENTURA COUNTY 1.0 Ozone and Oxidant Monitoring
Table 15: Historical Ozone and Oxidant Monitoring Locations
Air Monitoring Area Monitoring Site Dates of Operation Ventura – Loma Vista Intermittent
10/1963 –3/1973 Oxnard – A Street 5/1965 – 4/1966 Port Hueneme – Civil Engineering Lab Intermittent
3/1973 –10/1980 Ventura – Telegraph Road 4/1973 – 11/1977 Point Mugu – 13th Street 8/1973 – 8/1977 Ventura – Figueroa Street 9/1979 – 7/1984 La Conchita – 7128 Santa Paula Avenue 7/1983 – 10/1983
Coastal Area
Ventura – Emma Wood State Beach 2/1984 – Present Camarillo – Magnolia 8/1969 – 9/1971 Camarillo – Palm 9/1971 –11/1974 Camarillo – Elm 12/1974 – 5/1978 El Rio – Rio Mesa School 9/1978 – 2/1992
Ventura/Oxnard Plain Area
El Rio – Rio Mesa School #2 12/1979 – Present Ojai – Signal Street Intermittent
4/1965 – 10/1980 Ojai – 1401 Maricopa Highway 3/1981 – 3/1983 Ojai – 1768 Maricopa Highway 11/1982 – 3/1996 Casitas Pass (Air Resources Board) 10/1983 – 10/2002
Ojai Valley Area
Ojai – Ojai Avenue 3/1996 – Present Santa Paula – Santa Barbara Street 4/1972 – 6/1978 Piru – Main Street Intermittent
7/1976 –9/1981 Piru - 2 Miles SW 9/1981 – 11/2000
Santa Clara River Valley Area
Piru – Pacific Avenue 11/2000 – Present Moorpark College 5/1972 – 9/1972 Simi Valley – Cochran Street I 11/1973 to 8/1985
Simi Valley Area
Simi Valley – Cochran Street 6/1985 - Present Thousand Oaks – Windsor Drive Intermittent
5/1973 – 2/1992 Conejo Valley Area
Thousand Oaks – Moorpark Road 2/1992 – Present North Half Lockwood Valley 8/1979 – 8/1980 Offshore Anacapa Island – Lighthouse Intermittent
5/1984 – 10/1992

Ventura County APCD 2010 Ambient Air Monitoring Network Assessment
Page 32
This page intentionally left blank

Ventura County APCD 2010 Ambient Air Monitoring Network Assessment
Page 33
2.0 2004 Network Reductions In 2003, District staff conducted an assessment of the Ventura County air monitoring network, in consultation with EPA Region IX staff. The assessment was conducted in anticipation of new requirements under 40 CFR Part 58. The District determined that the existing network should be reduced to prepare for anticipated future monitoring program increases. On June 24, 2004, EPA Region IX approved the following reductions:
Table 16: Historical Network Reductions
Parameter Location Shutdown Date
PM10 Thousand Oaks – Moorpark Road July 22, 2004
Piru – Pacific Avenue July 27, 2004
Sulfur Dioxide El Rio – Rio Mesa School #2 July 28, 2004
Carbon Monoxide El Rio – Rio Mesa School #2 March 21, 2004
Simi Valley – Cochran Street March 28, 2004
Nitrogen Oxides Ojai – Ojai Avenue July 28, 2004
Ventura – Emma Wood State Beach July 29, 2004
Thousand Oaks – Moorpark Road July 22, 2004

Ventura County APCD 2010 Ambient Air Monitoring Network Assessment
Page 34
This page intentionally left blank

Ventura County APCD 2010 Ambient Air Monitoring Network Assessment
Page 35
APPENDIX B: HISTORICAL AIR QUALITY DATA
Table 17: Days Exceeding Federal Ozone Standard (0.075 PPM)
Year El Rio Ojai Piru Simi
Valley Thousand
Oaks
Ventura (Emma Wood)
Countywide
2009 1 11 11 24 5 0 25
2008 0 12 11 27 6 0 31
2007 0 4 4 19 2 1 21
2006 0 19 21 30 5 0 39
2005 0 20 20 35 6 1 39
2004 1 34 22 35 12 2 49
2003 0 59 43 42 22 2 68
2002 0 28 18 25 4 0 39
2001 0 33 31 46 11 4 57
2000 0 33 53 13 0 57
1999 1 26 51 10 0 57
1998 2 25 52 22 0 57
1997 2 37 70 25 3 78
1996 9 67 89 37 15 100
1995 13 97 37 9 103

Ventura County APCD 2010 Ambient Air Monitoring Network Assessment
Page 36
Table 18: PM2.5 Annual Mean (Federal Standard = 15 µg/m3)
Year El Rio Piru Simi
Valley Thousand
Oaks
2008 10.1 9.7 10.7 10.3
2007 10.6 10.2 11.6 10.5
2006 9.8 9.3 10.3 9.8
2005 10.5 9.2 11.2 10.5
2004 11.3 10.1 12.5 11.3
2003 11.7 11.0 14.2 11.9
2002 13.0 12.0 14.6 12.6
2001 13.1 14.9 14.1
2000 13.5
1999 13.7 12.5

Ventura County APCD 2010 Ambient Air Monitoring Network Assessment
Page 37
Table 19: PM2.5 Highest 24-Hour Average (Federal Standard = 35 µg/m3)
Year El Rio Piru Simi
Valley Thousand
Oaks
2009 19.7 20.5 22.2 21.7
2008 23.4 29.4 35.6 27.8
2007 39.9 34.3 48.8 31.5
2006 29.8 28.0 31.7 28.4
2005 35.2 20.4 42.4 27.8
2004 28.5 28.1 41.2 38.3
2003 81.7 26.1 116.0 31.4
2002 29.4 30.6 46.4 31.7
2001 41.0 37.2 50.0 45.5
2000 45.7 37.6 55.3 53.7
1999 36.7 64.6 53.2

Ventura County APCD 2010 Ambient Air Monitoring Network Assessment
Page 38
Table 20: PM10 Highest 24-Hour Average (Standard = 150 µg/m3)
Year El Rio Ojai Simi
Valley
2009 97.4 37.5 76.8
2008 79 62.4 83.6
2007 245.5 98.5 118.5
2006 119.4 46.4 56.9
2005 54 60.4 76
2004 59.6 43.8 48.7
2003 81.7 56.5 167.7
2002 29.4 41.9 65.4
2001 41 50.3 78
2000 45.7 46.3 71
1999 36.7 53.6 67.6
1998 70.3 109.5 49.1
1997 252.5 36.2 106.9
1996 63.5 38.8 71.2
1995 62 94
1994 54 86
1993 63.2 68
1992 58 84
1991 59 90
1990 102 90
1989 70 87
1988 64 103

Ventura County APCD 2010 Ambient Air Monitoring Network Assessment
Page 39
APPENDIX C: EL RIO MONITORING STATION
Figure 4:
El Rio Ozone8-Hour Design Values
0.050
0.060
0.070
0.080
0.090
0.100
0.110
0.120
0.130
0.140
1982
1984
1986
1988
1990
1992
1994
1996
1998
2000
2002
2004
2006
2008
Year
Ozo
ne
in P
arts
Mill
ion
8-Hour Ozone Design ValuesFederal 8-Hour Ozone Standard (0.075 PPM)
Figure 5:
El Rio PM2.5Annual Design Values
6
7
8
9
10
11
12
13
14
15
16
2003
2004
2005
2006
2007
2008
Year
PM
2.5,
µg
/cu
bic
met
er
PM2.5 Annual Design ValuePM2.5 Annual Standard (15 µg/m3)

Ventura County APCD 2010 Ambient Air Monitoring Network Assessment
Page 40
Figure 6:
El Rio PM 2.524-Hour Design Value
15
20
25
30
35
40
45
2003
2004
2005
2006
2007
2008
Year
PM
2.5,
µg
/cu
bic
met
er PM 2.5 24-Hour Design ValuePM2.5 24-Hour Standard (35 µg/m3)
Figure 7:
El Rio PM10 Highest 24-Hour Average
30
80
130
180
230
280
1988
1990
1992
1994
1996
1998
2000
2002
2004
2006
2008
Year
PM
10, µ
g/cu
bic
met
er
High 24-Hr AverageStandard - 150 µg/m3

Ventura County APCD 2010 Ambient Air Monitoring Network Assessment
Page 41
APPENDIX D: OJAI MONITORING STATION
Figure 8:
Ojai Ozone8-Hour Design Values
0.050
0.060
0.070
0.080
0.090
0.100
0.110
0.120
0.130
0.140
1998
1999
2000
2001
2002
2003
2004
2005
2006
2007
2008
2009
Year
Ozo
ne
in P
arts
Mill
ion
8-Hour Ozone Design Values
Federal 8-Hour Ozone Standard (0.075 PPM)
Figure 9:
Ojai PM10 Highest 24-Hour Average
30
80
130
180
230
280
1996
1998
2000
2002
2004
2006
2008
Year
PM
10, µ
g/cu
bic
met
er High 24-Hr AverageStandard - 150 µg/m3
Ventura County APCD 2010 Ambient Air Monitoring Network Assessment
Page 42
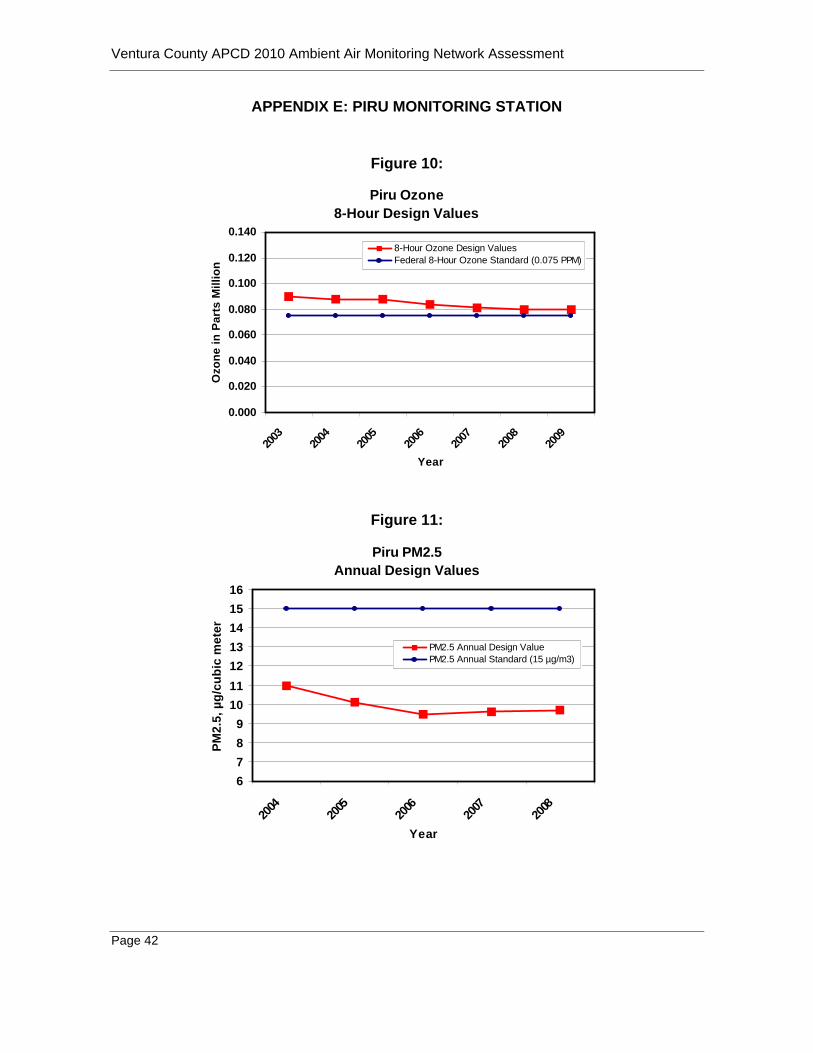
APPENDIX E: PIRU MONITORING STATION
Figure 10:
Piru Ozone8-Hour Design Values
0.000
0.020
0.040
0.060
0.080
0.100
0.120
0.140
2003
2004
2005
2006
2007
2008
2009
Year
Ozo
ne
in P
arts
Mill
ion
8-Hour Ozone Design ValuesFederal 8-Hour Ozone Standard (0.075 PPM)
Figure 11:
Piru PM2.5Annual Design Values
6
7
8
9
10
11
12
13
14
15
16
2004
2005
2006
2007
2008
Year
PM
2.5,
µg
/cu
bic
met
er
PM2.5 Annual Design ValuePM2.5 Annual Standard (15 µg/m3)

Ventura County APCD 2010 Ambient Air Monitoring Network Assessment
Page 43
Figure 12:
Piru PM2.524-Hour Design Values
15
20
25
30
35
40
45
2004
2005
2006
2007
2008
Year
PM
2.5,
µg
/cu
bic
met
erPM 2.5 24-Hour Design ValuePM2.5 24-Hour Standard (35 µg/m3)

Ventura County APCD 2010 Ambient Air Monitoring Network Assessment
Page 44
APPENDIX F: SIMI VALLEY MONITORING STATION
Figure 13:
Simi Valley Ozone8-Hour Design Values
0.050
0.060
0.070
0.080
0.090
0.100
0.110
0.120
0.130
0.140
1985
1987
1989
1991
1993
1995
1997
1999
2001
2003
2005
2007
2009
Year
Ozo
ne
in P
arts
Mill
ion
8-Hour Ozone Design ValuesFederal 8-Hour Ozone Standard (0.075 PPM)
Figure 14:
Simi Valley PM2.5Annual Design Values
6
7
8
9
10
11
12
13
14
15
16
2003
2004
2005
2006
2007
2008
Year
PM
2.5,
µg
/cu
bic
met
er
PM2.5 Annual Design ValuePM2.5 Annual Standard (15 µg/m3)

Ventura County APCD 2010 Ambient Air Monitoring Network Assessment
Page 45
Figure 15:
Simi Valley PM2.524-Hour Design Values
15
20
25
30
35
40
45
2001
2002
2003
2004
2005
2006
2007
2008
Year
PM
2.5,
µg
/cu
bic
met
er
PM 2.5 24-Hour Design ValuePM2.5 24-Hour Standard (35 µg/m3)
Figure 16:
Simi Valley PM10 Highest 24-Hour Average
40
60
80
100
120
140
160
180
1988
1990
1992
1994
1996
1998
2000
2002
2004
2006
2008
Year
PM
10, µ
g/cu
bic
met
er
High 24-Hr AverageStandard - 150 mg/m3

Ventura County APCD 2010 Ambient Air Monitoring Network Assessment
Page 46
APPENDIX G: THOUSAND OAKS MONITORING STATION
Figure 17:
Thousand Oaks Ozone8-Hour Design Values
0.050
0.060
0.070
0.080
0.090
0.100
0.110
0.120
0.130
0.140
1994
1996
1998
2000
2002
2004
2006
2008
Year
Ozo
ne
in P
arts
Mill
ion
8-Hour Ozone Design Values
Federal 8-Hour Ozone Standard (0.075 PPM)
Figure 18:
Thousand Oaks PM2.5Annual Design Values
6
7
8
9
10
11
12
13
14
15
16
2001
2002
2003
2004
2005
2006
2007
2008
Year
PM
2.5,
µg
/cu
bic
met
er
PM2.5 Annual Design ValuePM2.5 Annual Standard (15 µg/m3)

Ventura County APCD 2010 Ambient Air Monitoring Network Assessment
Page 47
Figure 19:
Thousand Oaks PM2.524-Hour Design Values
15
20
25
30
35
40
45
2001
2002
2003
2004
2005
2006
2007
2008
Year
PM
2.5,
µg
/cu
bic
met
er
PM 2.5 24-Hour Design ValuePM2.5 24-Hour Standard (35 µg/m3)

Ventura County APCD 2010 Ambient Air Monitoring Network Assessment
Page 48
APPENDIX H: VENTURA - EMMA WOOD MONITORING STATION
Figure 20:
Ventura-Emma Wood Ozone8-Hour Ozone Design Values
0.050
0.060
0.070
0.080
0.090
0.100
0.110
0.120
0.130
0.140
1990
1992
1994
1996
1998
2000
2002
2004
2006
2008
Year
Ozo
ne
in P
arts
Mill
ion
8-Hour Ozone Design Value
Federal 8-Hour Ozone Standard (0.075 PPM)