2010 project management report · 2010. 11. 10. · difficulty in sharing data across distributed...
TRANSCRIPT

2010 Project Management Report Standardized Best Practices and Technology Adoption in the AEC Industry
January 2010
Cindy Jutras
2010 Project Management Report: AEC Industry Page 2
© 2010 Aberdeen Group. Telephone: 617 854 5200
Executive Summary A difficult economy and global competition leave Architecture, Engineering, and Construction (AEC) firms with little room for error today in managing projects for profitability. The key to project profitability is delivering projects and milestones on time and under budget. A recent survey of 317 companies, including 83 AEC firms, revealed that those which combined standardized best practices in project management with enterprise level project management solutions delivered 39% more projects early or on time and 22% more projects within budget.
Standardized Business Processes and Technology We refer to these top performing companies as those with Standardized Best Practices and Technology (SBPT). The companies that combine these two characteristics are:
• 230% more likely to deliver more than 90% of projects early or on time
• 188% more likely to deliver more than 90% of projects within budget
• 183% more likely to contain budget overruns to less than 10%
• 43% less likely to have poor performance on one project have a ripple effect on other projects
"We have exploited all of our data sources to consolidate project information. The keys to success have been the maturation and standardization of the management processes guided by our project management solution. The key benefits were in distributing information, project performance analysis, from opportunity qualification to proposal development. We used workflow technology to standardize processes and employ change management in IT."
~ Vice President of Information Technology, AEC firm dealing
with the Aerospace and Defense industry
Competitive Assessment Survey results show that the firms demonstrating these characteristics shared several common capabilities, including:
• Decision-makers are 132% more likely to be notified in real time as exceptions occur and are able to react immediately
• Project managers are 180% more likely to have real-time visibility into all project milestones and schedule status
• Business executives are 232% more likely to have real-time visibility into project costs
Required Actions Those AEC firms which have not yet standardized project management processes should define and document best practices. Those that are still using spreadsheets and manual processes should invest in project management solutions to assist in scheduling, costing, management, and reporting. Those using tools and technology that are confined to the desktop should upgrade to enterprise level applications that support collaboration and enterprise-wide visibility.
www.aberdeen.com Fax: 617 723 7897

2010 Project Management Report: AEC Industry Page 3
© 2010 Aberdeen Group. Telephone: 617 854 5200 www.aberdeen.com Fax: 617 723 7897
Table of Contents Executive Summary....................................................................................................... 2
Standardized Business Processes and Technology........................................... 2 Competitive Assessment........................................................................................ 2 Required Actions...................................................................................................... 2
Chapter One: Benchmarking Best Practices and Technology Adoption........ 4 Business Context ..................................................................................................... 4 Best Practices and Technology Improve Performance ................................... 4 Challenges Faced ...................................................................................................... 5 Strategies That Produce Results........................................................................... 6
Chapter Two: Benchmarking Performance ........................................................... 8 On Time Delivery .................................................................................................... 9 Staying within Budget ............................................................................................11 Better Visibility .......................................................................................................12 Impact of Poor Performance...............................................................................14
Chapter Three: Required Actions .........................................................................17 Appendix A: Research Methodology.....................................................................18
Figures Figure 1: "Top Two" Project Pressures ................................................................... 4 Figure 2: "Top Two" Strategic Actions .................................................................... 7 Figure 3: Schedule and Budget Performance .......................................................... 9 Figure 4: Percentage of Projects Delivered Early or On Time ........................10 Figure 5: Performance on Late Projects ................................................................10 Figure 6: Percentage of Projects Delivered Within Budget ..............................11 Figure 7: Percentage Over Budget ..........................................................................11 Figure 8: Improved Visibility .....................................................................................13 Figure 9: Single Main Reasons for Poor Performance (Customer = Owner) ...13 Figure 10: "Top Two" Impacts of Poor Performance (Customer = Owner)....14
Tables Table 1: Mean Performance in AEC Firms.............................................................. 5 Table 2: Challenges ....................................................................................................... 6 Table 3: Organizational Differentiators .................................................................12 Table 4: Technology Adoption.................................................................................15 Table 5: Enterprise Level Applications...................................................................16

2010 Project Management Report: AEC Industry Page 4
© 2010 Aberdeen Group. Telephone: 617 854 5200
Chapter One: Benchmarking Best Practices and
Technology Adoption
Business Context Fast Facts
√ Challenges in successfully managing projects are reduced by 22% by implementing standard best practices and enterprise level technology
√ AEC firms with Standardized Best Practices and Technology (SBPT) implemented at the enterprise level are 40% more likely to deliver projects early or on time and 22% more likely to stay within budget than those that have neither
√ Projects managed with SBPT that do not stay within budget, result in overruns that are half of those in companies with neither
A difficult economy and global competition leave Architecture, Engineering, and Construction (AEC) firms with little room to maneuver these days. In a survey of 83 AEC firms, Aberdeen finds low margins forcing AEC companies to focus attention on managing projects for improved profitability. Added pressure comes from owners' demands for faster delivery to optimize time-to-market requirements, reduced project cost, greater project complexity and increased capital asset lifecycle value or reduced capital asset Total Cost of Ownership (TCO).
Figure 1: "Top Two" Project Pressures
19%
28%
28%
30%
36%
47%
0% 10% 20% 30% 40% 50%
Increased variability of coststhroughout the project lifecycle
Low productivity inproject delivery
Lack of available skilled resourcesneeded for projects
Increased need to reduceTCO of capital asset
Increased need for owner tooptimize time-to-market
Low profit margins leavelittle room for error
Percentage of Respondents
19%
28%
28%
30%
36%
47%
0% 10% 20% 30% 40% 50%
Increased variability of coststhroughout the project lifecycle
Low productivity inproject delivery
Lack of available skilled resourcesneeded for projects
Increased need to reduceTCO of capital asset
Increased need for owner tooptimize time-to-market
Low profit margins leavelittle room for error
Percentage of Respondents Note: Respondents were asked to select their top two answer choices
Source: Aberdeen Group, January 2010
In spite of high job losses, 28% of AEC firms struggle with the lack of necessary skills to fully staff and deliver against project requirements. In a business that requires highly skilled labor, the right people with the right skills are essential to success. In construction project delivery this situation is further aggravated by low productivity across multiple project stakeholders, particularly since the construction environment continues to present a significant challenge for effective collaboration across all stakeholders.
Best Practices and Technology Improve Performance Aberdeen found that a combination of standardized best practices and enterprise level technology were key factors in effectively addressing these project pressures. As a result, we define three categories of AEC firms:
www.aberdeen.com Fax: 617 723 7897
2010 Project Management Report: AEC Industry Page 5
© 2010 Aberdeen Group. Telephone: 617 854 5200 www.aberdeen.com Fax: 617 723 7897
• Standardized Best Practices and Technology (SBPT) are defined as those companies that have defined, documented, and standardized best practices across the enterprise and have implemented enterprise applications to provide visibility and assist in the management of projects.
• Standardized Best Practices (SBP) are those where best practices have been defined and standardized, but with limited use of technology. These firms may use a combination of desktop tools, spreadsheets, or manual processes to implement these standard best practices.
• Those with neither may have defined and documented best practices but have not standardized them across the enterprise. Any technology used is almost exclusively resident on the individual desktop, severely limiting visibility as well as collaborative efforts.
Table 1: Mean Performance in AEC Firms
Category of AEC Firms Mean Performance
Standard Best Practices and
Enterprise Level Technology
(SBPT)
89% of projects delivered early or on time Projects not delivered on time are on average four weeks late 89% of projects delivered within budget 10% average overrun on those projects not delivered within budget
Standard Best Practices with
Desktop Based or No Technology
(SBP)
71% of projects delivered early or on time Projects not delivered on time are on average six weeks late 79% of projects delivered within budget 14% average overrun on projects not delivered within budget
Neither Best Practices or
Enterprise Level Technology (Neither)
64% of projects delivered early or on time Projects not delivered on time are on average six weeks late 73% of projects delivered within budget 20% average overrun on projects not delivered within budget
Source: Aberdeen Group, January 2010
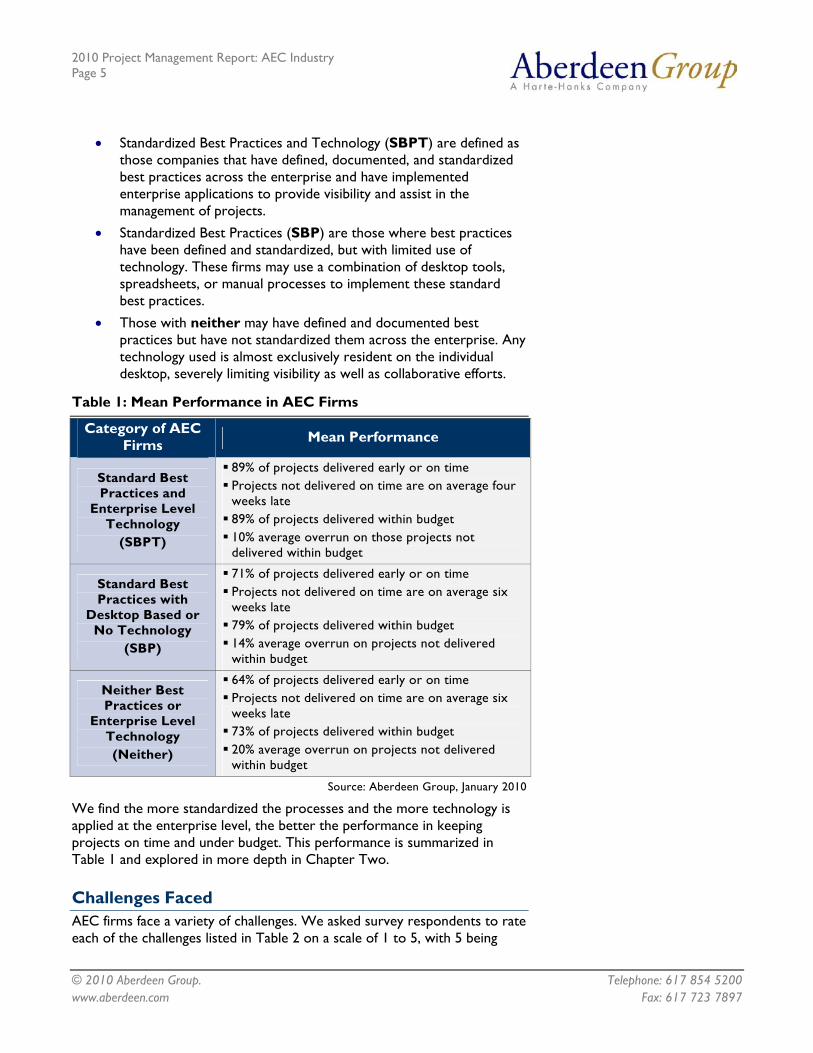
We find the more standardized the processes and the more technology is applied at the enterprise level, the better the performance in keeping projects on time and under budget. This performance is summarized in Table 1 and explored in more depth in Chapter Two.
Challenges Faced AEC firms face a variety of challenges. We asked survey respondents to rate each of the challenges listed in Table 2 on a scale of 1 to 5, with 5 being
2010 Project Management Report: AEC Industry Page 6
© 2010 Aberdeen Group. Telephone: 617 854 5200
"Currently the biggest challenge we face lies in the lack of connectivity among tools and applications; data entered multiple times into different applications makes it difficult to control versions and consolidate reports and information."
~ Project Manager, multibillion-dollar AEC firm planning to
invest in new technology
"very challenging" and 1 being "not a significant challenge." A rating of 3 indicated a "moderate" challenge.
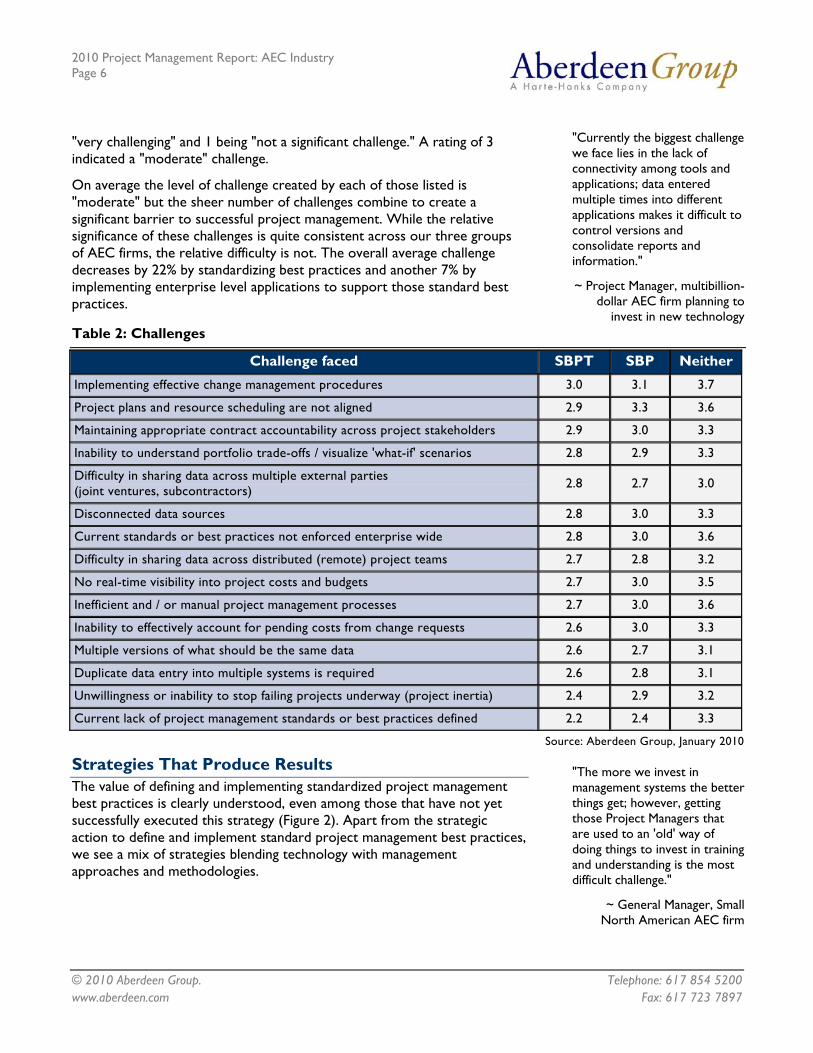
On average the level of challenge created by each of those listed is "moderate" but the sheer number of challenges combine to create a significant barrier to successful project management. While the relative significance of these challenges is quite consistent across our three groups of AEC firms, the relative difficulty is not. The overall average challenge decreases by 22% by standardizing best practices and another 7% by implementing enterprise level applications to support those standard best practices.
Table 2: Challenges
Challenge faced SBPT SBP Neither
Implementing effective change management procedures 3.0 3.1 3.7
Project plans and resource scheduling are not aligned 2.9 3.3 3.6
Maintaining appropriate contract accountability across project stakeholders 2.9 3.0 3.3
Inability to understand portfolio trade-offs / visualize 'what-if' scenarios 2.8 2.9 3.3
Difficulty in sharing data across multiple external parties (joint ventures, subcontractors) 2.8 2.7 3.0
Disconnected data sources 2.8 3.0 3.3
Current standards or best practices not enforced enterprise wide 2.8 3.0 3.6
Difficulty in sharing data across distributed (remote) project teams 2.7 2.8 3.2
No real-time visibility into project costs and budgets 2.7 3.0 3.5
Inefficient and / or manual project management processes 2.7 3.0 3.6
Inability to effectively account for pending costs from change requests 2.6 3.0 3.3
Multiple versions of what should be the same data 2.6 2.7 3.1
Duplicate data entry into multiple systems is required 2.6 2.8 3.1
Unwillingness or inability to stop failing projects underway (project inertia) 2.4 2.9 3.2
Current lack of project management standards or best practices defined 2.2 2.4 3.3
Source: Aberdeen Group, January 2010
"The more we invest in management systems the better things get; however, getting those Project Managers that are used to an 'old' way of doing things to invest in training and understanding is the most difficult challenge."
~ General Manager, Small North American AEC firm
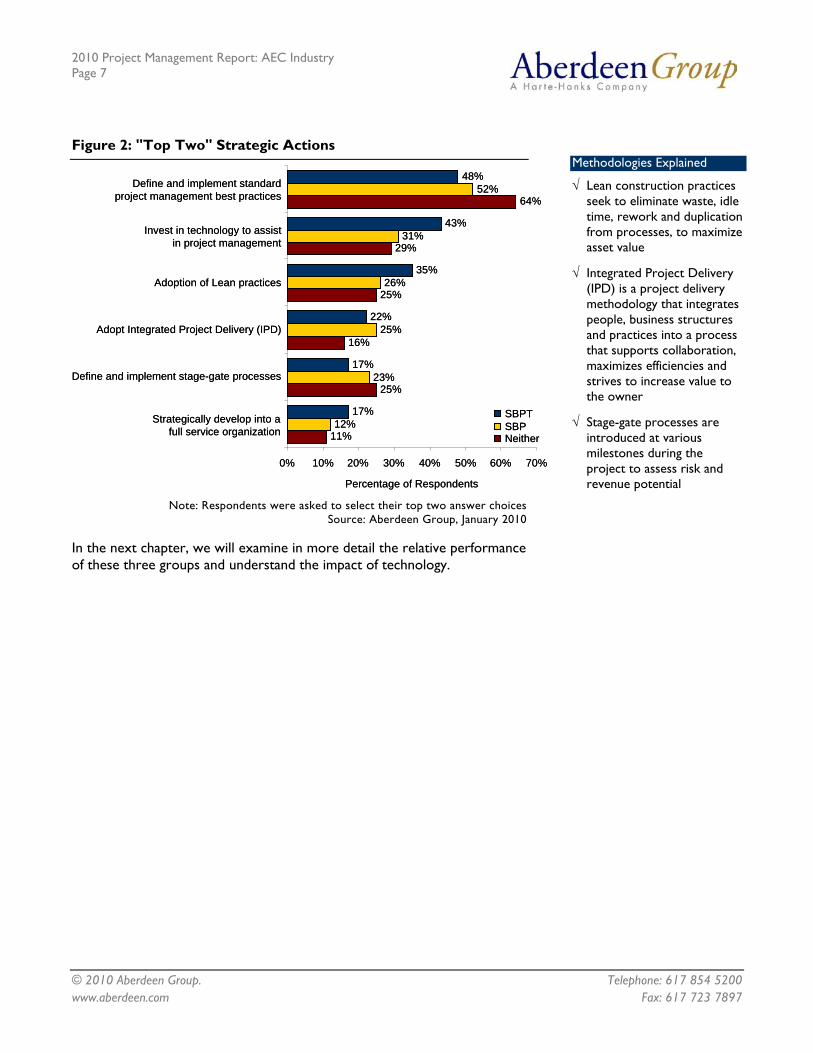
Strategies That Produce Results The value of defining and implementing standardized project management best practices is clearly understood, even among those that have not yet successfully executed this strategy (Figure 2). Apart from the strategic action to define and implement standard project management best practices, we see a mix of strategies blending technology with management approaches and methodologies.
www.aberdeen.com Fax: 617 723 7897
2010 Project Management Report: AEC Industry Page 7
© 2010 Aberdeen Group. Telephone: 617 854 5200
Figure 2: "Top Two" Strategic Actions Methodologies Explained
√ Lean construction practices seek to eliminate waste, idle time, rework and duplication from processes, to maximize asset value
√ Integrated Project Delivery (IPD) is a project delivery methodology that integrates people, business structures and practices into a process that supports collaboration, maximizes efficiencies and strives to increase value to the owner
√ Stage-gate processes are introduced at various milestones during the project to assess risk and revenue potential
11%
25%
16%
25%
29%
64%
12%
23%
25%
26%
31%
52%
17%
17%
22%
35%
43%
48%
0% 10% 20% 30% 40% 50% 60% 70%
Strategically develop into afull service organization
Define and implement stage-gate processes
Adopt Integrated Project Delivery (IPD)
Adoption of Lean practices
Invest in technology to assistin project management
Define and implement standardproject management best practices
Percentage of Respondents
SBPTSBPNeither11%
25%
16%
25%
29%
64%
12%
23%
25%
26%
31%
52%
17%
17%
22%
35%
43%
48%
0% 10% 20% 30% 40% 50% 60% 70%
Strategically develop into afull service organization
Define and implement stage-gate processes
Adopt Integrated Project Delivery (IPD)
Adoption of Lean practices
Invest in technology to assistin project management
Define and implement standardproject management best practices
Percentage of Respondents
SBPTSBPNeither
Note: Respondents were asked to select their top two answer choices
Source: Aberdeen Group, January 2010
In the next chapter, we will examine in more detail the relative performance of these three groups and understand the impact of technology.
www.aberdeen.com Fax: 617 723 7897

2010 Project Management Report: AEC Industry Page 8
© 2010 Aberdeen Group. Telephone: 617 854 5200
Chapter Two: Benchmarking Performance
As we saw summarized in Table 1, those companies with standardized best practices and enterprise level technology were better able to deliver projects on time and within budget.
Customer Case Study: Costain Group
The Costain Group is one of the UK's leading engineering and construction companies. With annual revenue of US$1.6 billion and 2,767 employees, Costain has a well defined culture with strong values. Costain has been using project management technology for many years, standardizing in 1995 with the purchase of Oracles’ Primavera Sure Trak.
“Three years ago I was given the responsibility for improving our applications from an enterprise perspective. Our goal was an enterprise solution that would establish one version of the ‘truth’ and allow collaboration and sharing across dispersed teams,” said Phil Budden, Planning Systems Deployment Manager. “We had moved from Sure Trak to Oracle’s Primavera P3 and now to P5 and P6. As a result we gained two real benefits. Dispersed teams can develop, share and access construction schedules and plans. Using Primavera as a vehicle for standardization, teams of partners, associates and subcontractors all share a common, real-time view of budgets, cash flow, resources and performance against schedule.”
Through the effective implementation of both standard practices and an enterprise level solution Costain was able to complete two high profile highway projects months ahead of schedule and under budget. “The ability to share data with the right people, develop ideas collaboratively and effectively communicate this to the client allowed us to introduce significant changes to the plan and get them approved quickly. Making the view available to the customer accelerated the discussion and the decision-making process,” said Budden. “The fact that we had a live developing program and could facilitate the discussion as we were developing it, and could involve the client, reduced the discussion by a week and ultimately improved the delivery of the entire project. Involving all the different parties, regardless of location, in the schedule development allows us to reduce both time and effort.”
continued
Costain Group Sectors
√ Water
√ Rail
√ Highway
√ Health
√ Education
√ Retail
√ Nuclear
√ Energy & Process
√ Marine
√ Property
√ Airports
√ Waste
Fast Facts
√ Decision-makers are 132% more likely to be notified in real time as exceptions in order to react immediately
√ Project managers are 180% more likely to have real-time visibility into all project milestones and schedule status
√ Business executives are 232% more likely to have real-time visibility into all project budget versus actual costs
www.aberdeen.com Fax: 617 723 7897
2010 Project Management Report: AEC Industry Page 9
© 2010 Aberdeen Group. Telephone: 617 854 5200
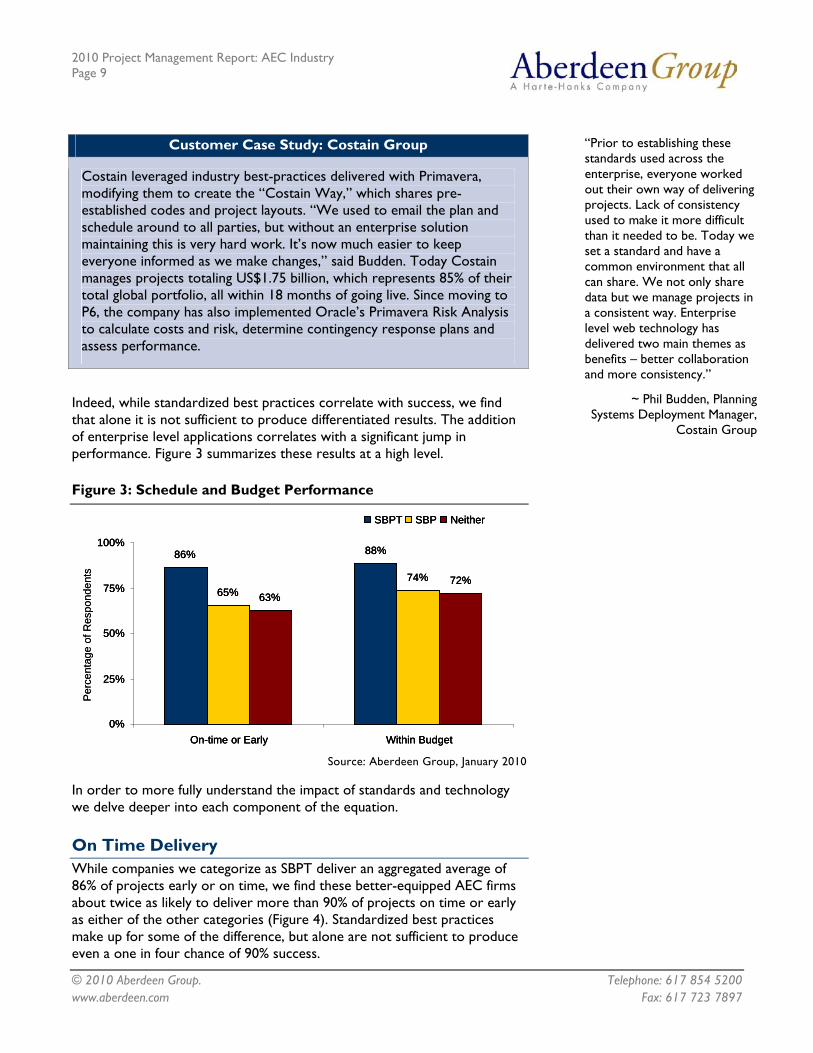
“Prior to establishing these standards used across the enterprise, everyone worked out their own way of delivering projects. Lack of consistency used to make it more difficult than it needed to be. Today we set a standard and have a common environment that all can share. We not only share data but we manage projects in a consistent way. Enterprise level web technology has delivered two main themes as benefits – better collaboration and more consistency.”
~ Phil Budden, Planning Systems Deployment Manager,
Costain Group
Customer Case Study: Costain Group
Costain leveraged industry best-practices delivered with Primavera, modifying them to create the “Costain Way,” which shares pre-established codes and project layouts. “We used to email the plan and schedule around to all parties, but without an enterprise solution maintaining this is very hard work. It’s now much easier to keep everyone informed as we make changes,” said Budden. Today Costain manages projects totaling US$1.75 billion, which represents 85% of their total global portfolio, all within 18 months of going live. Since moving to P6, the company has also implemented Oracle’s Primavera Risk Analysis to calculate costs and risk, determine contingency response plans and assess performance.
Indeed, while standardized best practices correlate with success, we find that alone it is not sufficient to produce differentiated results. The addition of enterprise level applications correlates with a significant jump in performance. Figure 3 summarizes these results at a high level.
Figure 3: Schedule and Budget Performance
86% 88%
65%74%
63%72%
0%
25%
50%
75%
100%
On-time or Early Within Budget
SBPT SBP Neither
Per
cent
age
of R
espo
nden
ts
86% 88%
65%74%
63%72%
0%
25%
50%
75%
100%
On-time or Early Within Budget
SBPT SBP Neither
86% 88%
65%74%
63%72%
0%
25%
50%
75%
100%
On-time or Early Within Budget
SBPT SBP Neither
Per
cent
age
of R
espo
nden
ts
Source: Aberdeen Group, January 2010
In order to more fully understand the impact of standards and technology we delve deeper into each component of the equation.
On Time Delivery While companies we categorize as SBPT deliver an aggregated average of 86% of projects early or on time, we find these better-equipped AEC firms about twice as likely to deliver more than 90% of projects on time or early as either of the other categories (Figure 4). Standardized best practices make up for some of the difference, but alone are not sufficient to produce even a one in four chance of 90% success.
www.aberdeen.com Fax: 617 723 7897

2010 Project Management Report: AEC Industry Page 10
© 2010 Aberdeen Group. Telephone: 617 854 5200
While the remainder of "SBPT" companies were able to deliver at least half of their projects on time or early, without enterprise level applications, a small percentage delivered less than 50% or even less than 30% of projects on time or early, leaving both their business as well as their owner clients at risk.
Figure 4: Percentage of Projects Delivered Early or On Time
43%
52%
0% 0%
55%
7%10%
23%
13%
52%
10% 8%
0%
10%
20%
30%
40%
50%
60%
90% to 100% Less than 90% Less than 50% Less than 30%
Per
cent
age
of R
espo
nden
ts SBPT SBP Neither43%
52%
0% 0%
55%
7%10%
23%
13%
52%
10% 8%
0%
10%
20%
30%
40%
50%
60%
90% to 100% Less than 90% Less than 50% Less than 30%
Per
cent
age
of R
espo
nden
ts SBPT SBP Neither
Note: Where percentages do not add up to be 100%, the remainder of companies either
did not know or did not measure this performance metric Source: Aberdeen Group, January 2010
Performance on Late Projects The degree of risk resulting from poor schedule performance varies depending on exactly how late those late projects are. Figure 5 shows that standardized best practices help companies come closer to their delivery dates, with the majority containing schedule overruns to one month or less while less than half of the "neither" category can boast this level of achievement. Obviously the duration and the nature of AEC projects can vary significantly from multi-week to multi-year projects so the negative impact of delays of longer duration will vary. Yet the goal for any AEC project is to deliver as close to the contracted delivery date as possible.
Figure 5: Performance on Late Projects
65%
9% 9% 8%14%
6%
61%
12%
45%
19%13%
9%
0%
10%
20%
30%
40%
50%
60%
70%
Less than 1 monthlate
1 to 2 months late 2 to 3 months late More than 3 monthslate
Per
cent
age
of R
espo
nden
ts SBPT SBP Neither
65%
9% 9% 8%14%
6%
61%
12%
45%
19%13%
9%
0%
10%
20%
30%
40%
50%
60%
70%
Less than 1 monthlate
1 to 2 months late 2 to 3 months late More than 3 monthslate
Per
cent
age
of R
espo
nden
ts SBPT SBP Neither
Source: Aberdeen Group, January 2010
www.aberdeen.com Fax: 617 723 7897

2010 Project Management Report: AEC Industry Page 11
© 2010 Aberdeen Group. Telephone: 617 854 5200
Staying within Budget While the vast majority of all AEC companies are able to deliver at least half of their projects within budget, more than half of SBPT companies (52%) are able to do so more than 90% of the time and 100% deliver at least half of projects within budget.
Figure 6: Percentage of Projects Delivered Within Budget
52%
39%
0%
33%
49%
9%
18%
54%
14%
0%
10%
20%
30%
40%
50%
60%
90% to 100% 50% or more Less than 50%
Per
cent
age
of R
espo
nden
ts
SBPT SBP Neither52%
39%
0%
33%
49%
9%
18%
54%
14%
0%
10%
20%
30%
40%
50%
60%
90% to 100% 50% or more Less than 50%
Per
cent
age
of R
espo
nden
ts
SBPT SBP Neither
Source: Aberdeen Group, January 2010
Cost Containment on Over Budget Projects The degree of budget overrun is critical to the profitability of the enterprise. With the standardization of best practices, AEC firms are more than twice as likely to contain those overruns to 10% or less. Adding enterprise level project management applications increases that likelihood by another 35%.
Figure 7: Percentage Over Budget
65%
17%
4%
48%
25%
15%
23%
32%28%
0%
10%
20%
30%
40%
50%
60%
70%
1% to 10% 11% to 20% More than 20%
Per
cent
age
of R
espo
nden
ts
SBPT SBP Neither
65%
17%
4%
48%
25%
15%
23%
32%28%
0%
10%
20%
30%
40%
50%
60%
70%
1% to 10% 11% to 20% More than 20%
Per
cent
age
of R
espo
nden
ts
SBPT SBP Neither
Source: Aberdeen Group, January 2010
www.aberdeen.com Fax: 617 723 7897
2010 Project Management Report: AEC Industry Page 12
© 2010 Aberdeen Group. Telephone: 617 854 5200 www.aberdeen.com Fax: 617 723 7897
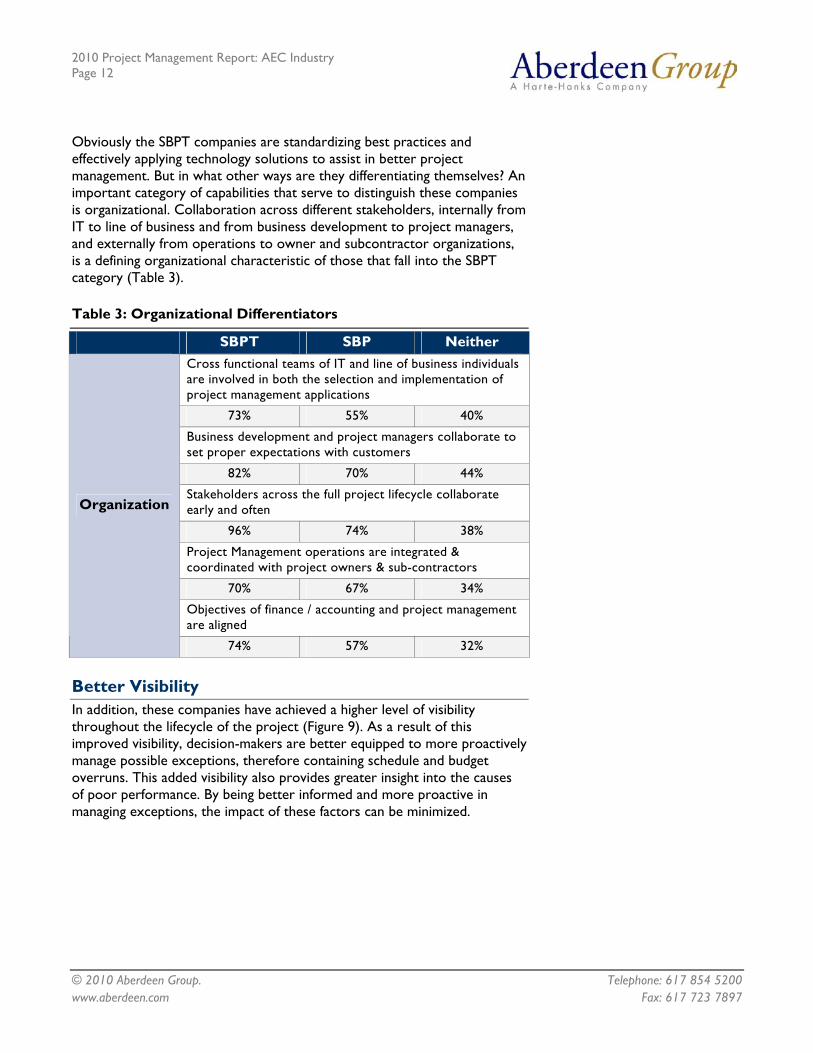
Obviously the SBPT companies are standardizing best practices and effectively applying technology solutions to assist in better project management. But in what other ways are they differentiating themselves? An important category of capabilities that serve to distinguish these companies is organizational. Collaboration across different stakeholders, internally from IT to line of business and from business development to project managers, and externally from operations to owner and subcontractor organizations, is a defining organizational characteristic of those that fall into the SBPT category (Table 3).
Table 3: Organizational Differentiators
SBPT SBP Neither Cross functional teams of IT and line of business individuals are involved in both the selection and implementation of project management applications
73% 55% 40%
Business development and project managers collaborate to set proper expectations with customers
82% 70% 44%
Stakeholders across the full project lifecycle collaborate early and often
96% 74% 38%
Project Management operations are integrated & coordinated with project owners & sub-contractors
70% 67% 34%
Objectives of finance / accounting and project management are aligned
Organization
74% 57% 32%
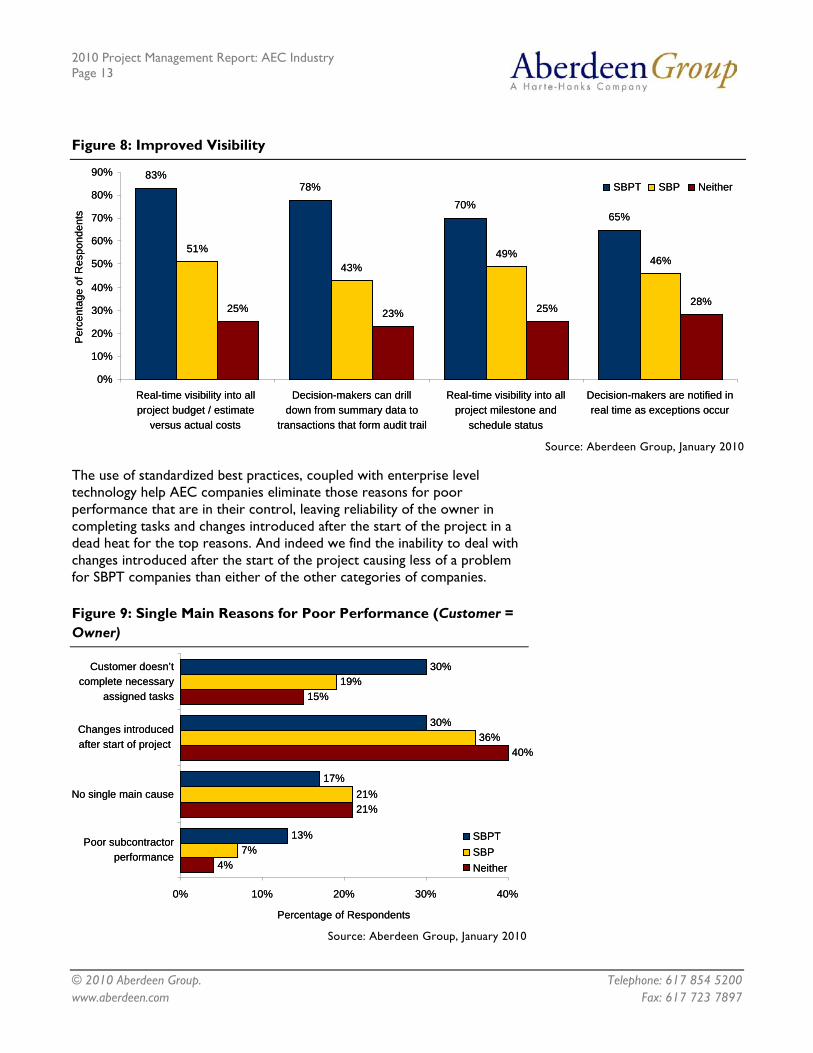
Better Visibility In addition, these companies have achieved a higher level of visibility throughout the lifecycle of the project (Figure 9). As a result of this improved visibility, decision-makers are better equipped to more proactively manage possible exceptions, therefore containing schedule and budget overruns. This added visibility also provides greater insight into the causes of poor performance. By being better informed and more proactive in managing exceptions, the impact of these factors can be minimized.
2010 Project Management Report: AEC Industry Page 13
© 2010 Aberdeen Group. Telephone: 617 854 5200
Figure 8: Improved Visibility
83%78%
70%65%
51%
43%49% 46%
25% 23% 25% 28%
0%
10%
20%
30%
40%
50%
60%
70%
80%
90%
Real-time visibility into allproject budget / estimate
versus actual costs
Decision-makers can drilldown from summary data to
transactions that form audit trail
Real-time visibility into allproject milestone and
Decision-makers are notified inreal time as exceptions occur
Per
cent
age
of R
espo
nden
ts
SBPT SBP Neither
schedule status
83%78%
70%65%
51%
43%49% 46%
25% 23% 25% 28%
0%
10%
20%
30%
40%
50%
60%
70%
80%
90%
Real-time visibility into allproject budget / estimate
versus actual costs
Decision-makers can drilldown from summary data to
transactions that form audit trail
Real-time visibility into allproject milestone and
Decision-makers are notified inreal time as exceptions occur
Per
cent
age
of R
espo
nden
ts
SBPT SBP Neither
schedule status Source: Aberdeen Group, January 2010
The use of standardized best practices, coupled with enterprise level technology help AEC companies eliminate those reasons for poor performance that are in their control, leaving reliability of the owner in completing tasks and changes introduced after the start of the project in a dead heat for the top reasons. And indeed we find the inability to deal with changes introduced after the start of the project causing less of a problem for SBPT companies than either of the other categories of companies.
Figure 9: Single Main Reasons for Poor Performance (Customer = Owner)
4%
21%
40%
15%
7%
21%
36%
19%
13%
17%
30%
30%
0% 10% 20% 30% 40%
Poor subcontractorperformance
No single main cause
Changes introducedafter start of project
Customer doesn’tcomplete necessary
assigned tasks
Percentage of Respondents
SBPTSBPNeither4%
21%
40%
15%
7%
21%
36%
19%
13%
17%
30%
30%
0% 10% 20% 30% 40%
Poor subcontractorperformance
No single main cause
Changes introducedafter start of project
Customer doesn’tcomplete necessary
assigned tasks
Percentage of Respondents
SBPTSBPNeither
Source: Aberdeen Group, January 2010
www.aberdeen.com Fax: 617 723 7897

2010 Project Management Report: AEC Industry Page 14
© 2010 Aberdeen Group. Telephone: 617 854 5200
Impact of Poor Performance "Staff seem to be too busy to plan ahead relative to staffing needs, to make realistic manpower cost projections, to stay ahead of scope changes with extra or supplemental fee requests, to recognize in scope versus out of scope work, to foresee pitfalls, and finally they are too busy to stop and recognize the value of using enterprise applications to their full advantage."
~ Vice President, Mid-size North American AEC firm
So what is the impact of poor performance? We see little difference in terms of the top two impacts across all companies (Figure 10). Poor performance can cause customer dissatisfaction which in turn can affect an AEC firm's ability to secure follow on business from the same customer and it can eat away at margins. Overruns in both schedule and budget usually correlate with additional resource requirements and we saw earlier in Chapter One that many of these AEC companies start with low profit margins to begin with. A serious overrun can have a catastrophic impact on project and company profitability.
Figure 10: "Top Two" Impacts of Poor Performance (Customer = Owner)
17%
46%
17%
49%
55%
17%
48%
14%
49%
57%
13%
26%
30%
52%
57%
0% 10% 20% 30% 40% 50% 60%
Negative impact on reputationimpacts ability to close new
business
Ripple effect on otherprojects when resources arenot available when expected
Margins are reduced by latefees or fines
Margins are reduced byincreased resource
requirements
Poor customer satisfactionnegatively impacts customer
repeat business
Percentage of Respondents
SBPTSBPNeither17%
46%
17%
49%
55%
17%
48%
14%
49%
57%
13%
26%
30%
52%
57%
0% 10% 20% 30% 40% 50% 60%
Negative impact on reputationimpacts ability to close new
business
Ripple effect on otherprojects when resources arenot available when expected
Margins are reduced by latefees or fines
Margins are reduced byincreased resource
requirements
Poor customer satisfactionnegatively impacts customer
repeat business
Percentage of Respondents
SBPTSBPNeither
Source: Aberdeen Group, January 2010
While we see little difference in the top two impacts, the difference becomes more pronounced when it comes to limiting the negative impact of poor performance. Through best practice, technology, and improved visibility, SBPT companies are able to better contain schedule delays and therefore reduce the probability of the negative effect cascading throughout other projects.
www.aberdeen.com Fax: 617 723 7897

2010 Project Management Report: AEC Industry Page 15
© 2010 Aberdeen Group. Telephone: 617 854 5200 www.aberdeen.com Fax: 617 723 7897
Aberdeen Insights — Technology
Throughout Chapter One and Chapter Two we have been referring to the use of technology in the management of projects. Exactly what kind and category of technology is most used and most prevalent in AEC firms? We defined SBPT companies as those using enterprise level applications for project scheduling, costing, management, and reporting. Therefore you will see 100% adoption of these solutions for the SBPT companies in Table 4 which lists overall technology adoption rates regardless of the level of sophistication of the solution. We also find relatively high adoption rates among other software categories, yet not all these categories are universally needed by all AEC firms, nor are they as universally adopted.
Table 4: Technology Adoption
Application SBPT SBP Neither
Project Scheduling 100% 79% 60%
Project Costing 100% 76% 56%
Project Management and Reporting 100% 82% 57%
Service Management (post project completion) 55% 36% 16%
Quoting and Estimating 73% 59% 43%
Document Management 68% 58% 46%
Contract Management 81% 58% 34%
Collaboration tools 82% 67% 33%
Workflow automation tools 68% 42% 21%
Subcontractor Management 45% 31% 21%
Change Management and control 77% 56% 33%
Building Information Management (BIM) 48% 31% 14%
Virtual Design and Construction (VDC) 29% 19% 14%
Source: Aberdeen Group, January 2010
Table 5 further refines the adoption rate by specifying an enterprise application. For example, while 79% of SBP companies use a project scheduling application (Table 4), about half are using either applications that are confined to the desktop, and only 40% are using enterprise level solutions (Table 5).
continued

2010 Project Management Report: AEC Industry Page 16
© 2010 Aberdeen Group. Telephone: 617 854 5200 www.aberdeen.com Fax: 617 723 7897
Aberdeen Insights — Technology
While adoption rates dipped below 100% beyond the basic functions of scheduling, project costing, construction management, and reporting, in each category, SBPT companies were significantly more likely to be using enterprise applications than desktop tools, spreadsheets, and manual processes.
Table 5: Enterprise Level Applications
Application SBPT SBP Neither
Project Scheduling 100% 40% 16%
Project Costing 100% 43% 23%
Project Management and Reporting 100% 46% 22%
Service Management (post project completion) 57% 27% 7%
Quoting and Estimating 55% 24% 10%
Document Management 78% 45% 28%
Contract Management 70% 33% 13%
Collaboration tools 65% 47% 19%
Workflow automation tools 61% 27% 9%
Subcontractor Management 61% 27% 9%
Change Management and control 77% 35% 14%
Building Information Management (BIM) 55% 26% 6%
Virtual Design and Construction (VDC) 41% 18% 5%
Source: Aberdeen Group, January 2010
While every AEC firm may not require each and every one of these solutions, most will definitely benefit from many, and tools such as document and change management and workflow automation have universal application across any segment of AEC.

2010 Project Management Report: AEC Industry Page 17
© 2010 Aberdeen Group. Telephone: 617 854 5200
Chapter Three: Required Actions
Our data shows that by simply defining, documenting, and standardizing best project management practices, AEC companies can deliver 11% more projects on time or early and are 83% more likely to deliver over 90% of their projects within budget. Yet when we add enterprise level project management solutions to these standardized best practices we see significantly higher jumps in performance. SBPT companies are:
• 230% more likely to deliver more than 90% of projects early or on time
"The biggest benefit we have seen from initiatives to improve project performance (including the investment in technology) was the formalization of project budget reporting. Implementation of a standard tracking system has allowed management to objectively review project-specific performance."
~ Manager, Small North American AEC Firm
• 188% more likely to deliver more than 90% of projects within budget
• 183% more likely to contain budget overruns to be less than 10%
• 43% less likely to have poor performance on one project have a ripple effect on other projects
Those AEC firms which have not yet standardized project management processes should research, define and document best practices. Those that are still using spreadsheets and manual processes should invest in project management solutions to assist in scheduling, project costing, construction management and reporting. Those using tools and technology that are confined to the desktop should upgrade to enterprise level applications that support collaboration and enterprise-wide visibility.
For companies that already meet the criteria of SBPT, look to expand your solutions beyond the basics. While some of the extended solutions such as Building Information Management and Virtual Design and Construction may not be requirements for every AEC firm, tools such as workflow automation, document management, and change management are basic needs of every project-based business. The added visibility and control afforded by enterprise level project management tools can directly impact the profitability of projects and the businesses that rely on them for growth and profit.
www.aberdeen.com Fax: 617 723 7897
2010 Project Management Report: AEC Industry Page 18
© 2010 Aberdeen Group. Telephone: 617 854 5200
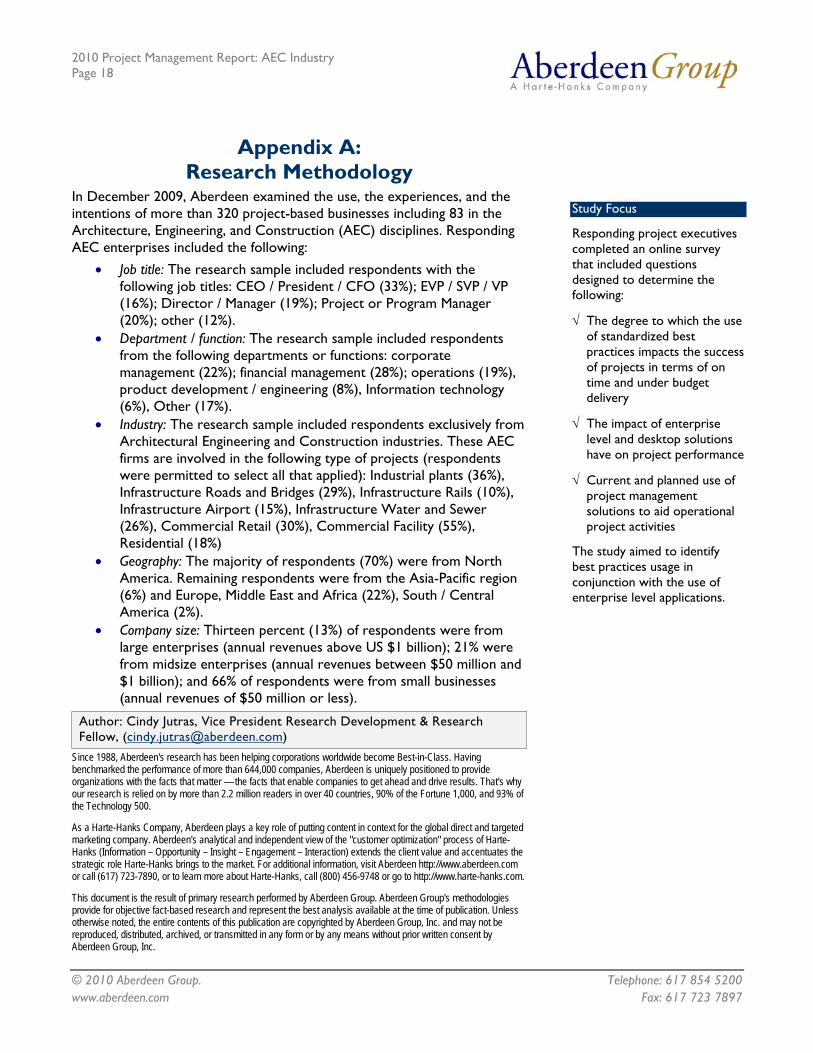
Appendix A: Research Methodology
In December 2009, Aberdeen examined the use, the experiences, and the intentions of more than 320 project-based businesses including 83 in the Architecture, Engineering, and Construction (AEC) disciplines. Responding AEC enterprises included the following:
Study Focus
Responding project executives completed an online survey that included questions designed to determine the following:
√ The degree to which the use of standardized best practices impacts the success of projects in terms of on time and under budget delivery
√ The impact of enterprise level and desktop solutions have on project performance
√ Current and planned use of project management solutions to aid operational project activities
The study aimed to identify best practices usage in conjunction with the use of enterprise level applications.
• Job title: The research sample included respondents with the following job titles: CEO / President / CFO (33%); EVP / SVP / VP (16%); Director / Manager (19%); Project or Program Manager (20%); other (12%).
• Department / function: The research sample included respondents from the following departments or functions: corporate management (22%); financial management (28%); operations (19%), product development / engineering (8%), Information technology (6%), Other (17%).
• Industry: The research sample included respondents exclusively from Architectural Engineering and Construction industries. These AEC firms are involved in the following type of projects (respondents were permitted to select all that applied): Industrial plants (36%), Infrastructure Roads and Bridges (29%), Infrastructure Rails (10%), Infrastructure Airport (15%), Infrastructure Water and Sewer (26%), Commercial Retail (30%), Commercial Facility (55%), Residential (18%)
• Geography: The majority of respondents (70%) were from North America. Remaining respondents were from the Asia-Pacific region (6%) and Europe, Middle East and Africa (22%), South / Central America (2%).
• Company size: Thirteen percent (13%) of respondents were from large enterprises (annual revenues above US $1 billion); 21% were from midsize enterprises (annual revenues between $50 million and $1 billion); and 66% of respondents were from small businesses (annual revenues of $50 million or less).
Author: Cindy Jutras, Vice President Research Development & Research Fellow, ([email protected])
Since 1988, Aberdeen's research has been helping corporations worldwide become Best-in-Class. Having benchmarked the performance of more than 644,000 companies, Aberdeen is uniquely positioned to provide organizations with the facts that matter — the facts that enable companies to get ahead and drive results. That's why our research is relied on by more than 2.2 million readers in over 40 countries, 90% of the Fortune 1,000, and 93% of the Technology 500.
As a Harte-Hanks Company, Aberdeen plays a key role of putting content in context for the global direct and targeted marketing company. Aberdeen's analytical and independent view of the "customer optimization" process of Harte-Hanks (Information – Opportunity – Insight – Engagement – Interaction) extends the client value and accentuates the strategic role Harte-Hanks brings to the market. For additional information, visit Aberdeen http://www.aberdeen.com or call (617) 723-7890, or to learn more about Harte-Hanks, call (800) 456-9748 or go to http://www.harte-hanks.com.
This document is the result of primary research performed by Aberdeen Group. Aberdeen Group's methodologies provide for objective fact-based research and represent the best analysis available at the time of publication. Unless otherwise noted, the entire contents of this publication are copyrighted by Aberdeen Group, Inc. and may not be reproduced, distributed, archived, or transmitted in any form or by any means without prior written consent by Aberdeen Group, Inc.
www.aberdeen.com Fax: 617 723 7897