2010 state technology needs assessment · 2010 state technology needs assessment ... executive...
TRANSCRIPT
Raggio Research Center for STEM Education at the University of Nevada
2010 State Technology Needs Assessment Report to the Nevada Commission on Educational Technology & the Nevada Department of Education
Jacque Ewing-Taylor, Projects Director Laurie McKinnon, Project Coordinator College of Education 6/1/2010
2
Table of Contents
Tables...................................................................................................................................................... 3
Figures .................................................................................................................................................... 3
Executive Summary ................................................................................................................................. 5
Purpose ................................................................................................................................................... 7
Needs Assessment Design ....................................................................................................................... 7
Teacher Survey ............................................................................................................................ 8
Technology Coordinators’ Survey ................................................................................................ 8
Interviews ................................................................................................................................... 8
Parent Survey .............................................................................................................................. 9
Other Data Sources ..................................................................................................................... 9
Results .................................................................................................................................................... 9
Organization ............................................................................................................................... 9
District Categories ....................................................................................................................... 9
Technology Plans ................................................................................................................................... 10
District Technology Plans .......................................................................................................... 10
State Technology Plan ............................................................................................................... 11
Technology Plan Impact ............................................................................................................ 12
Funding & Guidance .................................................................................................................. 12
Other States .............................................................................................................................. 13
Computer-Based Testing in Nevada ....................................................................................................... 14
Kansas ...................................................................................................................................... 15
Florida ...................................................................................................................................... 16
Virginia ..................................................................................................................................... 17
Nevada ..................................................................................................................................... 18
Educational Technologies Improving Instructional Development and Delivery ....................................... 19
Expanded Use of Laptop Computers .......................................................................................... 20
Internet Use .............................................................................................................................. 22
General Observations ................................................................................................................ 23
Current Capacity of Nevada Schools ...................................................................................................... 23
Survey Results ........................................................................................................................... 23
Technology Coordinator Surveys ............................................................................................... 24
Technology Coordinator Survey Results ..................................................................................... 24
3
Teacher Surveys ........................................................................................................................ 31
Nevada Classrooms ................................................................................................................... 32
Schools ..................................................................................................................................... 35
Technical Support: .................................................................................................................... 39
Frequency of Technology use: ................................................................................................... 41
Preparation and Professional Development ........................................................................................... 45
Technology Coordinator Responses ........................................................................................... 45
Preparation ............................................................................................................................... 46
Professional Development ......................................................................................................... 46
Parent Surveys ...................................................................................................................................... 53
Appendices ............................................................................................................................................ 56
Appendix A- Letters to Superintendents, IT Coordinators, Principals, Teachers, Parents ............ 57
Appendix B- Technology Coordinator Survey ............................................................................. 65
Appendix C– Teacher Survey ..................................................................................................... 68
Appendix D- Parent Survey........................................................................................................ 75
Appendix E – IT Coordinators’ Interview Protocol ...................................................................... 76
Tables
Table 1 District Size Definitions .............................................................................................................. 10
Table 2 Number of Respondents by District and Category ..................................................................... 24
Table 3 Responses to “Describe a common low-end, middle-end, and high-end classroom that a visitor might see in your district.” ........................................................................................................ 25
Table 4 Comparison of STNA 2008 and 2010 Reports on Technology Available via Check Out System .... 39
Table 5 Teacher Preparation in Comparison to 2008 .............................................................................. 46
Table 6 Professional Development Opportunities Compared to 2008 .................................................... 47
Figures
Figure 1 Age of Teacher Computers ....................................................................................................... 32
Figure 2 Responses to “Which of the following technology equipment do you have in your classroom all the time statewide?” ................................................................................................................ 32
Figure 3 Responses to “Which of the following do you have in your classroom all of the time as responded by large, medium and small districts?” .................................................................... 33
Figure 4 Number of Students Per Computer during a Typical Class ........................................................ 34
Figure 5 Classroom Internet Speed is Such that Online Videos begin playing.......................................... 34
Figure 6 Comparison of Washoe County SD and Clark County SD: Classroom Internet Speed is such that Online Videos Begin Playing ...................................................................................................... 35
4
Figure 7 Responses to “Which of the following do you have in your classroom all of the time?” ............ 36
Figure 8 Responses to "Which of the following do you have in your classroom all of the time?" ............ 36
Figure 9 Comparison by School Districts: Which of the following do you have in your classroom all of the time. ......................................................................................................................................... 37
Figure 10 Responses to "Teacher can Sign up/Check-out Technology for a Finite Time in Classroom." ... 38
Figure 11 Comparison by School Districts: Responses to “What technology equipment can you arrange to have in your classroom for a finite time.” .............................................................................. 38
Figure 12 Responses to "Time Required to Get Technical Assistance is Minimal." .................................. 39
Figure 13 Responses to "There is an Adequate System for Technical Support." ...................................... 40
Figure 14 Comparison between Clark County and All Other Districts: "Time required to Get Technical Assistance is Minimal." ............................................................................................................. 40
Figure 15 Comparison of Clark County teachers and teachers from all other districts of the teacher ratings to "What is your level of agreement with the current system for technical support." .... 41
Figure 16 Responses to “Of the most recent 60 minutes of Class Time, Did Students use the Computer for Instructional Purposes?” ...................................................................................................... 43
Figure 17 Responses to "During the most recent 60 minutes of classroom time, the number of Students that used computers." .............................................................................................................. 44
Figure 18 Responses to "How many days since the beginning of school has a typical student used a computer for instructional purposes?" ...................................................................................... 44
Figure 19 Responses to "How would you rate the quality of the technology related professional development opportunities offered by the following entities?" ................................................ 47
Figure 20 Responses to “Quality of Professional Development-District"................................................. 48
Figure 21 Responses to “Quality of Professional Development-Higher Education Institutions" ............... 48
Figure 22 "Responses to “Quality of Professional Development-RPDP" .................................................. 49
Figure 23 Responses to “Quality of Professional Development-School Site" ........................................... 49
Figure 24 Eureka County School District responses to "Quality of the technology related professional development opportunities offered." ........................................................................................ 50
Figure 25 Lyon County School District responses to "Quality of the technology related professional development opportunities offered." ........................................................................................ 51
Figure 26 Carson City School District responses to “Quality of the technology related professional development opportunities offered.”........................................................................................ 52
Figure 27 Lyon County School District responses to “Quality of the technology related professional development opportunities offered.”........................................................................................ 53
5
Executive Summary
Nevada’s schools have technology levels that are not insignificant and those levels are increasing.
Unfortunately, so is the age of the computers in the schools. While 99.6% of classrooms have at least
one computer, 74% of them are between four and ten-plus years old. In spite of gains since the last
needs assessment (2008), Nevada’s classrooms remain unable to leverage sufficient technology to focus
on student-centered instruction that utilizes technology. Only 20% of responding teachers said that their
classrooms have more than three computers for students to use. However, 54% have a projection
device in their classroom and 42% responded that they have laptop carts available for their classrooms,
up from 31% in the 2008 survey.
Respondents generally still agree that they are prepared to use technology and that there is an
adequate system for technical support. Although most of the teachers were neutral when responding to
a question about professional development, many rated those programs moderately low and cited lack
of time available as the biggest obstacle to training. Technology Coordinators feel that many teachers
still view technology as an “add-on” rather than a tool that enhances learning. They also still
acknowledge many challenges to implementing professional development, including funding,
substitutes for teachers, and district support.
Parents are generally very supportive of their children’s use of technology especially as it might translate
into 21st Century job skills, and they feel that classroom technology is critical to their child’s success later
in life. They are, however, somewhat unclear as to what technologies their children are learning and
why and would like to know more. Many respondents commented that they wanted their children to
learn to think critically about Web content and understand proper use of information found on the
Internet. Most parents said that there is inadequate funding for technology and that current classroom
technology is out of date and substandard. As one Clark County parent said: “We need so much more
access. We are raising tech savvy kids and we are putting them in old fashioned classrooms. Our world is
changing and public education needs to keep up with the times.”
Planning continues to be seen as critically important and Technology Coordinators say they look to the
Nevada Department of Education (NDE) to lead in technology planning, complimenting the staff for the
process and outcomes of revising the State Technology Plan last year. Many also acknowledged the help
they have received from the NDE staff in their district-level planning processes. Most districts try to
6
model their plans after the state’s newly revised plan but say that funding will keep many of their plans
from being realized.
Changing Federal policy regarding online testing means that Nevada will have to devote significant
resources in the next two biennia and speed up its online testing preparation in order to make the 2013-
2014 deadline for fully operational field testing, and the 2014-2015 mandatory start date. Failure to
adequately plan and prepare for the impending implementation of online testing will result in
significantly increased costs for Nevada. Although the current paper-and-pencil testing will be allowed
until the 2016-2017 school year, there will then be a per-pupil fee assessed as a way to penalize those
states not using online testing. This is in addition to the costs of the on-line testing, meaning that
Nevada would pay for every student to be tested online and then pay again for every student to take a
paper-and-pencil test if the state’s online testing system is not functional in all counties. The costs to
Nevada for that could be over $20 million. Planning for implementation and allocating appropriate
funding in the upcoming 2011 legislative session are crucial steps in this effort. The time is ripe to
address this issue and to plan for the change, thus ensuring a minimally disruptive and maximally
efficient implementation.
Nevada’s classrooms remain in great need of support at all levels for consistent and increased funding,
significant high-quality and prolonged professional development for teachers, and technologies that
actively engage students in learning and allow for computer-based testing. Many teachers commented
about the age of the equipment and the infrastructure, saying that they were being asked to prepare
students for 21st Century jobs with 20th Century equipment. As one teacher put it “I don’t even have
enough electrical outlets in my classroom, much less up-to-date technology!” and another said “I am
frustrated! I have so many great ideas for integrating technology and can't pursue these.”
7
Purpose
The purpose of this document is to present the findings of the 2010 State Technology Needs Assessment
(STNA) for Nevada schools and districts. The needs assessment was guided by the requirements set
forth in SB184 (sections 19.1d, 19.6a-b, and 27.1-27.3) and by the first needs assessment conducted in
2008. The following research questions were developed in 2008 to address these requirements and
remain the guiding questions in 2010.
1. What is the current status of the state and district educational technology plans?
2. In what ways can educational technologies, such as computer-based assessments, laptop computers and Web-based tools, improve instructional development, delivery, and assessment in Nevada?
3. What is the current capacity of schools in Nevada to positively impact the achievement of students through the use of educational technologies?
4. How prepared are Nevada teachers to integrate technology into the classroom?
Needs Assessment Design
It should be noted at the outset that funding for this year’s STNA is 50% of what it was in 2008 and the
timeline was compressed by several weeks, resulting in fewer resources being available to conduct the
study and prepare the report. The result is a report that lacks some of the depth of the previous report
but that nonetheless contains the full breadth of data collected. As with every public enterprise in the
state, we do with less. The 2010 surveys were composed of the same questions as the 2008 surveys for
consistency of data and so that comparisons between the years could be made. The protocols were
submitted to the University of Nevada, Reno’s Institutional Review Board (IRB) in the Office of Human
Research Protection (OHRP) and the project was deemed exempt from IRB oversight. All school district
superintendents were e-mailed and faxed an introductory letter so they were aware of the process and
of what information would be requested (Appendix A). A letter was also sent to school principals
explaining the process and the surveys and asking for their assistance with the parent surveys (Appendix
A). Technology Coordinators were sent copies of these introductory letters and subsequent survey links
(Appendix A) and were also contacted by phone. This step was designed to ensure that e-mails that
were being sent to teachers would actually be delivered past the districts’ firewalls. Four Technology
8
Coordinators were also personally interviewed. The surveys were then sent to the teachers (Appendix
C) and responses were collected over two and one half weeks.
Teacher Survey
The 39 items on the teacher survey used for the 2010 needs assessment were the same as those
answered by the teachers in the 2008 survey (Appendix C), and districts were separated by student
population size as in the previous survey. In districts with 2,000 or fewer students, all teachers were sent
the letter inviting them to take the survey. In districts of 2,000-20,000 students, 300 teachers were
selected from elementary, middle, and high schools for a total of 900 teachers. In the large districts of
20,000 or more students, 20% of the teacher workforce was invited to participate in the survey by
random selection. Teachers selected were given a district-specific link to Survey Monkey
(http://www.surveymonkey.com) where they responded to the survey questions. The data were
collected anonymously and aggregated by district. Of the 3,272 teachers invited to respond to the
surveys, 1,912 completed the surveys, a response rate of 58.4%. Questions designed to determine
technology capacity of classrooms, schools, and districts included items such as: Do you have an LCD
projector in your classroom? and Do you have computers that students can use? Questions that were
intended to gauge preparation and professional development included: How would you rate the quality
of the professional development opportunities provided by your district? and How well prepared are you
to integrate technology into the classroom?
Technology Coordinators’ Survey
All district Technology Coordinators were asked to respond to a 27-item, Web-based questionnaire.
Most of the questions were open-ended and focused on technology planning, classroom capacity,
school resources, teacher preparation, and professional development. Of the 17 possible respondents,
15 completed the survey. The items in this survey can be found in Appendix B.
Interviews
A very limited number of interviews were conducted this year due to budget constraints. The interviews
of district Technology Coordinators occurred in Carson City in conjunction with the meeting of the
Commission on Educational Technology (CET). The interview questions are listed in Appendix E.

9
Interviews with a large group of personnel from the NDE who are responsible for testing and with
representatives from Measured Progress, the state’s testing vendor, were done via teleconference.
Parent Survey
Due to the difficulty in obtaining contact information for and survey information from parents, the
school site principals were asked to provide assistance (Appendix A). It was suggested that they send out
the survey link via school/classroom letters, school-wide activities where a shared computer or
computer lab could be made available, PTA meetings, or school club and athletic event rosters. In all,
264 parents from seven districts responded to the survey. Initially, Clark County parents were not
invited to participate because the district was in the process of conducting a parent survey on other
topics and it was felt that asking for a response to a second survey would damage the response rate to
the first survey. However, the parent survey was later opened for 10 days and the link to the survey
provided via Clark County’s online system. The parent survey questions can be found in Appendix D.
Other Data Sources
Data from the newly revised state technology plan and district technology plans are included in this
report.
Results
Organization
The results reported herein are organized by the research questions. First is a snapshot of the
technology plans of both the state and the districts and some thoughts on technology planning. The next
section addresses the findings regarding specific initiatives. The third section addresses the questions
regarding teacher preparation and professional development in technology integration.
District Categories
Assessing and describing the technology needs of a state as large and diverse as Nevada is challenging.
The diverse nature of our state is evidenced by its geography, economics, and the great variations that
10
exist in the state’s districts and schools. The unique needs of each district, school, and classroom are
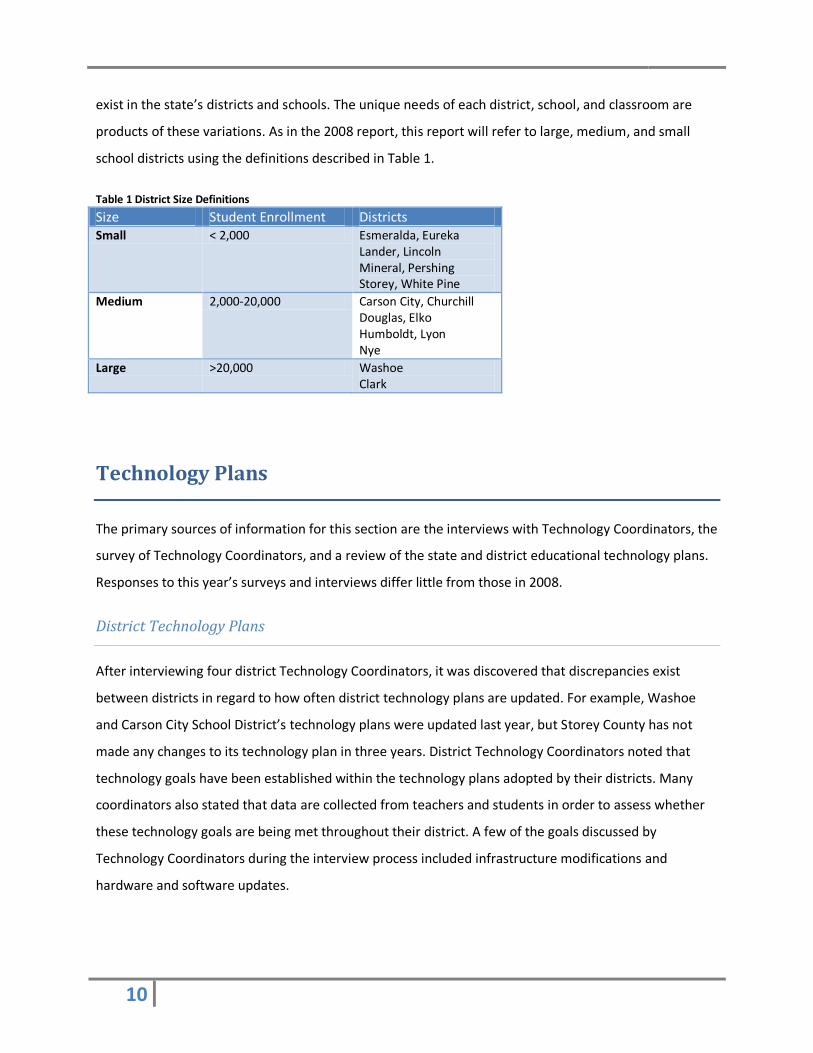
products of these variations. As in the 2008 report, this report will refer to large, medium, and small
school districts using the definitions described in Table 1.
Table 1 District Size Definitions
Size Student Enrollment Districts Small < 2,000 Esmeralda, Eureka
Lander, Lincoln Mineral, Pershing Storey, White Pine
Medium 2,000-20,000 Carson City, Churchill Douglas, Elko Humboldt, Lyon Nye
Large >20,000 Washoe Clark
Technology Plans
The primary sources of information for this section are the interviews with Technology Coordinators, the
survey of Technology Coordinators, and a review of the state and district educational technology plans.
Responses to this year’s surveys and interviews differ little from those in 2008.
District Technology Plans
After interviewing four district Technology Coordinators, it was discovered that discrepancies exist
between districts in regard to how often district technology plans are updated. For example, Washoe
and Carson City School District’s technology plans were updated last year, but Storey County has not
made any changes to its technology plan in three years. District Technology Coordinators noted that
technology goals have been established within the technology plans adopted by their districts. Many
coordinators also stated that data are collected from teachers and students in order to assess whether
these technology goals are being met throughout their district. A few of the goals discussed by
Technology Coordinators during the interview process included infrastructure modifications and
hardware and software updates.
11
When asked how closely the technology plans in their district mirror the state technology plans, a large
majority of Technology Coordinators stated the technology plans adopted within their districts are
aligned with those of the state. Many of the Technology Coordinators surveyed described the use of a
technology committee as the main source of district technology planning. The technology committees
described typically consist of representatives from each school in the district. Technology committees
specific to each school were also mentioned by a few coordinators, noting that these committees
reference both the state technology plans and the district plans created by the district technology
planning committee when forming the technology plans for their school.
In regard to technology plan integration, the Technology Coordinators interviewed stated that
integration plays a large role in technology implementation within their district. For example, Carson
City School District currently provides professional development opportunities for its educators in order
to increase successful technology plan integration in the classroom. One of the coordinators interviewed
discussed the establishment of a curriculum software committee within his district, in order to provide
support to teachers within his district.
State Technology Plan
The State Educational Technology Plan was revised following the 2008 needs assessment. The NDE went
through a lengthy process to revise the plan, calling on experts from both outside and inside the state
including the International Society for Technology in Education (ISTE), the Nevada Commission on
Educational Technology (CET), the Nevada System of Higher Education (NSHE), rural and urban Nevada
businesses, the Nevada Parent Teacher Association, and the Corporation for Public Broadcasting. ISTE
provided facilitators to help guide the process. The result is a comprehensive, up-to-date plan to guide
Nevada through the next five years, aligned with the ISTE’s National Educational Technology Standards
for Administrators (NETS-A), for Students (NETS-S), and for Teachers (NETS-T). With this task
accomplished, Nevada’s Educational Technology Plan can provide guidance to the districts as they
revise, expand, and update their own plans, and can provide a common foundation upon which intra-
state collaborations can be built. The 16-district Pathway to Nevada’s Future project, funded through
the American Recovery and Reinvestment Act (ARRA), is an excellent example of collaborations that can
be fostered when there are common goals and standards.

12
Technology Plan Impact
A problem mentioned by many coordinators involved the assessment of achievement impact within
their district. Many coordinators noted that achievement is hard to measure, due to the fact that
multiple programs are implemented within their district, making it difficult to decipher whether
measured success can be attributed to technology integration. One coordinator stated that the data
collected on district-wide achievement is sent to a statistician to be analyzed; therefore the impact of
the district technology plan on achievement is unknown at this time.
Technology Coordinators also stated that professional development is needed in order to ensure that
both state and district technology plans are implemented in every classroom. One coordinator believes
that providing technology instruction across the state will foster technology literacy and efficacy among
Nevada educators, but also notes the difficulties faced by the state and the districts when it comes to
providing professional development opportunities.
Finally, one coordinator described the struggle faced by teachers to keep up with the continuing
changes in technology, while still being asked to use the skills and tools available to implement the
technology plans created by their district. Problems with technology access, maintenance, and updates
will be discussed later in this document, but it is important to note that without the proper support, the
level of impact of the district technology plans within schools across the district will be difficult to
measure.
Funding & Guidance
In response to the surveys distributed, Technology Coordinators indicated that a lack of funding was the
biggest challenge faced by many of the districts across Nevada. A few districts described plans to apply
for grant funding in order to purchase updated software and hardware for their students, as well as
funding for repairs on technology equipment that is currently in use and bandwidth upgrades for
schools. A large majority of the Technology Coordinators surveyed indicated that while state technology
guidelines are being used as a reference for most districts, it is difficult to implement many of these
standards without adequate funding.
When asked about the major sources of funding for technology in each district, Technology Coordinators
repeatedly stated that funding for such endeavors is increasingly inconsistent. Many districts rely on

13
grant and bond funding, which is very limited. In addition, Technology Coordinators referenced the
Enhancing Education Through Technology (EETT) funding (Federal pass-through) as a source for financial
support for district technology use, but since a portion of this source is also formula-funded, the
monetary amounts provided to each district are both limited and unreliable. The EETT funds that are
awarded as competitive grants are small and it is difficult for small districts to compete. Based on the
limited amount of financial support each district receives, it was noted by one Technology Coordinator
that the task required of most districts is to find a balance between the students’ technology needs and
what funding can provide. Many of the coordinators surveyed expressed the need for adequate funding
not only to purchase updated technology, but also to sustain technology support and professional
development in technology integration.
For guidance, many Technology Coordinators look to Nevada’s State Technology Standards. Many
districts also rely on technology committees consisting of representatives from each school in the
district to discuss technology planning for their district. The consistency of technology committees
meeting times differ from district to district (e.g., one district has their technology committee meet
twice a year, while another district has their technology committee meet once every four years), but
each committee is typically responsible for the technology planning for the district and informing
teachers within the district of staff technology development opportunities.
A review of the 2008 report shows that little has changed and the same comments and concerns
expressed this year were also expressed then. The Technology and Innovative Programs office remains
understaffed in comparison to other states’ offices. As with the 2008 report, a full review of the staffing
levels of educational technology offices in other state departments of education is beyond the scope of
this project, but a review similar to the one conducted in 2008 reveals that the staffing levels are
insufficient for fulfilling the support needs of Nevada’s 17 school districts, as well as the necessary
functions required of Nevada Department of Education.
Other States
Many states have developed state technology plans in order to facilitate student learning through the
use of technology and to provide adequate and efficient technology-focused professional development
opportunities for instructors. It is important that educators continue to learn about and utilize the many
resources for support available to them on the Internet.
14
Many states have used the ISTE’s standards as the basis for the technology plans adopted and
implemented by their state. The national technology standards set by ISTE address basic goals that need
to be met by students, teachers, and administrators, as well as appoint specific indicators that suggest
proficient advancement toward these goals.
Computer-Based Testing in Nevada
Computer-based high-stakes testing is inevitable. The Federal government gave a Notice of Intent in
April of this year that computer-based testing will be in place by the 2013-2014 school year. By the
2015-2016 school year, states that have not fully implemented computer-based testing will have to pay
twice: once for the paper-and-pencil tests and once for the computer-based tests. This would effectively
double Nevada’s costs from the current $9 million per year to approximately $18 million per year if
computer-based testing is not fully implemented. It is therefore critical that Nevada plan and begin to
prepare now and that the 2011 Legislature budget for the process. Waiting until the 2013 session would
leave insufficient time to meet the deadline.
Two consortia have been formed nationally to affect this change to current testing practice. One is
developing online testing and the other is developing computer-adapted testing. Both systems will be
fully operational by the 2013-2014 school year. Any software used must be open-source so there will be
no software costs. There will, however, be costs associated with needed hardware, especially since so
many of Nevada’s school computers are so old and, in Clark County’s case, the computer labs are so
heavily used by classes that they are not available for testing.
Large scale efforts are underway to convert high-stakes testing from paper-and-pencil methods to
computer-based testing in North Carolina, South Carolina, Indiana, Oregon, Idaho, California, and
Massachusetts. Three of these states have completed the conversion or are within a couple of years of
converting to 100% computer-based high-stakes testing and their experience is useful to see how
Nevada might deal with some of the issues surrounding the conversion . Kansas has met its goal of 100%
computer-based testing, Florida anticipates 100% by the 2010/2011 testing year, and Virginia
anticipates a 100% conversion by the 2012/2013 testing cycle.
15
Kansas
The State of Kansas, in conjunction with the Center for Educational Testing and Evaluation, School of
Education at the University of Kansas, developed a comprehensive online assessment program for high-
stakes testing, designed to meet the requirements of the federal No Child Left Behind (NCLB)act. The
Kansas Computerized Assessment (KCA) is administered to all students in Kansas, with the exception of
those students needing accommodations.
One of the challenges Kansas encountered was the task of student tracking. Students in the Kansas
school system must be entered into the Kansas Department of Education tracking system in order to
take the computer-based exam. If students are not in the tracking system, they must take paper and
pencil exams, and are not counted for AYP accountability. Students who are not in the tracking system
will count against the school for participation and/or performance. Kansas addressed this issue by
assuring that the schools know the dates by which each student must be in the tracking system and by
sending reminders to districts and schools regarding the importance of getting all students’ information
entered.
Lack of student and teacher familiarity with the testing procedures presented another challenge for
Kansas. Early in the transition to computer-based testing, there was some concern that the teachers and
the students would not have adequate computer skills or would have difficulty using the software.
Online tutorials for teachers and students, as well as practice tests given to students in order to
familiarize them with the computer-based testing process have adequately dealt with these issues.
Other challenges faced by Kansas are the infrastructure, hardware, and technology base. The largest of
this subset of challenges is monetary. Each district must find money for the computers used for testing;
the state does not provide any funding for the KCA. Because each district and school must supply their
own computers, some of them do not have enough hardware to test all of the children at the same
time, which then necessitates a larger assessment window in order to accommodate all students.
Additionally, specific software is needed to run the assessment, and each computer must be updated
with the newest version prior to the testing session. Computers must also be capable of running the
software and therefore must be updated for compatibility. One of the potential technology-based
challenges is the possibility of a power outage or loss of internet connection during testing. There was
no evidence that either of these had ever occurred, however, in the event that one or both of these
events should happen, the software automatically saves and can be restarted with the entry of a

16
password. Schools and districts are instructed to plan for this eventuality and allow for up to two extra
testing days.
Although there have been some challenges, Kansas reports many benefits as well. The cost savings of
using a computer-based testing system are one very large benefit. Although only one savings figure is
mentioned ($350,000 per year in printing costs), other financial benefits mentioned are savings in
postage, scoring, and reporting costs that are associated with paper-and-pencil tests. A significant
benefit is the availability of the results almost immediately after testing which enables teachers to use
the results for immediate curriculum planning and to address student needs much more quickly and
effectively. Teachers also see benefits in the testing procedures; they can track student performance as
the students take the tests, allowing the teachers to track those students who may not have taken or
finished a test and then arrange for the student to complete the sections they missed, resulting in more
complete and reliable data.
Florida
Florida also has a comprehensive computer-based high-stakes testing system and as with Kansas, they
have seen both challenges and benefits. Florida anticipates that the Florida Comprehensive Assessment
Test (FCAT) will be 100% computer-based by the 2010/2011 testing year.
As with Kansas, Florida anticipated issues with teacher and student familiarity with computers and the
computer-based testing procedures. This was addressed by offering training and practice sessions for
both students and teachers. The training was in the form of both online tutorials and hands-on training
by trainers sent to the districts/schools by the testing vendor.
Florida also has issues with testing facilities, specifically they are attempting to address a shortfall in
adequate space for testing, lighting, and privacy issues (keeping monitors secure). As with Kansas, one of
the major issues is funding. They are examining the use of bonds or other methods to help implement
the FCAT computer-based testing statewide. In order to address possible technical needs, Florida works
very closely with their testing vendor for technical support. A comprehensive checklist and manual are
provided to technology departments in each district that outline the exact requirements that must be
met for testing. Field tests are performed, and a technical support team for training of personnel and
set-up of the testing system is provided by the vendor.
17
Florida lists many benefits for the computer-based testing and although they do not discuss specific
numbers when addressing the cost benefits, they list the same types of savings as does Kansas. The
majority of savings for Florida come from printing, postage, scoring, and reporting. This is a common
finding in all of the states that have moved toward computer-based testing. Florida also found that their
students are very enthusiastic about computer-based testing. They find that both students and teachers
give very positive feedback regarding the process and that buy-in is excellent. Florida is especially happy
with the faster scoring and reporting of test results. This is especially advantageous because scoring and
reporting can be done more efficiently, allowing for more instruction time before testing occurs and
teachers have more opportunity to assure that students are introduced to concepts that will be tested.
Virginia
Of the states discussed here, Virginia seems to have the best plan to convert to 100% computer-based
high-stakes testing and plans to be 100% by the 2012/2013 testing year. In 2000, the Standards of
Learning Technology Initiative (STLI) was implemented. This initiative was created in order to meet their
goals of, (1) one computer for every five students; (2) Internet-ready, local area network capability in
every school; and (3) high-speed, high-bandwidth capabilities for instructional, remedial, and testing
needs. These goals are anticipated to be met by 2013.
Due to implementation of STLI, the only challenge Virginia anticipates is the lack of student and teacher
familiarity with computer software and equipment. This challenge is being addressed with help from the
testing vendor, who has made online tutorials and practice tests available to students and teachers.
Virginia sees many more benefits than challenges for the conversion from paper-and-pencil to
computer-based testing including a faster return of student scores, increased instructional and
remediation time due to timely return of student results, improved efficiency of data collection and
management, increased accuracy of student data, increased security of test content and student data,
reduced administrative burdens on school and division staff, and increased student interest. There is no
direct discussion of the cost savings benefits but this may be due to the fact that they began their
conversion in 2000, making it difficult to locate that information.
These three states discussed here have all faced and overcome challenges and reaped many benefits
from their conversion from paper-and-pencil high-stakes testing to computer-based testing. Many issues
are common among them, such as the concern that teachers and students may have difficulty with
18
computer software and equipment, and each has addressed this concern. Both Florida and Kansas have
experienced funding issues. However, it seems that the implementation of a solid, well thought out plan
up-front, such as the Virginia STLI, helps to address the funding issues, as well as some of the challenges
that states find as they move through the conversion process.
The states also seem to find the same benefits: cost savings from the reduction or elimination of
printing, postage, scoring, and reporting of the paper-and-pencil tests; student enthusiasm and teacher
buy-in for the new testing process; and the significant benefits of increased efficiency in scoring and
reporting which facilitates instruction on many levels.
Nevada
Currently, 14 of Nevada’s 17 school districts use some form of computer-based testing. The exceptions
are Washoe and Clark County School Districts. District technology coordinators were asked about the
opportunities and challenges associated with computer-based testing in their districts. They identified
current infrastructure and access to adequate technology as the largest challenges faced by their
districts, not unlike the experiences of Kansas, Florida and Virginia. Many coordinators noted the lack of
computer lab availability, poor Internet access, and inadequate bandwidth capabilities as significant
impediments to implementing computer-based testing. Training for teachers was also noted as
necessary but lacking.
The technology coordinators from districts where some computer-based testing is being done stated
that Measure of Academic Progress (MAP) testing has been successful and has been favorably received
by the students in their district. The main concern for implementing this type of testing, however, is
ensuring that sufficient resources are available to successfully put this assessment strategy into practice.
When asked about their thoughts on using computer-based testing for high school proficiency exams,
many of the technology coordinators interviewed stated that they did not see any problems associated
with using this method of testing but did see many advantages. Examples of potential advantages to this
technology application included instant results, a controlled environment, a decrease in the chances of
student cheating, and a decrease in paper use. Many coordinators noted that this type of test taking
would be very beneficial for high school students, who tend to be proficient in technology by the time
they take their high school proficiency exams. Some of the disadvantages noted were lack of
technological capabilities within their district (i.e. there may not be enough computers available to

19
accommodate all of the students that will need to take the exam), a potential for technology failure, and
a lack of software needed in order to support this type of testing within the districts. Again, all are issues
mentioned by Kansas, Florida and Virginia, and all were eliminated as significant barriers to the adoption
of computer-based testing.
A review of this same section in the 2008 needs assessment report reveals that little, if anything, has
changed. Significant barriers to computer-based testing remain in all districts in spite of almost universal
enthusiasm for it. Technology coordinators were optimistic then and now about the potential for using
computer technology in this way, but none were optimistic that the requisite infrastructure would be in
place any time soon. Utilizing technology in the testing process provides students with technology
interaction opportunities and provides teachers with a resource that yields fast and accurate student
data from which they can base changes in curriculum to better prepare their students. Data-driven
decision-making is increasingly demanded of teachers and administrators, and computer-based testing
allows teachers to analyze and respond to student progress in a timely and efficient manner. In addition
to convenience and accuracy, computer-based testing also allows for reduction in paper use, printing
costs and postage associated with paper tests.
In that computer-based testing will be here in 2013, Nevada must begin planning now so that districts,
schools, teachers, technology coordinators, and students are well prepared to take advantage of the
benefits and minimize the problems. One of the suggestions made to consider for implementation is to
invest heavily in laptops so that each student has access to one. The new netbooks are inexpensive and
yet sufficiently powerful for testing and the success of one-to-one laptop initiatives such as Maine’s
show that they are well worth the investment. With prices in the $200-$400 range, several netbooks
could be purchased for the price of one desktop machine.
Educational Technologies Improving Instructional
Development and Delivery
Technology integration into the curriculum at all grade levels is a goal that is supported statewide, as
well as nationally, by legislators, administrators, educators, parents, and students alike. In order to
encourage and facilitate this process, the state of Nevada must take the necessary steps to foster
technology efficacy among its teachers so they can provide their students the 21st Century technology
20
skills needed to succeed. The purpose of this section is to focus on specific technological needs stated by
the technology coordinators surveyed and the role laptop computers and Web-based collaborative
technologies have in education.
Expanded Use of Laptop Computers
When asked about the opportunities and challenges associated with the expanded use of laptops by
students and teachers, a majority of the technology coordinators stated student engagement and their
acquisition of current technology skills as the greatest opportunities presented by laptop computer use.
Many of the technology coordinators that were interviewed discussed the availability of laptop carts in a
majority of the schools within their district. One coordinator also referred to the use of the iPod Touch,
noting that many schools within his district had access to two per classroom. The coordinators
interviewed also stated that laptop use within the classroom has encouraged student collaboration
during class time.
When questioned about challenges presented by increased laptop use, many coordinators cited
inadequate funding, lack of wireless Internet access, and proper technology support. Two coordinators
even stated that guaranteeing the security of the laptops would present problems within their districts.
One coordinator stated that each district should keep in mind that while this type of technology
integration might benefit some, it may not benefit others.
The increase in use of laptop computers in some Nevada school districts has provided more
opportunities for teachers and students to successfully combine education with technology. One of the
benefits to increasing laptop use and access among teachers and students is the potential transition
from traditional textbooks to electronic textbooks. The technology coordinators surveyed gave mixed
responses when asked their opinion on the increase in laptop use to facilitate the replacement of
textbooks. Some stated that this change would most likely be embraced by teachers and students alike,
while others stated that many teachers in their district would most likely struggle with the technological
replacement of textbooks. Coordinators addressed some of the issues that the switch from hard copy to
electronic textbooks would present, such as a lack of funding for the purchase of electronic books,
finding an electronic source that has quality educational material, and the technical support needed in
order to implement this transition.
21
Technology coordinators interviewed indicated that many teachers in their districts have inquired about
using electronic textbooks, which has urged coordinators to research electronic textbooks and their
impact in the classroom. One coordinator mentioned that electronic textbooks were introduced in high
school technology classes within his district, but it was discovered that making the transition from
bound textbooks to electronic textbooks does not save the district any money at this point in time.
However, as electronic textbooks become more in demand, prices will drop. Already we are seeing
prices drop for books on Kindles and iPads, with some titles as low as $5.
Textbook adoption cycles are not currently aligned with changes to state standards resulting in books
being used in classrooms that do not support the standards and money being spent on textbooks that
do not support what students are tested on. The adoption cycle has more to do with which district’s
turn it is and whether or not there is funding. Adopting netbooks would make electronic textbooks
more feasible, would allow adoption cycles to more easily be aligned with changes in state standards
and would more easily enable the conversion to computer-based testing. Again, planning now is the key.
Overall, a large majority of the technology coordinators surveyed agreed that the distribution of laptop
computers to students in their district would have a positive impact on the student population.
According to one coordinator, providing students with laptops also provides them with a way to access
education outside of the classroom. While laptop use may have a positive impact on students,
technology coordinators still addressed potential issues with district-wide laptop distribution, such as
security issues, software and electronic textbook access, and the lack of adequate technology support
for both teachers and students. The most frequent concern among the coordinators surveyed was
student use of the Internet on district-provided laptop computers outside of the classroom. For
example, two coordinators referenced lawsuits in other states that have occurred due to students using
school-provided laptops to access inappropriate materials on the Internet. Many coordinators also
noted that if laptop use within classrooms expanded, many teachers would have to be adequately
trained in order to best educate their students on this type of technology and its wide range of uses.
Many states have adopted laptops extensively and while there are problems such as those mentioned
by the technology coordinators, there are also many benefits for students and the problems have been
managed.
22
Internet Use
In the responses collected, Technology Coordinators stressed the importance of Internet use among
both teachers and students in the classroom. When asked to identify the ways in which teachers can
effectively utilize the Web to support their teaching, coordinators suggested using the Internet as a
research tool for students, a source for posting class materials and assignments, and as a resource for
communication and collaboration with other educators. Many coordinators also noted that the Web can
be used a great source for finding new, innovative ways to teach numerous subjects.
In response to questions regarding Internet use in the classroom, Technology Coordinators listed a
variety of ways that teachers are currently utilizing the Internet in their classrooms and integrating Web-
based materials into their curricula. For example, teachers are using class Web pages to post in-class
assignments and homework. The coordinators surveyed also stated that teachers within their districts
are encouraging students to present material using Smart Boards and to access the Internet to complete
class assignments and research. In addition to in class activities, many coordinators stated that teachers
within their district encourage active learning outside the classroom using the Internet. For example,
two coordinators mentioned the use of blogs, podcasts, and videos as resources for practice tests
students complete at home.
Technology Coordinators also stated that teachers within their districts frequently use the Internet as a
collaboration tool. A majority of the coordinators surveyed indicated that teachers within their districts
rely on the Internet to communicate with other teachers through e-mail, blogs, Web pages, and social
networking sites. Two coordinators discussed the increased use by teachers of the Moodle software and
district-wide wikis, which has increased teacher collaboration within their districts.
When asked to list the greatest challenges associated with Internet use by teachers within their districts,
an overwhelming majority of Technology Coordinators identified inadequate professional development
opportunities as the greatest challenge. Coordinators stated that due to a lack of training, many
teachers do not know how to effectively incorporate Internet use into their curricula. One coordinator
stated that it is impossible for teachers to share online resources with their students when teachers are
not even aware of the resources that can currently be accessed online. Other challenges to Internet use
by teachers provided by the coordinators included strict Internet filters and a lack of adequate software
and virus updates on classroom computers, a lack of funding for the purchase of current equipment, and
limited access to computers.
23
General Observations
Increasing the use of computer-based testing and assessments and putting laptops in classrooms
throughout the state of Nevada would have a positive impact on student technology literacy, would
expand the possibilities of teaching and learning styles within the classroom setting, would enable
adoption of electronic textbooks and would facilitate a textbook adoption cycle that would save money
and align with changes to state standards. However, in order to maximize the use of these types of
technologies, districts would need to be able to provide adequate hardware and software, reliable
access to the Internet, expand bandwidth capabilities, encourage professional development centered on
technology literacy, and provide teachers throughout the district with technological support. There is a
unique timing opportunity right now to critically examine these aspects of educational technology in
Nevada, make changes that serve the students as well as meet the upcoming requirement for computer-
based testing, and do this in carefully examined, planned and executed manner. Given the potential for
increased costs in the absence of good planning, this is also the fiscally responsible thing to do.
Current Capacity of Nevada Schools
Survey Results
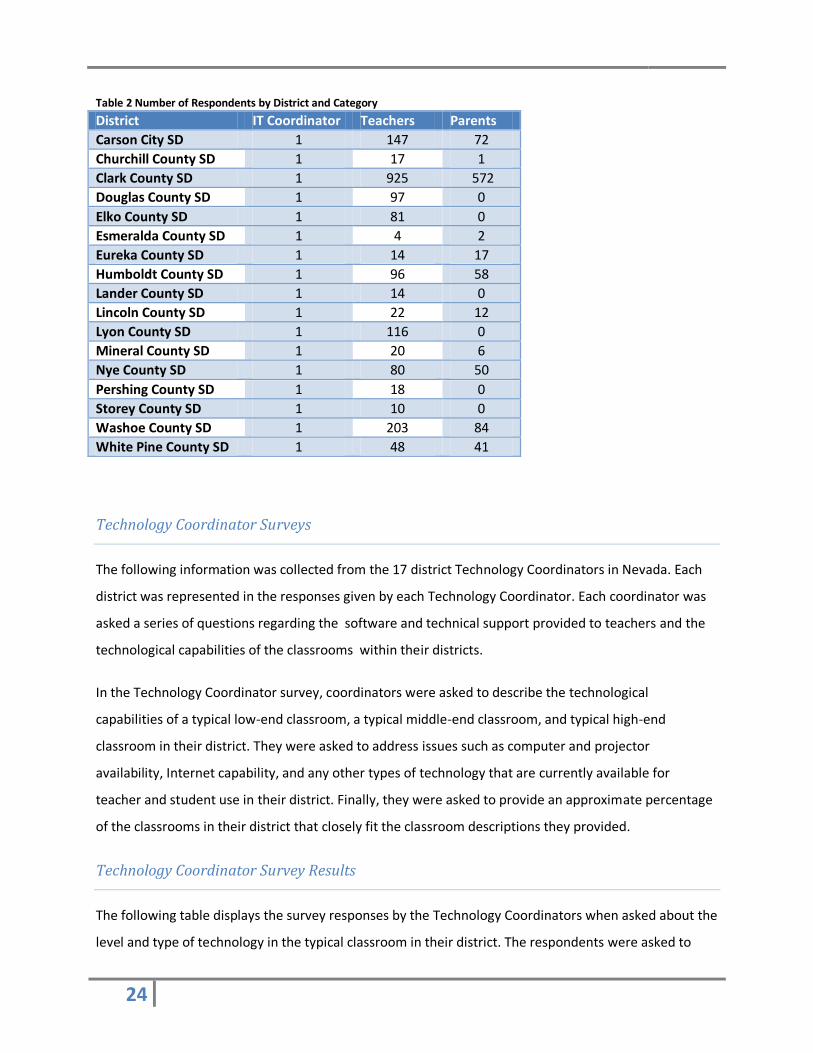
Survey requests were sent to all 17 districts’ Technology Coordinators and 15 of 17 responded. Of the
3,272 survey requests sent out via e-mail to teachers, 1,912 responses were collected for a response
rate of 58.4%. Table 2 shows the response levels from each district, by category of respondent. Because
the districts were asked to contact the parents, the total number of requests is unknown. Note that
Clark County was conducting a mandated district-wide parent survey at the same time and therefore did
not ask parents to participate in this survey.
24
Table 2 Number of Respondents by District and Category
District IT Coordinator Teachers Parents
Carson City SD 1 147 72
Churchill County SD 1 17 1
Clark County SD 1 925 572
Douglas County SD 1 97 0
Elko County SD 1 81 0
Esmeralda County SD 1 4 2
Eureka County SD 1 14 17
Humboldt County SD 1 96 58
Lander County SD 1 14 0
Lincoln County SD 1 22 12
Lyon County SD 1 116 0
Mineral County SD 1 20 6
Nye County SD 1 80 50
Pershing County SD 1 18 0
Storey County SD 1 10 0
Washoe County SD 1 203 84
White Pine County SD 1 48 41
Technology Coordinator Surveys
The following information was collected from the 17 district Technology Coordinators in Nevada. Each
district was represented in the responses given by each Technology Coordinator. Each coordinator was
asked a series of questions regarding the software and technical support provided to teachers and the
technological capabilities of the classrooms within their districts.
In the Technology Coordinator survey, coordinators were asked to describe the technological
capabilities of a typical low-end classroom, a typical middle-end classroom, and typical high-end
classroom in their district. They were asked to address issues such as computer and projector
availability, Internet capability, and any other types of technology that are currently available for
teacher and student use in their district. Finally, they were asked to provide an approximate percentage
of the classrooms in their district that closely fit the classroom descriptions they provided.
Technology Coordinator Survey Results
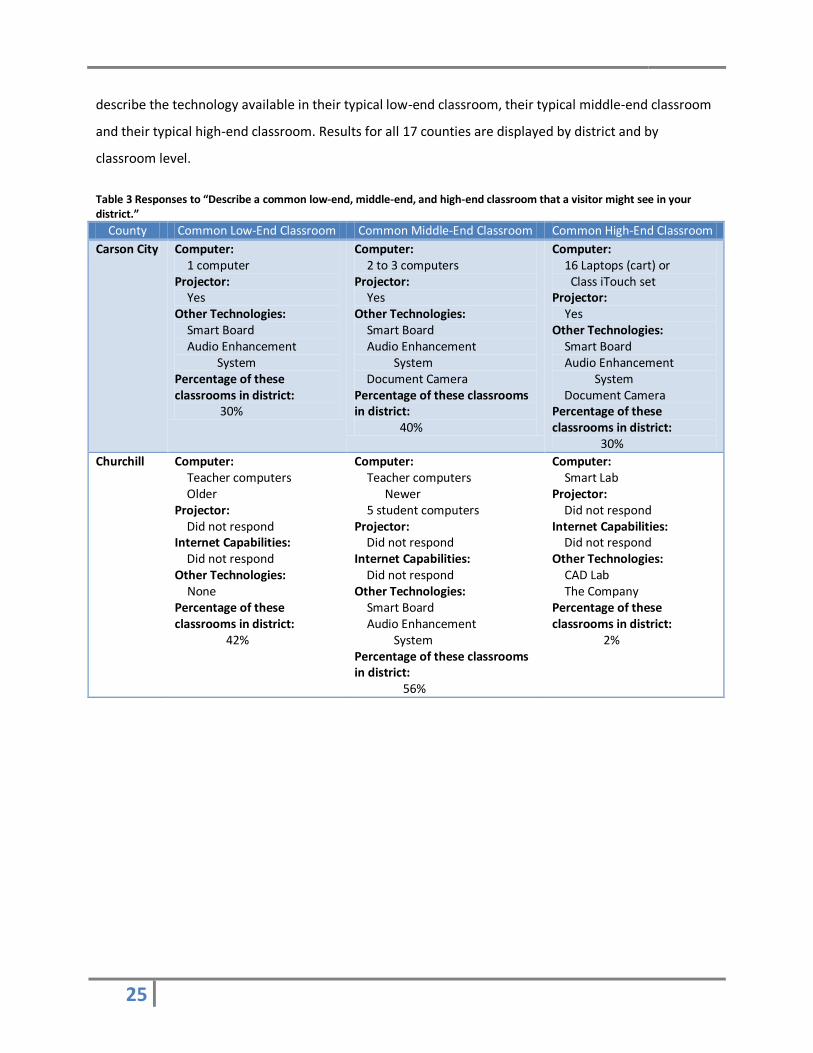
The following table displays the survey responses by the Technology Coordinators when asked about the
level and type of technology in the typical classroom in their district. The respondents were asked to
25
describe the technology available in their typical low-end classroom, their typical middle-end classroom
and their typical high-end classroom. Results for all 17 counties are displayed by district and by
classroom level.
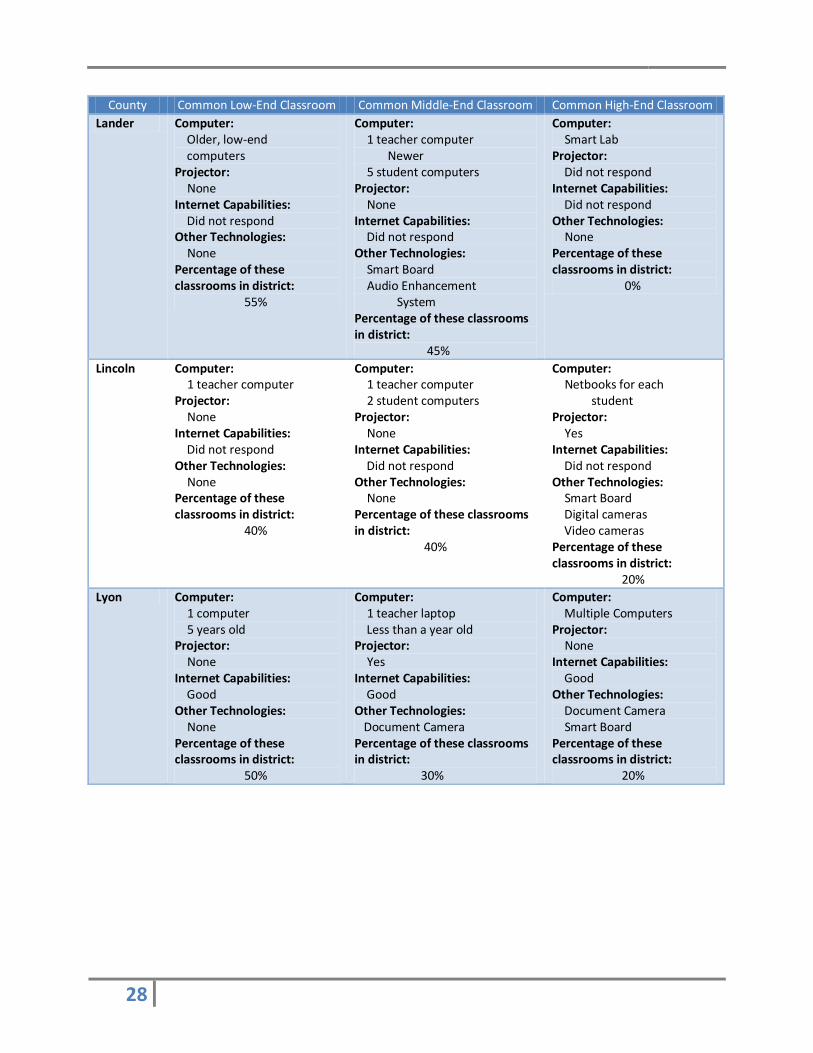
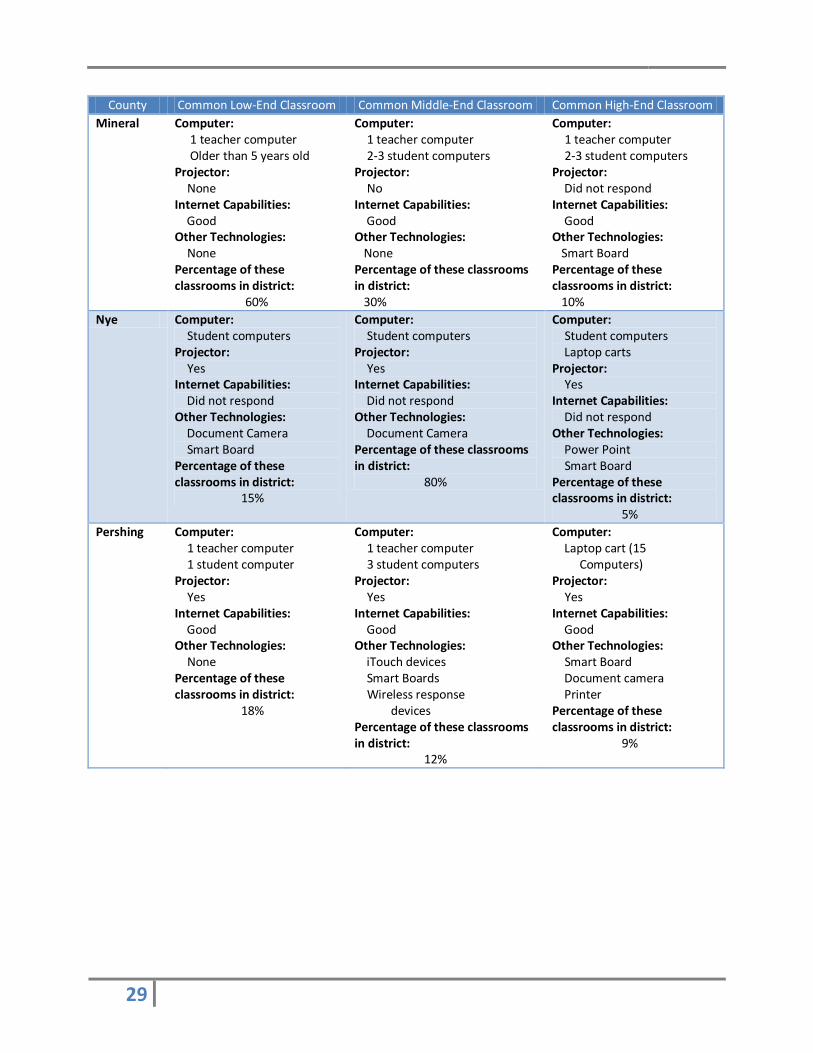
Table 3 Responses to “Describe a common low-end, middle-end, and high-end classroom that a visitor might see in your district.”
County Common Low-End Classroom Common Middle-End Classroom Common High-End Classroom
Carson City Computer: 1 computer Projector: Yes Other Technologies: Smart Board Audio Enhancement System Percentage of these classrooms in district: 30%
Computer: 2 to 3 computers Projector: Yes Other Technologies: Smart Board Audio Enhancement System Document Camera Percentage of these classrooms in district: 40%
Computer: 16 Laptops (cart) or Class iTouch set Projector: Yes Other Technologies: Smart Board Audio Enhancement System Document Camera Percentage of these classrooms in district: 30%
Churchill Computer: Teacher computers Older Projector: Did not respond Internet Capabilities: Did not respond Other Technologies: None Percentage of these classrooms in district: 42%
Computer: Teacher computers Newer 5 student computers Projector: Did not respond Internet Capabilities: Did not respond Other Technologies: Smart Board Audio Enhancement System Percentage of these classrooms in district: 56%
Computer: Smart Lab Projector: Did not respond Internet Capabilities: Did not respond Other Technologies: CAD Lab The Company Percentage of these classrooms in district: 2%

26
County Common Low-End Classroom Common Middle-End Classroom Common High-End Classroom
Clark Computer: 1 teacher computer <5 years old Projector: None Internet Capabilities: Good Other Technologies: None Percentage of these classrooms in district: 10%
Computer: 1 teacher computer 1 student computer >3 years old Laptop cart Projector: Yes Internet Capabilities: Good Other Technologies: Smart Board Classroom responders Percentage of these classrooms in district: 60%
Computer: 1 teacher computer 2 student computers >3 years old Laptop cart Projector: Yes Internet Capabilities: Good Other Technologies: Smart Board Classroom responders Percentage of these classrooms in district: 30%
Douglas Computer: 1 teacher computer Projector: Yes Internet Capabilities: Good Other Technologies: None Percentage of these classrooms in district: 50%
Computer: 1 teacher computer Projector: Yes Internet Capabilities: Good Other Technologies: None Percentage of these classrooms in district: 35%
Computer: 1 teacher computer Projector: Yes Internet Capabilities: Good Other Technologies: Smart Board Student response system Document camera Percentage of these classrooms in district: 15%
Elko Computer: 1 teacher computer 4 years old Projector: None Internet Capabilities: Good Other Technologies: None Percentage of these classrooms in district: 15%
Computer: 1 teacher computer 4 years old 4 student computers Projector: Yes Internet Capabilities: Good Other Technologies: Smart Board School lab Percentage of these classrooms in district: 84%
Computer: Laptop cart iPod cart Projector: Yes Internet Capabilities: Good Other Technologies: Smart Board Student response System Audio enhancement System Percentage of these classrooms in district: 1%

27
County Common Low-End Classroom Common Middle-End Classroom Common High-End Classroom
Esmeralda Computer: Did not respond Projector: None Internet Capabilities: Good Other Technologies: None Percentage of these classrooms in district: 2%
Computer: 1 computer Projector: None Internet Capabilities: Good Other Technologies: None Percentage of these classrooms in district: 2%
Computer: 1 computer Projector: None Internet Capabilities: Good Other Technologies: Smart Boards Percentage of these classrooms in district: 2%
Eureka Computer: 1 teacher computer Projector: Yes Internet Capabilities: Good Other Technologies: Smart Board Percentage of these classrooms in district: 20%
Computer: 1 teacher computer 1 student computer 3 years old Projector: Yes Internet Capabilities: Good Other Technologies: Smart Board Percentage of these classrooms in district: 50%
Computer: Laptop cart Projector: Yes Internet Capabilities: Good Other Technologies: Smart Board Percentage of these classrooms in district: 30%
Humboldt Computer: 1 teacher computer 5 years old Projector: None Internet Capabilities: 1.5 mg Other Technologies: Shared multimedia carts Percentage of these classrooms in district: 55%
Computer: 1 teacher computer 5 years old 5 student computers 5 to 10 years old Projector: None Internet Capabilities: 1.5. mg Other Technologies: Shared multimedia carts Percentage of these classrooms in district: 9%
Computer: 1 teacher computer 5 years old 4 student computers 5 to 10 years old Projector: Yes Internet Capabilities: 1.5 mg Other Technologies: Smart Board Elmo Percentage of these classrooms in district: 36%
28
County Common Low-End Classroom Common Middle-End Classroom Common High-End Classroom
Lander Computer: Older, low-end computers Projector: None Internet Capabilities: Did not respond Other Technologies: None Percentage of these classrooms in district: 55%
Computer: 1 teacher computer Newer 5 student computers Projector: None Internet Capabilities: Did not respond Other Technologies: Smart Board Audio Enhancement System Percentage of these classrooms in district: 45%
Computer: Smart Lab Projector: Did not respond Internet Capabilities: Did not respond Other Technologies: None Percentage of these classrooms in district: 0%
Lincoln Computer: 1 teacher computer Projector: None Internet Capabilities: Did not respond Other Technologies: None Percentage of these classrooms in district: 40%
Computer: 1 teacher computer 2 student computers Projector: None Internet Capabilities: Did not respond Other Technologies: None Percentage of these classrooms in district: 40%
Computer: Netbooks for each student Projector: Yes Internet Capabilities: Did not respond Other Technologies: Smart Board Digital cameras Video cameras Percentage of these classrooms in district: 20%
Lyon Computer: 1 computer 5 years old Projector: None Internet Capabilities: Good Other Technologies: None Percentage of these classrooms in district: 50%
Computer: 1 teacher laptop Less than a year old Projector: Yes Internet Capabilities: Good Other Technologies: Document Camera Percentage of these classrooms in district: 30%
Computer: Multiple Computers Projector: None Internet Capabilities: Good Other Technologies: Document Camera Smart Board Percentage of these classrooms in district: 20%
29
County Common Low-End Classroom Common Middle-End Classroom Common High-End Classroom
Mineral Computer: 1 teacher computer Older than 5 years old Projector: None Internet Capabilities: Good Other Technologies: None Percentage of these classrooms in district:
60%
Computer: 1 teacher computer 2-3 student computers Projector: No Internet Capabilities: Good Other Technologies: None Percentage of these classrooms in district: 30%
Computer: 1 teacher computer 2-3 student computers Projector: Did not respond Internet Capabilities: Good Other Technologies: Smart Board Percentage of these classrooms in district: 10%
Nye Computer: Student computers Projector: Yes Internet Capabilities: Did not respond Other Technologies: Document Camera Smart Board Percentage of these classrooms in district: 15%
Computer: Student computers Projector: Yes Internet Capabilities: Did not respond Other Technologies: Document Camera Percentage of these classrooms in district: 80%
Computer: Student computers Laptop carts Projector: Yes Internet Capabilities: Did not respond Other Technologies: Power Point Smart Board Percentage of these classrooms in district: 5%
Pershing Computer: 1 teacher computer 1 student computer Projector: Yes Internet Capabilities: Good Other Technologies: None Percentage of these classrooms in district: 18%
Computer: 1 teacher computer 3 student computers Projector: Yes Internet Capabilities: Good Other Technologies: iTouch devices Smart Boards Wireless response devices Percentage of these classrooms in district: 12%
Computer: Laptop cart (15 Computers) Projector: Yes Internet Capabilities: Good Other Technologies: Smart Board Document camera Printer Percentage of these classrooms in district: 9%

30
County Common Low-End Classroom Common Middle-End Classroom Common High-End Classroom
Storey Computer: 1 teacher computer <5 years old 1 student computer >5 years old Projector: None Internet Capabilities: Did not respond Other Technologies: Printer Percentage of these classrooms in district: 3%
Computer: 1 teacher computer <5 years old Many student Computers >5 years old Projector: None Internet Capabilities: Did not respond Other Technologies: Printer Audio Enhancement System Percentage of these classrooms in district: 75%
Computer: 1 teacher computer <5 years old Many student Computers >5 years old Projector: Yes Internet Capabilities: Did not respond Other Technologies: Smart Board Printer Audio Enhancement System Percentage of these classrooms in district: 22%
Washoe Computer: 1 teacher computer Projector: None Internet Capabilities: Did not respond Other Technologies: None Percentage of these classrooms in district: 63%
Computer: 1 teacher computer Projector: Yes Internet Capabilities: Did not respond Other Technologies: Smart Board Percentage of these classrooms in district: 25%
Computer: Laptop cart iPod cart Projector: Yes Internet Capabilities: Did not respond Other Technologies: Voting response system Percentage of these classrooms in district: 12%
White Pine Computer: 1 teacher computer 2 student computers 8 years old Projector: None Internet Capabilities: Good Other Technologies: None Percentage of these classrooms in district: 50%
Computer: 1 teacher computer 3 student computers 8 years old Projector: None Internet Capabilities: Good Other Technologies: Smart Board Percentage of these classrooms in district: 40%
Computer: Laptops and iPods Projector: None Internet Capabilities: Good Other Technologies: Smart Board Percentage of these classrooms in district: 10%
The information presented in Table 3 shows that classroom technology availability varies between
districts in Nevada, as well as between classrooms within the same district. Based on the information
provided by the Technology Coordinators surveyed, a typical low-end classroom in Nevada contains one

31
or two computers that are older and used only for administrative tasks. A low-end classroom may or
may not have access to a projector and reliable Internet access. A few coordinators reported that a low-
end classroom in their district may have a functioning printer, audio enhancement system, and a Smart
Board. After taking an average of the percentages of low-end classrooms within each district as reported
by Technology Coordinators, approximately 37.2% of Nevada classrooms fall into the “low-end
classroom” category (excluding Esmeralda and Pershing counties). The percentages reported by
Esmeralda and Pershing counties did not reflect an accurate account of sites within each district (i.e.,
Esmeralda county indicated 6% of schools, rather than 100%). Therefore, these percentages were
excluded from the state average.
A typical middle-end classroom in Nevada contains a computer for teacher use and administrative tasks
and two to five computers for student use. Internet access is provided and access to a projector for
classroom use is available. Other technologies reported by coordinators that can be found in a middle-
end classroom include Smart Boards, audio enhancement systems, printers, student response devices,
and a document camera. After taking an average of the percentages reported by the coordinators
surveyed, approximately 42.4% of Nevada classrooms fall into the “middle-end” category in regard to
technology access (excluding Esmeralda and Pershing counties).
Finally, based on the collected responses, a typical high-end classroom in Nevada contains a computer
for teacher use and administrative tasks and access to multiple computers for student use. This access
can be found in the form of laptop carts, computer labs, or access to iPod Touches. Internet access is
provided and access to a projector for classroom use is available, if a projector is not already provided in
each classroom. Other technologies found in high-end classrooms in Nevada, as reported by district
Technology Coordinators, include Smart Boards, audio enhancement systems, a printer, document
camera, student response devices, and access to a CAD lab. After taking an average of the percentages
reported by the coordinators, approximately 16.2% of Nevada classrooms fall into the “high-end
classroom” category in regard to technology access (excluding Esmeralda and Pershing counties).
Teacher Surveys
The following information was collected from surveys completed by 1,912 teachers from 17 districts in
Nevada. This represents a 58.4% response rate from 3,272 teachers or approximately 0.44% of the total
number of Nevada teachers. These data describe the technology environment in Nevada’s classrooms
and provide a snapshot of the available technology.

32
Nevada Classrooms
Ninety-nine percent of the teachers responding stated they have classrooms with computers for teacher
administrative tasks. These computers are between three and four years old (Figure 1).
Figure 1 Age of Teacher Computers
Sixty-three percent of the teachers responding to the survey stated they have an LCD projector, 31%
noted they could project from a computer to a TV, and 29% said they have an interactive whiteboard
(Figure 2). Eighteen percent have a digital camera and 9% have a digital video camera.
Figure 2 Responses to “Which of the following technology equipment do you have in your classroom all the time statewide?”
New or 1 year old4%
2-3 years22%
4-5 years old41%
6-10 years old31%
> 10 years old2%
0
200
400
600
800
1000
1200
Digital Camera Digital Video Camera
LCD Projector Project to computer
screen or TV
Interactive Whiteboard
Re
spo
nd
en
ts

33
Among all surveyed districts, the way that teachers displayed their information was varied. Smaller
districts tend to use, digital video cameras, LCD projectors, televisions showing computer displays, and
interactive whiteboards. Larger districts use LCD projectors, televisions showing computer displays, and
interactive whiteboards. (Figure 3).
Figure 3 Responses to “Which of the following do you have in your classroom all of the time as responded by large, medium and small districts?”
Sixty-two percent of the teachers reported having computers in their classrooms for student
instructional purposes. The number of students per computer has changed slightly since the 2008 study,
but there is not a noticeable trend (Figure 4).
0
10
20
30
40
50
60
70
80
Digital Video Camera LCD Projector Project Computer on TV Interactive Whiteboard
Re
spo
nd
en
ts
Small Districts
Medium Districts
Large Districts
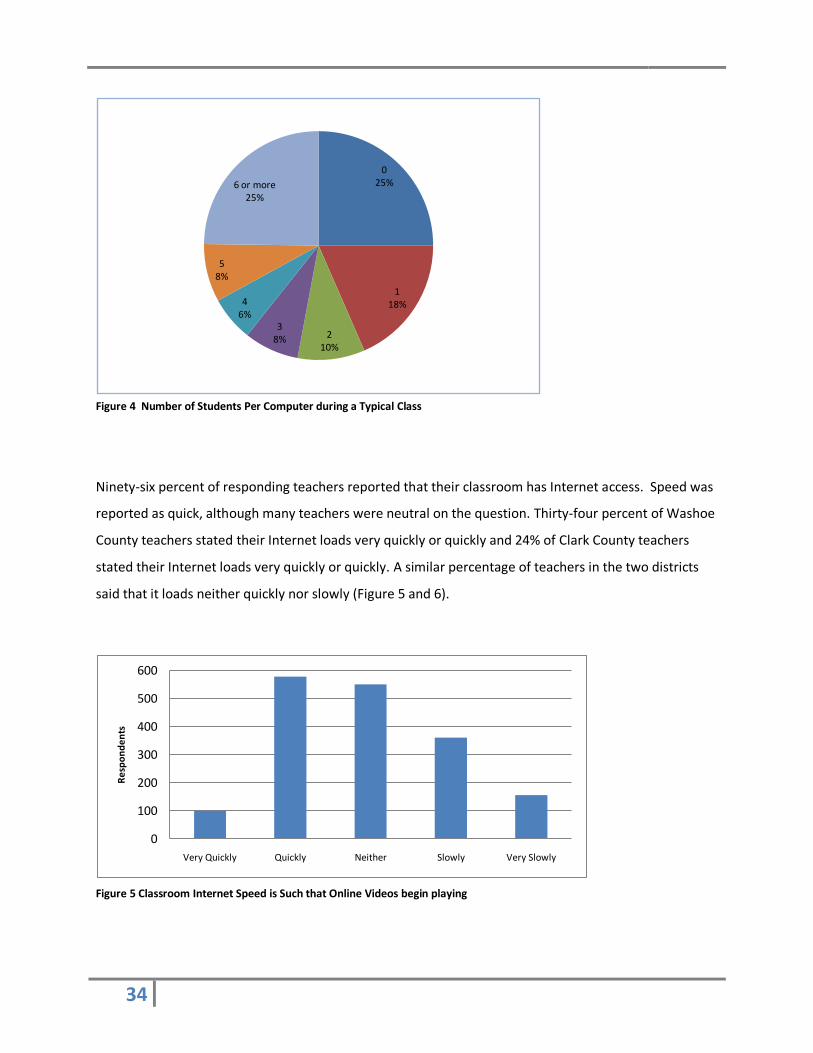
34
Figure 4 Number of Students Per Computer during a Typical Class
Ninety-six percent of responding teachers reported that their classroom has Internet access. Speed was
reported as quick, although many teachers were neutral on the question. Thirty-four percent of Washoe
County teachers stated their Internet loads very quickly or quickly and 24% of Clark County teachers
stated their Internet loads very quickly or quickly. A similar percentage of teachers in the two districts
said that it loads neither quickly nor slowly (Figure 5 and 6).
Figure 5 Classroom Internet Speed is Such that Online Videos begin playing
025%
118%
210%
38%
46%
58%
6 or more25%
0
100
200
300
400
500
600
Very Quickly Quickly Neither Slowly Very Slowly
Re
spo
nd
en
ts
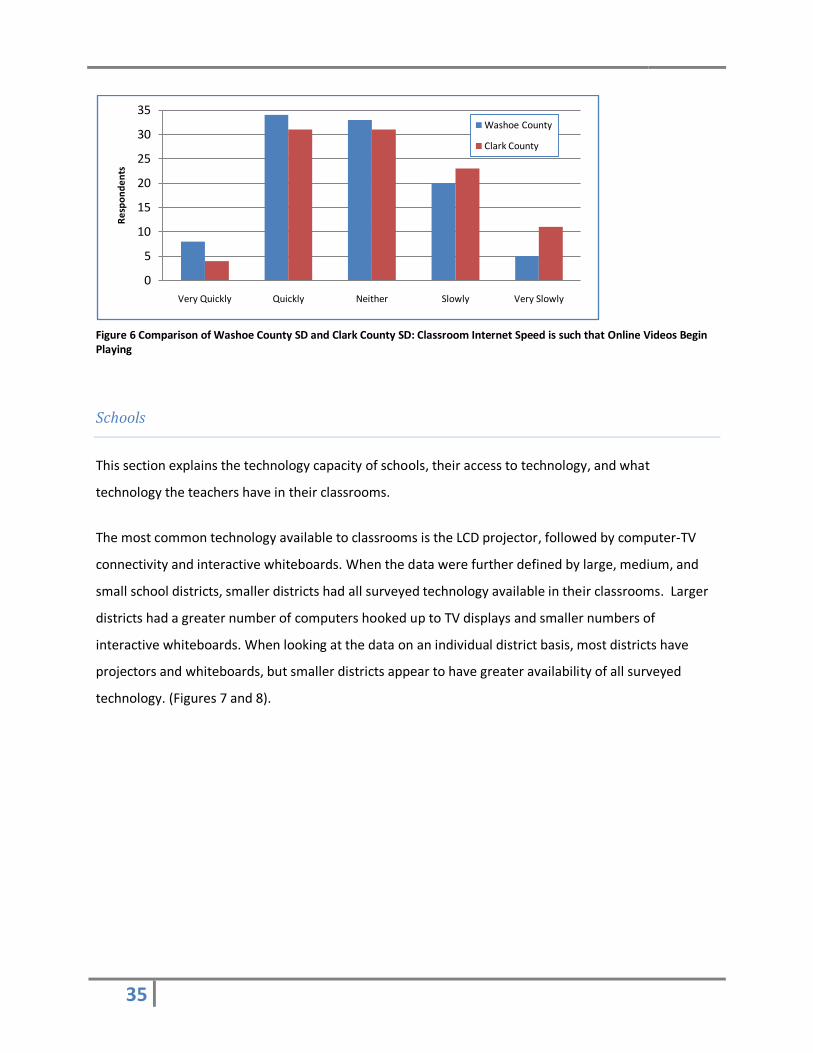
35
Figure 6 Comparison of Washoe County SD and Clark County SD: Classroom Internet Speed is such that Online Videos Begin Playing
Schools
This section explains the technology capacity of schools, their access to technology, and what
technology the teachers have in their classrooms.
The most common technology available to classrooms is the LCD projector, followed by computer-TV
connectivity and interactive whiteboards. When the data were further defined by large, medium, and
small school districts, smaller districts had all surveyed technology available in their classrooms. Larger
districts had a greater number of computers hooked up to TV displays and smaller numbers of
interactive whiteboards. When looking at the data on an individual district basis, most districts have
projectors and whiteboards, but smaller districts appear to have greater availability of all surveyed
technology. (Figures 7 and 8).
0
5
10
15
20
25
30
35
Very Quickly Quickly Neither Slowly Very Slowly
Re
spo
nd
en
tsWashoe County
Clark County
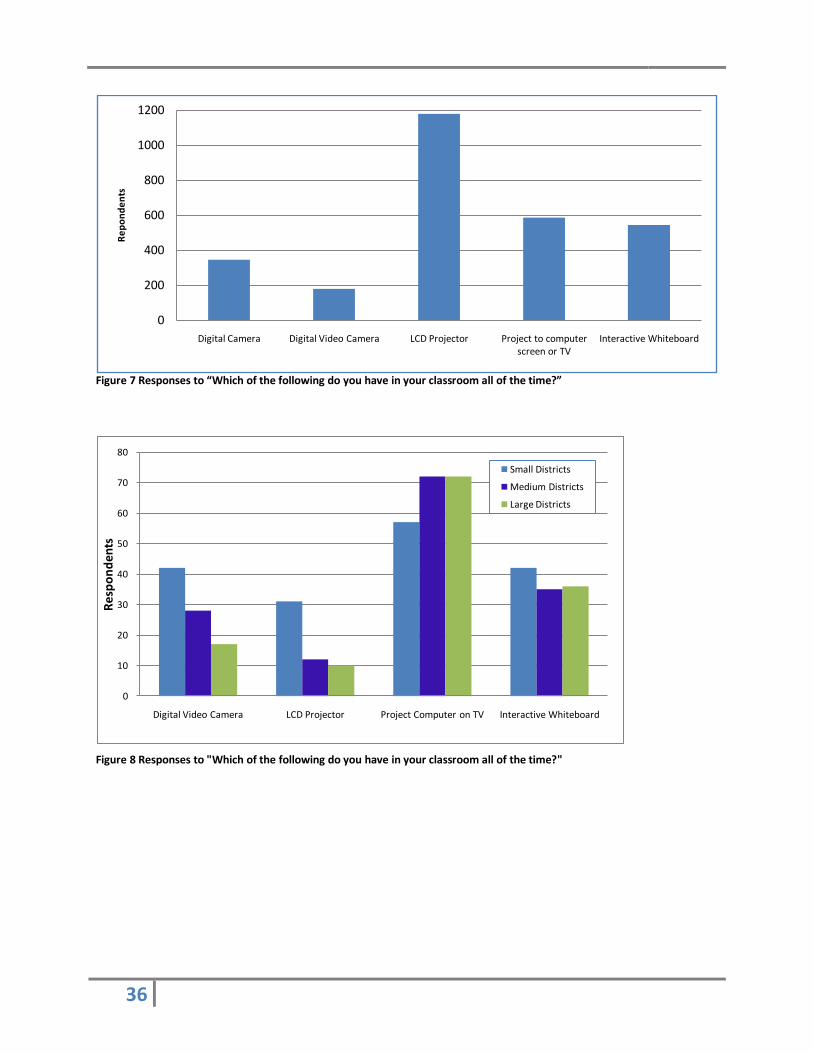
36
Figure 7 Responses to “Which of the following do you have in your classroom all of the time?”
Figure 8 Responses to "Which of the following do you have in your classroom all of the time?"
0
200
400
600
800
1000
1200
Digital Camera Digital Video Camera LCD Projector Project to computer screen or TV
Interactive Whiteboard
Re
po
nd
en
ts
0
10
20
30
40
50
60
70
80
Digital Video Camera LCD Projector Project Computer on TV Interactive Whiteboard
Res
po
nd
ents
Small Districts
Medium Districts
Large Districts
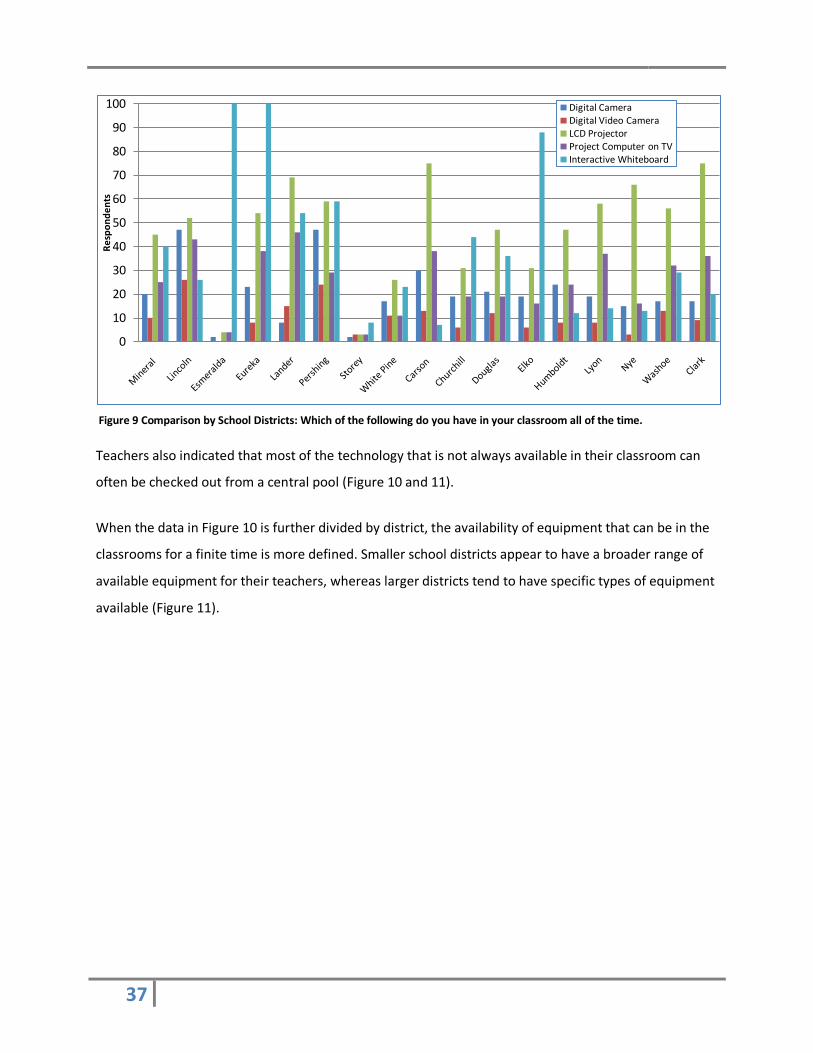
37
Figure 9 Comparison by School Districts: Which of the following do you have in your classroom all of the time.
Teachers also indicated that most of the technology that is not always available in their classroom can
often be checked out from a central pool (Figure 10 and 11).
When the data in Figure 10 is further divided by district, the availability of equipment that can be in the
classrooms for a finite time is more defined. Smaller school districts appear to have a broader range of
available equipment for their teachers, whereas larger districts tend to have specific types of equipment
available (Figure 11).
0
10
20
30
40
50
60
70
80
90
100R
esp
on
de
nts
Digital CameraDigital Video CameraLCD ProjectorProject Computer on TVInteractive Whiteboard
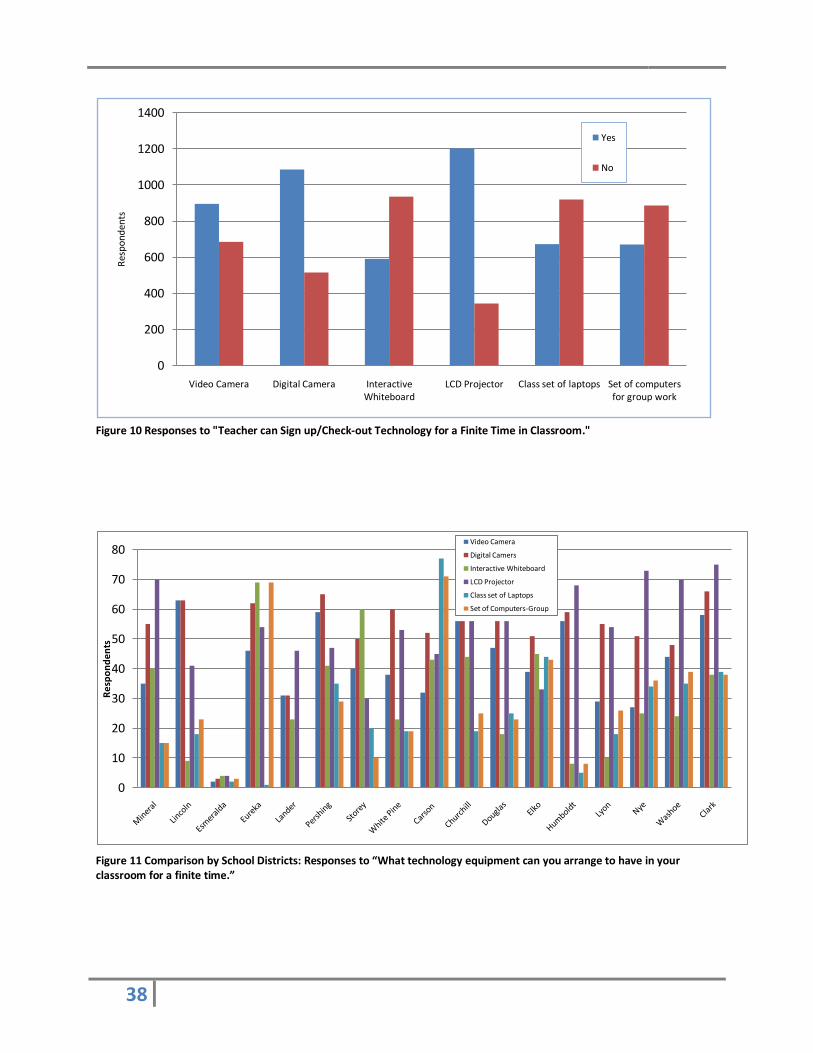
38
Figure 10 Responses to "Teacher can Sign up/Check-out Technology for a Finite Time in Classroom."
Figure 11 Comparison by School Districts: Responses to “What technology equipment can you arrange to have in your classroom for a finite time.”
0
200
400
600
800
1000
1200
1400
Video Camera Digital Camera Interactive Whiteboard
LCD Projector Class set of laptops Set of computers for group work
Res
po
nd
ents
Yes
No
0
10
20
30
40
50
60
70
80
Re
spo
nd
en
ts
Video Camera
Digital Camers
Interactive Whiteboard
LCD Projector
Class set of Laptops
Set of Computers-Group
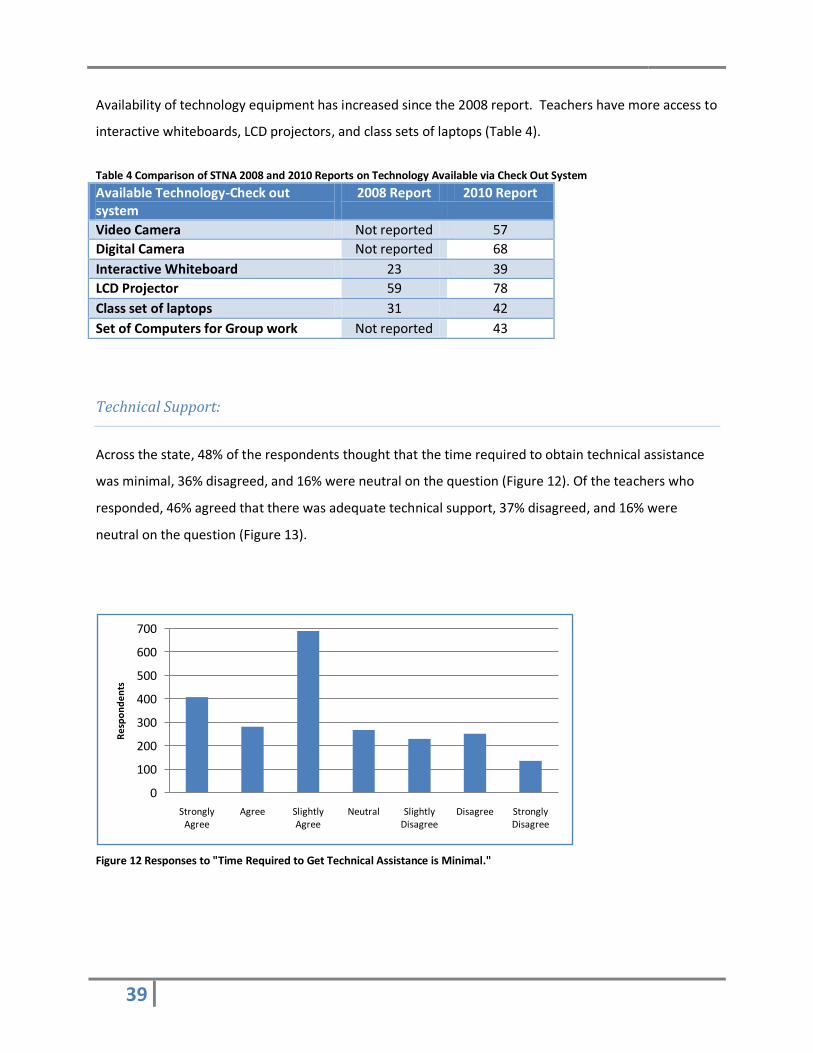
39
Availability of technology equipment has increased since the 2008 report. Teachers have more access to
interactive whiteboards, LCD projectors, and class sets of laptops (Table 4).
Table 4 Comparison of STNA 2008 and 2010 Reports on Technology Available via Check Out System
Available Technology-Check out system
2008 Report 2010 Report
Video Camera Not reported 57
Digital Camera Not reported 68
Interactive Whiteboard 23 39
LCD Projector 59 78
Class set of laptops 31 42
Set of Computers for Group work Not reported 43
Technical Support:
Across the state, 48% of the respondents thought that the time required to obtain technical assistance
was minimal, 36% disagreed, and 16% were neutral on the question (Figure 12). Of the teachers who
responded, 46% agreed that there was adequate technical support, 37% disagreed, and 16% were
neutral on the question (Figure 13).
Figure 12 Responses to "Time Required to Get Technical Assistance is Minimal."
0
100
200
300
400
500
600
700
Strongly Agree
Agree Slightly Agree
Neutral Slightly Disagree
Disagree Strongly Disagree
Re
spo
nd
en
ts

40
Figure 13 Responses to "There is an Adequate System for Technical Support."
Among respondents outside of Clark County, 41% strongly agreed or slightly agreed that the time to get
technical assistance was minimal and 44% strongly disagreed or slightly disagreed. Fifty-three percent
of the Clark County teachers who responded to the survey question strongly agreed or slightly agreed
that the time required to get technical assistance was minimal and 22% strongly disagreed or slightly
disagreed that the time was minimal. Overall, Clark County teachers felt they could get assistance when
needed and other Nevada school districts were slightly dissatisfied (Figure 14).
Figure 14 Comparison between Clark County and All Other Districts: "Time Required to Get Technical Assistance is Minimal."
0
50
100
150
200
250
300
350
400
450
Strongly Agree
Agree Slightly Agree
Neutral Slightly Disagree
Disagree Strongly Disagree
Re
spo
nd
en
ts
0
5
10
15
20
25
30
35
40
Strongly Agree Agree Slightly agree Neutral Slightly Disagree
Disagree Strongly Disagree
Re
spo
nd
en
ts
All Other
Clark
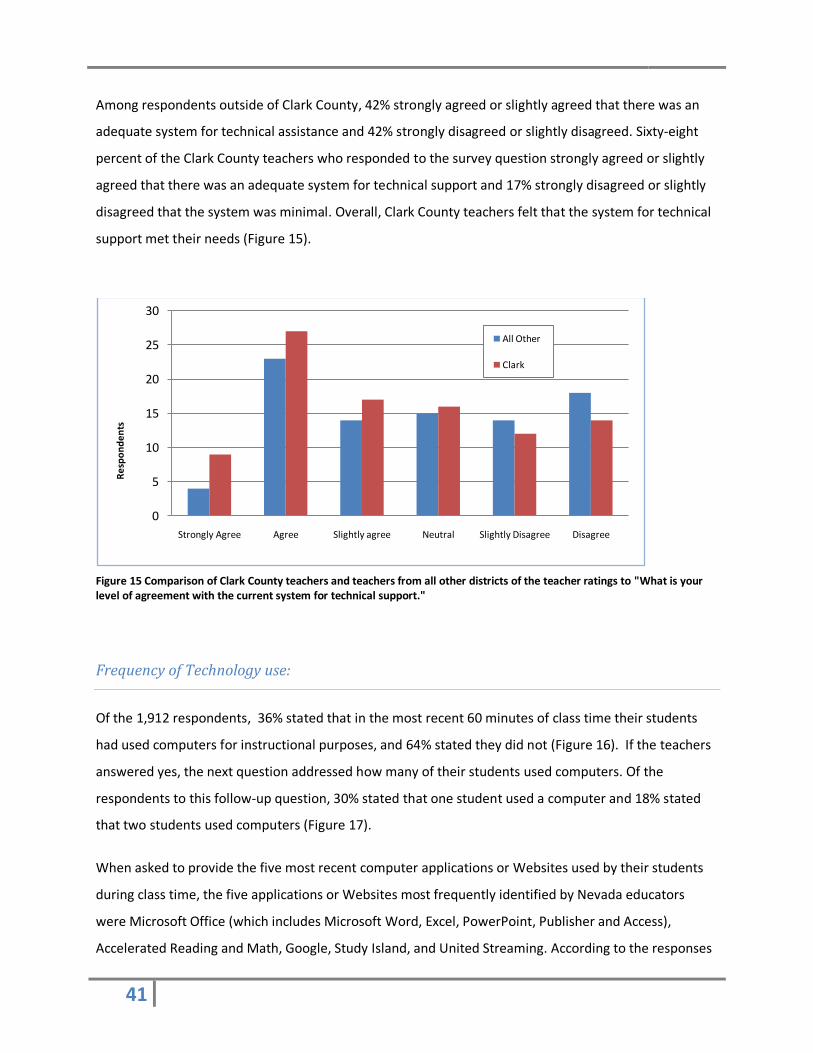
41
Among respondents outside of Clark County, 42% strongly agreed or slightly agreed that there was an
adequate system for technical assistance and 42% strongly disagreed or slightly disagreed. Sixty-eight
percent of the Clark County teachers who responded to the survey question strongly agreed or slightly
agreed that there was an adequate system for technical support and 17% strongly disagreed or slightly
disagreed that the system was minimal. Overall, Clark County teachers felt that the system for technical
support met their needs (Figure 15).
Figure 15 Comparison of Clark County teachers and teachers from all other districts of the teacher ratings to "What is your level of agreement with the current system for technical support."
Frequency of Technology use:
Of the 1,912 respondents, 36% stated that in the most recent 60 minutes of class time their students
had used computers for instructional purposes, and 64% stated they did not (Figure 16). If the teachers
answered yes, the next question addressed how many of their students used computers. Of the
respondents to this follow-up question, 30% stated that one student used a computer and 18% stated
that two students used computers (Figure 17).
When asked to provide the five most recent computer applications or Websites used by their students
during class time, the five applications or Websites most frequently identified by Nevada educators
were Microsoft Office (which includes Microsoft Word, Excel, PowerPoint, Publisher and Access),
Accelerated Reading and Math, Google, Study Island, and United Streaming. According to the responses
0
5
10
15
20
25
30
Strongly Agree Agree Slightly agree Neutral Slightly Disagree Disagree
Re
spo
nd
en
ts
All Other
Clark

42
provided, 40% of respondents reported student use of Microsoft Office, 25% reported student use of
Google, 8% reported student use of Accelerated Reading and Math programs, 6% reported student use
of Study Island, and 3% reported student use of United Streaming. Other frequently reported computer
applications used by Nevada students included Adobe Photoshop, Ticket to Read, and Smart Board
software. In addition to computer applications, other frequently reported Websites used by Nevada
students included Cool Math for Kids, Wikipedia, and YouTube.
Teachers were also asked to provide the five most recent computer applications or Websites that they
frequently use in the classroom. The five applications and Websites most frequently identified by
educators for their own use included Microsoft Office, United Streaming, Accelerated Reading and
Math, Google, and district-distributed software provided for student attendance and grade reporting.
Examples of this software include First Class and Power School (attendance recording software) and
Easy Grade Pro and Power Teacher (grade book software). According to the responses provided, 57% of
teachers reported using Microsoft Office, 24% of teachers reported using attendance and grade book
software, 21% of teachers reported using Google, 5% of teachers reported using United Streaming, and
4% of teachers reported using Accelerated Reading and Math software. In addition to the computer
applications listed above, teachers also reported the frequent use of Adobe Photoshop and Groupwise.
Other frequently reported Websites included Study Island, Promethean Planet, and the Northwest
Evaluation Association Website.
In this survey, Nevada educators were also asked to report on student computer use within the most
recent last hour of class time and were asked to provide the number of students in their classroom that
engage in computer use within the last hour of class time. Figure 16 presents the results of student
computer use within the most recent last hour of class time and Figure 17 presents the data collected
regarding the number of students that use computers within the most recent last hour of class time.
According to Figure 16, teacher responses suggest that 64% of Nevada students do not use a computer
during the last hour of class. In addition, Figure 17 suggests that even if students are using computers
during the last hour of class, the number of students engaging in computer-based activities is relatively
low.
The results presented in Figures 16 and 17 suggest that student computer use during the last hour of
class time is infrequent, but when asked about technology use in the classroom, a large majority of the
teachers surveyed provided explanations as to why computer use among their students is lower than

43
expected. For example, many of the teachers surveyed responded that access to computers for each
student in their classroom is difficult to obtain. A large majority of teachers stated that access to the
school computer lab or laptop cart needs to be reserved weeks or months ahead of time, which hinders
their ability to encourage student computer use during class time. In addition to issues with access,
many of the teachers surveyed reported a lack of classroom computer use due to inadequate equipment
and outdated software. Many teachers stated that while they would like to increase technology use in
their classrooms, a lack of current technology, access to technology, and knowledge of how to utilize the
technology provided to them causes many teachers to abstain from using technology in their
classrooms. This, in turn, decreases the opportunities presented to Nevada students to use technology
during class time.
Figure 16 Responses to “Of the most recent 60 minutes of Class Time, Did Students use the Computer for Instructional Purposes?”
0
200
400
600
800
1000
1200
Yes 36 % No 64%
Re
spo
nd
en
ts

44
Figure 17 Responses to "During the most recent 60 minutes of classroom time, the number of Students that used computers."
When asked how many times computers were used in the classroom this academic year, 21% stated
never, 31% stated 1-10 days, and 21% stated 80 or more days (Figure 18).
Figure 18 Responses to "How many days since the beginning of school has a typical student used a computer for instructional purposes?"
no computers
43%
1 student30%
2 students18%
3 students6%
4 students3%
Never21%
1-1031%
11-209%
21-40 10%
41-80 8%
80+21%

45
Preparation and Professional Development
Technology Coordinator Responses
In the surveys, Technology Coordinators were asked to provide feedback regarding the professional
development opportunities provided for teachers in their district. A large majority of coordinators stated
that while professional development may be offered, technology-focused professional development is
very limited. Sources for technology professional development mentioned by coordinators included
Website tutorials, Regional Professional Development Programs (RPDP) training, e-learning conferences,
and classes taught at local colleges or universities. One coordinator discussed a district technology
trainer that provides onsite training for teachers within the district and offers online support for
teachers that may be struggling with technology use in their classrooms. Overall, the Technology
Coordinators surveyed reported that professional development opportunities addressing technology use
in the classroom are minimal.
When asked to describe the key components of effective professional development, many Technology
Coordinators indicated that effective training would be timely, continuous, and relevant to current uses
of technology in the classroom. For example, many coordinators stressed that due to teaching and
testing demands, educators have very little time to devote to technology training. In addition, many
coordinators stated that if training is going to be made available, it needs to be relevant to the types of
technology that are available to the teachers within that district. A few coordinators also noted that
effective professional development should be tailored in such a way that all levels of technology
proficiency are addressed.
After describing the characteristics of effective professional development, Technology Coordinators
were asked to describe the key components to the professional development opportunities that are
currently being provided to the teachers in their districts. A few coordinators stated that two-minute
Web tutorials are currently being offered to teachers in their districts. It was noted that professional
development opportunities in some districts are voluntary. Coordinators noted that the voluntary aspect
of professional development makes it hard to provide educators with consistent training.
In regard to technology-based professional development, one coordinator stated that student
technology literacy often now surpasses that of teachers, although those students are often not able to

46
use the technology effectively to learn. Therefore, technology training for teachers needs to be current
and consistent. It was also noted that in order to ensure that technology training is current among
teachers, it is imperative that the technology provided within the classroom is current as well.
Preparation
The following questions were asked in regard to classroom availability of classroom technology; data
retrieval; and access to district, classroom, and instructional materials via computer. Improvement has
been made in several areas when compared to the 2008 STNA report (Table 5).
Table 5 Teacher Preparation in Comparison to 2008
Task Percentage responding either Moderately well or Very well prepared
2008
Teach in a classroom where every student had their own laptop
75.5% 42%
Access and use state assessment data to support instructional decisions
73% Not Reported
Access and use district assessment data to support instructional decisions
71% Not Reported
Teach in a classroom where all of the instructional materials are delivered via the computer
54% 39%
Find effective instructional materials on the Internet
88% 74%
Integrate educational technology into your classroom
77% 62%
Incorporate library databases into student research projects
58% 41%
Professional Development
Teachers were asked about their professional development training, and responses show that most is
provided by colleagues and in-service trainings. There is a small improvement in availability from the
previous reporting period (Table 6). When asked about their technology professional development from
other entities such as district, higher education institutions, RPDP, or school, responses were mostly
neutral (Figures 19, 20, 21, 22, and 23).
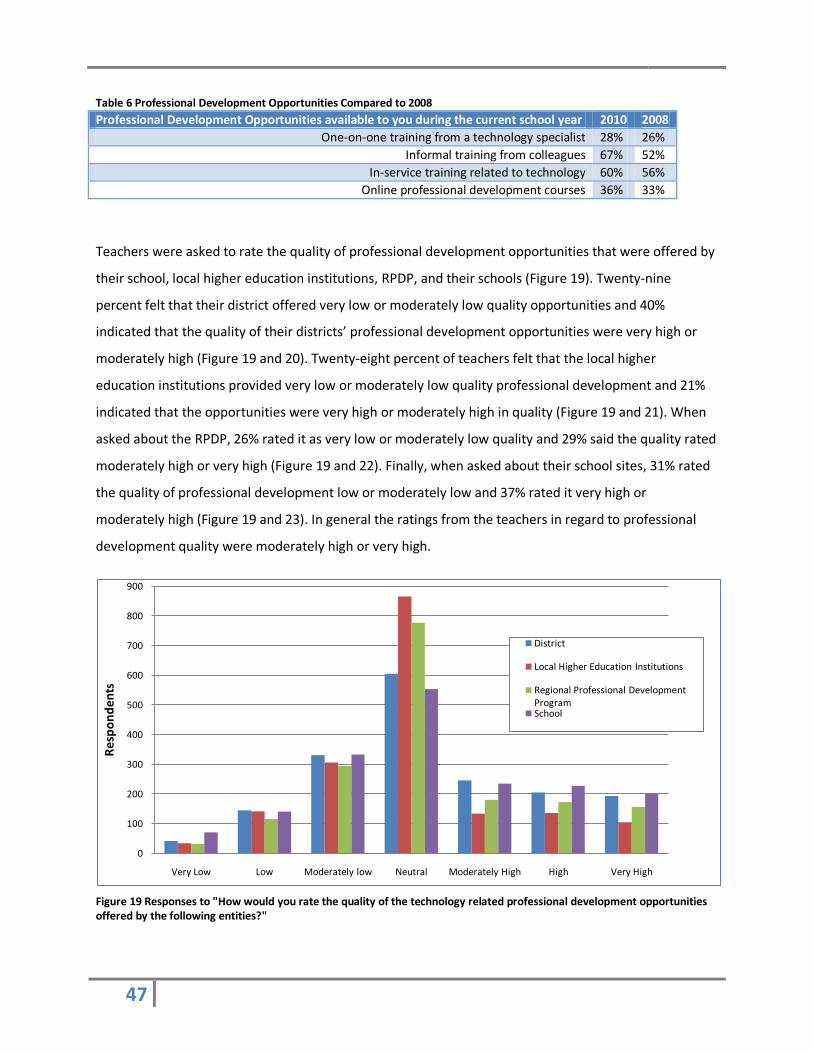
47
Table 6 Professional Development Opportunities Compared to 2008
Professional Development Opportunities available to you during the current school year 2010 2008
One-on-one training from a technology specialist 28% 26%
Informal training from colleagues 67% 52%
In-service training related to technology 60% 56%
Online professional development courses 36% 33%
Teachers were asked to rate the quality of professional development opportunities that were offered by
their school, local higher education institutions, RPDP, and their schools (Figure 19). Twenty-nine
percent felt that their district offered very low or moderately low quality opportunities and 40%
indicated that the quality of their districts’ professional development opportunities were very high or
moderately high (Figure 19 and 20). Twenty-eight percent of teachers felt that the local higher
education institutions provided very low or moderately low quality professional development and 21%
indicated that the opportunities were very high or moderately high in quality (Figure 19 and 21). When
asked about the RPDP, 26% rated it as very low or moderately low quality and 29% said the quality rated
moderately high or very high (Figure 19 and 22). Finally, when asked about their school sites, 31% rated
the quality of professional development low or moderately low and 37% rated it very high or
moderately high (Figure 19 and 23). In general the ratings from the teachers in regard to professional
development quality were moderately high or very high.
Figure 19 Responses to "How would you rate the quality of the technology related professional development opportunities offered by the following entities?"
0
100
200
300
400
500
600
700
800
900
Very Low Low Moderately low Neutral Moderately High High Very High
Re
spo
nd
en
ts
District
Local Higher Education Institutions
Regional Professional Development ProgramSchool
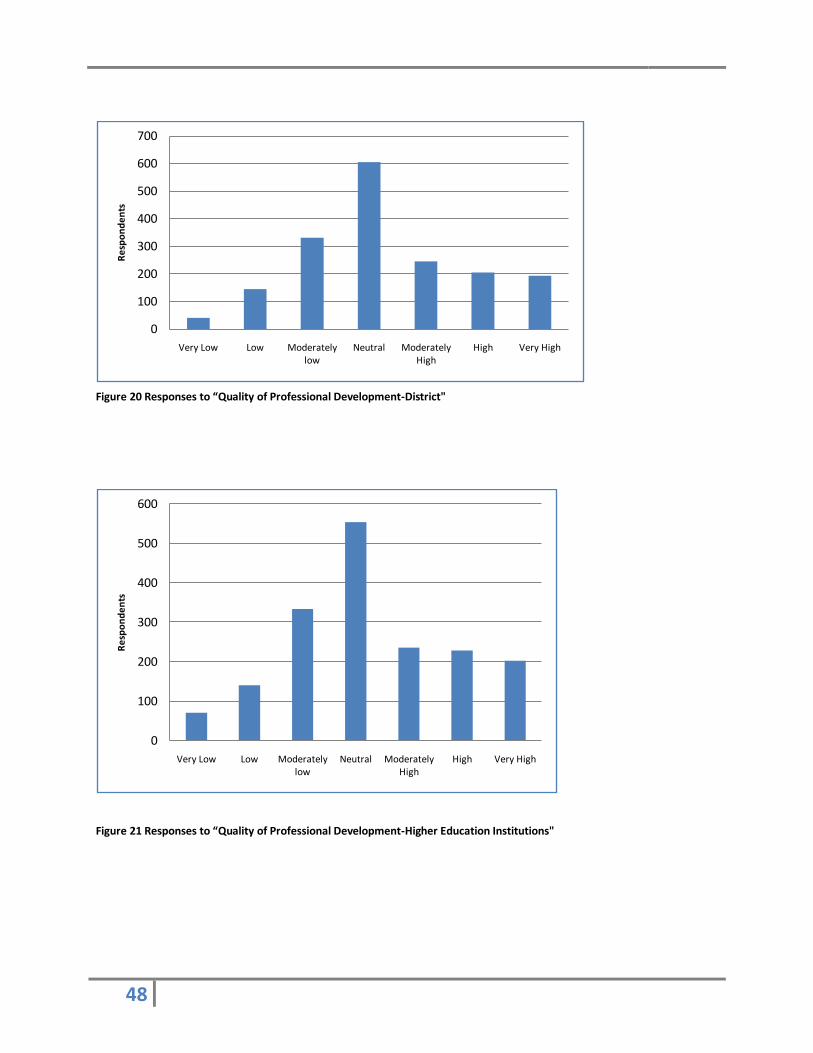
48
Figure 20 Responses to “Quality of Professional Development-District"
Figure 21 Responses to “Quality of Professional Development-Higher Education Institutions"
0
100
200
300
400
500
600
700
Very Low Low Moderately low
Neutral Moderately High
High Very High
Re
spo
nd
en
ts
0
100
200
300
400
500
600
Very Low Low Moderately low
Neutral Moderately High
High Very High
Re
spo
nd
en
ts
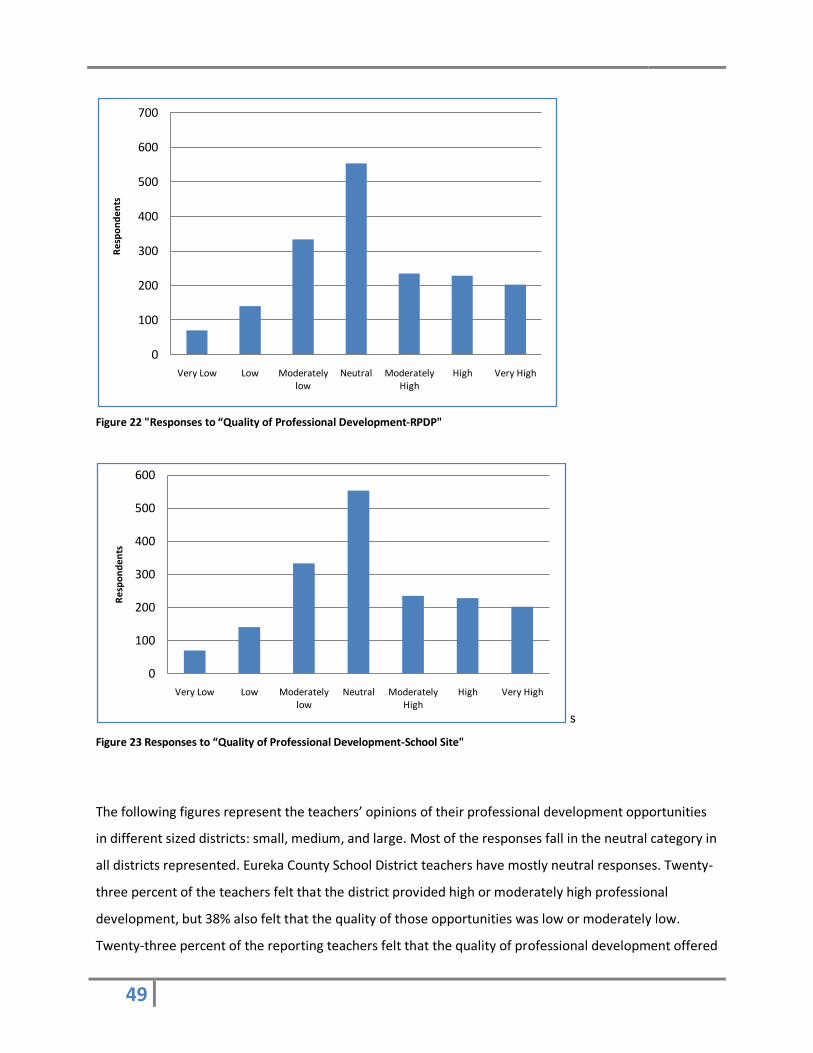
49
Figure 22 "Responses to “Quality of Professional Development-RPDP"
s
Figure 23 Responses to “Quality of Professional Development-School Site"
The following figures represent the teachers’ opinions of their professional development opportunities
in different sized districts: small, medium, and large. Most of the responses fall in the neutral category in
all districts represented. Eureka County School District teachers have mostly neutral responses. Twenty-
three percent of the teachers felt that the district provided high or moderately high professional
development, but 38% also felt that the quality of those opportunities was low or moderately low.
Twenty-three percent of the reporting teachers felt that the quality of professional development offered
0
100
200
300
400
500
600
700
Very Low Low Moderately low
Neutral Moderately High
High Very High
Re
spo
nd
en
ts
0
100
200
300
400
500
600
Very Low Low Moderately low
Neutral Moderately High
High Very High
Re
spo
nd
en
ts
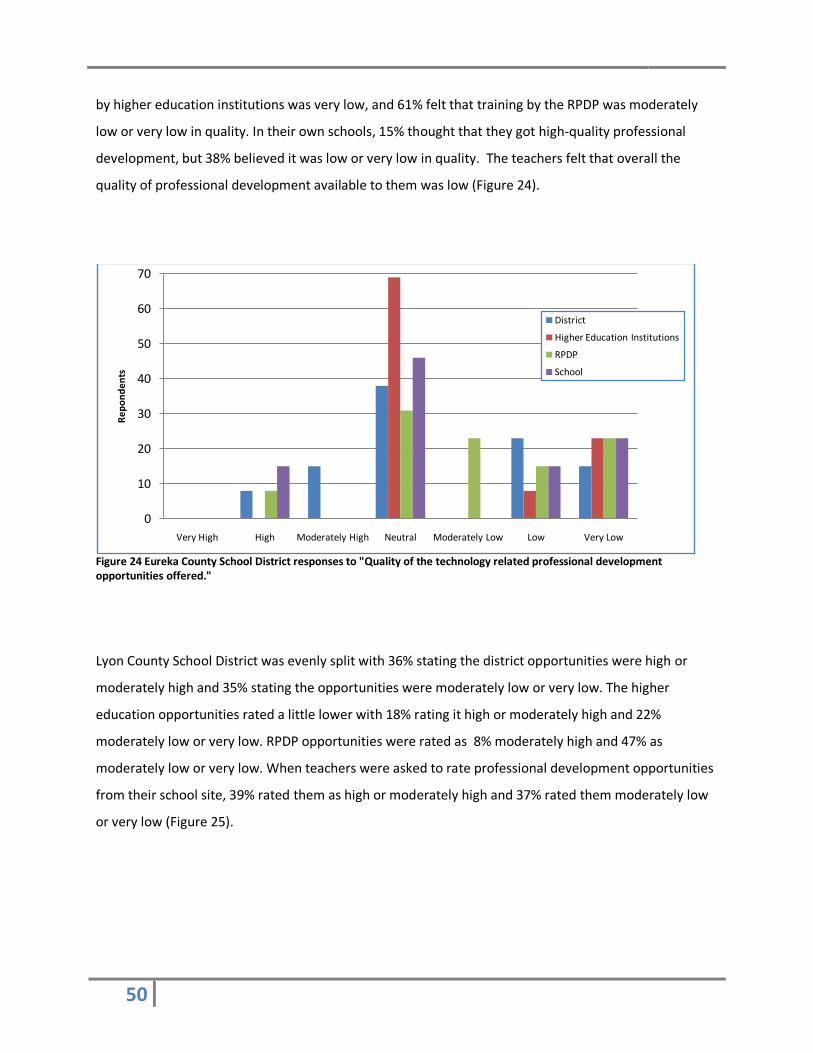
50
by higher education institutions was very low, and 61% felt that training by the RPDP was moderately
low or very low in quality. In their own schools, 15% thought that they got high-quality professional
development, but 38% believed it was low or very low in quality. The teachers felt that overall the
quality of professional development available to them was low (Figure 24).
Figure 24 Eureka County School District responses to "Quality of the technology related professional development opportunities offered."
Lyon County School District was evenly split with 36% stating the district opportunities were high or
moderately high and 35% stating the opportunities were moderately low or very low. The higher
education opportunities rated a little lower with 18% rating it high or moderately high and 22%
moderately low or very low. RPDP opportunities were rated as 8% moderately high and 47% as
moderately low or very low. When teachers were asked to rate professional development opportunities
from their school site, 39% rated them as high or moderately high and 37% rated them moderately low
or very low (Figure 25).
0
10
20
30
40
50
60
70
Very High High Moderately High Neutral Moderately Low Low Very Low
Re
po
nd
en
ts
District
Higher Education Institutions
RPDP
School

51
Figure 25 Lyon County School District responses to "Quality of the technology related professional development opportunities offered."
Of the Carson City School District teachers who responded to the survey, 40% thought the district
provided very high or moderately high quality professional development opportunities and 35%
believed the opportunities were moderately low or very low in quality. Twenty percent indicated that
professional development opportunities provided by higher education were very high or moderately
high quality and 35% believed the quality was moderately low or very low. Nine percent indicated that
quality of professional development provided by the RPDP was very high or moderately high and 37%
rated it as moderately low or very low in quality. When asked about the opportunities provided at their
school site, 43% felt that the quality was very high or moderately high and 37% rated them moderately
low or very low. Carson City School District teachers felt that professional development opportunities
provided by the district and their own schools were the most beneficial (Figure 26).
0
10
20
30
40
50
60
70
Very High High Moderately High Neutral Moderately Low Low Very Low
Re
spo
nd
en
ts
District
Higher Education Institutions
RPDP
School

52
Figure 26 Carson City School District responses to “Quality of the technology related professional development opportunities offered.”
Thirty-two percent rated Clark County School District’s professional development as very high or
moderately high quality and 27% moderately low or very low. When asked to rate the professional
development quality from higher education, 34% rated it very high or moderately high and only 15%
rated it moderately low or very low. Thirty-six percent of the teachers rated RPDP opportunities as very
high or moderately high in quality and 18% as moderately low or very low. The teachers that responded
to the survey felt 41% of the school-level professional development was very high or moderately high in
quality and 27% rated it moderately low or very low. Clark County teachers responded favorably in all
categories of professional development opportunities which is unique among the teachers reported
here (Figure 27).
0
10
20
30
40
50
60
70
Very High High Moderately High Neutral Moderately Low Low Very Low
Re
spo
nd
en
ts
District
Higher Education Institutions
RPDP
School

53
Figure 27 Lyon County School District responses to “Quality of the technology related professional development opportunities offered.”
Parent Surveys
A survey was distributed to parents in each district in Nevada in order to obtain their feedback on
technology use in schools and student technology use outside the classroom setting. A total of 915
parent surveys were completed from the following districts: Carson City, Churchill, Clark, Esmeralda,
Eureka, Humboldt, Lincoln, Mineral, Nye, Washoe, and White Pine. Responses to the parent survey were
not received from Douglas, Elko, Lander, Lyon, Pershing, or Storey Counties.
When asked about student technology use for homework purposes, a large majority of parents stated
that their student engages in technology use for homework in numerous subjects, including
mathematics, science, and language arts. Student use of the Internet as a research tool for various
homework assignments was widely reported by the parents that responded. Student use of the Internet
for online test-taking and class completion was also reported. Types of software technology used by
students at home that were identified by the parents surveyed included Microsoft Office elements of
Word, Excel, and PowerPoint. Many parents also reported that their students rely on the Internet for
homework assignments, such as online educational games and assignments that require research. With
that being said, a number of parents also stated that if homework assignments requiring the use of a
computer are going to be given to students, school districts that are promoting such assignments should
be providing students with a portable or home-based computer. The parents that responded in this
0
10
20
30
40
50
60
Very High High Moderately High Neutral Moderately Low Low Very Low
Re
spo
nd
en
ts
District
Higher Education Institutions
RPDP
School
54
manner argued that it is unfair to assume that all students have home access to a computer and the
Internet. Overall, a majority of parents stated that their student uses technology on a regular basis in
order to complete homework assignments.
Parents were also asked to report on their student’s use of technology in the classroom. A majority of
the parents surveyed stated that their student uses technology in such subjects as science, language
arts, mathematics, and computers. Specifically, student technology use was identified by parents by
subject, including: Microsoft Excel use in mathematics courses, word processing software and the
Internet for research and document writing purposes in science and language arts courses, and typing
skills programs in computer classes. Parents of younger students reported the use of learning games by
their students during class time, as well as the use of the computer to administer basic reading and
math assessments. The use of presentation software, such as Microsoft PowerPoint, was also reported
by the parents surveyed.
It was noted by some parents that in order for technology to be adequately taught, teachers and
administrators need to be knowledgeable in technology as well. One parent expressed concern that
teachers use technology in the classroom as a “babysitter” instead of teaching students about real-
world technology applications. Also, parents expressed concern that they are unaware of the technology
being taught to and used by their students, which hinders their ability to provide this technology at
home. Many parents would like to bring technology education into the home, but cannot do so without
knowing what types of technology are being taught by their student’s teachers. Finally, when asked to
identify their main concerns regarding their student’s technology use in school, many parents identified
the amount of time spent teaching technology in the classroom as their main concern. A large majority
of parents also expressed concern regarding district Internet filters and the likelihood that students
would be able to access inappropriate content on school-provided computers. Many of the parents
surveyed, most notably parents from Clark County, reported a strong desire for strict Internet filters on
school computers, as well as the need for regular monitoring of student computer use by administrators
and teachers. Based on the responses collected, it is important to parents that students have adequate
class time to learn technology, while ensuring that students are using technology properly and for
educational purposes only.
The parents that were surveyed were also asked to identify their expectations regarding technology use
in schools. An overwhelming majority of the parents surveyed stated that students need to be educated

55
in and utilize technology on a regular basis. Many parents expressed concern that without technology
education, students will be unsuccessful in a world that relies heavily on technology. Many of the
parents surveyed stressed the need for districts to provide students with current technology, rather
than using out-of-date machines to teach current uses of technology to students. A few of the
technological expectations identified by the parents surveyed included basic computer use, basic typing
skills, and knowledge of Internet capabilities. Many parents also stated that students should be
knowledgeable in Microsoft Office software, which includes Word, Excel, and PowerPoint. Overall, many
of the parents surveyed reported that their technology expectations are currently being met by the
schools within their district. One Clark County parent summed up the sentiments of most parents across
Nevada: “The world [our children] are living in is not the same as 5 years ago or even 10 years ago. In
Nevada, we are behind the times. Technology is the new age and we need to get into the 21st century. “
56
Appendices

57
Appendix A- Letters to Superintendents, IT Coordinators,
Principals, Teachers, Parents
Superintendent Letter
Dear Superintendent,
The Raggio Research Center, University of Nevada, Reno will be conducting the legislatively mandated
State Technology Needs Assessment Survey (STNA). This electronic survey will be sent to the designated
IT Coordinator in each school district, as well as to samples of teachers, administrators and parents. The
introduction letter will provide a link to Survey Monkey where the individuals will be invited to take the
survey.
We will be using the same sampling guidelines as were used for the 2008 STNA. For districts with fewer
than 1000 students, all of the classroom teachers will be surveyed. In districts with student populations
between 1000 and 10,000 students, we will be surveying 100 teachers each from elementary, middle
school/junior high and high schools (total 300 individuals). Districts greater than 10,000 students, 20%
of the teacher workforce will be randomly surveyed.
A piece of the previous survey that was missing was parent surveys. This part of data collection is
challenging at best. We will be sending letters to each school principal informing them of the surveys,
and asking them to distribute them in the most efficient way possible for their school site. They may
have a school wide parent notification system, teachers who use regular parent letter emails, a school
event such as parent teacher meetings, fundraisers or spirit days. For these events, perhaps a
community computer could be made available for parents to complete the 7 question survey.
Principals may have email lists of club, sport or band parents that could request the completion of the

58
surveys with the appropriate links. We will also be contacting the Nevada State PTA for dispersal of the
information.
In total we will be contacting the IT Coordinators for 17 districts, 7000 teachers and as many parents as
can be contacted in the possible ways explained above. It would seem that this data would represent a
good picture of the technology needs and uses in Nevada from many perspectives.
We greatly appreciate your help in supporting your principals, teachers and It Coordinators in
completing this critical survey.
Thank you in advance for your support. Please feel free to contact us with any questions.
Respectfully,
Jacque Ewing-Taylor, Projects Director
and
Laurie McKinnon, Projects Coordinator
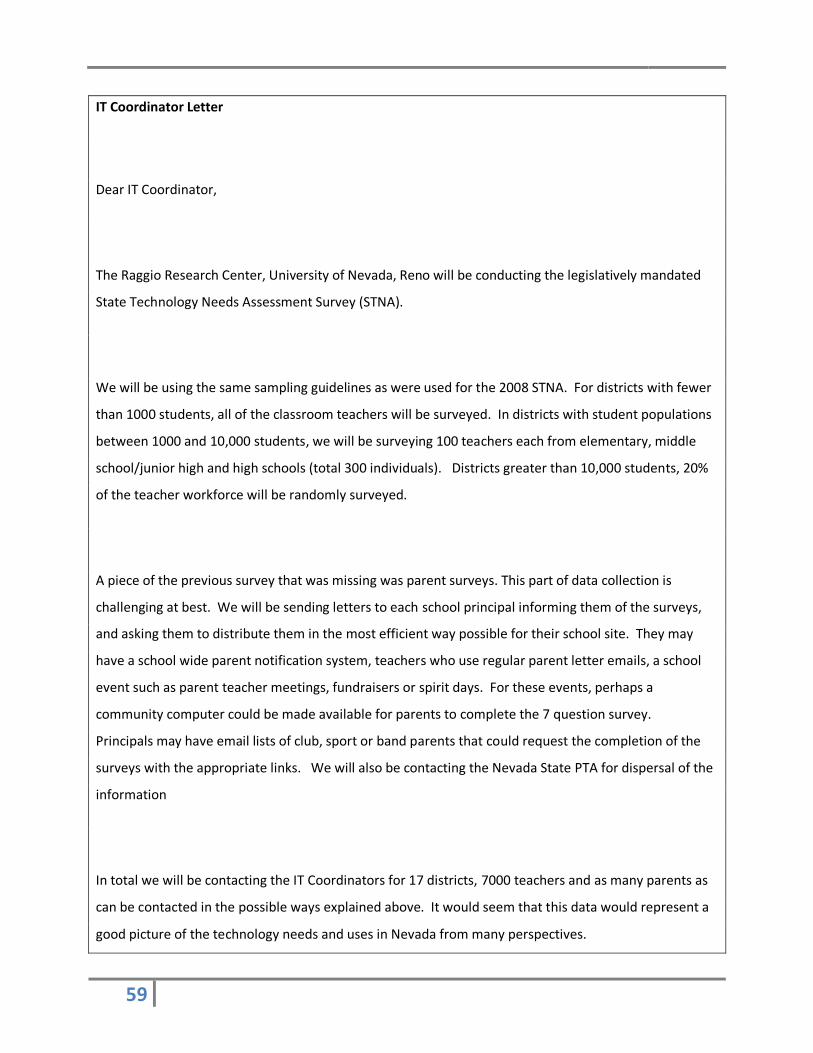
59
IT Coordinator Letter
Dear IT Coordinator,
The Raggio Research Center, University of Nevada, Reno will be conducting the legislatively mandated
State Technology Needs Assessment Survey (STNA).
We will be using the same sampling guidelines as were used for the 2008 STNA. For districts with fewer
than 1000 students, all of the classroom teachers will be surveyed. In districts with student populations
between 1000 and 10,000 students, we will be surveying 100 teachers each from elementary, middle
school/junior high and high schools (total 300 individuals). Districts greater than 10,000 students, 20%
of the teacher workforce will be randomly surveyed.
A piece of the previous survey that was missing was parent surveys. This part of data collection is
challenging at best. We will be sending letters to each school principal informing them of the surveys,
and asking them to distribute them in the most efficient way possible for their school site. They may
have a school wide parent notification system, teachers who use regular parent letter emails, a school
event such as parent teacher meetings, fundraisers or spirit days. For these events, perhaps a
community computer could be made available for parents to complete the 7 question survey.
Principals may have email lists of club, sport or band parents that could request the completion of the
surveys with the appropriate links. We will also be contacting the Nevada State PTA for dispersal of the
information
In total we will be contacting the IT Coordinators for 17 districts, 7000 teachers and as many parents as
can be contacted in the possible ways explained above. It would seem that this data would represent a
good picture of the technology needs and uses in Nevada from many perspectives.

60
As the designated IT Coordinator in your district, please go to the following link and complete the
survey:
https://www.surveymonkey.com/s/J777DTJ
Also attached are the Superintendant, Principal and Teacher Letters we sent out this week.
Thank you in advance for your support. Please feel free to contact us with any questions.
Respectfully,
Jacque Ewing-Taylor, Projects Director
and
Laurie McKinnon , Projects Coordinator
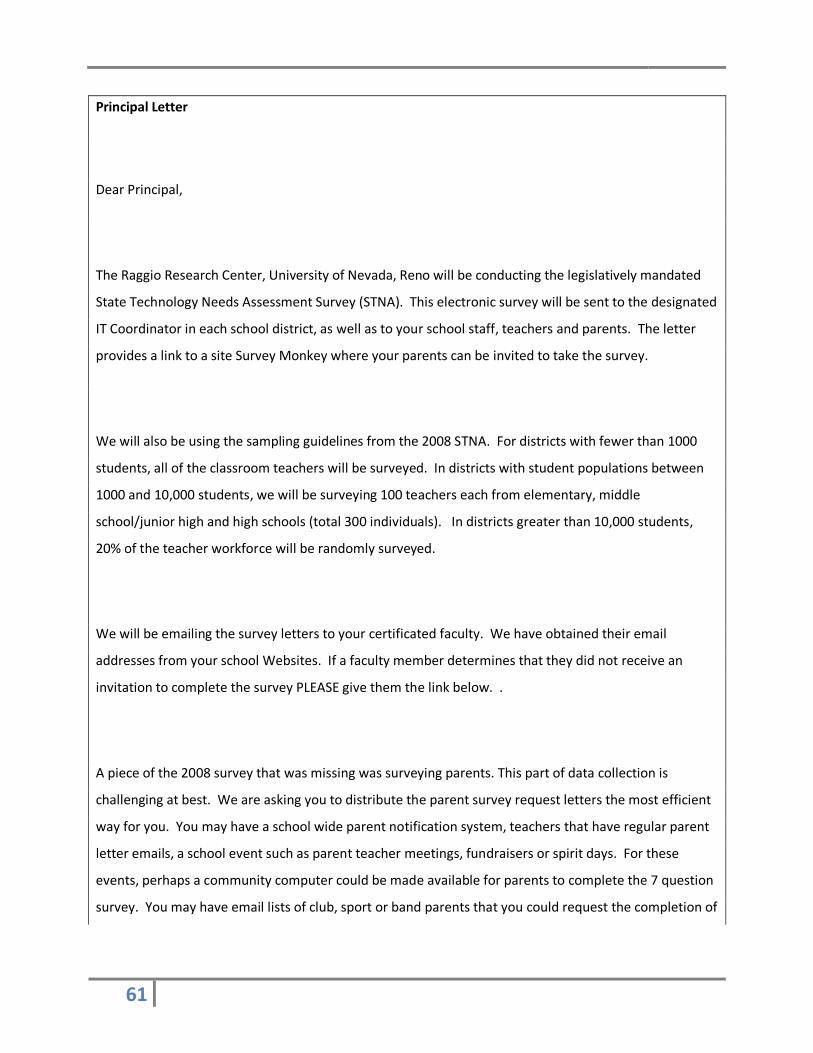
61
Principal Letter
Dear Principal,
The Raggio Research Center, University of Nevada, Reno will be conducting the legislatively mandated
State Technology Needs Assessment Survey (STNA). This electronic survey will be sent to the designated
IT Coordinator in each school district, as well as to your school staff, teachers and parents. The letter
provides a link to a site Survey Monkey where your parents can be invited to take the survey.
We will also be using the sampling guidelines from the 2008 STNA. For districts with fewer than 1000
students, all of the classroom teachers will be surveyed. In districts with student populations between
1000 and 10,000 students, we will be surveying 100 teachers each from elementary, middle
school/junior high and high schools (total 300 individuals). In districts greater than 10,000 students,
20% of the teacher workforce will be randomly surveyed.
We will be emailing the survey letters to your certificated faculty. We have obtained their email
addresses from your school Websites. If a faculty member determines that they did not receive an
invitation to complete the survey PLEASE give them the link below. .
A piece of the 2008 survey that was missing was surveying parents. This part of data collection is
challenging at best. We are asking you to distribute the parent survey request letters the most efficient
way for you. You may have a school wide parent notification system, teachers that have regular parent
letter emails, a school event such as parent teacher meetings, fundraisers or spirit days. For these
events, perhaps a community computer could be made available for parents to complete the 7 question
survey. You may have email lists of club, sport or band parents that you could request the completion of

62
the surveys by forwarding the attached letter with the survey links. Our goal is to get feedback from as
many of your parents as possible in order to get an accurate perspective.
In total we will be contacting the IT individuals for 17 districts, 7000 teachers and as many parents that
can be contacted in the possible ways explained above. These data will hopefully represent a good
picture of the technology needs and uses in Nevada from many perspectives. We greatly appreciate
your help!
Here is the link to the parent letter and Survey: 2010 NDE Technology Needs Assessment - Parent Survey
(Douglas)
Please have your parents respond no later than March 15, 2010.
Teacher Survey Monkey Link: 2010 NDE Technology Needs Assessment - Teacher Survey (Douglas)
Please have your teachers respond no later than March 15, 2010.
Thank you in advance for your support.
Respectfully,
Jacque Ewing-Taylor, Projects Director
and
Laurie McKinnon, Project Coordinator

63
Teacher Letter
Dear Teacher,
The Raggio Research Center, University of Nevada, Reno will be conducting the legislatively mandated
State Technology Needs Assessment Survey (STNA).
We ask that you go to the following link and take the teacher survey
https://www.surveymonkey.com/s/BL8ZR8C.
This survey will provide important feedback for the Nevada State Legislature. The results will be
tabulated on a district wide basis. If one of your colleagues has not received this email, please feel free
to pass it along to them.
In total we will be contacting the IT individuals for 17 districts, 7000 teachers and parents. We are
asking your principal to determine the best way to distribute the parent surveys. If you have a
classroom email letter, a school wide activity or another idea to contact as many parents as possible,
please talk to your principal. We believe this survey will represent a good picture of the technology
needs and uses in Nevada from many perspectives.
We greatly appreciate your assistance in completing the survey. We realize that you are incredibly busy
and thank you for your time and support. Please feel free to contact us with any questions.
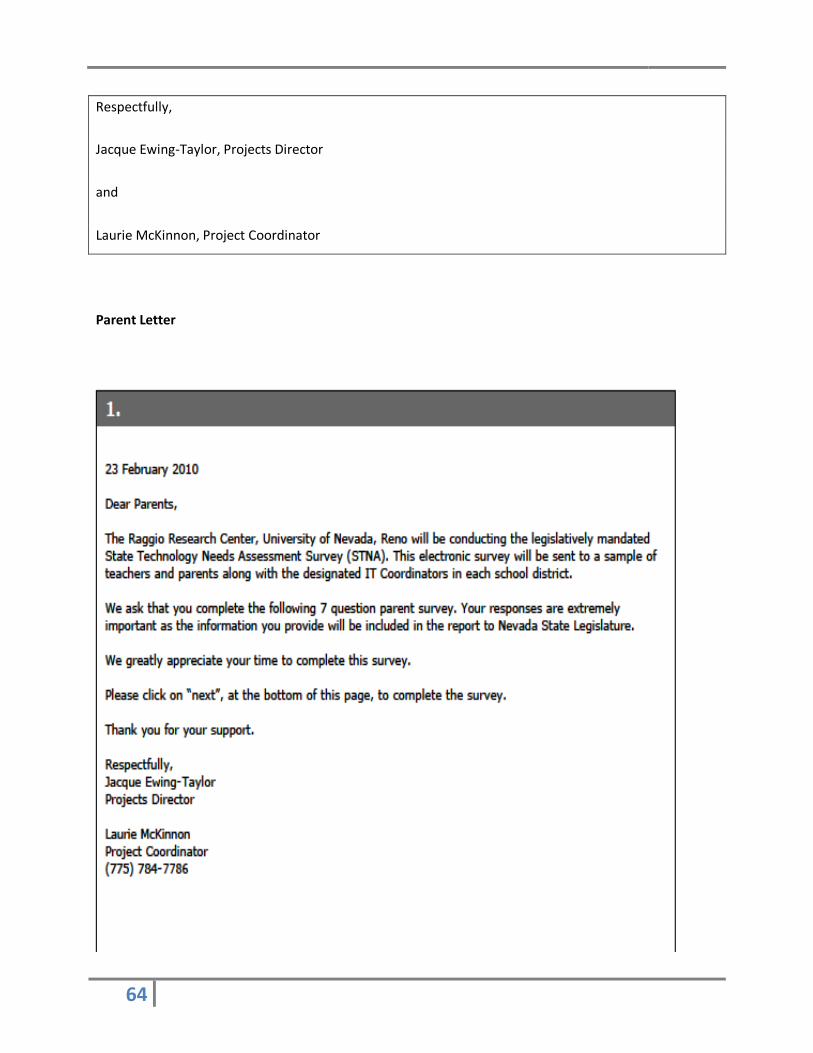
64
Respectfully,
Jacque Ewing-Taylor, Projects Director
and
Laurie McKinnon, Project Coordinator
Parent Letter
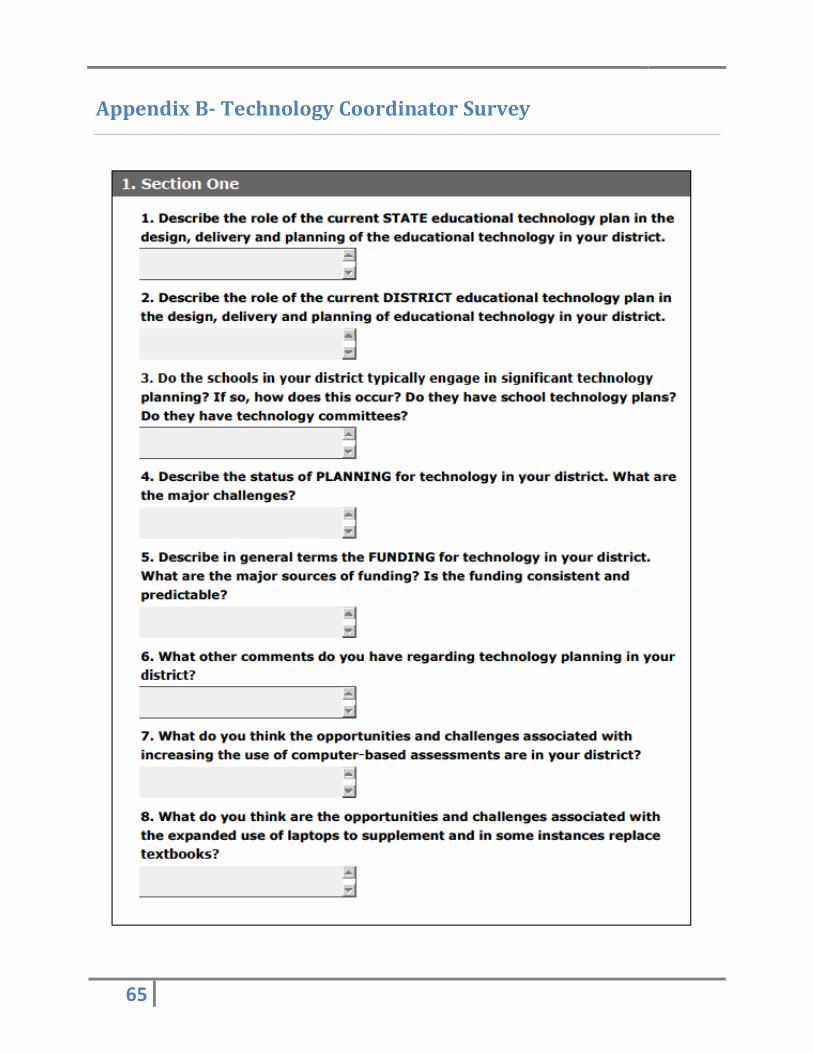
65
Appendix B- Technology Coordinator Survey
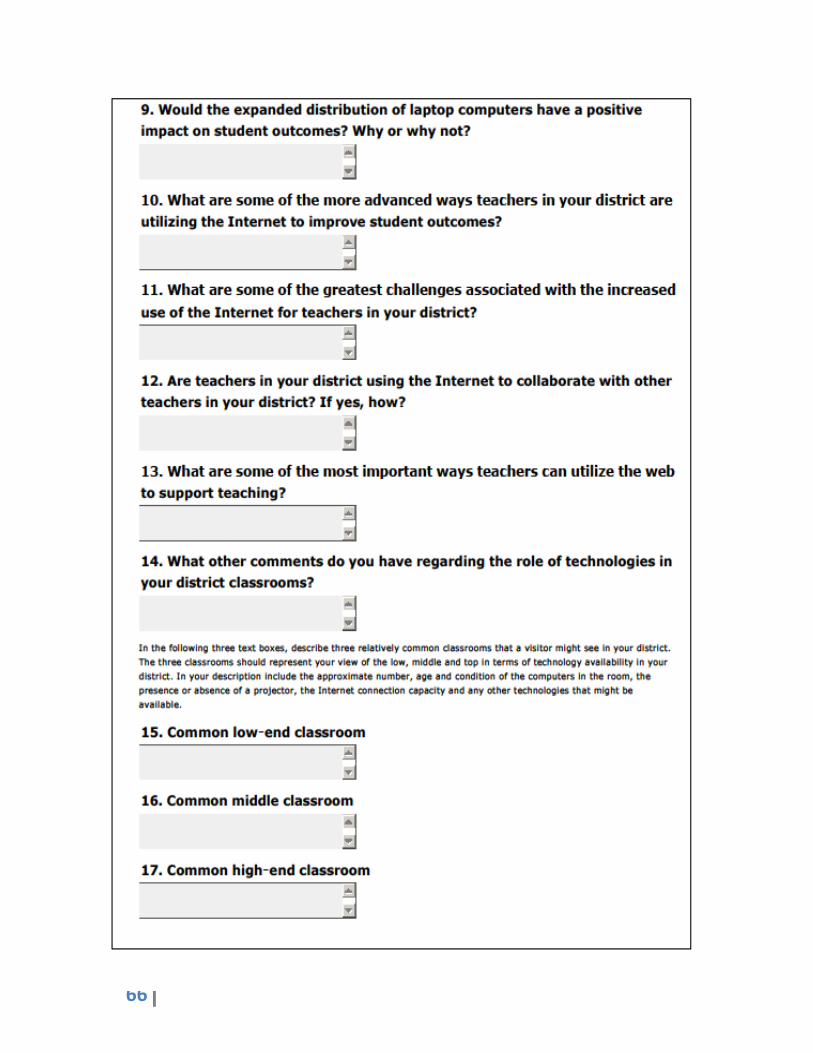
66
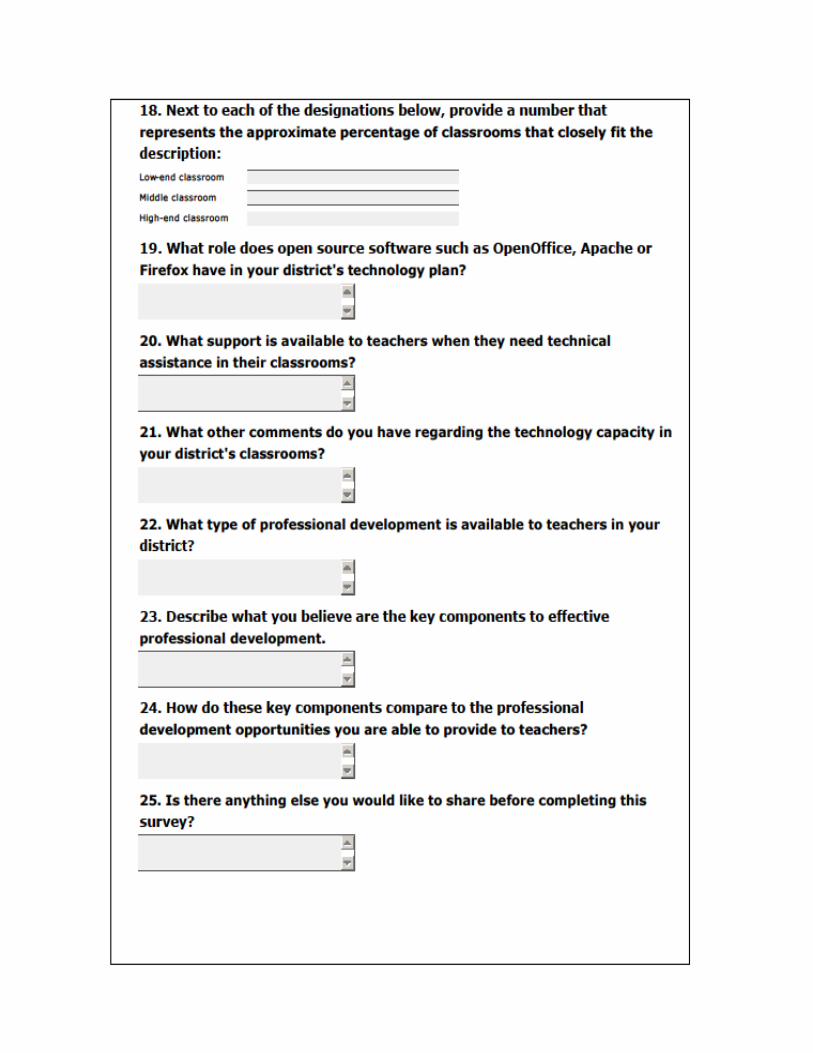
67
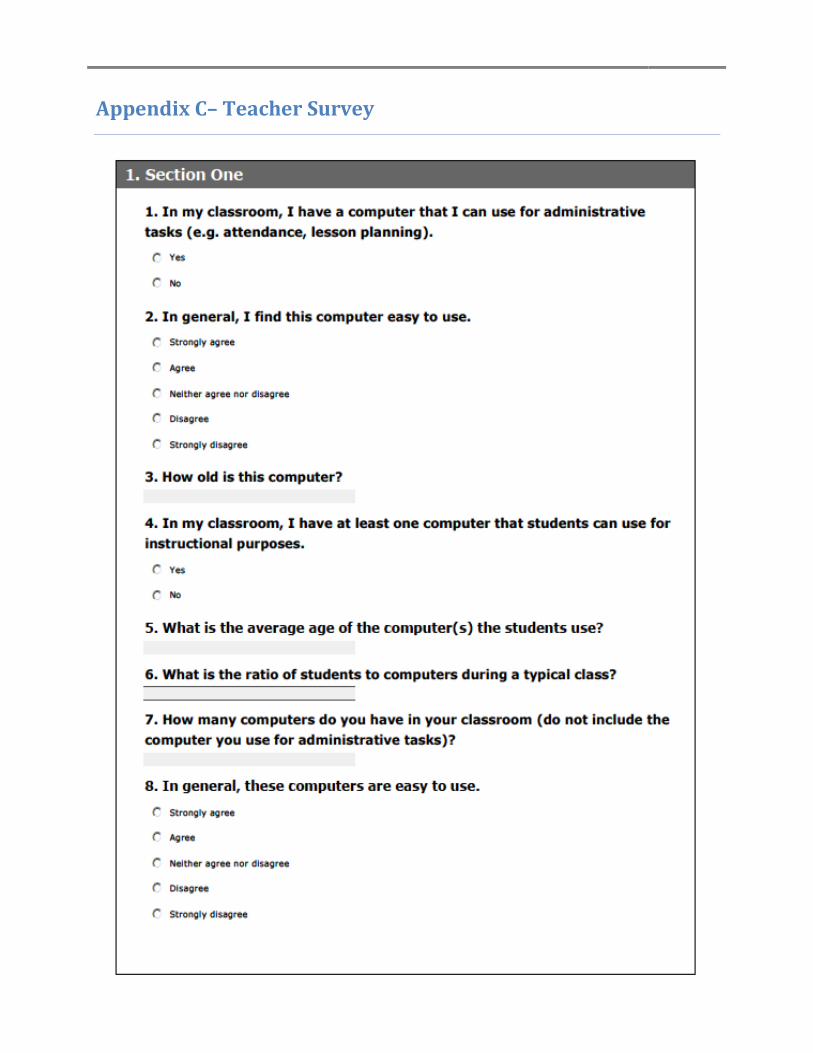
68
Appendix C– Teacher Survey
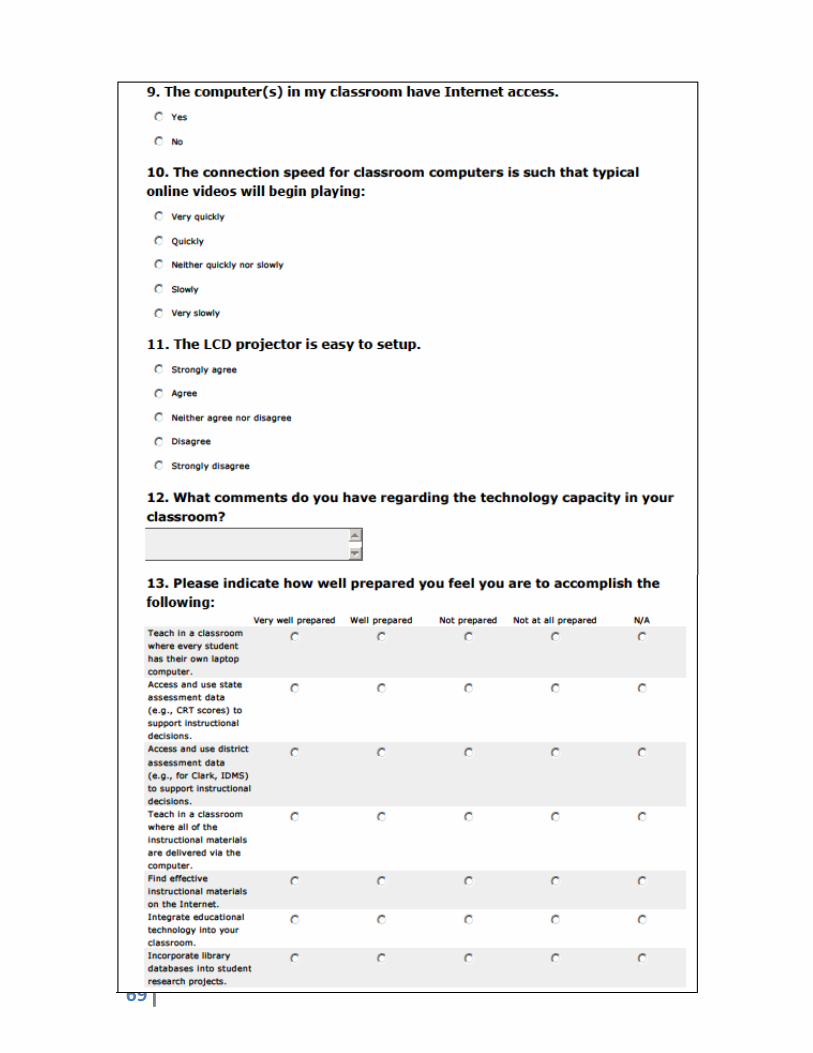
69
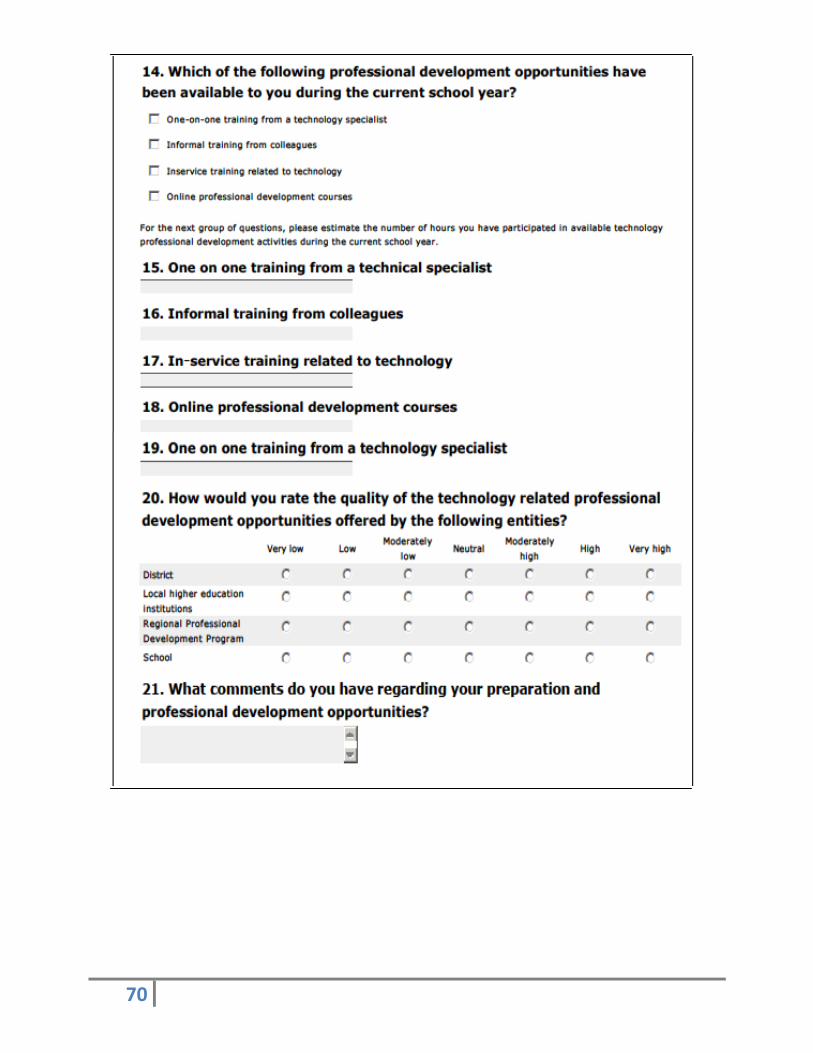
70
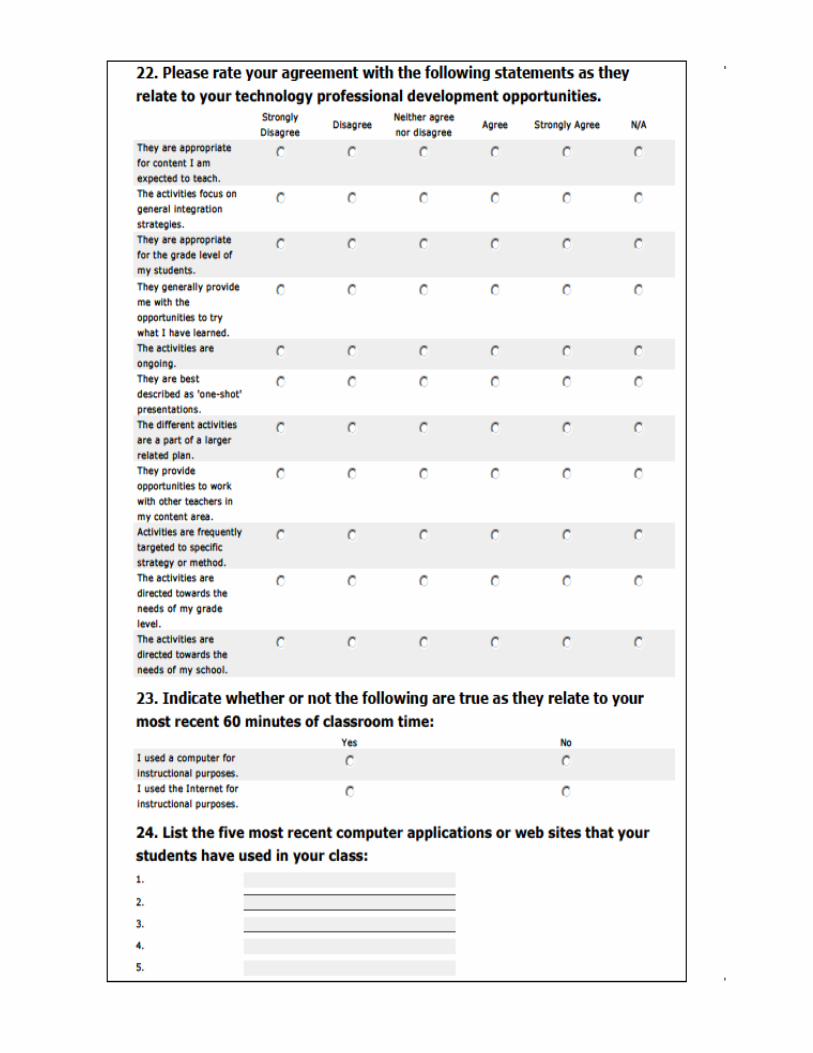
71
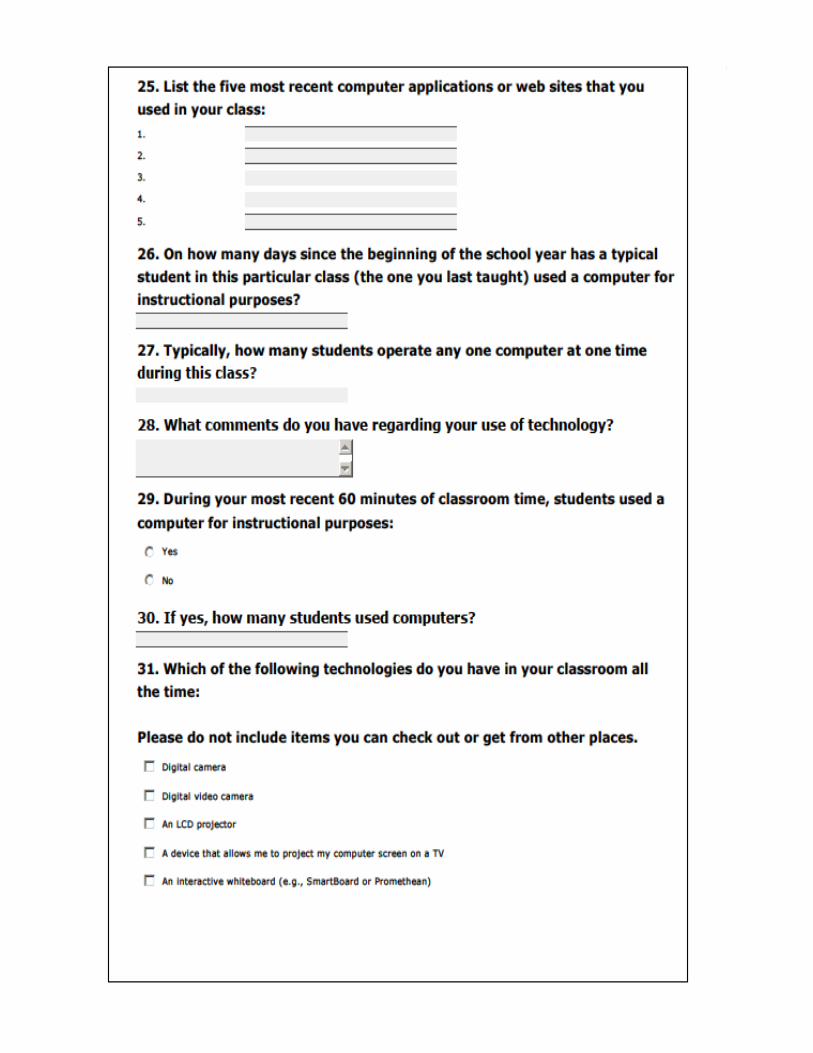
72
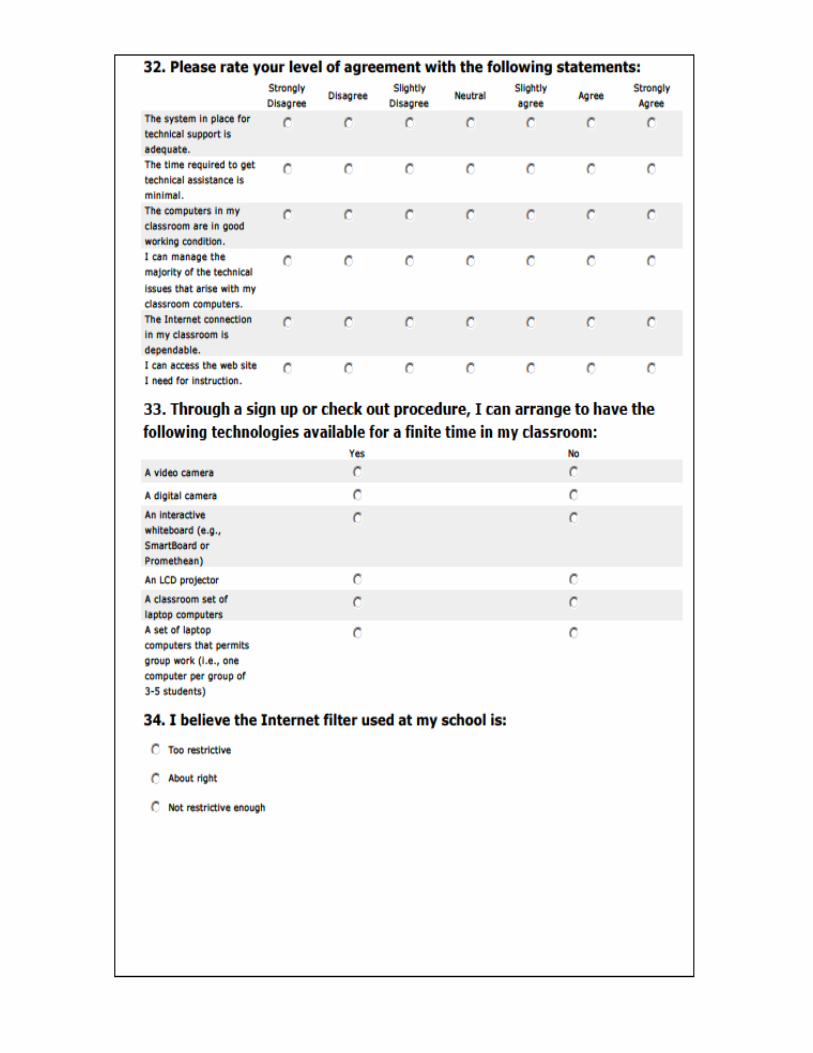
73

74

75
Appendix D- Parent Survey

76
Appendix E – IT Coordinators’ Interview Protocol
Coordinator Interview: Name ______________________District _______________
1. What is the current status of the district (or school) educational technology plan?
A. When was your district educational technology plan last updated?
B. What measurable goals were included and what, if any, data was collected?
C. How well aligned is your district plan with the state and national educational technology
plans?
D. How well did the district plans support planning for technology integration?
E. How well did the district plans subsequently impact achievement?
2. In what ways can educational technologies improve instructional development, delivery, and
assessment in your district and/or school?
A. Is your district using any computer based assessments at this time?

77
(Please describe)
1. What would your reaction be to the use of computer-based assessments for the high
school proficiency exam (if applicable, or CRT's for elem. Coord.)
a. Advantages
b. Disadvantages
B. Is your district currently involved in any laptop initiatives (e.g., 1-1 or laptop carts)?
C. Is your district currently involved in any initiatives to replace traditional textbooks with
electronic content?
D. Is your district currently involved in any initiatives to use of Web-based
collaborative technologies to support teachers’ lesson planning?
3. Capacity of the district (or school) in Nevada
A. What is the probability that a classroom teacher in your district (or school) at any given
moment will have in their classroom:
1. A computer that is less than five years old, internet connected, and currently in good
working condition? Filtering?
78
2. A ratio of students to computers in the classroom that is less than 5 to 1
3. A projection device that permits all of the students in the classroom to view the
computer display and requires minimal setup in terms of time and expertise
4. Access to timely, dependable and effective technical support?
B. What is the probability that a classroom teacher in your district (or school) will have on any
given day:
1. Utilized technology to support the delivery of a lesson?
2. Asked students to utilize technology to complete and individual activity?
3. Asked students to utilize technology to complete an activity that requires students to
engage in analytic or evaluative tasks.
C. What are the relationships between the access and use?
1. Is this a direct relationship or are their other factors?