2011 annual report · strategy management internal audit ... in line with this goal, with an...
TRANSCRIPT

Büyükdere Caddesi No: 163 34394 Zincirlikuyu - İstanbul - Turkey Tel: (00 90) 212 306 50 00 Faks: (00 90) 212 306 56 00
2011
2011
ANN
UAL
REPO
RT
ANNUAL REPORT

CONTENTS
Vision and Mission
Core Values and Business Principles
Key Financial Indicators
Çalık Holding in Brief
Milestones
Message from the Chairman
Message from the CEO
Executive Committee
Energy Sector
Telecom Sector
Textile Sector
Construction Sector
Finance Sector
Media Sector
Mining Sector
Social Responsibility
Corporate Management
Organizational Structure
Human Resources
Occupational Safety, Environment and Quality Policies
Strategy Management
Internal Audit
2011 Re�ections in Press
Independent Audit Reports
Consolidated Financial Statements
Contact
2
3
4
6
8
10
12
14
16
24
30
36
46
56
66
71
74
75
75
78
78
79
80
82
84
160

A Leading Company Which Generates Added Value For The Countries It Operates In;

ÇALIK HOLDİNG VISIONTo be the most valuable Turkish enterprise in three aspects: employees, management practices and business portfolio.
Our Group derives its strength through its business perception shaped by courage, innovation ve prudence. Our vision consists of three main components:
1. To be the most preferred workplace employing the best.2. To be an exemplary Group with its management understanding and systems.3. To own a superior and high return business portfolio.
ÇALIK HOLDİNG MISSIONTo enrich all stakeholders in Turkey and in other countries we do business in, through our innovative, courageous and prudent business understanding. Çalık Group exists to enrich its stakeholders. �e Group undertakes all its operations in line with this goal, with an innovative, courageous and prudent spirit. Çalık is a family internalizing its countries' high values and paying respect to all colours of the geographies it has a presence in.
2
A B
USI
NES
S U
ND
ERST
AN
DIN
G W
ITH
RIS
ING
TA
RG
ETS

3
ÇALIK HOLDİNG CORE VALUES;
Fairness - We act with a sense of justice and fairness.
Ethics - We have high moral standards.
Reputation - We keep our reputation above all else.
Respect - We see our di�erences as richness and reject all form of discrimination
Solidarity - We always support each other
Human Focus - We believe success is possible and meaningful with people.
ÇALIK HOLDİNG BUSINESS PRINCIPLES;
Determination - We work hard for what we promise.
Competence - We work with competent people.
Courage -We believe in ourselves and can be assertive
Consultation - We value di�erent ideas.
Customer Focus - We strive to better understand our customer's need and
expectations
Sense of Responsibility - We feel responsible to uphold values of humanity, our
society and company.
All Çalık Group Members faithfully embrace to these core values and business principles.

Çalık Holding’s Key Financial Indicators
STA
BIL
ITY
AN
D S
UST
AIN
AB
ILIT
Y
4
Key Financial Indicators(USD �ousands) 2011 2010 2009Total Assets 6,404,566 5,816,908 4,500,252Total Equity 944,851 1,113,662 1,136,558Net Sales* 2,929,166 2,056,830 1,510,786Gross Pro�t 715,265 474,686 386,830EBITDA* 449,219 256,479 197,367Net Pro�t 72,327 20,315 -6,224
Basic Ratios 2011 2010 2009Gross Pro�t Margin (%) 24% 23% 26%EBITDA Margin (%) 15% 12% 13%Return on Equity (%) 7% 2% -1%Net Debt/EBITDA 3.15 5.47 6.23
* �e amortisation of the invesments, arising from Transfer of Operating Rights owned by YEDAS, is excluded (IFRIC 12 e�ect).

5

6
ÇA
LIK
SIG
NAT
UR
E IN
7 S
EVEN
SEC
TO
RS
AR
OU
ND
TH
E W
OR
LD ÇALIK HOLDİNGÇalık Holding’s foundation was laid by Mr. Ahmet Çalık in 1981, a member of Çalık Family whose commercial
activities date back to 1930s. Today, Group employs more than 20,000 people by virtue of its business enterprises in
15 countries within the sectors of energy, telecom, textile, construction, �nance, media, and mining.
Çalık Holding, operating in a region extending from Central Asia to North Africa and from Middle East to the
Balkans, has approximately 3 billion USD annual turnover. �e Group's, consolidated asset size is approximately 6.5
billion USD and is currently working on 20 Billion USD worth project portfolio.
As a result of its active involvement in the domestic and foreign tenders, Çalık Group has incorporated Albtelecom,
the land line operator and internet supplier of Albania in 2007, the Turkuvaz Media Group, one of two largest media
enterprises of Turkey in 2008, and Yeşilırmak Electricity Distribution Inc. (YEDAŞ), which is accountable for the
electric distribution in 5 major cities of Turkey in 2010.
Initially aiming to create added value and making investments bene�cial for the people of every country it operates in,
Çalık Holding has begun to construct two power plants with totally 2,000 MW capacity in Iraq, started the broadcast
of two new thematic channels A Haber (A News) and Minika and recently started Infusion Solution Project with a
capacity of 10 million bottles and turn-key delivery Dental Hospital Projects, right after completing Eye Hospital
Project with a capacity of 120 beds in Turkmenistan.
Çalık Holding has become one of the leading Turkish investors in Central Asia and the Balkans as well as one of the
largest employers in Turkey. Çalık Holding has established international collaborations with many global and
prestigious companies such as Rosneft, Initec Energia, Eni, Mitsubishi, EBRD, EWE, General Electric, Alacer Gold,
Qatar Holding and Türk Telekom.
Çalık Holding has undertaken two energy projects which are regarded as global scaled milestones of Turkey -
Samsun-Adana/Ceyhan Crude Oil Pipeline Project and Adana (Ceyhan) Oil Re�nery Project, the �rst green-area
re�nery project to be established in the heart of East Mediterranean. Holding signed JV agreements with Alacer Gold,
Çalık Holding’s partner in the Çöpler Gold Mine in İliç, Erzincan, for 16 properties located in di�erent cities in
Turkey. Holding owns 50% of the three companies established for this purpose. Total gold production in Erzincan’s
currently operating Çöpler Gold Mine, exceeded 185 thousand of ounces in 2011.
Çalık Holding, known for its reputation and reliability in the sectors it operates, with its powerful �nancial structure,
has shaped its corporate plans, strategies and objectives on the basis of sustainability. Çalık Holding boasts an
innovative and corporate structure that renders it a trail blazer. In the light of its proven growth strategies Çalık
Holding has initiated outstanding projects and generated value added investments in the countries it operates. �e
Group makes the best of combining the entrepreneurial and productive qualities of its rich corporate culture to
remain among the leading and prevailing actors in its primary business �elds.

7

9
2001
■ Turkmenbashi Open-End Yarn Factory started to operate.
■ Fitch IBCA (Fitch Ratings) announced the �rst credit rating report
for Çalık Holding; Group was assigned a BBB (Tur) long-term
national credit rating.
2002
■ Gap İnşaat underpinned its position with global
construction projects for fertilizer, paper and cement
production facilities.
2003
■ Total assets of Çalık Holding exceeded 1 billion USD.
■ In line with the agreement signed with EBRD, production
capacity of Turkmenbashi Jeans Complex was expanded.
■ Çalık Enerji, in cooperation with General Electric realized
Turkmenbashi, Abadan and Balkanabad Power Plant Projects
with total 376 megawatt.
2004
■ Bursagaz, the natural gas distribution company serving Turkey's
fourth biggest city Bursa, was acquired by Çalık Enerji at the
privatization tender.
■ Gap İnşaat realized Yaslik Paper Factory project on turnkey
delivery basis.
2005
■ Italian energy company ENI became partner to TAPCO, which
was established to realize the Samsun-Adana/Ceyhan Crude
Oil Pipeline Project by Çalık Enerji.
■ Çalık Holding started wide-scoped SAP application in its
body; a �rst in Turkey.
■ Group, in cooperation with Etisalat o�ered the second best
prize in Türk Telekom tender with 6.5 billion USD; and in
cooperation with IOCL o�ered the second best prize in Tüpraş
tender with 4,120 billion USD.
■ Gap İnşaat completed the Tedjen Ammonium Factory and
Kelete Cement Factory Projects on turnkey delivery basis.
2006
■ Construction Licensee of Samsun-Adana/Ceyhan Oil Pipeline
Project by TAPCO was approved by National Security Council
and President Mr. Ahmet Necdet Sezer.
■ Çalık Holding acquired 60% shares of Banka Kombetare
Tregtare (BKT), the second biggest bank of Albania.
■ Gap Güneydoğu Tekstil loaned usury credit worth 50 million
USD from the consortium led by Kuwait Finance House and
Kuveyt Türk Katılım Bankası with the longest redemption date
of 4.5 years ever obtained.
■ Çalık Enerji completed Ashgabat Power Plant with 254
megawatt capacity in association with General Electric.
2007
■ Çalık Holding realized 200 million USD Eurobond issue with
�ve-year term loan. International investing corporations
showed a tremendous interest in the issue and Holding received
approximately one billion USD demand; �ve times more than
the supply ratio. �is was a �rst in Turkish Republic history.
■ Çalık Holding acquired Albtelecom, Albania's largest �xed line
telephone operator and internet provider, by privatization.
■ Banka Kombetare Tregtare's (BKT) �rst branch in Kosovo was
opened.
3
MILESTONES
Ever since its inception, Çalık Holding has realized successful projects and seized a
sustainable growth trend thanks to reasonable strategies it adopted.
From 1930’s to 1980’s…
■ Çalık Family’s involvement in textile industry
goes back to the 1930s. However, Ortadoğu
Tekstil, established in 1981 by the Group’s
founder, Ahmet Çalık marked the �rst
corporate venture.
1980’s
■ Mr. Ahmet Çalık continued to undertake new
ventures in the textile industry through the
second half of 1980’s. In 1987, Gap
Güneydoğu Tekstil, regarded as one of
world’s leading manufacturers of denim
fabric was founded.
1994
■ Gap Pazarlama was established to boost the
share of the Group in the international textile
trade.
1995
■ �e Group set out to establish the �rst denim
factory in CIS countries, and became one of
the �rst foreign investors in Ashgabat,
Turkmenistan.
1996
■ Initially established to construct the textile
factories for the Group, Gap İnşaat was
restructured and launched with the mission
of business development.
1997
■ All the subsidiaries of the Group were
reorganized under a uni�ed management
and Çalık Holding was established.
■ Serdar Spinning Factory and Turkmenbashi
Jeans Complex were put into service in
Turkmenistan.
1998
■ Çalık Enerji was established.
1999
■ �e Group entered the �nance sector with the
establishment of Çalıkbank.
2000
■ Türkmenbashi Textile Complex started its
production in Turkmenistan.
8

■ Çalık Enerji acquired Kayserigaz, a natural gas
distribution and operating company in Kayseri.
■ Çalık Enerji agreed to sell 39.9% share of Bursagaz to
the German-based international energy �rm EWE.
■ Energy Market Regulatory Authority (EMRA)
approved the license application of Çalık Enerji for an
integrated re�nery and petrochemicals facility with a
15 million ton annual capacity
■ Çalık Enerji completed Dashoguz Power Plant with 254
megawatt of power in association with General Electric.
2008
■ Bursagaz was awarded with EFQM European Quality
Award's Grand Prize that was given only to seven
companies in Turkey.
■ In line with its growth and restructuring strategies Çalık
Enerji after transforming Bursagaz and Kayserigaz to
the best managed private sector gas distribution
companies, sold part of its shares valued over 35X
EBITDA to its German partner, EWE. Group has
realized one of the most bene�cial sales of shares to the
foreigners in Turkey.
■ Çalık Holding completed the legal procedures for the
takeover of the media group ATV-Sabah Commercial
and Economical Entity, acquired with an o�er of
USD 1.1 billion at the tender held by the Turkish
Savings Deposit Insurance Fund (SDIF) in 2007.
■ 25% shares of ATV-Sabah Media Group were sold to
the Qatar Investment Authority.
■ Çalık Holding became one of the corporations that
provided the highest Foreign Direct Investment (FDI) to
Turkey with approximately 1 billion USD in last two years.
■ Çalıkbank was restructured and renamed as Aktif Bank.
■ In line Çalık Holding’s production strategy in
di�erent geographic areas, Çalık Holding commenced
production in Egypt Confection Factory.
■ Eagle Mobile, the youngest operator in the Albanian
GSM market, commenced its operations March by
completing its preparations within six months.
2009
■ Çalık Holding established a partnership with
Canadian based Anatolia Minerals of which shares
are traded at Toronto Stock Exchange and entered
mining sector.
■ Turkuvaz Media Group formed a partnership
with �e New York Times, one of the most prestigious
newspapers around the world, to o�er the
newspaper to readers in Turkey every Sunday.
■ Çalık Holding became 100% owner of Banka
Kombetare Tregtare (BKT) by purchasing share of
total 40% from EBRD and IFC.
■ Çalık Enerji won the tender for Yeşilırmak Elektrik
Dağıtım company who undertook electric
distribution to Samsun, Amasya, Çorum, Ordu and
Sinop Provinces against tender price of 441.5 USD in
electricity distribution privatization realized in
November.
2010
■ Turkuvaz Media Group, comprising 20% shares of
Turkish television and newspaper advertising market
with its in-�eld leading 1 TV channel, 4 newspapers
and 26 magazines, signed a content exchange
agreement with Maeil Business, the largest media
group in South Korea.
■ Eagle Mobile increased its market share 15%, in
customer base.
■ Eastern Mediterranean Petro Chemistry and Re�nery
Industry and Trade I.C., signed an agreement with
Shaw Group to receive Project Management
Consulting (PMC) services regarding Adana
East Mediterranean Re�nery Project.
■ Çalık Maden was restructured and received
the name Lidya Madencilik.
■ Çalık Enerji won the tender for construction
of El Khairat Natural Gas Cycle Power Plant
with 1,250 Megawatts capacity for 445.5
USD contract price.
■ On 22 December, the �rst gold was
produced in Çöpler Gold Mine operated
by Anagold Madencilik for which Lidya
Madencilik has partnership with Canadian
centered Alacer Gold.
■ Gap İnşaat undertook the project consisting of
reclamation of 19 km highway connecting
Baghdad International Airport to the city center
and establishing landscape area of 1,600 thou-
sands square meters in Iraq.
■ Çalık Holding and the Russian national oil
company Rosneft agreed to form a
partnership for international oil trade and
cooperation in the Turkish market.
■ Handover procedure of Yeşilirmak Electric
Distribution Company (YEDAŞ) was
completed and the company participated
in the body of Çalık Enerji.
■ Turkuvaz Media Group’s EBITDA reached 85
Million USD, the highest number ever in its
history.
2011
■ Turkuvaz Medya launched two new thematic
channels: A Haber and Minika.
■ Çalık Enerji, began the construction of a
750-MW power plant in Mosul, Iraq after
winning the tender.
■ Gap İnşaat completed 5 months ahead of
schedule a 120-bed Eye Hospital in Ashgabad,
a turnkey project commissioned by the
Ministry of Health of Turkmenistan. Two
other turnkey projects in Ashgabad;
construction of Infusion Solution Plant with
an annual capacity of 10 million bottles and
construction of Dental Hospital, commissioned
both by Turkmenistan Ministry of Health,
have started.
■ Under the aid campaign for Somalia initiated
by Turkuvaz Medya in collaboration with
TİKA and the Red Crescent of Turkey about
100 million TL has been collected.
■ Gap Güneydoğu Tekstil established its own
R&D department.
■ Lidya Madencilik concluded partnership
agreements for 16 new mining areas located in
various provinces of Turkey with its associate
Alacer Gold, acquiring a 50% share in each of
the three companies founded for that
purpose.
9

THE FUTURE IS WRITTEN WITH PAST...
Our Venerable Friends,
We have been facing rapid changes in the world in many areas ranging from economics to politics, from global power balances to individual lives since the beginning of the 21st century. �e year 2011 we have left behind also witnessed important developments.
Even though world economy has entered a period of recovery after the global crisis, mounting risks have continued to present a threat to the economy in 2011. Despite this negative atmosphere, Turkey has strengthened and improved its position with a higher grade at a time when the grades of leading countries were lowered by international rating corporations. Meanwhile, Turkey’s economical achievements maintained in 2011 were not con�ned to these. �e accomplishments of our country that is gradually becoming more in�uential are followed by countries ranging from Middle Asia to North Africa, Europe to the Middle East and their people. �e rise in the growth rate in economy and industry attained by Turkey brings important responsibilities to Çalık Group that has realised various projects with the investments it has made. �e fact that our Group with a history of 30 years has had di�erent experiences both in Turkey and in many important countries in the world plays an important role in this. By this means, we regard and make use of this this troubled period that the world has su�ered from as an opportunity to improve our activites. Besides, being one of Turkey’s long established groups in the international arena, we are able to adjust ourselves to the di�ering conditions of each one of the 15 countries that we furnish services and continue to grow with our long standing period of experience of 30 years.
Investing In �e Future In EnergyEnergy comes �rst among the sectors that our group focuses on in parallel with the growth strategy of our group. Estimations on the possibility that world energy consumption will rise by approximately 40% in 20 years reveals the rectitude of the sectors we have chosen for economical growth. It should not be forgotten that the great majority of this demand is expected to be supplied from the region our country is located in. An important part of the world’s oil and natural gas reserves is found in the Hazar basin, the Middle East and Russian Federation that surrounds Turkey. In other words, in today’s World, when the demand for energy is increasing, Turkey is going to continue to play an important role in projects aiming to diversify the energy sources and transportation.
�erefore, we are conscious of the fact that the projects our group undertook in 2011 in the energy sector have strategic signi�cance. Similarly, the commendations we have received as a result of the projects we have realized is a source of pride for us. For instance, Yeşilırmak Electricity Distribution Corp. (YEDAŞ) that joined our family by the end of 2010 has been successful in winning the appreciation of their subscribers with the renovations and practices it has realized within the scope of our group’s vision and strategies.
Our targets in this �eld are not restricted to Turkey. Besides the natural gas transformation station Project in Uzbakistan, Çalık Enerji has made an advancement in the same sector in Iraq. Natural gas transformation stations with an overall power of 2,000 MW that we have started the constructions of near Karbala and Mosul are to be operated soon with an 860 million USD investment. With these projects, we not only supply the electricity need of the population of our fraternal neighbor, Iraq, but also endeavor to raise the quality of life for the people in the region by means of providing employment to approximately 2,000 people with our social responsibility projects that we implement in the region.
We Redound Gold Reserves To �e EconomyAnother issue that has left its mark on the agenda of 2011 as much as energy was the rise in gold prices worldwide. In this respect, we are pleased to have made signi�cant achievements as Çalık Group. In such a period as this, the gold mine we have established in the town of İliç in Erzincan has gained big signi�cance. In the Çöpler Gold Mine that succeeded in enlivening the economy and employment in Erzincan 185 thousand ounces of gold was produced last year, which exceeded the limits we had set in the beginning of the year.
Undertaking Important Projects In İstanbulIt is for certain that construction has been one of the leading sectors in our Company for 30 years. We sustained the projects that would add value to Istanbul, the rising star of the estate agency market. Amongst these, Metropol İstanbul, whose construction is continuing within the scope of the International Finance Center in East Ataşehir is one of the most exciting projects in the world.What we have brought in Istanbul is not con�ned to this. As Çalık Group, we are conducting “Şehrizar Konakları” project in one of the most valuable lands of Istanbul. �is project, established in Altunizade with an investment of 450 million TL, is planned to have been �nished by the end of 2012.
We also continue to actively partake in the urban transformation of Istanbul, regarded as one of the most beautiful cities in the world. With this purpose, our construction process at “Tarlabaşı Urban 10

11
Renovation Project”, in which Gap İnşaat is the contractor and is operated by the Beyoğlu Municipality is in process of construction.
It must be stated once again that Gap İnşaat is unrivalled when it comes to ‘speed’. Gap İnşaat that realized over 110 projects in a vast landscape �nished the construction and delivery of a hospital ahead of time in Turkmenistan. Furthermore, our company laid the foundation of 3 institutions in Turkmenistan. Also, the reconstruction of the 19 km highway that links the airport to the city centre with a project of 1.6 million square meter landscaping surrounding the area is currently in its last stage.
An Award For Our R&D Performance In TextileIn our country that is designated as ‘the country of textile’ we are continuing to have presence in this sector as Çalık Group. We are using technology more in order to strengthen our position in this sector.
As you all follow, our government has implemented very important reforms with the purpose of the improvement of R&D activities in 2008. Gap Güneydoğu Tekstil, the most in�uential denim exporter in our country that has taken this into account, has made many achievements with the help of its R&D studies. In the Textiles and Confection sector in Turkey, we were rewarded for our achievements in the “IV. International R&D Project Market Summit”. Besides the importance we attach to innovation, we received the “R&D” and “R&D Pioneers” awards due to the accomplishments of our R&D centre.
Çalık Denim, which has become a leader producer worldwide with its high quality denim fabric, has started an innovatiory practice in Turkey, the ”green event”.
I would also like to emphasize the fact that in our group, both of our companies that actively operate in the textiles sector are to continue their operations with the environmental production techniques they have developed and will set examples in the sense of social responsibility.
We Are At �e Pinnacle Of �e Banking Sector�e striking improvement in the banking sector in recent years is viewed attentively by the whole world. Leading banking groups in the world are trying to process every opportunity in order to make an investment in our country. Our group attained a high performance in the banking sector last year. Aktif Bank’s asset size rose to 2 billion 553 million TL by the end of 2011. Besides �nancial achievements, Aktif Bank, which has adopted the business style called “new generation banking” has been found worthy of 8 inter-national rewards in the domains of payment systems, quality, distribution channels and communication.
�e year 2011 was not only a bright year for Aktif Bank but also for our bank BKT that operates in Albania. BKT, which furnishes services in Albania and Kosovo with 82 branches, has increased its market share in Albania. BKT was also chosen “the Best Bank in Albania” by the Banker magazine of Financial Times once again.
Our Rise Continues In Telekom Sector ContinuesWe are establishing a similar achievement to the one in the �nancial sector in Albania in the telecom sector. One of our participants, Eagle Mobile that furnishes service in the telecom sector in this country has become the most preferred operator in the number transfer service. As for Albtelecom, the biggest landline telephone
operator and internet provider, it has been experiencing the pride of being worthy of the “2011 Broadband Business Excellence” award by Infocom Albania.
�e Symbol Of Innovation In �e Media2011 was also a year in which important advances were made for the strong representative of independent press, Turkuvaz Media Group. While our new channel A Haber has become the representative of objective newsreporting, it also brought a new perspective to television reporting. Sabah newspaper, whose �rst pages are now printed with enamel paper, continues to be the symbol of entrepreneurship and innovation in the media.
Minika, which started its publications last year, has succeeded in winning childrens’ and adults’ admiration. Minika is continuing to improve its quality in order for it to be able to contribute to the development of our children.
Turkuvaz Media Group that upholds innovation in reporting, has also realized the �rst special media practice in Turkey, utilizing SAP solutions. Çalık Holding was entitled to the “Golden Award” with SAP’s IS-Media solutions in the SAP EMEA 2011 Quality Awards.
We Worked From Somali To Van For AidUndertaking it as a duty to enrich the sectors it is involved in, Çalık Group did not also forget about its social responsibilities in 2011. Its principle of “Creating added value for the society” continues to be the foundation of the institutional responsibility perspective of our Group. Our Group that sees its social responsibilities as one of the most important indicators of the respect shown to the society and its working people continues to run for the aid of disaster victims in all landscapes.
As Çalık Holding, we took the lead role in the aid campaign from Turkey for Somali that was struggling with hunger and draught in 2011. Aid collected by the organizations of Sabah, Turkish Red Crescent and TİKA lead the way for more help from the world.
�e earthquake we had on 23 October 2011 in Van with the magnitude of 7.2 set in motion our nation’s spirit of collaboration once again. �e aid that was transported by the collaboration of Sabah and Kızılay demonstrated the fact that everyone in Turkey had united for this purpose. �e success of these campaigns gave us strength for new practices. It is our greatest wish that our public and the whole humanity may never encounter similar disasters.
Finally, I would like to thank our employees and their families, the most important investments in our Group, for their devotion. We are all a family. �is family possesses very important experiences and achievements in its structure. As Çalık Family, we are determined to succeed in 2012, too, and continue to create added value in economies in all countries we work in.
Kind regards,
Ahmet ÇALIKChairman

12
Our Valuable Associates,
Our Group, thanks to its vision to become the most meritorious representative of Turkish entrepreneurism with its administration and business portfolio, is one of the biggest investors of Turkey abroad. As our Group receives its strength from a business percept shaped by courage, innovation and common sense, it continues its operations with the objective to enrich our country and the geography it is located upon. I am pleased to see that this stance has helped carry Çalık Holding forward to this day. Our Group has the power to adjust itself to all kinds of market conditions as it assimilates the lofty values of our country, respecting varying traits of the regions it is founded upon. �is skill of ours brings success along with it. As a matter of fact, we have become one of the Groups that have conducted the last global crisis in the best manner; reaching the highest rate in its history in EBITDA with 450 billion USD. Our Group’s turnover rose by 50% with respect to the year 2010, reaching approximately 3 billion USD. In 2010, our consolidated asset size that was 5.8 billion USD in 2010 rose to 6.4 billion USD by the end of 2011. Last year, we made investments worth 700 billion USD in order to strengthen our presence in our business domains.
Turkey, A Model Country, Is Monitored CarefullyTremors caused by the global crisis and especially problems encountered in the Euro Region threaten leading economies of the World. As for our country, it came into prominence with its economical performance and stability in a vast geography dealing with political and social problems. Turkey, shown as a model coun-try in the recent years has become a centre of attraction due to its success story that is viewed with admiration. Our country’s performance in 2011 demonstrated this fact once again to the world. Economical precautions taken in advance of time have turned di�culties into opportunities. As the economy grew, production and exportation increased while unemployment decreased.
Turkey’s growth sustains us in our activities that we pursue with more than 20,000 employees in 15 countries, including a vast geography from Central Asia to Northern Africa, and from Europe to the Middle East. �anks to our government’s active and dynamic foreign policies directed towards the Middle East, Africa and Balkan States, we are observing the fact that a broad range of employment opportunities is emerging.
�e Energy Demand Of Our Country Is Increasing FastAmong OECD countries, Turkey has been the country in which the demand for energy increased the most in the last 10 years. Our country has taken the second place in the world among countries in which the demand for natural gas and electricity was the highest since 2002.
Our Group concentrated on the oil and natural gas search operations in the year 2011. At the present, we are one of the two most active companies in oil and natural gas exploration in Turkey. �ese days, we are expecting the Çalıktepe-2 probing in Diyarbakır, Bismil to end up with oil discovery. On the other hand, our subsidiary Çalık Enerji is currently proceeding with Rize Adacami HES construction and has reached the contract stage in the wind plant and dam projects in Çeşme, İzmir.
As a Group we also carry out important projects in energy sector abroad. �e construction of 2,000 MW in total natural gas conversion plants near Karbala and Mosul, in Iraq, are in process; our target is to launch the power plants partially in 2012 summer as planned. Moreover, the 478 MW power plant being built in Navoi, Uzbekistan, will be completed by 2012.
Projects �at Add Value To IstanbulWithin the context of the International Finance Centre, Gap İnşaat is realizing a new project in Ataşehir Istanbul, with the collaboration of Varyap; Metropol Istanbul, with a construction site of 730 thousand square meters, will stand out in terms of size, technology and the life style it o�ers. Şehrizar Konakları, being built in Altunizade, will be completed as of the end of 2012 and the sales of Tarlabaşı Urban Renovation Project, in which Gap İnşaat is the subcontractor, will start by 2012.
In 2011, Gap İnşaat has completed the Eye Hospital with 120 bed capacity, built in Ashgabat, the capital of Turkmenistan, 5 months ahead of schedule and handed it over to the Ministry of Health. �e Company has also started the construction of the Infusion Solution Factory with a capacity of 10 million bottles and Hospital Dentistry in Ashgabat .
�e Steady Growth Of Aktif Bank And BKT Aktif Bank’s asset size exceeded 2 billion 553 million TL in 2011. �erefore, the active pro�tability of our Bank that rose 13 sequences in the growth ranking in the last 4 years reached 2.48, which is above the average in the sector. Realizing Turkey’s �rst Securitized Asset export in 2011, our Bank manufactured products such as “two step usury”, which would create a new category in funding.
�e asset size of our bank BKT that operates in Albania and Kosovo has reached approximately 2 billion USD, making a real increase of approximately 31% compared to the year 2010. Morover, the total bank deposit of our Bank reached the level of 2 billion USD, attaining a real annual increase of approximately 25%. �e yearly pro�t of BKT became about 30 billion US Dollars, while recovered equity capital pro�t came to pass at 30 percent.

13
185 �ousand Ounces Of Gold Produced In IliçSoon after Çöpler Gold Mine, with 4.6 million ounces of gold reserve in Iliç, Erzincan, put into operation by Anagold Company, an a�liate of Lidya Madencilik, with an investment of 250 million USD, displayed a striking performance. In 2011, over 185 thousand ounces of gold was produced in this mine; this year the production is aimed to reach 200 thousand ounces. �ree new companies established in collaboration with our associate Alacer Gold, will start operating 16 new mine areas this year. We are expecting positive developments in these new domains soon.
Our Telecom Companies Under �e Same Roof �e decision to unite the managements of Albtelecom and Eagle Mobile was taken in order to strengthen the presence of our telecom companies. �is reconstruction is planned to be completed in 2012. Last year, our GSM operator Eagle Mobile was the most preferred operator regarding number transfer services and its subscribers reached a �gure of 1 million. Albtelecom in collaboration with Telecom Italia Sparkle increased the capacity of the Adriatic link between Bari-Durres, providing faster internet service. Albtelecom, doubling its internet capacity, also completed the optical �ber connection between Albania and Kosovo. As wireless stable internet network was installed with the purpose to provide internet service in rural regions, the project that would supply 2 thousand schools with rapid internet service was also completed.
R&D Investment From Gap Güneydoğu TekstilGap Güneydoğu Tekstil, one of the leader companies in the denim world market, implemented its R&D Centre in the Malatya facilities in 2011. Last year, our environment friendly Company, focused on producing technological fabric, manufactured Blue&White denim cloth using “recycled paper”.
�e First Channels In HD Broadcasting; A Haber And AtvTurkuvaz Media Group has been the symbol of novelty and development in media since the day it was established. In this context, projects realized by Sabah and ATV set examples in the sector. After the completion of restructure and renewing the advertising operation system, Turkuvaz Media Group witnessed an immense acceleration in advertising activities.
A Haber, which started broadcasting with the purpose of compensating for an important de�ciency, and ATV, one of Turkey’s �rst private television channels, became the �rst channels to broadcast in HD. On the other hand, Minika channel that started broadcasting last year was favored by children and their parents. In order to serve better and ful�ll the need Minika, broadcasting under pedagogical supervision, now continues to broadcast in two di�erent channels, targeting 3-8, 7-14 age groups.
Leaving 2011 behind successfully, our Group valuing di�erent ideas and common sense set new goals for 2012. With the aim to be a model Group with its business principles and values as much as its success, we will continue to focus on our operations in 7 sectors. It would only be possible to reach our goals and complete another year with pride through our family members working in cooperation. As a Group we have faith in the fact that success is possible and meaningful with others.
I would hereby like to thank our employees who place importance to moral values, justice in business and relationships, as much as give priority to the reputation of our Company, and our valuable associates as well as all our supportive friends.
Kind Regards,
Dr. Berat AlbayrakCEO

Berat Albayrak began his professional life in 1996. Following his graduation from Istanbul University School of Business Administration, he joined Çalık Holding in 1999. He was appointed as Çalık Holding's US O�ce Financial Director in 2002 while he enrolled in MBA Program at Lubin School of Business, Pace University in New York. In 2004, he was appointed
as the Country Manager. Upon his return to Turkey in 2006, Mr. Albayrak �rst served as Assistant General Manager of Financial A�airs. In 2007 he was appointed as CEO of Çalık Holding. Berat Albayrak earned his Ph.D. in �nance and banking after completing his doctorate thesis in �nancing renewable energy resources �eld.
Born in Malatya in 1958, Ahmet Çalık began his professional venture by establishing Ortadoğu Tekstil Ticaret ve Sanayi A.Ş. in 1981. Coming from a family engaged in textile sector since 1930s, he made the �rst large-scale industrial investment of East Anatolia by establishing Gap Güneydoğu Tekstil San. ve Tic. Inc. In the same period, he commenced his �rst overseas investments in Central Asian countries in line with his operation and investment targets. Putting the vast commercial experience he built up over the years in Turkey since 1992 to good use abroad, Çalık has
Abidin SungurBoard Member
Born in 1939, Abidin Sungur graduated from �e Faculty of Law, Istanbul University in 1964. After working in senior managerial position in governmental institutions for several years, he retired as
Chief Inspector from Prime Ministry in 1988. Abidin Sungur joined Çalık Holding as Legal Counselor in 1998. He has been serving as Member of Board in Çalık Enerji primarily and other Holding subsidiary companies since 2010.
A.Ş. He served for Total Oil Türkiye A.Ş. as Deputy General Manager and General Secretary and joined Çalık Holding A.Ş. as General Manager in 1998. At present, Mr. Gürler serves as a Board Member of Çalık Holding, Aktif Bank and also serves as Vice Chairman of Banka Kombetare Tregtare (BKT).
EXECUTIVE COMMITTEE
Ahmet ÇalıkChairman of Çalık Holding
Dr. Berat AlbayrakCEO
Dr. Serhat AlbayrakVice Chairman
After receiving his BA from Boğaziçi University, Department of Political Science and International Relations, Serhat Albayrak worked at Wall Street from 1998 until 2000. He earned his MBA at Pace University in New York and worked in managerial position at Vestel, General Manager at Çalık Holding and Chairman at
Mehmet Ertuğrul GürlerBoard Member
Mehmet Ertuğrul Gürler was born in 1958. He graduated from Marmara University, School of Business Administration. He has got 33 years experience in business. Mr. Gürler served in several position as Financial Director and Board Member from 1987 to 1994 for Dow Türkiye
14
spearheaded major investments in various business lines such as energy, telecom, �nance, construction, media, textiles, and mining in several countries. He established Çalık Holding in 1997 with the intention of bringing all Group companies together under the same roof. He was declared worthy of the Turkish Republic Distinguished Service Medal in 1999, the Turkish Republic Ministry of Foreign A�airs Distinguished Service Medal in June 2002 and the Turkish Grand National Assembly’s (TBMM) Distinguished Service Prize in 2006. Being appointed as the Honorary Consul of the Republic of Kazakhstan for Bursa, Ahmet Çalık is the Chairman of Çalık Holding.
Star Medya Yayıncılık. Mr. Albayrak was appointed to the Executive Board of Çalık Holding in 2007. He has completed his doctorate degree in banking and �nance. At present he serves as Vice Chairman in Çalık Holding and Vice Chairman, General Manager in Turkuvaz Media Group.

1- Ahmet Çalık Chairman
2- Dr. Berat Albayrak CEO
3- Abidin Sungur Board Member
4- Mehmet Ertuğrul Gürler Board Member
5- Dr. Serhat Albayrak Vice Chairman
6- Şafak Karaaslan Foreign A�airs Director
7- Serhat Demir Legal A�airs Director
8- Özlem Özün Project Finance Director
9- İrfan Başak Strategy Management Director
10- Fatih Kazdal Finance and Treasury Director
11- İzzetiye Keçeci Human Resources Director
12- Hilmi Hülür Financial A�airs Director
13- Gaye Somuncu Corporate Communication Manager
14- Tahsin Yazar Energy Legal A�airs Director
15- Ebubekir Şimşek Information Technologies Director
15

ENERGY REQUIRES 300 BILLION USDWORTH OF INVESTMENT
ENERGY SECTOR OVERVIEW IN 2011While the world energy sector went through a di�cult period during the 2011 economic crisis, the Turkish
economy achieved a record growth, which manifested itself in energy consumption �gures as well.
Consumption rose by 9% from 191 billion kWh in 2010 to 229 billion in 2011. Daily consumption broke
a record with 730 million kWh. In the ranking of rates of increase in energy consumption, Turkey came
second after China. To meet these new requirements, an additional installed capacity of 3,600 MW was
created spending 5 billion USD.
In 2012, electricity consumption is expected to amount to 244 billion kWh. If the upward trend continues,
5 billion USD worth of additional production capacity will be needed every year to meet the 10-20 billion
kWh annual increase in requirements. �e installed capacity expected to be put into operation in 2012
amounts to 3,600 MW.
In 2011, natural gas consumption reached its highest point with 43 billion cubic meters. An important step
was made towards the target of liberalization when it was decided that the 6 billion-m³ Western Line
agreement that expired in 2011 should be renewed with private companies. According to EPDK (Energy
Market Regulatory Authority) estimates, the target natural gas consumption for 2012 amounts to 48 billion
cubic meters.
�e rate of import-dependency is around 95% in oil and natural gas. In 2011, Turkey’s total energy
importation amounted to 53.1 billion USD. �e principal factor that caused the increase in importations
was the oil prices rising to nearly 120 dollars during the year. �e rise in oil prices triggered by the Arab
Spring had an adverse e�ect on Turkey and increased the cost of energy importation.
An analysis of the Arab Spring countries shows that a number of such countries increased their public
expenditure by up to 48%. �is explains the high energy prices despite the manifest downward adjustment
of the expectations for the global economy.
�e increase in oil prices in Turkey and the need to reduce import-dependency in energy led to large-scale oil
prospecting activities in Turkey, abroad and in deep seas in 2011.
Installed Capacity Amounts To 53,000 MWIn 2012, Turkey’s installed capacity reached 53,211 MW. �e breakdown of this �gure by methods of
production is as follows: Natural gas-LNG – 16,304 MW (30%); imported coal-lignite – 12,355 MW
(23.2%), hydro-electric dams – 17,000 MW (32%); and wind power plants – 1,728 MW (3.2%). In
2011, the same breakdown was as follows: Natural gas-LNG 47%, imported coal-lignite 31.1%,
hydro-electric dams 15.2%, hydraulic rivers 2.3% and wind power plants 1.8%.
ENER
GY

Consumption Will Rise To 500 Billion KWh Electricity consumption is expected to reach 500 billion kWh in 2023. According to EPDK projections, 300
billion USD worth of investments in the production, distribution and transmission of electricity will be
required by 2030. �e Ministry of Energy and EPDK prioritise the achievement of these investments as a
strategic target. �e investments will take the form of hydro-electric and nuclear power plants and power
plants using local coal.
�e �rst agreement regarding collaboration with Russia in the �eld of nuclear power plants was signed in
2011 for the 4,800 MW nuclear power plant to be built in Mersin Akkuyu. Negotiations with Japan are
underway for another one in Sinop. Plans for 2023 include the completion of the two nuclear power plants
and the kick-o� of the construction of a third one. As for solar power plants, tender processes are planned to
be completed as soon as possible so that construction starts for a 600-MW installed capacity in 2012.
Local Coal TargetTurkey is planning to overcome her dependence on natural gas in the production of electricity by organizing
local coal tender processes starting from 2012. �e Turkish Coal Mines Exploitation Agency is planning to
award contracts to private companies for the exploitation of 2.8 billion tons of reserve through a process of
competitive bidding as of this year. �ese �elds of coal to be exploited by private companies, which are
located mainly in Afşin-Elbistan, Konya-Karapınar, Adana-Tufanbeyli, will feed new power plants to be
constructed with an installed capacity of a total of about 18,000 MW.
European Electricity TradeTurkey was connected to Greece and Bulgaria for a testing period under the European Electricity
System ENTSO-E on 18 September 2010 and these were completed last year. Once the testing period
is over, a 5,000 MW line with Europe will be installed to start trade with whole Europe.
Privatisations�e global �nancial bottleneck of 2011 caused by the economic crisis had an adverse e�ect on energy
privatisations. Regarding the planned giant privatisations that would take place in 2010, the tenders for
the distribution companies Başkent Doğalgaz, Boğaziçi, Gediz and Antalya were cancelled. �e
Toroslar tender became an impasse. �e 40-billion USD tender for electricity production that started
with Hamitabad was cancelled when only one bid was received. But, in 2011, Çalık Enerji was awarded
with the contract for the takeover of the Yeşilırmak Electricity Distribution Area with a tender price of
441,5 million USD thus achieving one of the most successful privatisations in the �eld of electricity
distribution. �e IC-İçtaş Group took over the electricity distribution areas of Trakya, Aksa Fırat.

18
ÇALIK ENERJİ SANAYİ VE TİCARET A.Ş.
TAPCO PETROL BORU HATTI SANAYİ VE TİCARET A.Ş.
ADACAMİ ENERJİ ELEKTRİK ÜRETİM SAN. VE TİC. A.Ş.
AKTİF DOĞAL GAZ TİCARET A.Ş.
TÜRKMEN'İN ALTIN ASRI ELEKTRİK ENERJİSİ TOPTAN SATIŞ A.Ş.
GAP ELEKTRİK DAĞITIM SANAYİ VE TİCARET A.Ş.
ÇALIK ENERJİ ELEKTRİK ÜRETİM VE MADENCİLİK A.Ş.
KIZILIRMAK ELEKTRİK ÜRETİM A.Ş.
DOĞU AKDENİZ PETROKİMYA VE RAFİNERİ SAN. VE TİC. A.Ş.
ÇALIK NTF ELEKTRİK ÜRETİM VE MADENCİLİK A.Ş.
YEŞİLÇAY ENERJİ ELEKTRİK ÜRETİM SANAYİ VE TİCARET A.Ş.
ATLAS PETROL GAZ İTHALAT İHRACAT VE PAZARLAMA TİC. A.Ş.
MOMENTUM ENERJİ ELEKTRİK ÜRETİM SANAYİ VE TİCARET A.Ş.
İKİDENİZ PETROL VE GAZ SANAYİ VE TİCARET A.Ş.
ÇEP PETROL DAĞITIM SANAYİ VE TİCARET A.Ş.
SEMBOL ENERJİ A.Ş.
AKÇAY ENERJİ A.Ş.
ÇALIK ELEKTRİK DAĞITIM A.Ş.
YEŞİLIRMAK ELEKTRİK DAĞITIM A.Ş.
ORTUR ELEKTRİK ÜRETİM VE TİCARET LİMİTED ŞİRKETİ
VADİ ELEKTRİK ÜRETİM SANAYİ VE TİCARET LİMİTED ŞİRKETİ
ANT ENERJİ SANAYİ VE TİCARET LİMİTED ŞİRKETİ
ÇALIK RÜZGAR ENERJİSİ ELEKTRİK ÜRETİM LİMİTED ŞİRKETİ
BURSAGAZ BURSA ŞEHİRİÇİ DOĞALGAZ DAĞITIM TİC VE TAAHÜT A.Ş.
KAYSERİGAZ KAYSERİ DOĞALGAZ DAĞITIM VE TİC A.Ş.
ATAYURT İNŞAAT A.Ş.
JAPAN INTERNATIONAL ENERJİ NETWORK A.Ş.

19
ÇALIK ENERJİ SIGNS IMPORTANT
ENERGY PROJECTS IN A LARGE
GEOGRAPHY
Çalık Enerji, founded in 1987, was restructured in 1998 and renamed Çalık Enerji Sanayi ve
Ticaret A.Ş. With the investments it has made in Turkey and abroad, the Company has become a
major component in the sector. It conducts business in three main domains: power systems,
oil&gas, re�neries and pipelines.
In the �eld of power systems, Çalık Enerji renders services in hydroelectric power plants, wind
power plants and thermal power plants, electricity distribution and turnkey delivery of energy
construction projects. In the domain of oil and natural gas, it conducts operations of oil prospect-
ing, production, ground services and trade of oil and oil products. In the domain of re�neries and
pipelines, the operations of the company consist of Samsun-Adana/Ceyhan pipeline, the re�nery
planned to be erected in Adana/Yumurtalık and petrochemical projects. In addition to all these
operations, Çalık Enerji has decided to start operations in two more �elds: solar energy invest-
ments and turnkey construction projects for aboveground oil installations.
An Energy Company That Realizes Region-Wide Projects�e global economic crisis of 2011 a�ected contractor’s business in the �eld of power plant
construction, but the same crisis provided Çalık Enerji with opportunities in the Commonwealth
of Independent States and in Iraq.
Despite the economic crisis which a�ected the whole world, but particularly Europe, Çalık Enerji
started in 2011 the construction of two power plants in Iraq; with 1,250 MW and 750 MW capaci-
ties, worth a total of 860 million USD. In 2011, the Company had over 1000 employees working
on its construction sites. It plans to increase this �gure to 2,000 in the spring of 2012. �e two
above-mentioned investments in Iraq, where power supply is on only 5 hours a day, will increase
the electricity production capacity of this country by 40%. Çalık Enerji is closely following large
scale future projects in Iraq. In line with this, Company has concluded an international partnership
and started to work on a 1600-MW power plant project.
Çalık Enerji, building Uzbekistan’s �rst natural gas turbine combined conversion power plant with
a capacity of 500 MW, currently employs 1,100 employees in Navoi. Test operations for Navoi
combined cycle power plant has started at the end of 2011. In addition, negotiations are underway
for two more power plants one with a capacity of 1,000 MW and the other 500 MW.
Renewable Energy Investments in Turkey�e construction of the Adacami Hydroelectric Power Plant in Rize has reached its �nal stage. �e
contract for one of the wind and hydraulic power plant projects in Çeşme/İzmir is ready for
signing. All permits, licenses have been obtained and engineering works are completed for wind
power plant projects in Demircili, Sarpıncık, and Hydroelectric Power Plant Projects in Kızkayası,
Aksu. �e constructions of these four projects are due to commence in 2012. In addition to these,
for 1,200 MW Kırıkkale combined conversion power plant, the land plot and licence have already
been acquired.
For the solar energy investment, Çalık Enerji concluded a partnership with the Japanese Mitsubishi
Corporation. It has also concluded a partnership with the Japan International Enerji Network A.Ş.
to develop solar energy, wind energy and other renewable energy solutions.

20
ÇALIK ENERJi CONCLUDES INTERNATIONAL
PARTNERSHIPS WITH MAJOR COMPANIES
Investments To Set The Route For The Sector Of Oil And Natural GasWith a view to ensuring domestic and international growth in EPC �eld, Çalık Enerji concluded a strategic partnership in
2011 with the Canadian company Anatolia Energy under 8 exploration licenses to prospect petroleum and natural gas. In
addition to these, the Company concluded 2 PSC (Petroleum Sharing Contract) licences for petroleum and natural gas
prospecting with Anatolia Energy. In 2011, intensive operations of two-dimensional and three-dimensional seismic oil
prospecting operations were conducted in Turkey and abroad. Çalık Enerji, accelerating its petroleum prospecting e�orts
in Turkey, has conducted the most seismic prospecting operations in the private sector. �e following seismic prospecting
operations were conducted in Turkey: in Gaziantep 2D 400 km², in Besni 2D 100 km², in Bismil 2D 116 km² and 3D 206
km². �e Company is expected to discover a petroleum reserve soon, at Çalıktepe-2 drilling site in Bismil, Diyarbakır.
Çalık Enerji signed 2 PSCs licences for prospecting and producing petroleum, natural gas abroad with which it expects to
make a great progress in the energy sector.
The Samsun-Adana/Ceyhan Project Will Reinforce Turkey’s Position On The North-South Axis Crude oil and oil products passing through the Straits and distributed to world markets from Black Sea ports are a threat
to the Bosphorus and Dardanelles straits, which are important parts of Turkey’s natural and cultural heritage. �e amount
of crude oil exported from the Black Sea is expected to increase due to the new production sites in Central Asia and the
Hazar basin. To reduce the transit load and to eliminate the risks threatening the Straits, Çalık Enerji is implementing the
Samsun-Adana/Ceyhan Crude Oil Pipeline Project. �is project will ensure the transportation of crude oil from the Black
Sea coast to Ceyhan. It is of great importance for Turkey and for the region as a whole. �anks to this project, the social
and environmental risks in the Straits will be reduced and the amount of crude oil shipped from Ceyhan to global markets
will rise to 220 million tons making Ceyhan the most important crude oil terminal in the East Mediterranean. Çalık Enerji
has been working on this project technically and commercially since 2003. �e company has applied to the Ministry of
Energy and Natural Resources, General Directorate of Petroleum A�airs, on 31 March 2004 and obtained the license for
building and operating a pipeline in June 2006. For this project, that will also serve to diversify petroleum routes, Çalık
Enerji has concluded a partnership with the Italian company ENI. Negotiations are underway with the Russian petroleum
companies Transneft and Rosneft. �e project will require an investment of 2.5 billion USD and make Turkey one of the
major players in the world energy sector and constitute a signi�cant step on the path to become a regional power. Under
this project, a loading terminal in Samsun and petroleum storage facilities in Ceyhan will be built and a 550-km pipeline
will be installed. When the project is �nished, the daily capacity of the pipeline is expected to reach 1.5 million barrels.
With the East Mediterranean Petrochemical And Refinery Project Daily Oil Production Will Exceed 200,000 Barrels �e existing BTC and Kirkuk-Yumurtalık Oil Pipelines in Adana/Yumurtalık-Ceyhan area supply to world markets
100-120 million tons of crude oil annually on average. �e East Mediterranean Petrochemical and Re�nery Project
developed by Çalık Enerji, the re�nery to be built in Yumurtalık, will process a part of the crude oil coming to the region
through pipelines. �e estimated capacity of the facilities is 212s,000 barrels. �e facilities will also process petroleum from
other sources such as Iraq, Russia and the Hazar region.
Work Safety, Environment And Quality Come FirstÇalık Enerji possesses an ISO 9001 Quality Management System Certi�cate, an ISO 14001 Environmental Management
Certi�cate and an OHSAS 18001 Occupational Health and Safety System Certi�cate issued and audited by an
international certi�cation institution.
Çalık Enerji produces projects in Turkey and abroad in the energy and communication sectors using its creativity and
quality based on respect for the environment and people and greatly contributes to the national economy. �e Company
continuously improves its services and creates added value for its customers and for the countries where it is present. Çalık
Enerji continues to produce equitable, pro�table and e�cient projects.

21

22

23
A BREATH OF FRESH AIR TO THE
ENERGY DISTRIBUTION SECTOR:
ÇALIK YEDAŞ
Yeşilırmak Elektrik Dağıtım Anonim Şirketi was incorporated into the Holding on 29 December
2010 after a privatisation process and came to be known as Çalık YEDAŞ. It operates in the Black
Sea region and serves as a model for privatised companies in the energy sector.
Çalık YEDAŞ, conducting operations of distribution and retail sale of electricity, operates in 5
provinces, namely Samsun, Ordu, Çorum, Amasya and Sinop. �e Companies operations cover
an area of 40,344 km² rendering service to 3,021,282 people.
Investments ContinueGiven the fact that the sector is a regulated one and taking into account the changes expected to
occur in the market in the near future, Çalık YEDAŞ has been focusing on preparations in terms
of strategy and operations. �e re-structuring process of the Company is about to be completed.
In addition, Çalık YEDAŞ is planning to make investments worth 500 million USD between 2011
and 2015.
In line with its object of achieving sustainable growth, Çalık YEDAŞ is systematically establishing
the EFQM Perfection model as a permanent part of its corporate culture. Çalık YEDAŞ aims to
acquire new electricity distribution companies in Turkey and abroad with a view to raising its
number of customers from 1.5 million to 5 million and its annual amount of power purchases
from 5 billion KWH to 20 billion KWH.
The Company Improves Its QualityIn line with its object of rendering perfect customer services, Çalık YEDAŞ has a call centre (444
55 23) operating on a 7/24 basis. It answered 1,607,604 calls in 2011 and thus enabled the
Company’s customers to communicate their suggestions, wishes and complaints, to notify power
failures, to report illegal consumers and to �le contract requests through phone connection. In
2011, Çalık YEDAŞ received 97,638 written requests and e-mail messages that were answered
within the legal time limit, which was another manifestation of the company’s high quality
service.
Çalık YEDAŞ attaches great importance to training its employees to ensure the proper application
of its policies based on customer satisfaction. A total of 1,272 hours of training has been dispensed
in the form of hands-on training, professional-technical training, personal improvement training,
management skills training and quality-occupational health and safety training. Çalık YEDAŞ put
into practice in only one year di�erent SAP applications in real life environments as part of its
e�orts to render correct and timely service.

TELE
CO
M DEVELOPING COUNTRIESGAINED MOMENTUM INTELECOM
TELECOM SECTOR OVERVIEW IN 2011In the Telecom sector, we are entering a time in which the internet encompasses all kinds of services and
products. Although the usage of stationary telephone is increasing in some of the developing markets,
developments in mobile communication and internet technology are becoming more impressive.
Statistics about the global sector of information technologies and telecommunication show that the use
of �xed phones falls while the use of mobile phones and internet rises. According to the estimates of the
International Telecommunication Union – ITU for 2011, the use of mobile phones per household in
the developed countries exceeded 100% (117.8%) while the world average was only 86.7%. �is rate is
76% for developing countries. According to the data of the same institution, use of internet per
household also increases. It is estimated that internet is available in one out of every three households in
the world (34.7%). In developed countries, this rate is 73.8%. According to a survey conducted by the
International Telecommunication Union, the use of �xed phones falls in developed countries and in the
world too on average but continues to rise in underdeveloped countries, particularly in Africa.
Sim Card For All DevicesNowadays, SIM cards used in cell phones can be found in all smart devices. Logistics, in which
measurement and follow up systems are used, as well as agriculture and manufacturing sectors will
continue using the SIM card to establish communication between machines. �e employment of smart
devices in developing markets is also keeping increasing. It is expected that internet from one device to
the other (M2M) will improve the mobility in the corporate market.
Use Of Internet To Increase�e increase in the use of internet urges the sector to follow the movements of internet companies as
well because internet is not simply a service of providing access anymore and the sector has gone beyond
mere numbers of users and chargeable time. A new telecommunication system emerges based on
information, advertising and interaction delivered through the 4 screens of social networks such as
Facebook and Twitter. Facebook has over 800 million active users and its market value is nearly 100
billion USD. It is a company that is at the centre of the transformation with information, internet and
4 screens. Twitter has 350 million users. �e number of those using Twitter through mobile phones
exceeded the number of those who use it through the Internet. In 2012, the use of internet is expected
to increase as well as the number of devices connecting to the internet.

The Growth Potential is HighInternet usage rate in Europe is about 58% on average. In Albania where the Group directs its telecom
investments the usage rate is still 43%. It is obvious that this country has an important potential with its 1
million 300 thousand internet users. �e utilization of social networks is increasing along with the
internet usage in Albania. �e number of Facebook users was 981 thousand by the end of 2011. In the
country in which campaigns are organized in order to compensate for the digital gap, the rate of internet
utilization is above that of European countries. While internet usage is 30% worldwide, it reaches 58% in
Europe. With its 476 million subscribers, Europe is the region in which internet utilization is the highest.
�e application of social networks increases even faster in the mobile medium, which increases data
consumption on mobile phones.
The Market Grows in AlbaniaAccording to the data of the Telecommunication Regulation Institution in Albania (TRIA), there was an
increase in the utilization of stationary lines and internet in 2011. �e number of people who owned a
stationary line reached 339 thousand, with an increase of 7 thousand users with respect to previous year.
�e rate of access in the country in general increased by 2%, reaching the level of 12%. �e number of
families and commercial subscribers in the country who use the internet through the utilization of
broadband and 3G technology has reached 174 thousand. Access number to broadband, which was at a
level of 3.7 last year became approximately 6,2% in 100 people. �e number of GSM users increased by
15% by the end of 2011, reaching a �gure of 5,2 million. Only 12% of families possess stationary internet
lines. Mobile phone users spend approximately 70 euros annually. �e access norm is around 185% in
100 citizens while the EU rate is around the level of 24%. Prepaid subscribers still constitute 90% of
general users. �e number of those who changed their operators was 41 thousand in 2011.

ALBTELECOM SH.A
EAGLE MOBILE SH.A
CETEL TELEKOM İLETİŞİM SANAYİ VE TİCARET A.Ş.
YENİKOM TELEKOMÜNİKASYON HİZMETLERİ A.Ş.
TELEMED TELEKOM A.Ş.
CETEL ÇALIK ENERJİ TELEKOMÜNİKASYON HİZMETLERİ A.Ş.

27
ALBTELECOM; THE STATIONARY
TELECOM OPERATOR OF THE
BALKAN PENINSULA
Albtelecom, the major stationary telephone operator and internet provider of the Republic of
Albania, continues to introduce its customers with technological innovations in order to speed up
and ease communication.
Albtelecom, founded in 1912, is the �rst choice of Albanian people as it meets expectations of its
customers on the modern and digital platform with its widespread network, technological
infrastructure, high quality service it o�ers.
Albtelecom, the largest stationary telephone operator and internet provider in Albania, joined
Çalık Holding in 2007 and employs 1,500 people.
Albtelecom continues its superior accomplishments regarding voice transmission in the
international network platform via its services in ADSL, Dial-up, Intranet, ISDN, LAN,
readymade cards and internet access. Bringing social life and technology together, the Company
facilitates its customers’ lives and is currently the leader company in the sector with its successful
investments.
Collaborating with Telecom Italia Sparkle in 2011, the Company has enhanced the capacity of the
Adriatic domain between Bari-Durres (Albania-Italy) by 20 times as much. Albtelecom, which
has completed its �ber optic connection line between Albania and Kosovo, has begun providing
high speed connection facilities for the Kosovan community via Albania.
Albtelecom, which has begun its studies on refurbishing its technological infrastructure in 2011
with the NGN/IMS project, has completed the inlay of 1,000 km �ber optic cables. �e Company
has already completed twice as many cables of the 500 cables that were inlaid since its
establishment.
�e company has also enhanced its stationary telecom access cable capacity by 100.000 while
doubling ADSL port number attaining a number of 150,000. �e Company also aims at
providing high speed internet connection in rural areas and has enabled internet access in remote
places as well. Following this achievement the Company has provided high quality internet
service for 200 schools all over the Country.
Albtelecom, which has been esteemed worthy of ‘�e Company of the Year in Internet Services’ by
INFOCOM Albania, has become one of the Data Processing Innovation Center consultants that
is to be established by the Albanian Government.
INFOCOM ALBANIA ESTEEMED ALBTELECOM WORTHY OF ‘THE COMPANY OF THE YEAR IN INTERNET SERVICES’

28
AN INNOVATIVE,
COMPETITIVE AND
DYNAMIC TELECOM ACTOR:
EAGLE MOBILE
Eagle Mobile brings a breath of fresh air to the world of communication in
Albania enabling the people of this country to receive “perfect service” at
home, o�ce and wherever they need.
Eagle Mobile was created under the roof of Çalık Holding in 2008. Today, it
is the most popular GSM operator in Albania. It is preparing to become the
leader of the sector, thanks to its high quality services and unique solutions.
Eagle Mobile has 400 base stations throughout the country providing mobile
Internet service for 98% of the population. In this context, Eagle Mobile has
recently started to conduct joint operations with BKT, another Çalık
Holding a�liate, to render mobile Internet services and solutions to BKT’s
corporate customer.
Despite the economic crisis, Eagle Mobile is the only operator in Albanian
GSM market to increase customer numbers. Currently, the number of its
customers has exceeded 1 million.
�e Company has increased its total international connection to 20 GB. In
the �eld of added value services, it has introduced a number of innovative
services such as Bill Check, SMS Health Package, Cell Broadcasting and
Mobile Portfolio, thus reinforcing its already strong position in the market.
In 2011, Albtelecom and Eagle Mobile, decided to merge under the same
management, were awarded by Dr. Liri Berisha, wife of the Albanian Prime
Minister Sali Belisha and also the President of the “Foundation for Albanian
Children”, the “Social Responsibility Prize” for the importance they attach
to education in the context of their social responsibility activities.

29

TEX
TILE
S TURKEY: SHINING STAR OF WORLD TEXTILES
TEXTILES SECTOR OVERVIEW IN 2011
�e Turkish textile sector, already the largest textile manufacturer in Europe, aims to become the
largest textile exporter of Europe as well within a few years. In 2011, the world textiles trade reached
247 billion USD, ready-made garments 423 billion and house textiles 74 billion. Despite the crisis in
Europe, there was no fall in Turkey’s textile and ready-made garment exports. �e exportation of
ready-made garments of Turkey rose by 10.7% in 2011 to reach 16.2 billion USD. �e sector’s share
in total exports was 12%. 80.4% of the exports were to the 27 EU countries. �e textile exports grew
by 22% reaching 8 billion USD as of the end of 2011.
Despite the di�culties caused by high indebtedness, the 27.8% increase in the textile exports to EU
countries is above the total increase in the textile exports. �anks to the good performance of the
sector in 2011, the share of textiles in the overall exports of Turkey rose to 6% and its share in
industrial exports to 7.2%. As a result of these high rates of increase, the share of exports to EU
countries in total textile exports rose from 46.3% to 47.6%. In 2012, the textile sector aims to
increase its exports to 10 billion USD. �e 2023 exports target of the sector is about 25 billion USD.
�e sector had achieved an increase of 18.4% in its exports in 2010. On the other hand, despite the
shrinkage in EU countries, the ready-made garment exports are expected to grow by 6% in 2012
exceeding 17 billion USD. �e sector is planning to recruit 50,000 new employees in 2012.
Additional Tax Benefits The Market�e additional tax introduced as of 2011 in textiles, knitwear and ready-made garments of certain
categories did cause di�culties in the ready-made garment sector but �nally turned out to bene�t the
textile industry. According to Euratex data, textiles investments with incentive certi�cates grew by
100% in 2011 after the decision for the additional tax was passed. In those fabric products on which
the additional tax was imposed, monthly importations fell from 200 million meters to under 100
million meters. With this decision, the current de�cit decreased by 670 million USD. �is �gure
reached 2.5 billion USD at the end of 12 months. �e number of people employed in the textile
sector rose by 9% annually to reach 375,810. �e number of people employed in the ready-made
garments sector rose by 6% in one year reaching 398,709. Additional taxes also led to more
enterprises. �e number of companies rose by 9% from 14,273 to 15,579 in the textiles industry and
by 7% from 27,955 to 29,782 in the ready-made garment sector. According to the data of the Union
of Istanbul Exporters of Textiles and Textiles Raw Materials (İTHİB), orders for machinery
signi�cantly increased after the introduction of the additional tax on imports. Nearly a thousand
pieces of machinery have been imported since the New Year.

Orders Replaced By TurkeyParticularly western brands started to channel their purchases to Turkey. Due to the economic crisis
in Europe, western brands are unwilling to place large orders with China because of the letters of
credits with large amounts that they entail and place their orders instead with Turkey and they do so
willingly thanks to the high quality and e�cient work of the Turkish labour.
Sector In Difficulty In EuropeMore than half of Turkey’s exportations go to the European Union. Naturally, the crisis in Europe has had
its adverse e�ects on the Turkish textiles sector too. EU countries have to import at high costs because of
the rising raw material prices and European companies see a solution in channelling their purchases to
developing countries. For investors who feel the adverse e�ects of the high rates of growth in Asia and
particularly in China, Turkey is the new rising star. Turkey’s low-cost but high-quality labour, young
population, stability and fast growing entrepreneurs of the provinces renders this country strategically
important for foreign investors, including her textiles industry, which is one of the locomotives of the
economy. European countries, which saw many of their companies go bankrupt or be put out for sale,
look for solutions to the problem of their increasing imports and falling exports. In the USA, although the
situation is not as bad as in Europe, the market is going through one of the worst periods of its history and
the American textiles industry is stagnating.
Strengths Of The Turkish Textile Industry �e Turkish textile industry is a driving force for the national economy in terms of manufacturing
and exports and also the second largest supplier of the European Union after China. Turkey’s close
geographical location to her export outlets is another factor in favour of the industry. �e yarn
technology used in Turkey is among the most advanced in the world, which has a favourable e�ect
on the industry in the form of high quality input. Due to the young and dynamic population of
the country, the sector enjoys an e�cient workforce.

GAP GÜNEYDOĞU TEKSTİL SAN. VE TİC. A.Ş.
GAP PAZARLAMA A.Ş.
ÇALIK PAMUK DOĞAL VE SENTETİK ELYAF TİC. A.Ş.
GAPPA TEXTILES, INC.
ÇALIK USA, INC.
ÇALIK ALEXANDRIA FOR READY MADE GARMENTS PFZ
A/O GAP TÜRKMEN (TÜRKMENBAŞI JEAN KOMPLEKSİ)
TÜRKMENBAŞI TEKSTİL KOMPLEKSİ
BALKAN DOKMA YGPJ
SERDAR PAMUK EĞRİCİ FABRİĞİ ÇJB

33
GAP GÜNEYDOĞU TEKSTİL
CONTINUES TO BE PREFERRED BY
PRESTIGIOUS BRANDSGap Güneydoğu Tekstil is one of the largest fabric exporters of Turkey. As a brand, it enjoys a global awareness that grows continuously.
Gap Güneydoğu Tekstil, founded in 1987, stands among the leading denim manufacturers in the world. It is one of the most reliable trademarks in a number of �elds of activity including the manufacturing of denim, ready-made garments, high quality yarn and raw cotton trade. �e Company is one of the largest denim exporters of Turkey.
A Trademark �at Closely Follows World TrendsGap Güneydoğu Tekstil conducts manufacturing operations in its facilities located in Malatya in an environment-friendly manner. �e Company with high quality production is among the leading companies of the sector. In an industry where competition is �erce, the Company closely follows world trends in terms of individual products as well as collections and collaborates with prestigious brands. Gap Güneydoğu Tekstil has o�ces in Treviso/Italy, New York/USA, Seoul/Korea and Hong Kong/China.
With its customer-oriented and innovative approach, Gap Güneydoğu Tekstil is one of the most distinguished companies in the sector. It has long standing values and a vision of being a “solution partner” for its customers. �e Company closely follows technological developments, including nanotechnology, and adapts them to its manufacturing operations to improve the quality of its products.
Environment-Friendly ManufacturingIn order to promote environment-friendly manufacturing, Gap Güneydoğu Tekstil adopted the motto “Denim is the only savior” under the “”Çalık Denim” brand, in 2011. �e Company organized the �rst “Green Event” in the textile sector.
Gap Güneydoğu Tekstil, already possessing a high-capacity machinery park, is planning to spend 22 million USD in e�ciency and quality improvement by 2013. Currently, Gap Güneydoğu Tekstil provides employment for 1,500 people in Malatya. It operates with 284 looms over an area of 364,803 square meters.
Gap Güneydoğu Tekstil collaborates with Gstar and Kici, a foundation company of the European Union, in the reuse of recycled �bre in fabric manufacturing. In that context, having extended the scope of its research and development activities, the Company created its own research and development centre. It has 16 projects that are already completed and 2 projects in progress, supported by TÜBİTAK-TEYDEB (Directorate of Support Programs for Technology and Innovation). A number of other projects are at the stage of preparations.
�e company that has achieved sustainable growth is among the top 10 denim manufacturers in the world and is one of the top 5 Company that are able to deliver high-quality products.
An Innovative CompanyGap Güneydoğu Tekstil created a new high fashion �ne gabardine collection titled “Fleur de Luxe” in 2011 thus o�ering a totally di�erent concept to American and European markets. At the same time, the Company introduced the manufacturing of “Paper Denim” in Turkey, using paper in the weft; giving denim a Japanese Vintage appearance.
Gap Güneydoğu Tekstil Manufacturing Capacities
Finished Fabric (Denim + Gabardine) 31.000.000 Metres/Year
OE Yarn Manufacturing 3.200.000 Kg/Year
Entwined Yarn Manufacturing 2.100.000 Kg/Year
Ring Yarn Manufacturing 6.700.00 Kg/Year
Denim Products 720.000 Units/Year
Total Area 364.803 m²
Indoor Area 125.600 m²

34
GAP PAZARLAMA, WITH ITS
SUCCESSFUL FOREIGN AND
DOMESTIC OPERATIONS,
CONTINUES TO PROGRESS
IN THE SECTOR.
In addition to manufacturing the best products from cotton to ready-made garments, Gap
Pazarlama works with world-famous brands and increases its share in the international textile
trade thanks to its strong corporate structure.
Gap Pazarlama, founded in 1994 under Çalık Holding, is globally one of the strongest companies
in the textile sector. As the Company continuously increases its share in the international textile
trade, employs more than 10,000 people and enjoys a strong corporate structure.
�e Türkmenbaşı Textile Complex and the Türkmenbaşı Jean Complex in Turkmenistan, the
Balkan Textile and Serdar Cotton Spinning Works, Çalık USA and Gappa Textile in New York are
Gap Pazarlama units manufacturing high quality products and conducting successful business
operations.
A Rising Brand In �e International Textile SectorGap Pazarlama, in addition to manufacturing fabrics in its Turkmenistan facilities, also imports
fabrics from various countries. �e company has enlarged its range of products and continues to
increase its domestic and international export volume.
�e Company, manufacturing high quality products from cotton to ready-made garments,
particularly increased its denim sales, in 2011. As the Company loom large with its exports to
European markets, it also has signi�cantly increased its share in both foreign and domestic markets.
Gap Marketing is one of the largest and most important manufacturers of the Inditex Group
thanks to its high value added range of products. Its principal competitive advantages result from
its integrated facilities and expertise in high quality manufacturing. Its reasonable prices, the
quality of its �nished products and its fast service largely compensate for its disadvantages with
respect to North African and East European competitors caused by the longer distances that
separate it from its outlets.
Leading World Brands Prefer Gap Pazarlama�e Company has undertaken important changes in its product groups with a view to improving
its pro�t margin. Its �annel bed linen sets are very popular with foreign consumers; the Company
provides 1.5 million sets for the USA market.
�e Türkmenbaşı Textile Complex, with an indoor area of 110,000 m² and a 100% integrated
structure, manufactures 60,000,000 m² of fabric per year on 165 Air-Jet looms and has an annual
print and painting capacity of 20,000,000 meters. �e Company has been working with leading
�rms of the sector such as IKEA, JCPENNEY, BB&B, COSTCO, SEARS and KMART since over
10 years. Its customer portfolio also includes big brands such as Bershka, Zara, Pull&Bear, Tesco,
River Island and La Redoute. Gap Pazarlama continues to perform outstandingly despite rising
raw material prices and �erce competition caused by the economic crisis.
Home Textiles Manufacturing Capacity
Türkmenbaşı Textile Complex
Annual capacity 2 million bed linen sets
Production 7,500 tons of oe. + 3,000 tons of ring
Yarn Production Capacity
Balkan Weaving
Annual capacity 36,864 spindles
Production 11,000 tons of ring carded yarn
Serdar Cotton Spinning
Annual capacity 60,480 spindles
Production 5,014 tons of Ring Combed Cotton + Ring Carded Yarn
Türkmenbaşı Jean Complex
Annual capacity 1,680 Rotors + 5,040 spindles
Production 9,000 tons of OE yarns + 2,808 tons of Ring carded yarns
Türkmenbaşı Jean Complex Denim Ready-made Garment Manufacturing Capacity
Annual capacity 10,000 units / day
Production 300,000 units / month
Türkmenbaşı Jean Complex Denim Fabric Manufacturing Capacity
Annual capacity 14,053,058 mt
Production 8,250 tons

35
ÇALIK COTTON USHERS IN
A NEW ERA IN COTTON
Çalık Cotton was founded in 2011 with the object of conducting international cotton trade activities. In
addition to cotton and yarn trade, it started to render counselling services in all matters related to cotton.
Çalık Cotton’s primary targets in the cotton sector, a keystone for the Turkish economy, are domestic
and foreign yarn manufacturers, denim manufacturers, cotton purchasers and commission agents.
Çalık Cotton delivers cottons from various origins including India, USA, Central Asia, Africa, Greece
and south-eastern Turkey to such customers. It now renders services to textile operators using cotton in
domestic and foreign markets.
Çalık Holding progresses continuously thanks to its dynamic approach and entrepreneurship skills,
delivering high quality products and exhibiting a customer-oriented approach.

CO
NST
RU
CTI
ON
CONSTRUCTION SECTOR TO BE A LOCOMOTIVE OF THE ECONOMY IN 2012
CONSTRUCTION SECTOR OVERVIEW IN 2012�e construction sector grew faster than the Turkish economy in 2011. While the Turkish
economy grew by 8.3%, the construction sector did so by 10% and thus proved that it was one
of driving forces of the national economy. In 2011, the number of people employed in the
construction sector rose to 1.9 million and the share of the sector in total employment to 7.7%.
An indicator of the growth of the sector was the increase in the number of construction permits
issued. In 2011, the number of construction permits issued by municipalities rose to 580,000
and the number of houses sold through title register o�ces to 450,000.
Given that Turkey’s average annual housing requirement amounts to 650,000 houses, the sector
will certainly remain a driving force for the economy in the coming years and continue to grow.
A source of stimulus for the sector in 2011was the rates of interest applied to the housing loans.
No fall was observed in the amount of housing loans even when these rates reached 1.30% in the
last quarter of the year. In 2011, the banking sector extended 75 billion TL worth of housing
loans. A slight fall is expected in housing loan rates of interest in 2012 and an increase in the
housing loans as a result of which an increase is expected in house purchases.
The Sector To Grow By 7%In 2012, the construction sector will be a driving force for the economy. �e economy is expected
to grow by 4% while the construction sector is expected to grow by 7%. �e greatest stimulus for
the construction sector will be the expected passing of a law lifting the restrictions on house sales
to foreigners (law of reciprocity) in 2012, the arrangements concerning the 2B domains and
urban transformation projects. Arrangements to be carried out in these �elds are expected to
trigger an increase in the house sales. House sales to foreigners, which remain at the level of 2
billion USD due to restrictions, are expected to reach 5 billion USD within 5 years when the new
law is passed. Mr. Erdoğan Bayraktar, Minister of Environment and Urban Planning, declared
that urban transformation projects would create an economic value of 200 billion USD. In
addition, the 2B domains will create a value of 26 billion TL.

Volume Of Loans Expected To Amount To 85 Billion TLIn 2012, the housing loans market is expected to grow by 15% and the volume of loans to reach
85 billion TL. �e average monthly rate of interest on housing loans is expected to be around
1.2%. Another important factor in 2012 will be the continuation of campaigns organized by
construction companies addressing consumers. �ese campaigns will follow new models
designed to increase the sales. �e rate of increase in house prices and rents are expected to be
limited to the rate of in�ation. Commercial real property investments are expected to grow by
8-10% and commercial real property rents to remain stable. A 5-10% increase in house
construction permits is expected.
Global Market To Reach 12 Trillion USDAccording to the Global Construction 2020 report issued in March 2012 by �e Global
Construction Perspectives and Oxford Economics, the size of the construction sector was 7.2
trillion USD in 2010 and will reach 12 trillion by 2020. China and India will account for the
largest part in this increase. A limited growth is expected in the USA. �e principal factor behind
this development will be the growth of the construction sector in these countries in response to
their population and economic growth. China has one of the largest construction sectors in the
world and is expected to reach 2,5 trillion USD in 2020. In the USA, the uncertainty continues
in the construction sector since the beginning of the crisis. According to the October 2011
�gures, a 9.5% fall was observed in new house constructions and a 5.6% fall in completed house
constructions. �ese �gures give an idea of what the 2012 performance of the sector might be.
In the current period, when the world economy is going through a recession and a relative
shrinkage, the Turkish construction sector is expected to grow both in the domestic and foreign
markets.

GAP İNŞAAT YATIRIM VE DIŞ TİCARET A.Ş.
ÇALIK GAYRİMENKUL TİCARET A.Ş.
ÇALIK İNŞAAT A.Ş.
KENTSEL DÖNÜŞÜM İNŞAAT A.Ş.
VARYAP - GAP ORTAK GİRİŞİMİ
ATAYURT İNŞAAT A.Ş.

39
A HIGHLY RESPECTED INSTITUTION
WITH INTERNATIONAL EXPERIENCE IN
THE CONSTRUCTION SECTOR:
GAP İNŞAAT
Gap İnşaat, founded with the speci�c purpose of building Çalık Holding’s textile factories,
became one of the Holding’s largest a�liates in less than 15 years. In 1996, it was re-structured
and started to conduct business development operations. Having completed large-scale
construction projects in a number of countries round the world, Gap İnşaat is progressing in
line with its object of growing in the oil & gas sector in the medium term thanks to its quali�ed
workforce and know-how. �e innovative and successful works it conducted for many years
paid o� in 2011. It focuses on oil & gas, hospital and infrastructure projects, particularly in
Turkmenistan, Iraq and Qatar.
�e construction sector is one of the main operation �elds of Çalık Holding and its subsidiary
Gap İnşaat has completed a large number of projects in Turkey as well as abroad since 1996. �e
fast growing construction Company has successfully completed over 110 projects up to the
present. �e total value of the projects it has undertaken amounts to nearly 4.5 billion USD. Its
main �elds of operation are: industrial facilities, energy projects, hospitals and health service
buildings, urban renovation and urban transformation projects, infrastructure projects,
multi-purpose housing and commercial area projects, public and military construction
projects, works of art and landscaping.
In line with its strategic motto “the right region, the right project, fast growth and geographical
expansion”, Gap İnşaat has branch o�ces in Iraq, Turkmenistan, Sudan, United Arab Emirates,
Ukraine, Saudi Arabia, Qatar and Kazakhstan beside Turkey.
Highly Experienced In International Arena Gap Inşaat Undertakes Real Estate Development Projects In Turkey
Gap İnşaat, proud of being the �rst Turkish contractor to have completed turnkey industrial
projects abroad, has �gured since 2006 in the “the Top 225 International Contractors” list,
published every year by Engineering News Record (ENR). In addition to its achievements
abroad, the Company is the author of many successfully ongoing operations in Turkey as well.
�e real estate development projects carried out by the Company has contributed greatly to its
domestic growth. Two renovation projects, Tarlabaşı Urban Renovation Project and Fener-
Balat-Ayvansaray Renovation Project, undertaken by Gap İnşaat are the �rst to be carried out
by a public-private sector partnership in Turkey. In 2007, Gap inşaat undertook the
construction of the Şehrizar Konakları in Burhaniye, Üsküdar. Finally, in 2010, it was awarded
the contract for the Metropol Istanbul Project under a Varyap – Gap İnşaat Joint Venture. It
continues to operate with the aim of implementing all of the projects it has undertaken in
Turkey up to the stage of cash generation.
Gap Inşaat’s Quality Certified
Gap İnşaat, developing customer-oriented solutions, aims to generate added value and deliver
the best possible service in the countries where it is present. In line with this, the Company has
the certi�cates of ISO 9001 Quality Management, ISO 14001 Environmental Management and
ISO 18001 Occupational Health and Safety. Now, the new target of Gap İnşaat is to obtain the
LEED certi�cate, a symbol of energy and environmental design leadership, for its projects.

40
Traditional Neighbourhood And Modern Life-Style Combined In Şehrizar Konakları
Şehrizar Konakları Project, a perfect combination of neighbourhood traditions with modern life styles, has been undertaken by Gap İnşaat in collaboration with the TOKİ subsidiary Emlak Konut GYO in the form of a revenue partnership. Brie�y after the Project came out, the demand shown to it has been greater than expected. �e project, located in Altunizade, Üsküdar, was designed by the famous architect Han Tümer Tekin, architect Nevzat Sayın and architect İhsan Bilgin, who managed to incorporate poetically treated traditional elements into modern residences. An important feature of the project is its position that allows easy access to the Bosphorus Bridge and its connection roads. �e total cost of the project, including the cost of the land plot, amounts to 460 million TL. Of its 108,000 m² construction area, 7,000 m² consist of social facilities. �e Şehrizar Konakları contains 38 blocks, each with a 300-m² base area, corresponding to 208 luxurious apartments. It has 5 car parks with a total of 600 parking spaces. �e layout is designed to create old-style quarters where a few blocks constitute a self-su�cient unit. �e apartments have 3 to 8 rooms and gross areas varying from 180 m² to 626 m², ideal sizes for large families. �e project is planned to receive its �rst occupants in 2012.
First Project In Istanbul’s Finance Centre: “Metropol Istanbul”
Gap İnşaat started the construction of “Metropol Istanbul” project, located in East Ataşehir, in partnership with Varyap. With its original and ambitious urban design, architectural-technical features and central position in the city, the project will satisfy world standards. Metropol İstanbul, one of the largest projects in Turkey, will cost 1.5 billion TL and is planned to be completed in 2014.
�e Project was designed by architects from RMJM, a world-famous interna-tional architecture company. Engineering counselling to the Project was provided by the Austria-based engineering company Hyder, a 150-year-old institution. Metropol Istanbul will add value to its environment in terms of architecture and engineering, be a permanent asset for the city and an illustration of the fast development of Turkey. With its height of 250 m (antennas not included), it is likely to be the tallest building in Turkey. It will consist of three tall buildings with over 1,500 independent units. With residences, o�ces, a shopping mall and recreation areas, Metropol Istanbul will be one of the largest mixed projects in Turkey. With its undivided construction area of 730,000 m², it will be an outstanding project. �e shopping mall, one of the most spectacular designs of the project, will consist of a 400 m-long Shopping Avenue and about 100,000 m² of leasable area. �anks to the natural lighting system created at the ground level, the Shopping Mall will bene�t from sunlight at an optimum level.
4 Projects In Turkmenistan From Gap İnşaat
In 2011, Gap İnşaat completed a 120-bed Eye Hospital, commissioned by the Ministry of Health of Turkmenistan, in the Turkmen capital Ashgabad, 5 months ahead of schedule. �e Company has also been granted by Ministry of Health of Turkmenistan, the constructions of an Infusion Solution Plant with an annual capacity of 10 million bottles as well as of a Dental Hospital and of a multi-storey car park with 270 parking spaces to meet the parking requirements of two hospitals in Ashgabad.

41

42

43
ÇALIK GAYRİMENKUL; ADDING
VALUE TO ISTANBUL WITH
URBAN RENOVATION PROJECTS:
Çalık Gayrimenkul ve Tic. A.Ş., a company operating under the roof of Gap İnşaat, started its
operations in 2010. It is a land development, investment and marketing company developing
projects in the �elds of urban renovation, o�ce spaces, housing and commerce. �e Company
undertakes the management of the development, investment and marketing aspects of
domestic real estate projects, taking great care to ensure that the operations are of a sustainable
nature and respect the environment and the character of the city.
Tarlabaşı Urban Renovation ProjectGap İnşaat participates as contractor in the “Tarlabaşı Urban Renovation Project”, the �rst
renovation project to be undertaken by a public-private partnership in Turkey. �e project,
conducted under the leadership of the Beyoğlu Municipality, is aimed to make Tarlabaşı a high
quality living area as a historic quarter of Istanbul should be.
An important quarter of Istanbul in terms of cultural heritage, Tarlabaşı is rich in 19th century
civil architectures. Its original street plan dates back to very old times. However, although it is
located in the very centre of the city, 40% of the buildings are abandoned, which accounts for
the urgency of a renovation in this part of the city. Home Owners are not willing to spend
money on their properties due to the predominantly insecure environment. �is is why this
urban renovation project is of great importance since it will recuperate a quarter of outstanding
historic, architectural and cultural value.
�e Tarlabaşı Renovation Project consists of the renovation of all buildings spread over an area
of about 24,000 m², including the improvement of the streets and of the infrastructure. �e
project concerns 196 cultural real estate assets that should be preserved. �e Renovation
Project was designed through a workshop process with joint e�orts of experts from various
disciplines, scholars, avant-garde architects and representatives of the private sector and of the
municipality.
�is project with long-term goals is guided by the decisions of the European Commission on
the identi�cation and preservation of Tarlabaşı’s cultural assets. In this context, inventories of
historic assets have been drawn up for the identi�cation of the monuments, buildings and
building groups to be preserved. �e operations conducted to identify and examine the
immovable cultural and natural assets that need to be preserved comply with the Convention
for the Protection of the Architectural Heritage of Europe and, accordingly, inventory leaves
and reports have been prepared for each building.
Following the o�cial approval of the project, owners’ consent to the project was sought
through amicable negotiations regarding the most critical stages of the Tarlabaşı Renovation
Project and, subsequently, the implementation of the project started. �anks to a successful
negotiation process, the Municipality of Beyoğlu managed to convince owners and tenants
through one-to-one dialogues. Preparations for the sale of the o�ce group located in the 360th
block, chosen to be the �rst stage of the project, are complete and sales will start in early 2012.

44
�e legal process for the collaboration between the Municipality of Beyoğlu and Gap İnşaat
for this speci�c project matured and developed as owners, current inhabitants and the related
non-governmental organisations became involved. Gap İnşaat considers the Tarlabaşı
Renovation Project, the �rst investment project it undertook in Turkey, to be an important
social responsibility action for the interests of the country. As a solution partner in this
long-term and multi-partite project, Gap İnşaat ful�ls its role with great pleasure in the social
scheme applied for the bene�t of the current inhabitants.
Fener-Balat-Ayvansaray Renovation Project�e second renovation project undertaken by a public-private sector partnership in Turkey
concerns the 79,335 m² area consisting of the quarters of Fener- Ayvansaray situated along
the Golden Horn on the northern side of the historic peninsula. �e project is being carried
out under the leadership of the Municipality of Fatih and includes the renovation of the
buildings and the improvement of the environmental conditions in order to preserve this part
of the heritage of the city so that future generations will also be able to enjoy it. Gap İnşaat
participates in this project as contractor. �e aim is to integrate these quarters with the greater
city, taking into account their cultural potential and preserving their original character, and
to recuperate them as high quality living spaces.
�e renovation of the area consisting of the quarters of Fener, Balat and Ayvansaray presents
a number of problems in physical as well as socio-economic terms. �e historic building stock
of the area is in a seriously bad condition and vulnerable to earthquakes. 19.4% of the
buildings have lost their structural qualities. 61.9% require large-scale repairs. Considering
the fact that Istanbul is situated on an earthquakezone , these buildings, 85% of which are
occupied, require urgent action. At the design stage of the project, o�cials from the
Municipality of Fatih collaborated with leading experts from universities and with companies
specializing in the subject. �e collaboration resulted in the identi�cation and a classi�cation
of the structural problems of the registered old buildings. At later stages, for those registered
buildings for which surveys and restitutions are ready, application projects will be prepared in
the light of the static analysis reports to be prepared under the guidance of universities.

45
With this urban transformation project, valuable original buildings contributing to the
characteristic silhouette of the city will be restored so that future generations will be able to
enjoy them. As for the buildings that have fallen in serious disrepair due to bad physical
conditions or become ineligible for preservation having lost their original character as a
result of incorrect repairs, a reinterpretation will take place if su�cient information and
documentation are available.
Of the renovation project, 69% is planned to consist of residences, 12% of shops, 8% of
o�ces and 2% of cultural buildings. One of the main objects is to improve the economic and
social conditions of the current inhabitants. �is is why the value to be generated by this
project is meant to bene�t �rst of all the owners. As a basic principle of the agreement
between the parties, all of the current owners in the area will continue to be owners after the
project. Once the process of negotiation is completed and the survey-restitution projects are
approved for all of the registered building stock, the application of the project will start for
individual blocks.

FIN
AN
CE THE FINANCE SECTOR
REMAINS PROFITABLE
FINANCE SECTOR OVERVIEW IN 2011Una�ected by the economic crisis in Europe, the Turkish �nance sector continued to progress in
2011. It is expected to reinforce its position in 2012 both in the region and in the world. �e size of
its assets reached 1 trillion 218 billion TL and it broke a record in pro�ts last year when giants of
the European banking sector declared loss one after another. �e total pro�ts of the Turkish
banking sector reached 20 billion TL in 2011. �e sector provides employment for 195,292 people
and operates 10,518 branches throughout Turkey. Last year, the sector stuck to its policy of opening
more branches abroad with 11 new branches opened in foreign countries. In 2011, the number of
employees increased by 4,112 and the number of branches by 452 with respect to previous year.
Loans IncreasedLoans remain the most important investment item in the sector. Share of loans in the total
assets increased by 3.8 points with respect to the end of 2010 reaching 56.1%. As of December
2011, the loans amounted to 682.9 billion TL, which means an increase of 157.1 billion TL
with respect to the end of 2010. �e annual rate of increase realised as 29.9%, lower than in
2010. �e actual increase in the loans was 14.6%. �e rate of increase adjusted for rate of
exchange e�ect was 21.6%. Of the increase in the volume of loans, 68.3 billion TL consist of
corporate/commercial loans, 51.3 billion of personal loans and 37.5 billion of loans extended
to Small and Medium Sized Enterprises. Delinquent loans fell by 5,2% with respect to the end
of 2010 to 19 billion TL as at December 2011.
Priorities For 2012�e banking sector will prioritise this year launching new products, issuing securities, creating
alternative distribution channels and, in particular, improving Internet and mobile banking,
investing in foreign banking operations, conducting strong risk management and supporting
venture capitals in order to strengthen its �nancial structure so that it can continue to support the
non-�nancial sector.
Successful Year For Insurance �e Turkish insurance sector exhibited a good level of performance in 2011. �e sector grew by
21.5% generating a total of 17.2 billion TL worth of premium. In 2011, the non-life (elementary)
branch grew by 21.25 percent generating 14,487,376,423 TL worth of premium. In the life branch,
premium generation grew by 23.13 reaching 2,685,686,964 TL. �e other branches of the sector
performed as follows: the “engine” branch, consisting of the land vehicles insurance (own
insurance) and land vehicles liability insurance (‘tra�c’), enjoyed the largest share in the non-life
branch. According to 2011 data, own insurance grew by 21.54% and ‘tra�c’ by 16.88%.
Considering that the two branches have a 40% share in the total insurance volume, one better
understands the e�ect of the growth of premium generation achieved in these branches on the
overall growth of the insurance sector. �e “sickness – health”, that accounts for 12% of the total
premium generation for 2011, grew by 17,24% and �re and natural disaster insurance, that
accounts for another 12%, by 16,69%. �e sector is expected to grow as fast in 2012.

Factoring Benefits From Growth �e growth achieved by the Turkish economy over the last few years and the prevailing
environment of stability has had direct favourable e�ects on the volume of factoring
transactions. �e factoring sector grew by 44% with respect to 1996. �is year the sector is
expected to grow by 10 – 20%. Consolidation operations are expected for companies that
su�er from a shortage of capital.
2011 Was An Excellent Year For Gold2011 was a good year for those who had invested in gold or foreign currency. �e selling price of
24-carat gold-bullion rose by 35.96% in 2011 and that of the ‘Cumhuriyet” gold by 36.23%. �e
annual revaluation of USD with respect to TL was 22.45% and that of Euro 18.97%. �ose who
had invested in stocks traded in the stock exchange su�ered a loss of 22.33% in 2011. �e İMKB
100 Index, which had closed 2010 with 66.004 points, fell to 51.266 points as at the end of 2011.
As for other countries, the stock exchange indexes of Greece, Portugal, Spain and Ireland but also
those of France and Italy saw abrupt falls in their performances. Particularly after June 2011, there
were falls in all USD-based stock exchange indexes with the sole exception of Mexico. As for
indexes based on national currencies, those of developing countries such as Turkey, Mexico and
Brazil, showed a relatively horizontal development in the second half of the year. Developed
economies fell below their 2009 levels while developing countries are still over that level.
Foreign Investments Increase By 84%During the �rst 10 months of 2011, the amount of direct international investment in Turkey rose
by 84% with respect to the same period of the last year reaching 11.5 billion USD. About 50
venture capital funds funded about 150 companies in Turkey. To mention the most important
measures taken in 2011: �e Banking Regulation and Supervision Agency raised in practice the
capital adequacy ratio from 8% to 12%; banks were allowed to issue TL securities in the domestic
market; and limitations were put on the volume of loans.

ÇALIK FİNANSAL HİZMETLERİ A.Ş.
AKTİF YATIRIM BANKASI A.Ş.
BANKA KOMBETARE TREGTARE SH.A
E-KENT TEKNOLOJİ VE ÖDEME SİSTEMLERİ SAN. TİC. A.Ş.
EPOST ELEKTRONİK PERAKENDE OTOMASYON SATIŞ TİCARET A.Ş.
ÇALIK YÖNETİM SİSTEMLERİ A.Ş.

49
THE BANK THAT HAS ATTAINED
“AKTİF” SUCCESS WITH THE RIGHT
STRATEGY
Employing the right strategies in its development, Aktif Bank has accomplished remarkable
achievements each day. Çalık Group that has been carrying out business in the �nancial sector since
1999, restructured Çalıkbank in 2007 after which it started to furnish services by the name Aktif Bank.
Aktif Bank comprises its products and services with respect to 3 fundamental strategies named as direct
banking, regional banking and urban banking.
Aktif Bank, that has brought Turkey’s �rst and only direct banking strategy to life, provides widespread
and grand scale banking services with low costs by employing electronic channels and various
institutions as transfer channels. In this context, credits supplied through PTT business centers and
contracted dealers and money transfers constitute examples to the direct banking services of Aktif Bank.
�e bank appraises Turkey’s big cities according to their di�erent economical conditions and develops
special strategies and products for them with urban banking strategies it employs. Within this
framework, Aktif Bank aims to work as a mediator in �nancial negotiatons and provide �nancial
solutions nationwide.
As for regional banking strategies, the bank improves its relations with MENA countries, primarily with
Albania, Kosovo and Iraq by expanding Turkey’s activities in neighboring lands. Aktif Bank, which
develops products and services designed for Turkish entrepreneurs who carry on commerce in these
lands, also takes part in the �nancing of activities of businessmen in neighboring countries who are
engaged in business in our country.
Aktif Bank Continues To Pioneer In The Finance Sector Through Considerable AdvancesAktif Bank realized Turkey’s �rst nationwide export in Asset-backed Securities (ABS). �e ABS
that amounted to 187 million TL exported by Turkey’s �rst Property Financing Fund that was
established by the bank was sold out in the �rst two hours due to high demand without having to
stay on sale for the alloted time of 7 days. �e processing of the securitization at issue that was
rated with the highest credit note, AAA, in Turkey and founded on Aktif Bank’s personal credit
portfolio is the �rst ABS o�-balance-sheet export realized in Turkey.

50
Foreign money transfers have been started since 2011 in the system of UPT (Cheap Money Transfer) that has
enabled everyone, whether a customer of Aktif Bank or not, to send money inexpensively, fast, easily and instantly
from almost 4,200 PTT o�ces within national borders. Also, a short, medium and long term �nancing model has
been created for ‘credit insured’ money to be taken on discount and the mentioned model has been demonstrated
as an example application by Türk Eximbank. Furthermore, Aktif Bank has been ranked among the top 5 banks
that has made an agreement with Trade Finance Program (TFP).
Aktif Bank Has Risen By 15 Orders All At Once In Active Growth RankingRising by 15 orders in the active growth ranking in the last 4 years, Aktif Bank exceeded 2,550 million TL in
active growth in December 2011. Aktif Bank, which is among the most successful banks in the sector with
respect to active pro�t and Return on equity (ROE) has come about above the average active pro�t rate in the
sector by %2.48.
The Bank Facilitates Life With The Opportunities It Offers Besides Its Outstanding ServicesAktif Bank that introduced new ancillary activities in 2011 began national and overseas money transfers as from
2011 and a fast growth trend has been attained by the Bank through the application of the most economical
remittance of funds program UPT (Cheap Money Transfer) in Turkey, started by in 2010, with a sum of 446,000
operations in UPT® and YP UPT® services together with overall transactions in 2011. Once again, in this context,
Aktif Bank has put into service Global Transfer Services as part of fast money order agreement realized with
overseas banks, fast money transfer corporations and other �nancial corporations having money transfer license.
Aktif Bank has become a primary performer in the consumer loan domain in the sector by granting credits of
hundreds of millions of liras with Paranthesis Credit System that provides a credit loan in a matter of minutes
for everyone getting their salaries from PTT. Aktif Bank has also matched up larger groups of people with
credits with respect to their needs at points of sale through an expansive credit network of dealers. Personal
credit items granted through PTT o�ces and Branches have reached 140,000 whereas credit balance has
amounted to 844 million TL.
Aktif Bank that realized its �rst bank bonds securities export in 2009 has continued to have more presence in the
export market in 2011. Adopting a more proactive sales strategy in 2011 the Bank targeted all distinguished
investors in the country as well as its own customers, reaching a sales �gure of 3.5 billion TL in total by means of
correspondences and visits it has undertaken.

51
Turkey’s Fastest Growing Bank In The Last 4 Years New banks have been added to the international banking network of Aktif Bank by providing attendance to
important international meetings and seminars such as IFC, EBRD, IMF, IIF, SIBOS made in Turkey and in
other countries as well in 2011. Exceeding the �gures of 2010 by 1.16 times, resources from outside Turkey has
reached 373 million TL. Furthermore, it has become a provider of foreign trade service throughout 86 countries
worldwide with its number of correspondents reaching as high as 450.
�e number of bank accounts opened by international banks within Aktif Bank has increased by four times,
reaching a total number of 100 with its more powerful network. In parallel with this, the Bank’s overseas
accounts has doubled, reaching a �gure of 72 altogether. Trade volume that used to be 940 million TL in 2010
has reached 3.8 billion TL in parallel with new limits and job opportunities created.
Besides all this �nancial success Aktif Bank has been rewarded with 8 international rewards in all in domains of
payment systems, quality, distribution channels and communication and all of the organizations in which these
rewards were presented were important organizations in which Aktif Bank got free of competition with
international trademarked corporations.
Indicators (�ousand USD) Aktif Bank
Total Actives 1.339.003
Credits (Cash Credits) 880.035
Funds (Borrower Funds) 266.174
Bank Bonds 439.258
Other Foreign Sources 225.467
Equity Capital (Liquidated Capital Stock) 120.640
Capital E�ciency Ratio 13,94
Net Pro�t 26.241
Number of Customers 142.068 (natural and legal entity in total)
Number of Sta� 373
Number of Branch O�ces 7
2011 Rate of exchange: 1,9065

52

53
A STRONG BANK, ACHIEVING SUSTAINABLE
GROWTH IN ITS REGION: BKT
BKT, continues to provide high quality services to its customers through its branches in Albania and in Kosovo with its objective to
contribute to the economy of the region. Banka Kombetare Tregtare (BKT), a Çalık Holding subsidiary, is one of the two largest banks
in Albania with branches in Albania and Kosovo. �e size of its assets has reached 1.9 billion USD with an actual growth rate of over
27% with respect to the end of the previous year. Likewise, the total of the deposits held in the bank reached 1.6 billion USD with an
actual increase of over 24%. �e annual pro�t of BKT is about 29.4 billion USD and its adjusted return on equity is 26%.
As of the end of 2011, BKT’s market share in terms of assets and deposits has increased signi�cantly with record growth rates: 17.7%
and 18.4% respectively. It was the only bank among the four largest in the sector to increase its market share. BKT has exhibited
success in terms of loans portfolio as well. �e portfolio grew by 45% annually and the bank increased its market share in terms of
loans to over 14.8% becoming one of the two largest banks in the ranking of market shares. In a context where in Albanian banking
sector the ratio of the total of the problem loans to the balance of loans (NPL 90) was over 18.7%, this rate was much lower for BKT
as it was only 5,64%.at the end of 2011. A performance that is considerably better than its competitors and that makes BKT the most
successful bank in Albania.
BKT Continues To Grow By Bringing Innovations To AlbaniaBKT introduced the Corporate and Commercial Internet Banking (???) to Albania in 2011 and added the functions of Bill
Settlement, Credit Loading on SIM Cards and Digital TV Package Purchase to Personal Internet Banking. Bank introduced to
Kosovo the system of contracting loan through SMS. At the same time, Bank has enlarged its service network in Albania by
sending personal consumer loan o�ers to potential loan customers through SMS. BKT became the �rst Albanian bank to be
directly admitted to the International Chamber of Commerce (ICC), based in Paris. Works are underway to create an Albanian
Committee reporting to the International Chamber of Commerce. BKT is the �rst and only Albanian bank to render
correspondent visits to various countries. It has also organized a “Foreign Trade Seminar” for private companies. In addition,
BKT and the Kuwait-based Liquidity Management House have started a joint operation to issue Islamic bonds with the support
of the Albanian Government.
BKT Continues To Render Solutions That Make A Difference In Service QualityBKT renders service with over 1,000 employees and a total 80 branches, of which 57 are in Albania and 23 in Kosovo. �e total
number of �nancial transactions carried out by the bank through its network of branches in 2011 was 7.5 million. �e number of
transactions carried out through the Bank’s 115 ATMs was 1.7 million. �e market share of BKT in terms of number of ATM
transactions rose from 14% to 16%. BKT has carried out 94,000 �nancial transactions through its POS network with a total of 2,171
POS terminals. Its market share in Albania in terms of numbers of POS transactions rose from 3% to 8%. �e bank has carried out
about 18,000 �nancial transactions through Personal Internet Banking in 2011. BKT started to receive dynamic reports through the
Business Intelligence system regarding products and service channels such as credit cards, debit cards, e-banking, mobile banking,
ATM and POS. �e bank continues to work on loan and deposit products. In 2011, BKT started to use the products and programs
named “EFSE Loan”, “Flexible Business Loan” and “Accounts Receivable Loan” in the domain of Commercial Banking. In addition,
the Bank continues to work on the implementation of the 2011 version (version 11.2) of its master banking software updated in 2005
(version 6.2). It continues to work on the integration of SAP “Active Asset Management” and “Procurement” modules with the master
banking system. �e Internet Banking software has been completed under a project conducted with Aktif Bank and OBSS for the
customers of Corporate and Commercial Banking; which is due to be commissioned in the second quarter of 2012.
Good Work Confirmed By AwardsBKT was placed in the category of highest investable by JCR-Eurasia on 13 April 2011 and its long term national rating was
determined as “AAA(Alb)” and its outlook as “stable”. On 27 January 2011, Moody’s determined BKT’s rating as “B1” with outlook
as “stable”; in comparison to Albanian country rating, it is considered to be the highest ranking possible at this level. BKT was
honoured with a number of awards in 2011 for its high quality service and good performance. EMEA Finance Magazine awarded the
Bank with the title of the “Best Bank in Albania”. Deutsche Bank honoured BKT with the award of “Outstanding Quality in Payment
Systems”. �e Banker Magazine awarded BKT with the title of the “Best Bank in Albania” for the second consecutive time.

54

55
E-KENT: A COMPANY THAT OFFERS
INNOVATIVE SOLUTIONS FOR CITIES
E-Kent works with the vision of “building urban technologies”. �e Company introduces new products and services in the
�eld and renders service to more and more cities. E-Kent was incorporated into Çalık Holding in 2008. It uses the high
technology that modern urbanism requires and o�ers the possibility of bene�ting from a number of services with a single
card. �e Company produces solutions destined to be indispensable aspects of urban life, ensuring fast and problem-free
payment. �e services it renders include: management of the organisation of selling points and authorized sellers throughout
the city, electronic fee collection service integrated with the public transport buses and light rail-transport system (EÜTS),
operation of fee collection boxes under bank guarantee, optimisation of transport lines, planning and e�ciency counselling
and instant communication of transport service information to citizens. With the transport turnover under its management
and its technological products and operational sta�, E-Kent is the leader of its sector. It is the only company to provide, in a
single device, solutions where in all of the public transportation system payment by cash is replaced with smart transportation
cards or magnetic paper tickets throughout Turkey. �e Company produces reliable solutions for new requirements using
advanced and continuously updated technology. In 2011, it started an intense process of research and development to o�er
its customers new generation hardware and software products developed exclusively by local engineering.
Enhancing Successful Operations With Its Innovative Structure �e �rst phase of the SAP project, intended to combine in cities where electronic fee collection systems are installed, systems in a single
platform in order to improve their control, to create a decision support system in harmony with developments and changes, to improve the
competitive power and to ensure standardization of business processes in the area, was completed only in 9 months. �e second phase of
the SAP integration, a �rst in the Turkish Electronic Fee Collection Systems sector, is planned to be completed in 2012. �e “New
generation validator” and back o�ce system developments were designed and their software prepared exclusively by E-Kent engineers
taking into account the current and expected requirements of the market. �ey operate in conjunction with the integrated vehicle tracking
system and the accompanying smart stop system and support telephones equipped with the features of bank card and NFC as well as
magnetic paper tickets and non-contact smart cards.
“Smart” Key Of TransportationE-Kent, the founder of a number of innovations in Turkey, developed and put into operation in Kütahya a “system of by-the-road car park
fee collection through a hand terminal” where “Kütahya Kart43”, used as a public transportation pass, is now able to be used to pay car
park fees, which is another novelty in this �eld. In addition, the “Ride Advance” method, started for the �rst time in Kütahya, enables
passengers who have run out of credits to have two more rides. E-Kent started the system that allows payment by “BUKART Kart16” at
barrier car parks in Bursa Kültürpark. In Sakarya Intercity Bus Terminal, it has installed “Kart54” payment system that allows access to
and exit from the car park area. As for the by-the-road parkomat systems installed in Sakarya, the hardware and software operations have
been completed and the system has been commissioned for “Kart54”, already used in public transportation, to be used as a means of
payment. �e public transportation card “Kart38”, supported by the metropolitan Municipality of Kayseri, is now used to rent bikes
under KAYBİS project, which is another �rst in Turkey. “Aktif81”, the second “City Card” introduced in Turkey, is now operating in
Düzce. In addition, a “Reduced-Price City Card”, “UniPasso38”, closely related to this project, has been introduced in Kayseri.
“UniPasso81”, a similar card, was introduced in Düzce. A web-based reporting and remuneration calculation system has been installed for
transportation authorities and municipalities who receive service from E-Kent. �e system will be used with personal user names and
passwords to secure access. �e system enables users at di�erent levels of authority to obtain remuneration calculation and passenger
reports through the Internet without installing any software program in personal computers. In addition to the installation of the Fee
Collection System, E-Kent also started to incorporate on-board passenger information and public announce systems and on-board security
cameras in its service network, and has started their installation. E-Kent renders services in Bursa, Kayseri, Gaziantep, Sakarya, Tokat,
Kütahya, Düzce, Konuralp, Akçakoca, Çankırı, Anamur and Simav with its 350 employees. It has a fee collection system installed at 2,700
turnstiles of public transportation buses and light rail-transport vehicles. It has sold 3 million smart transportation cards, of which 500,000
were in use in 2011, and 35 million magnetic card tickets. �e Company has reached a transaction �gure of 1 billion with over 300 million
rides. With the NFC technology, conducted in TÜBİTAK and receiving Technological Innovation Support, E-Kent continues to work on
the “Urban Card Applications Development Project” and “the Project of Entry-Exit System with HF&UHF Cards”.

MED
IAMEDIA SECTOR TO REACH 11.4 BILLION USD IN 2015
MEDIA SECTOR OVERVIEW IN 2011
�e crisis in Europe hit most seriously the media sector. Newspapers and radios owned by the
largest media groups in the world had to struggle hard to overcome their di�culties. Even
the British giant BBC had to make cuts in its traditional radio broadcasts in world languages.
La Tribune, a major French newspaper founded in 1985, had to say farewell to its readers.
2011 was a disastrous year for many media organs throughout the world from Hungary to
Cuba, from Greece to Chile.
According to the report ‘Global Entertaining and Media Outlook for 2011 – 2015’ issued by
the counselling unit of PwC, the entertaining and media sector is focusing on collaboration
after the global recession. �e report says that as demand for digital experiences increases
and this becomes the norm, those consumers who have obtained digital power triumph. In a
number of markets, the entertainment and media sector underwent a deep transformation
after the global crisis. �e shifting of consumers to digital media was boosted by the
revolution in mobile devices. �e entertainment and media sector regressed in 2009,
recovered in 2010 and started progressing in 2011. In 2010, the sector reached 1.4 trillion
USD. With a global annual growth rate of 5.7%, it is expected to reach 1.87 trillion USD in
2015. In Turkey, the sector underwent a regression in 2009, recovered in 2010 and reached
6.1 billion USD. With an annual rate of growth of 13.2%, it is expected to reach 11.4 billion
in 2015. �e entertainment and media sector will grow mainly in digital channels. Spending
shifts fast from conventional platforms to digital platforms and spending in digital platforms
accounts for 26% of total spending. �e share of digital platforms is expected to reach 33,9%
by 2015.

Advertising Investments Will Grow By 15% This Year According to the advertising investment reports prepared with the data of media agencies
belonging to the membership of the Association of Advertising Agencies, advertising
expenditures that amounted to 4.3 billion TL totally has increased 20% compared to the
year 2010. Advertising investments are expected to increase by 15% this year. In 2011,
56.66% of the investments constituted those on television, 24.25% on the press, 7.97% on
the internet, 7.09% on open air, 2.80% on radio, 1.23% on cinema advertising. Whereas the
sectors that encouraged growth in the TV domain were communication, food, cosmetics and
personal care, home cleaning products, retail, construction-decoration, publishing,
automotive and �nance sectors came into prominence in the sector of press. As the marketing
communication sector gains depth, it is expected that new brands will begin advertising
investments. In the report of �e consultancy company of the world’s communications giant
WPP, GroupM, titled “�is Year, Next Year”, covering 70 countries, it is maintained that the
Turkish advertising market will continue its growth. �e advertising market that was 3.817
million TL in 2010 exceeded 4 billion TL in 2011. When the �gures of 2011 are taken into
account, it is seen that TV and newspapers continued to receive the highest share in the
advertising market. While TVs took the �rst place with 2 billion 398 million liras,
newspapers came the second with 942 million liras, open air commercials the third with 302
million liras, and internet the fourth with 270 million liras. �e radio has reached a �gure of
114 million TL. In the 2012 section of the report, it is stated that, the global advertising
market could be in�uenced positively by the US Presidency elections and the Olympics in
London while the continuation of the economic growth in Turkey will go on expanding the
market with consistency. According to this report, it is expected that the market will reach 5
billion 84 million for the year 2012 in Turkey.

TURKUVAZ RADYO TELEVİZYON HABERLEŞME VE YAYINCILIK A.Ş.
TURKUVAZ YAYIN HİZMETLERİ VE TİCARET A.Ş.
TURKUVAZ FİLMCİLİK PRODÜKSİYON SANAYİ VE TİCARET A.Ş.
TURKUVAZ HABER AJANSI A.Ş.
TURKUVAZ TELEVİZYON VE RADYO İŞLETMECİLİĞİ A.Ş.
TURKUVAZ ATV TELEVİZYON PRODÜKSİYON A.Ş.
TURKUVAZ REKLAM PAZARLAMA DANIŞMANLIK A.Ş.
TURKUVAZ TEKNİK HİZMETLER SANAYİ VE TİCARET A.Ş.
TURKUVAZ KİTAPÇILIK YAYINCILIK A.Ş.
TURKUVAZ GAZETE DERGİ BASIM A.Ş.
TURKUVAZ DAĞITIM PAZARLAMA A.Ş.
TURKUVAZ MATBAACILIK YAYINCILIK A.Ş.
TURKUVAZ MOBİL HİZMETLER A.Ş.
TURKUVAZ İZMİR GAZETE DERGİ BASIM YAYIN A.Ş.
TURKUVAZ İZMİR TELEVİZYON PRODÜKSİYON VE RADYOCULUK A.Ş.
TURKUVAZ AKTİF TELEVİZYON PRODÜKSİYON A.Ş.
TURKUVAZ YENİ ASIR TELEVİZYON PRODÜKSİYON A.Ş.
TURKUVAZ MEDYA YAYIN HİZMETLERİ A.Ş.
TURKUVAZ TV HİZMETLERİ A.Ş.
TURKUVAZ GÖRSEL VE İŞİTSEL İLETİŞİM A.Ş.
TURKUVAZ MOTOR PRESSE DERGİ YAYINCILIK LİMİTED ŞİRKETİ
TURKUVAZ ATV SABAH GMBH

59
TURKUVAZ MEDIA GROUP;
WITH NEW CHANNELS,
NEW FACE, NEW TECHNOLOGIES
Turkuvaz Media Group, incorporated into Çalık Holding three years ago, provides reliable, impartial
and timely print and visual media services for its readers and viewers through a wide range of
communication channels.
Turkuvaz Media Group, one of the most in�uential media organs in Turkey, started its thematic
broadcasting operations in 2011 with the inauguration of the channels A Haber and Minika. �ese
two new channels enabled the Group to increase further its existing in�uence, thanks to the
technological superiority and visions put forward. �us, Turkuvaz Media is con�dently progressing
towards achieving its strategic targets. �e Group believes that sustainable growth in the media sector
is possible only through new investments and accordingly, as of 2011 started to distribute its
newspaper Sabah in �rst quality art paper throughout Turkey.
In addition to radio, TV and press media operations and book, periodicals publishing, Turkuvaz
Media Group is also active in a wide range of activities including Internet publishing, sales of
non-media products, newspaper and periodical distribution throughout Turkey.
Wider Service Network, Larger AudienceWith its 22 companies, Turkuvaz Media Group is one of the two largest media organs in Turkey;
in terms of market size and advertising share. It has a wide and diversi�ed media network in
Turkey and a large audience of readers and viewers in Europe. Its TV series and programs are very
popular in Near East Countries. �anks to the synergy created by its various brands, Turkuvaz
enjoys high e�ciency with a 360° �eld of operations.
�e TV channels ATV, A Haber, Minika, ATV Avrupa, Yeni Asır TV and Izmir TV enable the
Group to reach audiences from di�erent segments of the society at regional, national and
international level. Radio Turkuvaz operates on a national basis and Romantik Radyo on a local
basis. Turkuvaz Media Group is the owner of the national newspapers Sabah, Takvim and
Fotomaç and, at a local level, it is the leader of the sector of regional press with the newspaper
Yeni Asır, the oldest newspaper in Turkey. In the periodicals segment, Turkuvaz Media Group is,
in addition to its own brands, the authorized publisher in Turkey of the periodicals of the
world-famous groups Hearst and AMS.
In the online segment, the Group provides the public with information with a di�erent and rich
content covering various �elds of interest. Turkuvaz Publications has obtained a respected
position in the sector by publishing selected books. In the �elds of printing and distribution,
Turkuvaz Media Group is stationed in 5 strategic points throughout Turkey so that it can reach
the remotest parts of the Country rendering service to not only Group customers but also non
Group customers. �e Group closely follows the technological transformation in the sector. It
keeps investing in human resources as well as in digital technology in accordance with its
principle of continuous improvement and innovation.

60

61
Thematic Channels Are Already On, New Ones Coming SoonTurkuvaz Media Group is the author of many �rsts. Its operations are based on the principles of accurate, ethic
and impartial broadcasting. In addition to the channels Atv and Atv Avrupa, in 2011 Group launched A
Haber, Turkey’s �rst HD channel, and a children’s channel, Minika. At the same time, the Group moved to its
new visual media headquarters in Ihlamur. �e new headquarters is equipped with new studios, including the
largest barco video wall in Europe, and equipment that is able to broadcast fully in HD. As Turkuvaz Media
continues to attach great importance to its visual media operations, its children channel Minika is planning to
broadcast as two di�erent channel, targeting 3-8 and 7-14 age groups, in the �rst months of 2012.
Printed In High Quality Art Paper, Sabah Is Now Even Better Turkuvaz Media Group is aware that development and innovation in the sector is possible only through new
investments. �is is why it has started to print its Sabah newspaper in art paper. Group invests continuously
in printing technology in order to improve the quality of its copies. Now, all Sabah copies are printed in art
paper throughout Turkey. Group is planning to start a Turkuvaz printing house in Trabzon in 2012.
New Internet Brand Teknokulis Is LaunchedSimilar to its success’ in media sector, Turkuvaz continued its innovations in the �eld of Internet and launched new
Internet brand: TeknoKulis, in 2011. Accessible through the address http://www.teknokulis.com, Teknokulis
provides surfers with a wide range of technological contents including news from the technology sector, product
analyses, and feedbacks by experts regarding programs that are easily and securely downloadable.
A First In The Media Sector Turkuvaz Media Group has launched the SAP IS-Media system in collaboration with SAP, a world leader in the �eld
of corporate applications and software. �is was another �rst in the Turkish media industry which enables the
Group to manage all of its business processes through a single system. �anks to this system, the Group now
conducts all operations regarding newspaper, periodical and Internet advertising reservation, prices and accounting
through SAP. In addition to the SAP IS-Media system, the SAP BW&BI System has also been launched. �is system
is used to prepare all data collected through the SAP system in the form of Financial Reports and to meet in a more
reliable and expedient way the administrative and operational reporting requirements of the senior management
and of the units in charge of advertising marketing and �nancial a�airs.
Newspaper And Periodicals Subscription System ImprovedTurkuvaz Media Group, the owner of one of the largest media distribution companies in Turkey, has regional
headquarters in Istanbul, Ankara, Izmir, Adana, Antalya and representation o�ces in Trabzon and Erzurum.
�e distribution system, restructured on a national basis, was developed according to the business processes of
the Subscription and Distribution Unit of the older Sabah, Takvim, Fotomaç, Yeni Asır newspapers and the
periodicals. With the new system, �nancial and operational data management is ensured between subscribers,
subscription agents, regional agents, parcel services and Turkuvaz Media. �e Group currently renders service
to 85,000 newspaper and 130,000 periodical subscribers.
Turkuvaz Media Keeps Investing In InfrastructureTurkuvaz Media Group, connected to regions throughout Turkey via high-speed �bre metro Ethernet circuits,
has started to use a low speed G.SHDL system through copper cables, to make sure its connection is not
interrupted even in extraordinary situations. �e Group uses 3G-connection infrastructure in order to be able
to maintain printing operations even in emergency situations in its Istanbul, Ankara, Adana, Antalya and
Izmir printing houses. Turkuvaz has also installed dark �bre laser connections with Gigabyte speed in order
to ensure high speed data communication with its main service buildings in Istanbul.
Turkuvaz Media Group has ISO-9001:2008 Quality Management System Certi�cation in the �eld of printing
activities. Turkuvaz Dağıtım Pazarlama A.Ş., rendering service at internationally recognized standards to the
main headquarters and to 5 regional headquarters, has ISO-9001:2008 Certi�cation.

62
TURKUVAZ NEWSPAPER
SabahSabah, founded in Istanbul, 1985, renewed its outlook in 2011; as the daily newspaper continuously improves its printing
quality and technology, the art paper cover print version has started to be distributed throughout Turkey the same year. �e
newspaper, part of Turkuvaz Media Group since 2008, is a pro-European Union, supporter of free market economy and
believer in the rule of law. It is a defender of pluralism and of an impartial media. Its audience includes the strongest and most
dynamic section of the society. As of 2009, Sabah began to publish �e New York Times in Turkish for its readers. �e Turkish
version of �e New York Times news and comments is published weekly. In 2011, Sabah’s rate of newspaper reader access was
15.10 percent. �e general access for the Turkish population as a whole was 1 million 603 thousand according to the
cumulative results of the Turkish Press Readership Survey 4.-7.
Sabah AvrupaSabah Avrupa has been published since 2006 in 20 European cities, particularly in Germany, to enable Turkish expatriates to
follow the developments in Turkey and in the world in a fast and reliable manner. Sabah Avrupa’s average monthly number of
printed copies was 464,220 in 2011. Unlike other Turkish newspapers, Sabah Avrupa includes the supplement Günaydın. It
has become an indispensable source of information for Turkish expatriates. A signi�cant part of the audience of Sabah Avrupa
consists of people who have received their basic education in Turkey.
Yeni Asır�e Newspaper was founded in 1895 in �essalonica under the name “Asır” and was published under this title for 13 years.
It is the Newspaper that announced the proclamation of the Constitutionalist rule in 1908 and same year added the word
‘Yeni’ (New) to Asır (Century) in its title; since then the name Yeni Asır has been used. Its 114-year past is full of revolutions
in the press sector; besides being the largest regional newspaper in Turkey, it was the �rst Turkish newspaper to be printed in
Turkish Latin alphabet.
Yeni Asır, with its high quality, rich content and di�erent style of news reporting, is the main source of news for the Aegean
region. It closely follows the regional issues and proposes solutions for all. It has been the author of an unprecedented
performance in the �eld of news reporting. �e Newspaper is printed in Turkuvaz Media Group’s facilities in Izmir. Under
the structure of Yeni Asır, there are TV channels; Yeni Asır TV and Izmir TV, a radio channel; Romantik Radyo, and the Yeni
Asır Internet Newspaper. Its daily net sales have been 29,486 copies on the average and its reader access in general has been as
high as 351,000 people, in 2011.
TakvimTakvim Newspaper, founded in 1994, maintained its position among the best selling newspapers in Turkey, in 2011. �anks
to its young sta� and courageous style of news reporting, it has acquired the deserved reputation of being a defender of the
people and justice. It has been improving its brand value as well as reader pro�le. In 2011, it maintained its position in the
sector with a 2.35% market share and reached a total of 560,000 readers in Turkey.
FotomaçFotomaç, founded in 2000, is the best selling and most read sports daily newspaper in Turkey. Fotomaç, a leader in transfers of
footballers’ news, is distinguished with its exclusive interviews and visual quality. In 2011, its audience consisted of 1,313,000
readers in Turkey, which proved once more the success of the newspaper in sports news �eld.

63
TURKUVAZ PERIODICALTurkuvaz Periodical publishes a large number of magazines in a wide range of �elds of interest such as news, economics, hobbies,
fashion, youth and decoration. In addition to its own brands, Turkuvaz Periodicals is the publisher of the world famous magazine
groups Hearst and AMS in Turkey. Turkuvaz Periodical is in charge of the preparation of the content, printing and distribution
processes of these magazines as well as their importation and exportation. �e Company conducts commercial and marketing
activities for these magazines including domestic promotion, announcement and advertising operations. In 2011, Turkuvaz
Periodical had a share of 31% in the net sales of magazines in the sector and of 21.3% in advertising revenues. �e average monthly
sales of the magazines of the Group amounted to 263,938 copies in 2011.
VISUAL MEDIA
Turkuvaz Televizyon ve Radyo İşletmeciliği Sanayi ve Ticaret A.Ş.Turkuvaz TV and Radio was founded in 2005 by Turkuvaz Yayın Holding A.Ş. with the object of conducting TV and radio
broadcasting operations. Turkuvaz TV and Radio aims to reach large audiences in Turkey and abroad by producing and broadcasting
radio and TV programs using state-of-the-art technology.
ATVOne of the �rst private TV channels in Turkey, ATV, founded in 1993, is one of the most popular national TV channels; thanks to its
policy of impartial broadcasting, respect to social values and its programs addressing all family members. ATV broadcasts through
land transmitters, cable TV and digital platforms in Turkey. It also covers the whole Europe, the USA, North Africa, Australia and
Turkic Republics via satellite broadcasting and antennas. ATV is a trend-setter in the Turkish TV world and the author of a large
number of �rsts. Its highly quali�ed sta�, modern and pro-western attitude, high quality and stable policies, high ratings and large
advertising capacity make it a leader in the sector. �anks to its correct analysis of the popular series trends in Turkey, ATV achieved
an increase in its audience share in 2011.Its prime time audience share was 11.3 percent and o� prime time audience share 10.5
percent in 2011. ATV achieved a 5% growth compared to 2010.
ATV AvrupaLaunched in 1997 with the object of being a European channel ATV Avrupa broadcasts to over 40 countries, including Germany, in
two languages. Information and education occupy a privileged place in the programs of ATV Avrupa and the Channel addresses
Turkish expatriates with the consciousness of ful�lling a mission.
A HaberA Haber, news channel of Turkuvaz Media, was founded in 2011 with the object of providing its viewers with round the clock live
news broadcasts. It started with the motto “the Channel of the News”. It is the �rst news channel to provide HD broadcasting in
Turkey. It has already acquired a signi�cant position among Turkish news channels thanks to it principle of providing accurate live
news broadcasts round the clock from every single part of Turkey.

Minika TVMinika TV is Turkuvaz Media’s �rst thematic channel for children. After a period of intense preparations, it was
inaugurated on 28 January 2011. Minika TV aims to broadcast educational programs without neglecting children’s
right to have a good time according to the tastes of children and in accordance with the approval of pedagogues.
Minika is a channel that parents can put their trust in when it comes to the education of their children. It provides
pre-school and school children with the best cartoons, exciting TV series, entertaining family �lms and stimulating
educational programs and documentaries.
PUBLISHING AND DISTRIBUTION
Turkuvaz Distribution and Marketing�is establishment y is in charge of the distribution operations of Turkuvaz Media Group. Turkuvaz Distribution is
one of the two print media distribution companies of the Country. Its market share is 38.3 percent (Zaman and Yeni
Şafak, which have a subscription system, are not included). Currently, it distributes 26 national, 5 regional
newspapers and 361 periodicals to 195 main distribution points and 25,540 detail distributors using 1,662 vehicles.
Turkuvaz BookTurkuvaz Book, founded in 2005, provides readers with the works of selected writers in line with its principle
of publishing only high quality books in a reliable manner. Turkuvaz Book publications cover a wide range of
�elds of interest including literature, biographies, memoirs, history, philosophy, investigation and research,
children’s books, health, detective stories, popular tales, classics, modern classics and popular books.
ADVERTISING MARKETING COUNSELLING
AND NEWS AGENCY
Turkuvaz Advertising Marketing CounsellingTurkuvaz Advertising conducts operations of digital media advertising and sales marketing through its printed and visual
products. It consists of a head o�ce, four regional headquarters and regional representation o�ces. It enjoys a large share
in the advertising market and �gures among the leading companies of the sector thanks to its experienced sta�.
Turkuvaz News AgencyIt was founded with the object of rendering news services to the printed and visual media brands of Turkuvaz Yayın
Holding. It renders services to a number of leading media organs in Turkey and Europe.
Turkuvaz PrintingTurkuvaz Matbaacılık Yayıncılık A.Ş. owns one of the largest printing facilities in Turkey. It conducts operations of
printing and distribution for newspapers, periodicals and other publications. In line with its philosophy of
continuous improvement, it has attached great importance to improving the quality of its printing services regarding
various products such as newspapers, inserts, brochures, catalogues, periodicals, books, posters and �iers since 1985.
64

Another innovation led by Turkuvaz Media Group e�ectuated when the Group installed the �rst insert system in
Turkey in 1996-97 in its Istanbul printing facilities. Its printing facilities for newspapers are located in Istanbul,
Ankara, Izmir, Antalya and Adana and its printing facilities for periodicals and inserts are in Istanbul. In 2012, the
Trabzon printing house will start its operations.
TECHNICAL SERVICES
ATV TechnicATV Technic is the unit that provides technical support for the TV Group. It has studios in three di�erent locations, namely
Yenibosna studio complex, Yıldız Visual Media Centre and Ankara o�ce. All of the studios are equipped with state-of-the-art
technology. Yenibosna complex has 3 studios supported by 2 stage managements. Stage Management 1 is equipped with a
Full HD MVS8000G 3ME picture table and Stage Management 2 with a MVS6000 2,5ME full HD picture table. �ere are
a total of 11 Sony HSC300 studio cameras. Turkuvaz Visual Media Centre in Yıldız is equipped with 13 Sony HSC 300 and
4 Sony HSC100 cameras, a total of 17 HD studio cameras. It has 7 studios controlled by 3 Stage Managements.
ATV Technic is fully equipped with HD system equipment and infrastructure. It is capable of doing both HD and SD
broadcasting. It is able to broadcast 5-channel SD and 2-channel HD using Cinegy Broadcasting Automation with 150 users.
�e Turkuvaz Visual Media Centre has 3 Final Cut, 2 Cinegy and 2 Avid edition sets. �e Yenibosna Studios are equipped with 1
Avid edition set. �e Ankara o�ce is equipped with 5 HXC 100 LD studio cameras and 6 XDCAM PDW150 handheld cameras.
�e total light capacity provided by ATV Technic amounts to 1050 KW (robot, 2500 colouring, cold light). �ere are 30 LED
screens and 5 processors for shooting operations. In Istanbul there are 4 uplink vehicles and 2 generator vehicles (200KVA, 40
KVA). In Ankara, there are 2 uplink vehicles. And in Izmir, there is 1 uplink vehicle. So, ATV Technic has a total of 7 uplink
vehicles and 2 generator vehicles. It has a total of 25 XDCAM PDW-700 handheld cameras.
Turkuvaz Media Group has completely renewed the infrastructure of ATV and its thematic channels. It has a total of 33 HD
studio cameras and 25 XDCAM handheld cameras.
65

MIN
ING
TURKEY IS AMONG TOP 10 IN MINING
MINING SECTOR OVERVIEW IN 20112011 was marked by rising commodity prices in the world. Oil prices rose signi�cantly and so
did mining prices. Oil prices rose from 22 USD per barrel to 120 USD at the present. In 2002,
the price of gold was 309 USD per ounce compared to 1900 USD in 2011. �e price of copper,
an industrial input, rose from 1.670 USD per ton to 9.515 USD today.
�e most important factor in this process in the mining sector was the emergence of China. �e
inexorable rise of China made this country the largest producer and consumer of mining in the
world. Having managed to attract 1 trillion USD worth of direct foreign investment capital,
China is currently the leading industrializing country. �e world’s mineral production failed to
meet the Chinese demand for minerals that increased suddenly as of 2003. �e gap between the
demand and the o�er led to abrupt rises in energy and metal prices. China’s annual coal
production doubled over the last 5 years exceeding 3 billion tons. China is said to inaugurate a
new thermal power plant every week.
Turkey is also con�dently progressing in order to achieve her industrialization targets in line
with her 2023 vision, which means a signi�cant increase in her importation of intermediate
goods. Figures show the urgency of �lling the gap: Turkey’s per capita annual mineral
consumption amounts to 6 tons compared to 21 tons in the USA and 16 in Europe.
World mineral prices are expected to increase sharply. �e most important factors that justify
such expectations are: the fact that 350 million people in China are expected to migrate from
rural areas to cities by 2025; the fast industrialization of China and India leading to a fast
increase in the world demand for energy and mining; and the fact that it does not seem to be
possible to meet the increasing world demand for metal in the short run due to the fast
industrialization of China. �is is why the rising trend in metal prices is expected to persist
over the coming years.
12 billion USD was spent in 2008 in the world in non-ferrous metal mining explorations. �is
�gure fell to 8 billion in 2009 due to the crisis. In 2010, 10 billion USD was spent in the form
of venture capital. Out of this �gure, about 5 billion USD was spent in gold exploration
activities while in Turkey only 50 million USD was spent in gold exploration activities in 2010.
�e gold production of Turkey rose from practically nil in 2002 to 25 tons last year.
As for the mining resources available in our country including the newly discovered reserves,
Turkey is now among the top 10 in the world. �anks to her complex geological situation and
tectonic structure, Turkey possesses a wide variety of mineral resources. Of the 90 kinds of
minerals in the world, 60 are produced in our country.
With the amendments made in 2010 to Law no. 3213 on Mining, the sector became more active
and the sector’s share in exportations and national income increased signi�cantly. In 2011,

3,297 applications had been �led as at the end of October and a total of 2611 permits issued,
of which 1,138 were for exploration and 1,473 for exploitation. Before the promulgation of
Law no. 5995, the total number of permits was 43,166, which fell, after the promulgation of
the Law, to a total of 33,122 permits, of which 20,078 were for exploration and 13,044 for
exploitation. �is shows that the problem of permit trading, the most serious problem in the
mining sector, has been solved to a great extent.
With the increase in drilling exploration activities as of 2003, the amount of public-private
mining exploration drilling operations rose from 100,000 meters in 2002 to 1,300,000 meters
at the present.
Mining exportations rose from 700 million USD in 2002 to 3 billion 665 million in 2010. �e
exportation �gure for 2011 had already reached 1 billion 451 million USD as at September
2011.
�e GNP value of the mining sector rose from 1 billion 900 million USD in 2002 to 10 billion
510 million USD in 2010. �anks to the e�orts of ETİ General Directorate of Mining
Operations, important progresses were achieved in the production, sales and exportation of
boron, a mineral 72% of the world reserves of which are located in our country. �e
production of Boron chemicals and equivalent products rose from 436,000 tons in 2002 to 1.4
million tons in 2011. For 2011, the planned amount of production of boron chemicals and
equivalent products amounts to 1.9 million tons and 1,445,000 tons of this had already been
achieved as of the end of October. �anks to the exploration operations conducted in 2011,
important zinc-lead reserves were discovered in Turkey in Divriği-Akdağ and an important
iron ore reserve in Kuluncak, Malatya. In the Adıyaman region, copper deposits were found in
Sincik, Koçali and Tut. In western Anatolia, Çanakkale-Gökçeada explorations have been
completed and a large porphyry copper-gold and lead-zinc reserve with low content was
discovered. Signs of important gold-copper-nickel reserves were observed in Divriği-Sivas and
Oğuzlar, Çorum and more work is underway. Explorations for resources of industrial minerals
and raw materials led to the discovery of important resources of sodium sulphate and rock salt
in Niğde, Konya Ereğli, Çankırı and Çorum-Bayat. �e works still underway conducted by
MTA (the Mineral Research and Exploration Institute) under the project of reserve
improvement and boron exploration in exploitation and permit �elds owned by ETİ General
Directorate of Mining Operations led to an increase in our country’s boron reserves from 2 billion
tons to over 3 billion tons as visible + probable + possible and our reserves became visible to a
great extent.

LİDYA MADENCİLİK SAN. VE TİC. A.Ş.
TURA MADENCİLİK A.Ş.
DORE ALTIN VE MADEN A.Ş.
KARTALTEPE MADENCİLİK SANAYİ VE TİCARET A.Ş.
TUNÇPINAR MADENCİLİK SANAYİ VE TİCARET A.Ş.

69
LİDYA MADENCİLİK: THE NEW
AND DYNAMIC PARTICIPATOR IN
THE TURKISH MINING SECTOR
First founded in 2006 as a Çalık Holding subsidiary under the name Çalık Maden İşletmeleri A.Ş.,
Lidya Madencilik San. ve Tic. A.Ş. was renamed, in 2010 and since than its business volume grew fast.
Lidya Madencilik, operating in the �eld of metals and precious metals in Turkey, is focused on gold,
copper, silver and molybdenum.
Anagold, a�liate of Alacer Gold and Lidya Madencilik, started its gold production in Çöpler Gold
Mine, located in İliç, Erzincan, on 22 December 2011. �e Company, in which Lidya Madencilik has
20% share, produced 185,417 ounces of gold in 2011; the production in Çöpler area exceeded the
expectations, corresponding to a quarter of Turkey’s gold production. Providing employment for 700
people in Çöpler Gold Mine, including locals from İliç and the villages in the vicinity, Anagold
achieved 267 million USD turnover at the end of 2011.
In Çöpler gold mine, the second largest gold reserve in Turkey with a capacity of 4.6 million ounces of
gold, Anagold targets to produce 200,000 ounces of gold in 2012.
Fifty Fifty Partnership In 16 New FieldsLidya Madencilik concluded a half and half partnership with Alacer Gold for 16 new �elds, in 2011.
�e exploration operations have already begun on the �rst �eld.
In line with the new partnership both Companies agreed on; Kurudere Madencilik, a subsidiary of
Alacer Gold, to be the operator for Tunçpınar Madencilik, owner of copper �elds in Tunceli, and for
Kartaltepe Mining, owner of copper/gold �elds in the Erzincan area, while, Lidya Madencilik to be the
operator of Polimetal Madencilik that owns the other 12 �elds issued under �fty �fty partnership.
With this, Lidya will become involved as an operator as well as an investor in the Turkish mining
industry. �ese sites of di�erent metals in di�erent provinces of Turkey are expected to play a major
role in Lidya Madencilik’s investment and growth plans in the near future.
WITH ITS 250 MILLION USD INVESTMENT PRICE, ÇÖPLER GOLD MINE IS ONE OF THELARGEST INVESTMENTS IN THE REGION.

�e principle “creating added value for the society” underlies the basis of Çalık Holding’s corporate social responsibility understanding.

79
SOCIAL RESPONSIBILITY
Aware of its environmental and social responsibilities, Çalık Holding and its a�liates
conduct all of their operations in accordance with the conception of sustainable
development and social responsibility. Çalık Holding continuously generates added value
for the national economy through its products and services but also through the jobs it
creates directly or indirectly, its investments and the taxes it pays as well as through the
social responsibility projects it undertakes.
Çalık Holding continues to make contributions for the future of the countries where it is
present. “Generating added value for the society” is the basis of Çalık Holding’s corporate
conception of responsibility. �is is also an aspect of Çalık Holding’s corporate culture.
�e Holding supports social activities in the �elds of art, sports, education and health,
directly or through collaboration with non-governmental organizations. Çalık Holding’s
social responsibility e�orts are an illustration of its respect for the society and for its
employees.
“United for Van!”Right after the 7.2 magnitude earthquake in Van, 140 tons aid loaded on 7 trucks were
sent under a campaign organized by the newspaper Sabah and the Turkish Red
Crescent. 61 million TL were collected in the aid campaign to which ATV and A Haber
contributed through live coverage.
The Campaign “Hand By Hand; From House To House” Çalık Holding employees gave start to a new social responsibility campaign planned to be
carried out every year in the spring. Under the campaign “Hand By Hand; From House To
House”, clothes and house items were collected for families in need, living in Istanbul or in
its vicinity for the �rst time in 2011. Household appliances, furniture, clothes, toys and
stationery collected by Çalık Holding employees were classi�ed and packaged by Holding
employees themselves before being distributed to the pre-selected 100 families in need.
Circumcision Festival For Iraqi ChildrenIn the context of the post-war di�culties that the Iraq is going through, one of the most
serious problems is that of health services. Çalık Enerji, a Çalık Holding a�liate, organized
a circumcision festival for Iraqi children in its El Khairat Power Plant construction site
located near Kerbela. 80 Iraqi boys were circumcised by Turkish and Iraqi surgeons.
A G
RO
UP
CO
NT
RIB
UT
ING
TO
TH
E SO
CIE
TIE
S’ F
UT
UR
E IN
T
HE
CO
UN
TR
IES
IT O
PER
ATES

Somalia Campaign�e newspaper Sabah brought aid to the people of Somalia, a Country hit by the most serious drought of the
last 60 years where 11 million people are facing starvation, under the aid campaign organized together with
Turkish Red Crescent and TİKA. In addition to the 100 million TL worth of monetary aid collected, thousands
of tons of food and other materials were sent to Somalia by ships and aircraft.
Çalık WellÇalık Group employees started a campaign to support the people of Niger, one of the poorest Countries in the
world located in north-western Africa that is going through serious di�culties due to drought. �e people of
the Maradi region of Niger have to walk for 3 to 4 hours to �nd clean water. �e Çalık Well meets a major part
of the water requirement of the inhabitants of this area.
“Çalık Village” Project In PakistanÇalık Holding and its employees started a social responsibility project for the Pakistani people who have
su�ered from �oods that a�ected millions of people and killed thousands. �e project consists of the creation
of a Çalık Village in order to provide shelter and food and clothes for 175 families. �e Çalık Family was the
leader of the e�orts to create 175 Mevlana Houses in the Akura Khatak Village, Nowshera City, Khyber
Pakhtunkhwa province (KPK) under an operation of humanitarian aid organized by the Turkish Red Crescent.
Support To the Albanian Youth And Society�e FASTIP Banking Program, jointly organized by the Aleksander Moisiu University in the city of Durres and by
Banka Kombetare Tregtare (BKT), provides university students with practical business knowledge to complement
their theoretical knowledge. In addition to the 70 students bene�ting from this program, 15 students who graduated
in 2011 were employed by BKT. �e Bank gives high importance to education and provides �nancial support for
students in Albania. In this respect; BKT grants scholarships to successful students of the Tirana University.
Education Overcomes Every HurdleTurkuvaz Media Group is the media sponsor to the project “Education for all” organized by the Beyazay
Derneği (White Crescent Association). �e project aims to enable disabled people in Turkey to attend school.
Among its objects are to increase the number of schools, to improve the conditions of existing schools, to
conduct consciousness-raising activities among educators and parents and to improve the rate of disabled
people attending school. �e project is implemented with the support and collaboration of the local o�ces of
the Ministry of National Education. Under the project, pre-school and formal education is dispensed to the
disabled. Education for adults is also provided. Sabah and ATV supported the project from the very beginning
by publicizing it in order to improve its e�ciency through media coverage and public information spots. �ey
also collaborate with the White Crescent Association for the improvement of their project strategies.
72

Malatya Foundation For EducationÇalık Holding and its a�liates provide scholarships and student grants, for successful university students who
are in need, through the Malatya Foundation for Education. All of the Çalık a�liates regularly make donations
to the Foundation every year. Applications for scholarship are evaluated by the Foundation.
Mahmut Çalık Educational Complex�e Mahmut Çalık Educational Complex, installed on a 40,000-m² area in Malatya, will be completed in
3 stages. �e complex will consist of a pre-school, a primary school and a high school. �ere will also be
dormitories for girls and boys, indoor sports facilities, a canteen, houses for teachers, auxiliary social
facilities and a multi-purpose hall.
Support for Umut Evi (House of Hope)�e Hacettepe Umut Evi (Hacettepe House of Hope), designed by the Oncology Hospital of the Hacettepe
University according to a model developed by the Union for International Cancer Control (UICC), is intended
to provide clean, safe and proper accommodation for patients and their relatives who are in need during their
treatment. Çalık Holding provided �nancial support for the Hacettepe Umut Evi in 2006 in the form of
contribution to the restoration of a demolished house in Ankara into a new one maintaining its original
character..
Restoration of Atatürk’s Yalova Chalet (Walking Chalet)Atatürk once had had the Yalova Chalet slid on rails so that it would not damage a plane tree. �is Chalet was
restored with the support of Çalık Holding and inaugurated on 18 August 2006 with a ceremony held in the
garden of the Chalet. Atatürk had said: “No branch to be cut; but the chalet to be moved” and the chalet was
moved 4.8 meters and came to be known as the “Walking Chalet”. It served Atatürk for many years as a resting
and working place. It was restored, including landscaping, with everything it contains, respecting the original
character of the building and of its contents.
Hasan Çalık HospitalHasan Çalık Hospital was completed in Malatya in 1992. It consists of 4,000 m² of indoor and 8,000 m² of
outdoor areas, a total of 12,000 m². �e 70-bed hospital has services of internal diseases, external diseases,
urology, obstetrics, radiology, otolaryngology, paediatrics and infectious diseases. It was transferred to the
Ministry of Health in 1994 through a protocol and inaugurated in 1997. All construction expenses were
covered by Çalık Holding.
73

CORPORATE MANAGEMENT
�e shared corporate values created by the a�liates united under Çalık Holding roof and the synergies they achieve
are the basis of the stable growth of the Group. Çalık Holding aims to create value in a continuous manner for its
customers, employees and shareholders and for the community, takes great care to conduct all of its operations in
line with the principles of openness, transparency and accountability. �e development of the Holding is guided by
its awareness of the great importance of the adoption and implementation of corporate management for a sustain-
able growth.
Corporate Principles Of Çalık HoldingSince its foundation, the corporate culture of Çalık Holding has been based on the principle of foreseeing the
requirements of each particular period before its competitors to have the initiative in changes and innovations.
Çalık Holding is a dynamic organization that attaches great importance to customer satisfaction, conducts research
with a view to ensuring continuous competitive advantage, always aims for top quality in its products and services
and is a leading company in every sector where it is present.
Within the framework of these approaches, the basic corporate business principles of Çalık Holding are the following:
• A business model based on openness and transparency
• Creative, efficient and active business management
• Efficient communication and an environment of continuous training
• An innovative and challenging style of doing business
• Use of state-of-the-art technology
• Customer oriented work model
• A working environment attaching great importance to affection, respect and solidarity
• Sensitivity to and respect for the beliefs and values of the society
Basic Business Approaches Of Çalık HoldingÇalık Holding employees do business respecting ethic values and moral principles. �ey are conscious of being a
team with their workmates and commit themselves to the success of the company and of the group as a whole while
also being individuals generating result-oriented ideas and innovative solutions.
�e success of Çalık Holding and its employees are assured by the following principles:
• Grasping the needs of the customers as well as the customer to generate and introduce to the market effective,
lasting, creative and competitively priced solutions ahead of competition,
• Regarding subsidiaries of the Group and internal departments as internal customers and bearing in mind that the
ultimate goal of the common corporate e�ort is quality service for customers,
• Developing constructive propositions continuously to improve the quality of production, sourcing and provision
of services,
• Generating timely and lasting solutions in order to achieve success,
• Bearing in mind that every individual within the Group has equal rights and responsibilities to generate added
value for success,
• Fostering team spirit and teamwork as indispensable elements of the business model without sacrificing the
dynamics of individual competition,
• Appreciating that the strength of Çalık Holding corporate culture derives from noble values,
• Aspiring for the satisfaction of not only the target audience but also all social stakeholders in every effort,
• Restoring what was taken from this country to be utilized, Integrating with the world without compromising its
own culture and values, integrating with the world while protecting its own culture and values
• Representing Turkey on the international platform in the best possible way and contributing to the prestige of the nation,
• Embracing progress and development as the commonwealth of humanity74
STR
ON
G S
TR
UC
TU
RE
SHA
PED
BY
STR
ON
G C
OR
POR
ATE
VALU
ES

Çalık Holding regards the reputation it earned on the national and international platforms as the embodiment of the
highest set of values. Building on its success, becoming an exemplary corporation in Turkey and around the world, as
well as adding to its record of achievements daily without resting on its laurels are the primary objectives for Çalık
Holding. Never dissociating its existence from that of its country, Çalık Group acts in recognition that the
achievements of the Group belong to the country and identi�es enhancing Turkey’s credibility in the international
arena as its principal duty.
“Çalık” as a brand symbolizes the innovative and entrepreneurial skills, as well as the objectives and commitments of
Çalık Holding as an integral part of its stance. �e values embodied by the brand are fully embraced by all the
subsidiaries of the Group, serving as a compass, an underpinning and an important amalgam of years of experience.
Çalık Holding is �rmly committed to ensuring that all its future achievements, just like those in the past, will uphold
and preserve the values epitomized by the “Çalık” brand.
ORGANISATIONAL STRUCTUREOrganizational structures of Çalık Holding and its subsidiaries have been molded by an e�cient and coordinated
systematization of accumulating knowledge and experience, consciousness of institutionalization and e�ective human
resource within the Group in line with the strategic goals.
Boards and committees supporting organizational structure and providing strategic functions to be up-to-date,
rational and methodologically in line with the corporate culture, are fundamental practices that give direction to
corporate management.
Asset/Liability Committee and Risk Management Committee established to examine, implement and monitor
strategic functions in an holistic and comprehensive way, are cornerstones for evaluation of strategic corporate
decisions and their implementation on the basis of a “collective wisdom”.
HUMAN RESOURCESÇalık Holding’s primary goal in Human Resources Policy is to achieve maximum success in its business �elds by
investing in human resource to constantly improve its employees, personal and vocational quali�cations and to create
committed workforce.
Human Resources play a strategic role in corporate success;, accordingly, the Holding attaches great importance to this
matter. It aims to possess a solution-oriented and high value added employee pro�le equipped with up-to-date
knowledge and technology and with the skills to use them e�ciently. �e Holding supports the professional
development of its employees and aims to continuously improve their motivation and professional satisfaction.
�e Directorate of Human Resources works in coordination with all units to help the Group attain its goals by
ensuring that the corporate culture is adopted by the employees and by reinforcing their loyalty towards the group.
75

76
�e Directorate follows the developments and innovations in the �eld of human resources and adapts
state-of-the-art practices to the Holding. It adopts a strategic conception of management.
�e purpose is to equip the Holding with a workforce that is able to develop a multi-dimensional outlook and
possesses an analytic and positive approach. Systems are set up for the selection and employment of a highly
quali�ed workforce that is able to associate its personal career goals with the objects of the company and
committed to achieving the long term goals of the group. Find below the basic practices adopted regarding
Human Resources:
• Supporting the creation of a structure based on “continuous improvement” to enable employees to improve their
skills and competencies and to realize their full potential.
• Developing systems designed to encourage creativity and contributing to the creation of an efficient organization
• Privileging internal applications for vacant positions in the Group
• Encouraging employees to improve themselves and to train their juniors for succession
• Continuously reviewing the human resources organisation and restructuring it according to the requirements
• Being aware of the advantage of being an international company and working towards building a strong
consciousness of corporate identity.
Çalık Holding conducts a “Team Members Program” to bene�t from the great potential of new graduates and of
young people in general and to recruit highly-skilled, creative and competent new graduates and to train them for
leadership positions in the Group inculcating the corporate culture. �e Career Days Activities conducted with
this goal in mind ensure the recruitment of new graduates from di�erent universities and improves the reputation
of the holding among university students.
Performance Evaluation And Improvement System�e Çalık Holding Performance Evaluation System rede�nes strategic corporate targets as speci�c targets for each
individual department and determines annual personal targets and business plans so that the organization, the
management and the employees at various levels of the hierarchy can work in perfect harmony.
Weighted rates of concrete and measurable targets and business plans are �xed and updated in the course of the
year according to the position of each employee in the hierarchy. �e system follows the performance of the
employees by means of a performance module based on targets. �e level of achievement of targets and business
plans are followed the whole year round and the performance of each employee is evaluated at the end of the year.
All departments attach great importance to the Performance Evaluation System. In the process of its application,
all managers act as leaders by providing personal motivation for their employees in order to help them attain their
targets.
�e Çalık Holding Performance Evaluation System ensures that improvement areas are detected for each employee
and gaps are �lled through training. Likewise, a career process is followed on the basis of performance so that a
consistent and e�cient career planning can be prepared and implemented.

Career Development And Back-Up:�e Career Development and Back-up practices are designed according to the competencies of the employees and the
requirements of the organization. �ey aim to keep the motivation of the employees at a maximum level and to ensure
that the company’s strategic targets are attained. Career Development and Back-up Practices are implemented in
connection with Performance System data so that the development of the professional knowledge and skills and the
personal development of the employees are followed and highly skilled employees with a potential are supported to
enable them to realize their full potential.
�anks to the Career Development and Back-up practices based on the principles of impartiality and equal
opportunity, employees with a high potential become candidates for promotion to senior positions.
Training Management:Training requirements are determined on the basis of Performance Evaluation and Career Planning data and
improvement training sessions are planned for the corporate and professional competencies of the employees.
�e Orientation Training includes a process of familiarization with the Holding and the companies of the Group,
corporate culture, internal functioning and Human Resources practices for the newly-recruited personnel and intends
to shorten their period of adaptation.
�e Training System is designed to ensure that the Holding is a “learning organization” and to improve the awareness,
e�ciency and motivation of its employees and to make them attain a high performance level.
77
GRADUATE DEGREE 50%
PHD 1%
MASTER DEGREE 4%
PRIMARY EDUCATION 6%
SECONDARY EDUCATION 31%
TWO-YEAR DEGREE 8%
Educational Attainment – White Collars
WHITECOLLAR
BLUECOLLAR
NUMBER OF EMPLOYEES AS AT DECEMBER 2011; SECTORS TOTAL
HOLDING TOTAL 145 0 145
TEXTILES TOTAL 738 9,553 10,291
CONSTUCTION TOTAL 366 1,727 2,032
ENERGY TOTAL 1,156 472 1,628
MINING TOTAL 6 0 6
TELECOM TOTAL 1,868 0 1,868
FINANCE TOTAL 1,324 102 1,426
MEDIA TOTAL 2,561 494 3,055
OVERALL TOTAL 8,164 12,348 20,451
50%
4%
1%
6%
31%
8%

OCCUPATIONAL SAFETY, ENVIRONMENT AND
QUALITY POLICY
To ensure corporate sustainability in both economic and social terms, Çalık Holding, in all of its operations, gives
the utmost consideration to people, quality and the environment. In the execution of its projects, the Group is
attentive to take all necessary measures to preserve natural resources, minimize industrial waste and prevent soil, air
and water pollution. Furthermore, occupational health and safety procedures are revised to mitigate risk with the
active cooperation of all employees. Not only do Group companies draw up and implement e�ective quality,
environment and occupational health and safety policies but they are also committed to ensuring that these systems
are fully certi�ed.
Çalık Enerji and Gap İnşaat, have ISO 9001, ISO 14001 and OHSAS 18001 certi�cates. Gap Güneydoğu Tekstil
has ISO 9001, ISO 14001 and Oeko-Tex Standard 100, Akreditei Tests Laboratory and Organic Products
Manufacturing CU Certi�cates.
Turkuvaz Printing House, a Turkuvaz Media institution, has ISO 9001:2008 quality certi�cate. Turkuvaz
Distribution and Marketing has ISO 9001: 2008 certi�cate. It operates in the head o�ce area and in 5 regions in
conformity with internationally recognized standards.
STRATEGY MANAGEMENT
Çalık Holding and its a�liates are run with a strategy-based conception of management. Çalık Holding is an
institutionalised Group and its strategy management consists of two principal stages: development and execution.
In the development stage, the existing situation is analysed in detail and strategies determined, which are then
rede�ned in the form of operational targets. �is results in the production of a 3-year strategic concept document
for the Group as well as of a strategy map and a corporate performance sheet. At the stage of execution, quarterly
operational and strategic review meetings are held in order to ensure a dynamic execution and management
discipline. Execution is closely followed through performance sheets and amendments are made to strategies
according to the results noted in performance sheets.
Strategy Management Standards And Basic PoliciesÇalık Holding believes in the importance of conducting strategy management with the discipline of a continuous
process. �is is why it attaches equal importance to the correct formulation of strategies on one part and to their
proper implementation on the other.
A corporate performance sheet SAP Strategy Management (SSM) practice has been implemented in the Group in
order to correctly and clearly de�ne the strategy and to monitor its execution using pertinent criteria. Çalık
Holding is the �rst company to implement in Turkey a strategy management approach with data automation. Fully
supported by the senior management of the Holding, this practice is planned to be a standard for all a�liates.
�anks to the opportunities provided by the SAP ERP infrastructure, the Holding aims to implement data
automation in strategy management at a high level. As a basic policy, the strategy map and the targets that �gure
in the corporate performance sheet are the essential parameters of the performance system.
In 2011, “Çalık Holding Strategy Management Principles” and a “Çalık Holding Strategy Management Implementation
Guide” were prepared. �e systems installed and the contents mentioned above (principles and guide) are put into
practice in Alb Telecom and Eagle Mobile, our a�liates in the sector of telecommunication, in Gap Güneydoğu Tekstil
in the textiles sector and in YEDAŞ in the energy sector. In the short and medium term, the management e�ciency of the
Group is planned to be further improved thanks to an integrated strategic management system.78

INTERNAL AUDIT
Established in 2000, the Directorate of Internal Audit is an independent entity within the organizational structure of
Çalık Holding. �e Directorate was founded to examine the entire operational, �nancial and managerial activities
within the Group’s operations, to rectify the deliberate or involuntary errors in the internal control systems, to ensure
the accuracy and reliability of the data supplied to information requesters and to continuously improve the internal
control mechanism.
�e Directorate of Internal Audit at Çalık Holding has been structured in accordance with the Principles and
Standards of the Corporate Governance. Reporting directly to the Chairman of the Board and his Deputy, the
Directorate performs its duties in coordination with the members of Board assigned by the Chairman.
�e main priority of the Directorate throughout the internal audit procedures is to preserve the assets and resources of Çalık
Holding and its subsidiaries. Embracing the “Hybrid Control Approach” which was widely-popular in the 1980s and is still
relevant, the Directorate implements “In-Depth Examination” in cases where the Internal Audit System fails.
Çalık Holding Internal Audit Policy Is Based On Three Pillars: Support: Internal Audit helps the Group’s senior managers and executives, various business units and managers of
the subsidiaries as well as the entire Group personnel to carry out their duties successfully.
Control: Internal Audit examines and evaluates the managerial, operational and �nancial activities of all the
employees and makes suggestions to rectify deliberate or involuntary errors and to further improve the existing
operational systems.
Protection and Surveillance: Internal Audit preserves the assets of the Çalık Holding subsidiaries and works to
ensure that the resources are used economically and e�ciently in line with the corporate objectives and plans.
�e Directorate of Internal Audit of Çalık Holding performs the audits in the following �elds:
• Compliance of activities with legislation as well as corporate policies, plans and regulations
• Accuracy and reliability of all sorts of information supplied,
• Operational Quality in all activities
• Adequacy and efficacy of Internal Audit Systems,
• Efficient use of assets,
• Efficient use of resources as planned,
• With regard to all acquisition and merger procedures;
- Company valuation and feasibility surveys,
- Relevant veri�cation/evaluation work.
Furthermore, motivated by the principle of sourcing the quali�ed personnel requirements of the Group from within
the Group, the Directorate embraces the notion of o�ering human resources developed within the scope of the Internal
Audit to the bene�t of the subsidiaries and thus primes the Internal Audit team as all-rounders.
79

ASSETS OF ISTANBUL ALL COMBINED IN A SINGLE LOCATION: ŞEHRİZAR KONAKLARI Emlak Konut GYO, a TOKİ subsidiary, and Gap İnşaat, a Çalık Holding subsidiary, combine Istanbul’s nature, character and values in one place; at Şehrizar Konakları. �e project, implemented in Altunizade, Üsküdar in collaboration with Emlak Konut GYO, will be an ideal home to those aspiring to lead a peaceful life in full security in the neighbourhood of their beloved.
Emlak Konut GYO and Gap İnşaat are implementing a project in Altunizade, Üsküdar that will add value to Istanbul. Şehrizar Konakları located next to Çamlıca Hill, bene�ting profoundly from the air and view of the Bosphorus, o�er the advantage of being close to both Bosphorus Bridge and to intersecting highways.. �e project, located in a very central position in the city, also provides the opportunity of a life in nature.
BKT, THE BEST BANK IN ALBANIABKT was awarded the title of ‘the Best Bank in Albania’ in 2011 by “�e Banker”, the banking sector magazine of Financial Times. �e “Best Bank of the Year” awards were delivered in a ceremony organized at �e Intercontinental Park Lane Hotel – London on November 30. Banka Kombetare Tregtare, a Çalık Group subsidiary, was awarded the title of the best bank in Albania for the second consecutive time by the magazine “�e Banker”, the leading banking sector magazine of Financial Times.
GREEN EVENT BY ÇALIK DENIM FOR WORLD BRANDSÇalık Denim, an a�liate of Çalık Holding and a leading high quality denim manufacturer worldwide, is once again the leader in another enterprize.. Operating in line with its mission of being a world class brand, Çalık Denim organized a “Green Event” in the Philoxenus Byzantine Water Reservoir in Sultanahmet on November 19, Saturday evening. �is was the �rst event to be organized in Turkey with that concept in the textile industry. Çalık Denim exhibited fabrics representing its 3 di�erent groups of products to the representatives from world-famous denim companies from Italy, the USA, France, Belgium, the Netherlands, Germany, Spain, Tunisia, Morocco, Finland, China, Portugal and Switzerland and to designers of renowned brands.
CIRCUMCISION FESTIVAL FOR IRAQI CHILDREN BY ÇALIK ENERJİÇalık Enerji, a Çalık Holding a�liate, organized a circumcision festival for Iraqi children in its El Khairat Power Plant construction site located near Kerbela. 80 Iraqi boys were circumcised by surgeons who had been employed by the Turkish and Iraqi surgeons.
ÇALIK FAMILY MET AT RAMADAN FEASTÇalık Holding executives, employees and business partners from the sectors of media, energy, �nance, construction, telecom, textiles and mining came together at a traditional fast-breaking dinner. Over 900 guests were present, including Mr. Ahmet Çalık, Chairman of Çalık Holding, Dr. Berat Albayrak, CEO of Çalık Holding, and Dr. Serhat Albayrak, Deputy Chairman of Turkuvaz Media Group.
Mr. Ahmet Çalık delivered a speech during which he said: “Çalık Holding has progressed every passing year since its foundation. �is dinner is an occasion to share the enthusiasm of this success with you, my dear friends and colleagues, and to rea�rm our strong and con�dent march towards an even brighter future. �e dynamism and con�dence that your valuable collaboration creates constitute, together with sincere, committed and disciplined work, the main driving force behind the growth of Çalık Holding since its very foundation in the 1980s.”
A FRIENDLY VISIT TO ÇALIK HOLDING BY JAPANESE CHILDRENA 40-strong group of Japanese students, victims of the earthquake and tsunami that hit a signi�cant part of Japan, including the area where the Fukishima Nuclear Power Plant is located, paid a visit to Mr. Ahmet Çalık, Chairman of Çalık Holding.Mr. Çalık told them that the previous year had been the Year of Japan in Turkey and that Turks became acquainted with the Japanese. He said: “I sincerely sympathize with you regarding the latest tsunami disaster. We had a unfortunate experience during the 1999 earthquake. Back then, our Japanese friends gave us a hand. Our friendship is for good and bad days.”“Long ago, su�erings of the past became an impetus for the Japanese people to achieve their well-known impressive successes of the present. I believe that, likewise, the su�erings of the recent disaster will be an impetus for new achievements by the Japanese youth.” Mr. Çalık added that Turkish people admired the solidarity and discipline Japanese people exhibited during these di�cult days.
ÇALIK HOLDING KEEPS INVESTING ON ÇALIK YEDAŞ�e new head o�ce building for Çalık YEDAŞ, a Çalık Holding a�liate, was inaugurated in Atakum district of Samsun on 29 July 2011 with a ceremony attended by Mr. Hüseyin Aksoy, Governor of Samsun, Mr. Halil İbrahim Daşöz, Governor of Amasya, MPs of the area, Mr. Yusuf Ziya Yılmaz, Mayor of Samsun, Mr. Ahmet Çalık, Chairman of Çalık Holding, Mr. Osman Saim Dinç, CEO of Çalık Enerji, and Mr. Nurettin Türkoğlu, General Manager of YEDAŞ. Mr. Ahmet Çalık said on this occasion that Çalık Holding will keep on investing in infrastructure and technology with a view to make it the best electricity distribution company in Europe. �e services of Çalık YEDAŞ cover the provinces of Samsun, Amasya, Çorum, Ordu and Sinop. �e Company distributes electricity to about 1,6 million bill-payers, corresponding to 3 million consumers living in the area. �e �rm will conduct its operations from its new headquarters in Atakum, Samsun.
4 PROJECTS IN TURKMENISTAN FROM GAP İNŞAAT Gap İnşaat, a Çalık Holding a�liate, completed the Eye Hospital in Ashgabat, the Turkmen Capital, 5 months ahead of the schedule and inaugurated it on 21 July 2011 with a ceremony. �e inauguration ceremony was attended by Mr. Gurbanguli Berdimuhammedov, President of Turkmenistan, Mr. Şevki Mütevellioğlu, Ambassador of Turkey in Ashgabat, Mr. Ahmet Çalık, Chairman of Çalık Holding, Mr. Ahmet Taçyıldız, Deputy Chairman of Gap İnşaat, and Dr. Saim Dinç, CEO of Çalık Enerji. After this inauguration, ceremonies were held for 3 other projects undertaken by Gap İnşaat.
CHILDREN’S DAY GIFT TO ALBANIAN CHILDRENAlbtelecom and Eagle Mobile, both Çalık Holding a�liates, entertained 10 successful Albanian school children from low-income families under a social responsibility project in Istanbul. �e trip was a gift to these children on the occasion of Children’s Day celebrated every year on June 1 in Albania. During their 3-day stay in Istanbul, the children �rst visited Mr. Ahmet Çalık, Chairman of Çalık Holding.
80
2011 REFLECTIONSIN PRESS

ÇALIK ENERJİ STARTS THE CONSTRUCTION OF THE SECOND POWER PLANT IN IRAQ�e construction of the Ninova Natural Gas Cycle Power Plant 60 km south of Mosul, Iraq by Çalık Holding was launched in a ceremony on 22 May 2011 in the presence of Mr. Esil Nucey�, Governor of Mosul, Mr. Ahmet Yıldız, Consulate General of Turkey in Mosul, high rank o�cials from the Iraqi Minister of Electricity, notables from the city of Mosul, Mr. Ahmet Çalık, Chairman of Çalık Holding, and Dr. Saim Dinç, CEO of Çalık Enerji. Electricity shortage is a serious problem in Iraq. �e Iraqi Government aims to reduce this problem considerably by the end of 2012. Electricity shortage is a great source of distress for the Iraqi people, especially in the hot days of summer. Çalık Holding, keeping an eye on electricity, oil and gas sectors in Iraq, is preparing to take a major role in the solution of electricity shortage. �e Ninova Natural Gas Conversion Power Plant, with a cost of 388.5 million USD, will use 6 gas turbines, each with a power of 125 MW, purchased from General Electric (GE) by the Iraqi Government. �is 750-MW power plant will be able to operate using fuel oil and diesel in addition to natural gas.
ÇALIK ENERJİ SIGNATURE ON IRAQ ELECTRICITY Çalık Enerji has laid the foundation of Karbala El-Khairat Power Plant, to be one of the largest in Iraq, where power supply is on only for 5 – 10 hours a day. �e power plant, with a capacity of 1,250 megawatt, is the largest power investment in Iraq. �e country has an installed power capacity of 4,500 megawatt at present. �e very �rst plaster used for the foundation of the power plant to be built by Çalık Enerji was laid by the Iraqi Deputy Prime Minister Mr. Hüseyin Şehristani, accompanied by Mr. Ahmet Çalık, Chairman of Çalık Holding, and Dr. Osman Saim Dinç, CEO of Çalık Enerji. �e power plant, located in El Khairat district of Keabala, will cost 445.5 USD. �e �rst unit is planned to be commissioned next year and the whole power plant will be completed in 2 years.
GAP GÜNEYDOĞU TEKSTIL HONOURED WITH İTKİB PLAQUES �e General Secretariat of Istanbul Textile & Appparel Exporters’ Associations (İTKİB) organized an award ceremony under the title “All members of the İTKİB family around the same table” to honour Turkish Companies that have achieved in 2010 outstanding export �gures and thus contributed to the national economy. Successful exporters received plaques according to their respective export �gures: platinum for 25 million USD and over; golden for 10 to 25 million USD; silver for 5 to 10 million USD and bronze for 1 to 5 million USD. Gap Güneydoğu Tekstil received a platinum plaque thanks to its 175 million USD turnover and 108 million USD exports �gure for 2010. In the category of ready-made garments, Gap Güneydoğu Tekstil received a bronze plaque. �e awards were delivered to Mr. Önder Öksüz, CEO of Gap Güneydoğu Tekstil, by Minister of State Mr. Zafer Çağlayan.
ALBANIAN PRESIDENT MR. TOPI’S VISIT TO ÇALIK HOLDING Mr. Bamir Topi, President of Albania, visited Çalık Holding, one of the largest foreign investors in his country. He was in Istanbul on the occasion of the 14th Eurasian Economic Summit. Mr. Bamir Topi met, Mr. Ahmet Çalık, Chairman of Çalık Holding, board members and Dr. Berat Albayrak, CEO of Çalık Holding at the Çalık Holding headquarters in Zincirlikuyu. Mr. Topi thanked Mr. Ahmet Çalık for the Holding’s investments that are of vital importance to Albania and its contribution to the development of the relations between the two countries. Mr. Çalık said that they felt at home in Albania and were con�dent of the future of this country. Mr. Çalık said they would continue to invest in Albania in order to accelerate the growth of this country and to contribute to the development of friendly relations between the two countries.
JCR-EURASIA CONFIRMS BKT’S SUCCESSInternational rating institution JCR-Eurasia con�rms the outstanding performance of Banka Kombetare Tregtare (BKT), which joined Çalık Holding family about 6 years ago.
JCR-Eurasia placed BKT in the highest level investable category. It con�rmed the bank’s long term national rating as “AAA (Alb)” and its outlook as “stable”. BKT’s JCR-Eurasia Long Term International Foreign Currency Rating is “BB+” and Long Term International Local Currency Rating “BB”. A statement issued by JCR-Eurasia says that BKT, the second largest bank in Albania, has exceeded the growth performance in the sector in terms of volume and pro�tability with respect to indicators of assets, loans, deposits and equities.
388.5 MILLION USD POWER PLANT INVESTMENT IN MOSUL FROM ÇALIK ENERJİ After the 1,250 MW El Khairat Natural Gas Cycle Power Plant near Karbala in Iraq, Çalık Enerji, an a�liate of Çalık Holding, undertakes the construction of Ninova Natural Gas Cycle Power Plant to be erected 60 km south of Mosul in the same country. �e contract for the mentioned power plant, which will cost 388.5 million USD, was signed in Baghdad on 28 March 2011 in a ceremony attended by Dr. Husain al-Shahristani, Iraqi Deputy Prime Minister in charge of Energy, Mr. Raad Shallal Saeed, Iraqi Minister of Electricity, Mr. Salam Kazaz, Iraqi Deputy Minister of Electricity, Mr. Ahmet Çalık, Chairman of Çalık Holding, and Mr. Osman Saim Dinç, CEO of Çalık Enerji.
445.5 MILLION USD POWER PLANT INVESTMENT IN IRAQ BY ÇALIK ENERJİA contract signing ceremony was held on 13 January 2011 at the Iraqi Ministry of Electricity for the construction of El Khairat Natural Gas Cycle Power Plant. �e ceremony was attended by Mr. Hüseyin Şehristani, Iraqi Deputy Prime Minister, Mr. Murat Özçelik, Ambassador of Turkey to Iraq, Messrs. Selam Kazzaz and Raad Al Haris, Iraqi Deputy Ministers of Electricity, Mr. Adel Hameed Mahdi, Iraqi Undersecretary of the Minister of Electricity, Mr. Sabeh Kado, General Director of Natural Gas Power Plant Projects, Mr. Ahmet Çalık, Chairman of Çalık Holding, and Mr. Osman Saim Dinç, CEO of Çalık Enerji.
�e contract was signed by Mr. Selam Kazzaz, representing the Iraqi Government, and by Mr. Ahmet Çalık, representing Çalık Holding. 10 gas turbines will be installed in the power plant, each with a capacity of 125 MW, purchased from General Electric (GE) by the Iraqi Government. �e power plant, which will have a total installed capacity of 1,250 MW, will be able to use fuel oil and diesel fuel in addition to natural gas. �e 445.5 USD power plant is of vital importance to the post-war recovery of the country. It is planned to be built 20 km south of the city of Kerbela. It will increase the power production capacity of the country by 20%.
500 MILLION TL INVESTMENT FROM YEŞİLIRMAK EDAŞ Yeşilırmak Elektrik Dağıtım A.Ş. will invest 500 million TL spread over 5 years in a region consisting of Samsun, Amasya, Çorum, Ordu and Sinop in order to provide high standard services for the 3 million inhabitants of the area.
Yeşilırmak Elektrik Dağıtım A.Ş. (Yeşilırmak EDAŞ) joined Çalık Holding on 29 December 2010 after a process of privatisation. Now it is proceeding to implement its projects one by one focusing on customer satisfaction with the motto “We receive our energy from you!”. Mr. Nurettin Türkoğlu, CEO of Yeşilırmak Elektrik Dağıtım A.Ş., met executives from the local press at a breakfast. He said there were 1.5 million bill-payers consuming 5 billion kilowatt hours and gave detailed information about the services they would render to facilitate the lives of the 3 million inhabitants in the region.
81
2011 REFLECTIONSIN PRESS

82
IND
EPEN
DEN
TA
UD
ITO
R’S
REP
OR
T
ÇALIK HOLDİNG A.Ş.
ConsolidatedFinancial StatementsAt 01.01.2011 - 31.12.2011Together With Auditor’s Report

83
INDEPENDENT AUDITOR’S REPORT
To the Shareholders and Board of Directors ofÇalık Holding Anonim Şirketi Istanbul –Turkey
We have audited accompanying statement of consolidated financial position of Çalık Holding A.Ş (the“Company”) and its subsidiaries listed under note 1 (the “Group”), as at 31 December 2011, and the statements ofconsolidated income, comprehensive income, changes in equity and cash flows for the year then ended and asummary of significant accounting policies and other explanatory notes..
Management’s responsibility for the financial statements
Management is responsible for the preparation and fair presentation of these consolidated financial statements inaccordance with International Financial Reporting Standards. This responsibility includes: designing,implementing and maintaining internal control relevant to the preparation and fair presentation of financialstatements that are free from material misstatement, whether due to fraud or error; selecting and applyingappropriate accounting policies; and making accounting estimates that are reasonable in the circumstances.
Auditor’s responsibility
conducted our audit in accordance with International Standards on Auditing. Those standards require that wecomply with ethical requirements and plan and perform the audit to obtain reasonable assurance whether thefinancial statements are free from material misstatement.
An audit involves performing procedures to obtain audit evidence about the amounts and disclosures in thefinancial statements. The procedures selected depend on the auditor’s judgment, including the assessment of therisks of material misstatement of the financial statements, whether due to fraud or error. In making those riskassessments, the auditor considers internal control relevant to the entity’s preparation and fair presentation of thefinancial statements in order to design audit procedures that are appropriate in the circumstances, but not for thepurpose of expressing an opinion on the effectiveness of the entity’s internal control. An audit also includesevaluating the appropriateness of accounting policies used and the reasonableness of accounting estimates madeby management, as well as evaluating the overall presentation of the financial statements.
We believe that the audit evidence we have obtained is sufficient and appropriate to provide a basis for our auditopinion.
Conclusion
In our opinion, the consolidated financial statements present fairly in all material respects, the financial position ofÇalık Holding A.Ş. as at 31 December 2011, and of its consolidated financial performance and its consolidatedcash flows for the year then ended in accordance with International Financial Reporting Standards.
EREN Bağımsız Denetim ve Yeminli Mali Müşavirlik A.Ş.Member Firm of GRANT THORNTON International
Nazım HikmetPartner
Istanbul, 15 February 2012

84
1
ÇALIK HOLDİNG A.Ş. STATEMENTS OF CONSOLIDATED FINANCIAL POSITION
AT 31 DECEMBER 2011 AND 2010
(Currency shown in thousands of US Dollars ("USD") unless otherwise indicated.)
Assets Note 2011 2010 Current assets Cash and cash equivalents 7 455.039 340.080 Placements and balances with banks 8 125.065 231.989 Investments securities 9 1.128.296 813.914 Due from services concession agreements 10 30.203 32.742 Trade receivables 13 821.240 760.658 Loans and advances to customers 14 1.302.852 811.559 Construction contracts work in progress 12 124.814 68.780 Inventories 15 283.303 231.072 Other assets 16 299.908 353.104 Total current assets 4.570.720 3.643.898 Non-current assets Capital equivalency deposit 11 11.759 12.348 Trade receivables 5.159 6.203 Loans and advances to customers 14 15.390 71.273 Due from services concession agreements 10 88.343 110.928 Equity investments 17 44.703 126.398 Property, plant and equipment 18 593.334 666.438 Investment property 20 184.636 64.296 Intangible assets 19 885.345 1.068.346 Other assets 5.177 6.150 Deferred tax assets 27 -- 38.281 Total non-current assets 1.833.846 2.170.661 Total assets 6.404.566 5.814.559
The accompanying notes are an integral part of these consolidated financial statements.
The accompanying notes are an integral part of these consolidated financial statements.
ÇALIK HOLDİNG A.Ş.
STATEMENTS OF CONSOLIDATED FINANCIAL POSITION
AT 31 DECEMBER 2011 AND 2010
(Currency shown in thousands of US Dollars (USD) unless otherwise indicated.)

85
2
ÇALIK HOLDİNG A.Ş. STATEMENTS OF CONSOLIDATED FINANCIAL POSITION
AT 31 DECEMBER 2011 AND 2010
(Currency shown in thousands of US Dollars ("USD") unless otherwise indicated.) Liabilities and equity Note 2011 2010 Current liabilities Borrowings 21 1.118.043 736.097 Customer deposits 22 1.481.994 1.223.360 Due to banks 23 544.539 283.953 Trade payables 24 839.646 854.694 Deferred billings 12 29.978 28.266 Taxation on income 27 7.070 1.575 Provisions 25 25.991 20.557 Other liabilities 26 213.536 184.034 Total current liabilities 4.260.797 3.332.536 Non-current liabilities Borrowings 21 750.629 1.006.843 Customer deposits 22 98.383 78.503 Trade payables 24 1.011 1.244 Employee termination benefits 28 23.056 27.997 Provisions 25 22.612 9.252 Other liabilities 26 290.954 244.522 Deferred tax liability 27 12.273 -- Total non-current liabilities 1.198.918 1.368.361 Equity Share capital 29 130.509 159.456 Translation reserve 22.597 (17.859) Fair value reserve (11.090) 185 Revaluation reserve 166.204 85.473 General reserves 468.169 553.215
Equity attributable to owners of the parent 776.389 780.470 Non-controlling interest 168.462 333.192 Total equity 944.851 1.113.662 Commitments and contingencies 30 -- -- Total liabilities and equity 6.404.566 5.814.559
The accompanying notes are an integral part of these consolidated financial statements.
The accompanying notes are an integral part of these consolidated financial statements.
ÇALIK HOLDİNG A.Ş.
STATEMENTS OF CONSOLIDATED FINANCIAL POSITION
AT 31 DECEMBER 2011 AND 2010
(Currency shown in thousands of US Dollars (USD) unless otherwise indicated.)

86
3
ÇALIK HOLDİNG A.Ş. STATEMENTS OF CONSOLIDATED INCOME
FOR THE YEARS ENDED 31 DECEMBER 2011 AND 2010
(Currency shown in thousands of US Dollars ("USD") unless otherwise indicated.)
Note 2011 2010 Revenue 31 2.893.487 2.123.676 Cost of sales (2.178.222) (1.640.288) Gross profit 715.265 483.388 Research and development expenses (6.510) (6.050) Selling expenses (166.397) (117.121) General and administrative expenses (218.041) (173.065) Operating profit 324.317 187.152 Loss from investment in associate (5.454) (14.213) Other income 33 12.876 12.424 Other expense 33 (18.205) (55.184) Profit on sale of financial assets available for sale 5.975 -- Fair value gain on financial assets 9 251.457 -- Financing income 34 459.070 228.321 Financing expense 34 (896.589) (331.269) Profit before taxation 133.447 27.231 Taxation on income 27 (61.337) (7.137) Profit for the year from continuing operations 72.110 20.094 Discontinued operations Profit for the period from discontinued operations 37 217 840 Net profit for the year 72.327 20.934 Net profit (loss) attributable to: Owners of the parent 148.007 (7.679) Non-controlling interest (75.680) 28.613
The accompanying notes are an integral part of these interim consolidated financial statements.
The accompanying notes are an integral part of these consolidated financial statements.
ÇALIK HOLDİNG A.Ş.
STATEMENTS OF CONSOLIDATED INCOME
FOR THE YEARS ENDED 31 DECEMBER 2011 AND 2010
(Currency shown in thousands of US Dollars (USD) unless otherwise indicated.)

87
4
ÇALIK HOLDİNG A.Ş. STATEMENTS OF CONSOLIDATED COMPREHENSIVE INCOME
FOR THE YEARS ENDED 31 DECEMBER 2011 AND 2010
(Currency shown in thousands of US Dollars ("USD") unless otherwise indicated.)
2011 2010
Profit for the year 72.327 20.934 Fair value reserve for available-for-sale securities (11.241) 287 Translation differences (165.678) (45.079) Revaluation of investment properties 96.247 -- Other comprehensive income (loss) (80.672) (44.792) Total comprehensive income for the year (8.345) (23.858)
Attributable to: Owners of the parent 111.390 (40.022) Non-controlling interest (119.735) 16.164
The accompanying notes are an integral part of these consolidated financial statements.
The accompanying notes are an integral part of these consolidated financial statements.
ÇALIK HOLDİNG A.Ş.
STATEMENTS OF CONSOLIDATED COMPREHENSIVE INCOME
FOR THE YEARS ENDED 31 DECEMBER 2011 AND 2010
(Currency shown in thousands of US Dollars (USD) unless otherwise indicated.)

88 5
ÇA
LIK
HO
LDİN
G A
.Ş.
STA
TEM
ENTS
OF
CO
NSO
LID
ATE
D C
HA
NG
ES IN
EQ
UIT
Y
FO
R T
HE
YEA
RS
END
ED 3
1 D
ECEM
BER
201
1 A
ND
201
0
(Cur
renc
y sh
own
in th
ousa
nds o
f US
Dol
lars
("U
SD")
unl
ess o
ther
wise
indi
cate
d.)
Sh
are
capi
tal
Tran
slatio
n re
serv
e
Fair
va
lue
rese
rve
Rev
alua
tion
rese
rve
Gen
eral
re
serv
es
Tota
l at
trib
utab
le to
ow
ners
of
pare
nt
Non
-co
ntro
lling
in
tere
st To
tal
equi
ty
Bala
nce a
t 01.
01.2
01
159.
456
(17.
859)
18
5 85
.473
55
3.21
5 78
0.47
0 33
3.19
2 1.
113.
662
Unc
onso
lidat
ed su
bsid
iary
--
-- --
-- --
-- (2
.387
) (2
.387
) D
ivid
ends
pai
d --
-- --
-- (4
4.47
6)
(44.
476)
(6
32)
(45.
108)
Ca
sh in
crea
se in
subs
idia
ries s
hare
capi
tal
-- --
-- --
-- --
8.59
1
8.59
1
Cons
olid
ated
subs
idia
ries a
s fro
m 0
1 Ja
nuar
y 20
11
-- --
-- --
(34.
150)
(3
4.15
0)
(87.
412)
(1
21.5
62)
Chan
ges i
n m
inor
ity in
teres
t --
-- --
-- (3
6.84
5)
(36.
845)
36
.845
--
Tr
ansa
ctio
n w
ith o
wne
rs
159.
456
(17.
859)
18
5 85
.473
43
7.74
4 66
4.99
9 28
8.19
7 95
3.19
6
Net
pro
fit (l
oss)
for t
he y
ear
-- --
-- --
148.
007
14
8.00
7 (7
5.68
0)
72.3
27
O
ther
com
preh
ensiv
e inc
ome (
loss
):
Fa
ir va
lue g
ain
for a
vaila
ble-
for-s
ale s
ecur
ities
--
-- (1
1.24
1)
-- --
(11.
241)
--
(11.
241)
Tr
ansla
tion
diffe
renc
es
(28.
947)
40
.456
(3
4)
(15.
516)
(1
17.5
82)
(121
.623
) (4
4.05
5)
(165
.678
) Re
valu
ation
of i
nves
tmen
t pro
perti
es
-- --
-- 96
.247
--
96.2
47
-- 96
.247
Tota
l com
preh
ensiv
e inc
ome (
loss
) for
the y
ear
(28.
947)
40
.456
(1
1.27
5)
80.7
31
30.4
25
111.
390
(119
.735
) (8
.345
)
Bala
nce a
t 31.
12.2
011
130.
509
22.5
97
(11.
090)
16
6.20
4 46
8.16
9 77
6.38
9 16
8.46
2 94
4.85
1
Th
e acc
ompa
nyin
g no
tes a
re an
inte
gral
part
of th
ese c
onso
lidat
ed fi
nanc
ial s
tate
men
ts.
The
acc
ompa
nyin
g no
tes
are
an in
tegr
al p
art o
f th
ese
cons
olid
ated
fina
ncia
l sta
tem
ents
.
ÇALIK HOLDİNG A.Ş.
STATEMENTS OF CONSOLIDATED CHANGES IN EQUITY
FOR THE YEARS ENDED 31 DECEMBER 2011 AND 2010
(Currency shown in thousands of US Dollars (USD) unless otherwise indicated.)

89
6 Ç
ALI
K H
OLD
İNG
A.Ş
. ST
ATE
MEN
TS O
F C
ON
SOLI
DA
TED
CH
AN
GES
IN E
QU
ITY
F
OR
TH
E Y
EAR
S EN
DED
31
DEC
EMBE
R 2
011
AN
D 2
010
(C
urre
ncy
show
n in
thou
sand
s of U
S D
olla
rs ("
USD
") u
nles
s oth
erw
ise in
dica
ted.
)
Sh
are
capi
tal
Tran
slatio
n re
serv
e
Fair
va
lue
rese
rve
Rev
alua
tion
rese
rve
Gen
eral
re
serv
es
Tota
l at
trib
utab
le to
ow
ners
of
pare
nt
Non
-co
ntro
lling
in
tere
st To
tal
equi
ty
Bala
nce a
t 01.
01.2
010
163.
724
(7.3
94)
(105
) 88
.604
57
5.15
7 81
9.98
6 31
6.57
2 1.
136.
558
Div
iden
ds p
aid
to n
on-c
ontro
lling
inter
est
-- --
-- --
-- --
(407
) (4
07)
Cash
incr
ease
in su
bsid
iarie
s sha
re ca
pital
--
-- --
-- --
-- 97
0
970
Acq
uisit
ion
of n
on-c
ontro
lling
shar
es o
f Mot
or P
ress
e --
-- --
-- --
-- 47
1
471
Cons
olid
ated
subs
idia
ries a
s fro
m 0
1 Ja
nuar
y 20
10
-- --
-- --
(181
) (1
81)
109
(7
2)
Chan
ges i
n no
n-co
ntro
lling
inter
est
-- --
-- --
687
68
7 (6
87)
--
Tran
sact
ion
with
ow
ners
16
3.72
4 (7
.394
) (1
05)
88.6
04
575.
663
820.
492
317.
028
1.13
7.52
0
N
et p
rofit
(los
s) fo
r the
yea
r --
-- --
-- (7
.679
) (7
.679
) 28
.613
20
.934
Oth
er c
ompr
ehen
sive i
ncom
e (lo
ss):
Fair
valu
e gai
n fo
r ava
ilabl
e-fo
r-sal
e sec
uriti
es
-- --
287
--
-- 28
7 --
287
Tran
slatio
n di
ffere
nces
(4
.268
) (1
0.46
5)
3
(3.1
31)
(14.
769)
(3
2.63
0)
(12.
449)
(4
5.07
9)
To
tal c
ompr
ehen
sive i
ncom
e (lo
ss) f
or th
e yea
r (4
.268
) (1
0.46
5)
290
(3.1
31)
(22.
448)
(4
0.02
2)
16.1
64
(23.
858)
Bala
nce a
t 31.
12.2
010
159.
456
(17.
859)
18
5 85
.473
55
3.21
5 78
0.47
0 33
3.19
2 1.
113.
662
The a
ccom
pany
ing
note
s are
an in
tegr
al pa
rt of
thes
e con
solid
ated
fina
ncia
l sta
tem
ents.
The
acc
ompa
nyin
g no
tes
are
an in
tegr
al p
art o
f th
ese
cons
olid
ated
fina
ncia
l sta
tem
ents
.
ÇALIK HOLDİNG A.Ş.
STATEMENTS OF CONSOLIDATED CHANGES IN EQUITY
FOR THE YEARS ENDED 31 DECEMBER 2011 AND 2010
(Currency shown in thousands of US Dollars (USD) unless otherwise indicated.)

90
7
ÇALIK HOLDİNG A.Ş. STATEMENTS OF CONSOLIDATED CASH FLOW
FOR THE YEARS ENDED 31 DECEMBER 2011 AND 2010
(Currency shown in thousands of US Dollars ("USD") unless otherwise indicated.)
Note 2011 2010 Profit before taxation from continuing operations 133.447 27.231 Profit before taxation from discontinued operations 37 209 801 Adjustment to reconcile profit before taxation to net cash provided from operating activities: 35 (52.137) 151.960
Operating profit before changes in working capital 81.519 179.992 Changes in operating assets and liabilities 35 127.802 380.442 Taxes paid (33.445) (6.505) Net cash provided by operating activities 175.876 553.929 Cash flows from investing activities Investments securities (74.166) (274.889) Concession financial assets 25.124 -- Proceeds (purchases) of equity investments 30.341 (1.866) Acquisition of subsidiaries -- (416.498) Proceeds from sale of subsidiaries, net of cash 7.478 -- Purchases of property, plant and equipment 18 (113.530) (68.507) Purchases of intangible assets 19 (16.573) (10.116) Purchases of investment properties 20 (8.635) (12.888) Proceeds from sale of property, plant and equipments 2.924 1.016 Proceeds from sale of intangible assets 8.135 212 Proceeds from sale of investment properties 19.468 59.021 Petroleum drilling expenses -- 1.724 Net cash used in investing activities (119.434) (722.791) Cash flows from financing activities Proceeds from borrowings 355.599 543.661 Repayments of borrowings (267.330) (191.440) Interest paid (116.876) (87.821) Interest received 16.577 24.885 Dividends paid (45.108) (407) Cash increase in subsidiaries share capital 8.591 970 Net cash provided by financing activities (48.547) 289.848 Translation differences 107.064 (326) Net increase in cash and cash equivalents 114.959 120.660 Cash and cash equivalents at beginning of year 340.080 219.420 Cash and cash equivalents at end of year 7 455.039 340.080
The accompanying notes are an integral part of these interim consolidated financial statements.
ÇALIK HOLDİNG A.Ş.
STATEMENTS OF CONSOLIDATED CASH FLOW
FOR THE YEARS ENDED 31 DECEMBER 2011 AND 2010
(Currency shown in thousands of US Dollars (USD) unless otherwise indicated.)
The accompanying notes are an integral part of these consolidated financial statements.

91
ÇALIK HOLDİNG A.Ş. NOTES TO CONSOLIDATED FINANCIAL STATEMENTS
FOR THE YEAR ENDED 31 DECEMBER 2011
(Currency shown in thousands of US Dollars ("USD") unless otherwise indicated.)
8
1. ORGANISATION AND NATURE OF ACTIVITIES
Çalık Holding A.Ş. (the “Company” or “Çalık Holding”) was established in 1997 to support and organize the activities of its subsidiaries within the sectors of textile, energy, telecommunication, construction, banking, marketing and media by providing centralised services for finance, accounting, budget and internal audit, human resources and corporate communications.
The registered office address of the Company is located at Büyükdere Caddesi, Şişli/Istanbul Turkey.
As of 31 December 2011, the average number of personnel employed was 8.901 (2010: 12.335)
As of 31 December 2011, Çalık Holding, its subsidiaries (the “Group”) are made up of Çalık Holding, its 85 subsidiaries and a joint venture (2010: 81 subsidiaries) listed below: The Group is organised into 7 major business segments given below:
1.1 Textile group Consolidated company Location Gap Güneydoğu Tekstil Sanayi ve Ticaret A.Ş. Turkey Çalık Korea Inc. Korea Çalık USA USA Gap Güneydoğu FZE Jebel Ali Free Zone UAE – Dubai Çalık Alexandria For Readymade Garments Egypt
GAP Güneydoğu Tekstil Sanayi ve Ticaret A.Ş. (“GAP Güneydoğu”) GAP Güneydoğu was established in 1987 in Turkey. Its facilities are located in Malatya Industrial Area. GAP Güneydoğu has an annual production capacity of 11 thousand tonnes of open-end yarns, 8 thousand tons of ring and uneven yarns, and 40 million square meters of denim fabric. One branch of GAP Güneydoğu, namely, GAP Güneydoğu Mersin Free Zone is engaged in the importation and exportation of textile products.
Çalık Korea Inc. Çalık Korea Inc. was established in 2007 in order to import and export trade of textile and clothing, service industry related to distribution, forwarding and transportation. Çalık USA and GAP Güneydoğu FZE Jebel Ali Free Zone Çalık USA and GAP Güneydoğu FZE are engaged in the trade of textile products in the USA and Dubai respectively. Çalık Alexandria For Readymade Garments “Çalık Aleksandria” Çalık Alexandria For Readymade Garments was established in 2006 in Egypt. Çalık Alexandria is engaged in the business of manufacturing and marketing ready wear, yarn and textures.
ÇALIK HOLDİNG A.Ş.
NOTES TO CONSOLIDATED FINANCIAL STATEMENTS
FOR THE YEAR ENDED 31 DECEMBER 2011
(Currency shown in thousands of US Dollars (USD) unless otherwise indicated.)

92
ÇALIK HOLDİNG A.Ş. NOTES TO CONSOLIDATED FINANCIAL STATEMENTS
FOR THE YEAR ENDED 31 DECEMBER 2011
(Currency shown in thousands of US Dollars ("USD") unless otherwise indicated.)
9
1.2 Energy group
Consolidated company Location Çalık Enerji Sanayi ve Ticaret A.Ş. Turkey Çalık Enerji Dubai FZE UAE – Dubai Aktif Doğalgaz Ticaret A.Ş. Turkey Türkmen’in Altın Asrı Elektrik Enerjisi Toptan Satış A.Ş. Turkey Çalık Enerji Elektrik Üretim ve Madencilik A.Ş. Turkey TAPCO Petrol Boru Hattı Sanayi ve Ticaret A.Ş. Turkey Kızılırmak Enerji Elektrik A.Ş. Turkey Doğu Akdeniz Petrokimya ve Rafineri Sanayi ve Ticaret A.Ş. Turkey Çalık NTF Elektrik Üretim ve Madencilik A.Ş. Turkey Ant Enerji Sanayi ve Ticaret Limited Şirketi Turkey Vadi Elektrik Üretim Sanayi ve Ticaret Limited Şirketi Turkey Ortur Elektrik Üretim ve Ticaret Limited Şirketi Turkey Atlas Petrol Gaz İthalat İhracat ve Pazarlama Ticaret A.Ş. Turkey Başak Enerji Elektrik Üretim Sanayi ve Ticaret A.Ş. Turkey Çalık Rüzgar Enerjisi Elektrik Üretim Limited Şirketi Turkey Momentum Enerji Elektrik Üretim Sanayi ve Ticaret A.Ş. Turkey Irmak Enerji Elektrik Üretim Madencilik Sanayi ve Ticaret A.Ş. Turkey Yenikom Telekomünikasyon Hizmetleri A.Ş. Turkey Yeşilçay Enerji Elektrik Üretim Sanayi ve Ticaret A.Ş. Turkey İkideniz Petrol ve Gaz Sanayi ve Ticaret A.Ş. Turkey Çep Petrol Dağıtım Sanayi ve Ticaret A.Ş. Turkey Gap Elektrik Dağıtım Sanayi ve Ticaret A.Ş. Turkey Sembol Enerji A.Ş. Turkey Atayurt İnşaat A.Ş Turkey Adacami Enerji Elektrik Üretim Sanayi Ve Ticaret A.Ş Turkey Akçay Enerji A.Ş. Turkey Ayas Rafineri ve Petrokimya Sanayi ve Ticaret A.Ş. Turkey Petrotrans Enerji A.Ş. Turkey Yeşilırmak Elektrik Dağıtım A.Ş. Turkey Çalık Elektrik Dağıtım A.Ş. Turkey Çalık Energy Construction LLC Uzbekistan Japan International Enerji Network A.Ş. Turkey
Çalık Enerji Sanayi ve Ticaret A.Ş. (“Çalık Enerji”) Çalık Enerji was set up in 1998 to conduct the Group's activities in the energy sector and engaged in the exploitation of natural gas and petroleum resources in different parts of the world and in international shipments and sales. Çalık Enerji has four branches namely Çalık Enerji Turkmenistan, Çalık Enerji Atatürk Hava Limanı Free Zone, Çalık Enerji Uzbekistan and Çalık Enerji Iraq. Çalık Enerji Dubai FZE (“Çalık Enerji FZE”) Çalık Enerji FZE was incorporated as a Free Zone Establishment with a limited liability in Jebel Ali Free Zone pursuant to Dubai Law no.9 of 1992 and the implementing regulations issued there under by the Jebel Ali Free Zone Authority. The principal place of business of the establishment is located at the Jebel Ali free Zone, Dubai. The principal activity as per Licence no.5517 issued by the Jebel Ali Free Zone Authority is General Trading. Çalık Enerji FZE has a branch in Turkmenistan.
ÇALIK HOLDİNG A.Ş.
NOTES TO CONSOLIDATED FINANCIAL STATEMENTS
FOR THE YEAR ENDED 31 DECEMBER 2011
(Currency shown in thousands of US Dollars (USD) unless otherwise indicated.)

93
ÇALIK HOLDİNG A.Ş. NOTES TO CONSOLIDATED FINANCIAL STATEMENTS
FOR THE YEAR ENDED 31 DECEMBER 2011
(Currency shown in thousands of US Dollars ("USD") unless otherwise indicated.)
10
Aktif Doğalgaz Ticaret A.Ş. (“Aktif Doğalgaz”) Aktif Doğalgaz was established in 1999 in Istanbul in order to operate in gas distribution and trade. As of the financial position date, Aktif Doğalgaz is dormant. Türkmen’in Altın Asrı Elektrik Enerjisi Toptan Satış A.Ş. (“Türkmen Elektrik”) Türkmen Elektrik was established in 2000 in Istanbul in order to operate in electricity distribution and trade. As of the financial position date, Türkmen Elektrik is dormant. Çalık Enerji Elektrik Üretim ve Madencilik A.Ş. (“Çalık Elektrik”) Çalık Elektrik was established in 2004 in Merter, Istanbul in order to establish, operate and rent power generation plants. TAPCO Petrol Boru Hattı Sanayi ve Ticaret A.Ş. (“TAPCO”) TAPCO was established in 2005 in Merter, Istanbul in order to import, export, distribute and operate all kinds of natural gas, crude oil and derivatives of these products. Kızılırmak Enerji Elektrik A.Ş. (“Kızılırmak”) Kızılırmak was established in 2005 in Merter, Istanbul in order to import, export, distribute and operate all kinds of natural gas, crude oil and derivatives of these products. Doğu Akdeniz Petrokimya ve Rafineri Sanayi ve Ticaret A.Ş. (“Doğu Akdeniz Petrokimya”) Doğu Akdeniz Petrokimya (formerly known as Enerji Petrol Gaz İthalat Pazarlama Sanayi ve Ticaret A.Ş.) was established by the end of 2005 in Merter, Istanbul in order to realize prospects for oil and natural gas, produce, import and export these products and to establish or let establish the related plants for their distribution. Çalık NTF Elektrik Üretim ve Madencilik A.Ş. (“Çalık NTF”) Çalık NTF was established in February 2006 in Istanbul in order to establish, operate and rent power generation plants. Ant Enerji Sanayi ve Ticaret Limited Şirketi (“Ant Enerji”) Ant Enerji was established in 2006 in Istanbul in order to marketing, selling and distribution of electricity. Vadi Elektrik Üretim Sanayi ve Ticaret Limited Şirketi (“Vadi Elektrik”) Vadi Elektrik was established in February 2007 for producing and distributing electricity. Ortur Elektrik Üretim ve Ticaret Limited Şirketi (“Ortur Elektrik”) Ortur Elektrik was established in December 2005 for producing and distributing electricity.
Atlas Petrol Gaz İthalat İhracat ve Pazarlama Ticaret A.Ş. (“Atlas Petrol”) Atlas Petrol was established in 2008 in order to import, export, distribute and operate all kinds of crude oil and to build necessary facility for the production. Başak Enerji Elektrik Üretim Sanayi ve Ticaret A.Ş. (“Başak Enerji”) Başak Enerji was established in 2008 for building and operating of electricity facility, producing, selling and marketing of electricity. Çalık Rüzgar Enerjisi Elektrik Üretim Limited Şirketi (“Çalık Rüzgar”) Çalık Rüzgar was established for building and operating of electricity facility, producing, selling and marketing of electricity. Momentum Enerji Elektrik Üretim Sanayi ve Ticaret A.Ş. (“Momentum Enerji”) Momentum Enerji was established in 2008 for building and operating of electricity facility, producing, selling and marketing of electricity. Momentum Enerji also possesses another principal activity about engaging in exploration and production of mineral ore.
ÇALIK HOLDİNG A.Ş.
NOTES TO CONSOLIDATED FINANCIAL STATEMENTS
FOR THE YEAR ENDED 31 DECEMBER 2011
(Currency shown in thousands of US Dollars (USD) unless otherwise indicated.)

94
ÇALIK HOLDİNG A.Ş. NOTES TO CONSOLIDATED FINANCIAL STATEMENTS
FOR THE YEAR ENDED 31 DECEMBER 2011
(Currency shown in thousands of US Dollars ("USD") unless otherwise indicated.)
11
Irmak Enerji Elektrik Üretim Madencilik Sanayi ve Ticaret A.Ş. (“Irmak Enerji”) Irmak Enerji was established in 2008 for building and operating of electricity facility, producing, selling and marketing of electricity. Yenikom Telekomünikasyon Hizmetleri A.Ş. (“Yenikom”) Yenikom was established in 2008 for building and managing electronic communication network. Yeşilçay Enerji Elektrik Üretim Sanayi ve Ticaret A.Ş. (“Yeşilçay Enerji”) Yeşilçay Enerji was established in 2008 for building and operating of electricity facility, producing, selling and marketing of electricity. Yeşilçay Enerji also possesses another principal activity about engaging in exploration and production of mineral ore. İkideniz Petrol ve Gaz Sanayi ve Ticaret A.Ş. (“İkideniz”) İkideniz Petrol was established in 2008 in order to import, export, distribute and operate all kinds of crude oil and to build necessary facility for the production. Çep Petrol Dağıtım Sanayi ve Ticaret A.Ş. (“Çep Petrol”) Çep Petrol was established in 2008 in order to import, export, distribute and operate all kinds of crude oil and to build necessary facility for the production. Gap Elektrik Dağıtım Sanayi ve Ticaret A.Ş. (“Gap Elektrik”) Gap Elektrik was established in 1998. It has a 30-year authorization by the Council of Ministers resolution in March 1998, to operate electrical distribution systems in the provinces of Malatya, Elazığ, Tunceli and Bingöl. As of the financial position date, Gap Elektrik is dormant. Sembol Enerji A.Ş. (“Sembol”) Sembol was established in 2010 and is engaged in installing of electrical energy production facility, being commenced operations, being rented, production of electrical energy and selling of produced electrical energy and/or electrical capacity to the consumers.
Atayurt İnşaat A.Ş. (“Atayurt”) Atayurt was established in 2009 for the purpose of building and operating energy power plants and providing operational and maintenance services to power plants. Adacami Enerji Elektrik Üretim Sanayi Ve Ticaret A.Ş (‘‘Adacami Enerji’’) Adacami Enerji was established in December 2009, in order to build, rent, operate of electricity facility and selling generated electricity, which is generated by Adacami Enerji. Akçay Enerji A.Ş. (“Akçay”) Akçay was established in 2010. Akçay is engaged in installing of electrical energy production facility, being commenced operations, being rented, production of electrical energy and selling of produced electrical energy and/or electrical capacity to the consumers. Ayas Rafineri ve Petrokimya Sanayi ve Ticaret A.Ş. (“Ayas Rafineri”) Ayas Rafineri was established in 2010 to install petroleum refinery, petrochemical facilities, additional facilities and every kind of assistant and complementary facilities, to have these installed, buy and sell them, to acquire an interest in these facilities, operate and when necessary, to expand, etc. Petrotrans Enerji A.Ş. (“Petrotrans Enerji”) Petrotrans Enerji was established in 2010 to construct every kind of pipeline (warehousing & loading and unloading & others), have these constructed, take over and hand over. In order to service as transportation and warehousing, it can operate in these facilities, have these facilities operated, rent and lease. It has been founded to import, export and merchandise every kind of natural gas, crude oil and products of these, operate by installing necessary facilities, having these facilities installed or taking over existing facilities, to transmit and distribute crude oil, oil products and every kind of gas and regarding these operations to buy and sell every kind of natural gas, crude oil and products of natural gas and oil.
ÇALIK HOLDİNG A.Ş.
NOTES TO CONSOLIDATED FINANCIAL STATEMENTS
FOR THE YEAR ENDED 31 DECEMBER 2011
(Currency shown in thousands of US Dollars (USD) unless otherwise indicated.)

95
ÇALIK HOLDİNG A.Ş. NOTES TO CONSOLIDATED FINANCIAL STATEMENTS
FOR THE YEAR ENDED 31 DECEMBER 2011
(Currency shown in thousands of US Dollars ("USD") unless otherwise indicated.)
12
Yeşilırmak Elektrik Dağıtım A.Ş. (“Yeşilırmak”) Yeşilırmak Electricity Distribution Inc., 29.12.2010 While the State Agency on Public Company as a result of privatization to the transfer Çalık Group is made, has been operating in the field of energy distribution. Çalık Elektrik Dağıtım A.Ş. (“Çalık Elektrik Dağıtım”) Çalık Elektrik Dağıtım A.Ş.was established in 04.11.2010 and is engaged in distribution and sale of electricity and/or capacity as well as incorporating or participating in companies involved and operating within the energy sector according to legislations of Energy Market Regulatory Authority. Çalık Energy Construction LLC (“Çalık Enerji Construction”) Calik Energy Construction LLC was founded for trading operations on June 06, 2010 with the decree , numbered 4420 as a limited liability company. Calik Energy Construction LLC, which is registered with the license numbered 007024, aims basically general trading. Japan International Energy Network A. Ş. (“Japan International”) Japan International was established in 2010 for explorating and operating of solar power, wind power,geothermal power and other renewable energy resources selling and marketing of electricity. Japan International also possesses another principal activity about engaging in exploration and selling of mineral ore.
1.3 Telecommunication group Consolidated company Location Cetel Çalık Enerji Telekomünikasyon Hizmetleri A.Ş. Turkey Cetel Telekom İletişim Sanayi ve Ticaret A.Ş. Turkey Albtelecom Sh.a. Albania Eagle Mobile Sh.a. Albania Telemed Telekom A.Ş. Turkey Cetel Çalık Enerji Telekomünikasyon Hizmetleri A.Ş. (“Cetel Çalık”) Cetel Çalık was established in 2004 in Istanbul in order to render various services in the fields of telecommunication, communication, press, and internet. Cetel Telekom İletişim Sanayi ve Ticaret A.Ş. (“Cetel Telekom”) Cetel Telekom İletişim Sanayi ve Ticaret A.Ş. was established in 2007 in Istanbul. The principal activities are telecommunication, multimedia, internet and data transportation. Albtelecom Sh.a. (“Albtelecom”) Albtelecom was established in January 16, 1992 as Telekomi Shqiptar and transformed into a company limited by shares in 23 February 1999. Up to 28.09.2007, Government of Albania as represented by the Ministry of Economy, Trade and Energy was the sole shareholder of the Company. As of 28.09.2007 CT Telecom Sh.a, a subsidiary of Cetel Telekom İletişim Sanayi ve Ticaret A.Ş. (a Çalık Group Company) acquired 76% of the Albtelecom’s share capital. Albtelecom is the unique national operator of fixed telephony. Eagle Mobile Sh.a. (“Eagle Mobile”) Eagle Mobile was established on 24 October 2003 in Tirana, Albania. The Company provides public, mobile, terrestrial service 900/1800MHz, GSM standard, in compliance with the Firs Class License No. 253/03/04, dated 01.03.2004. Telemed Telekom A.Ş. (“Telemed”) Telemed was established in year 2010 to furnish every kind of services in the field of telecommunication, communication, press-information, internet, voice and data communication, etc.
ÇALIK HOLDİNG A.Ş.
NOTES TO CONSOLIDATED FINANCIAL STATEMENTS
FOR THE YEAR ENDED 31 DECEMBER 2011
(Currency shown in thousands of US Dollars (USD) unless otherwise indicated.)

96
ÇALIK HOLDİNG A.Ş. NOTES TO CONSOLIDATED FINANCIAL STATEMENTS
FOR THE YEAR ENDED 31 DECEMBER 2011
(Currency shown in thousands of US Dollars ("USD") unless otherwise indicated.)
13
1.4 Construction group Consolidated company Location GAP İnşaat Yatırım ve Dış Ticaret A.Ş. Turkey GAP İnşaat Dubai FZE Dubai GAP İnşaat Ukraine Ltd. Ukraine GAP İnşaat Construction and Investment Co. Ltd. Sudan Çalık Gayrimenkul Ticaret A.Ş. Turkey Soma Yapı Malzemeleri Sanayi ve Ticaret A.Ş. Turkey Aina - Gap İnşaat Joint Venture Sudan
Gap İnşaat Yatırım ve Dış Ticaret A.Ş. (“Gap İnşaat”) Gap İnşaat was established in 1996 in Istanbul, Turkey in order to provide construction, contracting and decoration businesses both within Turkey and abroad. It also administers mining of all kinds of minerals, marble, lime, clay, coal and stone quarries both within the country and abroad provided that the necessary permits are received.
Gap İnşaat has four branches in Turkmenistan, Saudi Arabia, Abu Dhabi, Iraq which were set up to operate several construction projects in Turkmenistan, Saudi Arabia, Abu Dhabi and Iraq.
Gap İnşaat Ukraine Ltd, Gap İnşaat Dubai FZE (UAE), Gap İnşaat Construction and Investment Co. Ltd. and Aina - Gap İnşaat Joint Venture Gap İnşaat’s three subsidiaries and one joint venture namely, Gap İnşaat Ukraine Ltd., Gap İnşaat Dubai FZE and Gap İnşaat Construction and Investment Co. Ltd. and Aina - Gap İnşaat Joint Venture operate construction projects in the countries they were established in.
Çalık Gayrimenkul Ticaret A.Ş. (“Çalık Gayrimenkul”) Çalık Gayrimenkul was founded in Merter , Istanbul in 2005 to buy and sell every kind of real estate, to build, divide, rent, have them rented and merchandise every kind of real estate, to found and buy companies and to create a partnership.
Soma Yapı Malzemeleri Sanayi ve Ticaret A.Ş. (“Soma Yapı”) Soma Yapı was established in 21 March 2003 in Ankara in order to produce raw materials for construction.
1.5 Banking group
Consolidated company Location Aktif Yatırım Bankası A.Ş. Turkey Çalık Finansal Hizmetler A.Ş. Turkey Banka Kombetare Tregtare Sh.a Albania Aktif Yatırım Bankası A.Ş. (“Aktifbank”) Aktifbank was founded as an investment bank in August 1999. Aktifbank operates as an investment bank and also involves in corporate services such as financial leasing, lending and trade finance. The majority of the transactions of Aktifbank are realized within Çalık Group. Çalık Finansal Hizmetler A.Ş. (“Çalık Finansal”) Çalık Finansal was established in 2003 as Aktifbank's cooperation with Şekerbank T.A.Ş. and Çalık Holding for their projects of investing in domestic and foreign oriented banks. In year 2008, Çalık Holding had acquired Şekerbank T.A.Ş.’s shares.
ÇALIK HOLDİNG A.Ş.
NOTES TO CONSOLIDATED FINANCIAL STATEMENTS
FOR THE YEAR ENDED 31 DECEMBER 2011
(Currency shown in thousands of US Dollars (USD) unless otherwise indicated.)

97
ÇALIK HOLDİNG A.Ş. NOTES TO CONSOLIDATED FINANCIAL STATEMENTS
FOR THE YEAR ENDED 31 DECEMBER 2011
(Currency shown in thousands of US Dollars ("USD") unless otherwise indicated.)
14
Banka Kombetare Tregtare Sh.a. (“BKT”) BKT was registered in December 1998 with the Bank of Albania to operate as a bank in the Republic of Albania. In December 2005, BKT convened an extraordinary general meeting of shareholders to transfer 60 per cent of the Bank’s shares to Çalık Şeker. The transfer was finalized and registered in the Tirana Court in June 2006, following the approvals by the Bank of Albania and the Competition Authority.
1.6 Marketing group
Consolidated company Location GAP Pazarlama A.Ş. Turkey GAPPA Inc. USA GAP Pazarlama FZE Jebel Ali Free Zone UAE – Dubai GAP Pazarlama A.Ş. (“GAP Pazarlama”) GAP Pazarlama A.Ş., was established in 1994 in Merter, Istanbul. GAP Pazarlama performs the functions of a supply agent for Çalık Group. GAP Pazarlama procures goods needed by the factories managed by the Çalık group and for projects undertaken by the contractor company from Turkey or off international markets.
Gap Pazarlama has one branch in Mersin Free Zone, which was set up to, operate import and export textile products.
GAPPA Inc. GAPPA Inc handles the international sales of the home textiles and ready-to-wear garments manufactured. GAP Pazarlama FZE Jebel Ali Free Zone (“GAP Pazarlama FZE”) GAP Pazarlama FZE was established by the end of 2004 in the United Arab Emirates (“UAE”) engaged in import and export of trade goods.
ÇALIK HOLDİNG A.Ş.
NOTES TO CONSOLIDATED FINANCIAL STATEMENTS
FOR THE YEAR ENDED 31 DECEMBER 2011
(Currency shown in thousands of US Dollars (USD) unless otherwise indicated.)

98
ÇALIK HOLDİNG A.Ş. NOTES TO CONSOLIDATED FINANCIAL STATEMENTS
FOR THE YEAR ENDED 31 DECEMBER 2011
(Currency shown in thousands of US Dollars ("USD") unless otherwise indicated.)
15
1.7 Media group
Consolidated company Location Turkuvaz Radyo Televizyon Haberleşme ve Yayıncılık A.Ş. TurkeyTurkuvaz Kitapçılık Yayıncılık A.Ş. TurkeyTurkuvaz Gazete Dergi Basım A.Ş. TurkeyTurkuvaz Haber Ajansı A.Ş. TurkeyTurkuvaz Dağıtım Pazarlama A.Ş. TurkeyTurkuvaz Yayın Hizmetleri ve Ticaret A.Ş. TurkeyTurkuvaz Filmcilik Prodüksiyon Sanayi ve Ticaret A.Ş. TurkeyTurkuvaz Televizyon ve Radyo İşletmeciliği A.Ş. TurkeyTurkuvaz Teknik Hizmetler Sanayi ve Ticaret A.Ş. TurkeyTurkuvaz Mobil Hizmetler A.Ş. TurkeyTurkuvaz ATV Televizyon Prodüksiyon A.Ş. TurkeyTurkuvaz Aktif Televizyon Prodüksiyon A.Ş. TurkeyTurkuvaz Reklam Pazarlama Danışmanlık A.Ş. TurkeyTurkuvaz Matbaacılık Yayıncılık A.Ş. TurkeyTurkuvaz İzmir Gazete Dergi Basım Yayın A.Ş. TurkeyTurkuvaz Yeni Asır Televizyon Prodüksiyon A.Ş. TurkeyTurkuvaz İzmir Televizyon Prodüksiyon ve Radyoculuk A.Ş. TurkeyTurkuvaz ATV Sabah GmbH Germany Turkuvaz Motor Presse Dergi Yayıncılık Limited Şirketi Turkey Turkuvaz Görsel ve İşitsel İletişim A.Ş. Turkey Turkuvaz Medya Yayın Hizmetleri A.Ş. Turkey Turkuvaz Televizyon Hizmetleri A.Ş. Turkey Turkuvaz Radyo Televizyon Haberleşme ve Yayıncılık A.Ş. (“Turkuvaz Radyo”) Turkuvaz Radyo, formerly known as Turkuvaz Radyo Televizyon Gazetecilik ve Yayıncılık A.Ş. was established in 2005 in Merter, Istanbul. Turkuvaz Radyo is mainly engaged in television and radio broadcasting in Turkey and abroad. The sale of ATV-Sabah to Turkuvaz Radyo which was performed under a formal public tender was approved on 21 February 2008 by Turkey’s Savings Deposit Insurance Fund.
Turkuvaz Kitapçılık Yayıncılık A.Ş. (“Turkuvaz Kitapçılık”) Turkuvaz Kitapçılık was founded in January 2008 in Istanbul. The principal activities are selling, editing and producing books.
Turkuvaz Gazete Dergi Basım A.Ş. (“Turkuvaz Gazete”) Turkuvaz Gazete was established in January 2008 in Istanbul. The principal activity of Turkuvaz Gazete is publishing newspapers such as “Sabah”, “Fotomaç”, “Takvim” and magazines such as “Türkiye Forbes”, “Şamdan”, “Bebeğim ve Biz”.
Turkuvaz Haber Ajansı A.Ş. (“Turkuvaz Haber”) Turkuvaz Haber was founded in January 2008 in Istanbul. As of the financial position date, it is inactive.
Turkuvaz Dağıtım Pazarlama A.Ş. (“Turkuvaz Dağıtım”) Turkuvaz Dağıtım was established in January 2008 in Istanbul. Turkuvaz Dağıtım distributes newspapers and magazines to retailers, gross markets and publishers.
Turkuvaz Yayın Hizmetleri ve Ticaret A.Ş. (“Turkuvaz Yayın”) Turkuvaz Yayın was founded in January 2008, in Istanbul in order to provide administrative services to the Group. As of the balance sheet date Turkuvaz Yayın is inactive.
Turkuvaz Filmcilik Prodüksiyon Sanayi Ticaret A.Ş. (“Turkuvaz Filmcilik”) Turkuvaz Filmcilik was set up in January 2008 in Istanbul. As of the financial position date, it is inactive.
ÇALIK HOLDİNG A.Ş.
NOTES TO CONSOLIDATED FINANCIAL STATEMENTS
FOR THE YEAR ENDED 31 DECEMBER 2011
(Currency shown in thousands of US Dollars (USD) unless otherwise indicated.)

99
ÇALIK HOLDİNG A.Ş. NOTES TO CONSOLIDATED FINANCIAL STATEMENTS
FOR THE YEAR ENDED 31 DECEMBER 2011
(Currency shown in thousands of US Dollars ("USD") unless otherwise indicated.)
16
Turkuvaz Televizyon ve Radyo İşletmeciliği A.Ş. (“Turkuvaz TV”) It was established in January 2008, in Istanbul. The company is active since June 2008 and its main activity is broadcasting.
Turkuvaz Teknik Hizmetler Sanayi ve Ticaret A.Ş. (“Turkuvaz Teknik”) Turkuvaz Teknik was established in January 2008 in Istanbul. As of the financial position date, it is inactive.
Turkuvaz Mobil Hizmetler A.Ş. (“Turkuvaz Mobil”) Turkuvaz Mobil was founded in January 2008 in Istanbul. As of the financial position date, it is inactive.
Turkuvaz ATV Televizyon Prodüksiyon A.Ş. (“Turkuvaz ATV”) Turkuvaz ATV was brought into existence in Istanbul, in January 2008. As of the financial position date, it is inactive.
Turkuvaz Aktif Televizyon Prodüksiyon A.Ş. (“Turkuvaz Aktif”) Turkuvaz Aktif was founded in March 2008 in Istanbul. As of the financial position date, it is inactive.
Turkuvaz Reklam Pazarlama Danışmanlık A.Ş. (“Turkuvaz Reklam”) Turkuvaz Reklam was established in January 2008 in Istanbul. Its main activities are marketing and sales of television and newspaper advertising.
Turkuvaz Matbaacılık Yayıncılık A.Ş. (“Turkuvaz Matbaacılık”) Turkuvaz Matbaacılık was founded in Istanbul, in January 2008 to print newspapers and magazines.
Turkuvaz İzmir Gazete Dergi Basım Yayın A.Ş. (“Turkuvaz İzmir Gazete”) Turkuvaz İzmir Gazete was established in January 2008 in İzmir. The main activity is publishing of “Yeniasır” newspaper.
Turkuvaz Yeni Asır Televizyon Prodüksiyon A.Ş. (“Turkuvaz Yeni Asır”) It was established in March 2008 in İzmir. The company is active since July 2008 and its main activity is broadcasting.
Turkuvaz İzmir Televizyon Prodüksiyon ve Radyoculuk A.Ş. (“Turkuvaz İzmir TV”) It was set up in March 2008 in İzmir. The company is active since July 2008 and its main activity is broadcasting.
Turkuvaz ATV Sabah GmbH (“Turkuvaz Sabah GmbH”) Turkuvaz Sabah GmbH was established in Germany and 100% of its shares owned by Turkuvaz Gazete. Turkuvaz Sabah GmbH purchased Merkez ATV GmbH’s assets on 23 July 2008. The main activity is publishing newspapers and operating TV. Turkuvaz Motor Presse Dergi Yayıncılık Limited Şirketi (“Turkuvaz Motor”) It was established in 2006 in Istanbul and is mainly engaged in publishing magazines in Turkey. Turkuvaz Gazete has been a partner of Turkuvaz Motor with buying 50% share that belongs to Merkez Yayın Holding A.Ş. on 02 December 2008. As of 11.01.2010, Motor Presse International Verlagsgesellschaft Holding GmbH sold its 750.000 (50% of its share capital) Turkuvaz Motor shares to Turkuvaz Gazete Dergi Basım A.Ş. (735.000 shares, 49% of its share capital) and Turkuvaz Matbaacılık Yayıncılık A.Ş. (15.000 shares, 1% of its share capital).
Turkuvaz Görsel ve İşitsel İletişim A.Ş. (“Turkuvaz Görsel”) Turkuvaz Görsel was set up in October 2009, in Istanbul. The company is active since July 2010 and its main activity is broadcasting.
Turkuvaz Medya Yayın Hizmetleri A.Ş. (“Turkuvaz Medya”) Turkuvaz Medya was founded in October 2009, in Istanbul. The company is active since July 2010 and its main activity is broadcasting.
Turkuvaz Televizyon Hizmetleri A.Ş. (“Turkuvaz Hizmet”) Turkuvaz Hizmet was set up in October 2009 in Istanbul. As of the financial position date, it is inactive.
ÇALIK HOLDİNG A.Ş.
NOTES TO CONSOLIDATED FINANCIAL STATEMENTS
FOR THE YEAR ENDED 31 DECEMBER 2011
(Currency shown in thousands of US Dollars (USD) unless otherwise indicated.)

100
ÇALIK HOLDİNG A.Ş. NOTES TO CONSOLIDATED FINANCIAL STATEMENTS
FOR THE YEAR ENDED 31 DECEMBER 2011
(Currency shown in thousands of US Dollars ("USD") unless otherwise indicated.)
17
1.8 Other
Consolidated company Location E-Kent Elektronik Ücret Toplama Sistemleri A.Ş. Turkey Çalık Yönetim Sistemleri A.Ş. Turkey E-Post Elektronik Perakende Otomasyon Satış ve Ticaret A.Ş. Turkey Lidya Madencilik Sanayi ve Ticaret A.Ş. Turkey Çalık Hava Taşımacılık Turizm Sanayi ve Ticaret A.Ş. Turkey Tura Madencilik A.Ş. Turkey Dore Altın ve Madencilik A.Ş. Turkey Çalık Turizm Kültür İnşaat Sanayi ve Ticaret A.Ş. Turkey E-Kent Elektronik Ücret Toplama Sistemleri A.Ş. (“E-Kent”) E-Kent was established in 2002. The main activity is modernization of public transportation and suggesting new electronic solution about electronic ticket and prosecution system.
Çalık Yönetim Sistemleri A.Ş. (“Çalık Yönetim”) Çalık Yönetim was established in 2008 in Istanbul. The main operation is to give consulting services about all kind of project, efficiency, organization, financing, sales and marketing ,etc.
E-Post Elektronik Perakende Otomasyon Satış ve Ticaret A.Ş. (“E-Post”) E-Post was established in September 2009, Istanbul in order to mine out, rent, operate and selling mine.
Lidya Madencilik Sanayi ve Ticaret A.Ş. (“Lidya Maden”) Lidya Maden was established in 2006 in Merter , Istanbul. The main operation is to prospect all kind of metal and mineral productions.
Çalık Hava Taşımacılık Turizm Sanayi ve Ticaret A.Ş. (“Çalık Hava”) Çalık Hava was established in 2010 in Istanbul to make every kind of air transport instruments, to make scheduled or unscheduled air transport at home or abroad, to make passenger transportation, transportation of freight cargo from one place to another at home and abroad, to operate in every kind of transportation related to aviation, etc.
Tura Madencilik A.Ş. (“Tura”) Tura was established in 2010 in Istanbul to mine, operate, buy and rent underground & surface mine and natural resources in accordance with existing codes, to have prospecting licence, to mine, to demand operating right, to have lease and operating concession, to take over mine rights which can be taken over, etc. Dore Altın ve Madencilik A.Ş. (“Dore Altın”) Dore Altın was established in 2010 in Istanbul to mine, operate, sell and rent underground & surface mine and natural resources in accordance with existing codes, to have prospecting licence, to mine, to demand operating right, to have lease and operating concession, to take over mine rights which can be taken over, etc. Çalık Turizm Kültür İnşaat Sanayi ve Ticaret A.Ş. (“Çalık Turizm”) Çalık Turizm was established in December 2004 in Istanbul in order to regard efficient utilization of immovable assets relation to establishment of mega-cities. Çalık Turizm is involved with the construction, establishment, operation and renting out of contemporary residential areas, trade and tourism centers, international and local press centers, mass housing, metres, bridges, and highways.
ÇALIK HOLDİNG A.Ş.
NOTES TO CONSOLIDATED FINANCIAL STATEMENTS
FOR THE YEAR ENDED 31 DECEMBER 2011
(Currency shown in thousands of US Dollars (USD) unless otherwise indicated.)

101
ÇALIK HOLDİNG A.Ş. NOTES TO CONSOLIDATED FINANCIAL STATEMENTS
FOR THE YEAR ENDED 31 DECEMBER 2011
(Currency shown in thousands of US Dollars ("USD") unless otherwise indicated.)
18
2. BASIS OF PRESENTATION OF FINANCIAL STATEMENTS Basis of preparation The consolidated financial statements have been prepared in accordance with the International Financial Reporting Standards (“IFRS”). The consolidated financial statements have been prepared under the historical cost convention, other than financial assets which are stated at fair value. The Company and its subsidiaries established in Turkey maintain their books of account and prepare their statutory financial statements in Turkish Lira (“TL”) in accordance with the Turkish Commercial Code, tax legislation and the Uniform Chart of Accounts issued by the Ministry of Finance. The TL financial statements prepared from the statutory records (which are maintained under the historical cost convention) are modified with certain out-of-book adjustments, reclassifications and restatements (as defined in the following paragraph) to comply with IFRS. Overseas subsidiary maintain its books of account and prepare its statutory financial statements in local currencies in accordance with the regulations of the countries in which they operate. The local currency financial statements prepared from the statutory records (which are maintained under the historical cost convention) are modified with certain out-of-book adjustments, reclassifications and translations as defined in the following paragraph to comply with IFRS.
Financial statements of the subsidiaries operating in foreign countries have been presented in US Dollars because their functional currency is US Dollars as the majority of their sales, purchases, property and equipment, debt and trade liabilities are either priced, incurred, payable or otherwise measured in US Dollars. Transactions and balances not already measured in US Dollars have been remeasured in US Dollars in accordance with IAS 21 “The Effects of Changes in Foreign Exchange Rates”. Presentation currency and functional currency These consolidated financial statements are presented in USD. Turkish Lira (“TL”) is the Company’ s functional currency. Translation of financial statements from functional currency to presentation currency Translation of financial statements from functional currency to presentation currency is done as follows:
Assets and liabilities for each financial position presented are translated at the closing rate at the date of that reporting
date (2011 TL 1,8889 (full) = USD 1,00 (full)), (2010 TL 1,5460 (full) = USD 1,00 (full)).
Income and expenses for each income statement are translated at exchange rates at the dates of the transactions; 2011 TL 1,67 (full) = USD 1,00 (full)), (2010 TL 1,5004 (full) = USD 1,00 (full)).
Equity items other than the net profit for the year and share capital and other comprehensive income are translated at the closing rate existing at the reporting date (2011 TL 1,8889 (full) = USD 1,00 (full)) , (2010 TL 1,5460 (full) = USD 1,00 (full)).
All resulting exchange differences are recognised as a separate component in of equity in the“Translation reserve” account.
Offsetting
Financial assets and liabilities are offset and the net amount is reported in the consolidated financial position when there is a legally enforceable right to set off the recognised amounts and there is an intention to settle on a net basis or realize the asset and settle the liability simultaneously.
ÇALIK HOLDİNG A.Ş.
NOTES TO CONSOLIDATED FINANCIAL STATEMENTS
FOR THE YEAR ENDED 31 DECEMBER 2011
(Currency shown in thousands of US Dollars (USD) unless otherwise indicated.)

102
ÇALIK HOLDİNG A.Ş. NOTES TO CONSOLIDATED FINANCIAL STATEMENTS
FOR THE YEAR ENDED 31 DECEMBER 2011
(Currency shown in thousands of US Dollars ("USD") unless otherwise indicated.)
19
Standards, amendments and interpretations to existing standards that are not yet effective and have not been adopted early by the Company At the date of authorisation of these financial statements, certain new standards, amendments and interpretations to existing standards have been published but are not yet effective, and have not been adopted early by the Group. a) Standards, amendments and interpretations effective in 2011:
IFRIC 19 “Extinguishing financial liabilities with equity instruments” IFRIC 14 “IAS 19 The Limit on a Defined Benefit Asset, Minimum Funding Requirements and their Interaction” IAS 32 (Amendment) “Classification of right issues” IAS 24 (Revised) “Related party disclosure” Annual Amendments to IFRS in May 2010
b) Standards, amendments and interpretations effective after 31 December 2011but not early adopted by the Company:
IFRS 9 “ Financial Instruments- Phase1 Classification and measurement” IAS 12 (Amendment) “Income Taxes- Deferred tax: recovery of underlying assets” IFRS 7 (Amendment) “Financial Instruments-Disclosures” IFRS 10 “Consolidated Financial Statements” IFRS 11 “Joint arrangements” IFRS 12 “Disclosure of Interest in Other Entities” IFRS 13 “Fair Value Measurement” IAS 27 (Revised) “Separate Financial Statements” IAS 28 (Revised) “Investments in Associates and Joint Ventures” IAS 19 (Revised) “Employee Benefits” IAS 1 (Revised) “Presentation of Financial Statements”
Management of the Group anticipates that all of the pronouncements detailed in (b) above will be adopted in the Group’s accounting policy for the first period beginning after the effective date of the pronouncement. Management of the Group has decided that these new standards and interpretations have been issued but are not expected to have a material impact on the Group’s financial statements. Comparable financial information and reclassification of prior period financial statements The financial positions with the accompanying notes as of 31.12.2011 and 31.12.2010 and statement of income, cash flow and changes in equity with the accompanying notes for the year ended 31.12.2011 and 31.12.2010 are presented as comparatively. For the comparability of the current financial statements, these financial statements are reclassified if necessary. As of 31.12.2011, Group’s statement of income and its related notes are restated for the accounting and presentation of IFRS 5 “Non-current Assets Held for Sale and Discontinued Operations”. As of 31.12.2010, advances received 22.918 USD which were accounted under “Other liabilities” were reclassified to “Deferred billings”. As of 31.12.2010, “Customer deposits” amounting to USD 78.503, which were accounted under current liabilities, were reclassified to non-current liabilities. As of 31.12.2010, “Impairment of loans” amounting to USD 1.692 which were accounted under “Other expense” was reclassified to “Financing expenses”. As of 31.12.2010, “Investment properties” amounting to USD 64.143 which were accounted under “Investment property” was reclassified to “Inventories”.
ÇALIK HOLDİNG A.Ş.
NOTES TO CONSOLIDATED FINANCIAL STATEMENTS
FOR THE YEAR ENDED 31 DECEMBER 2011
(Currency shown in thousands of US Dollars (USD) unless otherwise indicated.)

103
ÇALIK HOLDİNG A.Ş. NOTES TO CONSOLIDATED FINANCIAL STATEMENTS
FOR THE YEAR ENDED 31 DECEMBER 2011
(Currency shown in thousands of US Dollars ("USD") unless otherwise indicated.)
20
As of 31.12.2010, “Deposits and guaranties given” amounting to USD 2.723 and USD 479 which were respectively accounted under current and non-current “Trade receivables” were reclassified to current and non-current “Other assets”. As of 31.12.2010, “Deposits and guaranties received” amounting to USD 1.496 and USD 27.888 which were respectively accounted under current and non-current “Trade payables” were reclassified to current and non-current “Other liabilities”. As of 31.12.2010, “Provision for expenses” amounting to USD 9.252 which were accounted under non-current “Other liabilities” were reclassified tonon-current “Provisions” The prior years’ financial statements have been restated in order to conform to the presentation of the current period consolidated financial statement within the framework of IFRS 3 “Business Combinations”. In accordance with IFRS 3, the Company retrospectively adjust the provisional amounts recognised at the acquisition date to reflect new information obtained about facts and circumstances that existed as of the acquisition date of Yeşilırmak, a subsidiary acquired by Çalık Elektrik Dağıtım on 30.11.2010. Changes in accounting policy The effects arising from the changes in the Company’s subsidiary Yeşilırmak accounting policy on service concession agreements, recognition and measurement of revenue under financial asset model rather than intangible asset model, described in note 3 (“Services concession agreements”) have been reflected in the accompanying statements in accordance with IAS-8 “Accounting Policies, Change in Accounting Estimates and Errors”. To the extent that those changes had not an impact on the results reported for 2010, however for the comparability of the financial statements necessary reclassifications have been reflected in the accompanying financial statements as follows: 31.12.2010
Reclassification on financial position: - Due from services concession agreements
80.426 - Intangible assets
(80.426)
--
Reclassification on statements of income: - Revenue
14.474 - Cost of sales
(14.709)
- Financing income
5.325 - Financing expense
(5.090)
Effect on income statement -- Critical accounting estimates, assumptions and judgments The preparation of financial statements in conformity with IFRS requires management to make estimates and assumptions that affect reported amounts of assets and liabilities and disclosure of contingent assets and liabilities at the date of the financial statements, and the reported amounts of revenues and expenses during the reporting period. Actual results could differ from these estimates. These estimates are reviewed periodically, and as adjustments become necessary, they are reported in earnings in the periods in which they become known. The key assumption concerning the future and other key sources of estimation uncertainty at the financial position date and the significant judgments are set out below:
ÇALIK HOLDİNG A.Ş.
NOTES TO CONSOLIDATED FINANCIAL STATEMENTS
FOR THE YEAR ENDED 31 DECEMBER 2011
(Currency shown in thousands of US Dollars (USD) unless otherwise indicated.)

104
ÇALIK HOLDİNG A.Ş. NOTES TO CONSOLIDATED FINANCIAL STATEMENTS
FOR THE YEAR ENDED 31 DECEMBER 2011
(Currency shown in thousands of US Dollars ("USD") unless otherwise indicated.)
21
- Allowance for doubtful debts reflect the amount set aside for the losses in the future related to receivables which exist the financial position date but which, in the opinion of the management carry the risk of collection due to current economic conditions. When evaluating whether receivables has suffered a loss in value the past performance of the debtors, they are credibility in the market and their performance between the financial position date and report date together with changed circumstances are taken in the considerations. In addition, the collaterals existing as financial position date together with new collaterals obtained between the balance date and report date are also taken in the consideration. The allowance for doubtful receivables as of the financial position dates are explained under note 13. -When setting aside the provision for legal claims the probability of loosing the related case and the results to expect to be suffered in the event that the legal counsel of the Group and management of the Group make their best estimates to calculate the provision required.
- Property, plant and equipment and intangible assets held for use in the production or supply of goods or services, or for administrative purposes, are stated in the financial position at cost, less any subsequent accumulated depreciation and subsequent accumulated impairment losses. The Group estimates that the useful lives of property, plant and equipmen and intangible assets. Depreciation is charged using the straight-line basis over the useful lives, which depend on the best estimation of the management. Useful lives of property, plant and equipment and intangible assets are reviewed at each financial position dates and make changes if necessary.
ÇALIK HOLDİNG A.Ş.
NOTES TO CONSOLIDATED FINANCIAL STATEMENTS
FOR THE YEAR ENDED 31 DECEMBER 2011
(Currency shown in thousands of US Dollars (USD) unless otherwise indicated.)

105
ÇALIK HOLDİNG A.Ş. NOTES TO CONSOLIDATED FINANCIAL STATEMENTS
FOR THE YEAR ENDED 31 DECEMBER 2011
(Currency shown in thousands of US Dollars ("USD") unless otherwise indicated.)
22
3. SUMMARY OF SIGNIFICANT ACCOUNTING POLICIES The significant accounting policies followed in the preparation of the accompanying consolidated financial statements are summarized below:
Basis of consolidation The consolidated financial statements incorporate the financial statements of the Çalık Holding and the enterprises controlled by the Company. Control is achieved where the Çalık Holding has the power to govern the financial and operating policies of an investee enterprise so as to obtain benefits from its activities. Certain companies (as detailed note 17) where Çalık Holding has a controlling interest or significant influence are not consolidated or equity accounted as they are immaterial individually and in aggregate to the results and financial position of the Group.
On acquisition, the assets and liabilities of a subsidiary are measured at their fair values at the date of acquisition. The interest of non-controlling shareholders is stated at the non-controlling’s proportion of their fair values of the assets and liabilities recognised.
The financial position and income statement of the subsidiary are consolidated on a line-by-line basis, and the carrying value of the investment held by the Company is eliminated against related equity and reserves accounts.
All significant inter-company transactions and balances between group enterprises are eliminated on consolidation.
The results of subsidiary acquired or disposed of during the year are included in the consolidated income statement from the effective date of acquisition or up to the effective date of disposal, as appropriate.
Where necessary, adjustments are made to the financial statements of subsidiaries to bring the accounting policies used into line with those used by other members of the Company. The financial statements of the subsidiaries included in the consolidation have been prepared as of the date of the consolidated financial statements.
For the purpose of consolidated financial statements, Çalık Holding, its subsidiaries and its joint venture given below are referred to collectively as the “Group”.
The Company has always exercised effective control over the management of each of the companies included in the group consolidation. The ownership and economic interest of Çalık Holding in their capital is as follows: 2011 2010
Consolidated company
Direct ownership
(%)
Economic interest
(%)
Direct ownership
(%)
Economic interest
(%) Gap Güneydoğu Tekstil Sanayi ve Ticaret A.Ş. 99,2 98,9 99,2 98,9 Çalık Korea Inch. 100,0 98,9 100,0 98,9 Çalık USA 100,0 98,9 100,0 98,9 Gap Güneydoğu FZE Jebel Ali Free Zone 100,0 98,9 100,0 98,9 Çalık Enerji Sanayi ve Ticaret A.Ş. 99,9 99,9 99,9 99,9 Çalık Enerji Dubai FZE 100,0 99,9 100,0 99,9 Naturel Gaz Sanayi ve Ticaret A.Ş. -- -- 40,0 40,0 Aktif Doğalgaz Ticaret A.Ş. 96,5 96,4 96,5 96,4 Türkmen’in Altın Asrı Elektrik Enerjisi Toptan Satış A.Ş. 97,0 96,8 97,0 96,8 Çalık Enerji Elektrik Üretim ve Madencilik A.Ş. 100,0 99,9 100,0 99,9 TAPCO Petrol Boru Hattı Sanayi ve Ticaret A.Ş. 50,0 49,9 50,0 49,9 Kızılırmak Enerji Elektrik A.Ş. 99,2 99,1 99,2 99,1 Doğu Akdeniz Petrokimya ve Rafineri Sanayi ve Ticaret A.Ş. 84,2 84,1 99,2 99,1
ÇALIK HOLDİNG A.Ş.
NOTES TO CONSOLIDATED FINANCIAL STATEMENTS
FOR THE YEAR ENDED 31 DECEMBER 2011
(Currency shown in thousands of US Dollars (USD) unless otherwise indicated.)

106
ÇALIK HOLDİNG A.Ş. NOTES TO CONSOLIDATED FINANCIAL STATEMENTS
FOR THE YEAR ENDED 31 DECEMBER 2011
(Currency shown in thousands of US Dollars ("USD") unless otherwise indicated.)
23
2011 2010
Consolidated company (continued)
Direct ownership
(%)
Economic interest
(%)
Direct ownership
(%)
Economic interest
(%) Çalık NTF Elektrik Üretim ve Madencilik A.Ş. 90,0 89,9 90,0 89,9 Ant Enerji Sanayi ve Ticaret Ltd. 50,0 49,9 50,0 49,9 Vadi Elektrik Üretim Sanayi ve Ticaret Ltd. 99,0 98,9 99,0 98,9 Ortur Elektrik Üretim ve Ticaret Ltd. 90,0 89,9 90,0 89,9 Atlas Petrol Gaz İthalat İhracat ve Pazarlama Ticaret A.Ş. 100,0 99,9 100,0 99,9 Başak Enerji Elektrik Üretim Sanayi ve Ticaret A.Ş. 100,0 100,0 100,0 100,0 Çalık Rüzgar Enerjisi Elektrik Üretim Ltd. 95,0 94,9 95,0 94,9 Momentum Enerji Elektrik Üretim Sanayi ve Ticaret A.Ş. 100,0 99,9 100,0 99,9 Irmak Enerji Elektrik Üretim Madencilik Sanayi ve Ticaret A.Ş. 100,0 100,0 100,0 100,0 Yenikom Telekomünikasyon Hizmetleri A.Ş. 100,0 99,9 100,0 99,9 Yeşilçay Enerji Elektrik Üretim Sanayi ve Ticaret A.Ş. 100,0 99,9 100,0 99,9 Cetel Çalık Enerji Telekomünikasyon Hizmetleri A.Ş. 100,0 99,9 100,0 99,9 Cetel Telekom İletişim Sanayi ve İletişim A.Ş. 80,0 79,9 80,0 79,9 Albtelecom Sh.a. 76,0 60,7 76,0 60,7 Eagle Mobile Sh.a. 100,0 60,7 100,0 60,7 Gap İnşaat Yatırım ve Dış Ticaret A.Ş. 99,3 99,3 99,3 99,3 Gap İnşaat Dubai FZE 100,0 99,3 100,0 99,3 Çalık Gayrimenkul Ticaret A.Ş. 99,0 98,3 99,0 98,3 Gap İnşaat Ukraine Ltd. 100,0 99,3 100,0 99,3 Gap İnşaat Construction and Investment Co. Ltd. 100,0 99,3 100,0 99,3 Soma Yapı Malzemeleri Sanayi ve Ticaret A.Ş. 99,2 99,2 99,2 99,2 Aktif Yatırım Bankası A.Ş. 99,7 99,2 99,6 99,2 Çalık Finansal Hizmetler A.Ş. 100,0 100,0 100,0 99,8 Banka Kombetare Tregtare Sh.a. 100,0 100,0 100,0 99,8 Gap Pazarlama A.Ş. 95,0 95,0 95,0 95,0 GAPPA Inc. 100,0 95,0 100,0 95,0 Gap Pazarlama FZE Jebel Ali Free Zone 100,0 95,0 100,0 95,0 Turkuvaz Radyo Televizyon Haberleşme ve Yayıncılık A.Ş. 58,0 57,3 58,0 58,0 Turkuvaz Kitapçılık Yayıncılık A.Ş. 83,0 82,3 58,0 58,0 Turkuvaz Gazete Dergi Basım A.Ş. 83,0 82,3 58,0 58,0 Turkuvaz Haber Ajansı A.Ş. 83,0 82,3 58,0 58,0 Turkuvaz Dağıtım Pazarlama A.Ş. 83,0 82,3 58,0 58,0 Turkuvaz Yayın Hizmetleri ve Ticaret A.Ş. 83,0 82,3 58,0 58,0 Turkuvaz Filmcilik Prodüksiyon Sanayi ve Ticaret A.Ş. 83,0 82,3 58,0 58,0 Turkuvaz Televizyon ve Radyo İşletmeciliği A.Ş. 83,0 82,3 58,0 58,0 Turkuvaz Teknik Hizmetler Sanayi ve Ticaret A.Ş. 83,0 82,3 58,0 58,0 Turkuvaz Mobil Hizmetler A.Ş. 83,0 82,3 58,0 58,0 Turkuvaz ATV Televizyon Prodüksiyon A.Ş. 83,0 82,3 58,0 58,0 Turkuvaz Aktif Televizyon Prodüksiyon A.Ş. 83,0 82,3 58,0 58,0 Turkuvaz Reklam Pazarlama Danışmanlık A.Ş. 83,0 82,3 58,0 58,0 Turkuvaz Matbaacılık Yayıncılık A.Ş. 83,0 82,3 58,0 58,0 Turkuvaz İzmir Gazete Dergi Basım Yayın A.Ş. 83,0 82,3 58,0 58,0
ÇALIK HOLDİNG A.Ş.
NOTES TO CONSOLIDATED FINANCIAL STATEMENTS
FOR THE YEAR ENDED 31 DECEMBER 2011
(Currency shown in thousands of US Dollars (USD) unless otherwise indicated.)

107
ÇALIK HOLDİNG A.Ş. NOTES TO CONSOLIDATED FINANCIAL STATEMENTS
FOR THE YEAR ENDED 31 DECEMBER 2011
(Currency shown in thousands of US Dollars ("USD") unless otherwise indicated.)
24
2011 2010
Consolidated company (continued)
Direct ownership
(%)
Economic interest
(%)
Direct ownership
(%)
Economic interest
(%) Turkuvaz Yeni Asır Televizyon Prodüksiyon A.Ş. 83,0 82,3 58,0 58,0 Turkuvaz İzmir Televizyon Prodüksiyon ve Radyoculuk A.Ş. 83,0 82,3 58,0 58,0 Turkuvaz ATV Sabah GmbH 100,0 81,4 100,0 81,4 Turkuvaz Motor Presse Dergi Yayıncılık Ltd. 100,0 81,4 100,0 81,4 E-Kent Elektronik Ücret Toplama Sistemleri A.Ş. 100,0 74,4 100,0 74,4 Çalık Yönetim Sistemleri A.Ş. 75,0 74,4 75,0 74,4 Gap Elektrik Dağıtım Sanayi ve Ticaret A.Ş. 99,9 99,8 99,9 99,8 Lidya Madencilik Sanayi ve Ticaret A.Ş. 99,5 99,5 99,5 99,5 İkideniz Petrol ve Gaz Sanayi ve Ticaret A.Ş. 75,0 74,9 75,0 74,9 Çep Petrol Dağıtım Sanayi ve Ticaret A.Ş. 99,5 99,4 99,5 99,4 Çalık Alexandria For Readymade Garments 100,0 98,9 100,0 98,9 Gap İnşaat Aina Joint Venture 50,0 49,6 50,0 49,6 E-Post Elektronik Perakende Otomasyon Satış ve Ticaret A.Ş. 100,0 100,0 100,0 100,0 Turkuvaz Görsel ve İşitsel İletişim A.Ş. 83,0 82,3 83,0 83,0 Turkuvaz Medya Yayın Hizmetleri A.Ş. 83,0 82,3 83,0 83,0 Turkuvaz Televizyon Hizmetleri A.Ş. 83,0 82,3 83,0 83,0 Atayurt İnşaat A.Ş 99,8 99,6 99,8 99,6 Adacami Enerji Elektrik Üretim Sanayi Ve Ticaret A.Ş 99,9 99,9 99,9 99,9 Akçay Enerji A.Ş. 99,9 99,9 99,9 99,9 Sembol Enerji A.Ş. 100,0 99,9 100,0 99,9 Çalık Hava Taşımacılık Turizm Sanayi ve Ticaret A.Ş. 100,0 100,0 100,0 100,0 Ayas Rafineri ve Petrokimya Sanayi ve Ticaret A.Ş. 99,9 99,9 99,9 99,9 Dore Altın ve Madencilik A.Ş. 100,0 99,5 100,0 99,5 Tura Madencilik A.Ş. 100,0 99,5 100,0 99,5 Petrotrans Enerji A.Ş. 99,9 99,9 99,9 99,9 Telemed Telekom A.Ş. 99,9 99,9 99,9 99,9 Yeşilırmak Elektrik Dağıtım A. Ş. 100,0 99,9 100,0 99,9 Çalık Elektrik Dağıtım A. Ş. 100,0 99,9 100,0 99,9 Çalık Energy Construction LLC 100,0 99,9 100,0 99,9 Japan International Energy Network A. Ş. 24,9 24,9 -- -- Çalık Turizm Kültür İnşaat Sanayi ve Ticaret A.Ş. 83,1 97,3 -- --
As of and up to 31.12.2008, TTK, TJK, Serdar Pamyk and Balkan with group shares of respectively 32,0% 34,5%, 10,0% and 31% are consolidated because they are under the effective control and management of the Group. As from 01.01.2009, the Group ceased to have the power to govern but continued to have significant influence and therefore applied equity accounting method for these associates in the accompanying consolidated financial statements. TAPCO, Ant Enerji and Japan International with group shares of respectively, 49,9%, 49,9%, and 24,9% are consolidated because they are under the effective control and management of the Group.
ÇALIK HOLDİNG A.Ş.
NOTES TO CONSOLIDATED FINANCIAL STATEMENTS
FOR THE YEAR ENDED 31 DECEMBER 2011
(Currency shown in thousands of US Dollars (USD) unless otherwise indicated.)

108
ÇALIK HOLDİNG A.Ş. NOTES TO CONSOLIDATED FINANCIAL STATEMENTS
FOR THE YEAR ENDED 31 DECEMBER 2011
(Currency shown in thousands of US Dollars ("USD") unless otherwise indicated.)
25
Gap İnşaat Aina Joint Venture is the only jointly controlled entity within the Group and the ownership percentage is 50% (note 4). Its financial statements have been incorporated into the interim consolidated financial statements using the proportionate consolidation method. Business combinations The acquisition of subsidiaries is accounted for using the purchase method. The cost of the acquisition is measured at the aggregate of the fair values, at the date of exchange, of assets given, liabilities incurred or assumed, and equity instruments issued by the Group in exchange for control of the acquire, plus any costs directly attributable to the business combination. The acquirer’s identifiable assets, liabilities and contingent liabilities that meet the conditions for recognition under IFRS 3 are recognized at their fair values at the acquisition date.
Goodwill arising on acquisition is recognized as an asset and initially measured at cost, being the excess of the cost of the business combination over the Group’s interest in the net fair value of the identifiable assets, liabilities and contingent liabilities recognized. If, after reassessment, the Group’s interest in the net fair value of the acquirer’s identifiable assets, liabilities and contingent liabilities exceeds the cost of the business combination, the excess is recognized immediately in profit or loss.
The interest of non-controlling shareholders in the acquire is initially measured at the non-controlling’s proportion of the net fair value of the assets, liabilities and contingent liabilities recognized. Discontinued operations and non current assets held for sale Discontinued operation is a major line of business or geographical area of operations that is part of a single co-ordinated plan to dispose of or is held for sale.
Net assets related to the discontinued operations are measured at fair value less cost to sell. A single amount on the face of the income statements comprising the total of the post-tax profit or loss of discontinued operations and post-tax gain or loss recognised on the disposal of the assets constituting the discontinued operation is disclosed. Also, the net cash flows of the discontinued operations associated with the operating, investment and financing activities are disclosed in note 37.
Group of assets and liabilities are classified as held for sale if their carrying amount will be recovered principally through a sale transaction, not through continuing use. Liabilities directly associated with those assets are also classified similarly. Disposal group assets are measured at the lower of its carrying amount after deduction of the liabilities directly associated with those assets and its fair value less costs to sell. Services concession agreement Yeşilırmak, a subsidiary acquired by Çalık Elektrik Dağıtım on 29.12.2010 based on 30.11.2010 balance sheet, signed a contract with Türkiye Elektrik Dağıtım A.Ş. (“TEDAŞ”) on 24.07.2006 to identify the principles of allocation of transfer of operating rights (“TOOR”) of movable and immovable assets of the distribution zone 21st , Amasya, Çorum, Ordu, Samsun and Sinop. The agreement term is 30 years starting from 24.07.2006. At the end of this period, operational period may be extended in accordance with the related regulations which will be in force in the same period and approval of TEDAŞ. Yeşilırmak acts as an electricity distributor and constructs, operates and maintains the facility throughout the period identified above. In the current period, no change has taken place in the status of the agreement. In accordance with the concession agreement, the Group recognises guaranteed amount of investments as financial assets under the heading “Due from services concession agreements”. The Group recognizes and measures its revenue for the services it provides in accordance with IAS 11 “Construction Contracts” and IAS 18 “Revenue”. In the event that the Group provides multiple services in the framework of a single agreement or contract (for instance, construction or renovation services and operational services), the consideration received or to receivable is distributed in the ratio of realistic values of the services provided when amounts can be separately defined. Nature of the consideration identifies how it will later be recognized.
ÇALIK HOLDİNG A.Ş.
NOTES TO CONSOLIDATED FINANCIAL STATEMENTS
FOR THE YEAR ENDED 31 DECEMBER 2011
(Currency shown in thousands of US Dollars (USD) unless otherwise indicated.)

109
ÇALIK HOLDİNG A.Ş. NOTES TO CONSOLIDATED FINANCIAL STATEMENTS
FOR THE YEAR ENDED 31 DECEMBER 2011
(Currency shown in thousands of US Dollars ("USD") unless otherwise indicated.)
26
A financial asset is set up; this is recorded under IAS 39 at fair value. Hence, the financial asset is built up from day one and continues to build up until construction activity ceases. The asset is amortised as Yeşilırmak provides public service and receives cash from the grantor during the operation phase. IFRIC 12 clarifies the accounting for Yeşilırmak’s transfer of operating rights (TOOR). The adoption of IFRIC 12 has had impacts on the statements of income as given below:
2011 2010 Revenue 19.363.681 17.467.341 Cost (58.520.946) (29.644.338) Gross profit (39.157.265) (12.176.997)
Amortisation 8.784.346 3.285.245 Operating profit (30.372.919) (8.891.752)
Fiancing income (23.393.525) 235.026 Profit before tax (53.766.444) (8.656.726)
Deferred tax 8.971.151 690.547
Net profit for the year (44.795.293) (7.966.179)
Impact on consolidated EBITDA (39.157.265) (12.176.997) Foreign currency transactions Transactions in foreign currencies during the periods have been translated at the exchange rates prevailing at the dates of these transactions. Financial position items denominated in foreign currencies have been translated at the exchange rates prevailing at the financial position dates. Exchange gains or losses arising from settlement and translation of foreign currency items have been included in the financing income or expense accounts as appropriate.
As of the financial position dates, the major foreign exchange rates used by the Company and its subsidiaries established in Turkey against Turkish Lira are given below:
2011 2010 USD 1,8889 1,5460 EUR 2,4438 2,0491
Property, plant and equipment Property, plant and equipment held for use in the production or supply of goods or services, or for administrative purposes, are stated in the financial position at cost less accumulated depreciation and any impairment in value.
The carrying values of property, plant and equipment are reviewed for impairment when events or changes in circumstances indicate the carrying value may not be recoverable. If any such indication exists and where the carrying values exceed the estimated recoverable amount, the assets or cash-generating units are written down to their recoverable amount. The recoverable amount of property, plant and equipment is the greater of net selling price and value in use. In assessing value in use, the estimated future cash flows are discounted to their present value using a pre-tax discount rate that reflects current market assessments of the time value of money and the risks specific to the asset. For an asset that does not generate largely independent cash inflows, the recoverable amount is determined for the cash-generating unit to which the asset belongs.
ÇALIK HOLDİNG A.Ş.
NOTES TO CONSOLIDATED FINANCIAL STATEMENTS
FOR THE YEAR ENDED 31 DECEMBER 2011
(Currency shown in thousands of US Dollars (USD) unless otherwise indicated.)

110
ÇALIK HOLDİNG A.Ş. NOTES TO CONSOLIDATED FINANCIAL STATEMENTS
FOR THE YEAR ENDED 31 DECEMBER 2011
(Currency shown in thousands of US Dollars ("USD") unless otherwise indicated.)
27
Property, plant and equipment in the course of construction for production, rental or administrative purposes, or for purposes not yet determined, are carried at cost, less any identified impairment loss. Cost includes professional fees and, for qualifying assets, borrowing costs capitalized in accordance with the Company’s accounting policy. Depreciation of these assets, on the same basis as other property assets, commences when the assets are ready for their intended use.
Depreciation is charged so as to write off the cost or valuation of assets, other than land and properties under construction, over their estimated useful lives, using the straight-line basis over the following years stated below: Year Land improvements 5-50 Buildings 5-50 Plant 9-50 Machinery and equipment 5-20 Furniture and fixtures 3-50 Motor vehicles 4-20 Leasehold improvements 3-10
The gain or loss arising on the disposal or retirement of an asset is determined as the difference between the sales proceeds and the carrying amount of the asset and is recognised in the consolidated income statement.
Leasing
The Group as lessee Assets held under finance leases are recognised as assets of the Group at their fair value at the date of acquisition. The corresponding liability to the company is included in the financial position as a finance lease obligation. Finance costs, which represent the difference between the total leasing commitments and the fair value of the assets acquired, are charged to the consolidated income statement over the term of the relevant lease so as to produce a constant periodic rate of interest on the remaining balance of the liability for each accounting period.
All other leases are treated as operating leases. Payments on operating lease agreements are recognised as an expense on a straight-line basis. Associated costs, such as maintenance and insurance, are expensed as incurred.
Capitalized leased assets are depreciated in accordance with the depreciation policy noted above.
Goodwill Goodwill arising on consolidation represents the excess of the cost of acquisition over the Group’s interest in the fair value of the identifiable assets and liabilities of companies acquired at the date of acquisition. Goodwill is initially recognised as an asset at cost and is subsequently measured at cost less any accumulated impairment losses. For the purpose of impairment testing, goodwill is allocated to each of the Group’s cash-generating units expected to benefit from the synergies of the combination. Cash-generating units to which goodwill has been allocated are tested for impairment annually, or more frequently when there is an indication that the unit may be impaired. If the recoverable amount of the cash-generating unit is less than the carrying amount of the unit, the impairment loss is allocated first to reduce the carrying amount of any goodwill allocated to the unit and then to the other assets of the unit pro-rata on the basis of the carrying amount of each asset in the unit. Goodwill arising on the acquisition of subsidiaries is presented in intangible assets in the financial position:
On disposal of a subsidiary, the attributable amount of unamortised goodwill is included in the determination of the profit or loss on disposal.
Intangible assets Intangible assets are capitalized and amortised on a straight-line basis over their estimated useful life, not exceeding a period of 15 years except payments to acquire hydroelectric power plant licenses, electricity distribution licenses, wind energy plant licences and mineral prospecting and mining licence accounted under rights at 49, 25 and 30 years, respectively.
ÇALIK HOLDİNG A.Ş.
NOTES TO CONSOLIDATED FINANCIAL STATEMENTS
FOR THE YEAR ENDED 31 DECEMBER 2011
(Currency shown in thousands of US Dollars (USD) unless otherwise indicated.)

111
ÇALIK HOLDİNG A.Ş. NOTES TO CONSOLIDATED FINANCIAL STATEMENTS
FOR THE YEAR ENDED 31 DECEMBER 2011
(Currency shown in thousands of US Dollars ("USD") unless otherwise indicated.)
28
Equity investments Equity investments are initially recognised at cost and include acquisition charges associated with the investments less any impairment in value, being the fair value of the consideration given. Investment in associate Associates are those entities over which the Group is able to exert significant influence but which are neither subsidiaries nor interests in a joint venture. Investments in associates are initially recognized at cost and subsequently accounted for using the equity method.
Acquired investments in associates are also subject to purchase accounting. However, any goodwill or fair value adjustment attributable to the share in the associate is included in the amount recognized as investment in associates.
All subsequent changes to the share of interest in the equity of the associate are recognized in the Group’s carrying amount of the investment. Changes resulting from the profit or loss generated by the associate are charged against “results from equity investments” in the Group’s consolidated statement of income and therefore affect net results of the Group. Financial instruments
Classification Loans and receivables are created by the Banking Group providing money to a debtor. Originated loans and receivables comprise loans and advances to customers and credit institutions.
Held-to-maturity assets are financial assets with fixed or determinable payments and fixed maturity that the Banking Group has the intent and ability to hold to maturity.
Measurement Financial instruments are measured initially at cost, including transaction costs. Subsequent to initial recognition all non-trading financial liabilities, loans and receivables and held-to-maturity assets are measured at amortised cost less impairment losses. Amortised cost is calculated on the effective interest rate method. Premiums and discounts, including initial transaction costs, are included in the carrying amount of the related instrument and amortised to income through interest income in the income statement based on the effective interest rate of the instrument, when applicable.
Specific instruments Placements and balances with banks Placements and balances with banks include inter-bank placements and current account balances.
Treasury bills available-for-sale Treasury bills available-for-sale after initial recognition is re-measured at fair value. Gains and losses arising from change in the fair value of such available-for-sale investments are recognised directly in equity. The total amount of the available-for-sale portfolio is not exceeding 1% of the total held-to-maturity portfolio of Treasury Bills.
Treasury bills held-to-maturity Treasury bills are considered to be investments held-to-maturity as the Group has the intent and ability to do so.
Investment securities available-for-sale Investment securities available-for-sale after initial recognition is re-measured at fair value. Gains and losses arising from change in the fair value of such available-for-sale investments are recognised directly in equity. Investment securities held-to-maturity Investment securities held-to-maturity, are debt investments that the Group has the intent and ability to hold to maturity. As a result they are classified as held-to-maturity assets.
Loans and advances to customers Loans and advances originated by the Banking Group are classified as loans and receivables. Loans and advances are reported net of provisions for loan losses to reflect the estimated recoverable amounts.
ÇALIK HOLDİNG A.Ş.
NOTES TO CONSOLIDATED FINANCIAL STATEMENTS
FOR THE YEAR ENDED 31 DECEMBER 2011
(Currency shown in thousands of US Dollars (USD) unless otherwise indicated.)

112
ÇALIK HOLDİNG A.Ş. NOTES TO CONSOLIDATED FINANCIAL STATEMENTS
FOR THE YEAR ENDED 31 DECEMBER 2011
(Currency shown in thousands of US Dollars ("USD") unless otherwise indicated.)
29
Recognition and derecognition of financial instruments The Company recognizes a financial asset or financial liability in its financial position when and only when it becomes a party to the contractual provisions of the instrument. The Company derecognizes a financial asset or a portion of a financial asset when and only when it loses control of the contractual rights that comprise the financial asset or a portion of a financial asset or when a financial asset or a portion of a financial asset expires. The Company derecognizes a financial liability when and only when a liability is extinguished and that is when the obligation specified in the contract is discharged, cancelled and expires. Trade receivables Trade receivables are measured at initial recognition at fair value, and are subsequently measured at amortized cost using the effective interest rate method to set an allowance for unearned interest. Appropriate allowances for estimated irrecoverable amounts are recognised in profit or loss when there is objective evidence that the asset is impaired. The allowance recognised is measured as the difference between the asset’s carrying amount and the present value of estimated future cash flows discounted at the effective interest rate computed at initial recognition. Trade payables Trade payables are initially measured at fair value, and are subsequently measured at amortized cost, using the effective interest rate method to set an allowance for unearned interest. Deferred billings The parts of construction projects completed by the Group and approved by the customer are billed by the Group.
Loans and advances to customers Loans and advances to customers are reported at amortized cost net of allowances to reflect the estimated recoverable amounts. An allowance for loan impairment is established if there is objective evidence that the Banking Group will not be able to collect all amounts due according to the original contractual terms. The amount of the allowance is the difference between the carrying amount and the recoverable amount, being the present value of expected cash flows, including amounts recoverable from guarantees and collateral, discounted at the original effective interest rate of loans. Expected cash flows are estimated based on previous experience of customers’ repayment history and any late payments of interest or penalties. Changes in the allowance amount are recognised in the income statement.
If in a subsequent period the amount of impairment loss decreases and the decrease can be linked objectively to an event occurring after the write down of the allowance is reversed through the income statement. Segment reporting The Group operates on seven major business segments, the textile group, the energy group, the telecommunication group, the construction group, the banking group, the marketing group and the media group. The activities undertaken by these groups are described in note 6.
Revenue and expense
Banking group Interest income and expense is recognised in the income statement as it accrues, taking into account the effective yield of the asset. Interest income and expense includes the amortisation of any discount or premium or other differences between the initial carrying amount of an interest bearing instrument and its amount at maturity calculated on an effective interest rate basis6 Construction group Revenue from customer-related long-term construction contracts is recognised by reference to the percentage of completion of the contract at the financial position date.
ÇALIK HOLDİNG A.Ş.
NOTES TO CONSOLIDATED FINANCIAL STATEMENTS
FOR THE YEAR ENDED 31 DECEMBER 2011
(Currency shown in thousands of US Dollars (USD) unless otherwise indicated.)

113
ÇALIK HOLDİNG A.Ş. NOTES TO CONSOLIDATED FINANCIAL STATEMENTS
FOR THE YEAR ENDED 31 DECEMBER 2011
(Currency shown in thousands of US Dollars ("USD") unless otherwise indicated.)
30
Media group Revenues include the invoiced value of sales of goods and services. Revenues are recognized on an accrual basis at the time deliveries or acceptances are made and risk on benefits are transferred, the amount of the revenue can be measured reliably and it is probable that the economic benefits associated with the transaction will flow to the Group, at the fair value of the consideration received or receivable. Net sales represent the invoiced value of goods shipped less sales returns and commission.
When agreement effectively constitutes a financing transaction, the fair value of the consideration is determined by discounting all future receipts using an imputed rate of interest. The difference between the fair value and the nominal amount of the consideration is recognized as interest income on a time proportion basis that takes into account the effective yield on the asset.
Revenue from advertisements is recognised in an accrual basis at the time of broadcasting or printing the advertisement in the related media at the invoiced value.
Revenues from newspapers and magazine sales are recognised on an accrual basis at the time of delivery of the newspapers by the distribution company to the dealer at the invoiced values.
Revenues from printing services Income from printing arises from printing services given to third parties other than Group companies by using Group’s printing facilities. Related income is recognised on an accrual basis at the time of services given. Other Revenue is recognised to the extent that it is probable that the economic benefits will flow to the Group and the revenue can be reliably measured. Revenue is shown net of value added and sales taxes, discounts and returns. Revenue from the rendering of services is recognised by reference to the stage of completion of the transaction when the following conditions are met: the amount of revenue can be measured reliably, the flow of economic benefits to the entity is probable, the stage of completion at the period end can be measured reliably and the costs incurred to date can be measured reliably.
Revenue for services provided initially is measured at the fair value of the consideration receivable. Expenses is included in operating expenses at cost unless the expense was permitted or required to be included in the financial statements on another basis. Cost is the fair value of the consideration given for the materials or services used in the production of goods or provision of services. Cost of sales is presented as a separate line item on the face of the income statement for the functional analysis of expenditures is chosen for the format of the income statement. Repurchase agreements Securities purchased from the Central Bank under agreements to resell (‘reverse repos’) within a short period of time (usually 1 week) are recorded as amounts due from the Central Bank. The difference between the sale and repurchase price is treated as interest and accrued over the life of the repo agreements using the effective yield method. Taxation Income tax on the profit or loss for the year comprises current and deferred tax. Income tax is recognised in the statement of income and expenditures except to the extent that it relates to items recognised directly to equity, in which case it is recognised in equity.
Current tax is the expected tax payable on the taxable income for the year, using tax rates enacted at the financial position date, and any adjustment to tax payable in respect of previous years.
Deferred tax is provided using the financial position liability method, providing for temporary differences between the carrying amounts of assets and liabilities for financial reporting purposes and the amounts used for taxation purposes. The amount of deferred tax provided is based on the expected manner of realization or settlement of the carrying amount of assets and liabilities, using tax rates enacted or substantially enacted at the financial position date.
ÇALIK HOLDİNG A.Ş.
NOTES TO CONSOLIDATED FINANCIAL STATEMENTS
FOR THE YEAR ENDED 31 DECEMBER 2011
(Currency shown in thousands of US Dollars (USD) unless otherwise indicated.)

114
ÇALIK HOLDİNG A.Ş. NOTES TO CONSOLIDATED FINANCIAL STATEMENTS
FOR THE YEAR ENDED 31 DECEMBER 2011
(Currency shown in thousands of US Dollars ("USD") unless otherwise indicated.)
31
A deferred tax asset is recognised only to the extent that it is probable that future taxable profits will be available against which the asset can be utilised. Deferred tax assets are reduced to the extent that it is no longer probable that the related tax benefit will be realised. Borrowing cost Borrowing costs directly attributable to the acquisition, construction or production of qualifying assets, which are assets that necessarily take a substantial period of time to get ready for their intended use or sale, are added to the cost of those assets, until such time as the assets are substantially ready for their intended use or sale. Investment income earned on the temporary investment of specific borrowings pending their expenditure on qualifying assets is deducted from the cost of those assets. All other borrowing costs are recognised in net profit or loss in the period in which they are incurred. Bank borrowings Interest-bearing bank loans and overdrafts are recorded at the proceeds received, net of direct issue costs. Finance charges, including premiums payable on settlement or redemption, are accounted for on an accrual basis and are added to the carrying amount of the instrument to the extent that they are not settled in the period in which they arise. Inventories Inventories are stated at the lower of cost and net realizable value. Costs comprise direct materials and, where applicable, direct labour costs and those overheads that have been incurred in bringing the inventories to their present location and condition but exclude borrowing cost. Cost is calculated by using the weighted average method. Net realizable value represents the estimated selling price less all estimated costs to completion and costs to be incurred in marketing, selling and distribution. Impairment The carrying amounts of the Group’s assets are reviewed at each financial position date to determine whether any indication of impairment exists. If any such indication exists, the asset’s recoverable amount is estimated and an impairment loss is recognised in the income statement whenever the carrying amount of the asset exceeds its recoverable amount. Related parties Parties are considered to be related if one party has the ability to control the other party or exercise significant influence over the other party in making the financial and operating decisions. For the purpose of these financial statements shareholders are referred to as related parties. Related parties also include individuals that are principle owners, management and members of the Company's Board of Directors and their families (note 36). Employee termination benefits Under the Turkish Labour Law, the Company and its subsidiaries established in Turkey are required to pay termination benefits to each employee who has completed one year of service and whose employment is terminated without due cause, or who retires in accordance with social insurance regulations or is called up for military service or dies. Such payments are calculated on the basis of 30 days’ pay limited to a maximum of TL2.731,85 (2010: TL 2.517,01) per year of employment at the rate of pay applicable at the date of retirement and discounted to present value at the financial position date by using average market yield, expected inflation rates and an appropriate discount rate.
The bank in Albania has created a fully employer-sponsored pension plan during 2002. The amount to be charged to this fund is decided upon at the beginning of the year as 5% of budgeted personnel expenses. During the year, the amount accrued is charged to the income statement and to the fund on a monthly basis. The amount due to employees based on the above plan will be grossed up by the interest that will accrue from the date the employees leave the Bank until their retirement.
The telecommunication company in Albania makes no provision and has no obligation for employee pensions over and above the contributions paid into the State- pension scheme.
The subsidiaries in Turkmenistan contribute to the Turkmenistan state-pension on behalf of its employees. The contributions are expensed as incurred.
ÇALIK HOLDİNG A.Ş.
NOTES TO CONSOLIDATED FINANCIAL STATEMENTS
FOR THE YEAR ENDED 31 DECEMBER 2011
(Currency shown in thousands of US Dollars (USD) unless otherwise indicated.)

115
ÇALIK HOLDİNG A.Ş. NOTES TO CONSOLIDATED FINANCIAL STATEMENTS
FOR THE YEAR ENDED 31 DECEMBER 2011
(Currency shown in thousands of US Dollars ("USD") unless otherwise indicated.)
32
Provisions Provisions are recognised when the Group has a present obligation (legal or constructive) as a result of a past event, it is probable that an outflow of resources embodying economic benefits will be required to settle the obligation and a reliable estimate can be made of the amount of the obligation. Where the Group expects a provision to be reimbursed, for example under an insurance contract, the reimbursement is recognised as a separate asset but only when the reimbursement is virtually certain.
Commitments and contingencies Transactions that may give rise to contingencies and commitments are those where the outcome and the performance of which will be ultimately confirmed only on the occurrence or non-occurrence of certain future events, unless the expected performance is not very likely. Accordingly, contingent losses are recognised in the financial statements if a reasonable estimate of the amount of the resulting loss can be made. Contingent gains are reflected only if it is probable that the gain will be realized.
Cash and cash equivalents For the purpose of the cash flow statement, cash and cash equivalents comprise cash in hand, deposits with banks with the original maturity of three months or less.
ÇALIK HOLDİNG A.Ş.
NOTES TO CONSOLIDATED FINANCIAL STATEMENTS
FOR THE YEAR ENDED 31 DECEMBER 2011
(Currency shown in thousands of US Dollars (USD) unless otherwise indicated.)

116
ÇALIK HOLDİNG A.Ş. NOTES TO CONSOLIDATED FINANCIAL STATEMENTS
FOR THE YEAR ENDED 31 DECEMBER 2011
(Currency shown in thousands of US Dollars ("USD") unless otherwise indicated.)
33
4. INTEREST IN JOINT VENTURE The aggregate amounts of assets, liabilities and profit (loss) of Gap İnşaat Aina, a 50% joint venture, are proportionately consolidated in the accompanying financial statements. These summarised as follows:
2011 2010 Current assets 2.492 2.930 Non-current assets 698 899 3.190 3.829 Current liabilities 180 599 Equity 3.010 3.230 3.190 3.829
2011 2010 Total revenue -- -- Operating profit, net (249) (508) Profit for the year, net (249) (508)
ÇALIK HOLDİNG A.Ş.
NOTES TO CONSOLIDATED FINANCIAL STATEMENTS
FOR THE YEAR ENDED 31 DECEMBER 2011
(Currency shown in thousands of US Dollars (USD) unless otherwise indicated.)

117
ÇALIK HOLDİNG A.Ş. NOTES TO CONSOLIDATED FINANCIAL STATEMENTS
FOR THE YEAR ENDED 31 DECEMBER 2011
(Currency shown in thousands of US Dollars ("USD") unless otherwise indicated.)
34
5. BUSINESS COMBINATIONS Consolidated subsidiary as from 01.01.2011 In the preceding financial statements for the year ended 31.12.2010, Çalık Turizm Kültür İnşaat Sanayi ve Ticaret A.Ş., was not consolidated due to the fact that it was deemed to be immaterial individually and in aggregate to the results and financial position of Group. In the current year financial statements the Group consolidated Çalık Turizm Kültür İnşaat Sanayi ve Ticaret A.Ş. on the grounds that it became active and material individually and in aggregate to the results and financial position of Group. As the effect of not consolidating Çalık Turizm Kültür İnşaat Sanayi ve Ticaret A.Ş. in the comparative financial statements was not material, the Group did not restate prior year financial statements and presented the cumulative effect thousand of USD 35.108 on the opening general reserve on 01.01.2011 in the statement of equity. The balance sheet items of Çalık Turizm Kültür İnşaat Sanayi ve Ticaret A.Ş. as of 31.12.2010 are set out below for further 31.12.2010
Other assets 389Investments 86.453
Total assets 86.842
Bank borrowings 36.834Other liabilities 33.763
Total liabilities 70.597
Paid in capital 51.353 Retained earnings (35.108)
Total equity 16.245
Total liabilities and equity 86.842
ÇALIK HOLDİNG A.Ş.
NOTES TO CONSOLIDATED FINANCIAL STATEMENTS
FOR THE YEAR ENDED 31 DECEMBER 2011
(Currency shown in thousands of US Dollars (USD) unless otherwise indicated.)

118
ÇALIK HOLDİNG A.Ş. NOTES TO CONSOLIDATED FINANCIAL STATEMENTS
FOR THE YEAR ENDED 31 DECEMBER 2011
(Currency shown in thousands of US Dollars ("USD") unless otherwise indicated.)
35
6. SEGMENT REPORTING
Group is organised into seven business segments. The basis on which the Group reports its segment information is as follows:
Textile Manufacture and sale of textile goods.
Energy Electricity production, distribution, and power plant construction, oil and natural gas exploration (drilling), extraction and distribution.
Telecommunication Provide related infrastructure for GSM mobile phone services in Turkey and in operate fixed telephony and GSM mobile services in Albania.
Construction Construction and contracting projects.
Banking Operates a commercial bank in Albania and an investment bank in Turkey.
Media TV broadcasting, newspaper publishing and magazine distribution activities in Turkey
Marketing This segment mainly acts as a supply agent for Çalık Group. The segment procures goods needed by the factories managed by Çalık Group and for projects undertaken by the contractor company from Turkey or off international markets.
Other group operations mainly comprise the sale of services and neither of these constitutes a separately reportable segment and therefore reported in marketing activities.
ÇALIK HOLDİNG A.Ş.
NOTES TO CONSOLIDATED FINANCIAL STATEMENTS
FOR THE YEAR ENDED 31 DECEMBER 2011
(Currency shown in thousands of US Dollars (USD) unless otherwise indicated.)

119
ÇALIK HOLDİNG A.Ş. NOTES TO CONSOLIDATED FINANCIAL STATEMENTS
FOR THE YEAR ENDED 31 DECEMBER 2011
(Currency shown in thousands of US Dollars ("USD") unless otherwise indicated.)
36
(a) Primary reporting format - business segment As of the financial position dates, the segment assets and liabilities are as follows:
Assets 2011 2010 Textile 202.175 240.018 Energy 899.586 1.099.888 Telecommunication 430.292 472.036 Construction 825.267 612.597 Banking 3.223.234 2.467.274 Media 1.080.819 1.258.795 Marketing and other 1.899.829 1.375.510 8.561.202 7.526.118 Less : Inter-company eliminations (2.156.636) (1.711.559) Total assets 6.404.566 5.814.559
Liabilities
Textile 103.895 120.951 Energy 591.518 658.841 Telecommunication 194.131 214.905 Construction 574.105 470.441 Banking 2.944.495 2.253.681 Media 1.054.763 1.020.129 Marketing and other 1.144.685 785.279 6.607.592 5.524.227 Less : Inter-company eliminations (1.147.877) (823.330) Total liabilities 5.459.715 4.700.897
As of the financial position dates, segmental capital expenditure is as follows:
Textile 2.105 3.941 Energy 24.774 11.991 Telecommunication 29.653 21.547 Construction 14.610 14.115 Banking 11.928 8.411 Media 18.141 13.067 Marketing and other 37.527 18.439 138.738 91.511
ÇALIK HOLDİNG A.Ş.
NOTES TO CONSOLIDATED FINANCIAL STATEMENTS
FOR THE YEAR ENDED 31 DECEMBER 2011
(Currency shown in thousands of US Dollars (USD) unless otherwise indicated.)

120
37
Ç
ALI
K H
OLD
İNG
A.Ş
. N
OTE
S TO
CO
NSO
LID
ATE
D F
INA
NC
IAL
STA
TEM
ENTS
FO
R T
HE
YEA
R E
ND
ED 3
1 D
ECEM
BER
201
1
(Cur
renc
y sh
own
in th
ousa
nds o
f US
Dol
lars
("U
SD")
unl
ess o
ther
wise
indi
cate
d.)
Th
e seg
men
t res
ults
for t
he y
ear e
nded
31
Dec
embe
r 201
1 ar
e as f
ollo
ws:
2011
Te
xtile
En
ergy
Te
lecom
mun
icatio
n C
onstr
uctio
n Ba
nkin
g M
edia
M
arke
ting
and
oth
er
Inte
r-co
mpa
ny
elim
inat
ions
To
tal
Reve
nue
204.
543
1.13
6.45
1 14
0.00
8 32
8.60
7 32
9.95
9 59
9.95
3 22
1.45
7 (6
7.49
1)
2.89
3.48
7 Co
st of
sales
(1
52.9
42)
(988
.014
) (6
8.09
5)
(240
.066
) (1
26.3
62)
(481
.541
) (1
63.4
91)
42.2
89
(2.1
78.2
22)
Gro
ss p
rofit
51
.601
14
8.43
7 71
.913
88
.541
20
3.59
7 11
8.41
2 57
.966
(2
5.20
2)
715.
265
Ope
ratin
g ex
pens
es
(26.
931)
(1
00.6
47)
(56.
717)
(1
1.21
5)
(77.
176)
(9
1.15
2)
(33.
021)
5.
911
(390
.948
)
In
com
e fro
m o
pera
tions
24
.670
47
.790
15
.196
77
.326
12
6.42
1 27
.260
24
.945
(1
9.29
1)
324.
317
Lo
ss fr
om in
vestm
ent i
n as
socia
te (5
.454
) --
-- --
-- --
-- --
(5.4
54)
Oth
er in
com
e (e
xpen
se),
net
(4.6
05)
3.24
4 16
4 14
7 (1
2.45
4)
(1.8
24)
1.73
5 8.
264
(5.3
29)
Prof
it on
sale
of i
nves
tmen
t --
5.97
5 --
-- --
-- --
-- 5.
975
Fair
valu
e ga
in o
n fin
ancia
l ass
ets
-- --
-- --
-- --
251.
457
-- 25
1.45
7 Fi
nanc
ing
inco
me (
expe
nse)
, net
(1.9
61)
(72.
909)
(7
.443
) (4
6.29
5)
(22.
925)
(2
17.1
71)
(79.
842)
11
.027
(4
37.5
19)
Inco
me (
loss
) be
fore
taxa
tion
12.6
50
(15.
900)
7.
917
31.1
78
91.0
42
(191
.735
) 19
8.29
5 --
133.
447
Ta
x pr
ovisi
on
(5.0
75)
(13.
672)
(2
.344
) (1
.527
) (1
8.38
8)
(6.5
52)
(13.
779)
--
(61.
337)
Pr
ofit
(loss
) for
the p
erio
d fr
om co
ntin
uing
ope
ratio
ns
7.57
5 (2
9.57
2)
5.57
3 29
.651
72
.654
(1
98.2
87)
184.
516
-- 72
.110
Disc
ontin
ued
oper
atio
ns
Pr
ofit
for t
he p
erio
d fro
m d
iscon
tinue
d op
erat
ions
--
217
-- --
-- --
-- --
217
Net
pro
fit (l
oss)
for t
he p
erio
d 7.
575
(29.
355)
5.
573
29.6
51
72.6
54
(198
.287
) 18
4.51
6 --
72.3
27
Non
-con
trolli
ng in
teres
t 56
11
5 4.
191
573
337
(81.
502)
55
0 --
(75.
680)
Dep
recia
tion
expe
nse a
nd a
mor
tisat
ion
char
ge
10.3
57
13.7
88
22.9
03
4.97
7 7.
156
21.3
86
8.65
6 --
89.2
23
ÇALIK HOLDİNG A.Ş.
NOTES TO CONSOLIDATED FINANCIAL STATEMENTS
FOR THE YEAR ENDED 31 DECEMBER 2011
(Currency shown in thousands of US Dollars (USD) unless otherwise indicated.)

121
ÇA
LIK
HO
LDİN
G A
.Ş.
NO
TES
TO C
ON
SOLI
DA
TED
FIN
AN
CIA
L ST
ATE
MEN
TS
FOR
TH
E Y
EAR
EN
DED
31
DEC
EMBE
R 2
011
(C
urre
ncy
show
n in
thou
sand
s of U
S D
olla
rs ("
USD
") u
nles
s oth
erw
ise in
dica
ted.
)
38
The s
egm
ent r
esul
ts fo
r the
year
ende
d 31
Dec
embe
r 201
0 ar
e as f
ollo
ws:
2010
Te
xtile
En
ergy
Te
lecom
mun
icatio
n C
onstr
uctio
n Ba
nkin
g M
edia
M
arke
ting
and
oth
er
Inte
r-co
mpa
ny
elim
inat
ions
To
tal
Reve
nue
191.
123
666.
054
142.
458
186.
668
185.
662
676.
842
209.
485
(134
.616
) 2.
123.
676
Cost
of sa
les
(156
.743
) (6
06.6
16)
(64.
391)
(1
50.0
38)
(74.
017)
(5
20.8
93)
(172
.389
) 10
4.79
9 (1
.640
.288
)
G
ross
pro
fit
34.3
80
59.4
38
78.0
67
36.6
30
111.
645
155.
949
37.0
96
(29.
817)
48
3.38
8 O
pera
ting
expe
nses
(2
9.08
0)
(37.
347)
(5
0.78
6)
(8.8
76)
(65.
640)
(8
9.77
4)
(33.
188)
18
.455
(2
96.2
36)
Inco
me f
rom
ope
ratio
ns
5.30
0 22
.091
27
.281
27
.754
46
.005
66
.175
3.
908
(11.
362)
18
7.15
2
Lo
ss fr
om in
vestm
ent i
n as
socia
te (1
4.21
3)
--
--
--
--
--
--
--
(14.
213)
O
ther
inco
me
(exp
ense
), ne
t (7
.661
) (1
.566
) (5
.066
) (2
1.18
7)
(13.
701)
(4
65)
4.79
2 2.
094
(42.
760)
Fi
nanc
ing
inco
me (
expe
nse)
, net
(2.6
41)
32.5
73
(10.
282)
(3
.913
) (4
.705
) (8
2.37
1)
(40.
877)
9.
268
(102
.948
)
In
com
e (lo
ss)
befo
re ta
xatio
n (1
9.21
5)
53.0
98
11.9
33
2.65
4 27
.599
(1
6.66
1)
(32.
177)
--
27.2
31
Ta
x pr
ovisi
on
(459
) (1
.164
) (1
.895
) 25
8 (5
.630
) 1.
344
409
--
(7.1
37)
Prof
it (lo
ss) f
or th
e per
iod
from
cont
inui
ng
oper
atio
ns
(19.
674)
51
.934
10
.038
2.
912
21.9
69
(15.
317)
(3
1.76
8)
-- 20
.094
Disc
ontin
ued
oper
atio
ns
Pr
ofit
for t
he p
erio
d fro
m d
iscon
tinue
d op
erat
ions
--
840
-- --
-- --
-- --
840
Net
pro
fit (l
oss)
for t
he p
erio
d (1
9.67
4)
52.7
74
10.0
38
2.91
2 21
.969
(1
5.31
7)
(31.
768)
--
20.9
34
Non
-con
trolli
ng in
teres
t (4
0)
(1.0
20)
5.65
9 17
7 25
1 23
.047
53
9 --
28.6
13
Dep
recia
tion
expe
nse a
nd a
mor
tisat
ion
char
ge
12.3
73
3.56
1 19
.470
4.
220
5.96
9 21
.066
9.
784
-- 76
.443
ÇALIK HOLDİNG A.Ş.
NOTES TO CONSOLIDATED FINANCIAL STATEMENTS
FOR THE YEAR ENDED 31 DECEMBER 2011
(Currency shown in thousands of US Dollars (USD) unless otherwise indicated.)

122
ÇALIK HOLDİNG A.Ş. NOTES TO CONSOLIDATED FINANCIAL STATEMENTS
FOR THE YEAR ENDED 31 DECEMBER 2011
(Currency shown in thousands of US Dollars (“USD”) unless otherwise indicated.)
39
(b) Secondary reporting format - geographical segments The Group’s seven business segments operate in three main geographical areas through they are managed on a worldwide basis. Revenue is allocated based on the country in which the customer is located.
2011 2010 Revenue Currency zone TL 1.644.400 911.001 USD 376.431 590.802 LEK 279.334 249.857 Other 593.322 372.016
2.893.487 2.123.676
Total assets are allocated based on where the assets are located. Total assets Currency zone TL 3.636.732 3.242.077 USD 274.798 469.639 LEK 2.209.955 1.878.919 Other 283.081 223.924
6.404.566 5.814.559
Capital expenditure is allocated based on where the assets are located. Capital expenditure Currency zone TL 86.412 65.103 USD 4 9 LEK 37.336 24.545 Other 14.986 1.854
138.738 91.511
ÇALIK HOLDİNG A.Ş.
NOTES TO CONSOLIDATED FINANCIAL STATEMENTS
FOR THE YEAR ENDED 31 DECEMBER 2011
(Currency shown in thousands of US Dollars (USD) unless otherwise indicated.)

123
ÇALIK HOLDİNG A.Ş. NOTES TO CONSOLIDATED FINANCIAL STATEMENTS
FOR THE YEAR ENDED 31 DECEMBER 2011
(Currency shown in thousands of US Dollars (“USD”) unless otherwise indicated.)
40
7. CASH AND BALANCES WITH CENTRAL BANK
2011 2010 Cash in hand 32.321 29.631 Cash at banks - Demand deposit 56.011 28.896 - Time deposit 16.415 25.338 - Blocked accounts 19.585 14.973 - Treasury bills 185 11.647 124.517 110.485 Reserve deposits at central banks Turkish Republic 180.640 72.642 Albania 149.149 137.359 329.789 210.001 Other 733 19.594 455.039 340.080 As of 31 December 2011, interest rate for time deposit is 0,50% and 5,0% (31.12.2010: 0,2% and 5,7%) per year for foreign currency and between 3,75% and 11,0% (31.12.2010: 1,50% and 9,01%) per year for TL. In accordance with the Bank of Albania’s requirement relating to the deposit reserve, the Bank should maintain a minimum of 10% of customer deposits with the Bank of Albania as a statutory reserve account, which during the month can be decreased up to 60% of its level, provided that the monthly average is obtained.
8. PLACEMENTS AND BALANCES WITH BANKS Placements 112.480 227.867 Cash collaterals held by correspondent banks 1.991 1.012 Current accounts 10.594 3.110 125.065 231.989
Placements are held with non-resident banks from Organisation for Economic Cooperation and Development (“OECD”) countries and have contractual maturities up to 1 year. Current accounts represent balances with correspondent banks in the OECD countries.
Cash collateral represents mostly collateral held by financial institutions in relation with some margin trading accounts or by the correspondent banks against letters of credit issued to the Bank’s clients and cash deposits, which secure risks that are related to the credit cards activity of the Bank.
ÇALIK HOLDİNG A.Ş.
NOTES TO CONSOLIDATED FINANCIAL STATEMENTS
FOR THE YEAR ENDED 31 DECEMBER 2011
(Currency shown in thousands of US Dollars (USD) unless otherwise indicated.)

124
ÇALIK HOLDİNG A.Ş. NOTES TO CONSOLIDATED FINANCIAL STATEMENTS
FOR THE YEAR ENDED 31 DECEMBER 2011
(Currency shown in thousands of US Dollars (“USD”) unless otherwise indicated.)
41
9. INVESTMENT SECURITIES
2011 2010 Current Treasury bills held-to-maturity 40.345 84.226 Treasury bills available-for-sale 169.380 94.658 Investment securities available-for-sale 392.325 352.217 Investment securities held-to-maturity 290.918 282.813 Investment securities at fair value through profit or loss 235.328 -- 1.128.296 813.914 Treasury bills denominated in Lek earn interest at rates ranging from 6.78% p.a. to 8.74% p.a. (2010: from 6.70% p.a. to 9.93% p.a.) on a compound basis and are all denominated in Lek. As of the balance sheet dates, treasury bills held-to-maturity are presented as follows:
Treasury bills held-to-maturity 3 months 572 -- 6 months -- 3.464 12 months 39.773 80.762 40.345 84.226 As of the balance sheet dates, treasury bills available-for-sale are presented as follows:
Investment securities available-for-sale 6 months 112 119 12 months 169.268 94.539 169.380 94.658 As of the balance sheet dates, investment securities available-for-sale are presented as follows:
TL denominated bonds 259.862 250.503 LEK denominated bonds 64.601 15.778 USD denominated bonds 22.905 20.589 EUR denominated bonds 44.957 52.837 GBP denominated bonds -- 12.510
392.325 352.217 As of the balance sheet dates, investment securities available-for-sale are presented as follows:
LEK denominated bonds 201.558 212.813 USD denominated bonds 37.843 30.388 EUR denominated bonds 51.517 39.612
290.918 282.813
ÇALIK HOLDİNG A.Ş.
NOTES TO CONSOLIDATED FINANCIAL STATEMENTS
FOR THE YEAR ENDED 31 DECEMBER 2011
(Currency shown in thousands of US Dollars (USD) unless otherwise indicated.)

125
ÇALIK HOLDİNG A.Ş. NOTES TO CONSOLIDATED FINANCIAL STATEMENTS
FOR THE YEAR ENDED 31 DECEMBER 2011
(Currency shown in thousands of US Dollars (“USD”) unless otherwise indicated.)
42
Investment securities at fair value through profit or loss (FVTPL) 2011
Carrying amount at 01 January --
Reclassification 13.012 Change in fair value 251.457 Translation difference: (29.141)
Carrying amount at 31 December 235.328 Investment securities at FVTPL includes unlisted securities of which the fair value is determined in accordance with an independent valuer’ s report. The valuation technique is based on Discounted Cash Flow Analysis (DCFA). All differences resulting from fair value gain or losses are recognised in profit or loss under “Fair value gain on financial assets at fair value through profit or loss” as a separate item in the statements of income.
10. DUE FROM SERVICES CONCESSION AGREEMENTS 2011 2010
Short-term due from services concession agreements 30.203 32.742 Overdue or invoiced services concession agreements -- --
Total short-term due from services concession agreements 30.203 32.742
Total long-term due from services concession agreements 88.343 110.928
Total due from services concession agreements 118.546 143.670 Gross due from services concession agreements 140.966 148.612 Unearned financial income (-) (22.420) (4.942) Due from services concession agreements, net 118.546 143.670
ÇALIK HOLDİNG A.Ş.
NOTES TO CONSOLIDATED FINANCIAL STATEMENTS
FOR THE YEAR ENDED 31 DECEMBER 2011
(Currency shown in thousands of US Dollars (USD) unless otherwise indicated.)

126
ÇALIK HOLDİNG A.Ş. NOTES TO CONSOLIDATED FINANCIAL STATEMENTS
FOR THE YEAR ENDED 31 DECEMBER 2011
(Currency shown in thousands of US Dollars (“USD”) unless otherwise indicated.)
43
As of 31 December 2011, payment schedule for gross and net due from service agreements are shown below: Due from services concession agreements, gross 2011 2010
2011 -- 33.524 2012 31.629 29.150 2013 26.780 23.958 2014 17.126 12.886 2015 and upcoming years 65.431 49.094
140.966 148.612 Due from services concession agreements, net
2011 -- 32.742
2012 30.203 27.852 2013 23.441 22.512 2014 14.130 12.308 2015 and upcoming years 50.772 48.256
118.546 143.670 The movement of due from service concession agreements is given below: 2010 Opening Additions Amotisations Impairment Reclass Other Translation Closing
Short-term 35.952 -- (8.678) -- 6.336 -- (868) 32.742 Long-term 88.738 29.644 -- 1.940 (6.336) -- (3.061) 110.928
Total 124.690 29.644 (8.678) 1.940 -- -- (3.929) 143.670 2011 Opening Additions Amotisations Impairment Reclass Other Translation Closing
Short-term 32.742 -- -- -- 3.851 -- (6.390) 30.203 Long-term 110.928 58.521 (35.679) (25.360) (3.851) 3.599 (19.815) 88.343
Total 143.670 58.521 (35.679) (25.360) -- 3.599 (26.205) 118.546
ÇALIK HOLDİNG A.Ş.
NOTES TO CONSOLIDATED FINANCIAL STATEMENTS
FOR THE YEAR ENDED 31 DECEMBER 2011
(Currency shown in thousands of US Dollars (USD) unless otherwise indicated.)

127
ÇALIK HOLDİNG A.Ş. NOTES TO CONSOLIDATED FINANCIAL STATEMENTS
FOR THE YEAR ENDED 31 DECEMBER 2011
(Currency shown in thousands of US Dollars (“USD”) unless otherwise indicated.)
44
11. CAPITAL EQUIVALENCY DEPOSIT Capital equivalency deposit represent the amount of USD 11.759 (31.12.2010 :USD 12.348) transferred in favour of the Central Banking Authority of Kosovo, as a minimum required capital necessary to be blocked in order to obtain the license for Kosovo Branch opened in 2007.
12. CONSTRUCTION CONTRACTS WORK IN PROGRESS
Billed contract receivables Advances received from construction contracts
2011 2010 2011 2010 Deferred contract cost 72.715 3.131 -- -- Continuing projects 52.099 65.649 29.978 28.266
124.814 68.780 29.978 28.266
Deferred contract cost For a number of months, Turkmenistan Government Organizations have been authorizing some of the completed parts of the various construction projects much later than the actual time of completion by the Turkmenistan Branch of the Group and therefore the Group has not been able to recognize revenue relating to these projects. The Group's management is confident that they will receive these outstanding receivables that are not yet authorized and therefore they have continued to work according to planned work schedule and as a result, the Group has incurred contract costs of USD 70.536 as of 31 December 2011 (31.12.2010: USD 856). The Group's management expects to have the remaining contract costs to be authorized by the Turkmenistan Government Organizations until 2012.
ÇALIK HOLDİNG A.Ş.
NOTES TO CONSOLIDATED FINANCIAL STATEMENTS
FOR THE YEAR ENDED 31 DECEMBER 2011
(Currency shown in thousands of US Dollars (USD) unless otherwise indicated.)

128
ÇALIK HOLDİNG A.Ş. NOTES TO CONSOLIDATED FINANCIAL STATEMENTS
FOR THE YEAR ENDED 31 DECEMBER 2011
(Currency shown in thousands of US Dollars (“USD”) unless otherwise indicated.)
45
Billed contract
receivables Deferred Billings
2011 2010 2011 2010 Building for Ministry of Energy 10.000 12.250 -- -- Residential Building-2 for Municipality of Asghabat -- 540 -- -- Residential Building-1 for Ministry of Cotton 1 and 2 -- 2.409 -- -- The Children Park “World of Turkmen Tales” Project 2.500 5.591 -- -- Residential Building-1 for Ministry of Chemistry -- 2.951 -- -- Yashlik Pulp and Paper Mill 2.632 2.632 -- -- Facility for Ministry of Defense 3.250 1.250 -- -- Building for Ministry of Healtcare and Medical Industry -- 857 -- -- Alparslan Youth Theatre Project -- 850 -- -- Tedjen Amonnium and Urea Plant -- 677 -- -- Residential Building-4 for Ministry of Textile -- 664 -- -- Residential Building-2 for Ministry of Economy -- -- -- 96 Turkmenistan Arcabil Presidental Resident Lanscape Maintanance Works. -- 489 -- -- Upgrading of Wharf Fabyard -- 61 -- -- Presidential Old Palace Renovation Project -- 328 -- -- Residential Building-1 for Ministry of Tourism and Sport -- 1.179 -- -- Onshore Gas Terminal 23.303 16.247 -- -- Facility for Ministry of Defense 2 -- 2.125 -- -- Residential Building-1 for Ministry of Healtcare and Medical Industry -- -- -- 782 Residential Building-1 for Foreign Economic Bank -- -- -- 301 Additional Tankages at OGT -- 1.035 -- -- Asghabat Library Project -- 3.750 -- -- Bayramali Transformer Substation -- 1.473 -- -- Olympic Swimming Pool -- 1.250 -- -- Kelete Cement Factory 1.000 1.000 -- -- Coton Gin Factory -- 108 -- -- Asghabat Trade Centre -- 589 -- -- Eye Diseases Hospital 2.800 -- -- 1.935 Baghdad Airport Road Project -- -- 28.938 -- Dental Hospital Project 2.026 -- -- -- Navoi TTP 4.314 3.344 1.040 22.918 Other 274 2.000 -- 2.234 Deferred contract cost 72.715 3.131 -- -- Total 124.814 68.780 29.978 28.266
ÇALIK HOLDİNG A.Ş.
NOTES TO CONSOLIDATED FINANCIAL STATEMENTS
FOR THE YEAR ENDED 31 DECEMBER 2011
(Currency shown in thousands of US Dollars (USD) unless otherwise indicated.)

129
ÇALIK HOLDİNG A.Ş. NOTES TO CONSOLIDATED FINANCIAL STATEMENTS
FOR THE YEAR ENDED 31 DECEMBER 2011
(Currency shown in thousands of US Dollars (“USD”) unless otherwise indicated.)
46
13. TRADE RECEIVABLES
2011 2010 Current Current accounts - Third parties 853.831 789.446 - Related parties, note 36 7.049 2.693 Notes receivable - Third parties 11.140 10.375 - Related parties, note 36 255 2.888 Others 6.708 14.288 878.983 819.690 Unearned interest on receivables (-) (4.932) (2.524) Allowance for doubtful receivables (-) (52.811) (56.508) 821.240 760.658
14. LOANS AND ADVANCES TO CUSTOMERS
Loans and advances to customers, gross 1.338.136 898.197 Allowance for impairment on loans and advances (-) (19.890) (15.289) Unearned interest on lease receivables (-) (4) (76) 1.318.242 882.832 Current 1.302.852 811.559 Non-current 15.390 71.273 1.318.242 882.832
As of the financial position dates the breakdown of the loan portfolio is as follows:
The loans bear interest at the following rates: Loans in USD 1,73% to 13,00% 3,84% to 13,00% Loans in EUR 0,50% to 22,00% 1,64% to 22,00% Loans in LEK 0,50% to 21,79% 2,00% to 22,00% Loans in CHF 5,72% 4,64% to 5,84%
ÇALIK HOLDİNG A.Ş.
NOTES TO CONSOLIDATED FINANCIAL STATEMENTS
FOR THE YEAR ENDED 31 DECEMBER 2011
(Currency shown in thousands of US Dollars (USD) unless otherwise indicated.)
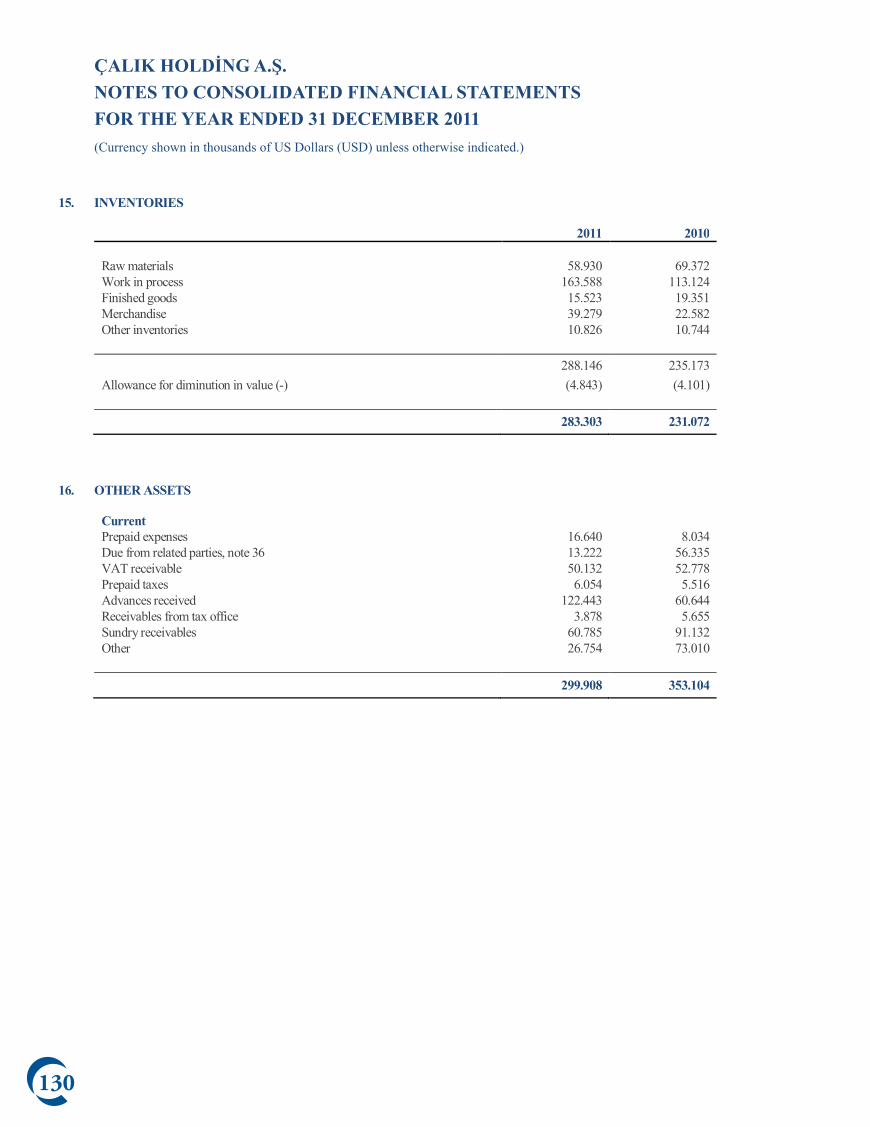
130
ÇALIK HOLDİNG A.Ş. NOTES TO CONSOLIDATED FINANCIAL STATEMENTS
FOR THE YEAR ENDED 31 DECEMBER 2011
(Currency shown in thousands of US Dollars (“USD”) unless otherwise indicated.)
47
15. INVENTORIES
2011 2010 Raw materials 58.930 69.372 Work in process 163.588 113.124 Finished goods 15.523 19.351 Merchandise 39.279 22.582 Other inventories 10.826 10.744 288.146 235.173 Allowance for diminution in value (-) (4.843) (4.101) 283.303 231.072
16. OTHER ASSETS
Current Prepaid expenses 16.640 8.034 Due from related parties, note 36 13.222 56.335 VAT receivable 50.132 52.778 Prepaid taxes 6.054 5.516 Advances received 122.443 60.644 Receivables from tax office 3.878 5.655 Sundry receivables 60.785 91.132 Other 26.754 73.010 299.908 353.104
ÇALIK HOLDİNG A.Ş.
NOTES TO CONSOLIDATED FINANCIAL STATEMENTS
FOR THE YEAR ENDED 31 DECEMBER 2011
(Currency shown in thousands of US Dollars (USD) unless otherwise indicated.)

131
ÇALIK HOLDİNG A.Ş. NOTES TO CONSOLIDATED FINANCIAL STATEMENTS
FOR THE YEAR ENDED 31 DECEMBER 2011
(Currency shown in thousands of US Dollars (“USD”) unless otherwise indicated.)
48
17. EQUITY INVESTMENTS
Share % Amount Entity Country 2011 2010 2011 2010
Unconsolidated subsidiaries Çalık İnşaat A.Ş. Turkey 99% 99% 169 206 Kentsel Dönüşüm A.Ş. Turkey 99% 99% 24 30 E-TİK Elektronik Transfer Kuponları Ltd.Şti. Turkey 100% 100% 25 31 Other 89 77.100 307 77.367 Equity investments Dubai International Development Dubai 49% 49% 30 37 Spectrum Çalık Investment Dubai 49% 49% 16 19 A/O Gap Turkmen Turkmenistan 40% 40% 4.767 11.648 Balkandokma YGPJ Turkmenistan 31% 31% 11.481 10.475 16.294 22.179 Other investments Bursagaz Bursa Şehiriçi Doğal Gaz Dağıtım A.Ş. Turkey 10% 10% 16.106 19.678 Kayserigaz Kayseri Doğalgaz Dağıtım Pazarlama A.Ş. Turkey 10% 10% 3.357 4.101 Serdar Pamyk Egrigi Fabrigi ÇJB Turkmenistan 10% 10% 2.379 2.907 Ataks Mağazacılık A.Ş. Turkey 2% 2% 28 34 Ataks Tekstil Dış Ticaret A.Ş. Turkey 3% 3% 108 132 Tunçpınar Madencilik A. Ş. Turkey 49,8% 49,8% 3.780 -- Kartaltepe Madencilik A. Ş. Turkey 49,8% 49,8% 2.227 -- Other 117 -- 28.102 26.852 44.703 126.398 As from 01.01.2009 A/O Gap Turkmen , Türkmenbaşı Tekstil Kompleksi, Serdar Pamyk Egrigi Fabrigi ÇJB, Balkandokma YGPJ were not consolidated in the accompanying consolidated financial statements. The Group ceases to have the power to govern but continues to have significant influence. Hence, the Group has applied to equity accounting method for these associates as from 01.01.2009. As of financial position dates, the above noted companies in which the Company has a controlling interest or significant influence are not consolidated or equity accounted as they are immaterial individually and in aggregate to the results and financial position of the Group.
ÇALIK HOLDİNG A.Ş.
NOTES TO CONSOLIDATED FINANCIAL STATEMENTS
FOR THE YEAR ENDED 31 DECEMBER 2011
(Currency shown in thousands of US Dollars (USD) unless otherwise indicated.)

132
ÇALIK HOLDİNG A.Ş. NOTES TO CONSOLIDATED FINANCIAL STATEMENTS
FOR THE YEAR ENDED 31 DECEMBER 2011
(Currency shown in thousands of US Dollars (“USD”) unless otherwise indicated.)
39
(b) Secondary reporting format - geographical segments The Group’s seven business segments operate in three main geographical areas through they are managed on a worldwide basis. Revenue is allocated based on the country in which the customer is located.
2011 2010 Revenue Currency zone TL 1.644.400 911.001 USD 376.431 590.802 LEK 279.334 249.857 Other 593.322 372.016
2.893.487 2.123.676
Total assets are allocated based on where the assets are located. Total assets Currency zone TL 3.636.732 3.242.077 USD 274.798 469.639 LEK 2.209.955 1.878.919 Other 283.081 223.924
6.404.566 5.814.559
Capital expenditure is allocated based on where the assets are located. Capital expenditure Currency zone TL 86.412 65.103 USD 4 9 LEK 37.336 24.545 Other 14.986 1.854
138.738 91.511
ÇALIK HOLDİNG A.Ş.
NOTES TO CONSOLIDATED FINANCIAL STATEMENTS
FOR THE YEAR ENDED 31 DECEMBER 2011
(Currency shown in thousands of US Dollars (USD) unless otherwise indicated.)

133
ÇALIK HOLDİNG A.Ş.
NOTES TO CONSOLIDATED FINANCIAL STATEMENTS
FOR THE YEAR ENDED 31 DECEMBER 2011
(Currency shown in thousands of US Dollars (USD) unless otherwise indicated.)
Ç
ALI
K H
OLD
İNG
A.Ş
. N
OTE
S TO
CO
NSO
LID
ATE
D FI
NA
NC
IAL
STA
TEM
ENTS
FO
R TH
E Y
EAR
END
ED 3
1 DEC
EMBE
R 20
11
(Cur
renc
y sh
own
in th
ousa
nds o
f US
Dol
lars
(“U
SD”)
unl
ess o
ther
wise
indi
cate
d.)
49
18.
PRO
PERT
Y, P
LANT
AN
D EQ
UIP
MEN
T
20
10
Add
ition
s D
ispos
als
Tran
slatio
n di
ffere
nces
C
onso
lidat
ed
subs
idia
ry
Unc
onso
lidat
ed
subs
idia
ry
Tran
sfers
20
11
C
ost
Land
34
.625
2.
117
-- (6
.330
) --
(275
) --
30.1
37
Land
impr
ovem
ents
3.83
1 9
-- (6
71)
-- (3
49)
-- 2.
820
Build
ings
14
4.845
9.
380
-- (1
4.34
0)
-- (8
43)
1.26
8 14
0.310
Le
aseh
old i
mpr
ovem
ents
21.8
09
1.99
4 (2
06)
(4.5
38)
-- (4
) 3.
287
22.3
42
Plan
t and
mac
hine
ry
550.7
33
13.9
17
(2.5
10)
(71.
392)
--
(5.9
58)
36.2
96
521.0
86
Mot
or v
ehicl
es
43.6
23
3.46
3 (1
.286
) (4
.607
) --
(831
) 32
6 40
.688
Fu
rnitu
re an
d fix
ture
s 74
.819
13
.835
(1
.959
) (1
0.83
2)
-- (1
.956
) 2.
148
76.0
55
Cons
tructi
on in
prog
ress
10
7.491
68
.815
--
(14.
051)
--
(175
) (7
2.22
3)
89.8
57
981.7
76
113.5
30
(5.9
61)
(126
.761
) --
(10.
391)
(2
8.89
8)
923.2
95
Acc
umul
ated
dep
recia
tion
Land
impr
ovem
ents
821
74
-- (1
55)
-- (1
18)
-- 62
2 Bu
ildin
gs
25.7
75
6.86
7 --
(3.6
14)
-- (2
00)
-- 28
.828
Le
aseh
old i
mpr
ovem
ents
10.5
70
4.19
6 (1
40)
(2.3
88)
-- (4
) --
12.2
34
Plan
t and
mac
hine
ry
216.5
17
47.0
34
(398
) (3
6.71
7)
-- (3
.001
) --
223.4
35
Mot
or v
ehicl
es
20.5
23
4.30
4 (1
.061
) (1
.349
) --
(694
) --
21.7
23
Furn
iture
and
fixtu
res
41.1
32
10.7
05
(1.3
27)
(6.2
89)
-- (1
.102
) --
43.1
19
315.3
38
73.1
80
(2.9
26)
(50.
512)
--
(5.1
19)
-- 32
9.961
Net
boo
k va
lue
666.4
38
593.3
34

134
Ç
AL
IK H
OL
DİN
G A
.Ş.
NO
TES
TO C
ON
SOLI
DA
TED
FIN
AN
CIA
L ST
ATE
MEN
TS
FOR
TH
E Y
EAR
EN
DED
31
DEC
EMBE
R 2
011
(Cur
renc
y sh
own
in th
ousa
nds o
f US
Dol
lars
(“U
SD”)
unl
ess o
ther
wis
e in
dica
ted.
)
50
20
09
Add
ition
s D
ispos
als
Tran
slatio
n di
ffere
nces
C
onso
lidat
ed
subs
idia
ries
U
ncon
solid
ated
su
bsid
iari
es
Tran
sfers
20
10
C
ost
Land
35
.406
11
6 --
(897
) --
-- --
34.6
25
Land
impr
ovem
ents
3.53
9 16
1 --
(103
) --
-- 23
4 3.
831
Build
ings
14
2.78
1 1.
640
(14)
(8
.422
) --
-- 8.
860
144.
845
Leas
ehol
d im
prov
emen
ts 21
.541
77
8 (1
5)
(587
) --
-- 92
21
.809
Pl
ant a
nd m
achi
nery
56
5.00
7 9.
565
(25.
103)
(2
4.51
3)
-- --
25.7
77
550.
733
Mot
or v
ehicl
es
23.7
16
1.45
1 (1
.576
) (2
96)
20.3
28
-- --
43.6
23
Furn
iture
and
fixtu
res
69.7
54
7.86
4 (3
.418
) (3
.122
) 47
--
3.69
4 74
.819
Co
nstru
ction
in p
rogr
ess
104.
489
46.9
32
-- (5
.273
) --
-- (3
8.65
7)
107.
491
966.
233
68.5
07
(30.
126)
(4
3.21
3)
20.3
75
-- --
981.
776
Acc
umul
ated
dep
reci
atio
n
La
nd im
prov
emen
ts 76
2 81
--
(22)
--
-- --
821
Build
ings
21
.004
6.
000
(14)
(1
.215
) --
-- --
25.7
75
Leas
ehol
d im
prov
emen
ts 6.
795
4.07
5 (3
) (2
97)
-- --
-- 10
.570
Pl
ant a
nd m
achi
nery
20
1.06
4 45
.382
(2
2.99
9)
(6.9
30)
-- --
-- 21
6.51
7 M
otor
veh
icles
17
.772
4.
320
(1.3
91)
(347
) 16
9 --
-- 20
.523
Fu
rnitu
re an
d fix
ture
s 36
.639
9.
398
(3.1
43)
(1.7
76)
14
-- --
41.1
32
284.
036
69.2
56
(27.
550)
(1
0.58
7)
183
-- --
315.
338
N
et b
ook
valu
e 68
2.19
7
66
6.43
8 Le
ased
asse
ts in
clude
d in
the t
able
abov
e com
prise
plan
t and
mac
hine
ry am
ount
ing
to U
SD 2
7.86
9 (3
1.12
.201
0: U
SD 2
9.52
6) n
et of
acc
umul
ated
dep
recia
tion.
The G
roup
’s bu
ildin
gs h
ave b
een
mor
tgag
ed to
the e
xten
t of U
SD 1
10.0
00 (3
1.12
.201
0: U
SD 1
10.0
00) c
ollat
eral
again
st ba
nk lo
ans.
Prop
erty
, plan
t and
equi
pmen
t of M
edia
Gro
up, h
ave b
een
mor
tgag
ed to
the e
xten
t of U
SD 9
75.0
00 ag
ains
t ban
k lo
ans.
ÇALIK HOLDİNG A.Ş.
NOTES TO CONSOLIDATED FINANCIAL STATEMENTS
FOR THE YEAR ENDED 31 DECEMBER 2011
(Currency shown in thousands of US Dollars (USD) unless otherwise indicated.)

135
Ç
ALI
K H
OLD
İNG
A.Ş
. N
OTE
S TO
CO
NSO
LID
ATE
D FI
NA
NC
IAL
STA
TEM
ENTS
FO
R TH
E Y
EAR
END
ED 3
1 DEC
EMBE
R 20
11
(Cur
renc
y sh
own
in th
ousa
nds o
f US
Dol
lars
(“U
SD”)
unl
ess o
ther
wise
indi
cate
d.)
51
19.
INTA
NGIB
LE A
SSET
S
20
10
Add
ition
s D
ispos
als
Tran
slatio
n di
ffere
nces
U
ncon
solid
ated
su
bsid
iary
Tr
ansfe
rs
2011
C
ost
Ri
ghts
and
softw
are l
icens
es
48.6
19
4.72
1 (8
.862
) (3
51)
(68)
1.
729
45.7
88
Elec
tricit
y dist
ribut
ion
right
s 25
8.435
--
-- (4
6.91
5)
-- --
211.5
20
Bran
d nam
es fo
r med
ia gr
oup
613.8
10
-- --
(106
.390
) --
-- 50
7.420
G
oodw
ill
-
Med
ia g
roup
10
8.454
--
-- (1
9.68
8)
-- --
88.7
66
- Te
lecom
mun
icatio
n gr
oup
37.7
92
-- --
(6.8
61)
-- --
30.9
31
- Ba
nkin
g gr
oup
20.1
29
-- --
(3.6
54)
-- --
16.4
75
Oth
er in
tangi
ble a
ssets
14
.867
11
.852
(3
14)
(3.5
99)
-- 2.
222
25.0
28
1.
102.
106
16.5
73
(9.1
76)
(187
.458
) (6
8)
3.95
1 92
5.928
A
ccum
ulat
ed a
mor
tizat
ion
Ri
ghts
and
softw
are l
icens
es
16.2
05
5.98
8 (1
.041
) (3
.406
) (4
8)
-- 17
.698
El
ectri
city d
istrib
utio
n rig
hts
10.2
92
7.38
7 --
(2.7
24)
-- --
14.9
55
Oth
er in
tangi
ble a
ssets
7.
263
1.79
1 --
(1.1
24)
-- --
7.93
0
33.7
60
15.1
66
(1.0
41)
(7.2
54)
(48)
--
40.5
83
Net
boo
k va
lue
1.06
8.34
6
885.3
45
ÇALIK HOLDİNG A.Ş.
NOTES TO CONSOLIDATED FINANCIAL STATEMENTS
FOR THE YEAR ENDED 31 DECEMBER 2011
(Currency shown in thousands of US Dollars (USD) unless otherwise indicated.)

136
Ç
AL
IK H
OL
DİN
G A
.Ş.
NO
TES
TO C
ON
SOLI
DA
TED
FIN
AN
CIA
L ST
ATE
MEN
TS
FOR
TH
E Y
EAR
EN
DED
31
DEC
EMBE
R 2
011
(Cur
renc
y sh
own
in th
ousa
nds o
f US
Dol
lars
(“U
SD”)
unl
ess o
ther
wis
e in
dica
ted.
)
52
20
09
Add
ition
s D
ispos
als
Tran
slatio
n di
ffere
nces
A
cqui
sitio
n of
a
subs
idia
ry
Con
solid
ated
su
bsid
iari
es
Tran
sfers
20
10
C
ost
Righ
ts an
d so
ftwar
e lic
ense
s 44
.574
5.
824
(244
) (1
.501
) --
-- (3
4)
48.6
19
Elec
tricit
y di
strib
utio
n rig
hts
-- --
-- --
-- 25
8.43
5 --
258.
435
Bran
d na
mes
for m
edia
gro
up
632.
237
-- --
(18.
427)
--
-- --
613.
810
Goo
dwill
Med
ia g
roup
11
1.35
7 --
-- (2
.903
) --
-- --
108.
454
Te
lecom
mun
icat
ion
grou
p 38
.804
--
-- (1
.012
) --
-- --
37.7
92
Ba
nkin
g gr
oup
20.6
68
-- --
(539
) --
-- --
20.1
29
Oth
er in
tangi
ble a
sset
s 12
.892
4.
292
(1.7
43)
(608
) --
-- 34
14
.867
86
0.53
2 10
.116
(1
.987
) (2
4.99
0)
-- 25
8.43
5 --
1.10
2.10
6
Acc
umul
ated
am
ortiz
atio
n
Ri
ghts
and
softw
are l
icen
ses
11.6
87
5.04
4 (4
9)
(477
) --
-- --
16.2
05
Elec
tricit
y di
strib
utio
n rig
hts
-- --
-- --
-- 10
.292
--
10.2
92
Oth
er in
tangi
ble a
sset
s 6.
296
1.30
8 (2
) (3
39)
-- --
-- 7.
263
17.9
83
6.35
2 (5
1)
(816
) --
10.2
92
-- 33
.760
Net
boo
k va
lue
842.
549
1.06
8.34
6
ÇALIK HOLDİNG A.Ş.
NOTES TO CONSOLIDATED FINANCIAL STATEMENTS
FOR THE YEAR ENDED 31 DECEMBER 2011
(Currency shown in thousands of US Dollars (USD) unless otherwise indicated.)

137
ÇALIK HOLDİNG A.Ş.
NOTES TO CONSOLIDATED FINANCIAL STATEMENTS
FOR THE YEAR ENDED 31 DECEMBER 2011
(Currency shown in thousands of US Dollars (USD) unless otherwise indicated.)
ÇALIK HOLDİNG A.Ş. NOTES TO CONSOLIDATED FINANCIAL STATEMENTS
FOR THE YEAR ENDED 31 DECEMBER 2011
(Currency shown in thousands of US Dollars (“USD”) unless otherwise indicated.)
53
20. INVESTMENT PROPERTY
2010 Additions Revaluation Disposals Translation differences Transfers 2011
Cost 66.999 8.635 120.309 (20.258) (13.707) 24.947 186.925 Accumulated depreciation (2.703) (877) -- 790 501 -- (2.289) Net book value 64.296 7.758 120.309 (19.468) (13.206) 24.947 184.636
2009 Additions Revaluation Disposals Translation differences Transfers 2010
Cost 114.764 12.888 -- (59.021) (1.632) -- 66.999 Accumulated depreciation (1.945) (834) -- -- 76 -- (2.703) Net book value 112.819 12.054 -- (59.021) (1.556) -- 64.296 The value of the Group’s buildings and lands with future economic benefits has been brought to its fair value on basis of the reports dated on 09.01.2012, 26.12.2011 and 30.12.2011 of Reel Gayrimenkul Değerleme A.Ş., an independent firm of valuers. These three reports have resulted in valuation surplus (positive difference) of USD 53.412.
The group has revalued another land by depending on an agreement signed on 13.12.2011 which ascertained the future economic benefits of the land of USD 66.897.
The difference between net book value of the assets and revalued amounts (USD 53.412, USD 66.897 of USD120.309) less deferred tax effect which amounted to USD 24.062 was credited to Revaluation Reserve which is a part of equity.
21. BORROWINGS 2011 2010 Current Turkish lira loans 500.760 350.256 Foreign currency bank loans 610.661 378.603 Finance lease liabilities, net 4.998 4.722 Other 1.624 2.516 1.118.043 736.097 Non-current Turkish lira loans 59.874 5.199 Foreign currency bank loans 676.009 985.151 Finance lease liabilities, net 14.746 16.493 Other -- -- 750.629 1.006.843 The maturity schedule of total borrowings is as follows:

138
ÇALIK HOLDİNG A.Ş. NOTES TO CONSOLIDATED FINANCIAL STATEMENTS
FOR THE YEAR ENDED 31 DECEMBER 2011
(Currency shown in thousands of US Dollars (“USD”) unless otherwise indicated.)
54
Due in one year 1.118.043 736.097 Due between one to two years 228.900 383.920 Due between two to three years 184.036 178.343 Due between three to four years 117.186 152.395 Over four years 220.507 292.185 1.868.672 1.742.940 Bank loans bear interest at the following rates per year: Loans in TL 9,90% - 11,76% 8,5% - 15,93% Loans in USD 2,74% - 8,50% 2,45% - 8,5% Loans in EUR 3,02% - 8,50% 2,92% - 5,37%
The Group’s buildings have been mortgaged to the extent of USD 110.000 (31.12.2010: USD 110.000) collateral against bank loans.
Property, plant and equipment of Media Group, have been mortgaged to the extent of USD 975.000 against bank loans. Albtelecom Sh.a (a subsidiary) borrowed a loan from European Bank for Reconstruction and Development amounting EUR 67,5 million with a maturity of 05.11.2015. Interest charge on the loan will vary between 2,99% to 4,40% plus Euro zone Interbank rate per year. Additionally the Group obtained a loan from Black Sea Trade and Development Bank (BSTDB) amounting to EUR 22,5 million with a maturity of 05.11.2015. Interest charge on the loan will vary between 3,31% to 4,40% plus Euro zone Interbank rate per year. Gap İnşaat Dubai FZE borrowed USD 200.000 in 5 March 2007. The loan bears interest at a rate of 8,5% per annum. The interest is payable semi-annually in arrears on the interest payment dates falling on 5 March and 5 September of each year, commencing on 5 September 2007. Çalık Holding A.Ş ̧GAP Inşaat Yatırım ve Dış Ticaret A.Ş ̧and Çalık Enerji Sanayi ve Ticaret A.Ş each being a joint stock company organized under the laws of the Republic of Turkey, agree to unconditionally and irrevocably guarantee the loan. The Group’s subsidiary Turkuvaz borrowed a loan from Türkiye Vakıflar Bankası T.A.O. amounting to USD 375 million with a maturity of 22.04.2018 and interest rate is libor+4,84% per year. The Group’s subsidiary Turkuvaz borrowed a loan from Türkiye Halk Bankası A.Ş. amounting to USD 375 million with a maturity of 22.04.2018 and interest rate is libor+4,84% per year.
ÇALIK HOLDİNG A.Ş.
NOTES TO CONSOLIDATED FINANCIAL STATEMENTS
FOR THE YEAR ENDED 31 DECEMBER 2011
(Currency shown in thousands of US Dollars (USD) unless otherwise indicated.)

139
ÇALIK HOLDİNG A.Ş. NOTES TO CONSOLIDATED FINANCIAL STATEMENTS
FOR THE YEAR ENDED 31 DECEMBER 2011
(Currency shown in thousands of US Dollars (“USD”) unless otherwise indicated.)
55
22. CUSTOMER DEPOSITS
2011 2010 Current customer deposits 1.481.994 1.223.360 Non-current customer deposits 98.383 78.503 1.580.377 1.301.863
The breakdown of customer deposits is as follows:
Current accounts Individuals 71.261 64.418 Private enterprises 101.960 94.958 State owned entities 22.183 26.906
195.404 186.282 Deposits Individuals 1.242.297 1.028.570 Private enterprises 93.250 43.498 State owned entities 31.122 27.714
1.366.669 1.099.782 Other customer accounts Individuals 1.708 5.461 Private enterprises 15.720 9.308 State owned entities 876 1.030
18.304 15.799
1.580.377 1.301.863 The maturity breakdown of customer deposits is as follows:
Current accounts 195.404 186.282 Deposits On demand 27.459 16.901 One month 80.044 76.931 Three months 139.089 141.284 Six months 208.499 183.514 Twelve months 789.715 581.959 Two years and over 98.383 78.503 Accrued interest on deposits 23.480 20.690 Total deposits 1.366.669 1.099.782 Other customer accounts 18.304 15.799 Total customer deposits 1.580.377 1.301.863
ÇALIK HOLDİNG A.Ş.
NOTES TO CONSOLIDATED FINANCIAL STATEMENTS
FOR THE YEAR ENDED 31 DECEMBER 2011
(Currency shown in thousands of US Dollars (USD) unless otherwise indicated.)

140
ÇALIK HOLDİNG A.Ş. NOTES TO CONSOLIDATED FINANCIAL STATEMENTS
FOR THE YEAR ENDED 31 DECEMBER 2011
(Currency shown in thousands of US Dollars (“USD”) unless otherwise indicated.)
56
23. DUE TO BANKS 2011 2010 Treasury bills sold under Repo agreements with Central Bank of Albania 88.211 21.292 Deposits received from residents 201.927 22.982 Current accounts of non resident banks 198.094 189.474 Current accounts of resident banks 30.198 31.448 Borrowings from financial institutions 26.109 18.757 544.539 283.953
24. TRADE PAYABLES
Current Current accounts - Third parties 827.721 838.568 - Due to related parties, note 36 1.732 2.824 Notes payable 10.893 12.978 Other 839 982 841.185 855.352 Unearned interest on payables (-) (1.539) (658) 839.646 854.694
Non-current accounts - Third parties 1.011 1.244
ÇALIK HOLDİNG A.Ş.
NOTES TO CONSOLIDATED FINANCIAL STATEMENTS
FOR THE YEAR ENDED 31 DECEMBER 2011
(Currency shown in thousands of US Dollars (USD) unless otherwise indicated.)

141
ÇALIK HOLDİNG A.Ş. NOTES TO CONSOLIDATED FINANCIAL STATEMENTS
FOR THE YEAR ENDED 31 DECEMBER 2011
(Currency shown in thousands of US Dollars (“USD”) unless otherwise indicated.)
57
25. PROVISIONS
2011 2010 Current Provision for deposit for insurance premiums 951 789 Provision for holiday salaries and year end bonus 7.700 8.452 Provision for promotion 3.663 3.030 Provision for legal cases 5.533 6.324 Provision for expenses 8.144 1.962 25.991 20.557
Non-current General provisions 15.882 -- Provision for expenses 6.730 9.252 22.612 9.252
The movement table of provisions is as follows: Opening balance as of 01.01, net 29.809 16.958 Additions - provision for deposit for insurance premiums 183 343 Additions - provision for holiday salaries and year end bonus 149 3.005 Additions - provision for promotion 4.247 3.122 Additions - provision for expenses 10.473 9.252 Additions - legal cases (895) 2.828 Additions - general provisions 15.882 -- Disposals - legal cases -- (143) Disposals - provision for holiday salaries and year end bonus (901) -- Disposals - provision for expenses (3.077) (2.472) Disposal - provision for promotion (3.122) (2.512) Translation differences (4.145) (572) Ending balance as of 31.12, net 48.603 29.809
ÇALIK HOLDİNG A.Ş.
NOTES TO CONSOLIDATED FINANCIAL STATEMENTS
FOR THE YEAR ENDED 31 DECEMBER 2011
(Currency shown in thousands of US Dollars (USD) unless otherwise indicated.)

142
ÇALIK HOLDİNG A.Ş. NOTES TO CONSOLIDATED FINANCIAL STATEMENTS
FOR THE YEAR ENDED 31 DECEMBER 2011
(Currency shown in thousands of US Dollars (“USD”) unless otherwise indicated.)
58
26. OTHER LIABILITIES
2011 2010 Current Income tax and social security premiums payable 30.303 35.786 Due to related parties, note 36 50.731 306 Advances received 18.399 13.172 Due to personnel 2.175 7.364 Payable to Privatization Administration of Turkey 92.291 95.669 Other 19.637 31.737 213.536 184.034 Non - current Deposits received 27.452 27.888 Payable to Privatization Administration of Turkey 84.353 169.231 Türkiye Elektrik Dağıtım A.Ş. 30.269 23.456 Deferred income 148.359 23.947 Other 521 --
290.954 244.522
27. TAXATION ON INCOME The corporation tax rate in Turkey on the profits for the calendar year 2011 is 20% (2010: 20%). Taxable profits are calculated by modifying accounting income for certain exclusions and allowances for tax purposes from the profit disclosed in the statutory income. No other taxes are paid unless profits are distributed.
In Turkey, no taxes are withheld from undistributed profits, profits added to share capital (bonus shares) and dividends paid to other resident companies. Other than those, profits distributed in dividends to individuals and non-resident companies are subject to withholding at the rate of 15%.
In Turkey, the tax legislation does not permit a parent company and its affiliates to file a consolidated tax return. Therefore, provision for taxation charge, as reflected in the accompanying consolidated financial information, has been calculated on a separate-entity basis.
The exemption period granted on profits from the sale of investment shares and immovable property by Corporation Tax Law transitory articles No. 28 and 29 expired on 31 December 2004. However, this exemption was re-enacted by Law No. 5281 on permanent basis in effect from 1 January 2005 and added to Corporation Tax Law article 8.
Accordingly, profits from the sale of investments and immovable held for a minimum of two years will be tax exempt provided such profits are added to share capital under certain conditions. However, the two-year holding period condition will not apply in the transfer or sale of investment and immovable property to creditor banks implemented by debtors and debt guarantors.
In Turkey, tax losses that are reported in the Corporation Tax return can be carried forward and deducted from the corporation tax base for a maximum of five consecutive years.
ÇALIK HOLDİNG A.Ş.
NOTES TO CONSOLIDATED FINANCIAL STATEMENTS
FOR THE YEAR ENDED 31 DECEMBER 2011
(Currency shown in thousands of US Dollars (USD) unless otherwise indicated.)

143
ÇALIK HOLDİNG A.Ş. NOTES TO CONSOLIDATED FINANCIAL STATEMENTS
FOR THE YEAR ENDED 31 DECEMBER 2011
(Currency shown in thousands of US Dollars (“USD”) unless otherwise indicated.)
59
The Turkish Tax Procedural Law does not include a procedure for formally agreeing tax assessments. Tax returns must be filed within three and a half months of the year-end and may be subject to investigation, together with their underlying accounting records, by the tax authorities at any stage during the following five years. The corporation tax rate in Albania on the profits for the calendar year 2011 is 10% (2010: 10%). Taxable profits are calculated by modifying accounting income for certain exclusions and allowances for tax purposes from the profit disclosed in the statutory income. Dividends are subject to 10% withholding tax.
The subsidiaries and the branches of Gap İnşaat and Çalık Enerji in Turkmenistan are exempt from taxes in Turkmenistan. The parent companies of these two branches are also exempt from corporate taxes as its source of income that originates from construction projects outside Turkey is not taxable in Turkey. On the other hand, the revenue that originates from the machinery and equipment exported from Turkey to the countries which are included in the construction costs in those countries, is subject to Corporation Tax in Turkey.
The subsidiaries in Sudan, Ukraine, Saudi Arabia and the USA have not produced taxable income in 2011 and in 2010.
The subsidiaries in UAE, Dubai are operating in the Free Trade Zone and therefore the tax rate is nil. Provision for taxes per income statement:
2011 2010 Deferred tax income (charge) (20.024) 4.327 Corporation and income taxes - current (41.305) (11.425) Discontinued operations, note 37 (8) (39) Income tax charge (61.337) (7.137)
The Group’s prepaid income and corporation taxes are netted off against the current income tax provision on the financial position as stated below:
Corporation and income taxes 35.064 6.473 Prepaid taxes (-) (27.994) (4.898) 7.070 1.575
ÇALIK HOLDİNG A.Ş.
NOTES TO CONSOLIDATED FINANCIAL STATEMENTS
FOR THE YEAR ENDED 31 DECEMBER 2011
(Currency shown in thousands of US Dollars (USD) unless otherwise indicated.)

144
ÇALIK HOLDİNG A.Ş. NOTES TO CONSOLIDATED FINANCIAL STATEMENTS
FOR THE YEAR ENDED 31 DECEMBER 2011
(Currency shown in thousands of US Dollars (“USD”) unless otherwise indicated.)
60
Deferred taxation The Group recognizes deferred tax assets and liabilities based upon temporary differences between its financial statements as reported for IAS purposes and its statutory tax financial statements. These differences usually result in the recognition of revenue and expenses in different reporting periods for IAS and tax purposes.
The composition of cumulative temporary differences and the related deferred tax assets/liabilities in respect of items for which deferred tax has been provided at 31 December 2011 and 2010 were as follows:
Cumulative temporary difference Deferred tax
2011 2010 2011 2010
Deferred tax asset Employee termination benefits 21.778 25.816 4.356 5.163 Unearned interest on receivables 4.843 4.988 962 996 Provision for doubtful receivables 17.210 23.065 1.859 2.677 Taxable losses carried forward 214.327 313.392 42.865 62.678 Due from services concession agreements 52.726 15.967 10.545 3.193 Other 27.928 13.548 5.711 2.705 66.298 77.412 Deferred tax liability Temporary differences arising from restating non-monetary assets 198.356 205.718 32.173 33.265 Unearned interest on payables 1.533 938 307 188 Income accruals 36.417 16.216 7.283 3.243 Fair value gain on financial assets 55.579 -- 11.116 -- Revaluation of investment properties 120.309 -- 24.062 -- Other 8.164 4.912 3.630 2.435 78.571 39.131 Deferred tax asset, net (12.273) 38.281
Deferred tax has been provided using the expected future tax rates at 20% (31.12.2010: 20%) except 10% tax rate is used for Albtelecom as explained above (31.12.2010: %10).
ÇALIK HOLDİNG A.Ş.
NOTES TO CONSOLIDATED FINANCIAL STATEMENTS
FOR THE YEAR ENDED 31 DECEMBER 2011
(Currency shown in thousands of US Dollars (USD) unless otherwise indicated.)

145
ÇALIK HOLDİNG A.Ş. NOTES TO CONSOLIDATED FINANCIAL STATEMENTS
FOR THE YEAR ENDED 31 DECEMBER 2011
(Currency shown in thousands of US Dollars (“USD”) unless otherwise indicated.)
61
The movement of deferred tax account is as follows: 2011 2010 Opening balance as of 01.01 38.281 26.092 Consolidated entities and translation difference (805) 275 Deferred tax effect of discontinued operations, net (1.043) -- Discontinued operations, note 37 8 39 Acquisition of a subsidiary -- 8.395 Deferred tax effect of revaluation of investment properties (24.062) -- Deferred tax charge (20.024) 4.327 Translation difference (4.628) (847) Ending balance as of 31.12 (12.273) 38.281
28. EMPLOYEE TERMINATION BENEFITS
In accordance with existing social legislation in Turkey, the Company is required to make lump-sum termination indemnities to each employee who has completed one year of service with the Company, and whose employment is terminated due to retirement or for reasons other than resignation or misconduct. Such payments are calculated on the basis of 30 days’ pay limited to a maximum of TL 2.731,85 (2010: TL 2.517,01) per year of employment at the rate of pay applicable at the date of retirement. The liability is not funded, as there is no funding requirement. The subsidiaries in Turkey have no other obligation for employee termination other than the retirement pay above. No provision for retirement pay is made for employees working in Dubai FZE as the amount is insignificant. The Company’s subsidiaries Albtelecom, CT Telecom, Çalık Energy Albania and Eagle Mobile in Albania make no provision and have no obligation for employee pensions over and above the contributions paid into the State-run pension scheme. The Company’s subsidiary BKT in Albania created a specific fund in 2002, which will be paid to staff on their retirement. As of 31.12.2011, the amount was USD 1.278 (31.12.2010: USD 1.567). The investment in this fund has been stopped by the Bank on 30 September 2010. The Group’s subsidiaries in Turkmenistan, contributes to the Turkmenistan state pension on behalf of its employees. The contributions are expensed as incurred.
ÇALIK HOLDİNG A.Ş.
NOTES TO CONSOLIDATED FINANCIAL STATEMENTS
FOR THE YEAR ENDED 31 DECEMBER 2011
(Currency shown in thousands of US Dollars (USD) unless otherwise indicated.)

146
ÇALIK HOLDİNG A.Ş. NOTES TO CONSOLIDATED FINANCIAL STATEMENTS
FOR THE YEAR ENDED 31 DECEMBER 2011
(Currency shown in thousands of US Dollars (“USD”) unless otherwise indicated.)
62
29. SHARE CAPITAL As of the financial position dates, the issued and paid up share capital of the Company is USD 130.509 (2010: USD 159.456) and comprised 240.852.000 shares of par value USD 0,54186 each. As of the financial position dates, the shareholders of the Company and their percentage shareholdings were as follows: Shareholders Percentage (%) Amount Ahmet Çalık 99,99 127.510 Others 0,01 1 127.511 Inflation adjustment of share capital 2.998
130.509
30. COMMITMENTS AND CONTINGENCIES
a) At 31.12.2011, the Group other than the banking sector had contingent liabilities of USD 589.303 (31.12.2010: USD 454.588) in respect of letters of guarantee obtained from local banks and submitted to various customs, state authorities for import and financial institutions. b) Gap İnşaat Dubai FZE borrowed USD 200.000 on 5 March 2007. The loan bears interest at a rate of 8.5% per annum. The interest is payable semi-annually in arrears on the interest payment dates falling on 5 March and 5 September of each year, commencing on 5 September 2007. Çalık Holding A.Ş ̧GAP İnşaat Yatırım ve Dış Ticaret A.Ş ̧and Çalık Enerji Sanayi ve Ticaret A.Ş each being a joint stock company organised under the laws of the Republic of Turkey, agree to unconditionally and irrevocably guarantee the loan. c) As of 31.12.2011, the Group had received letters of guarantee from suppliers amounting to USD 89.650 (31.12.2010: USD 37.861). d) As of 31 December 2011, 128 lawsuits opened and pending by Albtelecom amounted LEK 267.854, including the receivables from General Directory of Taxes amounted LEK 47.598. The remaining balance of these lawsuits is related to agreement obligations not fulfilled by the operators and the private and state-owned companies, which has damaged the infrastructure of the Albtelecom. e) As of 31 December 2011, other 55 court cases opened and pending against Albtelecom amounted LEK 7.708 and LEK 4.306, respectively, related to the employees whose agreements were cancelled and in the course of conducting its business with other companies on commercial terms. f) The Group mortgaged its land and pledged its operating rights and guarantee for the loan (note 18) obtained from Türkiye Halk Bankası A.Ş. and Türkiye Vakıflar Bankası T.A.O. amounting to USD 975.000 and USD 1.629.566, respectively. g) The Group’s subsidiary Gap İnşaat mortgaged its land and buildings to the extent of USD 110.000 (31.12.2010: USD 110.000) as collateral against bank loans. h) The Group’s subsidiary Gap Güneydoğu mortgaged its land and buildings to the extent of USD 5.821 as collateral against bank loans.
ÇALIK HOLDİNG A.Ş.
NOTES TO CONSOLIDATED FINANCIAL STATEMENTS
FOR THE YEAR ENDED 31 DECEMBER 2011
(Currency shown in thousands of US Dollars (USD) unless otherwise indicated.)

147
ÇALIK HOLDİNG A.Ş. NOTES TO CONSOLIDATED FINANCIAL STATEMENTS
FOR THE YEAR ENDED 31 DECEMBER 2011
(Currency shown in thousands of US Dollars (“USD”) unless otherwise indicated.)
63
i) Courts cases opened by Albtelecom and pending as of 31.12.2011 related to the results from fixing the price of agreements with the rural operator, H-Communications Sh.P.K. amounted USD 2.200.000. j) As of 05.06.2008, 76% (11.400.000 shares out of 15.000.000) of the Albtelecom Sh.a’s shares owned Cetel Telekom İletişim Sanayi ve Ticaret A.Ş. (59.200.000 shares) was secured by European Bank For Reconstruction and Development (“EBRD”) and Black Sea Trade and Development Bank (“BSTDB”) under shares agreement. k) As of 31.12.2011, lawsuits opened by the Group amounting to USD 40.910 (31.12.2010: USD 30.813) l) Commitments, contingencies and off financial position items of BKT:
2011 2010 Guarantees Guarantees in favour of customers 58.925 21.084 Guarantees received from credit institutions 1.834 2.198 Letters of credit issued to customers 3.537 6.992
Guarantees and letters of credit issued in favour of customers mostly are counter guaranteed by other financial institutions or fully cash collateralised. At present the Bank is operating as an agent for the Government in the administration and implementation of certain loans to state owned entities utilising credit lines received from international donors. These donors have received individual guarantees from the government of Albania to cover the reimbursement of their lines of credit. Other Undrawn credit commitments (credit cards and overdrafts) 39.461 30.705 Outstanding cheques of non-resident banks 727 394 Spot foreign currency contract 47.616 11.428 Collaterals for loan portfolio 2.029.294 1.534.414 Legal In the normal course of business the Bank is presented with legal claims and litigation; the Bank’s management is of the opinion that no material losses will be incurred in relation to legal claims outstanding as at 31 December 2011. Lease commitments Such commitments for the years ended 31 December 2011 and 2010 are composed as follows: Not later than 1 year 2.124 1.853 Later than 1 year and not later than 5 years 7.831 6.647 Later than 5 years 3.581 3.485 13.536 11.985 The Bank has entered into lease commitments for all the branches and agencies opened during the years 2003-2011 with a maximum duration of ten years.
The Bank had 76 rented buildings as at 31 December 2011, in which are included the rented space dedicated to offsite disaster recovery and the 24 buildings rented for units of Kosovo Branch.
The Bank may cancel these leases upon giving three months notice. Therefore, at 31 December 2011, the maximum non-cancellable commitment payable not later than one year is USD 531 (2010: USD 463).
ÇALIK HOLDİNG A.Ş.
NOTES TO CONSOLIDATED FINANCIAL STATEMENTS
FOR THE YEAR ENDED 31 DECEMBER 2011
(Currency shown in thousands of US Dollars (USD) unless otherwise indicated.)

148
ÇALIK HOLDİNG A.Ş. NOTES TO CONSOLIDATED FINANCIAL STATEMENTS
FOR THE YEAR ENDED 31 DECEMBER 2011
(Currency shown in thousands of US Dollars (“USD”) unless otherwise indicated.)
64
m) Commitments and contingencies of Aktifbank:
2011 2010 Letters of guarantee 550.017 599.461 Letters of credit 51.503 95.539 Other guarantees 14.673 19.110
31. REVENUE
2011 2010 Domestic 1.786.271 1.069.669 Export 1.249.087 1.212.675 3.035.358 2.282.344 Sales discounts (-) (141.871) (158.668) 2.893.487 2.123.676 As of 31.12.2011 USD 593.217 thousand, (31.12.2010: USD 236.035) out of the total exports represents the revenue from construction projects in accordance with IAS 11 using the percentage of completion method.
ÇALIK HOLDİNG A.Ş.
NOTES TO CONSOLIDATED FINANCIAL STATEMENTS
FOR THE YEAR ENDED 31 DECEMBER 2011
(Currency shown in thousands of US Dollars (USD) unless otherwise indicated.)

149
ÇALIK HOLDİNG A.Ş. NOTES TO CONSOLIDATED FINANCIAL STATEMENTS
FOR THE YEAR ENDED 31 DECEMBER 2011
(Currency shown in thousands of US Dollars (“USD”) unless otherwise indicated.)
65
32. NATURE OF EXPENSES
Nature of expenses consists of cost of sales, research and development, selling, and general and administrative expenses. 2011 2010 Direct materials and merchandises expenses 1.222.953 949.008 Employee and personnel expenses 290.558 246.642 Depreciation and amortisation expense 86.585 72.184 Cost of construction projects 385.668 213.836 Changes in semi-finished goods and finished goods 2.014 (4.532) Service expenses 143.958 102.436 Licence expenses 27.703 31.368 Interconnection cost - Albanian Mobile Company 3.336 8.939 Interconnection cost - Vodafone Sh.a. 6.158 5.683 Office expenses 23.057 20.453 Freight and freight insurance 36.496 27.688 Outsourcing expenses 30.327 6.640 Consulting expenses 5.848 7.510 Doubtful debt provision expenses 8.687 5.380 Advertising expenses 20.585 17.187 Sales commissions / premiums 7.426 7.776 Exhibition expenses 531 969 International traffic expenditures 25.318 13.061 Motor vehicle expenses 8.208 4.247 Other 233.754 200.049 2.569.170 1.936.524
ÇALIK HOLDİNG A.Ş.
NOTES TO CONSOLIDATED FINANCIAL STATEMENTS
FOR THE YEAR ENDED 31 DECEMBER 2011
(Currency shown in thousands of US Dollars (USD) unless otherwise indicated.)

150
ÇALIK HOLDİNG A.Ş. NOTES TO CONSOLIDATED FINANCIAL STATEMENTS
FOR THE YEAR ENDED 31 DECEMBER 2011
(Currency shown in thousands of US Dollars (“USD”) unless otherwise indicated.)
66
33. OTHER INCOME AND OTHER EXPENSE 2011 2010 Commission income 10 1.666 Rent income 351 203 Profit on sale of property, plant and equipment 576 583 Provisions released 2.255 261 Income on insurance claims 494 297 Other 9.190 9.414 Other income 12.876 12.424 Idle capacity expenses 1.335 2.324 Idle capacity depreciation expenses 2.167 2.903 Loss on sale of property, plant and equipment 687 2.144 Loss on insurance claims 51 24 Petroleum drilling expenses -- 1.724 Donation expense 1.364 23.305 Other 12.601 22.760 Other expense 18.205 55.184
ÇALIK HOLDİNG A.Ş.
NOTES TO CONSOLIDATED FINANCIAL STATEMENTS
FOR THE YEAR ENDED 31 DECEMBER 2011
(Currency shown in thousands of US Dollars (USD) unless otherwise indicated.)
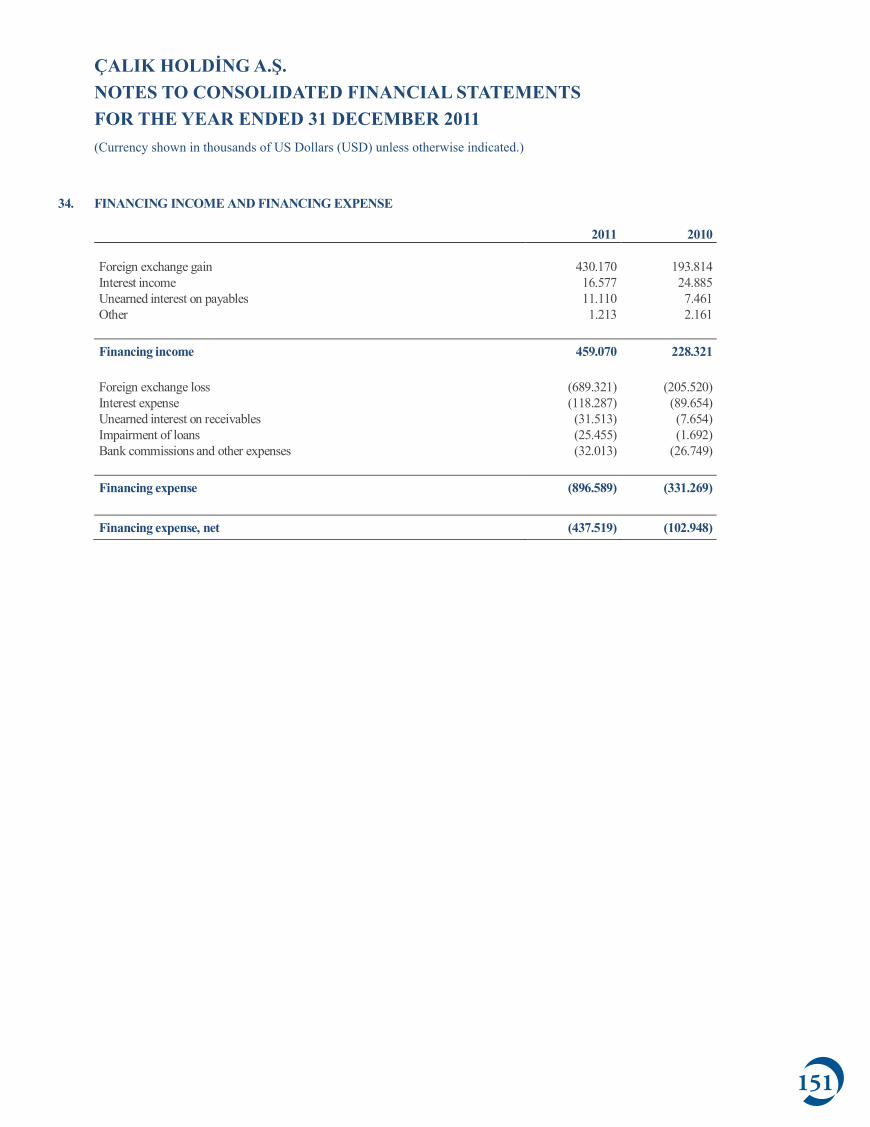
151
ÇALIK HOLDİNG A.Ş. NOTES TO CONSOLIDATED FINANCIAL STATEMENTS
FOR THE YEAR ENDED 31 DECEMBER 2011
(Currency shown in thousands of US Dollars (“USD”) unless otherwise indicated.)
67
34. FINANCING INCOME AND FINANCING EXPENSE 2011 2010 Foreign exchange gain 430.170 193.814 Interest income 16.577 24.885 Unearned interest on payables 11.110 7.461 Other 1.213 2.161 Financing income 459.070 228.321 Foreign exchange loss (689.321) (205.520) Interest expense (118.287) (89.654) Unearned interest on receivables (31.513) (7.654) Impairment of loans (25.455) (1.692) Bank commissions and other expenses (32.013) (26.749) Financing expense (896.589) (331.269) Financing expense, net (437.519) (102.948)
ÇALIK HOLDİNG A.Ş.
NOTES TO CONSOLIDATED FINANCIAL STATEMENTS
FOR THE YEAR ENDED 31 DECEMBER 2011
(Currency shown in thousands of US Dollars (USD) unless otherwise indicated.)

152
ÇALIK HOLDİNG A.Ş. NOTES TO CONSOLIDATED FINANCIAL STATEMENTS
FOR THE YEAR ENDED 31 DECEMBER 2011
(Currency shown in thousands of US Dollars (“USD”) unless otherwise indicated.)
68
35. SUPPLEMENTARY CASH FLOW INFORMATION 2011 2010 Adjustment to reconcile loss before taxation to net cash provided from operating activities: Depreciation expense 74.057 70.091 Amortization charge, note 19 15.166 6.352 Provision for/ (released from) employee termination benefits (4.768) 4.420 Interest expense, note 34 118.287 89.654 Interest received, note 34 (16.577) (24.885) Loss on sale of property, plant and equipment, note 33 687 2.144 Provision for expenses 19.019 4.171 Profit (loss) from sale of investment (5.975) 596 Profit on sale of property, plant and equipment, note 33 (576) (583) Fair value gain on financial assets (251.457) -- (52.137) 151.960
Changes in operating assets and liabilities:
Trade receivables (60.877) (157.589) Capital equivalency deposit 589 (4.243) Inventories (52.572) (95.711) Loans and advances to customers (435.410) (295.880) Construction contracts work in progress (56.034) 184.764 Placement and balances with banks 106.924 (43.913) Other assets 54.459 (155.226) Customer deposits 278.514 173.402 Trade payables (12.408) 433.608 Due to banks 260.586 105.730 Deferred billings 1.712 3.520 Other liabilities 42.319 231.980 127.802 380.442
Depreciation expense and amortization charged to: Cost of sales 55.356 42.195 Research and development expenses 780 437 Selling expenses 1.340 1.965 General and administrative expenses 29.109 27.587 Idle capacity depreciation expenses 2.167 2.903
88.752 75.087 Discontinued operations 471 1.356
89.223 76.443
ÇALIK HOLDİNG A.Ş.
NOTES TO CONSOLIDATED FINANCIAL STATEMENTS
FOR THE YEAR ENDED 31 DECEMBER 2011
(Currency shown in thousands of US Dollars (USD) unless otherwise indicated.)

153
ÇALIK HOLDİNG A.Ş. NOTES TO CONSOLIDATED FINANCIAL STATEMENTS
FOR THE YEAR ENDED 31 DECEMBER 2011
(Currency shown in thousands of US Dollars (“USD”) unless otherwise indicated.)
69
36. RELATED PARTY DISCLOSURE Parties are considered to be related if one party has the ability to control the other party or exercise significant influence over the other party in making the financial and operating decisions. For the purpose of these financial statements shareholders are referred to as related parties. Related parties also include individuals that are principle owners, management and members of the Company's Board of Directors and their families. 2011 2010
Related party Trade
receivables Other assets
Trade receivables
Other assets
Ministry of Textile Industry of Turkmenistan -- 2.691 -- 2.691 Serdar Pamyk Eğriği Fabriği 100 -- 100 -- Balkan Dokma YGPJ 114 -- 114 -- Shareholders -- 10.449 -- 52.944 Anateks Anadolu Pazarlama A.Ş. 891 -- 848 -- Anateks Anadolu Tekstil Fabrikası A.Ş. 5.944 -- 4.519 -- Other 255 82 -- 700 7.304 13.222 5.581 56.335 Unearned interest on receivables (-) (314) -- (19) -- 6.990 13.222 5.562 56.335
2011 2010
Trade
payables Other
liabilities Trade
payables Other
liabilities Shareholders -- 18 -- 38 Bursagaz Bursa Şehiriçi Doğal Gaz Dağıtım A.Ş. -- 445 2.699 126 Kayserigaz Kayseri Doğalgaz Dağıtım Pazarlama A.Ş -- 270 -- 141 Other 1.732 49.998 131 1 1.732 50.731 2.830 306 Unearned interest on receivables (-) -- -- (6) -- 1.732 50.731 2.824 306
ÇALIK HOLDİNG A.Ş.
NOTES TO CONSOLIDATED FINANCIAL STATEMENTS
FOR THE YEAR ENDED 31 DECEMBER 2011
(Currency shown in thousands of US Dollars (USD) unless otherwise indicated.)

154
ÇALIK HOLDİNG A.Ş. NOTES TO CONSOLIDATED FINANCIAL STATEMENTS
FOR THE YEAR ENDED 31 DECEMBER 2011
(Currency shown in thousands of US Dollars (“USD”) unless otherwise indicated.)
70
37. DISCONTINUED OPERATIONS As a result of Board of Directors’ decision dated 23.05.2011, Naturel Gaz, 40 % subsidiary of Çalık Enerji was sold to Enerji Yatırım Holding A. Ş. Naturel Gaz Sanayi ve Ticaret A.Ş. (“Naturel Gaz”) Naturel Gaz was established in 2004, in Istanbul. The principal activities are purchasing, compression, and delivery of natural gas as well as the fittings and installation works, and the necessary research studies made thereon. Profit and loss resulting from the operations of the subsidiaries which have been disposed were consolidated by eliminating all intercompany transactions until the date of cessation of control and presented in the statement income as discontinued operations in line with IFRS 5. a. Results of discontinued operations 2011 2010 Discontinued operations Revenue 3.696 10.139 Cost of sales (1.745) (4.649) Gross profit 1.951 5.490 Selling expenses (1.223) (4.100) General and administrative expenses (329) (944) Operating profit 399 446 Other income (expenses), net (50) 117 Financing income 14 238 Financing expense (154) -- Profit before taxation 209 801 Taxation on income 8 39
Profit for the year from discontinued operations 217 840
b. Cash flow from discontinued operations Net cash provided by operating activities (317) 530 Net cash provided by (used in) investing activities 1.584 1.434 Net cash used in financing activities (681) (1.445) 586 519
ÇALIK HOLDİNG A.Ş.
NOTES TO CONSOLIDATED FINANCIAL STATEMENTS
FOR THE YEAR ENDED 31 DECEMBER 2011
(Currency shown in thousands of US Dollars (USD) unless otherwise indicated.)

155
ÇALIK HOLDİNG A.Ş. NOTES TO CONSOLIDATED FINANCIAL STATEMENTS
FOR THE YEAR ENDED 31 DECEMBER 2011
(Currency shown in thousands of US Dollars (“USD”) unless otherwise indicated.)
71
38. FINANCIAL INSTRUMENTS Financial risk management objectives and policies A financial instrument is any contract that gives rise to the right to receive cash or another financial asset from another party or the obligation to deliver cash or another financial asset to another party. Financial instruments result in certain risks to the Group. The most significant risks facing the Group are discussed below: Credit risk The Group’s exposure to credit risk is limited to the carrying amount of financial assets recognized at the financial position date. Credit risk concerns the risk that a loss will be suffered by a party due to the reason that the other party to the transaction is unable to meet its obligations. The Group continuously monitors defaults of customers and other counterparties, identified either individually or by group, and incorporate this information into its credit risk controls. Where available at reasonable cost, external credit ratings and/or reports on customers and other counterparties are obtained and used. The Group’s policy is to deal only with creditworthy counterparties. In respect of trade and other receivables, the Group is not exposed to any significant credit risk exposure to any single counterparty or any group of counterparties having similar characteristics. The credit risk for liquid funds and other short-term financial assets is considered negligible, since the counterparties are reputable banks with high quality external credit ratings. Request for bank loans and advances to customers are reviewed and subjected to a screening procedure by the credit committee of Aktifbank and BKT prior to approval. Credit requests over certain amounts require the approval of the Board of Directors of each bank. There is a continuous focus on the quality of credits extended both at the time of approval and throughout their lives.
Bank Risk Committee is engaged with the grading of the customers and their scoring according to the proper categories. It decides the changes on grading and takes the necessary operations according to the monitoring procedures. The risk committee grades each loan according to these factors: · Ability to Pay · Financial Condition · Management ability · Collateral and Guarantors · Loan Structure · Industry and Economics Both BKT and Aktifbank hold collateral against bank loans and advances to customers in the form of mortgage interests over property, other registered securities over assets and guarantees. Interest rate risk Interest rate risk arises because changes in interest rates may affect profitability as disclosed in financial statements. The Group is subject to interest rate risk as a result of differences in balancing off the dates or timing differences related to assets and liabilities maturing or to be subjected to price revision. The Group manages its interest rate risk by applying risk management strategies whereby its strives to balance off the dates of changes in interest rates related to assets and liabilities. An increase in the variable interest rates related to the borrowings as of 31 December 2011 is not expected to have any material effect on the financial results because the Management of the Group is able to maintain existing loans on the same terms as before or negotiate new loans on the same terms as existing ones.
ÇALIK HOLDİNG A.Ş.
NOTES TO CONSOLIDATED FINANCIAL STATEMENTS
FOR THE YEAR ENDED 31 DECEMBER 2011
(Currency shown in thousands of US Dollars (USD) unless otherwise indicated.)

156
ÇALIK HOLDİNG A.Ş. NOTES TO CONSOLIDATED FINANCIAL STATEMENTS
FOR THE YEAR ENDED 31 DECEMBER 2011
(Currency shown in thousands of US Dollars (“USD”) unless otherwise indicated.)
72
The Treasury departments of the Banks manage the interest rate risk through monitoring the market conditions and taking necessary re-pricing or reallocation decisions with the approval of the Asset and Liability Committee. The sensitivity analysis has been determined based on the exposure to interest rates for both financial assets and financial liabilities assuming that their amounts outstanding at the financial position date were outstanding for the whole year. Liquidity risk Liquidity risk comprises the risk that the Group becomes unable to find its payment requirements. The Group manages its liquidity needs by carefully monitoring scheduled debt servicing payments for long-term financial liabilities as well as cash-outflows due in day-to-day business. Liquidity needs are monitored in various time bands, on a day-to-day and week-to-week basis, as well as on the basis of a rolling 30 day projection. Long term liquidity needs for a 180 day and 360 day lookout period are identified monthly. Aktifbank and BKT’s liquidity position are monitored and managed by the bank’s Treasury Department by daily tracking of cash availability at the branches and assuring, based on expected cash inflows and outflows, the availability of adequate liquidity maintained at branches as well as meeting its other obligations. Current Non-current
2011 Within 6
months 6 to 12
months 1 to
5 years Over 5
years Total Borrowings 910.290 207.753 621.437 129.192 1.868.672 Trade payables 788.666 50.980 1.011 -- 840.657 Due to banks 544.539 -- -- -- 544.539 Deferred billings -- 29.978 -- -- 29.978 Customer deposits 1.481.994 -- 98.383 -- 1.580.377 Other liabilities 69.872 143.664 290.954 -- 504.490
3.795.361 432.375 1.011.785 129.192 5.368.713
2010 Borrowings 419.959 316.138 824.074 182.769 1.742.940 Trade payables 851.365 3.329 1.244 -- 855.938 Due to banks 283.953 -- -- -- 283.953 Deferred billings -- 28.266 -- -- 28.266 Customer deposits 1.223.360 -- 78.503 -- 1.301.863 Other liabilities 96.999 87.035 244.522 -- 428.556 2.875.636 434.768 1.148.343 182.769 4.641.516
ÇALIK HOLDİNG A.Ş.
NOTES TO CONSOLIDATED FINANCIAL STATEMENTS
FOR THE YEAR ENDED 31 DECEMBER 2011
(Currency shown in thousands of US Dollars (USD) unless otherwise indicated.)

157
ÇALIK HOLDİNG A.Ş. NOTES TO CONSOLIDATED FINANCIAL STATEMENTS
FOR THE YEAR ENDED 31 DECEMBER 2011
(Currency shown in thousands of US Dollars (“USD”) unless otherwise indicated.)
73
Foreign currency risk Foreign currency risk is the risk that the value of financial instruments will fluctuate due to changes in foreign exchange rates. The Banking sector manages this risk by establishing and monitoring limits on open positions and also ensuring that these positions remain in compliance with the Bank guidelines and/or negotiations in the countries they operate. The Banking sector has in place procedures for the independent checking of open foreign currency positions. The Group other than the banking sector operates internationally. The majority of the Group’s transactions are carried out in Euros and US Dollars. Exposure to currency exchange rates arise from the Group’s overseas sales and purchases, trade receivables, bank borrowings and trade payables which are primarily denominated in US Dollars and Euros. Foreign exchange risk arises from future commercial transactions, recognized assets and liabilities and net investments in foreign operations. The Group manages its currency exposure risk by organizing a balanced distribution between its foreign currency assets and commitments and by matching off the liabilities and receivables and its net currency position. If the US Dollar (USD) increased or decreased in value against all other foreign currencies by 10% as of 31 December 2011 and if all other variable factors remained unchanged the results before tax would have been influenced favourably or unfavourably by USD 115.325 (2010 : USD 72.111) respectively for an increase and for a decrease in value of USD. As of the financial position date, currency position of Group is shown below:
USD EUR ('000)
JPY ('000)
LEK ('000)
SDR ('000)
Other ('000)
USD equivalent
2011 Cash and balances with Central Bank 57.264 167.165 -- 93.853 -- 2.320 281.200 Placement and balances with banks 32.482 63.382 -- 281 -- -- 114.500 Trade receivables 352.813 20.732 -- -- -- 4 379.640 Investment securities 102.455 96.474 -- 475.312 -- 10.707 265.038 Loans and advances to customers 191.943 483.091 -- 284.584 -- 2.074 835.227 Other assets 245.248 20.373 -- 8.912 -- 7.837 279.951 Total foreign currency assets 982.205 851.217 -- 862.942 -- 22.942 2.155.556 Borrowings 1.150.084 105.572 -- -- -- -- 1.286.670 Due to banks 75.475 104.892 -- 91.004 -- 4.626 220.987 Customer deposits 118.727 673.298 -- 770.613 -- 18.665 1.052.357 Trade payables 305.132 136.382 1.344.618 -- -- 911 499.816 Other liabilities 224.233 18.149 59.326 2.983 -- 332 248.980 Total foreign currency liabilities 1.873.651 1.038.293 1.403.944 864.600 -- 24.534 3.308.810 Net foreign currency position (891.446) (187.076) (1.403.944) (1.658) -- (1.592) (1.153.254)
ÇALIK HOLDİNG A.Ş.
NOTES TO CONSOLIDATED FINANCIAL STATEMENTS
FOR THE YEAR ENDED 31 DECEMBER 2011
(Currency shown in thousands of US Dollars (USD) unless otherwise indicated.)

158
ÇALIK HOLDİNG A.Ş. NOTES TO CONSOLIDATED FINANCIAL STATEMENTS
FOR THE YEAR ENDED 31 DECEMBER 2011
(Currency shown in thousands of US Dollars (“USD”) unless otherwise indicated.)
74
USD EUR ('000)
JPY ('000)
LEK ('000)
SDR ('000)
Other ('000)
USD equivalent
2010 Cash and balances with Central Bank 34.171 154.643 1.300.164 10.133 -- 1.068 256.225 Placement and balances with banks 35.475 56.287 -- 1 -- 3.611 113.690 Trade receivables 365.255 21.704 -- -- -- 274 394.296 Investment securities 138.781 82.023 -- 42.449 -- 12.509 260.410 Loans and advances to customers 170.292 275.274 -- 21.446 -- 3.115 538.466 Other assets 258.094 18.743 -- 173 -- 416 283.354 Total foreign currency assets 1.002.068 608.674 1.300.164 74.202 -- 20.993 1.846.441 Borrowings 1.258.348 93.514 -- -- -- 2.255 1.384.548 Due to banks 4.499 27.619 -- 2.229 -- -- 41.127 Customer deposits 83.203 382.653 -- 73.589 -- 16.404 607.486 Trade payables 146.967 4.419 -- -- -- 62 152.885 Other liabilities 73.910 219.869 1.300.005 2.822 -- 227 381.504 Total foreign currency liabilities 1.566.927 728.074 1.300.005 78.640 -- 18.948 2.567.550 Net foreign currency position (564.859) (119.400) 159 (4.438) -- 2.045 (721.109)
Capital risk management The Group’s capital management objectives are:
ensure the Group’s ability to continue as a going concern; and to provide an adequate return to shareholders,
by pricing products and services commensurately with the level of risk
The Group monitors capital on the basis of the carrying amount of equity plus its total of current and non current borrowings (net debt) less cash and cash equivalents as presented on the face of the consolidated financial position.
The Group sets the amounts of capital in proportion to its overall financing structure i.e. equity and financial liabilities. The Group manages the capital structure and makes adjustments to it in the light of changes in economic conditions and the risk characteristics of the underlying assets. In order to maintain or adjust the capital structure the Group may adjust the amount of dividends paid the shareholders, return capital to shareholders, issue new shares or sell assets to reduce debt.
Capital Management – Banks Aktifbank and BKT policy is to maintain a strong capital base so as to maintain investor, creditor and market confidence whilst at the same time complying with capital requirements and risk and/or capital adequacy ratios established by the Banking Regulator. Aktifbank and BKT have complied with all internally and externally imposed Capital requirements throughout the period.
ÇALIK HOLDİNG A.Ş.
NOTES TO CONSOLIDATED FINANCIAL STATEMENTS
FOR THE YEAR ENDED 31 DECEMBER 2011
(Currency shown in thousands of US Dollars (USD) unless otherwise indicated.)

159
ÇALIK HOLDİNG A.Ş. NOTES TO CONSOLIDATED FINANCIAL STATEMENTS
FOR THE YEAR ENDED 31 DECEMBER 2011
(Currency shown in thousands of US Dollars (“USD”) unless otherwise indicated.)
75
The Group’s capital to overall or financing ratio developed as follows:
2011 2010 Total borrowings (note 21) 1.868.672 1.742.940 Less: Cash and cash equivalents (note7) (455.039) (340.080) Net debt 1.413.633 1.402.860 Total equity 944.851 1.113.662 Overall financing 2.358.484 2.516.522 Net debt to overall financing ratio 60% 56% Fair value of financial instruments Fair value is the amount at which a financial instrument could be exchanged in a current transaction between willing parties, other than in a forced sale or liquidation, and is best evidenced by a quoted market price, if one exists.
The estimated fair values of financial instruments have been determined by the Group using available market information, management’s judgment and appropriate valuation methodologies. The following disclosure of the estimated fair value of financial instruments is made in accordance with the requirements of IAS 32. To the extent, relevant and reliable information is available from the financial markets in Turkey the fair value of the financial instruments of the Group is based on such market data. The fair values of the remaining financial instruments of the Group can only be estimated. The estimates presented herein are not necessarily indicative of the amounts the Group could realize in a current market exchange.
The following methods and assumptions were used to estimate the fair value of the Group’s financial instruments:
Financial assets Monetary assets for which fair value approximates carrying value: -Balances denominated in foreign currencies are translated at year-end exchange rates. The fair value of certain financial assets carried at cost, including cash and due from banks plus the respective accrued interest are considered to approximate their respective carrying values. -The carrying value of the trade receivables net of provisions for uncollectible are considered to approximate their fair values.
Financial liabilities Monetary liabilities for which fair value approximates carrying value: -The fair values of short-term bank loans and other monetary liabilities are considered to approximate their respective carrying values due to their short-term nature. -The fair values of long-term bank borrowings, which are denominated in foreign currencies and translated at year-end exchange rates, are considered to approximate their carrying values.
ÇALIK HOLDİNG A.Ş.
NOTES TO CONSOLIDATED FINANCIAL STATEMENTS
FOR THE YEAR ENDED 31 DECEMBER 2011
(Currency shown in thousands of US Dollars (USD) unless otherwise indicated.)

ENERGY
ÇALIK ENERJİ SAN. VE TİC. A.Ş.GENERAL MANAGEMENTYaşam Caddesi Ak Plaza Nr: 7 Kat: 17 Po Box: 06510 Söğütözü, Ankara, TurkeyTel: (00 90) 312 207 71 00Fax: (00 90) 312 207 71 71
HEAD OFFICEBüyükdere Caddesi Nr: 163 34394 Zincirlikuyu, İstanbul, TurkeyTel: (00 90) 212 306 50 00-97 Fax: (00 90) 212 306 29 66
ÇALIK ENERJİ ALBANIA OFFICETirana Business Center Bulevardi “Zogu 1” Tirana, AlbaniaTel: (00 355) 422 73 45 – 422 69 49Fax: (00 355) 422 73 39
ÇALIK ENERJİ TURKMENISTAN OFFICEAltın Asır Marketing Center Goroglu Street Nr: 77, 744000, Ashgabat, TurkmenistanTel: (00 99 312) 39 23 65Fax: (00 99 312) 39 23 79
ÇALIK ENERJİ FZEJafsa Viewvs 19 (Lob) 11.Floor Office No:1106 JAFZA / Dubai B.A.E.Tel: (00 971 4) 884 91 47Faks: (00 971 4) 884 91 48.
ÇALIK ENERJİ MOSCOW OFFICE115280,Ul. Leninskaya Sloboda 19, Etaj 5, Office: 21, Moscow, Russia FederationTel: (00 7 499) 995 04 91Fax: (00 7 499) 995 04 91
ÇALIK ENERJİ IRAQ OFFICE (POWER SYSTEMS)Al Wazırıyah Surveying 301/5th Street Nr:15 Baghdad, Iraq
ÇALIK ENERJİ NAVOİ OFİS Taşkent şehir, Mirzo Ulugbek semti, Afrosiyob sokağı, 14, ( Roison Business Center binası, 5. Kat ) Tashkent, OzbekistanTel: (00 998 71) 256 01 28, 256 01 29Faks:(00 998 71) 256 01 42.
ÇALIK ENERJİ DAPRAŞBüyükdere Cad.Nr:163 34394 Zincirlikuyu, Istanbul, TurkeyTel: (00 90) 212 306 50 17Fax: (00 90) 212 212 29 68
TAPCO PETROL BORU HATTI SANAYİ VE TİCARET A.Ş.Büyükdere Cad.No:163 3439 Zincirlikuyu, Istanbul, TurkeyTel: (00 90) 212 306 51 90Fax: (00 90) 212 306 58 90
YEŞİLIRMAK ELEKTRİK DAĞITIM A.Ş.(YEDAŞ)GENERAL MANAGEMENTMimar Sinan Mah. Atatürk Bul.Nr:19 55200 Atakum, Samsun, TurkeyTel: (00 90) 362 311 44 00Fax: (00 90) 362 400 42 05
ÇALIK HOLDİNG A.Ş.
Büyükdere Caddesi Nr: 163 34394 Zincirlikuyu – İstanbulTel: (00 90) 212 306 50 00 Fax: (00 90) 212 306 56 00
CO
NTA
CT

MINING
LİDYA MADENCİLİK SAN. VE TİC.A.Ş.Büyükdere Cad. Nr: 163 34394 Zincirlikuyu, İstanbul, TurkeyTel: (00 90) 212 306 52 46Fax: (00 90) 212 306 56 08
TELECOM
ALBTELECOMAutostrada Tirane - Durres Km 7. Tirana-AlbaniaTel: (00 355 4) 22 90 485Fax: (00 355 4) 22 32 200 'Rr. Myslym Shyri, Nr. 42, Tirana-Albania''Tel: (00 355 4) 238 7220
EAGLE MOBILEAutostrada Tirane - Durres Km 7. Tirana-AlbaniaTel: (00 355 4) 22 90 100Fax: (00 355 4) 22 32 200
İNŞAAT
GAP İNŞAAT YATIRIM VE DIŞ TİC. A.Ş.HEAD OFFICEKore Şehitleri Cad. Nr: 8 34394 Şişli, İstanbul, TurkeyTel: (00 90) 212 306 50 00Fax: (00 90) 212 306 56 00
GAP İNŞAAT TURKMENISTAN OFFICEAltı Garliyev Street.Nr:70 744028 Ashgabat, TurkmenistanTel: (00 99 312) 42 51 37 - 42 93 89Fax: (00 99 312) 42 51 40
SUDAN OFFICE OF GAP İNŞAATPlot Nr: 10 Block 2 Khartoum Almanshia Town, SudanTel: (00 249) 183 277 341Fax: (00 249) 183 273 377
DUBAI FZE OF GAP İNŞAATPo Box 54605 Dubai, U.A.E.Tel: (00 971 4) 361 51 71Fax: (00 971 4) 361 51 70
GAP İNŞAAT SAUDI ARABIA OFFICEKing Abdullah Street. Arabian Business Center Nr: 206 Po Box 1838 Jeddah, Saudi ArabiaTel: (00 966 2) 614 56 90Fax: (00 966 2) 614 56 93
IRAQ OFFICE OF GAP İNŞAATInternational Airport Street Hay-Al Amil Entry Karih District BaghdadTel: (00 90) 212 306 50 51
ÇALIK GAYRİMENKUL TİC. A.Ş.Kore Şehitleri Cad.Nr:8 34394 Şişli, İstanbul, TurkeyTel: (00 90)212 306 50 00Fax: (00 90)212 306 56 00
TARLABAŞI OFFICETarlabaşı Bulvarı. Nr: 59 Beyoğlu, İstanbul, TurkeyTel: (00 90) 212 293 38 02
BURHANİYE OFFICEBurhaniye Mah. Tunuslu Mahmutpaşa Cad. Nr: 2 TOKİ Emlak Konutları İstanbul, TurkeyTel: (00 90)216 557 51 50
161
TEXTILES
GAP GÜNEYDOĞU TEKSTİL SAN.ve TİC. A.Ş.HEAD OFFICEKeresteciler Sitesi, Fatih Cad. Ladin Sok. Nr:17 34169 Merter, Istanbul, TurkeyTel: (00 90) 212 459 26 26Fax: (00 90) 212 677 41 17
FACTORYOrganize San. Böl. 2. Cad. Malatya, TurkeyTel: (00 90) 422 237 54 18-19-20Fax: (00 90) 422 237 54 17
ITALY OFFICEVia Tommaso Salsa 71, 31030 Mignagola Di Cabonera (TV), ItalyTel: (00 39) 422 44 50 66Fax: (00 39) 422 69 92 55
KOREA OFFICESeocho-Gu , GangnamDaero6Gil 88, 401 (Yangjae-Dong, Jeongam Seul, KoreaTel: 00 822 821 0185
GAP PAZARLAMA A.Ş.HEAD OFFICEKore Şehitleri Cad.Nr:8 34394 Şişli, İstanbul, TurkeyTel: (00 90) 212 306 50 00Fax: (00 90) 212 306 56 00
ÇALIK USA, INC.295 5th Avenue Suite 1021 New York, N.Y 10016 U.S.A.Tel: (00 1)212 481 71 00Fax: (00 1)212 481 71 02
GAP-PA TEXTILES INC.295 5th Avenue Suite 1021 New York, N.Y 10016 U.S.A.Tel: (00 1)212 481 71 00Fax: (00 1) 212 481 71 02
TURKMENBASHI TEXTILE COMPLEXAltı Garliyev Street Nr: 70 744028 Ashgabat, TurkmenistanTel: (00 99 312) 42 83 05Fax: (00 99 312) 42 83 24
TURKMENBASHI JEANS COMPLEXTurkmen Main Road, 14th Km Ashgabat, TurkmenistanTel: (00 99 312) 51 00 05 - 07 - 08Fax: (00 99 312) 51 00 06
SERDAR COTTON SPINNER FABRICKakha Etrap Ahal Velayet, TurkmenistanTel: (00 99 312) 51 14 69Fax: (00 99 312) 51 00 04
BALKAN DOKUMA A/OMagistral Ashgabat Turkmenbashi, Nr: 1, Serdar Saheri, Balkan Velayet, TurkmenistanTel: (00 99 800) 246 22 770

FINANCE
AKTİF YATIRIM BANKASIAktif Bank Call Center: 444 30 50
GENERAL MANAGEMENTBüyükdere Cad.Nr:163/A 34394 Zincirlikuyu, Şişli, Istanbul, TurkeyTel: (00 90) 212 340 80 00Fax: (00 90) 212 340 88 01
AKTİF BANK ISTANBUL BRANCHBüyükdere Cad. Nr: 163 34394 Zincirlikuyu, Şişli, İstanbul, TurkeyTel: (00 90) 212 340 80 40Fax: (00 90) 212 340 80 80
AKTİF BANK BURSA BRANCHMudanya Yolu Sanayi Cad. Akpınar Mah. Nr: 398 16200 Osmangazi Bursa, TurkeyTel: (00 90) 224 242 62 72Fax: (00 90) 224 242 41 42
AKTİF BANK GAZİANTEP BRANCHİncilipınar Mah. Kıbrıs Cad. Ataseven Apt. A Blok Nr:8-9 27090 Şehitkamil, Gaziantep, TurkeyTel: (00 90) 342 324 79 00Fax: (00 90) 342 324 79 06
AKTİF BANK KAYSERİ BRANCHOsman Kavuncu Cad. Nr: 8/3 191/1 38060 Melikgazi, Kayseri, TurkeyTel : (00 90) 352 336 84 00Fax: (00 90) 352 336 95 15
AKTİF BANK SAKARYA BRANCHYenicami Mah. Sakarya Cad. Nr: 16 Adapazarı, Sakarya, TurkeyTel: (00 90) 264 278 84 00Fax: (00 90) 264 278 18 22
AKTİF BANK DÜZCE BRANCHKültür Mah. Kuyumcuzade Bul. Nr: 96/A-B-C Düzce, TurkeyTel: (00 90) 380 523 51 50Fax: (00 90) 380 523 86 15
162
E-KENT
GENERAL DIRECTORATEHamitler Mah. Sanayi Cad. Çalıskan İş Merkezi Kat:1 D:2Osmangazi, Bursa, TurkeyTel: (00 90) 224 242 46 07 - 0224 242 46 56Fax: (00 90) 224 242 73 87
ISTANBUL REGIONAL DIRECTORATEBüyükdere Caddesi No:163 Zincirlikuyu, Sisli 34394 Istanbul, TurkeyTel: (00 90) 212 340 88 50-51Fax: (00 90) 212 340 88 91
KAYSERİ REGIONAL DIRECTORATEOsmankavuncu Caddesi Sehit Cengiz Sabuncu Sokak Yıldız Sitesi8/3 Melikgazi, Kayseri, TurkeyTel: (00 90) 352 336 77 73(pbx)Fax: (00 90) 352 336 99 20
GAZİANTEP REGIONAL DIRECTORATEİncilipınar Mahallesi 4 nolu Cadde Kazaz İş Merkezi No:17Sehitkamil, Gaziantep, TurkeyTel: (00 90) 342 231 70 03Fax: (00 90) 342 231 70 06
KÜTAHYA REGIONAL DIRECTORATEAdnan Menderes Cad. No: 34 Kütahya, TurkeyTel: (00 90) 274 223 13 38Fax: (00 90) 274 223 17 41
SAKARYA REGIONAL DIRECTORATEYenicami Mah. Sakarya Cad. No: 16 Adapazarı, Sakarya, TurkeyTel: (00 90) 264 273 64 26
DÜZCE REGIONAL DIRECTORATEKültür Mah. Kuyumcuzade Bulvarı Muratbey Sok. No:6/1 Düzce, TurkeyTel: (00 90) 380 524 32 75
BKT
Bulevardi Zhan D’ark Tirana, AlbaniaTel: (00 355) 425 09 61Fax: (00 355) 425 09 56

163
MEDIA
TURKUVAZ MEDIABarbaros Bulvarı No:153 34349 Balmumcu, Besiktas, İstanbul, TurkeyTel: (00 90) 212 354 30 00
TURKUVAZ BOOKBarbaros Bulvarı No:153 34349 Balmumcu, Besiktas, İstanbul, TurkeyTel: (00 90) 212 354 30 00Fax: (00 90) 212 288 50 67
TURKUVAZ MAGAZINEIhlamur Yıldız Cad.No:10 Toprak Center 34353Yıldız-Besiktas/ İstanbul, TurkeyTel: (00 90) 212 326 33 34Fax: (00 90) 212 354 37 92
TURKUVAZ DISTRIBUTIONSabah 2000 Tesisleri Akpınar Mah. Hasanbasri Cad. No:4Samandıra, Kartal, İstanbul, TurkeyTel: (00 90) 216 585 90 00
TURKUVAZ PRINTING PRESSSabah 2000 Tesisleri Akpınar Mah. Hasanbasri Cad. No:4Samandıra, Kartal, İstanbul, TurkeyTel: (00 90 216) 585 90 00
SABAHBarbaros Bulvarı No:153 34349 Balmumcu, Besiktas, İstanbul, TurkeyTel: (00 90) 212 354 30 00
TAKVİMBarbaros Bulvarı No:153 34349 Balmumcu, Besiktas, İstanbul, TurkeyTel: (00 90 212) 354 30 00
FOTOMAÇBarbaros Bulvarı No:153 34349 Balmumcu, Besiktas, İstanbul, TurkeyTel: (00 90) 212 354 30 00
SABAH ANKARAÇetin Emeç Bulvarı,No:117 Balgat/Ankara, TurkeyTel: (00 90) 312 583 50 50Fax: (00 90) 312 473 99 99
YENİ ASIRGaziosmanpasa Bulvarı No:5 35210 Çankaya, İzmir, TurkeyTel: (00 90) 232 441 50 00Fax: (00 90) 232 446 42 22
ATVIhlamur Yıldız Cad.No:10 Toprak Center 34353Yıldız-Besiktas/ İstanbul, TurkeyTel: (00 90) 212 300 66 66Fax: (00 90) 212 227 40 39
ATV EUROPEBarbaros Bulvarı No:153 34349 Balmumcu, Besiktas, İstanbul, TurkeyTel: (00 90) 212 354 30 00
ATV GERMANYGmbh WaldeckerstraBe 6 64546 MörfeldenTel: (0049 0) 6105,975 09 12Fax: (0049 0) 6105, 975 09 35
İZMİR TVGaziosmanpasa Bulvarı No:5 35210 Çankaya, İzmir, TurkeyTel: (00 90) 232 441 50 00Fax: (00 90) 232 446 42 22

