2011 division iii
TRANSCRIPT
Division III RecordsIndividual Records ....................................... 2Team Records ................................................ 7Annual Champions,
All-Time Leaders ....................................... 9Team Champions ......................................... 30All-Time Team Won-Lost Records ......... 32Winningest Football Teams
of the 2000s ................................................ 34National Poll Rankings ............................... 35Undefeated, Untied Teams ...................... 36Streaks and Rivalries ................................... 39Trophy Games ............................................... 39Overtime Games .......................................... 40Division III Stadiums ................................... 41Division III Statistics Trends ...................... 43Division III Classification History............ 46
Offi cial national statistics for all nonmajor four-year colleges began in 1946 with a limited post-season survey. In 1948, the service was expanded to include weekly individual and team statistics rankings in all categories except interceptions, fi eld goals, punt returns and kickoff returns; these categories were added to offi cial individual rank-ings and records in 1970. In 1992, statistics compi-lations for individual all-purpose yards and team net punting, punt returns, kickoff returns and turnover margin were begun. In 2000, defensive team and individual statistics were added.For many years, individual rankings were by to-tals. Beginning in 1970, most season individual rankings were by per-game averages. In total of-fense, receiving yards, all-purpose yards, rushing and scoring, yards or points per game determine rankings; in receiving and interceptions, catches per game; in punt and kickoff returns, yards per return; and in fi eld goals, number made per game. Punting always has been by average, and all team rankings have been per game.Beginning in 1979, passers were ranked in all divi-sions on effi ciency rating points, and team pass defense rankings changed to the same rating system in 1990.Before 1967, rankings and records included all four-year colleges that reported their statistics to the NCAA. Beginning with the 1967 season, rank-ings and records included only members of the NCAA.
In 1973, College Division teams were divided into Division II and Division III under a three-division reorganization plan adopted by the special NCAA Convention on August 1, 1973. Career records of players include only those years in which they competed in Division II.Before 2002, postseason games were not in-cluded in NCAA fi nal football statistics or records. Beginning with the 2002 season, all postseason games were included in NCAA fi nal football sta-tistics and records.Collegiate records for all NCAA divisions can be determined by comparing records for all four di-visions.Before 2002, all individual and team statistics rankings include regular-season games only.A player whose career includes statistics for parts of fi ve seasons (or an active player who will play in fi ve seasons) because he was granted an addi-tional season of competition for reasons of hard-ship or a freshman redshirt, is denoted by “$.”
NCAA DEFENSIVE FOOTBALL STATISTICS COMPILATION POLICIESAll individual defensive statistics reported to the NCAA must be compiled by the press box statis-tics crew during the game. Defensive numbers compiled by the coaching staff or other univer-sity/college personnel using game fi lm will not be considered “offi cial” NCAA statistics.
This policy does not preclude a conference or institution from making after-the-game changes to press box numbers. This is consistent with ex-isting NCAA policies involving corrections to any off ensive statistics after a contest. Any changes to press box numbers must be obvious errors, such as misidentifi ed players, and this should not be interpreted as a way for press box statistics to be later “updated” by the coaching fi lms. Changes should be made within one week after the game is played. Statisticians also are reminded that NCAA policy does not permit changes to away-game statistics unless approved by the home sports information director.It is important to note that this policy applies ONLY to offi cial NCAA statistics and national rank-ings, and does not mean a coaching staff cannot compile separate defensive statistics for institu-tional use. Those compilations also could appear in the institution’s press releases and/or website, as long as they are identifi ed as coaching fi lm numbers rather than offi cial statistics as used by the NCAA.The NCAA statistics staff reserves the right to review any statistics provided to the national of-fi ce and may withhold publishing/posting those numbers until the accuracy of those statistics can be substantiated.
2 INDIVIDUAL RECORDS
Individual RecordsDivision III football records are based on the per-formances of Division III teams since the three-division reorganization plan was adopted by the special NCAA Convention in August 1973.
Total Offense(Rushing Plus Passing)
MOST PLAYSQuarter
37—Justin Peery, Westminster (MO) vs. MacMurray, Nov. 14, 1998 (4th)
Half59—Justin Peery, Westminster (MO) vs. Bethel (TN), Nov.
8, 1997 (2nd); Mike Wallace, Ohio Wesleyan vs. Denison, Oct. 3, 1981 (2nd)
Game98—Shane Brozowski, Castleton vs. Norwich, Nov. 6, 2010
(28 rushes, 70 passes; 419 yards); Mackenzie McGrady, Alma vs. Wis.-River Falls, Sept. 26, 2009 (14 rushes, 84 passes; 606 yards); Justin Peery, Westminster (MO) vs. MacMurray, Nov. 14, 1998 (21 rushes, 77 passes; 628 yards)
Season662—Steve Slowke, Alma, 2001 (3,630 yards)Also holds per-game record with 66.2 (662 in 10)
Career2,240—Josh Vogelbach, Guilford, 2005-08 (13,904 yards)Also holds per-game record with 56.0 (2,240 in 40)
MOST PLAYS BY A FRESHMANSeason
571—Greg Troutman, Juniata, 2001 (3,122 yards)Also holds per-game record with 57.1 (571 in 10)
MOST YARDS GAINEDHalf
517—Justin Peery, Westminster (MO) vs. Bethel (TN), Nov. 8, 1997 (497 passing, 20 rushing)
Game723—Zamir Amin, Menlo vs. Cal Lutheran, Oct. 7, 2000
(731 passing, -8 rushing)Season
4,663—Brett Elliott, Linfield, 2004 (68 rushing, 4,595 pass-ing) (13 games)
Per-game record—465.1, Justin Peery, Westminster (MO), 1998 (4,651 in 10)
Career14,231—Jason Boltus, Hartwick, 2005-08 (955 rushing,
13,276 passing)Per-game record—364.6, Brett Elliott, Linfield, 2004-05
(8,751 in 24)
MOST YARDS GAINED BY A FRESHMANSeason
3,638—Josh Vogelbach, Guilford, 2005 (538 plays)Also holds per-game record with 363.8 (3,638 in 10)
MOST GAMES GAINING 300 YARDS OR MORESeason
10—Jason Boltus, Hartwick, 2007 (played 11 games); Josh Brehm, Alma, 2006 (entire season)
Career26—Kirk Baumgartner, Wis.-Stevens Point, 1986-89
MOST CONSECUTIVE GAMES GAINING300 YARDS OR MORESeason
10—Josh Brehm, Alma, 2006 (entire season)
GAINING 4,000 YARDS RUSHINGAND 2,000 YARDS PASSINGCareer
Chris Spriggs, Denison, 1983-86 (4,248 rushing & 2,799 passing)
GAINING 3,000 YARDS RUSHINGAND 3,000 YARDS PASSINGCareer
Clay Sampson (TB), Denison, 1977-80 (3,726 rushing & 3,194 passing)
HIGHEST AVERAGE GAIN PER PLAYSeason
(Min. 2,500 yards) 12.4—Adam Ryan, Wilmington (OH), 1999 (280 for 3,478)
Career(Min. 6,000 yards) 9.8—Brett Elliott, Linfield, 2004-05 (895
for 8,751)(Min. 10,000 yards) 8.4—Bill Borchert, Mount Union, 1994-
97 (1,274 for 10,639)
MOST TOUCHDOWNS RESPONSIBLE FOR(TDs Scored and Passed For)Career
166—Justin Peery, Westminster (MO), 1996-99 (148 pass-ing, 18 rushing)
Also holds per-game record with 4.3 (166 in 39)
RushingMOST RUSHESGame
59—John Ortiz, King’s (PA) vs. Albright, Sept. 24, 2005 (267 yards)
Season463—Dante Washington, Carthage, 2004 (1,990 yards)
(13 games)Per-game record—38.0, Mike Birosak, Dickinson, 1989
(380 in 10)Career
1,190—Steve Tardif, Maine Maritime, 1996-99 (6,093 yards)
Per-game record—32.7, Chris Sizemore, Bridgewater (VA), 1972-74 (851 in 26)
MOST RUSHES BY A QUARTERBACKSeason
261—Chris Sharpe, Springfield, 2006 (1,941 yards)Per-game record—25.7, Jeff Saueressig, Wis.-River Falls,
1988 (231 in 9)
MOST CONSECUTIVE RUSHESBY THE SAME PLAYERGame
46—Dan Walsh, Montclair St. vs. Ramapo, Sept. 30, 1989 (during 13 possessions)
Season51—Dan Walsh, Montclair St., 1989 (Sept. 23 to Sept. 30)
MOST YARDS GAINEDHalf
370—Garet Lynch, Brockport vs. Hartwick, Nov. 22, 2008 (26 rushes)
Game441—Dante Brown, Marietta vs. Baldwin-Wallace, Oct.
5, 1996Season
2,790—Nate Kmic, Mount Union, 2008 (377 rushes)Per-game record—238.5, Dante Brown, Marietta, 1996
(2,385 in 10)Career
8,074—Nate Kmic, Mount Union, 2005-08 (1,189 rushes)Per-game record—187.1, Tony Sutton, Wooster, 2002-04
(5,613 in 30)
LONGEST RUSH99 yards—14 times. Most recent: Keith Welch, Lewis &
Clark vs. Pacific Lutheran, Oct. 30, 2010; Neil Suckow, Coe vs. Simpson, Nov. 12, 2005; Jay Bernardo, Rensselaer vs. Endicott, Sept. 10, 2005
MOST YARDS GAINED BY A FRESHMANSeason
2,176—Robert Heller, Waynesburg, 2007 (383 rushes)Also holds per-game record with 197.8 (2,176 in 11)
MOST RUSHING YARDS GAINEDBY A QUARTERBACKGame
342—Matt Roe, Augustana (IL) vs. Wheaton (IL), Nov. 13, 2004 (44 rushes)
Season1,941—Chris Sharpe, Springfield, 2006 (261 rushes)Also holds per-game record with 161.8 (1,941 in 12)
Career4,152—Chris Sharpe, Springfield, 2004-07 (633 rushes)
LONGEST RUSH BY A QUARTERBACKGame
98 yards—Jon Hinds, Principia vs. Illinois Col., Sept. 20, 1986 (TD)
MOST GAMES GAINING 100 YARDS OR MORECareer
36—Nate Kmic, Mount Union, 2005-08 (56 games)
MOST CONSECUTIVE GAMES GAINING 100 YARDS OR MORECareer
32—R.J. Bowers, Grove City, Oct. 4, 1997-Oct. 14, 2000
MOST CONSECUTIVE GAMES GAINING 100 YARDS OR MORE BY A QUARTERBACKSeason
5—Eric Hyten, Rose-Hulman, 1996
MOST GAMES GAINING 200 YARDS OR MORESeason
8—Ricky Gales, Simpson, 1989 (consecutive)Career
16—R.J. Bowers, Grove City, 1997-00 (40 games)
MOST SEASONS GAINING 1,000 YARDSOR MORECareer
4—Nate Kmic, Mount Union, 2005-08; Steve Tardif, Maine Maritime, 1996-99; Carey Bender, Coe, 1991-94; Steve Dixon, Beloit, 1990-93; Jim Romagna, Loras, 1989-92; Joe Dudek, Plymouth St., 1982-85; Rich Kowalski, Hobart, 1972-75
TWO PLAYERS, SAME TEAM, EACHGAINING 1,000 YARDS OR MORESeason
By 14 teams. Most recent: Jim Bower (FB) 1,916 & Matthew Rende (QB) 1,333, Maine Maritime, 2010
MOST YARDS GAINED BY TWO PLAYERS, SAME TEAMGame
523—Jarvis Thrasher (324) & Quincy Daniels (199), Mary Hardin-Baylor vs. Mississippi Col., Oct. 20, 2007
Season3,305—Nate Kmic (RB) 2,790 & Greg Micheli (QB) 515,
Mount Union, 2008 (15 games)
TWO PLAYERS, SAME TEAM, EACH GAINING 200 YARDS OR MOREGame
Jon Berg (213) & Fred Lee (204), Denison vs. Kenyon, Oct. 28, 2006 (2 ot)
HIGHEST AVERAGE GAIN PER RUSHGame
(Min. 15 rushes) 19.4—Oliver Jordan, Emory & Henry vs. Greensboro, Oct. 3, 1998 (16 for 310)
(Min. 24 rushes) 15.9—Pete Baranek, Carthage vs. North Central (IL), Oct. 5, 1985 (24 for 382)
Season(Min. 150 rushes) 8.96—Jarvis Thrasher, Mary Hardin-
Baylor, 2007 (212 for 1,899)(Min. 250 rushes) 7.6—Carey Bender, Coe, 1994 (295 for
2,243)Career
(Min. 500 rushes) 7.1—Joe Dudek, Plymouth St., 1982-85 (785 for 5,570)
MOST TOUCHDOWNS SCORED BY RUSHINGGame
8—Carey Bender, Coe vs. Beloit, Nov. 12, 1994Season
43—Nate Kmic, Mount Union, 2008 (15 games)Per-game record—3.4, R.J. Bowers, Grove City, 1998 (34
in 10)Career
125—Nate Kmic, Mount Union, 2005-08 (56 games)Per-game record—2.3, R.J. Bowers, Grove City, 1997-00
(91 in 40)
MOST RUSHING TOUCHDOWNS SCOREDBY A QUARTERBACKSeason
35—Chris Sharpe, Springfield, 2006 (12 games)Also holds per-game record with 2.9 (35 in 12)
Career70—Chris Sharpe, Springfield, 2004-06Also holds per-game record with 1.7 (70 in 41)
INDIVIDUAL RECORDS 3
PassingHIGHEST PASSING EFFICIENCY RATING POINTSSeason
(Min. 15 atts. per game) 225.0—Mike Simpson, Eureka, 1994 (158 attempts, 116 completions, 5 interceptions, 1,988 yards, 25 TDs)
(Min. 25 atts. per game) 216.7—Bill Borchert, Mount Union, 1997 (272 attempts, 190 completions, 1 interception, 2,933 yards, 47 TDs)
Career(Min. 325 comps.) 197.4—Greg Micheli, Mount Union,
2005-08 (780 attempts, 578 completions, 9 intercep-tions, 8,479 yards, 81 TDs)
(Min. 650 comps.) 194.2—Bill Borchert, Mount Union, 1994-97 (1,009 attempts, 671 completions, 17 intercep-tions, 10,201 yards, 141 TDs)
MOST PASSES ATTEMPTEDQuarter
31—Mike Wallace, Ohio Wesleyan vs. Denison, Oct. 3, 1981 (4th)
Half57—Justin Peery, Westminster (MO) vs. Bethel (TN), Nov.
8, 1997 (2nd); Mike Wallace, Ohio Wesleyan vs. Denison, Oct. 3, 1981 (2nd)
Game84—Evan Jones, Carthage vs. North Central (IL), Oct. 17,
2009 (completed 47); Mackenzie McGrady, Alma vs. Wis.-River Falls, Sept. 26, 2009 (completed 52)
Season575—Brett Dietz, Hanover, 2003 (completed 360)Per-game record—56.4, Jordan Poznick, Principia, 1992
(451 in 8)Career
1,982—Josh Vogelbach, Guilford, 2005-08 (completed 1,189)
Also holds per-game record with 49.6 (1,982 in 40)
MOST PASSES ATTEMPTED BY A FRESHMANSeason
475—Josh Vogelbach, Guilford, 2005 (completed 280)Per-game record—50.3, Mark Novara, Lakeland, 1994
(453 in 9)
MOST PASSES COMPLETEDQuarter
21—Rob Bristow, Pomona-Pitzer vs. Whittier, Oct. 19, 1985 (4th)
Half36—Mike Wallace, Ohio Wesleyan vs. Denison, Oct. 3,
1981 (2nd)Game
56—Brandon Luczak, Kalamazoo vs. Hope, Nov. 14, 2009 (attempted 79)
Season360—Brett Dietz, Hanover, 2003 (attempted 575)Per-game record—32.9, Justin Peery, Westminster (MO),
1999 (329 in 10)Career
1,189—Josh Vogelbach, Guilford, 2005-08 (attempted 1,982)
Also holds per-game record with 29.7 (1,189 in 40)
MOST PASSES COMPLETED BY A FRESHMANSeason
280—Josh Vogelbach, Guilford, 2005 (attempted 475)Also holds per-game record with 28.0 (280 in 10)
HIGHEST PERCENTAGE OF PASSES COMPLETEDGame
(Min. 20 comps.) 91.3%—Mitch Tanney, Monmouth (IL) vs. Knox, Nov. 5, 2005 (21 of 23); Chris Esterley, St. Thomas (MN) vs. St. Olaf, Sept. 23, 1995 (21 of 23)
(Min. 35 comps.) 83.3%—Scott Driggers, Colorado Col. vs. Neb. Wesleyan, Sept. 10, 1983 (35 of 42)
Season(Min. 250 atts.) 75.0%—Greg Micheli, Mount Union, 2008
(240 of 320)Career
(Min. 750 atts.) 74.1%—Greg Micheli, Mount Union, 2005-08 (578 of 780)
(Min. 1,000 atts.) 68.1%—Bobby Swallow, Wash. & Jeff., 2005-08 (697 of 1,023)
MOST CONSECUTIVE PASSES COMPLETEDGame
21—Chris Edwards, Wash. & Jeff. vs. Allegheny, Sept. 17, 2005 (first 21 attempts of game)
Season29—Chris Edwards, Wash. & Jeff., 2005 (completed
last 8 attempts vs. Hanover, Sept. 10, and first 21 vs. Allegheny, Sept. 17)
MOST CONSECUTIVE PASSES COMPLETEDBY TWO PLAYERS, SAME TEAMGame
20—Kevin Keefe (16) & David Skarupa (4), Baldwin-Wallace vs. Moravian, Sept. 10, 1994
MOST PASSES HAD INTERCEPTEDGame
8—Jason Clark, Ohio Northern vs. John Carroll, Nov. 9, 1991; Jim Higgins, Brockport vs. Buffalo St., Sept. 29, 1990; Dennis Bogacz, Wis.-Oshkosh vs. Wis.-Stevens Point, Oct. 29, 1988; Kevin Karwath, Canisius vs. Liberty, Nov. 19, 1979
Season43—Steve Hendry, Wis.-Superior, 1982 (attempted 480)Also holds per-game record with 3.9 (43 in 11)
Career117—Steve Hendry, Wis.-Superior, 1980-83 (attempted
1,343)Per-game record—3.2, Willie Martinez, Oberlin, 1973-74
(58 in 18)
LOWEST PERCENTAGE OF PASSES HAD INTERCEPTEDSeason
(Min. 150 atts.) 0.3%—Brad Boyle, Coe, 2009 (1 of 345)Career
(Min. 750 atts.) 1.2%—Greg Micheli, Mount Union, 2005-08 (9 of 780)
(Min. 1,000 atts.) 1.5%—Bobby Swallow, Wash. & Jeff., 2005-08 (15 of 1,023)
MOST CONSECUTIVE PASSES ATTEMPTED WITHOUT INTERCEPTIONGame
77—Justin Peery, Westminster (MO) vs. MacMurray, Nov. 14, 1998 (completed 50)
Season305—Brad Boyle, Coe, 2009 (during 10 games; began
Sept. 5 vs. Augustana [IL], ended Nov. 14 vs. Cornell College)
MOST YARDS GAINEDHalf
497—Justin Peery, Westminster (MO) vs. Bethel (TN), Nov. 8, 1997 (2nd)
Game731—Zamir Amin, Menlo vs. Cal Lutheran, Oct. 7, 2000
Season4,595—Brett Elliott, Linfield, 2004 (13 games)Per-game record—450.1, Justin Peery, Westminster (MO),
1998 (4,501 in 10)Career
13,605—Josh Vogelbach, Guilford, 2005-08 (40 games)Per-game record—358.9, Brett Elliott, Linfield, 2004-05
(8,614 in 24)
LONGEST COMPLETION99 yards—30 times. Most recent: Sam Landry to Cory
McCain, Kalamazoo vs. Benedictine (IL), Sept. 25, 2010; Jordan Becker to Chad Arlt, Gust. Adolphus vs. St. Thomas (MN), Oct. 4, 2008
MOST YARDS GAINED BY A FRESHMANSeason
3,549—Josh Vogelbach, Guilford, 2005Also holds per-game record with 354.9 (3,549 in 10)
MOST GAMES PASSING FOR 200 YARDSOR MORESeason
13—Rocky Pentello, Capital, 2006; Roy Hampton, Trinity (TX), 2002
Career34—Joel Steele, Anderson (IN), 2000-03
MOST CONSECUTIVE GAMES PASSINGFOR 200 YARDS OR MORESeason
13—Rocky Pentello, Capital, 2006; Roy Hampton, Trinity (TX), 2002
Career27—Keith Bishop, Ill. Wesleyan/Wheaton (IL), 1981,
1983-85
MOST GAMES PASSING FOR 300 YARDS OR MORESeason
9—Ben McLaughlin, Louisiana Col., 2010; Josh Brehm, Alma, 2006; Justin Peery, Westminster (MO), 1999; Kirk Baumgartner, Wis.-Stevens Point, 1989
Career24—Kirk Baumgartner, Wis.-Stevens Point, 1986-89
MOST CONSECUTIVE GAMES PASSINGFOR 300 YARDS OR MORESeason
9—Ben McLaughlin, Louisiana Col., 2010 (began Sept. 11 vs. Huntingdon, through Nov. 13 vs. Hardin-Simmons); Josh Brehm, Alma, 2006 (began Sept. 16 vs. Wis.-Eau Claire, through Nov. 11 vs. Adrian); Kirk Baumgartner, Wis.-Stevens Point, 1989 (began Sept. 9 vs. St. Norbert, through Nov. 4 vs. Wis.-Superior)
Career13—Kirk Baumgartner, Wis.-Stevens Point, 1988-89
(began Oct. 22, 1988, vs. Wis.-Stout, through Nov. 4, 1989, vs. Wis.-Superior)
MOST YARDS GAINED BY TWO OPPOSING PLAYERSGame
1,020—Josh Wakefield, Alma (569) & Travis McMahen, Franklin (451), Sept. 25, 1999 (completed 60 of 109)
MOST YARDS GAINED PER ATTEMPTSeason
(Min. 175 atts.) 12.9—Willie Seiler, St. John’s (MN), 1993 (205 for 2,648)
(Min. 275 atts.) 11.7—Greg Micheli, Mount Union, 2008 (320 for 3,743)
Career(Min. 950 atts.) 10.1—Bill Borchert, Mount Union, 1994-97
(1,009 for 10,201)
MOST YARDS GAINED PER COMPLETIONSeason
(Min. 100 comps.) 19.7—David Parker, Bishop, 1981 (114 for 2,242)
(Min. 200 comps.) 16.6—Kurt Rocco, Mount Union, 2009 (236 for 3,926)
Career(Min. 300 comps.) 18.3—David Parker, Bishop, 1981-84
(378 for 6,934)(Min. 600 comps.) 16.6—Jason Boltus, Hartwick, 2005-08
(801 for 13,276)
MOST TOUCHDOWN PASSESQuarter
5—David Sullivan, Williams vs. Hamilton, Oct. 30, 1993 (2nd)
Game9—Joe Zarlinga, Ohio Northern vs. Capital, Nov. 14, 1998
Season61—Brett Elliott, Linfield, 2004 (13 games)Per-game record—5.4, Justin Peery, Westminster (MO),
1999 (54 in 10)Career
148—Justin Peery, Westminster (MO), 1996-99Per-game record—4.6, Brett Elliott, Linfield, 2004-05 (110
in 24)
HIGHEST PERCENTAGE OF PASSES ATTEMPT-ED FOR TOUCHDOWNSSeason
(Min. 200 atts.) 17.3%—Bill Borchert, Mount Union, 1997 (47 of 272)
(Min. 300 atts.) 14.0%—Brett Elliott, Linfield, 2004 (61 of 437)
Career(Min. 800 atts.) 14.0%—Bill Borchert, Mount Union, 1994-
97 (141 of 1,009)
MOST TOUCHDOWN PASSES BY A FRESHMANSeason
37—Josh Vogelbach, Guilford, 2005Also holds per-game record with 3.7 (37 in 10)
MOST CONSECUTIVE GAMES THROWINGA TOUCHDOWN PASSCareer
40—Bill Borchert, Mount Union (from Sept. 10, 1994, through Nov. 15, 1997)
4 INDIVIDUAL RECORDS
ReceivingMOST PASSES CAUGHTGame
25—Daniel Passafiume, Hanover vs. Franklin, Nov. 14, 2009 (153 yards)
Season136—Scott Pingel, Westminster (MO), 1999 (1,648 yards)Also holds per-game record with 13.6 (136 in 10)
Career436—Scott Pingel, Westminster (MO), 1996-99 (6,108
yards)Also holds per-game record with 11.2 (436 in 39)
MOST PASSES CAUGHT BY A TIGHT ENDGame
17—Matt Surette, WPI vs. Springfield, Oct. 25, 1997Season
79—Brad Kalsow, Wis.-Stevens Point, 2008 (926 yards)Career
203—Jon Branche, Rensselaer, 2003-06 (2,849 yards)
MOST PASSES CAUGHT BY A RUNNING BACKGame
17—Greg Siebers, Wis.-Platteville vs. Wis.-La Crosse, Oct. 6, 2001 (99 yards); Theo Blanco, Wis.-Stevens Point vs. Wis.-Oshkosh, Oct. 31, 1987 (271 yards); Tim Mowery, Wis.-Superior vs. Wis.-Stevens Point, Oct. 17, 1981 (154 yards)
Season106—Theo Blanco, Wis.-Stevens Point, 1987 (1,616 yards)
Career169—Mike Christman, Wis.-Stevens Point, 1983-86 (2,190
yards)
MOST PASSES CAUGHT BY A FRESHMANSeason
97—Michael Zweifel, Wis.-River Falls, 2007 (1,056 yards)
MOST PASSES CAUGHT BY TWO PLAYERS,SAME TEAMSeason
203—Scott Pingel (WR) 130 & Logan Stanley (TE) 73, Westminster (MO), 1998 (3,168 yards, 33 TDs)
MOST PASSES CAUGHT BY THREE PLAYERS,SAME TEAMSeason
270—Scott Pingel (WR) 130, Logan Stanley (TE) 73 & John Squires (WR) 67, Westminster (MO), 1998 (3,996 yards, 33 TDs; team totals: 319 receps., 4,501 yards, 51 TDs)
MOST CONSECUTIVE GAMES CATCHING A PASSCareer
47—Blake Elliott, St. John’s (MN), 2000-03
MOST YARDS GAINEDGame
418—Lewis Howes, Principia vs. Martin Luther, Oct. 12, 2002 (caught 18)
Season2,157—Scott Pingel, Westminster (MO), 1998 (caught
130)Also holds per-game record with 215.7 (2,157 in 10)
Career6,108—Scott Pingel, Westminster (MO), 1996-99 (caught
436)Also holds per-game record with 156.6 (6,108 in 39)
LONGEST RECEPTION99 yards—30 times. Most recent: Cory McCain from Sam
Landry, Kalamazoo vs. Benedictine (IL), Sept. 25, 2010; Chad Arlt from Jordan Becker, Gust. Adolphus vs. St. Thomas (MN), Oct. 4, 2008
MOST 99-YARD RECEPTIONSCareer
2—Chad Arlt, Gust. Adolphus (2007 & 2008 seasons; R.J. Hoppe, Carroll (WI) (1995 & 1996 seasons))
MOST YARDS GAINED BY A TIGHT ENDGame
362—Matt Surette, WPI vs. Springfield, Oct. 25, 1997 (caught 17)
Season1,290—Don Moehling, Wis.-Stevens Point, 1988 (caught
72)Career
2,849—Jon Branche, Rensselaer, 2003-06 (caught 203)
MOST YARDS GAINED BY A RUNNING BACKGame
271—Theo Blanco, Wis.-Stevens Point vs. Wis.-Oshkosh, Oct. 31, 1987 (caught 17)
Season1,616—Theo Blanco, Wis.-Stevens Point, 1987 (caught
106)Career
2,190—Mike Christman, Wis.-Stevens Point, 1983-86 (caught 169)
MOST YARDS GAINED BY TWO PLAYERS,SAME TEAMSeason
3,168—Scott Pingel (WR) 2,157 & Logan Stanley (TE) 1,011, Westminster (MO), 1998 (caught 203, 33 TDs)
HIGHEST AVERAGE GAIN PER RECEPTIONGame
(Min. 3 receps.) 68.3—Paul Jaeckel, Elmhurst vs. Ill. Wesleyan, Oct. 8, 1983 (3 for 205)
(Min. 5 receps.) 56.8—Tom Casperson, TCNJ vs. Ramapo, Nov. 15, 1980 (5 for 284)
Season(Min. 35 receps.) 26.9—Marty Redlawsk, Concordia
Chicago, 1985 (38 for 1,022)(Min. 50 receps.) 25.5—Derek Stanley, Wis.-Whitewater,
2005 (52 for 1,328)Career
(Min. 125 receps.) 23.4—Michael Coleman, Widener, 1998-01 (139 for 3,254)
HIGHEST AVERAGE GAIN PER RECEPTIONBY A RUNNING BACKSeason
(Min. 50 receps.) 17.5—Barry Rose, Wis.-Stevens Point, 1989 (67 for 1,171)
MOST TOUCHDOWN PASSES CAUGHTGame
7—Matt Perceval, Wesleyan (CT) vs. Middlebury, Sept. 26, 1998
Season26—Jack Phelan, Hartwick, 2008 (10 games); Scott Pingel,
Westminster (MO), 1998 (10 games)Also hold per-game record with 2.6 (26 in 10)
Career75—Scott Pingel, Westminster (MO), 1996-99 (caught
436)Also holds per-game record with 1.9 (75 in 39)
MOST TOUCHDOWN PASSES CAUGHTBY A FRESHMANSeason
15—Mark Bartosic, Susquehanna, 2000
HIGHEST PERCENTAGE OF PASSESCAUGHT FOR TOUCHDOWNSSeason
(Min. 12 TDs) 55.6%—Kirk Aikens, Hartwick, 1998 (20 of 36)
Career(Min. 20 TDs) 33.9%—Kirk Aikens, Hartwick, 1995-98 (43
of 127)
MOST CONSECUTIVE PASSESCAUGHT FOR TOUCHDOWNS
9—Keith Gilliam, Randolph-Macon, 1984 (during four games)
PuntingMOST PUNTSGame
17—Jerry Williams, Frostburg St. vs. Salisbury, Sept. 30, 1978
Season106—Bob Blake, Wis.-Superior, 1977 (3,404 yards)Per-game record—11.0, Mark Roedelbronn, FDU-Florham,
1990 (99 in 9)Career
264—Gary Sheplavy, Hiram, 2004-07 (9,179 yards)
HIGHEST AVERAGE PER PUNTSeason
(Min. 40 punts) 45.5—Justin Shively, Anderson (IN), 1997 (55 for 2,502)
Career(Min. 100 punts) 43.4—Jeff Shea, Cal Lutheran, 1994-97
(183 for 7,939)
LONGEST PUNT90 yards—Sean Lipscomb, Redlands vs. Pomona-Pitzer,
Oct. 5, 2002; Dan Heeren, Coe vs. Lawrence, Oct. 12, 1974
Punt ReturnsMOST PUNT RETURNSGame
10—Ellis Wangelin, Wis.-River Falls vs. Wis.-Platteville, Oct. 12, 1985 (87 yards)
Season48—Rick Bealer, Lycoming, 1989 (492 yards)
Career134—Marvin Deal, McDaniel, 1996-99 (1,480 yards)
MOST YARDS ON PUNT RETURNSGame
278—P.J. Williams, Mary Hardin-Baylor vs. Mississippi Col., Oct. 1, 2005 (7 returns)
Season688—Melvin Dillard, Ferrum, 1990 (25 returns)
Career1,550—Joshua Carter, Muhlenberg, 1998-01 (133 returns)
LONGEST PUNT RETURN99 yards—Robert Middlebrook, Knoxville vs. Miles, Oct.
19, 1985
MOST YARDS PER PUNT RETURNSeason
(Min. 1.2 rets. per game) 31.2—Chuck Downey, Stony Brook, 1986 (17 for 530)
Career(Min. 1.2 rets. per game) 22.9—Keith Winston, Knoxville,
1986-87 (30 for 686)(Min. 50 rets.) 20.3—Chuck Downey, Stony Brook, 1984-87
(59 for 1,198)
MOST TOUCHDOWNS SCORED ONPUNT RETURNSGame
3—John Conroy, Otterbein vs. Heidelberg, Nov. 1, 2003 (65, 74 & 66 yards)
Season5—Chris McKinney, Guilford, 2001 (21 returns)
Career7—Chuck Downey, Stony Brook, 1984-87 (59 returns)
Kickoff ReturnsMOST KICKOFF RETURNSGame
11—Mason Tootell, Swarthmore vs. Johns Hopkins, Sept. 19, 1997 (197 yards)
Season49—Chris Schubert, Oberlin, 2007 (1,056 yards)
Career132—Chris Schubert, Oberlin, 2004-07 (2,867 yards)
MOST YARDS ON KICKOFF RETURNSGame
279—Chuck Downey, Stony Brook vs. TCNJ, Oct. 5, 1984 (7 returns)
Season1,014—Shane Nolan, Kalamazoo, 2008 (43 returns)
Career2,867—Chris Schubert, Oberlin, 2004-07 (132 returns)
LONGEST KICKOFF RETURN100 yards—60 times. Most recent: Pedro Hardy, Wis.
Lutheran vs. Lakeland, Oct. 16, 2010; Tariq Gaines, Rowan vs. Kean, Oct. 31, 2009; Cam Bramer, Olivet vs. Trine, Oct. 17, 2009
MOST YARDS PER KICKOFF RETURNGame
(Min. 3 rets.) 68.0—Victor Johnson, Elmhurst vs. Wheaton (IL), Sept. 15, 1979 (3 for 204)
Season(Min. 1.2 rets. per game) 48.5—Darnell Williams, Louisiana
Col., 2010 (12 for 582)Career
(Min. 1.2 rets. per game) 31.4—Stuart Sitterson, Wash. & Lee, 2005-08 (63 for 1,981)
INDIVIDUAL RECORDS 5
MOST TOUCHDOWNS SCORED ONKICKOFF RETURNSGame
2—By many players. Most recent: Nate Gibbons, Rochester (NY) vs. Union (NY), Sept. 25, 2004
Season5—Larry Beavers, Wesley, 2008 (17 returns)
Career10—Larry Beavers, Wesley, 2004-05, 07-08 (70 returns)
Total Kick Returns(Combined Punt and Kickoff Returns)
MOST YARDS ON KICK RETURNSGame
354—Chuck Downey, Stony Brook vs. TCNJ, Oct. 5, 1984 (7 kickoff returns for 279 yards, 1 punt return for 75 yards)
Career3,739—Joshua Carter, Muhlenberg, 1998-01 (133 punt
returns for 1,550 yards; 75 kickoff returns for 2,189 yards)
GAINING 1,000 YARDS ON PUNT RETURNSAND 1,000 YARDS ON KICKOFF RETURNSCareer
Thom Hauser, Capital, $2002-06 (1,026 on punt returns, 1,688 on kickoff returns); Matt Tosh, Ithaca, 2001-04 (1,297 on punt returns, 1,071 on kickoff returns); Joshua Carter, Muhlenberg, 1998-01 (1,550 on punt returns, 2,189 on kickoff returns); Marvin Deal, McDaniel, 1996-99 (1,480 on punt returns, 1,104 on kickoff returns); David Ziegler, John Carroll, 1996-99 (1,063 on punt returns, 1,047 on kickoff returns); Charles Warren, Dickinson, 1993-96 (1,239 on punt returns, 1,021 on kickoff returns); LaVant King, Ohio Northern, 1991, 93-95 (1,074 on punt returns, 1,298 on kickoff returns); Chuck Downey, Stony Brook, 1984-87 (1,198 on punt returns, 1,281 on kickoff returns)
$See initial page for explanation.
MOST TOUCHDOWNS ON KICK RETURNSGame
3—John Conroy, Otterbein vs. Heidelberg, Nov. 1, 2003 (3 punt returns, 65, 74 & 66 yards); Chuck Downey, Stony Brook vs. TCNJ, Oct. 5, 1984 (2 kickoff returns, 98 & 95 yards; 1 punt return, 75 yards)
Season8—Larry Beavers, Wesley, 2008 (3 punt returns, 5 kickoff
returns)Career
13—Larry Beavers, Wesley, 2004-05, 07-08 (3 punt returns, 10 kickoff returns)
MOST YARDS PER KICK RETURN(Min. 1.2 Returns Per Game Each)Career
23.6—Chuck Downey, Stony Brook, 1984-87 (59 for 1,198 on punt returns, 46 for 1,281 on kickoff returns)
AVERAGING 20 YARDS EACH ON PUNT RETURNS AND KICKOFF RETURNS(Min. 1.2 Returns Per Game Each)Career
Chuck Downey, Stony Brook, 1984-87 (20.3 on punt returns, 59 for 1,198; 27.8 on kickoff returns, 46 for 1,281)
All Runbacks(Combined Interceptions, Punt Returns and Kick off Returns)
MOST TOUCHDOWNS ON INTERCEPTIONS,PUNT RETURNS AND KICKOFF RETURNS (Must have one TD in at least three catego-ries)Game
3—By many playersSeason
6—Chuck Downey, Stony Brook, 1986 (1 interception return, 4 punt returns, 1 kickoff return)
Career11—Chuck Downey, Stony Brook, 1984-87 (1 interception
return, 7 punt returns, 3 kickoff returns)
Kicks BlockedMOST PUNTS BLOCKED BYGame
3—Matt Sheridan, Moravian vs. King’s (PA), Sept. 17, 2005; Don Rodgers, Sewanee vs. Rhodes, Oct. 19, 2002; Andy Waddle, Wittenberg vs. Urbana, Sept. 1, 2000; Scott Lunsford, Maryville (TN) vs. Rhodes, Sept. 26, 1998; Jim Perryman, Millikin vs. Carroll (WI), Nov. 1, 1980
Season9—Jim Perryman, Millikin, 1980
Career13—Frank Lyle, Millsaps, 1979-82
Note: Daryl Hobson, Benedictine (IL) DB, blocked 9 punts during 17 games in 1987-88
MOST TOTAL KICKS BLOCKED BY(Includes Punts, PAT Attempts, FG Attempts)Game
4—Ted Serafini, Beloit vs. St. Norbert, Sept. 11, 2004 (3 PAT and 1 punt); Bob Paulus, Rhodes vs. Washington-St. Louis, Sept. 29, 2001 (3 FG and 1 PAT)
MOST TOUCHDOWNS SCORED ONBLOCKED PUNTSGame
3—Nate Murphy, Sewanee vs. Rhodes, Oct. 19, 2002
All-Purpose Yards(Yardage Gained From Rushing, Receiving and All Runbacks)
MOST PLAYSSeason
429—Dan Pugh, Mount Union, 2002 (384 rushes, 32 receptions, 13 kickoff returns)
Career1,313—Steve Tardif, Maine Maritime, 1996-99 (1,190 rush-
ing, 58 receptions, 1 interception, 10 punt returns, 55 kickoff returns)
MOST YARDS GAINEDGame
527—Paul Smith, Gettysburg vs. Muhlenberg, Oct. 23, 1999 (390 rushing, 137 receiving)
Season3,189—Dan Pugh, Mount Union, 2002 (2,300 rushing, 382
receiving, 507 kickoff returns) (14 games)Per-game record—297.3, Dante Brown, Marietta, 1996
(2,973 in 10)Career
9,651—Nate Kmic, Mount Union, 2005-08 (8,074 rushing, 749 receiving, 828 kickoff returns)
Per-game record—231.3, R.J. Bowers, Grove City, 1997-00 (9,253 in 40)
MOST YARDS PER PLAYSeason
(Min. 1,500 yards, 125 plays) 16.9—Matt Eisenberg, Juniata, 1999 (2,113 in 125)
Career(Min. 4,000 yards, 300 plays) 16.0—Chris Wiesehan,
Wabash, 1990-93 (4,825 in 301)
TEAM HAVING A 200-YARD RUSHER AND200-YARD RECEIVER IN SAME GAME
St. John Fisher, Mark Robinson (229 rushing) and Noah Fehrenbach (207 receiving) vs. Rochester (NY), Sept. 10, 2005 (St. John Fisher won, 58-32)
ScoringMOST POINTS SCOREDGame
48—Carey Bender, Coe vs. Beloit, Nov. 12, 1994Season
264—Nate Kmic, Mount Union, 2008 (44 TDs) (15 games)Per-game record—20.8, James Regan, Pomona-Pitzer,
1997 (166 in 8)Career
780—Nate Kmic, Mount Union, 2005-08 (130 TDs)Per-game record—16.0, Tony Sutton, Wooster, 2002-04
(480 in 30)
TWO OR MORE PLAYERS, SAME TEAM,EACH SCORING 100 POINTS OR MORESeason
18 times. Most recent: Jeremy Murray (138), Cecil Shorts (132) & Tyler Almeida (122), Mount Union, 2010; Levell Coppage (150) & Eric Kindler (121), Wis.-Whitewater, 2010; Jim Bower (132) & Matthew Rende (116), Maine Maritime, 2010; Quincy Daniels (126) & Alan Munoz (108), Mary Hardin-Baylor, 2010
THREE PLAYERS, SAME TEAM,EACH SCORING 100 POINTS OR MORESeason
Jeremy Murray (138), Cecil Shorts (132) & Tyler Almeida (122), Mount Union, 2010; Nate Kmic (168), Mike Zimmerman (120) & Pierre Garcon (114), Mount Union, 2006; Justin Beaver (146), Mike Chaulk (109) & Derek Stanley (100), Wis.-Whitewater, 2005
MOST TOUCHDOWNS SCOREDSeason
44—Nate Kmic, Mount Union, 2008 (15 games)Per-game record—3.4, R.J. Bowers, Grove City, 1998 (34
in 10)Career
130—Nate Kmic, Mount Union, 2005-08 (125 rushing & 5 receiving)
Also holds per-game record with 2.3 (130 in 56)
MOST GAMES SCORING A TOUCHDOWNCareer
51—Nate Kmic, Mount Union, 2005-08 (56 games)
MOST CONSECUTIVE GAMES SCORINGA TOUCHDOWNCareer
25—Chuck Moore, Mount Union (from Oct. 10, 1998, through Nov. 4, 2000)
MOST GAMES SCORING TWO OR MORE TOUCHDOWNSCareer
40—Nate Kmic, Mount Union, 2005-08 (56 games)
MOST GAMES SCORING THREE OR MORE TOUCHDOWNSCareer
30—Nate Kmic, Mount Union, 2005-08 (56 games)
MOST EXTRA POINTS ATTEMPTED BY KICKINGGame
14—Kurt Christenson, Concordia-M’head vs. Macalester, Sept. 24, 1977 (made 13)
Season100—Mike Zimmerman, Mount Union, 2007 (made 100)
Career269—Mike Zimmerman, Mount Union, 2005-07 (made
263)
MOST EXTRA POINTS MADE BY KICKINGGame
13—Kurt Christenson, Concordia-M’head vs. Macalester, Sept. 24, 1977 (attempted 14)
Season100—Mike Zimmerman, Mount Union, 2007 (attempted
100)Career
263—Mike Zimmerman, Mount Union, 2005-07 (attempt-ed 269)
HIGHEST PERCENTAGE OF EXTRA POINTS MADE(Best Perfect Season)
100.0%—Mike Zimmerman, Mount Union, 2007 (100 of 100)
HIGHEST PERCENTAGE OF EXTRA POINTS MADECareer
(Min. 80 atts.) 100.0%—Mike Farrell, Adrian, 1983-85 (84 of 84)
(Min. 100 atts.) 98.5%—Rims Roof, Coe, 1982-85 (135 of 137)
(Min. 200 atts.) 97.8%—Mike Zimmerman, Mount Union, 2005-07 (263 of 269)
MOST CONSECUTIVE EXTRA POINTS MADEBY KICKINGGame
13—Kurt Christenson, Concordia-M’head vs. Macalester, Sept. 24, 1977
6 INDIVIDUAL RECORDS
Career142—Mike Zimmerman, Mount Union (from Oct. 14,
2006, through Dec. 15, 2007)
MOST POINTS SCORED BY KICKINGGame
20—Jim Hever, Rhodes vs. Millsaps, Sept. 22, 1984 (6 FGs, 2 PATs)
Season148—Mike Zimmerman, Mount Union, 2007 (16 FGs, 100
PATs) (15 games)Per-game record—10.2, Ken Edelman, Mount Union,
1990 (102 in 10)Career
383—Mike Zimmerman, Mount Union, 2005-07 (40 FGs, 263 PATs)
Also holds per-game record with 8.5 (383 in 45)
MOST SUCCESSFUL TWO-POINT PASS ATTEMPTSGame
4—Josh Vogelbach, Guilford vs. Hampden-Sydney, Sept. 24, 2005; Rob Bristow, Pomona-Pitzer vs. Whittier, Oct. 19, 1985 (all in 4th quarter); Dave Geissler, Wis.-Stevens Point vs. Wis.-La Crosse, Sept. 21, 1985 (all in 4th quarter)
Season10—Justin Peery, Westminster (MO), 1997 (14 attempts)
Career25—Justin Peery, Westminster (MO), 1996-99 (44
attempts)
Note: Rob Bristow, Pomona-Pitzer, 1983-86, holds record for highest percentage of successful two-point pass attempts (best perfect record) at 9 of 9
MOST TWO-POINT PASSES CAUGHTSeason
8—Scott Pingel, Westminster (MO), 1997Career
17—Scott Pingel, Westminster (MO), 1996-99
Field GoalsMOST FIELD GOALS MADEGame
6—Jim Hever, Rhodes vs. Millsaps, Sept. 22, 1984 (30, 24, 42, 44, 46, 30 yards; attempted 8)
Season22—Jeff Schebler, Wis.-Whitewater, 2008 (attempted 29)Per-game record—2.0, Ken Edelman, Mount Union, 1990
(20 in 10)Career
75—Jeff Schebler, Wis.-Whitewater, 2006-09 (attempted 95)
Also holds per-game record with 1.3 (75 in 57)
MOST FIELD GOALS ATTEMPTEDGame
8—Jim Hever, Rhodes vs. Millsaps, Sept. 22, 1984 (made 6)
Season29—Jeff Schebler, Wis.-Whitewater, 2008 (made 22); Scott
Ryerson, UCF, 1981 (made 18)Career
95—Jeff Schebler, Wis.-Whitewater, 2006-09 (made 75)
HIGHEST PERCENTAGE OF FIELD GOALS MADESeason
(Min. 15 atts.) 93.8%—Steve Graeca, John Carroll, 1988 (15 of 16)
Career(Min. 50 atts.) 78.9%—Jeff Schebler, Wis.-Whitewater,
2006-09 (75 of 95)
LONGEST FIELD GOAL MADE62—Dom Antonini, Rowan vs. Salisbury, Sept. 18, 1976
MOST FIELD GOALS ATTEMPTED WITHOUT SUCCESSSeason
11—Scott Perry, Moravian, 1986
Defensive RecordsTOTAL TACKLESGame
30—Bryan Meuse, Nichols vs. Endicott, Oct. 29, 2005Season
198—Kyle McGivney, Luther, 2010Also holds per-game record with 19.8 (198 in 10)
Career531—Casey McConnell, Kenyon, 2001-03, 05 (294 solo,
237 assisted)Per-game record—13.41, Tavarski Wallace, Adrian, 2003-
06 (429 in 32)
SOLO TACKLESGame
21—Tim Rotenberry, North Park vs. Millikin, Oct. 16, 2004Season
106—Robert Gunn, Earlham, 2000Also holds per-game record with 10.6 (106 in 10)
Career302—Kyle Follweiler, Wilkes, 2004-07 (43 games)Per-game record—7.4, Casey McConnell, Kenyon, 2001-03
(294 in 40)
ASSISTED TACKLESSeason
111—Kyle McGivney, Luther, 2010Also holds per-game record with 11.1 (111 in 10)
TACKLES FOR LOSSGame
8.5—Kevin McNamara, St. John’s (MN) vs. Monmouth (IL), Nov. 19, 2005
Season39.0—Steven Wilson, King’s (PA), 2002 (38 solo, 2 assisted)
(12 games)Also holds per-game record with 3.9 in 2001 (38.5 in 10)
Career106.5—Steven Wilson, King’s (PA), 2000-02Also holds per-game record with 3.3 (106.5 in 32)
PASS SACKSGame
7.5—Kevin McNamara, St. John’s (MN) vs. Monmouth (IL), Nov. 19, 2005
Season24.0—Russ Watson, Worcester St., 2000Also holds per-game record with 2.7 (24.0 in 9)
Career53.5—Mike Czerwien, Waynesburg, 2004-07Per-game record—1.5, Steven Wilson, King’s (PA), 2000-02
(49.0 in 32)
MOST PASSES DEFENDEDGame
10—James Patrick, Stillman vs. Edward Waters, Nov. 2, 2002 (5 pass breakups, 5 interceptions)
Season36—Jarrod Pence, Moravian, 2001 (31 pass breakups, 5
interceptions)Also holds per-game record with 3.6 (36 in 10)
Career66—Kennard Davis, Thiel, 2001-04Per-game record—2.6, Kip Daniels, Aurora, 2000-01 (50
in 19)
FORCED FUMBLESGame
4—Nick Rice, Thomas More vs. Franklin, Oct. 11, 2002Season
8—Tony Pate, Concordia Chicago, 2000Also holds per-game record with 0.9 (8 in 9)
FUMBLES (FUMBLE RECOVERIES AND FORCED FUMBLES)Season
11—Tony Pate, Concordia Chicago, 2000Also holds per-game record with 1.2 (11 in 9)
MOST PASSES INTERCEPTEDGame
5—By 11 players. Most recent: James Patrick, Stillman vs. Edward Waters, Nov. 2, 2002
Season15— Ben Matthews, Bethel (MN), 2000; Mark Dorner,
Juniata, 1987 (202 yards); (134 yards)Also hold per-game record with 1.5 (15 in 10)
Career29—Ralph Gebhardt, Rochester (NY), 1973-75 (384
yards)MOST CONSECUTIVE GAMESINTERCEPTING A PASSSeason
9—Brent Sands, Cornell College, 1992Also holds career record with 9
MOST YARDS ON INTERCEPTION RETURNSGame
164—Rick Conner, McDaniel vs. Dickinson, Oct. 15, 1983 (89-yard interception and 75-yard lateral after an inter-ception)
Season358—Rod Pesek, Whittier, 1987 (10 interceptions)
Career443—Mark Dorner, Juniata, 1984-87 (26 interceptions)
LONGEST INTERCEPTION RETURN100 yards—58 times. Most recent: Zach Hurtt, Wittenberg
vs. Ohio Northern, Nov. 20, 2010; Kevin Gerhart, Wilkes vs. Lycoming, Oct. 30, 2010; Kyle Longsdorf, Defiance vs. Earlham, Oct. 16, 2010
MOST YARDS PER INTERCEPTION RETURNSeason
(Min. 7 ints.) 38.4—Randy Ames, Hope, 1996 (7 for 269)Career
(Min. 20 ints.) 20.4—Todd Schoelzel, Wis.-Oshkosh, 1985-88 (22 for 448)
MOST TOUCHDOWNS SCORED ON INTERCEPTIONSGame
3—By many playersSeason
3—By many players. Most recent: Scott Driscoll, Curry, 2009 (9 interceptions); Mike Linhardt, Westminster (MO), 2002 (7 interceptions); Seth Berghoff, Pacific Lutheran, 2001 (4 interceptions)
MOST DEFENSIVE EXTRA POINTS SCOREDGame
2—Shontez Jones, Greenville vs. MacMurray, Sept. 30, 2000
Season2— Shontez Jones, Greenville, 2000 (2 blocked kick
returns); Dan Fichter, Brockport, 1990 (2 blocked kick returns)
LONGEST DEFENSIVE EXTRA POINT BLOCKED KICK RETURN
98—Paul Lewis (DB), Worcester St. vs. Maine Maritime, Oct. 2, 2010 (scored)
LONGEST DEFENSIVE EXTRA POINT INTERCEPTION
100—By many players. Most recent: Mike Ortiz (DB), FDU-Florham vs. Widener, Sept. 11, 1999
FIRST DEFENSIVE EXTRA POINT SCOREDSteve Nieves (DB), St. John’s (NY) vs. Iona, Sept. 10, 1988
(83-yard blocked kick return)
TEAM RECORDS 7
SINGLE GAME—Offense
Total OffenseMOST PLAYS
112—Gust. Adolphus vs. Bethel (MN), Nov. 2, 1985 (47 rushes, 65 passes; 493 yards)
MOST PLAYS, BOTH TEAMS214—Gust. Adolphus (112) & Bethel (MN) (102), Nov. 2,
1985 (71 rushes, 143 passes; 930 yards)
MOST YARDS GAINED823—Westminster (MO) vs. Principia, Oct. 17, 1998 (176
rushing, 647 passing)
MOST YARDS GAINED, BOTH TEAMS1,430—Eureka (744) & Crown (MN) (686), Nov. 7, 2009
(178 plays)
MOST TOUCHDOWNS SCORED BYRUSHING AND PASSING
14—Concordia-M’head vs. Macalester, Sept. 24, 1977 (12 rushing, 2 passing)
RushingMOST RUSHES
92—Wis.-River Falls vs. Wis.-Platteville, Oct. 21, 1989 (464 yards)
MOST YARDS GAINED730—Maine Maritime vs. Coast Guard, Oct. 31, 2009 (63
rushes)
MOST TOUCHDOWNS SCORED BY RUSHING12—Concordia-M’head vs. Macalester, Sept. 24, 1977
PassingMOST PASSES ATTEMPTED
84—Carthage vs. North Central (IL), Oct. 17, 2009 (com-pleted 47); Alma vs. Wis.-River Falls, Sept. 26, 2009 (completed 52)
MOST PASSES ATTEMPTED, BOTH TEAMS143—Bethel (MN) (78) & Gust. Adolphus (65), Nov. 2, 1985
(completed 65)
MOST PASSES ATTEMPTED WITHOUTAN INTERCEPTION
77—Westminster (MO) vs. MacMurray, Nov. 14, 1998 (completed 50)
MOST PASSES COMPLETED58—Kalamazoo vs. Hope, Nov. 14, 2009 (attempted 81)
MOST PASSES COMPLETED, BOTH TEAMS87—Sul Ross St. (52) & Howard Payne (35), Oct. 5, 2002
(attempted 128)
HIGHEST PERCENTAGE OF PASSES COMPLETED(Min. 35 Attempts)
86.1%—Howard Payne vs. East Tex. Baptist, Sept. 28, 2002 (31 of 36)
MOST YARDS GAINED731—Menlo vs. Cal Lutheran, Oct. 7, 2000
MOST YARDS GAINED, BOTH TEAMS1,180—Guilford (606) & Catholic (574), Nov. 9, 2005
(attempted 134, completed 80)
MOST TOUCHDOWN PASSES9—Ohio Northern vs. Capital, Nov. 14, 1998; Westminster
(MO) vs. Principia, Oct. 17, 1998;
MOST TOUCHDOWN PASSES, BOTH TEAMS12—St. Thomas (MN) (6) & Bethel (MN) (6), Nov. 13, 1993
PuntingMOST PUNTS
17—Frostburg St. vs. Salisbury, Sept. 30, 1978
MOST YARDS ON PUNTS591—Mississippi Col. vs. Mary Hardin-Baylor, Oct. 1, 2005
(14 punts)
Punt ReturnsMOST PUNT RETURNS
10—Wis.-River Falls vs. Wis.-Platteville, Oct. 12, 1985 (87 yards)
MOST YARDS ON PUNT RETURNS278—Mary Hardin-Baylor vs. Mississippi Col., Oct. 1, 2005
(8 returns)
MOST TOUCHDOWNS SCORED ONPUNT RETURNS
3—Otterbein vs. Heidelberg, Nov. 1, 2003; Emory & Henry vs. Tenn. Wesleyan, Sept. 27, 1986
Kickoff ReturnsMOST KICKOFF RETURNS
11—Swarthmore vs. Johns Hopkins, Sept. 19, 1997 (197 yards)
MOST YARDS ON KICKOFF RETURNS302—MacMurray vs. Greenville, Sept. 4, 1999
ScoringMOST POINTS SCORED
105—Rockford vs. Trinity Bible, Sept. 6, 2003
MOST POINTS SCORED VS. DIVISION III OPPONENT
97—Concordia-M’head vs. Macalester, Sept. 24, 1977
MOST POINTS SCORED, BOTH TEAMS INCLUDING OVERTIME
142—Hartwick (72) & Utica (70), Nov. 10, 2007 (4 ot)
MOST POINTS SCORED, BOTH TEAMS IN REGULATION
138—Brockport (70) & Hartwick (68), Nov. 22, 2008
MOST POINTS SCORED BY A LOSING TEAM INCLUDING OVERTIME
70—Utica vs. Hartwick (72), Nov. 10, 2007 (4 ot)
MOST POINTS SCORED BY A LOSING TEAM IN REGULATION
68—Hartwick vs. Brockport (70), Nov. 22, 2008
MOST POINTS SCORED IN ONE QUARTER52—Mount Union vs. Averett, Sept. 1, 2007 (1st quarter)
MOST POINTS OVERCOME TO WIN A GAME33—Lakeland vs. Concordia (WI), Oct. 11, 1997 (trailed
33-0 with 7:53 left in 3rd quarter; won 41-33); Salisbury vs. Randolph-Macon, Sept. 15, 1984 (trailed 33-0 with 14:18 left in 2nd quarter; won 34-33); Wis.-Platteville vs. Wis.-Eau Claire, Nov. 8, 1980 (trailed 33-0 with 7:00 left in 2nd quarter; won 52-43)
MOST POINTS SCORED IN A BRIEFPERIOD OF TIME
21 in 33 seconds—Mount Union vs. Defiance, Sept. 14, 1996 (turned 13-3 game into 34-3 in 2nd quarter, won 62-10)
32 in 4:04—Wis.-Stevens Point vs. Wis.-La Crosse, Sept. 21, 1985 (trailed 27-3 and 35-11 in 4th quarter; ended in 35-35 tie)
MOST POINTS SCORED IN FIRST VARSITY GAME
63—Bentley vs. Brooklyn (26), Sept. 24, 1988
MOST TOUCHDOWNS SCORED15—Rockford vs. Trinity Bible, Sept. 6, 2003
MOST PLAYERS SCORING TOUCHDOWNS10—Johns Hopkins vs. Swarthmore, Sept. 19, 1997
MOST EXTRA POINTS MADE BY KICKING13—Rockford vs. Trinity Bible, Sept. 6, 2003; Concordia-
M’head vs. Macalester, Sept. 24, 1977 (attempted 14);
MOST FIELD GOALS MADE6—Rhodes vs. Millsaps, Sept. 22, 1984 (attempted 8)
MOST FIELD GOALS ATTEMPTED8—Rhodes vs. Millsaps, Sept. 22, 1984 (made 6)
MOST DEFENSIVE EXTRA-POINTRETURNS SCORED
2—Greenville vs. MacMurray, Sept. 30, 2000
MOST DEFENSIVE EXTRA-POINT OPPORTUNITIES
2—Greenville vs. MacMurray, Sept. 30, 2000 (2 kick returns; 2 scored); Frank. & Marsh. vs. Johns Hopkins, Nov. 7, 1992 (1 interception & 1 kick return; none scored); Wis.-River Falls vs. Wis.-La Crosse, Nov. 11, 1989 (2 kick returns; 1 scored); Buffalo St. vs. Brockport, Oct. 1, 1988 (1 interception & 1 kick return; none scored); Wis.-Platteville vs. Wis.-Oshkosh, Oct. 15, 1988 (2 inter-ceptions; none scored)
Turnovers(Most Times Losing the Ball on Interceptions and Fumbles)
MOST TURNOVERS13—St. Olaf vs. St. Thomas (MN), Oct. 12, 1985 (10 inter-
ceptions, 3 fumbles); Mercyhurst vs. Buffalo St., Oct. 23, 1982 (1 interception, 12 fumbles); Albany (NY) vs. Rochester Inst., Oct. 1, 1977
MOST TURNOVERS, BOTH TEAMS24—Albany (NY) (13) & Rochester Inst. (11), Oct. 1, 1977
First DownsMOST TOTAL FIRST DOWNS
40—Mount Union vs. Marietta, Oct. 15, 2005 (25 rushing, 15 passing); Upper Iowa vs. Loras, Nov. 7, 1992 (19 rush-ing, 17 passing, 4 by penalty)
PenaltiesMOST PENALTIES AGAINST
25—Norwich vs. Coast Guard, Sept. 29, 1985 (192 yards)
SINGLE GAME—Defense
Total DefenseFEWEST YARDS ALLOWED
Minus 52—Worcester St. vs. Maine Maritime, Sept. 28, 1996 (-71 rushing, 19 passing)
Rushing DefenseFEWEST RUSHES ALLOWED
9—Wis.-La Crosse vs. Huron, Sept. 21, 1996 (-63 yards)
FEWEST YARDS ALLOWEDMinus 112—Coast Guard vs. Wesleyan (CT), Oct. 7, 1989
(23 plays)
Pass DefenseFEWEST ATTEMPTS ALLOWED
0—By many teams. Most recent: Concordia-M’head vs. Macalester, Oct. 12, 1991
FEWEST COMPLETIONS ALLOWED0—By many teams. Most recent: Alfred vs. Springfield,
Sept. 23, 2006 (1 attempt)
FEWEST YARDS ALLOWEDMinus 6—Wittenberg vs. Hiram, Oct. 27, 2001 (1 comple-
tion); Central (IA) vs. Simpson, Oct. 19, 1985 (1 comple-tion)
Team Records
8 TEAM RECORDS
MOST PASSES INTERCEPTED BY10—St. Thomas (MN) vs. St. Olaf, Oct. 12, 1985 (91 yards;
50 attempts)
MOST PLAYERS INTERCEPTING A PASS8—Samford vs. Anderson (SC), Oct. 11, 1986 (8 intercep-
tions in the game)
MOST TOUCHDOWNS ON INTERCEPTION RETURNS
4—Millikin vs. Ill. Wesleyan, Nov. 6, 1999
Defensive RecordsMOST TACKLES FOR LOSS(Since 2000)
22—St. John’s (MN) vs. Monmouth (IL), Nov. 19, 2005; King’s (PA) vs. Salisbury, Nov. 23, 2002
MOST PASS SACKS (Since 2000)
13—St. John’s (MN) vs. Monmouth (IL), Nov. 19, 2005
MOST PASSES DEFENDED (Since 2000)
21—Stillman vs. Edward Waters, Nov. 2, 2002 (13 pass breakups, 8 interceptions)
MOST FORCED FUMBLES8—Simpson vs. William Penn, Nov. 11, 2000
Punts Blocked ByMOST OPPONENT’S PUNTS BLOCKED BY
4—Benedictine (IL) vs. Olivet Nazarene, Oct. 22, & vs. Aurora, Oct. 29, 1988 (consecutive games, resulting in 4 TDs and 1 safety). Blocked 9 punts in three consecutive games, vs. MacMurray, Oct. 15, Olivet Nazarene and Aurora, resulting in 4 TDs and 2 safeties
First DownsFEWEST FIRST DOWNS ALLOWED
0—Case vs. Wooster, Sept. 21, 1985
SEASON—Offense
Total OffenseMOST YARDS GAINED PER GAME
565.3—Simpson, 1997 (5,653 in 10)
MOST YARDS GAINED8,192—Mount Union, 2008 (15 games)
MOST YARDS GAINED PER PLAY8.2—Mount Union, 2008 (999 for 8,192)
MOST PLAYS PER GAME85.6—Hampden-Sydney, 1978 (856 in 10)
MOST TOUCHDOWNS SCORED PER GAMEBY RUSHING AND PASSING
8.4—St. John’s (MN), 1993 (84 in 10; 44 rushing, 40 pass-ing)
RushingMOST YARDS GAINED PER GAME
471.6—Maine Maritime, 2010 (5,188 in 11)
MOST YARDS GAINED5,188—Maine Maritime, 2010 (11 games)
MOST YARDS GAINED PER RUSH8.3—Ferrum, 1990 (470 for 3,912)
MOST RUSHES PER GAME71.4—Wis.-River Falls, 1988 (714 in 10)
MOST TOUCHDOWNS SCORED PER GAMEBY RUSHING
5.5—Maine Maritime, 2010 (60 in 11)
PassingMOST YARDS GAINED PER GAME
488.8—Westminster (MO), 1998 (4,888 in 10)
FEWEST YARDS GAINED PER GAME18.4—Gallaudet, 2009 (184 in 10); Wis.-River Falls, 1983
(184 in 10)
MOST YARDS GAINED PER ATTEMPT(Min. 250 atts.) 11.14—Grinnell, 1998 (301 for 3,354)(Min. 350 atts.) 11.32—Mount Union, 2008 (361 for 4,088)(Min. 450 atts.) 9.5—Menlo, 2000 (479 for 4,529)
MOST YARDS GAINED PER COMPLETION(Min. 200 Completions)
17.1—Mount Union, 2003 (240 for 4,103)
MOST PASSES ATTEMPTED PER GAME59.9—Sul Ross St., 2002 (599 in 10)
FEWEST PASSES ATTEMPTED PER GAME3.3—Springfield, 2006 (40 in 12)
MOST PASSES COMPLETED PER GAME35.8—Sul Ross St., 2002 (358 in 10)
FEWEST PASSES COMPLETED PER GAME1.25—Springfield, 2006 (15 in 12)
HIGHEST PERCENTAGE COMPLETED(Min. 200 Attempts)
74.8%—Mount Union, 2008 (270 of 361)
LOWEST PERCENTAGE OF PASSES HAD INTERCEPTED(Min. 150 Attempts)
0.7%—San Diego, 1990 (1 of 153)
MOST TOUCHDOWN PASSES PER GAME5.7—Westminster (MO), 1998 (57 in 10)
HIGHEST PASSING EFFICIENCY RATING POINTS
(Min. 15 atts. per game) 211.3—Eureka, 1994 (205 attempts, 142 completions, 8 interceptions, 2,478 yards, 30 TDs)
(Min. 300 atts.) 202.8—Mount Union, 1997 (311 attempts, 212 completions, 3 interceptions, 3,171 yards, 48 TDs)
PuntingMOST PUNTS PER GAME
11.0—FDU-Florham, 1990 (99 in 9)
FEWEST PUNTS PER GAME2.1—Mount Union, 2002 (29 in 14)
HIGHEST PUNTING AVERAGE45.3—Ohio Northern, 1999 (43 for 1,950)
ScoringMOST POINTS PER GAME
61.5—St. John’s (MN), 1993 (615 in 10)
MOST TOUCHDOWNS PER GAME8.9—St. John’s (MN), 1993 (89 in 10)
BEST PERFECT RECORD ON EXTRA POINTS MADE BY KICKING
49 of 49—Dayton, 1989
MOST TWO-POINT ATTEMPTS PER GAME2.8—Martin Luther, 1990 (17 in 6)
MOST FIELD GOALS MADE PER GAME2.0—Mount Union, 1990 (20 in 10)
HIGHEST SCORING MARGIN51.8—St. John’s (MN), 1993 (averaged 61.5 and allowed
9.7 in 10 games)
MOST TOUCHDOWNS ON BLOCKED PUNT RETURNS
5—Widener, 1990
MOST SAFETIES4—Mount Union, 2007; Upper Iowa, 1995; Westfield
St., 1992; Central (IA), 1992; Alfred, 1992; Wis.-Stevens Point, 1990
MOST DEFENSIVE EXTRA-POINT RETURNS SCORED
2—Greenville, 2000; Wis.-River Falls, 2000; Springfield, 1998; Eureka, 1991; Brockport, 1990
MOST DEFENSIVE EXTRA-POINT BLOCKEDKICK RETURNS
3—Assumption, 1992 (1 scored); Ohio Wesleyan, 1991 (none scored); Brockport, 1990 (2 scored)
MOST DEFENSIVE EXTRA-POINT INTERCEPTIONS
2—Swarthmore, 1989 (1 scored); Wis.-Platteville, 1988 (none scored)
PenaltiesMOST PENALTIES PER GAME
13.3—Kean, 1990 (133 in 10, 1,155 yards)
MOST YARDS PENALIZED PER GAME121.9—Hofstra, 1991 (1,219 in 10, 124 penalties)
Turnovers (Giveaways)(Passes Had Intercepted and Fumbles Lost, Since 1985)
FEWEST TURNOVERS6—Tufts, 2009 (4 interceptions, 2 fumbles lost in 8 games);
McDaniel, 1999 (4 interceptions, 2 fumbles lost); Mount Union, 1995 (4 interceptions, 2 fumbles lost)
McDaniel & Mount Union share per-game record with 0.6 (6 in 10)
MOST TURNOVERS52—William Penn, 1985 (19 interceptions, 33 fumbles
lost)Also holds per-game record with 5.2 (52 in 10)
SEASON—Defense
Total DefenseFEWEST YARDS ALLOWED PER GAME
94.0—Knoxville, 1977 (940 in 10)
FEWEST YARDS ALLOWED PER PLAY(Min. 500 plays) 1.8—Bowie St., 1978 (576 for 1,011)(Min. 650 plays) 2.0—Plymouth St., 1987 (733 for 1,488)
FEWEST RUSHING AND PASSING TOUCHDOWNS ALLOWED PER GAME
0.3—Montclair St., 1984 (3 in 10)
Rushing DefenseFEWEST YARDS ALLOWED PER GAME
Minus 2.3—Knoxville, 1977 (-23 in 10 games)
FEWEST YARDS ALLOWED PER RUSH(Min. 275 rushes) Minus 0.1—Knoxville, 1977 (333 for -23)(Min. 400 rushes) 1.0—Lycoming, 1976 (400 for 399)
FEWEST TOUCHDOWNS ALLOWED BY RUSHING
0—Union (NY), 1983 (9 games); New Haven, 1978 (9 games);
Pass DefenseFEWEST YARDS ALLOWED PER GAME
48.5—Mass. Maritime, 1976 (388 in 8)
FEWEST YARDS ALLOWED PER ATTEMPT(Min. 150 atts.) 2.9—Plymouth St., 1982 (170 for 488)(Min. 225 atts.) 3.3—Plymouth St., 1987 (281 for 919)
FEWEST YARDS ALLOWED PER COMPLETION(Min. 100 Completions)
8.6—Baldwin-Wallace, 1990 (151 for 1,305)
LOWEST COMPLETION PERCENTAGE ALLOWED
(Min. 150 atts.) 24.3%—Doane, 1973 (41 of 169)(Min. 250 atts.) 31.3%—Hobart, 2000 (79 of 252)
HIGHEST PERCENTAGE INTERCEPTED BY(Min. 200 Attempts)
15.2%—Rose-Hulman, 1977 (32 of 210)
TEAM RECORDS 9
MOST PASSES INTERCEPTED BY35—Plymouth St., 1987 (12 games, 281 attempts against,
348 yards returned)Per-game record—3.4, Montclair St., 1981 (34 in 10)
FEWEST PASSES INTERCEPTED BY(Min. 125 Attempts)
1—Bates, 1987 (134 attempts against in 8 games, 0 yards returned)
MOST YARDS ON INTERCEPTION RETURNS576—Emory & Henry, 1987 (31 interceptions)
MOST TOUCHDOWNS SCORED ON INTERCEPTIONS
6—Coe, 1992 (22 interceptions, 272 passes against); Augustana (IL), 1987 (23 interceptions, 229 passes against)
FEWEST TOUCHDOWN PASSES ALLOWED0—By many teams. Most recent: Amherst, 2001 (8 games);
Johns Hopkins, 2001 (9 games)
LOWEST PASSING EFFICIENCY RATING POINTS ALLOWED OPPONENTS
(Min. 150 atts.) 27.8—Plymouth St., 1982 (allowed 170 attempts, 53 completions, 488 yards, 1 TD & inter-cepted 25 passes)
(Min. 275 atts.) 43.1—Plymouth St., 1987 (allowed 281 attempts, 94 completions, 919 yards, 6 TDs & inter-cepted 35 passes)
PuntingMOST PUNTS BLOCKED BY
11—Benedictine (IL), 1987 (78 punts against in 10 games). Blocked 17 punts in 18 games during 1987-88, result-ing in 5 TDs and 3 safeties
ScoringFEWEST POINTS ALLOWED PER GAME
3.4—Millsaps, 1980 (31 in 9)
FEWEST TOUCHDOWNS ALLOWED4—Trinity (CT), 2003 (8 games); Bentley, 1990 (8 games);
Baldwin-Wallace, 1981 (10 games); Millsaps, 1980 (9 games)
MOST SHUTOUTS7—Mount Union, 2007
MOST CONSECUTIVE SHUTOUTS6—Mount Union, 2007; Plymouth St., 1982
MOST POINTS ALLOWED PER GAME59.1—Macalester, 1977 (532 in 9; 76 TDs, 64 PATs, 4 FGs)
MOST DEFENSIVE EXTRA-POINT ATTEMPTSBY OPPONENTS
5—Norwich, 1992 (4 blocked kick returns, 1 interception; none scored)
Turnovers (Takeaways)(Opponent’s Passes Intercepted and Fumbles Recovered, Since 1985)
HIGHEST MARGIN OF TURNOVERS PER GAME OVER OPPONENTS
2.9—Macalester, 1986 (29 in 10; 29 giveaways vs. 58 takeaways)
MOST TAKEAWAYS58—Macalester, 1986 (28 interceptions, 30 fumbles
gained)Also holds per-game record with 5.8 (58 in 10)
Additional RecordsMOST CONSECUTIVE VICTORIES
55—Mount Union (from Sept. 2, 2000, to Dec. 13, 2003)
MOST CONSECUTIVE REGULAR-SEASON VICTORIES
110—Mount Union (from Oct. 22, 1994, to Oct. 22, 2005)
MOST CONSECUTIVE GAMES WITHOUT DEFEAT
60—Augustana (IL) (from Sept. 17, 1983, through Nov. 22, 1987; ended with 38-36 loss to Dayton, Nov. 29, 1987, in Division III playoffs and included one tie)
MOST CONSECUTIVE REGULAR-SEASON GAMES WITHOUT DEFEAT
110—Mount Union (from Oct. 22, 1994, to Oct. 22, 2005)
MOST CONSECUTIVE WINNING SEASONS42—Central (IA) (1961-02)
Note: Linfield has 55 consecutive winning seasons (1956-10), 13 seasons as an NCAA member (1998-10)
MOST CONSECUTIVE GAMES WITHOUT BEING SHUT OUT
370—Mount Union (from Nov. 7, 1981, to present)
MOST CONSECUTIVE LOSSES50—Macalester (from Oct. 5, 1974, to Nov. 10, 1979;
ended with 17-14 win over Mount Senario, Sept. 6, 1980)
MOST CONSECUTIVE GAMES WITHOUT A TIE371—Widener (from Oct. 29, 1949, to Nov. 11, 1989;
ended with 14-14 tie against Gettysburg, Sept. 8, 1990)
HIGHEST-SCORING TIE GAME50-50—Catholic vs. Randolph-Macon, Sept. 16, 1995
LAST SCORELESS GAMENov. 18, 1995—Amherst vs. Williams
MOST OVERTIME PERIODS IN A GAME6—Whittier (42) vs. Puget Sound (39), Sept. 25, 2010; St.
Olaf (29) vs. St. Thomas (MN) (23), Sept. 20, 2008
MOST CONSECUTIVE GAMES SCORINGA TOUCHDOWN BY PASSING
105—Mount Union (from Oct. 5, 1991, to Oct. 27, 2001)
MOST CONSECUTIVE QUARTERS WITHOUT YIELDING A TOUCHDOWN BY RUSHING
61—Augustana (IL) (in 16 games from Sept. 27, 1986, to Nov. 7, 1987; 77 including four 1986 Division III playoff games); Union (NY) (in 16 games from Oct. 23, 1982, to Sept. 29, 1984)
MOST CONSECUTIVE QUARTERS WITHOUT YIELDING A TOUCHDOWN BY PASSING
44—Swarthmore (from Oct. 31, 1981, to Nov. 13, 1982)
MOST IMPROVED WON-LOST RECORD(Including Postseason Games)
8½ games—LaGrange, 2008 (9-2) from 2007 (0-10)
Annual Champions, All-Time LeadersTotal Offense
CAREER YARDS PER GAME(Minimum 5,000 Yards)
Player, Team Years G Plays Yards Yd. PGBrett Elliott, Linfield ......................................... 2004-05 24 895 8,751 364.6Justin Peery, Westminster (MO) ................. 1996-99 39 2,001 13,645 349.9Josh Vogelbach, Guilford .............................. 2005-08 40 *2,240 13,904 347.6Jason Boltus, Hartwick ................................... 2005-08 41 1,839 *14,231 347.1Josh Brehm, Alma ............................................ 2003-06 36 1,946 12,247 340.2Terry Peebles, Hanover .................................. 1992-95 23 1,140 7,672 333.6Mackenzie McGrady, Alma .......................... 2006-09 29 1,573 9,382 323.5Brett Dietz, Hanover ....................................... 2002-03 22 1,054 6,969 316.7Corey Sedlar, Hampden-Sydney ............... 2006-09 32 1,409 10,079 315.0Adam Ryan, Wilmington (OH) .................... 1998-01 33 1,520 10,314 312.5Kirk Baumgartner, Wis.-Stevens Point ..... 1986-89 41 2,007 12,767 311.4Ben McLaughlin, Louisiana Col. ..... 2006-07, 09-10 39 1,709 12,007 307.9Donald McKillop, Middlebury .................... 2007-10 30 1,518 9,208 306.9Dan Cole, Rensselaer ...................................... 2001-03 31 1,488 9,487 306.0Zamir Amin, Menlo ......................................... 1999-01 26 1,015 7,836 301.4Adam King, Howard Payne .......................... 2001-04 39 1,798 11,588 297.1Evan Jones, Carthage ..................................... 2007-10 32 1,453 9,424 294.5Phil Butler, Hope ............................................... 2001-03 30 1,313 8,810 293.7Keith Bishop, Ill. Wesleyan/
Wheaton (IL) ........................................... 1981, 83-85 31 1,467 9,052 292.0Tom Stetzer, Wis.-Platteville ......................... 2000-03 35 1,823 10,081 288.0Mark Novara, Lakeland .................................. 1994-97 38 1,653 10,801 284.2Joel Steele, Anderson (IN) ............................ 2000-03 40 1,641 11,325 283.1Tim Bailey, St. John Fisher ............................ 2008-10 32 1,236 9,009 281.5Andy Collins, Occidental ............................... 2004-06 32 1,256 8,994 281.1Jordan Poznick, Principia .............................. 1990-93 32 1,757 8,983 280.7*Record. $See initial page for explanation.
SEASON YARDS PER GAMEPlayer, Team Year G Plays Yards Yd. PGJustin Peery, Westminster (MO) ..................... †1998 10 645 4,651 465.1Justin Peery, Westminster (MO) ..................... †1999 10 599 4,419 441.9Danny Ragsdale, Redlands .............................. 1999 9 464 3,855 428.3Zamir Amin, Menlo ............................................. †2000 10 511 4,231 423.1Jason Boltus, Hartwick ....................................... †2008 10 448 4,155 415.5Josh Brehm, Alma ................................................ †2006 10 616 4,084 408.4Jason Boltus, Hartwick ....................................... †2007 11 584 4,397 399.7Terry Peebles, Hanover ...................................... †1995 10 572 3,981 398.1Brandon Luczak, Kalamazoo ........................... †2009 10 596 3,818 381.8Brett Dietz, Hanover ........................................... †2003 11 635 4,186 380.5Wesley Cooper, Louisiana Col. ...................... †2005 9 504 3,415 379.4Ben McLaughlin, Louisiana Col. ..................... †2010 10 474 3,780 378.0J.D. Ricca, Hampden-Sydney .......................... 2005 10 461 3,748 374.8Brett Elliott, Linfield ............................................. 2005 11 423 4,088 371.6Donald McKillop, Middlebury ........................ 2009 8 464 2,967 370.9Jay Macias, Colorado Col. ................................ 2003 8 444 2,951 368.9Adam King, Howard Payne .............................. †2004 10 544 3,680 368.0Kyle Krober, Greenville ....................................... 2000 10 468 3,676 367.6Joel Steele, Anderson (IN) ................................ 2003 10 520 3,664 366.4Evan Jones, Carthage ......................................... 2009 10 524 3,655 365.5Josh Vogelbach, Guilford .................................. 2005 10 538 3,638 363.8Steve Slowke, Alma ............................................. †2001 10 *662 3,630 363.0Adam King, Howard Payne .............................. †2002 10 505 3,613 361.3Josh Vogelbach, Guilford .................................. 2007 10 567 3,600 360.0Shane Brozowski, Castleton ............................ 2010 9 483 3,237 359.7*Record. †National champion.
CAREER YARDSPlayer, Team Years Plays YardsJason Boltus, Hartwick ............................................................... 2005-08 1,839 14,231Josh Vogelbach, Guilford .......................................................... 2005-08 *2,240 13,904
10 ALL-TIME LEADERS
Justin Peery, Westminster (MO) ............................................. 1996-99 2,001 13,645Adam Knoblauch, Delaware Valley ...................................... 2002-05 1,985 12,833Kirk Baumgartner, Wis.-Stevens Point ................................. 1986-89 2,007 12,767Josh Brehm, Alma ........................................................................ 2003-06 1,946 12,247John Port, Albright ...................................................................... $2001-05 1,816 12,195Rocky Pentello, Capital .............................................................. $2002-06 1,770 12,126Ben McLaughlin, Louisiana Col. ................................. 2006-07, 09-10 1,709 12,007Adam King, Howard Payne ...................................................... 2001-04 1,798 11,588Joel Steele, Anderson (IN) ........................................................ 2000-03 1,641 11,325Kam Kniss, North Central (IL) .................................................. 2003-06 1,628 11,035Keith Ricca, Catholic ................................................................... 2005-08 1,782 10,919Alex Kofoed, St. John’s (MN) .................................................... 2004-07 1,577 10,818Mark Novara, Lakeland .............................................................. 1994-97 1,653 10,801Bill Borchert, Mount Union ...................................................... 1994-97 1,274 10,639Tanner Kelly, Albright ................................................................. 2006-09 1,687 10,576Jim Ballard, Wilmington (OH)/Mount Union .............. 1990, 91-93 1,328 10,545Tom Arth, John Carroll ............................................................... 1999-02 1,557 10,493Dan Whalen, Case ........................................................................ 2006-09 1,583 10,492Adam Ryan, Wilmington (OH) ................................................ 1998-01 1,520 10,314Troy Dougherty, Grinnell .................................................... 1994, 97-99 1,520 10,314Chris Warrick, Wesley .................................................................. 2003-06 1,475 10,305Chad Rupp, Franklin ................................................................... 2005-08 1,314 10,278Kyle Krober, Greenville ............................................................... 1998-01 1,603 10,239*Record. $See initial page for explanation.
SEASON YARDSPlayer, Team Year G Plays YardsBrett Elliott, Linfield ................................................................ †2004 13 472 4,663Justin Peery, Westminster (MO) ........................................ †1998 10 645 4,651Chad Rupp, Franklin .............................................................. †2008 13 628 4,625Justin Peery, Westminster (MO) ........................................ †1999 10 599 4,419Roy Hampton, Trinity (TX) ................................................... 2002 14 464 4,418Jason Boltus, Hartwick .......................................................... †2007 11 584 4,397Greg Micheli, Mount Union ................................................ 2008 15 405 4,258Zamir Amin, Menlo ................................................................ †2000 10 511 4,231Brett Dietz, Hanover .............................................................. †2003 11 635 4,186Jason Boltus, Hartwick .......................................................... 2008 10 482 4,155Brett Elliott, Linfield ................................................................ 2005 11 423 4,088Josh Brehm, Alma ................................................................... †2006 10 616 4,084Adam Knoblauch, Delaware Valley ................................. 2005 13 556 4,044Greg Micheli, Mount Union ................................................ 2007 15 434 4,003Kurt Rocco, Mount Union .................................................... 2009 15 378 3,997Terry Peebles, Hanover ......................................................... †1995 10 572 3,981Dan Cole, Rensselaer ............................................................. 2003 13 647 3,955Juan Joseph, Millsaps ............................................................ 2008 12 521 3,875Danny Ragsdale, Redlands ................................................. 1999 9 464 3,855Michael Jorris, Mount Union .............................................. 2005 15 455 3,853Alex Tanney, Monmouth (IL) .............................................. 2009 11 511 3,836Brandon Luczak, Kalamazoo .............................................. †2009 10 596 3,818Kirk Baumgartner, Wis.-Stevens Point ............................ †1988 11 604 3,790Ben McLaughlin, Louisiana Col. ........................................ †2010 10 474 3,780John Port, Albright ................................................................. 2004 11 473 3,766†National champion.
SINGLE-GAME YARDSYds. Player, Team (Opponent) Date723 Zamir Amin, Menlo (Cal Lutheran) .............................................................Oct. 7, 2000630 Justin Peery, Westminster (MO) (Colorado Col.) .................................Oct. 30, 1999628 Justin Peery, Westminster (MO) (MacMurray) ....................................Nov. 14, 1998617 Justin Peery, Westminster (MO) (Principia) ...........................................Oct. 17, 1998608 Zach Hubbard, Howard Payne (Louisiana Col.) ..................................Oct. 24, 2009606 Mackenzie McGrady, Alma (Wis.-River Falls)..................................... Sept. 26, 2009596 John Love, North Park (Elmhurst) .............................................................Oct. 13, 1990595 Adam King, Howard Payne (East Tex. Baptist) .................................. Sept. 18, 2004594 Josh Vogelbach, Guilford (Catholic) .......................................................... Nov. 5, 2005593 Duncan White, Puget Sound (Lewis & Clark) .......................................Oct. 23, 2010592 Josh Vogelbach, Guilford (Hampden-Sydney) ................................. Sept. 22, 2007590 Danny Ragsdale, Redlands (Azusa Pacific) ........................................ Sept. 25, 1999590 Tom Stallings, St. Thomas (MN) (Bethel [MN]) ...................................Nov. 13, 1993588 Danny Ragsdale, Redlands (Cal Lutheran) ...........................................Nov. 13, 1999587 Andrew Miller, Heidelberg (Capital) ..........................................................Oct. 2, 2010584 Chris Neal, Colorado Col. (Menlo) ............................................................Nov. 12, 2005584 Dustin Proctor, Hardin-Simmons (Howard Payne)............................Oct. 12, 2002580 Joe Montrella, Juniata (Widener) .............................................................Nov. 13, 1999577 Eric Noble, Wilmington (OH) (Urbana) .................................................... Nov. 5, 1994576 Chad Rupp, Franklin (Otterbein) ..............................................................Nov. 22, 2008576 Mackenzie McGrady, Alma (Albion) .......................................................Nov. 15, 2008
ANNUAL CHAMPIONSYear Player, Team Cl. G Plays Yards Avg.1973 Bob Dulich, San Diego ................................... Jr. 11 340 2,543 231.21974 Larry Cenotto, Pomona-Pitzer .................... Sr. 9 436 2,127 236.3
1975 Ricky Haygood, Millsaps ............................... Jr. 9 332 2,176 241.81976 Rollie Wiebers, Buena Vista .......................... So. 9 353 2,198 244.21977 Tom Hamilton, Occidental ........................... Sr. 9 358 2,050 227.81978 Robert Farra, Claremont-M-S ...................... Jr. 9 427 2,685 298.31979 Clay Sampson, Denison ................................ Jr. 9 412 2,255 250.61980 Jeff Beer, Bethany (WV) ................................. Sr. 9 372 2,331 259.01981 Brion Demski, Wis.-Stevens Point ............. Sr. 10 503 2,895 289.51982 Dave McCarrell, Wheaton (IL) ..................... Sr. 9 387 2,503 278.11983 Keith Bishop, Wheaton (IL) .......................... So. 9 421 3,193 354.81984 Keith Bishop, Wheaton (IL) .......................... Jr. 9 479 2,777 308.61985 Keith Bishop, Wheaton (IL) .......................... Sr. 9 521 2,951 327.91986 Larry Barretta, Lycoming .............................. Sr. 10 453 2,875 287.51987 Todde Greenough, Willamette................... Jr. 9 436 2,567 285.21988 Kirk Baumgartner, Wis.-Stevens Point ..... Jr. 11 604 3,790 344.51989 Kirk Baumgartner, Wis.-Stevens Point ..... Sr. 10 530 3,540 354.01990 Rhory Moss, Hofstra ........................................ Jr. 9 372 2,775 308.31991 Willie Reyna, La Verne .................................... Jr. 8 220 2,633 329.11992 Jordan Poznick, Principia .............................. Jr. 8 519 2,747 343.41993 Jordan Poznick, Principia .............................. Sr. 8 488 2,705 338.11994 Terry Peebles, Hanover .................................. Jr. 10 520 3,441 344.11995 Terry Peebles, Hanover .................................. Sr. 10 572 3,981 398.11996 Bill Nietzke, Alma ............................................. Sr. 9 468 3,185 353.91997 Matt Bunyan, Wis.-Stout ............................... Jr. 10 422 3,216 321.61998 Justin Peery, Westminster (MO) ................. Jr. 10 645 4,651 *465.11999 Justin Peery, Westminster (MO) ................. Sr. 10 599 4,419 441.92000 Zamir Amin, Menlo ......................................... Sr. 10 511 4,231 423.12001 Steve Slowke, Alma ......................................... Jr. 10 *662 3,630 363.02002 Adam King, Howard Payne .......................... So. 10 505 3,613 361.32003 Brett Dietz, Hanover ....................................... Sr. 11 635 4,186 380.52004 Adam King, Howard Payne .......................... Sr. 10 544 3,680 368.02005 Wesley Cooper, Louisiana Col. .................. Sr. 9 504 3,415 379.42006 Josh Brehm, Alma ............................................ Sr. 10 616 4,084 408.42007 Jason Boltus, Hartwick................................... Jr. 11 584 4,397 399.72008 Jason Boltus, Hartwick................................... Sr. 10 482 4,155 415.52009 Brandon Luczak, Kalamazoo....................... Sr. 10 596 3,818 381.82010 Ben McLaughlin, Louisiana Col. ................. Sr. 10 474 3,780 378.0*Record.
Rushing
CAREER YARDS PER GAME(Minimum 2,500 Yards)
Player, Team Years G Plays Yards Yd. PGTony Sutton, Wooster ..................................... 2002-04 30 838 5,613 187.1R.J. Bowers, Grove City ................................... 1997-00 40 1,188 7,353 183.8Ricky Gales, Simpson ...................................... 1988-89 19 530 3,326 175.1Rob Marchitello, Maine Maritime ............. 1993-95 26 879 4,300 165.4Kelvin Gladney, Millsaps ............................... 1993-94 19 510 3,085 162.4Brett Trichilo, Wilkes ........................................ 2001-04 36 981 5,837 162.1Carey Bender, Coe ........................................... 1991-94 39 926 6,125 157.1Brad Olson, Lawrence .................................... 1994-97 34 792 5,325 156.6Steve Tardif, Maine Maritime ...................... 1996-99 39 *1,190 6,093 156.2Kirk Matthieu, Maine Maritime .................. $1989-93 33 964 5,107 154.8Terry Underwood, Wagner .......................... 1985-88 33 742 5,010 151.8D’Andra Freeman, Fitchburg St. ............... 1997-99 27 789 3,957 146.6Nate Kmic, Mount Union .............................. 2005-08 56 1,189 *8,074 144.2Anthony Russo, St. John’s (NY) ................... 1990-92 30 841 4,276 142.5Marlon Thornton, Fitchburg St. ................. 2007-08 18 454 2,548 141.6Phil Porta, Bethel (MN)................................... 2003-06 37 947 5,235 141.5Justin Beaver, Wis.-Whitewater .................. 2004-07 47 1,188 6,584 140.1Peter Ereg, MacMurray .................................. 2004-05 20 565 2,735 136.8Joe Dudek, Plymouth St. ............................. 1982-85 41 785 5,570 135.9Kenneth Sasu, Marietta ................................. 1997-00 35 875 4,727 135.1Jason Brader, Muhlenberg ........................... 1997-98 20 548 2,684 134.2Mark Kacmarynski, Central (IA) .................. $1992-96 41 854 5,434 132.5Rich Kowalski, Hobart .................................... 1973-75 27 762 3,574 132.4Eric Frees, McDaniel ........................................ 1988-91 40 1,059 5,281 132.0Jim Bower, Maine Maritime ......................... $2006-10 46 963 6,060 131.7Rick Etienne, Franklin ..................................... 1994-96 30 676 3,952 131.7*Record. $See initial page for explanation.
SEASON YARDS PER GAMEPlayer, Team Year G Plays Yards TD Yd. PGDante Brown, Marietta ................................ †1996 10 314 2,385 25 238.5R.J. Bowers, Grove City ................................. †1998 10 329 2,283 34 228.3Carey Bender, Coe ......................................... †1994 10 295 2,243 29 224.3Tony Sutton, Wooster ................................... †2003 9 271 1,955 30 217.2R.J. Bowers, Grove City ................................. †1999 10 344 2,098 25 209.8Jamie Lee, MacMurray ................................. †1997 8 207 1,639 11 204.9
Player, Team Years Plays Yards Year Player, Team Cl. G Plays Yards Avg.
ALL-TIME LEADERS 11
Ricky Gales, Simpson .................................... †1989 10 297 2,035 26 203.5Terry Underwood, Wagner ........................ †1988 9 245 1,809 21 201.0Robert Heller, Waynesburg ........................ †2007 11 383 2,176 26 197.8Brett Trichilo, Wilkes ...................................... 2003 11 332 2,175 27 197.7Kenneth Sasu, Marietta ............................... 1999 9 332 1,770 15 196.7Brad Olson, Lawrence .................................. †1995 9 242 1,760 16 195.6Kirk Matthieu, Maine Maritime ................ †1992 9 327 1,733 16 192.6Kelvin Gladney, Millsaps ............................. 1994 10 307 1,882 19 188.2Brandon Steinheim, Wesley ...................... 1996 9 319 1,684 20 187.1D’Andra Freeman, Fitchburg St. ............. 1999 10 365 1,871 14 187.1Tony Sutton, Wooster ................................... †2004 12 352 2,240 31 186.7Nate Kmic, Mount Union ............................ †2008 15 377 *2,790 *43 186.0Krishaun Gilmore, Rensselaer ................... 1998 9 228 1,670 22 185.6Dante Washington, Carthage ................... 2003 10 308 1,838 12 183.8Jon Warga, Wittenberg ................................ †1990 10 254 1,836 15 183.6Mark Robinson, St. John Fisher ................ 2004 12 386 2,194 22 182.8Jamie Lee, MacMurray ................................. 1998 10 252 1,818 25 181.8Anthony Jones, La Verne ............................ 1995 8 200 1,453 19 181.6DeRon Brown, MIT ......................................... 2008 10 275 1,816 22 181.6*Record. †National champion.
CAREER YARDSPlayer, Team Years Plays Yards Avg.Nate Kmic, Mount Union .......................................... 2005-08 1,189 8,074 6.79R.J. Bowers, Grove City ............................................... 1997-00 1,188 7,353 6.19Justin Beaver, Wis.-Whitewater .............................. 2004-07 1,188 6,584 5.54Carey Bender, Coe ....................................................... 1991-94 926 6,125 6.61Steve Tardif, Maine Maritime .................................. 1996-99 *1,190 6,093 5.12Jim Bower, Maine Maritime ..................................... $2006-10 963 6,060 6.29Brett Trichilo, Wilkes .................................................... 2001-04 981 5,837 5.95¢Levell Coppage, Wis.-Whitewater ....................... 2008-10 944 5,675 6.01Tony Sutton, Wooster ................................................. 2002-04 838 5,613 6.70Joe Dudek, Plymouth St. ......................................... 1982-85 785 5,570 ‡7.10Mark Kacmarynski, Central (IA) .............................. $1992-96 854 5,434 6.36Richard Jackson, King’s (PA) ..................................... 2001-04 1,114 5,365 4.82Brad Olson, Lawrence ................................................ 1994-97 792 5,325 6.72Logan Flannery, Bethel (MN) .................................. 2007-10 1,039 5,310 5.11Eric Frees, McDaniel ................................................... 1988-91 1,059 5,281 4.99Phil Porta, Bethel (MN)............................................... 2003-06 947 5,235 5.53Paul Smith, Gettysburg ............................................. 1996-99 881 5,205 5.91Casey Donaldson, Wittenberg ............................... 1997-00 836 5,112 6.11Kirk Matthieu, Maine Maritime .............................. $1989-93 964 5,107 5.30Terry Underwood, Wagner ...................................... 1985-88 742 5,010 6.75Tom Arcidiacono, Union (NY) ................................. 2003-06 922 4,919 5.34Scott Froelich, Westminster (PA)............................ 2001-04 1,014 4,903 4.84Mark Robinson, St. John Fisher .............................. 2003-06 829 4,840 5.84Steve Dixon, Beloit ...................................................... 1990-93 986 4,792 4.86Shane Davis, Loras ....................................................... 1994-97 694 4,738 6.83*Record. $See initial page for explanation. ‡Record for minimum 500 carries. ¢Active player.
SEASON YARDSPlayer, Team Year G Plays Yards Avg.Nate Kmic, Mount Union ..................................... †2008 15 377 2,790 7.40Justin Beaver, Wis.-Whitewater ......................... 2007 15 444 2,455 5.53Justin Beaver, Wis.-Whitewater ......................... †2005 14 428 2,420 5.65Dante Brown, Marietta ......................................... †1996 10 314 2,385 7.60Nate Kmic, Mount Union ..................................... 2006 15 336 2,365 7.04Dan Pugh, Mount Union ..................................... †2002 14 384 2,300 5.99R.J. Bowers, Grove City .......................................... †1998 10 329 2,283 6.94Carey Bender, Coe .................................................. †1994 10 295 2,243 7.60Tony Sutton, Wooster ............................................ †2004 12 352 2,240 6.36Mark Robinson, St. John Fisher ......................... 2004 12 386 2,194 5.68Robert Heller, Waynesburg ................................. †2007 11 383 2,176 5.68Brett Trichilo, Wilkes ............................................... 2003 11 332 2,175 6.55Levell Coppage, Wis.-Whitewater .................... 2010 14 336 2,107 6.27Levell Coppage, Wis.-Whitewater .................... †2009 15 310 2,107 6.80R.J. Bowers, Grove City .......................................... †1999 10 344 2,098 6.10Ricky Gales, Simpson ............................................. †1989 10 297 2,035 6.85Dante Washington, Carthage ............................ 2004 13 *463 1,990 4.30Tony Sutton, Wooster ............................................ †2003 9 271 1,955 7.21Tom Arcidiacono, Union (NY) ............................ 2005 12 350 1,954 5.58Andrew Mocadlo, Wis.-La Crosse ..................... 2003 12 327 1,942 5.94Chris Sharpe, Springfield ..................................... †2006 12 261 1,941 7.44Logan Flannery, Bethel (MN) ............................. 2010 14 328 1,917 5.84Jim Bower, Maine Maritime ................................ †2010 11 247 1,916 7.76Jarvis Thrasher, Mary Hardin-Baylor ............... 2007 14 212 1,899 ‡8.96Kelvin Gladney, Millsaps ...................................... 1994 10 307 1,882 6.13*Record. †National champion. ‡Record for minimum 150 carries.
SINGLE-GAME YARDSYds. Player, Team (Opponent) Date441 Dante Brown, Marietta (Baldwin-Wallace) ..............................................Oct. 5, 1996436 A.J. Pittorino, Hartwick (Waynesburg) ..................................................... Nov. 2, 1996429 Garet Lynch, Brockport (Hartwick) ..........................................................Nov. 22, 2008417 Carey Bender, Coe (Grinnell) .........................................................................Oct. 9, 1993413 Dante Brown, Marietta (Heidelberg) ........................................................ Nov. 9, 1996391 Andrew Mocadlo, Wis.-La Crosse (Wis.-Stout)...................................... Nov. 1, 2003390 Paul Smith, Gettysburg (Muhlenberg) ...................................................Oct. 23, 1999386 Levell Coppage, Wis.-Whitewater (Wis.-Eau Claire) ..........................Oct. 10, 2009385 Anthony Ambers, Greenville (Eureka) ..................................................... Nov. 6, 2010385 Jason Meyers, St. John Fisher (Rochester [NY]) ............................... Sept. 13, 2003382 Shane Davis, Loras (Dubuque) .................................................................... Nov. 8, 1997382 Pete Baranek, Carthage (North Central [IL]) ...........................................Oct. 5, 1985377 Antwan Harris, Mount Ida (Becker) ....................................................... Sept. 24, 2005371 Nate Kmic, Mount Union (St. John Fisher) ..............................................Dec. 9, 2006363 Terry Underwood, Wagner (Hofstra) .......................................................Oct. 15, 1988361 Nate Kmic, Mount Union (Augustana [IL]) ...........................................Nov. 26, 2005361 Guy Leman, Simpson (Luther) ..................................................................Nov. 14, 1998357 Peter Ereg, MacMurray (Eureka) ................................................................. Nov. 4, 2006354 Terry Underwood, Wagner (Western Conn. St.) ...................................Oct. 3, 1986352 Steve Tardif, Maine Maritime (Westfield St.) .......................................Nov. 16, 1996
ANNUAL CHAMPIONSYear Player, Team Class G Plays Yards Avg.1973 Billy Johnson, Widener ............................... Sr. 9 168 1,494 166.01974 Tim Barrett, John Carroll ............................ Sr. 9 256 1,409 156.61975 Ron Baker, Monmouth (IL) ........................ Sr. 8 200 1,116 139.51976 Chuck Evans, Ferris St. ............................... Jr. 10 224 1,509 150.91977 Don Taylor, Central (IA) ............................... Sr. 9 267 1,329 147.71978 Dino Hall, Rowan ........................................... Sr. 10 239 1,330 133.01979 Clay Sampson, Denison ............................. Jr. 9 323 1,517 168.61980 Scott Reppert, Lawrence ........................... So. 8 223 1,223 152.91981 Scott Reppert, Lawrence ........................... Jr. 9 250 1,410 156.71982 Scott Reppert, Lawrence ........................... Sr. 8 254 1,323 165.41983 John Franco, Wagner ................................... Sr. 8 175 1,166 145.81984 Gary Errico, Mass.-Lowell ........................... Sr. 9 165 1,404 156.01985 Bruce Montella, Chicago ........................... Sr. 9 265 1,372 152.41986 Sandy Rogers, Emory & Henry ................ Sr. 11 231 1,730 157.31987 Chris Dabrow, Claremont-M-S ................ Sr. 9 265 1,486 165.11988 Terry Underwood, Wagner ....................... Sr. 9 245 1,809 201.01989 Ricky Gales, Simpson .................................. Sr. 10 297 2,035 203.51990 Jon Warga, Wittenberg ............................... Sr. 10 254 1,836 183.61991 Hank Wineman, Albion .............................. Sr. 9 307 1,629 181.01992 Kirk Matthieu, Maine Maritime ............... Jr. 9 327 1,733 192.61993 Carey Bender, Coe ........................................ Jr. 10 261 1,718 171.81994 Carey Bender, Coe ........................................ Sr. 10 295 2,243 224.31995 Brad Olson, Lawrence ................................. So. 9 242 1,760 195.61996 Dante Brown, Marietta ............................... Jr. 10 314 2,385 *238.51997 Jamie Lee, MacMurray ............................... Sr. 8 207 1,639 204.91998 R.J. Bowers, Grove City ................................ So. 10 329 2,283 228.31999 R.J. Bowers, Grove City ................................ Jr. 10 344 2,098 209.82000 Damon Saxon, King’s (PA) ......................... Sr. 10 281 1,744 174.42001 Shearrod Duncan, Ursinus ........................ Sr. 10 306 1,747 174.72002 Aaron Stepka, Colby .................................... So. 8 293 1,370 171.32003 Tony Sutton, Wooster .................................. Jr. 9 271 1,955 217.22004 Tony Sutton, Wooster .................................. Sr. 12 352 2,240 186.72005 Justin Beaver, Wis.-Whitewater ............... So. 14 428 2,420 172.92006 Chris Sharpe, Springfield ........................... Jr. 12 261 1,941 161.82007 Robert Heller, Waynesburg ....................... Fr. 11 383 2,176 197.82008 Nate Kmic, Mount Union ........................... Sr. 15 377 *2,790 186.02009 Jim Bower, Maine Maritime ...................... Jr. 10 256 1,605 160.52010 Jim Bower, Maine Maritime ...................... Sr. 11 247 1,916 174.2*Record.
Player, Team Year G Plays Yards TD Yd. PG
12 ALL-TIME LEADERS
Passing
CAREER PASSING EFFICIENCY(Minimum 325 Completions)
Player, Team Years Att. Cmp. Int. Pct. Yds. TD Pts.Greg Micheli, Mount Union ..................................... 2005-08 780 578 9 ‡.741 8,479 81 197.4Bill Borchert, Mount Union ...................................... 1994-97 1,009 671 17 .665 10,201 141 194.2Brett Elliott, Linfield ..................................................... 2004-05 833 567 20 .681 8,614 110 193.7Gary Smeck, Mount Union ...................................... 1997-00 752 504 15 .670 7,764 83 186.2Rob Adamson, Mount Union .................. 1998-99, 2001-02 582 369 17 .634 6,151 60 180.4Zac Bruney, Mount Union ........................................ 2001-04 568 357 19 .629 5,727 63 177.5Mitch Tanney, Wabash/Monmouth (IL) .............. 2002-05 531 353 6 .665 4,728 58 175.1Bobby Swallow, Wash. & Jeff. .................................. 2005-08 1,023 697 15 ^.681 9,020 104 172.8Roy Hampton, Trinity (TX) ........................................ $1998-02 942 600 26 .637 8,869 94 170.2Michael Jorris, Mount Union ................................... 2003-06 601 385 19 .641 5,723 58 169.6Chad Rupp, Franklin ................................................... 2005-08 1,068 709 25 .664 9,698 102 169.5J.D. Ricca, Hampden-Sydney .................................. 2002-05 920 584 28 .635 8,626 91 168.8Justin Feaster, Hardin-Simmons ............................ 2006-09 728 491 19 .675 6,545 67 168.1Aaron Fanthorpe, North Central (IL) .................... 2006-09 699 427 22 .611 6,284 74 165.2Jordan Neal, Hardin-Simmons ...................... $2001, 03-06 907 620 31 .684 8,347 72 165.0Kurt Ramler, St. John’s (MN)..................................... 1994-96 722 420 16 .582 6,475 75 163.4Matt Wheeler, Wartburg............................................ 1996-99 595 362 21 .608 5,390 59 162.6Danny Ragsdale, Redlands ...................................... 1997-99 610 386 17 .633 5,560 51 161.9Tom Linnemann, St. John’s (MN) ........................... 1998-00 552 337 23 .611 4,578 65 161.2Chris Edwards, Wash. & Jeff. ................................... 2002-05 923 561 30 .608 8,303 87 160.9Dan DesPlaines, Trinity (TX) .................................... 2001-04 720 461 19 .640 6,374 60 160.6Zamir Amin, Menlo ..................................................... 1999-01 905 566 29 .625 7,982 83 160.5Matt Hudson, Wabash ............................................... 2006-09 960 635 32 .662 8,420 79 160.3Kyle Adamson, Allegheny ........................................ 1995-97 608 388 18 .638 5,506 48 160.0Craig Kusick, Wis.-La Crosse ..................................... 1993-95 537 327 14 .609 4,767 48 159.8$See initial page for explanation. ‡Record for minimum 750 attempts. ^Record for minimum 1,000 attempts.
SEASON PASSING EFFICIENCY(Minimum 15 Attempts Per Game)
Player, Team Year G Att. Cmp. Int. Pct. Yds. TD Pts.Mike Simpson, Eureka ............................................. †1994 10 158 116 5 .734 1,988 25 225.0Willie Seiler, St. John’s (MN) ................................... †1993 10 205 141 6 .687 2,648 33 224.6Dustin Proctor, Hardin-Simmons ........................ †2001 9 178 116 3 .652 2,194 28 217.2Bill Borchert, Mount Union .................................... †1997 10 272 190 1 .698 2,933 47 ‡216.7Greg Micheli, Mount Union ................................... †2008 15 320 240 2 *.750 3,743 36 209.1Bill Borchert, Mount Union .................................... †1996 10 240 165 6 .687 2,655 38 208.9Gary Smeck, Mount Union .................................... †1999 10 199 131 3 .658 2,274 30 208.6Matt LeFever, Western Conn. St. ......................... 1999 10 158 95 7 .601 1,874 25 203.1Kurt Rocco, Mount Union ....................................... †2009 15 341 236 8 .692 3,926 42 201.9Brian Dawson, Wash. & Jeff. .................................. †2000 10 227 149 6 .656 2,675 29 201.5Troy Dougherty, Grinnell ........................................ †1998 10 293 198 5 .675 3,310 36 199.6Bill Borchert, Mount Union .................................... †1995 10 225 160 4 .711 2,270 30 196.3Brett Elliott, Linfield ................................................... †2004 13 437 290 11 .664 *4,595 *61 195.7Chad Rupp, Franklin ................................................ †2007 11 302 212 6 .702 3,250 35 194.9Greg Micheli, Mount Union ................................... 2007 15 327 238 6 .728 3,515 34 193.7Jim Ballard, Mount Union ....................................... 1993 10 314 229 11 .729 3,304 37 193.2Jason Baer, Wash. & Jeff. ......................................... 1995 8 146 95 3 .650 1,536 19 192.3Bobby Swallow, Wash. & Jeff. ............................... 2007 11 331 229 3 .692 3,106 46 192.1Greg Lister, Rowan ..................................................... 1997 9 162 111 4 .685 1,688 20 191.9Gary Smeck, Mount Union .................................... 2000 10 266 184 3 .691 2,773 30 191.7Brett Elliott, Linfield ................................................... †2005 11 396 277 9 .699 4,019 49 191.5Aaron Fanthorpe, North Central (IL) .................. 2009 10 208 142 7 .683 2,096 28 190.6Ty Grovesteen, Wis.-Whitewater .......................... 1998 9 180 103 5 .572 2,074 22 188.8Kurt Ramler, St. John’s (MN)................................... 1994 9 154 93 4 .603 1,560 22 187.4Roy Hampton, Trinity (TX) ...................................... 2001 9 251 168 7 .669 2,465 33 187.2*Record. †National champion. ‡Record for minimum 25 attempts per game.
CAREER YARDS PER GAME(Minimum 4,500 Yards)
Player, Team Years G Att. Cmp. Int. Pct. Yds. TD Avg.Brett Elliott, Linfield ...................................... 2004-05 24 833 567 20 .681 8,614 110 358.9Josh Vogelbach, Guilford ........................... 2005-08 40 *1,982 *1,189 86 .600 *13,605 124 340.1Justin Peery, Westminster (MO) .............. 1996-99 39 1,669 1,012 57 .606 13,262 *148 340.1Jason Boltus, Hartwick ................................ 2005-08 41 1,467 801 43 .546 13,276 134 323.8Corey Sedlar, Hampden-Sydney ............ 2006-09 32 1,299 816 56 .628 10,209 78 319.0Kirk Baumgartner, Wis.-Stevens Point .. 1986-89 41 1,696 883 57 .521 13,028 110 317.8Ben McLaughlin, Louisiana Col. 2006-07, 09-10 39 1,499 931 45 .621 12,055 111 309.1Keith Bishop, Ill. Wesleyan/
Wheaton (IL) ......................................... 1981, 83-85 31 1,311 772 65 .589 9,579 71 309.0Zamir Amin, Menlo ...................................... 1999-01 26 905 566 29 .625 7,982 83 307.0Adam Ryan, Wilmington (OH) ................. 1998-01 33 1,223 693 43 .567 10,095 88 305.9Brett Dietz, Hanover .................................... 2002-03 22 940 579 31 .616 6,663 67 302.9Josh Brehm, Alma ......................................... 2003-06 36 1,505 919 33 .611 10,706 85 297.4Phil Butler, Hope ............................................ 2001-03 30 1,142 625 51 .547 8,847 90 294.9Evan Jones, Carthage .................................. 2007-10 32 1,251 774 47 .619 9,406 82 293.9Jordan Berg, Augsburg ............................... 2006-08 30 1,350 796 39 .590 8,777 72 292.6
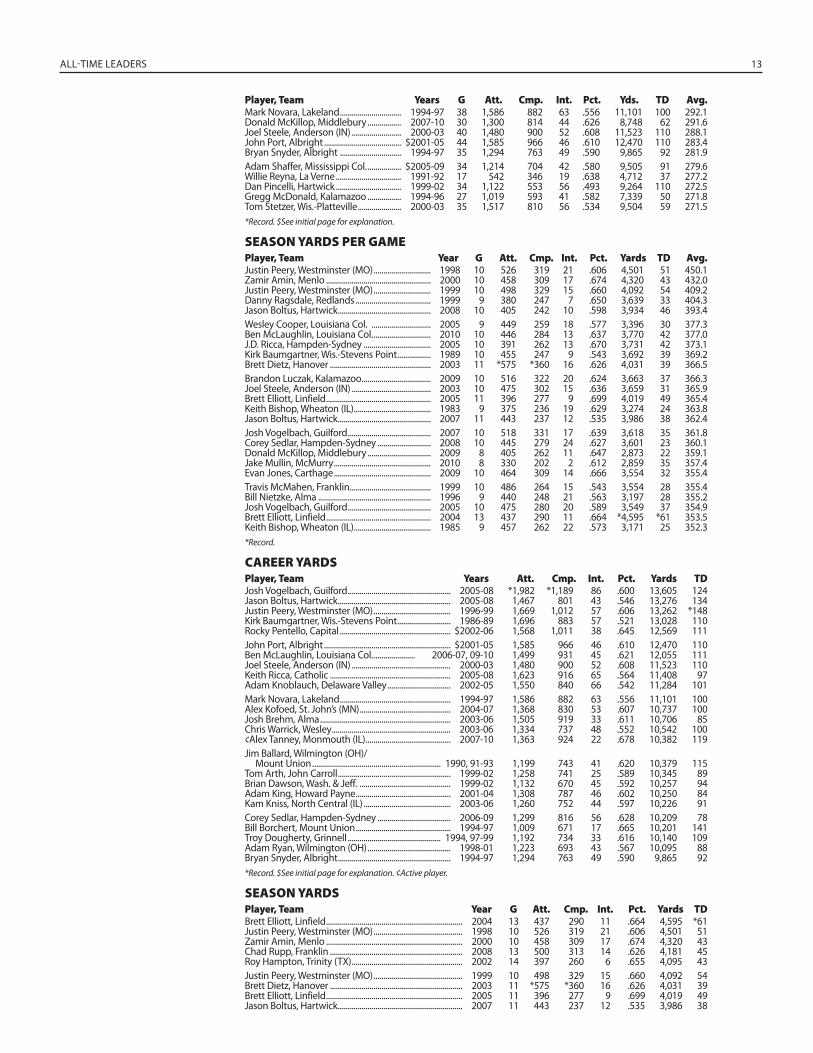
ALL-TIME LEADERS 13
Mark Novara, Lakeland ............................... 1994-97 38 1,586 882 63 .556 11,101 100 292.1Donald McKillop, Middlebury ................. 2007-10 30 1,300 814 44 .626 8,748 62 291.6Joel Steele, Anderson (IN) ......................... 2000-03 40 1,480 900 52 .608 11,523 110 288.1John Port, Albright ....................................... $2001-05 44 1,585 966 46 .610 12,470 110 283.4Bryan Snyder, Albright ............................... 1994-97 35 1,294 763 49 .590 9,865 92 281.9Adam Shaffer, Mississippi Col. ................. $2005-09 34 1,214 704 42 .580 9,505 91 279.6Willie Reyna, La Verne ................................. 1991-92 17 542 346 19 .638 4,712 37 277.2Dan Pincelli, Hartwick ................................. 1999-02 34 1,122 553 56 .493 9,264 110 272.5Gregg McDonald, Kalamazoo ................. 1994-96 27 1,019 593 41 .582 7,339 50 271.8Tom Stetzer, Wis.-Platteville ...................... 2000-03 35 1,517 810 56 .534 9,504 59 271.5*Record. $See initial page for explanation.
SEASON YARDS PER GAMEPlayer, Team Year G Att. Cmp. Int. Pct. Yards TD Avg.Justin Peery, Westminster (MO) ............................. 1998 10 526 319 21 .606 4,501 51 450.1Zamir Amin, Menlo ..................................................... 2000 10 458 309 17 .674 4,320 43 432.0Justin Peery, Westminster (MO) ............................. 1999 10 498 329 15 .660 4,092 54 409.2Danny Ragsdale, Redlands ...................................... 1999 9 380 247 7 .650 3,639 33 404.3Jason Boltus, Hartwick ............................................... 2008 10 405 242 10 .598 3,934 46 393.4Wesley Cooper, Louisiana Col. .............................. 2005 9 449 259 18 .577 3,396 30 377.3Ben McLaughlin, Louisiana Col. ............................. 2010 10 446 284 13 .637 3,770 42 377.0J.D. Ricca, Hampden-Sydney .................................. 2005 10 391 262 13 .670 3,731 42 373.1Kirk Baumgartner, Wis.-Stevens Point ................. 1989 10 455 247 9 .543 3,692 39 369.2Brett Dietz, Hanover ................................................... 2003 11 *575 *360 16 .626 4,031 39 366.5Brandon Luczak, Kalamazoo ................................... 2009 10 516 322 20 .624 3,663 37 366.3Joel Steele, Anderson (IN) ........................................ 2003 10 475 302 15 .636 3,659 31 365.9Brett Elliott, Linfield ..................................................... 2005 11 396 277 9 .699 4,019 49 365.4Keith Bishop, Wheaton (IL) ....................................... 1983 9 375 236 19 .629 3,274 24 363.8Jason Boltus, Hartwick ............................................... 2007 11 443 237 12 .535 3,986 38 362.4Josh Vogelbach, Guilford .......................................... 2007 10 518 331 17 .639 3,618 35 361.8Corey Sedlar, Hampden-Sydney ........................... 2008 10 445 279 24 .627 3,601 23 360.1Donald McKillop, Middlebury ................................ 2009 8 405 262 11 .647 2,873 22 359.1Jake Mullin, McMurry ................................................. 2010 8 330 202 2 .612 2,859 35 357.4Evan Jones, Carthage ................................................. 2009 10 464 309 14 .666 3,554 32 355.4Travis McMahen, Franklin ......................................... 1999 10 486 264 15 .543 3,554 28 355.4Bill Nietzke, Alma ......................................................... 1996 9 440 248 21 .563 3,197 28 355.2Josh Vogelbach, Guilford .......................................... 2005 10 475 280 20 .589 3,549 37 354.9Brett Elliott, Linfield ..................................................... 2004 13 437 290 11 .664 *4,595 *61 353.5Keith Bishop, Wheaton (IL) ....................................... 1985 9 457 262 22 .573 3,171 25 352.3*Record.
CAREER YARDSPlayer, Team Years Att. Cmp. Int. Pct. Yards TDJosh Vogelbach, Guilford .................................................... 2005-08 *1,982 *1,189 86 .600 13,605 124Jason Boltus, Hartwick ......................................................... 2005-08 1,467 801 43 .546 13,276 134Justin Peery, Westminster (MO) ....................................... 1996-99 1,669 1,012 57 .606 13,262 *148Kirk Baumgartner, Wis.-Stevens Point ........................... 1986-89 1,696 883 57 .521 13,028 110Rocky Pentello, Capital ........................................................ $2002-06 1,568 1,011 38 .645 12,569 111John Port, Albright ................................................................ $2001-05 1,585 966 46 .610 12,470 110Ben McLaughlin, Louisiana Col. ..................... 2006-07, 09-10 1,499 931 45 .621 12,055 111Joel Steele, Anderson (IN) .................................................. 2000-03 1,480 900 52 .608 11,523 110Keith Ricca, Catholic ............................................................. 2005-08 1,623 916 65 .564 11,408 97Adam Knoblauch, Delaware Valley ................................ 2002-05 1,550 840 66 .542 11,284 101Mark Novara, Lakeland ........................................................ 1994-97 1,586 882 63 .556 11,101 100Alex Kofoed, St. John’s (MN) .............................................. 2004-07 1,368 830 53 .607 10,737 100Josh Brehm, Alma .................................................................. 2003-06 1,505 919 33 .611 10,706 85Chris Warrick, Wesley ............................................................ 2003-06 1,334 737 48 .552 10,542 100¢Alex Tanney, Monmouth (IL) ........................................... 2007-10 1,363 924 22 .678 10,382 119Jim Ballard, Wilmington (OH)/
Mount Union ................................................................. 1990, 91-93 1,199 743 41 .620 10,379 115Tom Arth, John Carroll ......................................................... 1999-02 1,258 741 25 .589 10,345 89Brian Dawson, Wash. & Jeff. .............................................. 1999-02 1,132 670 45 .592 10,257 94Adam King, Howard Payne ................................................ 2001-04 1,308 787 46 .602 10,250 84Kam Kniss, North Central (IL) ............................................ 2003-06 1,260 752 44 .597 10,226 91Corey Sedlar, Hampden-Sydney ..................................... 2006-09 1,299 816 56 .628 10,209 78Bill Borchert, Mount Union ................................................ 1994-97 1,009 671 17 .665 10,201 141Troy Dougherty, Grinnell ............................................... 1994, 97-99 1,192 734 33 .616 10,140 109Adam Ryan, Wilmington (OH) .......................................... 1998-01 1,223 693 43 .567 10,095 88Bryan Snyder, Albright ......................................................... 1994-97 1,294 763 49 .590 9,865 92*Record. $See initial page for explanation. ¢Active player.
SEASON YARDSPlayer, Team Year G Att. Cmp. Int. Pct. Yards TDBrett Elliott, Linfield ..................................................................... 2004 13 437 290 11 .664 4,595 *61Justin Peery, Westminster (MO) ............................................. 1998 10 526 319 21 .606 4,501 51Zamir Amin, Menlo ..................................................................... 2000 10 458 309 17 .674 4,320 43Chad Rupp, Franklin ................................................................... 2008 13 500 313 14 .626 4,181 45Roy Hampton, Trinity (TX) ........................................................ 2002 14 397 260 6 .655 4,095 43Justin Peery, Westminster (MO) ............................................. 1999 10 498 329 15 .660 4,092 54Brett Dietz, Hanover ................................................................... 2003 11 *575 *360 16 .626 4,031 39Brett Elliott, Linfield ..................................................................... 2005 11 396 277 9 .699 4,019 49Jason Boltus, Hartwick ............................................................... 2007 11 443 237 12 .535 3,986 38
Player, Team Years G Att. Cmp. Int. Pct. Yds. TD Avg.
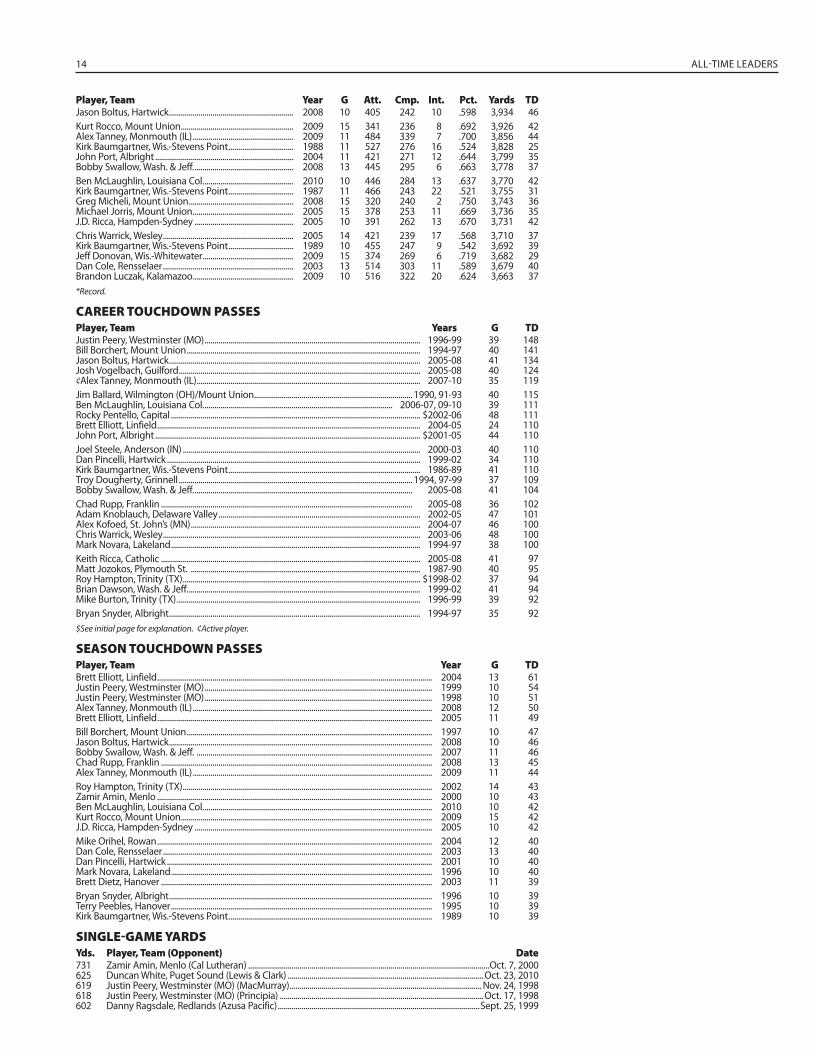
14 ALL-TIME LEADERS
Jason Boltus, Hartwick ............................................................... 2008 10 405 242 10 .598 3,934 46Kurt Rocco, Mount Union ......................................................... 2009 15 341 236 8 .692 3,926 42Alex Tanney, Monmouth (IL) ................................................... 2009 11 484 339 7 .700 3,856 44Kirk Baumgartner, Wis.-Stevens Point ................................. 1988 11 527 276 16 .524 3,828 25John Port, Albright ...................................................................... 2004 11 421 271 12 .644 3,799 35Bobby Swallow, Wash. & Jeff. .................................................. 2008 13 445 295 6 .663 3,778 37Ben McLaughlin, Louisiana Col. ............................................. 2010 10 446 284 13 .637 3,770 42Kirk Baumgartner, Wis.-Stevens Point ................................. 1987 11 466 243 22 .521 3,755 31Greg Micheli, Mount Union ..................................................... 2008 15 320 240 2 .750 3,743 36Michael Jorris, Mount Union ................................................... 2005 15 378 253 11 .669 3,736 35J.D. Ricca, Hampden-Sydney .................................................. 2005 10 391 262 13 .670 3,731 42Chris Warrick, Wesley .................................................................. 2005 14 421 239 17 .568 3,710 37Kirk Baumgartner, Wis.-Stevens Point ................................. 1989 10 455 247 9 .542 3,692 39Jeff Donovan, Wis.-Whitewater .............................................. 2009 15 374 269 6 .719 3,682 29Dan Cole, Rensselaer .................................................................. 2003 13 514 303 11 .589 3,679 40Brandon Luczak, Kalamazoo ................................................... 2009 10 516 322 20 .624 3,663 37*Record.
CAREER TOUCHDOWN PASSESPlayer, Team Years G TDJustin Peery, Westminster (MO) ............................................................................................................. 1996-99 39 148Bill Borchert, Mount Union ...................................................................................................................... 1994-97 40 141Jason Boltus, Hartwick ............................................................................................................................... 2005-08 41 134Josh Vogelbach, Guilford .......................................................................................................................... 2005-08 40 124¢Alex Tanney, Monmouth (IL) ................................................................................................................. 2007-10 35 119Jim Ballard, Wilmington (OH)/Mount Union ................................................................................ 1990, 91-93 40 115Ben McLaughlin, Louisiana Col. ............................................................................................... 2006-07, 09-10 39 111Rocky Pentello, Capital .............................................................................................................................. $2002-06 48 111Brett Elliott, Linfield ..................................................................................................................................... 2004-05 24 110John Port, Albright ...................................................................................................................................... $2001-05 44 110Joel Steele, Anderson (IN) ........................................................................................................................ 2000-03 40 110Dan Pincelli, Hartwick ................................................................................................................................ 1999-02 34 110Kirk Baumgartner, Wis.-Stevens Point ................................................................................................. 1986-89 41 110Troy Dougherty, Grinnell ...................................................................................................................... 1994, 97-99 37 109Bobby Swallow, Wash. & Jeff. .............................................................................................................. 2005-08 41 104Chad Rupp, Franklin ............................................................................................................................... 2005-08 36 102Adam Knoblauch, Delaware Valley ...................................................................................................... 2002-05 47 101Alex Kofoed, St. John’s (MN) .................................................................................................................... 2004-07 46 100Chris Warrick, Wesley .................................................................................................................................. 2003-06 48 100Mark Novara, Lakeland .............................................................................................................................. 1994-97 38 100Keith Ricca, Catholic ................................................................................................................................... 2005-08 41 97Matt Jozokos, Plymouth St. .................................................................................................................... 1987-90 40 95Roy Hampton, Trinity (TX) ........................................................................................................................ $1998-02 37 94Brian Dawson, Wash. & Jeff. ..................................................................................................................... 1999-02 41 94Mike Burton, Trinity (TX) ........................................................................................................................... 1996-99 39 92Bryan Snyder, Albright ............................................................................................................................... 1994-97 35 92$See initial page for explanation. ¢Active player.
SEASON TOUCHDOWN PASSESPlayer, Team Year G TDBrett Elliott, Linfield ........................................................................................................................................... 2004 13 61Justin Peery, Westminster (MO) ................................................................................................................... 1999 10 54Justin Peery, Westminster (MO) ................................................................................................................... 1998 10 51Alex Tanney, Monmouth (IL) ......................................................................................................................... 2008 12 50Brett Elliott, Linfield ........................................................................................................................................... 2005 11 49Bill Borchert, Mount Union ............................................................................................................................ 1997 10 47Jason Boltus, Hartwick ..................................................................................................................................... 2008 10 46Bobby Swallow, Wash. & Jeff. ....................................................................................................................... 2007 11 46Chad Rupp, Franklin ......................................................................................................................................... 2008 13 45Alex Tanney, Monmouth (IL) ......................................................................................................................... 2009 11 44Roy Hampton, Trinity (TX) .............................................................................................................................. 2002 14 43Zamir Amin, Menlo ........................................................................................................................................... 2000 10 43Ben McLaughlin, Louisiana Col. ................................................................................................................... 2010 10 42Kurt Rocco, Mount Union ............................................................................................................................... 2009 15 42J.D. Ricca, Hampden-Sydney ........................................................................................................................ 2005 10 42Mike Orihel, Rowan ........................................................................................................................................... 2004 12 40Dan Cole, Rensselaer ........................................................................................................................................ 2003 13 40Dan Pincelli, Hartwick ...................................................................................................................................... 2001 10 40Mark Novara, Lakeland .................................................................................................................................... 1996 10 40Brett Dietz, Hanover ......................................................................................................................................... 2003 11 39Bryan Snyder, Albright ..................................................................................................................................... 1996 10 39Terry Peebles, Hanover .................................................................................................................................... 1995 10 39Kirk Baumgartner, Wis.-Stevens Point ....................................................................................................... 1989 10 39
SINGLE-GAME YARDSYds. Player, Team (Opponent) Date731 Zamir Amin, Menlo (Cal Lutheran) ..........................................................................................................................Oct. 7, 2000625 Duncan White, Puget Sound (Lewis & Clark) ...................................................................................................Oct. 23, 2010619 Justin Peery, Westminster (MO) (MacMurray) ................................................................................................. Nov. 24, 1998618 Justin Peery, Westminster (MO) (Principia) .......................................................................................................Oct. 17, 1998602 Danny Ragsdale, Redlands (Azusa Pacific) ......................................................................................................Sept. 25, 1999
Player, Team Year G Att. Cmp. Int. Pct. Yards TD
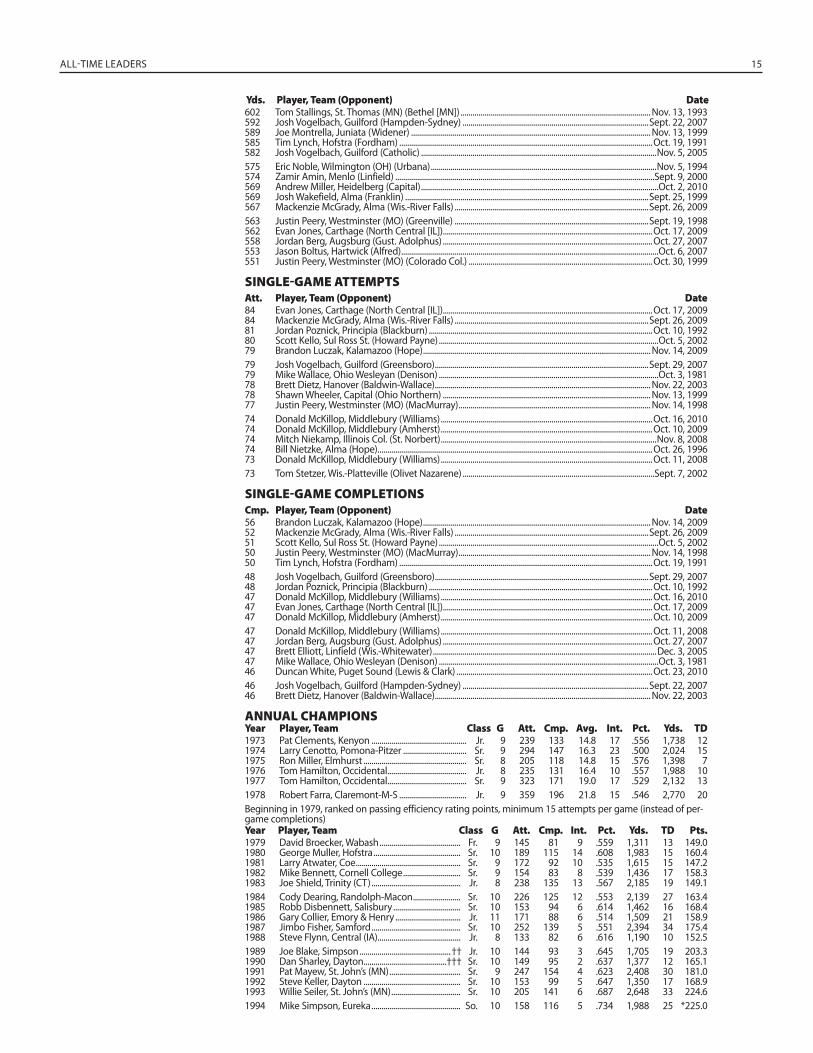
ALL-TIME LEADERS 15
602 Tom Stallings, St. Thomas (MN) (Bethel [MN]) ................................................................................................ Nov. 13, 1993592 Josh Vogelbach, Guilford (Hampden-Sydney) ..............................................................................................Sept. 22, 2007589 Joe Montrella, Juniata (Widener) ......................................................................................................................... Nov. 13, 1999585 Tim Lynch, Hofstra (Fordham) ................................................................................................................................Oct. 19, 1991582 Josh Vogelbach, Guilford (Catholic) .......................................................................................................................Nov. 5, 2005575 Eric Noble, Wilmington (OH) (Urbana) ..................................................................................................................Nov. 5, 1994574 Zamir Amin, Menlo (Linfield) ...................................................................................................................................Sept. 9, 2000569 Andrew Miller, Heidelberg (Capital) ........................................................................................................................Oct. 2, 2010569 Josh Wakefield, Alma (Franklin) ...........................................................................................................................Sept. 25, 1999567 Mackenzie McGrady, Alma (Wis.-River Falls) ..................................................................................................Sept. 26, 2009563 Justin Peery, Westminster (MO) (Greenville) ..................................................................................................Sept. 19, 1998562 Evan Jones, Carthage (North Central [IL])..........................................................................................................Oct. 17, 2009558 Jordan Berg, Augsburg (Gust. Adolphus) ..........................................................................................................Oct. 27, 2007553 Jason Boltus, Hartwick (Alfred) ..................................................................................................................................Oct. 6, 2007551 Justin Peery, Westminster (MO) (Colorado Col.) .............................................................................................Oct. 30, 1999
SINGLE-GAME ATTEMPTSAtt. Player, Team (Opponent) Date84 Evan Jones, Carthage (North Central [IL])..........................................................................................................Oct. 17, 200984 Mackenzie McGrady, Alma (Wis.-River Falls) ..................................................................................................Sept. 26, 200981 Jordan Poznick, Principia (Blackburn) .................................................................................................................Oct. 10, 199280 Scott Kello, Sul Ross St. (Howard Payne) ...............................................................................................................Oct. 5, 200279 Brandon Luczak, Kalamazoo (Hope) ................................................................................................................... Nov. 14, 200979 Josh Vogelbach, Guilford (Greensboro) ............................................................................................................Sept. 29, 200779 Mike Wallace, Ohio Wesleyan (Denison) ...............................................................................................................Oct. 3, 198178 Brett Dietz, Hanover (Baldwin-Wallace) ............................................................................................................. Nov. 22, 200378 Shawn Wheeler, Capital (Ohio Northern) ......................................................................................................... Nov. 13, 199977 Justin Peery, Westminster (MO) (MacMurray) ................................................................................................. Nov. 14, 199874 Donald McKillop, Middlebury (Williams) ...........................................................................................................Oct. 16, 201074 Donald McKillop, Middlebury (Amherst) ...........................................................................................................Oct. 10, 200974 Mitch Niekamp, Illinois Col. (St. Norbert) .............................................................................................................Nov. 8, 200874 Bill Nietzke, Alma (Hope)...........................................................................................................................................Oct. 26, 199673 Donald McKillop, Middlebury (Williams) ...........................................................................................................Oct. 11, 200873 Tom Stetzer, Wis.-Platteville (Olivet Nazarene) .................................................................................................Sept. 7, 2002
SINGLE-GAME COMPLETIONSCmp. Player, Team (Opponent) Date56 Brandon Luczak, Kalamazoo (Hope) ................................................................................................................... Nov. 14, 200952 Mackenzie McGrady, Alma (Wis.-River Falls) ..................................................................................................Sept. 26, 200951 Scott Kello, Sul Ross St. (Howard Payne) ...............................................................................................................Oct. 5, 200250 Justin Peery, Westminster (MO) (MacMurray) ................................................................................................. Nov. 14, 199850 Tim Lynch, Hofstra (Fordham) ................................................................................................................................Oct. 19, 199148 Josh Vogelbach, Guilford (Greensboro) ............................................................................................................Sept. 29, 200748 Jordan Poznick, Principia (Blackburn) .................................................................................................................Oct. 10, 199247 Donald McKillop, Middlebury (Williams) ...........................................................................................................Oct. 16, 201047 Evan Jones, Carthage (North Central [IL])..........................................................................................................Oct. 17, 200947 Donald McKillop, Middlebury (Amherst) ...........................................................................................................Oct. 10, 200947 Donald McKillop, Middlebury (Williams) ...........................................................................................................Oct. 11, 200847 Jordan Berg, Augsburg (Gust. Adolphus) ..........................................................................................................Oct. 27, 200747 Brett Elliott, Linfield (Wis.-Whitewater) .................................................................................................................Dec. 3, 200547 Mike Wallace, Ohio Wesleyan (Denison) ...............................................................................................................Oct. 3, 198146 Duncan White, Puget Sound (Lewis & Clark) ...................................................................................................Oct. 23, 201046 Josh Vogelbach, Guilford (Hampden-Sydney) ..............................................................................................Sept. 22, 200746 Brett Dietz, Hanover (Baldwin-Wallace) ............................................................................................................. Nov. 22, 2003
ANNUAL CHAMPIONSYear Player, Team Class G Att. Cmp. Avg. Int. Pct. Yds. TD1973 Pat Clements, Kenyon ................................................ Jr. 9 239 133 14.8 17 .556 1,738 121974 Larry Cenotto, Pomona-Pitzer ................................ Sr. 9 294 147 16.3 23 .500 2,024 151975 Ron Miller, Elmhurst .................................................... Sr. 8 205 118 14.8 15 .576 1,398 71976 Tom Hamilton, Occidental........................................ Jr. 8 235 131 16.4 10 .557 1,988 101977 Tom Hamilton, Occidental........................................ Sr. 9 323 171 19.0 17 .529 2,132 131978 Robert Farra, Claremont-M-S .................................. Jr. 9 359 196 21.8 15 .546 2,770 20Beginning in 1979, ranked on passing efficiency rating points, minimum 15 attempts per game (instead of per-game completions)Year Player, Team Class G Att. Cmp. Int. Pct. Yds. TD Pts.1979 David Broecker, Wabash ......................................... Fr. 9 145 81 9 .559 1,311 13 149.01980 George Muller, Hofstra ............................................ Sr. 10 189 115 14 .608 1,983 15 160.41981 Larry Atwater, Coe ..................................................... Sr. 9 172 92 10 .535 1,615 15 147.21982 Mike Bennett, Cornell College ............................. Sr. 9 154 83 8 .539 1,436 17 158.31983 Joe Shield, Trinity (CT) ............................................. Jr. 8 238 135 13 .567 2,185 19 149.11984 Cody Dearing, Randolph-Macon ........................ Sr. 10 226 125 12 .553 2,139 27 163.41985 Robb Disbennett, Salisbury .................................. Sr. 10 153 94 6 .614 1,462 16 168.41986 Gary Collier, Emory & Henry ................................. Jr. 11 171 88 6 .514 1,509 21 158.91987 Jimbo Fisher, Samford ............................................. Sr. 10 252 139 5 .551 2,394 34 175.41988 Steve Flynn, Central (IA).......................................... Jr. 8 133 82 6 .616 1,190 10 152.51989 Joe Blake, Simpson ..............................................†† Jr. 10 144 93 3 .645 1,705 19 203.31990 Dan Sharley, Dayton ..........................................††† Sr. 10 149 95 2 .637 1,377 12 165.11991 Pat Mayew, St. John’s (MN) .................................... Sr. 9 247 154 4 .623 2,408 30 181.01992 Steve Keller, Dayton ................................................. Sr. 10 153 99 5 .647 1,350 17 168.91993 Willie Seiler, St. John’s (MN) ................................... Sr. 10 205 141 6 .687 2,648 33 224.61994 Mike Simpson, Eureka ............................................. So. 10 158 116 5 .734 1,988 25 *225.0
Yds. Player, Team (Opponent) Date
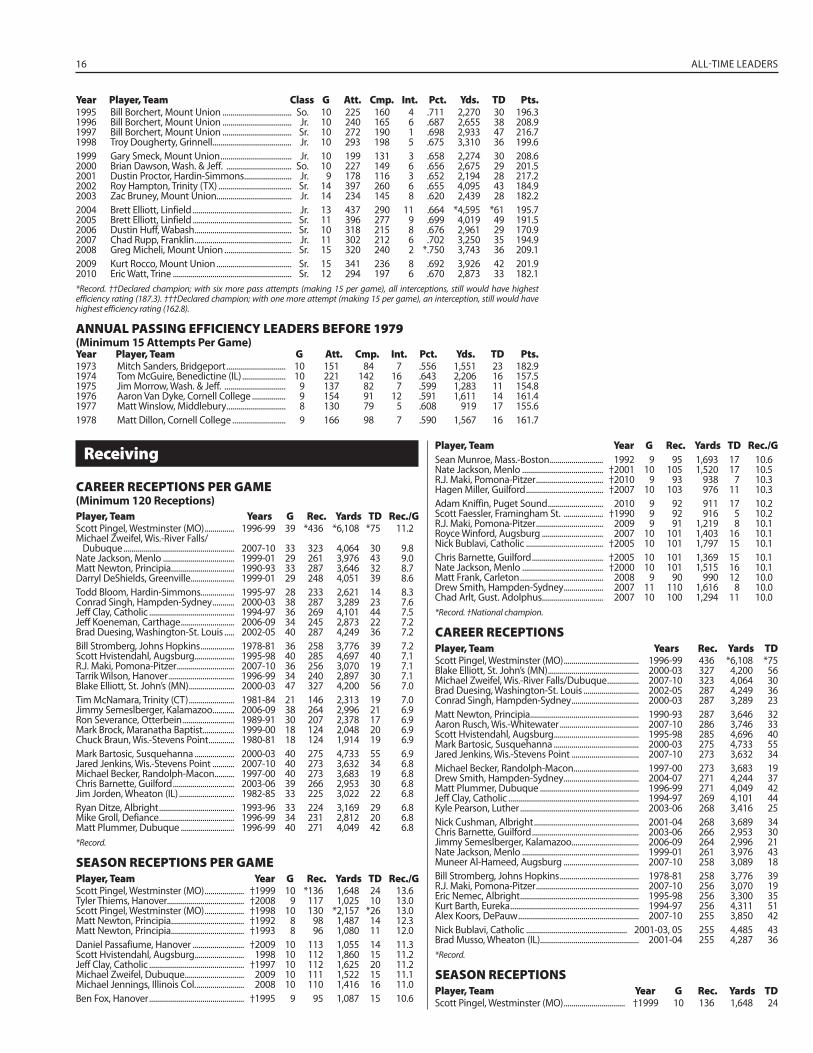
16 ALL-TIME LEADERS
1995 Bill Borchert, Mount Union ................................... So. 10 225 160 4 .711 2,270 30 196.31996 Bill Borchert, Mount Union ................................... Jr. 10 240 165 6 .687 2,655 38 208.91997 Bill Borchert, Mount Union ................................... Sr. 10 272 190 1 .698 2,933 47 216.71998 Troy Dougherty, Grinnell........................................ Jr. 10 293 198 5 .675 3,310 36 199.61999 Gary Smeck, Mount Union .................................... Jr. 10 199 131 3 .658 2,274 30 208.62000 Brian Dawson, Wash. & Jeff. ................................. So. 10 227 149 6 .656 2,675 29 201.52001 Dustin Proctor, Hardin-Simmons ........................ Jr. 9 178 116 3 .652 2,194 28 217.22002 Roy Hampton, Trinity (TX) ..................................... Sr. 14 397 260 6 .655 4,095 43 184.92003 Zac Bruney, Mount Union...................................... Jr. 14 234 145 8 .620 2,439 28 182.22004 Brett Elliott, Linfield .................................................. Jr. 13 437 290 11 .664 *4,595 *61 195.72005 Brett Elliott, Linfield .................................................. Sr. 11 396 277 9 .699 4,019 49 191.52006 Dustin Huff, Wabash ................................................. Sr. 10 318 215 8 .676 2,961 29 170.92007 Chad Rupp, Franklin ................................................. Jr. 11 302 212 6 .702 3,250 35 194.92008 Greg Micheli, Mount Union .................................. Sr. 15 320 240 2 *.750 3,743 36 209.12009 Kurt Rocco, Mount Union ...................................... Sr. 15 341 236 8 .692 3,926 42 201.92010 Eric Watt, Trine ............................................................ Sr. 12 294 197 6 .670 2,873 33 182.1*Record. ††Declared champion; with six more pass attempts (making 15 per game), all interceptions, still would have highest efficiency rating (187.3). †††Declared champion; with one more attempt (making 15 per game), an interception, still would have highest efficiency rating (162.8).
ANNUAL PASSING EFFICIENCY LEADERS BEFORE 1979(Minimum 15 Attempts Per Game)Year Player, Team G Att. Cmp. Int. Pct. Yds. TD Pts.1973 Mitch Sanders, Bridgeport .............................. 10 151 84 7 .556 1,551 23 182.91974 Tom McGuire, Benedictine (IL) ...................... 10 221 142 16 .643 2,206 16 157.51975 Jim Morrow, Wash. & Jeff. ............................... 9 137 82 7 .599 1,283 11 154.81976 Aaron Van Dyke, Cornell College ................. 9 154 91 12 .591 1,611 14 161.41977 Matt Winslow, Middlebury .............................. 8 130 79 5 .608 919 17 155.61978 Matt Dillon, Cornell College ........................... 9 166 98 7 .590 1,567 16 161.7
Year Player, Team Class G Att. Cmp. Int. Pct. Yds. TD Pts.
Receiving
CAREER RECEPTIONS PER GAME(Minimum 120 Receptions)
Player, Team Years G Rec. Yards TD Rec./GScott Pingel, Westminster (MO) ............... 1996-99 39 *436 *6,108 *75 11.2Michael Zweifel, Wis.-River Falls/ Dubuque ........................................................ 2007-10 33 323 4,064 30 9.8Nate Jackson, Menlo .................................... 1999-01 29 261 3,976 43 9.0Matt Newton, Principia................................ 1990-93 33 287 3,646 32 8.7Darryl DeShields, Greenville ...................... 1999-01 29 248 4,051 39 8.6Todd Bloom, Hardin-Simmons................. 1995-97 28 233 2,621 14 8.3Conrad Singh, Hampden-Sydney ........... 2000-03 38 287 3,289 23 7.6Jeff Clay, Catholic ........................................... 1994-97 36 269 4,101 44 7.5Jeff Koeneman, Carthage ........................... 2006-09 34 245 2,873 22 7.2Brad Duesing, Washington-St. Louis ..... 2002-05 40 287 4,249 36 7.2Bill Stromberg, Johns Hopkins ................. 1978-81 36 258 3,776 39 7.2Scott Hvistendahl, Augsburg .................... 1995-98 40 285 4,697 40 7.1R.J. Maki, Pomona-Pitzer ............................. 2007-10 36 256 3,070 19 7.1Tarrik Wilson, Hanover ................................. 1996-99 34 240 2,897 30 7.1Blake Elliott, St. John’s (MN) ....................... 2000-03 47 327 4,200 56 7.0Tim McNamara, Trinity (CT) ....................... 1981-84 21 146 2,313 19 7.0Jimmy Semeslberger, Kalamazoo........... 2006-09 38 264 2,996 21 6.9Ron Severance, Otterbein .......................... 1989-91 30 207 2,378 17 6.9Mark Brock, Maranatha Baptist ................ 1999-00 18 124 2,048 20 6.9Chuck Braun, Wis.-Stevens Point ............. 1980-81 18 124 1,914 19 6.9Mark Bartosic, Susquehanna .................... 2000-03 40 275 4,733 55 6.9Jared Jenkins, Wis.-Stevens Point ........... 2007-10 40 273 3,632 34 6.8Michael Becker, Randolph-Macon.......... 1997-00 40 273 3,683 19 6.8Chris Barnette, Guilford ............................... 2003-06 39 266 2,953 30 6.8Jim Jorden, Wheaton (IL) ............................ 1982-85 33 225 3,022 22 6.8Ryan Ditze, Albright ...................................... 1993-96 33 224 3,169 29 6.8Mike Groll, Defiance ...................................... 1996-99 34 231 2,812 20 6.8Matt Plummer, Dubuque ........................... 1996-99 40 271 4,049 42 6.8*Record.
SEASON RECEPTIONS PER GAMEPlayer, Team Year G Rec. Yards TD Rec./GScott Pingel, Westminster (MO) .................... †1999 10 *136 1,648 24 13.6Tyler Thiems, Hanover....................................... †2008 9 117 1,025 10 13.0Scott Pingel, Westminster (MO) .................... †1998 10 130 *2,157 *26 13.0Matt Newton, Principia..................................... †1992 8 98 1,487 14 12.3Matt Newton, Principia..................................... †1993 8 96 1,080 11 12.0Daniel Passafiume, Hanover .......................... †2009 10 113 1,055 14 11.3Scott Hvistendahl, Augsburg ......................... 1998 10 112 1,860 15 11.2Jeff Clay, Catholic ................................................ †1997 10 112 1,625 20 11.2Michael Zweifel, Dubuque .............................. 2009 10 111 1,522 15 11.1Michael Jennings, Illinois Col. ........................ 2008 10 110 1,416 16 11.0Ben Fox, Hanover ................................................ †1995 9 95 1,087 15 10.6
Sean Munroe, Mass.-Boston ........................... 1992 9 95 1,693 17 10.6Nate Jackson, Menlo ......................................... †2001 10 105 1,520 17 10.5R.J. Maki, Pomona-Pitzer .................................. †2010 9 93 938 7 10.3Hagen Miller, Guilford ....................................... †2007 10 103 976 11 10.3Adam Kniffin, Puget Sound ............................ 2010 9 92 911 17 10.2Scott Faessler, Framingham St. .................... †1990 9 92 916 5 10.2R.J. Maki, Pomona-Pitzer .................................. 2009 9 91 1,219 8 10.1Royce Winford, Augsburg ............................... 2007 10 101 1,403 16 10.1Nick Bublavi, Catholic ....................................... †2005 10 101 1,797 15 10.1Chris Barnette, Guilford .................................... †2005 10 101 1,369 15 10.1Nate Jackson, Menlo ......................................... †2000 10 101 1,515 16 10.1Matt Frank, Carleton .......................................... 2008 9 90 990 12 10.0Drew Smith, Hampden-Sydney .................... 2007 11 110 1,616 8 10.0Chad Arlt, Gust. Adolphus ............................... 2007 10 100 1,294 11 10.0*Record. †National champion.
CAREER RECEPTIONSPlayer, Team Years Rec. Yards TDScott Pingel, Westminster (MO) ...................................... 1996-99 436 *6,108 *75Blake Elliott, St. John’s (MN) .............................................. 2000-03 327 4,200 56Michael Zweifel, Wis.-River Falls/Dubuque ................ 2007-10 323 4,064 30Brad Duesing, Washington-St. Louis ............................ 2002-05 287 4,249 36Conrad Singh, Hampden-Sydney .................................. 2000-03 287 3,289 23Matt Newton, Principia....................................................... 1990-93 287 3,646 32Aaron Rusch, Wis.-Whitewater ........................................ 2007-10 286 3,746 33Scott Hvistendahl, Augsburg ........................................... 1995-98 285 4,696 40Mark Bartosic, Susquehanna ........................................... 2000-03 275 4,733 55Jared Jenkins, Wis.-Stevens Point .................................. 2007-10 273 3,632 34Michael Becker, Randolph-Macon................................. 1997-00 273 3,683 19Drew Smith, Hampden-Sydney ...................................... 2004-07 271 4,244 37Matt Plummer, Dubuque .................................................. 1996-99 271 4,049 42Jeff Clay, Catholic .................................................................. 1994-97 269 4,101 44Kyle Pearson, Luther ............................................................ 2003-06 268 3,416 25Nick Cushman, Albright ..................................................... 2001-04 268 3,689 34Chris Barnette, Guilford ...................................................... 2003-06 266 2,953 30Jimmy Semeslberger, Kalamazoo.................................. 2006-09 264 2,996 21Nate Jackson, Menlo ........................................................... 1999-01 261 3,976 43Muneer Al-Hameed, Augsburg ...................................... 2007-10 258 3,089 18Bill Stromberg, Johns Hopkins ........................................ 1978-81 258 3,776 39R.J. Maki, Pomona-Pitzer .................................................... 2007-10 256 3,070 19Eric Nemec, Albright ............................................................ 1995-98 256 3,300 35Kurt Barth, Eureka ................................................................. 1994-97 256 4,311 51Alex Koors, DePauw ............................................................. 2007-10 255 3,850 42Nick Bublavi, Catholic ................................................... 2001-03, 05 255 4,485 43Brad Musso, Wheaton (IL).................................................. 2001-04 255 4,287 36*Record.
SEASON RECEPTIONSPlayer, Team Year G Rec. Yards TDScott Pingel, Westminster (MO) ............................... †1999 10 136 1,648 24
Player, Team Year G Rec. Yards TD Rec./G
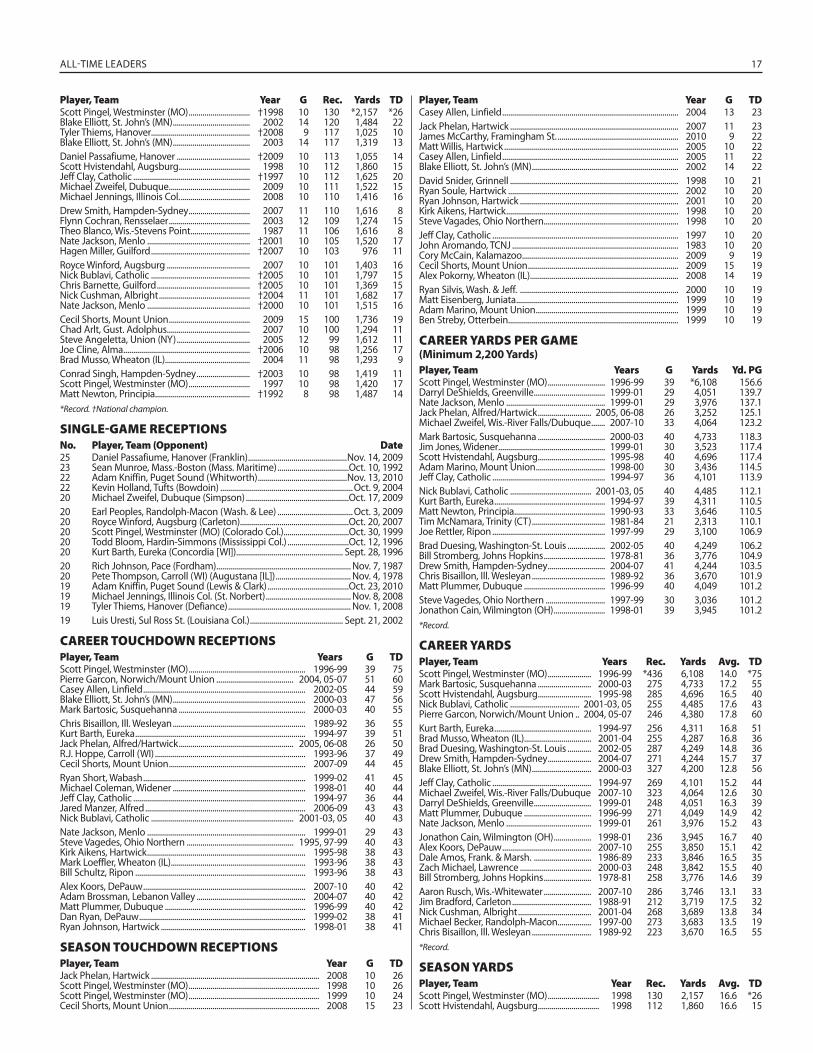
ALL-TIME LEADERS 17
Scott Pingel, Westminster (MO) ............................... †1998 10 130 *2,157 *26Blake Elliott, St. John’s (MN) ....................................... 2002 14 120 1,484 22Tyler Thiems, Hanover.................................................. †2008 9 117 1,025 10Blake Elliott, St. John’s (MN) ....................................... 2003 14 117 1,319 13Daniel Passafiume, Hanover ..................................... †2009 10 113 1,055 14Scott Hvistendahl, Augsburg .................................... 1998 10 112 1,860 15Jeff Clay, Catholic ........................................................... †1997 10 112 1,625 20Michael Zweifel, Dubuque ......................................... 2009 10 111 1,522 15Michael Jennings, Illinois Col. ................................... 2008 10 110 1,416 16Drew Smith, Hampden-Sydney ............................... 2007 11 110 1,616 8Flynn Cochran, Rensselaer ......................................... 2003 12 109 1,274 15Theo Blanco, Wis.-Stevens Point .............................. 1987 11 106 1,616 8Nate Jackson, Menlo .................................................... †2001 10 105 1,520 17Hagen Miller, Guilford .................................................. †2007 10 103 976 11Royce Winford, Augsburg .......................................... 2007 10 101 1,403 16Nick Bublavi, Catholic .................................................. †2005 10 101 1,797 15Chris Barnette, Guilford ............................................... †2005 10 101 1,369 15Nick Cushman, Albright .............................................. †2004 11 101 1,682 17Nate Jackson, Menlo .................................................... †2000 10 101 1,515 16Cecil Shorts, Mount Union ......................................... 2009 15 100 1,736 19Chad Arlt, Gust. Adolphus .......................................... 2007 10 100 1,294 11Steve Angeletta, Union (NY) ..................................... 2005 12 99 1,612 11Joe Cline, Alma ................................................................ †2006 10 98 1,256 17Brad Musso, Wheaton (IL)........................................... 2004 11 98 1,293 9Conrad Singh, Hampden-Sydney ........................... †2003 10 98 1,419 11Scott Pingel, Westminster (MO) ............................... 1997 10 98 1,420 17Matt Newton, Principia................................................ †1992 8 98 1,487 14*Record. †National champion.
SINGLE-GAME RECEPTIONSNo. Player, Team (Opponent) Date25 Daniel Passafiume, Hanover (Franklin) ..................................................Nov. 14, 200923 Sean Munroe, Mass.-Boston (Mass. Maritime) ....................................Oct. 10, 199222 Adam Kniffin, Puget Sound (Whitworth) .............................................Nov. 13, 201022 Kevin Holland, Tufts (Bowdoin) ...................................................................Oct. 9, 200420 Michael Zweifel, Dubuque (Simpson) ....................................................Oct. 17, 200920 Earl Peoples, Randolph-Macon (Wash. & Lee) ......................................Oct. 3, 200920 Royce Winford, Augsburg (Carleton).......................................................Oct. 20, 200720 Scott Pingel, Westminster (MO) (Colorado Col.) .................................Oct. 30, 199920 Todd Bloom, Hardin-Simmons (Mississippi Col.) ...............................Oct. 12, 199620 Kurt Barth, Eureka (Concordia [WI]) ...................................................... Sept. 28, 199620 Rich Johnson, Pace (Fordham) .................................................................... Nov. 7, 198720 Pete Thompson, Carroll (WI) (Augustana [IL]) ...................................... Nov. 4, 197819 Adam Kniffin, Puget Sound (Lewis & Clark) .........................................Oct. 23, 201019 Michael Jennings, Illinois Col. (St. Norbert) ........................................... Nov. 8, 200819 Tyler Thiems, Hanover (Defiance) .............................................................. Nov. 1, 200819 Luis Uresti, Sul Ross St. (Louisiana Col.) ............................................... Sept. 21, 2002
CAREER TOUCHDOWN RECEPTIONSPlayer, Team Years G TDScott Pingel, Westminster (MO) ........................................................... 1996-99 39 75Pierre Garcon, Norwich/Mount Union ....................................... 2004, 05-07 51 60Casey Allen, Linfield .................................................................................. 2002-05 44 59Blake Elliott, St. John’s (MN) ................................................................... 2000-03 47 56Mark Bartosic, Susquehanna ................................................................ 2000-03 40 55Chris Bisaillon, Ill. Wesleyan ................................................................... 1989-92 36 55Kurt Barth, Eureka ...................................................................................... 1994-97 39 51Jack Phelan, Alfred/Hartwick .......................................................... 2005, 06-08 26 50R.J. Hoppe, Carroll (WI) ............................................................................ 1993-96 37 49Cecil Shorts, Mount Union ..................................................................... 2007-09 44 45Ryan Short, Wabash .................................................................................. 1999-02 41 45Michael Coleman, Widener ................................................................... 1998-01 40 44Jeff Clay, Catholic ....................................................................................... 1994-97 36 44Jared Manzer, Alfred ................................................................................. 2006-09 43 43Nick Bublavi, Catholic ........................................................................ 2001-03, 05 40 43Nate Jackson, Menlo ................................................................................ 1999-01 29 43Steve Vagedes, Ohio Northern ...................................................... 1995, 97-99 40 43Kirk Aikens, Hartwick ................................................................................ 1995-98 38 43Mark Loeffler, Wheaton (IL) .................................................................... 1993-96 38 43Bill Schultz, Ripon ...................................................................................... 1993-96 38 43Alex Koors, DePauw .................................................................................. 2007-10 40 42Adam Brossman, Lebanon Valley ....................................................... 2004-07 40 42Matt Plummer, Dubuque ....................................................................... 1996-99 40 42Dan Ryan, DePauw .................................................................................... 1999-02 38 41Ryan Johnson, Hartwick ......................................................................... 1998-01 38 41
SEASON TOUCHDOWN RECEPTIONS Player, Team Year G TDJack Phelan, Hartwick ..................................................................................... 2008 10 26Scott Pingel, Westminster (MO) .................................................................. 1998 10 26Scott Pingel, Westminster (MO) .................................................................. 1999 10 24Cecil Shorts, Mount Union ............................................................................ 2008 15 23
Casey Allen, Linfield ......................................................................................... 2004 13 23Jack Phelan, Hartwick ..................................................................................... 2007 11 23James McCarthy, Framingham St. ............................................................. 2010 9 22Matt Willis, Hartwick ........................................................................................ 2005 10 22Casey Allen, Linfield ......................................................................................... 2005 11 22Blake Elliott, St. John’s (MN) .......................................................................... 2002 14 22David Snider, Grinnell ..................................................................................... 1998 10 21Ryan Soule, Hartwick ...................................................................................... 2002 10 20Ryan Johnson, Hartwick ................................................................................ 2001 10 20Kirk Aikens, Hartwick ....................................................................................... 1998 10 20Steve Vagades, Ohio Northern .................................................................... 1998 10 20Jeff Clay, Catholic .............................................................................................. 1997 10 20John Aromando, TCNJ .................................................................................... 1983 10 20Cory McCain, Kalamazoo ............................................................................... 2009 9 19Cecil Shorts, Mount Union ............................................................................ 2009 15 19Alex Pokorny, Wheaton (IL) ........................................................................... 2008 14 19Ryan Silvis, Wash. & Jeff. ................................................................................ 2000 10 19Matt Eisenberg, Juniata .................................................................................. 1999 10 19Adam Marino, Mount Union ........................................................................ 1999 10 19Ben Streby, Otterbein...................................................................................... 1999 10 19
CAREER YARDS PER GAME(Minimum 2,200 Yards)
Player, Team Years G Yards Yd. PGScott Pingel, Westminster (MO) ............................. 1996-99 39 *6,108 156.6Darryl DeShields, Greenville .................................... 1999-01 29 4,051 139.7Nate Jackson, Menlo .................................................. 1999-01 29 3,976 137.1Jack Phelan, Alfred/Hartwick ........................... 2005, 06-08 26 3,252 125.1Michael Zweifel, Wis.-River Falls/Dubuque ....... 2007-10 33 4,064 123.2Mark Bartosic, Susquehanna .................................. 2000-03 40 4,733 118.3Jim Jones, Widener ...................................................... 1999-01 30 3,523 117.4Scott Hvistendahl, Augsburg .................................. 1995-98 40 4,696 117.4Adam Marino, Mount Union ................................... 1998-00 30 3,436 114.5Jeff Clay, Catholic ......................................................... 1994-97 36 4,101 113.9Nick Bublavi, Catholic ......................................... 2001-03, 05 40 4,485 112.1Kurt Barth, Eureka ........................................................ 1994-97 39 4,311 110.5Matt Newton, Principia.............................................. 1990-93 33 3,646 110.5Tim McNamara, Trinity (CT) ..................................... 1981-84 21 2,313 110.1Joe Rettler, Ripon ......................................................... 1997-99 29 3,100 106.9Brad Duesing, Washington-St. Louis ................... 2002-05 40 4,249 106.2Bill Stromberg, Johns Hopkins ............................... 1978-81 36 3,776 104.9Drew Smith, Hampden-Sydney ............................. 2004-07 41 4,244 103.5Chris Bisaillon, Ill. Wesleyan ..................................... 1989-92 36 3,670 101.9Matt Plummer, Dubuque ......................................... 1996-99 40 4,049 101.2Steve Vagedes, Ohio Northern .............................. 1997-99 30 3,036 101.2Jonathon Cain, Wilmington (OH) .......................... 1998-01 39 3,945 101.2*Record.
CAREER YARDSPlayer, Team Years Rec. Yards Avg. TDScott Pingel, Westminster (MO) ...................... 1996-99 *436 6,108 14.0 *75Mark Bartosic, Susquehanna ........................... 2000-03 275 4,733 17.2 55Scott Hvistendahl, Augsburg ........................... 1995-98 285 4,696 16.5 40Nick Bublavi, Catholic ................................... 2001-03, 05 255 4,485 17.6 43Pierre Garcon, Norwich/Mount Union .. 2004, 05-07 246 4,380 17.8 60Kurt Barth, Eureka ................................................. 1994-97 256 4,311 16.8 51Brad Musso, Wheaton (IL).................................. 2001-04 255 4,287 16.8 36Brad Duesing, Washington-St. Louis ............ 2002-05 287 4,249 14.8 36Drew Smith, Hampden-Sydney ...................... 2004-07 271 4,244 15.7 37Blake Elliott, St. John’s (MN) .............................. 2000-03 327 4,200 12.8 56Jeff Clay, Catholic .................................................. 1994-97 269 4,101 15.2 44Michael Zweifel, Wis.-River Falls/Dubuque 2007-10 323 4,064 12.6 30Darryl DeShields, Greenville ............................. 1999-01 248 4,051 16.3 39Matt Plummer, Dubuque .................................. 1996-99 271 4,049 14.9 42Nate Jackson, Menlo ........................................... 1999-01 261 3,976 15.2 43Jonathon Cain, Wilmington (OH) ................... 1998-01 236 3,945 16.7 40Alex Koors, DePauw ............................................. 2007-10 255 3,850 15.1 42Dale Amos, Frank. & Marsh. ............................. 1986-89 233 3,846 16.5 35Zach Michael, Lawrence .................................... 2000-03 248 3,842 15.5 40Bill Stromberg, Johns Hopkins ........................ 1978-81 258 3,776 14.6 39Aaron Rusch, Wis.-Whitewater ........................ 2007-10 286 3,746 13.1 33Jim Bradford, Carleton ........................................ 1988-91 212 3,719 17.5 32Nick Cushman, Albright ..................................... 2001-04 268 3,689 13.8 34Michael Becker, Randolph-Macon................. 1997-00 273 3,683 13.5 19Chris Bisaillon, Ill. Wesleyan .............................. 1989-92 223 3,670 16.5 55*Record.
SEASON YARDSPlayer, Team Year Rec. Yards Avg. TDScott Pingel, Westminster (MO) .......................... 1998 130 2,157 16.6 *26Scott Hvistendahl, Augsburg ............................... 1998 112 1,860 16.6 15
Player, Team Year G TDPlayer, Team Year G Rec. Yards TD
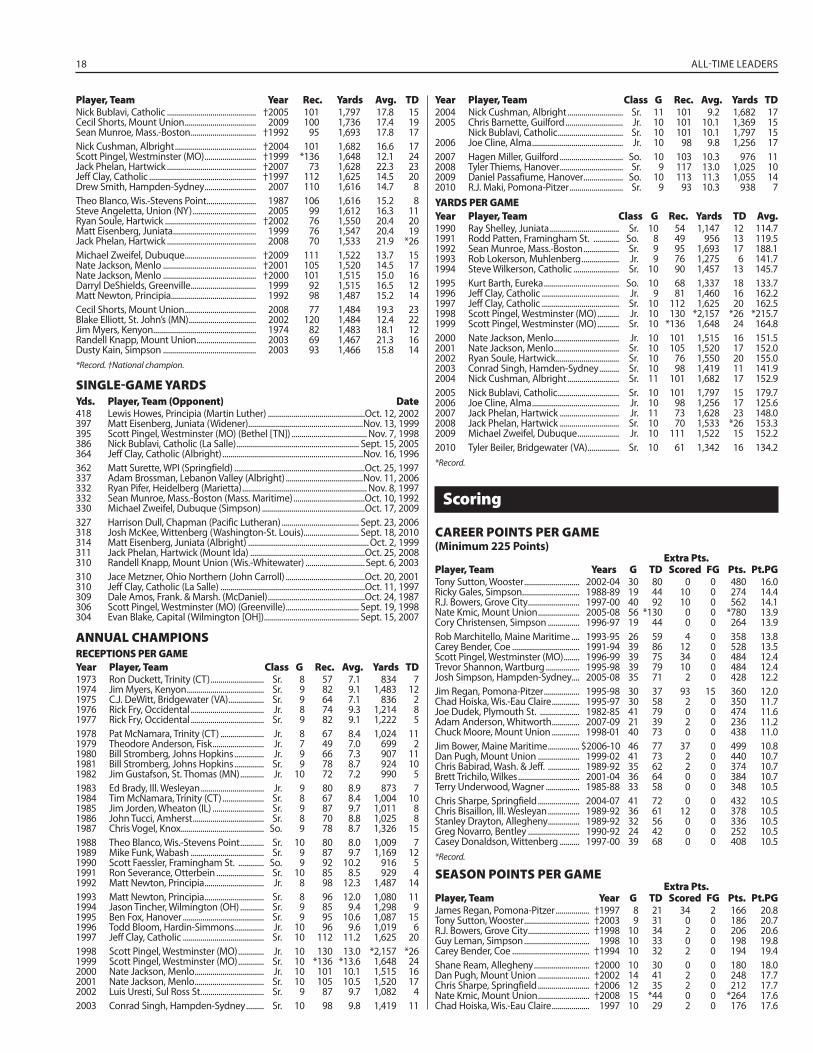
18 ALL-TIME LEADERS
Nick Bublavi, Catholic ............................................. †2005 101 1,797 17.8 15Cecil Shorts, Mount Union .................................... 2009 100 1,736 17.4 19Sean Munroe, Mass.-Boston ................................. †1992 95 1,693 17.8 17Nick Cushman, Albright ......................................... †2004 101 1,682 16.6 17Scott Pingel, Westminster (MO) .......................... †1999 *136 1,648 12.1 24Jack Phelan, Hartwick ............................................. †2007 73 1,628 22.3 23Jeff Clay, Catholic ...................................................... †1997 112 1,625 14.5 20Drew Smith, Hampden-Sydney .......................... 2007 110 1,616 14.7 8Theo Blanco, Wis.-Stevens Point ......................... 1987 106 1,616 15.2 8Steve Angeletta, Union (NY) ................................ 2005 99 1,612 16.3 11Ryan Soule, Hartwick .............................................. †2002 76 1,550 20.4 20Matt Eisenberg, Juniata .......................................... 1999 76 1,547 20.4 19Jack Phelan, Hartwick ............................................. 2008 70 1,533 21.9 *26Michael Zweifel, Dubuque .................................... †2009 111 1,522 13.7 15Nate Jackson, Menlo ............................................... †2001 105 1,520 14.5 17Nate Jackson, Menlo ............................................... †2000 101 1,515 15.0 16Darryl DeShields, Greenville ................................. 1999 92 1,515 16.5 12Matt Newton, Principia........................................... 1992 98 1,487 15.2 14Cecil Shorts, Mount Union .................................... 2008 77 1,484 19.3 23Blake Elliott, St. John’s (MN) .................................. 2002 120 1,484 12.4 22Jim Myers, Kenyon.................................................... 1974 82 1,483 18.1 12Randell Knapp, Mount Union .............................. 2003 69 1,467 21.3 16Dusty Kain, Simpson ............................................... 2003 93 1,466 15.8 14*Record. †National champion.
SINGLE-GAME YARDSYds. Player, Team (Opponent) Date418 Lewis Howes, Principia (Martin Luther) .................................................Oct. 12, 2002397 Matt Eisenberg, Juniata (Widener) ..........................................................Nov. 13, 1999395 Scott Pingel, Westminster (MO) (Bethel [TN]) ...................................... Nov. 7, 1998386 Nick Bublavi, Catholic (La Salle) .............................................................. Sept. 15, 2005364 Jeff Clay, Catholic (Albright) .......................................................................Nov. 16, 1996362 Matt Surette, WPI (Springfield) ..................................................................Oct. 25, 1997337 Adam Brossman, Lebanon Valley (Albright) .......................................Nov. 11, 2006332 Ryan Pifer, Heidelberg (Marietta) ............................................................... Nov. 8, 1997332 Sean Munroe, Mass.-Boston (Mass. Maritime) ....................................Oct. 10, 1992330 Michael Zweifel, Dubuque (Simpson) ....................................................Oct. 17, 2009327 Harrison Dull, Chapman (Pacific Lutheran) ....................................... Sept. 23, 2006318 Josh McKee, Wittenberg (Washington-St. Louis) ............................ Sept. 18, 2010314 Matt Eisenberg, Juniata (Albright) .............................................................Oct. 2, 1999311 Jack Phelan, Hartwick (Mount Ida) ..........................................................Oct. 25, 2008310 Randell Knapp, Mount Union (Wis.-Whitewater) ..............................Sept. 6, 2003310 Jace Metzner, Ohio Northern (John Carroll) ........................................Oct. 20, 2001310 Jeff Clay, Catholic (La Salle) .........................................................................Oct. 11, 1997309 Dale Amos, Frank. & Marsh. (McDaniel) .................................................Oct. 24, 1987306 Scott Pingel, Westminster (MO) (Greenville) ..................................... Sept. 19, 1998304 Evan Blake, Capital (Wilmington [OH]) ................................................ Sept. 15, 2007
ANNUAL CHAMPIONSRECEPTIONS PER GAMEYear Player, Team Class G Rec. Avg. Yards TD1973 Ron Duckett, Trinity (CT) ........................... Sr. 8 57 7.1 834 71974 Jim Myers, Kenyon ....................................... Sr. 9 82 9.1 1,483 121975 C.J. DeWitt, Bridgewater (VA) .................. Sr. 9 64 7.1 836 21976 Rick Fry, Occidental ..................................... Jr. 8 74 9.3 1,214 81977 Rick Fry, Occidental ..................................... Sr. 9 82 9.1 1,222 51978 Pat McNamara, Trinity (CT) ...................... Jr. 8 67 8.4 1,024 111979 Theodore Anderson, Fisk .......................... Jr. 7 49 7.0 699 21980 Bill Stromberg, Johns Hopkins ............... Jr. 9 66 7.3 907 111981 Bill Stromberg, Johns Hopkins ............... Sr. 9 78 8.7 924 101982 Jim Gustafson, St. Thomas (MN) ............ Jr. 10 72 7.2 990 51983 Ed Brady, Ill. Wesleyan ................................ Jr. 9 80 8.9 873 71984 Tim McNamara, Trinity (CT) ..................... Sr. 8 67 8.4 1,004 101985 Jim Jorden, Wheaton (IL) .......................... Sr. 9 87 9.7 1,011 81986 John Tucci, Amherst .................................... Sr. 8 70 8.8 1,025 81987 Chris Vogel, Knox .......................................... So. 9 78 8.7 1,326 151988 Theo Blanco, Wis.-Stevens Point ............ Sr. 10 80 8.0 1,009 71989 Mike Funk, Wabash ..................................... Sr. 9 87 9.7 1,169 121990 Scott Faessler, Framingham St. ............. So. 9 92 10.2 916 51991 Ron Severance, Otterbein ........................ Sr. 10 85 8.5 929 41992 Matt Newton, Principia .............................. Jr. 8 98 12.3 1,487 141993 Matt Newton, Principia .............................. Sr. 8 96 12.0 1,080 111994 Jason Tincher, Wilmington (OH) ............ Sr. 9 85 9.4 1,298 91995 Ben Fox, Hanover ......................................... Sr. 9 95 10.6 1,087 151996 Todd Bloom, Hardin-Simmons ............... Jr. 10 96 9.6 1,019 61997 Jeff Clay, Catholic ......................................... Sr. 10 112 11.2 1,625 201998 Scott Pingel, Westminster (MO) ............. Jr. 10 130 13.0 *2,157 *261999 Scott Pingel, Westminster (MO) ............. Sr. 10 *136 *13.6 1,648 242000 Nate Jackson, Menlo ................................... Jr. 10 101 10.1 1,515 162001 Nate Jackson, Menlo ................................... Sr. 10 105 10.5 1,520 172002 Luis Uresti, Sul Ross St. ............................... Sr. 9 87 9.7 1,082 42003 Conrad Singh, Hampden-Sydney ......... Sr. 10 98 9.8 1,419 11
2004 Nick Cushman, Albright ............................ Sr. 11 101 9.2 1,682 172005 Chris Barnette, Guilford ............................. Jr. 10 101 10.1 1,369 15 Nick Bublavi, Catholic ................................. Sr. 10 101 10.1 1,797 152006 Joe Cline, Alma .............................................. Jr. 10 98 9.8 1,256 172007 Hagen Miller, Guilford ................................ So. 10 103 10.3 976 112008 Tyler Thiems, Hanover ................................ Sr. 9 117 13.0 1,025 102009 Daniel Passafiume, Hanover .................... So. 10 113 11.3 1,055 142010 R.J. Maki, Pomona-Pitzer ........................... Sr. 9 93 10.3 938 7YARDS PER GAMEYear Player, Team Class G Rec. Yards TD Avg.1990 Ray Shelley, Juniata ................................... Sr. 10 54 1,147 12 114.71991 Rodd Patten, Framingham St. ............. So. 8 49 956 13 119.51992 Sean Munroe, Mass.-Boston .................. Sr. 9 95 1,693 17 188.11993 Rob Lokerson, Muhlenberg ................... Jr. 9 76 1,275 6 141.71994 Steve Wilkerson, Catholic ....................... Sr. 10 90 1,457 13 145.71995 Kurt Barth, Eureka ...................................... So. 10 68 1,337 18 133.71996 Jeff Clay, Catholic ....................................... Jr. 9 81 1,460 16 162.21997 Jeff Clay, Catholic ....................................... Sr. 10 112 1,625 20 162.51998 Scott Pingel, Westminster (MO) ........... Jr. 10 130 *2,157 *26 *215.71999 Scott Pingel, Westminster (MO) ........... Sr. 10 *136 1,648 24 164.82000 Nate Jackson, Menlo ................................. Jr. 10 101 1,515 16 151.52001 Nate Jackson, Menlo ................................. Sr. 10 105 1,520 17 152.02002 Ryan Soule, Hartwick ................................ Sr. 10 76 1,550 20 155.02003 Conrad Singh, Hamden-Sydney .......... Sr. 10 98 1,419 11 141.92004 Nick Cushman, Albright .......................... Sr. 11 101 1,682 17 152.92005 Nick Bublavi, Catholic ............................... Sr. 10 101 1,797 15 179.72006 Joe Cline, Alma ............................................ Jr. 10 98 1,256 17 125.62007 Jack Phelan, Hartwick .............................. Jr. 11 73 1,628 23 148.02008 Jack Phelan, Hartwick .............................. Sr. 10 70 1,533 *26 153.32009 Michael Zweifel, Dubuque ..................... Jr. 10 111 1,522 15 152.22010 Tyler Beiler, Bridgewater (VA) ................ Sr. 10 61 1,342 16 134.2*Record.
Scoring
CAREER POINTS PER GAME(Minimum 225 Points)
Extra Pts.Player, Team Years G TD Scored FG Pts. Pt.PGTony Sutton, Wooster ............................ 2002-04 30 80 0 0 480 16.0Ricky Gales, Simpson ............................. 1988-89 19 44 10 0 274 14.4R.J. Bowers, Grove City .......................... 1997-00 40 92 10 0 562 14.1Nate Kmic, Mount Union ..................... 2005-08 56 *130 0 0 *780 13.9Cory Christensen, Simpson ................ 1996-97 19 44 0 0 264 13.9Rob Marchitello, Maine Maritime .... 1993-95 26 59 4 0 358 13.8Carey Bender, Coe .................................. 1991-94 39 86 12 0 528 13.5Scott Pingel, Westminster (MO) ........ 1996-99 39 75 34 0 484 12.4Trevor Shannon, Wartburg ................. 1995-98 39 79 10 0 484 12.4Josh Simpson, Hampden-Sydney.... 2005-08 35 71 2 0 428 12.2Jim Regan, Pomona-Pitzer .................. 1995-98 30 37 93 15 360 12.0Chad Hoiska, Wis.-Eau Claire .............. 1995-97 30 58 2 0 350 11.7Joe Dudek, Plymouth St. .................... 1982-85 41 79 0 0 474 11.6Adam Anderson, Whitworth .............. 2007-09 21 39 2 0 236 11.2Chuck Moore, Mount Union .............. 1998-01 40 73 0 0 438 11.0Jim Bower, Maine Maritime ................ $2006-10 46 77 37 0 499 10.8Dan Pugh, Mount Union ..................... 1999-02 41 73 2 0 440 10.7Chris Babirad, Wash. & Jeff. ................ 1989-92 35 62 2 0 374 10.7Brett Trichilo, Wilkes ............................... 2001-04 36 64 0 0 384 10.7Terry Underwood, Wagner ................. 1985-88 33 58 0 0 348 10.5Chris Sharpe, Springfield ..................... 2004-07 41 72 0 0 432 10.5Chris Bisaillon, Ill. Wesleyan ................ 1989-92 36 61 12 0 378 10.5Stanley Drayton, Allegheny ................ 1989-92 32 56 0 0 336 10.5Greg Novarro, Bentley .......................... 1990-92 24 42 0 0 252 10.5Casey Donaldson, Wittenberg .......... 1997-00 39 68 0 0 408 10.5*Record.
SEASON POINTS PER GAMEExtra Pts.
Player, Team Year G TD Scored FG Pts. Pt.PGJames Regan, Pomona-Pitzer ................. †1997 8 21 34 2 166 20.8Tony Sutton, Wooster ................................. †2003 9 31 0 0 186 20.7R.J. Bowers, Grove City ............................... †1998 10 34 2 0 206 20.6Guy Leman, Simpson ................................. 1998 10 33 0 0 198 19.8Carey Bender, Coe ....................................... †1994 10 32 2 0 194 19.4Shane Ream, Allegheny ............................ †2000 10 30 0 0 180 18.0Dan Pugh, Mount Union .......................... †2002 14 41 2 0 248 17.7Chris Sharpe, Springfield .......................... †2006 12 35 2 0 212 17.7Nate Kmic, Mount Union .......................... †2008 15 *44 0 0 *264 17.6Chad Hoiska, Wis.-Eau Claire ................... 1997 10 29 2 0 176 17.6
Player, Team Year Rec. Yards Avg. TD Year Player, Team Class G Rec. Avg. Yards TD
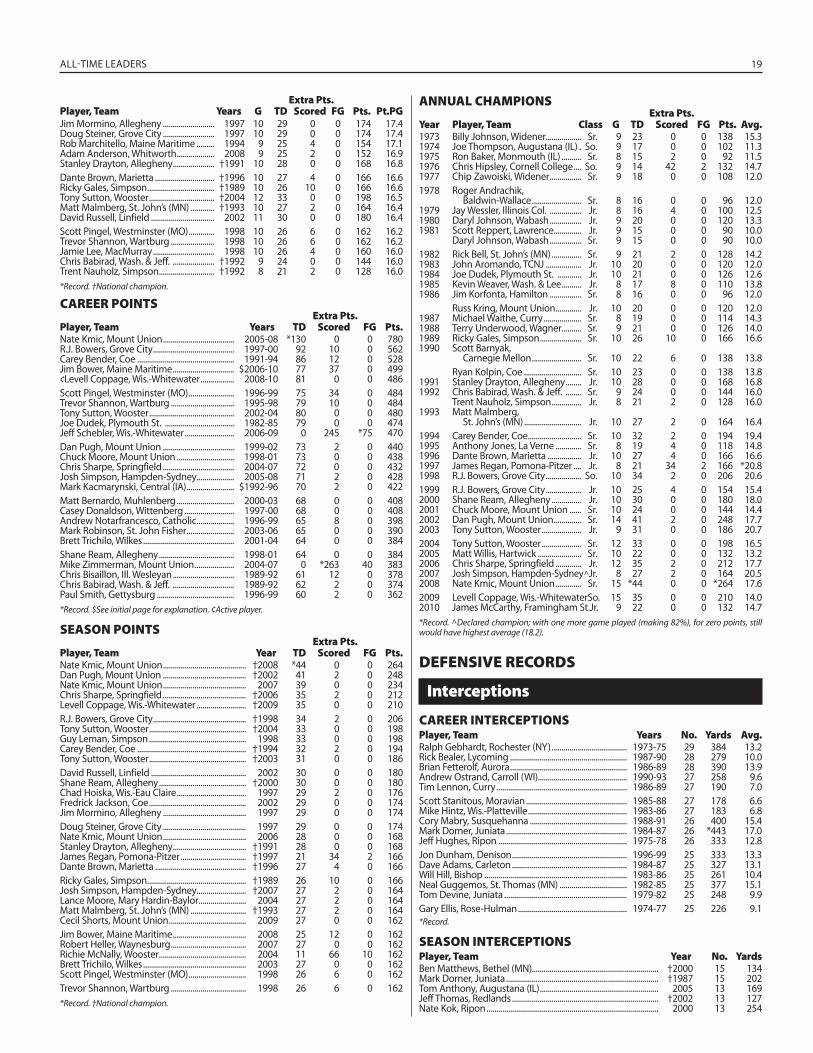
ALL-TIME LEADERS 19
Jim Mormino, Allegheny .......................... 1997 10 29 0 0 174 17.4Doug Steiner, Grove City .......................... 1997 10 29 0 0 174 17.4Rob Marchitello, Maine Maritime ......... 1994 9 25 4 0 154 17.1Adam Anderson, Whitworth ................... 2008 9 25 2 0 152 16.9Stanley Drayton, Allegheny ..................... †1991 10 28 0 0 168 16.8Dante Brown, Marietta .............................. †1996 10 27 4 0 166 16.6Ricky Gales, Simpson .................................. †1989 10 26 10 0 166 16.6Tony Sutton, Wooster ................................. †2004 12 33 0 0 198 16.5Matt Malmberg, St. John’s (MN) ............ †1993 10 27 2 0 164 16.4David Russell, Linfield ................................ 2002 11 30 0 0 180 16.4Scott Pingel, Westminster (MO) ............. 1998 10 26 6 0 162 16.2Trevor Shannon, Wartburg ...................... 1998 10 26 6 0 162 16.2Jamie Lee, MacMurray ............................... 1998 10 26 4 0 160 16.0Chris Babirad, Wash. & Jeff. ..................... †1992 9 24 0 0 144 16.0Trent Nauholz, Simpson ............................ †1992 8 21 2 0 128 16.0*Record. †National champion.
CAREER POINTSExtra Pts.
Player, Team Years TD Scored FG Pts.Nate Kmic, Mount Union .................................... 2005-08 *130 0 0 780R.J. Bowers, Grove City ......................................... 1997-00 92 10 0 562Carey Bender, Coe ................................................. 1991-94 86 12 0 528Jim Bower, Maine Maritime ............................... $2006-10 77 37 0 499¢Levell Coppage, Wis.-Whitewater ................. 2008-10 81 0 0 486Scott Pingel, Westminster (MO) ....................... 1996-99 75 34 0 484Trevor Shannon, Wartburg ................................ 1995-98 79 10 0 484Tony Sutton, Wooster ........................................... 2002-04 80 0 0 480Joe Dudek, Plymouth St. ................................... 1982-85 79 0 0 474Jeff Schebler, Wis.-Whitewater ......................... 2006-09 0 245 *75 470Dan Pugh, Mount Union .................................... 1999-02 73 2 0 440Chuck Moore, Mount Union ............................. 1998-01 73 0 0 438Chris Sharpe, Springfield .................................... 2004-07 72 0 0 432Josh Simpson, Hampden-Sydney................... 2005-08 71 2 0 428Mark Kacmarynski, Central (IA) ........................ $1992-96 70 2 0 422Matt Bernardo, Muhlenberg ............................. 2000-03 68 0 0 408Casey Donaldson, Wittenberg ......................... 1997-00 68 0 0 408Andrew Notarfrancesco, Catholic ................... 1996-99 65 8 0 398Mark Robinson, St. John Fisher ........................ 2003-06 65 0 0 390Brett Trichilo, Wilkes .............................................. 2001-04 64 0 0 384Shane Ream, Allegheny ...................................... 1998-01 64 0 0 384Mike Zimmerman, Mount Union .................... 2004-07 0 *263 40 383Chris Bisaillon, Ill. Wesleyan ............................... 1989-92 61 12 0 378Chris Babirad, Wash. & Jeff. ............................... 1989-92 62 2 0 374Paul Smith, Gettysburg ....................................... 1996-99 60 2 0 362*Record. $See initial page for explanation. ¢Active player.
SEASON POINTSExtra Pts.
Player, Team Year TD Scored FG Pts.Nate Kmic, Mount Union .......................................... †2008 *44 0 0 264Dan Pugh, Mount Union .......................................... †2002 41 2 0 248Nate Kmic, Mount Union .......................................... 2007 39 0 0 234Chris Sharpe, Springfield .......................................... †2006 35 2 0 212Levell Coppage, Wis.-Whitewater ......................... †2009 35 0 0 210R.J. Bowers, Grove City ............................................... †1998 34 2 0 206Tony Sutton, Wooster ................................................. †2004 33 0 0 198Guy Leman, Simpson ................................................. 1998 33 0 0 198Carey Bender, Coe ....................................................... †1994 32 2 0 194Tony Sutton, Wooster ................................................. †2003 31 0 0 186David Russell, Linfield ................................................ 2002 30 0 0 180Shane Ream, Allegheny ............................................ †2000 30 0 0 180Chad Hoiska, Wis.-Eau Claire ................................... 1997 29 2 0 176Fredrick Jackson, Coe ................................................. 2002 29 0 0 174Jim Mormino, Allegheny .......................................... 1997 29 0 0 174Doug Steiner, Grove City .......................................... 1997 29 0 0 174Nate Kmic, Mount Union .......................................... 2006 28 0 0 168Stanley Drayton, Allegheny ..................................... †1991 28 0 0 168James Regan, Pomona-Pitzer ................................. †1997 21 34 2 166Dante Brown, Marietta .............................................. †1996 27 4 0 166Ricky Gales, Simpson .................................................. †1989 26 10 0 166Josh Simpson, Hampden-Sydney......................... †2007 27 2 0 164Lance Moore, Mary Hardin-Baylor ........................ 2004 27 2 0 164Matt Malmberg, St. John’s (MN) ............................ †1993 27 2 0 164Cecil Shorts, Mount Union ....................................... 2009 27 0 0 162Jim Bower, Maine Maritime ..................................... 2008 25 12 0 162Robert Heller, Waynesburg ...................................... 2007 27 0 0 162Richie McNally, Wooster ............................................ 2004 11 66 10 162Brett Trichilo, Wilkes .................................................... 2003 27 0 0 162Scott Pingel, Westminster (MO) ............................. 1998 26 6 0 162Trevor Shannon, Wartburg ...................................... 1998 26 6 0 162*Record. †National champion.
ANNUAL CHAMPIONSExtra Pts.
Year Player, Team Class G TD Scored FG Pts. Avg.1973 Billy Johnson, Widener.................. Sr. 9 23 0 0 138 15.31974 Joe Thompson, Augustana (IL) . So. 9 17 0 0 102 11.31975 Ron Baker, Monmouth (IL) .......... Sr. 8 15 2 0 92 11.51976 Chris Hipsley, Cornell College .... So. 9 14 42 2 132 14.71977 Chip Zawoiski, Widener ................ Sr. 9 18 0 0 108 12.01978 Roger Andrachik,
Baldwin-Wallace ......................... Sr. 8 16 0 0 96 12.01979 Jay Wessler, Illinois Col. ................ Jr. 8 16 4 0 100 12.51980 Daryl Johnson, Wabash ................ Jr. 9 20 0 0 120 13.31981 Scott Reppert, Lawrence.............. Jr. 9 15 0 0 90 10.0 Daryl Johnson, Wabash ................ Sr. 9 15 0 0 90 10.01982 Rick Bell, St. John’s (MN) ............... Sr. 9 21 2 0 128 14.21983 John Aromando, TCNJ .................. Jr. 10 20 0 0 120 12.01984 Joe Dudek, Plymouth St. ............ Jr. 10 21 0 0 126 12.61985 Kevin Weaver, Wash. & Lee .......... Jr. 8 17 8 0 110 13.81986 Jim Korfonta, Hamilton ................ Sr. 8 16 0 0 96 12.0 Russ Kring, Mount Union ............. Jr. 10 20 0 0 120 12.01987 Michael Waithe, Curry ................... Sr. 8 19 0 0 114 14.31988 Terry Underwood, Wagner.......... Sr. 9 21 0 0 126 14.01989 Ricky Gales, Simpson ..................... Sr. 10 26 10 0 166 16.61990 Scott Barnyak,
Carnegie Mellon ......................... Sr. 10 22 6 0 138 13.8 Ryan Kolpin, Coe ............................. Sr. 10 23 0 0 138 13.81991 Stanley Drayton, Allegheny ........ Jr. 10 28 0 0 168 16.81992 Chris Babirad, Wash. & Jeff. ........ Sr. 9 24 0 0 144 16.0 Trent Nauholz, Simpson ............... Jr. 8 21 2 0 128 16.01993 Matt Malmberg,
St. John’s (MN) ............................. Jr. 10 27 2 0 164 16.41994 Carey Bender, Coe ........................... Sr. 10 32 2 0 194 19.41995 Anthony Jones, La Verne ............. Sr. 8 19 4 0 118 14.81996 Dante Brown, Marietta ................. Jr. 10 27 4 0 166 16.61997 James Regan, Pomona-Pitzer .... Jr. 8 21 34 2 166 *20.81998 R.J. Bowers, Grove City .................. So. 10 34 2 0 206 20.61999 R.J. Bowers, Grove City .................. Jr. 10 25 4 0 154 15.42000 Shane Ream, Allegheny ............... Jr. 10 30 0 0 180 18.02001 Chuck Moore, Mount Union ...... Sr. 10 24 0 0 144 14.42002 Dan Pugh, Mount Union .............. Sr. 14 41 2 0 248 17.72003 Tony Sutton, Wooster .................... Jr. 9 31 0 0 186 20.72004 Tony Sutton, Wooster .................... Sr. 12 33 0 0 198 16.52005 Matt Willis, Hartwick ...................... Sr. 10 22 0 0 132 13.22006 Chris Sharpe, Springfield ............. Jr. 12 35 2 0 212 17.72007 Josh Simpson, Hampden-Sydney ̂ Jr. 8 27 2 0 164 20.52008 Nate Kmic, Mount Union ............. Sr. 15 *44 0 0 *264 17.62009 Levell Coppage, Wis.-Whitewater So. 15 35 0 0 210 14.02010 James McCarthy, Framingham St. Jr. 9 22 0 0 132 14.7*Record. ^Declared champion; with one more game played (making 82%), for zero points, still would have highest average (18.2).
DEFENSIVE RECORDS
Interceptions
CAREER INTERCEPTIONSPlayer, Team Years No. Yards Avg.Ralph Gebhardt, Rochester (NY) ...................................... 1973-75 29 384 13.2Rick Bealer, Lycoming ........................................................... 1987-90 28 279 10.0Brian Fetterolf, Aurora ........................................................... 1986-89 28 390 13.9Andrew Ostrand, Carroll (WI)............................................. 1990-93 27 258 9.6Tim Lennon, Curry .................................................................. 1986-89 27 190 7.0Scott Stanitous, Moravian ................................................... 1985-88 27 178 6.6Mike Hintz, Wis.-Platteville .................................................. 1983-86 27 183 6.8Cory Mabry, Susquehanna ................................................. 1988-91 26 400 15.4Mark Dorner, Juniata ............................................................. 1984-87 26 *443 17.0Jeff Hughes, Ripon ................................................................. 1975-78 26 333 12.8Jon Dunham, Denison .......................................................... 1996-99 25 333 13.3Dave Adams, Carleton .......................................................... 1984-87 25 327 13.1Will Hill, Bishop ........................................................................ 1983-86 25 261 10.4Neal Guggemos, St. Thomas (MN) .................................. 1982-85 25 377 15.1Tom Devine, Juniata .............................................................. 1979-82 25 248 9.9Gary Ellis, Rose-Hulman ....................................................... 1974-77 25 226 9.1*Record.
SEASON INTERCEPTIONSPlayer, Team Year No. YardsBen Matthews, Bethel (MN)................................................................ †2000 15 134Mark Dorner, Juniata ............................................................................. †1987 15 202Tom Anthony, Augustana (IL) ............................................................ 2005 13 169Jeff Thomas, Redlands .......................................................................... †2002 13 127Nate Kok, Ripon ....................................................................................... 2000 13 254
Extra Pts.Player, Team Years G TD Scored FG Pts. Pt.PG
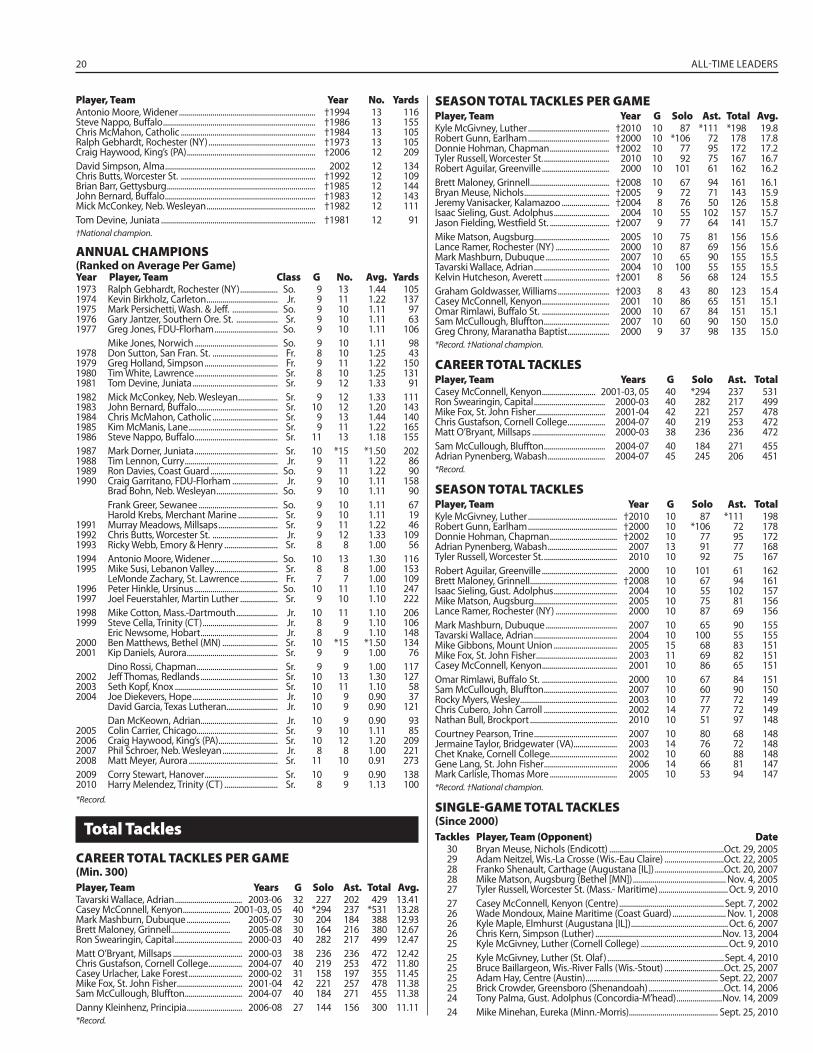
20 ALL-TIME LEADERS
Antonio Moore, Widener ..................................................................... †1994 13 116Steve Nappo, Buffalo ............................................................................. †1986 13 155Chris McMahon, Catholic .................................................................... †1984 13 105Ralph Gebhardt, Rochester (NY) ...................................................... †1973 13 105Craig Haywood, King’s (PA) ................................................................. †2006 12 209David Simpson, Alma ............................................................................ 2002 12 134Chris Butts, Worcester St. .................................................................... †1992 12 109Brian Barr, Gettysburg ........................................................................... †1985 12 144John Bernard, Buffalo ............................................................................ †1983 12 143Mick McConkey, Neb. Wesleyan ....................................................... †1982 12 111Tom Devine, Juniata .............................................................................. †1981 12 91†National champion.
ANNUAL CHAMPIONS(Ranked on Average Per Game)Year Player, Team Class G No. Avg. Yards1973 Ralph Gebhardt, Rochester (NY) ................... So. 9 13 1.44 1051974 Kevin Birkholz, Carleton .................................... Jr. 9 11 1.22 1371975 Mark Persichetti, Wash. & Jeff. ....................... So. 9 10 1.11 971976 Gary Jantzer, Southern Ore. St. ..................... Sr. 9 10 1.11 631977 Greg Jones, FDU-Florham ................................ So. 9 10 1.11 106 Mike Jones, Norwich .......................................... So. 9 10 1.11 981978 Don Sutton, San Fran. St. ................................. Fr. 8 10 1.25 431979 Greg Holland, Simpson ..................................... Fr. 9 11 1.22 1501980 Tim White, Lawrence .......................................... Sr. 8 10 1.25 1311981 Tom Devine, Juniata ........................................... Sr. 9 12 1.33 911982 Mick McConkey, Neb. Wesleyan .................... Sr. 9 12 1.33 1111983 John Bernard, Buffalo......................................... Sr. 10 12 1.20 1431984 Chris McMahon, Catholic ................................. Sr. 9 13 1.44 1401985 Kim McManis, Lane ............................................. Sr. 9 11 1.22 1651986 Steve Nappo, Buffalo .......................................... Sr. 11 13 1.18 1551987 Mark Dorner, Juniata .......................................... Sr. 10 *15 *1.50 2021988 Tim Lennon, Curry ............................................... Jr. 9 11 1.22 861989 Ron Davies, Coast Guard .................................. So. 9 11 1.22 901990 Craig Garritano, FDU-Florham ....................... Jr. 9 10 1.11 158 Brad Bohn, Neb. Wesleyan ............................... So. 9 10 1.11 90 Frank Greer, Sewanee ........................................ So. 9 10 1.11 67 Harold Krebs, Merchant Marine .................... Sr. 9 10 1.11 191991 Murray Meadows, Millsaps .............................. Sr. 9 11 1.22 461992 Chris Butts, Worcester St. ................................. Jr. 9 12 1.33 1091993 Ricky Webb, Emory & Henry ........................... Sr. 8 8 1.00 561994 Antonio Moore, Widener .................................. So. 10 13 1.30 1161995 Mike Susi, Lebanon Valley ................................ Sr. 8 8 1.00 153 LeMonde Zachary, St. Lawrence ................... Fr. 7 7 1.00 1091996 Peter Hinkle, Ursinus .......................................... So. 10 11 1.10 2471997 Joel Feuerstahler, Martin Luther ................... Sr. 9 10 1.10 2221998 Mike Cotton, Mass.-Dartmouth ..................... Jr. 10 11 1.10 2061999 Steve Cella, Trinity (CT) ...................................... Jr. 8 9 1.10 106 Eric Newsome, Hobart ....................................... Jr. 8 9 1.10 1482000 Ben Matthews, Bethel (MN) ............................ Sr. 10 *15 *1.50 1342001 Kip Daniels, Aurora .............................................. Sr. 9 9 1.00 76 Dino Rossi, Chapman ......................................... Sr. 9 9 1.00 1172002 Jeff Thomas, Redlands ....................................... Sr. 10 13 1.30 1272003 Seth Kopf, Knox .................................................... Sr. 10 11 1.10 582004 Joe Diekevers, Hope ........................................... Jr. 10 9 0.90 37 David Garcia, Texas Lutheran.......................... Jr. 10 9 0.90 121 Dan McKeown, Adrian ....................................... Jr. 10 9 0.90 932005 Colin Carrier, Chicago......................................... Sr. 9 10 1.11 852006 Craig Haywood, King’s (PA) .............................. Sr. 10 12 1.20 2092007 Phil Schroer, Neb. Wesleyan ............................ Jr. 8 8 1.00 2212008 Matt Meyer, Aurora ............................................. Sr. 11 10 0.91 2732009 Corry Stewart, Hanover ..................................... Sr. 10 9 0.90 1382010 Harry Melendez, Trinity (CT) ........................... Sr. 8 9 1.13 100*Record.
Total Tackles
CAREER TOTAL TACKLES PER GAME(Min. 300)
Player, Team Years G Solo Ast. Total Avg.Tavarski Wallace, Adrian .................................. 2003-06 32 227 202 429 13.41Casey McConnell, Kenyon ........................ 2001-03, 05 40 *294 237 *531 13.28Mark Mashburn, Dubuque ...................... 2005-07 30 204 184 388 12.93Brett Maloney, Grinnell .............................. 2005-08 30 164 216 380 12.67Ron Swearingin, Capital .................................. 2000-03 40 282 217 499 12.47Matt O’Bryant, Millsaps ................................... 2000-03 38 236 236 472 12.42Chris Gustafson, Cornell College ................. 2004-07 40 219 253 472 11.80Casey Urlacher, Lake Forest ........................... 2000-02 31 158 197 355 11.45Mike Fox, St. John Fisher ................................. 2001-04 42 221 257 478 11.38Sam McCullough, Bluffton ............................. 2004-07 40 184 271 455 11.38Danny Kleinhenz, Principia ............................ 2006-08 27 144 156 300 11.11*Record.
SEASON TOTAL TACKLES PER GAMEPlayer, Team Year G Solo Ast. Total Avg.Kyle McGivney, Luther ......................................... †2010 10 87 *111 *198 19.8Robert Gunn, Earlham ......................................... †2000 10 *106 72 178 17.8Donnie Hohman, Chapman .............................. †2002 10 77 95 172 17.2Tyler Russell, Worcester St. ................................. 2010 10 92 75 167 16.7Robert Aguilar, Greenville .................................. 2000 10 101 61 162 16.2Brett Maloney, Grinnell ........................................ †2008 10 67 94 161 16.1Bryan Meuse, Nichols ........................................... †2005 9 72 71 143 15.9Jeremy Vanisacker, Kalamazoo ........................ †2004 8 76 50 126 15.8Isaac Sieling, Gust. Adolphus ............................ 2004 10 55 102 157 15.7Jason Fielding, Westfield St. .............................. †2007 9 77 64 141 15.7Mike Matson, Augsburg...................................... 2005 10 75 81 156 15.6Lance Ramer, Rochester (NY) ........................... 2000 10 87 69 156 15.6Mark Mashburn, Dubuque ................................ 2007 10 65 90 155 15.5Tavarski Wallace, Adrian ...................................... 2004 10 100 55 155 15.5Kelvin Hutcheson, Averett ................................. †2001 8 56 68 124 15.5Graham Goldwasser, Williams .......................... †2003 8 43 80 123 15.4Casey McConnell, Kenyon .................................. 2001 10 86 65 151 15.1Omar Rimlawi, Buffalo St. .................................. 2000 10 67 84 151 15.1Sam McCullough, Bluffton ................................. 2007 10 60 90 150 15.0Greg Chrony, Maranatha Baptist ..................... 2000 9 37 98 135 15.0*Record. †National champion.
CAREER TOTAL TACKLESPlayer, Team Years G Solo Ast. TotalCasey McConnell, Kenyon ........................... 2001-03, 05 40 *294 237 531Ron Swearingin, Capital .................................... 2000-03 40 282 217 499Mike Fox, St. John Fisher ................................... 2001-04 42 221 257 478Chris Gustafson, Cornell College ................... 2004-07 40 219 253 472Matt O’Bryant, Millsaps ..................................... 2000-03 38 236 236 472Sam McCullough, Bluffton ............................... 2004-07 40 184 271 455Adrian Pynenberg, Wabash ............................. 2004-07 45 245 206 451*Record.
SEASON TOTAL TACKLESPlayer, Team Year G Solo Ast. TotalKyle McGivney, Luther ............................................. †2010 10 87 *111 198Robert Gunn, Earlham ............................................. †2000 10 *106 72 178Donnie Hohman, Chapman .................................. †2002 10 77 95 172Adrian Pynenberg, Wabash ................................... 2007 13 91 77 168Tyler Russell, Worcester St. ..................................... 2010 10 92 75 167Robert Aguilar, Greenville ...................................... 2000 10 101 61 162Brett Maloney, Grinnell ............................................ †2008 10 67 94 161Isaac Sieling, Gust. Adolphus ................................ 2004 10 55 102 157Mike Matson, Augsburg.......................................... 2005 10 75 81 156Lance Ramer, Rochester (NY) ............................... 2000 10 87 69 156Mark Mashburn, Dubuque .................................... 2007 10 65 90 155Tavarski Wallace, Adrian .......................................... 2004 10 100 55 155Mike Gibbons, Mount Union ................................ 2005 15 68 83 151Mike Fox, St. John Fisher ......................................... 2003 11 69 82 151Casey McConnell, Kenyon ...................................... 2001 10 86 65 151Omar Rimlawi, Buffalo St. ...................................... 2000 10 67 84 151Sam McCullough, Bluffton ..................................... 2007 10 60 90 150Rocky Myers, Wesley ................................................. 2003 10 77 72 149Chris Cubero, John Carroll ..................................... 2002 14 77 72 149Nathan Bull, Brockport ............................................ 2010 10 51 97 148Courtney Pearson, Trine .......................................... 2007 10 80 68 148Jermaine Taylor, Bridgewater (VA) ...................... 2003 14 76 72 148Chet Knake, Cornell College.................................. 2002 10 60 88 148Gene Lang, St. John Fisher ..................................... 2006 14 66 81 147Mark Carlisle, Thomas More .................................. 2005 10 53 94 147*Record. †National champion.
SINGLE-GAME TOTAL TACKLES (Since 2000)
Tackles Player, Team (Opponent) Date30 Bryan Meuse, Nichols (Endicott) ..........................................................Oct. 29, 200529 Adam Neitzel, Wis.-La Crosse (Wis.-Eau Claire) ..............................Oct. 22, 200528 Franko Shenault, Carthage (Augustana [IL]) ...................................Oct. 20, 200728 Mike Matson, Augsburg (Bethel [MN]) ............................................... Nov. 4, 200527 Tyler Russell, Worcester St. (Mass.- Maritime) ...................................Oct. 9, 201027 Casey McConnell, Kenyon (Centre) .....................................................Sept. 7, 200226 Wade Mondoux, Maine Maritime (Coast Guard) ........................... Nov. 1, 200826 Kyle Maple, Elmhurst (Augustana [IL]) .................................................Oct. 6, 200726 Chris Kern, Simpson (Luther) ................................................................Nov. 13, 200425 Kyle McGivney, Luther (Cornell College) ............................................Oct. 9, 201025 Kyle McGivney, Luther (St. Olaf) ...........................................................Sept. 4, 201025 Bruce Baillargeon, Wis.-River Falls (Wis.-Stout) ..............................Oct. 25, 200725 Adam Hay, Centre (Austin) ................................................................... Sept. 22, 200725 Brick Crowder, Greensboro (Shenandoah) ......................................Oct. 14, 200624 Tony Palma, Gust. Adolphus (Concordia-M’head) .......................Nov. 14, 200924 Mike Minehan, Eureka (Minn.-Morris)............................................. Sept. 25, 2010
Player, Team Year No. Yards
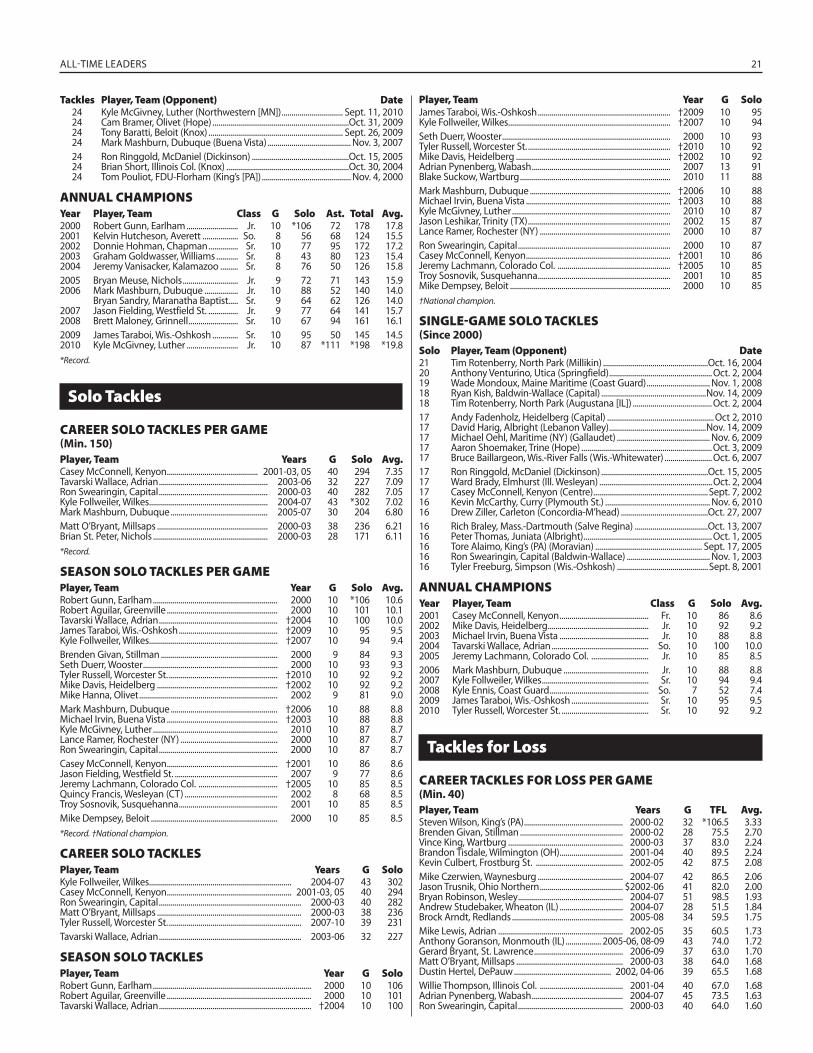
ALL-TIME LEADERS 21
24 Kyle McGivney, Luther (Northwestern [MN]) ............................... Sept. 11, 201024 Cam Bramer, Olivet (Hope) .....................................................................Oct. 31, 200924 Tony Baratti, Beloit (Knox) .................................................................... Sept. 26, 200924 Mark Mashburn, Dubuque (Buena Vista) .......................................... Nov. 3, 200724 Ron Ringgold, McDaniel (Dickinson) .................................................Oct. 15, 200524 Brian Short, Illinois Col. (Knox) ..............................................................Oct. 30, 200424 Tom Pouliot, FDU-Florham (King’s [PA]) ............................................. Nov. 4, 2000
ANNUAL CHAMPIONSYear Player, Team Class G Solo Ast. Total Avg.2000 Robert Gunn, Earlham .......................... Jr. 10 *106 72 178 17.82001 Kelvin Hutcheson, Averett .................. So. 8 56 68 124 15.52002 Donnie Hohman, Chapman ............... Sr. 10 77 95 172 17.22003 Graham Goldwasser, Williams ........... Sr. 8 43 80 123 15.42004 Jeremy Vanisacker, Kalamazoo ......... Sr. 8 76 50 126 15.82005 Bryan Meuse, Nichols ............................ Jr. 9 72 71 143 15.92006 Mark Mashburn, Dubuque ................. Jr. 10 88 52 140 14.0 Bryan Sandry, Maranatha Baptist..... Sr. 9 64 62 126 14.02007 Jason Fielding, Westfield St. ............... Jr. 9 77 64 141 15.72008 Brett Maloney, Grinnell ......................... Sr. 10 67 94 161 16.12009 James Taraboi, Wis.-Oshkosh ............. Sr. 10 95 50 145 14.52010 Kyle McGivney, Luther .......................... Jr. 10 87 *111 *198 *19.8*Record.
Solo Tackles
CAREER SOLO TACKLES PER GAME(Min. 150)
Player, Team Years G Solo Avg.Casey McConnell, Kenyon .............................................. 2001-03, 05 40 294 7.35Tavarski Wallace, Adrian ....................................................... 2003-06 32 227 7.09Ron Swearingin, Capital ....................................................... 2000-03 40 282 7.05Kyle Follweiler, Wilkes............................................................ 2004-07 43 *302 7.02Mark Mashburn, Dubuque ................................................. 2005-07 30 204 6.80Matt O’Bryant, Millsaps ........................................................ 2000-03 38 236 6.21Brian St. Peter, Nichols .......................................................... 2000-03 28 171 6.11*Record.
SEASON SOLO TACKLES PER GAMEPlayer, Team Year G Solo Avg.Robert Gunn, Earlham ............................................................... 2000 10 *106 10.6Robert Aguilar, Greenville ........................................................ 2000 10 101 10.1Tavarski Wallace, Adrian ............................................................ †2004 10 100 10.0James Taraboi, Wis.-Oshkosh .................................................. †2009 10 95 9.5Kyle Follweiler, Wilkes................................................................. †2007 10 94 9.4Brenden Givan, Stillman ........................................................... 2000 9 84 9.3Seth Duerr, Wooster .................................................................... 2000 10 93 9.3Tyler Russell, Worcester St. ....................................................... †2010 10 92 9.2Mike Davis, Heidelberg ............................................................. †2002 10 92 9.2Mike Hanna, Olivet ...................................................................... 2002 9 81 9.0Mark Mashburn, Dubuque ...................................................... †2006 10 88 8.8Michael Irvin, Buena Vista ........................................................ †2003 10 88 8.8Kyle McGivney, Luther ............................................................... 2010 10 87 8.7Lance Ramer, Rochester (NY) ................................................. 2000 10 87 8.7Ron Swearingin, Capital ............................................................ 2000 10 87 8.7Casey McConnell, Kenyon ........................................................ †2001 10 86 8.6Jason Fielding, Westfield St. .................................................... 2007 9 77 8.6Jeremy Lachmann, Colorado Col. ........................................ †2005 10 85 8.5Quincy Francis, Wesleyan (CT) ............................................... 2002 8 68 8.5Troy Sosnovik, Susquehanna .................................................. 2001 10 85 8.5Mike Dempsey, Beloit ................................................................ 2000 10 85 8.5*Record. †National champion.
CAREER SOLO TACKLESPlayer, Team Years G SoloKyle Follweiler, Wilkes........................................................................ 2004-07 43 302Casey McConnell, Kenyon ............................................................... 2001-03, 05 40 294Ron Swearingin, Capital ........................................................................ 2000-03 40 282Matt O’Bryant, Millsaps ......................................................................... 2000-03 38 236Tyler Russell, Worcester St. ................................................................... 2007-10 39 231Tavarski Wallace, Adrian ........................................................................ 2003-06 32 227
SEASON SOLO TACKLESPlayer, Team Year G SoloRobert Gunn, Earlham ................................................................................ 2000 10 106Robert Aguilar, Greenville ......................................................................... 2000 10 101Tavarski Wallace, Adrian ............................................................................. †2004 10 100
James Taraboi, Wis.-Oshkosh ................................................................... †2009 10 95Kyle Follweiler, Wilkes.................................................................................. †2007 10 94Seth Duerr, Wooster ..................................................................................... 2000 10 93Tyler Russell, Worcester St. ........................................................................ †2010 10 92Mike Davis, Heidelberg .............................................................................. †2002 10 92Adrian Pynenberg, Wabash ...................................................................... 2007 13 91Blake Suckow, Wartburg ............................................................................ 2010 11 88Mark Mashburn, Dubuque ....................................................................... †2006 10 88Michael Irvin, Buena Vista ......................................................................... †2003 10 88Kyle McGivney, Luther ................................................................................ 2010 10 87Jason Leshikar, Trinity (TX) ........................................................................ 2002 15 87Lance Ramer, Rochester (NY) .................................................................. 2000 10 87Ron Swearingin, Capital ............................................................................. 2000 10 87Casey McConnell, Kenyon ......................................................................... †2001 10 86Jeremy Lachmann, Colorado Col. ......................................................... †2005 10 85Troy Sosnovik, Susquehanna ................................................................... 2001 10 85Mike Dempsey, Beloit ................................................................................. 2000 10 85†National champion.
SINGLE-GAME SOLO TACKLES (Since 2000)
Solo Player, Team (Opponent) Date21 Tim Rotenberry, North Park (Millikin) .....................................................Oct. 16, 200420 Anthony Venturino, Utica (Springfield) ....................................................Oct. 2, 200419 Wade Mondoux, Maine Maritime (Coast Guard) ................................ Nov. 1, 200818 Ryan Kish, Baldwin-Wallace (Capital) .....................................................Nov. 14, 200918 Tim Rotenberry, North Park (Augustana [IL]) ........................................Oct. 2, 200417 Andy Fadenholz, Heidelberg (Capital) ......................................................Oct 2, 201017 David Harig, Albright (Lebanon Valley) .................................................Nov. 14, 200917 Michael Oehl, Maritime (NY) (Gallaudet) ............................................... Nov. 6, 200917 Aaron Shoemaker, Trine (Hope) ..................................................................Oct. 3, 200917 Bruce Baillargeon, Wis.-River Falls (Wis.-Whitewater) ........................Oct. 6, 200717 Ron Ringgold, McDaniel (Dickinson) ......................................................Oct. 15, 200517 Ward Brady, Elmhurst (Ill. Wesleyan) .........................................................Oct. 2, 200417 Casey McConnell, Kenyon (Centre) ..........................................................Sept. 7, 200216 Kevin McCarthy, Curry (Plymouth St.) ..................................................... Nov. 6, 201016 Drew Ziller, Carleton (Concordia-M’head) ............................................Oct. 27, 200716 Rich Braley, Mass.-Dartmouth (Salve Regina) .....................................Oct. 13, 200716 Peter Thomas, Juniata (Albright) .................................................................Oct. 1, 200516 Tore Alaimo, King’s (PA) (Moravian) ...................................................... Sept. 17, 200516 Ron Swearingin, Capital (Baldwin-Wallace) .......................................... Nov. 1, 200316 Tyler Freeburg, Simpson (Wis.-Oshkosh) ..............................................Sept. 8, 2001
ANNUAL CHAMPIONSYear Player, Team Class G Solo Avg.2001 Casey McConnell, Kenyon ............................................. Fr. 10 86 8.62002 Mike Davis, Heidelberg ................................................... Jr. 10 92 9.22003 Michael Irvin, Buena Vista ............................................. Jr. 10 88 8.82004 Tavarski Wallace, Adrian ................................................. So. 10 100 10.02005 Jeremy Lachmann, Colorado Col. ............................. Jr. 10 85 8.52006 Mark Mashburn, Dubuque ........................................... Jr. 10 88 8.82007 Kyle Follweiler, Wilkes ...................................................... Sr. 10 94 9.42008 Kyle Ennis, Coast Guard .................................................. So. 7 52 7.42009 James Taraboi, Wis.-Oshkosh ....................................... Sr. 10 95 9.52010 Tyler Russell, Worcester St. ............................................ Sr. 10 92 9.2
Tackles for Loss
CAREER TACKLES FOR LOSS PER GAME(Min. 40)
Player, Team Years G TFL Avg.Steven Wilson, King’s (PA) .................................................. 2000-02 32 *106.5 3.33Brenden Givan, Stillman .................................................... 2000-02 28 75.5 2.70Vince King, Wartburg .......................................................... 2000-03 37 83.0 2.24Brandon Tisdale, Wilmington (OH) ................................ 2001-04 40 89.5 2.24Kevin Culbert, Frostburg St. ............................................ 2002-05 42 87.5 2.08Mike Czerwien, Waynesburg ........................................... 2004-07 42 86.5 2.06Jason Trusnik, Ohio Northern .......................................... $2002-06 41 82.0 2.00Bryan Robinson, Wesley ..................................................... 2004-07 51 98.5 1.93Andrew Studebaker, Wheaton (IL) ................................ 2004-07 28 51.5 1.84Brock Arndt, Redlands ........................................................ 2005-08 34 59.5 1.75Mike Lewis, Adrian ............................................................... 2002-05 35 60.5 1.73Anthony Goranson, Monmouth (IL) .................. 2005-06, 08-09 43 74.0 1.72Gerard Bryant, St. Lawrence ............................................. 2006-09 37 63.0 1.70Matt O’Bryant, Millsaps ...................................................... 2000-03 38 64.0 1.68Dustin Hertel, DePauw ................................................. 2002, 04-06 39 65.5 1.68Willie Thompson, Illinois Col. .......................................... 2001-04 40 67.0 1.68Adrian Pynenberg, Wabash .............................................. 2004-07 45 73.5 1.63Ron Swearingin, Capital ..................................................... 2000-03 40 64.0 1.60
Tackles Player, Team (Opponent) Date Player, Team Year G Solo
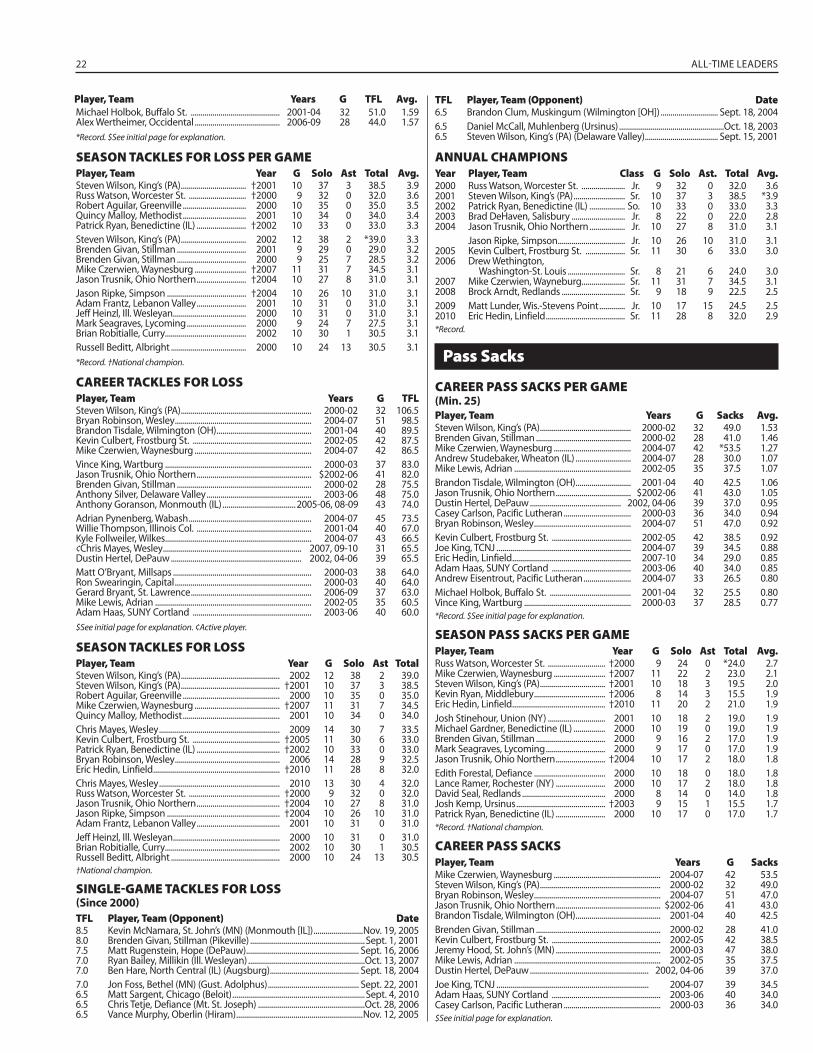
22 ALL-TIME LEADERS
Michael Holbok, Buffalo St. ............................................. 2001-04 32 51.0 1.59Alex Wertheimer, Occidental ........................................... 2006-09 28 44.0 1.57*Record. $See initial page for explanation.
SEASON TACKLES FOR LOSS PER GAMEPlayer, Team Year G Solo Ast Total Avg.Steven Wilson, King’s (PA) ................................. †2001 10 37 3 38.5 3.9Russ Watson, Worcester St. ............................. †2000 9 32 0 32.0 3.6Robert Aguilar, Greenville ................................ 2000 10 35 0 35.0 3.5Quincy Malloy, Methodist ................................ 2001 10 34 0 34.0 3.4Patrick Ryan, Benedictine (IL) ......................... †2002 10 33 0 33.0 3.3Steven Wilson, King’s (PA) ................................. 2002 12 38 2 *39.0 3.3Brenden Givan, Stillman ................................... 2001 9 29 0 29.0 3.2Brenden Givan, Stillman ................................... 2000 9 25 7 28.5 3.2Mike Czerwien, Waynesburg .......................... †2007 11 31 7 34.5 3.1Jason Trusnik, Ohio Northern ......................... †2004 10 27 8 31.0 3.1Jason Ripke, Simpson ........................................ †2004 10 26 10 31.0 3.1Adam Frantz, Lebanon Valley ......................... 2001 10 31 0 31.0 3.1Jeff Heinzl, Ill. Wesleyan ..................................... 2000 10 31 0 31.0 3.1Mark Seagraves, Lycoming .............................. 2000 9 24 7 27.5 3.1Brian Robitialle, Curry......................................... 2002 10 30 1 30.5 3.1Russell Beditt, Albright ...................................... 2000 10 24 13 30.5 3.1*Record. †National champion.
CAREER TACKLES FOR LOSSPlayer, Team Years G TFLSteven Wilson, King’s (PA) .................................................................. 2000-02 32 106.5Bryan Robinson, Wesley ..................................................................... 2004-07 51 98.5Brandon Tisdale, Wilmington (OH) ................................................ 2001-04 40 89.5Kevin Culbert, Frostburg St. ............................................................ 2002-05 42 87.5Mike Czerwien, Waynesburg ........................................................... 2004-07 42 86.5Vince King, Wartburg .......................................................................... 2000-03 37 83.0Jason Trusnik, Ohio Northern .......................................................... $2002-06 41 82.0Brenden Givan, Stillman .................................................................... 2000-02 28 75.5Anthony Silver, Delaware Valley ..................................................... 2003-06 48 75.0Anthony Goranson, Monmouth (IL) ..................................... 2005-06, 08-09 43 74.0Adrian Pynenberg, Wabash .............................................................. 2004-07 45 73.5Willie Thompson, Illinois Col. .......................................................... 2001-04 40 67.0Kyle Follweiler, Wilkes.......................................................................... 2004-07 43 66.5¢Chris Mayes, Wesley ...................................................................... 2007, 09-10 31 65.5Dustin Hertel, DePauw .................................................................. 2002, 04-06 39 65.5Matt O’Bryant, Millsaps ...................................................................... 2000-03 38 64.0Ron Swearingin, Capital ..................................................................... 2000-03 40 64.0Gerard Bryant, St. Lawrence ............................................................. 2006-09 37 63.0Mike Lewis, Adrian ............................................................................... 2002-05 35 60.5Adam Haas, SUNY Cortland ............................................................ 2003-06 40 60.0$See initial page for explanation. ¢Active player.
SEASON TACKLES FOR LOSSPlayer, Team Year G Solo Ast TotalSteven Wilson, King’s (PA) .................................................. 2002 12 38 2 39.0Steven Wilson, King’s (PA) .................................................. †2001 10 37 3 38.5Robert Aguilar, Greenville ................................................. 2000 10 35 0 35.0Mike Czerwien, Waynesburg ........................................... †2007 11 31 7 34.5Quincy Malloy, Methodist ................................................. 2001 10 34 0 34.0Chris Mayes, Wesley ............................................................. 2009 14 30 7 33.5Kevin Culbert, Frostburg St. ............................................ †2005 11 30 6 33.0Patrick Ryan, Benedictine (IL) .......................................... †2002 10 33 0 33.0Bryan Robinson, Wesley ..................................................... 2006 14 28 9 32.5Eric Hedin, Linfield ................................................................ †2010 11 28 8 32.0Chris Mayes, Wesley ............................................................. 2010 13 30 4 32.0Russ Watson, Worcester St. .............................................. †2000 9 32 0 32.0Jason Trusnik, Ohio Northern .......................................... †2004 10 27 8 31.0Jason Ripke, Simpson ......................................................... †2004 10 26 10 31.0Adam Frantz, Lebanon Valley .......................................... 2001 10 31 0 31.0Jeff Heinzl, Ill. Wesleyan ...................................................... 2000 10 31 0 31.0Brian Robitialle, Curry.......................................................... 2002 10 30 1 30.5Russell Beditt, Albright ....................................................... 2000 10 24 13 30.5†National champion.
SINGLE-GAME TACKLES FOR LOSS(Since 2000)
TFL Player, Team (Opponent) Date8.5 Kevin McNamara, St. John’s (MN) (Monmouth [IL]) .........................Nov. 19, 20058.0 Brenden Givan, Stillman (Pikeville) ..........................................................Sept. 1, 20017.5 Matt Rugenstein, Hope (DePauw) ......................................................... Sept. 16, 20067.0 Ryan Bailey, Millikin (Ill. Wesleyan) ...........................................................Oct. 13, 20077.0 Ben Hare, North Central (IL) (Augsburg) ............................................. Sept. 18, 20047.0 Jon Foss, Bethel (MN) (Gust. Adolphus) .............................................. Sept. 22, 20016.5 Matt Sargent, Chicago (Beloit) ...................................................................Sept. 4, 20106.5 Chris Tetje, Defiance (Mt. St. Joseph) ......................................................Oct. 28, 20066.5 Vance Murphy, Oberlin (Hiram) ................................................................Nov. 12, 2005
6.5 Brandon Clum, Muskingum (Wilmington [OH]) ............................. Sept. 18, 20046.5 Daniel McCall, Muhlenberg (Ursinus) .....................................................Oct. 18, 20036.5 Steven Wilson, King’s (PA) (Delaware Valley) ..................................... Sept. 15, 2001
ANNUAL CHAMPIONSYear Player, Team Class G Solo Ast. Total Avg.2000 Russ Watson, Worcester St. ...................... Jr. 9 32 0 32.0 3.62001 Steven Wilson, King’s (PA) .......................... Sr. 10 37 3 38.5 *3.92002 Patrick Ryan, Benedictine (IL) .................. So. 10 33 0 33.0 3.32003 Brad DeHaven, Salisbury ........................... Jr. 8 22 0 22.0 2.82004 Jason Trusnik, Ohio Northern .................. Jr. 10 27 8 31.0 3.1 Jason Ripke, Simpson .................................. Jr. 10 26 10 31.0 3.12005 Kevin Culbert, Frostburg St. .................... Sr. 11 30 6 33.0 3.02006 Drew Wethington,
Washington-St. Louis ............................. Sr. 8 21 6 24.0 3.02007 Mike Czerwien, Wayneburg...................... Sr. 11 31 7 34.5 3.12008 Brock Arndt, Redlands ................................ Sr. 9 18 9 22.5 2.52009 Matt Lunder, Wis.-Stevens Point ............. Jr. 10 17 15 24.5 2.52010 Eric Hedin, Linfield ........................................ Sr. 11 28 8 32.0 2.9*Record.
Pass Sacks
CAREER PASS SACKS PER GAME(Min. 25)
Player, Team Years G Sacks Avg.Steven Wilson, King’s (PA) .............................................. 2000-02 32 49.0 1.53Brenden Givan, Stillman ................................................ 2000-02 28 41.0 1.46Mike Czerwien, Waynesburg ....................................... 2004-07 42 *53.5 1.27Andrew Studebaker, Wheaton (IL) ............................ 2004-07 28 30.0 1.07Mike Lewis, Adrian ........................................................... 2002-05 35 37.5 1.07Brandon Tisdale, Wilmington (OH) ............................ 2001-04 40 42.5 1.06Jason Trusnik, Ohio Northern ...................................... $2002-06 41 43.0 1.05Dustin Hertel, DePauw .............................................. 2002, 04-06 39 37.0 0.95Casey Carlson, Pacific Lutheran .................................. 2000-03 36 34.0 0.94Bryan Robinson, Wesley ................................................. 2004-07 51 47.0 0.92Kevin Culbert, Frostburg St. ........................................ 2002-05 42 38.5 0.92Joe King, TCNJ .................................................................... 2004-07 39 34.5 0.88Eric Hedin, Linfield ............................................................ 2007-10 34 29.0 0.85Adam Haas, SUNY Cortland ........................................ 2003-06 40 34.0 0.85Andrew Eisentrout, Pacific Lutheran ........................ 2004-07 33 26.5 0.80Michael Holbok, Buffalo St. ......................................... 2001-04 32 25.5 0.80Vince King, Wartburg ...................................................... 2000-03 37 28.5 0.77*Record. $See initial page for explanation.
SEASON PASS SACKS PER GAMEPlayer, Team Year G Solo Ast Total Avg.Russ Watson, Worcester St. ............................. †2000 9 24 0 *24.0 2.7Mike Czerwien, Waynesburg .......................... †2007 11 22 2 23.0 2.1Steven Wilson, King’s (PA) ................................. †2001 10 18 3 19.5 2.0Kevin Ryan, Middlebury .................................... †2006 8 14 3 15.5 1.9Eric Hedin, Linfield ............................................... †2010 11 20 2 21.0 1.9Josh Stinehour, Union (NY) ............................. 2001 10 18 2 19.0 1.9Michael Gardner, Benedictine (IL) ................ 2000 10 19 0 19.0 1.9Brenden Givan, Stillman ................................... 2000 9 16 2 17.0 1.9Mark Seagraves, Lycoming .............................. 2000 9 17 0 17.0 1.9Jason Trusnik, Ohio Northern ......................... †2004 10 17 2 18.0 1.8Edith Forestal, Defiance .................................... 2000 10 18 0 18.0 1.8Lance Ramer, Rochester (NY) ......................... 2000 10 17 2 18.0 1.8David Seal, Redlands .......................................... 2000 8 14 0 14.0 1.8Josh Kemp, Ursinus ............................................. †2003 9 15 1 15.5 1.7Patrick Ryan, Benedictine (IL) ......................... 2000 10 17 0 17.0 1.7*Record. †National champion.
CAREER PASS SACKSPlayer, Team Years G SacksMike Czerwien, Waynesburg ...................................................... 2004-07 42 53.5Steven Wilson, King’s (PA) ............................................................. 2000-02 32 49.0Bryan Robinson, Wesley ................................................................ 2004-07 51 47.0Jason Trusnik, Ohio Northern ..................................................... $2002-06 41 43.0Brandon Tisdale, Wilmington (OH) ........................................... 2001-04 40 42.5Brenden Givan, Stillman ............................................................... 2000-02 28 41.0Kevin Culbert, Frostburg St. ....................................................... 2002-05 42 38.5Jeremy Hood, St. John’s (MN) ..................................................... 2000-03 47 38.0Mike Lewis, Adrian .......................................................................... 2002-05 35 37.5Dustin Hertel, DePauw ............................................................ 2002, 04-06 39 37.0Joe King, TCNJ ............................................................................. 2004-07 39 34.5Adam Haas, SUNY Cortland ....................................................... 2003-06 40 34.0Casey Carlson, Pacific Lutheran ................................................. 2000-03 36 34.0$See initial page for explanation.
Player, Team Years G TFL Avg. TFL Player, Team (Opponent) Date
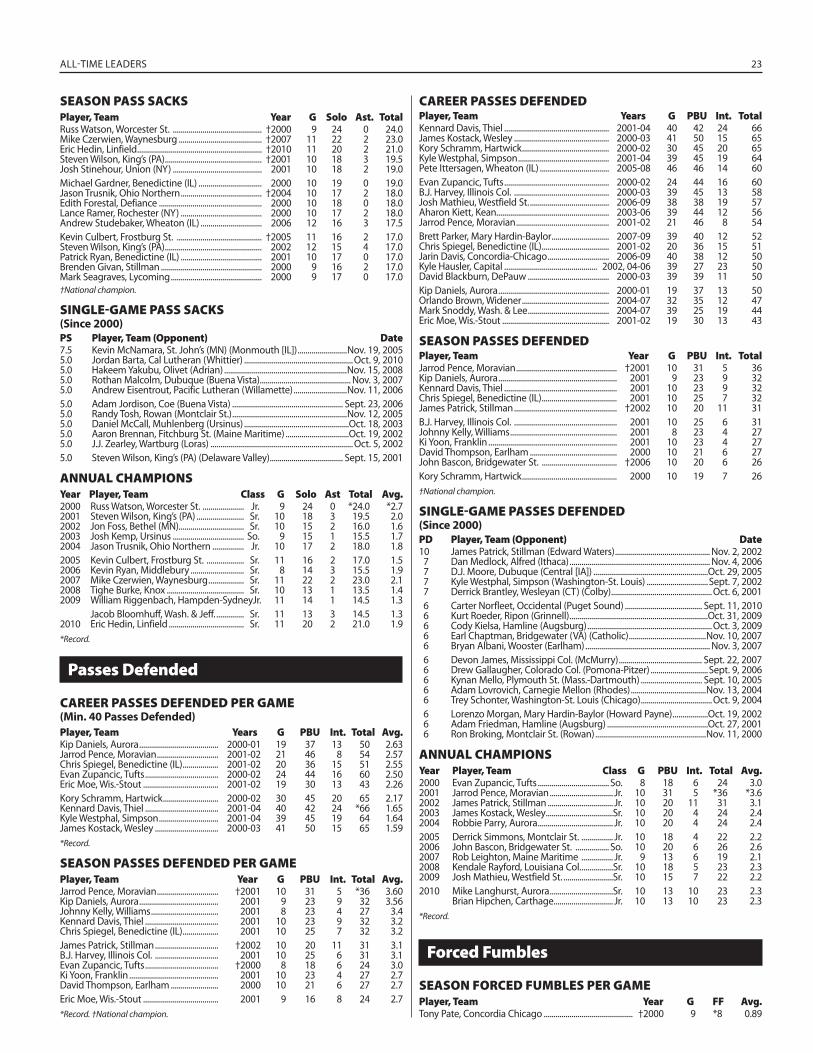
ALL-TIME LEADERS 23
SEASON PASS SACKSPlayer, Team Year G Solo Ast. TotalRuss Watson, Worcester St. ............................................. †2000 9 24 0 24.0Mike Czerwien, Waynesburg .......................................... †2007 11 22 2 23.0Eric Hedin, Linfield ............................................................... †2010 11 20 2 21.0Steven Wilson, King’s (PA) ................................................. †2001 10 18 3 19.5Josh Stinehour, Union (NY) ............................................. 2001 10 18 2 19.0Michael Gardner, Benedictine (IL) ................................ 2000 10 19 0 19.0Jason Trusnik, Ohio Northern ......................................... †2004 10 17 2 18.0Edith Forestal, Defiance .................................................... 2000 10 18 0 18.0Lance Ramer, Rochester (NY) ......................................... 2000 10 17 2 18.0Andrew Studebaker, Wheaton (IL) ............................... 2006 12 16 3 17.5Kevin Culbert, Frostburg St. ........................................... †2005 11 16 2 17.0Steven Wilson, King’s (PA) ................................................. 2002 12 15 4 17.0Patrick Ryan, Benedictine (IL) ......................................... 2001 10 17 0 17.0Brenden Givan, Stillman ................................................... 2000 9 16 2 17.0Mark Seagraves, Lycoming .............................................. 2000 9 17 0 17.0†National champion.
SINGLE-GAME PASS SACKS (Since 2000)
PS Player, Team (Opponent) Date7.5 Kevin McNamara, St. John’s (MN) (Monmouth [IL]) .........................Nov. 19, 20055.0 Jordan Barta, Cal Lutheran (Whittier) .......................................................Oct. 9, 20105.0 Hakeem Yakubu, Olivet (Adrian) ..............................................................Nov. 15, 20085.0 Rothan Malcolm, Dubuque (Buena Vista) .............................................. Nov. 3, 20075.0 Andrew Eisentrout, Pacific Lutheran (Willamette) ...........................Nov. 11, 20065.0 Adam Jordison, Coe (Buena Vista) ........................................................ Sept. 23, 20065.0 Randy Tosh, Rowan (Montclair St.) ..........................................................Nov. 12, 20055.0 Daniel McCall, Muhlenberg (Ursinus) .....................................................Oct. 18, 20035.0 Aaron Brennan, Fitchburg St. (Maine Maritime) ................................Oct. 19, 20025.0 J.J. Zearley, Wartburg (Loras) ........................................................................Oct. 5, 20025.0 Steven Wilson, King’s (PA) (Delaware Valley) ..................................... Sept. 15, 2001
ANNUAL CHAMPIONSYear Player, Team Class G Solo Ast Total Avg.2000 Russ Watson, Worcester St. ..................... Jr. 9 24 0 *24.0 *2.72001 Steven Wilson, King’s (PA) ........................ Sr. 10 18 3 19.5 2.02002 Jon Foss, Bethel (MN)................................. Sr. 10 15 2 16.0 1.62003 Josh Kemp, Ursinus .................................... So. 9 15 1 15.5 1.72004 Jason Trusnik, Ohio Northern ................ Jr. 10 17 2 18.0 1.82005 Kevin Culbert, Frostburg St. ................... Sr. 11 16 2 17.0 1.52006 Kevin Ryan, Middlebury ........................... Sr. 8 14 3 15.5 1.92007 Mike Czerwien, Waynesburg .................. Sr. 11 22 2 23.0 2.12008 Tighe Burke, Knox ....................................... Sr. 10 13 1 13.5 1.42009 William Riggenbach, Hampden-Sydney Jr. 11 14 1 14.5 1.3 Jacob Bloomhuff, Wash. & Jeff. .............. Sr. 11 13 3 14.5 1.32010 Eric Hedin, Linfield ...................................... Sr. 11 20 2 21.0 1.9*Record.
Passes Defended
CAREER PASSES DEFENDED PER GAME(Min. 40 Passes Defended)
Player, Team Years G PBU Int. Total Avg.Kip Daniels, Aurora ........................................ 2000-01 19 37 13 50 2.63Jarrod Pence, Moravian ............................... 2001-02 21 46 8 54 2.57Chris Spiegel, Benedictine (IL) .................. 2001-02 20 36 15 51 2.55Evan Zupancic, Tufts ..................................... 2000-02 24 44 16 60 2.50Eric Moe, Wis.-Stout ...................................... 2001-02 19 30 13 43 2.26Kory Schramm, Hartwick ............................ 2000-02 30 45 20 65 2.17Kennard Davis, Thiel ..................................... 2001-04 40 42 24 *66 1.65Kyle Westphal, Simpson .............................. 2001-04 39 45 19 64 1.64James Kostack, Wesley ................................ 2000-03 41 50 15 65 1.59*Record.
SEASON PASSES DEFENDED PER GAMEPlayer, Team Year G PBU Int. Total Avg.Jarrod Pence, Moravian ............................... †2001 10 31 5 *36 3.60Kip Daniels, Aurora ........................................ 2001 9 23 9 32 3.56Johnny Kelly, Williams .................................. 2001 8 23 4 27 3.4Kennard Davis, Thiel ..................................... 2001 10 23 9 32 3.2Chris Spiegel, Benedictine (IL) .................. 2001 10 25 7 32 3.2James Patrick, Stillman ................................ †2002 10 20 11 31 3.1B.J. Harvey, Illinois Col. ................................ 2001 10 25 6 31 3.1Evan Zupancic, Tufts ..................................... †2000 8 18 6 24 3.0Ki Yoon, Franklin ............................................. 2001 10 23 4 27 2.7David Thompson, Earlham ........................ 2000 10 21 6 27 2.7Eric Moe, Wis.-Stout ...................................... 2001 9 16 8 24 2.7*Record. †National champion.
CAREER PASSES DEFENDEDPlayer, Team Years G PBU Int. TotalKennard Davis, Thiel ..................................................... 2001-04 40 42 24 66James Kostack, Wesley ................................................ 2000-03 41 50 15 65Kory Schramm, Hartwick ............................................ 2000-02 30 45 20 65Kyle Westphal, Simpson .............................................. 2001-04 39 45 19 64Pete Ittersagen, Wheaton (IL) ................................... 2005-08 46 46 14 60Evan Zupancic, Tufts ..................................................... 2000-02 24 44 16 60B.J. Harvey, Illinois Col. ................................................ 2000-03 39 45 13 58Josh Mathieu, Westfield St. ........................................ 2006-09 38 38 19 57Aharon Kiett, Kean......................................................... 2003-06 39 44 12 56Jarrod Pence, Moravian ............................................... 2001-02 21 46 8 54Brett Parker, Mary Hardin-Baylor ............................. 2007-09 39 40 12 52Chris Spiegel, Benedictine (IL) .................................. 2001-02 20 36 15 51Jarin Davis, Concordia-Chicago ............................... 2006-09 40 38 12 50Kyle Hausler, Capital ............................................... 2002, 04-06 39 27 23 50David Blackburn, DePauw ......................................... 2000-03 39 39 11 50Kip Daniels, Aurora ........................................................ 2000-01 19 37 13 50Orlando Brown, Widener ............................................ 2004-07 32 35 12 47Mark Snoddy, Wash. & Lee ......................................... 2004-07 39 25 19 44Eric Moe, Wis.-Stout ...................................................... 2001-02 19 30 13 43
SEASON PASSES DEFENDEDPlayer, Team Year G PBU Int. TotalJarrod Pence, Moravian ................................................... †2001 10 31 5 36Kip Daniels, Aurora ............................................................ 2001 9 23 9 32Kennard Davis, Thiel ......................................................... 2001 10 23 9 32Chris Spiegel, Benedictine (IL) ...................................... 2001 10 25 7 32James Patrick, Stillman .................................................... †2002 10 20 11 31B.J. Harvey, Illinois Col. .................................................... 2001 10 25 6 31Johnny Kelly, Williams ...................................................... 2001 8 23 4 27Ki Yoon, Franklin ................................................................. 2001 10 23 4 27David Thompson, Earlham ............................................ 2000 10 21 6 27John Bascon, Bridgewater St. ...................................... †2006 10 20 6 26Kory Schramm, Hartwick ................................................ 2000 10 19 7 26†National champion.
SINGLE-GAME PASSES DEFENDED(Since 2000)
PD Player, Team (Opponent) Date10 James Patrick, Stillman (Edward Waters) ................................................ Nov. 2, 2002 7 Dan Medlock, Alfred (Ithaca) ....................................................................... Nov. 4, 2006 7 D.J. Moore, Dubuque (Central [IA]) ..........................................................Oct. 29, 2005 7 Kyle Westphal, Simpson (Washington-St. Louis) ...............................Sept. 7, 2002 7 Derrick Brantley, Wesleyan (CT) (Colby) ...................................................Oct. 6, 2001 6 Carter Norfleet, Occidental (Puget Sound) ....................................... Sept. 11, 2010 6 Kurt Roeder, Ripon (Grinnell) ......................................................................Oct. 31, 2009 6 Cody Kielsa, Hamline (Augsburg) ...............................................................Oct. 3, 2009 6 Earl Chaptman, Bridgewater (VA) (Catholic) .......................................Nov. 10, 2007 6 Bryan Albani, Wooster (Earlham) ............................................................... Nov. 3, 2007 6 Devon James, Mississippi Col. (McMurry) .......................................... Sept. 22, 2007 6 Drew Gallaugher, Colorado Col. (Pomona-Pitzer) .............................Sept. 9, 2006 6 Kynan Mello, Plymouth St. (Mass.-Dartmouth) ............................... Sept. 10, 2005 6 Adam Lovrovich, Carnegie Mellon (Rhodes) ......................................Nov. 13, 2004 6 Trey Schonter, Washington-St. Louis (Chicago) ....................................Oct. 9, 2004 6 Lorenzo Morgan, Mary Hardin-Baylor (Howard Payne) ..................Oct. 19, 2002 6 Adam Friedman, Hamline (Augsburg) ...................................................Oct. 27, 2001 6 Ron Broking, Montclair St. (Rowan) ........................................................Nov. 11, 2000
ANNUAL CHAMPIONSYear Player, Team Class G PBU Int. Total Avg.2000 Evan Zupancic, Tufts .................................... So. 8 18 6 24 3.02001 Jarrod Pence, Moravian ................................ Jr. 10 31 5 *36 *3.62002 James Patrick, Stillman ................................. Jr. 10 20 11 31 3.12003 James Kostack, Wesley ..................................Sr. 10 20 4 24 2.42004 Robbie Parry, Aurora ...................................... Jr. 10 20 4 24 2.42005 Derrick Simmons, Montclair St. ................ Jr. 10 18 4 22 2.22006 John Bascon, Bridgewater St. ................. So. 10 20 6 26 2.62007 Rob Leighton, Maine Maritime ................ Jr. 9 13 6 19 2.12008 Kendale Rayford, Louisiana Col. ................Sr. 10 18 5 23 2.32009 Josh Mathieu, Westfield St. .........................Sr. 10 15 7 22 2.22010 Mike Langhurst, Aurora ................................Sr. 10 13 10 23 2.3 Brian Hipchen, Carthage.............................. Jr. 10 13 10 23 2.3*Record.
Forced Fumbles
SEASON FORCED FUMBLES PER GAMEPlayer, Team Year G FF Avg.Tony Pate, Concordia Chicago ............................................. †2000 9 *8 0.89
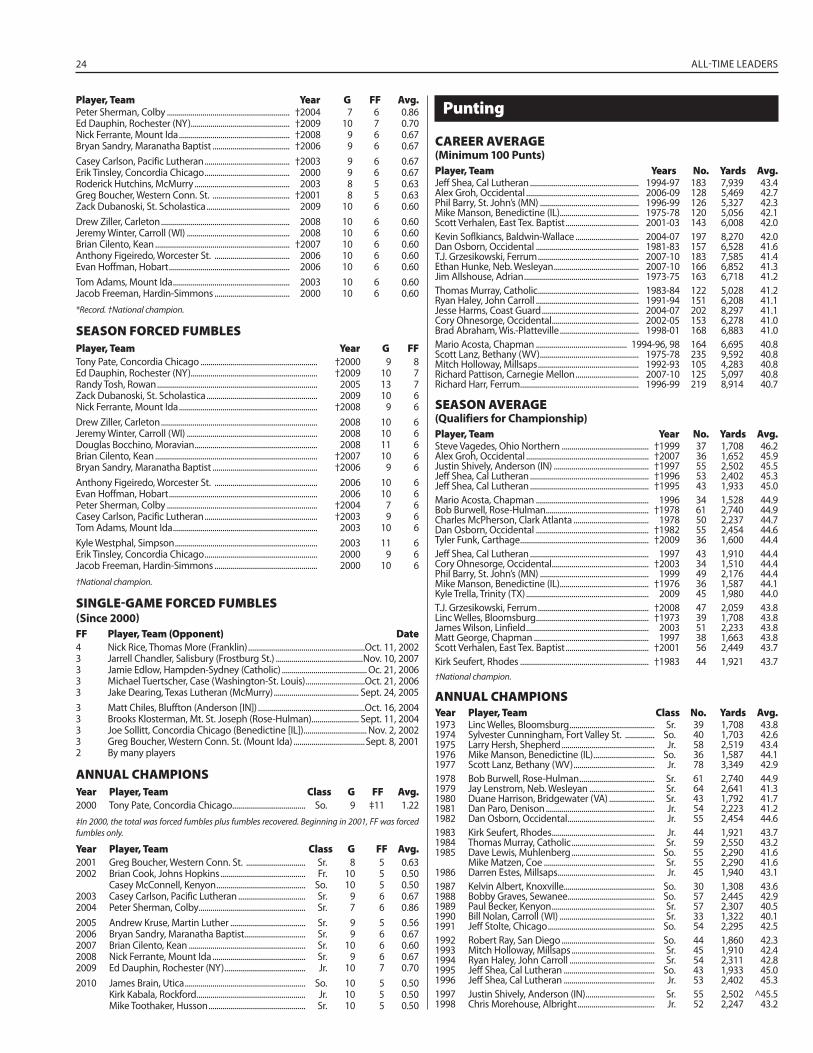
24 ALL-TIME LEADERS
Peter Sherman, Colby .............................................................. †2004 7 6 0.86Ed Dauphin, Rochester (NY).................................................. †2009 10 7 0.70Nick Ferrante, Mount Ida ........................................................ †2008 9 6 0.67Bryan Sandry, Maranatha Baptist ....................................... †2006 9 6 0.67Casey Carlson, Pacific Lutheran ........................................... †2003 9 6 0.67Erik Tinsley, Concordia Chicago ........................................... 2000 9 6 0.67Roderick Hutchins, McMurry ................................................ 2003 8 5 0.63Greg Boucher, Western Conn. St. ....................................... †2001 8 5 0.63Zack Dubanoski, St. Scholastica .......................................... 2009 10 6 0.60Drew Ziller, Carleton ................................................................. 2008 10 6 0.60Jeremy Winter, Carroll (WI) .................................................... 2008 10 6 0.60Brian Cilento, Kean .................................................................... †2007 10 6 0.60Anthony Figeiredo, Worcester St. ...................................... 2006 10 6 0.60Evan Hoffman, Hobart ............................................................. 2006 10 6 0.60Tom Adams, Mount Ida ........................................................... 2003 10 6 0.60Jacob Freeman, Hardin-Simmons ...................................... 2000 10 6 0.60*Record. †National champion.
SEASON FORCED FUMBLESPlayer, Team Year G FFTony Pate, Concordia Chicago ........................................................... †2000 9 8Ed Dauphin, Rochester (NY)................................................................ †2009 10 7Randy Tosh, Rowan ................................................................................. 2005 13 7Zack Dubanoski, St. Scholastica ........................................................ 2009 10 6Nick Ferrante, Mount Ida ...................................................................... †2008 9 6Drew Ziller, Carleton ............................................................................... 2008 10 6Jeremy Winter, Carroll (WI) .................................................................. 2008 10 6Douglas Bocchino, Moravian .............................................................. 2008 11 6Brian Cilento, Kean .................................................................................. †2007 10 6Bryan Sandry, Maranatha Baptist ..................................................... †2006 9 6Anthony Figeiredo, Worcester St. .................................................... 2006 10 6Evan Hoffman, Hobart ........................................................................... 2006 10 6Peter Sherman, Colby ............................................................................ †2004 7 6Casey Carlson, Pacific Lutheran ......................................................... †2003 9 6Tom Adams, Mount Ida ......................................................................... 2003 10 6Kyle Westphal, Simpson ........................................................................ 2003 11 6Erik Tinsley, Concordia Chicago ......................................................... 2000 9 6Jacob Freeman, Hardin-Simmons .................................................... 2000 10 6†National champion.
SINGLE-GAME FORCED FUMBLES (Since 2000)
FF Player, Team (Opponent) Date4 Nick Rice, Thomas More (Franklin) ...........................................................Oct. 11, 20023 Jarrell Chandler, Salisbury (Frostburg St.) ............................................Nov. 10, 20073 Jamie Edlow, Hampden-Sydney (Catholic) ........................................... Oc. 21, 20063 Michael Tuertscher, Case (Washington-St. Louis) ..............................Oct. 21, 20063 Jake Dearing, Texas Lutheran (McMurry) ........................................... Sept. 24, 20053 Matt Chiles, Bluffton (Anderson [IN]) ......................................................Oct. 16, 20043 Brooks Klosterman, Mt. St. Joseph (Rose-Hulman)........................ Sept. 11, 20043 Joe Sollitt, Concordia Chicago (Benedictine [IL]) ................................ Nov. 2, 20023 Greg Boucher, Western Conn. St. (Mount Ida) ....................................Sept. 8, 20012 By many players
ANNUAL CHAMPIONSYear Player, Team Class G FF Avg.2000 Tony Pate, Concordia Chicago ..................................... So. 9 ‡11 1.22‡In 2000, the total was forced fumbles plus fumbles recovered. Beginning in 2001, FF was forced fumbles only.
Year Player, Team Class G FF Avg.2001 Greg Boucher, Western Conn. St. .............................. Sr. 8 5 0.632002 Brian Cook, Johns Hopkins ........................................... Fr. 10 5 0.50 Casey McConnell, Kenyon ............................................. So. 10 5 0.502003 Casey Carlson, Pacific Lutheran .................................. Sr. 9 6 0.672004 Peter Sherman, Colby ...................................................... Sr. 7 6 0.862005 Andrew Kruse, Martin Luther ...................................... Sr. 9 5 0.562006 Bryan Sandry, Maranatha Baptist............................... Sr. 9 6 0.672007 Brian Cilento, Kean ........................................................... Sr. 10 6 0.602008 Nick Ferrante, Mount Ida ............................................... Sr. 9 6 0.672009 Ed Dauphin, Rochester (NY) ......................................... Jr. 10 7 0.702010 James Brain, Utica ............................................................. So. 10 5 0.50 Kirk Kabala, Rockford ....................................................... Jr. 10 5 0.50 Mike Toothaker, Husson ................................................. Sr. 10 5 0.50
Punting
CAREER AVERAGE(Minimum 100 Punts)
Player, Team Years No. Yards Avg.Jeff Shea, Cal Lutheran ....................................................... 1994-97 183 7,939 43.4Alex Groh, Occidental ......................................................... 2006-09 128 5,469 42.7Phil Barry, St. John’s (MN) .................................................. 1996-99 126 5,327 42.3Mike Manson, Benedictine (IL)........................................ 1975-78 120 5,056 42.1Scott Verhalen, East Tex. Baptist ..................................... 2001-03 143 6,008 42.0Kevin Soflkiancs, Baldwin-Wallace ................................ 2004-07 197 8,270 42.0Dan Osborn, Occidental .................................................... 1981-83 157 6,528 41.6T.J. Grzesikowski, Ferrum ................................................... 2007-10 183 7,585 41.4Ethan Hunke, Neb. Wesleyan ........................................... 2007-10 166 6,852 41.3Jim Allshouse, Adrian .......................................................... 1973-75 163 6,718 41.2Thomas Murray, Catholic ................................................... 1983-84 122 5,028 41.2Ryan Haley, John Carroll .................................................... 1991-94 151 6,208 41.1Jesse Harms, Coast Guard ................................................. 2004-07 202 8,297 41.1Cory Ohnesorge, Occidental ............................................ 2002-05 153 6,278 41.0Brad Abraham, Wis.-Platteville ........................................ 1998-01 168 6,883 41.0Mario Acosta, Chapman .............................................. 1994-96, 98 164 6,695 40.8Scott Lanz, Bethany (WV) .................................................. 1975-78 235 9,592 40.8Mitch Holloway, Millsaps ................................................... 1992-93 105 4,283 40.8Richard Pattison, Carnegie Mellon ................................ 2007-10 125 5,097 40.8Richard Harr, Ferrum............................................................ 1996-99 219 8,914 40.7
SEASON AVERAGE(Qualifiers for Championship)
Player, Team Year No. Yards Avg.Steve Vagedes, Ohio Northern ............................................ †1999 37 1,708 46.2Alex Groh, Occidental .............................................................. †2007 36 1,652 45.9Justin Shively, Anderson (IN) ................................................ †1997 55 2,502 45.5Jeff Shea, Cal Lutheran ............................................................ †1996 53 2,402 45.3Jeff Shea, Cal Lutheran ............................................................ †1995 43 1,933 45.0Mario Acosta, Chapman ......................................................... 1996 34 1,528 44.9Bob Burwell, Rose-Hulman .................................................... †1978 61 2,740 44.9Charles McPherson, Clark Atlanta ...................................... 1978 50 2,237 44.7Dan Osborn, Occidental ......................................................... †1982 55 2,454 44.6Tyler Funk, Carthage ................................................................. †2009 36 1,600 44.4Jeff Shea, Cal Lutheran ............................................................ 1997 43 1,910 44.4Cory Ohnesorge, Occidental ................................................. †2003 34 1,510 44.4Phil Barry, St. John’s (MN) ....................................................... 1999 49 2,176 44.4Mike Manson, Benedictine (IL)............................................. †1976 36 1,587 44.1Kyle Trella, Trinity (TX) .............................................................. 2009 45 1,980 44.0T.J. Grzesikowski, Ferrum ........................................................ †2008 47 2,059 43.8Linc Welles, Bloomsburg ......................................................... †1973 39 1,708 43.8James Wilson, Linfield .............................................................. 2003 51 2,233 43.8Matt George, Chapman .......................................................... 1997 38 1,663 43.8Scott Verhalen, East Tex. Baptist .......................................... †2001 56 2,449 43.7Kirk Seufert, Rhodes ................................................................. †1983 44 1,921 43.7†National champion.
ANNUAL CHAMPIONSYear Player, Team Class No. Yards Avg.1973 Linc Welles, Bloomsburg ........................................... Sr. 39 1,708 43.81974 Sylvester Cunningham, Fort Valley St. ............... So. 40 1,703 42.61975 Larry Hersh, Shepherd ............................................... Jr. 58 2,519 43.41976 Mike Manson, Benedictine (IL) ............................... So. 36 1,587 44.11977 Scott Lanz, Bethany (WV) ......................................... Jr. 78 3,349 42.91978 Bob Burwell, Rose-Hulman ...................................... Sr. 61 2,740 44.91979 Jay Lenstrom, Neb. Wesleyan ................................. Sr. 64 2,641 41.31980 Duane Harrison, Bridgewater (VA) ....................... Sr. 43 1,792 41.71981 Dan Paro, Denison ....................................................... Jr. 54 2,223 41.21982 Dan Osborn, Occidental ............................................ Jr. 55 2,454 44.61983 Kirk Seufert, Rhodes .................................................... Jr. 44 1,921 43.71984 Thomas Murray, Catholic .......................................... Sr. 59 2,550 43.21985 Dave Lewis, Muhlenberg .......................................... So. 55 2,290 41.6 Mike Matzen, Coe ........................................................ Sr. 55 2,290 41.61986 Darren Estes, Millsaps ................................................. Jr. 45 1,940 43.11987 Kelvin Albert, Knoxville.............................................. So. 30 1,308 43.61988 Bobby Graves, Sewanee ............................................ So. 57 2,445 42.91989 Paul Becker, Kenyon .................................................... Sr. 57 2,307 40.51990 Bill Nolan, Carroll (WI) ................................................ Sr. 33 1,322 40.11991 Jeff Stolte, Chicago ...................................................... So. 54 2,295 42.51992 Robert Ray, San Diego ............................................... So. 44 1,860 42.31993 Mitch Holloway, Millsaps .......................................... Sr. 45 1,910 42.41994 Ryan Haley, John Carroll ........................................... Sr. 54 2,311 42.81995 Jeff Shea, Cal Lutheran .............................................. So. 43 1,933 45.01996 Jeff Shea, Cal Lutheran .............................................. Jr. 53 2,402 45.31997 Justin Shively, Anderson (IN) ................................... Sr. 55 2,502 ^45.51998 Chris Morehouse, Albright ....................................... Jr. 52 2,247 43.2
Player, Team Year G FF Avg.
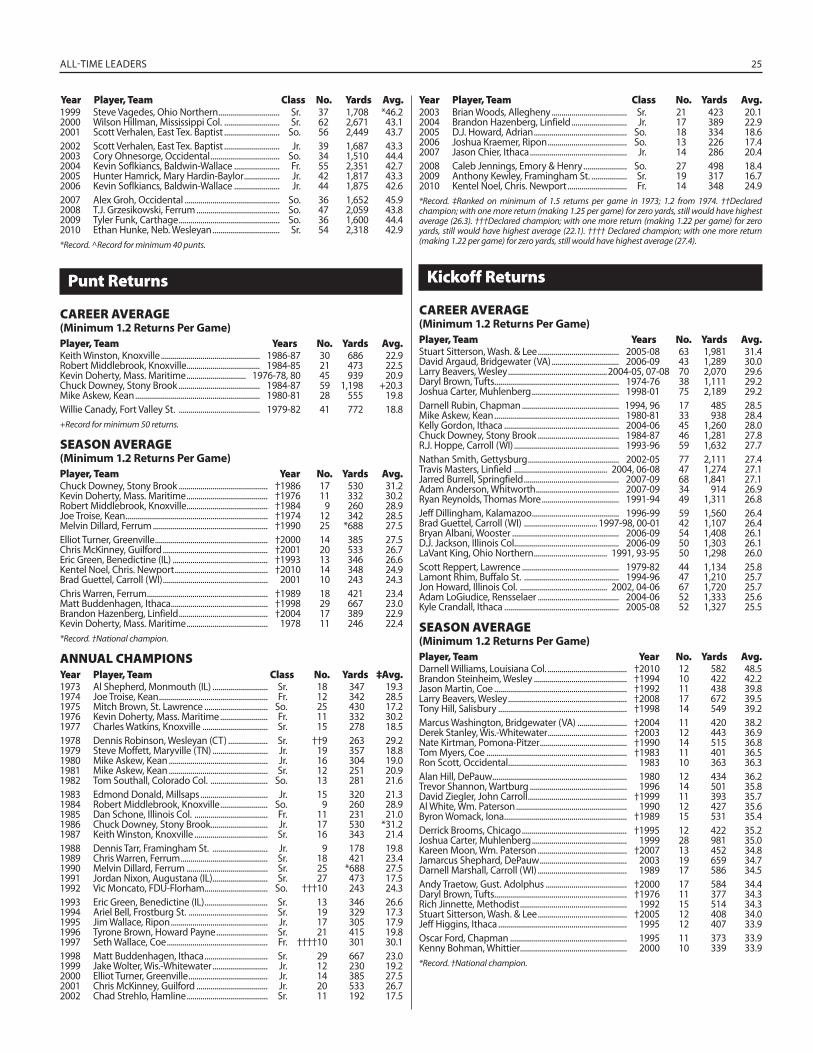
ALL-TIME LEADERS 25
1999 Steve Vagedes, Ohio Northern ............................... Sr. 37 1,708 *46.22000 Wilson Hillman, Mississippi Col. ............................ Sr. 62 2,671 43.12001 Scott Verhalen, East Tex. Baptist ............................ So. 56 2,449 43.72002 Scott Verhalen, East Tex. Baptist ............................ Jr. 39 1,687 43.32003 Cory Ohnesorge, Occidental ................................... So. 34 1,510 44.42004 Kevin Soflkiancs, Baldwin-Wallace ....................... Fr. 55 2,351 42.72005 Hunter Hamrick, Mary Hardin-Baylor .................. Jr. 42 1,817 43.32006 Kevin Soflkiancs, Baldwin-Wallace ....................... Jr. 44 1,875 42.62007 Alex Groh, Occidental ................................................ So. 36 1,652 45.92008 T.J. Grzesikowski, Ferrum .......................................... So. 47 2,059 43.82009 Tyler Funk, Carthage ................................................... So. 36 1,600 44.42010 Ethan Hunke, Neb. Wesleyan .................................. Sr. 54 2,318 42.9*Record. ^Record for minimum 40 punts.
Punt Returns
CAREER AVERAGE(Minimum 1.2 Returns Per Game)
Player, Team Years No. Yards Avg.Keith Winston, Knoxville .................................................. 1986-87 30 686 22.9Robert Middlebrook, Knoxville ..................................... 1984-85 21 473 22.5Kevin Doherty, Mass. Maritime .............................. 1976-78, 80 45 939 20.9Chuck Downey, Stony Brook ......................................... 1984-87 59 1,198 +20.3Mike Askew, Kean ............................................................... 1980-81 28 555 19.8Willie Canady, Fort Valley St. ......................................... 1979-82 41 772 18.8+Record for minimum 50 returns.
SEASON AVERAGE(Minimum 1.2 Returns Per Game)
Player, Team Year No. Yards Avg.Chuck Downey, Stony Brook ............................................. †1986 17 530 31.2Kevin Doherty, Mass. Maritime ......................................... †1976 11 332 30.2Robert Middlebrook, Knoxville ......................................... †1984 9 260 28.9Joe Troise, Kean ........................................................................ †1974 12 342 28.5Melvin Dillard, Ferrum .......................................................... †1990 25 *688 27.5Elliot Turner, Greenville ......................................................... †2000 14 385 27.5Chris McKinney, Guilford ..................................................... †2001 20 533 26.7Eric Green, Benedictine (IL) ................................................ †1993 13 346 26.6Kentel Noel, Chris. Newport ............................................... †2010 14 348 24.9Brad Guettel, Carroll (WI) ..................................................... 2001 10 243 24.3Chris Warren, Ferrum ............................................................. †1989 18 421 23.4Matt Buddenhagen, Ithaca ................................................. †1998 29 667 23.0Brandon Hazenberg, Linfield ............................................. †2004 17 389 22.9Kevin Doherty, Mass. Maritime ......................................... 1978 11 246 22.4*Record. †National champion.
ANNUAL CHAMPIONSYear Player, Team Class No. Yards ‡Avg.1973 Al Shepherd, Monmouth (IL) ............................ Sr. 18 347 19.31974 Joe Troise, Kean ....................................................... Fr. 12 342 28.51975 Mitch Brown, St. Lawrence ................................ So. 25 430 17.21976 Kevin Doherty, Mass. Maritime ........................ Fr. 11 332 30.21977 Charles Watkins, Knoxville ................................. Sr. 15 278 18.51978 Dennis Robinson, Wesleyan (CT) .................... Sr. ††9 263 29.21979 Steve Moffett, Maryville (TN) ............................ Jr. 19 357 18.81980 Mike Askew, Kean .................................................. Jr. 16 304 19.01981 Mike Askew, Kean .................................................. Sr. 12 251 20.91982 Tom Southall, Colorado Col. ............................. So. 13 281 21.61983 Edmond Donald, Millsaps .................................. Jr. 15 320 21.31984 Robert Middlebrook, Knoxville ........................ So. 9 260 28.91985 Dan Schone, Illinois Col. ..................................... Fr. 11 231 21.01986 Chuck Downey, Stony Brook............................. Jr. 17 530 *31.21987 Keith Winston, Knoxville ..................................... Sr. 16 343 21.41988 Dennis Tarr, Framingham St. ............................ Jr. 9 178 19.81989 Chris Warren, Ferrum ............................................ Sr. 18 421 23.41990 Melvin Dillard, Ferrum ......................................... Sr. 25 *688 27.51991 Jordan Nixon, Augustana (IL)............................ Sr. 27 473 17.51992 Vic Moncato, FDU-Florham................................ So. †††10 243 24.31993 Eric Green, Benedictine (IL) ................................ Sr. 13 346 26.61994 Ariel Bell, Frostburg St. ........................................ Sr. 19 329 17.31995 Jim Wallace, Ripon ................................................. Jr. 17 305 17.91996 Tyrone Brown, Howard Payne .......................... Sr. 21 415 19.81997 Seth Wallace, Coe ................................................... Fr. ††††10 301 30.11998 Matt Buddenhagen, Ithaca ................................ Sr. 29 667 23.01999 Jake Wolter, Wis.-Whitewater ............................ Jr. 12 230 19.22000 Elliot Turner, Greenville ........................................ Jr. 14 385 27.52001 Chris McKinney, Guilford .................................... Jr. 20 533 26.72002 Chad Strehlo, Hamline ......................................... Sr. 11 192 17.5
2003 Brian Woods, Allegheny ...................................... Sr. 21 423 20.12004 Brandon Hazenberg, Linfield ............................ Jr. 17 389 22.92005 D.J. Howard, Adrian ............................................... So. 18 334 18.62006 Joshua Kraemer, Ripon ........................................ So. 13 226 17.42007 Jason Chier, Ithaca ................................................. Jr. 14 286 20.42008 Caleb Jennings, Emory & Henry ...................... So. 27 498 18.42009 Anthony Kewley, Framingham St. .................. Sr. 19 317 16.72010 Kentel Noel, Chris. Newport .............................. Fr. 14 348 24.9*Record. ‡Ranked on minimum of 1.5 returns per game in 1973; 1.2 from 1974. ††Declared champion; with one more return (making 1.25 per game) for zero yards, still would have highest average (26.3). †††Declared champion; with one more return (making 1.22 per game) for zero yards, still would have highest average (22.1). †††† Declared champion; with one more return (making 1.22 per game) for zero yards, still would have highest average (27.4).
Kickoff Returns
CAREER AVERAGE(Minimum 1.2 Returns Per Game)
Player, Team Years No. Yards Avg.Stuart Sitterson, Wash. & Lee ......................................... 2005-08 63 1,981 31.4David Argaud, Bridgewater (VA) .................................. 2006-09 43 1,289 30.0Larry Beavers, Wesley .................................................. 2004-05, 07-08 70 2,070 29.6Daryl Brown, Tufts ............................................................... 1974-76 38 1,111 29.2Joshua Carter, Muhlenberg ............................................ 1998-01 75 2,189 29.2Darnell Rubin, Chapman ................................................. 1994, 96 17 485 28.5Mike Askew, Kean ............................................................... 1980-81 33 938 28.4Kelly Gordon, Ithaca .......................................................... 2004-06 45 1,260 28.0Chuck Downey, Stony Brook ......................................... 1984-87 46 1,281 27.8R.J. Hoppe, Carroll (WI) ..................................................... 1993-96 59 1,632 27.7Nathan Smith, Gettysburg .............................................. 2002-05 77 2,111 27.4Travis Masters, Linfield ............................................... 2004, 06-08 47 1,274 27.1Jarred Burrell, Springfield ................................................ 2007-09 68 1,841 27.1Adam Anderson, Whitworth .......................................... 2007-09 34 914 26.9Ryan Reynolds, Thomas More ....................................... 1991-94 49 1,311 26.8Jeff Dillingham, Kalamazoo ............................................ 1996-99 59 1,560 26.4Brad Guettel, Carroll (WI) ..................................... 1997-98, 00-01 42 1,107 26.4Bryan Albani, Wooster ...................................................... 2006-09 54 1,408 26.1D.J. Jackson, Illinois Col..................................................... 2006-09 50 1,303 26.1LaVant King, Ohio Northern ..................................... 1991, 93-95 50 1,298 26.0Scott Reppert, Lawrence ................................................. 1979-82 44 1,134 25.8Lamont Rhim, Buffalo St. ................................................ 1994-96 47 1,210 25.7Jon Howard, Illinois Col. ............................................ 2002, 04-06 67 1,720 25.7Adam LoGiudice, Rensselaer ......................................... 2004-06 52 1,333 25.6Kyle Crandall, Ithaca .......................................................... 2005-08 52 1,327 25.5
SEASON AVERAGE(Minimum 1.2 Returns Per Game)
Player, Team Year No. Yards Avg.Darnell Williams, Louisiana Col. ........................................ †2010 12 582 48.5Brandon Steinheim, Wesley ............................................... †1994 10 422 42.2Jason Martin, Coe ................................................................... †1992 11 438 39.8Larry Beavers, Wesley ............................................................ †2008 17 672 39.5Tony Hill, Salisbury ................................................................. †1998 14 549 39.2Marcus Washington, Bridgewater (VA) ......................... †2004 11 420 38.2Derek Stanley, Wis.-Whitewater ........................................ †2003 12 443 36.9Nate Kirtman, Pomona-Pitzer ............................................ †1990 14 515 36.8Tom Myers, Coe ....................................................................... †1983 11 401 36.5Ron Scott, Occidental ............................................................ 1983 10 363 36.3Alan Hill, DePauw.................................................................... 1980 12 434 36.2Trevor Shannon, Wartburg ................................................. 1996 14 501 35.8David Ziegler, John Carroll .................................................. †1999 11 393 35.7Al White, Wm. Paterson ........................................................ 1990 12 427 35.6Byron Womack, Iona .............................................................. †1989 15 531 35.4Derrick Brooms, Chicago ..................................................... †1995 12 422 35.2Joshua Carter, Muhlenberg ................................................ 1999 28 981 35.0Kareen Moon, Wm. Paterson ............................................. †2007 13 452 34.8Jamarcus Shephard, DePauw ............................................ 2003 19 659 34.7Darnell Marshall, Carroll (WI) ............................................. 1989 17 586 34.5Andy Traetow, Gust. Adolphus ......................................... †2000 17 584 34.4Daryl Brown, Tufts ................................................................... †1976 11 377 34.3Rich Jinnette, Methodist ...................................................... 1992 15 514 34.3Stuart Sitterson, Wash. & Lee ............................................. †2005 12 408 34.0Jeff Higgins, Ithaca ................................................................. 1995 12 407 33.9Oscar Ford, Chapman ........................................................... 1995 11 373 33.9Kenny Bohman, Whittier...................................................... 2000 10 339 33.9*Record. †National champion.
Year Player, Team Class No. Yards Avg.Year Player, Team Class No. Yards Avg.
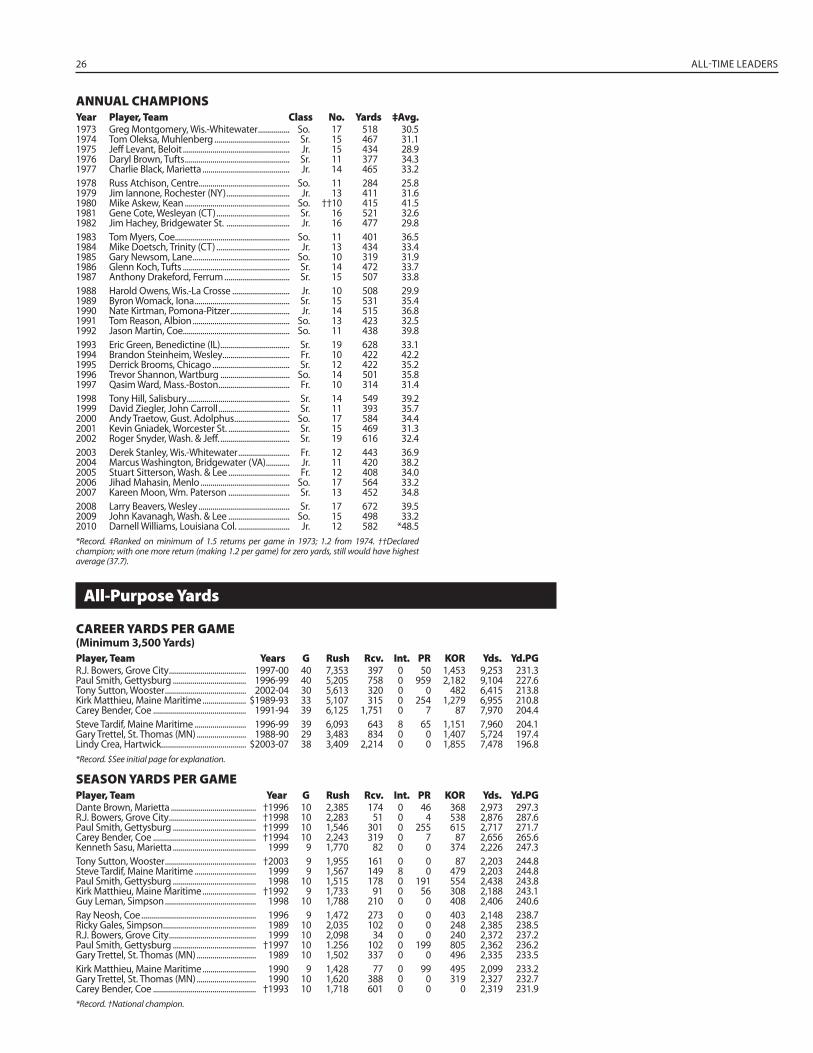
26 ALL-TIME LEADERS
ANNUAL CHAMPIONSYear Player, Team Class No. Yards ‡Avg.1973 Greg Montgomery, Wis.-Whitewater ................ So. 17 518 30.51974 Tom Oleksa, Muhlenberg ...................................... Sr. 15 467 31.11975 Jeff Levant, Beloit ...................................................... Jr. 15 434 28.91976 Daryl Brown, Tufts ..................................................... Sr. 11 377 34.31977 Charlie Black, Marietta ............................................ Jr. 14 465 33.21978 Russ Atchison, Centre .............................................. So. 11 284 25.81979 Jim Iannone, Rochester (NY) ................................ Jr. 13 411 31.61980 Mike Askew, Kean ..................................................... So. ††10 415 41.51981 Gene Cote, Wesleyan (CT) ..................................... Sr. 16 521 32.61982 Jim Hachey, Bridgewater St. ................................ Jr. 16 477 29.81983 Tom Myers, Coe.......................................................... So. 11 401 36.51984 Mike Doetsch, Trinity (CT) ..................................... Jr. 13 434 33.41985 Gary Newsom, Lane ................................................. So. 10 319 31.91986 Glenn Koch, Tufts ...................................................... Sr. 14 472 33.71987 Anthony Drakeford, Ferrum ................................. Sr. 15 507 33.81988 Harold Owens, Wis.-La Crosse ............................. Jr. 10 508 29.91989 Byron Womack, Iona ................................................ Sr. 15 531 35.41990 Nate Kirtman, Pomona-Pitzer .............................. Jr. 14 515 36.81991 Tom Reason, Albion ................................................. So. 13 423 32.51992 Jason Martin, Coe...................................................... So. 11 438 39.81993 Eric Green, Benedictine (IL) ................................... Sr. 19 628 33.11994 Brandon Steinheim, Wesley .................................. Fr. 10 422 42.21995 Derrick Brooms, Chicago ....................................... Sr. 12 422 35.21996 Trevor Shannon, Wartburg ................................... So. 14 501 35.81997 Qasim Ward, Mass.-Boston .................................... Fr. 10 314 31.41998 Tony Hill, Salisbury .................................................... Sr. 14 549 39.21999 David Ziegler, John Carroll .................................... Sr. 11 393 35.72000 Andy Traetow, Gust. Adolphus ............................ So. 17 584 34.42001 Kevin Gniadek, Worcester St. ............................... Sr. 15 469 31.32002 Roger Snyder, Wash. & Jeff. ................................... Sr. 19 616 32.42003 Derek Stanley, Wis.-Whitewater .......................... Fr. 12 443 36.92004 Marcus Washington, Bridgewater (VA) ............ Jr. 11 420 38.22005 Stuart Sitterson, Wash. & Lee ............................... Fr. 12 408 34.02006 Jihad Mahasin, Menlo ............................................. So. 17 564 33.22007 Kareen Moon, Wm. Paterson ............................... Sr. 13 452 34.82008 Larry Beavers, Wesley .............................................. Sr. 17 672 39.52009 John Kavanagh, Wash. & Lee ............................... So. 15 498 33.22010 Darnell Williams, Louisiana Col. .......................... Jr. 12 582 *48.5*Record. ‡Ranked on minimum of 1.5 returns per game in 1973; 1.2 from 1974. ††Declared champion; with one more return (making 1.2 per game) for zero yards, still would have highest average (37.7).
All-Purpose Yards
CAREER YARDS PER GAME(Minimum 3,500 Yards)
Player, Team Years G Rush Rcv. Int. PR KOR Yds. Yd.PGR.J. Bowers, Grove City ....................................... 1997-00 40 7,353 397 0 50 1,453 9,253 231.3Paul Smith, Gettysburg ..................................... 1996-99 40 5,205 758 0 959 2,182 9,104 227.6Tony Sutton, Wooster ......................................... 2002-04 30 5,613 320 0 0 482 6,415 213.8Kirk Matthieu, Maine Maritime ...................... $1989-93 33 5,107 315 0 254 1,279 6,955 210.8Carey Bender, Coe ............................................... 1991-94 39 6,125 1,751 0 7 87 7,970 204.4Steve Tardif, Maine Maritime .......................... 1996-99 39 6,093 643 8 65 1,151 7,960 204.1Gary Trettel, St. Thomas (MN) ......................... 1988-90 29 3,483 834 0 0 1,407 5,724 197.4Lindy Crea, Hartwick........................................... $2003-07 38 3,409 2,214 0 0 1,855 7,478 196.8*Record. $See initial page for explanation.
SEASON YARDS PER GAMEPlayer, Team Year G Rush Rcv. Int. PR KOR Yds. Yd.PGDante Brown, Marietta ........................................... †1996 10 2,385 174 0 46 368 2,973 297.3R.J. Bowers, Grove City ............................................ †1998 10 2,283 51 0 4 538 2,876 287.6Paul Smith, Gettysburg .......................................... †1999 10 1,546 301 0 255 615 2,717 271.7Carey Bender, Coe .................................................... †1994 10 2,243 319 0 7 87 2,656 265.6Kenneth Sasu, Marietta .......................................... 1999 9 1,770 82 0 0 374 2,226 247.3Tony Sutton, Wooster .............................................. †2003 9 1,955 161 0 0 87 2,203 244.8Steve Tardif, Maine Maritime ............................... 1999 9 1,567 149 8 0 479 2,203 244.8Paul Smith, Gettysburg .......................................... 1998 10 1,515 178 0 191 554 2,438 243.8Kirk Matthieu, Maine Maritime ........................... †1992 9 1,733 91 0 56 308 2,188 243.1Guy Leman, Simpson .............................................. 1998 10 1,788 210 0 0 408 2,406 240.6Ray Neosh, Coe .......................................................... 1996 9 1,472 273 0 0 403 2,148 238.7Ricky Gales, Simpson ............................................... 1989 10 2,035 102 0 0 248 2,385 238.5R.J. Bowers, Grove City ............................................ 1999 10 2,098 34 0 0 240 2,372 237.2Paul Smith, Gettysburg .......................................... †1997 10 1.256 102 0 199 805 2,362 236.2Gary Trettel, St. Thomas (MN) .............................. 1989 10 1,502 337 0 0 496 2,335 233.5Kirk Matthieu, Maine Maritime ........................... 1990 9 1,428 77 0 99 495 2,099 233.2Gary Trettel, St. Thomas (MN) .............................. 1990 10 1,620 388 0 0 319 2,327 232.7Carey Bender, Coe .................................................... †1993 10 1,718 601 0 0 0 2,319 231.9*Record. †National champion.
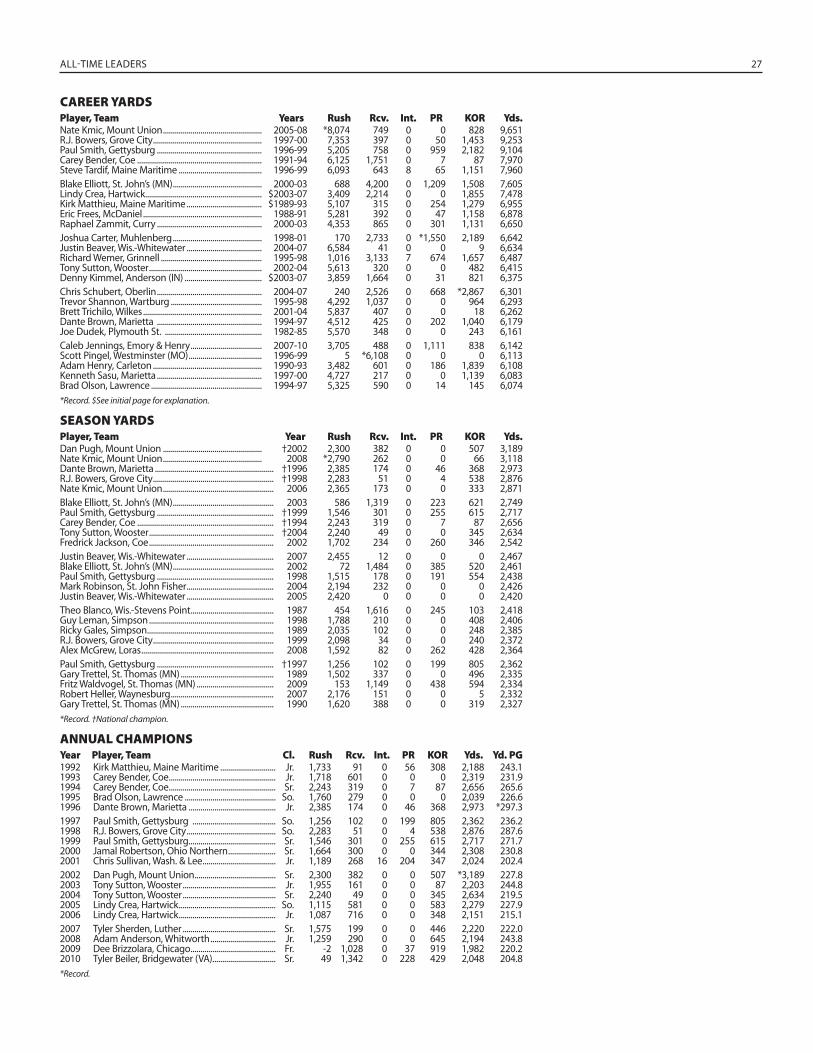
ALL-TIME LEADERS 27
CAREER YARDSPlayer, Team Years Rush Rcv. Int. PR KOR Yds.Nate Kmic, Mount Union .................................................. 2005-08 *8,074 749 0 0 828 9,651R.J. Bowers, Grove City ....................................................... 1997-00 7,353 397 0 50 1,453 9,253Paul Smith, Gettysburg ..................................................... 1996-99 5,205 758 0 959 2,182 9,104Carey Bender, Coe ............................................................... 1991-94 6,125 1,751 0 7 87 7,970Steve Tardif, Maine Maritime .......................................... 1996-99 6,093 643 8 65 1,151 7,960Blake Elliott, St. John’s (MN) ............................................. 2000-03 688 4,200 0 1,209 1,508 7,605Lindy Crea, Hartwick........................................................... $2003-07 3,409 2,214 0 0 1,855 7,478Kirk Matthieu, Maine Maritime ...................................... $1989-93 5,107 315 0 254 1,279 6,955Eric Frees, McDaniel ............................................................ 1988-91 5,281 392 0 47 1,158 6,878Raphael Zammit, Curry ..................................................... 2000-03 4,353 865 0 301 1,131 6,650Joshua Carter, Muhlenberg ............................................. 1998-01 170 2,733 0 *1,550 2,189 6,642Justin Beaver, Wis.-Whitewater ...................................... 2004-07 6,584 41 0 0 9 6,634Richard Wemer, Grinnell ................................................... 1995-98 1,016 3,133 7 674 1,657 6,487Tony Sutton, Wooster ......................................................... 2002-04 5,613 320 0 0 482 6,415Denny Kimmel, Anderson (IN) ....................................... $2003-07 3,859 1,664 0 31 821 6,375Chris Schubert, Oberlin ..................................................... 2004-07 240 2,526 0 668 *2,867 6,301Trevor Shannon, Wartburg .............................................. 1995-98 4,292 1,037 0 0 964 6,293Brett Trichilo, Wilkes ............................................................ 2001-04 5,837 407 0 0 18 6,262Dante Brown, Marietta ..................................................... 1994-97 4,512 425 0 202 1,040 6,179Joe Dudek, Plymouth St. ................................................. 1982-85 5,570 348 0 0 243 6,161Caleb Jennings, Emory & Henry .................................... 2007-10 3,705 488 0 1,111 838 6,142Scott Pingel, Westminster (MO) ..................................... 1996-99 5 *6,108 0 0 0 6,113Adam Henry, Carleton ....................................................... 1990-93 3,482 601 0 186 1,839 6,108Kenneth Sasu, Marietta ..................................................... 1997-00 4,727 217 0 0 1,139 6,083Brad Olson, Lawrence ........................................................ 1994-97 5,325 590 0 14 145 6,074*Record. $See initial page for explanation.
SEASON YARDSPlayer, Team Year Rush Rcv. Int. PR KOR Yds.Dan Pugh, Mount Union .................................................. †2002 2,300 382 0 0 507 3,189Nate Kmic, Mount Union .................................................. 2008 *2,790 262 0 0 66 3,118Dante Brown, Marietta ............................................................ †1996 2,385 174 0 46 368 2,973R.J. Bowers, Grove City ............................................................. †1998 2,283 51 0 4 538 2,876Nate Kmic, Mount Union ........................................................ 2006 2,365 173 0 0 333 2,871Blake Elliott, St. John’s (MN) ................................................... 2003 586 1,319 0 223 621 2,749Paul Smith, Gettysburg ........................................................... †1999 1,546 301 0 255 615 2,717Carey Bender, Coe ..................................................................... †1994 2,243 319 0 7 87 2,656Tony Sutton, Wooster ............................................................... †2004 2,240 49 0 0 345 2,634Fredrick Jackson, Coe ............................................................... 2002 1,702 234 0 260 346 2,542Justin Beaver, Wis.-Whitewater ............................................ 2007 2,455 12 0 0 0 2,467Blake Elliott, St. John’s (MN) ................................................... 2002 72 1,484 0 385 520 2,461Paul Smith, Gettysburg ........................................................... 1998 1,515 178 0 191 554 2,438Mark Robinson, St. John Fisher ............................................ 2004 2,194 232 0 0 0 2,426Justin Beaver, Wis.-Whitewater ............................................ 2005 2,420 0 0 0 0 2,420Theo Blanco, Wis.-Stevens Point .......................................... 1987 454 1,616 0 245 103 2,418Guy Leman, Simpson ............................................................... 1998 1,788 210 0 0 408 2,406Ricky Gales, Simpson ................................................................ 1989 2,035 102 0 0 248 2,385R.J. Bowers, Grove City ............................................................. 1999 2,098 34 0 0 240 2,372Alex McGrew, Loras ................................................................... 2008 1,592 82 0 262 428 2,364Paul Smith, Gettysburg ........................................................... †1997 1,256 102 0 199 805 2,362Gary Trettel, St. Thomas (MN) ............................................... 1989 1,502 337 0 0 496 2,335Fritz Waldvogel, St. Thomas (MN) ....................................... 2009 153 1,149 0 438 594 2,334Robert Heller, Waynesburg .................................................... 2007 2,176 151 0 0 5 2,332Gary Trettel, St. Thomas (MN) ............................................... 1990 1,620 388 0 0 319 2,327*Record. †National champion.
ANNUAL CHAMPIONSYear Player, Team Cl. Rush Rcv. Int. PR KOR Yds. Yd. PG1992 Kirk Matthieu, Maine Maritime ............................ Jr. 1,733 91 0 56 308 2,188 243.11993 Carey Bender, Coe ...................................................... Jr. 1,718 601 0 0 0 2,319 231.91994 Carey Bender, Coe ...................................................... Sr. 2,243 319 0 7 87 2,656 265.61995 Brad Olson, Lawrence .............................................. So. 1,760 279 0 0 0 2,039 226.61996 Dante Brown, Marietta ............................................ Jr. 2,385 174 0 46 368 2,973 *297.31997 Paul Smith, Gettysburg .......................................... So. 1,256 102 0 199 805 2,362 236.21998 R.J. Bowers, Grove City ............................................. So. 2,283 51 0 4 538 2,876 287.61999 Paul Smith, Gettysburg ............................................ Sr. 1,546 301 0 255 615 2,717 271.72000 Jamal Robertson, Ohio Northern ........................ Sr. 1,664 300 0 0 344 2,308 230.82001 Chris Sullivan, Wash. & Lee ..................................... Jr. 1,189 268 16 204 347 2,024 202.42002 Dan Pugh, Mount Union ......................................... Sr. 2,300 382 0 0 507 *3,189 227.82003 Tony Sutton, Wooster ............................................... Jr. 1,955 161 0 0 87 2,203 244.82004 Tony Sutton, Wooster ............................................... Sr. 2,240 49 0 0 345 2,634 219.52005 Lindy Crea, Hartwick ................................................. So. 1,115 581 0 0 583 2,279 227.92006 Lindy Crea, Hartwick ................................................. Jr. 1,087 716 0 0 348 2,151 215.12007 Tyler Sherden, Luther ............................................... Sr. 1,575 199 0 0 446 2,220 222.02008 Adam Anderson, Whitworth ................................. Jr. 1,259 290 0 0 645 2,194 243.82009 Dee Brizzolara, Chicago ........................................... Fr. -2 1,028 0 37 919 1,982 220.22010 Tyler Beiler, Bridgewater (VA) ................................ Sr. 49 1,342 0 228 429 2,048 204.8*Record.
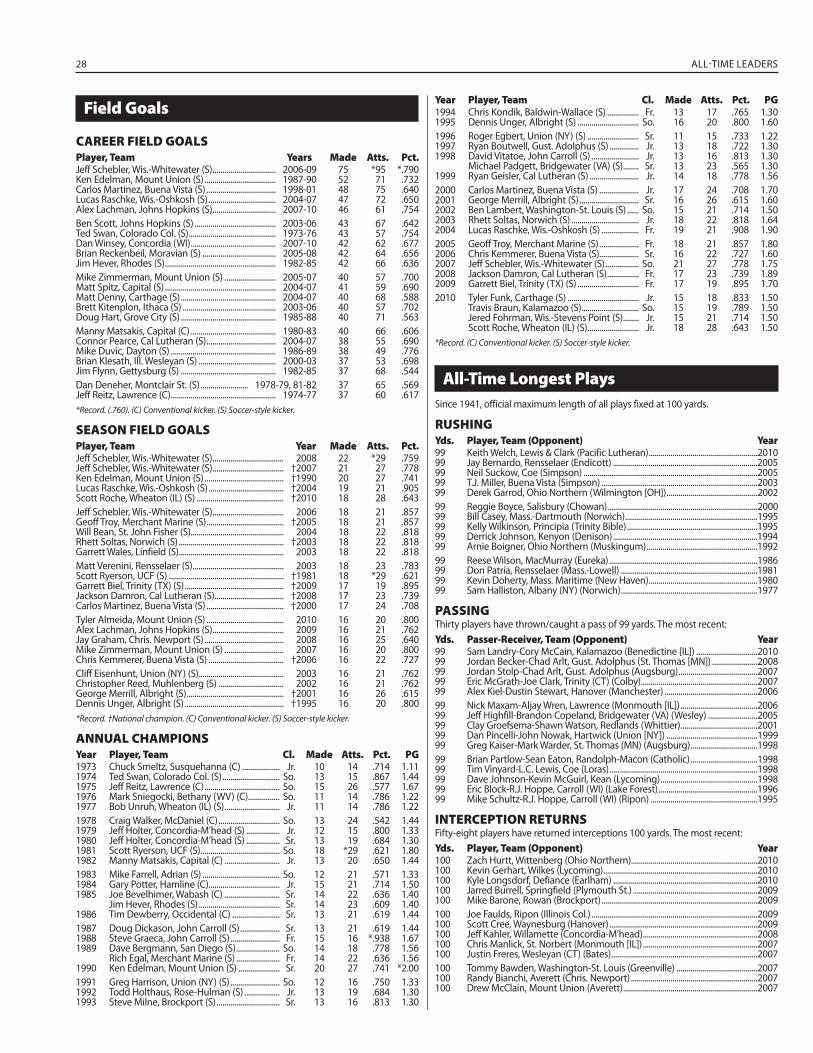
28 ALL-TIME LEADERS
Field Goals
CAREER FIELD GOALSPlayer, Team Years Made Atts. Pct.Jeff Schebler, Wis.-Whitewater (S) ................................ 2006-09 75 *95 *.790Ken Edelman, Mount Union (S) .................................... 1987-90 52 71 .732Carlos Martinez, Buena Vista (S) ................................... 1998-01 48 75 .640Lucas Raschke, Wis.-Oshkosh (S) .................................. 2004-07 47 72 .650Alex Lachman, Johns Hopkins (S) ................................ 2007-10 46 61 .754Ben Scott, Johns Hopkins (S) ......................................... 2003-06 43 67 .642Ted Swan, Colorado Col. (S) ............................................ 1973-76 43 57 .754Dan Winsey, Concordia (WI) ........................................... 2007-10 42 62 .677Brian Reckenbeil, Moravian (S) ..................................... 2005-08 42 64 .656Jim Hever, Rhodes (S) ........................................................ 1982-85 42 66 .636Mike Zimmerman, Mount Union (S) .......................... 2005-07 40 57 .700Matt Spitz, Capital (S) ........................................................ 2004-07 41 59 .690Matt Denny, Carthage (S) ................................................ 2004-07 40 68 .588Brett Kitenplon, Ithaca (S) ............................................... 2003-06 40 57 .702Doug Hart, Grove City (S) ................................................ 1985-88 40 71 .563Manny Matsakis, Capital (C) ........................................... 1980-83 40 66 .606Connor Pearce, Cal Lutheran (S) ................................... 2004-07 38 55 .690Mike Duvic, Dayton (S) ..................................................... 1986-89 38 49 .776Brian Klesath, Ill. Wesleyan (S) ....................................... 2000-03 37 53 .698Jim Flynn, Gettysburg (S) ................................................ 1982-85 37 68 .544Dan Deneher, Montclair St. (S) ........................ 1978-79, 81-82 37 65 .569Jeff Reitz, Lawrence (C) ..................................................... 1974-77 37 60 .617*Record. (.760). (C) Conventional kicker. (S) Soccer-style kicker.
SEASON FIELD GOALSPlayer, Team Year Made Atts. Pct.Jeff Schebler, Wis.-Whitewater (S) .................................... 2008 22 *29 .759Jeff Schebler, Wis.-Whitewater (S) .................................... †2007 21 27 .778Ken Edelman, Mount Union (S) ........................................ †1990 20 27 .741Lucas Raschke, Wis.-Oshkosh (S) ...................................... †2004 19 21 .905Scott Roche, Wheaton (IL) (S) ............................................ †2010 18 28 .643Jeff Schebler, Wis.-Whitewater (S) .................................... 2006 18 21 .857Geoff Troy, Merchant Marine (S) ....................................... †2005 18 21 .857Will Bean, St. John Fisher (S) ............................................... 2004 18 22 .818Rhett Soltas, Norwich (S) ..................................................... †2003 18 22 .818Garrett Wales, Linfield (S) ..................................................... 2003 18 22 .818Matt Verenini, Rensselaer (S) .............................................. 2003 18 23 .783Scott Ryerson, UCF (S) .......................................................... †1981 18 *29 .621Garrett Biel, Trinity (TX) (S) .................................................. †2009 17 19 .895Jackson Damron, Cal Lutheran (S) ................................... †2008 17 23 .739Carlos Martinez, Buena Vista (S) ....................................... †2000 17 24 .708Tyler Almeida, Mount Union (S) ....................................... 2010 16 20 .800Alex Lachman, Johns Hopkins (S) .................................... 2009 16 21 .762Jay Graham, Chris. Newport (S) ........................................ 2008 16 25 .640Mike Zimmerman, Mount Union (S) .............................. 2007 16 20 .800Chris Kemmerer, Buena Vista (S) ...................................... †2006 16 22 .727Cliff Eisenhunt, Union (NY) (S) ........................................... 2003 16 21 .762Christopher Reed, Muhlenberg (S) ................................. 2002 16 21 .762George Merrill, Albright (S) ................................................. †2001 16 26 .615Dennis Unger, Albright (S) .................................................. †1995 16 20 .800*Record. †National champion. (C) Conventional kicker. (S) Soccer-style kicker.
ANNUAL CHAMPIONSYear Player, Team Cl. Made Atts. Pct. PG1973 Chuck Smeltz, Susquehanna (C) ................... Jr. 10 14 .714 1.111974 Ted Swan, Colorado Col. (S) ............................. So. 13 15 .867 1.441975 Jeff Reitz, Lawrence (C) ...................................... So. 15 26 .577 1.671976 Mark Sniegocki, Bethany (WV) (C)................ So. 11 14 .786 1.221977 Bob Unruh, Wheaton (IL) (S) ............................ Jr. 11 14 .786 1.221978 Craig Walker, McDaniel (C) ............................... So. 13 24 .542 1.441979 Jeff Holter, Concordia-M’head (S) ................. Jr. 12 15 .800 1.331980 Jeff Holter, Concordia-M’head (S) ................. Sr. 13 19 .684 1.301981 Scott Ryerson, UCF (S) ........................................ So. 18 *29 .621 1.801982 Manny Matsakis, Capital (C) ............................ Jr. 13 20 .650 1.441983 Mike Farrell, Adrian (S) ....................................... So. 12 21 .571 1.331984 Gary Potter, Hamline (C).................................... Jr. 15 21 .714 1.501985 Joe Bevelhimer, Wabash (C) ............................ Sr. 14 22 .636 1.40 Jim Hever, Rhodes (S) ......................................... Sr. 14 23 .609 1.401986 Tim Dewberry, Occidental (C) ........................ Sr. 13 21 .619 1.441987 Doug Dickason, John Carroll (S) .................... Sr. 13 21 .619 1.441988 Steve Graeca, John Carroll (S) ......................... Fr. 15 16 *.938 1.671989 Dave Bergmann, San Diego (S) ...................... So. 14 18 .778 1.56 Rich Egal, Merchant Marine (S) ...................... Fr. 14 22 .636 1.561990 Ken Edelman, Mount Union (S) ..................... Sr. 20 27 .741 *2.001991 Greg Harrison, Union (NY) (S) ......................... So. 12 16 .750 1.331992 Todd Holthaus, Rose-Hulman (S) .................. Jr. 13 19 .684 1.301993 Steve Milne, Brockport (S) ................................ Sr. 13 16 .813 1.30
1994 Chris Kondik, Baldwin-Wallace (S) ................ Fr. 13 17 .765 1.301995 Dennis Unger, Albright (S) ............................... So. 16 20 .800 1.601996 Roger Egbert, Union (NY) (S) .......................... Sr. 11 15 .733 1.221997 Ryan Boutwell, Gust. Adolphus (S) ............... Jr. 13 18 .722 1.301998 David Vitatoe, John Carroll (S) ........................ Jr. 13 16 .813 1.30 Michael Padgett, Bridgewater (VA) (S) ........ Sr. 13 23 .565 1.301999 Ryan Geisler, Cal Lutheran (S) ......................... Jr. 14 18 .778 1.562000 Carlos Martinez, Buena Vista (S) .................... Jr. 17 24 .708 1.702001 George Merrill, Albright (S) .............................. Sr. 16 26 .615 1.602002 Ben Lambert, Washington-St. Louis (S) ...... So. 15 21 .714 1.502003 Rhett Soltas, Norwich (S) .................................. Jr. 18 22 .818 1.642004 Lucas Raschke, Wis.-Oshkosh (S) ................... Fr. 19 21 .908 1.902005 Geoff Troy, Merchant Marine (S) .................... Fr. 18 21 .857 1.802006 Chris Kemmerer, Buena Vista (S).................... Sr. 16 22 .727 1.602007 Jeff Schebler, Wis.-Whitewater (S) ................. So. 21 27 .778 1.752008 Jackson Damron, Cal Lutheran (S) ................ Fr. 17 23 .739 1.892009 Garrett Biel, Trinity (TX) (S) ............................... Fr. 17 19 .895 1.702010 Tyler Funk, Carthage (S) .................................... Jr. 15 18 .833 1.50 Travis Braun, Kalamazoo (S) ............................. So. 15 19 .789 1.50 Jered Fohrman, Wis.-Stevens Point (S) ........ Jr. 15 21 .714 1.50 Scott Roche, Wheaton (IL) (S) .......................... Jr. 18 28 .643 1.50*Record. (C) Conventional kicker. (S) Soccer-style kicker.
All-Time Longest PlaysSince 1941, official maximum length of all plays fixed at 100 yards.
RUSHINGYds. Player, Team (Opponent) Year99 Keith Welch, Lewis & Clark (Pacific Lutheran) .......................................................201099 Jay Bernardo, Rensselaer (Endicott) .........................................................................200599 Neil Suckow, Coe (Simpson) ........................................................................................200599 T.J. Miller, Buena Vista (Simpson) ...............................................................................200399 Derek Garrod, Ohio Northern (Wilmington [OH]) ..............................................200299 Reggie Boyce, Salisbury (Chowan) ............................................................................200099 Bill Casey, Mass.-Dartmouth (Norwich) ...................................................................199599 Kelly Wilkinson, Principia (Trinity Bible) ..................................................................199599 Derrick Johnson, Kenyon (Denison) .........................................................................199499 Arnie Boigner, Ohio Northern (Muskingum) ........................................................199299 Reese Wilson, MacMurray (Eureka) ...........................................................................198699 Don Patria, Rensselaer (Mass.-Lowell) .....................................................................198199 Kevin Doherty, Mass. Maritime (New Haven) .......................................................198099 Sam Halliston, Albany (NY) (Norwich) .....................................................................1977
PASSINGThirty players have thrown/caught a pass of 99 yards. The most recent:Yds. Passer-Receiver, Team (Opponent) Year99 Sam Landry-Cory McCain, Kalamazoo (Benedictine [IL]) ...............................201099 Jordan Becker-Chad Arlt, Gust. Adolphus (St. Thomas [MN]) .......................200899 Jordan Stolp-Chad Arlt, Gust. Adolphus (Augsburg) ........................................200799 Eric McGrath-Joe Clark, Trinity (CT) (Colby) ...........................................................200799 Alex Kiel-Dustin Stewart, Hanover (Manchester) ...............................................200699 Nick Maxam-Aljay Wren, Lawrence (Monmouth [IL]) .......................................200699 Jeff Highfill-Brandon Copeland, Bridgewater (VA) (Wesley) .........................200599 Clay Groefsema-Shawn Watson, Redlands (Whittier) .......................................200199 Dan Pincelli-John Nowak, Hartwick (Union [NY]) ..............................................199999 Greg Kaiser-Mark Warder, St. Thomas (MN) (Augsburg) ..................................199899 Brian Partlow-Sean Eaton, Randolph-Macon (Catholic) ..................................199899 Tim Vinyard-L.C. Lewis, Coe (Loras) ...........................................................................199899 Dave Johnson-Kevin McGuirl, Kean (Lycoming) .................................................199899 Eric Block-R.J. Hoppe, Carroll (WI) (Lake Forest) ..................................................199699 Mike Schultz-R.J. Hoppe, Carroll (WI) (Ripon) ......................................................1995
INTERCEPTION RETURNSFifty-eight players have returned interceptions 100 yards. The most recent:Yds. Player, Team (Opponent) Year100 Zach Hurtt, Wittenberg (Ohio Northern)................................................................2010100 Kevin Gerhart, Wilkes (Lycoming) ..............................................................................2010100 Kyle Longsdorf, Defiance (Earlham) .........................................................................2010100 Jarred Burrell, Springfield (Plymouth St.) ...............................................................2009100 Mike Barone, Rowan (Brockport) ...............................................................................2009100 Joe Faulds, Ripon (Illinois Col.) ....................................................................................2009100 Scott Cree, Waynesburg (Hanover) ...........................................................................2009100 Jeff Kahler, Willamette (Concordia-M’head) ..........................................................2008100 Chris Manlick, St. Norbert (Monmouth [IL]) ..........................................................2007100 Justin Freres, Wesleyan (CT) (Bates) ..........................................................................2007100 Tommy Bawden, Washington-St. Louis (Greenville) .........................................2007100 Randy Bianchi, Averett (Chris. Newport) ................................................................2007100 Drew McClain, Mount Union (Averett) ....................................................................2007
Year Player, Team Cl. Made Atts. Pct. PG
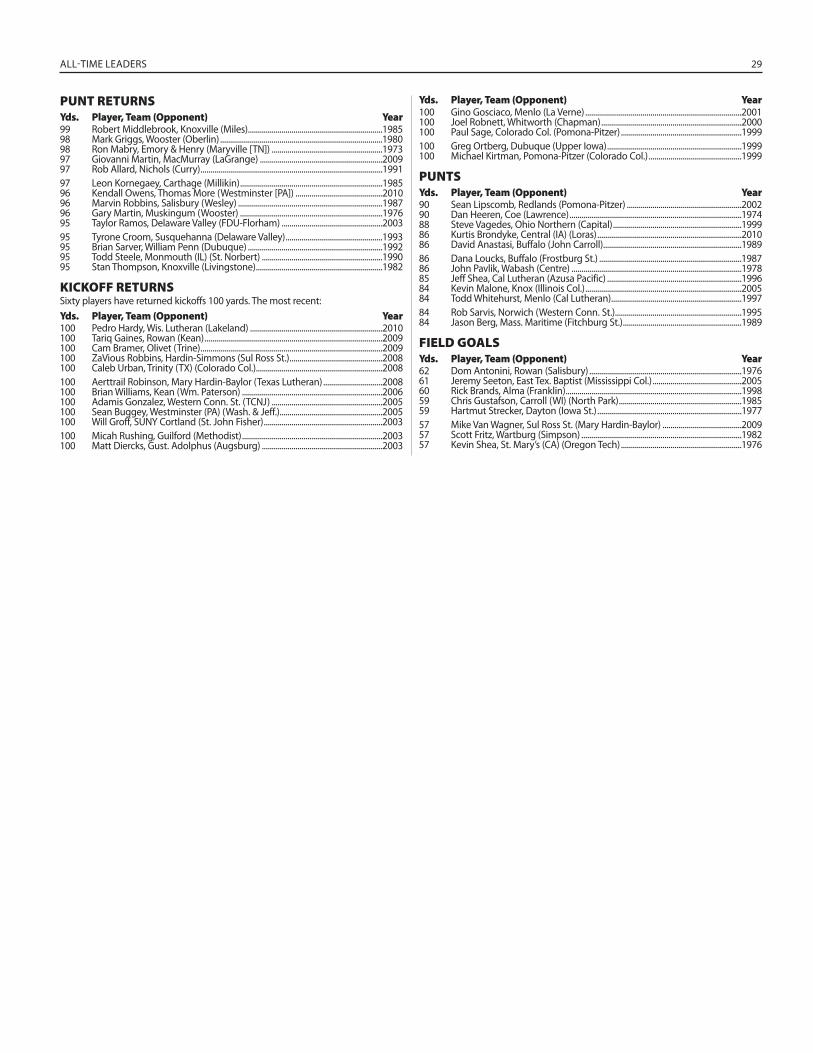
ALL-TIME LEADERS 29
PUNT RETURNSYds. Player, Team (Opponent) Year99 Robert Middlebrook, Knoxville (Miles) ....................................................................198598 Mark Griggs, Wooster (Oberlin) ..................................................................................198098 Ron Mabry, Emory & Henry (Maryville [TN]) ........................................................197397 Giovanni Martin, MacMurray (LaGrange) ..............................................................200997 Rob Allard, Nichols (Curry) ............................................................................................199197 Leon Kornegaey, Carthage (Millikin) ........................................................................198596 Kendall Owens, Thomas More (Westminster [PA]) ............................................201096 Marvin Robbins, Salisbury (Wesley) .........................................................................198796 Gary Martin, Muskingum (Wooster) ........................................................................197695 Taylor Ramos, Delaware Valley (FDU-Florham) ...................................................200395 Tyrone Croom, Susquehanna (Delaware Valley) .................................................199395 Brian Sarver, William Penn (Dubuque) ....................................................................199295 Todd Steele, Monmouth (IL) (St. Norbert) .............................................................199095 Stan Thompson, Knoxville (Livingstone) ................................................................1982
KICKOFF RETURNSSixty players have returned kickoffs 100 yards. The most recent:Yds. Player, Team (Opponent) Year100 Pedro Hardy, Wis. Lutheran (Lakeland) ...................................................................2010100 Tariq Gaines, Rowan (Kean) ..........................................................................................2009100 Cam Bramer, Olivet (Trine) ............................................................................................2009100 ZaVious Robbins, Hardin-Simmons (Sul Ross St.) ...............................................2008100 Caleb Urban, Trinity (TX) (Colorado Col.)................................................................2008100 Aerttrail Robinson, Mary Hardin-Baylor (Texas Lutheran) ..............................2008100 Brian Williams, Kean (Wm. Paterson) .......................................................................2006100 Adamis Gonzalez, Western Conn. St. (TCNJ) ........................................................2005100 Sean Buggey, Westminster (PA) (Wash. & Jeff.) ....................................................2005100 Will Groff, SUNY Cortland (St. John Fisher) ............................................................2003100 Micah Rushing, Guilford (Methodist) .......................................................................2003100 Matt Diercks, Gust. Adolphus (Augsburg) .............................................................2003
100 Gino Gosciaco, Menlo (La Verne) ...............................................................................2001100 Joel Robnett, Whitworth (Chapman) .......................................................................2000100 Paul Sage, Colorado Col. (Pomona-Pitzer) .............................................................1999100 Greg Ortberg, Dubuque (Upper Iowa) ....................................................................1999100 Michael Kirtman, Pomona-Pitzer (Colorado Col.) ...............................................1999
PUNTSYds. Player, Team (Opponent) Year90 Sean Lipscomb, Redlands (Pomona-Pitzer) ..........................................................200290 Dan Heeren, Coe (Lawrence) .......................................................................................197488 Steve Vagedes, Ohio Northern (Capital) .................................................................199986 Kurtis Brondyke, Central (IA) (Loras) .........................................................................201086 David Anastasi, Buffalo (John Carroll) ......................................................................198986 Dana Loucks, Buffalo (Frostburg St.) ........................................................................198786 John Pavlik, Wabash (Centre) ......................................................................................197885 Jeff Shea, Cal Lutheran (Azusa Pacific) ....................................................................199684 Kevin Malone, Knox (Illinois Col.) ...............................................................................200584 Todd Whitehurst, Menlo (Cal Lutheran) ..................................................................199784 Rob Sarvis, Norwich (Western Conn. St.)................................................................199584 Jason Berg, Mass. Maritime (Fitchburg St.) ............................................................1989
FIELD GOALSYds. Player, Team (Opponent) Year62 Dom Antonini, Rowan (Salisbury) .............................................................................197661 Jeremy Seeton, East Tex. Baptist (Mississippi Col.) .............................................200560 Rick Brands, Alma (Franklin) .........................................................................................199859 Chris Gustafson, Carroll (WI) (North Park) ..............................................................198559 Hartmut Strecker, Dayton (Iowa St.) .........................................................................197757 Mike Van Wagner, Sul Ross St. (Mary Hardin-Baylor) ........................................200957 Scott Fritz, Wartburg (Simpson) .................................................................................198257 Kevin Shea, St. Mary’s (CA) (Oregon Tech) .............................................................1976
Yds. Player, Team (Opponent) Year
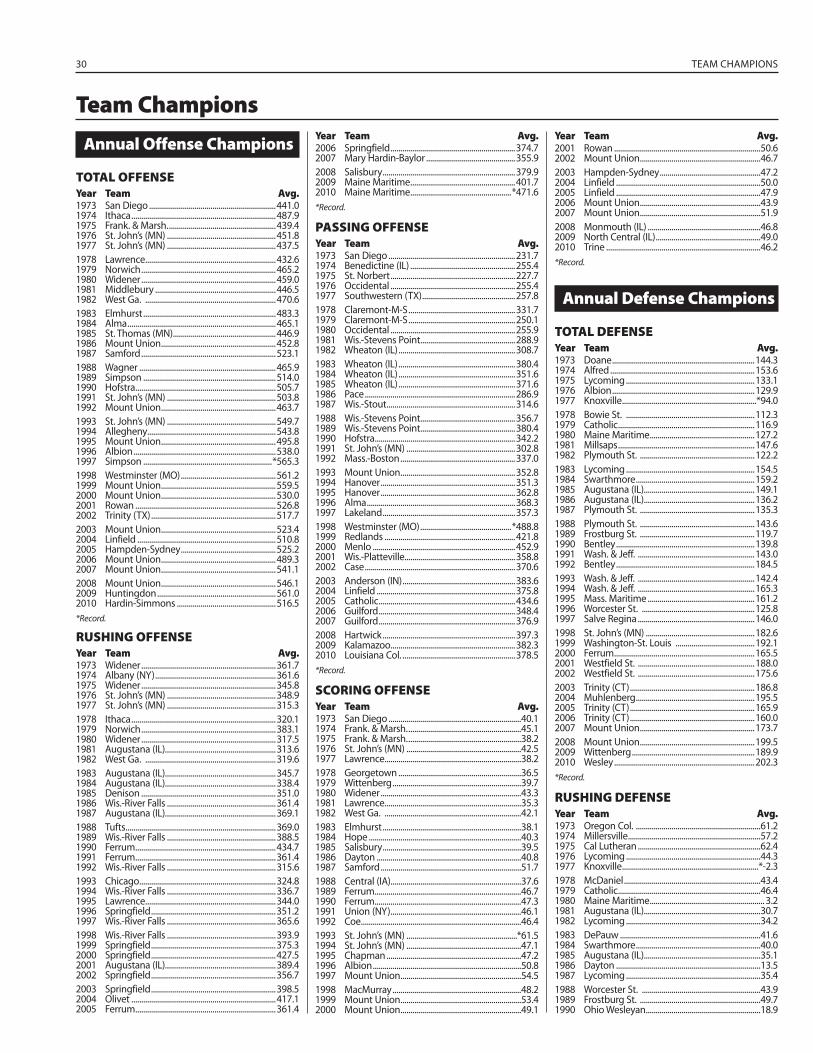
30 TEAM CHAMPIONS
Team ChampionsAnnual Offense Champions
TOTAL OFFENSEYear Team Avg.1973 San Diego ................................................................441.01974 Ithaca .........................................................................487.91975 Frank. & Marsh. ......................................................439.41976 St. John’s (MN) .......................................................451.81977 St. John’s (MN) .......................................................437.51978 Lawrence ..................................................................432.61979 Norwich ....................................................................465.21980 Widener ....................................................................459.01981 Middlebury .............................................................446.51982 West Ga. ..................................................................470.61983 Elmhurst ...................................................................483.31984 Alma ...........................................................................465.11985 St. Thomas (MN) ....................................................446.91986 Mount Union ..........................................................452.81987 Samford ....................................................................523.11988 Wagner .....................................................................465.91989 Simpson ...................................................................514.01990 Hofstra .......................................................................505.71991 St. John’s (MN) .......................................................503.81992 Mount Union ..........................................................463.71993 St. John’s (MN) .......................................................549.71994 Allegheny.................................................................543.81995 Mount Union ..........................................................495.81996 Albion ........................................................................538.01997 Simpson .................................................................*565.31998 Westminster (MO) ................................................561.21999 Mount Union ..........................................................559.52000 Mount Union ..........................................................530.02001 Rowan .......................................................................526.82002 Trinity (TX) ...............................................................517.72003 Mount Union ..........................................................523.42004 Linfield ......................................................................510.82005 Hampden-Sydney ................................................525.22006 Mount Union ..........................................................489.32007 Mount Union ..........................................................541.12008 Mount Union ..........................................................546.12009 Huntingdon ............................................................561.02010 Hardin-Simmons ..................................................516.5*Record.
RUSHING OFFENSEYear Team Avg.1973 Widener ....................................................................361.71974 Albany (NY) .............................................................361.61975 Widener ....................................................................345.81976 St. John’s (MN) .......................................................348.91977 St. John’s (MN) .......................................................315.31978 Ithaca .........................................................................320.11979 Norwich ....................................................................383.11980 Widener ....................................................................317.51981 Augustana (IL)........................................................313.61982 West Ga. ..................................................................319.61983 Augustana (IL)........................................................345.71984 Augustana (IL)........................................................338.41985 Denison ....................................................................351.01986 Wis.-River Falls .......................................................361.41987 Augustana (IL)........................................................369.11988 Tufts ............................................................................369.01989 Wis.-River Falls .......................................................388.51990 Ferrum .......................................................................434.71991 Ferrum .......................................................................361.41992 Wis.-River Falls .......................................................315.61993 Chicago .....................................................................324.81994 Wis.-River Falls .......................................................336.71995 Lawrence ..................................................................344.01996 Springfield ...............................................................351.21997 Wis.-River Falls .......................................................365.61998 Wis.-River Falls .......................................................393.91999 Springfield ...............................................................375.32000 Springfield ...............................................................427.52001 Augustana (IL)........................................................389.42002 Springfield ...............................................................356.72003 Springfield ...............................................................398.52004 Olivet .........................................................................417.12005 Ferrum .......................................................................361.4
Year Team Avg.2006 Springfield ...............................................................374.72007 Mary Hardin-Baylor .............................................355.92008 Salisbury ...................................................................379.92009 Maine Maritime .....................................................401.72010 Maine Maritime ...................................................*471.6*Record.
PASSING OFFENSEYear Team Avg.1973 San Diego ................................................................231.71974 Benedictine (IL) .....................................................255.41975 St. Norbert ...............................................................227.71976 Occidental ...............................................................255.41977 Southwestern (TX) ...............................................257.81978 Claremont-M-S ......................................................331.71979 Claremont-M-S ......................................................250.11980 Occidental ...............................................................255.91981 Wis.-Stevens Point................................................288.91982 Wheaton (IL) ...........................................................308.71983 Wheaton (IL) ...........................................................380.41984 Wheaton (IL) ...........................................................351.61985 Wheaton (IL) ...........................................................371.61986 Pace ............................................................................286.91987 Wis.-Stout .................................................................314.61988 Wis.-Stevens Point................................................356.71989 Wis.-Stevens Point................................................380.41990 Hofstra .......................................................................342.21991 St. John’s (MN) .......................................................302.81992 Mass.-Boston ..........................................................337.01993 Mount Union ..........................................................352.81994 Hanover ....................................................................351.31995 Hanover ....................................................................362.81996 Alma ...........................................................................368.31997 Lakeland ...................................................................357.31998 Westminster (MO) ..............................................*488.81999 Redlands ..................................................................421.82000 Menlo ........................................................................452.92001 Wis.-Platteville........................................................358.82002 Case ............................................................................370.62003 Anderson (IN) .........................................................383.62004 Linfield ......................................................................375.82005 Catholic .....................................................................434.62006 Guilford .....................................................................348.42007 Guilford .....................................................................376.92008 Hartwick ...................................................................397.32009 Kalamazoo...............................................................382.32010 Louisiana Col. .........................................................378.5*Record.
SCORING OFFENSEYear Team Avg.1973 San Diego ...................................................................40.11974 Frank. & Marsh. .........................................................45.11975 Frank. & Marsh. .........................................................38.21976 St. John’s (MN) ..........................................................42.51977 Lawrence .....................................................................38.21978 Georgetown ..............................................................36.51979 Wittenberg .................................................................39.71980 Widener .......................................................................43.31981 Lawrence .....................................................................35.31982 West Ga. .....................................................................42.11983 Elmhurst ......................................................................38.11984 Hope .............................................................................40.31985 Salisbury ......................................................................39.51986 Dayton .........................................................................40.81987 Samford .......................................................................51.71988 Central (IA) ..................................................................37.61989 Ferrum ..........................................................................46.71990 Ferrum ..........................................................................47.31991 Union (NY) ..................................................................46.11992 Coe .................................................................................46.41993 St. John’s (MN) ........................................................*61.51994 St. John’s (MN) ..........................................................47.11995 Chapman ....................................................................47.21996 Albion ...........................................................................50.81997 Mount Union .............................................................54.51998 MacMurray .................................................................48.21999 Mount Union .............................................................53.42000 Mount Union .............................................................49.1
2001 Rowan ..........................................................................50.62002 Mount Union .............................................................46.72003 Hampden-Sydney ...................................................47.22004 Linfield .........................................................................50.02005 Linfield .........................................................................47.92006 Mount Union .............................................................43.92007 Mount Union .............................................................51.92008 Monmouth (IL) .........................................................46.82009 North Central (IL) .....................................................49.02010 Trine ..............................................................................46.2*Record.
Annual Defense Champions
TOTAL DEFENSEYear Team Avg.1973 Doane ........................................................................144.31974 Alfred .........................................................................153.61975 Lycoming .................................................................133.11976 Albion ........................................................................129.91977 Knoxville ....................................................................*94.01978 Bowie St. .................................................................112.31979 Catholic .....................................................................116.91980 Maine Maritime .....................................................127.21981 Millsaps .....................................................................147.61982 Plymouth St. ..........................................................122.21983 Lycoming .................................................................154.51984 Swarthmore ............................................................159.21985 Augustana (IL)........................................................149.11986 Augustana (IL)........................................................136.21987 Plymouth St. ..........................................................135.31988 Plymouth St. ..........................................................143.61989 Frostburg St. ..........................................................119.71990 Bentley ......................................................................139.81991 Wash. & Jeff. ...........................................................143.01992 Bentley ......................................................................184.51993 Wash. & Jeff. ...........................................................142.41994 Wash. & Jeff. ...........................................................165.31995 Mass. Maritime ......................................................161.21996 Worcester St. .........................................................125.81997 Salve Regina ...........................................................146.01998 St. John’s (MN) .......................................................182.61999 Washington-St. Louis ........................................192.12000 Ferrum .......................................................................165.52001 Westfield St. ...........................................................188.02002 Westfield St. ...........................................................175.62003 Trinity (CT) ...............................................................186.82004 Muhlenberg ............................................................195.52005 Trinity (CT) ...............................................................165.92006 Trinity (CT) ...............................................................160.02007 Mount Union ..........................................................173.72008 Mount Union ..........................................................199.52009 Wittenberg ..............................................................189.92010 Wesley .......................................................................202.3*Record.
RUSHING DEFENSEYear Team Avg.1973 Oregon Col. ...............................................................61.21974 Millersville ...................................................................57.21975 Cal Lutheran ..............................................................62.41976 Lycoming ....................................................................44.31977 Knoxville .....................................................................*-2.31978 McDaniel .....................................................................43.41979 Catholic ........................................................................46.41980 Maine Maritime .......................................................... 3.21981 Augustana (IL)...........................................................30.71982 Lycoming ....................................................................34.21983 DePauw .......................................................................41.61984 Swarthmore ...............................................................40.01985 Augustana (IL)...........................................................35.11986 Dayton .........................................................................13.51987 Lycoming ....................................................................35.41988 Worcester St. ............................................................43.91989 Frostburg St. .............................................................49.71990 Ohio Wesleyan ..........................................................18.9
Year Team Avg.
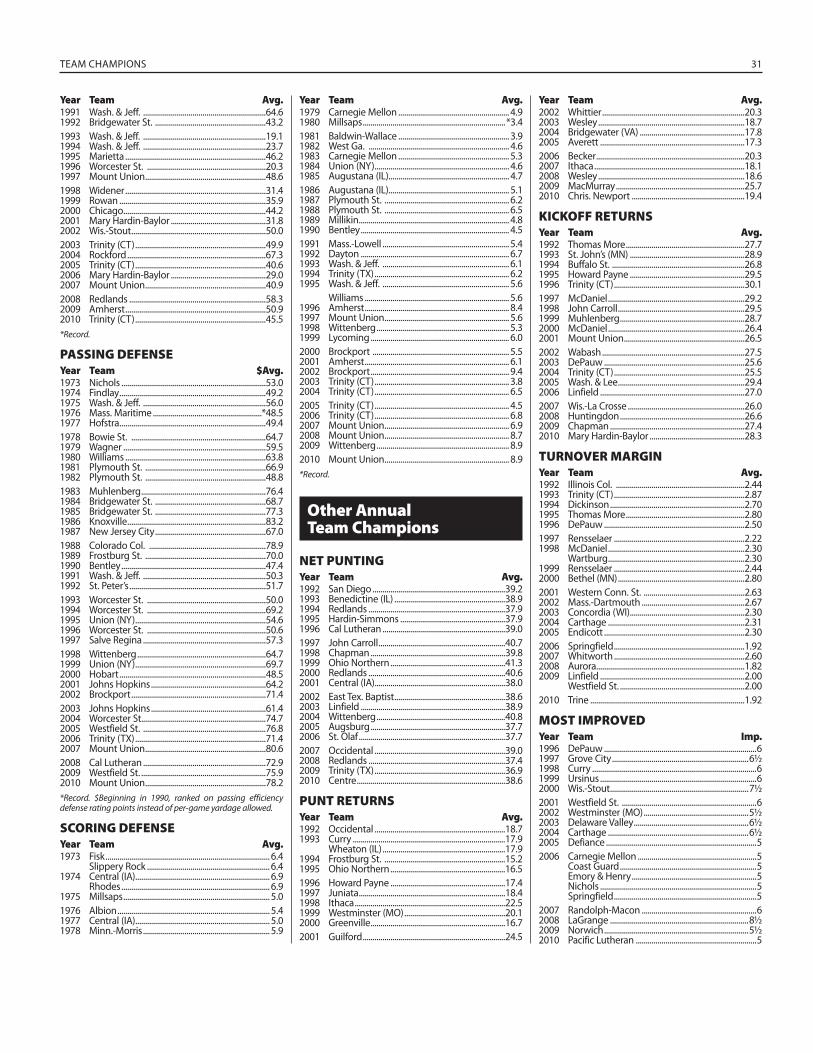
TEAM CHAMPIONS 31
1991 Wash. & Jeff. ..............................................................64.61992 Bridgewater St. ........................................................43.21993 Wash. & Jeff. ..............................................................19.11994 Wash. & Jeff. ..............................................................23.71995 Marietta .......................................................................46.21996 Worcester St. ............................................................20.31997 Mount Union .............................................................48.61998 Widener .......................................................................31.41999 Rowan ..........................................................................35.92000 Chicago ........................................................................44.22001 Mary Hardin-Baylor ................................................31.82002 Wis.-Stout ....................................................................50.02003 Trinity (CT) ..................................................................49.92004 Rockford ......................................................................67.32005 Trinity (CT) ..................................................................40.62006 Mary Hardin-Baylor ................................................29.02007 Mount Union .............................................................40.92008 Redlands .....................................................................58.32009 Amherst .......................................................................50.92010 Trinity (CT) ..................................................................45.5*Record.
PASSING DEFENSEYear Team $Avg.1973 Nichols .........................................................................53.01974 Findlay ..........................................................................49.21975 Wash. & Jeff. ..............................................................56.01976 Mass. Maritime .......................................................*48.51977 Hofstra ..........................................................................49.41978 Bowie St. ....................................................................64.71979 Wagner ........................................................................59.51980 Williams .......................................................................63.81981 Plymouth St. .............................................................66.91982 Plymouth St. .............................................................48.81983 Muhlenberg ...............................................................76.41984 Bridgewater St. ........................................................68.71985 Bridgewater St. ........................................................77.31986 Knoxville ......................................................................83.21987 New Jersey City ........................................................67.01988 Colorado Col. ...........................................................78.91989 Frostburg St. .............................................................70.01990 Bentley .........................................................................47.41991 Wash. & Jeff. ..............................................................50.31992 St. Peter’s .....................................................................51.71993 Worcester St. ............................................................50.01994 Worcester St. ............................................................69.21995 Union (NY) ..................................................................54.61996 Worcester St. ............................................................50.61997 Salve Regina ..............................................................57.31998 Wittenberg .................................................................64.71999 Union (NY) ..................................................................69.72000 Hobart ..........................................................................48.52001 Johns Hopkins ..........................................................64.22002 Brockport ....................................................................71.42003 Johns Hopkins ..........................................................61.42004 Worcester St...............................................................74.72005 Westfield St. ..............................................................76.82006 Trinity (TX) ..................................................................71.42007 Mount Union .............................................................80.62008 Cal Lutheran ..............................................................72.92009 Westfield St. ...............................................................75.92010 Mount Union .............................................................78.2*Record. $Beginning in 1990, ranked on passing efficiency defense rating points instead of per-game yardage allowed.
SCORING DEFENSEYear Team Avg.1973 Fisk ................................................................................... 6.4 Slippery Rock .............................................................. 6.41974 Central (IA) .................................................................... 6.9 Rhodes ........................................................................... 6.91975 Millsaps .......................................................................... 5.01976 Albion ............................................................................. 5.41977 Central (IA) .................................................................... 5.01978 Minn.-Morris ................................................................ 5.9
1979 Carnegie Mellon ........................................................ 4.91980 Millsaps ........................................................................*3.41981 Baldwin-Wallace ........................................................ 3.91982 West Ga. ....................................................................... 4.61983 Carnegie Mellon ........................................................ 5.31984 Union (NY) .................................................................... 4.61985 Augustana (IL)............................................................. 4.71986 Augustana (IL)............................................................. 5.11987 Plymouth St. ............................................................... 6.21988 Plymouth St. ............................................................... 6.51989 Millikin ............................................................................ 4.81990 Bentley ........................................................................... 4.51991 Mass.-Lowell ................................................................ 5.41992 Dayton ........................................................................... 6.71993 Wash. & Jeff. ................................................................ 6.11994 Trinity (TX) .................................................................... 6.21995 Wash. & Jeff. ................................................................ 5.6 Williams ......................................................................... 5.61996 Amherst ......................................................................... 8.41997 Mount Union ............................................................... 5.61998 Wittenberg ................................................................... 5.31999 Lycoming ...................................................................... 6.02000 Brockport ..................................................................... 5.52001 Amherst ......................................................................... 6.12002 Brockport ...................................................................... 9.42003 Trinity (CT) .................................................................... 3.82004 Trinity (CT) .................................................................... 6.52005 Trinity (CT) .................................................................... 4.52006 Trinity (CT) .................................................................... 6.82007 Mount Union ............................................................... 6.92008 Mount Union ............................................................... 8.72009 Wittenberg ................................................................... 8.92010 Mount Union ............................................................... 8.9*Record.
Other AnnualTeam Champions
NET PUNTINGYear Team Avg.1992 San Diego ...................................................................39.21993 Benedictine (IL) ........................................................38.91994 Redlands .....................................................................37.91995 Hardin-Simmons .....................................................37.91996 Cal Lutheran ..............................................................39.01997 John Carroll ................................................................40.71998 Chapman ....................................................................39.81999 Ohio Northern ..........................................................41.32000 Redlands .....................................................................40.62001 Central (IA) ..................................................................38.02002 East Tex. Baptist ........................................................38.62003 Linfield .........................................................................38.92004 Wittenberg .................................................................40.82005 Augsburg ....................................................................37.72006 St. Olaf ..........................................................................37.72007 Occidental ..................................................................39.02008 Redlands .....................................................................37.42009 Trinity (TX) ..................................................................36.92010 Centre ...........................................................................38.6
PUNT RETURNSYear Team Avg.1992 Occidental ..................................................................18.71993 Curry .............................................................................17.9 Wheaton (IL) ..............................................................17.91994 Frostburg St. .............................................................15.21995 Ohio Northern ..........................................................16.51996 Howard Payne ..........................................................17.41997 Juniata ..........................................................................18.41998 Ithaca ............................................................................22.51999 Westminster (MO) ...................................................20.12000 Greenville ....................................................................16.72001 Guilford ........................................................................24.5
2002 Whittier ........................................................................20.32003 Wesley ..........................................................................18.72004 Bridgewater (VA) .....................................................17.82005 Averett .........................................................................17.32006 Becker ...........................................................................20.32007 Ithaca ............................................................................18.12008 Wesley ..........................................................................18.62009 MacMurray .................................................................25.72010 Chris. Newport .........................................................19.4
KICKOFF RETURNSYear Team Avg.1992 Thomas More ............................................................27.71993 St. John’s (MN) ..........................................................28.91994 Buffalo St. ...................................................................26.81995 Howard Payne ..........................................................29.51996 Trinity (CT) ..................................................................30.11997 McDaniel .....................................................................29.21998 John Carroll ................................................................29.51999 Muhlenberg ...............................................................28.72000 McDaniel .....................................................................26.42001 Mount Union .............................................................26.52002 Wabash ........................................................................27.52003 DePauw .......................................................................25.62004 Trinity (CT) ..................................................................25.52005 Wash. & Lee ................................................................29.42006 Linfield .........................................................................27.02007 Wis.-La Crosse ...........................................................26.02008 Huntingdon ...............................................................26.62009 Chapman ....................................................................27.42010 Mary Hardin-Baylor ................................................28.3
TURNOVER MARGINYear Team Avg.1992 Illinois Col. .................................................................2.441993 Trinity (CT) ..................................................................2.871994 Dickinson ....................................................................2.701995 Thomas More ............................................................2.801996 DePauw .......................................................................2.501997 Rensselaer ..................................................................2.221998 McDaniel .....................................................................2.30 Wartburg .....................................................................2.301999 Rensselaer ..................................................................2.442000 Bethel (MN) ................................................................2.802001 Western Conn. St. ...................................................2.632002 Mass.-Dartmouth ....................................................2.672003 Concordia (WI) ..........................................................2.302004 Carthage .....................................................................2.312005 Endicott .......................................................................2.302006 Springfield ..................................................................1.922007 Whitworth ..................................................................2.602008 Aurora...........................................................................1.822009 Linfield .........................................................................2.00 Westfield St. ...............................................................2.002010 Trine ..............................................................................1.92
MOST IMPROVEDYear Team Imp.1996 DePauw .............................................................................61997 Grove City .....................................................................6½1998 Curry ...................................................................................61999 Ursinus ...............................................................................62000 Wis.-Stout ......................................................................7½2001 Westfield St. ....................................................................62002 Westminster (MO) .....................................................5½2003 Delaware Valley ..........................................................6½2004 Carthage .......................................................................6½2005 Defiance ............................................................................52006 Carnegie Mellon ............................................................5 Coast Guard .....................................................................5 Emory & Henry ...............................................................5 Nichols ...............................................................................5 Springfield ........................................................................52007 Randolph-Macon ..........................................................62008 LaGrange ......................................................................8½2009 Norwich .........................................................................5½2010 Pacific Lutheran .............................................................5
Year Team Avg. Year Team Avg.Year Team Avg.
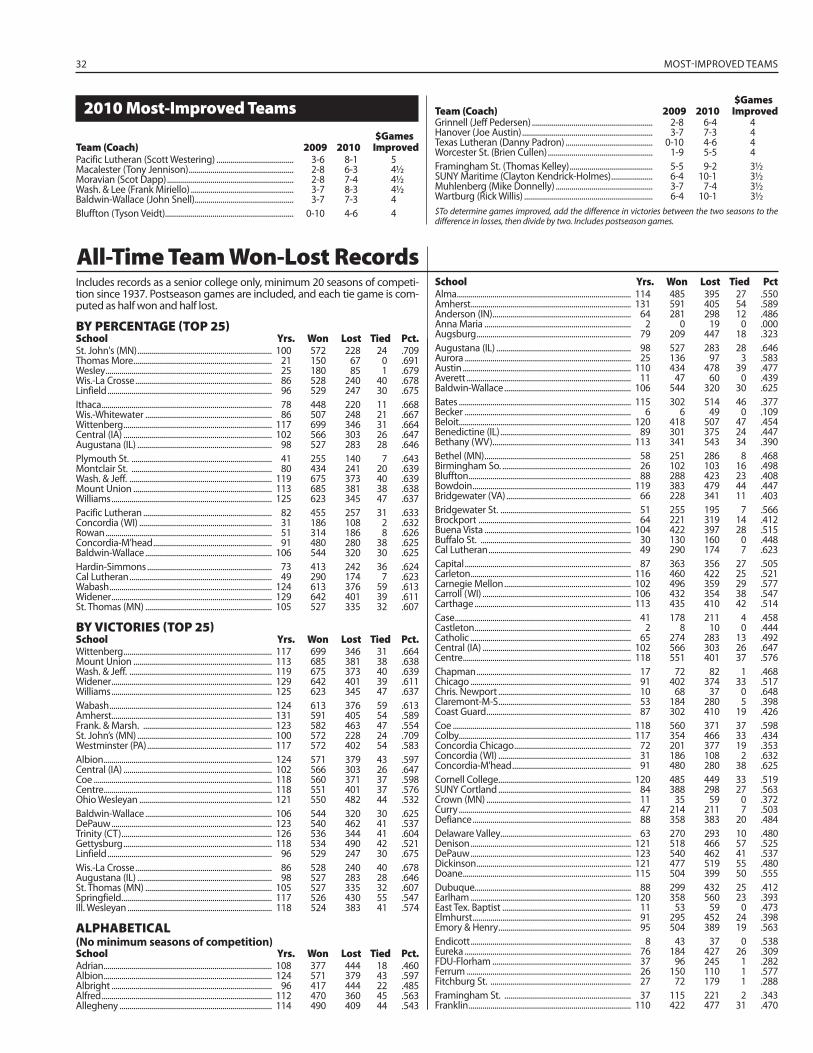
32 MOST-IMPROVED TEAMS
2010 Most-Improved Teams$Games
Team (Coach) 2009 2010 ImprovedPacific Lutheran (Scott Westering) ....................................... 3-6 8-1 5Macalester (Tony Jennison) ..................................................... 2-8 6-3 4½Moravian (Scot Dapp) ................................................................ 2-8 7-4 4½Wash. & Lee (Frank Miriello) .................................................... 3-7 8-3 4½Baldwin-Wallace (John Snell) .................................................. 3-7 7-3 4Bluffton (Tyson Veidt)................................................................. 0-10 4-6 4
Grinnell (Jeff Pedersen) ............................................................. 2-8 6-4 4Hanover (Joe Austin) .................................................................. 3-7 7-3 4Texas Lutheran (Danny Padron) ............................................ 0-10 4-6 4Worcester St. (Brien Cullen) ..................................................... 1-9 5-5 4Framingham St. (Thomas Kelley) .......................................... 5-5 9-2 3½SUNY Maritime (Clayton Kendrick-Holmes) ..................... 6-4 10-1 3½Muhlenberg (Mike Donnelly) ................................................. 3-7 7-4 3½Wartburg (Rick Willis) ................................................................. 6-4 10-1 3½$To determine games improved, add the difference in victories between the two seasons to the difference in losses, then divide by two. Includes postseason games.
$GamesTeam (Coach) 2009 2010 Improved
All-Time Team Won-Lost Record sIncludes records as a senior college only, minimum 20 seasons of competi-tion since 1937. Postseason games are included, and each tie game is com-puted as half won and half lost.
BY PERCENTAGE (TOP 25)School Yrs. Won Lost Tied Pct.St. John's (MN) .................................................................... 100 572 228 24 .709Thomas More ...................................................................... 21 150 67 0 .691Wesley .................................................................................... 25 180 85 1 .679Wis.-La Crosse ..................................................................... 86 528 240 40 .678Linfield ................................................................................... 96 529 247 30 .675Ithaca ...................................................................................... 78 448 220 11 .668Wis.-Whitewater ................................................................ 86 507 248 21 .667Wittenberg ........................................................................... 117 699 346 31 .664Central (IA) ........................................................................... 102 566 303 26 .647Augustana (IL) .................................................................... 98 527 283 28 .646Plymouth St. ....................................................................... 41 255 140 7 .643Montclair St. ....................................................................... 80 434 241 20 .639Wash. & Jeff. ........................................................................ 119 675 373 40 .639Mount Union ...................................................................... 113 685 381 38 .638Williams ................................................................................. 125 623 345 47 .637Pacific Lutheran ................................................................. 82 455 257 31 .633Concordia (WI) ................................................................... 31 186 108 2 .632Rowan .................................................................................... 51 314 186 8 .626Concordia-M’head ............................................................ 91 480 280 38 .625Baldwin-Wallace ................................................................ 106 544 320 30 .625Hardin-Simmons ............................................................... 73 413 242 36 .624Cal Lutheran ........................................................................ 49 290 174 7 .623Wabash .................................................................................. 124 613 376 59 .613Widener ................................................................................. 129 642 401 39 .611St. Thomas (MN) ................................................................ 105 527 335 32 .607
BY VICTORIES (TOP 25)School Yrs. Won Lost Tied Pct.Wittenberg ........................................................................... 117 699 346 31 .664Mount Union ...................................................................... 113 685 381 38 .638Wash. & Jeff. ........................................................................ 119 675 373 40 .639Widener ................................................................................. 129 642 401 39 .611Williams ................................................................................. 125 623 345 47 .637Wabash .................................................................................. 124 613 376 59 .613Amherst ................................................................................. 131 591 405 54 .589Frank. & Marsh. ................................................................. 123 582 463 47 .554St. John’s (MN) .................................................................... 100 572 228 24 .709Westminster (PA) ............................................................... 117 572 402 54 .583Albion ..................................................................................... 124 571 379 43 .597Central (IA) ........................................................................... 102 566 303 26 .647Coe .......................................................................................... 118 560 371 37 .598Centre ..................................................................................... 118 551 401 37 .576Ohio Wesleyan ................................................................... 121 550 482 44 .532Baldwin-Wallace ................................................................ 106 544 320 30 .625DePauw ................................................................................. 123 540 462 41 .537Trinity (CT) ............................................................................ 126 536 344 41 .604Gettysburg ........................................................................... 118 534 490 42 .521Linfield ................................................................................... 96 529 247 30 .675Wis.-La Crosse ..................................................................... 86 528 240 40 .678Augustana (IL) .................................................................... 98 527 283 28 .646St. Thomas (MN) ................................................................ 105 527 335 32 .607Springfield ............................................................................ 117 526 430 55 .547Ill. Wesleyan ......................................................................... 118 524 383 41 .574
ALPHABETICAL(No minimum seasons of competition)School Yrs. Won Lost Tied Pct.Adrian ..................................................................................... 108 377 444 18 .460Albion ..................................................................................... 124 571 379 43 .597Albright ................................................................................. 96 417 444 22 .485Alfred ...................................................................................... 112 470 360 45 .563Allegheny ............................................................................. 114 490 409 44 .543
Alma ........................................................................................ 114 485 395 27 .550Amherst ................................................................................. 131 591 405 54 .589Anderson (IN) ...................................................................... 64 281 298 12 .486Anna Maria .......................................................................... 2 0 19 0 .000Augsburg .............................................................................. 79 209 447 18 .323Augustana (IL) .................................................................... 98 527 283 28 .646Aurora .................................................................................... 25 136 97 3 .583Austin ..................................................................................... 110 434 478 39 .477Averett ................................................................................... 11 47 60 0 .439Baldwin-Wallace ................................................................ 106 544 320 30 .625Bates ....................................................................................... 115 302 514 46 .377Becker .................................................................................... 6 6 49 0 .109Beloit....................................................................................... 120 418 507 47 .454Benedictine (IL) .................................................................. 89 301 375 24 .447Bethany (WV)...................................................................... 113 341 543 34 .390Bethel (MN) .......................................................................... 58 251 286 8 .468Birmingham So. ................................................................. 26 102 103 16 .498Bluffton .................................................................................. 88 288 423 23 .408Bowdoin ................................................................................ 119 383 479 44 .447Bridgewater (VA) ............................................................... 66 228 341 11 .403Bridgewater St. .................................................................. 51 255 195 7 .566Brockport ............................................................................. 64 221 319 14 .412Buena Vista .......................................................................... 104 422 397 28 .515Buffalo St. ............................................................................ 30 130 160 0 .448Cal Lutheran ........................................................................ 49 290 174 7 .623Capital .................................................................................... 87 363 356 27 .505Carleton ................................................................................. 116 460 422 25 .521Carnegie Mellon ................................................................ 102 496 359 29 .577Carroll (WI) ........................................................................... 106 432 354 38 .547Carthage ............................................................................... 113 435 410 42 .514Case ......................................................................................... 41 178 211 4 .458Castleton ............................................................................... 2 8 10 0 .444Catholic ................................................................................. 65 274 283 13 .492Central (IA) ........................................................................... 102 566 303 26 .647Centre ..................................................................................... 118 551 401 37 .576Chapman .............................................................................. 17 72 82 1 .468Chicago ................................................................................. 91 402 374 33 .517Chris. Newport ................................................................... 10 68 37 0 .648Claremont-M-S ................................................................... 53 184 280 5 .398Coast Guard ......................................................................... 87 302 410 19 .426Coe .......................................................................................... 118 560 371 37 .598Colby....................................................................................... 117 354 466 33 .434Concordia Chicago ........................................................... 72 201 377 19 .353Concordia (WI) ................................................................... 31 186 108 2 .632Concordia-M'head ............................................................ 91 480 280 38 .625Cornell College ................................................................... 120 485 449 33 .519SUNY Cortland ................................................................... 84 388 298 27 .563Crown (MN) ......................................................................... 11 35 59 0 .372Curry ....................................................................................... 47 214 211 7 .503Defiance ................................................................................ 88 358 383 20 .484Delaware Valley.................................................................. 63 270 293 10 .480Denison ................................................................................. 121 518 466 57 .525DePauw ................................................................................. 123 540 462 41 .537Dickinson .............................................................................. 121 477 519 55 .480Doane ..................................................................................... 115 504 399 50 .555Dubuque............................................................................... 88 299 432 25 .412Earlham ................................................................................. 120 358 560 23 .393East Tex. Baptist ................................................................. 11 53 59 0 .473Elmhurst ................................................................................ 91 295 452 24 .398Emory & Henry ................................................................... 95 504 389 19 .563Endicott ................................................................................. 8 43 37 0 .538Eureka .................................................................................... 76 184 427 26 .309FDU-Florham ...................................................................... 37 96 245 1 .282Ferrum ................................................................................... 26 150 110 1 .577Fitchburg St. ....................................................................... 27 72 179 1 .288Framingham St. ................................................................ 37 115 221 2 .343Franklin .................................................................................. 110 422 477 31 .470
School Yrs. Won Lost Tied Pct
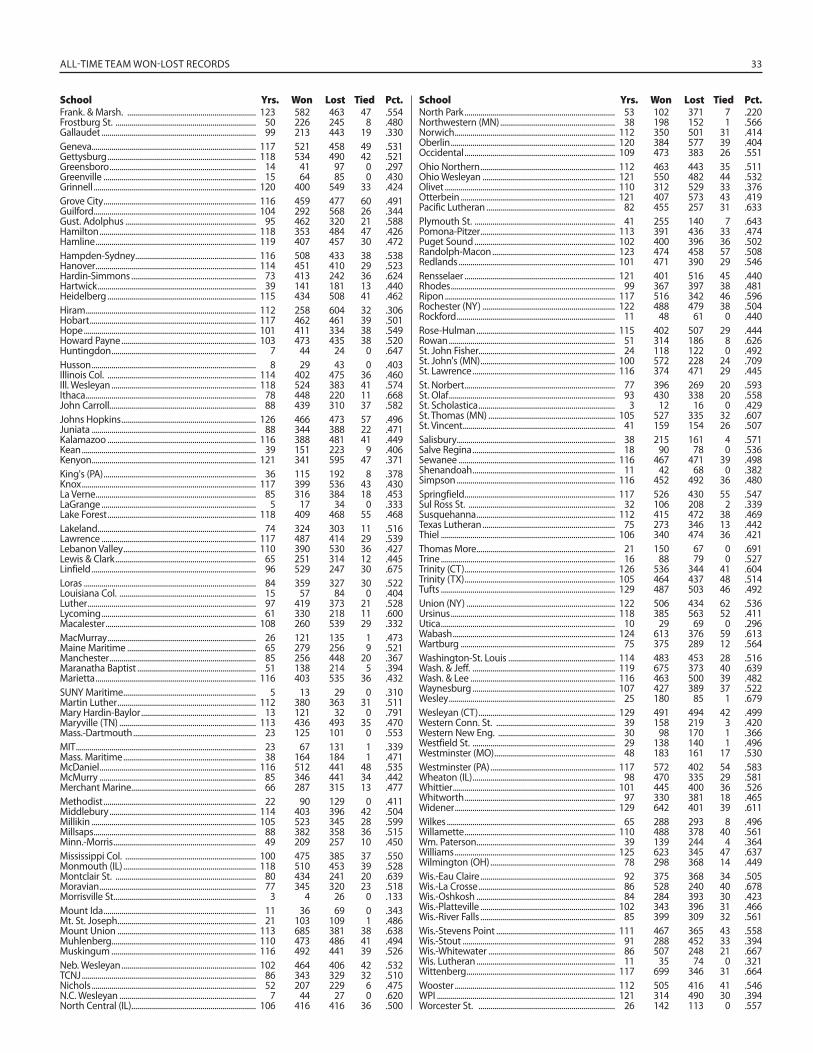
ALL-TIME TEAM WON-LOST RECORDS 33
Frank. & Marsh. ................................................................. 123 582 463 47 .554Frostburg St. ....................................................................... 50 226 245 8 .480Gallaudet .............................................................................. 99 213 443 19 .330Geneva................................................................................... 117 521 458 49 .531Gettysburg ........................................................................... 118 534 490 42 .521Greensboro .......................................................................... 14 41 97 0 .297Greenville ............................................................................. 15 64 85 0 .430Grinnell .................................................................................. 120 400 549 33 .424Grove City ............................................................................. 116 459 477 60 .491Guilford .................................................................................. 104 292 568 26 .344Gust. Adolphus .................................................................. 95 462 320 21 .588Hamilton ............................................................................... 118 353 484 47 .426Hamline ................................................................................. 119 407 457 30 .472Hampden-Sydney ............................................................. 116 508 433 38 .538Hanover ................................................................................. 114 451 410 29 .523Hardin-Simmons ............................................................... 73 413 242 36 .624Hartwick ................................................................................ 39 141 181 13 .440Heidelberg ........................................................................... 115 434 508 41 .462Hiram ...................................................................................... 112 258 604 32 .306Hobart .................................................................................... 117 462 461 39 .501Hope ....................................................................................... 101 411 334 38 .549Howard Payne .................................................................... 103 473 435 38 .520Huntingdon ......................................................................... 7 44 24 0 .647Husson ................................................................................... 8 29 43 0 .403Illinois Col. ........................................................................... 114 402 475 36 .460Ill. Wesleyan ......................................................................... 118 524 383 41 .574Ithaca ...................................................................................... 78 448 220 11 .668John Carroll.......................................................................... 88 439 310 37 .582Johns Hopkins .................................................................... 126 466 473 57 .496Juniata ................................................................................... 88 344 388 22 .471Kalamazoo ........................................................................... 116 388 481 41 .449Kean ........................................................................................ 39 151 223 9 .406Kenyon ................................................................................... 121 341 595 47 .371King's (PA) ............................................................................. 36 115 192 8 .378Knox ........................................................................................ 117 399 536 43 .430La Verne ................................................................................. 85 316 384 18 .453LaGrange .............................................................................. 5 17 34 0 .333Lake Forest ........................................................................... 118 409 468 55 .468Lakeland ................................................................................ 74 324 303 11 .516Lawrence .............................................................................. 117 487 414 29 .539Lebanon Valley ................................................................... 110 390 530 36 .427Lewis & Clark ....................................................................... 65 251 314 12 .445Linfield ................................................................................... 96 529 247 30 .675Loras ....................................................................................... 84 359 327 30 .522Louisiana Col. ..................................................................... 15 57 84 0 .404Luther ..................................................................................... 97 419 373 21 .528Lycoming .............................................................................. 61 330 218 11 .600Macalester ............................................................................ 108 260 539 29 .332MacMurray ........................................................................... 26 121 135 1 .473Maine Maritime ................................................................. 65 279 256 9 .521Manchester .......................................................................... 85 256 448 20 .367Maranatha Baptist ............................................................ 51 138 214 5 .394Marietta ................................................................................. 116 403 535 36 .432SUNY Maritime ................................................................... 5 13 29 0 .310Martin Luther ...................................................................... 112 380 363 31 .511Mary Hardin-Baylor .......................................................... 13 121 32 0 .791Maryville (TN) ..................................................................... 113 436 493 35 .470Mass.-Dartmouth .............................................................. 23 125 101 0 .553MIT ........................................................................................... 23 67 131 1 .339Mass. Maritime ................................................................... 38 164 184 1 .471McDaniel ............................................................................... 116 512 441 48 .535McMurry ............................................................................... 85 346 441 34 .442Merchant Marine............................................................... 66 287 315 13 .477Methodist ............................................................................. 22 90 129 0 .411Middlebury .......................................................................... 114 403 396 42 .504Millikin ................................................................................... 105 523 345 28 .599Millsaps .................................................................................. 88 382 358 36 .515Minn.-Morris ........................................................................ 49 209 257 10 .450Mississippi Col. .................................................................. 100 475 385 37 .550Monmouth (IL) ................................................................... 118 510 453 39 .528Montclair St. ....................................................................... 80 434 241 20 .639Moravian ............................................................................... 77 345 320 23 .518Morrisville St. ....................................................................... 3 4 26 0 .133Mount Ida ............................................................................. 11 36 69 0 .343Mt. St. Joseph ...................................................................... 21 103 109 1 .486Mount Union ...................................................................... 113 685 381 38 .638Muhlenberg......................................................................... 110 473 486 41 .494Muskingum ......................................................................... 116 492 441 39 .526Neb. Wesleyan .................................................................... 102 464 406 42 .532TCNJ ........................................................................................ 86 343 329 32 .510Nichols ................................................................................... 52 207 229 6 .475N.C. Wesleyan ..................................................................... 7 44 27 0 .620North Central (IL) ............................................................... 106 416 416 36 .500
North Park ............................................................................ 53 102 371 7 .220Northwestern (MN) .......................................................... 38 198 152 1 .566Norwich ................................................................................. 112 350 501 31 .414Oberlin ................................................................................... 120 384 577 39 .404Occidental ............................................................................ 109 473 383 26 .551Ohio Northern .................................................................... 112 463 443 35 .511Ohio Wesleyan ................................................................... 121 550 482 44 .532Olivet ...................................................................................... 110 312 529 33 .376Otterbein .............................................................................. 121 407 573 43 .419Pacific Lutheran ................................................................. 82 455 257 31 .633Plymouth St. ....................................................................... 41 255 140 7 .643Pomona-Pitzer .................................................................... 113 391 436 33 .474Puget Sound ....................................................................... 102 400 396 36 .502Randolph-Macon .............................................................. 123 474 458 57 .508Redlands ............................................................................... 101 471 390 29 .546Rensselaer ............................................................................ 121 401 516 45 .440Rhodes ................................................................................... 99 367 397 38 .481Ripon ...................................................................................... 117 516 342 46 .596Rochester (NY) ................................................................... 122 488 479 38 .504Rockford ................................................................................ 11 48 61 0 .440Rose-Hulman ...................................................................... 115 402 507 29 .444Rowan .................................................................................... 51 314 186 8 .626St. John Fisher..................................................................... 24 118 122 0 .492St. John's (MN) .................................................................... 100 572 228 24 .709St. Lawrence ........................................................................ 116 374 471 29 .445St. Norbert ............................................................................ 77 396 269 20 .593St. Olaf .................................................................................... 93 430 338 20 .558St. Scholastica ..................................................................... 3 12 16 0 .429St. Thomas (MN) ................................................................ 105 527 335 32 .607St. Vincent ............................................................................. 41 159 154 26 .507Salisbury................................................................................ 38 215 161 4 .571Salve Regina ........................................................................ 18 90 78 0 .536Sewanee ............................................................................... 116 467 471 39 .498Shenandoah ........................................................................ 11 42 68 0 .382Simpson ................................................................................ 116 452 492 36 .480Springfield ............................................................................ 117 526 430 55 .547Sul Ross St. .......................................................................... 32 106 208 2 .339Susquehanna ...................................................................... 112 415 472 38 .469Texas Lutheran ................................................................... 75 273 346 13 .442Thiel ........................................................................................ 106 340 474 36 .421Thomas More ...................................................................... 21 150 67 0 .691Trine ........................................................................................ 16 88 79 0 .527Trinity (CT) ............................................................................ 126 536 344 41 .604Trinity (TX) ............................................................................ 105 464 437 48 .514Tufts ........................................................................................ 129 487 503 46 .492Union (NY) ........................................................................... 122 506 434 62 .536Ursinus ................................................................................... 118 385 563 52 .411Utica ........................................................................................ 10 29 69 0 .296Wabash .................................................................................. 124 613 376 59 .613Wartburg .............................................................................. 75 375 289 12 .564Washington-St. Louis ...................................................... 114 483 453 28 .516Wash. & Jeff. ........................................................................ 119 675 373 40 .639Wash. & Lee ......................................................................... 116 463 500 39 .482Waynesburg ........................................................................ 107 427 389 37 .522Wesley .................................................................................... 25 180 85 1 .679Wesleyan (CT) ..................................................................... 129 491 494 42 .499Western Conn. St. ............................................................ 39 158 219 3 .420Western New Eng. ........................................................... 30 98 170 1 .366Westfield St. ........................................................................ 29 138 140 1 .496Westminster (MO) ............................................................. 48 183 161 17 .530Westminster (PA) ............................................................... 117 572 402 54 .583Wheaton (IL) ........................................................................ 98 470 335 29 .581Whittier .................................................................................. 101 445 400 36 .526Whitworth ............................................................................ 97 330 381 18 .465Widener ................................................................................. 129 642 401 39 .611Wilkes ..................................................................................... 65 288 293 8 .496Willamette ............................................................................ 110 488 378 40 .561Wm. Paterson ...................................................................... 39 139 244 4 .364Williams ................................................................................. 125 623 345 47 .637Wilmington (OH) ............................................................... 78 298 368 14 .449Wis.-Eau Claire .................................................................... 92 375 368 34 .505Wis.-La Crosse ..................................................................... 86 528 240 40 .678Wis.-Oshkosh ...................................................................... 84 284 393 30 .423Wis.-Platteville .................................................................... 102 343 396 31 .466Wis.-River Falls .................................................................... 85 399 309 32 .561Wis.-Stevens Point ............................................................ 111 467 365 43 .558Wis.-Stout ............................................................................. 91 288 452 33 .394Wis.-Whitewater ................................................................ 86 507 248 21 .667Wis. Lutheran ...................................................................... 11 35 74 0 .321Wittenberg ........................................................................... 117 699 346 31 .664Wooster ................................................................................. 112 505 416 41 .546WPI .......................................................................................... 121 314 490 30 .394Worcester St. ..................................................................... 26 142 113 0 .557
School Yrs. Won Lost Tied Pct. School Yrs. Won Lost Tied Pct.
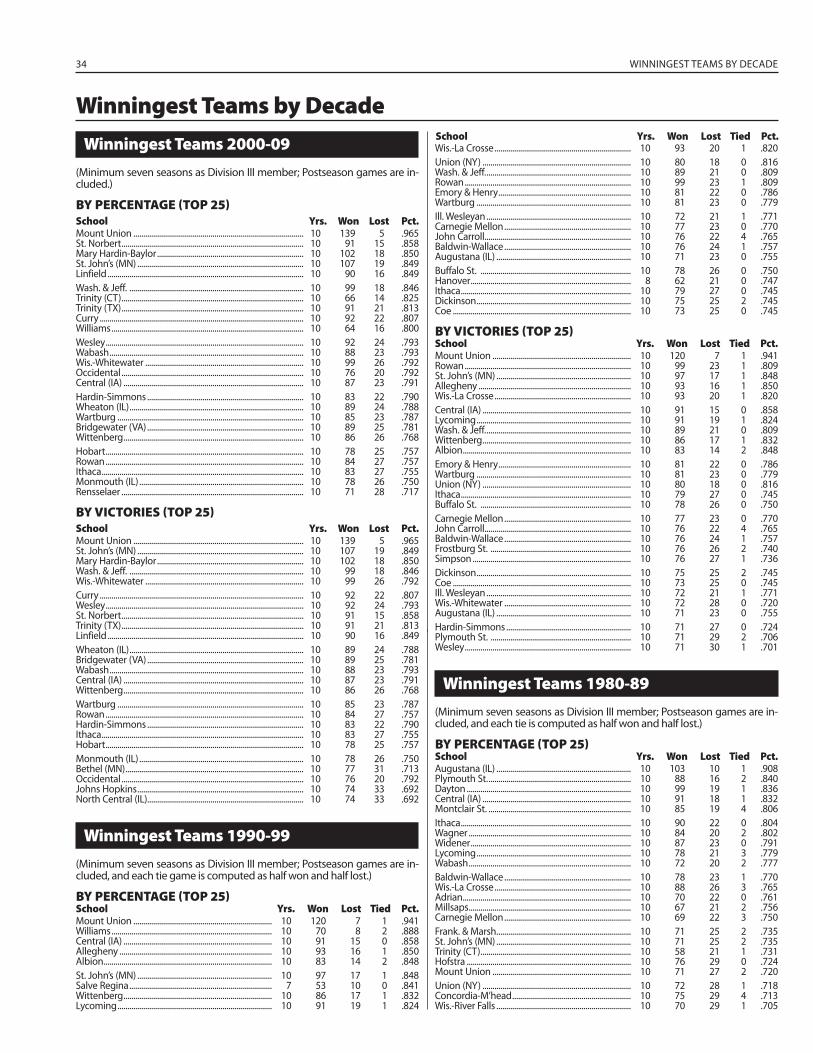
34 WINNINGEST TEAMS BY DECADE
Winningest Teams 2000-09(Minimum seven seasons as Division III member; Postseason games are in-cluded.)
BY PERCENTAGE (TOP 25)School Yrs. Won Lost Pct.Mount Union ...................................................................................... 10 139 5 .965St. Norbert ............................................................................................ 10 91 15 .858Mary Hardin-Baylor .......................................................................... 10 102 18 .850St. John’s (MN) .................................................................................... 10 107 19 .849Linfield ................................................................................................... 10 90 16 .849Wash. & Jeff. ........................................................................................ 10 99 18 .846Trinity (CT) ............................................................................................ 10 66 14 .825Trinity (TX) ............................................................................................ 10 91 21 .813Curry ....................................................................................................... 10 92 22 .807Williams ................................................................................................. 10 64 16 .800Wesley .................................................................................................... 10 92 24 .793Wabash .................................................................................................. 10 88 23 .793Wis.-Whitewater ................................................................................ 10 99 26 .792Occidental ............................................................................................ 10 76 20 .792Central (IA) ........................................................................................... 10 87 23 .791Hardin-Simmons ............................................................................... 10 83 22 .790Wheaton (IL) ........................................................................................ 10 89 24 .788Wartburg .............................................................................................. 10 85 23 .787Bridgewater (VA) ............................................................................... 10 89 25 .781Wittenberg ........................................................................................... 10 86 26 .768Hobart .................................................................................................... 10 78 25 .757Rowan .................................................................................................... 10 84 27 .757Ithaca ...................................................................................................... 10 83 27 .755Monmouth (IL) ................................................................................... 10 78 26 .750Rensselaer ............................................................................................ 10 71 28 .717
BY VICTORIES (TOP 25)School Yrs. Won Lost Pct.Mount Union ...................................................................................... 10 139 5 .965St. John’s (MN) .................................................................................... 10 107 19 .849Mary Hardin-Baylor .......................................................................... 10 102 18 .850Wash. & Jeff. ........................................................................................ 10 99 18 .846Wis.-Whitewater ................................................................................ 10 99 26 .792Curry ....................................................................................................... 10 92 22 .807Wesley .................................................................................................... 10 92 24 .793St. Norbert ............................................................................................ 10 91 15 .858Trinity (TX) ............................................................................................ 10 91 21 .813Linfield ................................................................................................... 10 90 16 .849Wheaton (IL) ........................................................................................ 10 89 24 .788Bridgewater (VA) ............................................................................... 10 89 25 .781Wabash .................................................................................................. 10 88 23 .793Central (IA) ........................................................................................... 10 87 23 .791Wittenberg ........................................................................................... 10 86 26 .768Wartburg .............................................................................................. 10 85 23 .787Rowan .................................................................................................... 10 84 27 .757Hardin-Simmons ............................................................................... 10 83 22 .790Ithaca ...................................................................................................... 10 83 27 .755Hobart .................................................................................................... 10 78 25 .757Monmouth (IL) ................................................................................... 10 78 26 .750Bethel (MN) .......................................................................................... 10 77 31 .713Occidental ............................................................................................ 10 76 20 .792Johns Hopkins .................................................................................... 10 74 33 .692North Central (IL) ............................................................................... 10 74 33 .692
Winningest Teams 1990-99(Minimum seven seasons as Division III member; Postseason games are in-cluded, and each tie game is computed as half won and half lost.)
BY PERCENTAGE (TOP 25)School Yrs. Won Lost Tied Pct.Mount Union ...................................................................... 10 120 7 1 .941Williams ................................................................................. 10 70 8 2 .888Central (IA) ........................................................................... 10 91 15 0 .858Allegheny ............................................................................. 10 93 16 1 .850Albion ..................................................................................... 10 83 14 2 .848St. John’s (MN) .................................................................... 10 97 17 1 .848Salve Regina ........................................................................ 7 53 10 0 .841Wittenberg ........................................................................... 10 86 17 1 .832Lycoming .............................................................................. 10 91 19 1 .824
Wis.-La Crosse ..................................................................... 10 93 20 1 .820Union (NY) ........................................................................... 10 80 18 0 .816Wash. & Jeff. ......................................................................... 10 89 21 0 .809Rowan .................................................................................... 10 99 23 1 .809Emory & Henry ................................................................... 10 81 22 0 .786Wartburg .............................................................................. 10 81 23 0 .779Ill. Wesleyan ......................................................................... 10 72 21 1 .771Carnegie Mellon ................................................................ 10 77 23 0 .770John Carroll.......................................................................... 10 76 22 4 .765Baldwin-Wallace ................................................................ 10 76 24 1 .757Augustana (IL) .................................................................... 10 71 23 0 .755Buffalo St. ............................................................................ 10 78 26 0 .750Hanover ................................................................................. 8 62 21 0 .747Ithaca ...................................................................................... 10 79 27 0 .745Dickinson .............................................................................. 10 75 25 2 .745Coe .......................................................................................... 10 73 25 0 .745
BY VICTORIES (TOP 25)School Yrs. Won Lost Tied Pct.Mount Union ...................................................................... 10 120 7 1 .941Rowan .................................................................................... 10 99 23 1 .809St. John’s (MN) .................................................................... 10 97 17 1 .848Allegheny ............................................................................. 10 93 16 1 .850Wis.-La Crosse ..................................................................... 10 93 20 1 .820Central (IA) ........................................................................... 10 91 15 0 .858Lycoming .............................................................................. 10 91 19 1 .824Wash. & Jeff. ......................................................................... 10 89 21 0 .809Wittenberg ........................................................................... 10 86 17 1 .832Albion ..................................................................................... 10 83 14 2 .848Emory & Henry ................................................................... 10 81 22 0 .786Wartburg .............................................................................. 10 81 23 0 .779Union (NY) ........................................................................... 10 80 18 0 .816Ithaca ...................................................................................... 10 79 27 0 .745Buffalo St. ............................................................................ 10 78 26 0 .750Carnegie Mellon ................................................................ 10 77 23 0 .770John Carroll.......................................................................... 10 76 22 4 .765Baldwin-Wallace ................................................................ 10 76 24 1 .757Frostburg St. ....................................................................... 10 76 26 2 .740Simpson ................................................................................ 10 76 27 1 .736Dickinson .............................................................................. 10 75 25 2 .745Coe .......................................................................................... 10 73 25 0 .745Ill. Wesleyan ......................................................................... 10 72 21 1 .771Wis.-Whitewater ................................................................ 10 72 28 0 .720Augustana (IL) .................................................................... 10 71 23 0 .755Hardin-Simmons ............................................................... 10 71 27 0 .724Plymouth St. ....................................................................... 10 71 29 2 .706Wesley .................................................................................... 10 71 30 1 .701
Winningest Teams 1980-89(Minimum seven seasons as Division III member; Postseason games are in-cluded, and each tie is computed as half won and half lost.)
BY PERCENTAGE (TOP 25)School Yrs. Won Lost Tied Pct.Augustana (IL) .................................................................... 10 103 10 1 .908Plymouth St. ........................................................................ 10 88 16 2 .840Dayton ................................................................................... 10 99 19 1 .836Central (IA) ........................................................................... 10 91 18 1 .832Montclair St. ........................................................................ 10 85 19 4 .806Ithaca ...................................................................................... 10 90 22 0 .804Wagner .................................................................................. 10 84 20 2 .802Widener ................................................................................. 10 87 23 0 .791Lycoming .............................................................................. 10 78 21 3 .779Wabash .................................................................................. 10 72 20 2 .777Baldwin-Wallace ................................................................ 10 78 23 1 .770Wis.-La Crosse ..................................................................... 10 88 26 3 .765Adrian ..................................................................................... 10 70 22 0 .761Millsaps .................................................................................. 10 67 21 2 .756Carnegie Mellon ................................................................ 10 69 22 3 .750Frank. & Marsh. ................................................................... 10 71 25 2 .735St. John’s (MN) .................................................................... 10 71 25 2 .735Trinity (CT) ............................................................................ 10 58 21 1 .731Hofstra ................................................................................... 10 76 29 0 .724Mount Union ...................................................................... 10 71 27 2 .720Union (NY) ........................................................................... 10 72 28 1 .718Concordia-M’head ............................................................ 10 75 29 4 .713Wis.-River Falls .................................................................... 10 70 29 1 .705
Winningest Teams by DecadeSchool Yrs. Won Lost Tied Pct.
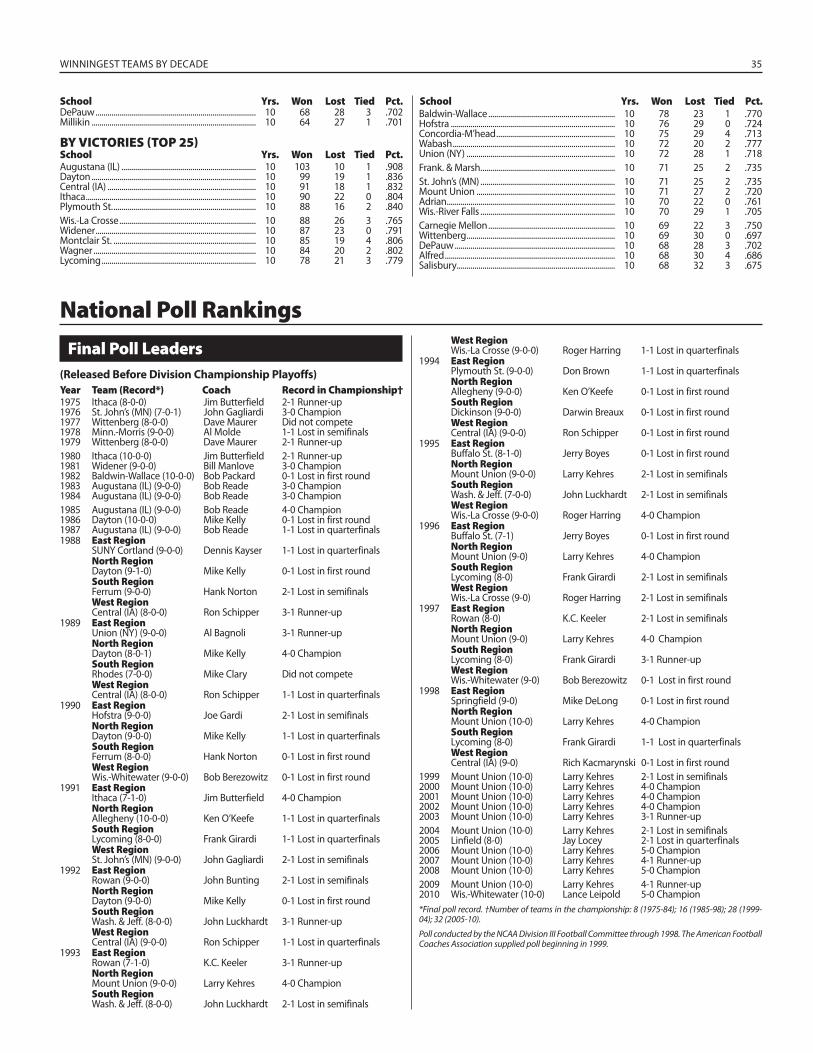
WINNINGEST TEAMS BY DECADE 35
DePauw ................................................................................. 10 68 28 3 .702Millikin ................................................................................... 10 64 27 1 .701
BY VICTORIES (TOP 25)School Yrs. Won Lost Tied Pct.Augustana (IL) .................................................................... 10 103 10 1 .908Dayton ................................................................................... 10 99 19 1 .836Central (IA) ........................................................................... 10 91 18 1 .832Ithaca ...................................................................................... 10 90 22 0 .804Plymouth St. ........................................................................ 10 88 16 2 .840Wis.-La Crosse ..................................................................... 10 88 26 3 .765Widener ................................................................................. 10 87 23 0 .791Montclair St. ........................................................................ 10 85 19 4 .806Wagner .................................................................................. 10 84 20 2 .802Lycoming .............................................................................. 10 78 21 3 .779
Baldwin-Wallace ................................................................ 10 78 23 1 .770Hofstra ................................................................................... 10 76 29 0 .724Concordia-M’head ............................................................ 10 75 29 4 .713Wabash .................................................................................. 10 72 20 2 .777Union (NY) ........................................................................... 10 72 28 1 .718Frank. & Marsh. ................................................................... 10 71 25 2 .735St. John’s (MN) .................................................................... 10 71 25 2 .735Mount Union ...................................................................... 10 71 27 2 .720Adrian ..................................................................................... 10 70 22 0 .761Wis.-River Falls .................................................................... 10 70 29 1 .705Carnegie Mellon ................................................................ 10 69 22 3 .750Wittenberg ........................................................................... 10 69 30 0 .697DePauw ................................................................................. 10 68 28 3 .702Alfred ...................................................................................... 10 68 30 4 .686Salisbury................................................................................ 10 68 32 3 .675
School Yrs. Won Lost Tied Pct.
National Poll RankingsFinal Poll Leaders
(Released Before Division Championship Playoffs)
Year Team (Record*) Coach Record in Championship†1975 Ithaca (8-0-0) Jim Butterfield 2-1 Runner-up1976 St. John’s (MN) (7-0-1) John Gagliardi 3-0 Champion1977 Wittenberg (8-0-0) Dave Maurer Did not compete1978 Minn.-Morris (9-0-0) Al Molde 1-1 Lost in semifinals1979 Wittenberg (8-0-0) Dave Maurer 2-1 Runner-up1980 Ithaca (10-0-0) Jim Butterfield 2-1 Runner-up1981 Widener (9-0-0) Bill Manlove 3-0 Champion1982 Baldwin-Wallace (10-0-0) Bob Packard 0-1 Lost in first round1983 Augustana (IL) (9-0-0) Bob Reade 3-0 Champion1984 Augustana (IL) (9-0-0) Bob Reade 3-0 Champion1985 Augustana (IL) (9-0-0) Bob Reade 4-0 Champion1986 Dayton (10-0-0) Mike Kelly 0-1 Lost in first round1987 Augustana (IL) (9-0-0) Bob Reade 1-1 Lost in quarterfinals1988 East Region SUNY Cortland (9-0-0) Dennis Kayser 1-1 Lost in quarterfinals North Region Dayton (9-1-0) Mike Kelly 0-1 Lost in first round South Region Ferrum (9-0-0) Hank Norton 2-1 Lost in semifinals West Region Central (IA) (8-0-0) Ron Schipper 3-1 Runner-up1989 East Region Union (NY) (9-0-0) Al Bagnoli 3-1 Runner-up North Region Dayton (8-0-1) Mike Kelly 4-0 Champion South Region Rhodes (7-0-0) Mike Clary Did not compete West Region Central (IA) (8-0-0) Ron Schipper 1-1 Lost in quarterfinals1990 East Region Hofstra (9-0-0) Joe Gardi 2-1 Lost in semifinals North Region Dayton (9-0-0) Mike Kelly 1-1 Lost in quarterfinals South Region Ferrum (8-0-0) Hank Norton 0-1 Lost in first round West Region Wis.-Whitewater (9-0-0) Bob Berezowitz 0-1 Lost in first round1991 East Region Ithaca (7-1-0) Jim Butterfield 4-0 Champion North Region Allegheny (10-0-0) Ken O’Keefe 1-1 Lost in quarterfinals South Region Lycoming (8-0-0) Frank Girardi 1-1 Lost in quarterfinals West Region St. John’s (MN) (9-0-0) John Gagliardi 2-1 Lost in semifinals1992 East Region Rowan (9-0-0) John Bunting 2-1 Lost in semifinals North Region Dayton (9-0-0) Mike Kelly 0-1 Lost in first round South Region Wash. & Jeff. (8-0-0) John Luckhardt 3-1 Runner-up West Region Central (IA) (9-0-0) Ron Schipper 1-1 Lost in quarterfinals1993 East Region Rowan (7-1-0) K.C. Keeler 3-1 Runner-up North Region Mount Union (9-0-0) Larry Kehres 4-0 Champion South Region Wash. & Jeff. (8-0-0) John Luckhardt 2-1 Lost in semifinals
West Region Wis.-La Crosse (9-0-0) Roger Harring 1-1 Lost in quarterfinals1994 East Region Plymouth St. (9-0-0) Don Brown 1-1 Lost in quarterfinals North Region Allegheny (9-0-0) Ken O’Keefe 0-1 Lost in first round South Region Dickinson (9-0-0) Darwin Breaux 0-1 Lost in first round West Region Central (IA) (9-0-0) Ron Schipper 0-1 Lost in first round1995 East Region Buffalo St. (8-1-0) Jerry Boyes 0-1 Lost in first round North Region Mount Union (9-0-0) Larry Kehres 2-1 Lost in semifinals South Region Wash. & Jeff. (7-0-0) John Luckhardt 2-1 Lost in semifinals West Region Wis.-La Crosse (9-0-0) Roger Harring 4-0 Champion1996 East Region Buffalo St. (7-1) Jerry Boyes 0-1 Lost in first round North Region Mount Union (9-0) Larry Kehres 4-0 Champion South Region Lycoming (8-0) Frank Girardi 2-1 Lost in semifinals West Region Wis.-La Crosse (9-0) Roger Harring 2-1 Lost in semifinals1997 East Region Rowan (8-0) K.C. Keeler 2-1 Lost in semifinals North Region Mount Union (9-0) Larry Kehres 4-0 Champion South Region Lycoming (8-0) Frank Girardi 3-1 Runner-up West Region Wis.-Whitewater (9-0) Bob Berezowitz 0-1 Lost in first round1998 East Region Springfield (9-0) Mike DeLong 0-1 Lost in first round North Region Mount Union (10-0) Larry Kehres 4-0 Champion South Region Lycoming (8-0) Frank Girardi 1-1 Lost in quarterfinals West Region Central (IA) (9-0) Rich Kacmarynski 0-1 Lost in first round1999 Mount Union (10-0) Larry Kehres 2-1 Lost in semifinals2000 Mount Union (10-0) Larry Kehres 4-0 Champion2001 Mount Union (10-0) Larry Kehres 4-0 Champion2002 Mount Union (10-0) Larry Kehres 4-0 Champion2003 Mount Union (10-0) Larry Kehres 3-1 Runner-up2004 Mount Union (10-0) Larry Kehres 2-1 Lost in semifinals2005 Linfield (8-0) Jay Locey 2-1 Lost in quarterfinals2006 Mount Union (10-0) Larry Kehres 5-0 Champion2007 Mount Union (10-0) Larry Kehres 4-1 Runner-up2008 Mount Union (10-0) Larry Kehres 5-0 Champion2009 Mount Union (10-0) Larry Kehres 4-1 Runner-up2010 Wis.-Whitewater (10-0) Lance Leipold 5-0 Champion*Final poll record. †Number of teams in the championship: 8 (1975-84); 16 (1985-98); 28 (1999-04); 32 (2005-10).
Poll conducted by the NCAA Division III Football Committee through 1998. The American Football Coaches Association supplied poll beginning in 1999.
School Yrs. Won Lost Tied Pct.
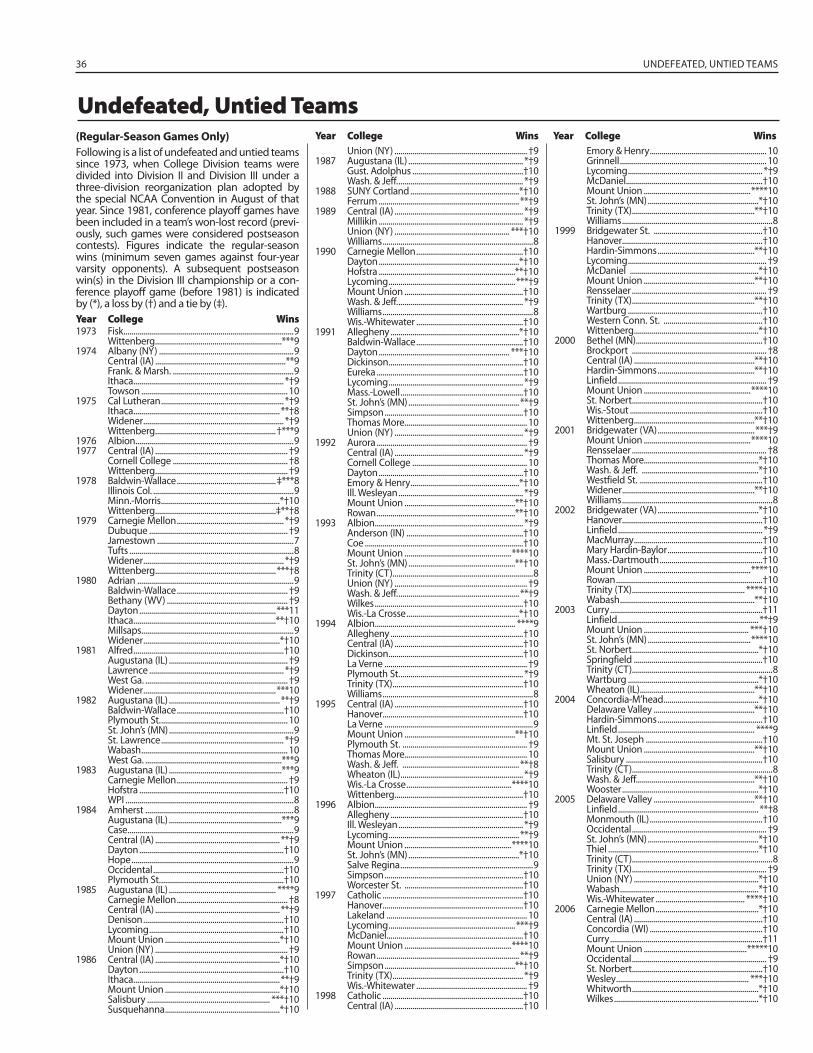
36 UNDEFEATED, UNTIED TEAMS
(Regular-Season Games Only)
Following is a list of undefeated and untied teams since 1973, when College Division teams were divided into Division II and Division III under a three-division reorganization plan adopted by the special NCAA Convention in August of that year. Since 1981, conference playoff games have been included in a team’s won-lost record (previ-ously, such games were considered postseason contests). Figures indicate the regular-season wins (minimum seven games against four-year varsity opponents). A subsequent postseason win(s) in the Division III championship or a con-ference playoff game (before 1981) is indicated by (*), a loss by (†) and a tie by (‡).Year College Wins1973 Fisk ......................................................................................9 Wittenberg ................................................................***91974 Albany (NY) ....................................................................9 Central (IA) ..................................................................**9 Frank. & Marsh. .............................................................9 Ithaca ............................................................................ *†9 Towson .......................................................................... 101975 Cal Lutheran .............................................................. *†9 Ithaca ..........................................................................**†8 Widener ....................................................................... *†9 Wittenberg .............................................................†***91976 Albion ................................................................................91977 Central (IA) ................................................................... †9 Cornell College .......................................................... †8 Wittenberg ................................................................... †91978 Baldwin-Wallace ..................................................‡***8 Illinois Col. .......................................................................9 Minn.-Morris ............................................................*†10 Wittenberg .............................................................‡**†81979 Carnegie Mellon ...................................................... *†9 Dubuque ...................................................................... †9 Jamestown .....................................................................7 Tufts ...................................................................................8 Widener ....................................................................... *†9 Wittenberg .............................................................***†81980 Adrian ...............................................................................9 Baldwin-Wallace ........................................................ †9 Bethany (WV) ............................................................. †9 Dayton .....................................................................***11 Ithaca ........................................................................**†10 Millsaps.............................................................................9 Widener .....................................................................*†101981 Alfred ............................................................................†10 Augustana (IL) ............................................................ †9 Lawrence .................................................................... *†9 West Ga. ........................................................................ †9 Widener ...................................................................***101982 Augustana (IL) ........................................................**†9 Baldwin-Wallace ......................................................†10 Plymouth St. ................................................................ 10 St. John’s (MN) ...............................................................9 St. Lawrence .............................................................. *†9 Wabash .......................................................................... 10 West Ga. .....................................................................***91983 Augustana (IL) .........................................................***9 Carnegie Mellon ........................................................ †9 Hofstra .........................................................................†10 WPI .....................................................................................81984 Amherst ...........................................................................8 Augustana (IL) .........................................................***9 Case ....................................................................................9 Central (IA) ...............................................................**†9 Dayton .........................................................................†10 Hope ..................................................................................9 Occidental ..................................................................†10 Plymouth St. ..............................................................†101985 Augustana (IL) ...................................................... ****9 Carnegie Mellon ........................................................ †8 Central (IA) ...............................................................**†9 Denison .......................................................................†10 Lycoming ....................................................................†10 Mount Union ..........................................................*†10 Union (NY) ................................................................... †91986 Central (IA) ...............................................................*†10 Dayton .........................................................................†10 Ithaca ..........................................................................**†9 Mount Union ..........................................................*†10 Salisbury .............................................................. ***†10 Susquehanna ..........................................................*†10
Union (NY) ................................................................... †91987 Augustana (IL) .......................................................... *†9 Gust. Adolphus ........................................................†10 Wash. & Jeff. ............................................................... *†91988 SUNY Cortland .......................................................*†10 Ferrum .......................................................................**†91989 Central (IA) ................................................................. *†9 Millikin ......................................................................... *†9 Union (NY) .......................................................... ***†10 Williams ............................................................................81990 Carnegie Mellon ......................................................†10 Dayton .......................................................................*†10 Hofstra .....................................................................**†10 Lycoming ................................................................***†9 Mount Union ............................................................†10 Wash. & Jeff. ............................................................... *†9 Williams ............................................................................8 Wis.-Whitewater ......................................................†101991 Allegheny .................................................................*†10 Baldwin-Wallace ......................................................†10 Dayton .................................................................. ***†10 Dickinson ....................................................................†10 Eureka ..........................................................................†10 Lycoming .................................................................... *†9 Mass.-Lowell ..............................................................†10 St. John’s (MN) ........................................................**†9 Simpson ......................................................................†10 Thomas More.............................................................. 10 Union (NY) ................................................................. *†91992 Aurora ............................................................................ †9 Central (IA) ................................................................. *†9 Cornell College .......................................................... 10 Dayton .........................................................................†10 Emory & Henry .......................................................*†10 Ill. Wesleyan ............................................................... *†9 Mount Union ........................................................**†10 Rowan ......................................................................**†101993 Albion ........................................................................... *†9 Anderson (IN) ...........................................................†10 Coe ................................................................................†10 Mount Union ......................................................****10 St. John’s (MN) ......................................................**†10 Trinity (CT).......................................................................8 Union (NY) ................................................................... †9 Wash. & Jeff. .............................................................**†9 Wilkes ...........................................................................†10 Wis.-La Crosse .........................................................*†101994 Albion ....................................................................... ****9 Allegheny ...................................................................†10 Central (IA) .................................................................†10 Dickinson ....................................................................†10 La Verne ........................................................................ †9 Plymouth St. .............................................................. *†9 Trinity (TX) ..................................................................†10 Williams ............................................................................81995 Central (IA) .................................................................†10 Hanover .......................................................................†10 La Verne ...........................................................................9 Mount Union ........................................................**†10 Plymouth St. ............................................................... †9 Thomas More.............................................................. 10 Wash. & Jeff. ...........................................................**†8 Wheaton (IL) .............................................................. *†9 Wis.-La Crosse .....................................................****10 Wittenberg .................................................................†101996 Albion ............................................................................. †9 Allegheny ...................................................................†10 Ill. Wesleyan ............................................................... *†9 Lycoming ..................................................................**†9 Mount Union ......................................................****10 St. John’s (MN) ........................................................*†10 Salve Regina ...................................................................9 Simpson ......................................................................†10 Worcester St. ............................................................†101997 Catholic .......................................................................†10 Hanover .......................................................................†10 Lakeland ....................................................................... 10 Lycoming ................................................................***†9 McDaniel .....................................................................†10 Mount Union ......................................................****10 Rowan ........................................................................**†9 Simpson ..................................................................**†10 Trinity (TX) .................................................................. *†9 Wis.-Whitewater ........................................................ †91998 Catholic .......................................................................†10 Central (IA) .................................................................†10
Emory & Henry ........................................................... 10 Grinnell .......................................................................... 10 Lycoming .................................................................... *†9 McDaniel .....................................................................†10 Mount Union ......................................................****10 St. John’s (MN) ........................................................*†10 Trinity (TX) ..............................................................**†10 Williams ............................................................................81999 Bridgewater St. .......................................................†10 Hanover .......................................................................†10 Hardin-Simmons .................................................**†10 Lycoming ...................................................................... †9 McDaniel .................................................................*†10 Mount Union ........................................................**†10 Rensselaer .................................................................... †9 Trinity (TX) ..............................................................**†10 Wartburg ....................................................................†10 Western Conn. St. ..................................................†10 Wittenberg ...............................................................*†102000 Bethel (MN) ................................................................†10 Brockport .................................................................... †8 Central (IA) .............................................................**†10 Hardin-Simmons .................................................**†10 Linfield ........................................................................... †9 Mount Union ......................................................****10 St. Norbert ..................................................................†10 Wis.-Stout ...................................................................†10 Wittenberg .............................................................**†102001 Bridgewater (VA) .................................................***†9 Mount Union ......................................................****10 Rensselaer .................................................................... †8 Thomas More..........................................................*†10 Wash. & Jeff. ...........................................................*†10 Westfield St. ..............................................................†10 Widener ...................................................................**†10 Williams ............................................................................82002 Bridgewater (VA) ...................................................*†10 Hanover .......................................................................†10 Linfield ......................................................................... *†9 MacMurray .................................................................†10 Mary Hardin-Baylor ................................................†10 Mass.-Dartmouth ....................................................†10 Mount Union ......................................................****10 Rowan ..........................................................................†10 Trinity (TX) ......................................................... ****†10 Wabash ....................................................................**†102003 Curry .............................................................................†11 Linfield .......................................................................**†9 Mount Union ..................................................... ***†10 St. John’s (MN) ....................................................****10 St. Norbert ................................................................*†10 Springfield .................................................................†10 Trinity (CT).......................................................................8 Wartburg ..................................................................*†10 Wheaton (IL) ..........................................................**†102004 Concordia-M’head ................................................*†10 Delaware Valley ...................................................**†10 Hardin-Simmons .....................................................†10 Linfield ..................................................................... ****9 Mt. St. Joseph ...........................................................†10 Mount Union ........................................................**†10 Salisbury .....................................................................†10 Trinity (CT).......................................................................8 Wash. & Jeff. ...........................................................**†10 Wooster .....................................................................*†102005 Delaware Valley ...................................................**†10 Linfield .......................................................................**†8 Monmouth (IL) .........................................................†10 Occidental .................................................................... †9 St. John’s (MN) ........................................................*†10 Thiel ............................................................................*†10 Trinity (CT).......................................................................8 Trinity (TX) .................................................................... †9 Union (NY) ...............................................................*†10 Wabash ......................................................................*†10 Wis.-Whitewater ............................................. ****†102006 Carnegie Mellon ....................................................*†10 Central (IA) .................................................................†10 Concordia (WI) .........................................................†10 Curry .............................................................................†11 Mount Union ....................................................*****10 Occidental .................................................................... †9 St. Norbert ..................................................................†10 Wesley ................................................................... ***†10 Whitworth ................................................................*†10 Wilkes .........................................................................*†10
Year College Wins Year College Wins
Undefeated, Untied Teams
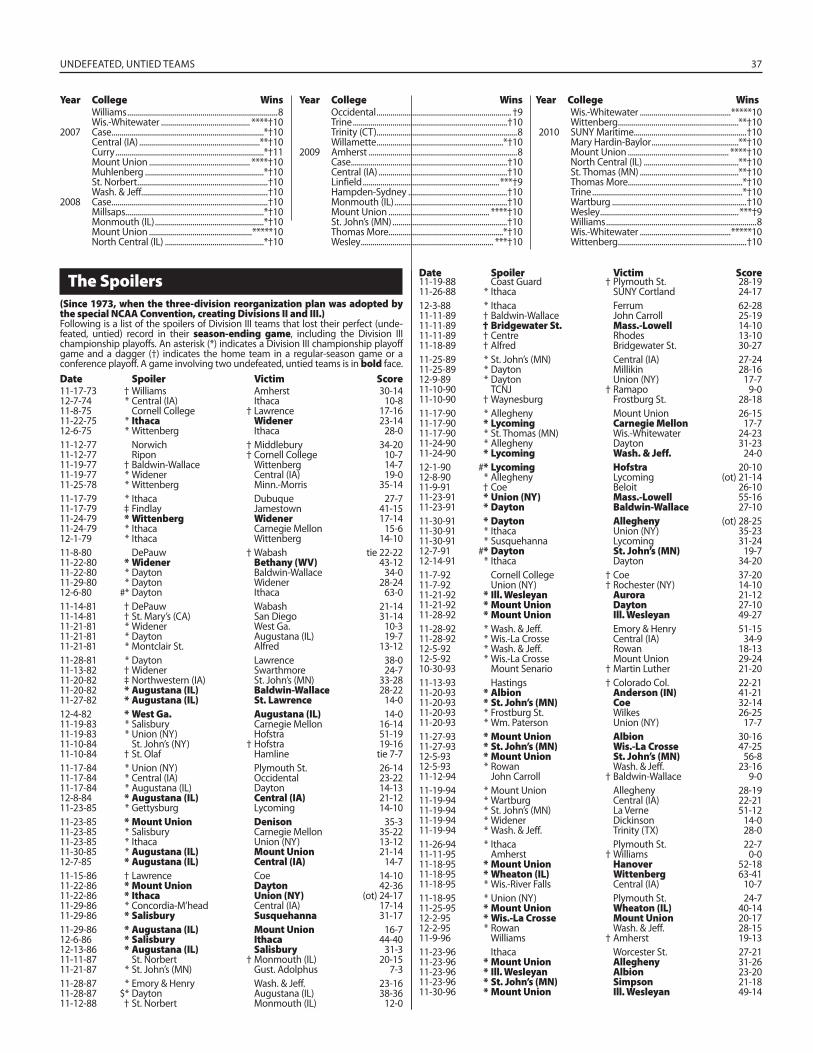
UNDEFEATED, UNTIED TEAMS 37
Williams ............................................................................8 Wis.-Whitewater ............................................. ****†102007 Case .............................................................................*†10 Central (IA) .............................................................**†10 Curry ...........................................................................*†11 Mount Union ................................................... ****†10 Muhlenberg ............................................................*†10 St. Norbert ..................................................................†10 Wash. & Jeff. ...............................................................†102008 Case ...............................................................................†10 Millsaps......................................................................*†10 Monmouth (IL) .......................................................*†10 Mount Union ....................................................*****10 North Central (IL) ..................................................*†10
Occidental .................................................................... †9 Trine ..............................................................................†10 Trinity (CT).......................................................................8 Willamette ................................................................*†102009 Amherst ...........................................................................8 Case ...............................................................................†10 Central (IA) .................................................................†10 Linfield .....................................................................***†9 Hampden-Sydney ..................................................†10 Monmouth (IL) .........................................................†10 Mount Union ................................................... ****†10 St. John’s (MN) ..........................................................†10 Thomas More..........................................................*†10 Wesley ................................................................... ***†10
Wis.-Whitewater ..............................................*****10 Wittenberg .............................................................**†102010 SUNY Maritime.........................................................†10 Mary Hardin-Baylor ............................................**†10 Mount Union ................................................... ****†10 North Central (IL) ................................................**†10 St. Thomas (MN) ..................................................**†10 Thomas More..........................................................*†10 Trine ............................................................................*†10 Wartburg ....................................................................†10 Wesley ......................................................................***†9 Williams ............................................................................8 Wis.-Whitewater ..............................................*****10 Wittenberg .................................................................†10
The Spoilers(Since 1973, when the three-division reorganization plan was adopted by the special NCAA Convention, creating Divisions II and III.)Following is a list of the spoilers of Division III teams that lost their perfect (unde-feated, untied) record in their season-ending game, including the Division III championship playoffs. An asterisk (*) indicates a Division III championship playoff game and a dagger (†) indicates the home team in a regular-season game or a conference playoff. A game involving two undefeated, untied teams is in bold face.Date Spoiler Victim Score11-17-73 † Williams Amherst 30-1412-7-74 * Central (IA) Ithaca 10-811-8-75 Cornell College † Lawrence 17-1611-22-75 * Ithaca Widener 23-1412-6-75 * Wittenberg Ithaca 28-011-12-77 Norwich † Middlebury 34-2011-12-77 Ripon † Cornell College 10-711-19-77 † Baldwin-Wallace Wittenberg 14-711-19-77 * Widener Central (IA) 19-011-25-78 * Wittenberg Minn.-Morris 35-1411-17-79 * Ithaca Dubuque 27-711-17-79 ‡ Findlay Jamestown 41-1511-24-79 * Wittenberg Widener 17-1411-24-79 * Ithaca Carnegie Mellon 15-612-1-79 * Ithaca Wittenberg 14-1011-8-80 DePauw † Wabash tie 22-2211-22-80 * Widener Bethany (WV) 43-1211-22-80 * Dayton Baldwin-Wallace 34-011-29-80 * Dayton Widener 28-2412-6-80 #* Dayton Ithaca 63-011-14-81 † DePauw Wabash 21-1411-14-81 † St. Mary’s (CA) San Diego 31-1411-21-81 * Widener West Ga. 10-311-21-81 * Dayton Augustana (IL) 19-711-21-81 * Montclair St. Alfred 13-1211-28-81 * Dayton Lawrence 38-011-13-82 † Widener Swarthmore 24-711-20-82 ‡ Northwestern (IA) St. John’s (MN) 33-2811-20-82 * Augustana (IL) Baldwin-Wallace 28-2211-27-82 * Augustana (IL) St. Lawrence 14-012-4-82 * West Ga. Augustana (IL) 14-011-19-83 * Salisbury Carnegie Mellon 16-1411-19-83 * Union (NY) Hofstra 51-1911-10-84 St. John’s (NY) † Hofstra 19-1611-10-84 † St. Olaf Hamline tie 7-711-17-84 * Union (NY) Plymouth St. 26-1411-17-84 * Central (IA) Occidental 23-2211-17-84 * Augustana (IL) Dayton 14-1312-8-84 * Augustana (IL) Central (IA) 21-1211-23-85 * Gettysburg Lycoming 14-1011-23-85 * Mount Union Denison 35-311-23-85 * Salisbury Carnegie Mellon 35-2211-23-85 * Ithaca Union (NY) 13-1211-30-85 * Augustana (IL) Mount Union 21-1412-7-85 * Augustana (IL) Central (IA) 14-711-15-86 † Lawrence Coe 14-1011-22-86 * Mount Union Dayton 42-3611-22-86 * Ithaca Union (NY) (ot) 24-1711-29-86 * Concordia-M’head Central (IA) 17-1411-29-86 * Salisbury Susquehanna 31-1711-29-86 * Augustana (IL) Mount Union 16-712-6-86 * Salisbury Ithaca 44-4012-13-86 * Augustana (IL) Salisbury 31-311-11-87 St. Norbert † Monmouth (IL) 20-1511-21-87 * St. John’s (MN) Gust. Adolphus 7-311-28-87 * Emory & Henry Wash. & Jeff. 23-1611-28-87 $* Dayton Augustana (IL) 38-3611-12-88 † St. Norbert Monmouth (IL) 12-0
11-19-88 Coast Guard † Plymouth St. 28-1911-26-88 * Ithaca SUNY Cortland 24-1712-3-88 * Ithaca Ferrum 62-2811-11-89 † Baldwin-Wallace John Carroll 25-1911-11-89 † Bridgewater St. Mass.-Lowell 14-1011-11-89 † Centre Rhodes 13-1011-18-89 † Alfred Bridgewater St. 30-2711-25-89 * St. John’s (MN) Central (IA) 27-2411-25-89 * Dayton Millikin 28-1612-9-89 * Dayton Union (NY) 17-711-10-90 TCNJ † Ramapo 9-011-10-90 † Waynesburg Frostburg St. 28-1811-17-90 * Allegheny Mount Union 26-1511-17-90 * Lycoming Carnegie Mellon 17-711-17-90 * St. Thomas (MN) Wis.-Whitewater 24-2311-24-90 * Allegheny Dayton 31-2311-24-90 * Lycoming Wash. & Jeff. 24-012-1-90 #* Lycoming Hofstra 20-1012-8-90 * Allegheny Lycoming (ot) 21-1411-9-91 † Coe Beloit 26-1011-23-91 * Union (NY) Mass.-Lowell 55-1611-23-91 * Dayton Baldwin-Wallace 27-1011-30-91 * Dayton Allegheny (ot) 28-2511-30-91 * Ithaca Union (NY) 35-2311-30-91 * Susquehanna Lycoming 31-2412-7-91 #* Dayton St. John’s (MN) 19-712-14-91 * Ithaca Dayton 34-2011-7-92 Cornell College † Coe 37-2011-7-92 Union (NY) † Rochester (NY) 14-1011-21-92 * Ill. Wesleyan Aurora 21-1211-21-92 * Mount Union Dayton 27-1011-28-92 * Mount Union Ill. Wesleyan 49-2711-28-92 * Wash. & Jeff. Emory & Henry 51-1511-28-92 * Wis.-La Crosse Central (IA) 34-912-5-92 * Wash. & Jeff. Rowan 18-1312-5-92 * Wis.-La Crosse Mount Union 29-2410-30-93 Mount Senario † Martin Luther 21-2011-13-93 Hastings † Colorado Col. 22-2111-20-93 * Albion Anderson (IN) 41-2111-20-93 * St. John’s (MN) Coe 32-1411-20-93 * Frostburg St. Wilkes 26-2511-20-93 * Wm. Paterson Union (NY) 17-711-27-93 * Mount Union Albion 30-1611-27-93 * St. John’s (MN) Wis.-La Crosse 47-2512-5-93 * Mount Union St. John’s (MN) 56-812-5-93 * Rowan Wash. & Jeff. 23-1611-12-94 John Carroll † Baldwin-Wallace 9-011-19-94 * Mount Union Allegheny 28-1911-19-94 * Wartburg Central (IA) 22-2111-19-94 * St. John’s (MN) La Verne 51-1211-19-94 * Widener Dickinson 14-011-19-94 * Wash. & Jeff. Trinity (TX) 28-011-26-94 * Ithaca Plymouth St. 22-711-11-95 Amherst † Williams 0-011-18-95 * Mount Union Hanover 52-1811-18-95 * Wheaton (IL) Wittenberg 63-4111-18-95 * Wis.-River Falls Central (IA) 10-711-18-95 * Union (NY) Plymouth St. 24-711-25-95 * Mount Union Wheaton (IL) 40-1412-2-95 * Wis.-La Crosse Mount Union 20-1712-2-95 * Rowan Wash. & Jeff. 28-1511-9-96 Williams † Amherst 19-1311-23-96 Ithaca Worcester St. 27-2111-23-96 * Mount Union Allegheny 31-2611-23-96 * Ill. Wesleyan Albion 23-2011-23-96 * St. John’s (MN) Simpson 21-1811-30-96 * Mount Union Ill. Wesleyan 49-14
Date Spoiler Victim Score
Year College Wins Year College Wins Year College Wins
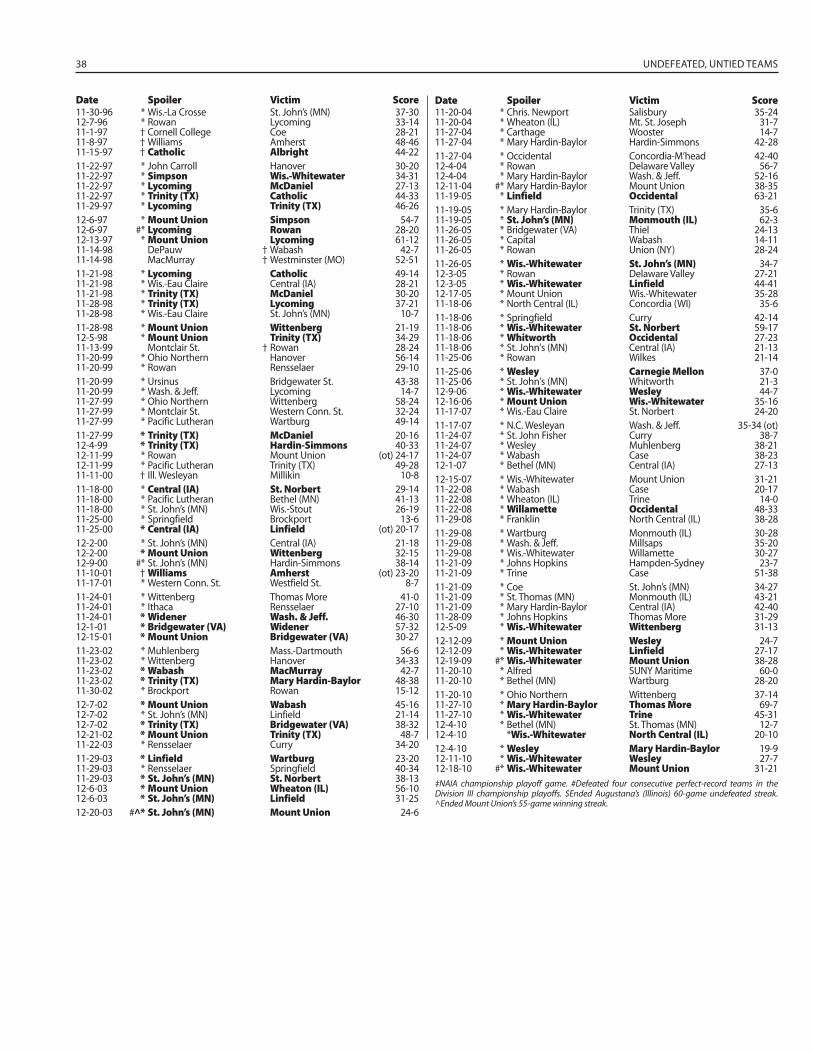
38 UNDEFEATED, UNTIED TEAMS
11-30-96 * Wis.-La Crosse St. John’s (MN) 37-3012-7-96 * Rowan Lycoming 33-1411-1-97 † Cornell College Coe 28-2111-8-97 † Williams Amherst 48-4611-15-97 † Catholic Albright 44-2211-22-97 * John Carroll Hanover 30-2011-22-97 * Simpson Wis.-Whitewater 34-3111-22-97 * Lycoming McDaniel 27-1311-22-97 * Trinity (TX) Catholic 44-3311-29-97 * Lycoming Trinity (TX) 46-2612-6-97 * Mount Union Simpson 54-712-6-97 #* Lycoming Rowan 28-2012-13-97 * Mount Union Lycoming 61-1211-14-98 DePauw † Wabash 42-711-14-98 MacMurray † Westminster (MO) 52-5111-21-98 * Lycoming Catholic 49-1411-21-98 * Wis.-Eau Claire Central (IA) 28-2111-21-98 * Trinity (TX) McDaniel 30-2011-28-98 * Trinity (TX) Lycoming 37-2111-28-98 * Wis.-Eau Claire St. John’s (MN) 10-711-28-98 * Mount Union Wittenberg 21-1912-5-98 * Mount Union Trinity (TX) 34-2911-13-99 Montclair St. † Rowan 28-2411-20-99 * Ohio Northern Hanover 56-1411-20-99 * Rowan Rensselaer 29-1011-20-99 * Ursinus Bridgewater St. 43-3811-20-99 * Wash. & Jeff. Lycoming 14-711-27-99 * Ohio Northern Wittenberg 58-2411-27-99 * Montclair St. Western Conn. St. 32-2411-27-99 * Pacific Lutheran Wartburg 49-1411-27-99 * Trinity (TX) McDaniel 20-1612-4-99 * Trinity (TX) Hardin-Simmons 40-3312-11-99 * Rowan Mount Union (ot) 24-1712-11-99 * Pacific Lutheran Trinity (TX) 49-2811-11-00 † Ill. Wesleyan Millikin 10-811-18-00 * Central (IA) St. Norbert 29-1411-18-00 * Pacific Lutheran Bethel (MN) 41-1311-18-00 * St. John’s (MN) Wis.-Stout 26-1911-25-00 * Springfield Brockport 13-611-25-00 * Central (IA) Linfield (ot) 20-1712-2-00 * St. John’s (MN) Central (IA) 21-1812-2-00 * Mount Union Wittenberg 32-1512-9-00 #* St. John’s (MN) Hardin-Simmons 38-1411-10-01 † Williams Amherst (ot) 23-2011-17-01 * Western Conn. St. Westfield St. 8-711-24-01 * Wittenberg Thomas More 41-011-24-01 * Ithaca Rensselaer 27-1011-24-01 * Widener Wash. & Jeff. 46-3012-1-01 * Bridgewater (VA) Widener 57-3212-15-01 * Mount Union Bridgewater (VA) 30-2711-23-02 * Muhlenberg Mass.-Dartmouth 56-611-23-02 * Wittenberg Hanover 34-3311-23-02 * Wabash MacMurray 42-711-23-02 * Trinity (TX) Mary Hardin-Baylor 48-3811-30-02 * Brockport Rowan 15-1212-7-02 * Mount Union Wabash 45-1612-7-02 * St. John’s (MN) Linfield 21-1412-7-02 * Trinity (TX) Bridgewater (VA) 38-3212-21-02 * Mount Union Trinity (TX) 48-711-22-03 * Rensselaer Curry 34-2011-29-03 * Linfield Wartburg 23-2011-29-03 * Rensselaer Springfield 40-3411-29-03 * St. John’s (MN) St. Norbert 38-1312-6-03 * Mount Union Wheaton (IL) 56-1012-6-03 * St. John’s (MN) Linfield 31-2512-20-03 #^* St. John’s (MN) Mount Union 24-6
11-20-04 * Chris. Newport Salisbury 35-2411-20-04 * Wheaton (IL) Mt. St. Joseph 31-711-27-04 * Carthage Wooster 14-711-27-04 * Mary Hardin-Baylor Hardin-Simmons 42-2811-27-04 * Occidental Concordia-M’head 42-4012-4-04 * Rowan Delaware Valley 56-712-4-04 * Mary Hardin-Baylor Wash. & Jeff. 52-1612-11-04 #* Mary Hardin-Baylor Mount Union 38-3511-19-05 * Linfield Occidental 63-2111-19-05 * Mary Hardin-Baylor Trinity (TX) 35-611-19-05 * St. John’s (MN) Monmouth (IL) 62-311-26-05 * Bridgewater (VA) Thiel 24-1311-26-05 * Capital Wabash 14-1111-26-05 * Rowan Union (NY) 28-2411-26-05 * Wis.-Whitewater St. John’s (MN) 34-712-3-05 * Rowan Delaware Valley 27-2112-3-05 * Wis.-Whitewater Linfield 44-4112-17-05 * Mount Union Wis.-Whitewater 35-2811-18-06 * North Central (IL) Concordia (WI) 35-611-18-06 * Springfield Curry 42-1411-18-06 * Wis.-Whitewater St. Norbert 59-1711-18-06 * Whitworth Occidental 27-2311-18-06 * St. John's (MN) Central (IA) 21-1311-25-06 * Rowan Wilkes 21-1411-25-06 * Wesley Carnegie Mellon 37-011-25-06 * St. John's (MN) Whitworth 21-312-9-06 * Wis.-Whitewater Wesley 44-712-16-06 * Mount Union Wis.-Whitewater 35-1611-17-07 * Wis.-Eau Claire St. Norbert 24-2011-17-07 * N.C. Wesleyan Wash. & Jeff. 35-34 (ot)11-24-07 * St. John Fisher Curry 38-711-24-07 * Wesley Muhlenberg 38-2111-24-07 * Wabash Case 38-2312-1-07 * Bethel (MN) Central (IA) 27-1312-15-07 * Wis.-Whitewater Mount Union 31-2111-22-08 * Wabash Case 20-1711-22-08 * Wheaton (IL) Trine 14-011-22-08 * Willamette Occidental 48-3311-29-08 * Franklin North Central (IL) 38-2811-29-08 * Wartburg Monmouth (IL) 30-2811-29-08 * Wash. & Jeff. Millsaps 35-2011-29-08 * Wis.-Whitewater Willamette 30-2711-21-09 * Johns Hopkins Hampden-Sydney 23-711-21-09 * Trine Case 51-3811-21-09 * Coe St. John’s (MN) 34-2711-21-09 * St. Thomas (MN) Monmouth (IL) 43-2111-21-09 * Mary Hardin-Baylor Central (IA) 42-4011-28-09 * Johns Hopkins Thomas More 31-2912-5-09 * Wis.-Whitewater Wittenberg 31-1312-12-09 * Mount Union Wesley 24-712-12-09 * Wis.-Whitewater Linfield 27-1712-19-09 #* Wis.-Whitewater Mount Union 38-2811-20-10 * Alfred SUNY Maritime 60-011-20-10 * Bethel (MN) Wartburg 28-2011-20-10 * Ohio Northern Wittenberg 37-1411-27-10 * Mary Hardin-Baylor Thomas More 69-711-27-10 * Wis.-Whitewater Trine 45-3112-4-10 * Bethel (MN) St. Thomas (MN) 12-712-4-10 *Wis.-Whitewater North Central (IL) 20-1012-4-10 * Wesley Mary Hardin-Baylor 19-912-11-10 * Wis.-Whitewater Wesley 27-712-18-10 #* Wis.-Whitewater Mount Union 31-21‡NAIA championship playoff game. #Defeated four consecutive perfect-record teams in the Division III championship playoffs. $Ended Augustana’s (Illinois) 60-game undefeated streak. ^Ended Mount Union’s 55-game winning streak.
Date Spoiler Victim Score Date Spoiler Victim Score
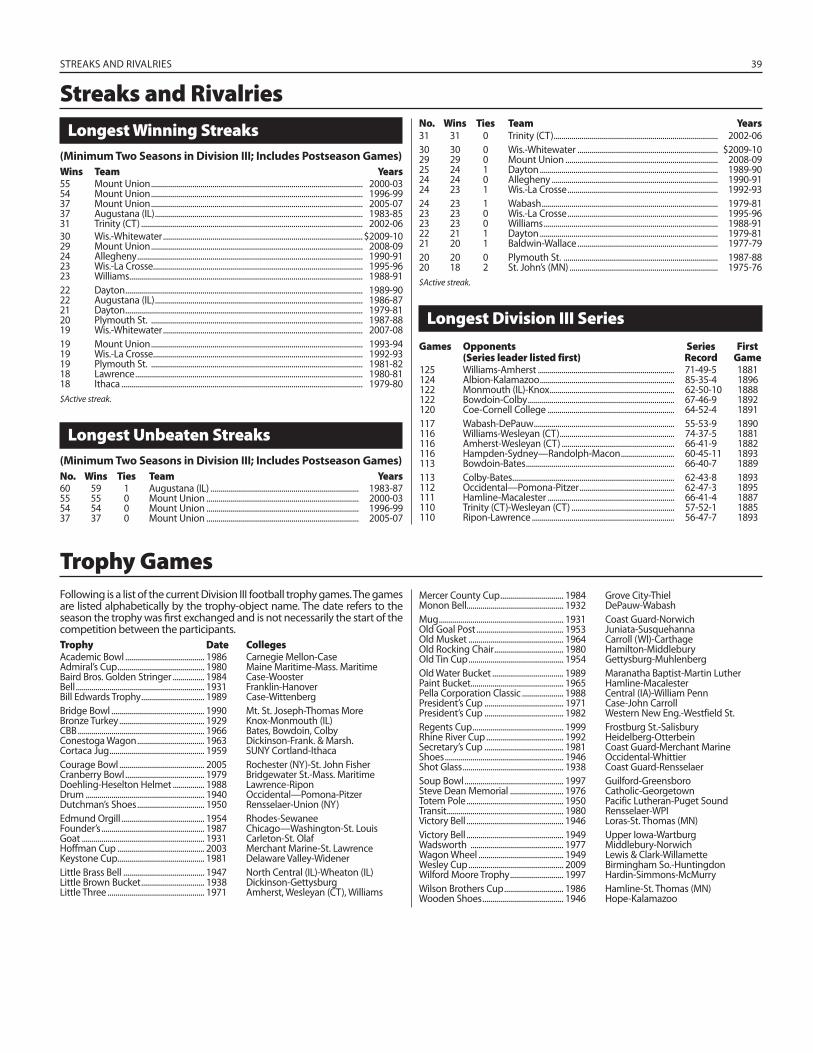
STREAKS AND RIVALRIES 39
Streaks and RivalriesLongest Winning Streaks
(Minimum Two Seasons in Division III; Includes Postseason Games)
Wins Team Years55 Mount Union ........................................................................................................... 2000-0354 Mount Union ........................................................................................................... 1996-9937 Mount Union ........................................................................................................... 2005-0737 Augustana (IL) ......................................................................................................... 1983-8531 Trinity (CT) ................................................................................................................ 2002-0630 Wis.-Whitewater ..................................................................................................... $2009-1029 Mount Union ........................................................................................................... 2008-0924 Allegheny .................................................................................................................. 1990-9123 Wis.-La Crosse.......................................................................................................... 1995-9623 Williams ...................................................................................................................... 1988-9122 Dayton ........................................................................................................................ 1989-9022 Augustana (IL) ......................................................................................................... 1986-8721 Dayton ........................................................................................................................ 1979-8120 Plymouth St. ........................................................................................................... 1987-8819 Wis.-Whitewater ..................................................................................................... 2007-0819 Mount Union ........................................................................................................... 1993-9419 Wis.-La Crosse.......................................................................................................... 1992-9319 Plymouth St. ........................................................................................................... 1981-8218 Lawrence ................................................................................................................... 1980-8118 Ithaca .......................................................................................................................... 1979-80$Active streak.
Longest Unbeaten Streaks(Minimum Two Seasons in Division III; Includes Postseason Games)
No. Wins Ties Team Years60 59 1 Augustana (IL) ........................................................................... 1983-8755 55 0 Mount Union ............................................................................. 2000-0354 54 0 Mount Union ............................................................................. 1996-9937 37 0 Mount Union ............................................................................. 2005-07
31 31 0 Trinity (CT) ................................................................................... 2002-0630 30 0 Wis.-Whitewater ....................................................................... $2009-1029 29 0 Mount Union ............................................................................. 2008-0925 24 1 Dayton .......................................................................................... 1989-9024 24 0 Allegheny .................................................................................... 1990-9124 23 1 Wis.-La Crosse ............................................................................ 1992-9324 23 1 Wabash ......................................................................................... 1979-8123 23 0 Wis.-La Crosse ............................................................................ 1995-9623 23 0 Williams ........................................................................................ 1988-9122 21 1 Dayton .......................................................................................... 1979-8121 20 1 Baldwin-Wallace ....................................................................... 1977-7920 20 0 Plymouth St. .............................................................................. 1987-8820 18 2 St. John’s (MN) ........................................................................... 1975-76$Active streak.
Longest Division III SeriesGames Opponents Series First (Series leader listed first) Record Game 125 Williams-Amherst ..................................................................... 71-49-5 1881 124 Albion-Kalamazoo .................................................................... 85-35-4 1896 122 Monmouth (IL)-Knox ............................................................... 62-50-10 1888 122 Bowdoin-Colby .......................................................................... 67-46-9 1892 120 Coe-Cornell College ................................................................ 64-52-4 1891 117 Wabash-DePauw ....................................................................... 55-53-9 1890 116 Williams-Wesleyan (CT) .......................................................... 74-37-5 1881 116 Amherst-Wesleyan (CT) ......................................................... 66-41-9 1882 116 Hampden-Sydney—Randolph-Macon ........................... 60-45-11 1893 113 Bowdoin-Bates ........................................................................... 66-40-7 1889 113 Colby-Bates.................................................................................. 62-43-8 1893 112 Occidental—Pomona-Pitzer ................................................ 62-47-3 1895 111 Hamline-Macalester ................................................................ 66-41-4 1887 110 Trinity (CT)-Wesleyan (CT) .................................................... 57-52-1 1885 110 Ripon-Lawrence ........................................................................ 56-47-7 1893
Following is a list of the current Division III football trophy games. The games are listed alphabetically by the trophy-object name. The date refers to the season the trophy was fi rst exchanged and is not necessarily the start of the competition between the participants.Trophy Date CollegesAcademic Bowl ........................................ 1986 Carnegie Mellon-CaseAdmiral’s Cup ............................................ 1980 Maine Maritime-Mass. MaritimeBaird Bros. Golden Stringer ................ 1984 Case-WoosterBell ................................................................. 1931 Franklin-HanoverBill Edwards Trophy ................................ 1989 Case-WittenbergBridge Bowl ............................................... 1990 Mt. St. Joseph-Thomas MoreBronze Turkey ........................................... 1929 Knox-Monmouth (IL)CBB ................................................................ 1966 Bates, Bowdoin, ColbyConestoga Wagon .................................. 1963 Dickinson-Frank. & Marsh.Cortaca Jug ................................................ 1959 SUNY Cortland-IthacaCourage Bowl ........................................... 2005 Rochester (NY)-St. John FisherCranberry Bowl ........................................ 1979 Bridgewater St.-Mass. MaritimeDoehling-Heselton Helmet ................ 1988 Lawrence-RiponDrum ............................................................ 1940 Occidental—Pomona-PitzerDutchman’s Shoes .................................. 1950 Rensselaer-Union (NY)Edmund Orgill .......................................... 1954 Rhodes-SewaneeFounder’s .................................................... 1987 Chicago—Washington-St. LouisGoat .............................................................. 1931 Carleton-St. OlafHoffman Cup ............................................ 2003 Merchant Marine-St. LawrenceKeystone Cup............................................ 1981 Delaware Valley-WidenerLittle Brass Bell ......................................... 1947 North Central (IL)-Wheaton (IL)Little Brown Bucket ................................ 1938 Dickinson-GettysburgLittle Three ................................................. 1971 Amherst, Wesleyan (CT), Williams
Trophy GamesMercer County Cup ................................ 1984 Grove City-ThielMonon Bell................................................. 1932 DePauw-WabashMug ............................................................... 1931 Coast Guard-NorwichOld Goal Post ............................................ 1953 Juniata-SusquehannaOld Musket ................................................ 1964 Carroll (WI)-CarthageOld Rocking Chair ................................... 1980 Hamilton-MiddleburyOld Tin Cup ................................................ 1954 Gettysburg-MuhlenbergOld Water Bucket .................................... 1989 Maranatha Baptist-Martin LutherPaint Bucket............................................... 1965 Hamline-MacalesterPella Corporation Classic ..................... 1988 Central (IA)-William PennPresident’s Cup ........................................ 1971 Case-John CarrollPresident’s Cup ........................................ 1982 Western New Eng.-Westfield St.Regents Cup .............................................. 1999 Frostburg St.-SalisburyRhine River Cup ....................................... 1992 Heidelberg-OtterbeinSecretary’s Cup ........................................ 1981 Coast Guard-Merchant MarineShoes ............................................................ 1946 Occidental-WhittierShot Glass ................................................... 1938 Coast Guard-RensselaerSoup Bowl .................................................. 1997 Guilford-GreensboroSteve Dean Memorial ........................... 1976 Catholic-GeorgetownTotem Pole ................................................. 1950 Pacific Lutheran-Puget SoundTransit ........................................................... 1980 Rensselaer-WPIVictory Bell ................................................. 1946 Loras-St. Thomas (MN)Victory Bell ................................................. 1949 Upper Iowa-WartburgWadsworth ............................................... 1977 Middlebury-NorwichWagon Wheel ........................................... 1949 Lewis & Clark-WillametteWesley Cup ................................................ 2009 Birmingham So.-HuntingdonWilford Moore Trophy ........................... 1997 Hardin-Simmons-McMurryWilson Brothers Cup .............................. 1986 Hamline-St. Thomas (MN)Wooden Shoes ......................................... 1946 Hope-Kalamazoo
No. Wins Ties Team Years
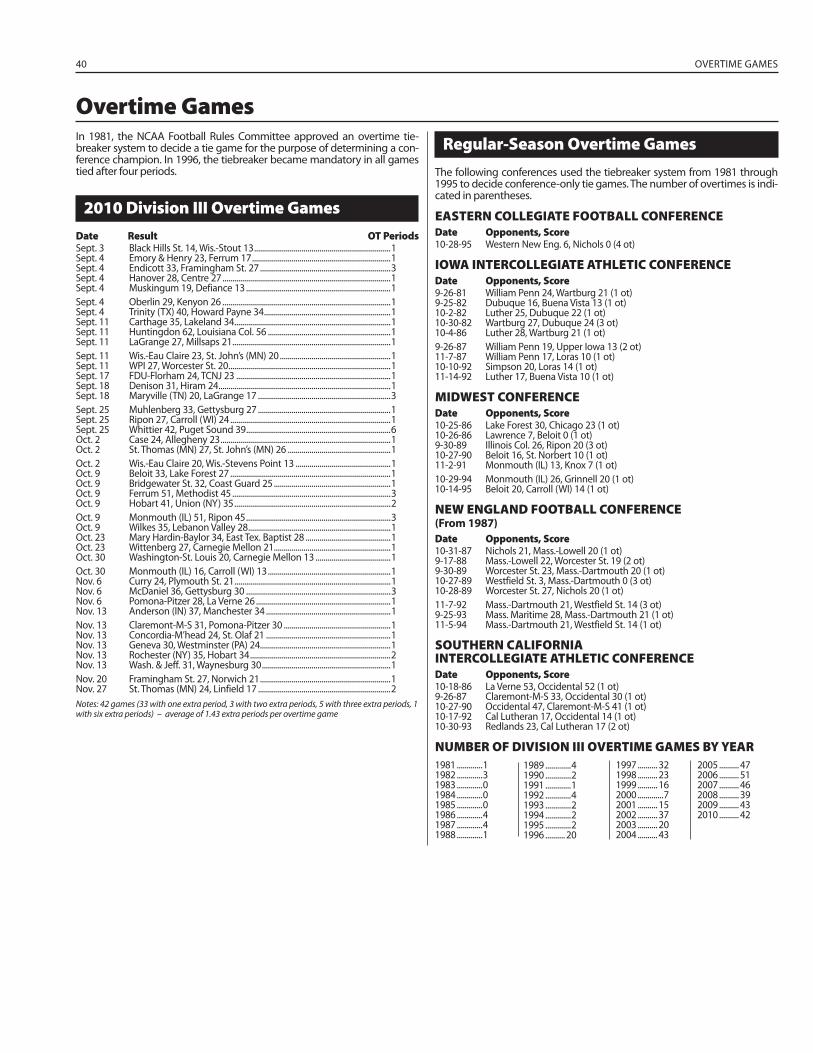
40 OVERTIME GAMES
In 1981, the NCAA Football Rules Committee approved an overtime tie-breaker system to decide a tie game for the purpose of determining a con-ference champion. In 1996, the tiebreaker became mandatory in all games tied after four periods.
2010 Division III Overtime GamesDate Result OT PeriodsSept. 3 Black Hills St. 14, Wis.-Stout 13 .....................................................................1Sept. 4 Emory & Henry 23, Ferrum 17 ......................................................................1Sept. 4 Endicott 33, Framingham St. 27 ..................................................................3Sept. 4 Hanover 28, Centre 27 .....................................................................................1Sept. 4 Muskingum 19, Defiance 13 .........................................................................1Sept. 4 Oberlin 29, Kenyon 26 .....................................................................................1Sept. 4 Trinity (TX) 40, Howard Payne 34 ................................................................1Sept. 11 Carthage 35, Lakeland 34 ...............................................................................1Sept. 11 Huntingdon 62, Louisiana Col. 56 ..............................................................1Sept. 11 LaGrange 27, Millsaps 21 ................................................................................1Sept. 11 Wis.-Eau Claire 23, St. John’s (MN) 20 ........................................................1Sept. 11 WPI 27, Worcester St. 20 ..................................................................................1Sept. 17 FDU-Florham 24, TCNJ 23 ..............................................................................1Sept. 18 Denison 31, Hiram 24 .......................................................................................1Sept. 18 Maryville (TN) 20, LaGrange 17 ...................................................................3Sept. 25 Muhlenberg 33, Gettysburg 27 ...................................................................1Sept. 25 Ripon 27, Carroll (WI) 24 .................................................................................1Sept. 25 Whittier 42, Puget Sound 39 .........................................................................6Oct. 2 Case 24, Allegheny 23 ......................................................................................1Oct. 2 St. Thomas (MN) 27, St. John’s (MN) 26 ....................................................1Oct. 2 Wis.-Eau Claire 20, Wis.-Stevens Point 13 ................................................1Oct. 9 Beloit 33, Lake Forest 27 .................................................................................1Oct. 9 Bridgewater St. 32, Coast Guard 25 ...........................................................1Oct. 9 Ferrum 51, Methodist 45 ................................................................................3Oct. 9 Hobart 41, Union (NY) 35 ...............................................................................2Oct. 9 Monmouth (IL) 51, Ripon 45 .........................................................................3Oct. 9 Wilkes 35, Lebanon Valley 28 ........................................................................1Oct. 23 Mary Hardin-Baylor 34, East Tex. Baptist 28 ...........................................1Oct. 23 Wittenberg 27, Carnegie Mellon 21...........................................................1Oct. 30 Washington-St. Louis 20, Carnegie Mellon 13 ......................................1Oct. 30 Monmouth (IL) 16, Carroll (WI) 13 ..............................................................1Nov. 6 Curry 24, Plymouth St. 21 ...............................................................................1Nov. 6 McDaniel 36, Gettysburg 30 .........................................................................3Nov. 6 Pomona-Pitzer 28, La Verne 26 ....................................................................1Nov. 13 Anderson (IN) 37, Manchester 34 ...............................................................1Nov. 13 Claremont-M-S 31, Pomona-Pitzer 30 ......................................................1Nov. 13 Concordia-M’head 24, St. Olaf 21 ...............................................................1Nov. 13 Geneva 30, Westminster (PA) 24..................................................................1Nov. 13 Rochester (NY) 35, Hobart 34 .......................................................................2Nov. 13 Wash. & Jeff. 31, Waynesburg 30 .................................................................1Nov. 20 Framingham St. 27, Norwich 21 ..................................................................1Nov. 27 St. Thomas (MN) 24, Linfield 17 ...................................................................2Notes: 42 games (33 with one extra period, 3 with two extra periods, 5 with three extra periods, 1 with six extra periods) – average of 1.43 extra periods per overtime game
Overtime GamesRegular-Season Overtime Games
The following conferences used the tiebreaker system from 1981 through 1995 to decide conference-only tie games. The number of overtimes is indi-cated in parentheses.
EASTERN COLLEGIATE FOOTBALL CONFERENCEDate Opponents, Score10-28-95 Western New Eng. 6, Nichols 0 (4 ot)
IOWA INTERCOLLEGIATE ATHLETIC CONFERENCEDate Opponents, Score9-26-81 William Penn 24, Wartburg 21 (1 ot)9-25-82 Dubuque 16, Buena Vista 13 (1 ot)10-2-82 Luther 25, Dubuque 22 (1 ot)10-30-82 Wartburg 27, Dubuque 24 (3 ot)10-4-86 Luther 28, Wartburg 21 (1 ot)9-26-87 William Penn 19, Upper Iowa 13 (2 ot)11-7-87 William Penn 17, Loras 10 (1 ot)10-10-92 Simpson 20, Loras 14 (1 ot)11-14-92 Luther 17, Buena Vista 10 (1 ot)
MIDWEST CONFERENCEDate Opponents, Score10-25-86 Lake Forest 30, Chicago 23 (1 ot)10-26-86 Lawrence 7, Beloit 0 (1 ot)9-30-89 Illinois Col. 26, Ripon 20 (3 ot)10-27-90 Beloit 16, St. Norbert 10 (1 ot)11-2-91 Monmouth (IL) 13, Knox 7 (1 ot)10-29-94 Monmouth (IL) 26, Grinnell 20 (1 ot)10-14-95 Beloit 20, Carroll (WI) 14 (1 ot)
NEW ENGLAND FOOTBALL CONFERENCE(From 1987)
Date Opponents, Score10-31-87 Nichols 21, Mass.-Lowell 20 (1 ot)9-17-88 Mass.-Lowell 22, Worcester St. 19 (2 ot)9-30-89 Worcester St. 23, Mass.-Dartmouth 20 (1 ot)10-27-89 Westfield St. 3, Mass.-Dartmouth 0 (3 ot)10-28-89 Worcester St. 27, Nichols 20 (1 ot)11-7-92 Mass.-Dartmouth 21, Westfield St. 14 (3 ot)9-25-93 Mass. Maritime 28, Mass.-Dartmouth 21 (1 ot)11-5-94 Mass.-Dartmouth 21, Westfield St. 14 (1 ot)
SOUTHERN CALIFORNIAINTERCOLLEGIATE ATHLETIC CONFERENCEDate Opponents, Score10-18-86 La Verne 53, Occidental 52 (1 ot)9-26-87 Claremont-M-S 33, Occidental 30 (1 ot)10-27-90 Occidental 47, Claremont-M-S 41 (1 ot)10-17-92 Cal Lutheran 17, Occidental 14 (1 ot)10-30-93 Redlands 23, Cal Lutheran 17 (2 ot)
NUMBER OF DIVISION III OVERTIME GAMES BY YEAR1981 .............11982 .............31983 .............01984 .............01985 .............01986 .............41987 .............41988 .............1
1989 .............41990 .............21991 .............11992 .............41993 .............21994 .............21995 .............21996 ..........20
1997 ..........321998 ..........231999 ..........162000 .............72001 ..........152002 ..........372003 ..........202004 ..........43
2005 ..........472006 ..........512007 ..........462008 ..........392009 ..........432010 ..........42
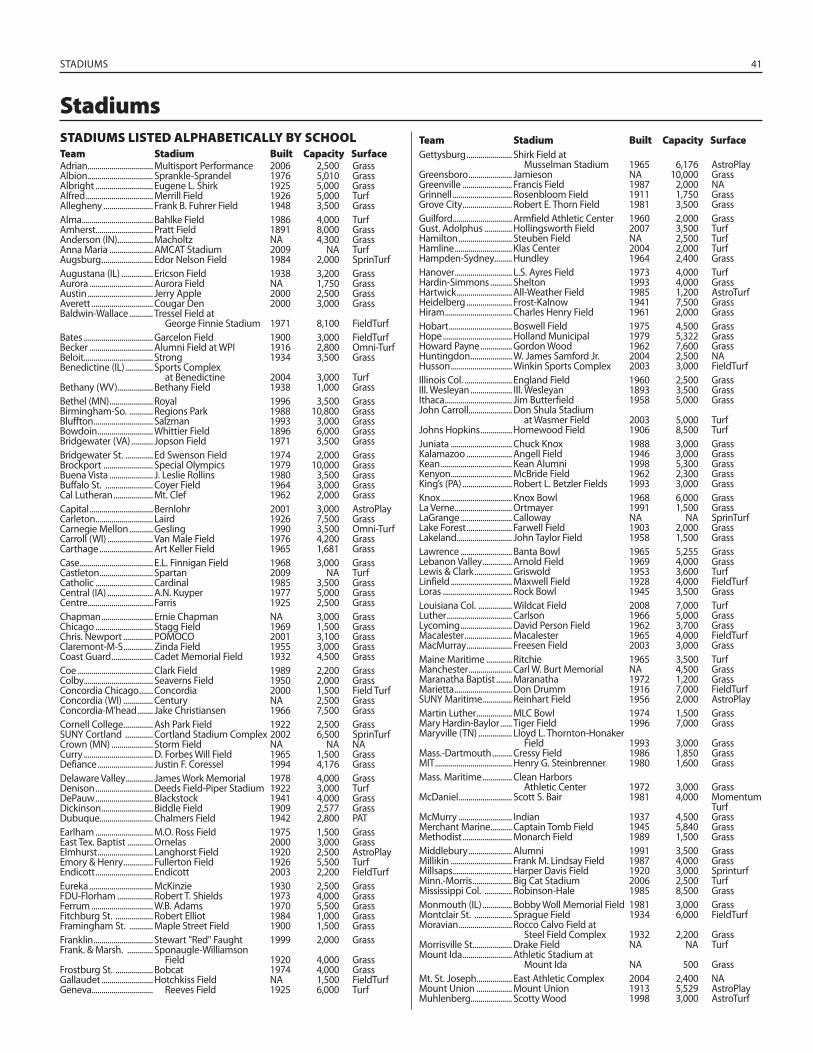
STADIUMS 41
STADIUMS LISTED ALPHABETICALLY BY SCHOOLTeam Stadium Built Capacity SurfaceAdrian ................................. Multisport Performance 2006 2,500 GrassAlbion ................................. Sprankle-Sprandel 1976 5,010 GrassAlbright ............................. Eugene L. Shirk 1925 5,000 GrassAlfred .................................. Merrill Field 1926 5,000 TurfAllegheny ......................... Frank B. Fuhrer Field 1948 3,500 GrassAlma .................................... Bahlke Field 1986 4,000 TurfAmherst ............................. Pratt Field 1891 8,000 GrassAnderson (IN) .................. Macholtz NA 4,300 GrassAnna Maria ...................... AMCAT Stadium 2009 NA TurfAugsburg .......................... Edor Nelson Field 1984 2,000 SprinTurfAugustana (IL) ................ Ericson Field 1938 3,200 GrassAurora ................................ Aurora Field NA 1,750 GrassAustin ................................. Jerry Apple 2000 2,500 GrassAverett ............................... Cougar Den 2000 3,000 GrassBaldwin-Wallace ............ Tressel Field at
George Finnie Stadium 1971 8,100 FieldTurfBates ................................... Garcelon Field 1900 3,000 FieldTurfBecker ................................ Alumni Field at WPI 1916 2,800 Omni-TurfBeloit................................... Strong 1934 3,500 GrassBenedictine (IL) .............. Sports Complex
at Benedictine 2004 3,000 TurfBethany (WV).................. Bethany Field 1938 1,000 GrassBethel (MN) ...................... Royal 1996 3,500 GrassBirmingham-So. ............ Regions Park 1988 10,800 GrassBluffton .............................. Salzman 1993 3,000 GrassBowdoin ............................ Whittier Field 1896 6,000 GrassBridgewater (VA) ........... Jopson Field 1971 3,500 GrassBridgewater St. .............. Ed Swenson Field 1974 2,000 GrassBrockport ......................... Special Olympics 1979 10,000 GrassBuena Vista ...................... J. Leslie Rollins 1980 3,500 GrassBuffalo St. ........................ Coyer Field 1964 3,000 GrassCal Lutheran .................... Mt. Clef 1962 2,000 GrassCapital ................................ Bernlohr 2001 3,000 AstroPlayCarleton ............................. Laird 1926 7,500 GrassCarnegie Mellon ............ Gesling 1990 3,500 Omni-TurfCarroll (WI) ....................... Van Male Field 1976 4,200 GrassCarthage ........................... Art Keller Field 1965 1,681 GrassCase ..................................... E.L. Finnigan Field 1968 3,000 GrassCastleton ........................... Spartan 2009 NA TurfCatholic ............................. Cardinal 1985 3,500 GrassCentral (IA) ....................... A.N. Kuyper 1977 5,000 GrassCentre ................................. Farris 1925 2,500 GrassChapman .......................... Ernie Chapman NA 3,000 GrassChicago ............................. Stagg Field 1969 1,500 GrassChris. Newport ............... POMOCO 2001 3,100 GrassClaremont-M-S ............... Zinda Field 1955 3,000 GrassCoast Guard ..................... Cadet Memorial Field 1932 4,500 GrassCoe ...................................... Clark Field 1989 2,200 GrassColby................................... Seaverns Field 1950 2,000 GrassConcordia Chicago ....... Concordia 2000 1,500 Field TurfConcordia (WI) ............... Century NA 2,500 GrassConcordia-M’head ........ Jake Christiansen 1966 7,500 GrassCornell College ............... Ash Park Field 1922 2,500 GrassSUNY Cortland .............. Cortland Stadium Complex 2002 6,500 SprinTurfCrown (MN) ..................... Storm Field NA NA NACurry ................................... D. Forbes Will Field 1965 1,500 GrassDefiance ............................ Justin F. Coressel 1994 4,176 GrassDelaware Valley.............. James Work Memorial 1978 4,000 GrassDenison ............................. Deeds Field-Piper Stadium 1922 3,000 TurfDePauw ............................. Blackstock 1941 4,000 GrassDickinson .......................... Biddle Field 1909 2,577 GrassDubuque........................... Chalmers Field 1942 2,800 PATEarlham ............................. M.O. Ross Field 1975 1,500 GrassEast Tex. Baptist ............. Ornelas 2000 3,000 GrassElmhurst ............................ Langhorst Field 1920 2,500 AstroPlayEmory & Henry ............... Fullerton Field 1926 5,500 TurfEndicott ............................. Endicott 2003 2,200 FieldTurfEureka ................................ McKinzie 1930 2,500 GrassFDU-Florham .................. Robert T. Shields 1973 4,000 GrassFerrum ............................... W.B. Adams 1970 5,500 GrassFitchburg St. ................... Robert Elliot 1984 1,000 GrassFramingham St. ............ Maple Street Field 1900 1,500 GrassFranklin .............................. Stewart "Red" Faught 1999 2,000 GrassFrank. & Marsh. ............. Sponaugle-Williamson
Field 1920 4,000 GrassFrostburg St. ................... Bobcat 1974 4,000 GrassGallaudet .......................... Hotchkiss Field NA 1,500 FieldTurfGeneva............................... Reeves Field 1925 6,000 Turf
Gettysburg ....................... Shirk Field atMusselman Stadium 1965 6,176 AstroPlay
Greensboro ...................... Jamieson NA 10,000 GrassGreenville ......................... Francis Field 1987 2,000 NAGrinnell .............................. Rosenbloom Field 1911 1,750 GrassGrove City ......................... Robert E. Thorn Field 1981 3,500 GrassGuilford .............................. Armfield Athletic Center 1960 2,000 GrassGust. Adolphus .............. Hollingsworth Field 2007 3,500 TurfHamilton ........................... Steuben Field NA 2,500 TurfHamline ............................. Klas Center 2004 2,000 TurfHampden-Sydney ......... Hundley 1964 2,400 GrassHanover ............................. L.S. Ayres Field 1973 4,000 TurfHardin-Simmons ........... Shelton 1993 4,000 GrassHartwick ............................ All-Weather Field 1985 1,200 AstroTurfHeidelberg ....................... Frost-Kalnow 1941 7,500 GrassHiram .................................. Charles Henry Field 1961 2,000 GrassHobart ................................ Boswell Field 1975 4,500 GrassHope ................................... Holland Municipal 1979 5,322 GrassHoward Payne ................ Gordon Wood 1962 7,600 GrassHuntingdon ..................... W. James Samford Jr. 2004 2,500 NAHusson ............................... Winkin Sports Complex 2003 3,000 FieldTurfIllinois Col. ........................ England Field 1960 2,500 GrassIll. Wesleyan ..................... Ill. Wesleyan 1893 3,500 GrassIthaca .................................. Jim Butterfield 1958 5,000 GrassJohn Carroll...................... Don Shula Stadium
at Wasmer Field 2003 5,000 TurfJohns Hopkins ................ Homewood Field 1906 8,500 TurfJuniata ............................... Chuck Knox 1988 3,000 GrassKalamazoo ....................... Angell Field 1946 3,000 GrassKean .................................... Kean Alumni 1998 5,300 GrassKenyon ............................... McBride Field 1962 2,300 GrassKing’s (PA) ......................... Robert L. Betzler Fields 1993 3,000 GrassKnox .................................... Knox Bowl 1968 6,000 GrassLa Verne ............................. Ortmayer 1991 1,500 GrassLaGrange .......................... Calloway NA NA SprinTurfLake Forest ....................... Farwell Field 1903 2,000 GrassLakeland ............................ John Taylor Field 1958 1,500 GrassLawrence .......................... Banta Bowl 1965 5,255 GrassLebanon Valley ............... Arnold Field 1969 4,000 GrassLewis & Clark ................... Griswold 1953 3,600 TurfLinfield ............................... Maxwell Field 1928 4,000 FieldTurfLoras ................................... Rock Bowl 1945 3,500 GrassLouisiana Col. ................. Wildcat Field 2008 7,000 TurfLuther ................................. Carlson 1966 5,000 GrassLycoming .......................... David Person Field 1962 3,700 GrassMacalester ........................ Macalester 1965 4,000 FieldTurfMacMurray ....................... Freesen Field 2003 3,000 GrassMaine Maritime ............. Ritchie 1965 3,500 TurfManchester ...................... Carl W. Burt Memorial NA 4,500 GrassMaranatha Baptist ........ Maranatha 1972 1,200 GrassMarietta ............................. Don Drumm 1916 7,000 FieldTurfSUNY Maritime ............... Reinhart Field 1956 2,000 AstroPlayMartin Luther .................. MLC Bowl 1974 1,500 GrassMary Hardin-Baylor ...... Tiger Field 1996 7,000 GrassMaryville (TN) ................. Lloyd L. Thornton-Honaker
Field 1993 3,000 GrassMass.-Dartmouth .......... Cressy Field 1986 1,850 GrassMIT ....................................... Henry G. Steinbrenner 1980 1,600 GrassMass. Maritime ............... Clean Harbors
Athletic Center 1972 3,000 GrassMcDaniel ........................... Scott S. Bair 1981 4,000 Momentum
TurfMcMurry ........................... Indian 1937 4,500 GrassMerchant Marine........... Captain Tomb Field 1945 5,840 GrassMethodist ......................... Monarch Field 1989 1,500 GrassMiddlebury ...................... Alumni 1991 3,500 GrassMillikin ............................... Frank M. Lindsay Field 1987 4,000 GrassMillsaps .............................. Harper Davis Field 1920 3,000 SprinturfMinn.-Morris .................... Big Cat Stadium 2006 2,500 TurfMississippi Col. .............. Robinson-Hale 1985 8,500 GrassMonmouth (IL) ............... Bobby Woll Memorial Field 1981 3,000 GrassMontclair St. ................... Sprague Field 1934 6,000 FieldTurfMoravian ........................... Rocco Calvo Field at
Steel Field Complex 1932 2,200 GrassMorrisville St. ................... Drake Field NA NA TurfMount Ida ......................... Athletic Stadium at
Mount Ida NA 500 GrassMt. St. Joseph .................. East Athletic Complex 2004 2,400 NAMount Union .................. Mount Union 1913 5,529 AstroPlayMuhlenberg..................... Scotty Wood 1998 3,000 AstroTurf
Team Stadium Built Capacity Surface
Stadiums
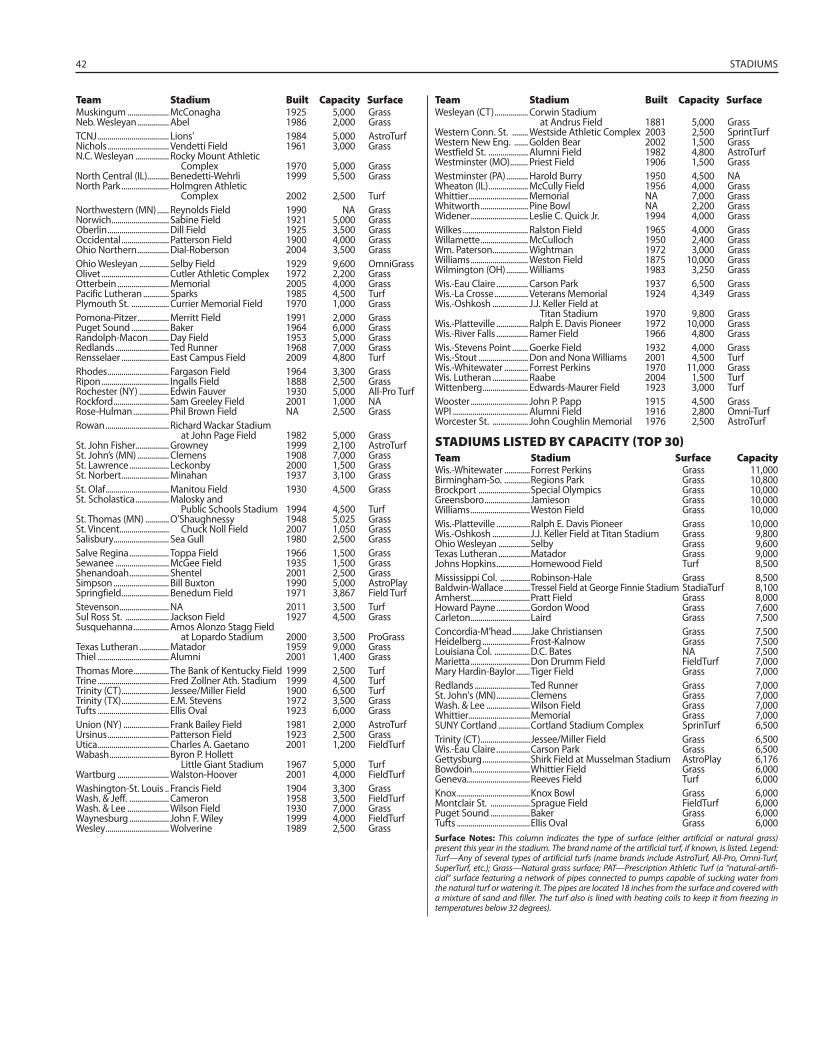
42 STADIUMS
Muskingum ..................... McConagha 1925 5,000 GrassNeb. Wesleyan ................ Abel 1986 2,000 GrassTCNJ .................................... Lions' 1984 5,000 AstroTurfNichols ............................... Vendetti Field 1961 3,000 GrassN.C. Wesleyan ................. Rocky Mount Athletic
Complex 1970 5,000 GrassNorth Central (IL) ........... Benedetti-Wehrli 1999 5,500 GrassNorth Park ........................ Holmgren Athletic
Complex 2002 2,500 TurfNorthwestern (MN) ...... Reynolds Field 1990 NA GrassNorwich ............................. Sabine Field 1921 5,000 GrassOberlin ............................... Dill Field 1925 3,500 GrassOccidental ........................ Patterson Field 1900 4,000 GrassOhio Northern ................ Dial-Roberson 2004 3,500 GrassOhio Wesleyan ............... Selby Field 1929 9,600 OmniGrassOlivet .................................. Cutler Athletic Complex 1972 2,200 GrassOtterbein .......................... Memorial 2005 4,000 GrassPacific Lutheran ............. Sparks 1985 4,500 TurfPlymouth St. ................... Currier Memorial Field 1970 1,000 GrassPomona-Pitzer ................ Merritt Field 1991 2,000 GrassPuget Sound ................... Baker 1964 6,000 GrassRandolph-Macon .......... Day Field 1953 5,000 GrassRedlands ........................... Ted Runner 1968 7,000 GrassRensselaer ........................ East Campus Field 2009 4,800 TurfRhodes ............................... Fargason Field 1964 3,300 GrassRipon .................................. Ingalls Field 1888 2,500 GrassRochester (NY) ............... Edwin Fauver 1930 5,000 All-Pro TurfRockford ............................ Sam Greeley Field 2001 1,000 NARose-Hulman .................. Phil Brown Field NA 2,500 GrassRowan ................................ Richard Wackar Stadium
at John Page Field 1982 5,000 GrassSt. John Fisher................. Growney 1999 2,100 AstroTurfSt. John’s (MN) ................ Clemens 1908 7,000 GrassSt. Lawrence .................... Leckonby 2000 1,500 GrassSt. Norbert ........................ Minahan 1937 3,100 GrassSt. Olaf ................................ Manitou Field 1930 4,500 GrassSt. Scholastica ................. Malosky and
Public Schools Stadium 1994 4,500 TurfSt. Thomas (MN) ............ O’Shaughnessy 1948 5,025 GrassSt. Vincent ......................... Chuck Noll Field 2007 1,050 GrassSalisbury............................ Sea Gull 1980 2,500 GrassSalve Regina .................... Toppa Field 1966 1,500 GrassSewanee ........................... McGee Field 1935 1,500 GrassShenandoah .................... Shentel 2001 2,500 GrassSimpson ............................ Bill Buxton 1990 5,000 AstroPlaySpringfield ........................ Benedum Field 1971 3,867 Field TurfStevenson ......................... NA 2011 3,500 TurfSul Ross St. ...................... Jackson Field 1927 4,500 GrassSusquehanna .................. Amos Alonzo Stagg Field
at Lopardo Stadium 2000 3,500 ProGrassTexas Lutheran ............... Matador 1959 9,000 GrassThiel .................................... Alumni 2001 1,400 GrassThomas More .................. The Bank of Kentucky Field 1999 2,500 TurfTrine .................................... Fred Zollner Ath. Stadium 1999 4,500 TurfTrinity (CT) ........................ Jessee/Miller Field 1900 6,500 TurfTrinity (TX) ........................ E.M. Stevens 1972 3,500 GrassTufts .................................... Ellis Oval 1923 6,000 GrassUnion (NY) ....................... Frank Bailey Field 1981 2,000 AstroTurfUrsinus ............................... Patterson Field 1923 2,500 GrassUtica .................................... Charles A. Gaetano 2001 1,200 FieldTurfWabash .............................. Byron P. Hollett
Little Giant Stadium 1967 5,000 TurfWartburg .......................... Walston-Hoover 2001 4,000 FieldTurfWashington-St. Louis .. Francis Field 1904 3,300 GrassWash. & Jeff. .................... Cameron 1958 3,500 FieldTurfWash. & Lee ..................... Wilson Field 1930 7,000 GrassWaynesburg .................... John F. Wiley 1999 4,000 FieldTurfWesley ................................ Wolverine 1989 2,500 Grass
Team Stadium Built Capacity SurfaceWesleyan (CT) ................. Corwin Stadium
at Andrus Field 1881 5,000 GrassWestern Conn. St. ........ Westside Athletic Complex 2003 2,500 SprintTurfWestern New Eng. ....... Golden Bear 2002 1,500 GrassWestfield St. .................... Alumni Field 1982 4,800 AstroTurfWestminster (MO) ......... Priest Field 1906 1,500 GrassWestminster (PA) ........... Harold Burry 1950 4,500 NAWheaton (IL) .................... McCully Field 1956 4,000 GrassWhittier .............................. Memorial NA 7,000 GrassWhitworth ........................ Pine Bowl NA 2,200 GrassWidener ............................. Leslie C. Quick Jr. 1994 4,000 GrassWilkes ................................. Ralston Field 1965 4,000 GrassWillamette ........................ McCulloch 1950 2,400 GrassWm. Paterson .................. Wightman 1972 3,000 GrassWilliams ............................. Weston Field 1875 10,000 GrassWilmington (OH) ........... Williams 1983 3,250 GrassWis.-Eau Claire ................ Carson Park 1937 6,500 GrassWis.-La Crosse ................. Veterans Memorial 1924 4,349 GrassWis.-Oshkosh .................. J.J. Keller Field at
Titan Stadium 1970 9,800 GrassWis.-Platteville ................ Ralph E. Davis Pioneer 1972 10,000 GrassWis.-River Falls ................ Ramer Field 1966 4,800 GrassWis.-Stevens Point ........ Goerke Field 1932 4,000 GrassWis.-Stout ......................... Don and Nona Williams 2001 4,500 TurfWis.-Whitewater ............ Forrest Perkins 1970 11,000 GrassWis. Lutheran .................. Raabe 2004 1,500 TurfWittenberg ....................... Edwards-Maurer Field 1923 3,000 TurfWooster ............................. John P. Papp 1915 4,500 GrassWPI ...................................... Alumni Field 1916 2,800 Omni-TurfWorcester St. .................. John Coughlin Memorial 1976 2,500 AstroTurf
STADIUMS LISTED BY CAPACITY (TOP 30)Team Stadium Surface CapacityWis.-Whitewater .............Forrest Perkins Grass 11,000Birmingham-So. .............Regions Park Grass 10,800Brockport ..........................Special Olympics Grass 10,000Greensboro .......................Jamieson Grass 10,000Williams ..............................Weston Field Grass 10,000Wis.-Platteville .................Ralph E. Davis Pioneer Grass 10,000Wis.-Oshkosh ...................J.J. Keller Field at Titan Stadium Grass 9,800Ohio Wesleyan ................Selby Grass 9,600Texas Lutheran ................Matador Grass 9,000Johns Hopkins .................Homewood Field Turf 8,500Mississippi Col. ...............Robinson-Hale Grass 8,500Baldwin-Wallace .............Tressel Field at George Finnie Stadium StadiaTurf 8,100Amherst ..............................Pratt Field Grass 8,000Howard Payne .................Gordon Wood Grass 7,600Carleton ..............................Laird Grass 7,500Concordia-M’head .........Jake Christiansen Grass 7,500Heidelberg ........................Frost-Kalnow Grass 7,500Louisiana Col. ..................D.C. Bates NA 7,500Marietta ..............................Don Drumm Field FieldTurf 7,000Mary Hardin-Baylor .......Tiger Field Grass 7,000Redlands ............................Ted Runner Grass 7,000St. John's (MN) .................Clemens Grass 7,000Wash. & Lee ......................Wilson Field Grass 7,000Whittier ...............................Memorial Grass 7,000SUNY Cortland ................Cortland Stadium Complex SprinTurf 6,500Trinity (CT) .........................Jessee/Miller Field Grass 6,500Wis.-Eau Claire .................Carson Park Grass 6,500Gettysburg ........................Shirk Field at Musselman Stadium AstroPlay 6,176Bowdoin .............................Whittier Field Grass 6,000Geneva................................Reeves Field Turf 6,000Knox .....................................Knox Bowl Grass 6,000Montclair St. ....................Sprague Field FieldTurf 6,000Puget Sound ....................Baker Grass 6,000Tufts .....................................Ellis Oval Grass 6,000Surface Notes: This column indicates the type of surface (either artificial or natural grass) present this year in the stadium. The brand name of the artificial turf, if known, is listed. Legend: Turf—Any of several types of artificial turfs (name brands include AstroTurf, All-Pro, Omni-Turf, SuperTurf, etc.); Grass—Natural grass surface; PAT—Prescription Athletic Turf (a “natural-artifi-cial” surface featuring a network of pipes connected to pumps capable of sucking water from the natural turf or watering it. The pipes are located 18 inches from the surface and covered with a mixture of sand and filler. The turf also is lined with heating coils to keep it from freezing in temperatures below 32 degrees).
Team Stadium Built Capacity Surface
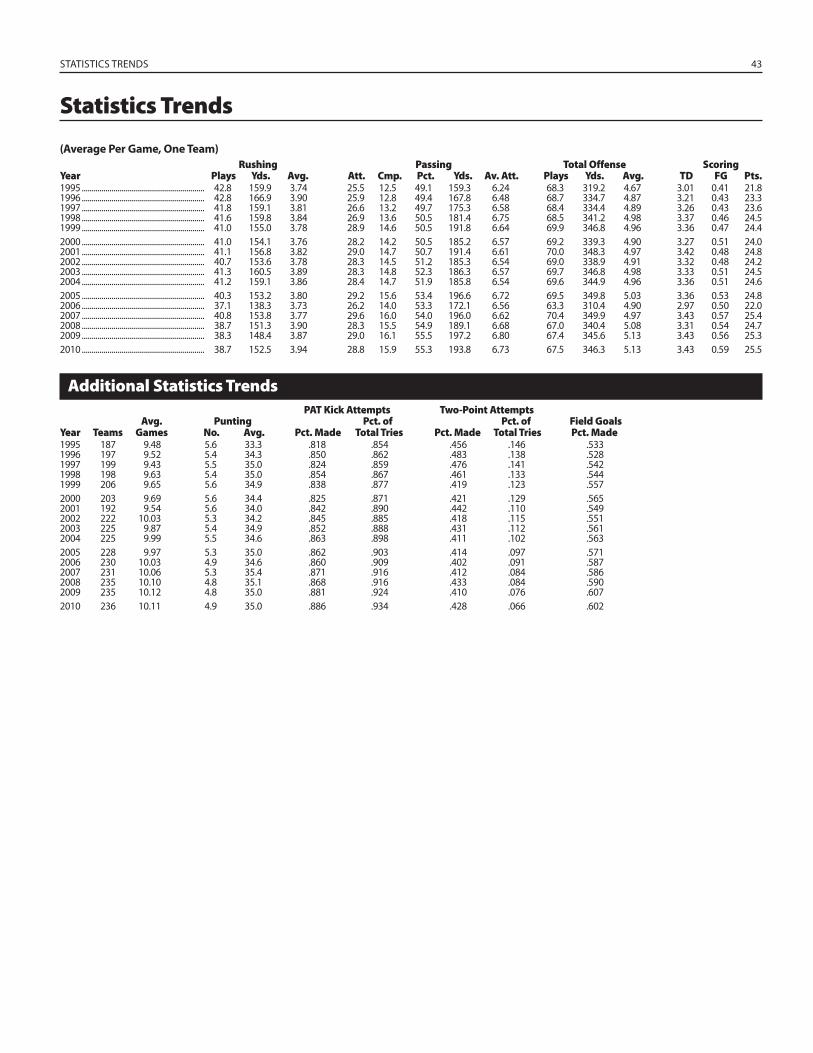
STATISTICS TRENDS 43
Statistics Trends
(Average Per Game, One Team)
Rushing Passing Total Offense ScoringYear Plays Yds. Avg. Att. Cmp. Pct. Yds. Av. Att. Plays Yds. Avg. TD FG Pts.1995 .............................................................. 42.8 159.9 3.74 25.5 12.5 49.1 159.3 6.24 68.3 319.2 4.67 3.01 0.41 21.81996 .............................................................. 42.8 166.9 3.90 25.9 12.8 49.4 167.8 6.48 68.7 334.7 4.87 3.21 0.43 23.31997 .............................................................. 41.8 159.1 3.81 26.6 13.2 49.7 175.3 6.58 68.4 334.4 4.89 3.26 0.43 23.61998 .............................................................. 41.6 159.8 3.84 26.9 13.6 50.5 181.4 6.75 68.5 341.2 4.98 3.37 0.46 24.51999 .............................................................. 41.0 155.0 3.78 28.9 14.6 50.5 191.8 6.64 69.9 346.8 4.96 3.36 0.47 24.42000 .............................................................. 41.0 154.1 3.76 28.2 14.2 50.5 185.2 6.57 69.2 339.3 4.90 3.27 0.51 24.02001 .............................................................. 41.1 156.8 3.82 29.0 14.7 50.7 191.4 6.61 70.0 348.3 4.97 3.42 0.48 24.82002 .............................................................. 40.7 153.6 3.78 28.3 14.5 51.2 185.3 6.54 69.0 338.9 4.91 3.32 0.48 24.22003 .............................................................. 41.3 160.5 3.89 28.3 14.8 52.3 186.3 6.57 69.7 346.8 4.98 3.33 0.51 24.52004 .............................................................. 41.2 159.1 3.86 28.4 14.7 51.9 185.8 6.54 69.6 344.9 4.96 3.36 0.51 24.62005 .............................................................. 40.3 153.2 3.80 29.2 15.6 53.4 196.6 6.72 69.5 349.8 5.03 3.36 0.53 24.82006 .............................................................. 37.1 138.3 3.73 26.2 14.0 53.3 172.1 6.56 63.3 310.4 4.90 2.97 0.50 22.02007 .............................................................. 40.8 153.8 3.77 29.6 16.0 54.0 196.0 6.62 70.4 349.9 4.97 3.43 0.57 25.42008 .............................................................. 38.7 151.3 3.90 28.3 15.5 54.9 189.1 6.68 67.0 340.4 5.08 3.31 0.54 24.72009 .............................................................. 38.3 148.4 3.87 29.0 16.1 55.5 197.2 6.80 67.4 345.6 5.13 3.43 0.56 25.32010 .............................................................. 38.7 152.5 3.94 28.8 15.9 55.3 193.8 6.73 67.5 346.3 5.13 3.43 0.59 25.5
Additional Statistics Trends PAT Kick Attempts Two-Point Attempts Avg. Punting Pct. of Pct. of Field GoalsYear Teams Games No. Avg. Pct. Made Total Tries Pct. Made Total Tries Pct. Made1995 187 9.48 5.6 33.3 .818 .854 .456 .146 .5331996 197 9.52 5.4 34.3 .850 .862 .483 .138 .5281997 199 9.43 5.5 35.0 .824 .859 .476 .141 .5421998 198 9.63 5.4 35.0 .854 .867 .461 .133 .5441999 206 9.65 5.6 34.9 .838 .877 .419 .123 .5572000 203 9.69 5.6 34.4 .825 .871 .421 .129 .5652001 192 9.54 5.6 34.0 .842 .890 .442 .110 .5492002 222 10.03 5.3 34.2 .845 .885 .418 .115 .5512003 225 9.87 5.4 34.9 .852 .888 .431 .112 .5612004 225 9.99 5.5 34.6 .863 .898 .411 .102 .5632005 228 9.97 5.3 35.0 .862 .903 .414 .097 .5712006 230 10.03 4.9 34.6 .860 .909 .402 .091 .5872007 231 10.06 5.3 35.4 .871 .916 .412 .084 .5862008 235 10.10 4.8 35.1 .868 .916 .433 .084 .5902009 235 10.12 4.8 35.0 .881 .924 .410 .076 .6072010 236 10.11 4.9 35.0 .886 .934 .428 .066 .602
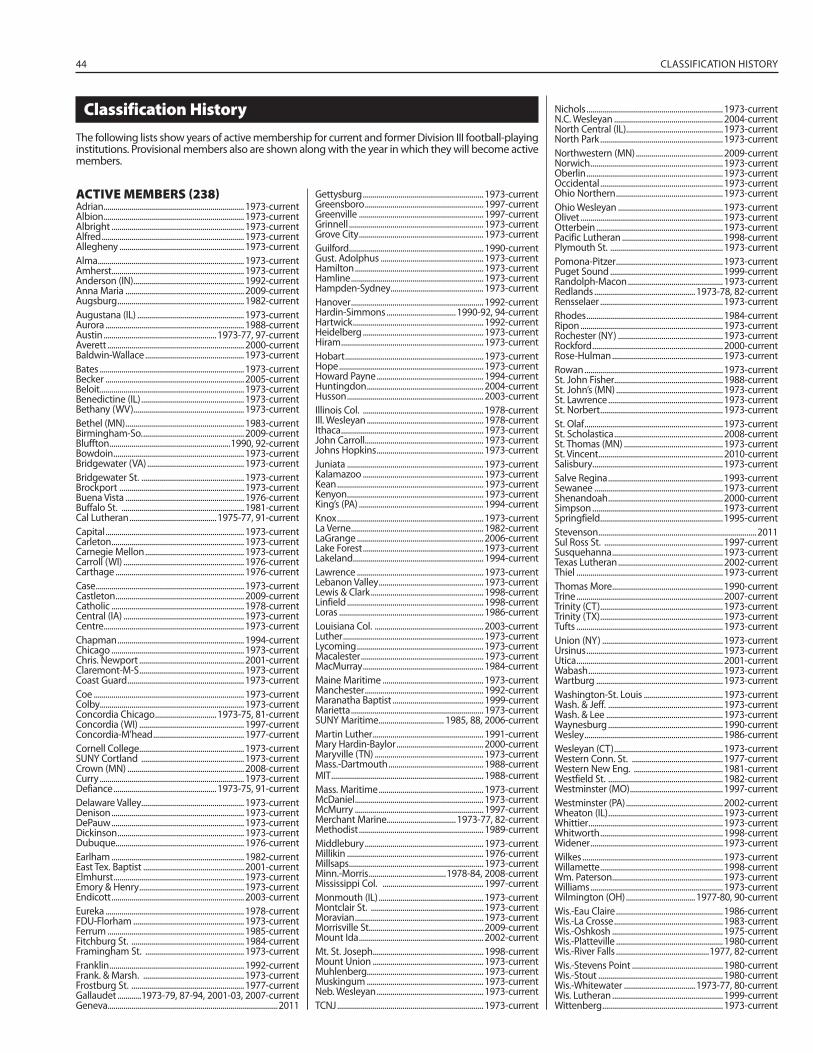
44 CLASSIFICATION HISTORY
Classification HistoryThe following lists show years of active membership for current and former Division III football-playing institutions. Provisional members also are shown along with the year in which they will become active members.
ACTIVE MEMBERS (238)Adrian .......................................................................1973-currentAlbion .......................................................................1973-currentAlbright ...................................................................1973-currentAlfred ........................................................................1973-currentAllegheny ...............................................................1973-currentAlma ..........................................................................1973-currentAmherst ...................................................................1973-currentAnderson (IN) ........................................................1992-currentAnna Maria ............................................................2009-currentAugsburg ................................................................1982-currentAugustana (IL) ......................................................1973-currentAurora ......................................................................1988-currentAustin .........................................................1973-77, 97-currentAverett .....................................................................2000-currentBaldwin-Wallace ..................................................1973-currentBates .........................................................................1973-currentBecker ......................................................................2005-currentBeloit.........................................................................1973-currentBenedictine (IL) ....................................................1973-currentBethany (WV)........................................................1973-currentBethel (MN) ............................................................1983-currentBirmingham-So. ...................................................2009-currentBluffton .............................................................1990, 92-currentBowdoin ..................................................................1973-currentBridgewater (VA) .................................................1973-currentBridgewater St. ....................................................1973-currentBrockport ...............................................................1973-currentBuena Vista ............................................................1976-currentBuffalo St. ..............................................................1981-currentCal Lutheran ............................................1975-77, 91-currentCapital ......................................................................1973-currentCarleton ...................................................................1973-currentCarnegie Mellon ..................................................1973-currentCarroll (WI) .............................................................1976-currentCarthage .................................................................1976-currentCase ...........................................................................1973-currentCastleton .................................................................2009-currentCatholic ...................................................................1978-currentCentral (IA) .............................................................1973-currentCentre .......................................................................1973-currentChapman ................................................................1994-currentChicago ...................................................................1973-currentChris. Newport .....................................................2001-currentClaremont-M-S .....................................................1973-currentCoast Guard ...........................................................1973-currentCoe ............................................................................1973-currentColby.........................................................................1973-currentConcordia Chicago ...............................1973-75, 81-currentConcordia (WI) .....................................................1997-currentConcordia-M’head ..............................................1977-currentCornell College .....................................................1973-currentSUNY Cortland ....................................................1973-currentCrown (MN) ...........................................................2008-currentCurry .........................................................................1973-currentDefiance ....................................................1973-75, 91-currentDelaware Valley....................................................1973-currentDenison ...................................................................1973-currentDePauw ...................................................................1973-currentDickinson ................................................................1973-currentDubuque.................................................................1976-currentEarlham ...................................................................1982-currentEast Tex. Baptist ...................................................2001-currentElmhurst ..................................................................1973-currentEmory & Henry .....................................................1973-currentEndicott ...................................................................2003-currentEureka ......................................................................1978-currentFDU-Florham ........................................................1973-currentFerrum .....................................................................1985-currentFitchburg St. .........................................................1984-currentFramingham St. ..................................................1973-currentFranklin ....................................................................1992-currentFrank. & Marsh. ...................................................1973-currentFrostburg St. .........................................................1977-currentGallaudet ............1973-79, 87-94, 2001-03, 2007-currentGeneva......................................................................................2011
Gettysburg .............................................................1973-currentGreensboro ............................................................1997-currentGreenville ...............................................................1997-currentGrinnell ....................................................................1973-currentGrove City ...............................................................1973-currentGuilford ....................................................................1990-currentGust. Adolphus ....................................................1973-currentHamilton .................................................................1973-currentHamline ...................................................................1973-currentHampden-Sydney ...............................................1973-currentHanover ...................................................................1992-currentHardin-Simmons ...................................1990-92, 94-currentHartwick ..................................................................1992-currentHeidelberg .............................................................1973-currentHiram ........................................................................1973-currentHobart ......................................................................1973-currentHope .........................................................................1973-currentHoward Payne ......................................................1994-currentHuntingdon ...........................................................2004-currentHusson .....................................................................2003-currentIllinois Col. .............................................................1978-currentIll. Wesleyan ...........................................................1978-currentIthaca ........................................................................1973-currentJohn Carroll............................................................1973-currentJohns Hopkins ......................................................1973-currentJuniata .....................................................................1973-currentKalamazoo .............................................................1973-currentKean ..........................................................................1973-currentKenyon .....................................................................1973-currentKing’s (PA) ...............................................................1994-currentKnox ..........................................................................1973-currentLa Verne ...................................................................1982-currentLaGrange ................................................................2006-currentLake Forest .............................................................1973-currentLakeland ..................................................................1994-currentLawrence ................................................................1973-currentLebanon Valley .....................................................1973-currentLewis & Clark .........................................................1998-currentLinfield .....................................................................1998-currentLoras .........................................................................1986-currentLouisiana Col. .......................................................2003-currentLuther .......................................................................1973-currentLycoming ................................................................1973-currentMacalester ..............................................................1973-currentMacMurray .............................................................1984-currentMaine Maritime ...................................................1973-currentManchester ............................................................1992-currentMaranatha Baptist ..............................................1999-currentMarietta ...................................................................1973-currentSUNY Maritime ................................. 1985, 88, 2006-currentMartin Luther ........................................................1991-currentMary Hardin-Baylor ............................................2000-currentMaryville (TN) .......................................................1973-currentMass.-Dartmouth ................................................1988-currentMIT .............................................................................1988-currentMass. Maritime .....................................................1973-currentMcDaniel .................................................................1973-currentMcMurry .................................................................1997-currentMerchant Marine...................................1973-77, 82-currentMethodist ...............................................................1989-currentMiddlebury ............................................................1973-currentMillikin .....................................................................1976-currentMillsaps ....................................................................1973-currentMinn.-Morris .......................................1978-84, 2008-currentMississippi Col. ...................................................1997-currentMonmouth (IL) .....................................................1973-currentMontclair St. .........................................................1973-currentMoravian .................................................................1973-currentMorrisville St. .........................................................2009-currentMount Ida ...............................................................2002-currentMt. St. Joseph ........................................................1998-currentMount Union ........................................................1973-currentMuhlenberg...........................................................1973-currentMuskingum ...........................................................1973-currentNeb. Wesleyan ......................................................1973-currentTCNJ ..........................................................................1973-current
Nichols .....................................................................1973-currentN.C. Wesleyan .......................................................2004-currentNorth Central (IL) .................................................1973-currentNorth Park ..............................................................1973-currentNorthwestern (MN) ............................................2009-currentNorwich ...................................................................1973-currentOberlin .....................................................................1973-currentOccidental ..............................................................1973-currentOhio Northern ......................................................1973-currentOhio Wesleyan .....................................................1973-currentOlivet ........................................................................1973-currentOtterbein ................................................................1973-currentPacific Lutheran ...................................................1998-currentPlymouth St. .........................................................1973-currentPomona-Pitzer ......................................................1973-currentPuget Sound .........................................................1999-currentRandolph-Macon ................................................1973-currentRedlands ...................................................1973-78, 82-currentRensselaer ..............................................................1973-currentRhodes .....................................................................1984-currentRipon ........................................................................1973-currentRochester (NY) .....................................................1973-currentRockford ..................................................................2000-currentRose-Hulman ........................................................1973-currentRowan ......................................................................1973-currentSt. John Fisher.......................................................1988-currentSt. John’s (MN) ......................................................1973-currentSt. Lawrence ..........................................................1973-currentSt. Norbert ..............................................................1973-currentSt. Olaf ......................................................................1973-currentSt. Scholastica .......................................................2008-currentSt. Thomas (MN) ..................................................1973-currentSt. Vincent ...............................................................2010-currentSalisbury..................................................................1973-currentSalve Regina ..........................................................1993-currentSewanee .................................................................1973-currentShenandoah ..........................................................2000-currentSimpson ..................................................................1973-currentSpringfield ..............................................................1995-currentStevenson ................................................................................2011Sul Ross St. ............................................................1997-currentSusquehanna ........................................................1973-currentTexas Lutheran .....................................................2002-currentThiel ..........................................................................1973-currentThomas More ........................................................1990-currentTrine ..........................................................................2007-currentTrinity (CT) ..............................................................1973-currentTrinity (TX) ..............................................................1973-currentTufts ..........................................................................1973-currentUnion (NY) .............................................................1973-currentUrsinus .....................................................................1973-currentUtica ..........................................................................2001-currentWabash ....................................................................1973-currentWartburg ................................................................1973-currentWashington-St. Louis ........................................1973-currentWash. & Jeff. ..........................................................1973-currentWash. & Lee ...........................................................1973-currentWaynesburg ..........................................................1990-currentWesley ......................................................................1986-currentWesleyan (CT) .......................................................1973-currentWestern Conn. St. ..............................................1977-currentWestern New Eng. .............................................1981-currentWestfield St. ..........................................................1982-currentWestminster (MO) ...............................................1997-currentWestminster (PA) .................................................2002-currentWheaton (IL) ..........................................................1973-currentWhittier ....................................................................1973-currentWhitworth ..............................................................1998-currentWidener ...................................................................1973-currentWilkes .......................................................................1973-currentWillamette ..............................................................1998-currentWm. Paterson ........................................................1973-currentWilliams ...................................................................1973-currentWilmington (OH) ...................................1977-80, 90-currentWis.-Eau Claire ......................................................1986-currentWis.-La Crosse .......................................................1983-currentWis.-Oshkosh ........................................................1975-currentWis.-Platteville ......................................................1980-currentWis.-River Falls ...............................................1977, 82-currentWis.-Stevens Point ..............................................1980-currentWis.-Stout ...............................................................1980-currentWis.-Whitewater ....................................1973-77, 80-currentWis. Lutheran ........................................................1999-currentWittenberg .............................................................1973-current
CLASSIFICATION HISTORY 45
Wooster ...................................................................1973-currentWPI ............................................................................1973-currentWorcester St. ........................................................1985-current
FORMER MEMBERS (103)Albany (NY) ...................................................................... 1973-94Albany St. (GA) ............................................................... 1973-75American Int’l ........................................................................1973Ashland ............................................................................. 1973-79Assumption ..................................................................... 1988-92Bentley ............................................................................... 1988-92Blackburn ......................................................................... 1990-08Bloomsburg ..................................................................... 1973-79Bowie St. .......................................................................... 1973-79Bridgeport ...............................................................................1973Brooklyn ............................................................................ 1978-91Buffalo ................................................................................ 1978-92C.W. Post ......................................................1975-77, 84, 89-92UC Santa Barbara ......................................................... 1986-90Cal St. Chico ..................................................................... 1973-77Caltech ............................................................................... 1973-77Cameron ..................................................................................1973Canisius ............................................................................. 1975-92UCF ...................................................................................... 1980-81Charleston So. ............................................................... 1991-92Cheyney ............................................................................ 1973-79Chowan ............................................................................. 1997-04Clark Atlanta .................................................................... 1973-79Colorado Col. .................................................................. 1973-08Colorado Mines.....................................................................1973Davidson ........................................................................... 1990-92Dayton ............................................................................... 1976-92Delaware St. ................................................................... 1973-77Dist. Columbia .......................................................................1978Drake .................................................................................. 1987-92Duquesne ......................................................................... 1979-92Eastern Ore. .................................................................... 1999-03Evansville ............................................................ 1973-77, 89-92
Ferris St. ............................................................................ 1975-76Fisk ....................................................................................... 1973-83Fordham............................................................................ 1973-88Fort Valley St. ................................................................. 1973-80Gannon .............................................................................. 1989-92Georgetown .................................................................... 1973-92Hillsdale ....................................................................................1975Hofstra ............................................................................... 1973-92Humboldt St. ................................................................. 1975-79Ill.-Chicago ..............................................................................1973Iona ..................................................................................... 1978-92James Madison .............................................................. 1977-79Ky. Wesleyan .................................................................... 1983-92Knoxville ........................................................................... 1973-88Kutztown .......................................................................... 1973-79Lane .................................................................................... 1973-87Lock Haven ...................................................................... 1973-79Mansfield .......................................................................... 1973-79Marist .................................................................................. 1978-92Mass.-Boston ................................................................... 1988-00Mass.-Lowell .................................................................... 1981-92Menlo ................................................................................. 1986-09Mercyhurst ....................................................................... 1982-92Merrimack ...............................................................................1989Miles .................................................................................... 1973-87Millersville ........................................................................ 1973-79Minn. St. Mankato ................................................................1977Morehouse ....................................................................... 1973-80New Haven ...............................................................1973, 77-80New Jersey City .............................................................. 1973-02NYIT ............................................................................................1973Oswego St. .............................................................................1976Pace ..................................................................................... 1978-92Plattsburgh St. ............................................................... 1973-78Principia............................................................................. 1973-08Quincy ................................................................................ 1987-92Ramapo ............................................................................. 1981-92Rochester Inst. ............................................................... 1973-77
Sacred Heart .................................................................... 1991-92St. Francis (PA)................................................................. 1978-92St. John’s (NY) ................................................................. 1978-92St. Joseph’s (IN) ............................................................... 1973-78St. Mary’s (CA) ................................................................. 1973-80St. Peter’s ........................................................................... 1973-92Samford ............................................................................. 1985-88San Diego ......................................................................... 1973-92San Fran. St. .................................................................... 1973-78Savannah St. ................................................................... 1973-80Seton Hall ........................................................... 1973-76, 78-80Shepherd .......................................................................... 1973-75Shippensburg ................................................................. 1973-75Siena ................................................................................... 1988-92Slippery Rock .................................................................. 1973-78Sonoma St. ...................................................................... 1980-83Stillman ............................................................................. 1999-03Stonehill ............................................................................ 1989-92Stony Brook ..................................................................... 1983-94Swarthmore ..................................................................... 1973-00Tarleton St. ............................................................................1977Towson .............................................................................. 1973-79Upper Iowa ...................................................................... 1976-02Upsala ................................................................................ 1973-96Valparaiso ......................................................................... 1973-78Villanova............................................................................ 1985-86Wagner .............................................................................. 1973-92West Ala. ..................................................................................1973West Ga. ........................................................................... 1981-82William Penn ................................................................... 1976-00Winona St. ..............................................................................1975Wis.-Superior ................................................................... 1973-92*Provisional members are not active members of the Association and, thus are not eligible for NCAA statistics, records and cham-pionship play. The end of the provisional status and first season of active membership in Division III football is listed to the right of the school name.