2011 full year results presentation - nestlé · pdf filefebruary 21st, 2012 2011 full...
TRANSCRIPT
February 21st, 2012 2011 Full Year Roadshow
2011 Full Year RoadshowPaul Bulcke
Chief Executive Officer
Jim SinghChief Financial Officer
Wan Ling MartelloChief Financial Officer
Designate

February 21st, 2012 2011 Full Year Roadshow
Disclaimer
This presentation contains forward looking statements which reflect Management’s current views and estimates. The forward looking statements involve certain risks and uncertainties that could cause actual results to differ materially from those contained in the forward looking statements. Potential risks and uncertainties include such factors as general economic conditions, foreign exchange fluctuations, competitive product and pricing pressures and regulatory developments.
1

February 21st, 2012 2011 Full Year Roadshow
2011 Full Year Roadshow
Jim SinghChief Financial Officer
February 21st, 2012 2011 Full Year Results Roadshow3
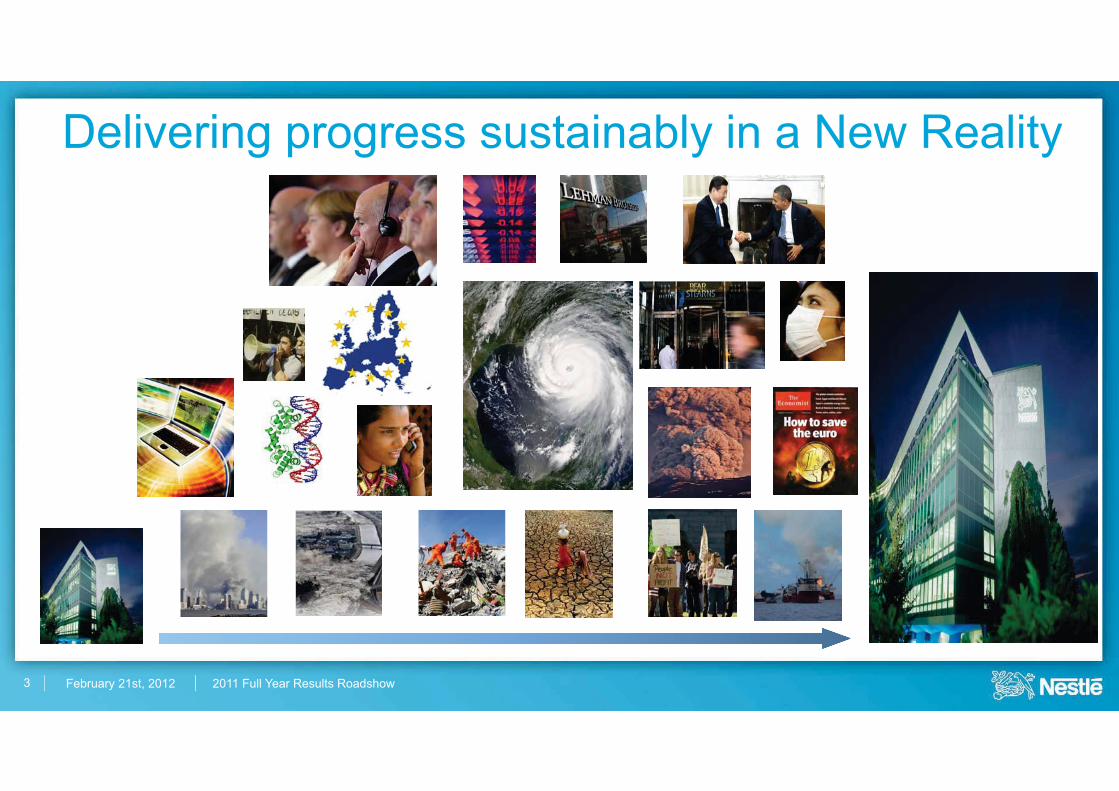
Delivering progress sustainably in a New Reality
February 21st, 2012 2011 Full Year Results Roadshow
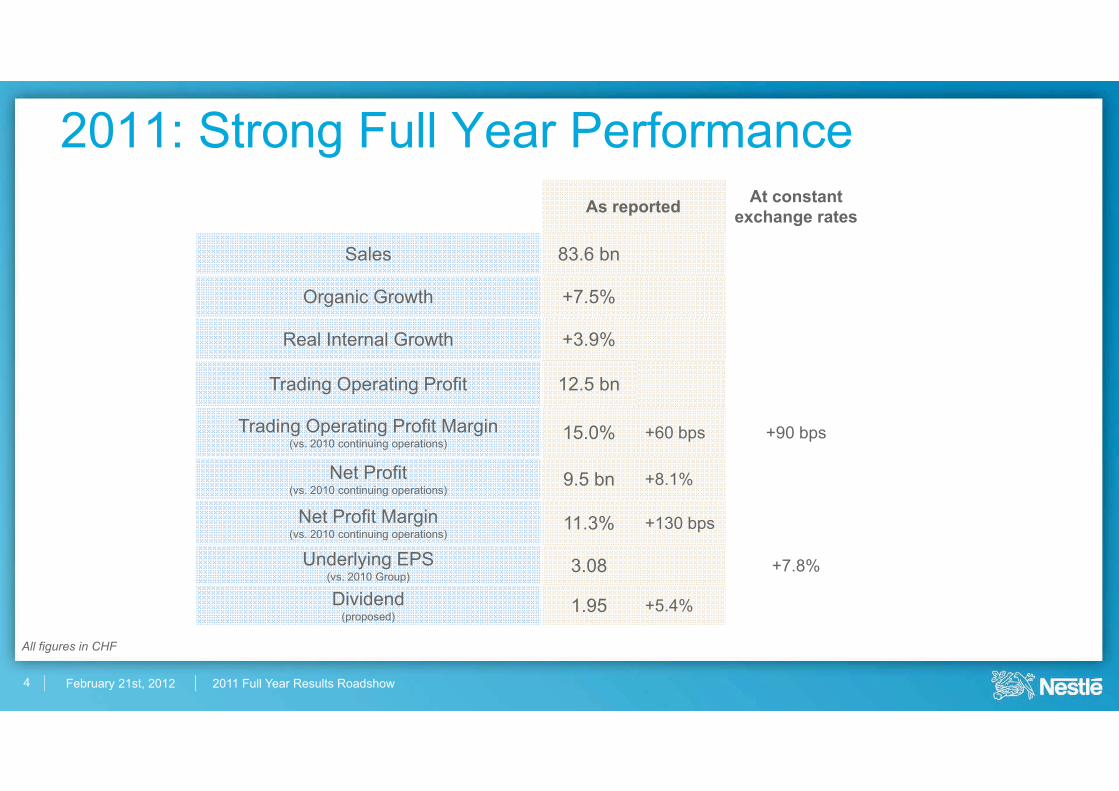
2011: Strong Full Year PerformanceAs reported At constant
exchange rates
Sales 83.6 bn
Organic Growth +7.5%
Real Internal Growth +3.9%
Trading Operating Profit 12.5 bn
Trading Operating Profit Margin(vs. 2010 continuing operations)
15.0% +60 bps +90 bps
Net Profit(vs. 2010 continuing operations)
9.5 bn +8.1%
Net Profit Margin(vs. 2010 continuing operations)
11.3% +130 bps
Underlying EPS(vs. 2010 Group)
3.08 +7.8%
Dividend(proposed)
1.95 +5.4%
4
All figures in CHF

February 21st, 2012 2011 Full Year Results Roadshow
Delivering the Nestlé Model in 2011
Former Nestlé Model FY 2011
Organic growth 5-6% +7.5%
Increased EBIT margin in constant currencies
+10 bps
Improvement in capital efficiency
Enhanced Nestlé Model FY 2011
Organic growth 5-6% +7.5%
Increased trading operating margin in constant currencies
+90 bps
Increased underlying EPS in constant FX
+7.8%
Improvement in capital efficiency
5
February 21st, 2012 2011 Full Year Results Roadshow
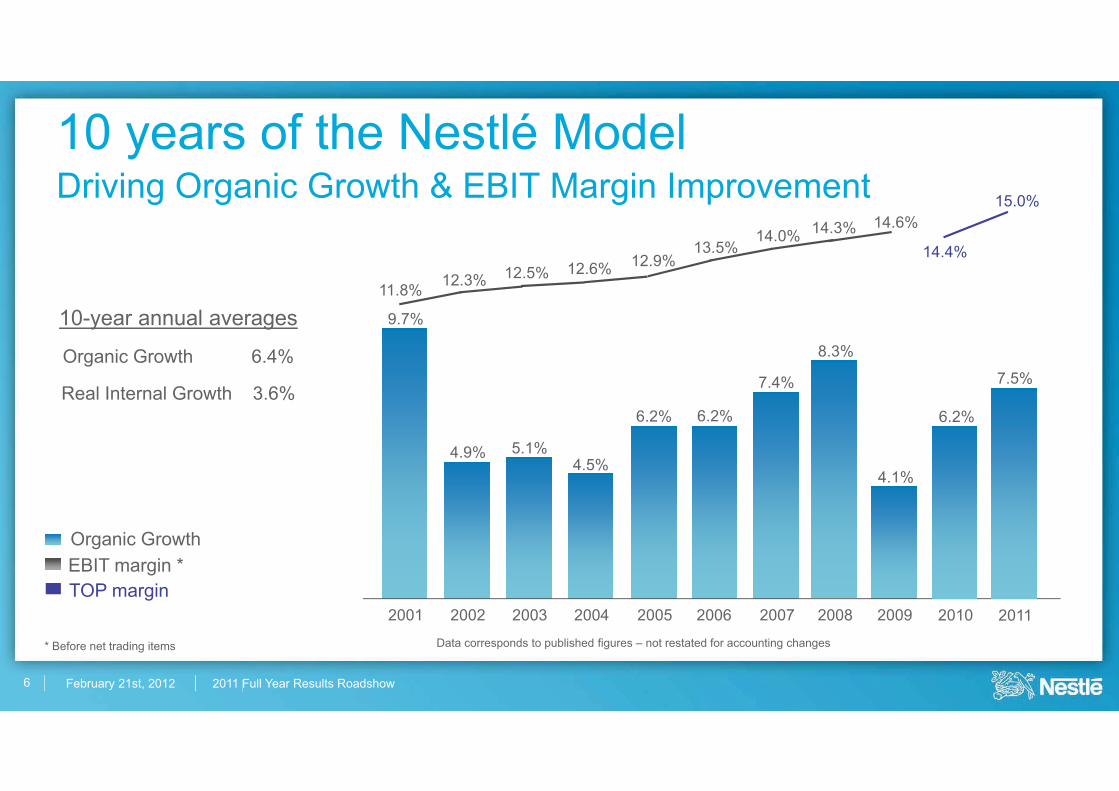
11.8% 12.3% 12.5% 12.6% 12.9%13.5%
14.0% 14.3% 14.6%
10 years of the Nestlé ModelDriving Organic Growth & EBIT Margin Improvement
Data corresponds to published figures – not restated for accounting changes
7.4%
20092001 2002 2003 2004 2005 2006 2007
9.7%
5.1%4.5%
6.2% 6.2%
4.1%4.9%
Organic GrowthEBIT margin *
2008
8.3%
10-year annual averages
Organic Growth 6.4%
Real Internal Growth 3.6%
2010
6.2%
2011
7.5%
14.4%
15.0%
TOP margin
* Before net trading items
6
February 21st, 2012 2011 Full Year Results Roadshow7
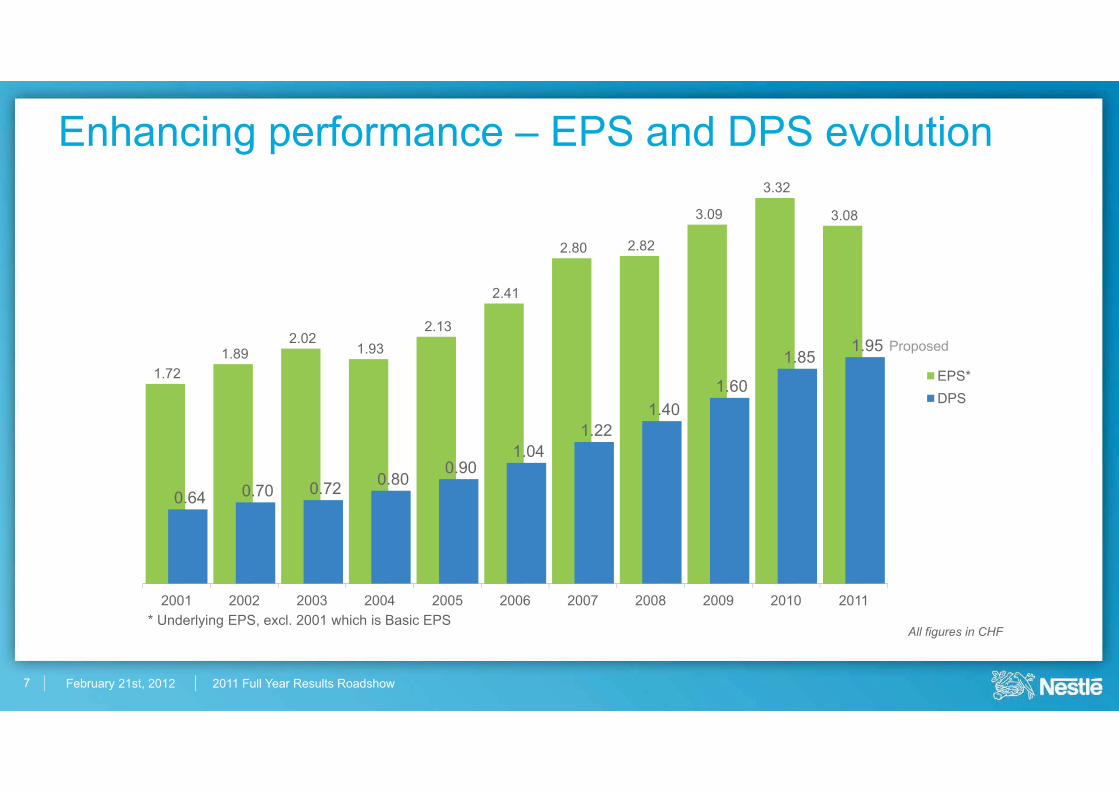
Enhancing performance – EPS and DPS evolution
* Underlying EPS, excl. 2001 which is Basic EPS
1.721.89
2.021.93
2.13
2.41
2.80 2.82
3.09
3.32
3.08
0.64 0.70 0.72 0.800.90
1.041.22
1.401.60
1.851.95
2001 2002 2003 2004 2005 2006 2007 2008 2009 2010 2011
EPS*DPS
Proposed
All figures in CHF

February 21st, 2012 2011 Full Year Results Roadshow
A winning strategy driving superior shareholder returns
-18.1% -15.2%
8.3% 14.4% 17.7% 20.7%29.6%
43.2%52.6%
96.1%
Nestlé SA Total Shareholder Returns 2002-2011
CHF, dividends reinvested
USA 7 USA 6 USA 5 USA 4 USA 3 USA 2 USA 1 EUR 3 EUR 2
Source: Bloomberg
8
February 21st, 2012 2011 Full Year Results Roadshow9
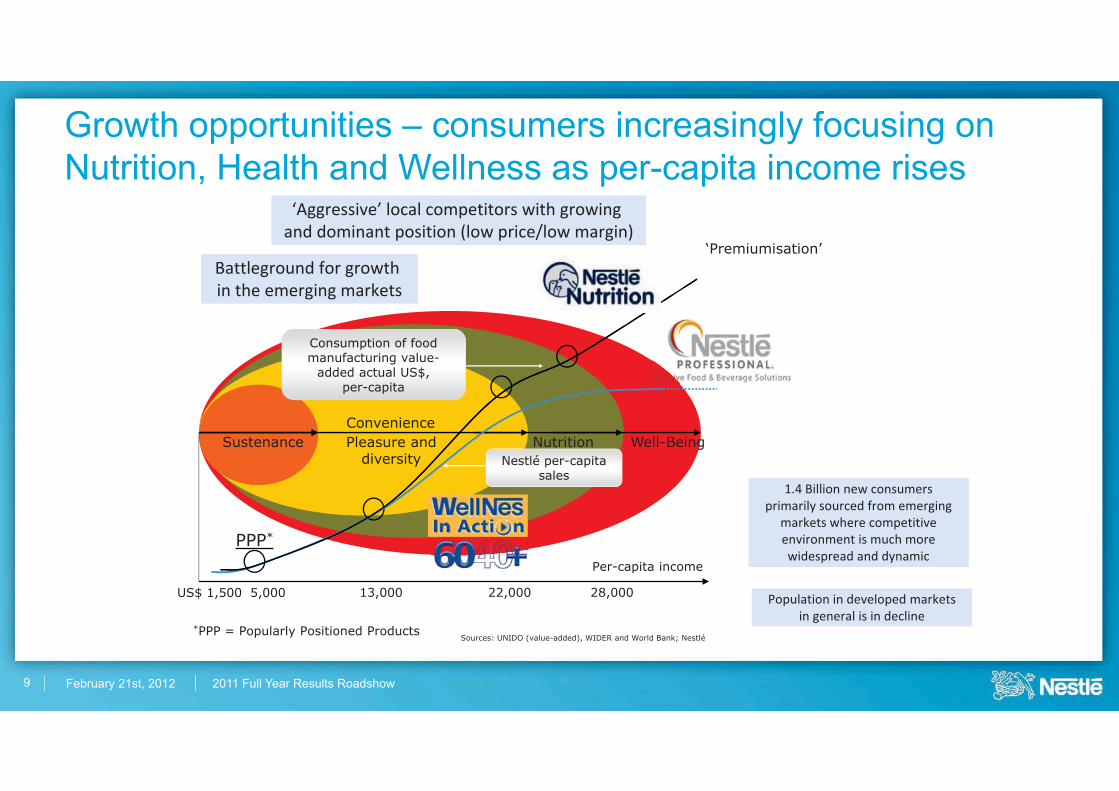
Growth opportunities – consumers increasingly focusing on Nutrition, Health and Wellness as per-capita income rises
Sources: UNIDO (value-added), WIDER and World Bank; Nestlé
US$ 1,500
*PPP = Popularly Positioned Products
SustenanceConvenience
5,000 13,000 22,000
Per-capita income
28,000
‘Premiumisation’
*PPP
Nutrition Well-Being
Consumption of food manufacturing value-
added actual US$, per-capita
Pleasure anddiversity Nestlé per-capita
sales
Battleground�for�growth�in�the�emerging�markets
‘Aggressive’�local�competitors�with�growing�and�dominant�position�(low�price/low�margin)
1.4�Billion�new�consumers�primarily�sourced�from�emerging�
markets�where�competitive�environment�is�much�more�widespread�and�dynamic
Population�in�developed�markets�in�general�is�in�decline
February 21st, 2012 2011 Full Year Results Roadshow
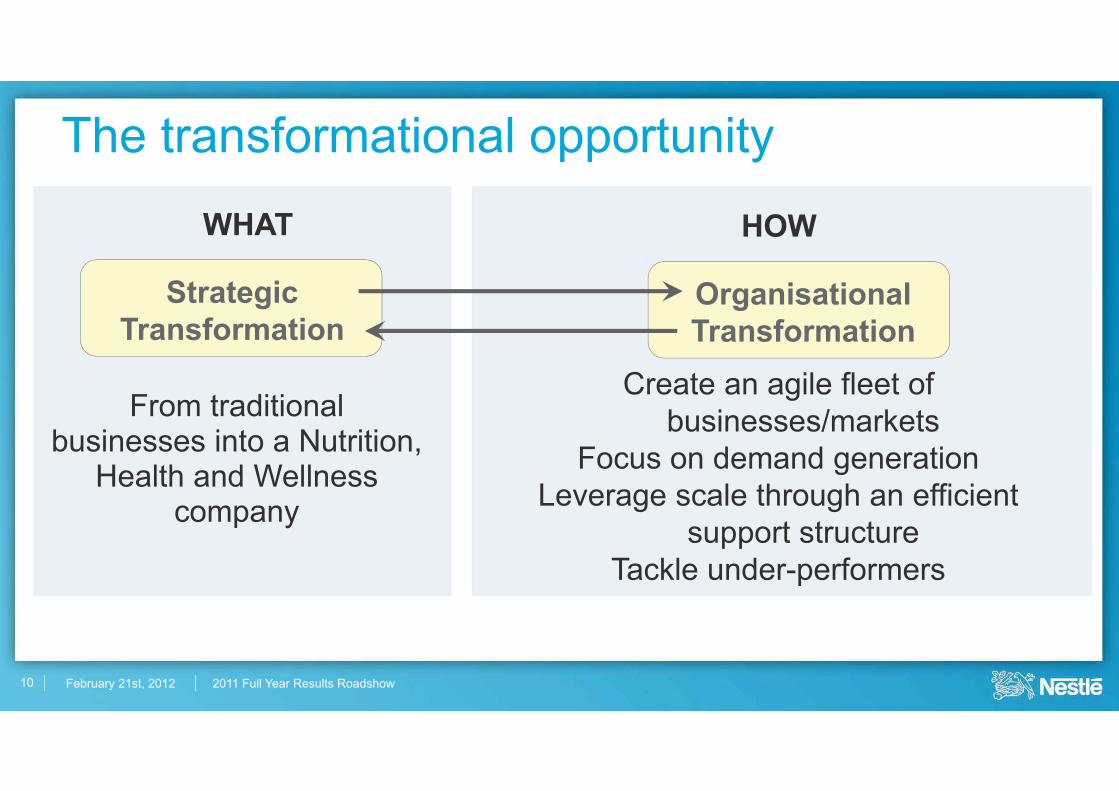
OrganisationalTransformation
Create an agile fleet of businesses/markets
Focus on demand generationLeverage scale through an efficient
support structureTackle under-performers
From traditional businesses into a Nutrition,
Health and Wellness company
StrategicTransformation
The transformational opportunity
WHAT HOW
10
February 21st, 2012 2011 Full Year Results Roadshow11
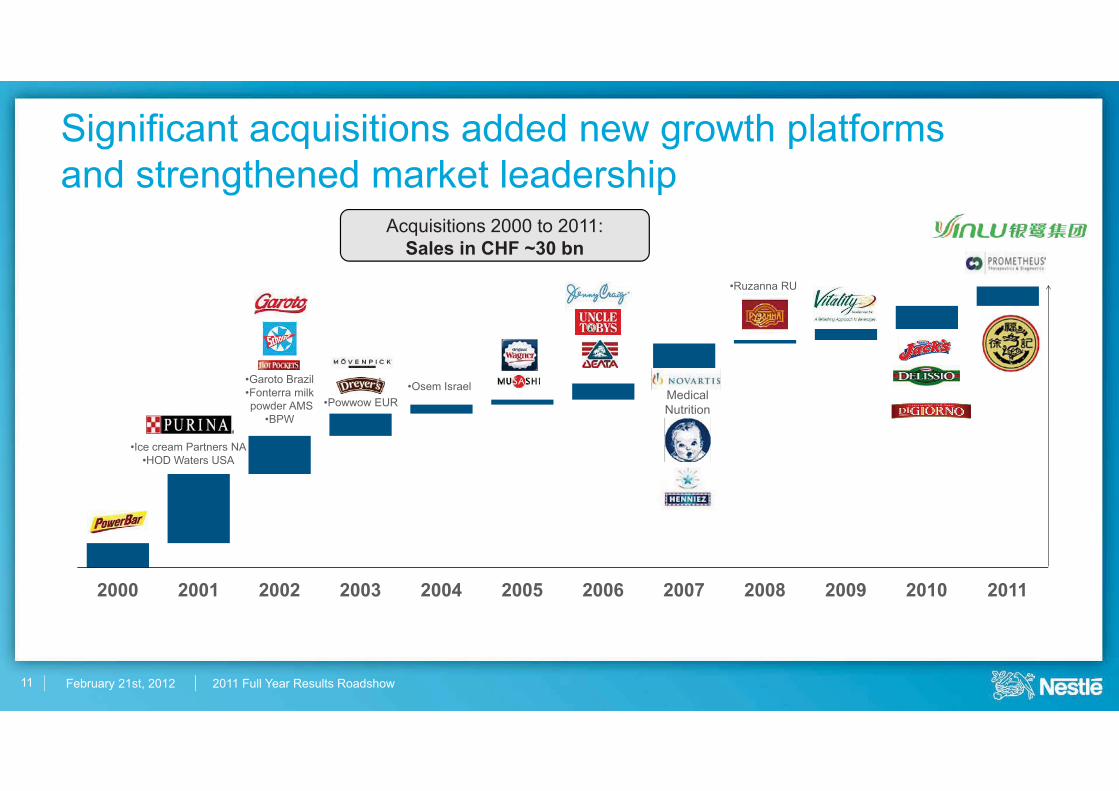
2000 2001 2002 2003 2004 2005 2006 2007 2008 2009 2010 2011
•Ice cream Partners NA•HOD Waters USA
•Garoto Brazil•Fonterra milk powder AMS
•BPW•Powwow EUR
•Osem IsraelMedicalNutrition
Significant acquisitions added new growth platforms and strengthened market leadership
•Ruzanna RU
Acquisitions 2000 to 2011: Sales in CHF ~30 bn

February 21st, 2012 2011 Full Year Results Roadshow12
2000 2001 2002 2003 2004 2005 2006 2007 2008 2009 2010 2011
•Findus EUR•Frozen Potato USA
•Minag Water GER
•FIS International•Project Perm UK
• Dallmayr R&G• Chilled Dairy GER
•Trinks GER•Eismann EUR
•Private Label Ice cream GER
•Canned & Liquid Milk AOA
•San Sepolcro Italy•Frozen Meat GER
•Family Frost
•Dry cut pasta Italy•Crosse & Blackwell
South Africa
Significant divestitures rationalized the portfolio and eliminated non strategic and loss-making businesses
•Eden Springs Water FR•Barnaul Conf RU
Divestitures 2000 to 2011: Sales in CHF ~ -17 bn
23% 25% 52%
February 21st, 2012 2011 Full Year Results Roadshow13
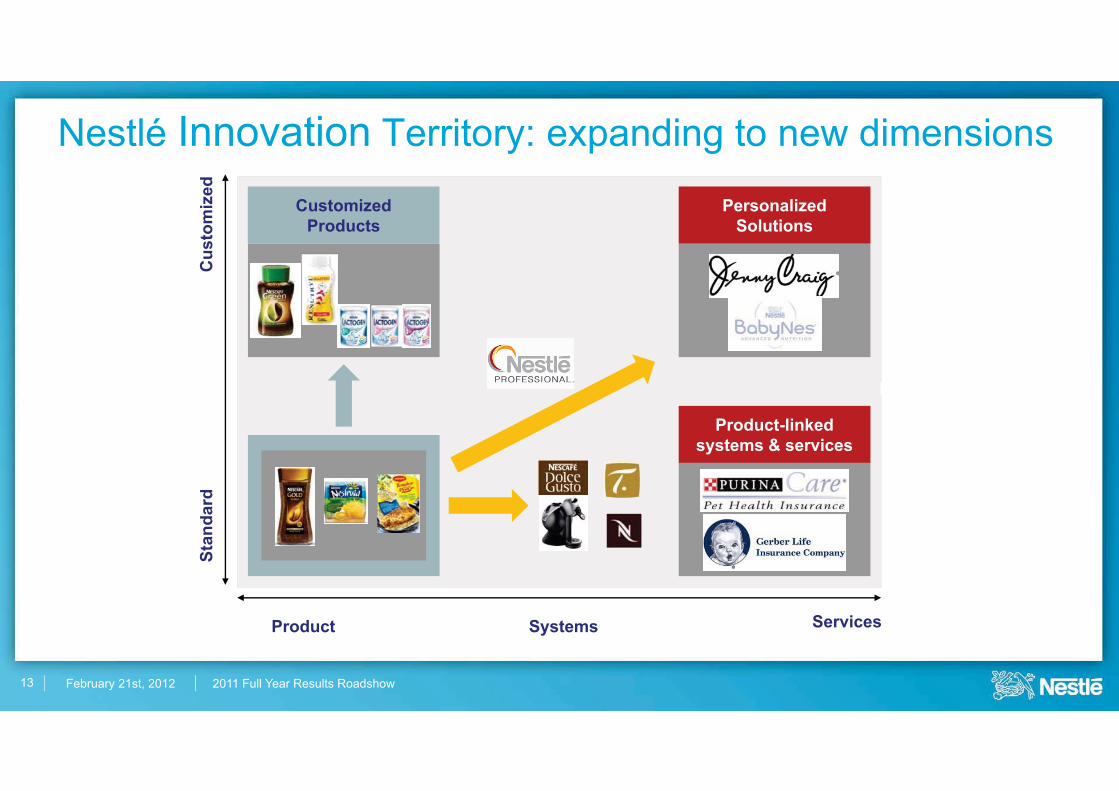
Nestlé Innovation Territory: expanding to new dimensions
PersonalizedSolutions
CustomizedProducts
Cus
tom
ized
Stan
dard
Product Systems Services
Product-linkedsystems & services
February 21st, 2012 2011 Full Year Results Roadshow14
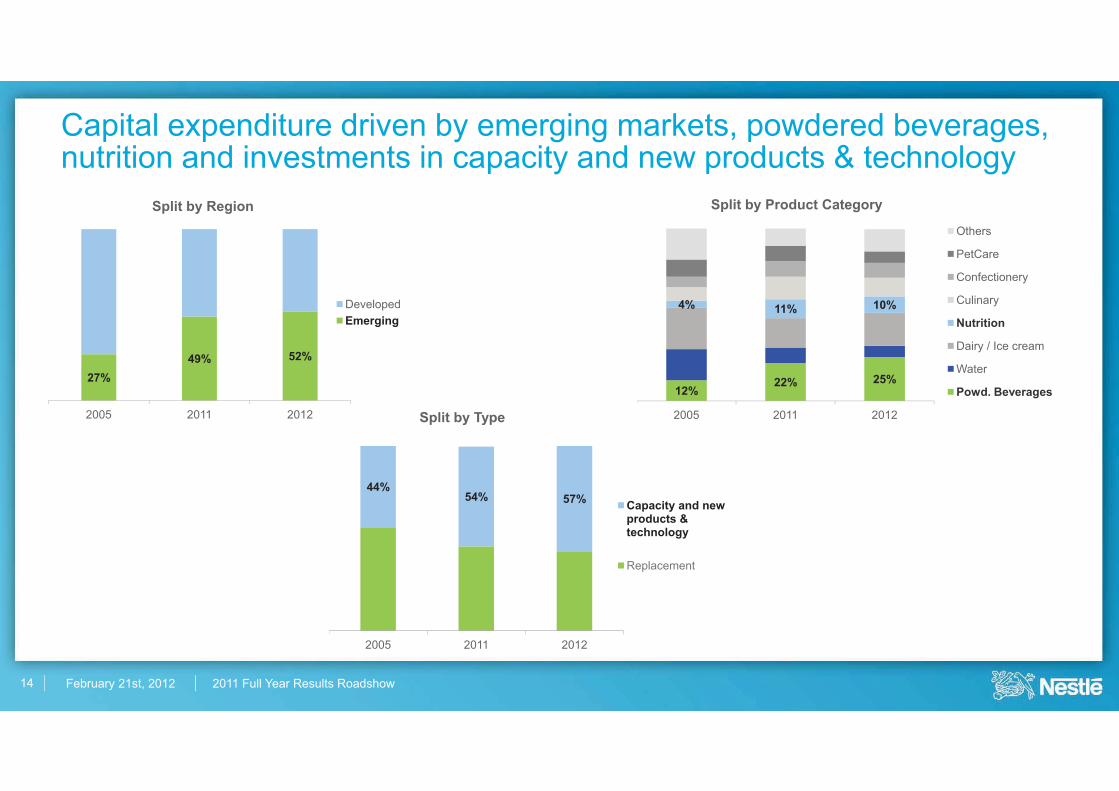
27%49% 52%
2005 2011 2012
Split by Region
DevelopedEmerging
Capital expenditure driven by emerging markets, powdered beverages, nutrition and investments in capacity and new products & technology
12%22% 25%
4% 11% 10%
2005 2011 2012
Split by Product Category
Others
PetCare
Confectionery
Culinary
Nutrition
Dairy / Ice cream
Water
Powd. Beverages
44%54% 57%
2005 2011 2012
Split by Type
Capacity and new products & technology
Replacement

February 21st, 2012 2011 Full Year Results Roadshow15
2005 2006 2007 2008 2009 2010 2011
TNWC as % of sales
Trade Net Working Capital is an area of focus and improvement
Notes: Like for like estimate2010 and 2011 figures exclude Alcon, Hsu Fu Chi and Yinlu
February 21st, 2012 2011 Full Year Results Roadshow16
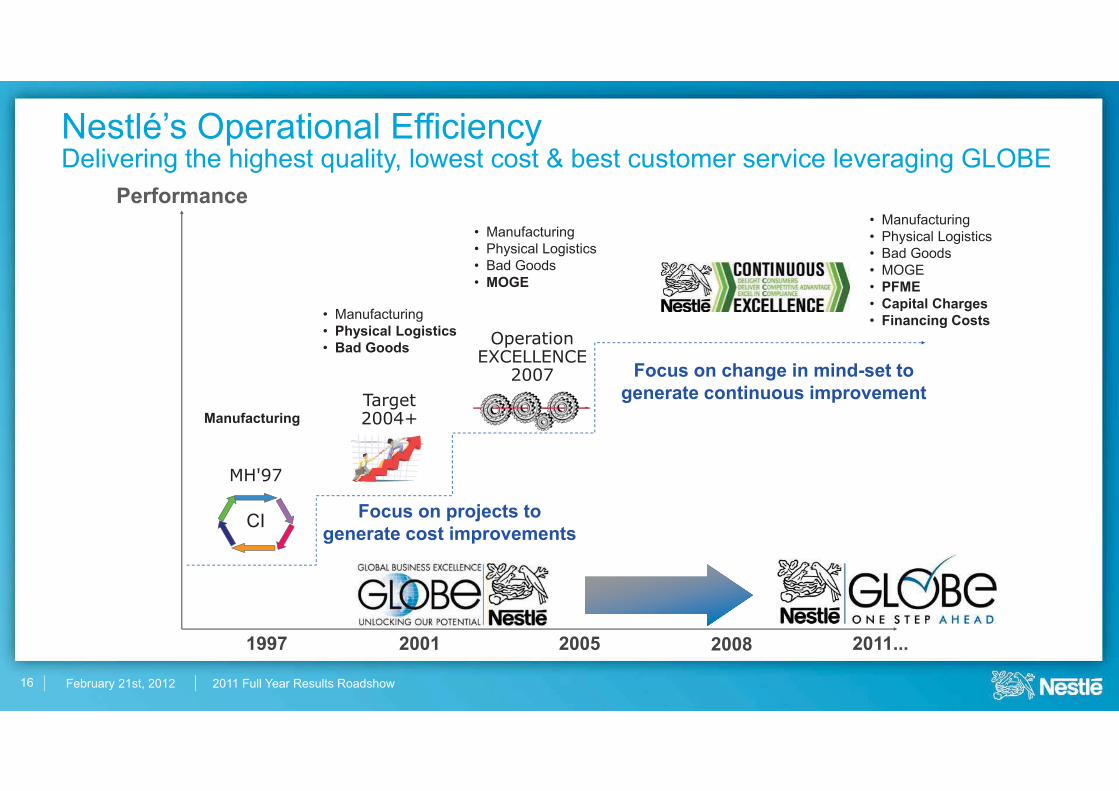
MH'97
Target 2004+
OperationEXCELLENCE
2007
CI
Performance
2011...200520011997 2008
Nestlé’s Operational EfficiencyDelivering the highest quality, lowest cost & best customer service leveraging GLOBE
Manufacturing
• Manufacturing• Physical Logistics • Bad Goods
• Manufacturing• Physical Logistics • Bad Goods• MOGE
Focus on projects to generate cost improvements
Focus on change in mind-set to generate continuous improvement
• Manufacturing• Physical Logistics • Bad Goods• MOGE• PFME• Capital Charges • Financing Costs
February 21st, 2012 2011 Full Year Results Roadshow
The Nestlé Model
� Organic growth 5-6%
� Increased trading operating margin in constant currencies
� Increased underlying EPS in constant currencies
� Improvement in capital efficiency
17

February 21st, 2012 2011 Full Year Roadshow
2011 Full Year Roadshow
PaulBulckeChief Executive Officer

February 21st, 2012 2011 Full Year Results Roadshow
The New Reality
19
February 21st, 2012 2011 Full Year Results Roadshow20
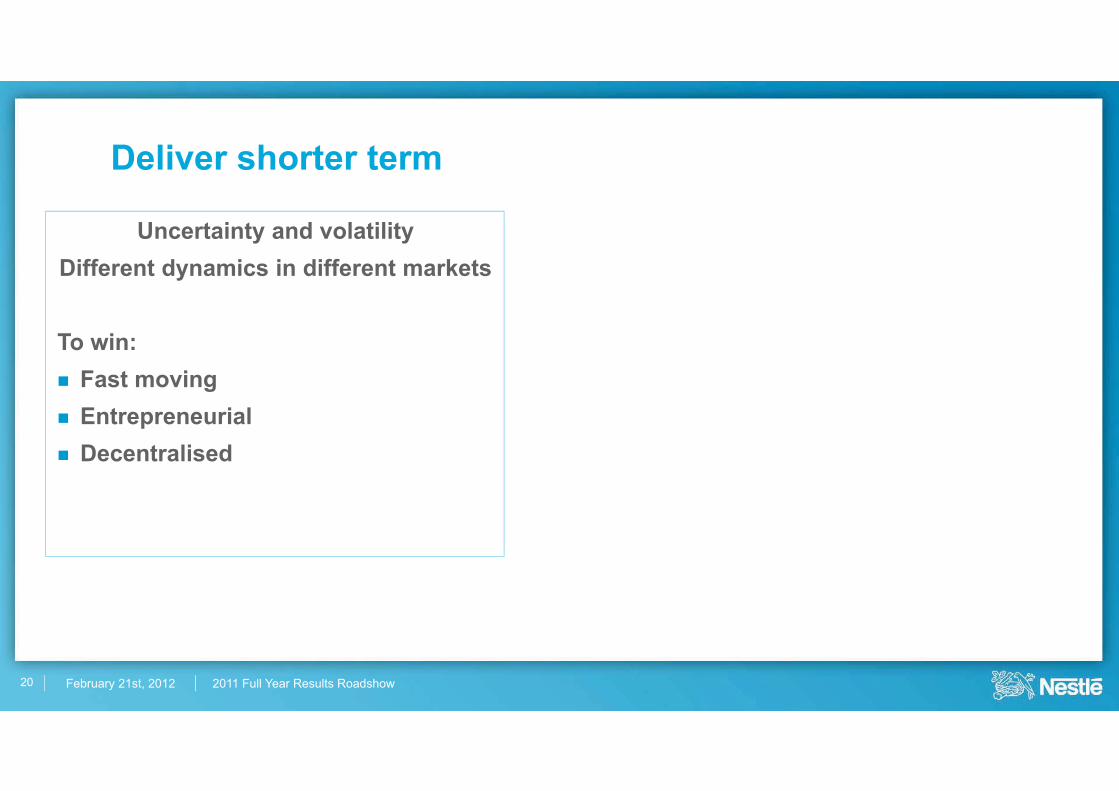
Deliver shorter term
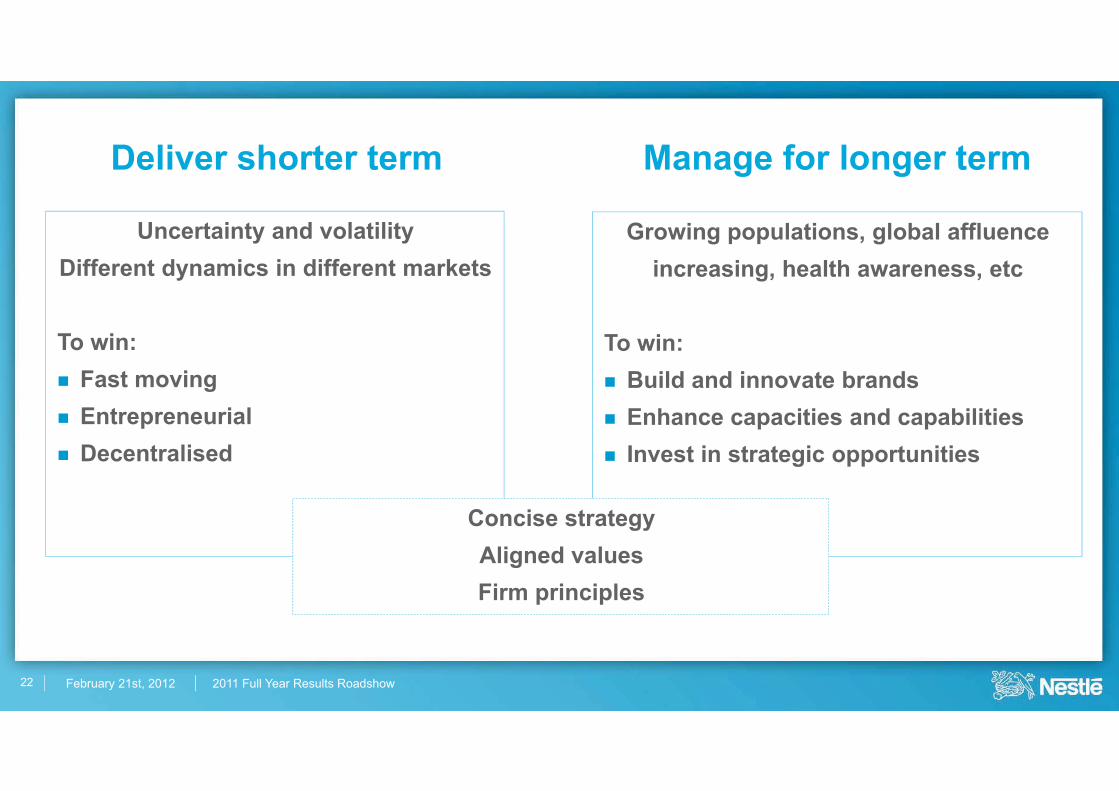
Uncertainty and volatilityDifferent dynamics in different markets
To win:� Fast moving� Entrepreneurial� Decentralised

February 21st, 2012 2011 Full Year Results Roadshow
Growing populations, global affluenceincreasing, health awareness, etc
To win:� Build and innovate brands � Enhance capacities and capabilities� Invest in strategic opportunities
Uncertainty and volatilityDifferent dynamics in different markets
To win:� Fast moving� Entrepreneurial� Decentralised
21
Deliver shorter term Manage for longer term
February 21st, 2012 2011 Full Year Results Roadshow
Growing populations, global affluenceincreasing, health awareness, etc
To win:� Build and innovate brands � Enhance capacities and capabilities� Invest in strategic opportunities
Uncertainty and volatilityDifferent dynamics in different markets
To win:� Fast moving� Entrepreneurial� Decentralised
Concise strategyAligned valuesFirm principles
22
Deliver shorter term Manage for longer term

February 21st, 2012 2011 Full Year Results Roadshow
Deliver shorter term
Growing populations, global affluenceincreasing, health awareness, etc
To win:� Build and innovate brands � Enhance capacities and capabilities� Invest in strategic opportunities
Uncertainty and volatilityDifferent dynamics in different markets
To win:� Fast moving� Entrepreneurial� Decentralised
Manage for longer term
The Nestlé Roadmap
23

February 21st, 2012 2011 Full Year Results Roadshow
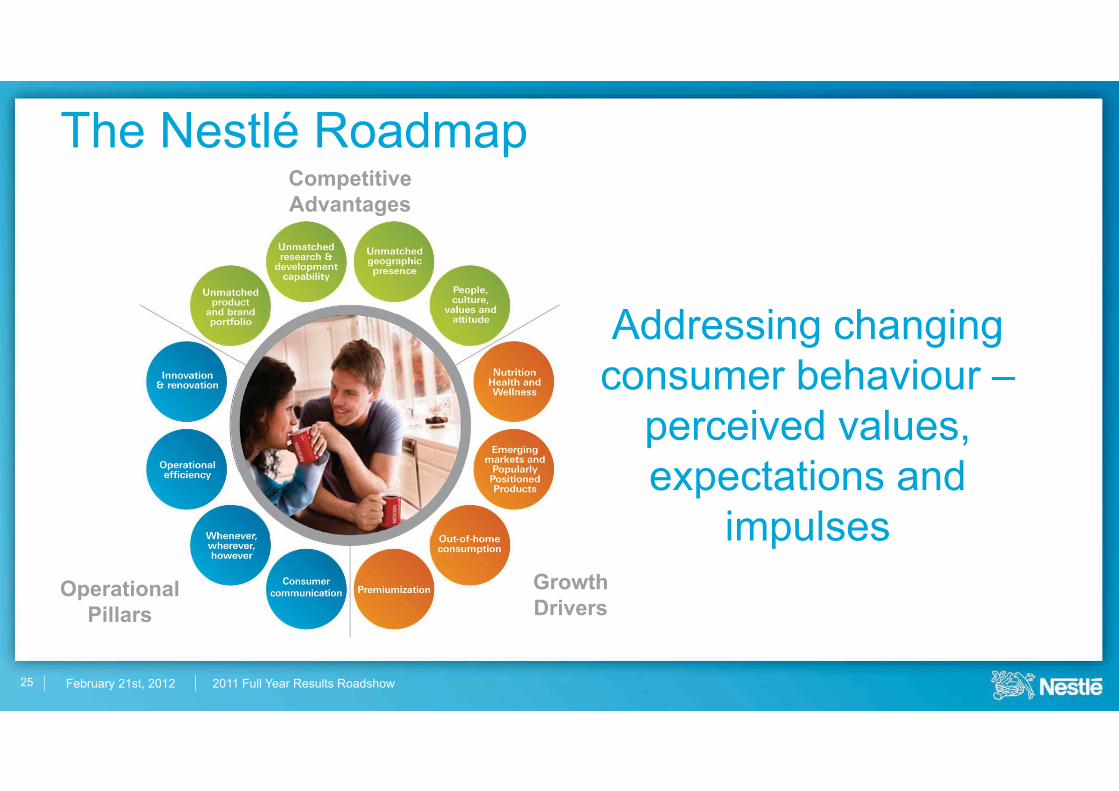
The Nestlé Roadmap
24
OperationalPillars
GrowthDrivers
CompetitiveAdvantages
Appropriateto the New Reality
DrivingSustainablePerformance
February 21st, 2012 2011 Full Year Results Roadshow25
The Nestlé Roadmap
Addressing changing consumer behaviour –
perceived values, expectations and
impulsesOperational
PillarsGrowthDrivers
CompetitiveAdvantages
February 21st, 2012 2011 Full Year Results Roadshow
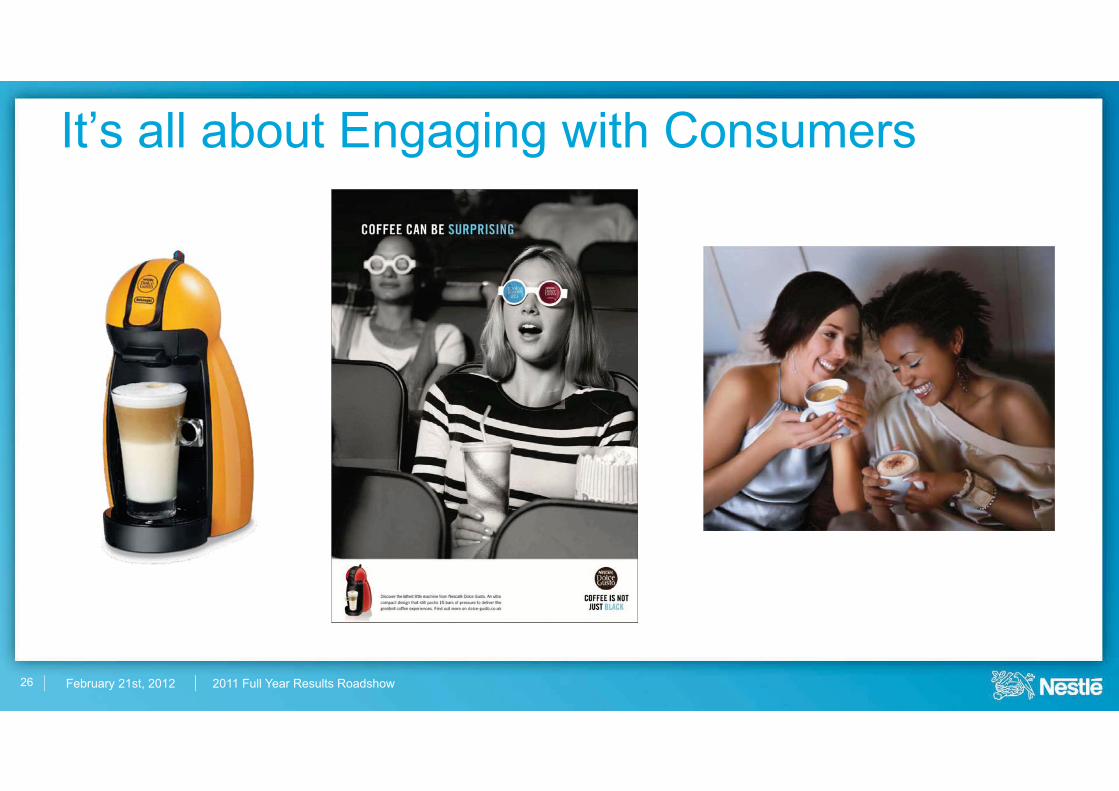
It’s all about Engaging with Consumers
26
February 21st, 2012 2011 Full Year Results Roadshow
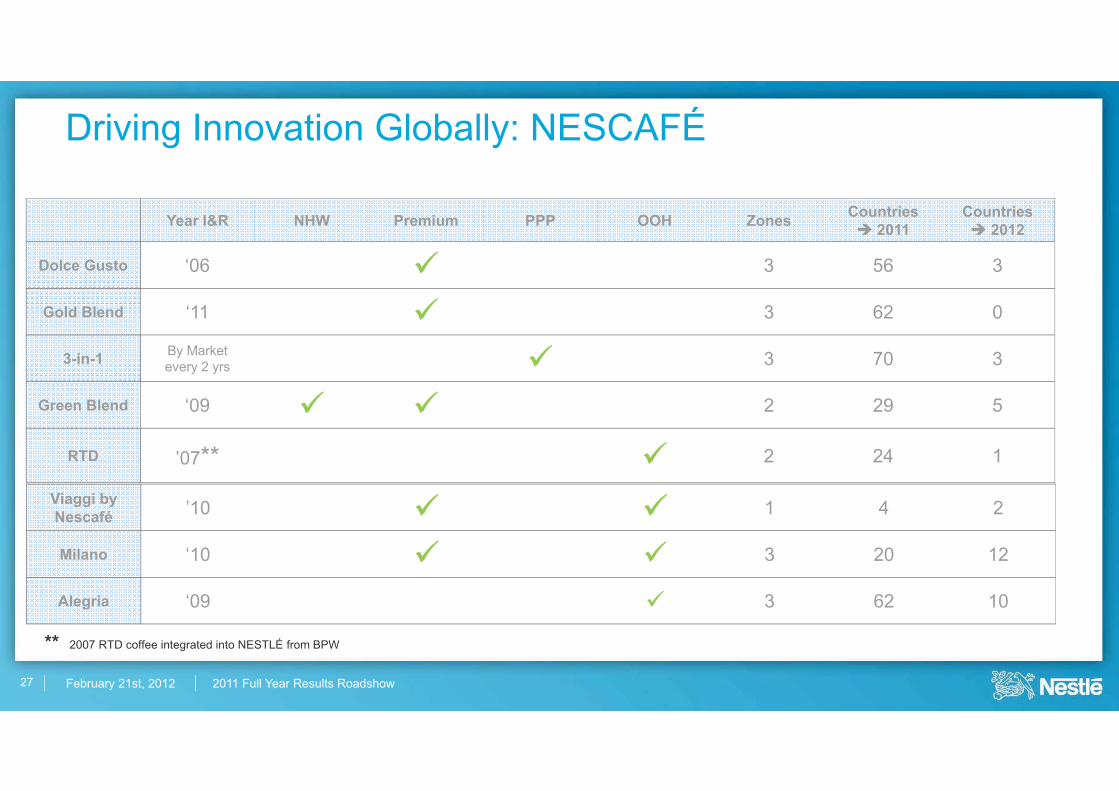
Year I&R NHW Premium PPP OOH Zones Countries� 2011
Countries� 2012
Dolce Gusto ‘06 � 3 56 3
Gold Blend ‘11 � 3 62 0
3-in-1 By Marketevery 2 yrs � 3 70 3
Green Blend ‘09 � � 2 29 5
RTD ’07** � 2 24 1
Driving Innovation Globally: NESCAFÉ
** 2007 RTD coffee integrated into NESTLÉ from BPW
Viaggi by Nescafé ’10 � � 1 4 2
Milano ‘10 � � 3 20 12
Alegria ‘09 � 3 62 10
27
February 21st, 2012 2011 Full Year Results Roadshow
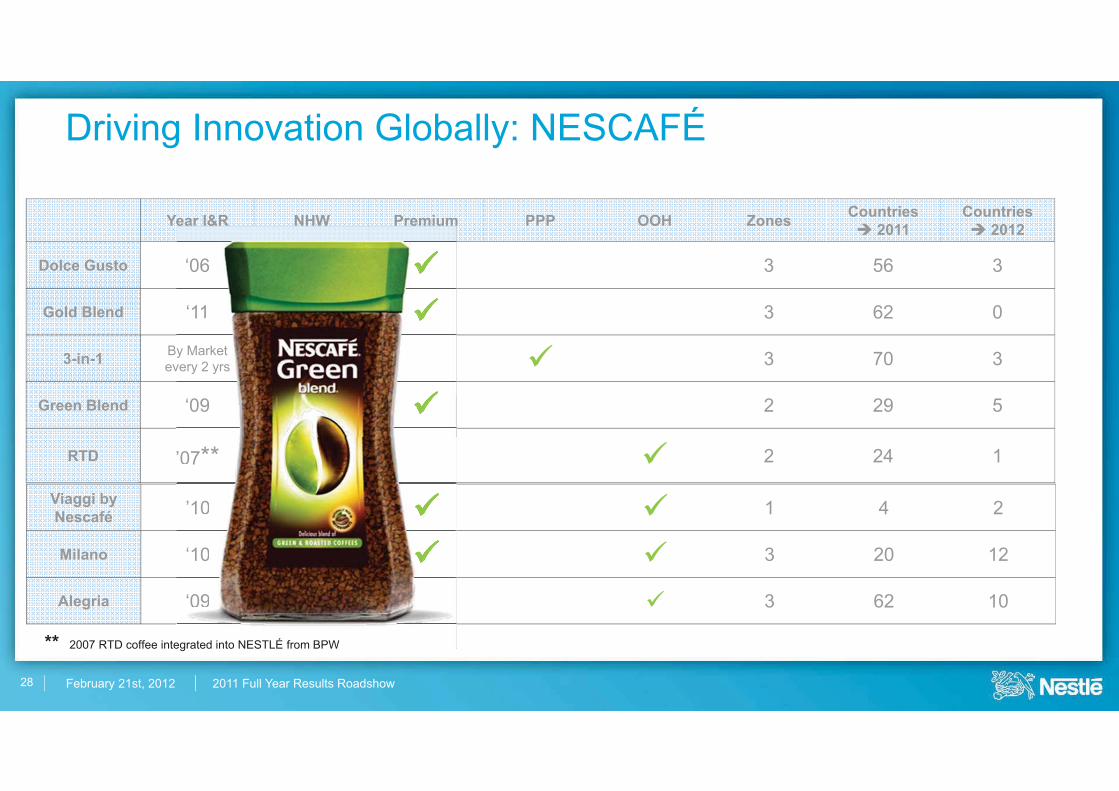
Year I&R NHW Premium PPP OOH Zones Countries� 2011
Countries� 2012
Dolce Gusto ‘06 � 3 56 3
Gold Blend ‘11 � 3 62 0
3-in-1 By Marketevery 2 yrs � 3 70 3
Green Blend ‘09 � � 2 29 5
RTD ’07** � 2 24 1
Driving Innovation Globally: NESCAFÉ
** 2007 RTD coffee integrated into NESTLÉ from BPW
Viaggi by Nescafé ’10 � � 1 4 2
Milano ‘10 � � 3 20 12
Alegria ‘09 � 3 62 10
28
‘06
‘11
y Marketvery 2 yrs
‘09
’07**
egrated into NESTLÉ from BPW
’10
‘10
‘09

February 21st, 2012 2011 Full Year Results Roadshow
Year I&R NHW Premium PPP OOH Zones Countries� 2011
Countries� 2012
Dolce Gusto ‘06 � 3 56 3
Gold Blend ‘11 � 3 62 0
3-in-1 By Marketevery 2 yrs � 3 70 3
Green Blend ‘09 � � 2 29 5
RTD ’07** � 2 24 1
Driving Innovation Globally: NESCAFÉ
** 2007 RTD coffee integrated into NESTLÉ from BPW
Viaggi by Nescafé ’10 � � 1 4 2
Milano ‘10 � � 3 20 12
Alegria ‘09 � 3 62 10
29
Premium PPP
February 21st, 2012 2011 Full Year Results Roadshow
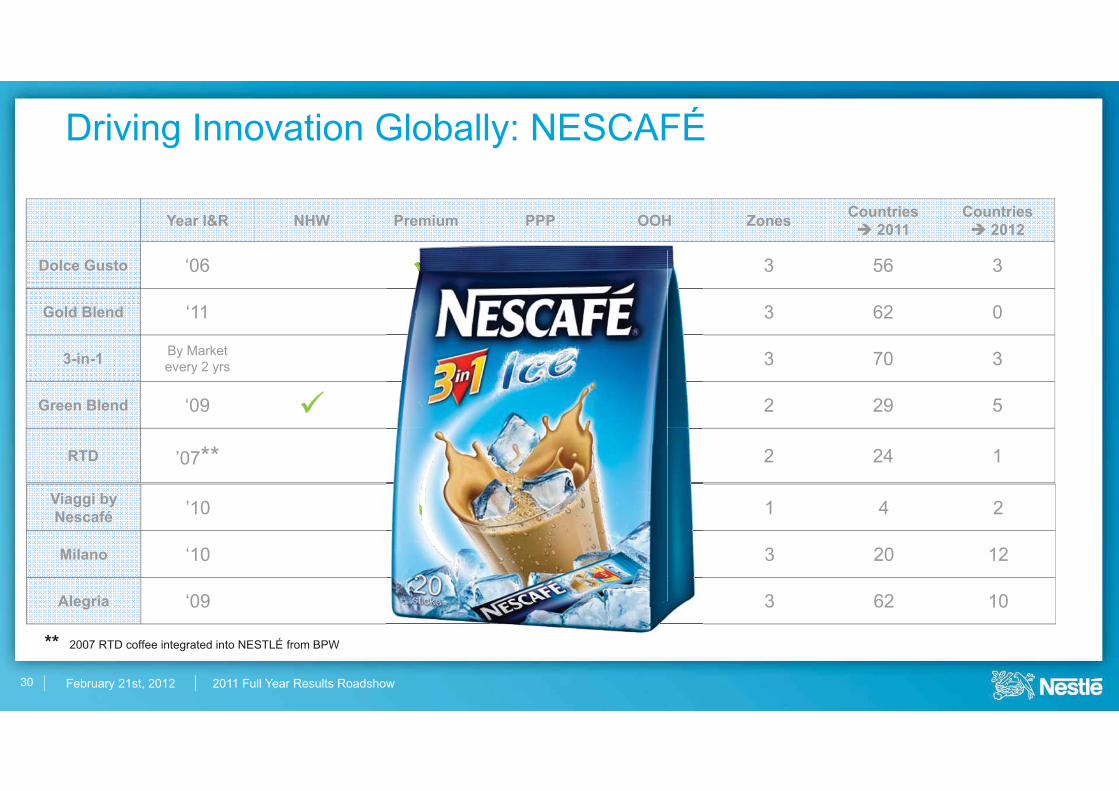
Year I&R NHW Premium PPP OOH Zones Countries� 2011
Countries� 2012
Dolce Gusto ‘06 � 3 56 3
Gold Blend ‘11 � 3 62 0
3-in-1 By Marketevery 2 yrs � 3 70 3
Green Blend ‘09 � � 2 29 5
RTD ’07** � 2 24 1
Driving Innovation Globally: NESCAFÉ
** 2007 RTD coffee integrated into NESTLÉ from BPW
Viaggi by Nescafé ’10 � � 1 4 2
Milano ‘10 � � 3 20 12
Alegria ‘09 � 3 62 10
30
������������������������������������

February 21st, 2012 2011 Full Year Results Roadshow
Year I&R NHW Premium PPP OOH Zones Countries� 2011
Countries� 2012
Dolce Gusto ‘06 � 3 56 3
Gold Blend ‘11 � 3 62 0
3-in-1 By Marketevery 2 yrs � 3 70 3
Green Blend ‘09 � � 2 29 5
RTD ‘07** � 2 24 1
Driving Innovation Globally: NESCAFÉ
** 2007 RTD coffee integrated into NESTLÉ from BPW
Viaggi by Nescafé ‘10 � � 1 4 2
Milano ‘10 � � 3 20 12
Alegria ‘09 � 3 62 10
31
PP OOH Zones C
33333333333333333333333333333333
February 21st, 2012 2011 Full Year Results Roadshow
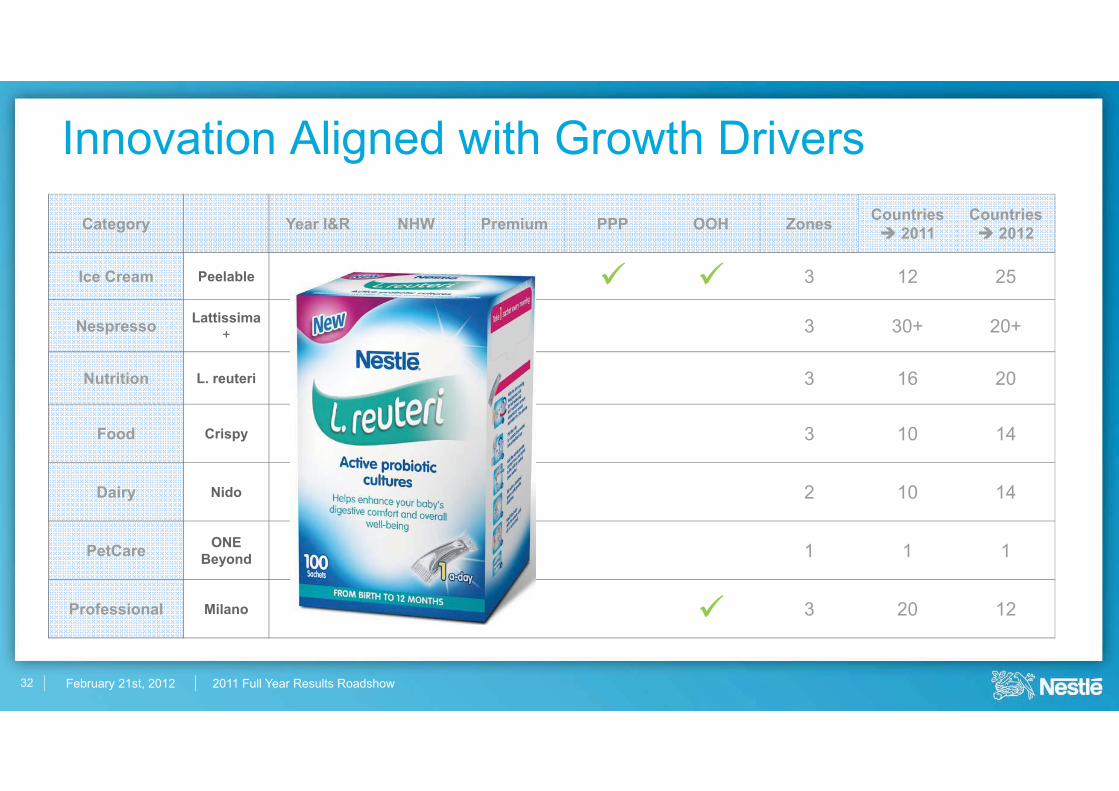
Category Year I&R NHW Premium PPP OOH Zones Countries� 2011
Countries� 2012
Ice Cream Peelable ‘10 � � 3 12 25
Nespresso Lattissima+ ‘11 � � 3 30+ 20+
Nutrition L. reuteri ‘10 � 3 16 20
Food Crispy ‘11 � 3 10 14
Dairy Nido ’11 � � 2 10 14
PetCare ONEBeyond ’11 � � 1 1 1
Professional Milano ‘10 � � 3 20 12
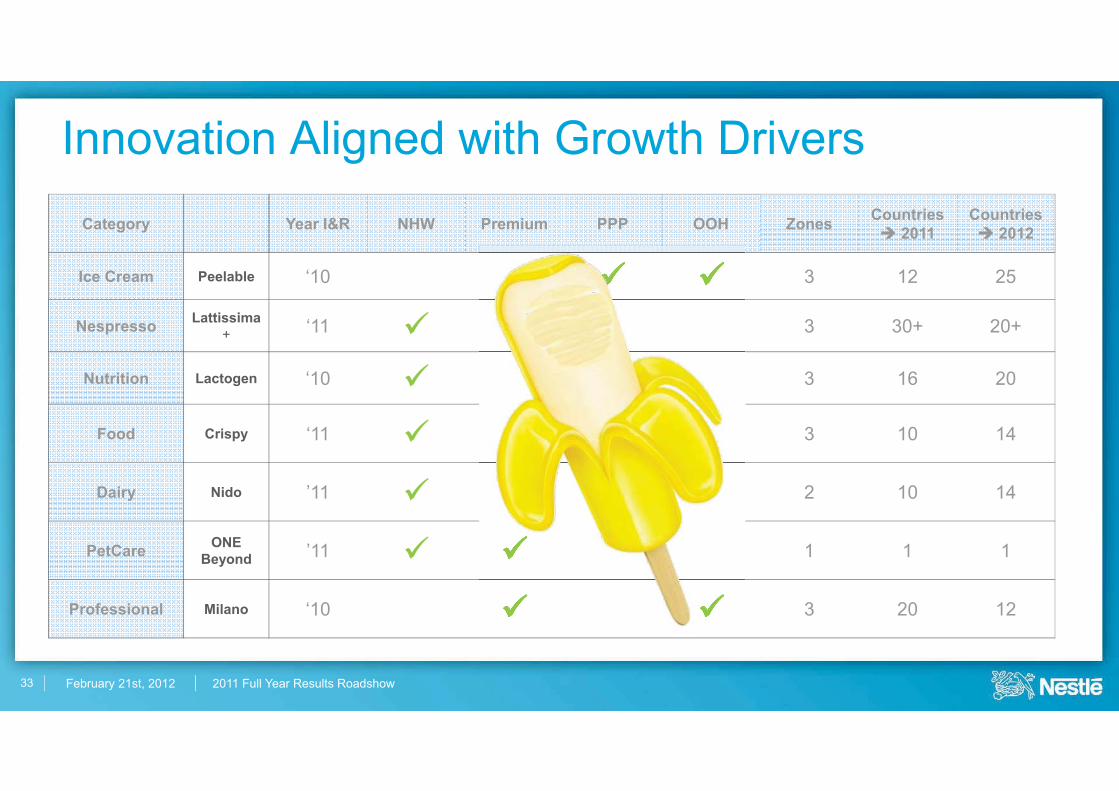
Innovation Aligned with Growth Drivers
32
February 21st, 2012 2011 Full Year Results Roadshow
Category Year I&R NHW Premium PPP OOH Zones Countries� 2011
Countries� 2012
Ice Cream Peelable ‘10 � � 3 12 25
Nespresso Lattissima+ ‘11 � � 3 30+ 20+
Nutrition Lactogen ‘10 � 3 16 20
Food Crispy ‘11 � 3 10 14
Dairy Nido ’11 � � 2 10 14
PetCare ONEBeyond ’11 � � 1 1 1
Professional Milano ‘10 � � 3 20 12
Innovation Aligned with Growth Drivers
33

February 21st, 2012 2011 Full Year Results Roadshow
Category Year I&R NHW Premium PPP OOH Zones Countries� 2011
Countries� 2012
Ice Cream Peelable ‘10 � � 3 12 25
Nespresso Lattissima+ ‘11 � � 3 30+ 20+
Nutrition Lactogen ‘10 � 3 16 20
Food Crispy ‘11 � 3 10 14
Dairy Nido ’11 � � 2 10 14
PetCare ONEBeyond ’11 � � 1 1 1
Professional Milano ‘10 � � 3 20 12
Innovation Aligned with Growth Drivers
34

February 21st, 2012 2011 Full Year Results Roadshow
Category Year I&R NHW Premium PPP OOH Zones Countries� 2011
Countries� 2012
Ice Cream Peelable ‘10 � � 3 12 25
Nespresso Lattissima+ ‘11 � � 3 30+ 20+
Nutrition Lactogen ‘10 � 3 16 20
Food Crispy ‘11 � 3 10 14
Dairy Nido ’11 � � 2 10 14
PetCare ONEBeyond ’11 � � 1 1 1
Professional Milano ‘10 � � 3 20 12
Innovation Aligned with Growth Drivers
35
February 21st, 2012 2011 Full Year Results Roadshow
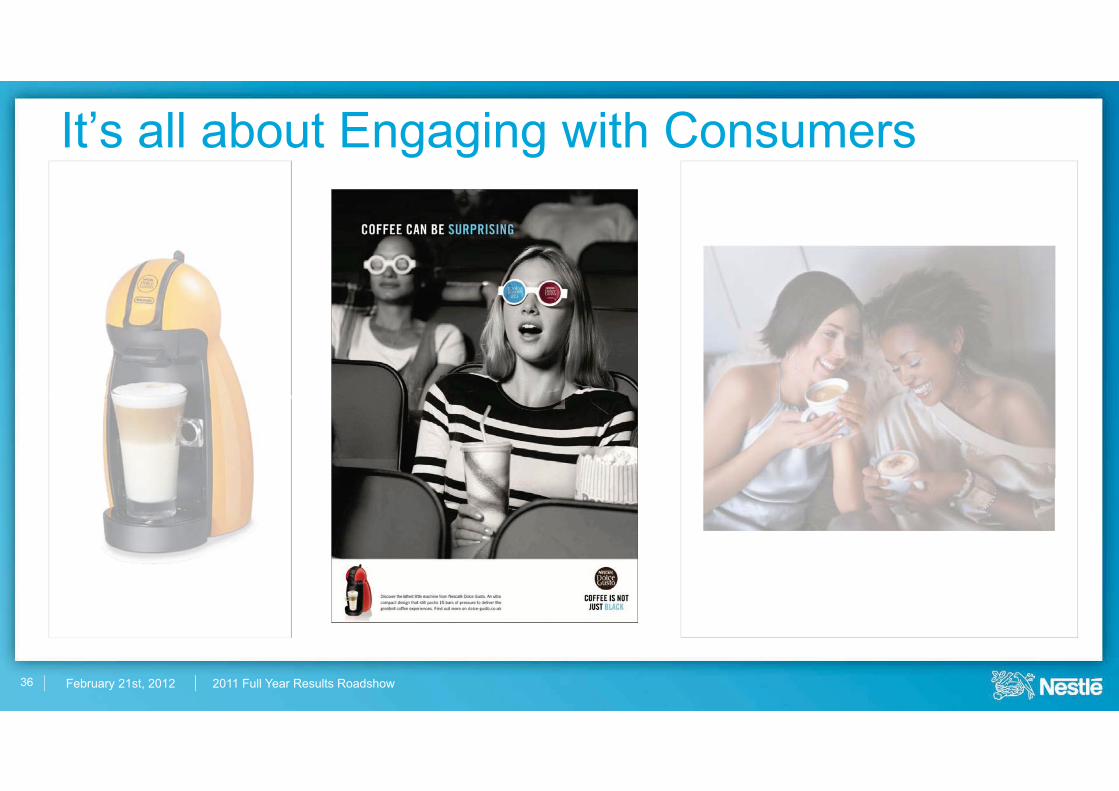
It’s all about Engaging with Consumers
36

February 21st, 2012 2011 Full Year Results Roadshow
Communication trends
37
� Earn Attention
� Start a Conversation
� Buy Space
� Deliver a Message
Spend gets brands visibility: Paid mediaCreativity gets people ‘liking’ them: Earned media
February 21st, 2012 2011 Full Year Results Roadshow
From Brand Communication to Brand Conversationwhile increasing ROBBI*
38
*Return On Brand Building
Investment
February 21st, 2012 2011 Full Year Results Roadshow
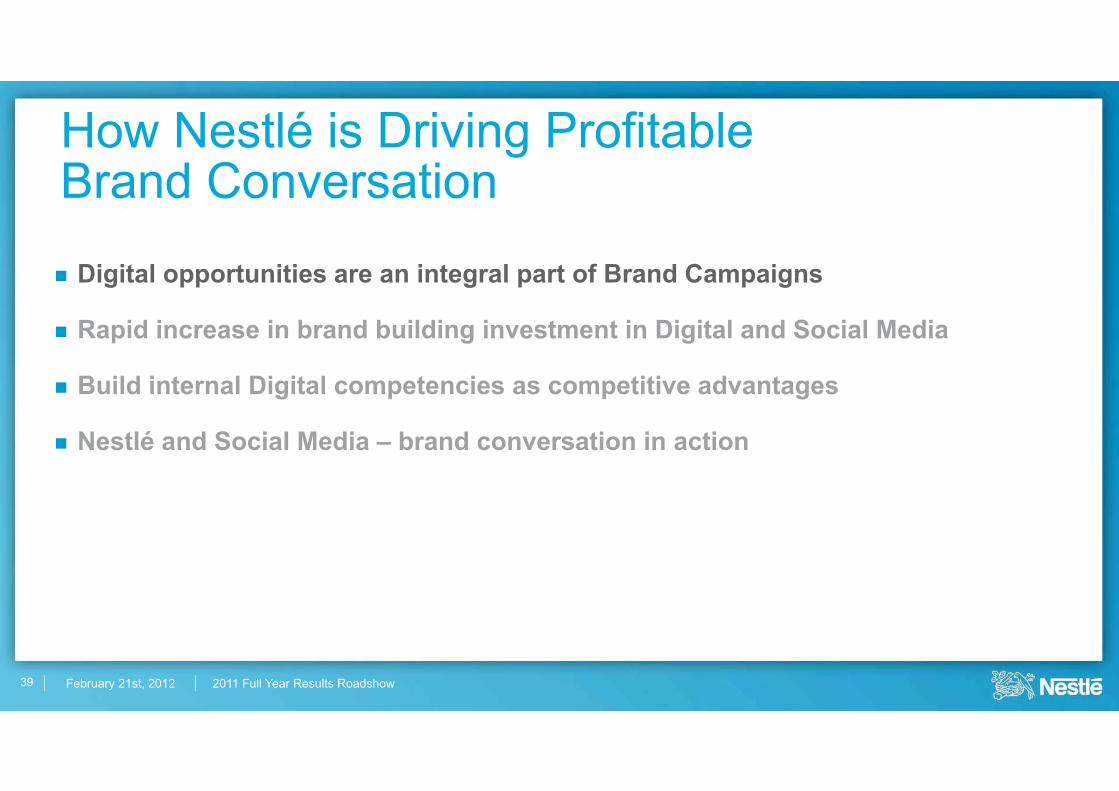
How Nestlé is Driving ProfitableBrand Conversation
� Digital opportunities are an integral part of Brand Campaigns
� Rapid increase in brand building investment in Digital and Social Media
� Build internal Digital competencies as competitive advantages
� Nestlé and Social Media – brand conversation in action
39
February 21st, 2012 2011 Full Year Results Roadshow
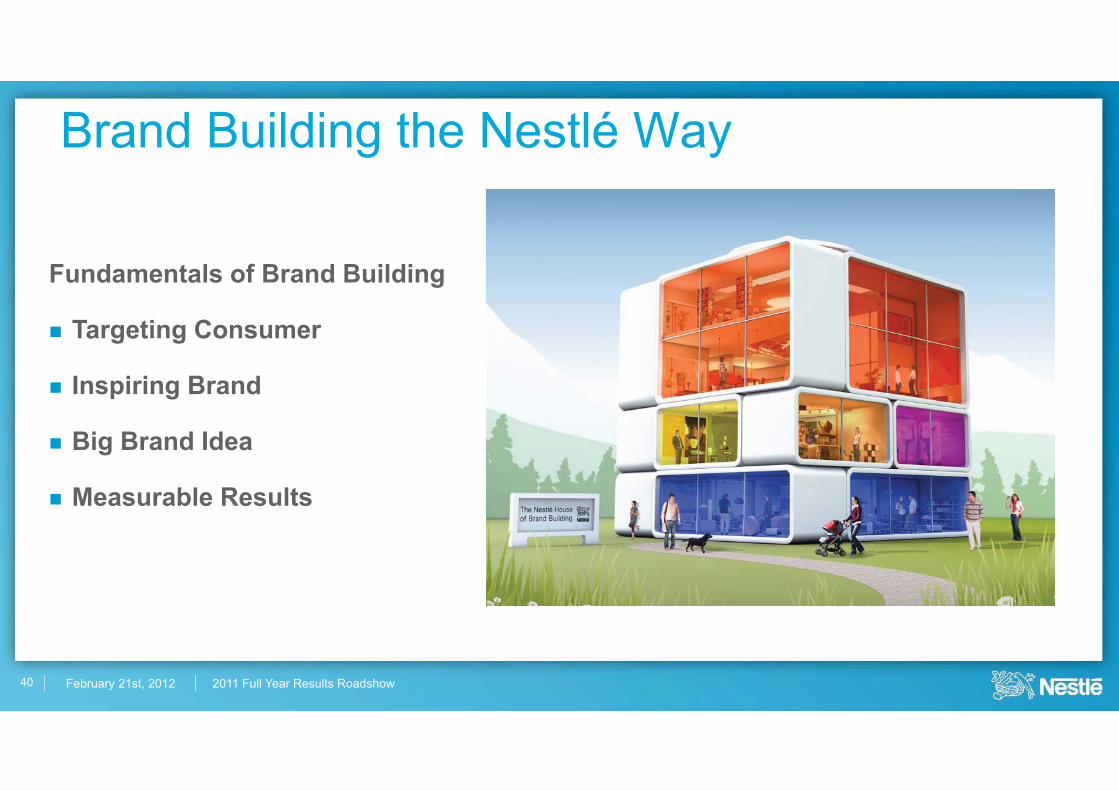
Brand Building the Nestlé Way
40
Fundamentals of Brand Building
� Targeting Consumer
� Inspiring Brand
� Big Brand Idea
� Measurable Results
February 21st, 2012 2011 Full Year Results Roadshow
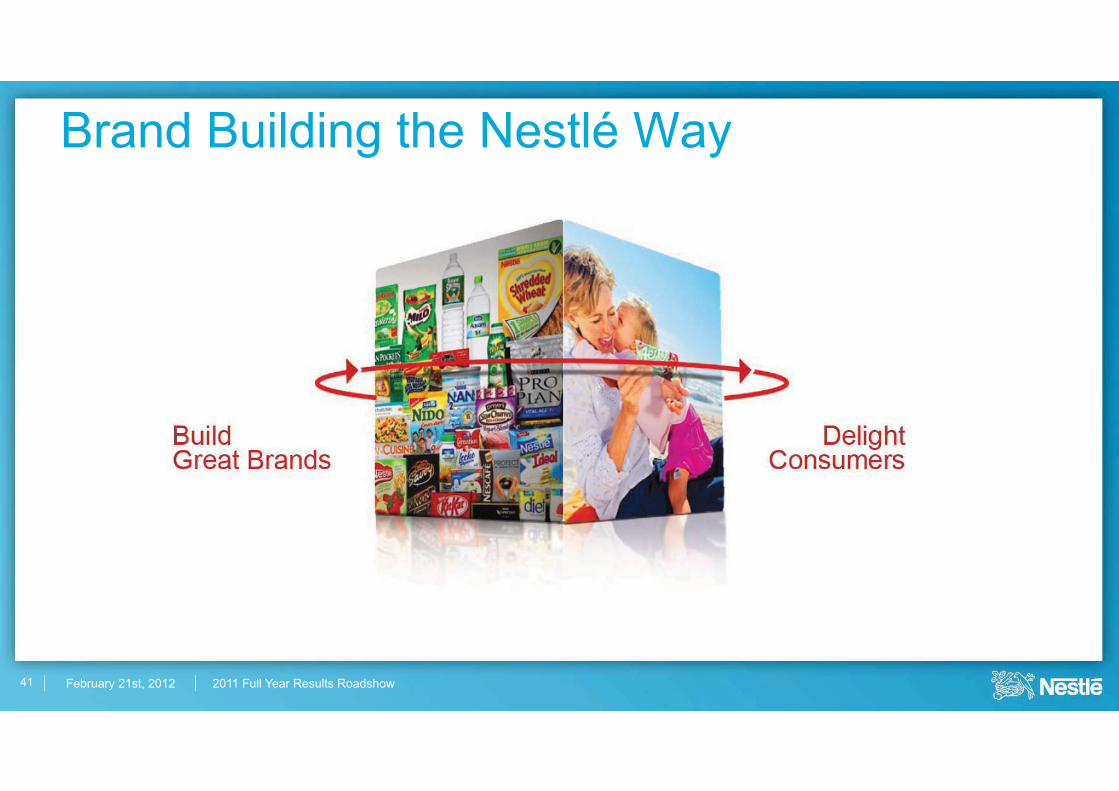
Brand Building the Nestlé Way
41
February 21st, 2012 2011 Full Year Results Roadshow
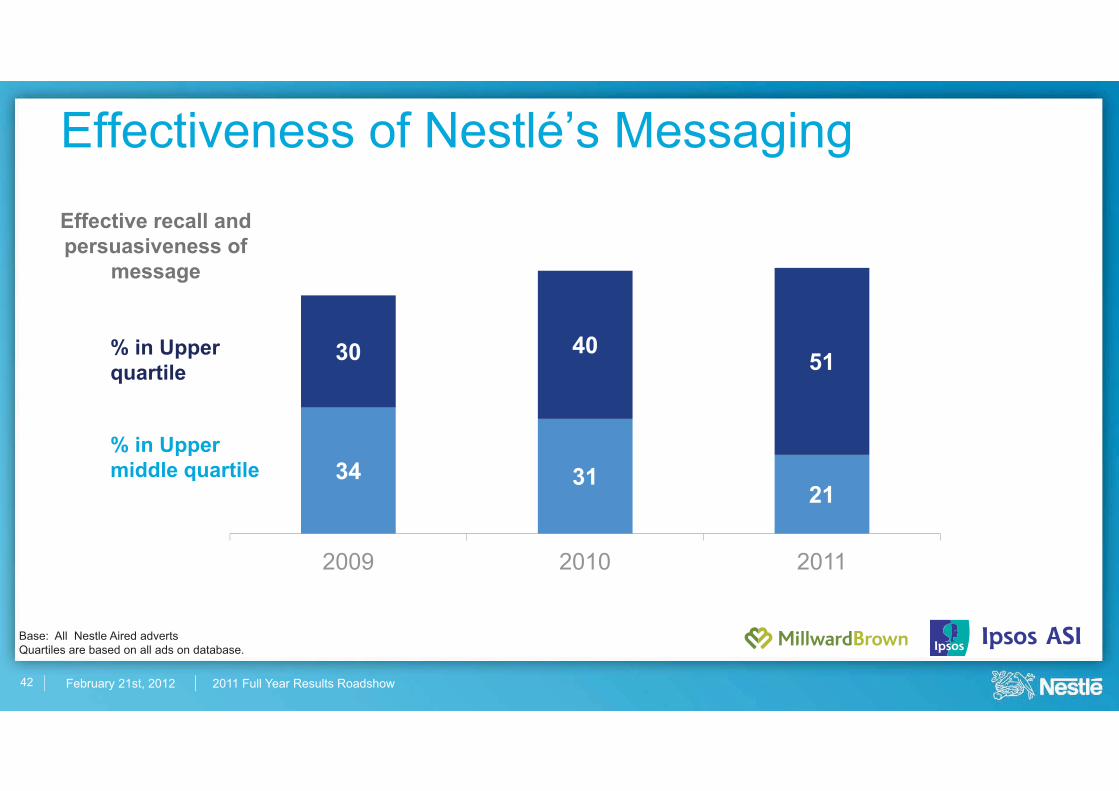
Effectiveness of Nestlé’s Messaging
42
% in Upper quartile
% in Upper middle quartile 34 31
21
30 4051
2009 2010 2011
Base: All Nestle Aired advertsQuartiles are based on all ads on database.
Effective recall and persuasiveness of
message
February 21st, 2012 2011 Full Year Results Roadshow
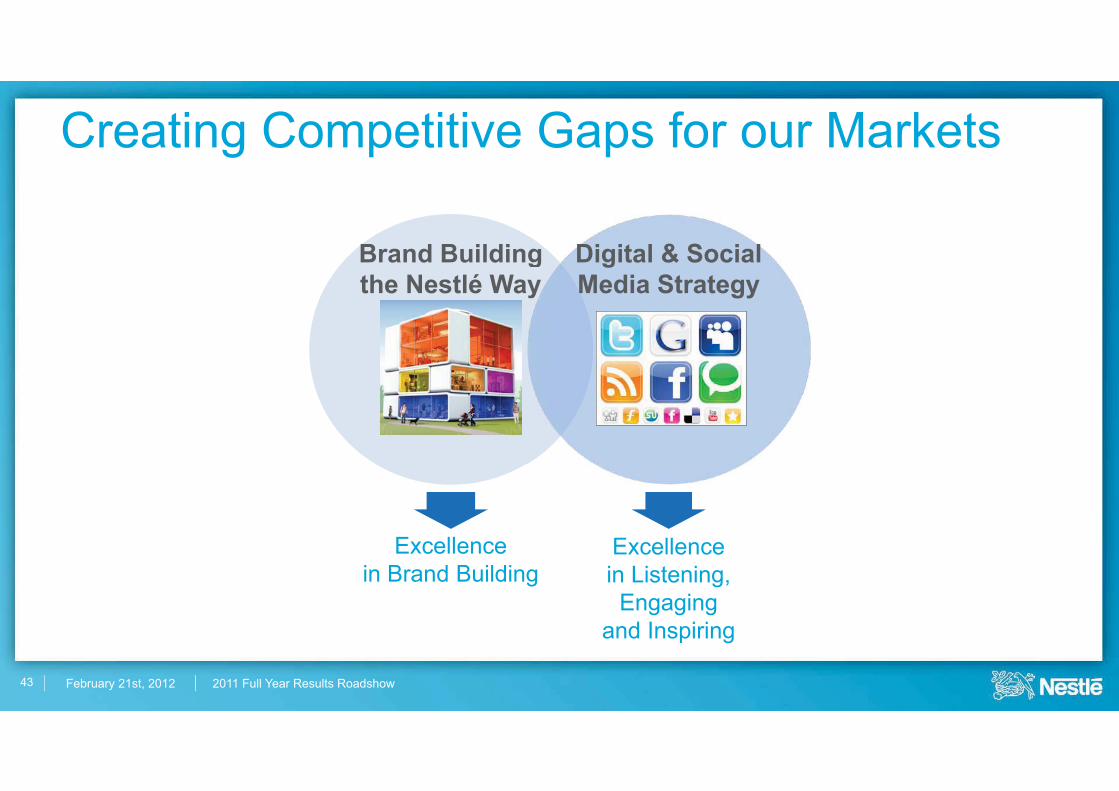
Creating Competitive Gaps for our Markets
43
Excellencein Brand Building
Brand Building the Nestlé Way
g yyyyyyyyyyyyyyyyyyyyyyyyyyyyyyyyyyyyy
Excellencein Listening,Engaging
and Inspiring
Digital & Social Media Strategy
February 21st, 2012 2011 Full Year Results Roadshow
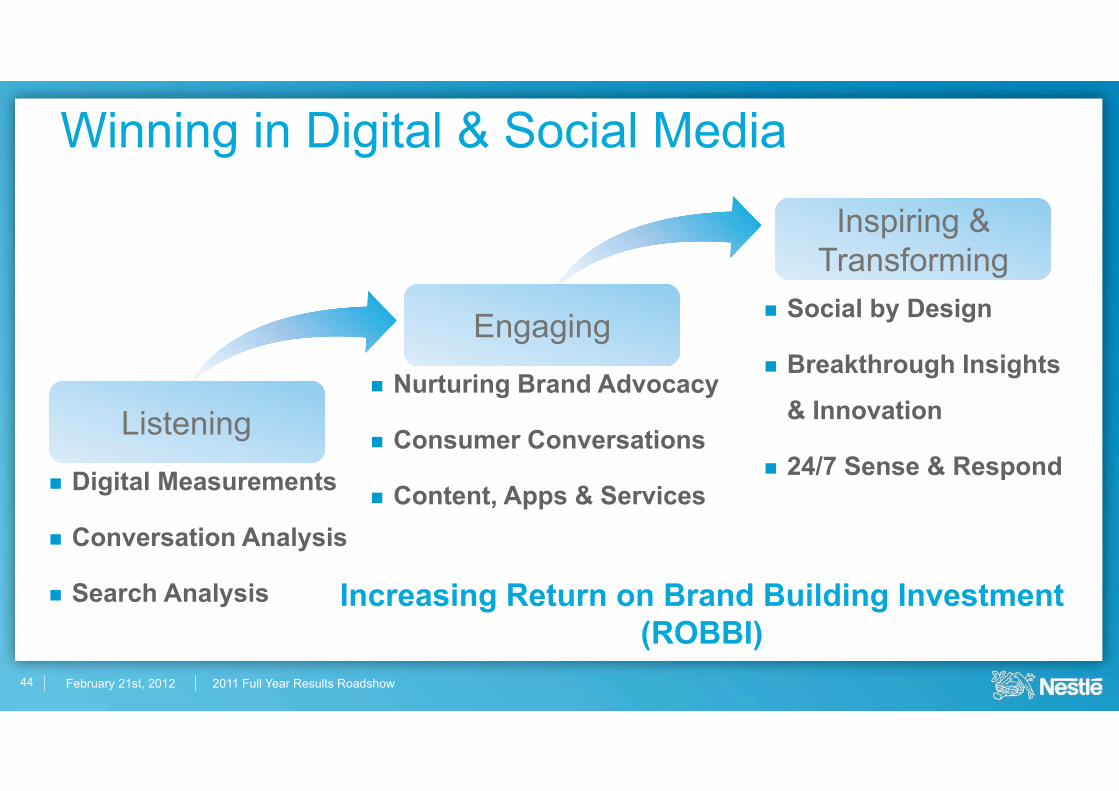
Winning in Digital & Social Media
� Digital Measurements
� Conversation Analysis
� Search Analysis
44
� Nurturing Brand Advocacy
� Consumer Conversations
� Content, Apps & Services
� Social by Design
� Breakthrough Insights
& Innovation
� 24/7 Sense & RespondListening
Engaging
Inspiring & Transforming
Increasing Return on Brand Building Investment(ROBBI)
February 21st, 2012 2011 Full Year Results Roadshow
How Nestlé is Driving ProfitableBrand Conversation
� Digital opportunities are an integral part of Brand Campaigns
� Rapid increase in brand building investment in Digital and Social Media
� Build internal Digital competencies as competitive advantages
� Nestlé and Social Media – brand conversation in action
45

February 21st, 2012 2011 Full Year Results Roadshow
Over 1000 brand websites
Over 250 Nestlé brand pages on Facebook
Over 50 Apps launched
Trend in Digital Investment
46

February 21st, 2012 2011 Full Year Results Roadshow
How Nestlé is Driving ProfitableBrand Conversation
� Digital opportunities are an integral part of Brand Campaigns
� Rapid increase in brand building investment in Digital and Social Media
� Build internal Digital competencies as competitive advantages
� Nestlé and Social Media – brand conversation in action
47
February 21st, 2012 2011 Full Year Results Roadshow
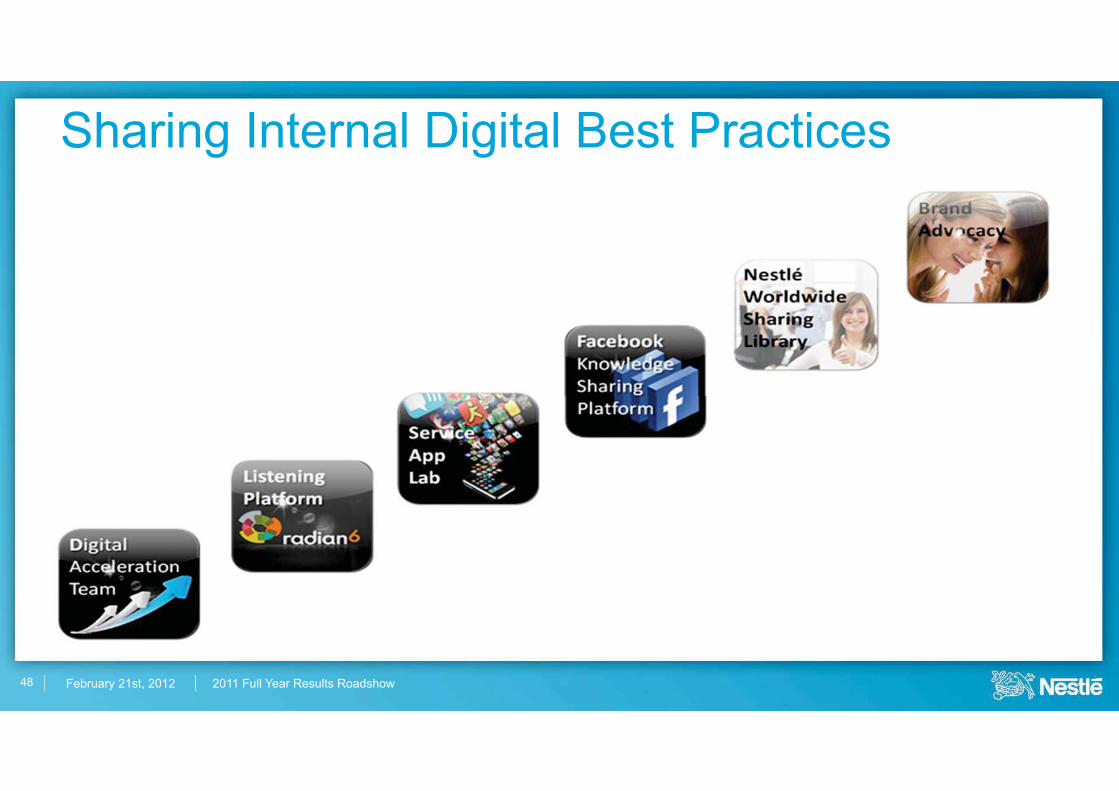
Sharing Internal Digital Best Practices
48
February 21st, 2012 2011 Full Year Results Roadshow
How Nestlé is Driving ProfitableBrand Conversation
� Digital opportunities are an integral part of Brand Campaigns
� Rapid increase in brand building investment in Digital and Social Media
� Build internal Digital competencies as competitive advantages
� Nestlé and Social Media – brand conversation in action
49
February 21st, 2012 2011 Full Year Results Roadshow
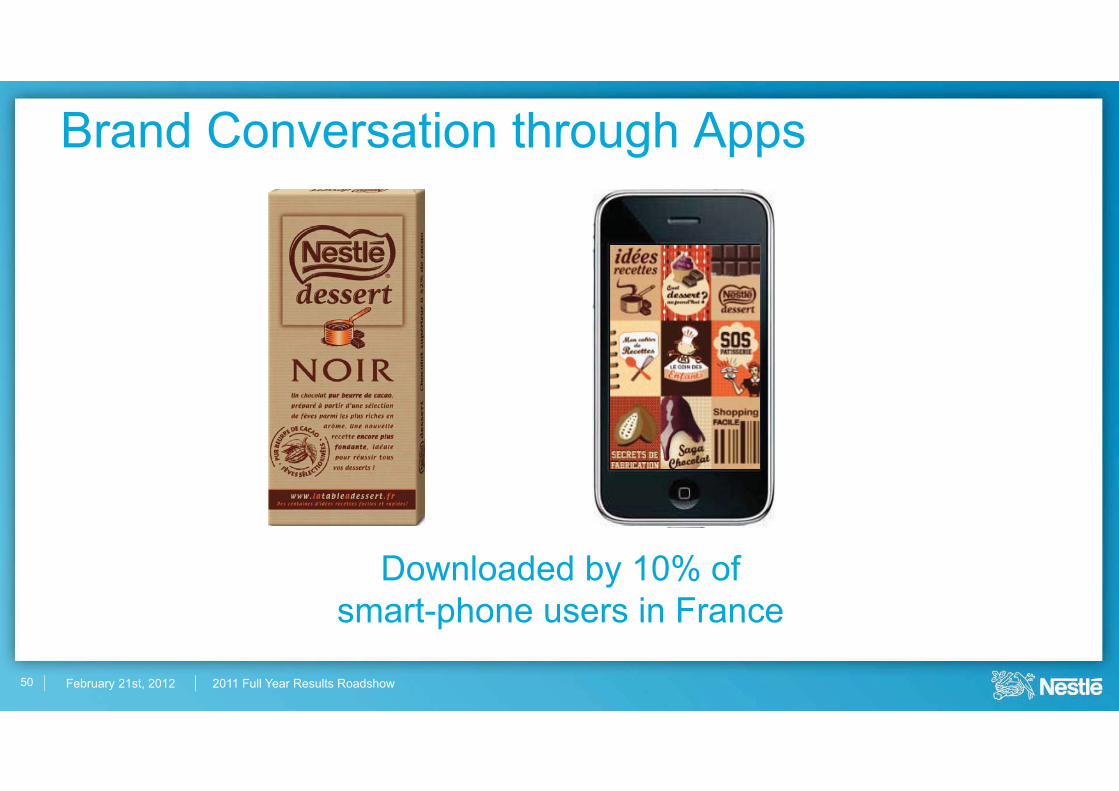
Brand Conversation through Apps
50
Downloaded by 10% of smart-phone users in France
February 21st, 2012 2011 Full Year Results Roadshow
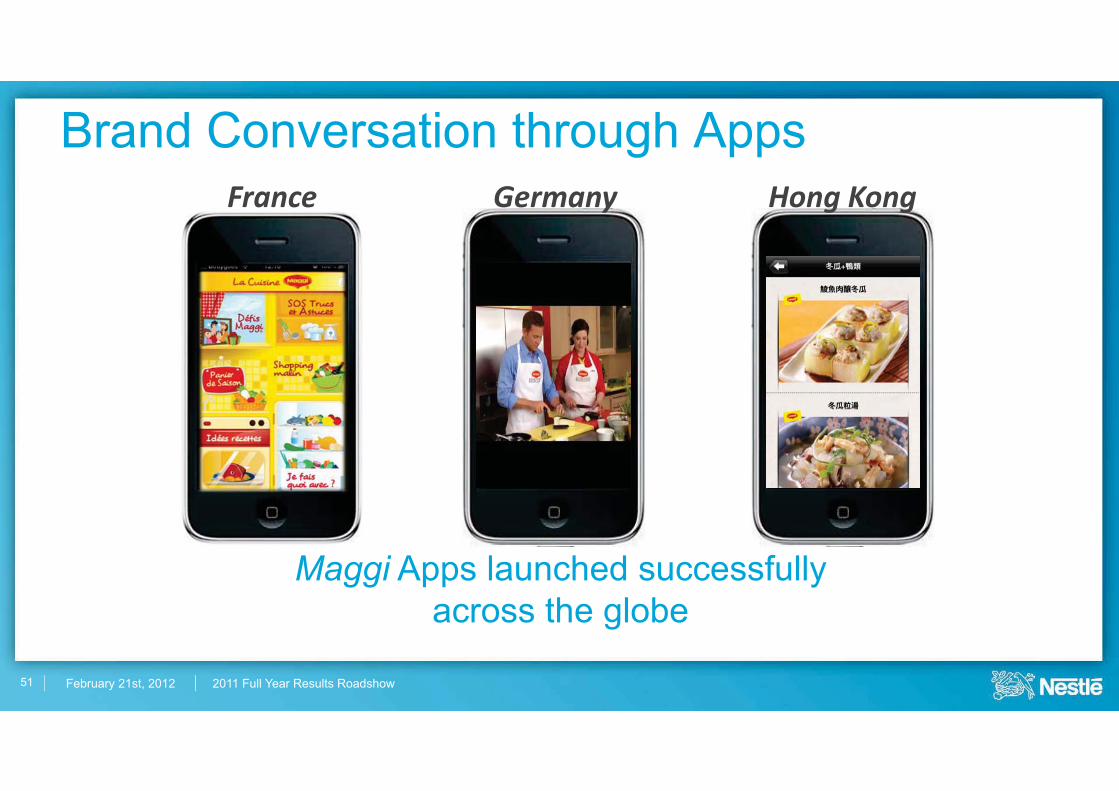
France Hong�KongGermany
Brand Conversation through Apps
51
Maggi Apps launched successfully across the globe

February 21st, 2012 2011 Full Year Results Roadshow
Brand Conversation through Facebook
52
250+ Nestlé brand pages with 40+ million Facebook fans7 brands have 1+ million fans each

February 21st, 2012 2011 Full Year Results Roadshow
Brand Conversation through Earned Media
53
Over 10 million earned media viewings each
February 21st, 2012 2011 Full Year Results Roadshow
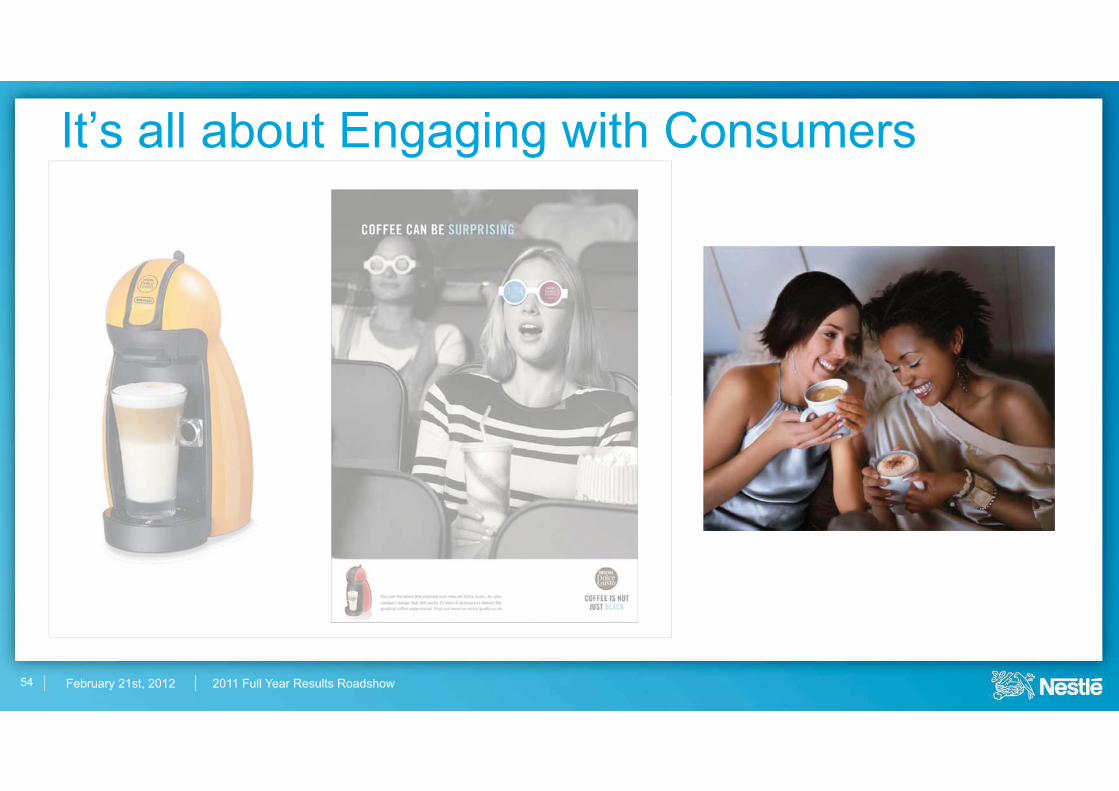
It’s all about Engaging with Consumers
54

February 21st, 2012 2011 Full Year Results Roadshow
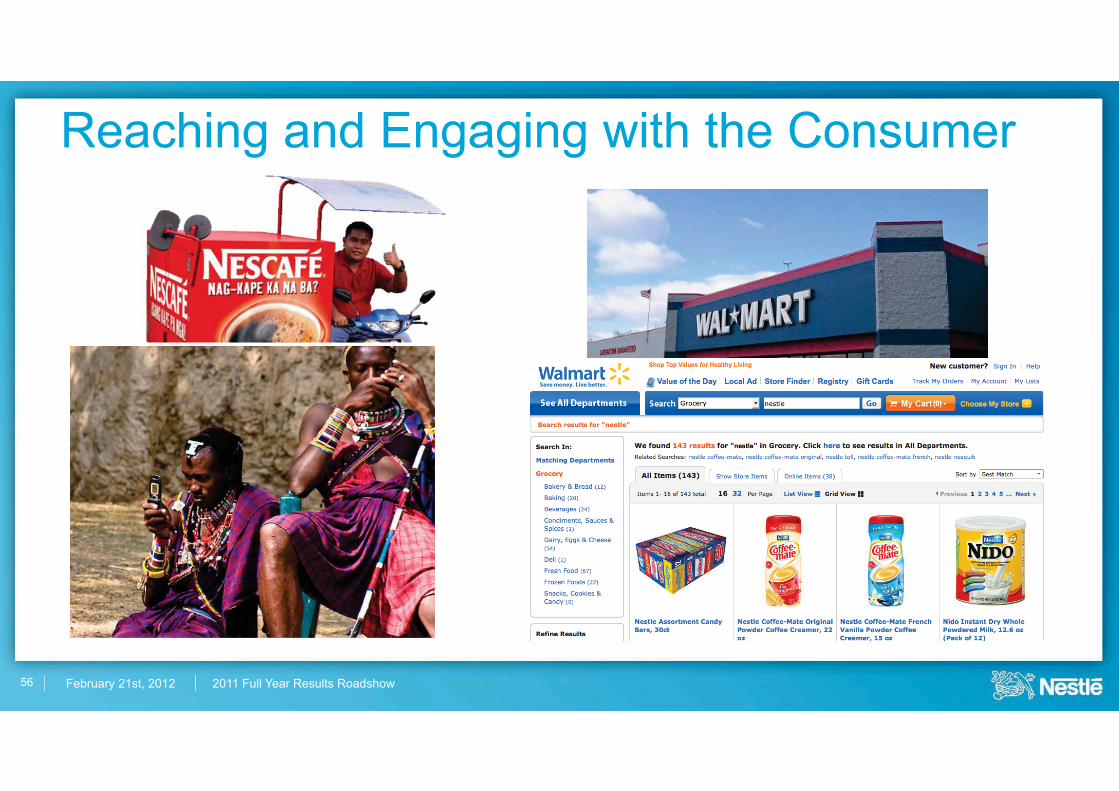
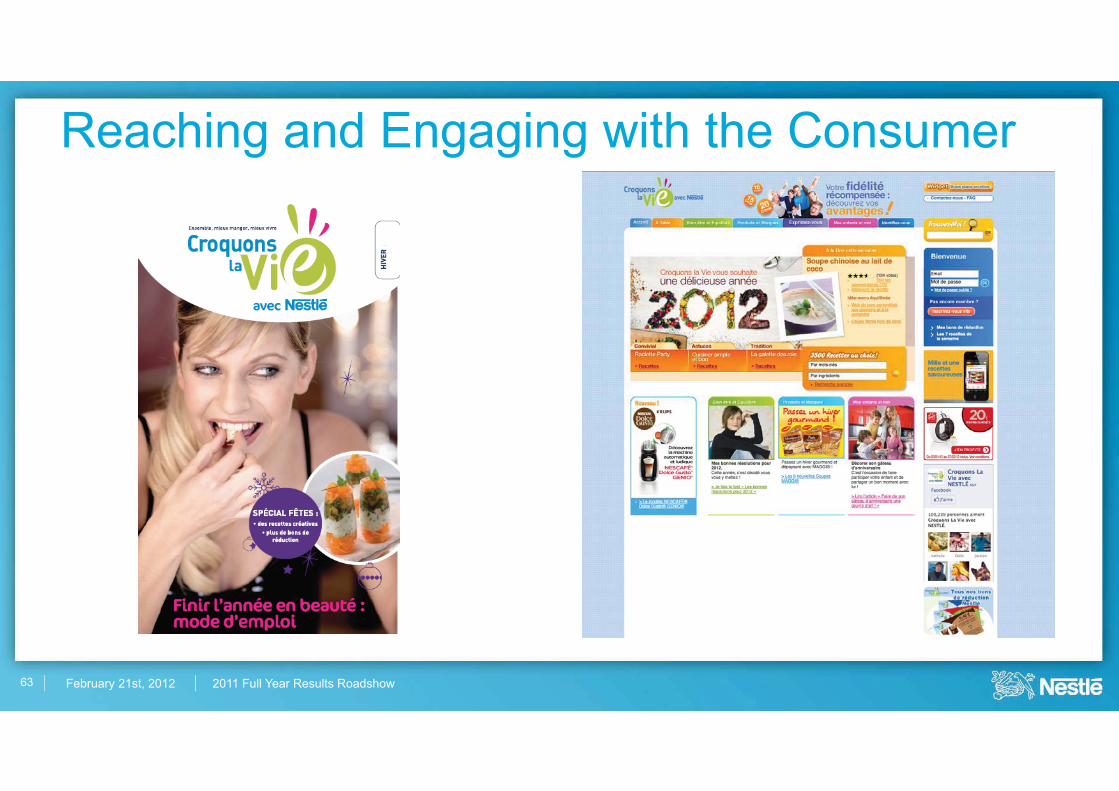
Reaching and Engaging with the Consumer
55
February 21st, 2012 2011 Full Year Results Roadshow
Reaching and Engaging with the Consumer
56

February 21st, 2012 2011 Full Year Results Roadshow
Reaching and Engaging with the Consumer
57
February 21st, 2012 2011 Full Year Results Roadshow
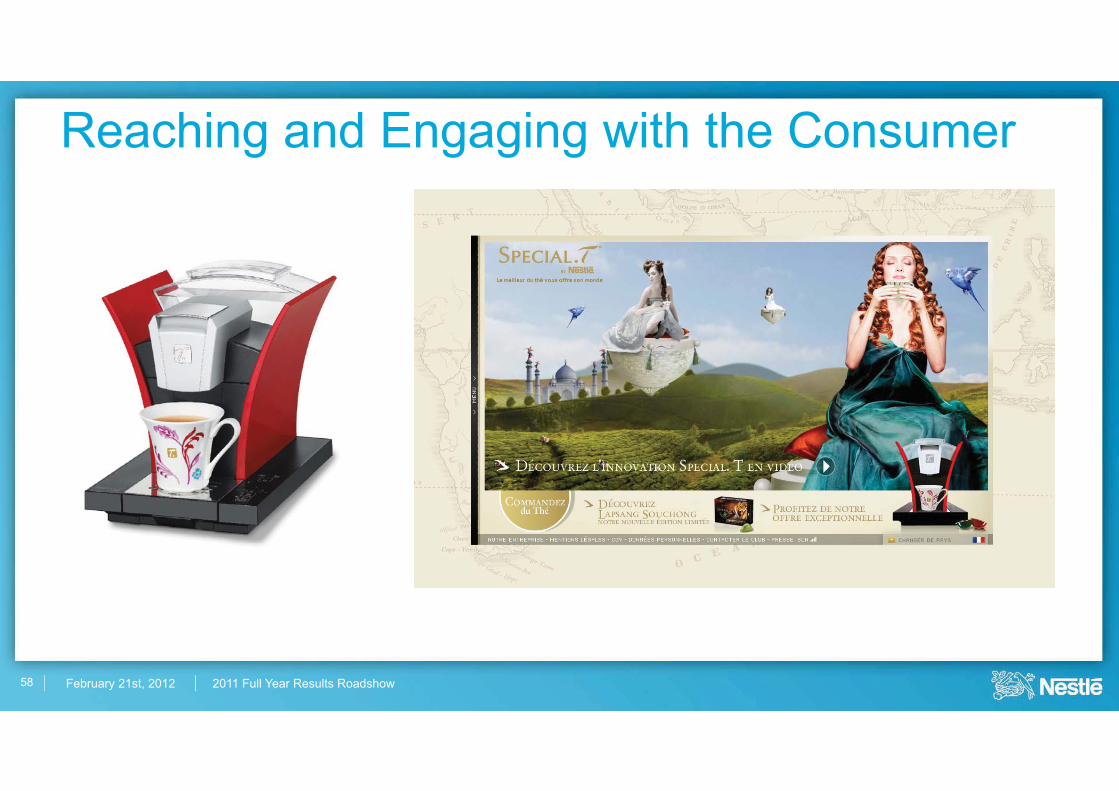
Reaching and Engaging with the Consumer
58
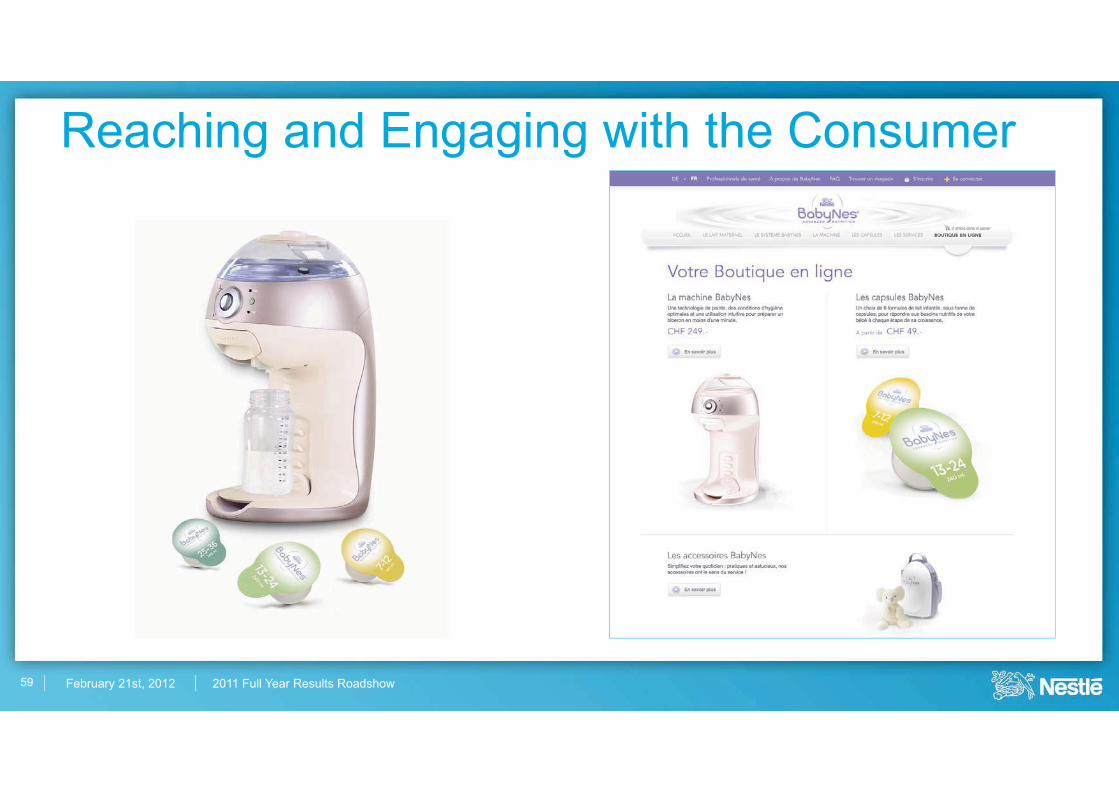
February 21st, 2012 2011 Full Year Results Roadshow
Reaching and Engaging with the Consumer
59
February 21st, 2012 2011 Full Year Results Roadshow
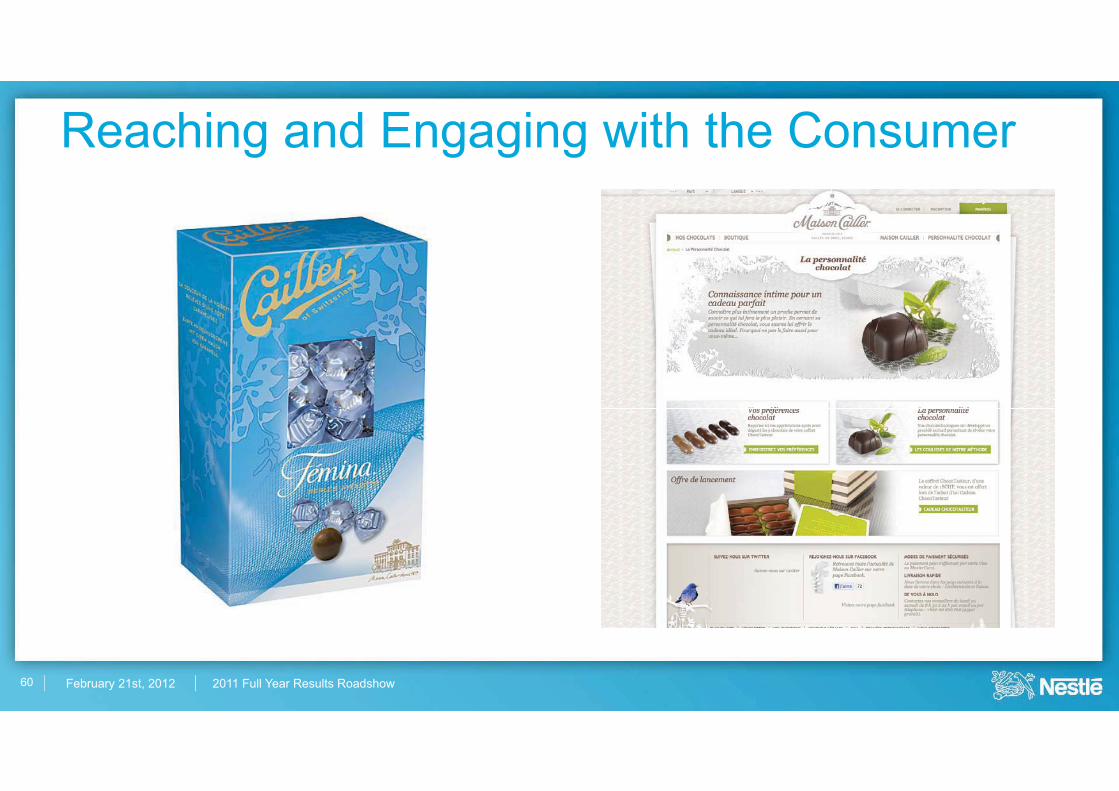
Reaching and Engaging with the Consumer
60

February 21st, 2012 2011 Full Year Results Roadshow
Reaching and Engaging with the Consumer
61
February 21st, 2012 2011 Full Year Results Roadshow
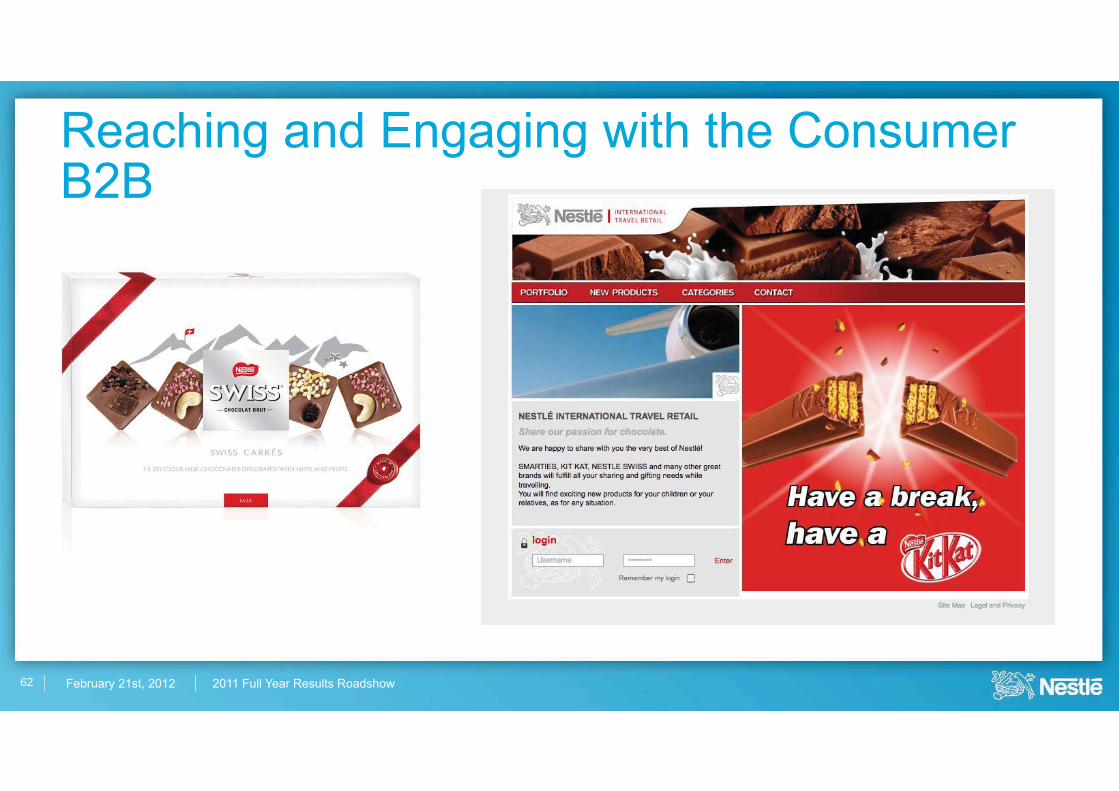
Reaching and Engaging with the ConsumerB2B
62
February 21st, 2012 2011 Full Year Results Roadshow
Reaching and Engaging with the Consumer
63
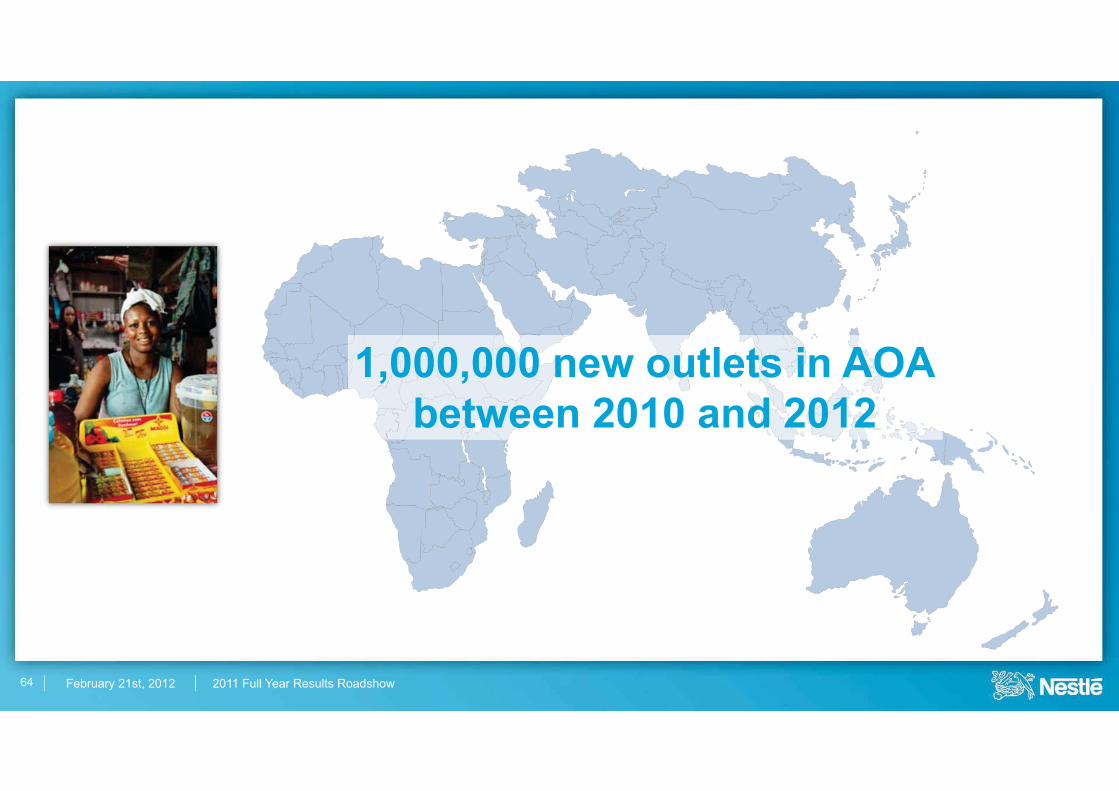
February 21st, 2012 2011 Full Year Results Roadshow64
1,000,000 new outlets in AOAbetween 2010 and 2012

February 21st, 2012 2011 Full Year Results Roadshow
It’s all about Engaging with Consumers
65

February 21st, 2012 2011 Full Year Results Roadshow
Roadmap Driving Performance in New Reality
66
OperationalPillars
GrowthDrivers
CompetitiveAdvantages

February 21st, 2012 2011 Full Year Roadshow
2011 Full Year Roadshow
Wan Ling MartelloChief Financial Officer
Designate
February 21st, 2012 2011 Full Year Results Roadshow
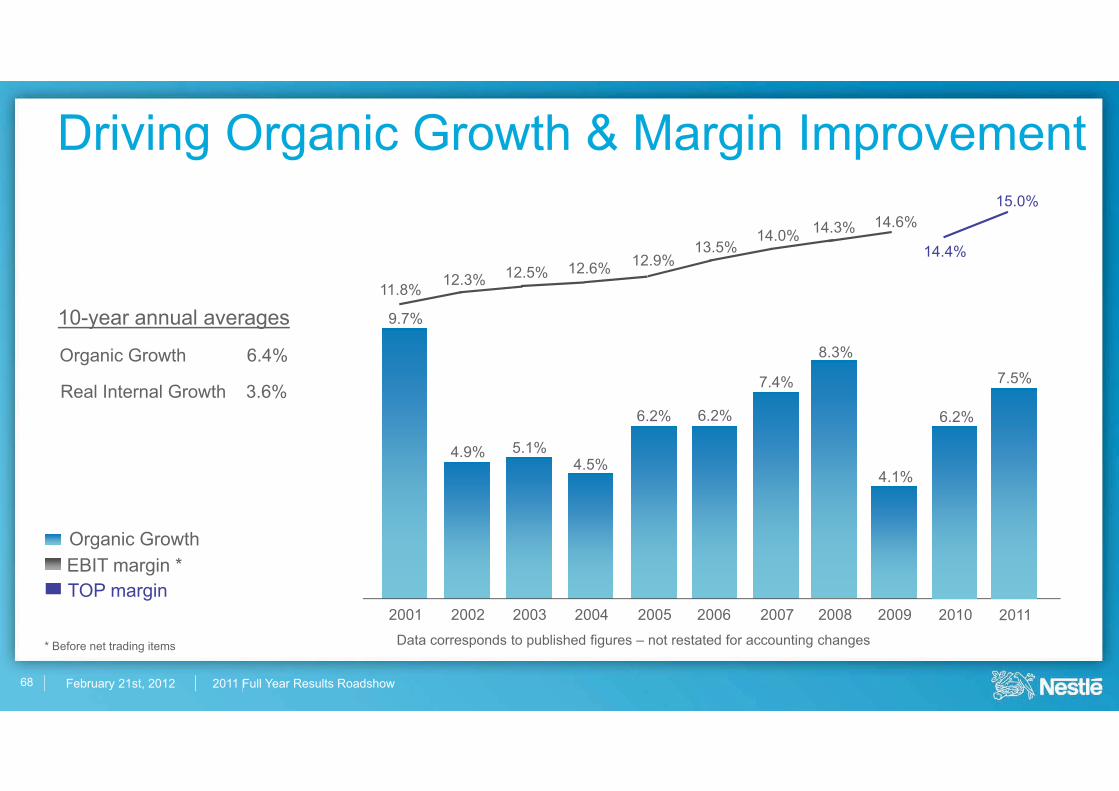
11.8% 12.3% 12.5% 12.6% 12.9%13.5%
14.0% 14.3% 14.6%
Driving Organic Growth & Margin Improvement
Data corresponds to published figures – not restated for accounting changes
7.4%
20092001 2002 2003 2004 2005 2006 2007
9.7%
5.1%4.5%
6.2% 6.2%
4.1%4.9%
2008
8.3%
10-year annual averages
Organic Growth 6.4%
Real Internal Growth 3.6%
2010
6.2%
2011
7.5%
14.4%
15.0%
Organic GrowthEBIT margin *TOP margin
* Before net trading items
68

February 21st, 2012 2011 Full Year Results Roadshow
The Nestlé Model
� Organic growth 5-6%
� Increased trading operating margin in constant currencies
� Increased underlying EPS in constant currencies
� Improvement in capital efficiency
69

February 21st, 2012 2011 Full Year Roadshow
2011 Full Year Roadshow
Discussion