2011 investment company fact book - ici
TRANSCRIPT

51st EDITION
2011 Investment Company Fact Book
A Review of Trends and Activity in the Investment Company Industry
WWW.ICIFACTBOOK.ORG
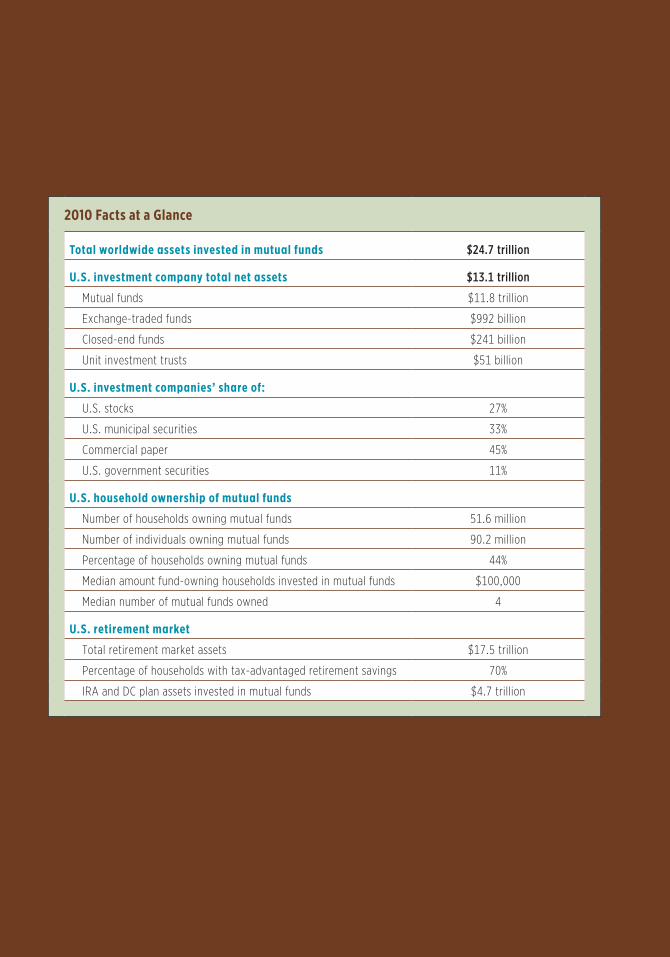
2010 Facts at a Glance
Total worldwide assets invested in mutual funds $24.7 trillion
U.S. investment company total net assets $13.1 trillion
Mutual funds $11.8 trillion
Exchange-traded funds $992 billion
Closed-end funds $241 billion
Unit investment trusts $51 billion
U.S. investment companies’ share of:
U.S. stocks 27%
U.S. municipal securities 33%
Commercial paper 45%
U.S. government securities 11%
U.S. household ownership of mutual funds
Number of households owning mutual funds 51.6 million
Number of individuals owning mutual funds 90.2 million
Percentage of households owning mutual funds 44%
Median amount fund-owning households invested in mutual funds $100,000
Median number of mutual funds owned 4
U.S. retirement market
Total retirement market assets $17.5 trillion
Percentage of households with tax-advantaged retirement savings 70%
IRA and DC plan assets invested in mutual funds $4.7 trillion

2011 Investment Company Fact Book

51st EDITION
2011 Investment Company Fact Book
A Review of Trends and Activity in the Investment Company Industry
WWW.ICIFACTBOOK.ORG

The Investment Company Institute (ICI) is the national association of U.S. investment companies. ICI seeks to encourage adherence to high ethical standards, promote public understanding, and otherwise advance the interests of funds, their shareholders, directors, and advisers.
Although information or data provided by independent sources are believed to be reliable, ICI is not responsible for its accuracy, completeness, or timeliness. Opinions expressed by independent sources are not necessarily those of the Institute. If you have questions or comments about this material, please contact the source directly.
Fifty-first edition
ISBN 978-1-878731-50-5
Copyright © 2011 by the Investment Company Institute

Contents
Letter from the Chief Economist vii
ICI Research: Staff and Publications xi
Part 1: Analysis and Statistics
List of Figures 3
Chapter 1: Overview of U.S.-Registered Investment Companies 7
Chapter 2: Recent Mutual Fund Trends 21
Chapter 3: Exchange-Traded Funds 39
Chapter 4: Closed-End Funds 53
Chapter 5: Mutual Fund Fees and Expenses 63
Chapter 6: Characteristics of Mutual Fund Owners 79
Chapter 7: Retirement and Education Savings 99
Part 2: Data Tables
List of Data Tables 126
Section 1: U.S. Mutual Fund Totals 128
Section 2: Closed-End Funds, Exchange-Traded Funds, and Unit Investment Trusts 138
Section 3: U.S. Long-Term Mutual Funds 144
Section 4: U.S. Money Market Funds 164
Section 5: Additional Categories of U.S. Mutual Funds 172
Section 6: Institutional Investors in the U.S. Mutual Fund Industry 184
Section 7: Worldwide Mutual Fund Totals 187
Appendix A: How U.S.-Registered Investment Companies Operate and the Core Principles Underlying Their Regulation 190
Appendix B: Significant Events in Fund History 211
Glossary 214
Index 224


Letter from the Chief Economist
Brian ReidChief Economist of the Investment Company Institute
One of the aspects of my job that I enjoy the most is visiting our member firms
to update them on issues in Washington or trends among funds and investors
While the purpose of my visits is for me to inform members, in truth, these
presentations serve more to launch conversations in which I learn from them
about the asset management business These conversations provide color and
context for the data that we gather, and they highlight new developments
among funds and their shareholders

viii LETTER FROM THE CHIEF ECONOMIST
Each year, the annual update of the Fact Book gives us an opportunity to present a broad overview
of the investment landscape by recording in a single volume some of the insights from these
meetings and from our own research Sometimes the developments are slow, and the picture
barely changes from one year to the next In other years, there are large shifts that permanently
affect the investment management business
To capture these trends, Senior Economist Rochelle Antoniewicz and Senior Director of Statistical
Research Judy Steenstra, who lead ICI Research’s efforts to update the Fact Book, decide early
each winter what modifications need to be made to the volume’s seven chapters and nearly 170
charts and tables Often, changes from one year to the next, like those in the fund business, are
incremental: we expand on an existing topic, add a new chart or table, or even remove material
that has become less relevant Sometimes, sweeping revisions are needed, and we reorganize one
or more chapters With each rewrite, the chapter’s author has an opportunity to restructure the
material to reflect how funds and investing behavior have changed over time
This year, Senior Economist Peter Brady rewrote Chapter 7, which examines the role that mutual
funds play in the retirement and education savings markets For example, you will see an expanded
discussion of target date funds, which have become a popular investment within 401(k) and other
defined contribution plans
Peter also has done extensive research on how people prepare for retirement, and he discusses
some of this work in the restructured chapter I find it notable that many of the Baby Boomers
who are in or nearing retirement will draw income from many of the same sources on which their
parents relied Social Security, for example, continues to play a key role in providing income
security for many retired Americans because it replaces a large share of annual labor income for
many low- to moderate-income families At the same time, the creation of IRAs in the 1970s and
the expansion of 401(k)s and other defined contribution plans in the past two decades have given
these workers new ways to save for retirement
Exchange-traded funds provide another example of how changes in the fund industry drive ICI
Research and the composition of the Fact Book The development of this investment product
has been quite rapid In the past decade, ETF assets have grown from $66 billion to $992 billion,
making them the second most common type of registered investment company Three years ago
we included ETFs in a chapter that focused on indexing and index funds, with an emphasis on
equity funds In 2009, we dedicated a separate chapter to ETFs, reflecting both their rapid asset
growth and their increasing diversity as they expand to include actively managed funds and funds
investing in commodities, fixed-income securities, and a variety of other forms

ix
In other ways, investing trends have come full circle While researchers and journalists tend to
focus on domestic stock mutual funds, today the assets of fixed-income funds—money market and
bond funds—nearly equal those of stock funds Table 3 in the data section tells us this is not the
first time that this has occurred Stock funds dominated fund investing following the passage of
the Investment Company Act of 1940 But successive bear markets in stocks in the 1970s along with
rising interest rates drew investors into a growing number of bond and money market funds By
1979, these funds managed more assets than stock funds, and they remained the dominant form
of fund investing as recently as 1995
As I read this year’s Fact Book one last time before it goes to the printer, I am reminded how
much both funds and their investors have changed over time The Fact Book also has evolved, by
reflecting our current research and analysis What has not changed is our mission ICI Research
seeks to bring together the highest quality data and scholarship about investment companies,
fund shareholders, and retirement markets; to serve as a resource for ICI members, educators,
government officials, journalists, and the general public; and to facilitate sound, well-informed
public policies affecting investment companies, their investors, and the retirement markets
This mission is central to the work of every member of the ICI Research Department Each spring
we dedicate months of effort, bringing together our talents and deep knowledge of funds and their
investors, to publish the latest edition of the Fact Book Thank you for your continued interest and
feedback on our research and publications
LETTER FROM THE CHIEF ECONOMIST


xiSTAFF AND PUBLICATIONS
ICI Senior Research Staff
Chief EconomistBrian Reid leads the Institute’s Research Department The department serves as a source for statistical data on the investment company industry and conducts public policy research on fund industry trends, shareholder demographics, the industry’s role in U S and foreign financial markets, and the retirement market Prior to joining ICI in 1996, Reid served as an economist at the Federal Reserve Board of Governors He has a PhD in economics from the University of Michigan and a BS in economics from the University of Wisconsin–Madison
Industry and Financial AnalysisSean Collins, Senior Director of Industry and Financial Analysis, heads ICI’s research on the structure of the mutual fund industry, industry trends, and the broader financial markets Collins, who joined ICI in 2000, is responsible for conducting and overseeing research on the flows, assets, and fees of mutual funds, as well as a major research initiative to better understand the costs and benefits of laws and regulations governing mutual funds Prior to joining ICI, Collins was a staff economist at the Federal Reserve Board of Governors and at the Reserve Bank of New Zealand He has a PhD in economics from the University of California, Santa Barbara, and a BA in economics from Claremont McKenna College
Retirement and Investor ResearchSarah Holden, Senior Director of Retirement and Investor Research, leads the Institute’s research efforts on investor demographics and behavior, retirement and tax policy, and international issues Holden, who joined ICI in 1999, heads efforts to track trends in household retirement saving activity and ownership of funds and other investments inside and outside retirement accounts Prior to joining ICI, Holden served as an economist at the Federal Reserve Board of Governors She has a PhD in economics from the University of Michigan and a BA in mathematics and economics from Smith College
Statistical ResearchJudy Steenstra, Senior Director of Statistical Research, oversees the collection and publication of weekly, monthly, quarterly, and annual data on open-end mutual funds, as well as data on closed-end funds, exchange-traded funds, unit investment trusts, and the worldwide mutual fund industry Steenstra joined ICI in 1987 and was appointed Director of Statistical Research in 2000 She has a BS in marketing from The Pennsylvania State University
ICI Research
Staff and Publications
xii STAFF AND PUBLICATIONS
ICI Research Department Staff
The ICI Research Department consists of 41 staff members, including economists, research
assistants, policy analysts, and data assistants This staff collected and disseminated data for
all types of registered investment companies, offering detailed analyses of fund shareholders,
the economics of investment companies, and the retirement and education savings markets
2010 Research Publications and Statistical Releases
ICI is the primary source of analysis and statistical information on the investment company industry
In 2010, the Institute’s Research Department released almost 150 statistical reports examining
the broader investment company industry as well as specific segments of the industry: money
market funds, closed-end funds, exchange-traded funds, and unit investment trusts In addition
to the annual Investment Company Fact Book, ICI published 20 research and policy reports in
2010, examining the industry, its shareholders, and industry issues ICI also regularly compiles and
releases specialized statistical reports that measure mutual funds in the retirement, institutional,
and worldwide markets
Industry and Financial Analysis Research Publications » “Trends in the Fees and Expenses of Mutual Funds, 2009,” Fundamentals, April 2010
» “Trends in Proxy Voting by Registered Investment Companies, 2007–2009,” Perspective,
November 2010
Investor Research Publications » Enduring Confidence in the 401(k) System: Investor Attitudes and Actions, January 2010
» Profile of Mutual Fund Shareholders, 2009, February 2010
» “The Closed-End Fund Market, 2009,” Fundamentals, June 2010
» The IRA Investor Profile: Traditional IRA Investors’ Contribution Activity, 2007 and 2008,
June 2010
» “Ownership of Mutual Funds, Shareholder Sentiment, and Use of the Internet, 2010,”
Fundamentals, September 2010
» “Characteristics of Mutual Fund Investors, 2010,” Fundamentals, September 2010
» The IRA Investor Profile: Traditional IRA Investors’ Rollover Activity, 2007 and 2008,
December 2010

xiiiSTAFF AND PUBLICATIONS
Retirement Research Publications » “The U S Retirement Market, Third Quarter 2009,” Fundamentals, January 2010
» “The Role of IRAs in U S Households’ Saving for Retirement, 2009,” Fundamentals,
January 2010
» “The U S Retirement Market, 2009,” Fundamentals, May 2010
» “The U S Retirement Market, First Quarter 2010,” Fundamentals, August 2010
» Defined Contribution Plan Participants’ Activities: First Quarter 2010, August 2010
» “The Economics of Providing 401(k) Plans: Services, Fees, and Expenses, 2009,”
Fundamentals, September 2010
» “The U S Retirement Market, Second Quarter 2010,” Fundamentals, October 2010
» Defined Contribution Plan Participants’ Activities: First Half 2010, October 2010
» “A Look at Retirement Income After ERISA,” Perspective, November 2010
» “401(k) Plan Asset Allocation, Account Balances, and Loan Activity in 2009,” Perspective,
November 2010
» “The Role of IRAs in U S Households’ Saving for Retirement, 2010,” Fundamentals,
December 2010
Statistical Releases
Trends in Mutual Fund Investing
A monthly report that includes mutual fund sales, redemptions, assets, cash positions, exchange
activity, and portfolio transactions for the period
Long-Term Mutual Fund Flows
A weekly report on aggregate estimates of net new cash flows to equity, hybrid, and bond funds
Money Market Fund Assets
A weekly report on money market fund assets by type of fund
Mutual Fund Assets in Retirement Accounts
A quarterly report that includes individual retirement account and defined contribution plan assets
and estimates of net new cash flows to mutual funds from retirement accounts

xiv STAFF AND PUBLICATIONS
Closed-End Fund Statistics
A quarterly report on closed-end fund assets, number of funds, issuance, and number of
shareholders
Exchange-Traded Funds
A monthly report on ETF assets, number of funds, issuance, and redemptions of ETFs
Unit Investment Trusts
A monthly report on UIT value and number of deposits of new trusts by type and maturity
Worldwide Mutual Fund Market
A quarterly report that includes assets, number of funds, and net sales of mutual funds in countries
worldwide
To find ICI research, visit our website at www.ici.org/research. The most recent ICI statistics and an
archive of statistical releases are available at www.ici.org/research#statistics. To subscribe to ICI’s
statistical releases, visit www.ici.org/pdf/stats_subs_order.pdf.
Acknowledgments
Publication of the 2011 Investment Company Fact Book was directed by Rochelle Antoniewicz,
Senior Economist, and Judy Steenstra, Senior Director of Statistical Research, working with Miriam
Moore, Senior Editor, and Jodi Weakland, Design Director

Part One
Analysis and Statistics


3
Figures
FIGURES
Chapter 1Overview of U.S.-Registered Investment CompaniesFigure 1.1: Investment Company Total Net Assets by Type 9 1.2: Share of Household Financial Assets Held in Investment Companies 10 1.3: Household Net Investments in Funds, Bonds, and Stocks 10 1.4: Mutual Funds in Household Retirement Accounts 11 1.5: Investment Companies Channel Investment to Stock, Bond, and Money Markets 12 1.6: Nearly Three-Quarters of Fund Complexes Were Independent Fund Advisers 13 1.7: Number of Fund Sponsors 14 1.8: Fund Complexes with Positive Net New Cash Flow to Stock, Bond, and Hybrid Funds 15 1.9: Number of Mutual Funds Leaving and Entering the Industry 15 1.10: Number of Investment Companies by Type 16 1.11: Investment Company Industry Employment 17 1.12: Investment Company Industry Employment by Job Function 18 1.13: Investment Company Industry Employment by State 19
Chapter 2Recent Mutual Fund TrendsFigure 2.1: The U.S. Had the World’s Largest Mutual Fund Market 23 2.2: Share of Assets at the Largest Mutual Fund Complexes 23 2.3: Net Flows to Mutual Funds 25 2.4: Net Flows to Equity Funds Related to Global Stock Price Performance 26 2.5: Willingness to Take Above-Average or Substantial Investment Risk by Age 27 2.6: Turnover Rate Experienced by Equity Fund Investors 28 2.7: Net Flows to Bond Funds Related to Bond Returns 29 2.8: Total Net Assets and Net Flows to Funds of Funds 31 2.9: Net Flows to Index Funds 32 2.10: 37 Percent of Index Fund Assets Were Invested in S&P 500 Index Funds 33 2.11: Equity Index Funds’ Share Continued to Rise 33 2.12: Net Flows to Money Market Funds 34 2.13: Net Flows to Taxable Retail Money Market Funds Related to Interest Rate Spread 35 2.14: Total Net Assets and Net Flows to Taxable U.S. Government and Non-Government
Institutional Money Market Funds 36 2.15: Money Market Funds Managed 25 Percent of U.S. Businesses’ Short-Term Assets in 2010 37

4 2011 INVESTMENT COMPANY FACT BOOK
Chapter 3Exchange-Traded FundsFigure 3.1: Total Net Assets and Number of ETFs 41 3.2: Legal Structure of ETFs 41 3.3: Creation of an ETF 43 3.4: Net Issuance of ETF Shares 45 3.5: Net Issuance of ETF Shares by Investment Classification 46 3.6: Total Net Assets of ETFs Concentrated in Large-Cap Domestic Stocks 47 3.7: Number of ETFs 47 3.8: Number of Commodity and Sector ETFs 49 3.9: Total Net Assets of Commodity and Sector ETFs 49 3.10: ETF-Owning Households Held a Broad Range of Investments 50 3.11: Characteristics of ETF-Owning Households 51
Chapter 4Closed-End FundsFigure 4.1: Closed-End Fund Total Net Assets Increased to $241 Billion 55 4.2: Bond Funds Were the Largest Segment of the Closed-End Fund Market 55 4.3: Closed-End Fund Share Issuance 56 4.4: Number of Closed-End Funds 57 4.5: Bulk of Closed-End Fund Total Net Assets Was in Common Share Classes 58 4.6: Closed-End Fund AMPS Redemptions 59 4.7: Closed-End Fund–Owning Households Held a Broad Range of Investments 60 4.8: Closed-End Fund–Owning Households Had Above-Average Household Incomes and
Financial Assets 61
Chapter 5Mutual Fund Fees and ExpensesFigure 5.1: Fees and Expenses Incurred by Stock and Bond Mutual Fund Investors Have Declined
by More Than Half Since 1990 64 5.2: Front-End Sales Loads That Investors Paid Were Well Below Maximum Front-End Sales
Loads That Funds Charged 65 5.3: Fund Shareholders Paid Lower-Than-Average Expenses in Stock Funds 66 5.4: Least Costly Stock Funds Attract Most of the Net New Cash 67 5.5: Expense Ratios for Selected Investment Objectives 68 5.6: Fund Sizes and Average Account Balances Varied Widely 69 5.7: Investor Assets Were Concentrated in S&P 500 Index Mutual Funds with the Lowest Expense Ratios 70 5.8: Investors’ Net Purchases of S&P 500 Index Mutual Funds Were Concentrated in Least Costly Funds 71 5.9: Fund Expense Ratios Tend to Fall as Fund Total Net Assets Rise 72 5.10: Most 12b-1 Fees Used to Pay for Shareholder Services 73 5.11: 12b-1 Fees Paid Reflect Asset Growth and Shift in Source of Financial Advisers’ Compensation 75 5.12: Net New Cash Flow Was Greatest in No-Load Share Classes 76 5.13: Total Net Assets of Long-Term Funds Were Concentrated in No-Load Share Classes 77

5FIGURES
Chapter 6Characteristics of Mutual Fund OwnersFigure 6.1: 44 Percent of U.S. Households Owned Mutual Funds in 2010 80 6.2: Characteristics of Mutual Fund Investors 81 6.3: Mutual Fund Ownership Is Greatest Among 35- to 64-Year-Olds 83 6.4: The U.S. Population and Mutual Fund Shareholders Are Getting Older 83 6.5: Ownership of Mutual Funds Increases with Household Income 84 6.6: Employer-Sponsored Retirement Plans Are Increasingly the Source of First Mutual Fund Purchase 85 6.7: 72 Percent of Mutual Fund–Owning Households Held Shares Outside Employer-Sponsored
Retirement Plans 86 6.8: About Half of Mutual Fund Shareholders Used an Adviser 87 6.9: The Average Mutual Fund Account Has Been Open for Five Years 88 6.10: The Average Shareholder Tenure with a Fund Company Is Eight Years 88 6.11: Mutual Fund Shareholder Sentiment Rises and Falls with Stock Market Performance 89 6.12: Households’ Willingness to Take Investment Risk Tends to Move with the S&P 500 Stock Index 90 6.13: Households’ Willingness to Take Investment Risk 91 6.14: Mutual Fund Shareholders’ Confidence Rose in 2010 91 6.15: Internet Access Is Widespread Among Mutual Fund–Owning Households 92 6.16: Most Mutual Fund Shareholders Used the Internet for Financial Purposes 93 6.17: Mutual Fund Shareholders’ Use of the Internet by Age, Education, and Income for 2010 94
6.18: Institutional and Household Ownership of Mutual Funds 96
Chapter 7Retirement and Education SavingsFigure 7.1: Social Security Benefit Formula Is Highly Progressive 101 7.2: U.S. Retirement Assets Increased in 2010 101 7.3: Many U.S. Households Had Tax-Advantaged Retirement Savings 102 7.4: Younger Households Have Had Higher and Faster Growing Rates of IRA or Defined
Contribution Plan Ownership 103 7.5: Defined Contribution Plan Assets by Type of Plan 104 7.6: 401(k) Asset Allocation Varied with Participant Age 105 7.7: Asset Allocation to Equities Varied Widely Among 401(k) Participants 106 7.8: Target Date Funds’ 401(k) Market Share 107 7.9: 401(k) Balances Tend to Increase with Participant Age and Job Tenure 108 7.10: Use of Lump-Sum Distributions from Defined Contribution Plans at Retirement 109 7.11: A Variety of Arrangements May Be Used to Compensate 401(k) Service Providers 111 7.12: 401(k) Stock Mutual Fund Assets Are Concentrated in Lower-Cost Funds 111 7.13: IRA Assets 112 7.14: 49 Million U.S. Households Owned IRAs 113 7.15: Rollover Activity in The IRA Investor Database™ 114 7.16: Rollovers Are Often a Source of Assets for Traditional IRA Investors 114 7.17: Households Invested Their IRAs in Many Types of Assets 115 7.18: Withdrawals from Traditional IRAs Are Infrequent 116 7.19: Traditional IRA Withdrawals Among Retirees Are Often Used to Pay for Living Expenses 117 7.20: Households’ Mutual Fund Assets by Type of Account 118 7.21: Bulk of Mutual Fund Retirement Account Assets Was Invested in Equities 119 7.22: Target Date and Lifestyle Mutual Fund Assets by Account Type 121 7.23: Section 529 Savings Plan Assets 122 7.24: Characteristics of Households Saving for College .123

Investment companies held more than one-quarter of U.S. corporate equities in 2010
27%of U.S. corporate equities heldby investment companies

Chapter One
Overview of U S -Registered Investment Companies
U S -registered investment companies play a significant role in the U S
economy and world financial markets These funds managed over $13 trillion
in assets at the end of 2010 for over 91 million U S investors Funds supplied
investment capital in securities markets around the world and were among the
largest groups of investors in the U S stock, commercial paper, and municipal
securities markets

8 2011 INVESTMENT COMPANY FACT BOOK
This chapter provides a broad overview of U.S.-registered investment companies—mutual funds, closed-end funds, exchange-traded funds, and unit investment trusts—and their sponsors.
Investment Company Assets in 2010 8
Americans’ Continued Reliance on Investment Companies 8
Role of Investment Companies in Financial Markets 12
Types of Intermediaries and Number of Investment Companies 13
Investment Company Employment 17
Investment Company Assets in 2010
U S -registered investment companies managed $13 1 trillion at year-end 2010 (Figure 1 1), a
$943 billion increase from year-end 2009 Major U S stock indexes rose between 13 and 17 percent
during the year, significantly increasing total net assets of funds invested in domestic equity
markets Gains in stock prices abroad had a similar effect on funds invested in foreign stocks
However, gains in U S stock and bond funds that held international assets were moderated
by the strengthening of the U S dollar and the resulting decrease in the dollar value of their
foreign securities
The rise in the value of U S fund assets was tempered somewhat by net outflows from money
market funds Overall, mutual funds reported $297 billion of net outflows in 2010 Investors
pulled $525 billion from money market funds, but added $228 billion to long-term mutual funds
In addition, mutual fund shareholders reinvested $157 billion of income dividends and $39 billion
of capital gains distributions that mutual funds paid out during the year Investor demand for
exchange-traded funds (ETFs), unit investment trusts (UITs), and closed-end funds remained
fairly steady In 2010, flows into ETFs were on pace with the previous year, with net share issuance
(including reinvested dividends) of $118 billion UITs had new deposits of $31 billion, while closed-
end funds issued $8 billion in new shares during 2010, both up from 2009
Americans’ Continued Reliance on Investment Companies
Households are the largest group of investors in funds, and registered investment companies
managed 23 percent of households’ financial assets at year-end 2010, little changed from 2009
(Figure 1 2) The increase is largely due to the continued rebound in the value of stocks held in
equity and hybrid funds As households have increased their reliance on funds, their demand for
directly held stocks has been decreasing for most of the decade with only one year of moderately
renewed interest in 2009 (Figure 1 3) Household demand for directly held bonds rebounded in
2010 after two years of substantially lower demand in 2008 and 2009 In contrast, over the past
decade, households’ net investment in registered investment companies has been substantially

9OVERVIEW OF U.S.-REGISTERED INVESTMENT COMPANIES
FIGURE 1.1
Investment Company Total Net Assets by TypeBillions of dollars, year-end, 1995–2010
Mutual funds1 Closed-end funds ETFs2 UITs Total3
1995 $2,811 $143 $1 $73 $3,028
1996 3,526 147 2 72 3,747
1997 4,468 152 7 85 4,712
1998 5,525 156 16 94 5,791
1999 6,846 147 34 92 7,119
2000 6,965 143 66 74 7,248
2001 6,975 141 83 49 7,248
2002 6,383 159 102 36 6,680
2003 7,402 214 151 36 7,803
2004 8,095 254 228 37 8,614
2005 8,891 277 301 41 9,510
2006 10,398 298 423 50 11,168
2007 12,002 313 608 53 12,977
2008 9,604 186 531 29 10,349
2009 11,120 225 777 38 12,161
2010 11,821 241 992 51 13,104
1 Mutual fund data include only mutual funds that report statistical information to the Investment Company Institute. The data do not include mutual funds that invest primarily in other mutual funds.
2 ETF data prior to 2001 were provided by Strategic Insight Simfund. ETF data include investment companies not registered under the Investment Company Act of 1940 and exclude ETFs that invest primarily in other ETFs.
3 Total investment company assets include mutual fund holdings of closed-end funds and ETFs.
Note: Components may not add to the total because of rounding.
Sources: Investment Company Institute and Strategic Insight Simfund
stronger than their net purchases of directly held bonds and stocks Households invested an
average of $349 billion each year, on net, in registered investment companies versus average
annual sales, on net, of $333 billion in directly held stocks and bonds over the past 11 years
The growth of individual retirement accounts (IRAs) and defined contribution (DC) plans,
particularly 401(k) plans, in conjunction with the important role that mutual funds play in these
plans, explains some of households’ increased reliance on investment companies during the past
two decades At year-end 2010, 9 percent of household financial assets were invested in 401(k)
and other DC retirement plans, up from 6 percent in 1990 Mutual funds managed 54 percent
of the assets in these plans in 2010, up from 8 percent in 1990 (Figure 1 4) IRAs made up
10 percent of household financial assets, and mutual funds managed 47 percent of IRA assets
in 2010 Additionally, mutual funds managed $1 trillion in variable annuities outside of retirement
accounts, as well as $4 trillion of assets in taxable household accounts

10 2011 INVESTMENT COMPANY FACT BOOK
FIGURE 1.2
Share of Household Financial Assets Held in Investment CompaniesPercent, year-end, 1980–2010
3
23
2010200520001995199019851980
Note: Household financial assets held in registered investment companies include household holdings of ETFs, closed-end funds, UITs, and mutual funds. Mutual funds held in employer-sponsored DC plans, IRAs, and variable annuities are included.
Sources: Investment Company Institute and Federal Reserve Board
FIGURE 1.3
Household Net Investments* in Funds, Bonds, and StocksBillions of dollars, 2000–2010
Registered investment companiesDirectly held bondsDirectly held stock
20102009200820072006200520042003200220012000
459
-680
369
-125
-518
173 5-213
175
-125
278
193
-344
374
218
-441
555
-656
706
520
-1,004
241
-247
275
-269
230
143
-18738-419252-72
* Net new cash flow and reinvested interest and dividends are included. Data include mutual funds, variable annuities, ETFs, and closed-end funds.
Sources: Investment Company Institute and Federal Reserve Board

11OVERVIEW OF U.S.-REGISTERED INVESTMENT COMPANIES
FIGURE 1.4
Mutual Funds in Household Retirement AccountsMutual fund percentage of retirement assets by type of retirement vehicle, 1990–2010
20102008200620042002200019981996199419921990
20102008200620042002200019981996199419921990
8
DC plans*
IRAs
5449
53504544
38
3023
16
47454947
424846
41
3428
22
* DC plans include 403(b) plans, 457 plans, and private employer-sponsored DC plans (including 401(k) plans).
Sources: Investment Company Institute, Federal Reserve Board, National Association of Government Defined Contribution Administrators, American Council of Life Insurers, and Internal Revenue Service Statistics of Income Division
Businesses and other institutional investors also rely on funds Many institutions use money market
funds to manage a portion of their cash and short-term assets For example, as of year-end 2010,
nonfinancial businesses held 25 percent of their cash in money market funds, although this is down
from 30 percent at year-end 2009 Institutional investors have also contributed to the growing
demand for ETFs Investment managers, including mutual funds and pension funds, use ETFs to
manage liquidity This strategy allows them to remain fully invested in the market while holding a
highly liquid asset to manage their investor flows Asset managers also use ETFs as part of their
investment strategies, including as a hedge for their exposure to equity markets
For more statistics on investment companies, see the data tables listed on pages 126–127
12 2011 INVESTMENT COMPANY FACT BOOK
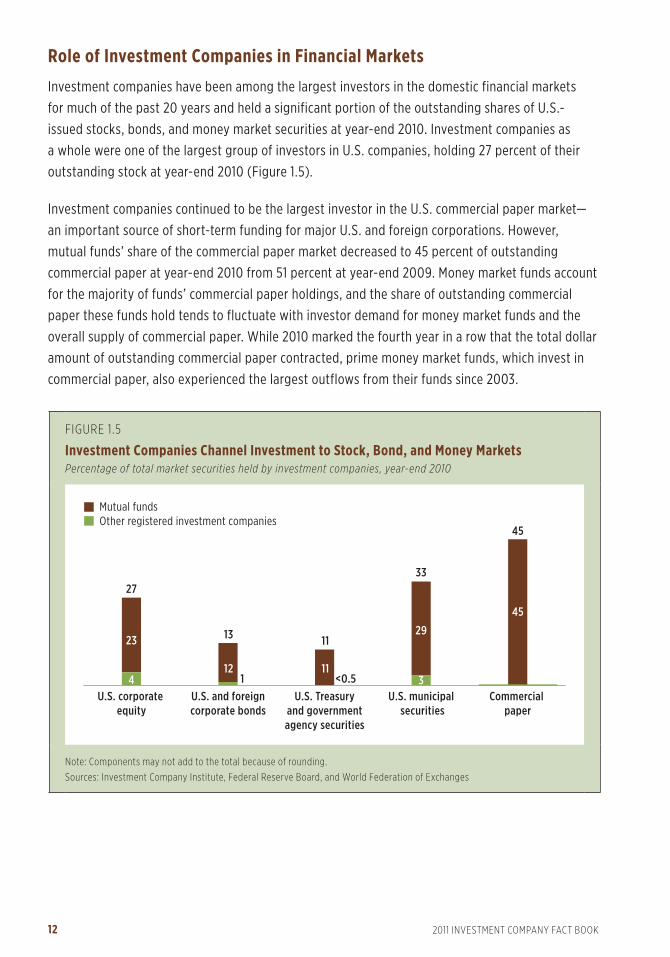
FIGURE 1.5
Investment Companies Channel Investment to Stock, Bond, and Money MarketsPercentage of total market securities held by investment companies, year-end 2010
Commercial paper
U.S. municipal securities
U.S. Treasuryand governmentagency securities
U.S. and foreigncorporate bonds
U.S. corporate equity
4
23
27
12
13
111
11
<0.5 3
29
33
45
45
Mutual fundsOther registered investment companies
Note: Components may not add to the total because of rounding.
Sources: Investment Company Institute, Federal Reserve Board, and World Federation of Exchanges
Role of Investment Companies in Financial Markets
Investment companies have been among the largest investors in the domestic financial markets
for much of the past 20 years and held a significant portion of the outstanding shares of U S -
issued stocks, bonds, and money market securities at year-end 2010 Investment companies as
a whole were one of the largest group of investors in U S companies, holding 27 percent of their
outstanding stock at year-end 2010 (Figure 1 5)
Investment companies continued to be the largest investor in the U S commercial paper market—
an important source of short-term funding for major U S and foreign corporations However,
mutual funds’ share of the commercial paper market decreased to 45 percent of outstanding
commercial paper at year-end 2010 from 51 percent at year-end 2009 Money market funds account
for the majority of funds’ commercial paper holdings, and the share of outstanding commercial
paper these funds hold tends to fluctuate with investor demand for money market funds and the
overall supply of commercial paper While 2010 marked the fourth year in a row that the total dollar
amount of outstanding commercial paper contracted, prime money market funds, which invest in
commercial paper, also experienced the largest outflows from their funds since 2003

13OVERVIEW OF U.S.-REGISTERED INVESTMENT COMPANIES
FIGURE 1.6
Nearly Three-Quarters of Fund Complexes Were Independent Fund AdvisersPercentage of investment company complexes by type of intermediary, year-end 2010
74%Independent fund advisers
11%Non-U.S. fund advisers
6%Insurance companies
8%Banks or thrifts
3%Brokerage firms
Note: Components do not add to 100 percent because of rounding.
At year-end 2010, investment companies held 33 percent of tax-exempt debt issued by U S
municipalities, which is on par with direct household ownership Funds’ share of the tax-exempt
market has remained fairly stable in the past several years despite changes in the demand for
tax-exempt funds and the overall supply of tax-exempt debt Funds held 11 percent of U S Treasury
and government agency securities at year-end 2010 Inflows into bond funds, which increased
their holdings of U S Treasury and government agency securities, largely offset sales by U S
government money market funds Funds’ share of U S government debt securities remained
4 percentage points higher than at year-end 2006, prior to the start of the financial crisis
Funds’ role in the corporate bond market expanded somewhat in 2010 Funds held 13 percent
of the outstanding debt securities in this market compared to 11 percent at year-end 2009
Types of Intermediaries and Number of Investment Companies
A variety of financial service companies offer registered funds in the United States By year-end
2010, 74 percent of fund complexes were independent fund advisers (Figure 1 6), and these
firms managed more than half of investment company assets Non-U S fund advisers, banks,
thrifts, insurance companies, and brokerage firms are other types of fund complexes in the
U S marketplace

14 2011 INVESTMENT COMPANY FACT BOOK
FIGURE 1.7
Number of Fund Sponsors2000–2010
16
0
10
20
30
40
50
60
70
80
90
100
201020092008200720062005200420032002200120000
100
200
300
400
500
600
700
800
900
4843
27
64
17
55
44 44
31
47 49 46 4440
5562
4752
25
4940
792
669
Total number of fund sponsors at year-end (right axis)Fund sponsors exiting (left axis)Fund sponsors entering (left axis)
776729 718 705 707 705 720 705 678
In 2010, there were 669 financial firms from around the world that competed in the U S market to
provide investment management services to fund investors Historically, low barriers to entry have
attracted a large number of investment company sponsors to the fund marketplace in the United
States These low barriers to entry led to a rapid increase in the number of fund sponsors in the
1980s and 1990s However, competition among these sponsors and pressure from other financial
products have reversed this trend over the past decade From year-end 2000 to year-end 2010,
502 fund sponsors left the fund business In the same time, 379 new firms entered (Figure 1 7)
The overall effect has been a net reduction of 16 percent in the number of industry firms serving
investors The decrease in the number of advisers has occurred with larger fund sponsors acquiring
some smaller fund families and with some fund advisers liquidating funds and leaving the fund
business In addition, several other large sponsors of funds sold their fund advisory businesses
The portion of fund companies that have been able to retain assets in addition to attracting new
investments has been generally lower in this decade than during the 1990s (Figure 1 8) Two
bear markets leading to outflows from stock funds and other competitive pressures affected the
profitability of fund sponsors and contributed to the decline in their number over the past 10 years

15OVERVIEW OF U.S.-REGISTERED INVESTMENT COMPANIES
FIGURE 1.8
Fund Complexes with Positive Net New Cash Flow to Stock, Bond, and Hybrid FundsPercent, selected years
57
72
5564 64
53 55 56 5650
38
5851
2010200920082007200620042002200019981996199419921990
FIGURE 1.9
Number of Mutual Funds Leaving and Entering the Industry*2000–2010
20102009200820072006200520042003200220012000
1,111
261
237
340
397
858
498
737
355
310
665559
286
394
680
496
286
248
534534
250
336
586704
207
231
438
665
221
315
536
730
321
252
573708
496
349
845
505
227
252
479464
Merged mutual fundsLiquidated mutual fundsOpened mutual funds
* Data include mutual funds that do not report statistical information to the Investment Company Institute. Data also include mutual funds that invest primarily in other mutual funds.
The decline in the number of fund sponsors has been concentrated primarily among those advising
mutual funds, and their exit from the industry has caused the growth in the number of mutual
funds to slow in recent years and to decline over the past two years Competitive dynamics also
affect the number of funds offered in any given year by the fund advisers that remain In particular,
fund sponsors create new funds to meet investor demand, and they merge or liquidate funds that
do not attract sufficient investor interest The pace of newly opened funds continued to slow in
2010 to its lowest level since 1996 Nevertheless, the rate of fund mergers and liquidations dropped
appreciably from 2009 and, as a result, the number of mutual funds was reduced, on net, by only
15 funds in 2010 (Figure 1 9)

16 2011 INVESTMENT COMPANY FACT BOOK
FIGURE 1.10
Number of Investment Companies1 by TypeYear-end, 1995–2010
Mutual funds2 Closed-end funds ETFs3 UITs Total
1995 5,761 500 2 12,979 19,242
1996 6,293 497 19 11,764 18,573
1997 6,778 487 19 11,593 18,877
1998 7,489 492 29 10,966 18,976
1999 8,003 512 30 10,414 18,959
2000 8,370 482 80 10,072 19,004
2001 8,518 492 102 9,295 18,407
2002 8,511 545 113 8,303 17,472
2003 8,426 584 119 7,233 16,362
2004 8,415 619 152 6,499 15,685
2005 8,449 635 204 6,019 15,307
2006 8,721 647 359 5,907 15,634
2007 8,747 664 629 6,030 16,070
2008 8,884 643 743 5,984 16,254
2009 8,617 628 820 6,049 16,114
2010 8,545 624 950 5,971 16,090
1 Investment company data include only investment companies that report statistical information to the Investment Company Institute.
2 The data include mutual funds that invest primarily in other mutual funds.3 ETF data prior to 2001 were provided by Strategic Insight Simfund. ETF data include investment companies not registered
under the Investment Company Act of 1940 and ETFs that invest primarily in other ETFs.
Sources: Investment Company Institute and Strategic Insight Simfund
The total number of other investment companies has fallen considerably since 2000, as sponsors
of UITs have been creating fewer new trusts (Figure 1 10) These investment companies often have
preset termination dates, and in conjunction with a slowdown in the creation of new UITs, the total
number of UITs has declined substantially Additionally, closed-end fund sponsors shut down four
more funds than they opened in 2010 Sponsors of ETFs, however, opened 130 new funds, on net,
in 2010
17OVERVIEW OF U.S.-REGISTERED INVESTMENT COMPANIES
FIGURE 1.11
Investment Company Industry EmploymentEstimated number of employees of registered investment companies, selected years*
114,000
200920072005200019991997
149,000 154,000 146,000168,000
157,000
* Years in which the ICI employment survey was conducted.
Investment Company Employment
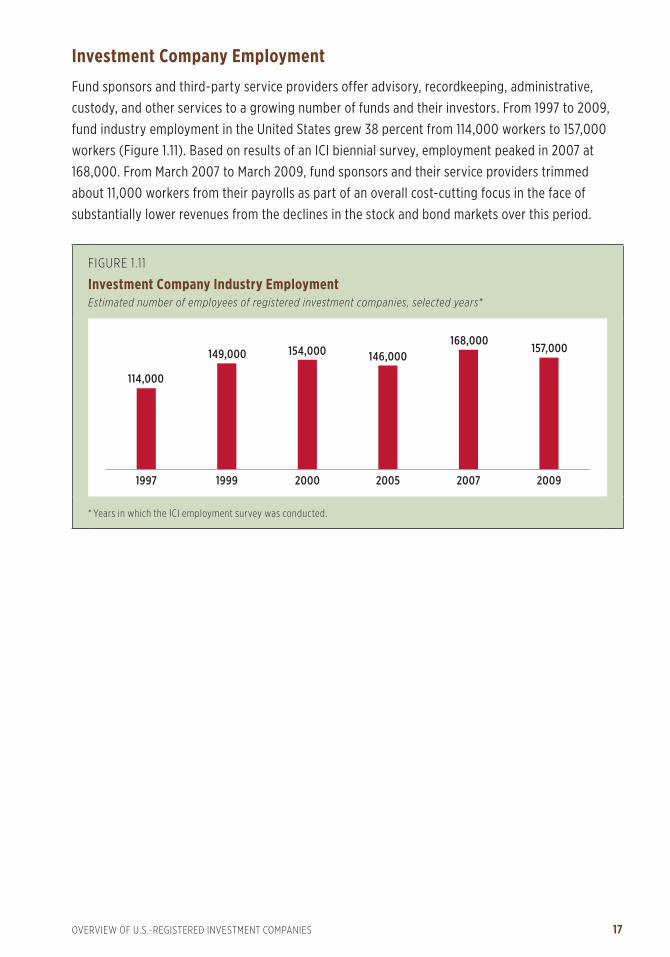
Fund sponsors and third-party service providers offer advisory, recordkeeping, administrative,
custody, and other services to a growing number of funds and their investors From 1997 to 2009,
fund industry employment in the United States grew 38 percent from 114,000 workers to 157,000
workers (Figure 1 11) Based on results of an ICI biennial survey, employment peaked in 2007 at
168,000 From March 2007 to March 2009, fund sponsors and their service providers trimmed
about 11,000 workers from their payrolls as part of an overall cost-cutting focus in the face of
substantially lower revenues from the declines in the stock and bond markets over this period

18 2011 INVESTMENT COMPANY FACT BOOK
FIGURE 1.12
Investment Company Industry Employment by Job FunctionPercentage of employees in registered investment company operations areas, March 2009
36%Shareholder account
services
9%Sales 16%
Distribution
11%Fund administration
28%Fund management
Total employment: 157,000
The largest group of workers provides services to fund investors and their accounts, with
36 percent of fund employees involved in these activities in March 2009 (Figure 1 12) Shareholder
account servicing encompasses a wide range of activities to help investors monitor and update
their accounts These employees work in call centers and help shareholders and their financial
advisers with questions about investor accounts They also process applications for account
openings and closings Other services include retirement plan transaction processing, retirement
plan participant education, participant enrollment, and plan compliance
At the same time, 28 percent of the industry’s workforce was employed by a fund’s investment
adviser or a third-party service provider in support of portfolio management functions such as
investment research, trading and security settlement, information systems and technology, and
other corporate management functions Jobs related to fund administration, including financial
and portfolio accounting and regulatory compliance duties, accounted for 11 percent of industry
employment Personnel involved with distribution services (e g , marketing, product development
and design, investor communications) represented 16 percent of the workforce Sales-force
employees—including registered representatives and sales support staff where at least 50 percent
of the employee’s income is derived from fund sales—and fund supermarket representatives
accounted for 9 percent of fund industry jobs

19OVERVIEW OF U.S.-REGISTERED INVESTMENT COMPANIES
FIGURE 1.13
Investment Company Industry Employment by StateEstimated number of employees of registered investment companies by state, March 2009
4,000 or more1,500 to 3,999500 to 1,499100 to 4990 to 99
For many industries, employment tends to be concentrated in locations of the industry’s origins,
and investment companies are no exception Massachusetts and New York served as early hubs
of investment company operations, and remained so in March 2009 (Figure 1 13), employing
nearly 30 percent of the workers in the fund industry As the industry has grown from its early
roots, other states have become significant centers of fund employment—including California,
Pennsylvania, and Texas Fund companies in these states employed about one-quarter of all fund
industry employees as of March 2009

Nearly half of mutual fund assets were in equity funds
48%were in equity funds

Chapter Two
Recent Mutual Fund Trends
With $11 8 trillion in assets, the U S mutual fund industry remained the largest
in the world at year-end 2010 Total net assets increased $700 billion from the
level at year-end 2009, largely reflecting the continued rise in stock prices in
2010 At the same time, investor demand for mutual funds declined further
in 2010 with net withdrawals from all types of mutual funds amounting to
$297 billion Investor demand for certain types of mutual funds appeared to
be driven in large part by the interest rate environment and the tepid pace of
the economic recovery In 2010, money market funds continued to experience
substantial outflows and equity funds saw net withdrawals for the third
consecutive year While inflows to bond funds were still strong, they slowed
appreciably from their record high in 2009
22 2011 INVESTMENT COMPANY FACT BOOK
This chapter describes recent U.S. mutual fund developments and examines the market factors that affect the demand for equity, bond, hybrid, and money market funds.
U.S. Mutual Fund Assets 22
Developments in Mutual Fund Flows 24
Demand for Long-Term Mutual Funds 26
Equity Mutual Funds 26
Bond and Hybrid Mutual Funds 29
Index Mutual Funds 32
Demand for Money Market Funds 34
Retail Money Market Funds 34
Institutional Money Market Funds 36
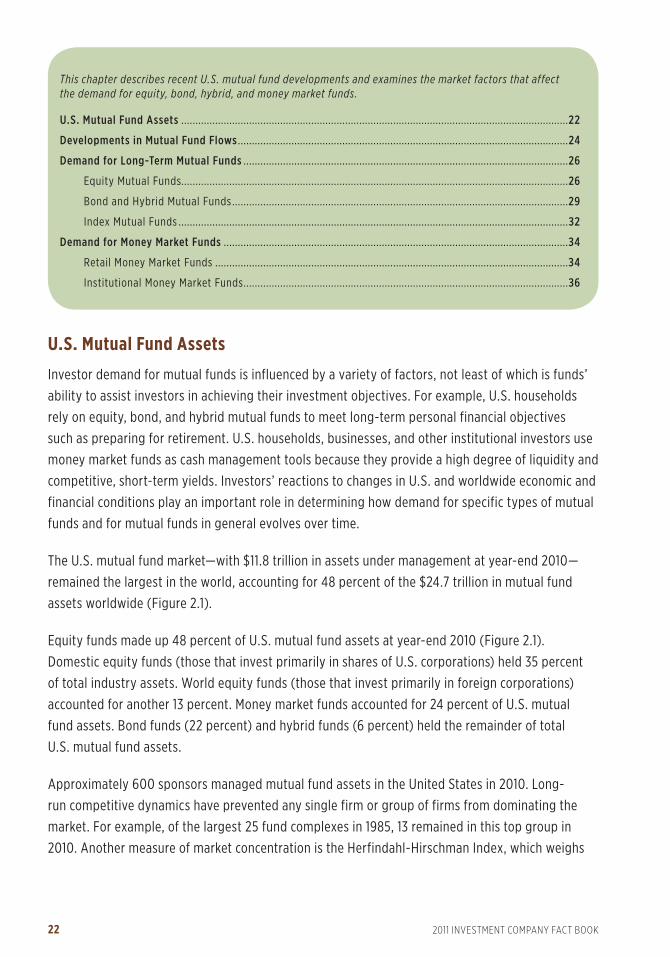
U.S. Mutual Fund Assets
Investor demand for mutual funds is influenced by a variety of factors, not least of which is funds’
ability to assist investors in achieving their investment objectives For example, U S households
rely on equity, bond, and hybrid mutual funds to meet long-term personal financial objectives
such as preparing for retirement U S households, businesses, and other institutional investors use
money market funds as cash management tools because they provide a high degree of liquidity and
competitive, short-term yields Investors’ reactions to changes in U S and worldwide economic and
financial conditions play an important role in determining how demand for specific types of mutual
funds and for mutual funds in general evolves over time
The U S mutual fund market—with $11 8 trillion in assets under management at year-end 2010—
remained the largest in the world, accounting for 48 percent of the $24 7 trillion in mutual fund
assets worldwide (Figure 2 1)
Equity funds made up 48 percent of U S mutual fund assets at year-end 2010 (Figure 2 1)
Domestic equity funds (those that invest primarily in shares of U S corporations) held 35 percent
of total industry assets World equity funds (those that invest primarily in foreign corporations)
accounted for another 13 percent Money market funds accounted for 24 percent of U S mutual
fund assets Bond funds (22 percent) and hybrid funds (6 percent) held the remainder of total
U S mutual fund assets
Approximately 600 sponsors managed mutual fund assets in the United States in 2010 Long-
run competitive dynamics have prevented any single firm or group of firms from dominating the
market For example, of the largest 25 fund complexes in 1985, 13 remained in this top group in
2010 Another measure of market concentration is the Herfindahl-Hirschman Index, which weighs

23RECENT MUTUAL FUND TRENDS
FIGURE 2.2
Share of Assets at the Largest Mutual Fund ComplexesPercentage of industry total net assets, year-end, selected years
1985 1990 1995 2000 2005 2009 2010
Top 5 complexes 37 34 34 32 37 39 40
Top 10 complexes 54 53 48 44 48 53 53
Top 25 complexes 78 75 71 68 70 74 74
FIGURE 2.1
The U.S. Had the World’s Largest Mutual Fund MarketPercentage of total net assets, year-end 2010
7%Other Americas
48%United States
13%Africa and
Asia/Pacific
32%Europe
Percentage of U.S. mutual fund assetsBy type of fund
Total U.S. mutual fund assets:$11.8 trillion
Domestic stock funds
International stock funds
Bond funds
Money market funds
35
13
22
24
Hybrid funds6
Total worldwide mutual fund assets:$24.7 trillion
Sources: Investment Company Institute, European Fund and Asset Management Association, and other national mutual fund associations
both the number and relative size of firms in the industry Index numbers below 1,000 indicate that
an industry is unconcentrated The mutual fund industry had a Herfindahl-Hirschman Index number
of 465 as of December 2010
In this past decade, however, the percentage of industry assets at larger fund complexes has
increased The share of assets managed by the largest 25 firms increased to 74 percent in 2010
from 68 percent in 2000 (Figure 2 2) In addition, the share of assets managed by the largest
10 firms in 2010 was 53 percent, up from the 44 percent share managed by the largest 10 firms
in 2000

24 2011 INVESTMENT COMPANY FACT BOOK
Several factors likely contributed to this development One factor is the acquisition of smaller fund
complexes by larger ones Second, total returns on U S stocks averaged only a little over 1 percent
annually from year-end 1999 to year-end 2010 and likely held down assets managed by fund
complexes that concentrate their offerings primarily in domestic equity funds—many of which tend
to be smaller fund complexes Third, in contrast, total returns on bonds averaged over 6 percent
annually in the past 11 years Finally, strong inflows over the decade to bond funds, which are fewer
in number and have fewer fund sponsors than equity mutual funds, helped boost the share of
assets managed by those large fund complexes that offer bond funds
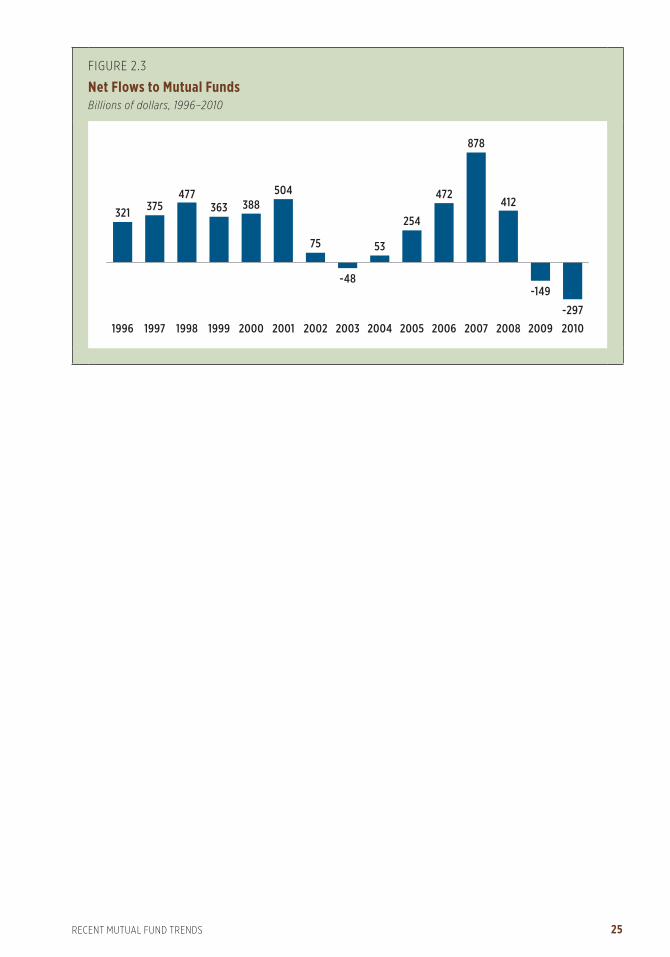
Developments in Mutual Fund Flows
Investor demand for mutual funds as measured by net new cash flow—the dollar value of new
fund sales less redemptions combined with net exchanges—declined further in 2010 Overall, the
industry had a net cash outflow of $297 billion (Figure 2 3) Investors pulled $525 billion from
money market funds, particularly institutional funds Investors, however, added $228 billion, on
net, to long-term funds The $297 billion total net outflow in 2010 was the largest on record in
dollar terms As a percentage of the average market value of assets, it amounted to 2 7 percent
On this basis, the outflow was about the same as the $23 billion outflow in 1988, which measured
2 8 percent of average assets
Conditions in financial markets continued to improve in 2010 The Federal Reserve closed several
special credit and liquidity programs that had been instituted during the financial crisis in 2008
U S stock prices, as measured by the Wilshire 5000 Total Market Index, rose over 15 percent,
putting the index almost back to its August 2008 level Credit spreads on corporate bonds—the
difference in yields between investment-grade corporate bonds and Treasury securities—remained
fairly stable over the year, hovering around 200 basis points Nevertheless, the pace of economic
activity was fairly modest during 2010—held down by persistently high unemployment, modest
income growth, lower housing wealth, and tight credit conditions for households Consequently,
the Federal Reserve kept the federal funds rate in a target range of 0 percent to 0 25 percent
Abroad, many developed European countries experienced slower economic growth and weaker
stock prices than that of the United States in 2010 Emerging markets experienced gains in stock
prices that were about on par with the United States
25RECENT MUTUAL FUND TRENDS
FIGURE 2.3
Net Flows to Mutual Funds Billions of dollars, 1996–2010
201020092008200720062005200420032002200120001999199819971996
-297
-149
412
878
472
254
53
-48
75
504388363
477375321

26 2011 INVESTMENT COMPANY FACT BOOK
FIGURE 2.4
Net Flows to Equity Funds Related to Global Stock Price Performance1996–2010
-40
-30
-20
-10
0
10
20
30
40
201020092008200720062005200420032002200120001999199819971996
Net new cash flow1
Total return on equities2
Billions of dollars Percentage points
-60
-50
-40
-30
-20
-10
0
10
20
30
40
50
60
1 Net new cash flow to equity funds is plotted as a six-month moving average. 2 The total return on equities is measured as the year-over-year change in the MSCI All Country World Daily Total Return Index.
Sources: Investment Company Institute and Morgan Stanley Capital International
Demand for Long-Term Mutual Funds
Investors added $228 billion in net new cash to equity, bond, and hybrid funds in 2010, down from
the record pace of $390 billion in 2009 Bond and hybrid funds remained popular investment
choices by investors, while domestic equity funds continued to experience outflows in 2010
Equity Mutual Funds
Investors withdrew cash from equity funds—particularly domestic equity funds—in 2010 at a
faster pace than in 2009 In 2010, withdrawals from all equity funds amounted to $37 billion for
the year, more than the $9 billion investors withdrew, on net, the previous year Generally, demand
for equity funds is strongly related to performance in the stock markets (Figure 2 4) Net flows to
equity funds tend to rise with stock prices and the opposite tends to occur when stock prices fall
In the past two years, one would have expected sizable inflows to equity funds given the strong
rally in stock prices worldwide Since year-end 2008, major U S stock price indexes rose between
45 and 50 percent including any dividends that were paid The technology-heavy NASDAQ
Composite Index rose 68 percent Despite these gains, domestic equity funds experienced a net
outflow of $39 billion in 2009 and $96 billion in 2010 Indeed, domestic equity funds have had
four consecutive years of withdrawals totaling $335 billion

27RECENT MUTUAL FUND TRENDS
FIGURE 2.5
Willingness to Take Above-Average or Substantial Investment Risk by AgePercentage of U.S. households by age of head of household,* selected years
’95 ’98 ’01 ’04’07 ’09 ’10 ’95 ’98 ’01 ’04’07 ’09 ’10 ’95 ’98 ’01 ’04’07 ’09 ’10 ’95 ’98 ’01 ’04’07 ’09 ’10
Younger than 35 35 to 49 50 to 64 65 or older
24
30 30
24 2422 22 21
2927
2426 26 26
15
2023
19 20 19 19
6 79 8 8 8
10
Age of head of household*
* Age is based on the age of the sole or co-decisionmaker for household saving and investing.
Sources: Investment Company Institute and Federal Reserve Board
Funds investing in foreign companies fared somewhat better than domestic equity funds
International equity funds garnered $31 billion in net new cash in 2009 and $59 billion in 2010
These inflows, however, were still modest when compared with past inflows and total returns on
stocks traded on many foreign stock markets The MSCI All Country World Daily Total Return Index
(excluding U S stocks) increased 25 percent annually over the two-year period from year-end 2008
to year-end 2010; the MSCI Daily Total Return Emerging Markets Index rose 46 percent annually To
put this development in perspective with past experience, from 2004 to 2007, the MSCI All Country
World Daily Total Return Stock Index increased at an average annual rate of 20 percent, and
shareholders invested over $100 billion on average annually into international equity funds
One factor that may partly explain investors’ reduced demand for equity funds is a lower tolerance
for risk In the past decade, households have endured two of the worst bear markets in stocks
since the Great Depression U S household surveys show that even within specified age groups,
willingness to take investment risk has dropped since the late 1990s and early 2000s (Figure 2 5)
For example, only 22 percent of households headed by someone younger than 35 in 2010 were
willing to take above-average or substantial investment risk, compared with 30 percent of such
households in 1998 The aging of the population also likely has played a role in reducing demand
for equity funds As investors grow older, their willingness to take investment risk tends to decline
In 2010, only 10 percent of households headed by someone 65 or older were willing to take above-
average or substantial investment risk, versus 26 percent of households headed by someone
between 35 and 49 years old

28 2011 INVESTMENT COMPANY FACT BOOK
Asset-Weighted Turnover Rate
The turnover rate—the lesser of purchases or sales (excluding those of short-term assets)
in a fund’s portfolio scaled by average net assets—is a measure of a fund’s trading activity
To analyze the turnover rate that shareholders actually experience in their funds, it is
important to identify those funds in which shareholders are most heavily invested Neither
a simple average nor a median takes into account where fund assets are concentrated
An asset-weighted average gives more weight to funds with large amounts of assets,
and accordingly, indicates the average portfolio turnover actually experienced by fund
shareholders In 2010, the asset-weighted annual turnover rate experienced by equity fund
investors moved down to 53 percent, somewhat below the average experience of the past
37 years (Figure 2 6)
Investors tend to own equity funds with relatively low turnover rates In 2010, about half of
equity fund assets were in funds with portfolio turnover rates under 35 percent This reflects
shareholders’ tendency to own equity funds with below-average turnover and the propensity
for funds with below-average turnover to attract more shareholder dollars
FIGURE 2.6
Turnover Rate1 Experienced by Equity Fund Investors2 Percent, 1974–2010
Average over 1974−2010: 58%
0
20
40
60
80
100
’10’08’06’04’02’00’98’96’94’92’90’88’86’84’82’80’78’76’74
1 The turnover rate is an asset-weighted average. 2 Data exclude mutual funds available as investment choices in variable annuities.
Sources: Investment Company Institute, Center for Research in Security Prices (CRSP), and Strategic Insight Simfund

29RECENT MUTUAL FUND TRENDS
FIGURE 2.7
Net Flows to Bond Funds Related to Bond Returns1996–2010
Net new cash flow1
Total return on bonds2
Percentage of total net assets Percentage points
-2.0
-1.5
-1.0
-0.5
0.0
0.5
1.0
1.5
2.0
2.5
-5
0
5
10
15
20
201020092008200720062005200420032002200120001999199819971996
1 Net new cash flow to bond funds is plotted as a three-month moving average of net new cash flow as a percentage of previous month-end assets. The data exclude flows to high-yield bond funds.
2 The total return on bonds is measured as the year-over-year change in the Citigroup Broad Investment Grade Bond Index.
Sources: Investment Company Institute and Citigroup
Bond and Hybrid Mutual Funds
Secular and demographic factors that appear to have tempered inflows into equity funds likely
have served to boost flows into bond funds In 2010, investors added $241 billion to their bond fund
holdings—a strong rate, albeit down from the record $376 billion pace of net investment in the
previous year Traditionally, cash flow into bond funds is highly correlated with the performance of
bonds (Figure 2 7) The U S interest rate environment typically has played a prominent role in the
demand for bond funds Movements in short- and long-term interest rates can significantly impact
the returns offered by these types of funds and, in turn, influence retail and institutional investor
demand for bond funds Low short-term interest rates and the relatively steep yield curve likely
continued to entice some investors to shift out of money market funds and into bond funds in 2010
The pace of inflows into bond funds was quite strong through the first nine months of 2010, but
slowed appreciably—particularly for tax-exempt bond funds—in the fourth quarter and turned
negative in the last couple of months of the year This pattern likely was the result of market
conditions From year-end 2009 through September 2010, returns on investment-grade corporate
bonds were about 6 percent and those of municipal securities at over 4 percent Returns on these
securities turned negative in the fourth quarter of 2010

30 2011 INVESTMENT COMPANY FACT BOOK
One contributing factor to the decline in bond returns likely was the glut of bond issuance by
municipalities before the expiration of the Build America Bonds program at the end of the year
The outsized supply helped drive up interest rates for municipal securities and reportedly enticed
buyers that normally would purchase corporate securities to cross over and buy securities in the
municipal market In addition, investor concerns about inflationary pressure from the Federal
Reserve’s second round of quantitative easing, the ability of the federal government to finance
growing budget deficits at attractive interest rates, and the deterioration in the outlook for state
and local governments’ fiscal positions were cited as possible reasons for the downturn in the bond
market at the end of 2010
Despite the relative weakness in bond flows in the fourth quarter of 2010, inflows to bond funds
since 2004 have been stronger than what would have been expected based on the historical
relationship between bond returns and demand for bond funds A few secular and demographic
factors may have contributed to this development: the aging of the U S population, the reduced
appetite for investment risk by investors of all ages, and the increasing use of target date and other
asset allocation funds, many of which are offered in a funds of funds structure First, the leading
edge of the Baby Boom Generation has just started to retire, and because investors’ willingness
to take investment risk tends to decline as they age (Figure 2 5), it is natural for them to allocate
their investments increasingly toward fixed-income securities Second, the decline in risk tolerance
across all age groups (Figure 2 5) likely boosted flows into bond funds over the past couple of
years Last, funds of funds remained a popular choice with investors and a portion of the flows into
these funds was directed to underlying bond funds Funds of funds garnered $134 billion in net new
cash flow in 2010 (Figure 2 8)
Investor demand for hybrid funds, which invest in a combination of stocks and bonds, remained
steady in 2010, with investors adding $23 billion, on net, to these funds—about the same pace as
in 2009 Over the six-year period of 2005 to 2010, hybrid funds attracted a total of $84 billion in
net new cash

31RECENT MUTUAL FUND TRENDS
Funds of Funds
Funds of funds are mutual funds that primarily hold and invest in shares of other mutual
funds The most popular type of these funds is hybrid funds—over 80 percent of funds of
funds’ total net assets were in hybrid funds in 2010 Hybrid funds of funds invest their cash
in underlying equity, bond, and hybrid mutual funds
Assets of funds of funds have grown rapidly over the past decade By the end of 2010,
the number of funds of funds had grown to 964, and total net assets were $928 billion
(Figure 2 8) About two-thirds of the increase in the assets of funds of funds in the past
10 years is attributable to increasing investor interest in target date funds (also known as
lifecycle funds) and lifestyle funds (also known as target risk funds) The growing popularity
of these funds, especially for retirement investing, likely reflects the automatic rebalancing
features of these products Target date funds allow a predetermined allocation of risk over
time, and lifestyle funds maintain a predetermined risk level Since year-end 2000, funds of
funds received a total of $673 billion in net new cash, of which 62 percent was from target
date and lifestyle funds
For more information on target date and lifestyle funds, see page 120
FIGURE 2.8
Total Net Assets and Net Flows to Funds of Funds2000–2010
Number of funds Year-end
AssetsBillions of dollars, year-end
Net new cash flowBillions of dollars, annual
2000 215 $57 $10
2001 213 63 9
2002 268 69 12
2003 301 123 30
2004 375 200 51
2005 475 306 79
2006 603 470 101
2007 720 637 126
2008 862 487 62
2009 932 673 69
2010 964 928 134

32 2011 INVESTMENT COMPANY FACT BOOK
FIGURE 2.9
Net Flows to Index FundsBillions of dollars, 1996–2010
201020092008200720062005200420032002200120001999199819971996
1425
3128
1411
2831
171821
5439
3022
194
-6
17
118
6
212
2
2
1
1
242710
17
88
7
782
5
5
4
2
5856
35
61
3328
4035
252726
62
46
35
25
Bond and hybridGlobal/International equityDomestic equity
22
Note: Components may not add to the total because of rounding.
Index Mutual Funds
Index funds continued to remain popular with investors Of households that owned mutual funds,
31 percent owned at least one index mutual fund in 2010 As of year-end 2010, 365 index funds
managed total net assets of $1 trillion Similar to funds of funds, demand for index funds remained
strong in 2010 with investors adding $58 billion in net new cash flow to these funds (Figure 2 9)
About 40 percent of the new money that flowed to index funds was invested in funds indexed to
bond indexes, while one-third was directed toward funds indexed to global and international stock
indexes and one-quarter went to funds indexed to domestic stock indexes Demand for global and
international equity index funds picked up in 2010, with these funds experiencing an aggregate
inflow of $19 billion

33RECENT MUTUAL FUND TRENDS
FIGURE 2.10
37 Percent of Index Fund Assets Were Invested in S&P 500 Index Funds Percent, year-end 2010
19%Bond and hybrid
12%Global/International equity
37%S&P 500
32%Other domestic equity
Total: $1.0 trillion
FIGURE 2.11
Equity Index Funds’ Share Continued to RisePercentage of equity mutual fund assets, 1996–2010
201020092008200720062005200420032002200120001999199819971996
14.513.713.0
11.511.211.111.311.010.69.89.08.98.26.6
5.2
Equity index funds accounted for the bulk of index mutual fund assets at year-end 2010
Eighty-one percent of index mutual fund assets were invested in index funds that track either
the S&P 500 or other domestic and international stock indexes (Figure 2 10) Funds indexed to
the S&P 500 managed 37 percent of all assets invested in index mutual funds The share of assets
invested in equity index funds relative to all equity mutual funds assets moved up to 14 5 percent
in 2010 (Figure 2 11)

34 2011 INVESTMENT COMPANY FACT BOOK
FIGURE 2.12
Net Flows to Money Market FundsBillions of dollars, 1996–2010
201020092008200720062005200420032002200120001999199819971996
201020092008200720062005200420032002200120001999199819971996
-125
-309
113171
962
-89-152
-81
3644821314753
-399
-230
525483
14960
-68-112
35
339
1161121045737
Retail funds
Institutional funds
Demand for Money Market Funds
Money market funds continued to experience substantial outflows in 2010 This trend likely reflects
the search by investors for higher yields in an environment of low short-term interest rates
accompanied by a steep yield curve and a continued unwinding of the flight to safety in response
to the financial crisis of 2007 and 2008
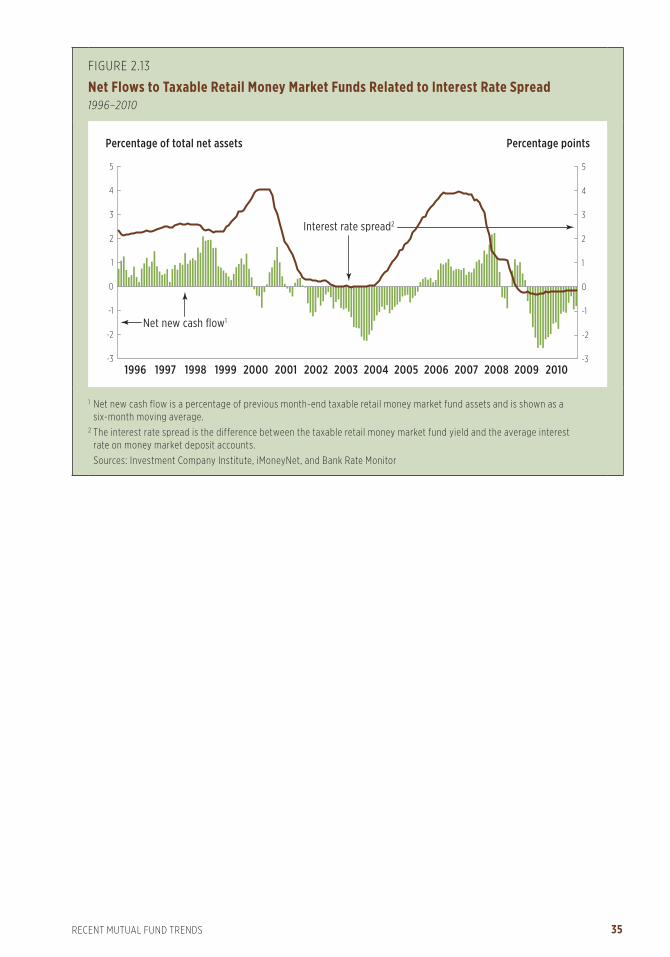
Retail Money Market Funds
Retail money market funds, which are principally sold to individual investors, saw a total outflow
of $125 billion in 2010, following an outflow of $309 billion in 2009 (Figure 2 12) Money market
fund yields continued to follow the pattern of short-term interest rates in 2010, hovering between
0 and 25 basis points In addition, yields on money market funds remained consistently below
those on bank deposits for the past two years (Figure 2 13) —an unprecedented occurrence since
the inception of money market funds in the early 1970s In general, retail investors tend to withdraw
cash from money market funds when the difference in interest rates between bank deposits and
money market funds narrows The sizable outflows from retail money market funds in 2009 and
2010 do not appear to be atypical considering the negative interest rate spread
35RECENT MUTUAL FUND TRENDS
FIGURE 2.13
Net Flows to Taxable Retail Money Market Funds Related to Interest Rate Spread1996–2010
Net new cash flow1
Interest rate spread2
Percentage of total net assets Percentage points
201020092008200720062005200420032002200120001999199819971996-3
-2
-1
0
1
2
3
4
5
-3
-2
-1
0
1
2
3
4
5
1 Net new cash flow is a percentage of previous month-end taxable retail money market fund assets and is shown as a six-month moving average.
2 The interest rate spread is the difference between the taxable retail money market fund yield and the average interest rate on money market deposit accounts.
Sources: Investment Company Institute, iMoneyNet, and Bank Rate Monitor

36 2011 INVESTMENT COMPANY FACT BOOK
FIGURE 2.14
Total Net Assets and Net Flows to Taxable U.S. Government and Non-Government Institutional Money Market FundsBillions of dollars, 2001–2010
U.S. government Non-government
Total net assetsYear-end
Net new cash flowAnnual
Total net assetsYear-end
Net new cash flowAnnual
2001 $296 $73 $787 $255
2002 301 -0.4 818 20
2003 272 -32 733 -95
2004 256 -20 675 -64
2005 276 17 745 33
2006 289 9 901 130
2007 578 281 1,106 169
2008 1,204 600 1,076 -75
2009 903 -310 1,181 108
2010 677 -227 1,058 -132
Institutional Money Market Funds
Institutional money market funds—used by businesses, pension funds, state and local governments,
and other large-account investors—had outflows of $399 billion in 2010, following outflows of
$230 billion during the previous year (Figure 2 12) Outflows from institutional money market
funds likely reflected the low interest rate environment and the continued unwinding of the flight
to quality by these investors in 2007 and 2008
The tumult in financial markets around the world that started in August 2007 and continued
through early 2009 led many institutional investors to seek the liquidity and safety of money
market funds that invest primarily in U S government securities These funds, which can invest
in U S Treasury debt solely or a combination of U S Treasury debt and obligations of U S
government agencies, received $881 billion in net new cash flow from institutional investors
in 2007 and 2008 (Figure 2 14) As financial markets stabilized in 2009 and 2010, institutional
investors shifted away from U S government money market funds, withdrawing $537 billion, on
net, from these funds over the past two years Nevertheless, U S government money market funds
comprised nearly 39 percent of institutional taxable money market assets at year-end 2010, up
from only 24 percent at year-end 2006, prior to the start of the financial crisis

37RECENT MUTUAL FUND TRENDS
FIGURE 2.15
Money Market Funds Managed 25 Percent of U.S. Businesses’ Short-Term Assets* in 2010Percent, year-end, 1996–2010
201020092008200720062005200420032002200120001999199819971996
2530
36
2823212223
2927
1918171412
* U.S. nonfinancial businesses’ short-term assets consist of foreign deposits, checkable deposits, time and savings deposits, money market funds, repurchase agreements, and commercial paper.
Sources: Investment Company Institute and Federal Reserve Board
U S nonfinancial businesses continued to reduce their holdings of money market funds in 2010
During the financial crisis, corporate treasurers made extensive use of institutional money market
funds; at year-end 2008, 36 percent of their short-term assets were in money market funds
(Figure 2 15) By year-end 2010, nonfinancial businesses held 25 percent of their short-term
assets in money market funds, back to approximately the same proportion measured at year-end
2006, prior to the start of the financial crisis
For more complete data on money market funds, see section 4 in the data tables on pages 164–171
For More Information
» Frequently Asked Questions About Bond Mutual Funds
» Frequently Asked Questions About Money Market Funds
»“Pricing of U S Money Market Funds,” ICI Research Report
Available at www.ici.org.

Total net assets of ETFs reached nearly $1 trillionat year-end 2010
$992 billionat year-end 2010

Chapter Three
Exchange-Traded Funds
Over the past decade, demand for ETFs has grown markedly as investors—
both institutional and retail—increasingly turn to them as investment options
in their portfolios With the increase in demand, sponsors have offered more
ETFs with a greater variety of investment objectives While ETFs share some
basic characteristics with mutual funds, there remain key operational and
structural differences between the two types of investment products

40 2011 INVESTMENT COMPANY FACT BOOK
This chapter provides an overview of exchange-traded funds (ETFs)—how they are created, how they differ from mutual funds, how they trade, the demand by investors for ETFs, and the characteristics of ETF-owning households.
What Is an ETF? 40
Total Net Assets of ETFs 40
Creation of an ETF 42
ETFs and Mutual Funds 43
Key Differences 43
How ETFs Trade 44
Demand for ETFs 45
Characteristics of ETF-Owning Households 50
What Is an ETF?
An ETF is an investment company, typically an open-end investment company (open-end fund)
or unit investment trust, whose shares are traded intraday on stock exchanges at market-
determined prices Investors may buy or sell ETF shares through a broker just as they would
the shares of any publicly traded company
ETFs are a relatively recent innovation to the investment company concept The first ETF—a
broad-based domestic equity fund tracking the S&P 500 index—was introduced in 1993 after
a fund sponsor received U S Securities and Exchange Commission (SEC) exemptive relief from
various provisions of the Investment Company Act of 1940 that would not otherwise allow the
ETF structure Until 2008, SEC exemptive relief was granted only to ETFs that tracked designated
indexes These ETFs, commonly referred to as index-based ETFs, are designed to track the
performance of their specified indexes or, in some cases, a multiple of or an inverse (or a
multiple of an inverse) of their indexes
In early 2008, the SEC first granted exemptive relief to several fund sponsors to offer fully
transparent actively managed ETFs that meet certain requirements These actively managed ETFs
must disclose each business day on their publicly available websites the identities and weightings
of the component securities and other assets held by the ETF Actively managed ETFs do not seek
to track the return of a particular index Instead, an actively managed ETF’s investment adviser, like
that of an actively managed mutual fund, creates a unique mix of investments to meet a particular
investment objective and policy
Total Net Assets of ETFs
By the end of 2010, the total number of index-based and actively managed ETFs had grown to
923, and total net assets were $992 billion (Figure 3 1)

41EXCHANGE-TRADED FUNDS
FIGURE 3.1
Total Net Assets and Number of ETFs*Billions of dollars, year-end, 2000–2010
Number of ETFs
20102009200820072006200520042003200220012000
992101
77775
531608
423
301228
1511028366
92379772862935920415211911310280
Total net assets of nonregistered ETFsTotal net assets of registered ETFs
15
15
2936 891
703496
580408296226
* ETF data include ETFs not registered under the Investment Company Act of 1940; ETF data exclude ETFs that invest primarily in other ETFs.
Note: Components may not add to the total because of rounding.
FIGURE 3.2
Legal Structure of ETFs1
Percentage of total net assets, year-end 2010
90%Registered ETFs
10%Nonregistered ETFs2
Total: $992 billion
1 ETF data exclude ETFs that invest primarily in other ETFs.2 The funds in this category invest primarily in commodities, currency, and futures, and are not registered under the Investment
Company Act of 1940.
The vast majority of assets in ETFs are in funds registered with and regulated by the SEC under
the Investment Company Act of 1940 (Figure 3 2) At year-end 2010, about 10 percent of assets
were held in ETFs that invest primarily in commodities, currency, and futures These ETFs are not
registered with or regulated by the SEC under the Investment Company Act of 1940 Nonregistered
ETFs that invest in commodity futures are regulated by the Commodity Futures Trading Commission
(CFTC), while those that invest solely in physical commodities are regulated by the SEC under the
Securities Act of 1933

42 2011 INVESTMENT COMPANY FACT BOOK
Creation of an ETF
An ETF originates with a sponsor, who chooses the investment objective of the ETF In the case of
an index-based ETF, the sponsor chooses both an index and a method of tracking its target index
Index-based ETFs track their target index in one of two ways A replicate index-based ETF holds
every security in the target index and invests its assets proportionately in all the securities in the
target index A sample index-based ETF does not hold every security in the target index; instead
the sponsor chooses a representative sample of securities in the target index in which to invest
Representative sampling is a practical solution for an ETF that has a target index with thousands
of securities in it
The sponsor of an actively managed ETF also determines the investment objective of the fund
and may trade securities at its discretion, much like an actively managed mutual fund In theory,
an actively managed ETF could trade its portfolio securities regularly In practice, however, most
existing actively managed ETFs tend to trade only weekly or monthly for a number of reasons,
including minimizing the risk of other market participants front-running their trades
ETFs are required to publish information about their portfolio holdings daily Each business day, the
ETF publishes a “creation basket,” a specific list of names and quantities of securities and/or other
assets The creation basket is either a replicate or a sample of the ETF’s portfolio Actively managed
ETFs and certain types of index-based ETFs are required to publish their complete portfolio
holdings in addition to their creation basket
ETF shares are created when an “authorized participant”—typically a large institutional investor,
such as a market maker or specialist—deposits the daily creation basket and/or cash with the ETF
(Figure 3 3) The ETF may require or permit an authorized participant to substitute cash for some
or all of the securities or assets in the creation basket For instance, if a security in the creation
basket is difficult to obtain or may not be held by certain types of investors (as is the case with
certain foreign securities), the ETF may allow the authorized participant to pay that security’s
portion of the basket in cash An authorized participant may also be charged a transaction fee
to offset any transaction expenses the fund undertakes In return for the creation basket and/or
cash, the ETF issues to the authorized participant a “creation unit” that consists of a specified
number of ETF shares Creation units are large blocks of shares that generally range in size from
25,000 to 200,000 shares The authorized participant can either keep the ETF shares that make up
the creation unit or sell all or part of them on an exchange ETF shares are listed on a number of
exchanges where investors can purchase them as they would shares of a publicly traded company
A creation unit is liquidated when an authorized participant returns the specified number of shares
in the creation unit to the ETF In return, the authorized participant receives the daily “redemption
basket,” a set of specific securities and/or other assets contained within the ETF’s portfolio The
composition of the redemption basket typically mirrors that of the creation basket

43EXCHANGE-TRADED FUNDS
FIGURE 3.3
Creation of an ETF
Fund or trust
Creation basketand/or cash
One creation unit(e.g., 50,000 shares of an ETF)
Hold shares
Trade on anexchange
InvestorsAuthorizedparticipant
ETFs and Mutual Funds
A registered ETF is similar to a mutual fund in that it offers investors a proportionate share in a
pool of stocks, bonds, and other assets It is most commonly structured as an open-end investment
company and is governed by the Investment Company Act of 1940 like other mutual funds For
example, like a mutual fund, an ETF is required to post the mark-to-market net asset value (NAV)
of its portfolio at the end of each trading day Despite these similarities, key features differentiate
ETFs from mutual funds
Key Differences
One major difference is that retail investors buy and sell ETF shares on a stock exchange through a
broker-dealer, much like they would any other type of stock In contrast, mutual fund shares are not
listed on stock exchanges Rather, retail investors buy and sell mutual fund shares through a variety
of distribution channels, including through a financial adviser, broker-dealer, or directly from a fund
company
Pricing also differs between mutual funds and ETFs Mutual funds are “forward priced,” which
means that although investors can place orders to buy or sell shares throughout the day, all orders
placed during the day will receive the same price—the NAV—the next time it is computed Most
mutual funds calculate their NAV as of 4:00 p m eastern time because that is the time U S stock
exchanges typically close In contrast, the price of an ETF share is continuously determined on
a stock exchange Consequently, the price at which investors buy and sell ETF shares may not
necessarily equal the NAV of the portfolio of securities in the ETF In addition, two investors selling
the same ETF shares at different times on the same day may receive different prices for their
shares, both of which may differ from the ETF’s NAV

44 2011 INVESTMENT COMPANY FACT BOOK
How ETFs Trade
The price of an ETF share on a stock exchange is influenced by the forces of supply and demand
While imbalances in supply and demand can cause the price of an ETF share to deviate from its
underlying value (i e , the market value of the underlying instruments, also known as the Intraday
Indicative Value or IIV), substantial deviations tend to be short-lived for many ETFs Two primary
features of an ETF’s structure promote trading of an ETF’s shares at a price that approximates the
ETF’s underlying value: portfolio transparency and the ability for authorized participants to create
or redeem ETF shares at NAV at the end of each trading day
The transparency of an ETF’s holdings enables investors to observe discrepancies between the
ETF’s share price and its underlying value during the trading day and to attempt to profit from
them ETFs contract with third parties (typically market data vendors) to calculate an estimate of
an ETF’s IIV, using the portfolio information an ETF publishes daily IIVs are disseminated at regular
intervals during the trading day (typically every 15 to 60 seconds) Some market participants for
whom a 15- to 60-second latency is too long will use their own computer programs to estimate the
underlying value of the ETF on a more real-time basis
If the ETF is trading at a discount to its underlying value, investors may buy ETF shares and/or sell
the underlying securities The increased demand for the ETF should raise its share price and the
sales of the underlying securities should lower their share prices, narrowing the gap between the
ETF and its underlying value If the ETF is trading at a premium to its underlying value, investors
may choose to sell the ETF and/or buy the underlying securities These actions should reduce the
ETF share price and/or raise the price of the underlying securities, bringing the price of the ETF and
the market value of its underlying securities closer together
The ability of authorized participants to create or redeem ETF shares at the end of each trading
day also helps an ETF trade at market prices that approximate the underlying market value of
the portfolio When a deviation between an ETF’s market price and its underlying value occurs,
authorized participants may engage in trading strategies similar to those described above, but
will purchase or sell creation units directly with the ETF For example, when an ETF is trading at a
premium, authorized participants may find it profitable to sell short the ETF during the day while
simultaneously buying the underlying securities At the end of the day, the authorized participant
will deliver the creation basket of securities to the ETF in exchange for ETF shares that they use
to cover their short sales When an ETF is trading at a discount, authorized participants may find
it profitable to buy the ETF shares and sell short the underlying securities At the end of the day,
authorized participants return ETF shares to the fund in exchange for the ETF’s redemption basket
of securities that they use for their short positions These actions by authorized participants,
commonly described as “arbitrage opportunities,” help keep the market-determined price of an
ETF’s shares close to its underlying value

45EXCHANGE-TRADED FUNDS
FIGURE 3.4
Net Issuance of ETF Shares*Billions of dollars, 2000–2010
745756
16
4531
43
151
177
116 118
20102009200820072006200520042003200220012000
* ETF data prior to 2001 were provided by Strategic Insight Simfund; ETF data include ETFs not registered under the Investment Company Act of 1940. ETF data exclude ETFs that invest primarily in other ETFs.
Sources: Investment Company Institute and Strategic Insight Simfund
Demand for ETFs
In the past decade, demand for ETFs has accelerated as institutional investors have found ETFs a
convenient vehicle for participating in, or hedging against, broad movements in the stock market
Demand for ETFs also has been influenced by increased awareness of these investment vehicles
by retail investors and their financial advisers Assets in ETFs accounted for 8 percent of total net
assets managed by investment companies at year-end 2010 Net issuance of ETF shares in 2010
amounted to $118 billion, about the same pace as in 2009 (Figure 3 4)

46 2011 INVESTMENT COMPANY FACT BOOK
In 2010, investor demand for broad-based domestic equity ETFs rebounded, and demand for global
and international ETFs remained strong (Figure 3 5) Broad-based domestic equity ETFs saw net
issuance of $28 billion, after net redemptions of $12 billion in 2009 This reversal more than offset a
decline in demand for domestic sector equity ETFs and commodity ETFs in 2010 Demand for bond
and hybrid ETFs slowed as well with net issuance amounting to $30 billion in 2010, down from the
record pace of $46 billion in 2009 Net issuance of global and international equity ETFs remained
strong in 2010 at $42 billion, up from $40 billion in 2009
FIGURE 3.5
Net Issuance of ETF Shares1 by Investment ClassificationBillions of dollars, 2008–2010
200820092010
88
Commodities4Bond andhybrid3
Global/Internationalequity
Domesticsector equity2
Broad-baseddomestic equity
-12
28 3014 10
2540 42
23
4630
1128
8
1 ETF data exclude ETFs that invest primarily in other ETFs.2 This category includes funds both registered and not registered under the Investment Company Act of 1940.3 Bond ETFs represented 99.52 percent of flows in the bond and hybrid category in 2010.4 The funds in this category invest primarily in commodities, currency, and futures, and are not registered under the Investment
Company Act of 1940.
As of year-end 2010, large-cap domestic equity ETFs accounted for the largest proportion of all
ETF assets—21 percent, or $212 billion (Figure 3 6) The second-largest category was emerging
market equity ETFs, which accounted for 16 percent ($154 billion) of all ETF assets
Increased investor demand for ETFs led to a rapid increase in the number of ETFs created by fund
sponsors in the past decade (Figure 3 7) Over the period of 2000 to 2010, 1,055 ETFs were created
with an average of almost 175 ETFs created per year in the past five years Few ETFs had been
liquidated until 2008 when market pressures appeared to come into play and sponsors began
liquidating ETFs that had failed to gather sufficient assets Liquidations have tended to occur
among ETFs tracking virtually identical indexes, those focusing on specialty or niche indexes,
or those using alternative weighting methodologies Despite increasing liquidations over the period
2008 through 2010, the total number of ETFs also increased, on net, by 294 to a total of 923 over
the same time frame

47EXCHANGE-TRADED FUNDS
FIGURE 3.6
Total Net Assets of ETFs1 Concentrated in Large-Cap Domestic StocksBillions of dollars, year-end 2010
Bond and
hybrid5
Commodities4Emerging markets
International3GlobalDomestic sector equity2
OtherSmall-capMid-capLarge-cap
Broad-based domestic equity Global/Internationalequity
138101
154
97
26
104
635048
212
1 ETF data exclude ETFs that invest primarily in other ETFs.2 This category includes funds both registered and not registered under the Investment Company Act of 1940.3 This category includes international, regional, and single country ETFs.4 The funds in this category invest primarily in commodities, currency, and futures, and are not registered under the Investment
Company Act of 1940.5 Bond ETFs represented 99.77 percent of the assets in the bond and hybrid category.
FIGURE 3.7
Number of ETFs1
2000–2010
Created Liquidated Total at year-end
2000 50 0 80
2001 22 0 102
2002 14 3 113
2003 10 4 119
2004 35 2 152
2005 52 0 204
2006 156 1 359
2007 270 0 629
2008 149 50 728
2009 120 49 7972
2010 177 51 923
1 ETF data include ETFs not registered under the Investment Company Act of 1940. ETF data exclude ETFs that invest primarily in other ETFs.
2 In 2009, two ETFs converted from holding securities directly to investing primarily in other ETFs.

48 2011 INVESTMENT COMPANY FACT BOOK
As demand for ETFs has grown, ETF sponsors have offered more funds with a greater variety of
investment objectives Recently, sponsors have introduced ETFs that invest in particular market
sectors, industries, or commodities At year-end 2010, there were 248 sector and commodity ETFs
with $205 billion in assets While commodity ETFs only made up 22 percent of the number of sector
and commodity ETFs (Figure 3 8), they accounted for 49 percent of the total net assets of these
funds (Figure 3 9) Since their introduction in 2004, commodity ETFs have grown from just over
$1 billion to $101 billion by the end of 2010, with total net assets almost tripling in the past two
years Strong net issuance and surging gold and silver prices were the primary drivers behind the
increase in assets during this time Approximately three-quarters of commodity ETF assets tracked
the price of gold and silver through the spot and futures markets in 2010
In 2010, ETF sponsors continued building on recent innovations by launching additional actively
managed ETFs and ETFs that are structured as funds of funds, both of which were first introduced
in 2008 During 2010, seven actively managed ETFs were launched, bringing the total number of
actively managed ETFs to 26* with nearly $3 billion in assets at year-end, excluding ETF funds of
funds ETF funds of funds are ETFs that hold and invest primarily in shares of other ETFs At year-
end 2010, there were 27 ETF funds of funds—including three actively managed ETF funds of funds
that launched in 2010—with $1 3 billion in assets
* This total includes two nonregistered ETFs.

49EXCHANGE-TRADED FUNDS
FIGURE 3.8
Number of Commodity and Sector ETFs1
Percent, year-end 2010
22%Commodities2
10%Consumer
12%Financial16%
Natural resources
4%Utilities
Total: 248 funds
8%Health
7%Real estate
13%Technology
7%Other
1 ETF data exclude ETFs that invest primarily in other ETFs.2 The funds in this category invest primarily in commodities, currency, and futures, and are not registered under the Investment
Company Act of 1940.
Note: Components do not add to 100 percent because of rounding.
FIGURE 3.9
Total Net Assets of Commodity and Sector ETFs1
Percent, year-end 2010
49%Commodities2
4%Consumer
9%Financial
12%Natural resources
3%Utilities
Total: $205 billion
4%Health
8%Real estate
7%Technology
4%Other
1 ETF data exclude ETFs that invest primarily in other ETFs.2 The funds in this category invest primarily in commodities, currency, and futures, and are not registered under the Investment
Company Act of 1940.

50 2011 INVESTMENT COMPANY FACT BOOK
FIGURE 3.10
ETF-Owning Households Held a Broad Range of InvestmentsPercentage of ETF-owning households holding each type of investment, May 2010*
Stock mutual funds, stocks, or variable annuities (total) 97
Bond mutual funds, bonds, or fixed annuities (total) 66
Mutual funds (total) 86
Stock mutual funds 76
Bond mutual funds 55
Hybrid mutual funds 57
Money market funds 64
Stocks 88
Bonds 27
Fixed or variable annuities 33
Investment real estate 39
* Multiple responses are included.
Characteristics of ETF-Owning Households
An estimated 3 3 million U S households held ETFs in 2010 Of households that owned mutual
funds, an estimated 5 percent also owned ETFs ETF-owning households tended to include affluent,
experienced investors who owned a range of equity and fixed-income investments In 2010,
97 percent of ETF-owning households also owned stocks, either directly or through stock mutual
funds or variable annuities (Figure 3 10) Sixty-six percent of households that owned ETFs also held
bonds, bond mutual funds, or fixed annuities In addition, 39 percent of ETF-owning households
owned investment real estate
Some characteristics of retail ETF owners are similar to those of retail stock owners because a
large number of households that owned ETFs also owned stock For instance, households that
owned ETFs—like stock-owning households—tended to have household incomes above the national
median and to own at least one defined contribution (DC) retirement plan account (Figure 3 11)
However, ETF-owning households also exhibit some characteristics that distinguish them from
stock-owning households For example, ETF-owning households tended to have higher incomes,
greater household financial assets, and to be headed by younger and college-educated individuals

51EXCHANGE-TRADED FUNDS
FIGURE 3.11
Characteristics of ETF-Owning HouseholdsMay 2010
All U.S. households
Households owning ETFs
Households owning individual
stocks
Median
Age of head of household 49 46 52
Household income1 $49,800 $130,000 $85,000
Household financial assets2 $75,000 $300,000 $225,000
Percentage of households
Household primary or co-decisionmaker for saving and investing:
Married or living with a partner 63 84 76
Widowed 10 3 7
Four-year college degree or more 31 84 50
Employed (full- or part-time) 60 80 67
Retired from lifetime occupation 29 29 33
Household owns:
IRA(s) 41 85 68
DC retirement plan account(s) 52 74 71
1 Total reported is household income before taxes in 2009.2 Household financial assets include assets in employer-sponsored retirement plans but exclude the household’s primary
residence.
For More Information
» Frequently Asked Questions About Exchange-Traded Funds
Available at www.ici.org.

Over half of closed-end fund total net assets were in bond funds in 2010
58%in bond closed-end funds

Chapter Four
Closed-End Funds
Closed-end funds are one of four types of investment companies, along with
mutual (or open-end) funds, exchange-traded funds, and unit investment
trusts Closed-end funds generally issue a fixed number of shares that are listed
on a stock exchange or traded in the over-the-counter market The assets of
a closed-end fund are professionally managed in accordance with the fund’s
investment objectives and policies, and may be invested in stocks, bonds,
and other securities

54 2011 INVESTMENT COMPANY FACT BOOK
This chapter describes recent closed-end fund developments in the United States and provides a profile of the U.S. households that own them.
What Is a Closed-End Fund? 54
Total Net Assets of Closed-End Funds 54
Number of Closed-End Funds 56
Closed-End Fund Preferred Shares 57
Closed-End Fund Auction Market Preferred Stock 57
Redemption and Replacement of AMPS 59
MuniFund Term Preferred Shares and Puttable Preferred Stock 59
Characteristics of Households Owning Closed-End Funds 60
What Is a Closed-End Fund?
A closed-end fund is a type of investment company whose shares are listed on a stock exchange or
traded in the over-the-counter market The assets of a closed-end fund are professionally managed
in accordance with the fund’s investment objectives and policies, and may be invested in stocks,
bonds, and other securities The market price of closed-end fund shares fluctuates like that of other
publicly traded securities and is determined by supply and demand in the marketplace
Closed-end funds offer a fixed number of shares to investors during an initial public offering
Closed-end funds also may make subsequent public offerings of shares in order to raise additional
capital Once issued, the shares of a closed-end fund are not typically purchased or redeemed
directly by the fund Rather, they are bought and sold by investors in the open market
Because a closed-end fund does not need to maintain cash reserves or sell securities to meet
redemptions, the fund has the flexibility to invest in less liquid portfolio securities For example,
a closed-end fund may invest in securities of very small companies, municipal bonds that are not
widely traded, or securities traded in countries that do not have fully developed securities markets
Closed-end funds also have flexibility to borrow against their assets, allowing them to use leverage
as part of their investment strategy
Total Net Assets of Closed-End Funds
Total net assets of closed-end funds increased to $241 billion at year-end 2010, up 7 percent from
year-end 2009 but still below the recent high of $313 billion in assets at year-end 2007 (Figure 4 1)
Closed-end fund assets have increased by $98 billion, on net, over the past decade

55CLOSED-END FUNDS
Historically, bond funds have accounted for a large share of assets in closed-end funds In 2000,
74 percent of all closed-end fund assets were held in bond funds, while the remainder was held in
equity funds At year-end 2010, assets in bond closed-end funds were $140 billion, or 58 percent of
closed-end fund assets (Figure 4 2) Equity closed-end funds totaled $101 billion, or 42 percent of
closed-end fund assets These relative shares have shifted over time, in part because issuance by
equity closed-end funds exceeded that of bond closed-end funds for every year from 2004 through
2008 (Figure 4 3)
FIGURE 4.1
Closed-End Fund Total Net Assets Increased to $241 Billion Billions of dollars, year-end, 2000–2010
143 141 159
214254
277298 313
186225 241
20102009200820072006200520042003200220012000
140135112167176171172161
125110107
1019074
1221068253
343137
Equity fundsBond funds
146
Note: Components may not add to the total because of rounding.
FIGURE 4.2
Bond Funds Were the Largest Segment of the Closed-End Fund MarketPercentage of closed-end fund total net assets, year-end 2010
32%Domestic municipal bond
6%Global/International bond
25%Domestic equity
Total closed-end fund assets: $241 billion
17%Global/International equity
20%Domestic taxable bond

56 2011 INVESTMENT COMPANY FACT BOOK
Proceeds from issuance of closed-end funds totaled $8 3 billion in 2010, up from $3 9 billion in the
previous year (Figure 4 3) In 2010, issuance of closed-end bond funds totaled $4 6 billion, of which
$4 3 billion—or about half of total issuance—was domestic bond funds The remaining $3 6 billion
in proceeds was from issuance of closed-end equity funds Virtually all equity closed-end fund
issuance in 2010 was from domestic equity closed-end funds, in contrast to 2009 in which equity
fund proceeds were primarily global and international equity closed-end funds
For more data on closed-end funds, see section 2 in the data tables on pages 138–139
Number of Closed-End Funds
The number of closed-end funds available to investors has increased over the past decade At
the end of 2010, there were 624 closed-end funds, up from 482 at the end of 2000, but still down
from 664 at the end of 2007 (Figure 4 4) Bond funds were the most common type of closed-end
fund, accounting for 67 percent of the total number of funds Municipal bond funds represented
41 percent of all closed-end funds in 2010 Equity funds made up 33 percent of the total number
of closed-end funds
FIGURE 4.3
Closed-End Fund Share IssuanceProceeds from the issuance of initial and additional public offerings of closed-end fund shares, millions of dollars, 2002–2010*
Total
Equity Bond
DomesticGlobal/
International DomesticGlobal/
International
2002 $24,911 $9,191 $18 $15,701 $0
2003 40,963 11,187 161 28,582 1,032
2004 27,867 15,424 5,801 5,613 1,028
2005 21,266 12,559 6,628 1,955 124
2006 12,333 7,692 2,583 1,724 334
2007 31,193 5,973 19,871 2,654 2,695
2008 330 8 200 121 0
2009 3,900 476 1,176 1,931 317
2010 8,291 3,628 13 4,291 358
* Data are not available for years prior to 2002.
Note: Components may not add to the total because of rounding.

57CLOSED-END FUNDS
Closed-End Fund Preferred Shares
Closed-end funds are permitted to issue one class of preferred shares in addition to common
shares Preferred shares differ from common shares in that preferred shareholders are paid
dividends but do not share in the gains and losses of the fund Issuing preferred shares allows
a closed-end fund to raise additional capital, which it can use to purchase more securities for
its portfolio This strategy, known as leveraging, is intended to allow the fund to produce higher
returns for its common shareholders At year-end 2010, 13 percent of the $241 billion in closed-end
fund assets were preferred shares (Figure 4 5) Bond closed-end funds accounted for more than
three-quarters of outstanding preferred share assets
Closed-End Fund Auction Market Preferred Stock
In the early 1990s, closed-end funds began issuing a type of preferred share referred to as auction
market preferred stock (AMPS) AMPS are structured to pay dividends at rates set through auctions
run by an independent auction agent Typically, shares traded hands and dividend rates were reset
through auctions that were held every seven or 28 days Investors submitted bids and sell orders
through a broker-dealer, who, in turn, submitted them to an auction agent Bids were filled to the
extent shares were available, and sell orders were filled to the extent there were bids All filled bids
received dividends at the new set dividend, or market clearing, rate
FIGURE 4.4
Number of Closed-End FundsYear-end, 2000–2010
20102009200820072006200520042003200220012000
Equity funds Bond funds
123
359
482116
376
492123
422
545131
453
584158
461
619
193
442
635
204
443
647
230
434
664
222
421
643
209
419
628
204
420
624

58 2011 INVESTMENT COMPANY FACT BOOK
Since mid-February 2008, all auctions for closed-end fund AMPS have failed The failed auctions
have not been caused by defaults under the terms of the AMPS or credit quality concerns with fund
investments; they failed because there were more shares offered for sale in the auction than there
were bids to buy shares Prior to the failures, if more shares were tendered for sale than purchased,
broker-dealers typically would enter the auction and purchase any excess shares to prevent the
auction from failing However, broker-dealers are not, and never have been, legally required to bid
for their own accounts in an auction
As a result of a series of pressures on their balance sheets, broker-dealers stopped participating
in the auctions After a few auctions failed, all subsequent auctions for closed-end fund preferred
stock failed Preferred shareholders appeared to become concerned about the liquidity of their
AMPS, and many sought to sell their shares This move by preferred shareholders increased the
imbalance between supply and demand, making it difficult for the auction market to resume
functioning
FIGURE 4.5
Bulk of Closed-End Fund Total Net Assets Was in Common Share ClassesBillions of dollars, year-end, 2000–2010
Common1
Preferred2
20102009200820072006200520042003200220012000
118
25
143
113
28
141
123
36
159
165
49
214
195
59
254
217
60
277
238
60
298
253
60
313
147
39
186
191
34
225
209
32
241
1 All closed-end funds issue common stock, which is also known as common shares.2 A closed-end fund may issue preferred shares to raise additional capital, which can be used to purchase more securities for
its portfolio. Preferred stock differs from common stock in that preferred shareholders are paid dividends but do not share in the gains and losses of the fund.
Note: Components may not add to the total because of rounding.

59CLOSED-END FUNDS
Redemption and Replacement of AMPS
As of year-end 2010, closed-end funds had redeemed, or announced plans to redeem,
approximately $43 billion, or 67 percent, of the $64 billion in AMPS that were outstanding in mid-
February 2008 (Figure 4 6) Closed-end funds have, among other things, obtained bank loans and
lines of credit, issued tender option bonds, engaged in reverse repurchase agreements, and issued
extendable notes to replace AMPS while maintaining leverage Taxable bond closed-end funds have
redeemed or announced redemptions for 85 percent of their original outstanding AMPS Because
tax-exempt bond closed-end funds (also known as municipal bond funds) have fewer options for
alternative leverage than taxable funds do, they have redeemed, or announced redemptions for,
a smaller amount (47 percent of the original AMPS outstanding) A number of these funds have
issued MuniFund Term Preferred (MTP) shares and have privately placed Variable Rate Demand
Preferred (VRDP) shares to redeem AMPS while maintaining leverage
MuniFund Term Preferred Shares and Puttable Preferred Stock
A number of municipal bond closed-end funds issued—or announced their intention to issue—
MTP shares beginning in October 2009 MTP shares are exchange-listed closed-end fund preferred
shares that have a fixed dividend rate set at the time of issuance MTP shares have a mandatory
redemption period (typically five years) unless they are redeemed or repurchased earlier by the
fund Unlike fixed-rate preferred stock previously issued, MTP shares were created for issuance by
closed-end funds investing in municipal bonds
FIGURE 4.6
Closed-End Fund AMPS RedemptionsBillions of dollars, year-end 2010
Still outstandingRedeemed or pending
Municipal bond closed-end fund–issued AMPS
Taxable bond closed-endfund–issued AMPS
5
28
33
16
15
31
Source: Thomas J. Herzfeld Advisors, Inc.

60 2011 INVESTMENT COMPANY FACT BOOK
FIGURE 4.7
Closed-End Fund–Owning Households Held a Broad Range of InvestmentsPercentage of closed-end fund–owning households holding each type of investment, May 2010*
Stock mutual funds, stocks, or variable annuities (total) 95
Bond mutual funds, bonds, or fixed annuities (total) 79
Mutual funds (total) 87
Stock mutual funds 80
Bond mutual funds 61
Hybrid mutual funds 65
Money market funds 68
Stocks 82
Bonds 43
Fixed or variable annuities 51
Investment real estate 52
* Multiple responses are included.
Further, VRDP shares—a type of puttable preferred stock—were privately placed for a few
municipal bond closed-end funds beginning in August 2008 These issuances continued throughout
2010 They are similar to AMPS in that they pay dividends at variable rates, and sell orders are filled
to the extent there are bids Unlike AMPS, however, rates are set through remarketings (rather than
through auctions); and if there are more sell orders than bids, a third party, commonly referred to
as a liquidity provider, purchases the VRDP shares Dividends are set weekly at a rate established
by the remarketing agent subject to a maximum rate, which will increase over time in the event of
an extended period of unsuccessful remarketing Closed-end funds are required to redeem VRDP
shares still owned by the liquidity provider if there are six months of continuous, unsuccessful
remarketing
Characteristics of Households Owning Closed-End Funds
An estimated 2 1 million U S households held closed-end funds in 2010 These households
tended to include affluent, experienced investors who owned a range of equity and fixed-income
investments In 2010, 95 percent of closed-end fund–owning households also owned stocks, either
directly or through stock mutual funds or variable annuities (Figure 4 7) Seventy-nine percent of
households that owned closed-end funds also held bonds, bond mutual funds, or fixed annuities In
addition, 52 percent of these households owned investment real estate Because a large number of
households that owned closed-end funds also owned stocks and mutual funds, the characteristics
of closed-end fund–owning households were similar in many respects to those of stock- and
mutual fund–owning households For instance, households that owned closed-end funds—like
stock- and mutual fund–owning households—tended to be headed by college-educated individuals
and had household incomes above the national average (Figure 4 8)

61CLOSED-END FUNDS
Nonetheless, households that owned closed-end funds exhibit certain characteristics that
distinguish them from stock- and mutual fund–owning households For example, households with
closed-end funds tended to have much greater household financial assets than either stock or
mutual fund investors Closed-end fund investors were also more likely to be retired from their
lifetime occupations than either stock or mutual fund investors
FIGURE 4.8
Closed-End Fund–Owning Households Had Above-Average Household Incomes and Financial AssetsMay 2010
All U.S. households
Households owning
closed-end funds
Households owning mutual funds
Households owning
individual stocks
Median
Age of head of household 49 54 50 52
Household income1 $49,800 $87,500 $80,000 $85,000
Household financial assets2 $75,000 $500,000 $200,000 $225,000
Percentage of households
Household primary or co-decisionmaker for saving and investing:
Married or living with a partner 63 70 75 76
Widowed 10 13 6 7
Four-year college degree or more 31 63 46 50
Employed (full- or part-time) 60 63 73 67
Retired from lifetime occupation 29 55 25 33
Household owns:
IRA(s) 41 75 68 68
DC retirement plan account(s) 52 65 77 71
1 Total reported is household income before taxes in 2009.2 Household financial assets include assets in employer-sponsored retirement plans but exclude the household’s primary
residence.
For More Information
»“The Closed-End Fund Market, 2010,” ICI Research Perspective
» Frequently Asked Questions About Closed-End Funds and Their Use of Leverage
Available at www.ici.org.

Fees and expenses of stock funds dropped by more than half since 1990
0.95% average fees and expenses in 2010

Chapter Five
Mutual Fund Fees and Expenses
Mutual fund investing involves two primary types of fees and expenses: sales
loads and ongoing expenses Sales loads are one-time fees—paid directly by
investors either at the time of share purchase (front-end loads) or, in some
cases, when shares are redeemed (back-end loads) Unlike sales loads, ongoing
expenses are paid from fund assets, and thus investors pay them indirectly
A fund’s expense ratio is its annual ongoing expenses expressed as a
percentage of fund assets Ongoing fund expenses cover portfolio
management, fund administration, daily fund accounting and pricing,
shareholder services (such as call centers and websites), distribution charges
known as 12b-1 fees, and other miscellaneous costs of operating the fund

64 2011 INVESTMENT COMPANY FACT BOOK
Mutual fund investors, like investors in all financial products, pay for services they receive. This chapter provides an overview of mutual fund fees and expenses.
Trends in Mutual Fund Fees and Expenses 64
Shareholder Demand for Lower-Cost Funds 66
Factors Influencing Mutual Fund Expenses 68
The Changing Distribution Structure of Mutual Funds 73
FIGURE 5.1
Fees and Expenses Incurred by Stock and Bond Mutual Fund Investors Have Declined by More Than Half Since 1990
Percent, selected years
2010200920082007200620052004200320022001200019951990
2010200920082007200620052004200320022001200019951990
Stock funds1, 2
Bond funds1
2.001.56 1.28 1.24 1.23 1.22 1.16 1.09 1.04 1.01 0.97 0.98 0.95
1.851.41
1.00 0.96 0.94 0.94 0.91 0.84 0.81 0.76 0.72 0.73 0.72
1 Data exclude mutual funds available as investment choices in variable annuities and mutual funds that invest primarily in other mutual funds. Figure reports year-end asset-weighted average of annual expense ratios and annualized loads for individual funds.
2 Stock funds include equity and hybrid funds.
Sources: Investment Company Institute and Lipper
Trends in Mutual Fund Fees and Expenses
To understand trends in mutual fund fees and expenses, it is helpful to combine major fund fees
and expenses into a single measure ICI created such a measure by adding a fund’s annual expense
ratio to an estimate of the annualized cost that investors pay for one-time sales loads This measure
is reported as an asset-weighted average, which gives more weight to those funds that have the
most assets
Mutual fund fees and expenses that investors pay have trended downward since 1990 In 1990,
investors in stock funds, on average, paid fees and expenses of 2 00 percent of fund assets
By 2010, that figure had fallen by more than 50 percent to 0 95 percent (Figure 5 1) Fees and

65MUTUAL FUND FEES AND EXPENSES
FIGURE 5.2
Front-End Sales Loads That Investors Paid Were Well Below Maximum Front-End Sales Loads That Funds Charged
Percentage of purchase amount, selected years
Maximum front-end sales load1
Front-end sales load that investors actually incurred1
Stock2 Bond Stock2 Bond
1990 5.0 4.6 3.9 3.5
1995 4.8 4.1 2.5 2.1
2000 5.2 4.2 1.4 1.1
2001 5.2 4.2 1.2 1.0
2002 5.3 4.1 1.3 1.0
2003 5.3 4.1 1.3 1.0
2004 5.3 4.1 1.4 1.1
2005 5.3 4.0 1.3 1.0
2006 5.3 4.0 1.2 0.9
2007 5.3 4.0 1.2 0.9
2008 5.3 4.0 1.1 0.8
2009 5.3 3.9 1.0 0.8
2010 5.3 3.9 1.0 0.8
1 The maximum front-end sales load is a simple average of the highest front-end sales load that funds may charge as set forth in their prospectuses. The average actually incurred is the maximum sales load multiplied by the ratio of total front-end sales loads collected by front-end load funds as a percentage of new sales of shares by such funds.
2 Stock funds include equity and hybrid funds.
Note: Data exclude mutual funds available as investment choices in variable annuities and mutual funds that invest primarily in other mutual funds.
Sources: Investment Company Institute, Lipper, and Strategic Insight Simfund
expenses paid on bond funds declined by 61 percent from 1 85 percent of fund assets to
0 72 percent over the same time period
There are a number of reasons for the dramatic drop in fees and expenses incurred by mutual
fund investors First, investors generally pay much less in sales loads than they did in 1990
Maximum front-end loads that an investor might pay for investing in mutual funds have remained
fairly stable since 1990 (Figure 5 2) However, the front-end loads that shareholders actually
incurred—sometimes referred to as the effective load—have fallen significantly For stock
funds, for example, the average front-end sales load actually paid fell from 3 9 percent in 1990
to 1 0 percent in 2010 A key factor contributing to the steep decline in loads paid has been the
growth of mutual fund sales through employer-sponsored retirement plans Load funds often
waive loads for purchases of fund shares through such retirement plans

66 2011 INVESTMENT COMPANY FACT BOOK
FIGURE 5.3
Fund Shareholders Paid Lower-Than-Average Expenses in Stock Funds1, 2
Percent, 1996–2010
201020092008200720062005200420032002200120001999199819971996
1.03 0.98 0.95 0.97 0.98 0.98 0.99 0.99 0.94 0.90 0.87 0.85 0.82 0.86 0.84
1.55 1.54 1.55 1.58 1.58 1.63 1.65 1.66 1.58 1.52 1.50 1.45 1.45 1.48 1.45
Simple average expense ratio for stock fundsAverage expense ratio paid by shareholders3
1 Data exclude mutual funds available as investment choices in variable annuities and mutual funds that invest primarily in other mutual funds.
2 Stock funds include equity and hybrid funds. 3 Figure reports year-end asset-weighted average of annual expense ratios for individual funds.
Sources: Investment Company Institute and Lipper
Another reason for the decline in the fees and expenses of investing in mutual funds has been
growth in the sales of no-load funds Much of the increase in sales of no-load funds has occurred
through the employer-sponsored retirement plan market In addition, sales of no-load funds have
also expanded through mutual fund supermarkets, discount brokers, and full-service brokerage
platforms that compensate financial advisers with asset-based fees paid outside of funds
Finally, mutual fund fees have been pushed down by economies of scale and competition within
the mutual fund industry The demand for mutual fund services has increased dramatically over
the past several decades For example, the number of households owning mutual funds has more
than doubled since 1990, going from 23 4 million in 1990 to 51 6 million in 2010 Over the same
period, the number of shareholder accounts rose from 61 9 million to over 290 million Ordinarily,
such a sharp increase in demand could tend to raise fund expense ratios Any such effect, however,
was more than offset by the downward pressure on fund expense ratios from competition among
existing fund sponsors, the entry of new fund sponsors into the industry, economies of scale
resulting from the growth in fund assets, and shareholder movement to lower-cost funds
Shareholder Demand for Lower-Cost Funds
ICI research indicates that mutual fund shareholders invest predominantly in lower expense ratio
funds This can be seen by comparing the average expense ratio on mutual funds offered in the
marketplace with the average expense ratio actually paid by mutual fund shareholders (Figure 5 3)
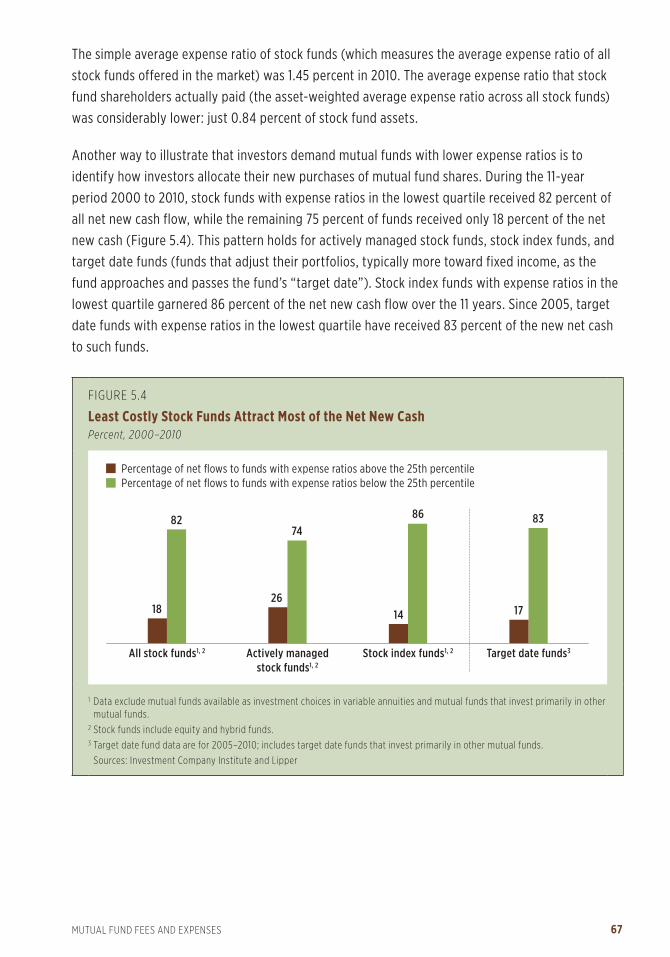
67MUTUAL FUND FEES AND EXPENSES
FIGURE 5.4
Least Costly Stock Funds Attract Most of the Net New CashPercent, 2000–2010
Percentage of net flows to funds with expense ratios above the 25th percentilePercentage of net flows to funds with expense ratios below the 25th percentile
18
Target date funds3Stock index funds1, 2Actively managedstock funds1, 2
All stock funds1, 2
82
26
74
14
86
17
83
1 Data exclude mutual funds available as investment choices in variable annuities and mutual funds that invest primarily in other mutual funds.
2 Stock funds include equity and hybrid funds. 3 Target date fund data are for 2005–2010; includes target date funds that invest primarily in other mutual funds.
Sources: Investment Company Institute and Lipper
The simple average expense ratio of stock funds (which measures the average expense ratio of all
stock funds offered in the market) was 1 45 percent in 2010 The average expense ratio that stock
fund shareholders actually paid (the asset-weighted average expense ratio across all stock funds)
was considerably lower: just 0 84 percent of stock fund assets
Another way to illustrate that investors demand mutual funds with lower expense ratios is to
identify how investors allocate their new purchases of mutual fund shares During the 11-year
period 2000 to 2010, stock funds with expense ratios in the lowest quartile received 82 percent of
all net new cash flow, while the remaining 75 percent of funds received only 18 percent of the net
new cash (Figure 5 4) This pattern holds for actively managed stock funds, stock index funds, and
target date funds (funds that adjust their portfolios, typically more toward fixed income, as the
fund approaches and passes the fund’s “target date”) Stock index funds with expense ratios in the
lowest quartile garnered 86 percent of the net new cash flow over the 11 years Since 2005, target
date funds with expense ratios in the lowest quartile have received 83 percent of the new net cash
to such funds

68 2011 INVESTMENT COMPANY FACT BOOK
FIGURE 5.5
Expense Ratios for Selected Investment Objectives*Percent, 2010
Investment objective
10th percentile Median
90th percentile
AverageAsset-
weightedAverage
Simple
Equity funds 0.80 1.40 2.25 0.84 1.47
Aggressive growth 0.89 1.45 2.27 0.99 1.54
Growth 0.76 1.29 2.15 0.89 1.39
Sector funds 0.93 1.56 2.43 0.98 1.65
Growth and income 0.55 1.18 2.00 0.54 1.25
Income equity 0.73 1.20 1.94 0.83 1.27
International equity 0.95 1.53 2.38 0.99 1.61
Hybrid funds 0.62 1.21 2.00 0.83 1.27
Bond funds 0.50 0.92 1.70 0.64 1.04
Taxable bond 0.49 0.95 1.78 0.65 1.06
Municipal bond 0.53 0.87 1.60 0.62 1.02
Money market funds 0.16 0.29 0.52 0.26 0.32
* Data exclude mutual funds available as investment choices in variable annuities and mutual funds that invest primarily in other mutual funds.
Sources: Investment Company Institute and Lipper
Factors Influencing Mutual Fund Expenses
The prices of most goods and services differ considerably across the array of available products
Mutual funds are no exception: expense ratios vary across the range of mutual funds (Figure 5 5)
The level of fund expenses depends on the fund investment objective, fund assets, balances in
shareholder accounts, payments to intermediaries, and other factors
Fund Investment Objective
Expenses vary by type of fund; for example, bond and money market funds tend to have lower
expense ratios than equity funds Among equity funds, expense ratios tend to be higher among
funds that specialize in particular sectors—“sector” funds, such as healthcare or real estate—or
those that invest in international stocks, because such funds tend to be more costly to manage
Even within a particular type of investment objective, there can be considerable variation in fund
expense ratios For example, 10 percent of aggressive growth equity funds have expense ratios of
0 89 percent or less, while 10 percent have expense ratios of 2 27 percent or more Among other

69MUTUAL FUND FEES AND EXPENSES
FIGURE 5.6
Fund Sizes and Average Account Balances Varied WidelyLong-term funds, year-end 20101, 2
Fund assetsMillions of dollars
Average account balance3
Dollars
10th percentile $21 $10,461
25th percentile 70 19,307
Median 264 49,052
75th percentile 929 162,094
90th percentile 2,703 1,245,613
1 Data exclude mutual funds available as investment choices in variable annuities and mutual funds that invest primarily in other mutual funds.
2 Long-term funds include equity, hybrid, and bond funds. 3 Average account balance is calculated at the fund level as total fund assets divided by the total number of shareholder
accounts, which includes a mix of individual and omnibus accounts.
things, such variation reflects the fact that some aggressive growth funds focus more on small-
or mid-cap stocks while others focus more on large-cap stocks This can be significant because
portfolios of small- and mid-cap stocks tend to be more costly to manage
Fund and Average Fund Account Size
Other factors—such as fund size and average fund account size—also help explain differences in
fund expense ratios These two factors vary widely across the industry In 2010, the median long-
term mutual fund had assets of $264 million (Figure 5 6) Twenty-five percent of all long-term
funds had assets of $70 million or less, while another 25 percent of long-term funds had assets
greater than $929 million Average fund account balances show similar variation In 2010,
50 percent of long-term funds had average account balances of $49,052 or less Twenty-five
percent of long-term funds had average account balances of $19,307 or less At the other extreme,
25 percent of long-term funds had average account balances of more than $162,094
All else equal, larger mutual funds tend to have lower-than-average expense ratios because of
economies of scale Funds with higher account balances also tend to have lower expense ratios than
other funds This reflects the fact that each account, regardless of its size, requires certain services
(such as mailing periodic account statements to account holders) Funds that cater primarily to
institutional investors—who typically invest large amounts of money—tend to have higher average
account balances Funds that primarily serve retail investors typically have lower average account
balances

70 2011 INVESTMENT COMPANY FACT BOOK
A Look at the Fees and Expenses of S&P 500 Index Mutual Funds
All S&P 500 index funds share the goal of mirroring the return on the S&P 500, a well-known
index of 500 large-cap U S stocks As a result, S&P 500 index funds all hold essentially
identical portfolios
Nevertheless, S&P 500 index funds differ from one another in important ways Some S&P
500 index funds are very large—among the largest of any mutual funds—while other S&P
500 index funds are quite small Required minimum investments range widely for S&P 500
index funds, from $100 for some retail funds to more than $25 million among S&P 500 index
funds that cater to institutions S&P 500 index funds also differ in terms of certain fees that
investors may pay out of pocket, such as account maintenance fees Finally, some S&P 500
index funds are sold through intermediaries (load funds), while others can be purchased
directly from fund companies (no-load funds)
FIGURE 5.7
Investor Assets Were Concentrated in S&P 500 Index Mutual Funds with the Lowest Expense RatiosPercentage of total net assets of S&P 500 index mutual funds, year-end 2010
More than 0.200.11 to 0.200.10 or less
1523
63
Total expense ratio*
* The total expense ratio, which is reported as a percentage of fund assets, includes fund operating expenses and 12b-1 fees.
Note: Components do not add to 100 percent because of rounding. Data exclude mutual funds available as investment choices in variable annuities.
Sources: Investment Company Institute and Lipper

71MUTUAL FUND FEES AND EXPENSES
Because S&P 500 index funds are not all identical, their expense ratios differ Similar to all
long-term mutual funds, larger S&P 500 index funds and those S&P 500 index funds with
higher average account balances tend to have lower-than-average expense ratios because
of economies of scale S&P 500 index funds sold through intermediaries tend to have higher
expense ratios than comparable no-load S&P 500 index funds in order to compensate
financial advisers for the planning, advice, and ongoing service that they provide to clients
Retail investors who purchase no-load S&P 500 index funds either do not use a financial
adviser or use a financial adviser but pay the adviser directly
Investors favor the least costly S&P 500 index funds For example, in 2010, over 60 percent
of the assets in S&P 500 index funds were held in funds with expense ratios of 0 10 percent
or less (Figure 5 7) Lower-cost funds have garnered the bulk of investors’ net new purchases
of shares of S&P 500 index funds From 1996 to 2010, 81 percent of the total net new cash
flow to S&P 500 index funds went to those funds with expense ratios of 0 20 percent or less
(Figure 5 8)
FIGURE 5.8
Investors’ Net Purchases of S&P 500 Index Mutual Funds Were Concentrated in Least Costly FundsPercentage of net new cash flow of S&P 500 index mutual funds, 1996–2010
Total expense ratio*
More than 0.200.11 to 0.200.10 or less
19
3843
*The total expense ratio, which is reported as a percentage of fund assets, includes fund operating expenses and 12b-1 fees.
Note: Data exclude mutual funds available as investment choices in variable annuities.
Sources: Investment Company Institute and Lipper

72 2011 INVESTMENT COMPANY FACT BOOK
FIGURE 5.9
Fund Expense Ratios Tend to Fall as Fund Total Net Assets Rise Share classes of domestic equity funds continuously in existence since 19911
Average expense ratio2
0
200
400
600
800
1,000
1,200
1,400
1,600
1,800
’10’09’08’07’06’05’04’03’02’01’00’99’98’97’96’95’94’93’92’910.70
0.75
0.80
0.85
0.90
0.95
1.00 Total net assets
1,1521,115
912
1,6281,5921,4511,392
1,2281,209
1,4071,504
1,223
766602
412384291228
Percent Billions of dollars
1,004 931
1 Calculations are based on a fixed sample of share classes. Sample includes all domestic equity share classes continuously in existence since 1991, excluding mutual funds available as investment choices in variable annuities and mutual funds that invest primarily in other mutual funds.
2 Average expense ratio is an asset-weighted average.
Sources: Investment Company Institute and Lipper
Because larger funds typically have lower expense ratios, the expense ratios of individual funds
often fall as those funds grow This is illustrated in Figure 5 9, which tracks the expense ratios of
domestic equity funds continuously in existence since 1991, along with the growth in their assets
Generally, the expense ratios of these funds declined as their total net assets rose, and vice versa
For example, from 1991 to 2010, the average expense ratio of this group of funds fell 13 percent,
reflecting trend growth in their assets On the other hand, when the assets of these funds declined
during the bear markets that began in 2000 and 2007, their average expense ratio rose
Payments to Intermediaries
Another factor that helps explain variation in fund fees is whether funds are sold through
intermediaries, such as brokers or registered financial advisers These professionals help investors
define their investment goals, select appropriate funds, and provide ongoing advice and service
Financial advisers can be compensated for these services through a particular kind of fund fee,
known as a 12b-1 fee, which is included in a fund’s expense ratio As a result, funds sold through
intermediaries tend to have higher expense ratios than other funds (no-load funds) No-load
funds are sold directly to investors or are sold to investors through financial advisers who charge
investors separately for investment advice Thus, no-load funds tend to have lower expense ratios
than other funds with similar investment objectives

73MUTUAL FUND FEES AND EXPENSES
FIGURE 5.10
Most 12b-1 Fees Used to Pay for Shareholder ServicesPercentage of 12b-1 fees collected, 2004
52%Ongoing shareholder services
40%Compensation to financial advisers
for initial assistance
6%Payments to fund underwriters
2%Advertising and promotion
Source: ICI Fundamentals, “How Mutual Funds Use 12b-1 Fees”
The Changing Distribution Structure of Mutual Funds
Many mutual fund investors pay for the services of a professional financial adviser ICI research
finds that among investors owning mutual fund shares outside of retirement plans at work,
81 percent own fund shares through professional financial advisers Financial advisers typically
devote time and attention to prospective investors before investors make an initial purchase of
funds and other securities The adviser generally meets with the investor, identifies financial goals,
analyzes existing financial portfolios, determines an appropriate asset allocation, and recommends
funds to help achieve the investor’s goals Advisers also provide ongoing services, such as
periodically reviewing investors’ portfolios, adjusting asset allocations, and responding to
customer inquiries
Thirty years ago, fund shareholders usually compensated financial advisers for their assistance
through a front-end load—a one-time, upfront payment for current and future services After 1980,
when the U S Securities and Exchange Commission (SEC) adopted Rule 12b-1 under the Investment
Company Act of 1940, funds and their shareholders had greater flexibility in compensating financial
advisers Rule 12b-1 and subsequent regulatory action established a framework under which
investors can pay indirectly for some or all of the services they receive from financial advisers
through 12b-1 fees—asset-based fees that are included in a fund’s expense ratio
Under this framework, 12b-1 fees can also be used to compensate financial intermediaries, such
as retirement plan recordkeepers and discount brokerage firms, for the services they provide to
fund shareholders Although they can be used to pay for advertising and marketing, 12b-1 fees
are primarily used to compensate financial advisers and other financial intermediaries for assisting
fund investors before (40 percent of fees collected) and after they purchase fund shares
(52 percent of fees collected) (Figure 5 10)

74 2011 INVESTMENT COMPANY FACT BOOK
Mutual Fund Share Classes
Mutual funds are often classified according to the class of shares that fund sponsors offer
to investors, primarily load or no-load classes Load classes generally serve investors who
own fund shares purchased through financial advisers; no-load fund classes usually serve
investors who purchase shares without the assistance of a financial adviser or choose to
compensate the financial adviser separately About two-thirds of all mutual funds offer two
or more share classes Funds that sell through financial advisers typically offer more than
one share class to provide investors with alternative ways to pay for the services of financial
advisers
Load Share Classes
Load share classes—front-end load, back-end load, and level-load shares—usually include
a sales load or a 12b-1 fee or both The sales load and 12b-1 fees are used to compensate
financial advisers and other investment professionals for their services
Front-end load shares, which are predominantly Class A shares, represent the traditional
means of paying for securities-related assistance Front-end load shares generally charge a
sales load at the time of purchase, which is a percentage of the sales price or offering price
Front-end load shares also often have a 12b-1 fee of 0 25 percent Front-end load shares are
sometimes used in employer-sponsored retirement plans, but fund sponsors typically waive
the sales load for purchases made through such retirement plans
Back-end load shares, which are primarily Class B shares, typically do not have a front-end
load Investors using back-end load shares pay for services provided by financial advisers
through a combination of an annual 12b-1 fee and a contingent deferred sales load (CDSL)
The CDSL is paid if fund shares are redeemed before a given number of years of ownership
The CDSL decreases the longer the investor owns the shares and reaches zero typically after
the shares have been held six or seven years After six to eight years, back-end load shares
usually convert to a share class with a lower 12b-1 fee For example, Class B shares typically
convert to Class A shares after a specified number of years
Level-load shares, which include Class C shares, generally do not have a front-end load
Investors in this kind of share class compensate financial advisers with a combination of an
annual 12b-1 fee (typically 1 percent) and a CDSL (also often 1 percent) that shareholders pay
if they sell their shares within the first year after purchase

75MUTUAL FUND FEES AND EXPENSES
FIGURE 5.11
12b-1 Fees Paid Reflect Asset Growth and Shift in Source of Financial Advisers’ CompensationBillions of dollars, selected years1
2010200920082007200620052004200320022001200019951990
10.69.7
12.313.1
11.610.710.2
9.08.99.8
11.0
3.6
1.1
No-load funds2
Load funds
1 Data exclude mutual funds available as investment choices in variable annuities and mutual funds that invest primarily in other mutual funds.
2 Front-end load = 0 percent, CDSL = 0 percent, and 12b-1 fee ≤ 0.25 percent.
Sources: Investment Company Institute and Lipper
No-Load Share Classes
No-load share classes have no front-end load or CDSL, and have a 12b-1 fee of 0 25 percent
or less Originally, no-load share classes were offered by mutual fund sponsors that sold
directly to investors Now, investors can purchase no-load funds through employer-
sponsored retirement plans, mutual fund supermarkets, discount brokerage firms, and bank
trust departments, as well as directly from mutual fund sponsors Some financial advisers
who charge investors separately for their services rather than through a load or 12b-1 fee use
no-load share classes
The introduction of Rule 12b-1 changed the means by which financial advisers were compensated
The maximum front-end load fees that funds might charge declined sharply in the 1980s as funds
adopted 12b-1 fees as an alternative way to compensate financial advisers and intermediaries for
providing services to fund shareholders Since 1990, 12b-1 fees paid by shareholders rose from
$1 1 billion to $10 6 billion (Figure 5 11) This increase reflects, in part, the roughly tenfold increase
in mutual fund assets and the more than twofold increase in the number of households owning
funds since 1990

76 2011 INVESTMENT COMPANY FACT BOOK
FIGURE 5.12
Net New Cash Flow Was Greatest in No-Load Share ClassesBillions of dollars, 2001–2010
2001 2002 2003 2004 2005 2006 2007 2008 2009 2010
All long-term funds $129 $121 $216 $210 $192 $227 $224 -$225 $390 $228
Load 45 26 49 49 31 39 16 -145 30 -33
Front-end load1 23 19 33 46 41 42 19 -104 2 -60
Back-end load2 -2 -18 -20 -40 -47 -47 -42 -39 -24 -27
Level load3 23 24 28 20 17 20 24 -12 30 22
Other load4 1 2 8 22 20 24 15 10 22 34
No-load5 72 96 125 125 143 164 184 -54 330 253
Retail or general purpose
37 47 82 90 68 74 60 -115 131 28
Institutional 35 49 43 34 75 91 124 61 199 224
Variable annuities 13 -2 42 36 18 24 25 -26 30 8
1 Front-end load > 1 percent. Primarily includes A shares; includes sales where front-end loads are waived.2 Front-end load = 0 percent and CDSL > 2 percent. Primarily includes B shares.3 Front-end load ≤ 1 percent, CDSL ≤ 2 percent, and 12b-1 fee > 0.25 percent. Primarily includes C shares; excludes institutional
share classes.4 All other load share classes not classified as front-end load, back-end load, or level load. Primarily includes retirement share
classes known as R shares.5 Front-end load = 0 percent, CDSL = 0 percent, and 12b-1 fee ≤ 0.25 percent.
Note: Components may not add to the total because of rounding. Data exclude mutual funds that invest primarily in other mutual funds.
Sources: Investment Company Institute and Lipper
In recent years, the system for compensating financial intermediaries for distributing mutual fund
shares and assisting investors has continued to evolve For example, maximum front-end load
fees have stabilized, but front-end load fee payments (as a percentage of assets) have continued
to decline This, in large measure, reflects the discounts from the maximum front-end load that
investors often receive when making large share purchases or purchases through 401(k) plans
There has also been a shift by investors toward no-load share classes No-load share classes have
consistently attracted more net new cash than load share classes in recent years (Figure 5 12) In
2010, for example, no-load share classes of long-term funds garnered $253 billion in net new cash,
compared to an outflow of $33 billion for load share classes Cumulatively, these flows have led to
a concentration of long-term fund assets in no-load share classes; by 2010, no-load share classes
of long-term funds had $5 1 trillion in total net assets compared to $2 6 trillion in load share

77MUTUAL FUND FEES AND EXPENSES
FIGURE 5.13
Total Net Assets of Long-Term Funds Were Concentrated in No-Load Share ClassesBillions of dollars, 2001–2010
2001 2002 2003 2004 2005 2006 2007 2008 2009 2010
All long-term funds $4,690 $4,118 $5,362 $6,194 $6,864 $8,059 $8,917 $5,771 $7,804 $9,017
Load 1,937 1,552 1,956 2,222 2,409 2,784 2,980 1,844 2,335 2,621
Front-end load1 1,367 1,069 1,360 1,567 1,720 2,014 2,171 1,373 1,744 1,869
Back-end load2 407 309 356 334 271 241 204 102 98 78
Level load3 151 149 214 252 284 334 373 235 325 396
Other load4 12 24 26 68 133 195 233 134 168 279
No-load5 2,055 1,976 2,605 3,031 3,416 4,051 4,590 3,073 4,332 5,096
Retail or general purpose
1,492 1,424 1,862 2,163 2,399 2,798 3,074 1,922 2,650 2,987
Institutional 563 552 742 869 1,018 1,252 1,516 1,151 1,682 2,109
Variable annuities 698 591 802 941 1,039 1,225 1,347 855 1,138 1,300
1 Front-end load > 1 percent. Primarily includes A shares; includes sales where front-end loads are waived.2 Front-end load = 0 percent and CDSL > 2 percent. Primarily includes B shares.3 Front-end load ≤ 1 percent, CDSL ≤ 2 percent, and 12b-1 fee > 0.25 percent. Primarily includes C shares; excludes institutional
share classes.4 All other load share classes not classified as front-end load, back-end load, or level load. Primarily includes retirement share
classes known as R shares.5 Front-end load = 0 percent, CDSL = 0 percent, and 12b-1 fee ≤ 0.25 percent.
Note: Components may not add to the total because of rounding. Data exclude mutual funds that invest primarily in other mutual funds.
Sources: Investment Company Institute and Lipper
For More Information
» “Trends in the Fees and Expenses of Mutual Funds, 2010,” ICI Research Perspective
» “The Economics of Providing 401(k) Plans: Services, Fees, and Expenses, 2009,” Investment
Company Institute Fundamentals
Available at www.ici.org.
classes (Figure 5.13). The shift toward no-load funds should not be taken as indicating that
investors are eschewing advice from financial advisers. To be sure, some of the flows to no-load
funds owe to “do-it-yourself” investors. However, much of the shift represents a change in the way
investors compensate their financial advisers, with many investors now paying for financial advice
directly out of their pockets instead of indirectly through their mutual funds. Flows from 401(k)
plans and other retirement accounts also are often invested in no-load funds.

More than four in 10 U.S. households held mutual fundsin 2010
44%of U.S. households owned mutual funds

Chapter Six
Characteristics of Mutual Fund Owners
Ownership of mutual funds by U S households has grown significantly in the
past 30 years Forty-four percent of all U S households owned mutual funds
in 2010, compared with less than 6 percent in 1980 The estimated 90 million
individuals who owned mutual funds in 2010 included many different types of
people across all age and income groups with a variety of financial goals These
fund investors purchase and sell mutual funds through four principal sources:
professional financial advisers (e g , full-service brokers, independent financial
planners), employer-sponsored retirement plans, fund companies directly, and
fund supermarkets

80 2011 INVESTMENT COMPANY FACT BOOK
This chapter looks at the characteristics of individual and institutional owners of U.S. mutual funds and examines how these investors purchase fund shares.
Individual and Household Ownership of Mutual Funds 80
Mutual Fund Ownership by Age and Income 82
Savings Goals of Mutual Fund Investors 84
Where Investors Own Mutual Funds 85
Sources of Mutual Fund Purchases 87
Adviser Contact in 2009 and 2010 87
Shareholder Sentiment, Willingness to Take Investment Risk, and Confidence 89
Shareholders’ Use of the Internet 92
Institutional Ownership 95
FIGURE 6.1
44 Percent of U.S. Households Owned Mutual Funds in 2010Millions and percentage of U.S. households owning mutual funds, selected years
Percentage ofU.S. households
51.648.747.4
28.423.4
12.84.6
43.943.044.528.725.114.75.7
2010200520001995199019851980
Sources: Investment Company Institute and U.S. Census Bureau. See ICI Fundamentals, “Ownership of Mutual Funds, Shareholder Sentiment, and Use of the Internet, 2010.”
Individual and Household Ownership of Mutual Funds
In 2010, an estimated 90 million individual investors owned mutual funds and held 87 percent
of total mutual fund assets at year-end Altogether, 51 6 million households, or 44 percent of all
U S households, owned funds (Figure 6 1)
Mutual funds represented a significant component of many U S households’ financial holdings
in 2010 Among households owning mutual funds, the median amount invested in mutual funds
was $100,000 (Figure 6 2) Seventy-five percent of individuals heading households that owned
mutual funds were married or living with a partner, and 46 percent were college graduates
Seventy-three percent of these individuals worked full- or part-time

81CHARACTERISTICS OF MUTUAL FUND OWNERS
FIGURE 6.2
Characteristics of Mutual Fund InvestorsMay 2010
How Many People Own Mutual Funds?
90.2 million individuals
51.6 million U.S. households
Who Are They?
50 is the median age of the head of household
75 percent are married or living with a partner
46 percent are college graduates
73 percent are employed (full- or part-time)
18 percent are Silent or GI Generation
44 percent are Baby Boomers
24 percent are Generation X
14 percent are Generation Y
$80,000 is the median household income
What Do They Own?
$200,000 is the median household financial assets
65 percent hold more than half of their financial assets in mutual funds
68 percent own IRAs
77 percent own DC retirement plan accounts
4 mutual funds is the median number owned
$100,000 is the median mutual fund assets
80 percent own equity funds
When and How Did They Make Their First Fund Purchase?
54 percent bought their first mutual fund before 1995
61 percent purchased their first mutual fund through an employer-sponsored retirement plan
Why Do They Invest?
93 percent are saving for retirement
50 percent hold mutual funds to reduce taxable income
47 percent are saving for emergencies
25 percent are saving for education
Sources: Investment Company Institute and U.S. Census Bureau. See ICI Fundamentals, “Ownership of Mutual Funds, Shareholder Sentiment, and Use of the Internet, 2010”; ICI Fundamentals, “Characteristics of Mutual Fund Investors, 2010”; and Profile of Mutual Fund Shareholders, 2010.

82 2011 INVESTMENT COMPANY FACT BOOK
Mutual Fund Ownership by Age and Income
The incidence of mutual fund ownership in 2010 was greatest among households in their peak
earning and saving years, that is, between the ages of 35 and 64 (Figure 6 3) About half of all
households in this age group owned mutual funds Fewer than one-third of households younger
than 35 and fewer than 40 percent of households aged 65 or older owned mutual funds
Among mutual fund–owning households in 2010, 67 percent were headed by individuals between
the ages of 35 and 64 (Figure 6 4) Fifteen percent of mutual fund–owning households were
headed by individuals younger than 35, and 18 percent were headed by individuals 65 or older
The median age of individuals heading households owning mutual funds was 50 (Figure 6 2)
Like the U S population as a whole, the population of mutual fund–owning households is aging
Thirty-eight percent of mutual fund–owning households were headed by individuals 55 or older
in 2010 compared with 26 percent in 1994 (Figure 6 4)
The majority of U S households owning mutual funds had moderate incomes One-quarter of
mutual fund–owning households had household incomes of less than $50,000; 20 percent had
household incomes between $50,000 and $74,999; 19 percent had incomes between $75,000 and
$99,999; and the remaining 36 percent had incomes of $100,000 or more The median household
income of mutual fund–owning households was $80,000 (Figure 6 2)

83CHARACTERISTICS OF MUTUAL FUND OWNERS
FIGURE 6.3
Mutual Fund Ownership Is Greatest Among 35- to 64-Year-OldsPercentage of U.S. households within each age group,* May 2010
31
65 or older55 to 6445 to 5435 to 44Younger than 35
4756
51
37
Age of head of household*
* Age is based on the age of the sole or co-decisionmaker for household saving and investing.
Sources: Investment Company Institute and U.S. Census Bureau. See ICI Fundamentals, “Ownership of Mutual Funds, Shareholder Sentiment, and Use of the Internet, 2010.”
FIGURE 6.4
The U.S. Population and Mutual Fund Shareholders Are Getting OlderPercentage of households by mutual fund ownership status and age group,* May 2010
65 or older55 to 6445 to 5435 to 44Younger than 35
21
13
17
23
26
22
17
21
18
22
13
13
21
29
24
18
20
27
20
15
2010199420101994
All U.S. households Households owning mutual funds
Age of head of household*
* Age is based on the age of the sole or co-decisionmaker for household saving and investing.
Sources: Investment Company Institute and U.S. Census Bureau. See ICI Fundamentals, “Ownership of Mutual Funds, Shareholder Sentiment, and Use of the Internet, 2010.”

84 2011 INVESTMENT COMPANY FACT BOOK
FIGURE 6.5
Ownership of Mutual Funds Increases with Household IncomePercentage of U.S. households within each income group,* May 2010
10Less than $25,000
$25,000 to $34,999
$35,000 to $49,999
$50,000 to $74,999
$75,000 to $99,999
$100,000 or more
66%$50,000 or more
22%Less than $50,00026
40
48
71
79
Household income*
* Total reported is household income before taxes in 2009.
Sources: Investment Company Institute and U.S. Census Bureau. See ICI Fundamentals, “Ownership of Mutual Funds, Shareholder Sentiment, and Use of the Internet, 2010.”
Although individuals across all income groups own mutual funds, households with higher incomes
are more likely to own mutual funds than lower-income households In 2010, 66 percent of all U S
households with incomes of $50,000 or more owned mutual funds, compared with 22 percent of
households with incomes of less than $50,000 (Figure 6 5) In fact, lower-income households are
less likely to have any type of savings The typical household with income less than $50,000 had
$15,000 in savings and investments, while the typical household with incomes of $50,000 or more
held $160,000 in savings and investments
Savings Goals of Mutual Fund Investors
Mutual funds play a key role in achieving both the long- and short-term savings goals of U S
households In 2010, 74 percent of mutual fund–owning households indicated that their primary
financial goal for their fund investments was saving for retirement Ninety-one percent of
households that owned mutual funds held shares inside workplace retirement plans, individual
retirement accounts (IRAs), and other tax-deferred accounts Households were more likely to
invest their retirement assets in long-term mutual funds than in money market funds Defined
contribution (DC) retirement plans and IRA assets held in stock, bond, and hybrid mutual
funds totaled $4 3 trillion in 2010 and accounted for 48 percent of those funds’ assets, whereas
retirement account assets in money market funds were $351 billion, or 13 percent of those
funds’ assets

85CHARACTERISTICS OF MUTUAL FUND OWNERS
FIGURE 6.6
Employer-Sponsored Retirement Plans Are Increasingly the Source of First Mutual Fund PurchasePercentage of U.S. households owning mutual funds, May 2010
Year of household’s first mutual fund purchase Memo: all mutual
fund–owning households
Before 1990
1990 to 1994
1995 to 1999
2000 to 2004
2005 or later
Source of first mutual fund purchase
Inside employer-sponsored retirement plan
52 62 66 66 72 61
Outside employer-sponsored retirement plan
48 38 34 34 28 39
Note: Employer-sponsored retirement plans include DC plans (such as 401(k), 403(b), or 457 plans) and employer-sponsored IRAs (SEP IRAs, SAR-SEP IRAs, and SIMPLE IRAs).
Sources: Investment Company Institute and U.S. Census Bureau. See ICI Fundamentals, “Characteristics of Mutual Fund Investors, 2010.”
Retirement is not the only financial goal for households’ mutual fund investments Half of mutual
fund–owning households reported that reducing their taxable income was one of their goals;
47 percent listed saving for an emergency as a goal; and 25 percent reported saving for education
among their goals (Figure 6 2)
Where Investors Own Mutual Funds
The importance of retirement saving among mutual fund investors also is reflected in where they
own their funds As 401(k) and other employer-sponsored DC retirement plans have become
increasingly popular in the workplace, the fraction of households that make their first foray into
mutual fund investing inside their employer-sponsored retirement plans has increased Among
those households that made their first mutual fund purchase in 2005 or later, 72 percent did so
inside an employer-sponsored retirement plan (Figure 6 6) Among those households that made
their first purchase before 1990, 52 percent did so inside an employer-sponsored retirement plan
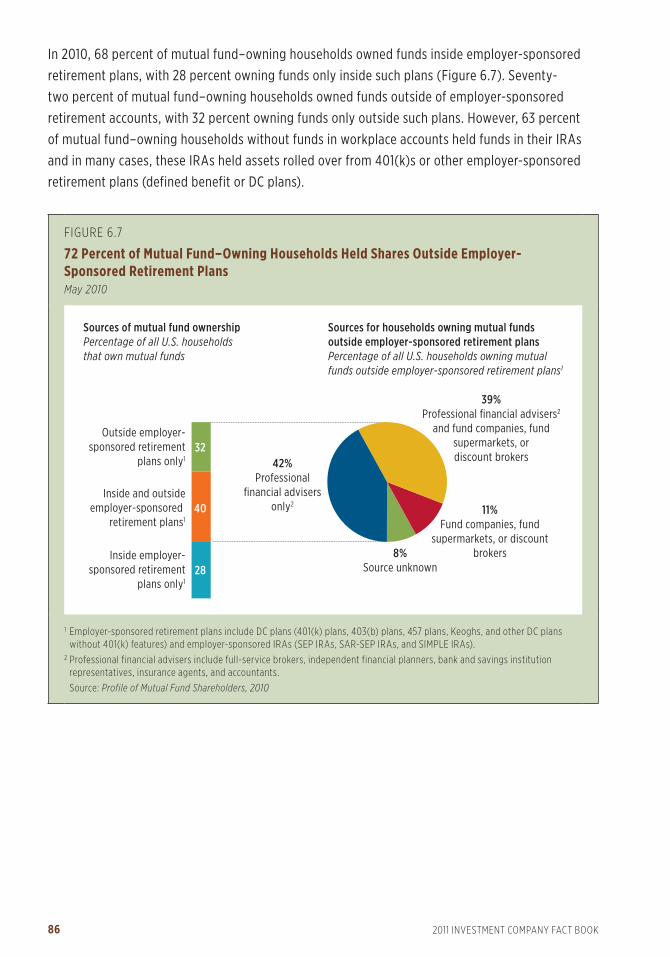
86 2011 INVESTMENT COMPANY FACT BOOK
FIGURE 6.7
72 Percent of Mutual Fund–Owning Households Held Shares Outside Employer-Sponsored Retirement PlansMay 2010
Outside employer-sponsored retirement
plans only1
Inside and outsideemployer-sponsored
retirement plans1
Inside employer-sponsored retirement
plans only1
39%Professional financial advisers2
and fund companies, fundsupermarkets, ordiscount brokers
11%Fund companies, fund
supermarkets, or discountbrokers8%
Source unknown
42%Professional
financial advisersonly2
Sources of mutual fund ownershipPercentage of all U.S. households that own mutual funds
Sources for households owning mutual fundsoutside employer-sponsored retirement plansPercentage of all U.S. households owning mutual funds outside employer-sponsored retirement plans1
32
40
28
1 Employer-sponsored retirement plans include DC plans (401(k) plans, 403(b) plans, 457 plans, Keoghs, and other DC plans without 401(k) features) and employer-sponsored IRAs (SEP IRAs, SAR-SEP IRAs, and SIMPLE IRAs).
2 Professional financial advisers include full-service brokers, independent financial planners, bank and savings institution representatives, insurance agents, and accountants.
Source: Profile of Mutual Fund Shareholders, 2010
In 2010, 68 percent of mutual fund–owning households owned funds inside employer-sponsored
retirement plans, with 28 percent owning funds only inside such plans (Figure 6 7) Seventy-
two percent of mutual fund–owning households owned funds outside of employer-sponsored
retirement accounts, with 32 percent owning funds only outside such plans However, 63 percent
of mutual fund–owning households without funds in workplace accounts held funds in their IRAs
and in many cases, these IRAs held assets rolled over from 401(k)s or other employer-sponsored
retirement plans (defined benefit or DC plans)

87CHARACTERISTICS OF MUTUAL FUND OWNERS
FIGURE 6.8
About Half of Mutual Fund Shareholders Used an AdviserMay 2010
Ongoing relationshipwith an adviser
Did not havean adviser
12%Shareholder initiated
contact only
2%No contact at all
8%Adviser initiated
contact only
78%Both adviser
and shareholderinitiated contact
Shareholder adviser usePercentage of all mutual fund–owning households
Contact with advisers within the past 12 monthsPercentage of mutual fund–owning householdswith ongoing adviser relationships
51
49
Source: ICI Fundamentals, “Ownership of Mutual Funds, Shareholder Sentiment, and Use of the Internet, 2010”
Sources of Mutual Fund Purchases
Households owning mutual funds outside of workplace retirement plans purchased their funds
through a variety of sources Indeed, 81 percent of those that owned funds outside a workplace
retirement plan held funds purchased through a professional adviser (Figure 6 7) Professional
financial advisers include full-service brokers, independent financial planners, bank and savings
institution representatives, insurance agents, and accountants Forty-two percent of investors who
owned funds outside employer-sponsored retirement plans owned funds solely through advisers,
while another 39 percent owned funds purchased from advisers, fund companies directly, or
discount brokers Eleven percent solely owned funds purchased directly from fund companies or
discount brokers
Adviser Contact in 2009 and 2010
About half (51 percent) of all mutual fund–owning households indicated they had ongoing
relationships with financial advisers (Figure 6 8) Between June 2009 and May 2010, nearly all
households with advisers had contact with their advisers Seventy-eight percent of shareholders
who reported using an adviser indicated that both they and their advisers initiated contact
during this time period Another 12 percent reported contact initiated only by the shareholder,
and 8 percent reported contact initiated only by their adviser

88 2011 INVESTMENT COMPANY FACT BOOK
FIGURE 6.9
The Average Mutual Fund Account Has Been Open for Five YearsPercentage of mutual fund accounts held outside DC retirement plans by age of account, year-end 2009
17%Less than 1 year
26%1 to 2 years
20%3 to 4 years
23%5 to 9 years
14%10 years or more
Mean: 5 yearsMedian: 4 years
FIGURE 6.10
The Average Shareholder Tenure with a Fund Company Is Eight YearsPercentage of mutual fund shareholders by tenure of shareholder with the fund company, year-end 2009
9%Less than 1 year
17%1 to 2 years
14%3 to 4 years
25%5 to 9 years
35%10 years or more
Mean: 8 yearsMedian: 7 years
Those who own funds outside DC retirement plans typically hold mutual funds in their investment
portfolios for several years On average, mutual fund accounts held outside retirement plans
at work have been open for five years (Figure 6 9), and shareholders on average have had a
relationship with the fund company offering the fund(s) for eight years (Figure 6 10)

89CHARACTERISTICS OF MUTUAL FUND OWNERS
FIGURE 6.11
Mutual Fund Shareholder Sentiment Rises and Falls with Stock Market PerformancePercentage of mutual fund shareholders familiar with mutual fund companies, 1998–2010
Very favorableSomewhat favorable
2010200920082007200620052004200320022001200019991998
67647377767473717579838481Totalpercentagewith positiveopinions1
56545757575957555657555353
121016201915
16161922283128
Mutual fund company favorability rating1
1125
902
14031511
12901178
1103936
1079
12701418
1332
1108
S&P 500,2 May average
1 The mutual fund industry favorability rating is the percentage of mutual fund shareholders familiar with the mutual fund industry who have a “very” or “somewhat” favorable impression of the fund industry.
2 The S&P 500 is an index of 500 stocks chosen for market size, liquidity, and industry group representation.
Sources: Investment Company Institute and Standard & Poor’s. See ICI Fundamentals, “Ownership of Mutual Funds, Shareholder Sentiment, and Use of the Internet, 2010.”
Shareholder Sentiment, Willingness to Take Investment Risk, and Confidence
Shareholder sentiment generally moves with stock market performance largely because of the
impact on mutual fund returns For example, mutual fund companies’ favorability rose in the late
1990s along with stock prices (measured by the S&P 500), then declined between May 2000 and
May 2003 as stock prices fell, and increased between May 2003 and May 2007 as the stock market
gained (Figure 6 11)
After falling during the market decline in 2008 and 2009, mutual fund favorability rebounded
somewhat as the stock market gained in 2010 Sixty-seven percent of shareholders familiar with
mutual fund companies had “very” or “somewhat” favorable impressions of fund companies in
2010, up from 64 percent in 2009 (Figure 6 11)

90 2011 INVESTMENT COMPANY FACT BOOK
FIGURE 6.12
Households’ Willingness to Take Investment Risk Tends to Move with the S&P 500 Stock IndexMeasure is percentage of U.S. households willing to take above-average or substantial investment risk, 1988–2010
0
200
400
600
800
1,000
1,200
1,400
1,600
1,800
Sept
-10
May
-10
Nov-
09M
ay-0
9No
v-08
May
-08
Nov-
07M
ay-0
7No
v-06
May
-06
Nov-
05M
ay-0
5No
v-04
May
-04
Nov-
03M
ay-0
3No
v-02
May
-02
Nov-
01M
ay-0
1No
v-00
May
-00
Nov-
99M
ay-9
9No
v-98
May
-98
Nov-
97M
ay-9
7No
v-96
May
-96
Nov-
95M
ay-9
5No
v-94
May
-94
Nov-
93M
ay-9
3No
v-92
May
-92
Nov-
91M
ay-9
1No
v-90
May
-90
Nov-
89M
ay-8
9O
ct-8
8
10
12
14
16
18
20
22
24
Index level Percent
S&P 500 (left scale)
ICI measure of willingness to take risk (right scale)SCF measure of willingness to take risk (right scale)
Sources: ICI Annual Mutual Fund Shareholder Tracking Survey, Federal Reserve Board Survey of Consumer Finances (SCF), and Standard & Poor’s
Among all U S households, the percentage willing to take above-average or substantial investment
risk tends to move with stock market performance (Figure 6 12) U S households become less
tolerant of investment risk in times of poor stock market performance For example, willingness
to take risk is lower from 2008 to 2010, compared to time periods of higher stock market gains
Households owning mutual funds also have expressed less willingness to take investment risk in
recent years In May 2008, 37 percent of U S households owning mutual funds were willing to take
above-average or substantial risk with their investments (Figure 6 13) By May 2010, this fraction
had fallen to 31 percent of mutual fund–owning households
Investors’ confidence that mutual funds are helping them reach their financial goals declined a bit
in the wake of the financial market crisis In 2009, 73 percent of fund shareholders said they were
confident in mutual funds’ ability to help them achieve their financial goals, compared to 85 percent
in 2008 (Figure 6 14) In 2010, confidence rose: 79 percent of all fund shareholders said they were
confident in mutual funds’ ability to help them achieve their financial goals Indeed, nearly one-
quarter of fund investors in 2010 were “very” confident that mutual funds could help them meet
their financial goals

91CHARACTERISTICS OF MUTUAL FUND OWNERS
FIGURE 6.13
Households’ Willingness to Take Investment RiskPercentage of U.S. households by mutual fund ownership status; May 2008, May 2009, and May 2010
201020092008 201020092008 201020092008
All U.S. households Households owningmutual funds
Households not owningmutual funds
Substantial financial risk for substantial financial gainAbove-average risk for above-average gainAverage risk for average gainBelow-average risk for below-average gainUnwilling to take any risk
518
38
8
32
415
37
11
33
416
37
10
33
6
31
50
77
5
25
50
1010
5
26
49
119
48
27
8
53
47
27
11
50
47
26
9
53
23
40
19
44
20
43
37
14
30
20
31
20
12
61
11
61
11
62
Note: Components may not add to 100 percent because of rounding.
Source: ICI Fundamentals, “Ownership of Mutual Funds, Shareholder Sentiment, and Use of the Internet, 2010”
FIGURE 6.14
Mutual Fund Shareholders’ Confidence Rose in 2010Percentage of all mutual fund shareholders by level of confidence that mutual funds can help them meet their investment goals, 2005–2010
Very confidentSomewhat confident
29
57
201020092008200720062005
86
32
54
86
31
53
84
26
59
85
18
55
7324
55
79
Note: This question was not included in the survey prior to 2005. The question has four choices; the other two possible responses are “not very confident” and “not at all confident.”
Source: ICI Fundamentals, “Ownership of Mutual Funds, Shareholder Sentiment, and Use of the Internet, 2010”

92 2011 INVESTMENT COMPANY FACT BOOK
FIGURE 6.15
Internet Access Is Widespread Among Mutual Fund–Owning HouseholdsPercentage of households with Internet access, May 2005 and May 2010
All U.S. householdsMutual fund–
owning householdsHouseholds with
DC plans
Had Internet access in
2005
Had Internet access in
2010
Had Internet access in
2005
Had Internet access in
2010
Had Internet access in
2005
Had Internet access in
2010
Respondent age
Younger than 35 82 84 95 96 93 94
35 to 49 81 85 91 95 90 93
50 to 64 74 77 90 91 87 88
65 or older 34 49 60 70 58 74
Respondent education
High school graduate or less 51 57 75 77 73 79
Some college or associate’s degree
82 84 87 90 90 92
College or postgraduate degree 89 91 94 96 95 96
Household income*
Less than $50,000 55 59 74 76 75 78
$50,000 to $99,999 84 87 90 90 90 92
$100,000 to $149,999 95 98 97 97 95 98
$150,000 or more 96 95 96 97 98 95
Total 70 75 87 89 86 90
* Total reported is household income before taxes in prior year.
Note: Internet access includes access to the Internet at home, work, or some other location.
Source: ICI Fundamentals, “Ownership of Mutual Funds, Shareholder Sentiment, and Use of the Internet, 2010”
Shareholders’ Use of the Internet
Some shareholders use the Internet to access fund and other investment information In 2010,
89 percent of U S households owning mutual funds had Internet access (Figure 6 15), up from
68 percent in 2000—the first year in which ICI measured shareholders’ access to the Internet
Similar to all U S households and households owning DC plans, the incidence of Internet access
traditionally has been greatest among younger mutual fund shareholders Increases in Internet
access among older shareholder segments, however, have narrowed the generational gap
considerably Overall, eight in 10 mutual fund–owning households with Internet access used
the Internet daily

93CHARACTERISTICS OF MUTUAL FUND OWNERS
In 2010, 82 percent of shareholders with Internet access went online for financial purposes, most
often to obtain investment information or check their bank or investment accounts (Figure 6 16)
In addition, mutual fund–owning households were much more likely than non-fund-owning
households to engage in common online activities, such as accessing email, obtaining information
about products and services other than investments, or purchasing products and services other
than investments
FIGURE 6.16
Most Mutual Fund Shareholders Used the Internet for Financial PurposesPercentage of fund-owning and non-fund-owning households with Internet access in the past 12 months by online activities,1, 2 May 2010
Households owning mutual funds
Households not owning mutual funds
Accessed email 91 85
Used Internet for a financial purpose (total) 82 62
Accessed any type of financial account, such as bank or investment accounts
79 57
Obtained investment information 58 23
Bought or sold investments online 21 9
Used Internet for a nonfinancial purpose (total) 91 78
Obtained information about products and services other than investments
83 68
Bought or sold something other than investments online 81 64
1 Online activities are based on the sole or co-decisionmaker for household saving and investing.2 For this survey, the past 12 months were June 2009 through May 2010.
Note: Internet access includes access to the Internet at home, work, or some other location.
Source: ICI Fundamentals, “Ownership of Mutual Funds, Shareholder Sentiment, and Use of the Internet, 2010”

94 2011 INVESTMENT COMPANY FACT BOOK
FIGURE 6.17
Mutual Fund Shareholders’ Use of the Internet by Age, Education, and Income for 2010Percentage of U.S. households with Internet access by mutual fund ownership and online activities in past 12 months,1, 2 May 2010
Accessed emailUsed Internet for a financial purpose
Used Internet for a nonfinancial
purpose
Respondent age
Younger than 35 95 89 92
35 to 49 93 86 93
50 to 64 92 79 92
65 or older 83 73 82
Respondent education
High school graduate or less 80 69 83
Some college or associate’s degree 92 84 90
College or postgraduate degree 96 87 95
Household income3
Less than $50,000 85 69 83
$50,000 to $99,999 91 83 91
$100,000 to $149,999 92 87 94
$150,000 or more 98 91 97
Total 91 82 91
1 Online activities are based on the household’s sole or co-decisionmaker for saving and investing.2 For this survey, the past 12 months were June 2009 through May 2010.3 Total reported is household income before taxes in 2009.
Note: Internet access includes access to the Internet at home, work, or some other location.
Source: ICI Fundamentals, “Ownership of Mutual Funds, Shareholder Sentiment, and Use of the Internet, 2010”
Younger shareholders, shareholders with higher education levels, and shareholders with higher
household incomes all reported the highest levels of Internet use for financial and nonfinancial
purposes (Figure 6 17) About nine in 10 members of these groups indicated using the Internet for
these online tasks

95CHARACTERISTICS OF MUTUAL FUND OWNERS
Institutional Ownership
Nonfinancial businesses, financial institutions, nonprofit organizations, and other institutional
investors held 13 percent of mutual fund assets at year-end 2010 (Figure 6 18) Institutional investor
data exclude mutual fund holdings by fiduciaries, retirement plans, and variable annuities, which
are considered to be held primarily by individual investors
As of year-end 2010, nonfinancial businesses were the largest segment of institutional investors
in mutual funds, holding $730 billion in corporate and similar accounts These firms primarily
use mutual funds as a cash management tool, and 71 percent of their mutual funds holdings
were money market funds Business investments in funds do not include assets held by funds in
retirement plans on behalf of employees in employer-sponsored retirement plans, since those
assets are considered employee assets rather than employer assets
Financial institutions—which include credit unions, investment clubs, banks, and insurance
companies—were the second-largest component of institutional investors in mutual funds
Financial institutions held $544 billion in fund assets at year-end 2010 Nonprofit organizations and
other institutional investors held $131 billion and $141 billion, respectively, in mutual fund accounts
Institutional investors overwhelmingly held money market funds as the primary type of mutual
fund Across all types of institutional investors, 63 percent of investments in mutual funds were in
money market funds at year-end 2010

96 2011 INVESTMENT COMPANY FACT BOOK
FIGURE 6.18
Institutional and Household Ownership of Mutual FundsBillions of dollars, year-end 2010
$1,824Households’1 money
market funds
$8,450Households’1 long-term
mutual funds2
Households held the majority (87 percent)of mutual fund assets
Nonfinancial businesses are the largest typeof institutional investorAssets in long-term and money market fundsby type of institution
517
213
Otherinstitutional
investors3
Nonprofitorganizations
Financialinstitutions
Nonfinancialbusinesses
$567Institutional investors’
long-term mutual funds2 362
183 5081
5090
$730
$544
$131 $141
Money market fundsLong-term mutual funds2
Total mutual fund assets: $11,821 billionTotal long-term2 mutual fund assets: $9,017 billionTotal money market fund assets: $2,804 billion Type of institutional investor
$980Institutional investors’money market funds
1 Mutual funds held as investments in variable annuities and 529 plans are counted as household holdings of mutual funds.2 Long-term mutual funds include stock, hybrid, and bond mutual funds.3 This category includes state and local governments and other institutional accounts not classified.
Note: Components may not add to the total because of rounding.

97CHARACTERISTICS OF MUTUAL FUND OWNERS
For More Information
» Profile of Mutual Fund Shareholders, 2010
»“Characteristics of Mutual Fund Investors, 2010,” Investment Company Institute
Fundamentals
»“Ownership of Mutual Funds, Shareholder Sentiment, and Use of the Internet, 2010,”
Investment Company Institute Fundamentals
Available at www.ici.org.

U.S. retirement assets were $17.5 trillion in 2010
$17.5 trillionat year-end 2010

Chapter Seven
Retirement and Education Savings
National policies that have created or enhanced tax-advantaged savings
accounts have proven integral to helping Americans prepare for retirement and
other long-term savings goals Because many Americans use mutual funds in
tax-advantaged accounts to reach these goals, ICI studies the U S retirement
market; the investors who use IRAs, 401(k) plans, 529 plans, and other tax-
advantaged savings vehicles; and the role of funds in the retirement and
education savings markets

100 2011 INVESTMENT COMPANY FACT BOOK
This chapter analyzes the U.S. retirement market; describes the investors who use IRAs, 401(k) plans, 529 plans, and other tax-advantaged savings vehicles; and explores the role of mutual funds in U.S. households’ efforts to save for retirement and education.
The U.S. Retirement System 100
Defined Contribution Plans 103
401(k) Participants: Asset Allocations, Account Balances, and Loans 104
Distributions from Defined Contribution Plans 108
Services and Expenses in 401(k) Plans 109
Individual Retirement Accounts 112
IRA Investors 113
Distributions from IRAs 116
The Role of Mutual Funds in Households’ Retirement Savings 118
Types of Mutual Funds Used by Retirement Plan Investors 119
The Role of Mutual Funds in Households’ Education Savings 120
The U.S. Retirement System
In retirement, Americans rely on a combination of resources including Social Security benefits
and income from employer-sponsored retirement plans, individual retirement accounts (IRAs),
and annuities Reliance on each of these components varies by individual
The largest component of retiree income and the predominant income source for lower-income
retirees is Social Security benefits Social Security benefits are funded through a payroll tax equal
to 12 4 percent of earnings of covered workers (6 2 percent paid by employees* and 6 2 percent
paid by employers) up to a maximum taxable earnings amount ($106,800 in 2010) The Social
Security benefit formula is highly progressive, with benefits representing a much higher percentage
of earnings for workers with lower lifetime earnings For individuals born in the 1940s, the
Congressional Budget Office (CBO) projects that Social Security benefits will replace, on average,
71 percent of average earnings for the bottom 20 percent of retired workers ranked by lifetime
earnings (Figure 7 1) This replacement rate drops to 50 percent for the second quintile of retired
workers, and then declines more slowly as lifetime earnings increase For even the top 20 percent
of earners, Social Security benefits are projected to replace a considerable fraction (31 percent)
of earnings Over time, Social Security has become a system designed to be the primary means
of support for retirees with low lifetime earnings and a substantial source of income for all retired
workers
Employer-sponsored retirement plans, IRAs, and annuities also play an important role in the
U S retirement system Such retirement assets increased to $17 5 trillion at year-end 2010, up
* For 2011, this rate has been temporarily changed to 4.2 percent.

101RETIREMENT AND EDUCATION SAVINGS
FIGURE 7.1
Social Security Benefit Formula Is Highly ProgressiveCBO estimates of first-year benefits relative to average indexed earnings by household lifetime earnings, 1940s birth cohort, percent
HighestFourthMiddleSecondLowest
71
5043 38
31
Quintiles of household lifetime earnings
Source: Congressional Budget Office (CBO’s 2010 Long-Term Projections for Social Security: Additional Information)
FIGURE 7.2
U.S. Retirement Assets Increased in 2010Trillions of dollars, year-end, selected years
2010200920082007200620042002200019951990
Other plans1
DC plans2
IRAs
3.92.4
0.9 0.6
7.0
4.0
1.31.7
11.7
6.1
2.6
3.0
10.5
5.5
2.52.5
13.8
7.1
3.3
3.3
16.7
8.4
4.2p
4.1
17.9
8.7
4.8p
4.4
13.9
6.9
3.6e
3.4
16.0
7.7
4.3e
4.1
17.5
8.3
4.7e
4.5
1 Other plans include private-sector DB plans; federal, state, and local pension plans; and all fixed and variable annuity reserves at life insurance companies less annuities held by IRAs, 403(b) plans, 457 plans, and private pension funds. Federal pension plans include U.S. Treasury security holdings of the civil service retirement and disability fund, the military retirement fund, the judicial retirement funds, the Railroad Retirement Board, and the foreign service retirement and disability fund. These plans also include securities held in the National Railroad Retirement Investment Trust and Federal Employees Retirement System (FERS) Thrift Savings Plan (TSP).
2 DC plans include 403(b) plans, 457 plans, and private employer-sponsored DC plans (including 401(k) plans). e Data are estimated.p Data are preliminary.
Note: Components may not add to the total because of rounding.
Sources: Investment Company Institute, Federal Reserve Board, National Association of Government Defined Contribution Administrators, American Council of Life Insurers, and Internal Revenue Service Statistics of Income Division. See “The U.S. Retirement Market, Fourth Quarter 2010.”

102 2011 INVESTMENT COMPANY FACT BOOK
9 percent from year-end 2009 (Figure 7 2) The largest components of retirement assets were
IRAs and employer-sponsored defined contribution (DC) plans, holding $4 7 trillion and
$4 5 trillion, respectively, at year-end 2010 Other employer-sponsored pensions include private-
sector defined benefit (DB) pension funds ($2 2 trillion), state and local government employee
retirement plans ($3 0 trillion), and federal government DB plans and the federal employees’
Thrift Savings Plan ($1 4 trillion) In addition, there were $1 6 trillion in annuity reserves outside
of retirement plans at year-end 2010
Seventy percent of U S households (or 82 million households) reported that they had employer-
sponsored retirement plans, IRAs, or both in May 2010 (Figure 7 3) Sixty-two percent of U S
households reported that they had employer-sponsored retirement plans—that is, they had
assets in DC plan accounts, were receiving or expecting to receive benefits from DB plans, or
both Forty-one percent of households reported having assets in IRAs Thirty-three percent
of households had both IRAs and employer-sponsored retirement plans
Ownership of IRA and DC plan assets has become more common with each successive generation
of workers This can be seen by comparing the ownership rates of households grouped by the
decade in which the household heads were born (Figure 7 4) At any given age, younger households
have had higher ownership rates over time For example, in 2010, when they were 51 to 60 years of
age, 72 percent of households born in the 1950s owned IRAs and DC plan accounts By comparison,
households born a decade earlier had a 64 percent ownership rate when they were aged 52 to 61 in
FIGURE 7.3
Many U.S. Households Had Tax-Advantaged Retirement Savings Percentage of U.S. households, May 2010
8%Had IRA only1
30%Did not have IRA or
employer-sponsoredretirement plan
Total number of U.S. households: 117.5 million
33%Had IRA and
employer-sponsoredretirement plan1, 2
29%Had employer-sponsored
retirement plan only2
1 IRAs include traditional IRAs, Roth IRAs, and employer-sponsored IRAs (SEP IRAs, SAR-SEP IRAs, and SIMPLE IRAs). 2 Employer-sponsored retirement plans include DC and DB retirement plans.
Sources: Investment Company Institute and U.S. Census Bureau. See ICI Fundamentals, “The Role of IRAs in U.S. Households’ Saving for Retirement, 2010.”

103RETIREMENT AND EDUCATION SAVINGS
FIGURE 7.4
Younger Households Have Had Higher and Faster Growing Rates of IRA or Defined Contribution Plan OwnershipPercentage of U.S. households owning IRAs or DC plans by decade in which household heads were born, 1989–2010
0
10
20
30
40
50
60
70
80
85807570656055504540353025200
10
20
30
40
50
60
70
80
Age at time of survey
1989 1992 1995 1998 2001 2004 2007 2008 2010
Born 1960 to 1969
Born 1950 to 1959
Born 1940 to 1949
Born 1930 to 1939
Born 1920 to 1929
Born 1970 to 1979
Note: Age is the average age of the 10-year birth cohort at the time of the survey. The 10-year birth cohorts are defined using the age of the head of household.
Sources: ICI tabulations of Federal Reserve Board Survey of Consumer Finances 1989–2007 and ICI Annual Mutual Fund Shareholder Tracking Surveys 2000–2010
2001 At younger ages, the differences between birth cohorts are even greater For example,
70 percent of households with heads born in the 1970s held assets in IRAs or DC plan accounts in
2010 when they were aged 31 to 40 In contrast, those born in earlier decades had lower ownership
rates at similar ages Sixty-five percent of households born in the 1960s owned IRAs or DC plan
accounts in 2001, when they were then aged 32 to 41, and 48 percent of households born in the
1950s owned IRAs or DC plan accounts in 1992, when they were aged 33 to 42
Defined Contribution Plans
DC plans provide employees with an account derived from employer or employee contributions
or both, plus investment earnings or losses on those contributions, less withdrawals from the plans
Assets in employer-sponsored DC plans have grown more rapidly than assets in other types of
employer-sponsored retirement plans over the past quarter century, increasing from 27 percent
of employer plan assets in 1985 to 40 percent at year-end 2010 At the end of 2010, employer-
sponsored DC plans—which include 401(k) plans, 403(b) plans, 457 plans, Keoghs, and other

104 2011 INVESTMENT COMPANY FACT BOOK
DC plans—held an estimated $4 5 trillion in assets (Figure 7 5) With $3 1 trillion in assets at year-
end 2010, 401(k) plans held the largest share of employer-sponsored DC plan assets Two types
of plans similar to 401(k) plans—403(b) plans, which allow employees of educational institutions
and certain nonprofit organizations to receive deferred compensation, and 457 plans, which
allow employees of state and local governments and certain tax-exempt organizations to receive
deferred compensation—held another $939 billion in assets The remaining $530 billion in DC plan
assets were held by other DC plans without 401(k) features
FIGURE 7.5
Defined Contribution Plan Assets by Type of Plan Billions of dollars, year-end, selected years
201020092008200720062004200220001995
Other DC plans*403(b) plans and 457 plans401(k) plans
4,525
530
3,056e
939
4,084490
2,725e
869
3,416427
2,230
759
4,444555
2,982
907
4,147531
2,768
8473,344
453
2,189
7032,471366
1,573
532
2,970
618
1,725
6271,717492
864361
* Other DC plans include Keoghs and other DC plans (profit-sharing, thrift-savings, stock bonus, and money purchase) without 401(k) features.
e Data are estimated.
Note: Components may not add to the total because of rounding.
Sources: Investment Company Institute, Federal Reserve Board, Department of Labor, National Association of Government Defined Contribution Administrators, and American Council of Life Insurers
401(k) Participants: Asset Allocations, Account Balances, and Loans
For many American workers, 401(k) plan accounts have become an important part of their
retirement planning The income these accounts provide in retirement depends, in part, on
the asset allocation decisions of plan participants

105RETIREMENT AND EDUCATION SAVINGS
FIGURE 7.6
401(k) Asset Allocation Varied with Participant AgeAverage asset allocation of 401(k) account balances, percentage of assets, year-end 2009
38.3%Equity funds
11.2%Non–target date balanced funds
7.7%Bond funds
7.3%Company stock
23.5%Target date funds
3.5%Money funds
3.3%Other funds
5.5%GICs and other stable
value funds
32.2%Equity funds
6.9%Non–target date balanced funds13.9%
Bond funds
8.3%Company stock
7.6%Target date funds
7.3%Money funds
4.1%Other funds
19.9%GICs and other stable
value funds
Participants in their twenties
Participants in their sixties
Note: Funds include mutual funds, bank collective trusts, life insurance separate accounts, and any pooled investment product invested primarily in the security indicated. Components may not add to 100 percent because of rounding. Percentages are dollar-weighted averages.
Source: Tabulations from EBRI/ICI Participant-Directed Retirement Plan Data Collection Project. See ICI Perspective, “401(k) Plan Asset Allocation, Account Balances, and Loan Activity in 2009.”
On average, younger participants allocate a larger portion of their portfolio to equities (which
include equity mutual funds and other pooled equity investments; the equity portion of balanced
funds, including target date funds; and company stock of their employers) According to research
conducted by ICI and the Employee Benefit Research Institute (EBRI), at year-end 2009,
individuals in their twenties invested 46 percent of their assets in equity funds and company
stock; 35 percent in target date funds and non–target date balanced funds; and 17 percent in
guaranteed investment contracts (GICs), stable value funds, money funds, and bond funds
(Figure 7 6) All told, participants in their twenties had 73 percent of their 401(k) assets in

106 2011 INVESTMENT COMPANY FACT BOOK
FIGURE 7.7
Asset Allocation to Equities Varied Widely Among 401(k) ParticipantsAsset allocation distribution of 401(k) participant account balance to equities, percentage of participants, year-end 2009
Participants in their sixtiesParticipants in their twenties
54.2
13.63.33.6 6.5
18.8
22.3
12.9
20.3
18.9
10.4
15.2
>80 percent>60 to 80 percent>40 to 60 percent>20 to 40 percent1 to 20 percentZero
Percentage of account balance in equities
Note: Equities include equity funds, company stock, and the equity portion of balanced funds. Funds include mutual funds, bank collective trusts, life insurance separate accounts, and any pooled investment product invested primarily in the security indicated. Components may not add to 100 percent because of rounding.
Source: Tabulations from EBRI/ICI Participant-Directed Retirement Plan Data Collection Project. See ICI Perspective, “401(k) Plan Asset Allocation, Account Balances, and Loan Activity in 2009.”
equities By comparison, at year-end 2009, individuals in their sixties invested 41 percent of their
assets in equity funds and company stock, 15 percent in target date funds and non–target date
balanced funds, and 41 percent in GICs, stable value funds, money funds, and bond funds All told,
participants in their sixties had 48 percent of their 401(k) assets in equities
Within age groups, however, portfolio allocation varies widely For example, at year-end 2009,
54 percent of 401(k) participants in their twenties held more than 80 percent of their account in
equities and 17 percent held 20 percent or less (Figure 7 7) Of 401(k) participants in their sixties,
22 percent held more than 80 percent of their account in equities and 29 percent held 20 percent
or less
Only in existence since the mid-1990s, target date funds (including both target date mutual funds
and other pooled target date investments) have grown rapidly in recent years A target date fund
follows a predetermined reallocation of assets over time based on a specified target retirement
date, and typically the fund rebalances its portfolio to become less focused on growth and more
focused on income as it approaches and passes the target date, which is usually indicated in the
fund’s name At year-end 2009, target date fund assets represented about 10 percent of total
401(k) assets, up from 5 percent at year-end 2006 (Figure 7 8)

107RETIREMENT AND EDUCATION SAVINGS
FIGURE 7.8
Target Date Funds’ 401(k) Market ShareMeasures of percentage of total 401(k) market, year-end, 2006–2009
57
2006200720082009
AssetsParticipants holdingParticipants o�eredPlans o�ering
6775 77
6268
72 71
1925
31 33
5 7 7 10
Note: Funds include mutual funds, bank collective trusts, life insurance separate accounts, and any pooled investment product invested primarily in the security indicated.
Source: Tabulations from EBRI/ICI Participant-Directed Retirement Plan Data Collection Project. See ICI Perspective, “401(k) Plan Asset Allocation, Account Balances, and Loan Activity in 2009.”
The share of 401(k) plans offering target date funds increased to 77 percent in 2009 from
57 percent in 2006, and the share of 401(k) plan participants offered target date funds increased
to 71 percent from 62 percent over the same period Because not all plan participants choose to
allocate assets to the funds, the percentage of 401(k) participants with target date fund assets
was lower than the percentage of participants who were offered the option At year-end 2009,
33 percent of 401(k) participants held at least some plan assets in target date funds, up from
19 percent at year-end 2006 In addition, because not all participants with assets in the funds
allocated 100 percent of their holdings to the funds, and because participants with assets in the
funds were more likely to be younger or recently hired and have lower account balances, the share
of 401(k) assets invested in target date funds was lower than the share of participants invested in
the funds

108 2011 INVESTMENT COMPANY FACT BOOK
Account balances tended to be higher the longer 401(k) plan participants had been working
for their current employers and the older the participant Workers in their sixties with at least
30 years of tenure at their current employers had an average 401(k) account balance of $198,993
(Figure 7 9) The median age of 401(k) plan participants was 45 years at year-end 2009, and the
median job tenure was 6 years
Most 401(k) participants do not borrow from their plans, although loan activity has edged up in
recent years At year-end 2009, 21 percent of those eligible for loans had loans outstanding The
average unpaid loan balance for these participants represented about 15 percent of their 401(k)
account balances (net of the unpaid loan balances)
Distributions from Defined Contribution Plans
With DC plans representing an increasing share of household retirement assets, the decisions
participants make about distributing those assets in retirement have become an issue of increasing
interest to plan sponsors, financial institutions, and policymakers In late 2007, ICI surveyed
recent retirees who had actively participated in DC plans about how they used plan proceeds at
retirement Just over half (52 percent) of surveyed DC plan retirees received all their distributions
as lump sums, and another 7 percent received a portion of their distributions as lump sums The
remainder deferred withdrawal (i e , left their money in their plans), received their distribution as
annuities or installment payments, or chose some combination of options that did not include lump
sums
FIGURE 7.9
401(k) Balances Tend to Increase with Participant Age and Job TenureAverage 401(k) participant account balance, year-end 2009
0
$50,000
$100,000
$150,000
$200,000
>30>20 to 30>10 to 20>5 to 10>2 to 50 to 2
20s
30s
40s
50s60s
Dollars
Participant job tenure (years)
Source: Tabulations from EBRI/ICI Participant-Directed Retirement Plan Data Collection Project. See ICI Perspective, “401(k) Plan Asset Allocation, Account Balances, and Loan Activity in 2009.”

109RETIREMENT AND EDUCATION SAVINGS
Of respondents who received lump-sum distributions, 86 percent of respondents rolled over some
or all of the balance to an IRA or otherwise reinvested the assets (Figure 7 10) Indeed, distributions
from employer-sponsored retirement plans (of all types) are an important source of funds in IRAs
The remaining 14 percent spent all of the proceeds of the distribution Because retirees who spent
some or all of their lump-sum distributions tended to have lower account balances, only 7 percent
of the total dollars distributed as lump sums at retirement were spent immediately
Services and Expenses in 401(k) Plans
Employers are confronted with two competing economic pressures: the need to attract and retain
quality workers with competitive compensation packages and the need to keep their products and
services competitively priced In deciding whether to offer 401(k) plans to their workers, employers
must decide if the benefits of offering a plan (in attracting and retaining quality workers) outweigh
the costs of providing the plan and plan services—both the compensation paid to the worker and
any other costs associated with maintaining the plan and each individual plan participant account
To provide and maintain 401(k) plans, employers are required to obtain a variety of administrative,
participant-focused, regulatory, and compliance services Employers offering 401(k) plans typically
hire service providers to operate these plans, and these providers charge fees for their services
FIGURE 7.10
Use of Lump-Sum Distributions from Defined Contribution Plans at RetirementPercentage of respondents*
14%Spent all proceeds
86%Reinvested some or all
of the proceeds
Rolled over all to IRA
Rolled over some to IRA, spent some
Rolled over some to IRA, reinvested some outside IRA, spent some
Rolled over some to IRA, reinvested some outside IRA, spent noneReinvested all outside IRA
Reinvested some outside IRA, spent some
65
9
11
84
3
* Based upon respondents’ recall. Responses are from a survey of employees retiring between 2002 and 2007 who were interviewed in the fall of 2007.
Source: Investment Company Institute, Defined Contribution Plan Distribution Choices at Retirement

110 2011 INVESTMENT COMPANY FACT BOOK
As with any employee benefit, the employer generally determines how the costs will be shared
between the employer and employee Fees can be paid directly by the plan sponsor (i e ,
employer), directly by the plan participants (i e , employees), indirectly by the participants through
fees or other reductions in returns paid to the investment provider, or by some combination of
these methods (Figure 7 11)
Participants in 401(k) plans holding mutual funds tend to invest in lower-cost funds and funds with
below-average portfolio turnover Both characteristics help to keep down the costs of investing
in mutual funds through 401(k) plans For example, at year-end 2009, 27 percent of 401(k) stock
mutual fund assets were in funds that had total annual expense ratios below 0 50 percent of
fund assets, and another 49 percent had expense ratios between 0 50 percent and 1 00 percent
(Figure 7 12) On an asset-weighted basis, the average total expense ratio incurred on 401(k)
participants’ holdings of stock mutual funds through their 401(k) plans was 0 74 percent in 2009,
compared with an asset-weighted average total expense ratio of 0 86 percent for stock mutual
funds industrywide Similarly, stock mutual funds held in 401(k) accounts tend to have lower
turnover in their portfolios The asset-weighted average turnover rate of stock funds held in
401(k) accounts was 54 percent in 2009, compared with an industrywide asset-weighted average
of 64 percent Fifty-nine percent of 401(k) assets at year-end 2010 were invested in mutual funds
A Deloitte/ICI study of 130 plan sponsors in late 2008 created and analyzed a comprehensive plan
fee measure, the “all-in fee ” The study found a range of fees across 401(k) plans and that a key
driver of the all-in fee is plan size Specifically, plans with more participants and larger average
account balances tended to have lower all-in fees than plans with fewer participants and smaller
average account balances This observed effect likely results in part from fixed costs required
to start up and run the plan, much of which are driven by legal and regulatory requirements
It appears that economies are gained as a plan grows in size because these fixed costs can be
spread over more participants or a larger asset base or both The Deloitte/ICI study also found that
employers that sponsor smaller plans (plans with less than $10 million in assets), on average, paid
a larger share of plan fees than employers sponsoring larger plans (plans with $10 million or more
in assets)

111RETIREMENT AND EDUCATION SAVINGS
FIGURE 7.11
A Variety of Arrangements May Be Used to Compensate 401(k) Service Providers
Services and products providedFee payment/form of fee payment
Direct fees: dollar per participant; percentage based on assets; transactional fees
Recordkeeping and administration; plan service and consulting; legal, compliance, and regulatory
Participant service, education, advice, and communication
Expense ratio (percentage of assets)
Asset management; investment products
Employer/Plan
Participants Investment provider(s)
Recordkeeper/Retirement
service provider
Direct fees: dollar per participant; percentage based on assets; transactional fees
Recordkeeping;distribution
Recordkeeping/administrative
payment(percentage
of assets)
Note: In selecting the service provider(s) and deciding the cost sharing for the 401(k) plan, the employer/plan sponsor will determine which combinations of these fee arrangements will be used in the plan.
Source: ICI Fundamentals, “The Economics of Providing 401(k) Plans: Services, Fees, and Expenses, 2009”
FIGURE 7.12
401(k) Stock Mutual Fund Assets Are Concentrated in Lower-Cost Funds Percentage of 401(k) stock mutual fund assets, year-end 2009
≥1.501.00 to <1.500.50 to <1.00<0.50
27
49
20
4
Total expense ratio*
* The total expense ratio, which is reported as a percentage of fund assets, includes fund operating expenses and 12b-1 fee.
Note: Figures exclude mutual funds available as investment choices in variable annuities. Stock funds include hybrid funds.
Sources: Investment Company Institute and Lipper. See ICI Fundamentals, “The Economics of Providing 401(k) Plans: Services, Fees, and Expenses, 2009.”

112 2011 INVESTMENT COMPANY FACT BOOK
FIGURE 7.13
IRA AssetsBillions of dollars, year-end, selected years
201020092008200720062004200220001995
Securities held through brokerage accounts1
Life insurance companies2
Bank and thrift deposits3
Mutual funds
1,288464
482
81261
2,629
203
1,256
920
250
2,533
268
1,057
263
945
3,299
283
1,532
269
1,216
4,207p
318
2,036
313
1,541p
4,784p
327e
2,311
340
1,806p3,585e
316e
1,604
391
1,274e
4,251e
320e
1,974
431
1,526e
4,710e
337e
2,222
460
1,690e
1 Category excludes mutual fund assets held through brokerage accounts, which are included in mutual funds. 2 Life insurance company IRA assets are annuities held by IRAs, excluding variable annuity mutual fund IRA assets, which are
included in mutual funds.3 Bank and thrift deposits include Keogh deposits. e Data are estimated. p Data are preliminary.
Note: Components may not add to the total because of rounding.
Sources: Investment Company Institute, Federal Reserve Board, American Council of Life Insurers, and Internal Revenue Service Statistics of Income Division
Individual Retirement Accounts
IRAs were designed with two goals when they were created in 1974 under the Employee Retirement
Income Security Act (ERISA) First, they provide individuals not covered by workplace retirement
plans with an opportunity to save for retirement on their own Second, they allow workers who
are leaving jobs a means to preserve the tax benefits and growth opportunities that employer-
sponsored retirement plans provide
IRA assets accounted for 27 percent of U S retirement assets with $4 7 trillion at year-end
2010 (Figure 7 13) Mutual fund assets held in IRAs were $2 2 trillion at year-end 2010, an increase
of $248 billion, or 13 percent, from year-end 2009 Assets managed by mutual funds were
the largest component of IRA assets, followed by securities held through brokerage accounts
($1 7 trillion at year-end 2010) The mutual fund industry’s share of the IRA market was 47 percent
at year-end 2010, compared with 46 percent at year-end 2009

113RETIREMENT AND EDUCATION SAVINGS
Since 1990, assets in IRAs have grown primarily due to the investment performance of the
securities held in IRA portfolios and rollovers into traditional IRAs from employer-sponsored
retirement plans Although they represent only a small portion of the overall IRA market, assets
in two new types of IRAs—SIMPLE IRAs and Roth IRAs—have grown rapidly since they were
introduced in the late 1990s
IRA Investors
More than four out of 10 U S households, or 49 million, owned IRAs as of mid-2010 (Figure 7 14)
Traditional IRAs—defined as those IRAs first allowed under ERISA—were the most common type
of IRA, owned by 39 million U S households Roth IRAs, first made available in 1998 under the
Taxpayer Relief Act of 1997, were owned by 20 million U S households in mid-2010 Over 9 million
U S households owned employer-sponsored IRAs (SEP IRAs, SAR-SEP IRAs, or SIMPLE IRAs)
Although most U S households were eligible to make contributions to IRAs, few did so Only
15 percent of U S households contributed to any type of IRA in tax year 2009 In addition, very
few eligible households made “catch-up” contributions to traditional or Roth IRAs
FIGURE 7.14
49 Million U.S. Households Owned IRAsMay 2010
Year created
Number of U.S. households with type of IRA
Percentage of U.S. households with type of IRA
Traditional IRA1974
(Employee Retirement Income Security Act)
38.5 million 32.8%
SEP IRA 1978 (Revenue Act)
9.4 million 8.0%SAR-SEP IRA 1986
(Tax Reform Act)
SIMPLE IRA1996
(Small Business Job Protection Act)
Roth IRA 1997 (Taxpayer Relief Act)
19.5 million 16.6%
Any IRA 48.6 million 41.4%
Note: Households may own more than one type of IRA. SEP IRAs, SAR-SEP IRAs, and SIMPLE IRAs are employer-sponsored IRAs.
Sources: Investment Company Institute and U.S. Census Bureau. See ICI Fundamentals, “The Role of IRAs in U.S. Households’ Saving for Retirement, 2010.”

114 2011 INVESTMENT COMPANY FACT BOOK
FIGURE 7.15
Rollover Activity in The IRA Investor Database™Percentage of traditional IRA investors aged 25 to 74, 2008
11.3
With rollover in 2007 or 2008With rollover in 2008
20.8
Source: The IRA Investor Database™
FIGURE 7.16
Rollovers Are Often a Source of Assets for Traditional IRA InvestorsPercentage of households owning traditional IRAs, May 2010
55%Traditional IRA–owning householdshave made rollovers at some time
45%Traditional IRA–owning
households reported no rollovers
Source: ICI Fundamentals, “The Role of IRAs in U.S. Households’ Saving for Retirement, 2010”
Instead, investment returns and rollovers from employer-sponsored retirement plans have fueled
the growth of IRAs In any given year, a small portion of traditional IRA investors makes rollovers,
but analysis of The IRA Investor DatabaseTM finds that it is largely a different group that make
rollovers year-to-year For example, of investors with IRAs at year-end 2008, 21 percent had made
a rollover in 2007 or 2008, with 11 percent making a rollover in 2008, 11 percent in 2007, and only
1 percent in both years (Figure 7 15) The proportion of IRA owners that have ever made a rollover
is higher because typically different investors make rollovers each year Of U S households owning
traditional IRAs in May 2010, an ICI household survey found that 55 percent (or 21 million U S
households) had traditional IRAs that included rollover assets (Figure 7 16) In their most recent
rollover, the vast majority of these households (85 percent) transferred their entire retirement plan
balances into traditional IRAs

115RETIREMENT AND EDUCATION SAVINGS
Households owning IRAs generally are headed by middle-aged individuals (median age 51 years)
with moderate household incomes (median income $73,000) These households held a median
of $36,000 in IRAs In addition, many households held multiple types of IRAs For example,
32 percent of households with traditional IRAs also owned Roth IRAs, and 14 percent also
owned employer-sponsored IRAs
IRA owners are more likely to hold mutual funds, especially long-term mutual funds, in their
IRA portfolios than any other type of investment (Figure 7 17) Sixty-three percent of IRA-
owning households had IRA assets invested in mutual funds, with about three-quarters of these
households holding at least a portion of their balance in stock mutual funds Far fewer households
owned other types of investments in their IRAs: 36 percent held individual stocks, 28 percent held
annuities, and 25 percent held bank deposits
FIGURE 7.17
Households Invested Their IRAs in Many Types of AssetsPercentage of U.S. households owning IRAs, May 2010*
Mutual funds (total) 63
Stock mutual funds 48
Bond mutual funds 30
Hybrid mutual funds 26
Money market funds 27
Individual stocks 36
Annuities (total) 28
Fixed annuities 19
Variable annuities 19
Bank savings accounts, money market deposit accounts, or certificates of deposit 25
Individual bonds (not including U.S. savings bonds) 11
U.S. savings bonds 11
ETFs 8
Other 5
* Multiple responses are included.
Source: ICI Fundamentals, “Appendix: Additional Data on IRA Ownership in 2010”

116 2011 INVESTMENT COMPANY FACT BOOK
Distributions from IRAs
Of households with traditional IRAs in May 2010, 15 percent took withdrawals in tax year 2009
(Figure 7 18) The share of traditional IRA owners who took withdrawals was down substantially
from the previous year’s survey, which found that 19 percent took withdrawals in tax year 2008 The
lower withdrawal rate in part can be attributed to the temporary suspension of required minimum
distributions (RMDs) during the 2009 tax year An RMD is a distribution equal to a percentage of
the IRA account balance, with the percentage based on remaining life expectancy Traditional IRA
owners aged 70½ or older must withdraw the minimum amount each year or pay a penalty for
failing to do so Typically, withdrawals from traditional IRAs are taken to fulfill RMD requirements
For example, 64 percent of individuals who took withdrawals in tax year 2008 stated they did so
to meet the RMD requirements In fact, even though the rules were suspended in tax year 2009,
48 percent cited RMD requirements as the reason for their withdrawals
Withdrawals from traditional IRAs were typically modest: the median withdrawal in tax year 2009
was $7,500 and 39 percent of withdrawals totaled less than $5,000 (Figure 7 18) The median ratio
of withdrawals to account balance was 8 percent
FIGURE 7.18
Withdrawals from Traditional IRAs Are Infrequent
19%Less than $2,500
20%$2,500 to $4,999
Retired, did not take a withdrawal1
Retired, took a withdrawal1, 2
Not retired, took a withdrawal2
Not retired, did not take a withdrawal
24
114
61
15%$5,000 to $9,999
11%$10,000 to $14,999
29%$20,000 or more
6%$15,000 to $19,999
U.S. households with traditional IRAs in 2010Percent
Amount withdrawn in tax year 2009Percentage of traditional IRA–owning households that made withdrawals
Mean: $18,500Median: $7,500
1 The household was considered retired if either the head of household or spouse responded affirmatively to “are you retired from your lifetime occupation?”
2 Households that no longer owned traditional IRAs were not included.
Source: ICI Fundamentals, “The Role of IRAs in U.S. Households’ Saving for Retirement, 2010”

117RETIREMENT AND EDUCATION SAVINGS
Of the 15 percent of households who reported taking withdrawals in tax year 2009, 73 percent
reported that the head of household or the spouse or both were retired Of retired households
that took traditional IRA withdrawals in tax year 2009, 50 percent reported using some or all of
the funds to pay for living expenses (Figure 7 19) Other uses included reinvesting or saving the
withdrawal amount in another account (28 percent), using the withdrawal for a healthcare expense
(16 percent), and using the withdrawal for a home purchase, repair, or remodeling (14 percent)
Because current withdrawal activity may not be a good indicator of future withdrawal activity,
ICI also asked about plans for future traditional IRA withdrawals Among traditional IRA–owning
households in 2010 that did not take a withdrawal in tax-year 2009, 59 percent said that they were
not likely to take a withdrawal before age 70½ The top two expected future uses of traditional IRA
withdrawals were to pay for living expenses (mentioned by 67 percent of traditional IRA–owning
households in 2010 that did not take withdrawals in tax year 2009) and to pay for emergencies
(mentioned by 64 percent)
FIGURE 7.19
Traditional IRA Withdrawals Among Retirees Are Often Used to Pay for Living ExpensesPercentage of traditional IRA–owning households1 in which either the head of household or spouse is retired, May 2010
Use of traditional IRA withdrawal in retirement2
Took withdrawals to pay for living expenses 50
Spent it on a car, boat, or big-ticket item other than a home 6
Spent it on a healthcare expense 16
Used it for an emergency 9
Used it for home purchase, repair, or remodeling 14
Reinvested or saved it in another account 28
Paid for education 2
Some other use 11
1 The base of respondents includes the 11 percent of traditional IRA–owning households that were retired and took withdrawals reported in Figure 7.18.
2 Multiple responses are included.
Source: ICI Fundamentals, “The Role of IRAs in U.S. Households’ Saving for Retirement, 2010”

118 2011 INVESTMENT COMPANY FACT BOOK
The Role of Mutual Funds in Households’ Retirement Savings
At year-end 2010, mutual funds accounted for $4 7 trillion, or 27 percent, of the $17 5 trillion
U S retirement market The $4 7 trillion in mutual fund retirement assets represented
40 percent of all mutual fund assets at year-end 2010 Retirement savings accounts were a
significant portion of long-term mutual fund assets (48 percent), but were a relatively minor
share of money market fund assets (13 percent) Similarly, as a share of households’ mutual fund
holdings, mutual fund assets held in DC plans and IRAs represented 51 percent of household long-
term mutual funds, but only 19 percent of household money market funds (Figure 7 20)
Retirement assets invested in mutual funds primarily come from two sources: IRAs and employer-
sponsored DC plans, such as 401(k) plans Investors held slightly more mutual fund assets in DC
plans than they held in IRAs At year-end 2010, IRAs held $2 2 trillion in mutual fund assets, and
employer-sponsored DC plans had $2 5 trillion (Figure 7 21) Among DC plans, 401(k) plans were
the largest holder of mutual funds, with $1 8 trillion in assets At year-end 2010, 403(b) plans
held $365 billion in mutual fund assets, 457 plans held $75 billion, and other DC plans held
$223 billion
FIGURE 7.20
Households’ Mutual Fund Assets by Type of AccountBillions of dollars, year-end 2010
Other household accounts1
Variable annuities outside retirement accountsIRAsDC plans2
Households’ money market fundsHouseholds’ long-term mutual funds
3,137
976
2,016
2,321
51%
8,450
1,440
1,824
33 145206 19%
1 Mutual funds held as investments in 529 plans and Coverdell ESAs are counted in this category.2 DC plans include 401(k) plans, 403(b) plans, 457 plans, Keoghs, and other DC plans without 401(k) features.

119RETIREMENT AND EDUCATION SAVINGS
FIGURE 7.21
Bulk of Mutual Fund Retirement Account Assets Was Invested in EquitiesBillions of dollars, year-end 2010
Equity
Hybrid1 BondMoney market TotalDomestic Foreign
IRAs $942 $326 $372 $376 $206 $2,222
DC plans 1,132 349 506 334 145 2,466
401(k) plans 788 272 415 232 96 1,803
403(b) plans 222 35 52 35 22 365
457 plans 37 10 13 13 2 75
Other DC plans2 85 32 26 54 26 223
Total 2,074 675 878 710 351 4,687
1 Hybrid funds invest in a mix of equities and fixed-income securities. The bulk of target date and lifestyle funds is counted in this category.
2 Other DC plans include Keoghs and other DC plans without 401(k) features.
Note: Components may not add to the total because of rounding.
Types of Mutual Funds Used by Retirement Plan Investors
Fifty-nine percent of the $4 7 trillion in mutual fund retirement assets held in IRAs, 401(k)
plans, and other retirement accounts at year-end 2010 were invested in domestic or foreign equity
funds (Figure 7 21) By comparison, about 48 percent of overall fund industry assets—including
retirement and nonretirement accounts—were invested in domestic or foreign equity funds at
year-end 2010 Domestic equity funds alone constituted about $2 1 trillion, or 44 percent, of
mutual fund retirement assets
At year-end 2010, 23 percent of mutual fund retirement assets were invested in bond funds and
money market funds Bond funds held $710 billion, or 15 percent, of mutual fund retirement assets,
and money market funds accounted for $351 billion, or 7 percent The remaining $878 billion, or
approximately 19 percent, of mutual fund retirement assets were held in hybrid funds, which invest
in a mix of equity, bond, and money market securities

120 2011 INVESTMENT COMPANY FACT BOOK
Target Date and Lifestyle Mutual Funds
Target date and lifestyle mutual funds, generally included in the hybrid fund category, have grown
in popularity among investors and retirement plan sponsors over the past decade As previously
described, a target date fund follows a predetermined reallocation of assets over time based on
a specified target retirement date, and typically the fund rebalances its portfolio to become less
focused on growth and more focused on income as it approaches and passes the target date, which
is usually indicated in the fund’s name A lifestyle fund maintains a predetermined risk level and
generally uses words such as “conservative,” “moderate,” or “aggressive” in its name to indicate
the fund’s risk level Assets in target date and lifestyle mutual funds totaled $604 billion at the end
of 2010 (Figure 7 22), up from $487 billion at year-end 2009 Target date mutual funds’ assets were
up 33 percent in 2010, increasing from $256 billion to $340 billion Assets of lifestyle mutual
funds were up 14 percent in 2010, rising from $231 billion to $264 billion The bulk (91 percent)
of target date mutual fund assets was held in retirement accounts, compared with 43 percent
of lifestyle mutual fund assets
The Role of Mutual Funds in Households’ Education Savings
ICI research finds that 25 percent of households that owned mutual funds in 2010 cited education
as a financial goal for their fund investments Nevertheless, the demand for education savings
vehicles has been historically modest since their introduction in the 1990s, partly because of their
limited availability and investors’ lack of familiarity with them The enactment of the Economic
Growth and Tax Relief Reconciliation Act (EGTRRA) in 2001 enhanced the attractiveness of both
Section 529 plans and Coverdell Education Savings Accounts (ESAs)—two education savings
vehicles—by allowing greater contributions and flexibility in the plans The enactment of the
Pension Protection Act (PPA) in 2006 made permanent the EGTRRA enhancements to Section 529
plans The enactment of the Tax Relief, Unemployment Insurance Reauthorization, and Job Creation
Act of 2010 extended for two years the EGTRRA enhancements to Coverdell ESAs

121RETIREMENT AND EDUCATION SAVINGS
FIGURE 7.22
Target Date and Lifestyle Mutual Fund Assets by Account Type Billions of dollars, year-end, 2000–2010
20102009200820072006200520042003200220012000
20102009200820072006200520042003200220012000
21
Other investorsIRAsDC plans
Target date mutual funds1
Lifestyle mutual funds2
30
65
245
340
18
48
189
256
931
119
1601338
131
183
725
83
115
515
51
71
39
31
44
19
2652
1115
2212
911
96
151
55
58
264
132
48
51
231
98
37
41
176126
52
60
238
98
40
51
189
65
26
39
131
46
1524
85
20102656
13 714
3511 715
3312 612
31
1 A target date mutual fund typically rebalances its portfolio to become less focused on growth and more focused on income as it approaches and passes the target date of the fund, which is usually included in the fund’s name.
2 A lifestyle mutual fund maintains a predetermined risk level and generally contains “conservative,” “moderate,” or “aggressive” in the fund’s name.
Note: Components may not add to the total because of rounding.

122 2011 INVESTMENT COMPANY FACT BOOK
FIGURE 7.23
Section 529 Savings Plan AssetsBillions of dollars, year-end, 2000–2010
2.6 8.518.5
35.152.2
68.7
90.1
112.5
89.4
116.9
138.2
20102009200820072006200520042003200220012000
Note: Data were estimated for a few individual state observations in order to construct a continuous time series.
Sources: Investment Company Institute, College Savings Plans Network, College Savings Foundation, and Financial Research Corporation
Assets in Section 529 savings plans increased 18 percent in 2010, with $138 2 billion in assets at
the end of 2010, up from $116 9 billion at year-end 2009 (Figure 7 23) As of year-end 2010, the
number of accounts was 9 5 million, and the average account size was approximately $14,500
In 2010, as a group, households saving for college through 529 plans, Coverdell ESAs, or mutual
funds held outside of these accounts tended to be headed by younger individuals, with 57 percent
younger than 45 years of age (Figure 7 24) Heads of households saving for college had a range of
educational attainment: 49 percent had not completed college and 51 percent had college degrees
or higher education In addition, these households represented a range of incomes: 40 percent had
household income less than $75,000; 18 percent earned between $75,000 and $99,999; and
42 percent had household incomes of $100,000 or more Nearly 70 percent of these households
had children (younger than 18) in the home and 45 percent had more than one child in the home

123RETIREMENT AND EDUCATION SAVINGS
FIGURE 7.24
Characteristics of Households Saving for CollegePercentage of U.S. households saving for college,1 May 2010
Age of head of household2
Younger than 35 26
35 to 44 31
45 to 54 23
55 to 64 9
65 or older 11
Education level of head of household2
High school graduate or less 16
Associate’s degree or some college 33
Completed college 23
Some graduate school or completed graduate school 28
Household income3
Less than $25,000 6
$25,000 to $34,999 6
$35,000 to $49,999 10
$50,000 to $74,999 18
$75,000 to $99,999 18
$100,000 or more 42
Number of children in home4
None 31
One 24
Two 29
Three or more 16
1 Households saving for college are households that own education savings plans (Coverdell ESAs or 529 plans) or responded that paying for education was one of their financial goals for their mutual funds.
2 Head of household is the sole or co-decisionmaker for saving and investing. 3 Total reported is household income before taxes in 2009.4 The number of children reported is children younger than 18 living in the home.

124 2011 INVESTMENT COMPANY FACT BOOK
For More Information
» “The U S Retirement Market, Fourth Quarter 2010”
» “Who Gets Retirement Plans and Why: An Update,” ICI Research Perspective
» “The Role of IRAs in U S Households’ Saving for Retirement, 2010,” Investment Company
Institute Fundamentals
» The IRA Investor Profile: Traditional IRA Investors’ Rollover Activity, 2007 and 2008
» The IRA Investor Profile: Traditional IRA Investors’ Contribution Activity, 2007 and 2008
» “The Evolving Role of IRAs in U S Retirement Planning,” Investment Company Institute
Perspective
» Frequently Asked Questions About Individual Retirement Accounts
» Commitment to Retirement Security: Investor Attitudes and Actions
» “A Look at Private-Sector Retirement Plan Income After ERISA,” Investment Company
Institute Perspective
» “401(k) Plan Asset Allocation, Account Balances, and Loan Activity in 2009,” Investment
Company Institute Perspective
» “The Economics of 401(k) Plans: Services, Fees, and Expenses, 2009,” Investment Company
Institute Fundamentals
» Defined Contribution / 401(k) Fee Study: Inside the Structure of Defined Contribution/401(k)
Plan Fees: A Study Assessing the Mechanics of What Drives the “All-In” Fee
» ICI Resources on Target Retirement Date Funds
Available at www.ici.org.

Part Two
Data Tables

126 2011 INVESTMENT COMPANY FACT BOOK
Data Tables
Section 1U.S. Mutual Fund TotalsTable 1: Total Net Assets, Number of Funds, Number of Share Classes, and Number of Shareholder Accounts of the U.S. Mutual Fund Industry 128
2: Total Sales, New Sales, Exchange Sales, Redemptions, and Exchange Redemptions of the U.S. Mutual Fund Industry. 129
3: Total Net Assets of the U.S. Mutual Fund Industry 130
4: Total Net Assets of the U.S. Mutual Fund Industry by Investment Classification 131
5: Number of Funds of the U.S. Mutual Fund Industry 132
6: Number of Funds of the U.S. Mutual Fund Industry by Investment Classification 133
7: Number of Share Classes of the U.S. Mutual Fund Industry. 134
8: Number of Share Classes of the U.S. Mutual Fund Industry by Investment Classification 135
9: Number of Shareholder Accounts of the U.S. Mutual Fund Industry. 136
10: Number of Shareholder Accounts of the U.S. Mutual Fund Industry by Investment Classification 137
Section 2Closed-End Funds, Exchange-Traded Funds, and Unit Investment TrustsTable 11: Closed-End Funds: Total Net Assets and Proceeds from Issuance by Type of Fund 138
12: Closed-End Funds: Number of Funds by Type of Fund 139
13: Exchange-Traded Funds: Total Net Assets by Type of Fund 140
14: Exchange-Traded Funds: Number of Funds by Type of Fund 141
15: Exchange-Traded Funds: Net Issuance by Type of Fund 142
16: Unit Investment Trusts: Total Net Assets, Number of Trusts, and New Deposits by Type of Trust 143
Section 3U.S. Long-Term Mutual FundsTable 17: Liquid Assets and Liquidity Ratio of Long-Term Mutual Funds 144
18: Liquidity Ratio of Long-Term Mutual Funds by Investment Classification 145
19: Net New Cash Flow of Long-Term Mutual Funds 146
20: Net New Cash Flow and Components of Net New Cash Flow of Equity Mutual Funds 147
21: Net New Cash Flow and Components of Net New Cash Flow of Hybrid Mutual Funds 148
22: Net New Cash Flow and Components of Net New Cash Flow of Bond Mutual Funds 149
23: Net New Cash Flow of Long-Term Mutual Funds by Investment Classification 150
24: New Sales of Long-Term Mutual Funds by Investment Classification 151
25: Exchange Sales of Long-Term Mutual Funds by Investment Classification 152
26: Redemptions of Long-Term Mutual Funds by Investment Classification 153
27: Exchange Redemptions of Long-Term Mutual Funds by Investment Classification 154
28: Annual Redemption Rates of Long-Term Mutual Funds 155
29: Portfolio Holdings of Long-Term Mutual Funds and Share of Total Net Assets 156
30: Portfolio Holdings of Long-Term Mutual Funds as a Share of Total Net Assets by Type of Fund 157
31: Paid and Reinvested Dividends of Long-Term Mutual Funds by Type of Fund 158
32: Paid and Reinvested Capital Gains of Long-Term Mutual Funds by Type of Fund 159
33: Total Portfolio, Common Stock, and Other Securities: Purchases, Sales, and Net Purchases by Long-Term Mutual Funds 160
34: Total Portfolio, Common Stock, and Other Securities: Purchases, Sales, and Net Purchases by Equity Mutual Funds 161
35: Total Portfolio, Common Stock, and Other Securities: Purchases, Sales, and Net Purchases by Hybrid Mutual Funds 162
36: Total Portfolio, Common Stock, and Other Securities: Purchases, Sales, and Net Purchases by Bond Mutual Funds 163

127DATA TABLES
Section 4U.S. Money Market FundsTable 37: Total Net Assets and Number of Shareholder Accounts of Money Market Funds by Type of Fund 164
38: Number of Funds and Number of Share Classes of Money Market Funds by Type of Fund 165
39: Total Net Assets of Money Market Funds by Type of Fund 166
40: Net New Cash Flow of Money Market Funds by Type of Fund 167
41: Net New Cash Flow and Components of Net New Cash Flow of Money Market Funds 168
42: Paid and Reinvested Dividends of Money Market Funds by Type of Fund 169
43: Asset Composition of Taxable Government Money Market Funds as a Percentage of Total Net Assets 170
44: Asset Composition of Taxable Non-Government Money Market Funds as a Percentage of Total Net Assets 171
Section 5Additional Categories of U.S. Mutual FundsTable 45: Funds of Funds: Total Net Assets, Net New Cash Flow, Number of Funds, and Number of Share Classes 172
46: Funds of Funds: Components of Net New Cash Flow 173
47: Index Mutual Funds: Total Net Assets and Net New Cash Flow 174
48: Index Mutual Funds: Number of Funds and Number of Share Classes 175
49: Index Mutual Funds: New Sales and Exchange Sales 176
50: Index Mutual Funds: Redemptions and Exchange Redemptions 177
51: Lifestyle and Target Date Mutual Funds: Total Net Assets, Net New Cash Flow, Number of Funds, and Number of Share Classes 178
52: Lifestyle and Target Date Mutual Funds: Components of Net New Cash Flow 179
53: Retirement Mutual Funds: Total Net Assets, Net New Cash Flow, Number of Funds, and Number of Share Classes 180
54: Retirement Mutual Funds: Components of Net New Cash Flow 181
55: Variable Annuity Mutual Funds: Total Net Assets, Net New Cash Flow, and Number of Funds 182
56: Variable Annuity Mutual Funds: Components of Net New Cash Flow 183
Section 6Institutional Investors in the U.S. Mutual Fund IndustryTable 57: Total Net Assets of Mutual Funds Held in Individual and Institutional Accounts 184
58: Total Net Assets of Institutional Investors in Mutual Funds by Type of Institution and Type of Fund 185
59: Total Net Assets of Institutional Investors in Taxable Money Market Funds by Type of Institution and Type of Fund 186
Section 7Worldwide Mutual Fund TotalsTable 60: Worldwide Total Net Assets of Mutual Funds 187
61: Worldwide Number of Mutual Funds 188
62: Worldwide Net Sales of Mutual Funds 189

128 2011 INVESTMENT COMPANY FACT BOOK
Data
Sec
tion
1
TABLE 1Total Net Assets, Number of Funds, Number of Share Classes, and Number of Shareholder Accounts of the U.S. Mutual Fund IndustryYear-end
YearTotal net assets
Billions of dollars Number of fundsNumber of
share classesNumber of shareholder accounts*
Thousands
1940 $0.45 68 – 2961945 1.28 73 – 4981950 2.53 98 – 9391955 7.84 125 – 2,0851960 17.03 161 – 4,8981965 35.22 170 – 6,7091970 47.62 361 – 10,6901975 45.87 426 – 9,8761976 51.28 452 – 9,0601977 48.94 477 – 8,6931978 55.84 505 – 8,6581979 94.51 526 – 9,7901980 134.76 564 – 12,0881981 241.37 665 – 17,4991982 296.68 857 – 21,4481983 292.99 1,026 – 24,6051984 370.68 1,243 1,243 27,6361985 495.39 1,528 1,528 34,0981986 715.67 1,835 1,835 45,3741987 769.17 2,312 2,312 53,7171988 809.37 2,737 2,737 54,0561989 980.67 2,935 2,935 57,5601990 1,065.19 3,079 3,177 61,9481991 1,393.19 3,403 3,587 68,3321992 1,642.54 3,824 4,208 79,9311993 2,069.96 4,534 5,562 94,0151994 2,155.32 5,325 7,697 114,3831995 2,811.29 5,725 9,007 131,2191996 3,525.80 6,248 10,352 149,9331997 4,468.20 6,684 12,002 170,2991998 5,525.21 7,314 13,720 194,0291999 6,846.34 7,791 15,262 226,2122000 6,964.63 8,155 16,738 244,7052001 6,974.91 8,305 18,023 248,7012002 6,383.48 8,243 18,984 251,1232003 7,402.42 8,125 19,318 260,6982004 8,095.08 8,040 20,029 269,4682005 8,891.11 7,974 20,549 275,4792006 10,397.94 8,118 21,257 288,5962007 12,002.28 8,027 21,621 292,5902008 9,603.60 8,022 22,237 264,5992009 11,120.20 7,685 21,716 269,2242010 11,820.68 7,581 21,971 292,109
* Number of shareholder accounts includes a mix of individual and omnibus accounts. Note: Data for funds that invest primarily in other mutual funds were excluded from the series.

129U.S. MUTUAL FUND TOTALS
Data Section 1
TABLE 2Total Sales, New Sales, Exchange Sales, Redemptions, and Exchange Redemptions of the U.S. Mutual Fund IndustryBillions of dollars, annual
Year Total sales1 New sales Exchange sales2 RedemptionsExchange
redemptions3
1945 $0.29 – – $0.11 – 1950 0.52 – – 0.28 – 1955 1.21 – – 0.44 – 1960 2.10 – – 0.84 – 1965 4.36 $3.93 – 1.96 – 1970 4.63 3.84 – 2.99 – 1975 10.06 8.94 – 9.57 –1976 13.72 11.92 $1.52 16.41 $1.441977 17.07 14.75 2.24 16.69 2.311978 37.16 35.40 3.97 31.53 3.941979 119.32 115.66 5.83 86.74 5.891980 247.42 238.96 10.10 216.08 9.941981 472.13 452.42 14.44 362.44 14.591982 626.94 604.09 28.25 588.35 27.861983 547.77 532.04 35.67 565.83 36.031984 680.12 661.74 36.66 607.02 37.111985 953.85 933.37 46.55 864.88 46.841986 1,204.90 1,179.40 107.75 1,015.64 107.961987 1,251.19 1,220.27 205.68 1,178.75 207.351988 1,176.81 1,143.62 134.28 1,166.67 134.241989 1,444.84 1,401.21 130.66 1,327.05 131.951990 1,564.81 1,517.41 138.79 1,470.83 140.981991 2,037.64 1,990.53 155.75 1,879.69 154.311992 2,749.68 2,704.69 197.43 2,548.28 198.151993 3,187.49 3,137.76 248.79 2,904.44 253.951994 3,075.63 3,019.76 317.55 2,928.62 325.001995 3,600.62 3,526.00 351.53 3,314.86 351.081996 4,671.44 4,586.71 504.73 4,266.20 503.941997 5,801.23 5,704.83 613.44 5,324.29 618.491998 7,230.40 7,126.92 742.97 6,649.27 743.371999 9,043.58 8,922.96 949.96 8,562.10 947.362000 11,109.54 10,970.50 1,149.75 10,586.59 1,145.422001 12,866.21 12,747.53 797.34 12,242.32 798.082002 13,168.76 13,084.32 747.34 13,011.36 745.652003 12,393.72 12,315.54 572.50 12,361.83 573.762004 12,176.96 12,086.82 408.99 12,024.72 417.952005 13,939.25 13,812.42 420.83 13,546.66 432.432006 17,409.60 17,229.04 487.71 16,752.22 492.192007 23,471.88 23,237.64 606.46 22,353.77 611.962008 26,346.81 26,133.01 733.84 25,725.92 728.842009 20,681.89 20,530.39 529.96 20,681.38 528.122010 18,193.46 18,036.65 420.04 18,318.76 434.77
1 Total sales are the dollar value of new sales plus sales made through reinvestment of income dividends from existing accounts, but exclude reinvestment of capital gains distributions.
2 Exchange sales are the dollar value of mutual fund shares switched into funds within the same fund group.3 Exchange redemptions are the dollar value of mutual fund shares switched out of funds and into other funds in the same
fund group. Note: Data for funds that invest primarily in other mutual funds were excluded from the series.

130 2011 INVESTMENT COMPANY FACT BOOK
Data
Sec
tion
1
TABLE 3Total Net Assets of the U.S. Mutual Fund IndustryBillions of dollars, year-end
Year Total
Long-term fundsMoney market
fundsEquity funds Bond and income funds
1960 $17.03 $16.00 $1.02 – 1965 35.22 32.76 2.46 – 1970 47.62 45.13 2.49 – 1975 45.87 37.49 4.68 $3.701976 51.28 39.19 8.39 3.691977 48.94 34.07 10.98 3.891978 55.84 32.67 12.31 10.861979 94.51 35.88 13.10 45.531980 134.76 44.42 13.98 76.361981 241.37 41.19 14.01 186.161982 296.68 53.63 23.21 219.841983 292.99 76.97 36.63 179.39
Year Total
Long-term fundsMoney market
fundsEquity funds Hybrid funds Bond funds
1984 $370.68 $79.73 $11.15 $46.24 $233.551985 495.39 111.33 17.61 122.65 243.801986 715.67 154.45 25.76 243.31 292.151987 769.17 175.45 29.25 248.37 316.101988 809.37 189.38 26.35 255.69 337.951989 980.67 245.04 35.64 271.90 428.091990 1,065.19 239.48 36.12 291.25 498.341991 1,393.19 404.73 52.23 393.78 542.441992 1,642.54 514.09 78.04 504.21 546.191993 2,069.96 740.67 144.50 619.48 565.321994 2,155.32 852.76 164.40 527.15 611.001995 2,811.29 1,249.08 210.33 598.87 753.021996 3,525.80 1,726.01 252.58 645.41 901.811997 4,468.20 2,368.02 317.11 724.18 1,058.891998 5,525.21 2,977.94 365.00 830.59 1,351.681999 6,846.34 4,041.89 378.81 812.49 1,613.152000 6,964.63 3,961.92 346.28 811.19 1,845.252001 6,974.91 3,419.61 344.87 925.12 2,285.312002 6,383.48 2,664.01 323.95 1,130.45 2,265.082003 7,402.42 3,686.30 428.33 1,247.77 2,040.022004 8,095.08 4,386.67 516.60 1,290.48 1,901.342005 8,891.11 4,942.65 564.35 1,357.28 2,026.822006 10,397.94 5,914.10 650.31 1,495.07 2,338.452007 12,002.28 6,518.76 716.73 1,681.03 3,085.762008 9,603.60 3,705.55 498.28 1,567.54 3,832.242009 11,120.20 4,957.04 639.15 2,208.11 3,315.892010 11,820.68 5,667.40 741.07 2,608.29 2,803.92
Note: Data for funds that invest primarily in other mutual funds were excluded from the series.The data contain a series break beginning in 1984. All funds were reclassified in 1984, and a separate category was created for hybrid funds.Components may not add to the total because of rounding.

131U.S. MUTUAL FUND TOTALS
Data Section 1
TABL
E 4
Tota
l Net
Ass
ets o
f the
U.S
. Mut
ual F
und
Indu
stry
by
Inve
stm
ent C
lass
ifica
tion
Billi
ons
of d
olla
rs, y
ear-
end
Year
EQUI
TY F
UNDS
HYB
RID
FUN
DS
BON
D FU
NDS
MO
NEY
MAR
KET
FUN
DS
Capi
tal
appr
ecia
tion
W
orld
To
tal r
etur
n Co
rpor
ate
High
yie
ld
Wor
ld
Gove
rnm
ent
Stra
tegi
c in
com
eSt
ate
mun
i N
atio
nal
mun
i Ta
xabl
eTa
x-ex
empt
1986
$70.
53$1
5.47
$68.
45$2
5.76
$9.0
8$2
4.59
$0.5
2$1
22.0
6$1
1.37
$25.
81$4
9.86
$228
.35
$63.
8119
8779
.31
17.4
378
.71
29.2
59.
4724
.16
2.14
123.
1112
.53
27.7
949
.17
254.
6861
.42
1988
83.0
917
.98
88.3
126
.35
10.4
633
.43
3.02
111.
4010
.65
32.4
154
.32
272.
2065
.76
1989
107.
2323
.59
114.
2235
.64
11.6
828
.49
3.06
109.
6013
.41
41.2
164
.45
358.
6269
.47
1990
113.
3728
.30
97.8
136
.12
25.8
019
.15
13.0
210
4.43
8.61
49.5
570
.70
414.
5683
.78
1991
178.
7339
.52
186.
4852
.23
36.6
026
.33
27.7
113
4.24
14.7
065
.81
88.3
945
2.46
89.9
819
9223
5.06
45.6
823
3.34
78.0
448
.16
34.4
731
.02
172.
6821
.63
85.4
811
0.78
451.
3594
.84
1993
321.
1811
4.13
305.
3614
4.50
68.2
948
.97
32.9
118
8.67
26.0
511
3.59
141.
0146
1.88
103.
4419
9436
1.62
161.
1932
9.95
164.
4064
.78
45.0
823
.60
140.
4425
.95
104.
8212
2.49
501.
1110
9.89
1995
572.
3419
6.51
480.
2321
0.33
84.7
559
.70
24.8
314
3.00
33.3
011
7.30
135.
9963
1.32
121.
6919
9678
1.72
285.
2065
9.10
252.
5810
0.61
78.9
025
.74
130.
6356
.47
116.
9613
6.10
763.
9413
7.87
1997
1,07
5.27
346.
3794
6.39
317.
1111
9.35
104.
9125
.99
128.
8973
.15
126.
5414
5.35
901.
2315
7.66
1998
1,40
4.71
391.
641,
181.
5936
5.00
143.
5111
7.44
24.6
414
4.35
102.
0513
9.96
158.
631,
166.
9718
4.71
1999
2,11
5.06
585.
251,
341.
5837
8.81
157.
6811
6.90
22.9
413
8.58
104.
9012
7.89
143.
591,
413.
2519
9.90
2000
2,14
4.63
551.
761,
265.
5434
6.28
140.
6490
.28
19.9
413
3.34
149.
1513
2.72
145.
121,
611.
3823
3.87
2001
1,79
1.27
434.
881,
193.
4634
4.87
160.
9794
.28
19.0
716
4.24
191.
5514
0.99
154.
032,
026.
2325
9.08
2002
1,33
7.99
360.
7696
5.25
323.
9517
9.42
100.
4021
.08
233.
5026
7.53
154.
1417
4.38
1,98
8.78
276.
3020
031,
854.
9151
9.40
1,31
2.00
428.
3320
1.12
153.
9827
.19
219.
9431
1.42
150.
9418
3.16
1,74
9.73
290.
2920
042,
154.
5369
2.39
1,53
9.74
516.
6022
4.63
155.
9336
.35
205.
6434
0.21
145.
1018
2.62
1,58
9.34
312.
0020
052,
374.
9792
1.70
1,64
5.98
564.
3523
9.79
144.
1744
.72
201.
3738
8.47
148.
1419
0.61
1,69
0.45
336.
3720
062,
697.
781,
315.
251,
901.
0765
0.31
272.
1715
6.50
62.7
018
6.61
452.
2015
4.87
210.
031,
969.
4236
9.03
2007
2,88
8.80
1,66
8.20
1,96
1.76
716.
7329
9.78
156.
9788
.35
195.
0356
7.07
155.
6321
8.21
2,61
7.67
468.
0920
081,
648.
4586
6.44
1,19
0.65
498.
2824
6.08
111.
5888
.42
226.
1755
7.58
134.
8720
2.84
3,33
8.56
493.
6820
092,
214.
031,
273.
121,
469.
9063
9.15
357.
4218
7.55
125.
6727
1.10
809.
2315
8.96
298.
182,
916.
9639
8.94
2010
2,54
4.67
1,50
2.04
1,62
0.70
741.
0743
7.62
218.
6319
2.15
299.
3898
7.06
155.
8231
7.63
2,47
3.92
330.
01
Not
e: D
ata
for f
unds
that
inve
st p
rimar
ily in
oth
er m
utua
l fun
ds w
ere
excl
uded
from
the
serie
s.

132 2011 INVESTMENT COMPANY FACT BOOK
Data
Sec
tion
1
TABLE 5Number of Funds of the U.S. Mutual Fund Industry Year-end
Year Total
Long-term fundsMoney market
fundsEquity funds Bond and income funds
1970 361 323 38 – 1971 392 350 42 – 1972 410 364 46 – 1973 421 366 55 – 1974 431 343 73 151975 426 314 76 361976 452 302 102 481977 477 296 131 501978 505 294 150 611979 526 289 159 781980 564 288 170 1061981 665 306 180 1791982 857 340 199 3181983 1,026 396 257 373
Year Total
Long-term fundsMoney market
fundsEquity funds Hybrid funds Bond funds
1984 1,243 459 89 270 4251985 1,528 562 103 403 4601986 1,835 678 121 549 4871987 2,312 824 164 781 5431988 2,737 1,006 179 942 6101989 2,935 1,069 189 1,004 6731990 3,079 1,099 193 1,046 7411991 3,403 1,191 212 1,180 8201992 3,824 1,325 235 1,400 8641993 4,534 1,586 282 1,746 9201994 5,325 1,886 361 2,115 9631995 5,725 2,139 412 2,177 9971996 6,248 2,570 466 2,224 9881997 6,684 2,951 501 2,219 1,0131998 7,314 3,512 526 2,250 1,0261999 7,791 3,952 532 2,262 1,0452000 8,155 4,385 523 2,208 1,0392001 8,305 4,717 482 2,091 1,0152002 8,243 4,748 472 2,035 9882003 8,125 4,600 507 2,045 9732004 8,040 4,547 509 2,042 9422005 7,974 4,586 504 2,014 8702006 8,118 4,769 507 1,995 8472007 8,027 4,764 488 1,970 8052008 8,022 4,827 492 1,920 7832009 7,685 4,653 471 1,857 7042010 7,581 4,585 478 1,866 652
Note: Data for funds that invest primarily in other mutual funds were excluded from the series. The data contain a series break beginning in 1984. All funds were reclassified in 1984, and a separate category was created for hybrid funds.

133U.S. MUTUAL FUND TOTALS
Data Section 1
TABL
E 6
Num
ber o
f Fun
ds o
f the
U.S
. Mut
ual F
und
Indu
stry
by
Inve
stm
ent C
lass
ifica
tion
Year
-end
Year
EQUI
TY F
UNDS
HYB
RID
FUN
DS
BON
D FU
NDS
MO
NEY
MAR
KET
FUN
DS
Capi
tal
appr
ecia
tion
W
orld
To
tal r
etur
n Co
rpor
ate
High
yie
ld
Wor
ld
Gove
rnm
ent
Stra
tegi
c in
com
eSt
ate
mun
i N
atio
nal
mun
i Ta
xabl
eTa
x-ex
empt
1986
439
5718
212
135
574
139
6712
212
536
012
719
8751
481
229
164
4270
1620
186
217
149
389
154
1988
578
109
319
179
5810
328
248
8524
517
543
317
719
8959
712
834
418
959
105
3026
610
126
018
347
020
319
9062
115
532
319
312
010
641
252
6427
219
150
523
619
9164
520
634
021
214
495
6128
176
331
192
552
268
1992
717
239
369
235
183
8989
335
7641
421
458
527
919
9385
030
643
028
225
190
115
405
8953
126
562
729
319
9499
442
346
936
130
495
138
457
109
707
305
649
314
1995
1,11
052
850
141
235
810
415
942
911
671
030
167
632
119
961,
325
668
577
466
386
119
173
422
143
686
295
669
319
1997
1,53
876
864
550
137
213
418
640
718
764
928
468
532
819
981,
894
890
728
526
350
183
188
395
234
615
285
687
339
1999
2,20
895
079
453
233
620
817
537
428
260
528
270
434
120
002,
541
1,00
683
852
330
521
414
435
132
659
427
470
433
520
012,
852
1,01
585
048
229
321
113
132
032
355
625
769
032
520
022,
955
947
846
472
298
200
116
314
338
519
250
677
311
2003
2,93
086
380
750
729
119
910
531
535
752
725
166
031
320
042,
934
820
793
509
301
199
106
313
357
516
250
637
305
2005
2,96
883
977
950
429
420
810
530
736
150
123
859
327
720
063,
068
915
786
507
289
208
114
309
364
481
230
573
274
2007
3,01
798
076
748
829
220
712
430
137
244
922
554
526
020
083,
018
1,06
074
949
228
119
613
129
438
141
722
053
424
920
092,
822
1,11
571
647
127
518
713
529
736
637
821
947
622
820
102,
750
1,14
369
247
827
718
715
529
137
536
122
044
221
0
Not
e: D
ata
for f
unds
that
inve
st p
rimar
ily in
oth
er m
utua
l fun
ds w
ere
excl
uded
from
the
serie
s.

134 2011 INVESTMENT COMPANY FACT BOOK
Data
Sec
tion
1
TABLE 7Number of Share Classes of the U.S. Mutual Fund IndustryYear-end
Year Total Equity funds Hybrid funds Bond fundsMoney market
funds
1986 1,835 678 121 549 4871987 2,312 824 164 781 5431988 2,737 1,006 179 942 6101989 2,935 1,069 189 1,004 6731990 3,177 1,128 200 1,087 7621991 3,587 1,248 224 1,244 8711992 4,208 1,452 258 1,584 9141993 5,562 1,945 349 2,259 1,0091994 7,697 2,656 517 3,263 1,2611995 9,007 3,287 637 3,703 1,3801996 10,352 4,211 753 3,935 1,4531997 12,002 5,309 877 4,267 1,5491998 13,720 6,642 968 4,483 1,6271999 15,262 7,785 1,031 4,716 1,7302000 16,738 9,079 1,024 4,780 1,8552001 18,023 10,326 996 4,753 1,9482002 18,984 11,005 1,043 4,930 2,0062003 19,318 10,956 1,172 5,159 2,0312004 20,029 11,398 1,271 5,314 2,0462005 20,549 11,824 1,371 5,323 2,0312006 21,257 12,509 1,355 5,381 2,0122007 21,621 12,827 1,338 5,438 2,0182008 22,237 13,391 1,382 5,476 1,9882009 21,716 13,095 1,350 5,422 1,8492010 21,971 13,130 1,422 5,636 1,783
Note: Data for funds that invest primarily in other mutual funds were excluded from the series.

135U.S. MUTUAL FUND TOTALS
Data Section 1
TABL
E 8
Num
ber o
f Sha
re C
lass
es o
f the
U.S
. Mut
ual F
und
Indu
stry
by
Inve
stm
ent C
lass
ifica
tion
Year
-end
Year
EQUI
TY F
UNDS
HYB
RID
FUN
DS
BON
D FU
NDS
MO
NEY
MAR
KET
FUN
DS
Capi
tal
appr
ecia
tion
W
orld
To
tal r
etur
n Co
rpor
ate
High
yie
ld
Wor
ld
Gove
rnm
ent
Stra
tegi
c in
com
eSt
ate
mun
i N
atio
nal
mun
i Ta
xabl
eTa
x-ex
empt
1986
439
5718
212
135
574
139
6712
212
536
012
719
8751
481
229
164
4270
1620
186
217
149
389
154
1988
578
109
319
179
5810
328
248
8524
517
543
317
719
8959
712
834
418
959
105
3026
610
126
018
347
020
319
9063
216
633
020
012
110
945
258
6429
119
952
224
019
9166
622
735
522
414
610
070
293
7735
220
659
128
019
9278
526
340
425
820
110
011
138
282
466
242
616
298
1993
1,03
338
552
734
930
711
515
252
210
970
834
667
233
719
941,
362
630
664
517
434
135
205
679
150
1,18
747
385
840
319
951,
660
845
782
637
557
172
248
697
167
1,34
152
195
342
719
962,
099
1,15
595
775
363
720
228
971
120
71,
352
537
1,00
544
819
972,
704
1,44
91,
156
877
647
264
335
743
300
1,41
556
31,
075
474
1998
3,46
41,
770
1,40
896
864
837
834
876
239
21,
365
590
1,13
749
019
994,
231
1,96
91,
585
1,03
166
945
233
476
050
31,
380
618
1,23
050
020
005,
163
2,20
71,
709
1,02
465
547
928
773
160
11,
407
620
1,33
152
420
016,
155
2,37
51,
796
996
682
491
271
698
655
1,34
261
41,
405
543
2002
6,75
72,
342
1,90
61,
043
729
498
270
732
763
1,29
764
11,
463
543
2003
6,82
32,
199
1,93
41,
172
753
507
254
766
842
1,34
469
31,
462
569
2004
7,21
82,
177
2,00
31,
271
801
528
260
797
881
1,34
070
71,
470
576
2005
7,50
52,
287
2,03
21,
371
809
557
268
794
906
1,31
467
51,
464
567
2006
7,90
22,
555
2,05
21,
355
837
567
299
796
947
1,26
866
71,
454
558
2007
7,94
12,
808
2,07
81,
338
871
597
337
783
963
1,22
366
41,
448
570
2008
8,11
23,
166
2,11
31,
382
890
589
387
782
1,00
21,
157
669
1,44
554
320
097,
682
3,37
32,
040
1,35
086
857
242
680
31,
003
1,07
167
91,
332
517
2010
7,56
33,
551
2,01
61,
422
892
594
513
828
1,04
21,
064
703
1,28
350
0
Not
e: D
ata
for f
unds
that
inve
st p
rimar
ily in
oth
er m
utua
l fun
ds w
ere
excl
uded
from
the
serie
s.

136 2011 INVESTMENT COMPANY FACT BOOK
Data
Sec
tion
1
TABLE 9Number of Shareholder Accounts* of the U.S. Mutual Fund IndustryThousands, year-end
Year Total
Long-term fundsMoney market
fundsEquity funds Hybrid funds Bond funds
1986 45,374 15,509 2,101 11,450 16,3131987 53,717 20,371 2,732 12,939 17,6751988 54,056 19,658 2,575 13,253 18,5701989 57,560 20,348 2,727 13,170 21,3141990 61,948 22,157 3,203 13,619 22,9691991 68,332 25,648 3,620 15,509 23,5561992 79,931 32,730 4,532 19,023 23,6471993 94,015 42,554 6,741 21,135 23,5851994 114,383 57,948 10,251 20,806 25,3791995 131,219 69,340 10,926 20,816 30,1371996 149,933 85,301 12,026 20,406 32,2001997 170,299 101,679 12,856 20,140 35,6241998 194,029 119,557 14,138 21,486 38,8471999 226,212 147,391 14,252 20,953 43,6162000 244,705 163,948 13,066 19,553 48,1382001 248,701 165,649 14,257 21,560 47,2362002 251,123 164,295 15,579 25,869 45,3802003 260,698 174,060 17,672 27,752 41,2142004 269,468 183,241 20,004 28,587 37,6362005 275,479 187,990 21,206 29,446 36,8372006 288,596 200,020 21,967 29,541 37,0672007 292,590 201,293 22,338 29,830 39,1302008 264,599 175,634 20,753 30,100 38,1112009 269,224 177,511 21,610 36,637 33,4662010 292,109 188,858 22,828 49,816 30,606
* Number of shareholder accounts includes a mix of individual and omnibus accounts. Note: Data for funds that invest primarily in other mutual funds were excluded from the series. Components may not add to the total because of rounding.

137U.S. MUTUAL FUND TOTALS
Data Section 1
TABL
E 10
Num
ber o
f Sha
reho
lder
Acc
ount
s* o
f the
U.S
. Mut
ual F
und
Indu
stry
by
Inve
stm
ent C
lass
ifica
tion
Thou
sand
s, y
ear-
end
Year
EQUI
TY F
UNDS
HYBR
ID
FUN
DS
BON
D FU
NDS
MO
NEY
MAR
KET
FUN
DS
Capi
tal
appr
ecia
tion
W
orld
To
tal r
etur
n Co
rpor
ate
High
yie
ld
Wor
ld
Gove
rnm
ent
Stra
tegi
c in
com
eSt
ate
mun
i N
atio
nal
mun
iTa
xabl
eTa
x-ex
empt
1986
8,24
01,
631
5,63
82,
101
659
1,74
447
5,98
560
372
21,
691
15,6
5466
019
8710
,557
2,17
17,
644
2,73
270
81,
974
156
6,66
669
487
41,
866
16,8
3384
219
8810
,312
2,03
47,
312
2,57
577
22,
488
255
6,29
350
81,
000
1,93
817
,631
939
1989
10,1
722,
062
8,11
42,
727
810
2,40
923
75,
847
584
1,14
72,
138
20,1
731,
141
1990
11,4
273,
077
7,65
33,
203
1,38
92,
204
680
5,39
431
01,
323
2,31
821
,578
1,39
119
9113
,628
3,47
88,
542
3,62
01,
678
1,99
21,
306
5,84
643
21,
631
2,62
421
,863
1,69
319
9217
,842
4,20
310
,685
4,53
22,
073
2,04
11,
725
7,18
179
92,
163
3,04
121
,771
1,87
619
9322
,003
7,12
213
,430
6,74
12,
463
2,37
31,
878
7,22
697
72,
579
3,63
921
,587
1,99
919
9428
,407
12,1
6217
,379
10,2
512,
849
2,44
01,
435
6,35
91,
010
3,23
23,
482
23,3
422,
037
1995
35,7
5813
,195
20,3
8710
,926
3,16
02,
816
1,28
36,
395
1,13
22,
621
3,40
927
,866
2,27
119
9644
,731
15,6
5124
,919
12,0
263,
632
3,18
91,
214
5,55
91,
152
2,47
33,
187
29,9
292,
271
1997
53,1
0117
,912
30,6
6612
,856
3,72
23,
756
1,11
64,
918
1,34
42,
289
2,99
532
,986
2,63
819
9863
,288
18,5
1537
,754
14,1
384,
333
4,16
884
44,
984
1,65
12,
487
3,02
036
,461
2,38
619
9983
,170
21,8
3342
,388
14,2
524,
760
4,11
078
34,
871
1,44
82,
228
2,75
441
,187
2,42
820
0099
,310
23,5
1441
,124
13,0
663,
892
3,53
265
74,
539
2,24
02,
120
2,57
345
,489
2,64
920
0199
,381
22,6
2843
,639
14,2
574,
813
3,60
563
25,
120
2,82
22,
044
2,52
444
,425
2,81
120
0297
,939
22,3
6543
,991
15,5
795,
523
3,81
871
36,
360
4,75
92,
060
2,63
642
,725
2,65
520
0310
2,13
524
,341
47,5
8517
,672
5,52
94,
783
897
6,18
65,
957
1,84
12,
559
38,4
112,
803
2004
103,
812
29,5
1049
,919
20,0
045,
966
4,78
41,
038
5,89
16,
677
1,74
42,
487
34,7
932,
843
2005
101,
856
35,5
5050
,584
21,2
066,
369
4,62
61,
355
5,43
87,
468
1,71
32,
476
34,0
312,
806
2006
103,
710
44,5
9151
,720
21,9
676,
184
4,70
01,
742
4,55
28,
197
1,64
72,
519
34,0
043,
063
2007
100,
787
49,8
6250
,643
22,3
385,
936
4,71
12,
140
4,07
28,
930
1,57
52,
466
35,6
613,
469
2008
85,9
9644
,071
45,5
6820
,753
5,17
54,
106
2,54
94,
894
9,63
11,
375
2,37
034
,497
3,61
420
0986
,580
47,2
0043
,731
21,6
106,
840
4,80
23,
256
5,17
212
,361
1,42
42,
784
30,3
003,
166
2010
91,3
7851
,610
45,8
7022
,828
11,6
536,
334
4,54
95,
892
16,7
491,
490
3,14
927
,435
3,17
1
* Num
ber o
f sha
reho
lder
acc
ount
s in
clud
es a
mix
of i
ndiv
idua
l and
om
nibu
s ac
coun
ts.
Not
e: D
ata
for f
unds
that
inve
st p
rimar
ily in
oth
er m
utua
l fun
ds w
ere
excl
uded
from
the
serie
s.

138 2011 INVESTMENT COMPANY FACT BOOK
Data
Sec
tion
2
TABLE 11Closed-End Funds: Total Net Assets and Proceeds from Issuance by Type of FundMillions of dollars
Year Total
Equity funds Bond funds
Total equity Domestic
Global/ International
Total bond
Domestic taxable
Domestic municipal
Global/ International
Total net assetsYear-end
1990 $59,106 $16,634 $10,791 $5,843 $42,472 $16,820 $16,482 $9,1701991 76,164 19,296 13,109 6,187 56,868 19,403 29,519 7,9471992 100,666 21,766 14,581 7,185 78,900 24,632 45,593 8,6741993 131,520 28,010 15,462 12,548 103,510 30,909 60,100 12,5011994 130,675 37,611 16,018 21,594 93,063 26,604 56,035 10,4251995 142,619 41,926 18,078 23,848 100,694 28,678 60,318 11,6981996 146,991 46,987 19,830 27,157 100,004 28,418 59,540 12,0461997 151,845 49,625 20,536 29,089 102,220 28,315 61,992 11,9121998 155,814 47,606 22,529 25,077 108,208 34,127 63,628 10,4541999 147,016 41,267 24,696 16,571 105,749 30,888 64,513 10,3482000 143,134 36,611 24,557 12,054 106,523 28,581 68,266 9,6762001 141,251 31,075 22,261 8,814 110,176 26,606 74,467 9,1022002 158,805 33,724 26,596 7,128 125,081 25,643 90,024 9,4142003 214,088 53,019 42,987 10,032 161,069 55,428 94,102 11,5392004 254,296 82,327 63,762 18,565 171,969 64,230 94,884 12,8552005 277,017 105,588 77,124 28,464 171,430 64,119 94,606 12,7052006 298,328 122,477 87,772 34,705 175,851 68,051 94,569 13,2312007 313,099 146,174 87,569 58,604 166,926 62,281 88,963 15,6822008 185,983 74,288 45,777 28,511 111,695 32,997 67,807 10,8912009 225,000 90,086 52,309 37,777 134,914 43,189 78,065 13,6602010 240,782 100,803 59,600 41,203 139,979 48,481 76,551 14,947
Proceeds from issuance* Annual
2002 $24,911 $9,210 $9,191 $18 $15,701 $2,309 $13,392 $0 2003 40,963 11,349 11,187 161 29,614 25,587 2,995 1,0322004 27,867 21,225 15,424 5,801 6,642 5,608 5 1,0282005 21,266 19,187 12,559 6,628 2,080 1,924 31 1242006 12,333 10,275 7,692 2,583 2,057 1,528 196 3342007 31,193 25,844 5,973 19,871 5,349 2,221 433 2,6952008 330 208 8 200 121 121 0 0 2009 3,900 1,652 476 1,176 2,248 876 1,055 3172010 8,291 3,643 3,628 13 4,648 2,323 1,968 358
* Data are not available for years prior to 2002. The data include proceeds from the issuance of initial and additional public offerings of closed-end fund shares.
Note: Components may not add to the total because of rounding.

Data Section 2
139CLOSED-END FUNDS, EXCHANGE-TRADED FUNDS, AND UNIT INVESTMENT TRUSTS
TABLE 12Closed-End Funds: Number of Funds by Type of FundYear-end
Year Total
Equity funds Bond funds
Total equity Domestic
Global/ International
Total bond
Domestic taxable
Domestic municipal
Global/ International
1990 249 93 41 52 156 85 53 181991 281 93 40 53 188 86 87 151992 373 105 43 62 268 99 149 201993 495 119 48 71 376 120 227 291994 511 137 50 87 374 123 219 321995 500 141 49 92 359 119 207 331996 497 142 50 92 355 118 205 321997 487 135 45 90 352 115 205 321998 492 128 44 84 364 123 211 301999 512 124 49 75 388 117 241 302000 482 123 53 70 359 109 220 302001 492 116 51 65 376 109 240 272002 545 123 63 60 422 105 292 252003 584 131 75 56 453 129 297 272004 619 158 96 62 461 136 295 302005 635 193 121 72 442 131 280 312006 647 204 129 75 443 134 276 332007 664 230 137 93 434 131 269 342008 643 222 128 94 421 128 260 332009 628 209 117 92 419 127 260 322010 624 204 116 88 420 130 258 32
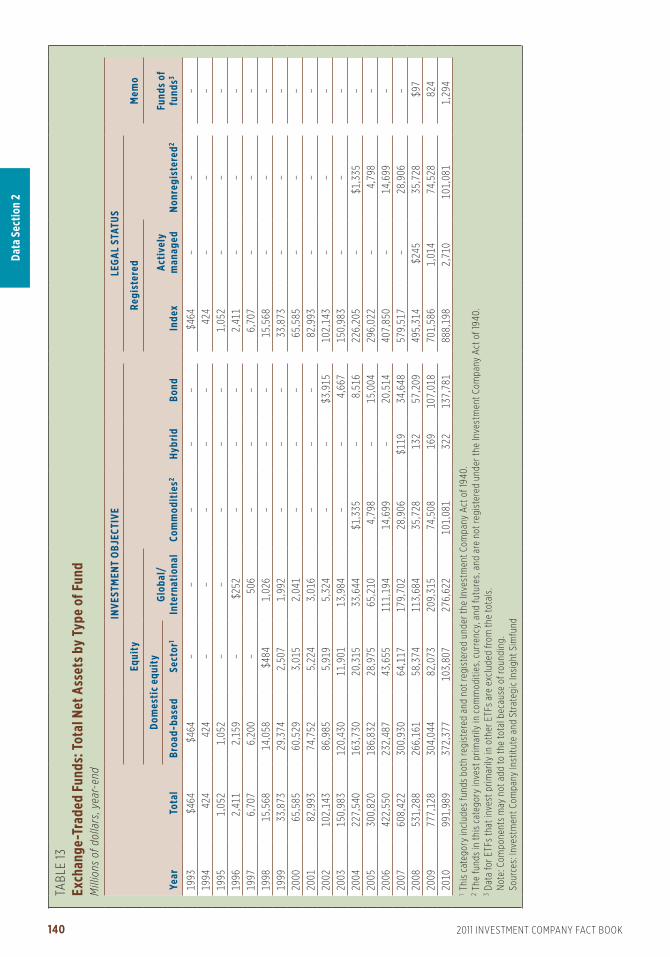
140 2011 INVESTMENT COMPANY FACT BOOK
Data
Sec
tion
2
TABL
E 13
Exch
ange
-Tra
ded
Fund
s: T
otal
Net
Ass
ets b
y Ty
pe o
f Fun
dM
illio
ns o
f dol
lars
, yea
r-en
d
Year
Tota
l
INVE
STM
ENT
OBJ
ECTI
VELE
GAL
STAT
US
Mem
oEq
uity
Com
mod
itie
s2Hy
brid
Bond
Regi
ster
ed
Non
regi
ster
ed2
Dom
esti
c eq
uity
Glob
al/
Inte
rnat
iona
l In
dex
Acti
vely
m
anag
edFu
nds
of
fund
s3Br
oad-
base
dSe
ctor
1
1993
$464
$464
– –
– –
– $4
64–
– –
1994
424
424
– –
– –
– 42
4–
– –
1995
1,05
21,
052
– –
– –
– 1,
052
– –
– 19
962,
411
2,15
9–
$252
– –
– 2,
411
– –
– 19
976,
707
6,20
0–
506
– –
– 6,
707
– –
– 19
9815
,568
14,0
58$4
841,
026
– –
– 15
,568
– –
– 19
9933
,873
29,3
742,
507
1,99
2–
– –
33,8
73–
– –
2000
65,5
8560
,529
3,01
52,
041
– –
– 65
,585
– –
– 20
0182
,993
74,7
525,
224
3,01
6–
– –
82,9
93–
– –
2002
102,
143
86,9
855,
919
5,32
4–
– $3
,915
102,
143
– –
– 20
0315
0,98
312
0,43
011
,901
13,9
84–
– 4,
667
150,
983
– –
– 20
0422
7,54
016
3,73
020
,315
33,6
44$1
,335
– 8,
516
226,
205
– $1
,335
– 20
0530
0,82
018
6,83
228
,975
65,2
104,
798
– 15
,004
296,
022
– 4,
798
– 20
0642
2,55
023
2,48
743
,655
111,
194
14,6
99–
20,5
1440
7,85
0–
14,6
99–
2007
608,
422
300,
930
64,1
1717
9,70
228
,906
$119
34,6
4857
9,51
7–
28,9
06–
2008
531,
288
266,
161
58,3
7411
3,68
435
,728
132
57,2
0949
5,31
4$2
4535
,728
$97
2009
777,
128
304,
044
82,0
7320
9,31
574
,508
169
107,
018
701,
586
1,01
474
,528
824
2010
991,
989
372,
377
103,
807
276,
622
101,
081
322
137,
781
888,
198
2,71
010
1,08
11,
294
1 Th
is c
ateg
ory
incl
udes
fund
s bo
th re
gist
ered
and
not
regi
ster
ed u
nder
the
Inve
stm
ent C
ompa
ny A
ct o
f 194
0.2
The
fund
s in
this
cat
egor
y in
vest
prim
arily
in c
omm
oditi
es, c
urre
ncy,
and
futu
res,
and
are
not
regi
ster
ed u
nder
the
Inve
stm
ent C
ompa
ny A
ct o
f 194
0.3
Dat
a fo
r ETF
s th
at in
vest
prim
arily
in o
ther
ETF
s ar
e ex
clud
ed fr
om th
e to
tals
. N
ote:
Com
pone
nts
may
not
add
to th
e to
tal b
ecau
se o
f rou
ndin
g. S
ourc
es: I
nves
tmen
t Com
pany
Inst
itute
and
Str
ateg
ic In
sigh
t Sim
fund

Data Section 2
141CLOSED-END FUNDS, EXCHANGE-TRADED FUNDS, AND UNIT INVESTMENT TRUSTS
TABL
E 14
Exch
ange
-Tra
ded
Fund
s: N
umbe
r of F
unds
by
Type
of F
und
Year
–end
Year
Tota
l
INVE
STM
ENT
OBJ
ECTI
VELE
GAL
STAT
US
Mem
oEq
uity
Com
mod
itie
s2Hy
brid
Bond
Regi
ster
ed
Non
regi
ster
ed2
Dom
esti
c eq
uity
Glob
al/
Inte
rnat
iona
l In
dex
Acti
vely
m
anag
edFu
nds
of
fund
s3Br
oad–
base
dSe
ctor
1
1993
11
–
–
–
–
–
1 –
–
–
19
941
1 –
–
–
–
–
1
–
–
–
1995
22
–
–
–
–
–
2 –
–
–
19
9619
2 –
17
–
–
–
19 –
–
–
19
9719
2 –
17
–
–
–
19 –
–
–
19
9829
39
17 –
–
–
29
–
–
–
1999
304
917
–
–
–
30 –
–
–
20
0080
2926
25 –
–
–
80
–
–
–
2001
102
3434
34 –
–
–
10
2 –
–
–
20
0211
334
3239
–
–
811
3 –
–
–
20
0311
939
3341
–
–
611
9 –
–
–
20
0415
260
4243
1 –
6
151
–
1 –
20
0520
481
6549
3 –
6
201
–
3 –
20
0635
913
311
985
16 –
6
343
–
16 –
20
0762
919
719
115
928
549
601
–
28 –
20
0872
820
418
622
545
662
670
1345
1520
0979
722
218
124
447
598
727
2149
2320
1092
324
319
329
855
612
884
424
5527
1 Th
is c
ateg
ory
incl
udes
fund
s bo
th re
gist
ered
and
not
regi
ster
ed u
nder
the
Inve
stm
ent C
ompa
ny A
ct o
f 194
0.2
The
fund
s in
this
cat
egor
y in
vest
prim
arily
in c
omm
oditi
es, c
urre
ncy,
and
futu
res,
and
are
not
regi
ster
ed u
nder
the
Inve
stm
ent C
ompa
ny A
ct o
f 194
0.3
Dat
a fo
r ETF
s th
at in
vest
prim
arily
in o
ther
ETF
s ar
e ex
clud
ed fr
om th
e to
tals
. S
ourc
es: I
nves
tmen
t Com
pany
Inst
itute
and
Str
ateg
ic In
sigh
t Sim
fund

142 2011 INVESTMENT COMPANY FACT BOOK
Data
Sec
tion
2
TABL
E 15
Exch
ange
-Tra
ded
Fund
s: N
et Is
suan
ce b
y Ty
pe o
f Fun
d
M
illio
ns o
f dol
lars
, ann
ual
Year
Tota
l
INVE
STM
ENT
OBJ
ECTI
VELE
GAL
STAT
US
Mem
oEq
uity
Com
mod
itie
s2Hy
brid
Bond
Regi
ster
ed
Non
regi
ster
ed2
Dom
esti
c eq
uity
Glob
al/
Inte
rnat
iona
l In
dex
Acti
vely
m
anag
edFu
nds
of
fund
s3Br
oad–
base
dSe
ctor
1
1993
$442
$442
– –
– –
– $4
42–
– –
1994
-28
-28
– –
– –
– -2
8–
– –
1995
443
443
– –
– –
– 44
3–
– –
1996
1,10
884
2–
$266
– –
– 1,
108
– –
– 19
973,
466
3,16
0–
306
– –
– 3,
466
– –
– 19
986,
195
5,15
8$4
8455
3–
– –
6,19
5–
– –
1999
11,9
2910
,221
1,59
611
2–
– –
11,9
29–
– –
2000
42,5
0840
,591
1,03
388
4–
– –
42,5
08–
– –
2001
31,0
1226
,911
2,73
51,
366
– –
– 31
,012
– –
– 20
0245
,302
35,4
772,
304
3,79
2–
– $3
,729
45,3
02–
– –
2003
15,8
105,
737
3,58
75,
764
– –
721
15,8
10–
– –
2004
56,3
7529
,084
6,51
415
,645
$1,3
53–
3,77
855
,021
– $1
,353
– 20
0556
,729
16,9
416,
719
23,4
552,
859
– 6,
756
53,8
71–
2,85
9–
2006
73,9
9521
,589
9,78
028
,423
8,47
5–
5,72
965
,520
– 8,
475
– 20
0715
0,61
761
,152
18,1
2248
,842
9,06
2$1
2213
,318
141,
555
– 9,
062
– 20
0817
7,22
088
,105
30,2
9625
,243
10,5
6758
22,9
5216
6,37
2$2
8110
,567
$107
2009
116,
469
-11,
842
14,3
5039
,599
28,3
8815
45,9
5887
,336
724
28,4
1023
720
1011
7,97
828
,317
10,1
6741
,523
8,17
514
429
,652
108,
137
1,68
68,
155
433
1 Th
is c
ateg
ory
incl
udes
fund
s bo
th re
gist
ered
and
not
regi
ster
ed u
nder
the
Inve
stm
ent C
ompa
ny A
ct o
f 194
0.2
The
fund
s in
this
cat
egor
y in
vest
prim
arily
in c
omm
oditi
es, c
urre
ncy,
and
futu
res,
and
are
not
regi
ster
ed u
nder
the
Inve
stm
ent C
ompa
ny A
ct o
f 194
0.3
Dat
a fo
r ETF
s th
at in
vest
prim
arily
in o
ther
ETF
s ar
e ex
clud
ed fr
om th
e to
tals
. N
ote:
Com
pone
nts
may
not
add
to th
e to
tal b
ecau
se o
f rou
ndin
g. S
ourc
es: I
nves
tmen
t Com
pany
Inst
itute
and
Str
ateg
ic In
sigh
t Sim
fund

Data Section 2
143CLOSED-END FUNDS, EXCHANGE-TRADED FUNDS, AND UNIT INVESTMENT TRUSTS
TABL
E 16
Unit
Inve
stm
ent T
rust
s: T
otal
Net
Ass
ets,
Num
ber o
f Tru
sts,
and
New
Dep
osits
by
Type
of T
rust
Year
Ass
ets
Mill
ions
of d
olla
rs, y
ear-
end
Num
ber o
f tru
sts
Year
-end
New
dep
osit
sM
illio
ns o
f dol
lars
, ann
ual
Tota
l tr
usts
Equi
tyTa
xabl
e de
btTa
x-fr
ee
debt
Tota
l tr
usts
Equi
tyTa
xabl
e de
btTa
x-fr
ee
debt
Tota
l tr
usts
Equi
tyTa
xabl
e de
btTa
x-fr
ee
debt
1990
$105
,390
$4,1
92$9
,456
$91,
742
12,1
3117
172
211
,238
$7,4
89$4
95$1
,349
$5,6
4419
9110
2,82
84,
940
9,72
188
,167
12,3
8816
867
811
,542
8,19
590
01,
687
5,60
919
9297
,925
6,48
49,
976
81,4
6513
,598
230
745
12,6
238,
909
1,77
12,
385
4,75
219
9387
,574
8,49
48,
567
70,5
1313
,740
258
679
12,8
039,
359
3,20
61,
598
4,55
519
9473
,682
9,28
57,
252
57,1
4413
,310
306
568
12,4
368,
915
3,26
51,
709
3,94
119
9573
,125
14,0
198,
094
51,0
1312
,979
301
578
12,1
0011
,264
6,74
31,
154
3,36
719
9672
,204
22,9
228,
485
40,7
9611
,764
378
591
10,7
9521
,662
18,3
1680
02,
546
1997
84,7
6140
,747
6,48
037
,533
11,5
9356
351
310
,517
38,5
4635
,855
771
1,91
919
9893
,943
56,4
135,
380
32,1
5110
,966
872
414
9,68
047
,675
45,9
4756
21,
166
1999
91,9
7062
,128
4,28
325
,559
10,4
141,
081
409
8,92
452
,046
50,6
2934
31,
074
2000
74,1
6148
,060
3,50
222
,599
10,0
721,
554
369
8,14
943
,649
42,5
7019
688
320
0149
,249
26,4
673,
784
18,9
999,
295
1,50
032
47,
471
19,0
4916
,927
572
1,55
020
0236
,016
14,6
514,
020
17,3
458,
303
1,24
736
66,
690
11,6
009,
131
862
1,60
720
0335
,826
19,0
243,
311
13,4
917,
233
1,20
632
05,
707
12,7
3110
,071
931
1,72
920
0437
,267
23,2
012,
635
11,4
326,
499
1,16
629
55,
038
17,1
2514
,559
981
1,58
520
0540
,894
28,6
342,
280
9,98
06,
019
1,25
130
44,
464
22,5
9821
,526
289
782
2006
49,6
6238
,809
2,14
28,
711
5,90
71,
566
319
4,02
229
,057
28,1
8529
457
820
0753
,040
43,2
952,
066
7,68
06,
030
1,96
432
73,
739
35,8
3635
,101
298
438
2008
28,5
4320
,080
2,00
76,
456
5,98
42,
175
343
3,46
623
,590
22,3
3555
769
820
0938
,336
24,7
743,
668
9,89
46,
049
2,14
543
83,
466
22,2
9316
,159
2,20
13,
933
2010
50,5
6734
,112
3,78
012
,675
5,97
12,
212
491
3,26
830
,936
25,0
0392
85,
006
Not
e: C
ompo
nent
s m
ay n
ot a
dd to
the
tota
l bec
ause
of r
ound
ing.

144 2011 INVESTMENT COMPANY FACT BOOK
Data
Sec
tion
3
TABLE 17Liquid Assets and Liquidity Ratio of Long-Term Mutual FundsYear-end
Year
Liquid assetsMillions of dollars
Liquidity ratio*Percent
TotalEquityfunds
Hybridfunds
Bondfunds Total
Equityfunds
Hybridfunds
Bondfunds
1986 $30,611 $14,612 $2,514 $13,485 7.2% 9.5% 9.8% 5.5%1987 37,930 16,319 2,730 18,881 8.4 9.3 9.3 7.61988 44,980 17,742 2,986 24,252 9.5 9.4 11.3 9.51989 44,603 25,602 5,747 13,253 8.1 10.4 16.1 4.91990 48,440 27,344 4,225 16,872 8.5 11.4 11.7 5.81991 60,385 30,657 3,318 26,410 7.1 7.6 6.4 6.71992 73,984 42,417 6,595 24,972 6.7 8.3 8.5 5.01993 99,436 57,539 16,774 25,123 6.6 7.8 11.6 4.11994 120,430 70,885 20,093 29,453 7.8 8.3 12.2 5.61995 141,755 97,743 19,494 24,518 6.9 7.8 9.3 4.11996 151,988 107,667 18,067 26,254 5.8 6.2 7.2 4.11997 198,826 145,565 24,761 28,500 5.8 6.1 7.8 3.91998 191,393 143,516 25,569 22,307 4.6 4.8 7.0 2.71999 219,098 174,692 20,656 23,750 4.2 4.3 5.5 2.92000 277,164 227,961 23,774 25,429 5.4 5.8 6.9 3.12001 222,475 172,044 25,938 24,492 4.7 5.0 7.5 2.62002 208,939 122,903 23,540 62,495 5.1 4.6 7.3 5.52003 259,580 157,218 29,218 73,144 4.8 4.3 6.8 5.92004 306,756 186,380 34,965 85,411 5.0 4.2 6.8 6.62005 302,922 194,394 40,030 68,499 4.4 3.9 7.1 5.02006 346,491 229,409 52,773 64,309 4.3 3.9 8.1 4.32007 381,306 276,962 54,092 50,251 4.3 4.2 7.5 3.02008 296,206 193,406 45,155 57,645 5.1 5.2 9.1 3.72009 365,866 178,229 46,386 141,251 4.7 3.6 7.3 6.42010 331,696 198,089 59,468 74,139 3.7 3.5 8.0 2.8
* Liquidity ratio is the ratio of liquid assets divided by total net assets at year-end. Note: Data for funds that invest primarily in other mutual funds were excluded from the series. Components may not add to the total because of rounding.

145U.S. LONG-TERM MUTUAL FUNDS
Data Section 3
TABL
E 18
Liqu
idity
Rat
io* o
f Lon
g-Te
rm M
utua
l Fun
ds b
y In
vest
men
t Cla
ssifi
catio
n
Pe
rcen
t, ye
ar-e
nd
Year
EQUI
TY F
UNDS
HYBR
ID
FUN
DS
BON
D FU
NDS
Capi
tal
appr
ecia
tion
W
orld
To
tal r
etur
n Co
rpor
ate
High
yie
ld
Wor
ld
Gove
rnm
ent
Stra
tegi
c in
com
eSt
ate
mun
i N
atio
nal m
uni
1986
8.7%
9.4%
10.2
%9.
8%6.
3%5.
0%21
.1%
6.7%
10.8
%2.
5%3.
0%19
8710
.211
.57.
99.
37.
97.
322
.28.
211
.24.
36.
519
8810
.57.
18.
811
.313
.17.
017
.311
.517
.84.
47.
219
8911
.07.
210
.716
.18.
66.
914
.84.
313
.52.
43.
519
9012
.011
.710
.611
.78.
611
.443
.71.
38.
02.
74.
719
918.
68.
76.
36.
47.
95.
430
.55.
57.
02.
83.
819
9210
.39.
65.
98.
58.
45.
722
.82.
36.
52.
83.
819
938.
510
.66.
011
.68.
84.
617
.90.
97.
52.
13.
519
949.
110
.86.
212
.210
.27.
920
.02.
88.
62.
84.
519
958.
58.
66.
79.
36.
37.
012
.31.
57.
32.
13.
519
966.
67.
05.
47.
25.
36.
79.
0-0
.611
.22.
43.
619
976.
48.
05.
17.
84.
85.
38.
70.
89.
82.
12.
819
985.
05.
84.
37.
03.
24.
66.
1-3
.08.
71.
72.
419
994.
55.
33.
65.
55.
54.
36.
9-4
.68.
22.
12.
520
006.
07.
84.
56.
94.
78.
44.
3-2
.63.
13.
13.
520
015.
36.
34.
27.
55.
76.
93.
3-0
.30.
42.
33.
120
024.
95.
83.
87.
34.
16.
83.
60.
513
.12.
64.
120
034.
15.
73.
96.
86.
25.
36.
11.
112
.32.
23.
720
044.
25.
43.
86.
84.
75.
99.
82.
512
.02.
96.
520
053.
85.
13.
57.
13.
85.
16.
10.
38.
82.
65.
720
063.
74.
33.
98.
10.
45.
513
.3-4
.99.
52.
14.
420
074.
15.
13.
77.
50.
14.
914
.5-4
.94.
61.
84.
620
085.
26.
34.
59.
13.
011
.17.
7-0
.53.
61.
74.
920
093.
94.
02.
87.
36.
75.
58.
63.
87.
82.
86.
020
103.
74.
32.
58.
03.
45.
810
.3-1
.81.
32.
15.
2
* Liq
uidi
ty ra
tio is
the
ratio
of l
iqui
d as
sets
div
ided
by
tota
l net
ass
ets
at y
ear-
end.
N
ote:
Dat
a fo
r fun
ds th
at in
vest
prim
arily
in o
ther
mut
ual f
unds
wer
e ex
clud
ed fr
om th
e se
ries.

146 2011 INVESTMENT COMPANY FACT BOOK
Data
Sec
tion
3
TABLE 19Net New Cash Flow* of Long-Term Mutual FundsMillions of dollars, annual
Year Total Equity funds Hybrid funds Bond funds
1986 $129,991 $20,386 $6,988 $102,6181987 29,776 19,231 3,748 6,7971988 -23,119 -14,948 -3,684 -4,4881989 8,731 6,774 3,183 -1,2261990 21,211 12,915 1,483 6,8131991 106,213 39,888 7,089 59,2361992 171,696 78,983 21,832 70,8811993 242,049 127,260 44,229 70,5591994 75,160 114,525 23,105 -62,4701995 122,208 124,392 3,899 -6,0821996 231,874 216,937 12,177 2,7601997 272,030 227,106 16,499 28,4241998 241,796 156,875 10,311 74,6101999 169,780 187,565 -13,705 -4,0812000 228,874 309,367 -30,728 -49,7652001 129,188 32,138 9,346 87,7042002 120,583 -27,177 7,148 140,6122003 215,843 152,451 31,762 31,6292004 209,851 178,171 42,438 -10,7572005 192,086 135,773 25,081 31,2322006 227,104 158,942 7,481 60,6822007 223,898 90,675 24,163 109,0602008 -225,027 -234,324 -18,393 27,6902009 389,990 -8,755 22,718 376,0282010 227,825 -36,787 23,315 241,297
* Net new cash flow is the dollar value of new sales minus redemptions combined with net exchanges. Note: Data for funds that invest primarily in other mutual funds were excluded from the series. Components may not add to the total because of rounding.

147U.S. LONG-TERM MUTUAL FUNDS
Data Section 3
TABLE 20Net New Cash Flow and Components of Net New Cash Flow of Equity Mutual Funds Millions of dollars, annual
YearNet new cash
flow1
Sales Redemptions
New + exchange New2 Exchange3
Regular + exchange Regular4 Exchange5
1986 $20,386 $87,997 $50,774 $37,224 $67,612 $26,051 $41,5611987 19,231 139,596 65,093 74,502 120,365 38,601 81,7641988 -14,948 68,827 25,641 43,186 83,774 33,247 50,5281989 6,774 89,345 46,817 42,527 82,571 37,229 45,3421990 12,915 104,334 62,872 41,462 91,419 44,487 46,9311991 39,888 146,618 90,192 56,427 106,730 53,394 53,3361992 78,983 201,720 134,309 67,411 122,738 61,465 61,2721993 127,260 307,356 213,639 93,717 180,095 91,944 88,1511994 114,525 366,659 252,887 113,772 252,134 141,097 111,0371995 124,392 433,853 282,937 150,915 309,461 170,402 139,0591996 216,937 674,323 442,372 231,951 457,385 240,531 216,8541997 227,106 880,286 579,064 301,222 653,180 362,022 291,1581998 156,875 1,065,197 699,554 365,643 908,322 534,256 374,0651999 187,565 1,410,845 918,600 492,245 1,223,280 744,144 479,1362000 309,367 1,975,882 1,321,838 654,044 1,666,515 1,038,572 627,9432001 32,138 1,330,963 953,475 377,488 1,298,826 892,985 405,8412002 -27,177 1,220,950 899,182 321,768 1,248,127 879,216 368,9112003 152,451 1,086,828 848,078 238,749 934,376 710,876 223,5002004 178,171 1,107,248 935,762 171,486 929,077 762,520 166,5572005 135,773 1,210,416 1,032,245 178,171 1,074,643 882,789 191,8542006 158,942 1,437,413 1,231,740 205,672 1,278,471 1,054,828 223,6432007 90,675 1,758,340 1,531,577 226,763 1,667,665 1,398,416 269,2492008 -234,324 1,539,568 1,341,369 198,199 1,773,892 1,491,355 282,5382009 -8,755 1,205,186 1,047,273 157,913 1,213,942 1,028,038 185,9042010 -36,787 1,412,070 1,239,233 172,837 1,448,857 1,253,551 195,306
1 Net new cash flow is the dollar value of new sales minus redemptions combined with net exchanges.2 New sales are the dollar value of new purchases of mutual fund shares. This does not include shares purchased through
reinvestment of dividends in existing accounts.3 Exchange sales are the dollar value of mutual fund shares switched into funds within the same fund group.4 Regular redemptions are the dollar value of shareholder liquidation of mutual fund shares.5 Exchange redemptions are the dollar value of mutual fund shares switched out of funds and into other funds in the same fund group. Note: Data for funds that invest primarily in other mutual funds were excluded from the series. Components may not add to the total because of rounding.
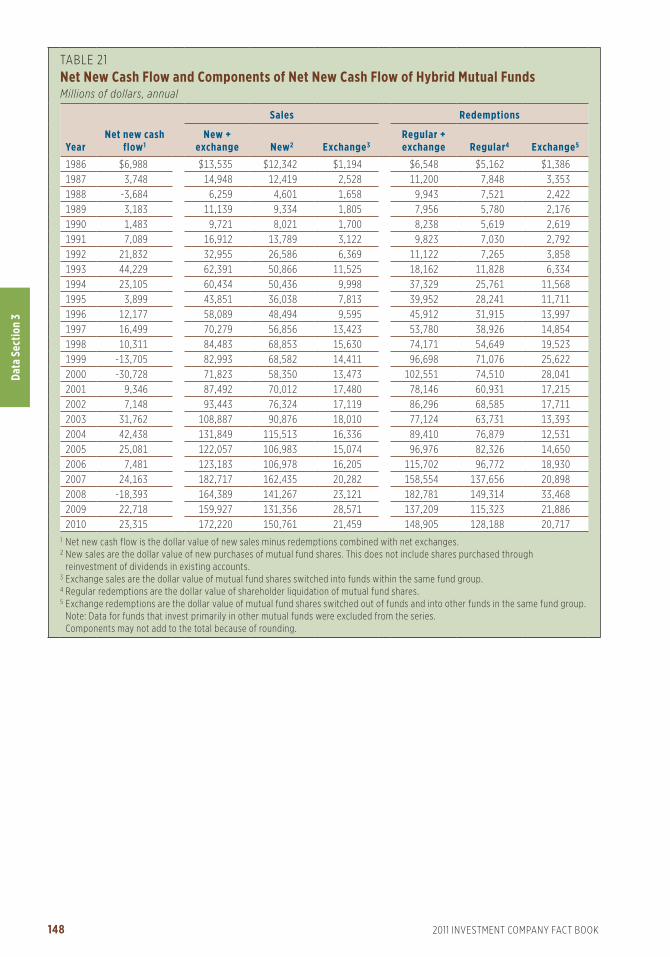
148 2011 INVESTMENT COMPANY FACT BOOK
Data
Sec
tion
3
TABLE 21Net New Cash Flow and Components of Net New Cash Flow of Hybrid Mutual Funds Millions of dollars, annual
YearNet new cash
flow1
Sales Redemptions
New + exchange New2 Exchange3
Regular + exchange Regular4 Exchange5
1986 $6,988 $13,535 $12,342 $1,194 $6,548 $5,162 $1,3861987 3,748 14,948 12,419 2,528 11,200 7,848 3,3531988 -3,684 6,259 4,601 1,658 9,943 7,521 2,4221989 3,183 11,139 9,334 1,805 7,956 5,780 2,1761990 1,483 9,721 8,021 1,700 8,238 5,619 2,6191991 7,089 16,912 13,789 3,122 9,823 7,030 2,7921992 21,832 32,955 26,586 6,369 11,122 7,265 3,8581993 44,229 62,391 50,866 11,525 18,162 11,828 6,3341994 23,105 60,434 50,436 9,998 37,329 25,761 11,5681995 3,899 43,851 36,038 7,813 39,952 28,241 11,7111996 12,177 58,089 48,494 9,595 45,912 31,915 13,9971997 16,499 70,279 56,856 13,423 53,780 38,926 14,8541998 10,311 84,483 68,853 15,630 74,171 54,649 19,5231999 -13,705 82,993 68,582 14,411 96,698 71,076 25,6222000 -30,728 71,823 58,350 13,473 102,551 74,510 28,0412001 9,346 87,492 70,012 17,480 78,146 60,931 17,2152002 7,148 93,443 76,324 17,119 86,296 68,585 17,7112003 31,762 108,887 90,876 18,010 77,124 63,731 13,3932004 42,438 131,849 115,513 16,336 89,410 76,879 12,5312005 25,081 122,057 106,983 15,074 96,976 82,326 14,6502006 7,481 123,183 106,978 16,205 115,702 96,772 18,9302007 24,163 182,717 162,435 20,282 158,554 137,656 20,8982008 -18,393 164,389 141,267 23,121 182,781 149,314 33,4682009 22,718 159,927 131,356 28,571 137,209 115,323 21,8862010 23,315 172,220 150,761 21,459 148,905 128,188 20,717
1 Net new cash flow is the dollar value of new sales minus redemptions combined with net exchanges.2 New sales are the dollar value of new purchases of mutual fund shares. This does not include shares purchased through
reinvestment of dividends in existing accounts.3 Exchange sales are the dollar value of mutual fund shares switched into funds within the same fund group.4 Regular redemptions are the dollar value of shareholder liquidation of mutual fund shares.5 Exchange redemptions are the dollar value of mutual fund shares switched out of funds and into other funds in the same fund group. Note: Data for funds that invest primarily in other mutual funds were excluded from the series. Components may not add to the total because of rounding.

149U.S. LONG-TERM MUTUAL FUNDS
Data Section 3
TABLE 22Net New Cash Flow and Components of Net New Cash Flow of Bond Mutual Funds Millions of dollars, annual
YearNet new cash
flow1
Sales Redemptions
New + exchange New2 Exchange3
Regular + exchange Regular4 Exchange5
1986 $102,618 $158,874 $138,240 $20,634 $56,256 $35,776 $20,4801987 6,797 123,528 93,725 29,803 116,731 69,627 47,1041988 -4,488 72,174 47,378 24,796 76,662 51,558 25,1031989 -1,226 71,770 48,602 23,168 72,996 48,517 24,4801990 6,813 80,608 57,074 23,534 73,795 47,959 25,8361991 59,236 141,622 108,059 33,563 82,387 56,158 26,2281992 70,881 217,680 171,868 45,812 146,799 96,573 50,2261993 70,559 260,519 207,265 53,254 189,960 127,200 62,7591994 -62,470 185,015 129,958 55,057 247,485 162,360 85,1251995 -6,082 165,610 109,797 55,814 171,693 114,252 57,4411996 2,760 202,037 136,827 65,210 199,277 124,984 74,2931997 28,424 240,377 174,682 65,695 211,953 140,245 71,7081998 74,610 312,637 229,375 83,263 238,028 158,775 79,2531999 -4,081 298,122 216,467 81,655 302,202 205,968 96,2342000 -49,765 245,866 184,021 61,845 295,631 217,157 78,4742001 87,704 389,128 297,243 91,885 301,424 222,933 78,4912002 140,612 508,466 396,225 112,241 367,854 280,355 87,4992003 31,629 515,201 424,037 91,164 483,572 373,295 110,2762004 -10,757 396,214 341,542 54,672 406,971 338,386 68,5862005 31,232 407,115 355,676 51,438 375,882 320,739 55,1432006 60,682 448,892 394,315 54,577 388,211 331,234 56,9762007 109,060 587,890 503,557 84,333 478,831 408,328 70,5022008 27,690 710,442 582,981 127,461 682,752 586,584 96,1682009 376,028 1,011,491 862,410 149,081 635,463 525,647 109,8162010 241,297 1,101,017 976,494 124,523 859,721 745,531 114,190
1 Net new cash flow is the dollar value of new sales minus redemptions combined with net exchanges.2 New sales are the dollar value of new purchases of mutual fund shares. This does not include shares purchased through
reinvestment of dividends in existing accounts.3 Exchange sales are the dollar value of mutual fund shares switched into funds within the same fund group.4 Regular redemptions are the dollar value of shareholder liquidation of mutual fund shares.5 Exchange redemptions are the dollar value of mutual fund shares switched out of funds and into other funds in the same fund group. Note: Data for funds that invest primarily in other mutual funds were excluded from the series. Components may not add to the total because of rounding.

150 2011 INVESTMENT COMPANY FACT BOOK
Data
Sec
tion
3
TABL
E 23
Net N
ew C
ash
Flow
* of L
ong-
Term
Mut
ual F
unds
by
Inve
stm
ent C
lass
ifica
tion
Mill
ions
of d
olla
rs, a
nnua
l
Year
EQUI
TY F
UNDS
HYBR
ID
FUN
DS
BON
D FU
NDS
Capi
tal
appr
ecia
tion
W
orld
To
tal r
etur
n Co
rpor
ate
High
yie
ld
Wor
ld
Gove
rnm
ent
Stra
tegi
c in
com
eSt
ate
mun
i N
atio
nal m
uni
1986
$3,0
71$4
,200
$13,
115
$6,9
88$3
,468
$9,6
18$4
29$5
7,45
0$3
,416
$12,
105
$16,
132
1987
7,43
2-5
6812
,368
3,74
860
861
067
32,
892
1,11
41,
864
-964
1988
-7,2
10-2
,402
-5,3
36-3
,684
-200
3,20
960
9-1
3,65
546
42,
878
2,20
919
89-6
41,
210
5,62
83,
183
774
-2,8
75-8
4-1
2,81
21,
738
6,48
45,
550
1990
4,61
06,
812
1,49
31,
483
1,26
9-5
,229
7,61
5-7
,574
791
6,19
23,
749
1991
23,5
093,
959
12,4
217,
089
6,01
61,
682
10,2
8217
,337
2,68
511
,112
10,1
2119
9243
,171
7,04
428
,768
21,8
326,
881
4,60
4-3
,003
29,6
434,
389
13,2
0515
,162
1993
48,2
4738
,441
40,5
7344
,229
11,9
588,
467
750
6,18
64,
867
18,9
9819
,333
1994
42,8
5444
,248
27,4
2423
,105
715
-972
-6,8
00-3
9,86
2-1
02-6
,242
-9,2
0819
9572
,452
11,5
1240
,428
3,89
96,
366
8,25
8-4
,248
-13,
670
4,10
1-2
,221
-4,6
7019
9699
,511
47,5
1669
,910
12,1
776,
368
12,4
86-2
,202
-13,
771
5,77
2-1
,953
-3,9
4019
9794
,495
37,8
4694
,766
16,4
9911
,077
16,8
51-1
,287
-9,4
9410
,405
353
520
1998
82,5
917,
527
66,7
5710
,311
20,1
2113
,602
-1,1
668,
899
17,9
557,
999
7,20
019
9916
0,19
011
,224
16,1
51-1
3,70
56,
195
-2,5
46-2
,179
-2,2
018,
802
-4,5
83-7
,568
2000
307,
602
52,9
01-5
1,13
6-3
0,72
8-7
,736
-12,
306
-2,2
08-1
6,34
62,
968
-5,5
13-8
,625
2001
17,5
91-2
2,17
636
,723
9,34
611
,149
7,19
5-1
,022
27,8
7230
,919
6,63
14,
961
2002
-35,
360
-4,2
4212
,424
7,14
88,
808
10,5
8016
758
,370
46,2
845,
720
10,6
8420
0367
,380
22,0
4763
,024
31,7
627,
902
26,3
353,
040
-18,
729
20,1
60-8
,056
977
2004
47,2
4466
,002
64,9
2542
,438
11,5
34-9
,327
5,81
0-1
9,37
614
,263
-8,2
39-5
,422
2005
14,5
2510
4,18
817
,060
25,0
816,
229
-15,
607
7,73
9-9
,720
37,5
5188
14,
159
2006
7,91
114
7,90
33,
128
7,48
114
,060
-2,8
189,
730
-20,
603
45,1
943,
647
11,4
7220
07-3
1,72
513
8,31
8-1
5,91
824
,163
11,3
88-2
,679
18,4
98-2
,736
73,7
153,
337
7,53
620
08-1
04,1
88-8
2,73
2-4
7,40
4-1
8,39
3-2
2,11
9-7
005,
325
23,0
5214
,313
-2,2
3910
,058
2009
-11,
064
30,7
21-2
8,41
222
,718
70,4
0222
,381
22,4
0035
,111
156,
649
6,08
263
,003
2010
-53,
467
59,1
05-4
2,42
523
,315
52,1
817,
556
51,3
0415
,200
103,
870
-2,8
1213
,999
* Net
new
cas
h flo
w is
the
dolla
r val
ue o
f new
sal
es m
inus
rede
mpt
ions
com
bine
d w
ith n
et e
xcha
nges
. N
ote:
Dat
a fo
r fun
ds th
at in
vest
prim
arily
in o
ther
mut
ual f
unds
wer
e ex
clud
ed fr
om th
e se
ries.

151U.S. LONG-TERM MUTUAL FUNDS
Data Section 3
TABL
E 24
New
Sal
es* o
f Lon
g-Te
rm M
utua
l Fun
ds b
y In
vest
men
t Cla
ssifi
catio
n
M
illio
ns o
f dol
lars
, ann
ual
Year
EQUI
TY F
UNDS
HYBR
ID
FUN
DS
BON
D FU
NDS
Capi
tal
appr
ecia
tion
W
orld
To
tal r
etur
n Co
rpor
ate
High
yie
ld
Wor
ld
Gove
rnm
ent
Stra
tegi
c in
com
eSt
ate
mun
i N
atio
nal m
uni
1986
$21,
395
$7,0
76$2
2,30
3$1
2,34
2$4
,066
$12,
645
$432
$78,
991
$4,8
73$1
4,50
5$2
2,72
819
8730
,529
6,82
927
,736
12,4
193,
224
8,28
51,
073
51,0
194,
574
9,90
915
,642
1988
12,4
172,
206
11,0
184,
601
1,73
87,
856
1,34
815
,940
2,92
37,
104
10,4
6919
8919
,943
4,24
522
,629
9,33
42,
514
7,60
774
010
,966
3,67
910
,046
13,0
4919
9027
,234
11,2
7324
,364
8,02
15,
545
3,37
28,
639
13,2
062,
093
11,4
3012
,789
1991
44,0
819,
860
36,2
5113
,789
13,2
424,
546
14,5
5637
,187
4,02
816
,571
17,9
3119
9268
,960
13,2
2552
,124
26,5
8624
,014
9,36
212
,664
70,1
487,
167
21,5
5426
,957
1993
99,3
0940
,651
73,6
7950
,866
37,0
4514
,375
14,1
9365
,850
9,05
829
,828
36,9
1719
9411
2,06
368
,396
72,4
2850
,436
37,1
6711
,852
8,32
427
,386
6,58
116
,677
21,9
7119
9514
2,59
153
,555
86,7
9236
,038
28,6
8615
,415
4,88
921
,993
9,47
713
,355
15,9
8319
9622
1,53
088
,669
132,
173
48,4
9436
,433
22,9
896,
441
20,7
5715
,936
15,5
8818
,684
1997
275,
013
120,
065
183,
986
56,8
5642
,472
33,3
127,
773
24,1
0624
,104
19,0
2923
,886
1998
344,
980
132,
747
221,
827
68,8
5353
,039
41,8
727,
533
38,6
0733
,863
25,4
0629
,056
1999
500,
938
181,
670
235,
992
68,5
8251
,509
32,3
605,
620
38,1
3838
,372
22,9
3127
,536
2000
765,
497
334,
218
222,
123
58,3
5043
,763
23,1
715,
911
26,4
5043
,706
17,1
5223
,868
2001
480,
724
248,
277
224,
474
70,0
1260
,866
33,7
476,
127
63,1
8077
,281
25,7
0130
,341
2002
437,
932
241,
734
219,
516
76,3
2466
,736
40,2
697,
566
102,
936
111,
889
27,5
7839
,250
2003
422,
909
199,
696
225,
474
90,8
7679
,333
66,4
3313
,410
82,7
8412
0,20
521
,967
39,9
0620
0449
7,00
417
4,78
826
3,96
911
5,51
376
,513
39,6
6214
,881
52,1
8710
7,79
517
,631
32,8
7320
0553
4,95
623
1,02
226
6,26
710
6,98
372
,424
33,9
5620
,261
46,0
5312
2,74
822
,259
37,9
7520
0660
9,75
034
3,70
927
8,28
210
6,97
885
,305
32,6
9125
,919
41,0
0313
6,91
225
,615
46,8
7120
0773
7,62
846
4,29
732
9,65
216
2,43
598
,122
42,4
5738
,682
48,1
5319
2,24
929
,469
54,4
2620
0868
1,47
235
2,86
330
7,03
514
1,26
791
,546
42,9
2146
,595
87,3
8621
4,09
930
,483
69,9
5120
0953
3,79
928
1,79
723
1,67
713
1,35
616
1,21
766
,221
54,1
3912
4,94
531
5,65
328
,333
111,
902
2010
608,
138
372,
454
258,
641
150,
761
190,
496
75,8
0797
,500
121,
883
353,
573
28,4
6010
8,77
5
* New
sal
es a
re th
e do
llar v
alue
of n
ew p
urch
ases
of m
utua
l fun
d sh
ares
. Thi
s do
es n
ot in
clud
e sh
ares
pur
chas
ed th
roug
h re
inve
stm
ent o
f div
iden
ds in
exi
stin
g ac
coun
ts.
Not
e: D
ata
for f
unds
that
inve
st p
rimar
ily in
oth
er m
utua
l fun
ds w
ere
excl
uded
from
the
serie
s.

152 2011 INVESTMENT COMPANY FACT BOOK
Data
Sec
tion
3
TABL
E 25
Exch
ange
Sal
es* o
f Lon
g-Te
rm M
utua
l Fun
ds b
y In
vest
men
t Cla
ssifi
catio
n M
illio
ns o
f dol
lars
, ann
ual
Year
EQUI
TY F
UNDS
HYBR
ID
FUN
DS
BON
D FU
NDS
Capi
tal
appr
ecia
tion
W
orld
To
tal r
etur
n Co
rpor
ate
High
yie
ld
Wor
ld
Gove
rnm
ent
Stra
tegi
c in
com
eSt
ate
mun
i N
atio
nal m
uni
1986
$20,
019
$3,6
19$1
3,58
5$1
,194
$1,1
92$2
,792
$37
$4,0
96$1
,197
$2,2
42$9
,079
1987
47,3
824,
434
22,6
862,
528
1,59
53,
398
438
6,00
11,
898
3,90
312
,569
1988
31,0
411,
451
10,6
931,
658
1,65
04,
364
605
4,97
91,
451
3,07
78,
670
1989
30,6
501,
676
10,2
011,
805
1,74
83,
396
367
4,57
51,
463
3,36
08,
259
1990
29,0
223,
804
8,63
51,
700
2,10
82,
279
816
5,37
053
53,
429
8,99
819
9139
,712
4,35
712
,357
3,12
23,
874
3,39
21,
280
10,3
5693
53,
814
9,91
319
9245
,976
6,32
715
,108
6,36
96,
008
6,22
82,
475
11,7
841,
184
5,02
113
,113
1993
57,0
8018
,074
18,5
6311
,525
6,69
06,
694
4,17
99,
795
1,43
56,
121
18,3
4019
9462
,488
33,3
1617
,968
9,99
85,
465
7,87
53,
355
7,80
72,
066
9,42
419
,063
1995
95,5
8630
,313
25,0
177,
813
6,77
66,
995
2,01
67,
279
1,86
810
,808
20,0
7119
9613
8,83
552
,450
40,6
669,
595
6,92
09,
773
2,99
67,
666
2,50
710
,599
24,7
4819
9717
2,14
065
,594
63,4
8813
,423
7,97
712
,588
3,32
39,
757
3,77
08,
309
19,9
7119
9821
7,43
477
,380
70,8
2815
,630
13,1
0613
,920
2,92
420
,792
8,17
87,
485
16,8
5819
9930
4,71
911
1,44
276
,084
14,4
1113
,505
13,0
001,
367
23,1
426,
602
6,98
417
,056
2000
427,
248
161,
953
64,8
4413
,473
9,19
310
,268
1,33
316
,715
8,16
15,
309
10,8
6520
0123
3,73
184
,066
59,6
9217
,480
17,6
8611
,093
1,16
226
,694
16,2
165,
367
13,6
6620
0219
9,82
469
,250
52,6
9317
,119
16,4
8611
,262
1,79
939
,068
24,3
985,
654
13,5
7320
0314
1,96
240
,278
56,5
0918
,010
15,6
2216
,948
2,80
421
,452
19,8
314,
312
10,1
9420
0410
1,31
527
,014
43,1
5716
,336
11,2
277,
694
1,54
112
,433
12,8
932,
788
6,09
620
0598
,347
37,7
0342
,121
15,0
748,
796
6,46
32,
186
11,4
4213
,153
3,01
26,
386
2006
106,
295
55,9
2343
,455
16,2
059,
028
6,31
02,
229
11,7
2715
,006
3,45
66,
821
2007
102,
352
67,7
9856
,613
20,2
8214
,921
6,94
03,
658
13,9
4228
,499
5,70
410
,669
2008
93,4
2446
,724
58,0
5123
,121
19,9
257,
251
7,13
834
,481
33,8
677,
069
17,7
3020
0972
,179
44,4
5541
,279
28,5
7124
,974
12,9
206,
697
24,2
4855
,088
5,18
019
,975
2010
75,5
4456
,018
41,2
7521
,459
25,2
8613
,283
7,20
420
,863
38,7
723,
856
15,2
59
* Exc
hang
e sa
les
are
the
dolla
r val
ue o
f mut
ual f
und
shar
es s
witc
hed
into
fund
s w
ithin
the
sam
e fu
nd g
roup
.
N
ote:
Dat
a fo
r fun
ds th
at in
vest
prim
arily
in o
ther
mut
ual f
unds
wer
e ex
clud
ed fr
om th
e se
ries.

153U.S. LONG-TERM MUTUAL FUNDS
Data Section 3
TABL
E 26
Rede
mpt
ions
* of L
ong-
Term
Mut
ual F
unds
by
Inve
stm
ent C
lass
ifica
tion
Mill
ions
of d
olla
rs, a
nnua
l
Year
EQUI
TY F
UNDS
HYBR
ID
FUN
DS
BON
D FU
NDS
Capi
tal
appr
ecia
tion
W
orld
To
tal r
etur
n Co
rpor
ate
High
yie
ld
Wor
ld
Gove
rnm
ent
Stra
tegi
c in
com
eSt
ate
mun
i N
atio
nal m
uni
1986
$14,
004
$2,9
58$9
,089
$5,1
62$8
72$3
,128
$28
$21,
045
$1,6
45$2
,677
$6,3
8119
8719
,892
5,04
413
,665
7,84
82,
233
5,90
048
940
,407
3,17
65,
733
11,6
8919
8816
,268
3,66
313
,316
7,52
11,
891
5,52
773
128
,056
2,68
74,
290
8,37
719
8917
,859
2,89
516
,476
5,78
02,
000
8,13
376
822
,889
2,39
84,
248
8,08
019
9019
,810
4,19
820
,480
5,61
94,
366
6,79
81,
326
20,3
141,
288
5,14
38,
724
1991
23,9
825,
645
23,7
667,
030
8,38
73,
856
4,47
622
,883
1,44
66,
030
9,08
119
9229
,209
6,73
025
,526
7,26
517
,633
5,65
212
,462
37,5
892,
343
8,31
012
,583
1993
47,8
8510
,183
33,8
7611
,828
24,9
667,
255
11,1
9052
,251
3,48
710
,647
17,4
0419
9468
,498
28,8
5443
,745
25,7
6132
,827
10,5
0613
,016
56,8
355,
512
18,3
9925
,265
1995
81,9
5037
,830
50,6
2228
,241
23,3
429,
390
7,91
233
,731
5,19
815
,209
19,4
7019
9612
6,34
944
,950
69,2
3331
,915
29,4
8712
,096
8,19
429
,956
9,32
616
,145
19,7
8219
9718
3,15
779
,102
99,7
6338
,926
30,7
4518
,013
8,22
030
,288
13,7
4716
,965
22,2
6719
9826
1,49
111
9,84
215
2,92
454
,649
35,3
6827
,247
8,01
031
,552
17,4
4517
,204
21,9
4919
9936
7,67
417
1,23
820
5,23
371
,076
44,5
6932
,125
7,09
136
,639
28,0
6825
,176
32,2
9920
0051
9,96
928
3,69
723
4,90
774
,510
49,0
9830
,805
7,53
637
,693
38,7
1922
,077
31,2
2920
0144
4,99
226
0,51
218
7,48
160
,931
53,5
3126
,799
6,76
239
,908
50,5
3118
,921
26,4
8220
0244
5,58
523
9,85
419
3,77
768
,585
60,9
9829
,877
7,79
858
,159
71,4
1621
,733
30,3
7420
0336
1,17
818
0,36
416
9,33
463
,731
71,9
2643
,779
10,7
3286
,906
95,9
2926
,861
37,1
6320
0444
3,26
511
8,17
820
1,07
776
,879
65,8
9145
,667
9,19
966
,640
91,0
9823
,938
35,9
5320
0550
2,05
214
2,23
723
8,50
082
,326
66,1
4246
,136
13,2
7553
,933
86,7
1321
,099
33,4
4220
0657
7,61
521
5,01
326
2,20
196
,772
70,8
9935
,174
16,5
6657
,300
93,5
1521
,957
35,8
2320
0773
6,02
733
6,03
532
6,35
313
7,65
687
,940
43,3
4021
,538
53,4
2712
9,46
525
,738
46,8
8120
0875
5,81
740
7,40
532
8,13
314
9,31
411
5,04
542
,410
42,7
6882
,032
209,
180
32,0
8463
,066
2009
533,
008
248,
533
246,
497
115,
323
100,
918
47,4
5934
,718
89,5
7817
3,90
522
,716
56,3
5320
1065
0,80
030
8,20
829
4,54
312
8,18
814
1,60
571
,910
48,1
6710
5,55
925
5,86
229
,007
93,4
21
* Red
empt
ions
are
the
dolla
r val
ue o
f sha
reho
lder
liqu
idat
ion
of m
utua
l fun
d sh
ares
.
N
ote:
Dat
a fo
r fun
ds th
at in
vest
prim
arily
in o
ther
mut
ual f
unds
wer
e ex
clud
ed fr
om th
e se
ries.

154 2011 INVESTMENT COMPANY FACT BOOK
Data
Sec
tion
3
TABL
E 27
Exch
ange
Red
empt
ions
* of L
ong-
Term
Mut
ual F
unds
by
Inve
stm
ent C
lass
ifica
tion
M
illio
ns o
f dol
lars
, ann
ual
Year
EQUI
TY F
UNDS
HYBR
ID
FUN
DS
BON
D FU
NDS
Capi
tal
appr
ecia
tion
W
orld
To
tal r
etur
n Co
rpor
ate
High
yie
ld
Wor
ld
Gove
rnm
ent
Stra
tegi
c in
com
eSt
ate
mun
i N
atio
nal m
uni
1986
$24,
340
$3,5
37$1
3,68
4$1
,386
$918
$2,6
91$1
3$4
,592
$1,0
09$1
,964
$9,2
9419
8750
,587
6,78
724
,389
3,35
31,
979
5,17
334
913
,721
2,18
26,
215
17,4
8619
8834
,400
2,39
613
,731
2,42
21,
697
3,48
461
46,
519
1,22
33,
013
8,55
319
8932
,799
1,81
710
,726
2,17
61,
488
5,74
542
45,
465
1,00
62,
673
7,67
919
9031
,837
4,06
811
,027
2,61
92,
018
4,08
251
55,
836
549
3,52
49,
313
1991
36,3
014,
613
12,4
222,
792
2,71
22,
399
1,07
87,
323
831
3,24
38,
642
1992
42,5
565,
778
12,9
383,
858
5,50
85,
334
5,68
014
,700
1,61
95,
060
12,3
2619
9360
,257
10,1
0117
,793
6,33
46,
810
5,34
76,
432
17,2
082,
138
6,30
518
,520
1994
63,2
0028
,610
19,2
2711
,568
9,09
110
,193
5,46
318
,220
3,23
813
,944
24,9
7719
9583
,775
34,5
2520
,759
11,7
115,
754
4,76
23,
241
9,21
12,
045
11,1
7421
,254
1996
134,
505
48,6
5333
,696
13,9
977,
498
8,18
03,
446
12,2
383,
345
11,9
9527
,590
1997
169,
502
68,7
1252
,944
14,8
548,
627
11,0
364,
163
13,0
703,
722
10,0
2121
,069
1998
218,
332
82,7
5972
,974
19,5
2310
,656
14,9
433,
613
18,9
476,
641
7,68
816
,764
1999
277,
794
110,
650
90,6
9225
,622
14,2
5015
,780
2,07
426
,842
8,10
49,
322
19,8
6120
0036
5,17
315
9,57
310
3,19
728
,041
11,5
9514
,939
1,91
621
,818
10,1
815,
897
12,1
2820
0125
1,87
194
,008
59,9
6217
,215
13,8
7210
,846
1,55
022
,095
12,0
485,
517
12,5
6420
0222
7,53
175
,373
66,0
0817
,711
13,4
1611
,075
1,40
025
,476
18,5
875,
780
11,7
6620
0313
6,31
337
,563
49,6
2413
,393
15,1
2713
,267
2,44
336
,058
23,9
477,
475
11,9
6020
0410
7,81
017
,622
41,1
2412
,531
10,3
1611
,016
1,41
317
,356
15,3
274,
720
8,43
820
0511
6,72
622
,300
52,8
2814
,650
8,84
99,
889
1,43
213
,283
11,6
383,
291
6,76
120
0613
0,51
836
,716
56,4
0818
,930
9,37
46,
644
1,85
116
,033
13,2
103,
467
6,39
820
0713
5,67
757
,742
75,8
3020
,898
13,7
158,
735
2,30
411
,403
17,5
686,
098
10,6
7820
0812
3,26
774
,913
84,3
5833
,468
18,5
468,
462
5,64
016
,784
24,4
747,
707
14,5
5720
0984
,035
46,9
9754
,872
21,8
8614
,871
9,30
03,
718
24,5
0440
,188
4,71
412
,520
2010
86,3
4961
,159
47,7
9920
,717
21,9
969,
625
5,23
321
,986
32,6
136,
121
16,6
15
* Exc
hang
e re
dem
ptio
ns a
re th
e do
llar v
alue
of m
utua
l fun
d sh
ares
sw
itche
d ou
t of f
unds
and
into
oth
er fu
nds
in th
e sa
me
fund
gro
up.
Not
e: D
ata
for f
unds
that
inve
st p
rimar
ily in
oth
er m
utua
l fun
ds w
ere
excl
uded
from
the
serie
s.

155U.S. LONG-TERM MUTUAL FUNDS
Data Section 3
TABLE 28Annual Redemption Rates of Long-Term Mutual FundsPercent
Year
Narrow redemption rate1 Broad redemption rate2
TotalEquityfunds
Hybridfunds
Bondfunds Total
Equityfunds
Hybridfunds
Bondfunds
1986 19.8% 19.6% 23.8% 19.6% 38.6% 50.9% 30.2% 30.7%1987 26.5 23.4 28.5 28.3 56.7 73.0 40.7 47.51988 20.0 18.2 27.1 20.5 36.9 45.9 35.8 30.41989 17.9 17.1 18.7 18.4 31.9 38.0 25.7 27.71990 17.5 18.4 15.7 17.0 31.0 37.7 23.0 26.21991 16.4 16.6 15.9 16.4 28.1 33.1 22.2 24.11992 17.0 13.4 11.2 21.5 28.8 26.7 17.1 32.71993 17.8 14.7 10.6 22.6 29.9 28.7 16.3 33.81994 21.6 17.7 16.7 28.3 35.2 31.6 24.2 43.21995 17.4 16.2 15.1 20.3 28.9 29.4 21.3 30.51996 17.0 16.2 13.8 20.1 30.0 30.7 19.8 32.01997 17.9 17.7 13.7 20.5 30.5 31.9 18.9 31.01998 19.7 20.0 16.0 20.4 32.2 34.0 21.7 30.61999 21.7 21.2 19.1 25.1 34.5 34.9 26.0 36.82000 25.7 26.0 20.6 26.7 39.9 41.6 28.3 36.42001 24.0 24.2 17.6 25.7 34.2 35.2 22.6 34.72002 27.9 28.9 20.5 27.3 38.7 41.0 25.8 35.82003 24.2 22.4 16.9 31.4 31.5 29.4 20.5 40.72004 20.4 18.9 16.3 26.7 24.7 23.0 18.9 32.12005 19.7 18.9 15.2 24.2 23.7 23.0 17.9 28.42006 19.9 19.4 15.9 23.2 23.9 23.6 19.1 27.22007 22.9 22.5 20.1 25.7 27.2 26.8 23.2 30.22008 30.3 29.2 24.6 36.1 35.9 34.7 30.1 42.02009 24.6 23.7 20.3 27.8 29.3 28.0 24.1 33.72010 25.3 23.6 18.6 31.0 29.2 27.3 21.6 35.7
1 Narrow redemption rate is calculated by taking the sum of regular redemptions for the year as a percentage of average net assets at the beginning and end of the period.
2 Broad redemption rate is calculated by taking the sum of regular redemptions and exchange redemptions for the year as a percentage of average net assets at the beginning and end of the period.
Note: Data for funds that invest primarily in other mutual funds were excluded from the series.

156 2011 INVESTMENT COMPANY FACT BOOK
Data
Sec
tion
3
TABLE 29Portfolio Holdings of Long-Term Mutual Funds and Share of Total Net AssetsMillions of dollars, year-end
YearTotal net
assets
Common and preferred
stocks
Long-term U.S. government
bondsCorporate
bondsMunicipal
bondsLiquid assets Other
1990 $566,849 $216,451 $128,153 $45,365 $117,084 $48,440 $11,3561991 850,744 381,289 163,093 87,571 149,439 60,385 8,9671992 1,096,342 485,188 225,358 115,389 191,779 73,984 4,6451993 1,504,644 712,137 272,293 165,387 249,203 99,436 6,1871994 1,544,320 823,714 223,070 155,157 211,127 120,430 10,8221995 2,058,275 1,215,210 259,076 190,880 245,330 141,755 6,0241996 2,623,994 1,718,220 264,925 238,030 245,182 151,988 5,6491997 3,409,315 2,358,205 282,183 292,901 266,324 198,826 10,8761998 4,173,531 3,004,181 286,577 389,225 292,395 191,393 9,7601999 5,233,194 4,059,536 293,542 388,385 267,428 219,098 5,2042000 5,119,386 3,910,275 309,697 349,072 269,179 277,164 3,9992001 4,689,603 3,424,372 379,392 371,946 289,655 222,475 1,7632002 4,118,402 2,687,884 481,377 417,779 320,509 208,939 1,9132003 5,362,398 3,761,057 506,227 500,390 332,114 259,580 3,0312004 6,193,746 4,490,102 537,583 532,486 318,333 306,756 8,4862005 6,864,287 5,055,348 612,962 549,619 330,879 302,922 12,5572006 8,059,484 6,024,631 645,685 667,555 359,156 346,491 15,9662007 8,916,522 6,612,378 749,917 782,802 369,040 381,306 21,0802008 5,771,368 3,736,193 704,716 675,919 336,820 296,206 21,5142009 7,804,303 5,098,508 850,434 1,022,205 449,807 365,866 17,4832010 9,016,755 5,862,371 1,079,681 1,257,895 478,757 331,696 6,355
Percent, year-end
1990 100.0% 38.2% 22.6% 8.0% 20.7% 8.5% 2.0%1991 100.0 44.8 19.2 10.3 17.6 7.1 1.11992 100.0 44.3 20.6 10.5 17.5 6.7 0.41993 100.0 47.3 18.1 11.0 16.6 6.6 0.41994 100.0 53.3 14.4 10.0 13.7 7.8 0.71995 100.0 59.0 12.6 9.3 11.9 6.9 0.31996 100.0 65.5 10.1 9.1 9.3 5.8 0.21997 100.0 69.2 8.3 8.6 7.8 5.8 0.31998 100.0 72.0 6.9 9.3 7.0 4.6 0.21999 100.0 77.6 5.6 7.4 5.1 4.2 0.12000 100.0 76.4 6.0 6.8 5.3 5.4 0.12001 100.0 73.0 8.1 7.9 6.2 4.7 0.02002 100.0 65.3 11.7 10.1 7.8 5.1 0.02003 100.0 70.1 9.4 9.3 6.2 4.8 0.12004 100.0 72.5 8.7 8.6 5.1 5.0 0.12005 100.0 73.6 8.9 8.0 4.8 4.4 0.22006 100.0 74.8 8.0 8.3 4.5 4.3 0.22007 100.0 74.2 8.4 8.8 4.1 4.3 0.22008 100.0 64.7 12.2 11.7 5.8 5.1 0.42009 100.0 65.3 10.9 13.1 5.8 4.7 0.22010 100.0 65.0 12.0 14.0 5.3 3.7 0.1
Note: Data for funds that invest primarily in other mutual funds were excluded from the series.Components may not add to the total because of rounding.
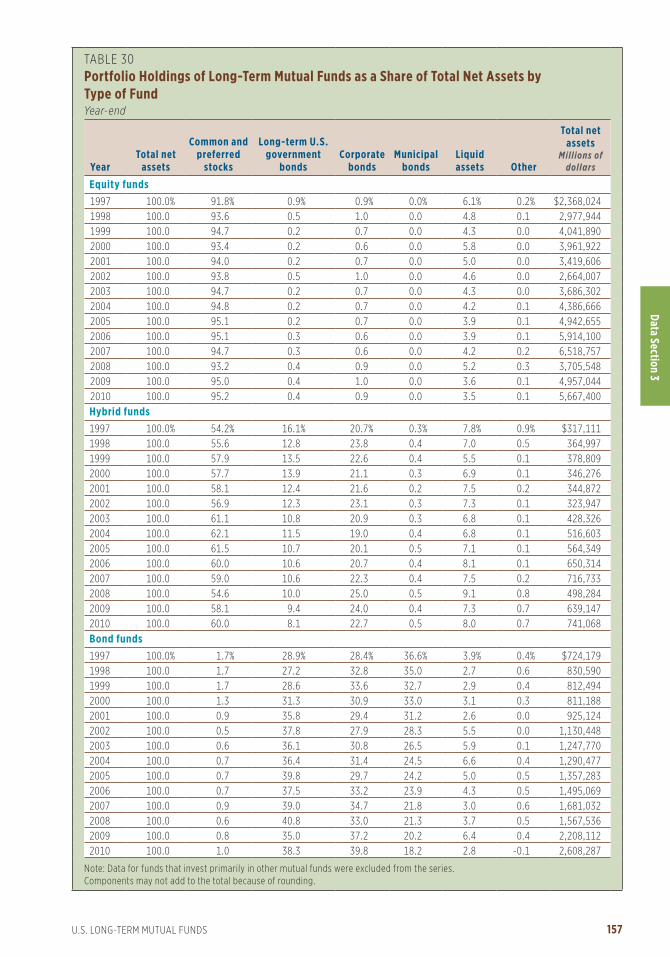
157U.S. LONG-TERM MUTUAL FUNDS
Data Section 3
TABLE 30Portfolio Holdings of Long-Term Mutual Funds as a Share of Total Net Assets by Type of FundYear-end
YearTotal net
assets
Common and preferred
stocks
Long-term U.S. government
bondsCorporate
bondsMunicipal
bondsLiquid assets Other
Total net assets
Millions of dollars
Equity funds1997 100.0% 91.8% 0.9% 0.9% 0.0% 6.1% 0.2% $2,368,0241998 100.0 93.6 0.5 1.0 0.0 4.8 0.1 2,977,9441999 100.0 94.7 0.2 0.7 0.0 4.3 0.0 4,041,8902000 100.0 93.4 0.2 0.6 0.0 5.8 0.0 3,961,9222001 100.0 94.0 0.2 0.7 0.0 5.0 0.0 3,419,6062002 100.0 93.8 0.5 1.0 0.0 4.6 0.0 2,664,0072003 100.0 94.7 0.2 0.7 0.0 4.3 0.0 3,686,3022004 100.0 94.8 0.2 0.7 0.0 4.2 0.1 4,386,6662005 100.0 95.1 0.2 0.7 0.0 3.9 0.1 4,942,6552006 100.0 95.1 0.3 0.6 0.0 3.9 0.1 5,914,1002007 100.0 94.7 0.3 0.6 0.0 4.2 0.2 6,518,7572008 100.0 93.2 0.4 0.9 0.0 5.2 0.3 3,705,5482009 100.0 95.0 0.4 1.0 0.0 3.6 0.1 4,957,0442010 100.0 95.2 0.4 0.9 0.0 3.5 0.1 5,667,400Hybrid funds1997 100.0% 54.2% 16.1% 20.7% 0.3% 7.8% 0.9% $317,1111998 100.0 55.6 12.8 23.8 0.4 7.0 0.5 364,9971999 100.0 57.9 13.5 22.6 0.4 5.5 0.1 378,8092000 100.0 57.7 13.9 21.1 0.3 6.9 0.1 346,2762001 100.0 58.1 12.4 21.6 0.2 7.5 0.2 344,8722002 100.0 56.9 12.3 23.1 0.3 7.3 0.1 323,9472003 100.0 61.1 10.8 20.9 0.3 6.8 0.1 428,3262004 100.0 62.1 11.5 19.0 0.4 6.8 0.1 516,6032005 100.0 61.5 10.7 20.1 0.5 7.1 0.1 564,3492006 100.0 60.0 10.6 20.7 0.4 8.1 0.1 650,3142007 100.0 59.0 10.6 22.3 0.4 7.5 0.2 716,7332008 100.0 54.6 10.0 25.0 0.5 9.1 0.8 498,2842009 100.0 58.1 9.4 24.0 0.4 7.3 0.7 639,1472010 100.0 60.0 8.1 22.7 0.5 8.0 0.7 741,068Bond funds1997 100.0% 1.7% 28.9% 28.4% 36.6% 3.9% 0.4% $724,1791998 100.0 1.7 27.2 32.8 35.0 2.7 0.6 830,5901999 100.0 1.7 28.6 33.6 32.7 2.9 0.4 812,4942000 100.0 1.3 31.3 30.9 33.0 3.1 0.3 811,1882001 100.0 0.9 35.8 29.4 31.2 2.6 0.0 925,1242002 100.0 0.5 37.8 27.9 28.3 5.5 0.0 1,130,4482003 100.0 0.6 36.1 30.8 26.5 5.9 0.1 1,247,7702004 100.0 0.7 36.4 31.4 24.5 6.6 0.4 1,290,4772005 100.0 0.7 39.8 29.7 24.2 5.0 0.5 1,357,2832006 100.0 0.7 37.5 33.2 23.9 4.3 0.5 1,495,0692007 100.0 0.9 39.0 34.7 21.8 3.0 0.6 1,681,0322008 100.0 0.6 40.8 33.0 21.3 3.7 0.5 1,567,5362009 100.0 0.8 35.0 37.2 20.2 6.4 0.4 2,208,1122010 100.0 1.0 38.3 39.8 18.2 2.8 -0.1 2,608,287
Note: Data for funds that invest primarily in other mutual funds were excluded from the series.Components may not add to the total because of rounding.
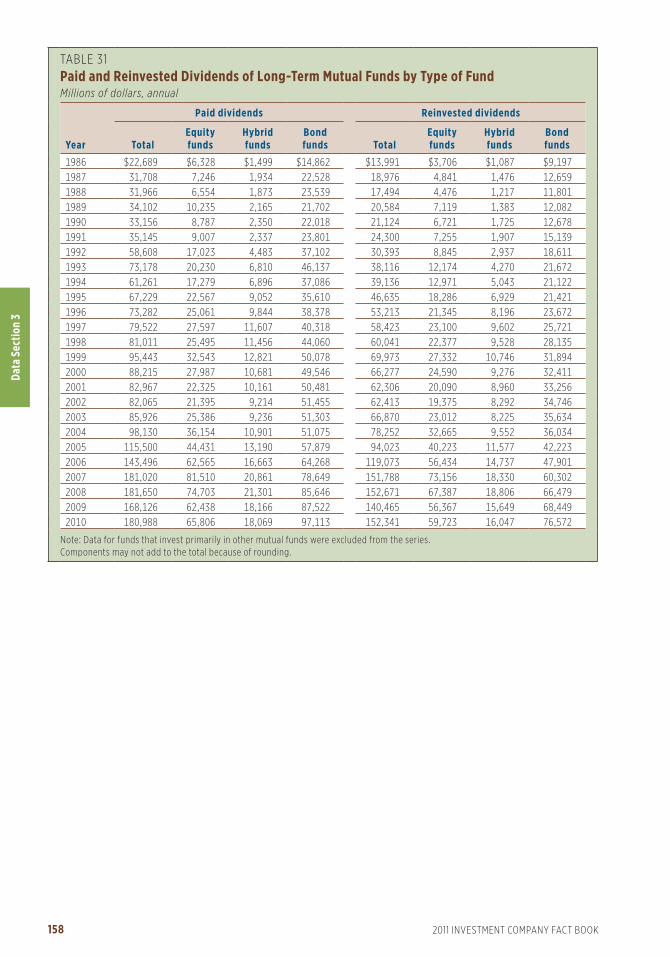
158 2011 INVESTMENT COMPANY FACT BOOK
Data
Sec
tion
3
TABLE 31Paid and Reinvested Dividends of Long-Term Mutual Funds by Type of FundMillions of dollars, annual
Year
Paid dividends Reinvested dividends
TotalEquityfunds
Hybridfunds
Bondfunds Total
Equityfunds
Hybridfunds
Bondfunds
1986 $22,689 $6,328 $1,499 $14,862 $13,991 $3,706 $1,087 $9,1971987 31,708 7,246 1,934 22,528 18,976 4,841 1,476 12,6591988 31,966 6,554 1,873 23,539 17,494 4,476 1,217 11,8011989 34,102 10,235 2,165 21,702 20,584 7,119 1,383 12,0821990 33,156 8,787 2,350 22,018 21,124 6,721 1,725 12,6781991 35,145 9,007 2,337 23,801 24,300 7,255 1,907 15,1391992 58,608 17,023 4,483 37,102 30,393 8,845 2,937 18,6111993 73,178 20,230 6,810 46,137 38,116 12,174 4,270 21,6721994 61,261 17,279 6,896 37,086 39,136 12,971 5,043 21,1221995 67,229 22,567 9,052 35,610 46,635 18,286 6,929 21,4211996 73,282 25,061 9,844 38,378 53,213 21,345 8,196 23,6721997 79,522 27,597 11,607 40,318 58,423 23,100 9,602 25,7211998 81,011 25,495 11,456 44,060 60,041 22,377 9,528 28,1351999 95,443 32,543 12,821 50,078 69,973 27,332 10,746 31,8942000 88,215 27,987 10,681 49,546 66,277 24,590 9,276 32,4112001 82,967 22,325 10,161 50,481 62,306 20,090 8,960 33,2562002 82,065 21,395 9,214 51,455 62,413 19,375 8,292 34,7462003 85,926 25,386 9,236 51,303 66,870 23,012 8,225 35,6342004 98,130 36,154 10,901 51,075 78,252 32,665 9,552 36,0342005 115,500 44,431 13,190 57,879 94,023 40,223 11,577 42,2232006 143,496 62,565 16,663 64,268 119,073 56,434 14,737 47,9012007 181,020 81,510 20,861 78,649 151,788 73,156 18,330 60,3022008 181,650 74,703 21,301 85,646 152,671 67,387 18,806 66,4792009 168,126 62,438 18,166 87,522 140,465 56,367 15,649 68,4492010 180,988 65,806 18,069 97,113 152,341 59,723 16,047 76,572
Note: Data for funds that invest primarily in other mutual funds were excluded from the series. Components may not add to the total because of rounding.

159U.S. LONG-TERM MUTUAL FUNDS
Data Section 3
TABLE 32Paid and Reinvested Capital Gains of Long-Term Mutual Funds by Type of Fund Millions of dollars, annual
Year
Paid capital gains Reinvested capital gains
TotalEquityfunds
Hybridfunds
Bondfunds Total
Equityfunds
Hybridfunds
Bondfunds
1986 $17,661 $13,942 $1,240 $2,478 $14,275 $11,851 $778 $1,6461987 22,926 18,603 1,605 2,718 17,816 15,449 1,056 1,3121988 6,354 4,785 620 948 4,769 3,883 364 5221989 14,766 12,665 540 1,562 9,710 8,744 348 6171990 8,017 6,833 443 742 5,515 4,975 255 2851991 13,917 11,961 861 1,095 9,303 8,242 485 5761992 22,089 17,294 1,488 3,306 14,906 12,233 1,134 1,5381993 35,905 27,705 3,496 4,704 25,514 19,954 2,697 2,8621994 29,744 26,351 2,411 981 24,864 22,038 2,093 7331995 54,271 50,204 3,343 724 46,866 43,550 2,845 4711996 100,489 88,212 10,826 1,451 87,416 76,638 9,769 1,0091997 182,764 160,744 19,080 2,941 164,916 145,358 17,360 2,1981998 164,989 138,681 21,572 4,737 151,105 127,473 19,698 3,9351999 237,624 219,484 16,841 1,299 206,508 190,300 15,229 9792000 325,841 307,586 17,808 446 298,429 281,339 16,719 3712001 68,626 60,717 5,488 2,421 64,820 57,564 5,198 2,0592002 16,097 10,886 548 4,663 14,749 10,186 530 4,0332003 14,397 7,728 813 5,856 12,956 7,142 748 5,0652004 54,741 42,286 5,982 6,473 49,896 38,740 5,547 5,6092005 129,042 113,878 11,274 3,890 117,556 103,816 10,410 3,3302006 256,915 236,622 18,218 2,076 236,466 217,589 17,099 1,7782007 413,630 380,193 29,984 3,453 380,975 349,876 28,096 3,0032008 132,406 110,278 8,613 13,514 123,273 103,270 8,141 11,8632009 15,680 6,104 413 9,163 14,370 5,781 402 8,1882010 42,909 15,532 1,767 25,610 38,922 14,594 1,659 22,670
Note: Data for funds that invest primarily in other mutual funds were excluded from the series. Components may not add to the total because of rounding.

160 2011 INVESTMENT COMPANY FACT BOOK
Data
Sec
tion
3
TABL
E 33
Tota
l Por
tfol
io, C
omm
on S
tock
, and
Oth
er S
ecur
ities
: Pur
chas
es, S
ales
, and
Net
Pur
chas
es b
y Lo
ng-T
erm
Mut
ual F
unds
Mill
ions
of d
olla
rs, a
nnua
l
Year
Tota
l por
tfol
ioCo
mm
on s
tock
Oth
er s
ecur
itie
s
Purc
hase
sSa
les
Net
pur
chas
esPu
rcha
ses
Sale
sN
et p
urch
ases
Purc
hase
sSa
les
Net
pur
chas
es
1986
$500
,597
$365
,087
$135
,509
$134
,446
$118
,026
$16,
421
$366
,150
$247
,062
$119
,089
1987
530,
601
485,
271
45,3
3019
8,85
917
6,00
422
,855
331,
741
309,
267
22,4
7419
8841
0,50
942
1,22
3-1
0,71
311
2,74
212
8,81
5-1
6,07
329
7,76
729
2,40
75,
359
1989
471,
744
445,
453
26,2
9114
2,77
114
1,69
41,
077
328,
973
303,
759
25,2
1419
9055
4,72
050
5,78
048
,940
166,
398
146,
580
19,8
1738
8,32
235
9,19
929
,123
1991
735,
674
608,
111
127,
563
250,
289
209,
276
41,0
1348
5,38
639
8,83
586
,551
1992
949,
366
758,
475
190,
891
327,
518
261,
857
65,6
6162
1,84
849
6,61
812
5,23
019
931,
335,
506
1,06
0,36
027
5,14
550
6,71
338
0,85
512
5,85
882
8,79
367
9,50
514
9,28
819
941,
433,
739
1,32
9,32
410
4,41
462
8,66
851
2,34
611
6,32
180
5,07
181
6,97
8-1
1,90
719
951,
550,
510
1,40
0,70
214
9,80
979
0,01
768
6,75
610
3,26
076
0,49
471
3,94
646
,548
1996
2,01
8,25
31,
736,
884
281,
370
1,15
1,26
292
7,26
622
3,99
686
6,99
180
9,61
857
,373
1997
2,38
4,63
92,
108,
981
275,
659
1,45
7,38
41,
268,
983
188,
401
927,
255
839,
997
87,2
5819
982,
861,
562
2,56
0,07
430
1,48
71,
762,
565
1,59
7,31
116
5,25
51,
098,
997
962,
764
136,
233
1999
3,43
7,18
03,
224,
301
212,
878
2,26
2,50
52,
088,
544
173,
962
1,17
4,67
41,
135,
757
38,9
1720
004,
922,
927
4,69
8,19
222
4,73
43,
560,
671
3,33
0,41
723
0,25
41,
362,
255
1,36
7,77
5-5
,519
2001
4,68
8,53
04,
393,
114
295,
416
2,73
6,93
32,
609,
657
127,
275
1,95
1,59
71,
783,
456
168,
141
2002
4,01
8,96
93,
807,
392
211,
578
2,17
6,36
32,
141,
754
34,6
091,
842,
606
1,66
5,63
817
6,96
820
034,
281,
605
3,99
8,76
628
2,84
02,
054,
379
1,88
4,71
116
9,66
72,
227,
227
2,11
4,05
411
3,17
320
044,
310,
180
4,01
9,27
329
0,90
72,
390,
924
2,19
8,57
819
2,34
61,
919,
256
1,82
0,69
598
,561
2005
4,83
4,37
44,
532,
166
302,
208
2,76
5,10
02,
610,
805
154,
296
2,06
9,27
41,
921,
362
147,
912
2006
5,73
7,37
95,
398,
123
339,
257
3,33
0,06
83,
172,
237
157,
832
2,40
7,31
12,
225,
886
181,
425
2007
7,09
9,17
46,
721,
565
377,
609
3,83
6,03
33,
733,
373
102,
660
3,26
3,14
12,
988,
192
274,
949
2008
7,35
3,80
37,
295,
224
58,5
793,
656,
331
3,71
6,02
5-5
9,69
43,
697,
472
3,57
9,19
911
8,27
320
096,
935,
792
6,45
4,75
748
1,03
42,
645,
445
2,54
3,65
010
1,79
64,
290,
346
3,91
1,10
837
9,23
920
107,
297,
941
6,84
6,70
445
1,23
82,
781,
498
2,73
6,47
845
,019
4,51
6,44
44,
110,
225
406,
219
Not
e: D
ata
for f
unds
that
inve
st p
rimar
ily in
oth
er m
utua
l fun
ds w
ere
excl
uded
from
the
serie
s.Co
mpo
nent
s m
ay n
ot a
dd to
the
tota
l bec
ause
of r
ound
ing.

161U.S. LONG-TERM MUTUAL FUNDS
Data Section 3
TABL
E 34
Tota
l Por
tfol
io, C
omm
on S
tock
, and
Oth
er S
ecur
ities
: Pur
chas
es, S
ales
, and
Net
Pur
chas
es b
y Eq
uity
Mut
ual F
unds
Mill
ions
of d
olla
rs, a
nnua
l
Year
Tota
l por
tfol
ioCo
mm
on s
tock
Oth
er s
ecur
itie
s
Purc
hase
sSa
les
Net
pur
chas
esPu
rcha
ses
Sale
sN
et p
urch
ases
Purc
hase
sSa
les
Net
pur
chas
es
1986
$129
,723
$111
,233
$18,
491
$110
,016
$96,
512
$13,
504
$19,
708
$14,
721
$4,9
8719
8719
6,90
217
5,29
221
,611
170,
715
150,
705
20,0
0926
,188
24,5
861,
601
1988
119,
861
130,
821
-10,
959
100,
888
113,
635
-12,
747
18,9
7317
,186
1,78
819
8914
8,34
614
4,75
33,
593
128,
998
127,
026
1,97
319
,348
17,7
281,
621
1990
187,
592
169,
373
18,2
1815
1,90
713
3,63
018
,277
35,6
8435
,743
-59
1991
251,
775
207,
946
43,8
2922
4,11
718
6,78
537
,333
27,6
5821
,162
6,49
619
9233
9,00
226
8,86
870
,134
300,
712
242,
319
58,3
9338
,290
26,5
4911
,741
1993
500,
197
382,
432
117,
765
451,
485
345,
357
106,
128
48,7
1237
,075
11,6
3719
9461
8,00
450
8,38
910
9,61
556
4,38
045
6,70
810
7,67
253
,623
51,6
811,
942
1995
785,
867
678,
060
107,
807
718,
298
621,
699
96,5
9967
,569
56,3
6111
,208
1996
1,11
6,90
689
6,64
422
0,26
21,
050,
884
832,
486
218,
397
66,0
2264
,157
1,86
519
971,
421,
211
1,22
3,46
319
7,74
81,
352,
085
1,16
6,64
918
5,43
669
,126
56,8
1412
,312
1998
1,72
3,75
21,
557,
212
166,
540
1,63
5,84
21,
475,
384
160,
458
87,9
0981
,827
6,08
219
992,
232,
821
2,04
9,53
918
3,28
22,
126,
853
1,94
1,50
418
5,34
910
5,96
810
8,03
5-2
,067
2000
3,53
7,39
43,
286,
115
251,
279
3,39
6,79
23,
152,
518
244,
274
140,
601
133,
597
7,00
520
012,
731,
622
2,61
6,10
711
5,51
62,
576,
761
2,46
9,08
210
7,67
915
4,86
114
7,02
57,
837
2002
2,15
6,88
22,
126,
447
30,4
352,
022,
673
2,00
6,16
516
,507
134,
210
120,
282
13,9
2720
031,
991,
674
1,83
9,64
215
2,03
31,
912,
286
1,76
1,50
015
0,78
679
,388
78,1
421,
246
2004
2,30
5,78
82,
128,
510
177,
277
2,22
5,25
62,
057,
243
168,
012
80,5
3271
,267
9,26
520
052,
704,
427
2,54
5,50
515
8,92
32,
601,
659
2,45
6,26
114
5,39
810
2,76
889
,243
13,5
2520
063,
269,
410
3,09
3,80
717
5,60
33,
146,
149
2,97
7,00
016
9,14
912
3,26
111
6,80
76,
454
2007
3,79
2,13
53,
671,
456
120,
679
3,59
1,68
83,
484,
353
107,
335
200,
447
187,
103
13,3
4420
083,
628,
851
3,69
8,46
8-6
9,61
73,
345,
555
3,41
3,84
7-6
8,29
228
3,29
628
4,62
1-1
,326
2009
2,77
9,69
92,
704,
572
75,1
272,
431,
202
2,34
1,17
590
,027
348,
497
363,
398
-14,
900
2010
2,84
3,37
02,
853,
003
-9,6
342,
550,
676
2,52
3,97
026
,706
292,
693
329,
033
-36,
339
Not
e: D
ata
for f
unds
that
inve
st p
rimar
ily in
oth
er m
utua
l fun
ds w
ere
excl
uded
from
the
serie
s.Co
mpo
nent
s m
ay n
ot a
dd to
the
tota
l bec
ause
of r
ound
ing.

162 2011 INVESTMENT COMPANY FACT BOOK
Data
Sec
tion
3
TABL
E 35
Tota
l Por
tfol
io, C
omm
on S
tock
, and
Oth
er S
ecur
ities
: Pur
chas
es, S
ales
, and
Net
Pur
chas
es b
y Hy
brid
Mut
ual F
unds
Mill
ions
of d
olla
rs, a
nnua
l
Year
Tota
l por
tfol
ioCo
mm
on s
tock
Oth
er s
ecur
itie
s
Purc
hase
sSa
les
Net
pur
chas
esPu
rcha
ses
Sale
sN
et p
urch
ases
Purc
hase
sSa
les
Net
pur
chas
es
1986
$34,
746
$28,
007
$6,7
39$2
1,89
4$1
9,45
1$2
,443
$12,
853
$8,5
56$4
,297
1987
48,3
3544
,168
4,16
826
,282
23,9
892,
293
22,0
5320
,179
1,87
419
8828
,070
31,4
55-3
,384
10,6
2813
,833
-3,2
0517
,442
17,6
22-1
7919
8926
,747
24,8
641,
883
12,4
5913
,598
-1,1
3914
,288
11,2
663,
022
1990
31,0
0327
,042
3,96
113
,329
11,8
491,
480
17,6
7415
,192
2,48
119
9142
,937
34,6
568,
281
18,6
5815
,435
3,22
324
,279
19,2
215,
058
1992
64,4
2943
,855
20,5
7423
,966
17,2
006,
766
40,4
6326
,655
13,8
0919
9311
6,82
174
,135
42,6
8649
,689
30,4
9019
,200
67,1
3143
,645
23,4
8619
9414
1,26
811
4,96
226
,306
54,8
1246
,429
8,38
386
,456
68,5
3317
,923
1995
189,
989
180,
066
9,92
367
,628
60,6
127,
016
122,
360
119,
454
2,90
719
9623
3,47
121
1,09
422
,377
92,4
9588
,487
4,00
814
0,97
612
2,60
718
,370
1997
266,
438
245,
278
21,1
6098
,115
94,9
903,
125
168,
323
150,
288
18,0
3619
9829
0,68
226
6,33
424
,347
115,
714
111,
414
4,30
017
4,96
715
4,92
020
,047
1999
303,
946
304,
642
-696
128,
313
138,
952
-10,
639
175,
633
165,
690
9,94
320
0031
7,61
733
9,13
5-2
1,51
715
6,08
216
8,52
0-1
2,43
816
1,53
617
0,61
5-9
,079
2001
360,
107
337,
367
22,7
4015
2,17
713
2,09
320
,084
207,
930
205,
274
2,65
620
0234
0,54
332
1,25
819
,285
142,
241
124,
414
17,8
2819
8,30
219
6,84
41,
457
2003
360,
701
318,
785
41,9
1612
9,37
011
1,74
317
,628
231,
330
207,
042
24,2
8820
0441
2,95
235
3,73
859
,215
156,
504
130,
888
25,6
1625
6,44
922
2,85
033
,599
2005
389,
769
350,
637
39,1
3215
7,03
914
7,68
09,
359
232,
730
202,
957
29,7
7320
0639
1,07
037
2,39
318
,678
176,
560
187,
855
-11,
296
214,
511
184,
537
29,9
7320
0752
3,17
047
7,54
145
,629
234,
408
238,
103
-3,6
9528
8,76
323
9,43
949
,324
2008
613,
713
594,
658
19,0
5530
0,64
728
9,09
211
,555
313,
066
305,
566
7,50
020
0946
5,63
143
2,97
432
,657
203,
898
194,
760
9,13
826
1,73
323
8,21
323
,519
2010
496,
461
452,
279
44,1
8221
1,79
619
7,48
414
,311
284,
665
254,
795
29,8
71
Not
e: D
ata
for f
unds
that
inve
st p
rimar
ily in
oth
er m
utua
l fun
ds w
ere
excl
uded
from
the
serie
s.Co
mpo
nent
s m
ay n
ot a
dd to
the
tota
l bec
ause
of r
ound
ing.

163U.S. LONG-TERM MUTUAL FUNDS
Data Section 3
TABL
E 36
Tota
l Por
tfol
io, C
omm
on S
tock
, and
Oth
er S
ecur
ities
: Pur
chas
es, S
ales
, and
Net
Pur
chas
es b
y Bo
nd M
utua
l Fun
dsM
illio
ns o
f dol
lars
, ann
ual
Year
Tota
l por
tfol
ioCo
mm
on s
tock
Oth
er s
ecur
itie
s
Purc
hase
sSa
les
Net
pur
chas
esPu
rcha
ses
Sale
sN
et p
urch
ases
Purc
hase
sSa
les
Net
pur
chas
es
1986
$336
,127
$225
,848
$110
,279
$2,5
37$2
,062
$475
$333
,590
$223
,785
$109
,805
1987
285,
363
265,
812
19,5
511,
862
1,31
055
328
3,50
126
4,50
218
,999
1988
262,
577
258,
947
3,63
01,
226
1,34
7-1
2126
1,35
125
7,60
03,
751
1989
296,
651
275,
836
20,8
151,
314
1,07
124
329
5,33
727
4,76
520
,572
1990
336,
125
309,
364
26,7
611,
161
1,10
160
334,
964
308,
264
26,7
0019
9144
0,96
236
5,50
975
,453
7,51
47,
056
457
433,
449
358,
453
74,9
9619
9254
5,93
444
5,75
210
0,18
22,
840
2,33
850
254
3,09
544
3,41
499
,680
1993
718,
488
603,
793
114,
694
5,53
85,
009
529
712,
950
598,
785
114,
165
1994
674,
467
705,
973
-31,
506
9,47
59,
209
266
664,
991
696,
764
-31,
773
1995
574,
655
542,
576
32,0
794,
091
4,44
5-3
5457
0,56
453
8,13
132
,433
1996
667,
876
629,
146
38,7
307,
884
6,29
21,
591
659,
992
622,
854
37,1
3919
9769
6,99
064
0,24
056
,750
7,18
47,
344
-160
689,
806
632,
896
56,9
1019
9884
7,12
973
6,52
911
0,60
011
,009
10,5
1249
683
6,12
072
6,01
611
0,10
419
9990
0,41
387
0,12
130
,292
7,33
98,
088
-749
893,
074
862,
033
31,0
4120
001,
067,
916
1,07
2,94
3-5
,027
7,79
79,
380
-1,5
821,
060,
118
1,06
3,56
3-3
,445
2001
1,59
6,80
01,
439,
640
157,
160
7,99
48,
482
-488
1,58
8,80
61,
431,
158
157,
648
2002
1,52
1,54
41,
359,
686
161,
858
11,4
4911
,175
274
1,51
0,09
51,
348,
512
161,
584
2003
1,92
9,23
01,
840,
339
88,8
9212
,722
11,4
691,
254
1,91
6,50
81,
828,
870
87,6
3820
041,
591,
441
1,53
7,02
554
,415
9,16
510
,447
-1,2
821,
582,
276
1,52
6,57
855
,698
2005
1,74
0,17
81,
636,
024
104,
153
6,40
26,
863
-461
1,73
3,77
61,
629,
161
104,
615
2006
2,07
6,89
91,
931,
923
144,
976
7,36
07,
382
-22
2,06
9,53
91,
924,
541
144,
998
2007
2,78
3,86
82,
572,
567
211,
301
9,93
710
,918
-981
2,77
3,93
12,
561,
650
212,
281
2008
3,11
1,23
93,
002,
098
109,
141
10,1
2913
,087
-2,9
583,
101,
110
2,98
9,01
111
2,09
920
093,
690,
462
3,31
7,21
237
3,25
010
,345
7,71
52,
631
3,68
0,11
63,
309,
497
370,
620
2010
3,95
8,11
13,
541,
421
416,
690
19,0
2615
,024
4,00
23,
939,
085
3,52
6,39
841
2,68
7
Not
e: D
ata
for f
unds
that
inve
st p
rimar
ily in
oth
er m
utua
l fun
ds w
ere
excl
uded
from
the
serie
s.Co
mpo
nent
s m
ay n
ot a
dd to
the
tota
l bec
ause
of r
ound
ing.

Data
Sec
tion
4
164 2011 INVESTMENT COMPANY FACT BOOK
TABLE 37Total Net Assets and Number of Shareholder Accounts of Money Market Funds by Type of FundYear-end
Year
Total net assetsMillions of dollars
Number of shareholder accounts*Thousands
Total
Taxable
Tax- exempt Total
Taxable
Tax- exemptGovernment
Non-government Government
Non-government
1986 $292,152 $63,736 $164,610 $63,806 16,313 2,397 13,256 6601987 316,096 67,589 187,087 61,420 17,675 2,484 14,348 8421988 337,954 61,298 210,897 65,758 18,570 1,684 15,947 9391989 428,093 74,685 283,939 69,470 21,314 1,814 18,359 1,1411990 498,341 109,376 305,189 83,777 22,969 2,283 19,294 1,3911991 542,442 138,111 314,346 89,984 23,556 2,557 19,306 1,6931992 546,194 151,043 300,310 94,841 23,647 2,826 18,945 1,8761993 565,319 149,180 312,701 103,439 23,585 2,806 18,780 1,9991994 611,005 148,139 352,972 109,894 25,379 3,047 20,295 2,0371995 753,018 181,494 449,829 121,695 30,137 3,823 24,042 2,2711996 901,807 223,790 540,146 137,871 32,200 4,241 25,688 2,2711997 1,058,886 254,223 647,005 157,658 35,624 4,643 28,342 2,6381998 1,351,678 312,907 854,061 184,711 38,847 4,452 32,009 2,3861999 1,613,146 333,726 1,079,523 199,897 43,616 4,843 36,344 2,4282000 1,845,248 359,166 1,252,212 233,869 48,138 4,941 40,548 2,6492001 2,285,310 463,764 1,562,465 259,081 47,236 6,792 37,632 2,8112002 2,265,075 455,507 1,533,271 276,297 45,380 6,800 35,925 2,6552003 2,040,022 410,481 1,339,249 290,291 41,214 5,960 32,451 2,8032004 1,901,336 380,238 1,209,099 311,999 37,636 5,619 29,174 2,8432005 2,026,822 399,892 1,290,557 336,373 36,837 5,530 28,501 2,8062006 2,338,451 426,819 1,542,603 369,029 37,067 4,297 29,707 3,0632007 3,085,760 759,934 1,857,735 468,092 39,130 4,682 30,978 3,4692008 3,832,236 1,489,740 1,848,817 493,680 38,111 5,410 29,087 3,6142009 3,315,893 1,106,879 1,810,078 398,935 33,466 5,308 24,992 3,1662010 2,803,922 855,021 1,618,896 330,006 30,606 4,511 22,924 3,171
* Number of shareholder accounts includes a mix of individual and omnibus accounts. Note: Data for funds that invest primarily in other mutual funds were excluded from the series. Components may not add to the total because of rounding.

Data Section 4
165U.S. MONEY MARKET FUNDS
TABLE 38Number of Funds and Number of Share Classes of Money Market Funds by Type of FundYear-end
Year
Number of funds Number of share classes
Total
Taxable
Tax- exempt Total
Taxable
Tax- exemptGovernment
Non-government Government
Non-government
1986 487 147 213 127 487 147 213 1271987 543 154 235 154 543 154 235 1541988 610 159 274 177 610 159 274 1771989 673 160 310 203 673 160 310 2031990 741 176 329 236 762 183 339 2401991 820 211 341 268 871 228 363 2801992 864 235 350 279 914 248 368 2981993 920 265 362 293 1,009 286 386 3371994 963 276 373 314 1,261 368 490 4031995 997 284 392 321 1,380 404 549 4271996 988 277 392 319 1,453 413 592 4481997 1,013 279 406 328 1,549 442 633 4741998 1,026 277 410 339 1,627 462 675 4901999 1,045 281 423 341 1,730 488 742 5002000 1,039 276 428 335 1,855 533 798 5242001 1,015 272 418 325 1,948 575 830 5432002 988 262 415 311 2,006 582 881 5432003 973 253 407 313 2,031 575 887 5692004 942 242 395 305 2,046 580 890 5762005 870 223 370 277 2,031 572 892 5672006 847 216 357 274 2,012 576 878 5582007 805 202 343 260 2,018 568 880 5702008 783 198 336 249 1,988 577 868 5432009 704 179 297 228 1,849 560 772 5172010 652 165 277 210 1,783 544 739 500
Note: Data for funds that invest primarily in other mutual funds were excluded from the series.

Data
Sec
tion
4
166 2011 INVESTMENT COMPANY FACT BOOK
TABL
E 39
Tota
l Net
Ass
ets o
f Mon
ey M
arke
t Fun
ds b
y Ty
pe o
f Fun
dM
illio
ns o
f dol
lars
, yea
r-en
d
Year
All m
oney
mar
ket f
unds
Reta
il m
oney
mar
ket f
unds
Inst
itut
iona
l mon
ey m
arke
t fun
ds
Tota
l
Taxa
ble
Tax-
ex
empt
Tota
l
Taxa
ble
Tax-
ex
empt
Tota
l
Taxa
ble
Tax-
ex
empt
Gove
rnm
ent
Non
-go
vern
men
tGo
vern
men
tN
on-
gove
rnm
ent
Gove
rnm
ent
Non
-go
vern
men
t
1996
$901
,807
$223
,790
$540
,146
$137
,871
$592
,604
$94,
786
$387
,705
$110
,113
$309
,203
$129
,003
$152
,441
$27,
758
1997
1,05
8,88
625
4,22
364
7,00
515
7,65
866
3,40
810
0,99
143
9,67
012
2,74
739
5,47
815
3,23
220
7,33
434
,911
1998
1,35
1,67
831
2,90
785
4,06
118
4,71
183
5,25
512
1,66
457
1,46
514
2,12
651
6,42
319
1,24
328
2,59
642
,585
1999
1,61
3,14
633
3,72
61,
079,
523
199,
897
964,
686
132,
915
675,
986
155,
785
648,
460
200,
812
403,
537
44,1
1120
001,
845,
248
359,
166
1,25
2,21
223
3,86
91,
061,
923
141,
122
741,
762
179,
039
783,
325
218,
044
510,
450
54,8
3020
012,
285,
310
463,
764
1,56
2,46
525
9,08
11,
132,
956
167,
712
775,
760
189,
484
1,15
2,35
429
6,05
278
6,70
669
,597
2002
2,26
5,07
545
5,50
71,
533,
271
276,
297
1,06
2,10
315
4,46
071
5,61
819
2,02
51,
202,
973
301,
047
817,
653
84,2
7220
032,
040,
022
410,
481
1,33
9,24
929
0,29
193
5,55
713
8,62
160
6,32
419
0,61
21,
104,
465
271,
860
732,
926
99,6
7920
041,
901,
336
380,
238
1,20
9,09
931
1,99
984
9,47
212
3,96
453
3,71
419
1,79
41,
051,
864
256,
274
675,
385
120,
205
2005
2,02
6,82
239
9,89
21,
290,
557
336,
373
872,
557
123,
763
545,
389
203,
406
1,15
4,26
527
6,12
974
5,16
813
2,96
820
062,
338,
451
426,
819
1,54
2,60
336
9,02
91,
004,
092
138,
218
641,
830
224,
043
1,33
4,35
928
8,60
190
0,77
314
4,98
620
073,
085,
760
759,
934
1,85
7,73
546
8,09
21,
220,
122
182,
423
752,
109
285,
590
1,86
5,63
957
7,51
11,
105,
626
182,
503
2008
3,83
2,23
61,
489,
740
1,84
8,81
749
3,68
01,
361,
966
285,
658
773,
095
303,
212
2,47
0,27
11,
204,
082
1,07
5,72
219
0,46
720
093,
315,
893
1,10
6,87
91,
810,
078
398,
935
1,06
8,65
920
4,09
562
9,21
923
5,34
52,
247,
234
902,
784
1,18
0,86
016
3,59
020
102,
803,
922
855,
021
1,61
8,89
633
0,00
694
5,33
217
8,25
656
1,13
220
5,94
41,
858,
590
676,
764
1,05
7,76
312
4,06
2
Not
e: D
ata
for f
unds
that
inve
st p
rimar
ily in
oth
er m
utua
l fun
ds w
ere
excl
uded
from
the
serie
s.Co
mpo
nent
s m
ay n
ot a
dd to
the
tota
l bec
ause
of r
ound
ing.

Data Section 4
167U.S. MONEY MARKET FUNDS
TABL
E 39
Tota
l Net
Ass
ets o
f Mon
ey M
arke
t Fun
ds b
y Ty
pe o
f Fun
dM
illio
ns o
f dol
lars
, yea
r-en
d
Year
All m
oney
mar
ket f
unds
Reta
il m
oney
mar
ket f
unds
Inst
itut
iona
l mon
ey m
arke
t fun
ds
Tota
l
Taxa
ble
Tax-
ex
empt
Tota
l
Taxa
ble
Tax-
ex
empt
Tota
l
Taxa
ble
Tax-
ex
empt
Gove
rnm
ent
Non
-go
vern
men
tGo
vern
men
tN
on-
gove
rnm
ent
Gove
rnm
ent
Non
-go
vern
men
t
1996
$901
,807
$223
,790
$540
,146
$137
,871
$592
,604
$94,
786
$387
,705
$110
,113
$309
,203
$129
,003
$152
,441
$27,
758
1997
1,05
8,88
625
4,22
364
7,00
515
7,65
866
3,40
810
0,99
143
9,67
012
2,74
739
5,47
815
3,23
220
7,33
434
,911
1998
1,35
1,67
831
2,90
785
4,06
118
4,71
183
5,25
512
1,66
457
1,46
514
2,12
651
6,42
319
1,24
328
2,59
642
,585
1999
1,61
3,14
633
3,72
61,
079,
523
199,
897
964,
686
132,
915
675,
986
155,
785
648,
460
200,
812
403,
537
44,1
1120
001,
845,
248
359,
166
1,25
2,21
223
3,86
91,
061,
923
141,
122
741,
762
179,
039
783,
325
218,
044
510,
450
54,8
3020
012,
285,
310
463,
764
1,56
2,46
525
9,08
11,
132,
956
167,
712
775,
760
189,
484
1,15
2,35
429
6,05
278
6,70
669
,597
2002
2,26
5,07
545
5,50
71,
533,
271
276,
297
1,06
2,10
315
4,46
071
5,61
819
2,02
51,
202,
973
301,
047
817,
653
84,2
7220
032,
040,
022
410,
481
1,33
9,24
929
0,29
193
5,55
713
8,62
160
6,32
419
0,61
21,
104,
465
271,
860
732,
926
99,6
7920
041,
901,
336
380,
238
1,20
9,09
931
1,99
984
9,47
212
3,96
453
3,71
419
1,79
41,
051,
864
256,
274
675,
385
120,
205
2005
2,02
6,82
239
9,89
21,
290,
557
336,
373
872,
557
123,
763
545,
389
203,
406
1,15
4,26
527
6,12
974
5,16
813
2,96
820
062,
338,
451
426,
819
1,54
2,60
336
9,02
91,
004,
092
138,
218
641,
830
224,
043
1,33
4,35
928
8,60
190
0,77
314
4,98
620
073,
085,
760
759,
934
1,85
7,73
546
8,09
21,
220,
122
182,
423
752,
109
285,
590
1,86
5,63
957
7,51
11,
105,
626
182,
503
2008
3,83
2,23
61,
489,
740
1,84
8,81
749
3,68
01,
361,
966
285,
658
773,
095
303,
212
2,47
0,27
11,
204,
082
1,07
5,72
219
0,46
720
093,
315,
893
1,10
6,87
91,
810,
078
398,
935
1,06
8,65
920
4,09
562
9,21
923
5,34
52,
247,
234
902,
784
1,18
0,86
016
3,59
020
102,
803,
922
855,
021
1,61
8,89
633
0,00
694
5,33
217
8,25
656
1,13
220
5,94
41,
858,
590
676,
764
1,05
7,76
312
4,06
2
Not
e: D
ata
for f
unds
that
inve
st p
rimar
ily in
oth
er m
utua
l fun
ds w
ere
excl
uded
from
the
serie
s.Co
mpo
nent
s m
ay n
ot a
dd to
the
tota
l bec
ause
of r
ound
ing.
TABL
E 40
Net N
ew C
ash
Flow
of M
oney
Mar
ket F
unds
by
Type
of F
und
M
illio
ns o
f dol
lars
, ann
ual
Year
All m
oney
mar
ket f
unds
Reta
il m
oney
mar
ket f
unds
Inst
itut
iona
l mon
ey m
arke
t fun
ds
Tota
l
Taxa
ble
Tax-
ex
empt
Tota
l
Taxa
ble
Tax-
ex
empt
Tota
l
Taxa
ble
Tax-
ex
empt
Gove
rnm
ent
Non
-go
vern
men
tGo
vern
men
tN
on-
gove
rnm
ent
Gove
rnm
ent
Non
-go
vern
men
t
1996
$89,
422
$20,
572
$58,
935
$9,9
15$5
2,88
6$6
,181
$39,
505
$7,2
00$3
6,53
6$1
4,39
1$1
9,43
0$2
,715
1997
103,
466
20,1
2969
,107
14,2
3146
,620
4,78
132
,081
9,75
856
,846
15,3
4737
,026
4,47
319
9823
5,45
745
,178
167,
909
22,3
7013
0,99
215
,835
100,
428
14,7
2810
4,46
529
,343
67,4
817,
642
1999
193,
681
8,48
617
4,95
710
,238
82,0
06-7
5772
,935
9,82
711
1,67
59,
243
102,
021
411
2000
159,
365
14,4
9411
8,30
826
,563
43,6
23-7
2725
,679
18,6
7211
5,74
115
,222
92,6
297,
891
2001
375,
291
85,9
1026
8,04
021
,340
36,2
6212
,714
13,5
3010
,017
339,
029
73,1
9625
4,51
011
,323
2002
-45,
937
-10,
923
-51,
268
16,2
54-8
0,69
0-1
0,53
0-7
1,48
91,
328
34,7
53-3
9320
,220
14,9
2520
03-2
63,4
03-5
2,32
7-2
20,8
509,
774
-151
,649
-20,
771
-125
,971
-4,9
08-1
11,7
54-3
1,55
6-9
4,88
014
,682
2004
-156
,713
-35,
584
-139
,155
18,0
27-8
8,83
6-1
5,71
6-7
5,55
52,
434
-67,
876
-19,
869
-63,
600
15,5
9220
0562
,082
13,1
1528
,075
20,8
912,
202
-3,6
74-4
,912
10,7
8859
,880
16,7
9032
,988
10,1
0320
0624
5,23
619
,041
200,
763
25,4
3296
,174
9,61
670
,533
16,0
2414
9,06
29,
425
130,
230
9,40
820
0765
4,47
631
9,12
725
1,32
784
,022
171,
269
38,0
4482
,532
50,6
9348
3,20
728
1,08
216
8,79
533
,329
2008
637,
122
697,
455
-73,
532
13,1
9811
2,59
597
,393
1,47
613
,727
524,
526
600,
063
-75,
008
-528
2009
-539
,139
-414
,767
-28,
741
-95,
631
-308
,729
-104
,306
-136
,829
-67,
595
-230
,410
-310
,461
108,
088
-28,
036
2010
-524
,658
-253
,927
-201
,359
-69,
372
-125
,283
-27,
218
-69,
667
-28,
398
-399
,375
-226
,708
-131
,692
-40,
975
Not
e: D
ata
for f
unds
that
inve
st p
rimar
ily in
oth
er m
utua
l fun
ds w
ere
excl
uded
from
the
serie
s.Co
mpo
nent
s m
ay n
ot a
dd to
the
tota
l bec
ause
of r
ound
ing.

Data
Sec
tion
4
168 2011 INVESTMENT COMPANY FACT BOOK
TABLE 41Net New Cash Flow and Components of Net New Cash Flow of Money Market Funds Millions of dollars, annual
YearNet new
cash flow1
Sales Redemptions
New + exchange New2 Exchange3
Regular + exchange Regular4 Exchange5
1986 $33,552 $1,026,745 $978,041 $48,704 $993,193 $948,656 $44,5371987 10,072 1,147,877 1,049,034 98,843 1,137,805 1,062,671 75,1331988 106 1,130,639 1,066,003 64,636 1,130,534 1,074,346 56,1881989 64,132 1,359,616 1,296,458 63,158 1,295,484 1,235,527 59,9571990 23,179 1,461,537 1,389,439 72,098 1,438,358 1,372,764 65,5941991 6,068 1,841,131 1,778,491 62,640 1,835,063 1,763,106 71,9571992 -16,006 2,449,766 2,371,925 77,841 2,465,772 2,382,976 82,7961993 -13,890 2,756,282 2,665,987 90,295 2,770,172 2,673,464 96,7071994 8,525 2,725,201 2,586,478 138,722 2,716,675 2,599,400 117,2751995 89,381 3,234,216 3,097,225 136,990 3,144,834 3,001,968 142,8661996 89,422 4,156,985 3,959,014 197,971 4,067,563 3,868,772 198,7911997 103,466 5,127,328 4,894,226 233,102 5,023,863 4,783,096 240,7671998 235,457 6,407,574 6,129,140 278,434 6,172,116 5,901,590 270,5261999 193,681 8,080,959 7,719,310 361,649 7,887,278 7,540,912 346,3672000 159,365 9,826,677 9,406,287 420,391 9,667,312 9,256,350 410,9622001 375,291 11,737,291 11,426,804 310,487 11,362,000 11,065,468 296,5332002 -45,937 12,008,801 11,712,587 296,215 12,054,738 11,783,209 271,5302003 -263,403 11,177,118 10,952,544 224,574 11,440,521 11,213,929 226,5922004 -156,713 10,860,499 10,694,008 166,492 11,017,212 10,846,935 170,2772005 62,082 12,493,663 12,317,518 176,145 12,431,581 12,260,802 170,7792006 245,236 15,707,260 15,496,005 211,256 15,462,024 15,269,381 192,6432007 654,476 21,315,157 21,040,070 275,087 20,660,681 20,409,373 251,3072008 637,122 24,452,449 24,067,390 385,059 23,815,327 23,498,664 316,6632009 -539,139 18,683,752 18,489,354 194,399 19,222,891 19,012,375 210,5162010 -524,658 15,771,387 15,670,167 101,220 16,296,045 16,191,487 104,558
1 Net new cash flow is the dollar value of new sales minus redemptions combined with net exchanges.2 New sales are the dollar value of new purchases of mutual fund shares. This does not include shares purchased through
reinvestment of dividends in existing accounts.3 Exchange sales are the dollar value of mutual fund shares switched into funds within the same fund group.4 Regular redemptions are the dollar value of shareholder liquidation of mutual fund shares.5 Exchange redemptions are the dollar value of mutual fund shares switched out of funds and into other funds in the same fund group. Note: Data for funds that invest primarily in other mutual funds were excluded from the series. Components may not add to the total because of rounding.

Data Section 4
169U.S. MONEY MARKET FUNDS
TABLE 42Paid and Reinvested Dividends of Money Market Funds by Type of FundMillions of dollars, annual
Year
Paid dividends Reinvested dividends
Total
Taxable money market
funds
Tax-exempt money market
funds Total
Taxable money market
funds
Tax-exempt money market
funds
1986 $14,832 $12,432 $2,400 $11,514 $9,981 $1,5331987 15,654 12,833 2,821 11,946 10,136 1,8101988 21,618 17,976 3,642 15,692 13,355 2,3371989 28,619 24,683 3,936 23,050 20,294 2,7561990 30,258 26,448 3,810 26,282 23,226 3,0561991 28,604 25,121 3,483 22,809 19,998 2,8111992 20,280 17,197 3,083 14,596 12,567 2,0291993 18,991 15,690 3,302 11,615 10,007 1,6071994 23,737 20,504 3,233 16,739 14,626 2,1131995 37,038 32,855 4,183 27,985 24,873 3,1111996 42,555 38,446 4,108 31,516 28,448 3,0681997 48,843 44,185 4,658 37,979 34,425 3,5541998 57,375 52,164 5,211 43,443 39,580 3,8631999 69,004 63,229 5,775 50,648 46,602 4,0462000 98,219 90,154 8,064 72,771 66,887 5,8842001 79,307 73,361 5,946 56,367 51,949 4,4182002 32,251 29,397 2,854 22,033 19,940 2,0932003 17,041 15,124 1,917 11,314 9,916 1,3982004 18,374 15,891 2,482 11,883 10,077 1,8072005 50,186 43,547 6,639 32,803 27,951 4,8522006 96,425 85,020 11,405 61,489 53,268 8,2202007 127,908 113,178 14,730 82,457 71,938 10,5192008 93,858 82,727 11,130 61,135 53,455 7,6802009 18,619 16,590 2,030 11,035 9,999 1,0372010 7,171 6,718 453 4,461 4,209 252
Note: Data for funds that invest primarily in other mutual funds were excluded from the series. Components may not add to the total because of rounding.

Data
Sec
tion
4
170 2011 INVESTMENT COMPANY FACT BOOK
TABL
E 43
Asse
t Com
posi
tion
of T
axab
le G
over
nmen
t Mon
ey M
arke
t Fun
ds a
s a P
erce
ntag
e of
Tot
al N
et A
sset
sYe
ar-e
nd
Year
Tota
l net
as
sets
Mill
ions
of
dolla
rs
U.S.
Tr
easu
ry
bills
Oth
er
Trea
sury
se
curi
ties
U.S.
go
vern
men
t ag
ency
issu
esRe
purc
hase
ag
reem
ents
Cert
ific
ates
of
dep
osit
Euro
dolla
r CD
sCo
mm
erci
al
pape
rBa
nk
note
s1Co
rpor
ate
note
s2O
ther
as
sets
3
Aver
age
mat
urit
y D
ays
1986
$63,
736
22.8
%7.
9%14
.4%
39.1
%4.
1%4.
9%4.
3%–
–
2.
5%51
1987
67,5
894.
611
.222
.044
.94.
87.
44.
0–
–
1.
135
1988
61,2
985.
09.
720
.558
.41.
20.
13.
2–
–
2.
028
1989
74,6
855.
06.
920
.662
.70.
20.
13.
0–
–
1.
531
1990
109,
376
11.1
12.2
20.6
45.7
0.0
0.0
0.3
–
–
9.9
4619
9113
8,11
121
.516
.520
.340
.90.
00.
00.
4–
–
0.
358
1992
151,
043
26.0
16.5
21.6
34.7
0.0
0.0
0.5
–
–
0.6
5519
9314
9,18
030
.314
.120
.732
.80.
00.
00.
3–
–
1.
861
1994
148,
139
24.4
12.6
26.3
34.0
0.0
0.0
0.4
0.0%
–
2.2
3719
9518
1,49
419
.813
.928
.534
.10.
00.
00.
50.
0–
3.
148
1996
223,
790
17.7
18.5
25.4
35.2
0.0
0.1
0.7
0.0
–
2.4
4919
9725
4,22
315
.217
.625
.137
.80.
10.
01.
20.
1–
2.
950
1998
312,
907
14.3
17.7
30.4
33.4
0.3
0.0
1.7
0.1
0.2%
2.0
5219
9933
3,72
617
.113
.037
.128
.20.
10.
01.
40.
11.
11.
948
2000
359,
166
14.5
10.3
31.7
37.2
0.0
0.0
2.1
0.1
1.2
2.9
4520
0146
3,76
419
.19.
134
.431
.60.
20.
00.
70.
01.
73.
255
2002
455,
507
20.3
6.4
33.1
35.4
0.1
0.0
0.8
0.0
1.7
2.1
5220
0341
0,48
119
.97.
233
.936
.20.
30.
00.
90.
01.
9-0
.352
2004
380,
238
21.3
4.9
34.6
35.9
0.2
0.0
0.9
0.1
0.9
1.2
3620
0539
9,89
215
.84.
428
.149
.90.
00.
00.
30.
10.
80.
627
2006
426,
819
14.9
4.0
21.6
58.6
0.1
0.0
0.4
0.0
0.1
0.3
3220
0775
9,93
416
.35.
124
.153
.70.
30.
00.
20.
00.
00.
231
2008
1,48
9,74
030
.56.
236
.226
.80.
00.
00.
10.
10.
2-0
.148
2009
1,10
6,87
925
.66.
035
.430
.60.
00.
01.
00.
20.
30.
747
2010
855,
021
22.9
8.5
33.3
33.0
0.0
0.0
0.9
0.1
0.4
0.9
471
Prio
r to
1994
, ban
k no
tes
are
incl
uded
in o
ther
ass
ets.
2 Pr
ior t
o 19
98, c
orpo
rate
not
es a
re in
clud
ed in
oth
er a
sset
s.3
Oth
er a
sset
s in
clud
e ba
nker
’s ac
cept
ance
s, m
unic
ipal
sec
uriti
es, a
nd c
ash
rese
rves
. N
ote:
Dat
a fo
r fun
ds th
at in
vest
prim
arily
in o
ther
mut
ual f
unds
wer
e ex
clud
ed fr
om th
e se
ries.
Com
pone
nts
may
not
add
to 10
0 pe
rcen
t bec
ause
of r
ound
ing.
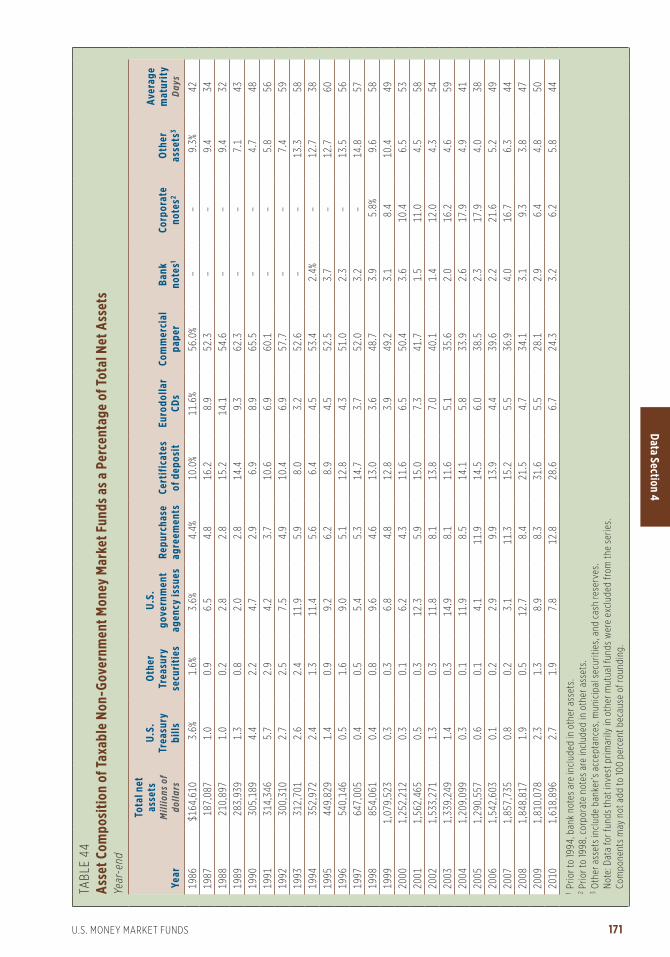
Data Section 4
171U.S. MONEY MARKET FUNDS
TABL
E 44
Asse
t Com
posi
tion
of T
axab
le N
on-G
over
nmen
t Mon
ey M
arke
t Fun
ds a
s a P
erce
ntag
e of
Tot
al N
et A
sset
sYe
ar-e
nd
Year
Tota
l net
as
sets
Mill
ions
of
dolla
rs
U.S.
Tr
easu
ry
bills
Oth
er
Trea
sury
se
curi
ties
U.S.
go
vern
men
t ag
ency
issu
esRe
purc
hase
ag
reem
ents
Cert
ific
ates
of
dep
osit
Euro
dolla
r CD
sCo
mm
erci
al
pape
rBa
nk
note
s1Co
rpor
ate
note
s2O
ther
as
sets
3
Aver
age
mat
urit
y D
ays
1986
$164
,610
3.6%
1.6%
3.6%
4.4%
10.0
%11
.6%
56.0
%–
–
9.
3%42
1987
187
,087
1.
00.
96.
54.
816
.28.
952
.3–
–
9.
434
1988
210
,897
1.
00.
22.
82.
815
.214
.154
.6–
–
9.
432
1989
283
,939
1.
30.
82.
02.
814
.49.
362
.3–
–
7.
143
1990
305
,189
4.
42.
24.
72.
96.
98.
965
.5–
–
4.
748
1991
314
,346
5.
72.
94.
23.
710
.66.
960
.1–
–
5.
856
1992
300
,310
2.
72.
57.
54.
910
.46.
957
.7–
–
7.
459
1993
312
,701
2.
62.
411
.95.
98.
03.
252
.6–
–
13
.358
1994
352
,972
2.
41.
311
.45.
66.
44.
553
.42.
4%–
12
.738
1995
449
,829
1.
40.
99.
26.
28.
94.
552
.53.
7–
12
.760
1996
540
,146
0.
51.
69.
05.
112
.84.
351
.02.
3–
13
.556
1997
647
,005
0.
40.
55.
45.
314
.73.
752
.03.
2–
14
.857
1998
854
,061
0.
40.
89.
64.
613
.03.
648
.73.
95.
8%9.
658
1999
1,0
79,5
23
0.3
0.3
6.8
4.8
12.8
3.9
49.2
3.1
8.4
10.4
4920
00 1
,252
,212
0.
30.
16.
24.
311
.66.
550
.43.
610
.46.
553
2001
1,5
62,4
65
0.5
0.3
12.3
5.9
15.0
7.3
41.7
1.5
11.0
4.5
5820
02 1
,533
,271
1.
30.
311
.88.
113
.87.
040
.11.
412
.04.
354
2003
1,3
39,2
49
1.4
0.3
14.9
8.1
11.6
5.1
35.6
2.0
16.2
4.6
5920
04 1
,209
,099
0.
30.
111
.98.
514
.15.
833
.92.
617
.94.
941
2005
1,2
90,5
57
0.6
0.1
4.1
11.9
14.5
6.0
38.5
2.3
17.9
4.0
3820
06 1
,542
,603
0.
10.
22.
99.
913
.94.
439
.62.
221
.65.
249
2007
1,8
57,7
35
0.8
0.2
3.1
11.3
15.2
5.5
36.9
4.0
16.7
6.3
4420
08 1
,848
,817
1.
90.
512
.78.
421
.54.
734
.13.
19.
33.
847
2009
1,8
10,0
78
2.3
1.3
8.9
8.3
31.6
5.5
28.1
2.9
6.4
4.8
5020
10 1
,618
,896
2.
71.
97.
812
.828
.66.
724
.33.
26.
25.
844
1 Pr
ior t
o 19
94, b
ank
note
s ar
e in
clud
ed in
oth
er a
sset
s.2
Prio
r to
1998
, cor
pora
te n
otes
are
incl
uded
in o
ther
ass
ets.
3 O
ther
ass
ets
incl
ude
bank
er’s
acce
ptan
ces,
mun
icip
al s
ecur
ities
, and
cas
h re
serv
es.
Not
e: D
ata
for f
unds
that
inve
st p
rimar
ily in
oth
er m
utua
l fun
ds w
ere
excl
uded
from
the
serie
s. C
ompo
nent
s m
ay n
ot a
dd to
100
perc
ent b
ecau
se o
f rou
ndin
g.

Data
Sec
tion
5
172 2011 INVESTMENT COMPANY FACT BOOK
TABL
E 45
Fund
s of F
unds
:1 Tot
al N
et A
sset
s, N
et N
ew C
ash
Flow
, Num
ber o
f Fun
ds, a
nd N
umbe
r of S
hare
Cla
sses
Year
Tota
l net
ass
ets
Mill
ions
of d
olla
rs, y
ear-
end
Net
new
cas
h fl
ow2
Mill
ions
of d
olla
rs, a
nnua
lN
umbe
r of f
unds
Year
-end
Num
ber o
f sha
re c
lass
esYe
ar-e
nd
Tota
lEq
uity
Hybr
id
and
bond
Tota
lEq
uity
Hybr
id
and
bond
Tota
lEq
uity
Hybr
id
and
bond
Tota
lEq
uity
Hybr
id
and
bond
1990
$1,4
26$2
11$1
,215
$131
-$21
$152
2011
920
119
1991
2,31
340
31,
910
475
9737
820
1010
2010
1019
923,
722
651
3,07
21,
134
205
929
2110
1121
1011
1993
5,40
390
04,
503
1,16
015
41,
006
2412
1224
1212
1994
6,17
01,
367
4,80
356
734
222
532
1517
3215
1719
959,
063
2,28
86,
774
1,13
563
350
236
1917
3719
1819
9613
,404
4,59
68,
808
2,45
71,
572
885
4524
2156
2828
1997
21,4
807,
580
13,9
003,
380
1,61
71,
763
9441
5314
858
9019
9835
,368
12,2
1223
,156
6,37
62,
006
4,37
017
575
100
305
112
193
1999
48,3
1018
,676
29,6
346,
572
3,39
23,
180
212
8312
939
413
725
720
0056
,911
16,2
0640
,704
10,4
015,
101
5,30
021
586
129
414
143
271
2001
63,3
8515
,756
47,6
298,
929
1,85
87,
072
213
8512
845
015
429
620
0268
,960
14,4
0354
,557
11,5
932,
097
9,49
626
810
316
562
519
443
120
0312
3,09
128
,509
94,5
8229
,900
4,78
025
,120
301
111
190
720
214
506
2004
199,
552
41,7
8415
7,76
850
,520
8,02
242
,497
375
111
264
963
223
740
2005
306,
016
58,5
6924
7,44
779
,480
8,70
870
,772
475
129
346
1,29
827
31,
025
2006
469,
597
94,9
3937
4,65
810
1,32
418
,461
82,8
6260
316
044
31,
859
337
1,52
220
0763
7,02
611
4,56
552
2,46
112
6,32
618
,153
108,
173
720
173
547
2,35
839
31,
965
2008
486,
586
75,1
2241
1,46
461
,547
7,60
653
,941
862
181
681
2,81
441
52,
399
2009
672,
720
72,2
6460
0,45
669
,429
7,54
361
,886
932
172
760
3,00
041
22,
588
2010
928,
169
124,
411
803,
757
134,
219
24,0
0611
0,21
396
418
378
13,
095
433
2,66
21
Fund
s of
fund
s ar
e m
utua
l fun
ds th
at in
vest
prim
arily
in o
ther
mut
ual f
unds
.2
Net
new
cas
h flo
w is
the
dolla
r val
ue o
f new
sal
es m
inus
rede
mpt
ions
com
bine
d w
ith n
et e
xcha
nges
. N
ote:
Com
pone
nts
may
not
add
to th
e to
tal b
ecau
se o
f rou
ndin
g.

Data Section 5
173ADDITIONAL CATEGORIES OF U.S. MUTUAL FUNDS
TABL
E 46
Fund
s of F
unds
:1 Com
pone
nts o
f Net
New
Cas
h Fl
ow2
Mill
ions
of d
olla
rs, a
nnua
l
Year
Sale
sRe
dem
ptio
ns
New
+ e
xcha
nge
New
3Ex
chan
ge4
Regu
lar +
exc
hang
eRe
gula
r5Ex
chan
ge6
Tota
lEq
uity
Hybr
id
and
bond
Tota
lEq
uity
Hybr
id
and
bond
Tota
lEq
uity
Hybr
id
and
bond
Tota
lEq
uity
Hybr
id
and
bond
Tota
lEq
uity
Hybr
id
and
bond
Tota
lEq
uity
Hybr
id
and
bond
1990
$416
$68
$348
$351
$58
$293
$65
$10
$55
$285
$89
$196
$186
$87
$99
$100
$3$9
719
9177
219
258
057
914
243
719
450
143
298
9520
318
579
105
113
1697
1992
1,61
737
11,
246
1,25
529
496
136
276
286
483
166
318
303
130
174
180
3614
419
931,
953
358
1,59
41,
533
293
1,24
041
965
354
793
205
588
453
156
297
340
4929
119
941,
781
583
1,19
71,
341
389
952
439
194
245
1,21
324
197
268
216
651
753
175
456
1995
2,36
298
71,
376
1,75
069
21,
059
612
295
317
1,22
735
487
376
823
353
545
912
133
819
964,
522
2,32
12,
201
3,62
11,
847
1,77
490
147
442
82,
066
749
1,31
71,
290
519
771
776
230
546
1997
6,31
72,
858
3,45
94,
753
2,01
72,
736
1,56
584
272
32,
937
1,24
11,
696
1,74
977
497
51,
189
468
721
1998
12,9
314,
398
8,53
29,
938
3,57
86,
360
2,99
382
12,
172
6,55
42,
392
4,16
23,
766
1,54
12,
225
2,78
885
01,
938
1999
16,7
496,
861
9,88
812
,759
5,57
57,
184
3,99
01,
287
2,70
310
,177
3,46
96,
708
6,63
82,
553
4,08
43,
540
916
2,62
420
0024
,092
9,34
614
,746
18,6
077,
539
11,0
685,
485
1,80
63,
678
13,6
904,
245
9,44
59,
250
3,19
96,
052
4,44
01,
046
3,39
420
0122
,577
5,73
516
,842
17,6
064,
893
12,7
124,
971
842
4,12
913
,647
3,87
79,
770
9,54
63,
111
6,43
54,
101
766
3,33
520
0228
,193
6,78
021
,414
23,0
635,
787
17,2
765,
131
993
4,13
816
,600
4,68
311
,917
12,2
093,
865
8,34
44,
391
818
3,57
320
0346
,962
8,71
138
,251
38,4
447,
260
31,1
848,
518
1,45
17,
068
17,0
623,
931
13,1
3112
,785
3,27
69,
509
4,27
765
53,
622
2004
76,8
2113
,709
63,1
1263
,136
11,4
5151
,685
13,6
852,
258
11,4
2726
,301
5,68
720
,614
19,8
454,
809
15,0
366,
456
878
5,57
820
0512
2,86
116
,760
106,
102
106,
077
13,9
8692
,091
16,7
842,
774
14,0
1043
,381
8,05
235
,329
35,3
517,
034
28,3
178,
030
1,01
87,
012
2006
163,
087
30,2
0113
2,88
513
8,85
224
,854
113,
998
24,2
345,
347
18,8
8861
,763
11,7
4050
,023
49,0
4610
,057
38,9
9012
,717
1,68
311
,033
2007
226,
953
37,3
2718
9,62
619
3,60
929
,870
163,
739
33,3
437,
457
25,8
8710
0,62
719
,174
81,4
5381
,950
15,8
4266
,108
18,6
763,
331
15,3
4520
0821
4,54
733
,545
181,
002
183,
647
27,8
2215
5,82
530
,900
5,72
325
,177
153,
000
25,9
3812
7,06
112
1,25
420
,978
100,
276
31,7
464,
961
26,7
8520
0918
9,56
326
,453
163,
110
170,
197
24,2
7414
5,92
319
,366
2,18
017
,187
120,
134
18,9
1010
1,22
410
1,65
816
,954
84,7
0418
,476
1,95
616
,520
2010
307,
649
46,7
7126
0,87
928
2,27
545
,152
237,
123
25,3
741,
619
23,7
5617
3,43
022
,764
150,
666
151,
321
20,8
9013
0,43
222
,109
1,87
520
,234
1 Fu
nds
of fu
nds
are
mut
ual f
unds
that
inve
st p
rimar
ily in
oth
er m
utua
l fun
ds.
2 N
et n
ew c
ash
flow
is th
e do
llar v
alue
of n
ew s
ales
min
us re
dem
ptio
ns c
ombi
ned
with
net
exc
hang
es.
3 N
ew s
ales
are
the
dolla
r val
ue o
f new
pur
chas
es o
f mut
ual f
und
shar
es. T
his
does
not
incl
ude
shar
es p
urch
ased
thro
ugh
rein
vest
men
t of d
ivid
ends
in e
xist
ing
acco
unts
.4
Exch
ange
sal
es a
re th
e do
llar v
alue
of m
utua
l fun
d sh
ares
sw
itche
d in
to fu
nds
with
in th
e sa
me
fund
gro
up.
5 Re
gula
r red
empt
ions
are
the
dolla
r val
ue o
f sha
reho
lder
liqu
idat
ion
of m
utua
l fun
d sh
ares
.6
Exch
ange
rede
mpt
ions
are
the
dolla
r val
ue o
f mut
ual f
und
shar
es s
witc
hed
out o
f fun
ds a
nd in
to o
ther
fund
s in
the
sam
e fu
nd g
roup
. N
ote:
Com
pone
nts
may
not
add
to th
e to
tal b
ecau
se o
f rou
ndin
g.

Data
Sec
tion
5
174 2011 INVESTMENT COMPANY FACT BOOK
TABL
E 47
Inde
x M
utua
l Fun
ds: T
otal
Net
Ass
ets a
nd N
et N
ew C
ash
Flow
Mill
ions
of d
olla
rs
Year
Tota
l net
ass
ets
Year
-end
Net
new
cas
h fl
ow*
Annu
al
Tota
l
Equi
ty
Hybr
id
and
bond
Tota
l
Equi
ty
Hybr
id
and
bond
S&P
500
Oth
er
dom
esti
cGl
obal
/ In
tern
atio
nal
S&P
500
Oth
er
dom
esti
cGl
obal
/ In
tern
atio
nal
1993
$27,
460
$19,
445
$3,3
38$1
,281
$3,3
96$6
,350
$3,9
16$9
53$5
01$9
8019
9432
,078
22,2
573,
863
2,09
53,
863
3,29
81,
821
515
436
525
1995
57,0
4241
,744
6,44
22,
846
6,00
911
,808
8,81
61,
038
512
1,44
219
9697
,759
73,8
5611
,241
4,12
48,
538
24,7
8018
,447
3,19
21,
033
2,10
819
9717
0,30
212
9,85
721
,221
5,32
913
,894
34,8
4725
,208
5,23
081
83,
591
1998
264,
998
201,
791
35,0
517,
962
20,1
9346
,143
30,9
778,
499
1,56
85,
099
1999
387,
411
284,
588
63,3
8613
,130
26,3
0761
,603
38,0
6316
,102
2,24
15,
197
2000
384,
039
272,
462
72,0
2812
,625
26,9
2325
,592
10,7
8310
,672
1,66
02,
477
2001
370,
560
249,
452
73,5
9811
,128
36,3
8126
,735
9,11
38,
846
1,19
47,
582
2002
327,
417
200,
989
69,4
2611
,050
45,9
5225
,255
4,81
812
,152
1,66
96,
616
2003
455,
293
273,
691
112,
469
18,2
1850
,903
35,2
3414
,231
16,5
372,
199
2,26
620
0455
4,04
431
7,82
614
7,81
928
,236
60,1
6340
,130
11,7
3916
,078
5,66
16,
651
2005
618,
699
334,
012
171,
377
42,7
9270
,518
27,8
77-3
1711
,731
8,45
68,
007
2006
747,
468
379,
765
218,
303
66,6
4782
,752
32,9
74-5
,908
20,2
8310
,674
7,92
520
0785
4,71
539
4,59
325
7,93
595
,667
106,
520
61,1
39-1
,440
29,0
9516
,903
16,5
8220
0860
1,72
825
2,95
617
8,04
550
,125
120,
602
34,9
667,
705
23,3
98-6
,003
9,86
620
0983
5,42
232
8,64
725
6,80
392
,177
157,
795
55,9
768,
195
16,4
094,
257
27,1
1520
101,
016,
713
375,
949
325,
767
122,
385
192,
612
57,5
60-8
0815
,035
19,0
6424
,269
* Net
new
cas
h flo
w is
the
dolla
r val
ue o
f new
sal
es m
inus
rede
mpt
ions
com
bine
d w
ith n
et e
xcha
nges
.
N
ote:
Dat
a fo
r fun
ds th
at in
vest
prim
arily
in o
ther
mut
ual f
unds
wer
e ex
clud
ed fr
om th
e se
ries.
C
ompo
nent
s m
ay n
ot a
dd to
the
tota
l bec
ause
of r
ound
ing.

Data Section 5
175ADDITIONAL CATEGORIES OF U.S. MUTUAL FUNDS
TABL
E 48
Inde
x M
utua
l Fun
ds: N
umbe
r of F
unds
and
Num
ber o
f Sha
re C
lass
es
Year
-end
Year
Num
ber o
f fun
dsN
umbe
r of s
hare
cla
sses
Tota
l
Equi
ty
Hybr
id
and
bond
Tota
l
Equi
ty
Hybr
id
and
bond
S&P
500
Oth
er
dom
esti
cGl
obal
/ In
tern
atio
nal
S&P
500
Oth
er
dom
esti
cGl
obal
/ In
tern
atio
nal
1993
6938
156
1073
4215
610
1994
8142
177
1595
5317
1015
1995
8748
187
1411
063
1911
1719
9610
560
227
1614
386
2511
2119
9713
272
2712
2120
511
538
2131
1998
156
8637
1518
252
148
5225
2719
9919
797
5920
2132
316
695
3131
2000
271
120
100
2526
465
221
164
4238
2001
286
126
110
2426
518
238
197
4340
2002
313
132
124
2829
578
255
221
5349
2003
321
128
134
3029
601
253
243
5649
2004
328
127
146
2827
633
262
269
5547
2005
322
119
147
2927
647
258
279
6248
2006
342
125
158
3326
697
272
304
7051
2007
354
125
161
3632
735
276
316
8063
2008
359
122
164
4132
754
278
317
9564
2009
357
113
153
4843
757
259
296
103
9920
1036
511
116
349
4277
625
330
611
710
0
Not
e: D
ata
for f
unds
that
inve
st p
rimar
ily in
oth
er m
utua
l fun
ds w
ere
excl
uded
from
the
serie
s.

Data
Sec
tion
5
176 2011 INVESTMENT COMPANY FACT BOOK
TABL
E 49
Inde
x M
utua
l Fun
ds: N
ew S
ales
and
Exc
hang
e Sa
les
Mill
ions
of d
olla
rs, a
nnua
l
Year
New
+ e
xcha
nge
New
1Ex
chan
ge2
Tota
l
Equi
ty
Hybr
id
and
bond
Tota
l
Equi
ty
Hybr
id
and
bond
Tota
l
Equi
ty
Hybr
id
and
bond
S&P
500
Oth
er
dom
esti
cGl
obal
/ In
tern
atio
nal
S&P
500
Oth
er
dom
esti
cGl
obal
/ In
tern
atio
nal
S&P
500
Oth
er
dom
esti
cGl
obal
/ In
tern
atio
nal
1993
$13,
267
$8,8
98$1
,560
$746
$2,0
64$1
1,20
8$7
,826
$1,2
83$4
55$1
,644
$2,0
59$1
,072
$277
$291
$420
1994
11,8
507,
976
1,28
382
41,
767
10,1
727,
103
1,13
057
91,
361
1,67
787
415
324
540
519
9521
,845
15,9
032,
107
1,01
92,
815
17,6
6513
,087
1,88
380
01,
895
4,18
02,
816
224
219
920
1996
42,6
8031
,828
4,89
31,
855
4,10
334
,903
26,1
654,
182
1,46
33,
093
7,77
65,
663
711
392
1,01
019
9773
,274
54,4
9410
,219
2,17
36,
388
54,0
9341
,160
6,56
21,
816
4,55
519
,181
13,3
343,
657
357
1,83
419
9810
2,84
375
,186
15,5
153,
014
9,12
879
,382
59,4
5711
,405
2,15
76,
362
23,4
6115
,728
4,10
985
72,
767
1999
145,
582
101,
675
26,7
554,
544
12,6
0811
2,68
681
,540
18,9
943,
232
8,92
032
,896
20,1
357,
761
1,31
23,
688
2000
136,
385
92,0
1929
,055
6,08
59,
225
107,
344
75,9
9020
,147
4,85
76,
351
29,0
4116
,029
8,90
81,
228
2,87
520
0112
2,24
772
,936
28,0
574,
641
16,6
1294
,018
58,6
5420
,961
3,94
510
,458
28,2
2914
,282
7,09
669
76,
154
2002
127,
752
68,0
8534
,211
5,16
120
,295
99,6
4057
,060
24,9
224,
505
13,1
5428
,112
11,0
269,
289
656
7,14
120
0313
6,83
067
,688
44,5
935,
998
18,5
5010
4,70
354
,472
31,6
805,
178
13,3
7232
,127
13,2
1612
,913
820
5,17
820
0415
9,31
074
,967
53,9
479,
403
20,9
9212
8,16
263
,371
40,6
227,
915
16,2
5331
,148
11,5
9713
,325
1,48
84,
739
2005
163,
344
70,7
6356
,374
13,5
2322
,684
131,
335
58,8
1843
,402
11,2
7517
,840
32,0
0911
,945
12,9
712,
248
4,84
420
0618
9,91
469
,619
73,4
8819
,890
26,9
1815
2,43
659
,125
57,5
3516
,061
19,7
1537
,478
10,4
9415
,953
3,82
87,
203
2007
259,
419
93,6
9192
,182
30,5
2343
,023
200,
041
76,3
0072
,054
23,6
3328
,054
59,3
7817
,391
20,1
296,
889
14,9
6920
0824
9,58
587
,086
82,2
1026
,262
54,0
2720
1,21
374
,133
64,7
9422
,358
39,9
2848
,371
12,9
5317
,416
3,90
314
,099
2009
243,
411
69,3
9866
,721
24,5
7182
,721
181,
737
60,0
2452
,542
19,0
1750
,154
61,6
749,
374
14,1
785,
554
32,5
6720
1027
9,01
670
,013
84,1
4850
,788
74,0
6621
2,86
559
,437
64,7
8731
,937
56,7
0466
,151
10,5
7719
,361
18,8
5117
,362
1 N
ew s
ales
are
the
dolla
r val
ue o
f new
pur
chas
es o
f mut
ual f
und
shar
es. T
his
does
not
incl
ude
shar
es p
urch
ased
thro
ugh
rein
vest
men
t of d
ivid
ends
in e
xist
ing
acco
unts
.2
Exch
ange
sal
es a
re th
e do
llar v
alue
of m
utua
l fun
d sh
ares
sw
itche
d in
to fu
nds
with
in th
e sa
me
fund
gro
up.
Not
e: D
ata
for f
unds
that
inve
st p
rimar
ily in
oth
er m
utua
l fun
ds w
ere
excl
uded
from
the
serie
s. C
ompo
nent
s m
ay n
ot a
dd to
the
tota
l bec
ause
of r
ound
ing.

Data Section 5
177ADDITIONAL CATEGORIES OF U.S. MUTUAL FUNDS
TABL
E 50
Inde
x M
utua
l Fun
ds: R
edem
ptio
ns a
nd E
xcha
nge
Rede
mpt
ions
M
illio
ns o
f dol
lars
, ann
ual
Year
Regu
lar +
exc
hang
eRe
gula
r1Ex
chan
ge2
Tota
l
Equi
ty
Hybr
id
and
bond
Tota
l
Equi
ty
Hybr
id
and
bond
Tota
l
Equi
ty
Hybr
id
and
bond
S&P
500
Oth
er
dom
esti
cGl
obal
/ In
tern
atio
nal
S&P
500
Oth
er
dom
esti
cGl
obal
/ In
tern
atio
nal
S&P
500
Oth
er
dom
esti
cGl
obal
/ In
tern
atio
nal
1993
$6,9
17$4
,982
$607
$245
$1,0
84$5
,278
$3,9
96$4
49$1
18$7
15$1
,639
$986
$158
$127
$369
1994
8,55
26,
155
768
387
1,24
17,
134
5,38
364
524
386
31,
418
772
123
144
379
1995
10,0
377,
087
1,06
950
71,
373
7,72
35,
732
935
337
719
2,31
41,
355
135
170
654
1996
17,9
0013
,382
1,70
082
21,
995
13,5
7810
,330
1,42
956
61,
253
4,32
13,
052
271
256
742
1997
38,4
2729
,286
4,98
81,
355
2,79
724
,753
19,8
242,
468
779
1,68
113
,674
9,46
22,
520
576
1,11
619
9856
,700
44,2
087,
016
1,44
64,
029
40,0
2432
,563
4,25
697
32,
232
16,6
7611
,646
2,76
047
31,
797
1999
83,9
7963
,612
10,6
532,
303
7,41
160
,809
48,3
367,
050
1,27
64,
146
23,1
7015
,276
3,60
31,
027
3,26
520
0011
0,79
381
,237
18,3
834,
425
6,74
980
,788
61,7
3511
,961
2,81
44,
278
30,0
0519
,501
6,42
21,
611
2,47
120
0195
,512
63,8
2319
,211
3,44
79,
030
68,4
7447
,792
12,7
462,
582
5,35
327
,038
16,0
306,
465
865
3,67
720
0210
2,49
763
,267
22,0
593,
492
13,6
7974
,963
48,6
2515
,223
2,81
98,
296
27,5
3414
,642
6,83
567
35,
383
2003
101,
596
53,4
5728
,056
3,80
016
,284
76,8
0442
,814
20,5
483,
407
10,0
3524
,792
10,6
437,
508
393
6,24
920
0411
9,18
063
,228
37,8
693,
742
14,3
4190
,044
50,3
4026
,886
3,06
19,
756
29,1
3612
,888
10,9
8268
14,
585
2005
135,
467
71,0
8044
,643
5,06
714
,677
102,
053
54,6
2132
,287
4,10
811
,036
33,4
1416
,459
12,3
5695
93,
641
2006
156,
940
75,5
2753
,205
9,21
518
,993
118,
530
59,5
5639
,117
6,77
513
,083
38,4
1015
,971
14,0
882,
441
5,91
020
0719
8,28
095
,131
63,0
8713
,620
26,4
4114
1,05
971
,405
43,0
0110
,076
16,5
7657
,221
23,7
2620
,086
3,54
49,
865
2008
214,
619
79,3
8158
,812
32,2
6444
,161
167,
780
62,2
8643
,152
28,0
6734
,275
46,8
3917
,094
15,6
604,
197
9,88
720
0918
7,43
561
,203
50,3
1220
,315
55,6
0513
3,21
149
,794
38,8
1617
,079
27,5
2154
,223
11,4
0911
,495
3,23
628
,084
2010
221,
456
70,8
2169
,113
31,7
2549
,797
162,
503
56,9
9354
,910
14,6
2335
,977
58,9
5313
,828
14,2
0317
,102
13,8
201
Regu
lar r
edem
ptio
ns a
re th
e do
llar v
alue
of s
hare
hold
er li
quid
atio
n of
mut
ual f
und
shar
es.
2
Exch
ange
rede
mpt
ions
are
the
dolla
r val
ue o
f mut
ual f
und
shar
es s
witc
hed
out o
f fun
ds a
nd in
to o
ther
fund
s in
the
sam
e fu
nd g
roup
.
Not
e: D
ata
for f
unds
that
inve
st p
rimar
ily in
oth
er m
utua
l fun
ds w
ere
excl
uded
from
the
serie
s.
C
ompo
nent
s m
ay n
ot a
dd to
the
tota
l bec
ause
of r
ound
ing.

Data
Sec
tion
5
178 2011 INVESTMENT COMPANY FACT BOOK
TABL
E 51
Life
styl
e an
d Ta
rget
Dat
e M
utua
l Fun
ds:1 T
otal
Net
Ass
ets,
Net
New
Cas
h Fl
ow, N
umbe
r of F
unds
, and
Num
ber o
f Sha
re C
lass
es
Year
Tota
l net
ass
ets
Mill
ions
of d
olla
rs, y
ear-
end
Net
new
cas
h fl
ow2
Mill
ions
of d
olla
rs, a
nnua
lN
umbe
r of f
unds
Year
-end
Num
ber o
f sha
re c
lass
esYe
ar-e
nd
Tota
lLi
fest
yle
Targ
et
date
Tota
lLi
fest
yle
Targ
et
date
Tota
lLi
fest
yle
Targ
et
date
Tota
lLi
fest
yle
Targ
et
date
1995
$2,7
46$2
,259
$487
$1,1
94$1
,009
$185
2620
650
4010
1996
6,49
75,
693
805
2,58
32,
367
216
4435
970
619
1997
14,3
1412
,906
1,40
84,
138
3,94
519
377
6512
141
124
1719
9825
,413
20,9
054,
508
6,01
54,
862
1,15
311
093
1719
917
623
1999
34,8
4927
,835
7,01
44,
928
3,61
81,
311
130
111
1924
021
030
2000
39,7
1630
,928
8,78
87,
581
3,98
33,
598
146
122
2427
923
742
2001
45,4
6733
,095
12,3
727,
696
3,90
23,
795
147
122
2535
126
982
2002
49,4
2534
,523
14,9
028,
095
4,38
63,
708
171
146
2543
235
082
2003
81,7
3355
,832
25,9
0119
,040
11,8
197,
221
192
147
4549
937
912
020
0412
9,17
085
,414
43,7
5628
,336
15,4
3212
,903
241
157
8474
047
726
320
0520
2,01
713
0,79
471
,223
57,1
6634
,910
22,2
5632
419
712
71,
128
663
465
2006
303,
594
189,
034
114,
560
66,7
9133
,769
33,0
2242
223
818
41,
558
775
783
2007
420,
863
237,
958
182,
905
91,9
2035
,720
56,2
0049
424
924
51,
840
805
1,03
520
0833
5,42
817
5,59
115
9,83
754
,424
12,5
2741
,897
617
275
342
2,22
285
11,
371
2009
486,
553
230,
950
255,
603
52,1
188,
674
43,4
4464
726
438
32,
357
840
1,51
720
1060
3,95
026
4,15
533
9,79
548
,587
4,18
444
,403
642
261
381
2,33
183
61,
495
1 Ca
tego
ries
incl
ude
data
for f
unds
that
inve
st p
rimar
ily in
oth
er fu
nds.
2 N
et n
ew c
ash
flow
is th
e do
llar v
alue
of n
ew s
ales
min
us re
dem
ptio
ns c
ombi
ned
with
net
exc
hang
es.
Not
e: C
ompo
nent
s m
ay n
ot a
dd to
the
tota
l bec
ause
of r
ound
ing.

Data Section 5
179ADDITIONAL CATEGORIES OF U.S. MUTUAL FUNDS
TABL
E 52
Life
styl
e an
d Ta
rget
Dat
e M
utua
l Fun
ds:1 C
ompo
nent
s of N
et N
ew C
ash
Flow
2
Mill
ions
of d
olla
rs, a
nnua
l
Year
Sale
sRe
dem
ptio
ns
New
3Ex
chan
ge4
Regu
lar5
Exch
ange
6
Tota
lLi
fest
yle
Targ
et
date
Tota
lLi
fest
yle
Targ
et
date
Tota
lLi
fest
yle
Targ
et
date
Tota
lLi
fest
yle
Targ
et
date
1995
$1,2
89$1
,008
$282
$364
$355
$9$3
04$2
03$1
00$1
55$1
51$5
1996
3,39
32,
771
622
564
552
1298
958
340
638
537
311
1997
5,58
05,
067
513
1,06
61,
033
331,
763
1,43
233
174
672
322
1998
8,85
67,
549
1,30
62,
782
1,42
81,
354
3,55
72,
916
641
2,06
61,
199
867
1999
10,6
638,
832
1,83
13,
144
1,43
61,
707
6,10
25,
102
1,00
02,
776
1,54
91,
227
2000
15,0
3410
,767
4,26
74,
621
1,77
62,
845
8,30
26,
648
1,65
43,
772
1,91
21,
861
2001
15,4
0810
,621
4,78
74,
179
1,60
22,
576
8,51
06,
665
1,84
43,
381
1,65
61,
724
2002
18,2
3512
,953
5,28
23,
691
1,38
42,
307
10,9
018,
561
2,34
02,
930
1,38
91,
541
2003
27,5
8119
,498
8,08
35,
321
1,93
13,
390
11,0
388,
518
2,52
12,
824
1,09
31,
731
2004
41,6
7025
,228
16,4
428,
713
3,23
95,
474
17,5
7111
,296
6,27
44,
477
1,73
82,
739
2005
77,1
1150
,358
26,7
5411
,647
3,95
57,
692
25,9
1917
,287
8,63
35,
673
2,11
63,
558
2006
89,4
9649
,584
39,9
1217
,113
5,95
611
,157
31,2
3218
,571
12,6
628,
586
3,20
15,
385
2007
137,
672
61,5
1776
,155
23,4
566,
415
17,0
4156
,637
28,1
3128
,507
12,5
704,
080
8,49
020
0812
7,51
848
,978
78,5
3922
,099
5,97
916
,120
73,8
7935
,492
38,3
8721
,314
6,93
814
,375
2009
118,
475
38,1
3880
,337
15,1
723,
618
11,5
5468
,200
28,8
0539
,395
13,3
294,
277
9,05
320
1014
9,98
842
,356
107,
632
20,6
063,
983
16,6
2310
4,98
237
,567
67,4
1517
,025
4,58
812
,437
1 Ca
tego
ries
incl
ude
data
for f
unds
that
inve
st p
rimar
ily in
oth
er fu
nds.
2 N
et n
ew c
ash
flow
is th
e do
llar v
alue
of n
ew s
ales
min
us re
dem
ptio
ns c
ombi
ned
with
net
exc
hang
es.
3 N
ew s
ales
are
the
dolla
r val
ue o
f new
pur
chas
es o
f mut
ual f
und
shar
es. T
his
does
not
incl
ude
shar
es p
urch
ased
thro
ugh
rein
vest
men
t of d
ivid
ends
in e
xist
ing
acco
unts
.4
Exch
ange
sal
es a
re th
e do
llar v
alue
of m
utua
l fun
d sh
ares
sw
itche
d in
to fu
nds
with
in th
e sa
me
fund
gro
up.
5 Re
gula
r red
empt
ions
are
the
dolla
r val
ue o
f sha
reho
lder
liqu
idat
ion
of m
utua
l fun
d sh
ares
.6
Exch
ange
rede
mpt
ions
are
the
dolla
r val
ue o
f mut
ual f
und
shar
es s
witc
hed
out o
f fun
ds a
nd in
to o
ther
fund
s in
the
sam
e fu
nd g
roup
. N
ote:
Com
pone
nts
may
not
add
to th
e to
tal b
ecau
se o
f rou
ndin
g.

Data
Sec
tion
5
180 2011 INVESTMENT COMPANY FACT BOOK
TABLE 53Retirement Mutual Funds:1 Total Net Assets, Net New Cash Flow, Number of Funds, and Number of Share Classes
Year
Total Equity Hybrid BondMoney market Total Equity Hybrid Bond
Money market
Total net assetsMillions of dollars, year-end
Net new cash flow2
Millions of dollars, annual
1993 $4,900 $529 $487 $304 $3,580 $470 $197 -$5 $51 $2261994 4,929 421 628 234 3,646 -132 40 29 -59 -1421995 9,092 1,408 1,907 428 5,349 2,055 394 140 35 1,4851996 9,574 1,420 2,003 446 5,705 610 612 -135 23 1101997 10,960 2,066 2,284 518 6,092 505 430 -56 43 891998 13,273 2,564 2,578 709 7,423 1,197 285 -267 159 1,0191999 18,113 6,859 2,304 860 8,090 138 57 -482 161 4022000 18,762 6,961 1,764 1,034 9,004 917 844 -451 73 4512001 25,303 6,646 1,487 1,348 15,823 542 -256 -160 221 7372002 26,491 7,316 1,674 1,418 16,083 1,944 1,489 283 124 482003 40,074 21,536 3,748 2,359 12,431 8,385 9,686 1,610 820 -3,7312004 66,421 47,856 8,104 2,822 7,640 18,637 19,300 3,193 324 -4,1802005 101,133 78,680 11,747 3,780 6,926 25,053 21,848 3,145 908 -8482006 154,252 124,148 16,556 5,340 8,207 33,430 28,241 3,147 1,197 8452007 221,421 175,699 26,078 8,363 11,282 46,391 34,691 6,964 2,141 2,5952008 181,160 130,837 25,201 9,417 15,704 46,413 32,855 8,094 2,090 3,3732009 281,649 211,604 39,493 13,399 17,153 36,806 28,922 6,891 2,459 -1,4662010 359,190 273,490 52,695 16,132 16,873 40,288 30,247 7,587 2,202 252
Number of fundsYear-end
Number of share classesYear-end
1993 28 10 5 7 6 28 10 5 7 61994 44 17 7 12 8 44 17 7 12 81995 52 21 10 13 8 52 21 10 13 81996 53 23 10 12 8 53 23 10 12 81997 57 25 11 13 8 57 25 11 13 81998 63 30 16 10 7 63 30 16 10 71999 79 45 16 12 6 79 45 16 12 62000 127 85 18 17 7 160 111 18 23 82001 184 123 27 24 10 237 150 46 30 112002 281 188 34 44 15 422 267 61 70 242003 461 316 55 73 17 641 422 88 105 262004 703 462 110 111 20 944 602 161 149 322005 826 523 157 125 21 1,302 787 274 203 382006 966 592 217 134 23 1,679 944 470 225 402007 1,147 679 284 158 26 1,967 1,062 605 255 452008 1,328 759 368 176 25 2,196 1,152 728 272 442009 1,380 750 421 185 24 2,321 1,199 775 306 412010 1,414 770 410 211 23 2,401 1,245 765 351 40
1 Retirement mutual funds include share classes and funds that are primarily available to retirement plans or IRAs. The table includes data for funds that invest primarily in other funds.
2 Net new cash flow is the dollar value of new sales minus redemptions combined with net exchanges. Note: Components may not add to the total because of rounding.

Data Section 5
181ADDITIONAL CATEGORIES OF U.S. MUTUAL FUNDS
TABL
E 54
Retir
emen
t Mut
ual F
unds
:1 Com
pone
nts o
f Net
New
Cas
h Fl
ow2
Mill
ions
of d
olla
rs, a
nnua
l
Year
Sale
sRe
dem
ptio
ns
New
3Ex
chan
ge4
Regu
lar5
Exch
ange
6
Equi
tyHy
brid
Bond
Mon
ey
mar
ket
Equi
tyHy
brid
Bond
Mon
ey
mar
ket
Equi
tyHy
brid
Bond
Mon
ey
mar
ket
Equi
tyHy
brid
Bond
Mon
ey
mar
ket
1993
$242
$14
$90
$13,
907
$188
$1$6
0(*
)
$67
$17
$55
$13,
681
$165
$3$4
4(*
)
1994
9491
6014
,760
204
526
$261
5965
14,9
0319
79
79$1
1995
1,34
241
112
817
,250
207
1426
1192
325
093
15,7
6623
236
2610
1996
1,32
544
014
118
,998
196
2427
2075
250
110
118
,887
157
9844
2219
9786
444
218
621
,575
169
3638
1144
147
513
621
,470
162
5945
2719
981,
073
463
333
23,8
6725
423
5636
789
670
183
22,8
6725
383
4717
1999
1,18
944
546
429
,494
161
1545
221,
184
857
307
29,0
8510
986
4130
2000
2,26
936
445
231
,729
194
1025
441,
533
746
353
31,2
7987
8051
4220
011,
392
337
642
40,0
0734
820
8322
91,
712
498
441
39,4
9228
420
638
2002
3,20
373
785
859
,587
583
6322
861
2,07
948
892
559
,549
218
2937
5120
0310
,548
2,14
61,
748
58,8
872,
333
162
137
163
2,96
465
194
662
,488
231
4711
929
320
0424
,947
4,24
41,
781
39,2
371,
274
136
107
177
6,58
11,
108
1,43
743
,156
341
7912
643
820
0534
,373
5,02
82,
092
41,2
901,
611
173
170
193
13,4
881,
911
1,17
341
,876
648
145
181
456
2006
49,8
556,
517
2,30
545
,463
3,72
142
625
332
224
,171
3,50
91,
168
44,4
261,
165
287
193
514
2007
76,3
1513
,326
4,48
133
,373
4,15
948
953
080
843
,689
6,49
72,
511
30,6
402,
094
355
359
945
2008
76,3
6215
,672
5,32
744
,770
5,30
41,
466
730
1,33
643
,523
7,86
53,
437
41,8
095,
288
1,17
852
992
420
0968
,624
13,7
697,
874
41,0
7518
,384
2,67
21,
471
914
39,2
296,
628
4,82
642
,422
18,8
582,
922
2,06
01,
032
2010
85,8
5718
,090
7,52
772
,488
15,0
691,
467
709
657
56,0
9010
,583
5,16
972
,277
14,5
891,
387
866
616
1 Re
tirem
ent m
utua
l fun
ds in
clud
e sh
are
clas
ses
and
fund
s th
at a
re p
rimar
ily a
vaila
ble
to re
tirem
ent p
lans
or I
RAs.
The
tabl
e in
clud
es d
ata
for f
unds
that
inve
st p
rimar
ily in
oth
er fu
nds.
2 N
et n
ew c
ash
flow
is th
e do
llar v
alue
of n
ew s
ales
min
us re
dem
ptio
ns c
ombi
ned
with
net
exc
hang
es.
3 N
ew s
ales
are
the
dolla
r val
ue o
f new
pur
chas
es o
f mut
ual f
und
shar
es. T
his
does
not
incl
ude
shar
es p
urch
ased
thro
ugh
rein
vest
men
t of d
ivid
ends
in e
xist
ing
acco
unts
.4
Exch
ange
sal
es a
re th
e do
llar v
alue
of m
utua
l fun
d sh
ares
sw
itche
d in
to fu
nds
with
in th
e sa
me
fund
fam
ily.
5 Re
gula
r red
empt
ions
are
the
dolla
r val
ue o
f sha
reho
lder
liqu
idat
ion
of m
utua
l fun
d sh
ares
.6
Exch
ange
rede
mpt
ions
are
the
dolla
r val
ue o
f mut
ual f
und
shar
es s
witc
hed
out o
f fun
ds a
nd in
to o
ther
fund
s in
the
sam
e fu
nd g
roup
. (
*) =
less
than
$50
0,00
0 N
ote:
Com
pone
nts
may
not
add
to th
e to
tal b
ecau
se o
f rou
ndin
g.

Data
Sec
tion
5
182 2011 INVESTMENT COMPANY FACT BOOK
TABL
E 55
Varia
ble
Annu
ity M
utua
l Fun
ds: T
otal
Net
Ass
ets,
Net
New
Cas
h Fl
ow, a
nd N
umbe
r of F
unds
Year
Tota
l net
ass
ets
Mill
ions
of d
olla
rs, y
ear-
end
Net
new
cas
h fl
ow*
Mill
ions
of d
olla
rs, a
nnua
lN
umbe
r of f
unds
Year
-end
Tota
lEq
uity
Hybr
id
and
bond
Mon
ey
mar
ket
Tota
lEq
uity
Hybr
id
and
bond
Mon
ey
mar
ket
Tota
lEq
uity
Hybr
id
and
bond
Mon
ey
mar
ket
1990
$28,
749
$14,
974
$8,3
55$5
,420
$3,0
83$1
,866
$323
$895
331
145
134
5219
9191
,056
69,1
3813
,734
8,18
46,
174
5,09
71,
498
-420
354
150
147
5719
9210
9,86
880
,934
21,0
467,
888
12,8
848,
708
4,36
3-1
8836
615
715
158
1993
152,
403
104,
823
39,7
407,
841
26,0
8816
,423
9,83
4-1
6942
819
217
660
1994
176,
370
121,
153
44,3
3910
,878
22,0
6615
,998
3,76
32,
305
507
245
202
6019
9525
9,81
318
7,70
260
,042
12,0
6920
,824
18,6
042,
214
566
534
425
071
1996
349,
341
260,
959
73,1
8915
,193
40,1
3332
,699
5,06
32,
371
800
435
290
7519
9747
3,33
136
4,28
692
,571
16,4
7440
,470
33,7
436,
316
411
937
535
323
7919
9861
5,15
247
4,96
111
6,33
723
,853
44,2
5927
,857
10,3
626,
040
1,16
270
337
782
1999
818,
958
656,
874
128,
352
33,7
3238
,543
30,7
36-4
618,
267
1,35
386
740
581
2000
816,
800
658,
176
125,
587
33,0
3748
,461
56,4
20-5
,896
-2,0
631,
562
1,05
442
880
2001
742,
258
564,
622
132,
881
44,7
5621
,583
3,45
29,
444
8,68
71,
750
1,25
540
689
2002
638,
949
440,
533
150,
346
48,0
70-1
,286
-13,
705
12,0
9232
71,
903
1,39
341
892
2003
837,
443
620,
662
181,
130
35,6
5229
,827
34,4
287,
471
-12,
071
1,88
91,
369
432
8820
0497
3,91
073
9,98
320
0,56
733
,361
33,5
0533
,021
3,16
7-2
,683
1,88
11,
354
440
8720
051,
072,
894
823,
049
216,
146
33,6
9916
,404
12,6
795,
024
-1,2
991,
882
1,36
043
983
2006
1,26
6,93
497
6,18
424
8,55
842
,192
29,7
1217
,198
7,01
35,
501
1,92
61,
396
449
8120
071,
399,
513
1,05
6,47
229
0,31
852
,723
31,9
572,
559
22,1
487,
250
1,89
51,
376
441
7820
0892
9,51
260
3,78
425
0,75
774
,971
-6,1
39-2
8,02
92,
352
19,5
381,
892
1,37
743
679
2009
1,19
5,03
479
6,69
934
1,03
957
,296
10,9
45-9
,929
39,6
79-1
8,80
61,
856
1,33
644
773
2010
1,34
8,27
689
2,77
340
6,94
948
,554
-2,0
26-2
4,24
731
,932
-9,7
111,
805
1,29
044
570
* Net
new
cas
h flo
w is
the
dolla
r val
ue o
f new
sal
es m
inus
rede
mpt
ions
com
bine
d w
ith n
et e
xcha
nges
. N
ote:
Dat
a fo
r fun
ds th
at in
vest
prim
arily
in o
ther
mut
ual f
unds
wer
e ex
clud
ed fr
om th
e se
ries.
Com
pone
nts
may
not
add
to th
e to
tal b
ecau
se o
f rou
ndin
g.

Data Section 5
183ADDITIONAL CATEGORIES OF U.S. MUTUAL FUNDS
TABL
E 56
Varia
ble
Annu
ity M
utua
l Fun
ds: C
ompo
nent
s of N
et N
ew C
ash
Flow
1
Mill
ions
of d
olla
rs, a
nnua
l
Year
Sale
sRe
dem
ptio
ns
New
2Ex
chan
ge3
Regu
lar4
Exch
ange
5
Tota
lEq
uity
Hybr
id
and
bond
Mon
ey
mar
ket
Tota
lEq
uity
Hybr
id
and
bond
Mon
ey
mar
ket
Tota
lEq
uity
Hybr
id
and
bond
Mon
ey
mar
ket
Tota
lEq
uity
Hybr
id
and
bond
Mon
ey
mar
ket
1990
$9,9
94$4
,714
$1,8
08$3
,473
$1,0
82$4
50$1
83$4
49$6
,993
$2,9
41$1
,465
$2,5
87$1
,000
$357
$203
$440
1991
16,4
089,
034
3,36
84,
006
838
331
174
333
10,2
943,
967
1,92
04,
407
778
301
124
352
1992
24,7
7913
,294
6,63
44,
851
1,56
874
035
047
812
,014
4,74
52,
348
4,92
11,
450
581
273
596
1993
42,3
9222
,738
13,1
466,
508
1,13
157
632
523
016
,352
6,42
53,
410
6,51
71,
084
467
227
390
1994
48,0
1025
,661
10,9
0711
,443
7,01
74,
064
429
2,52
525
,933
9,94
16,
830
9,16
17,
029
3,78
674
22,
501
1995
53,1
0131
,661
9,32
612
,114
8,67
44,
984
727
2,96
332
,283
13,2
017,
234
11,8
498,
668
4,84
060
63,
223
1996
84,9
3353
,188
13,0
5618
,689
12,6
567,
190
864
4,60
244
,729
20,4
978,
041
16,1
9112
,726
7,18
281
54,
729
1997
105,
222
67,0
0515
,290
22,9
2624
,210
13,0
172,
348
8,84
665
,377
33,4
089,
905
22,0
6323
,586
12,8
711,
417
9,29
819
9814
1,46
483
,457
23,2
2734
,780
37,1
3618
,967
5,50
212
,668
99,1
4154
,024
14,9
6430
,153
35,1
9920
,542
3,40
311
,254
1999
212,
025
130,
900
22,0
0559
,120
40,8
1822
,080
2,98
515
,753
174,
418
100,
392
22,2
7651
,750
39,8
8321
,853
3,17
414
,856
2000
334,
936
221,
862
21,2
1191
,863
36,3
2622
,853
1,82
111
,652
287,
230
166,
996
26,6
7393
,561
35,5
7121
,299
2,25
512
,017
2001
346,
166
196,
698
34,8
4011
4,62
831
,716
16,1
844,
928
10,6
0432
5,67
619
1,31
827
,169
107,
189
30,6
2318
,112
3,15
59,
356
2002
342,
193
183,
337
48,6
0011
0,25
634
,170
16,4
657,
123
10,5
8334
4,22
419
4,90
038
,382
110,
942
33,4
2518
,607
5,24
99,
570
2003
283,
007
168,
816
54,6
1959
,572
28,7
9115
,457
5,79
47,
540
253,
526
136,
424
46,2
6970
,832
28,4
4513
,421
6,67
38,
351
2004
261,
715
169,
962
46,7
1145
,042
26,4
0714
,451
5,65
66,
300
228,
278
136,
810
43,9
1647
,552
26,3
4014
,582
5,28
56,
472
2005
246,
396
162,
156
48,4
5135
,789
19,5
9810
,601
3,40
25,
595
230,
118
148,
412
44,1
2737
,578
19,4
7211
,666
2,70
25,
104
2006
280,
246
192,
938
50,4
6336
,846
22,3
1810
,826
3,42
28,
070
250,
509
174,
188
43,4
6232
,859
22,3
4412
,378
3,41
06,
555
2007
343,
673
219,
650
72,6
8951
,334
37,0
4519
,701
8,24
79,
097
317,
211
216,
347
55,3
7545
,488
31,5
5020
,444
3,41
37,
693
2008
380,
416
201,
941
90,3
0788
,169
25,4
4511
,160
5,06
59,
220
390,
185
228,
548
89,4
9372
,144
21,8
1612
,583
3,52
75,
706
2009
314,
975
154,
729
98,7
1861
,528
22,6
506,
875
11,4
804,
294
303,
902
157,
151
68,5
2178
,231
22,7
7814
,382
1,99
96,
397
2010
339,
011
167,
184
138,
863
32,9
6417
,325
6,75
56,
742
3,82
834
0,78
418
9,67
010
8,71
342
,401
17,5
788,
517
4,95
94,
102
1 N
et n
ew c
ash
flow
is th
e do
llar v
alue
of n
ew s
ales
min
us re
dem
ptio
ns c
ombi
ned
with
net
exc
hang
es.
2 N
ew s
ales
are
the
dolla
r val
ue o
f new
pur
chas
es o
f mut
ual f
und
shar
es. T
his
does
not
incl
ude
shar
es p
urch
ased
thro
ugh
rein
vest
men
t of d
ivid
ends
in e
xist
ing
acco
unts
.3
Exch
ange
sal
es a
re th
e do
llar v
alue
of m
utua
l fun
d sh
ares
sw
itche
d in
to fu
nds
with
in th
e sa
me
fund
gro
up.
4 Re
gula
r red
empt
ions
are
the
dolla
r val
ue o
f sha
reho
lder
liqu
idat
ion
of m
utua
l fun
d sh
ares
.5
Exch
ange
rede
mpt
ions
are
the
dolla
r val
ue o
f mut
ual f
und
shar
es s
witc
hed
out o
f fun
ds a
nd in
to o
ther
fund
s in
the
sam
e fu
nd g
roup
. N
ote:
Dat
a fo
r fun
ds th
at in
vest
prim
arily
in o
ther
mut
ual f
unds
wer
e ex
clud
ed fr
om th
e se
ries.
Com
pone
nts
may
not
add
to th
e to
tal b
ecau
se o
f rou
ndin
g.

Data
Sec
tion
6
184 2011 INVESTMENT COMPANY FACT BOOK
TABLE 57Total Net Assets of Mutual Funds Held in Individual and Institutional AccountsMillions of dollars, year-end
Year Total Equity funds Hybrid funds Bond fundsMoney market
funds
Total2000 $6,964,634 $3,961,922 $346,276 $811,188 $1,845,2482001 6,974,913 3,419,606 344,872 925,124 2,285,310 2002 6,383,477 2,664,007 323,947 1,130,448 2,265,075 2003 7,402,420 3,686,302 428,326 1,247,770 2,040,022 2004 8,095,082 4,386,666 516,603 1,290,477 1,901,336 2005 8,891,108 4,942,655 564,349 1,357,283 2,026,822 2006 10,397,935 5,914,100 650,314 1,495,069 2,338,451 2007 12,002,282 6,518,757 716,733 1,681,032 3,085,760 2008 9,603,604 3,705,548 498,284 1,567,536 3,832,236 2009 11,120,196 4,957,044 639,147 2,208,112 3,315,893 2010 11,820,677 5,667,400 741,068 2,608,287 2,803,922 Individual accounts2000 $6,237,606 $3,749,687 $334,296 $741,692 $1,411,9312001 6,098,684 3,239,488 331,983 843,414 1,683,799 2002 5,517,068 2,509,892 312,905 1,037,277 1,656,995 2003 6,529,580 3,473,839 414,027 1,147,865 1,493,848 2004 7,174,316 4,111,954 499,480 1,187,400 1,375,482 2005 7,774,598 4,605,373 545,468 1,222,769 1,400,987 2006 9,057,897 5,480,112 627,962 1,339,176 1,610,647 2007 10,327,955 6,040,802 692,158 1,494,546 2,100,449 2008 7,817,678 3,408,233 482,709 1,401,450 2,525,286 2009 9,262,344 4,526,140 619,586 1,981,616 2,135,002 2010p 9,995,832 5,150,129 716,691 2,314,935 1,814,076 Institutional accounts*2000 $727,029 $212,235 $11,980 $69,496 $433,3172001 876,229 180,119 12,889 81,710 601,511 2002 866,409 154,115 11,042 93,171 608,081 2003 872,840 212,463 14,299 99,904 546,174 2004 920,766 274,712 17,123 103,077 525,854 2005 1,116,510 337,281 18,881 134,514 625,834 2006 1,340,038 433,988 22,352 155,893 727,804 2007 1,674,327 477,955 24,575 186,486 985,311 2008 1,785,926 297,315 15,574 166,086 1,306,950 2009 1,857,852 430,904 19,560 226,497 1,180,891 2010p 1,824,845 517,271 24,377 293,351 989,846
* Institutional accounts include accounts purchased by an institution, such as a business, financial, or nonprofit organization. Institutional accounts do not include primary accounts of individuals issued by a broker-dealer.
p Data are preliminary. Note: Data for funds that invest primarily in other mutual funds were excluded from the series. Components may not add to the total because of rounding.

Data Section 6
185INSTITUTIONAL INVESTORS IN THE U.S. MUTUAL FUND INDUSTRY
TABLE 58Total Net Assets of Institutional Investors in Mutual Funds by Type of Institution and Type of FundMillions of dollars, year-end
Year Total Business
corporationsFinancial
institutions1Nonprofit
organizations Other2
2002 Total $866,409 $414,108 $314,708 $86,734 $50,859 Equity 154,115 56,570 56,755 23,710 17,080 Hybrid 11,042 5,027 4,282 1,089 643 Bond 93,171 32,780 16,519 32,323 11,549 Money market 608,081 319,731 237,152 29,611 21,587
2003 Total 872,840 408,534 304,365 94,343 65,598 Equity 212,463 79,352 70,561 33,639 28,910 Hybrid 14,299 6,784 4,625 2,185 705 Bond 99,904 33,119 18,416 32,479 15,890 Money market 546,174 289,278 210,763 26,040 20,093
2004 Total 920,766 429,853 293,830 94,236 102,846 Equity 274,712 92,787 88,198 38,004 55,723 Hybrid 17,123 7,482 6,036 2,654 951 Bond 103,077 30,020 20,305 28,992 23,760 Money market 525,854 299,563 179,291 24,587 22,412
2005 Total 1,116,510 492,419 350,909 100,114 173,069 Equity 337,281 104,857 101,871 43,549 87,004 Hybrid 18,881 6,809 7,611 2,627 1,834 Bond 134,514 28,542 26,041 25,597 54,334 Money market 625,834 352,211 215,385 28,341 29,896
2006 Total 1,340,038 602,349 402,541 112,820 222,328 Equity 433,988 138,718 121,376 53,181 120,713 Hybrid 22,352 7,847 9,815 2,738 1,953 Bond 155,893 34,509 28,478 26,062 66,845 Money market 727,804 421,275 242,873 30,840 32,817
2007 Total 1,674,327 741,848 496,617 133,144 302,718 Equity 477,955 141,623 122,199 58,103 156,029 Hybrid 24,575 8,152 11,799 2,436 2,187 Bond 186,486 41,243 30,610 25,180 89,453 Money market 985,311 550,830 332,008 47,425 55,048
2008 Total 1,785,926 840,434 566,927 118,179 260,385 Equity 297,315 83,240 70,967 31,936 111,173 Hybrid 15,574 5,780 6,692 1,463 1,640 Bond 166,086 36,747 26,425 23,368 79,547 Money market 1,306,950 714,668 462,844 61,413 68,025
2009 Total 1,857,852 836,279 566,616 126,988 327,968 Equity 430,904 122,373 98,391 43,670 166,470 Hybrid 19,560 7,316 8,244 1,792 2,208 Bond 226,497 60,492 36,479 30,067 99,459 Money market 1,180,891 646,098 423,502 51,460 59,831
2010p Total 1,824,845 740,441 544,477 133,306 406,620 Equity 517,271 139,226 120,982 48,578 208,485 Hybrid 24,377 8,661 9,836 2,081 3,799 Bond 293,351 75,059 51,784 32,329 134,180 Money market 989,846 517,495 361,875 50,319 60,157
1 Financial institutions include credit unions, investment clubs, accounts of banks not held as fiduciaries, insurance companies, and other financial organizations.
2 Other institutional investors include state and local governments, funds holding mutual fund shares, and other institutional accounts not classified.
p Data are preliminary. Note: Data for funds that invest primarily in other mutual funds were excluded from the series. Components may not add to the total because of rounding.

Data
Sec
tion
6
186 2011 INVESTMENT COMPANY FACT BOOK
TABLE 59Total Net Assets of Institutional Investors in Taxable Money Market Funds by Type of Institution and Type of Fund1 Millions of dollars, year-end
Year Total Business
corporationsFinancial
institutions2Nonprofit
organizations Other3
2000 Total $409,477 $201,996 $158,334 $22,987 $26,160 Institutional funds 305,180 137,226 134,543 14,951 18,460 Retail funds 104,297 64,770 23,791 8,037 7,699
2001 Total 575,202 300,491 219,136 27,975 27,599 Institutional funds 469,332 235,735 195,688 18,212 19,698 Retail funds 105,870 64,757 23,448 9,764 7,902
2002 Total 578,129 303,165 226,645 27,673 20,646 Institutional funds 485,717 247,775 202,489 20,205 15,248 Retail funds 92,412 55,390 24,156 7,468 5,398
2003 Total 509,444 266,890 198,158 24,873 19,523 Institutional funds 426,835 217,867 176,770 18,535 13,663 Retail funds 82,609 49,023 21,389 6,339 5,859
2004 Total 480,301 271,792 165,395 22,936 20,178 Institutional funds 404,084 223,647 149,570 16,274 14,593 Retail funds 76,217 48,146 15,825 6,662 5,585
2005 Total 569,730 317,580 198,300 26,146 27,704 Institutional funds 479,977 266,053 173,229 20,393 20,302 Retail funds 89,753 51,527 25,071 5,753 7,401
2006 Total 667,533 383,030 224,721 29,134 30,648 Institutional funds 575,482 318,958 210,539 21,925 24,060 Retail funds 92,051 64,072 14,182 7,209 6,588
2007 Total 909,719 501,673 311,080 44,878 52,089 Institutional funds 802,379 430,233 289,954 36,668 45,525 Retail funds 107,339 71,440 21,125 8,210 6,564
2008 Total 1,238,258 671,540 441,820 59,770 65,128 Institutional funds 1,123,636 594,591 417,579 51,754 59,712 Retail funds 114,623 76,950 24,241 8,016 5,416
2009 Total 1,119,079 604,351 407,882 49,884 56,963 Institutional funds 1,028,286 541,198 390,271 44,024 52,794 Retail funds 90,793 63,153 17,611 5,860 4,169
2010p Total 941,277 485,487 348,829 49,218 57,743 Institutional funds 865,554 432,953 334,022 44,325 54,255 Retail funds 75,722 52,535 14,807 4,893 3,488
1 Institutional funds are sold primarily to institutional investors or institutional accounts. This includes accounts that are purchased by an institution, such as a business, financial, or nonprofit organization. Retail funds are sold primarily to individual investors and include variable annuity mutual funds.
2 Financial institutions include credit unions, investment clubs, accounts of banks not held as fiduciaries, insurance companies, and other financial organizations.
3 Other institutional investors include state and local governments, funds holding mutual fund shares, and other institutional accounts not classified.
p Data are preliminary. Note: Data for funds that invest primarily in other mutual funds were excluded from the series. Components may not add to the total because of rounding.

Data Section 7
187WORLDWIDE MUTUAL FUND TOTALS
TABLE 60Worldwide Total Net Assets of Mutual Funds*Millions of U.S. dollars, year-end
2004 2005 2006 2007 2008 2009 2010World $16,152,911 $17,757,360 $21,808,884 $26,132,316 $18,920,012 $22,952,849 $24,698,642Americas 8,780,593 9,750,205 11,470,489 13,423,909 10,581,943 12,585,819 13,586,869
Argentina 2,355 3,626 6,153 6,789 3,867 4,470 5,179Brazil 220,586 302,927 418,771 615,365 479,321 783,970 980,448Canada 413,772 490,518 566,298 698,397 416,031 565,156 636,947Chile 12,588 13,969 17,700 24,444 17,587 34,227 38,243Costa Rica 1,053 804 1,018 1,203 1,098 1,309 1,470Mexico 35,157 47,253 62,614 75,428 60,435 70,659 98,094Trinidad and Tobago N/A N/A N/A N/A N/A 5,832 5,812United States 8,095,082 8,891,108 10,397,935 12,002,283 9,603,604 11,120,196 11,820,677
Europe 5,640,425 6,002,310 7,803,877 8,934,860 6,231,116 7,545,535 7,902,835Austria 103,709 109,002 128,236 138,709 93,269 99,628 94,670Belgium 118,373 115,314 137,291 149,842 105,057 106,721 96,288Bulgaria N/A N/A N/A N/A 226 256 302Czech Republic 4,859 5,334 6,488 7,595 5,260 5,436 5,508Denmark 64,796 75,187 95,601 104,083 65,182 83,024 89,800Finland 37,658 45,415 67,804 81,136 48,750 66,131 71,210France 1,370,954 1,362,671 1,769,258 1,989,690 1,591,082 1,805,641 1,617,176Germany 295,997 296,787 340,325 372,072 237,986 317,543 333,713Greece 43,106 32,011 27,604 29,807 12,189 12,434 8,627Hungary 4,932 6,113 8,472 12,573 9,188 11,052 11,532Ireland 467,620 546,242 855,011 951,371 720,486 860,515 1,013,549Italy 511,733 450,514 452,798 419,687 263,588 279,474 234,313Liechtenstein 12,543 13,970 17,315 25,103 20,489 30,329 35,387Luxembourg 1,396,131 1,635,785 2,188,278 2,685,065 1,860,763 2,293,973 2,512,874Netherlands 102,134 94,357 108,560 113,759 77,379 95,512 85,924Norway 29,911 40,111 54,075 74,709 41,157 71,170 84,505Poland 12,015 17,651 28,959 45,542 17,782 23,025 25,595Portugal 30,514 28,801 31,214 29,732 13,572 15,808 11,004Romania 72 109 247 390 326 1,134 1,713Russia 1,347 2,417 5,659 7,175 2,026 3,182 3,917Slovakia 2,171 3,031 3,168 4,762 3,841 4,222 4,349Slovenia N/A N/A 2,486 4,219 2,067 2,610 2,663Spain 317,538 316,864 367,918 396,534 270,983 269,611 216,915Sweden 107,064 119,103 176,968 194,955 113,331 170,277 205,449Switzerland 94,405 116,669 159,517 176,282 135,052 168,260 261,893Turkey 18,112 21,760 15,462 22,609 15,404 19,426 19,545United Kingdom 492,731 547,092 755,163 897,460 504,681 729,141 854,413
Asia and Pacific 1,677,887 1,939,251 2,456,492 3,678,326 2,037,536 2,715,234 3,067,323Australia 635,073 700,068 864,234 1,192,988 841,133 1,198,838 1,455,850China N/A N/A N/A 434,063 276,303 381,207 364,985Hong Kong 343,638 460,517 631,055 818,421 N/A N/A N/AIndia 32,846 40,546 58,219 108,582 62,805 130,284 111,421Japan 399,462 470,044 578,883 713,998 575,327 660,666 785,504Korea, Rep. of 177,417 198,994 251,930 329,979 221,992 264,573 266,495New Zealand 11,171 10,332 12,892 14,925 10,612 17,657 19,562Pakistan N/A N/A 2,164 4,956 1,985 2,224 2,290Philippines 952 1,449 1,544 2,090 1,263 1,488 2,184Taiwan 77,328 57,301 55,571 58,323 46,116 58,297 59,032
Africa 54,006 65,594 78,026 95,221 69,417 106,261 141,615South Africa 54,006 65,594 78,026 95,221 69,417 106,261 141,615
* Funds of funds are not included except for France, Italy, and Luxembourg. Data include home-domiciled funds, except for Hong Kong, Korea, and New Zealand, which include home- and foreign-domiciled funds.
N/A = not available Note: Components may not add to the total because of rounding. For more worldwide mutual fund statistics, visit ICI’s website at
www.ici.org/research#statistics. Sources: Investment Company Institute, European Fund and Asset Management Association, and other national mutual fund associations

Data
Sec
tion
7
188 2011 INVESTMENT COMPANY FACT BOOK
TABLE 61Worldwide Number of Mutual Funds* Year-end
2004 2005 2006 2007 2008 2009 2010World 55,523 56,867 61,855 66,348 69,032 67,552 69,519Americas 14,063 13,763 14,475 15,460 16,459 16,954 18,019
Argentina 186 200 223 241 253 252 254Brazil 2,859 2,685 2,907 3,381 4,169 4,744 5,618Canada 1,915 1,695 1,764 2,038 2,015 2,075 2,117Chile 537 683 926 1,260 1,484 1,691 1,912Costa Rica 115 110 100 93 85 64 68Mexico 411 416 437 420 431 407 434Trinidad and Tobago N/A N/A N/A N/A N/A 36 35United States 8,040 7,974 8,118 8,027 8,022 7,685 7,581
Europe 29,306 30,060 33,151 35,210 36,780 34,899 35,292Austria 840 881 948 1,070 1,065 1,016 1,016Belgium 1,281 1,391 1,549 1,655 1,828 1,845 1,797Bulgaria N/A N/A N/A N/A 81 85 90Czech Republic 53 51 52 66 76 78 80Denmark 423 471 494 500 489 483 490Finland 280 333 376 379 389 377 366France 7,908 7,758 8,092 8,243 8,301 7,982 7,791Germany 1,041 1,076 1,199 1,462 1,675 2,067 2,106Greece 262 247 247 230 239 210 213Hungary 97 91 161 212 270 264 276Ireland 2,088 2,127 2,531 2,898 3,097 2,721 2,899Italy 1,142 1,035 989 924 742 675 650Liechtenstein 171 200 233 391 335 348 409Luxembourg 6,855 7,222 7,919 8,782 9,351 9,017 9,353Netherlands 542a 515 473 450 458a N/A N/ANorway 406 419 524 511 530 487 507Poland 130 150 157 188 210 208 214Portugal 163 169 175 180 184 171 171Romania 19 23 32 41 52 51 56Russia 210 257 358 533 528 480 462Slovakia 40 43 43 54 56 54 58Slovenia N/A N/A 96 106 125 125 130Spain 2,559 2,672 3,235 2,940 2,944 2,588 2,486Sweden 461 464 474 477 508 506 504Switzerland 385 510 609 567 572 509 653Turkey 240 275 282 294 304 286 311United Kingdom 1,710 1,680 1,903 2,057 2,371 2,266 2,204
Asia and Pacific 11,617 12,427 13,479 14,847 14,909 14,795 15,265Australia N/A N/A N/A N/A N/A N/A N/AChina N/A N/A N/A 341 429 547 660Hong Kong 1,013 1,009 1,099 1,162 N/A N/A N/AIndia 394 445 468 555 551 590 658Japan 2,552 2,640 2,753 2,997 3,333 3,656 3,905Korea, Rep. of 6,636 7,279 8,030 8,609 9,384 8,703 8,687New Zealand 553 563 613 623 643 702 700Pakistan N/A N/A 31 64 83 96 125Philippines 24 32 38 40 43 41 43Taiwan 445 459 447 456 443 460 487
Africa 537 617 750 831 884 904 943South Africa 537 617 750 831 884 904 943
* Funds of funds are not included except for France, Italy, and Luxembourg. Data include home-domiciled funds, except for Hong Kong, Korea, and New Zealand, which include home- and foreign-domiciled funds.
a Year-end data are not available. Data are as of September. N/A = not available Note: For more worldwide mutual fund statistics, visit ICI’s website at www.ici.org/research#statistics. Sources: Investment Company Institute, European Fund and Asset Management Association, and other national mutual fund associations

Data Section 7
189WORLDWIDE MUTUAL FUND TOTALS
TABLE 62Worldwide Net Sales1 of Mutual Funds2 Millions of U.S. dollars, annual
2004 2005 2006 2007 2008 2009 2010World $458,515 $968,786 $1,296,992 $1,533,465 $275,672 $272,149 $57,296Americas 167,343 424,357 725,054 1,204,158 606,159 80,084 -38,994
Argentina N/A N/A N/A N/A N/A N/A N/ABrazil 1,611 5,293 21,083 16,880 -32,653 47,317 58,316Canada 18,454 31,220 36,579 61,286 17,495 12,074 23,797Chile 3,236 N/A 3,113 3,282 -1,167 9,921 416Costa Rica N/A N/A N/A N/A N/A N/A 171Mexico 768 6,849 11,377 10,154 -3,418 8,572 18,382Trinidad and Tobago N/A N/A N/A N/A N/A -150 -45United States 143,274 380,995 652,902 1,112,556 625,902 2,350 -140,031
Europe 236,618 459,913 427,527 101,766 -443,035 166,653 84,421Austria 6,874 16,240 3,402 -4,864 -18,147 -4,746 -2,301Belgium N/A N/A N/A N/A N/A N/A N/ABulgaria N/A N/A N/A N/A -151 8 51Czech Republic -77 642 59 198 -1,561 -263 55Denmark 9,260 12,950 5,646 1,893 -4,000 2,419 5,204Finland 7,856 6,371 13,229 3,535 -11,387 5,475 936France 66,216 76,442 133,843 -49,354 -68,351 6,164 -110,856Germany -8,687 10,557 -10,472 -18,531 -32,746 11,935 13,835Greece 52 -7,810 -9,598 -2,643 -11,382 -1,124 -1,424Hungary N/A 1,777 -42 2,436 -1,755 776 936Ireland N/A N/A N/A N/A N/A N/A N/AItaly -37,142 -19,216 -59,828 -81,538 -107,691 -10,925 -29,921Liechtenstein 2,569 1,363 782 3,636 2,317 5,087 261Luxembourg 142,199 293,331 299,906 255,689 -102,257 95,059 152,608Netherlands 802 -9,313 11 -5,732 -6,117a N/A 225Norway 2,968 8,231 4,676 6,870 40 6,689 4,807Poland N/A N/A N/A N/A -1,423 859 1,278Portugal 534 1,645 -1,843 -5,707 -11,169 1,120 -3,684Romania 29 20 97 93 125 760 561Russia N/A N/A N/A N/A N/A N/A N/ASlovakia 594 1,207 -512 689 -897 80 308Slovenia N/A N/A 18 637 -433 27 21Spain 30,610 26,962 -3,852 -23,273 -84,149 -15,858 -30,938Sweden 5,400 7,518 7,735 2,228 3,754 10,203 7,371Switzerland -2,185 9,218 11,681 15,074 17,851 7,343 4,063Turkey N/A N/A N/A N/A N/A 2,324 2,608United Kingdom 8,746 21,778 32,589 430 -3,506 43,241 68,417
Asia and Pacific 48,005 75,420 135,467 217,849 105,561 13,908 -3,093Australia N/A N/A N/A N/A N/A N/A N/AChina N/A N/A N/A N/A 35,721b -35,612 -15,115Hong Kong 2,640 1,195 3,613 6,834 N/A N/A N/AIndia 339 4,915 11,766 27,357 2,754 43,029 -35,950Japan 22,429 77,458 99,625 120,308 5,430 32,571 68,847Korea, Rep. of 31,540 13,585 25,292 61,081 58,818 -27,836 -19,604New Zealand -132 -555 -196 254 226 1,363 1,281Pakistan N/A N/A 425 2,922 -612 -3 -208Philippines 118 300 -241 -15 -453 11 318Taiwan -8,929 -21,478 -4,817 -892 3,677 385 -2,661
Africa 6,549 9,096 8,944 9,692 6,987 11,504 14,962South Africa 6,549 9,096 8,944 9,692 6,987 11,504 14,962
1 Net sales is a calculation of total sales minus total redemptions plus net exchanges. 2 Funds of funds are not included except for France, Italy, and Luxembourg. Data include home-domiciled funds, except for Hong Kong,
Korea, and New Zealand, which include home- and foreign-domiciled funds. a Year-end data are not available. Data are for January through September. b Data are only for October through December. N/A = not available Note: Components may not add to the total because of rounding. Sources: Investment Company Institute, European Fund and Asset Management Association, and other national mutual fund associations

190 APPENDIX A
Appendix A
How U S -Registered Investment Companies Operate and the Core Principles Underlying Their Regulation
This appendix provides an overview of how investment company operations and features serve investors, examines the tax treatment of funds, and describes the core principles underlying investment company regulation.
The Origins of Pooled Investing 190
The Different Types of U.S. Investment Companies 192
The Organization of a Mutual Fund 192
Tax Features of Mutual Funds 196
Core Principles Underlying the Regulation of U.S. Investment Companies 202
The Origins of Pooled Investing
The investment company concept dates to the late 1700s in Europe, according to K Geert
Rouwenhorst in The Origins of Mutual Funds, when “a Dutch merchant and broker…invited
subscriptions from investors to form a trust…to provide an opportunity to diversify for small
investors with limited means ”
The emergence of “investment pooling” in England in the 1800s brought the concept closer to
U S shores In 1868, the Foreign and Colonial Government Trust formed in London This trust
resembled the U S fund model in basic structure, providing “the investor of moderate means the
same advantages as the large capitalists…by spreading the investment over a number of different
stocks ”
Perhaps more importantly, the British fund model established a direct link with U S securities
markets, helping finance the development of the post–Civil War U S economy The Scottish
American Investment Trust, formed on February 1, 1873, by fund pioneer Robert Fleming, invested
in the economic potential of the United States, chiefly through American railroad bonds Many other
trusts followed that not only targeted investment in America, but also led to the introduction of the
fund investing concept on U S shores in the late 1800s and early 1900s

191HOW U.S.-REGISTERED INVESTMENT COMPANIES OPERATE AND THE CORE PRINCIPLES UNDERLYING THEIR REGULATION
Four Principal Securities Laws Govern Investment Companies
The Investment Company Act of 1940 Regulates the structure and operations of investment companies through a combination of disclosure requirements and restrictions on day-to-day operations. Among other things, the Investment Company Act addresses investment company capital structures, custody of assets, investment activities (particularly with respect to transactions with affiliates and other transactions involving potential conflicts of interest), and the duties of fund boards.
The Investment Advisers Act of 1940 Regulates investment advisers. Requires all advisers to registered investment companies and other large advisers to register with the SEC. The Advisers Act contains provisions requiring fund advisers to meet recordkeeping, custodial, reporting, and other regulatory responsibilities.
The Securities Exchange Act of 1934 Regulates the trading, purchase, and sale of securities, including investment company shares. The 1934 Act also regulates broker-dealers, including investment company principal underwriters and others that sell investment company shares, and requires them to register with the SEC.
The Securities Act of 1933 Regulates public offerings of securities, including investment company shares. The 1933 Act also requires that all investors receive a current prospectus describing the fund.
The first mutual, or “open-end,” fund was introduced in Boston in March 1924 The Massachusetts
Investors Trust, formed as a common law trust, introduced important innovations to the investment
company concept by establishing a simplified capital structure, continuous offering of shares,
the ability to redeem shares rather than hold them until dissolution of the fund, and a set of clear
investment restrictions and policies
The stock market crash of 1929 and the Great Depression that followed greatly hampered the
growth of pooled investments until a succession of landmark securities laws, beginning with the
Securities Act of 1933 and concluding with the Investment Company Act of 1940, reinvigorated
investor confidence Renewed investor confidence and many innovations led to relatively steady
growth in industry assets and number of accounts

192 APPENDIX A
The Different Types of U.S. Investment Companies
Fund sponsors in the U S offer four types of registered investment companies: open-end
investment companies (commonly called mutual funds), closed-end investment companies,
exchange-traded funds (ETFs), and unit investment trusts (UITs)
The vast majority of investment companies are mutual funds, both in terms of number of funds
and assets under management Mutual funds can have actively managed portfolios, in which
a professional investment adviser creates a unique mix of investments to meet a particular
investment objective, or passively managed portfolios, in which the adviser seeks to track the
performance of a selected benchmark or index One hallmark of mutual funds is that they issue
redeemable securities, meaning that the fund stands ready to buy back its shares at their current
net asset value (NAV) The NAV is calculated by dividing the total market value of the fund’s assets,
minus its liabilities, by the number of mutual fund shares outstanding
Unlike mutual funds, closed-end funds do not issue redeemable shares Instead, they issue a fixed
number of shares that trade intraday on stock exchanges at market-determined prices Investors
in a closed-end fund buy or sell shares through a broker, just as they would trade the shares of any
publicly traded company For more information on closed-end funds, see chapter 4 on page 53
ETFs are described as a hybrid of other types of investment companies They are structured and
legally classified as mutual funds or UITs (discussed below), but trade intraday on stock exchanges
like closed-end funds ETFs only buy and sell fund shares directly to authorized participants in large
blocks, often 50,000 shares or more For more information on ETFs, see chapter 3 on page 39
UITs are also a hybrid, with some characteristics of mutual funds and some of closed-end funds
Like closed-end funds, UITs typically issue only a specific, fixed number of shares, called “units ”
Like mutual funds, the units are redeemable, but unlike mutual funds, generally the UIT sponsor
will maintain a secondary market in the units so that redemptions do not deplete the UIT’s assets
A UIT does not actively trade its investment portfolio, instead buying and holding a set of particular
investments until a set termination date, at which time the trust is dissolved and proceeds are paid
to shareholders
The Organization of a Mutual Fund
Individuals and institutions invest in a mutual fund by purchasing shares issued by the fund It is
through these sales of shares that a mutual fund raises the cash used to invest in its portfolio of
stocks, bonds, and other investments Each investor shares in the returns from the fund’s portfolio
while benefiting from professional investment management, diversification, and liquidity Mutual
funds may offer other benefits and services, such as asset allocation programs or check-writing
privileges on money market fund accounts

193HOW U.S.-REGISTERED INVESTMENT COMPANIES OPERATE AND THE CORE PRINCIPLES UNDERLYING THEIR REGULATION
A mutual fund is organized under state law either as a corporation or a business trust (sometimes
called a statutory trust) Mutual funds have officers and directors (if the fund is a corporation)
or trustees (if the fund is a business trust) 1 In this way, mutual funds are like any other type of
operating company, such as Exxon or Google The fund’s board plays an important role, described
in more detail below, in overseeing fund operations
Unlike other companies, however, a mutual fund is typically externally managed; it is not an
operating company and it has no employees in the traditional sense Instead, a fund relies upon
third parties or service providers that are either affiliated organizations or independent contractors
to invest fund assets and carry out other business activities The diagram below (Figure A 1) shows
the primary types of service providers usually relied upon by a fund
Although it typically has no employees, a fund is required by law to have its own written
compliance program, overseen by an individual designated as a chief compliance officer (CCO)
This compliance program establishes detailed procedures and internal controls designed to ensure
compliance with all relevant laws and regulations
FIGURE A.1
Organization of a Mutual Fund
Shareholders
Board of directorsFund
Sponsor/Investment
adviser
Independentpublic
accountant
Custodian Transfer agent
Principalunderwriter
Administrator
1 For ease of reference, this appendix refers to all directors and trustees as directors and all boards as boards of directors.
194 APPENDIX A
Shareholders
Like shareholders of other companies, mutual fund shareholders have specific voting rights These
include the right to elect directors at meetings called for that purpose and the right to approve
material changes in the terms of a fund’s contract with its investment adviser, the entity that
manages the fund’s assets For example, a fund’s management fee cannot be increased or a fund’s
investment objectives or fundamental policies cannot be changed unless a majority of shareholders
vote to approve the increase or change
Sponsors
Setting up a mutual fund is a complicated process performed by the fund’s sponsor, which is
typically the fund’s investment adviser The fund sponsor has a variety of responsibilities For
example, it must assemble the group of third parties needed to launch the fund, including
the persons or entities charged with managing and operating the fund The sponsor provides
officers and affiliated directors to oversee the fund and recruits unaffiliated persons to serve as
independent directors
Some of the major steps in the process of starting a mutual fund include organizing the fund
under state law as either a business trust or corporation, registering the fund with the SEC as an
investment company pursuant to the Investment Company Act of 1940, and registering the fund
shares for sale to the public pursuant to the Securities Act of 1933 2 Unless otherwise exempt from
doing so, the fund must also make filings and pay fees to each state (except Florida) in which the
fund’s shares will be offered to the public The Investment Company Act also requires that each
new fund have at least $100,000 of seed capital before distributing its shares to the public; this
capital is usually contributed by the sponsor or adviser in the form of an initial investment
Advisers
Investment advisers have overall responsibility for directing the fund’s investments and handling
its business affairs The investment advisers have their own employees, including investment
professionals who work on behalf of the funds’ shareholders and determine which securities to
buy and sell in the funds’ portfolio, consistent with the funds’ investment objectives and policies
In addition to managing the fund’s portfolio, the adviser often serves as administrator to the fund,
providing various “back office” services As noted earlier, a fund’s investment adviser is often the
fund’s initial sponsor and its initial shareholder through the seed money invested to create the
fund
2 For more information on the requirements for the initial registration of a mutual fund, see the SEC’s Investment Company Registration and Regulation Package, available at www.sec.gov/divisions/investment/invcoreg121504.htm.

195HOW U.S.-REGISTERED INVESTMENT COMPANIES OPERATE AND THE CORE PRINCIPLES UNDERLYING THEIR REGULATION
To protect investors, a fund’s investment adviser and the adviser’s employees are subject to
numerous standards and legal restrictions, including restrictions on transactions that may pose
conflicts of interest Like the mutual fund, investment advisers are required to have their own
written compliance programs that are overseen by chief compliance officers and establish detailed
procedures and internal controls designed to ensure compliance with all relevant laws and
regulations
Administrators
A fund’s administrator handles the many back office functions for a fund For example,
administrators often provide office space, clerical and fund accounting services, data processing,
bookkeeping and internal auditing, and prepare and file SEC, tax, shareholder, and other reports
Fund administrators also help maintain compliance procedures and internal controls, subject to
oversight by the fund’s board and CCO
Principal Underwriters
Investors buy and redeem fund shares either directly or indirectly through the principal
underwriter, also known as the fund’s distributor Principal underwriters are registered under
the Securities Exchange Act of 1934 as broker-dealers, and, as such, are subject to strict rules
governing how they offer and sell securities to investors
The principal underwriter contracts with the fund to purchase and then resell fund shares to the
public A majority of both the fund’s independent directors and the entire fund board must approve
the contract with the principal underwriter
Transfer Agents
Mutual funds and their shareholders rely on the services of transfer agents to maintain records of
shareholder accounts, calculate and distribute dividends and capital gains, and prepare and mail
shareholder account statements, federal income tax information, and other shareholder notices
Some transfer agents also prepare and mail statements confirming shareholder transactions and
account balances, and maintain customer service departments, including call centers, to respond
to shareholder inquiries
Auditors
Auditors certify the fund’s financial statements The auditors’ oversight role is described more
fully below

196 APPENDIX A
Tax Features of Mutual Funds
Mutual funds are subject to special tax rules set forth in subchapter M of the Internal Revenue
Code Unlike most corporations, mutual funds are not subject to taxation on their income or capital
gains at the entity level, provided that they meet certain gross income, asset, and distribution
requirements
To qualify as a regulated investment company (RIC), under subchapter M, at least 90 percent of
a mutual fund’s gross income must be derived from certain sources, including dividends, interest,
payments with respect to securities loans, and gains from the sale or other disposition of stock,
securities, or foreign currencies In addition, at the close of each quarter of the fund’s taxable year,
at least 50 percent of the value of the fund’s total net assets must consist of cash, cash items,
government securities, securities of other funds, and investments in other securities which, with
respect to any one issuer, represent neither more than 5 percent of the assets of the fund nor more
than 10 percent of the voting securities of the issuer Further, no more than 25 percent of the fund’s
assets may be invested in the securities of any one issuer (other than government securities or the
securities of other funds), the securities (other than the securities of other funds) of two or more
issuers which the fund controls and are engaged in similar trades or businesses, or the securities
of one or more qualified publicly traded partnerships
If a mutual fund satisfies the gross income and asset tests and thus qualifies as a RIC, the fund
is not subject to tax on its income and capital gains, provided that the RIC distributes at least
90 percent of its income (other than net capital gains) each year A RIC may retain up to 10 percent
of its income and all capital gains, but the retained income is taxed at regular corporate tax rates
Therefore, mutual funds generally distribute substantially all of their income and capital gains
each year

197HOW U.S.-REGISTERED INVESTMENT COMPANIES OPERATE AND THE CORE PRINCIPLES UNDERLYING THEIR REGULATION
Mutual Fund Assets by Tax Status
Mutual funds generally distribute all earnings—capital gains and ordinary dividends—each
year to shareholders, and are taxed only on amounts retained Fund investors are ultimately
responsible for paying tax on a fund’s earnings, whether they receive the distributions in
cash or reinvest them in additional fund shares Investors often attempt to lessen the impact
of taxes on their investments by investing in tax-exempt funds and tax-deferred retirement
accounts and variable annuities As of year-end 2010, 7 percent of all mutual fund assets
were held in tax-exempt funds, and 48 percent were invested in tax-deferred accounts held
by households (Figure A 2)
For more information on tax issues affecting mutual fund shareholders, visit the Institute’s
website at www ici org
FIGURE A.2
55 Percent of Mutual Fund Assets Were Held in Tax-Deferred Accounts and Tax-Exempt FundsPercent, year-end 2010
12%Taxable nonhousehold
33%Taxable household
48%Tax-deferred household
7%Tax-exempt funds
Total mutual fund assets: $11.8 trillion

198 APPENDIX A
The Internal Revenue Code also imposes an excise tax on RICs, unless a RIC distributes by
December 31 at least 98 percent of its ordinary income earned during the calendar year, and
98 percent of its net capital gain earned during the 12-month period ending on October 31 of
the calendar year Mutual funds typically seek to avoid this charge—imposed at a 4 percent rate
on the “underdistributed” amount—by electing to distribute their income each year
Types of Distributions
Mutual funds make two types of taxable distributions to shareholders: ordinary dividends and
capital gains
Dividend distributions come primarily from the interest and dividends earned by the securities
in a fund’s portfolio and net short-term gains, if any, after expenses are paid by the fund These
distributions must be reported as dividends on an investor’s tax return and are taxed at the
investor’s ordinary income tax rate Legislation in effect through 2012 provides a top tax rate of
15 percent on certain “qualified dividend” income Some dividends paid by mutual funds may
qualify for this lower tax rate
Long-term capital gains distributions represent a fund’s net gains, if any, from the sale of securities
held in its portfolio for more than one year Legislation in effect through 2012 also provides a top
tax rate of 15 percent on investors’ long-term capital gains; a lower rate applies to some taxpayers
Fund investors ultimately are responsible for paying tax on their share of a fund’s earnings, whether
they receive the distributions in cash or reinvest them in additional fund shares To help mutual
fund shareholders understand the impact of taxes on the returns generated by their investments,
the SEC requires mutual funds to disclose standardized after-tax returns for one-, five-, and
10-year periods After-tax returns, which accompany before-tax returns in fund prospectuses,
are presented in two ways:
» After taxes on fund distributions only (preliquidation)
» After taxes on fund distributions and an assumed redemption of fund shares (postliquidation)

199HOW U.S.-REGISTERED INVESTMENT COMPANIES OPERATE AND THE CORE PRINCIPLES UNDERLYING THEIR REGULATION
Mutual Fund Dividend Distributions
Dividend distributions represent income—primarily from interest and dividends earned by
securities in a fund’s portfolio—after expenses are paid by the fund Mutual funds distributed
$188 billion in dividends to fund shareholders in 2010 (Figure A 3) Bond and money market
funds accounted for 55 percent of all dividend distributions in 2010 Fifty-six percent of
all dividend distributions were paid to tax-exempt fund shareholders and tax-deferred
household accounts Another 36 percent were paid to taxable household accounts
FIGURE A.3
Dividend DistributionsBillions of dollars, 1998–2010
Tax-deferred household and
tax-exempt fundsTaxable
householdTaxable
nonhousehold Total
1998 $61 $63 $15 $138
1999 74 72 18 164
2000 75 87 24 186
2001 68 72 22 162
2002 59 44 12 114
2003 57 38 8 103
2004 65 42 10 117
2005 83 62 20 166
2006 113 92 35 240
2007 141 121 47 309
2008 135 103 38 276
2009 105 65 17 187
2010 106 68 14 188
Note: Components may not add to the total because of rounding.

200 APPENDIX A
Mutual Fund Capital Gains Distributions
Capital gains distributions represent a fund’s net gains, if any, from the sale of securities
held in its portfolio When gains from these sales exceed losses, they are distributed to fund
shareholders Mutual funds distributed $43 billion in capital gains to shareholders in 2010
(Figure A 4) Forty-nine percent of these distributions were paid to tax-deferred household
accounts, and another 42 percent were paid to taxable household accounts Stock, bond, and
hybrid funds can distribute capital gains, but stock funds typically account for the bulk of
distributions In 2010, 11 percent of stock fund share classes made a capital gains distribution,
and half of these share classes distributed at least 1 7 percent of their assets as capital gains
FIGURE A.4
Capital Gains Distributions*Billions of dollars, 1998–2010
Tax-deferred household
Taxable household
Taxable nonhousehold Total
1998 $98 $61 $6 $165
1999 144 82 11 238
2000 197 116 13 326
2001 50 16 2 69
2002 10 6 1 16
2003 7 6 1 14
2004 30 21 4 55
2005 76 45 8 129
2006 161 81 14 257
2007 253 137 23 414
2008 94 31 8 132
2009 11 4 1 16
2010 21 18 4 43
* Capital gains distributions include long-term and short-term capital gains.
Note: Components may not add to the total because of rounding.

201HOW U.S.-REGISTERED INVESTMENT COMPANIES OPERATE AND THE CORE PRINCIPLES UNDERLYING THEIR REGULATION
Types of Taxable Shareholder Transactions
An investor who sells mutual fund shares usually incurs a capital gain or loss in the year the shares
are sold; an exchange of shares between funds in the same fund family also results in either a
capital gain or loss
Investors are liable for tax on any capital gain arising from the sale of fund shares, just as they
would be if they sold a stock, bond, or other security Capital losses from mutual fund share sales
and exchanges, like capital losses from other investments, may be used to offset other capital gains
in the current year and thereafter
The amount of a shareholder’s gain or loss on fund shares is determined by the difference between
the “cost basis” of the shares (generally, the purchase price—including sales loads—of the shares,
whether acquired with cash or reinvested dividends) and the sale price Many funds voluntarily
provide cost basis information to shareholders or compute gains and losses for shares sold
Beginning in 2012, new tax rules will require all brokers and funds to provide cost basis information
to shareholders, as well as indicate whether any gains or losses are long-term or short-term, for
fund shares acquired on or after January 2, 2012
Tax-Exempt Funds
Tax-exempt bond funds pay dividends earned from municipal bond interest This income is
exempt from federal income tax and, in some cases, state and local taxes as well Tax-exempt
money market funds invest in short-term municipal securities or equivalent instruments and also
pay exempt-interest dividends Even though income from these funds generally is tax-exempt,
investors must report it on their income tax returns Tax-exempt funds provide investors with this
information and typically explain how to handle tax-exempt dividends on a state-by-state basis
For some taxpayers, portions of income earned by tax-exempt funds also may be subject to the
federal alternative minimum tax
202 APPENDIX A
Core Principles Underlying the Regulation of U.S. Investment Companies
Embedded in the structure and regulation of mutual funds and other registered investment
companies are several core principles that provide important protections for shareholders
Transparency
Funds are subject to more extensive disclosure requirements than any other comparable financial
product, such as separately managed accounts, collective investment trusts, and private pools The
cornerstone of the disclosure regime for mutual funds and ETFs is the prospectus 3 Mutual funds
and ETFs are required to maintain a current prospectus, which provides investors with information
about the fund, including its investment objectives, investment strategies, risks, fees and expenses,
and performance, as well as how to purchase, redeem, and exchange fund shares Importantly, the
key parts of this disclosure with respect to performance information and fees and expenses are
standardized to facilitate comparisons by investors Mutual funds and ETFs may provide investors
with a “summary prospectus” containing key information about the fund, while making more
information available on the Internet and on paper upon request
Mutual funds and ETFs also are required to make statements of additional information (SAIs)
available to investors upon request and without charge The SAI conveys information about
the fund that, while useful to some investors, is not necessarily needed to make an informed
investment decision For example, the SAI generally includes information about the history of the
fund, offers detailed disclosure on certain investment policies (such as borrowing and concentration
policies), and lists officers, directors, and persons who control the fund
The prospectus, SAI, and certain other required information are contained in the fund’s registration
statement, which is filed electronically with the Securities and Exchange Commission (SEC) and is
publicly available via the SEC’s Electronic Data Gathering, Analysis, and Retrieval (EDGAR) system
Mutual fund and ETF registration statements are amended at least once each year to ensure
that financial statements and other information do not become stale 4 These funds also amend
registration statements throughout the year as necessary to reflect material changes to their
disclosure
3 Closed-end funds and UITs also provide investors with extensive disclosure, but under a slightly different regime that reflects the way shares of these funds trade. Both closed-end funds and UITs file an initial registration statement with the SEC, containing a prospectus and other information related to the initial offering of their shares to the public.
4 Section 10(a)(3) of the Securities Act of 1933 prohibits investment companies that make a continuous offering of shares from using a registration statement with financial information that is more than 16 months old. As a result, mutual funds and ETFs must amend their registration statements within four months after the end of their fiscal year.
203HOW U.S.-REGISTERED INVESTMENT COMPANIES OPERATE AND THE CORE PRINCIPLES UNDERLYING THEIR REGULATION
In addition to registration statement disclosure, funds provide shareholders with several other
disclosure documents Shareholders receive audited annual and unaudited semiannual reports
within 60 days after the end and the midpoint of the fund’s fiscal year These reports contain
updated financial statements, a list of the fund’s portfolio securities,5 management’s discussion
of financial performance, and other information current as of the date of the report
Following their first and third quarter, funds file an additional form with the SEC, Form N-Q,
disclosing the complete schedule of their portfolio holdings Finally, funds annually disclose how
they voted on specific proxy issues at portfolio companies on Form N-PX Funds are the only
shareholders required to publicly disclose each and every proxy vote they cast Funds are not
required to mail Form N-Q and Form N-PX to shareholders, but the forms are publicly available
via the SEC’s EDGAR database
The combination of prospectuses, SAIs, annual and semiannual shareholder reports, Form N-Qs,
and Form N-PXs provide the investing public, regulators, media, and other interested parties with
far more information on funds than is available for other types of investments This information is
easily and readily available from most funds and the SEC It is also available from any number of
private-sector vendors, such as Morningstar, that are in the business of compiling publicly available
information on funds in ways that might benefit investors
Daily Valuation and Liquidity
Nearly all funds offer shareholders liquidity and objective, market-based valuation of their
investments at least daily ETF and closed-end fund shares are traded intraday on stock exchanges
at market-determined prices, giving shareholders real-time liquidity and pricing Mutual fund
shares are redeemable on a daily basis at a price that reflects the current market value of the fund’s
portfolio securities, calculated according to pricing methodologies established by each fund’s board
of directors The value of each security in the fund’s portfolio is determined either by a market
quotation, if a market quotation is readily available, or at fair value as determined in good faith
The daily pricing process is a critically important core compliance function that involves numerous
staff, the fund board, and pricing vendors The fair valuation process, a part of the overall
pricing process, receives particular scrutiny from funds, their board of directors, regulators, and
independent auditors Under SEC rules, all funds must adopt written policies and procedures that
address the circumstances under which securities may be fair valued, and must establish criteria
for determining how to assign fair values in particular instances 6
5 A fund is permitted to include a summary portfolio schedule in its shareholder reports in lieu of the complete schedule, provided that the complete portfolio schedule is filed with the SEC and is provided to shareholders upon request, free of charge. The summary portfolio schedule includes each of the fund’s 50 largest holdings in unaffiliated issuers and each investment that exceeds 1 percent of the fund’s NAV.
6 ICI has published several papers on the mutual fund valuation process. For more information, see ICI’s two white papers titled Valuation and Liquidity Issues for Mutual Funds (February 1997 and March 2002) and two installments of ICI’s Fair Value Series, “An Introduction to Fair Valuation” (2005) and “The Role of the Board” (2007).

204 APPENDIX A
This daily valuation process results in a net asset value, or NAV, for the fund The NAV is the price
used for all mutual fund share transactions—new purchases, sales (redemptions), and exchanges
from one fund to another within the same fund family 7 It represents the current mark-to-market
value of all the fund’s assets, minus liabilities (e g , fund expenses), divided by the total number of
outstanding shares (Figure A 5) Mutual funds release their daily NAVs to investors and others after
they complete the pricing process, generally around 6:00 p m eastern time Daily fund prices are
available through fund toll-free telephone services, websites, and other means
The Investment Company Act of 1940 requires mutual funds to process transactions based upon
“forward pricing,” meaning that shareholders receive the next computed NAV following the fund’s
receipt of their transaction order So, for a fund that prices its shares at 4:00 p m ,8 orders received
prior to 4:00 p m receive the NAV determined that same day at 4:00 p m Orders received after
4:00 p m receive the NAV determined at 4:00 p m on the next business day Forward pricing is
an important protection for mutual fund shareholders It is designed to minimize the ability of
shareholders to take advantage of fluctuations in the price of the securities in the fund’s portfolio
that occur after the fund calculates its NAV
7 The pricing process is also critical for ETFs, although for slightly different reasons. ETFs operate like mutual funds with respect to transactions with “authorized participants” who trade with the ETF in large blocks, often of 50,000 shares or more. The NAV is the price used for these large transactions. Closed-end funds are not required to strike a daily NAV, but most do so in order to provide the market with the ability to calculate the difference between the fund’s market price and its NAV. That difference is called the fund’s “premium” or “discount.”
8 Funds must price their shares at least once per day at a time determined by the fund’s board. Many funds price at 4:00 p.m. eastern time or when the New York Stock Exchange closes.
FIGURE A.5
Determining NAV
Fund X owns a portfolio of stocks worth $6 million; its liabilities are $60,000; its shareholders own 500,000 shares.
NAVs can be found on most major financial websites or in the financial pages of most major newspapers.
Net asset value (NAV)$11.88 =
Market value in dollars of securitiesminus liabilities
$6,000,000 - $60,000
Number of investor shares outstanding500,000

205HOW U.S.-REGISTERED INVESTMENT COMPANIES OPERATE AND THE CORE PRINCIPLES UNDERLYING THEIR REGULATION
When a shareholder redeems shares in a mutual fund, he or she can expect to be paid promptly
Mutual funds may not suspend redemptions of their shares (subject to certain extremely limited
exceptions)9 or delay payments of redemption proceeds for more than seven days
SEC guidelines require a mutual fund to have at least 85 percent of its assets in liquid securities 10
In part to ensure that redemptions can be made, a security is generally deemed to be liquid if it
can be sold or disposed of in the ordinary course of business within seven days at approximately
the price at which the mutual fund has valued it Many funds adopt a specific policy with respect
to investments in illiquid securities; these policies are sometimes more restrictive than the SEC
requirements
Oversight and Accountability
All funds are subject to a strong system of oversight from both internal and external sources
Internal oversight mechanisms include boards of directors, which include independent directors,
and written compliance programs overseen by chief compliance officers, both at the fund and
adviser levels External oversight is provided by the SEC, the Financial Industry Regulatory
Association (FINRA), and external service providers, such as certified public accounting firms
Fund Boards
Mutual funds, closed-end funds, and most ETFs have boards A fund’s board of directors is elected
by the fund’s shareholders to govern the fund, and its role is primarily one of oversight The board
of directors typically is not involved in the day-to-day management of the fund company Instead,
day-to-day management of the fund is handled by the fund’s investment adviser or administrator
pursuant to a contract with the fund
Investment company directors review and approve major contracts with service providers
(including, notably, the fund’s investment adviser), approve policies and procedures to ensure
the fund’s compliance with the federal securities laws, and undertake oversight and review of
the performance of the fund’s operations Directors devote substantial time and consider large
amounts of information in fulfilling these duties, in part because they must perform all their duties
in “an informed and deliberate manner ”
9 An example of such an exception would be an emergency that affects markets or funds, such as the assassination of President John F. Kennedy in 1963, the blackouts that affected lower Manhattan in 1990, or earthquakes and other natural disasters. The SEC must declare an emergency to exist to trigger an exception.
10 Money market funds are held to a stricter standard, and must limit illiquid investments to 5 percent of the portfolio.

206 APPENDIX A
Unlike boards of operating companies, these fund boards must maintain a particular level of
independence The Investment Company Act requires at least 40 percent of the members of a fund
board to be independent from fund management An independent director is a fund director who
does not have any significant business relationship with a mutual fund’s adviser or underwriter In
practice, most fund boards have far higher percentages of independent directors As of year-end
2009, independent directors comprised at least three-quarters of boards in almost 90 percent of
fund complexes
Independent fund directors play a critical role in overseeing fund operations and are entrusted with
the primary responsibility for looking after the interests of the fund’s shareholders They serve
as “watchdogs,” furnishing an independent check on the management of funds Like directors of
operating companies, they owe shareholders the duties of loyalty and care under state law But
independent fund directors also have specific statutory and regulatory responsibilities under the
Investment Company Act beyond the duties required of other types of directors Among other
things, for example, they oversee the performance of the fund, approve the fees paid to the
investment adviser for its services, and oversee the fund’s compliance program
Compliance Programs
The internal oversight function played by the board has been greatly enhanced in recent years
by the development of written compliance programs and a formal requirement that all funds
have chief compliance officers Rules adopted in 2003 require every fund and adviser to have a
CCO who administers a written compliance program reasonably designed to prevent, detect, and
correct violations of the federal securities laws Compliance programs must be reviewed at least
annually for their adequacy and effectiveness, and fund CCOs are required to report directly to the
independent directors
Regulatory Oversight
Internal oversight is accompanied by a number of forms of external oversight and accountability
Funds are subject to inspections, examinations, and enforcement by their primary regulator, the
SEC Funds are also overseen by self-regulatory organizations, such as FINRA and stock exchanges;
state securities regulators; and banking regulators (to the extent the fund is affiliated with a bank)
Auditors
Funds’ financial statement disclosure is also subject to several internal and external checks
For example, annual reports include audited financial statements certified by a certified public
accounting firm subject to oversight by the Public Company Accounting Oversight Board (PCAOB)
This ensures that the financial statements are prepared in conformity with generally accepted
accounting principles (GAAP) and present fairly the fund’s financial position and results of
operations
207HOW U.S.-REGISTERED INVESTMENT COMPANIES OPERATE AND THE CORE PRINCIPLES UNDERLYING THEIR REGULATION
Sarbanes-Oxley
Like officers of public companies, fund officers are required to make certifications and disclosures
required by the Sarbanes-Oxley Act For example, they must certify the accuracy of the financial
statements
Additional Regulation of Advisers
In addition to the system of oversight applicable directly to funds, investors enjoy protections
through SEC regulation of the investment advisers that manage fund portfolios All advisers
to registered funds are required to register with the SEC, and are subject to SEC oversight and
disclosure requirements Advisers also owe a fiduciary duty to each fund they advise, meaning that
they have a fundamental legal obligation to act in the best interests of the fund pursuant to a duty
of undivided loyalty and utmost good faith
Limits on Leverage
The inherent nature of a fund—a professionally managed pool of securities owned pro rata by its
investors—is straightforward and easily understood by investors The Investment Company Act
fosters simplicity by prohibiting complex capital structures and limiting funds’ use of leverage
The Investment Company Act imposes various requirements on the capital structure of mutual
funds, closed-end funds, and ETFs, including limitations on the issuance of “senior securities” and
borrowing These limitations greatly minimize the possibility that a fund’s liabilities will exceed the
value of its assets
Generally speaking, a senior security is any debt that takes priority over the fund’s shares, such
as a loan or preferred stock The SEC has historically interpreted the definition of senior security
broadly, taking the view that selling securities short, purchasing securities on margin, and investing
in many types of derivative instruments, among other practices, may create senior securities
The SEC also takes the view that the Investment Company Act prohibits a fund from creating a
future obligation to pay unless it “covers” the obligation A fund generally can cover an obligation
by owning the instrument underlying that obligation For example, a fund that wants to take a short
position in a certain stock can comply with the Investment Company Act by owning an equivalent
long position in that stock The fund can also cover by earmarking or segregating liquid securities
equal in value to the fund’s potential exposure from the leveraged transaction The assets set aside
to cover the potential future obligation must be liquid, unencumbered, and marked-to-market daily
They may not be used to cover other obligations and, if disposed of, must be replaced

208 APPENDIX A
The Investment Company Act also limits borrowing With the exception of certain privately
arranged loans and temporary loans, any promissory note or other indebtedness would generally
be considered a prohibited senior security 11 Mutual funds and ETFs are permitted to borrow from
a bank if, immediately after the bank borrowing, the fund’s total net assets are at least three
times total aggregate borrowings In other words, the fund must have at least 300 percent asset
coverage
Closed-end funds have a slightly different set of limitations They are permitted to issue debt and
preferred stock, subject to certain conditions, including asset coverage requirements of
300 percent for debt and 200 percent for preferred stock
Many funds voluntarily go beyond the prohibitions in the Investment Company Act, adopting
policies that further restrict their ability to issue senior securities or borrow Funds often,
for example, adopt a policy stating that they will borrow only as a temporary measure for
extraordinary or emergency purposes and not to finance investment in securities In addition,
they may disclose that, in any event, borrowings will be limited to a small percentage of fund
assets (such as 5 percent) These are meaningful voluntary measures, because under the
Investment Company Act, a fund’s policies on borrowing money and issuing senior securities
cannot be changed without the approval of fund shareholders
Custody
To protect fund assets, the Investment Company Act requires all funds to maintain strict
custody of fund assets, separate from the assets of the adviser Although the Act permits other
arrangements,12 nearly all funds use a bank custodian for domestic securities Foreign securities
are required to be held in the custody of a foreign bank or securities depository
A fund’s custody agreement with a bank is typically far more elaborate than the arrangements
used for other bank clients The custodian’s services generally include safekeeping and accounting
for the fund’s assets, settling securities transactions, receiving dividends and interest, providing
foreign exchange services, paying fund expenses, reporting failed trades, reporting cash
transactions, monitoring corporate actions at portfolio companies, and tracing loaned securities
11 Temporary loans cannot exceed 5 percent of the fund’s total net assets and must be repaid within 60 days.12 The Investment Company Act contains six separate custody rules for the different types of possible custody arrangements for mutual
funds, closed-end funds, and ETFs. UITs are subject to a separate rule that requires the use of a bank to maintain custody.

209HOW U.S.-REGISTERED INVESTMENT COMPANIES OPERATE AND THE CORE PRINCIPLES UNDERLYING THEIR REGULATION
The strict rules on the custody and reconciliation of fund assets are designed to prevent the types
of theft and other fraud-based losses that have occurred in less-regulated investment products 13
Shareholders are further insulated from these types of losses by a provision in the Investment
Company Act that requires all mutual funds to have fidelity bonds designed to protect them against
possible instances of employee larceny or embezzlement
Prohibitions on Transactions with Affiliates
The Investment Company Act contains a number of strong and detailed prohibitions on transactions
between the fund and fund insiders or affiliated organizations (such as the corporate parent of
the fund’s adviser) Many of these prohibitions were part of the original statutory text of the
Act, enacted in 1940 in response to instances of overreaching and self-dealing by fund insiders
during the 1920s in the purchase and sale of portfolio securities, loans by funds, and investments
in related funds The SEC’s Division of Investment Management has said that “for more than
50 years, [the affiliated transaction prohibitions] have played a vital role in protecting the interests
of shareholders and in preserving the industry’s reputation for integrity; they continue to be among
the most important of the Act’s many protections ”14
Although there are a number of affiliated transaction prohibitions in the Investment Company Act,
three are particularly noteworthy:
» Generally prohibiting direct transactions between a fund and an affiliate
» Generally prohibiting joint transactions, where the fund and affiliate are acting together
vis-à-vis a third party
» Preventing investment banks from placing or “dumping” unmarketable securities with
an affiliated fund by generally prohibiting the fund from buying securities in an offering
syndicated by an affiliated investment bank
13 Ponzi schemes and other frauds involving the misappropriation of assets in unregistered pools or private accounts have comprised a significant portion of SEC enforcement cases in recent years.
14 See Protecting Investors: A Half Century of Investment Company Regulation, Report of the Division of Investment Management, Securities and Exchange Commission (May 1992), available at http://www.sec.gov/divisions/investment/guidance/icreg50-92.pdf. The Division of Investment Management is the division within the SEC responsible for the regulation of funds.

210 APPENDIX A
Diversification
Both tax law and the Investment Company Act provide diversification standards for funds As
discussed in detail above, under the tax laws, all mutual funds, closed-end funds, and ETFs, as well
as most UITs, qualify as RICs and, as such, must meet a tax diversification test every quarter The
effect of this test is that a fund with a modest cash position and no government securities would
hold securities from at least 12 different issuers Another tax diversification restriction limits the
amount of an issuer’s outstanding voting securities that a fund may own
The securities laws set higher standards for funds that elect to be diversified If a fund elects to
be diversified, the Investment Company Act requires that, with respect to at least 75 percent of
the portfolio, no more than 5 percent may be invested in the securities of any one issuer and no
investment may represent more than 10 percent of the outstanding voting securities of any issuer
Diversification is not mandatory, but all mutual funds, closed-end funds, and ETFs must disclose
whether they are diversified under the Act’s standards or not
In practice, most funds that elect to be diversified are much more highly diversified than they need
to be to meet these two tests As of December 2010, for example, the median number of stocks
held by U S equity funds was 101 15
15 This number is the median (the midpoint of a range of numbers that are arranged in order of value) among U.S. actively managed and index equity funds, excluding sector funds.

211SIGNIFICANT EVENTS IN FUND HISTORY
Appendix B
Significant Events in Fund History
1774 Dutch merchant and broker Adriaan van Ketwich invites subscriptions from investors
to form a trust, the Eendragt Maakt Magt, with the aim of providing investment
diversification opportunities to investors of limited means
1868 The Foreign and Colonial Government Trust, the precursor to the U S investment fund
model, is formed in London This trust provides “the investor of moderate means the
same advantages as large capitalists ”
1924 The first mutual funds are established in Boston
1933 The Securities Act of 1933 regulates the registration and offering of new securities,
including mutual fund and closed-end fund shares, to the public
1934 The Securities Exchange Act of 1934 authorizes the Securities and Exchange Commission
(SEC) to provide for fair and equitable securities markets
1936 The Revenue Act of 1936 establishes the tax treatment of mutual funds and their
shareholders Closed-end funds were covered by the Act in 1942
1940 The Investment Company Act of 1940 is signed into law, setting the structure and
regulatory framework for registered investment companies The forerunner to the
National Association of Investment Companies (NAIC) is formed The NAIC will become
the Investment Company Institute
1944 The NAIC begins collecting investment company industry statistics
1951 The total number of mutual funds surpasses 100, and the number of shareholder
accounts exceeds one million for the first time
1954 Households’ net purchases of fund shares exceed those of corporate stock NAIC
initiates a nationwide public information program emphasizing the role of investors
in the U S economy and explaining the concept of investment companies

212 APPENDIX B
1955 The first U S -based international mutual fund is introduced
1961 The first tax-free unit investment trust is offered The NAIC changes its name to the
Investment Company Institute (ICI) and welcomes fund advisers and underwriters as
members
1962 The Self-Employed Individuals Tax Retirement Act creates savings opportunities
(Keogh plans) for self-employed individuals
1971 Money market funds are introduced
1974 The Employee Retirement Income Security Act (ERISA) creates the individual retirement
account (IRA) for workers not covered by employer-sponsored retirement plans
1976 The Tax Reform Act of 1976 permits the creation of municipal bond funds The first retail
index fund is offered
1978 The Revenue Act of 1978 creates new Section 401(k) retirement plans and simplified
employee pensions (SEPs)
1981 The Economic Recovery Tax Act establishes “universal” IRAs for all workers IRS
proposes regulations for Section 401(k)
1986 The Tax Reform Act of 1986 reduces IRA deductibility
1987 ICI welcomes closed-end funds as members
1989 Mutual fund assets top $1 trillion
1993 The first exchange-traded fund (ETF) shares are issued
1996 Enactment of the National Securities Markets Improvement Act of 1996 (NSMIA)
provides a more rational system of state and federal regulation, giving the SEC exclusive
jurisdiction for registering and regulating mutual funds, exchange listed securities, and
larger advisers States retain their antifraud authority and responsibility for regulating
nonexchange listed offerings and smaller advisers The Small Business Job Protection
Act creates SIMPLE plans for employees of small businesses
1997 The Taxpayer Relief Act of 1997 creates the Roth IRA and eliminates restrictions on
portfolio management that disadvantage fund shareholders
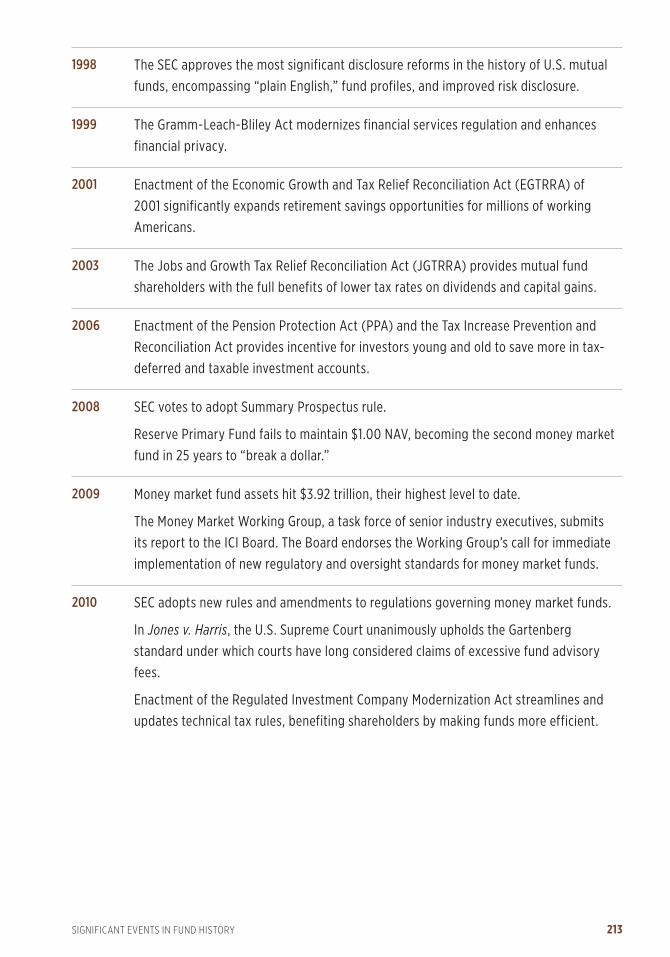
213SIGNIFICANT EVENTS IN FUND HISTORY
1998 The SEC approves the most significant disclosure reforms in the history of U S mutual
funds, encompassing “plain English,” fund profiles, and improved risk disclosure
1999 The Gramm-Leach-Bliley Act modernizes financial services regulation and enhances
financial privacy
2001 Enactment of the Economic Growth and Tax Relief Reconciliation Act (EGTRRA) of
2001 significantly expands retirement savings opportunities for millions of working
Americans
2003 The Jobs and Growth Tax Relief Reconciliation Act (JGTRRA) provides mutual fund
shareholders with the full benefits of lower tax rates on dividends and capital gains
2006 Enactment of the Pension Protection Act (PPA) and the Tax Increase Prevention and
Reconciliation Act provides incentive for investors young and old to save more in tax-
deferred and taxable investment accounts
2008 SEC votes to adopt Summary Prospectus rule
Reserve Primary Fund fails to maintain $1 00 NAV, becoming the second money market
fund in 25 years to “break a dollar ”
2009 Money market fund assets hit $3 92 trillion, their highest level to date
The Money Market Working Group, a task force of senior industry executives, submits
its report to the ICI Board The Board endorses the Working Group’s call for immediate
implementation of new regulatory and oversight standards for money market funds
2010 SEC adopts new rules and amendments to regulations governing money market funds
In Jones v. Harris, the U S Supreme Court unanimously upholds the Gartenberg
standard under which courts have long considered claims of excessive fund advisory
fees
Enactment of the Regulated Investment Company Modernization Act streamlines and
updates technical tax rules, benefiting shareholders by making funds more efficient

214 GLOSSARY
Glossary
adviser. An organization employed by a mutual fund to give professional advice on the fund’s investments and asset management practices Also known as investment adviser
after-tax return. The total return of a fund after the effects of taxes on distributions and/or redemptions have been assessed Funds are required by federal securities law to calculate after-tax returns using standardized formulas based upon the highest tax rates (Consequently, they are not representative of the after-tax returns of most mutual fund shareholders ) These standardized after-tax returns are not relevant for shareholders in tax-deferred retirement accounts
annual report. A report that a fund sends to its shareholders that discusses the fund’s performance over the past fiscal year and identifies the securities in the fund’s portfolio on the last business day of the fund’s fiscal year The annual report includes audited financial statements See also semiannual report
appreciation. An increase in an investment’s value Contrast depreciation
assets. Securities, cash, and receivables owned by a fund
auction market preferred stock (AMPS). A type of preferred share AMPS are structured to pay dividends at rates set through auctions run by an independent auction agent
authorized participant. An entity, usually an institutional investor, that submits orders to the exchange-traded fund (ETF) for the creation and redemption of ETF “creation units ”
automatic reinvestment. A fund service giving shareholders the option to purchase additional shares using dividend and capital gains distributions
average portfolio maturity. The average maturity of all the securities in a bond or money market fund’s portfolio
back-end load. See contingent deferred sales load (CDSL)
basis point. One one-hundredth of 1 percent (0 01 percent); thus, 100 basis points equal 1 percent When applied to $1 00, 1 basis point is $0 0001; 100 basis points equal one cent ($0 01)
bear market. A period during which the majority of securities prices in a particular market (such as the stock market) drop substantially One generally accepted measure is a price decline of 20 percent or more over at least a two-month period Contrast bull market
bond. A debt security issued by a company, municipality, or government agency A bond investor lends money to the issuer and, in exchange, the issuer promises to repay the loan amount on a specified maturity date; the issuer usually pays the bondholder periodic interest payments over the life of the loan

215GLOSSARY
break the dollar. A phrase used to describe when the net asset value (NAV) of a money market fund is repriced from its stable $1 00 NAV, an event that could be triggered by a deviation greater than one-half of 1 percent (one-half cent, or $0 0050) between the fund’s mark-to-market value (shadow price) and its stable $1 00 NAV Also known as break the buck
breakpoints. The dollar amounts at which many mutual funds offer reduced fees to investors
There are two kinds of breakpoints One kind is a reduction in sales charges (load fees) to
investors when they initially purchase fund shares The amount of the discount varies, depending
upon the amount of the investment: the more invested, the greater the likelihood of surpassing
a “breakpoint” and thus receiving a discount The other kind of breakpoint is a reduction in
management fees that fund advisers may charge their associated funds as fund assets surpass
a given level
broker-dealer. A firm that buys and sells mutual fund shares and other securities from and to investors, operating as either a broker or dealer depending on the transaction
bull market. A period during which a majority of securities prices in a particular market (such as the stock market) rise substantially Contrast bear market
capital gains distributions. Profits distributed to shareholders resulting from the sale of securities held in the fund’s portfolio
catch-up contribution. Individuals aged 50 or older are permitted to make contributions to an IRA or employer-sponsored retirement savings plan in excess of the annual contribution limit In 2010, the catch-up limit was $1,000 for IRAs, $2,500 for SIMPLE plans, and $5,500 for 401(k) plans
certificate of deposit (CD). A savings certificate entitling the bearer to receive interest A CD bears a fixed maturity date, has a specified fixed interest rate, and can be issued in any denomination CDs are generally issued by commercial banks and are currently insured by the Federal Deposit Insurance Corporation (FDIC) up to a maximum of $250,000 CDs are generally offered at terms ranging from one month to five years
closed-end fund. A type of investment company that issues a fixed number of shares that trade intraday on stock exchanges at market-determined prices Investors in a closed-end fund buy or sell shares through a broker, just as they would trade the shares of any publicly traded company
commercial paper. Short-term, unsecured notes issued by a corporation to meet immediate short-term needs for cash, such as the financing of accounts payable, inventories, and short-term liabilities Maturities typically range from overnight to 270 days Commercial paper is usually issued by corporations with high credit ratings and sold at a discount from face value
commission. A fee paid to a broker or other sales agent for services related to transactions in securities
compounding. The effect of growth on reinvestment of future earnings Over time, compounding can produce significant growth in the value of an investment
contingent deferred sales load (CDSL). A fee imposed by some funds when shares are redeemed (sold back to the fund) during the first few years of ownership Also known as back-end load.

216 GLOSSARY
Coverdell Education Savings Account (ESA). This type of account, formerly known as an education IRA, is a tax-advantaged trust or custodial account set up to pay the qualified education expenses of a designated beneficiary
creation unit. A specified number of shares issued by an exchange-traded fund (ETF) in large blocks, generally between 25,000 and 200,000 shares Authorized participants that buy creation units either keep the ETF shares that make up the creation unit or sell all or part of them on a stock exchange
credit risk. The possibility that a bond issuer may not be able to pay interest or repay its debt
credit spread. The additional yield required of a debt security beyond that of a risk-free alternative (such as a U S Treasury instrument of the same maturity)
custodian. An organization, usually a bank, that safeguards the securities and other assets of a mutual fund
default. A failure by an issuer to: (1) pay principal or interest when due, (2) meet nonpayment obligations, such as reporting requirements, or (3) comply with certain covenants in the document authorizing the issuance of a bond (an indenture)
defined benefit (DB) plan. An employer-sponsored pension plan where the amount of future benefits an employee will receive from the plan is defined, typically by a formula based on salary history and years of service The amount of contributions the employer is required to make will depend on the investment returns experienced by the plan and the benefits promised Contrast defined contribution plan
defined contribution (DC) plan. An employer-sponsored retirement plan, such as a 401(k) plan or a 403(b) plan, in which contributions are made to individual participant accounts Depending on the type of DC plan, contributions may be made by the employee, the employer, or both The employee’s benefits at retirement or termination of employment are based on the employee and employer contributions and earnings and losses on those contributions See also 401(k) plan Contrast defined benefit plan
depreciation. A decline in an investment’s value Contrast appreciation
distribution. (1) The payment of dividends and capital gains, or (2) a term used to describe a method of selling fund shares to the public
diversification. The practice of investing broadly across a number of different securities, industries, or asset classes to reduce risk Diversification is a key benefit of investing in mutual funds and other investment companies that have diversified portfolios
dollar-cost averaging. The practice of investing a fixed amount of money at regular intervals, regardless of whether the securities markets are declining or rising, in the hopes of reducing average share cost by acquiring more shares when prices are low and fewer shares when prices are high
education IRA. See Coverdell Education Savings Account (ESA)
equity fund. See stock fund

217GLOSSARY
exchange privilege. A fund option enabling shareholders to transfer their investments from one fund to another within the same fund family as their needs or objectives change Typically, fund companies allow exchanges several times a year for a low fee or no fee
exchange-traded fund (ETF). An investment company, typically a mutual fund or unit investment trust, whose shares are traded intraday on stock exchanges at market-determined prices Investors may buy or sell ETF shares through a broker just as they would the shares of any publicly traded company
ex-dividend date. With regard to mutual funds, this is the day on which declared distributions (dividends or capital gains) are deducted from the fund’s assets before it calculates its net asset value (NAV) The NAV per share will drop by the amount of the distribution per share
expense ratio. A fund’s total expenses—disclosed in the prospectus and shareholder reports—expressed as a percentage of its assets
face value. The stated principal or redemption value of a bond; the amount that a bond’s issuer must repay at the bond’s maturity date
fair value. The price for a security which the fund might reasonably expect to receive upon its current sale
family of funds. A group or “complex” of mutual funds, each typically with its own investment objective, managed and distributed by the same company
federal funds. Non-interest-bearing deposits held by member banks at the Federal Reserve
Financial Industry Regulatory Authority (FINRA). A self-regulatory organization with authority over broker-dealer firms that distribute mutual fund shares as well as other securities
529 Plan. An investment program, offered by state governments, designed to help pay future qualified higher education expenses States offer two types of 529 plans: prepaid tuition programs allow contributors to establish an account in the name of a student to cover the cost of a specified number of academic periods or course units in the future at current prices; and college savings plans allow individuals to contribute to an investment account to pay for a student’s qualified higher education expenses
forward pricing. The concept describing the price at which mutual fund shareholders buy or redeem fund shares Shareholders must receive the next computed share price following the fund’s receipt of a shareholder transaction order
457 plan. An employer-sponsored retirement plan that enables employees of state and local governments and other tax-exempt employers to make tax-deferred contributions from their salaries to the plan
401(k) plan. An employer-sponsored retirement plan that enables employees to make tax-deferred contributions from their salaries to the plan See also defined contribution plan
403(b) plan. An employer-sponsored retirement plan that enables employees of universities, public schools, and nonprofit organizations to make tax-deferred contributions from their salaries to the plan

218 GLOSSARY
front-end load. A fee imposed by some funds at the point of purchase
funds of funds. Mutual funds that primarily hold and invest in shares of other mutual funds
fund supermarket. A brokerage platform that provides access to funds from a wide range of fund families
health savings account (HSA). A plan that allows workers with high-deductible health insurance coverage to set aside money each year for routine or future health care costs
hedge fund. A private investment pool for qualified (typically wealthy) investors that, unlike a mutual fund, is exempt from SEC registration
hybrid fund. A mutual fund that invests in a mix of equity and fixed-income securities
income distributions. Dividends, interest, and/or short-term capital gains paid to a mutual fund’s shareholders Operating expenses are deducted from income before it is distributed to shareholders
independent director. A fund director or trustee who does not have any significant business relationship with a mutual fund’s adviser or underwriter An independent director better enables the fund board to provide an independent check on the fund’s management
index mutual fund. A fund designed to track the performance of a market index The fund’s portfolio of securities is either a replicate or a representative sample of the designated market index
individual retirement account (IRA). A tax-deferred account set up by or for an individual to hold and invest funds for retirement
inflation risk. The risk that the purchasing power of the future value of assets or income will be lower due to inflation
initial public offering (IPO). A corporation’s or closed-end fund’s first offering of stock or fund shares to the public
institutional investor. The businesses, nonprofit organizations, and other similar investors who own funds and other securities on behalf of their organizations This classification of investors differs from individual or household investors who own the majority of investment company assets
interest rate risk. Risk of gain or loss on a security due to possible changes in interest-rate levels When interest rates rise, the market value of a debt security will fall, and vice versa
intraday indicative value (IIV). A real-time estimate of an exchange-traded fund’s (ETF) intraday value Third-party providers calculate and disseminate this measure every 15 to 60 seconds during securities market trading hours
investment adviser. See adviser
investment company. A corporation, trust, or partnership that invests pooled shareholder dollars in securities appropriate to the organization’s objective Mutual funds, closed-end funds, unit investment trusts, and exchange-traded funds are the main types of SEC-registered investment companies
219GLOSSARY
investment objective. The goal (e g , current income, long-term capital growth) that a mutual fund pursues on behalf of its investors
issuer. The company, municipality, or government agency that issues securities, such as stocks, bonds, or money market instruments
Keogh. A tax-favored investment vehicle covering self-employed individuals, partners, and owners of unincorporated businesses; also called an H R 10 plan These were first made available by Congress in 1962, but today operate under rules very similar to those for retirement plans for a corporation’s employees
lifecycle fund. See target date fund
lifestyle fund. Mutual funds that maintain a predetermined risk level and generally use words such as “conservative,” “moderate,” or “aggressive” in their names to indicate the fund’s risk level Also known as target risk fund
liquidity. The ability to gain ready access to invested money Mutual funds are liquid because their shares can be redeemed for the next computed net asset value on any business day In the money market, a security is said to be liquid if the spread between bid and ask prices is narrow and reasonably sized trades can take place at those quotes
load. See sales charge
load fund. A mutual fund that imposes a sales charge—either when fund shares are purchased (front-end load) or redeemed (contingent deferred sales load)—or a fund that charges a 12b-1 fee greater than 0 25 percent
long-term funds. A mutual fund industry designation for all funds other than money market funds Long-term funds are broadly divided into equity (stock), bond, and hybrid funds
management fee. The amount paid by a mutual fund to the investment adviser for its services
market value. The price at which a security was last traded or a market maker or dealer is currently offering to trade and could presumably be purchased or sold
maturity. The date by which an issuer promises to repay a bond’s face value
money market. The global financial market for short-term borrowing and lending where short-term instruments such as Treasury bills, commercial paper, and repurchase agreements are bought and sold
money market fund. A mutual fund that invests in short-term, high-grade fixed-income securities, and seeks the highest level of income consistent with preservation of capital (i e , maintaining a stable share price)
MuniFund Term Preferred (MTP) shares. Exchange-listed closed-end fund preferred shares that have a fixed dividend rate set at the time of issuance MTP shares have a mandatory redemption period (usually five years) unless they are redeemed or repurchased earlier by the fund Unlike fixed-rate preferred stock previously issued, MTP shares were created for issuance by closed-end funds investing in municipal bonds

220 GLOSSARY
mutual fund. An investment company that buys a portfolio of securities selected by a professional investment adviser to meet a specified financial goal (investment objective) Mutual funds can have actively managed portfolios, where a professional investment adviser creates a unique mix of investments to meet a particular investment objective, or passively managed portfolios, in which the adviser seeks to track the performance of a selected benchmark or index One hallmark of mutual funds is that they issue “redeemable securities,” meaning that the fund stands ready to buy back its shares at their current net asset value See also open-end investment company
net asset value (NAV). The per-share value of an investment company, calculated by subtracting the fund’s liabilities from the current market value of its assets and dividing by the number of shares outstanding Mutual funds calculate their NAVs at least once daily
net new cash flow. The dollar value of new sales minus redemptions, plus net exchanges A positive number indicates new sales plus exchanges into funds exceeded redemptions plus exchanges out of funds A negative number indicates redemptions plus exchanges out of funds exceeded new sales plus exchanges into funds
no-load fund. A mutual fund whose shares are sold without a sales commission and without a 12b-1 fee of more than 0 25 percent per year
open-end investment company. The legal name for a mutual fund, indicating that it stands ready to redeem (buy back) its shares from investors
operating expenses. Business costs paid from a fund’s assets These include management fees, 12b-1 fees, and other expenses
payroll deduction plan. An arrangement that some employers offer employees where employees can authorize their employer to deduct a specified amount from their salaries at stated times to buy mutual fund shares
pooled investing. The basic concept behind mutual funds in which a fund aggregates the assets of investors who share common financial goals A fund uses the pool assets to buy a diversified portfolio of investments, and each mutual fund share purchased represents ownership in all the fund’s underlying securities
portfolio. A collection of securities owned by an individual or an institution (such as a mutual fund) that may include stocks, bonds, money market instruments, and other securities
portfolio manager. A specialist employed by a mutual fund’s adviser to invest the fund’s assets in accordance with predetermined investment objectives
portfolio turnover. A measure of the trading activity in a fund’s investment portfolio; how often securities are bought and sold by a fund
prepayment risk. The possibility that a bond owner will receive his or her principal investment back from the issuer prior to the bond’s maturity date
principal. See face value
prospectus. The official document that describes an investment company to prospective investors The prospectus contains information required by the SEC, such as investment objectives and policies, risks, services, and fees

221GLOSSARY
puttable preferred stock. See Variable Rate Demand Preferred (VRDP) shares
quality. A term used in portfolio management to describe the creditworthiness of an issuer of fixed-income securities and indicate the likelihood that the issuer will be able to repay its debt
redeem. To sell mutual fund shares back to the fund Mutual fund shares may be redeemed on any business day An investor receives the next computed share price, called net asset value (NAV), minus any deferred sales charge or redemption fee
redemption price. The amount per share that mutual fund shareholders receive when they redeem
reinvestment privilege. An option whereby shareholders may elect to use dividend and capital gains distributions to automatically buy additional fund shares
repurchase agreements. A form of short-term funding for dealers The dealer sells the securities to investors, usually on an overnight basis, and buys them back at a higher price reflecting the cost of funding
required minimum distribution (RMD). Minimum distribution rules require that beginning at age 70½, the entire amount of a traditional IRA be distributed over the expected life of the individual (or the joint lives of the individual and designated beneficiary) Distributing less than the required amount will result in a tax penalty Roth IRAs are not subject to required minimum distributions during the account holder’s lifetime
risk/return tradeoff. The principle that an investment must offer higher potential returns as compensation for the likelihood of higher volatility in returns
rollover. The transfer of an investor’s assets from one qualified retirement plan (including an IRA) to another—due to changing jobs, for instance—without a tax penalty
Roth IRA. An individual retirement plan, first available in 1998, that permits only after-tax contributions; earnings are not taxed, and qualified distributions of earnings and principal are generally tax-free
sales charge. An amount charged for the sale of some fund shares, usually those sold by brokers or other sales professionals By regulation, mutual fund sales charges are capped The charge may vary depending on the amount invested and the fund chosen Also known as the load
SAR-SEP IRA (salary reduction simplified employee pension). A SEP IRA with a salary reduction feature (see SEP IRA) The Small Business Job Protection Act of 1996, which created SIMPLE IRAs, prohibited the formation of new SAR-SEP IRAs, which were created in 1986
secondary market. Market in which an investor purchases or sells certain investment company shares (closed-end, UIT, and ETF) from another investor through an intermediary such as a broker-dealer
Securities and Exchange Commission. See U.S. Securities and Exchange Commission (SEC)
securitization. The process of aggregating similar instruments, such as loans or mortgages, into a negotiable security, such as the creation of mortgage-backed securities

222 GLOSSARY
semiannual report. A report a fund sends to its shareholders that discusses the fund’s performance over the first six months of the fiscal year and identifies the securities in the fund’s portfolio on the last business day of the first six months of the fiscal year See also annual report
SEP IRA (simplified employee pension plan). A retirement program created in 1978 that consists of individual retirement accounts for all eligible employees, to which the employer can contribute according to certain rules A fairly simple, inexpensive plan to establish and administer, a SEP can be attractive to small businesses and self-employed individuals
series fund. A group of different mutual funds, each with its own investment objective and policies, that is structured as a single corporation or business trust
share classes. Some mutual funds offer investors different types of shares known as classes Each class will invest in the same portfolio of securities and will have the same investment objectives and policies, but each class will have different shareholder services and/or distribution arrangements with different fees and expenses and, therefore, different performance results A multiclass structure offers investors the ability to select a fee and expense structure that is most appropriate for their investment goals (including the time that they expect to remain invested in the fund)
shareholder. An investor who owns shares of a mutual fund or other company
short-term fund. See money market fund
SIMPLE IRA (savings incentive match plan for employees). A simplified tax-favored retirement plan created in 1996 that small employers can set up for the benefit of their employees
Standard & Poor’s 500 index (S&P 500). A daily measure of stock market performance based on 500 U S stocks chosen for market size, liquidity, and industry group representation
statement of additional information (SAI). The supplementary document to a prospectus that contains more detailed information about a fund; also known as “Part B” of the prospectus
stock. A share of ownership or equity in a corporation
stock fund. A fund that concentrates its investments in stocks
summary prospectus. A short-form prospectus that mutual funds and exchange-traded funds (ETFs) may use with investors if the fund meets certain requirements, including making the long-form prospectus and additional information available online or in paper upon request See also prospectus
target date fund. Hybrid funds that follow a predetermined reallocation of risk over a working career and into retirement for a person expecting to retire at the target date of the fund (which is usually included in the fund’s name) These funds invest in a mix of asset classes and typically rebalance their portfolios over time to become more conservative and income-producing Also known as lifecycle fund
target risk fund. See lifestyle fund
total net assets. The total amount of assets, less any liabilities, a fund holds as of a certain date

223GLOSSARY
total return. A measure of a fund’s performance that encompasses all elements of return: dividends, capital gains distributions, and changes in net asset value Total return is the change in value of an investment over a given period, assuming reinvestment of any dividends and capital gains distributions, expressed as a percentage of the initial investment
traditional IRA. The first type of individual retirement account, created in 1974 Individuals may make tax-deductible or nondeductible (depending on income and other requirements) contributions to these accounts See also individual retirement account (IRA)
transfer agent. The internal or external organization that a mutual fund uses to prepare and maintain records relating to shareholder accounts
Treasury bill (T-bill). A short-term debt obligation of the U S government with a maturity of less than one year T-bills are sold in denominations of $1,000 up to a maximum purchase of $5 million and commonly have maturities of one month (four weeks), three months (13 weeks), or six months (26 weeks)
12b-1 fee. A mutual fund fee, named for the SEC rule that permits it, used to pay distribution costs, such as compensation to financial advisers for initial and ongoing assistance If a fund has a 12b-1 fee, it will be disclosed in the fee table of a fund’s prospectus
underwriter. The organization that sells a mutual fund’s shares to broker-dealers and investors
unit investment trust (UIT). A type of fund with some characteristics of mutual funds and some of closed-end funds Like mutual funds, UITs issue redeemable shares Like closed-end funds, however, UITs typically issue only a specific, fixed number of shares A UIT does not actively trade its investment portfolio, instead buying and holding a set of particular investments until a set termination date, at which time the trust is dissolved and proceeds are paid to shareholders
U.S. Securities and Exchange Commission (SEC). The primary U S government agency responsible for the regulation of the day-to-day operations and disclosure obligations of registered investment companies
variable annuity. An investment contract sold by an insurance company; capital is accumulated, often through mutual fund investments, with the option to convert to an income stream in retirement
Variable Rate Demand Preferred (VRDP) shares. A type of puttable preferred stock that is similar to auction market preferred stock (AMPS) in that they pay dividends at variable rates, and sell orders are filled to the extent there are bids Rates are set through remarketings, and if there are more sell orders than bids, a third party (commonly referred to as a liquidity provider) purchases the VRDP shares
withdrawal plan. A fund service allowing shareholders to receive income or principal payments from their fund account at regular intervals
yield. A measure of income (dividends and interest) earned by the securities in a fund’s portfolio less the fund’s expenses during a specified period A fund’s yield is expressed as a percentage of the maximum offering price per share on a specified date

224 INDEX
Index
A page number with an f indicates a figure; an n indicates a note; a t indicates a table. Page numbers in bold indicate a definition.
12b-1 fees, 72–75, 73f, 75f, 223401(k) plans, 217
account balances, 108, 108f
asset allocation, 104–7, 105f, 106f
assets, 101f, 103–4, 104f
front-end load discounts for, 74
household financial assets in, 9
loans outstanding, 108
mutual fund assets, 9, 11f, 118, 118f, 119, 119f
mutual fund purchases through, 85, 85f, 86, 86f
no-load fund investments, 75
participant demographics, 105–6, 105f
portfolio turnover, 110
services and expenses, 109–11, 111f
target date funds in, 106–7, 107f, 120, 121f
403(b) plans, 217assets, 101f, 103–4, 104f, 118, 118f
mutual fund assets, 11f, 119, 119f
mutual fund purchases through, 85, 85f, 86, 86f
457 plans, 217assets, 101f, 103–4, 104f, 118
mutual fund assets, 11f, 118f, 119, 119f
mutual fund purchases through, 85, 85f, 86, 86f
529 plans, 96f, 120, 122–23, 122f, 123f, 217
Aactively managed ETFs, 40, 42, 48, 140t, 141t, 142t
actively managed mutual funds, 67, 67f
administrators, 193f, 194, 195
advertising and promotion, 73, 73f
advisers, 194–95, 207, 214. See also financial advisers
aggressive growth funds, 68–69, 68f
aging investors, 27, 27f, 30, 82, 83f
AMPS (auction market preferred stock), 57–60, 59f, 214annuities, 100, 101f, 115, 115f. See also fixed annuities; variable annuities
appreciation, 214arbitrage opportunities, 44
assets, 214auction market preferred stock (AMPS), 57–60, 59f, 214auditors, 195, 206
authorized participants, 214automatic reinvestment, 214average portfolio maturity, 214
Bback-end load, 214back-end load funds, 74, 76f, 77f
balanced mutual funds, 105–6, 105f
bank and thrift assets, 34, 35f, 112, 112f, 115, 115f
bank notes, 170t, 171t
basis points, 214bear market, 214bear market effects, 14, 27, 27f, 30, 72, 89f, 90f
boards of directors, 193f, 193n1, 194, 205–6
bond and income funds, 130t, 132t
bond closed-end funds, 52f, 55, 55f, 56, 56f, 57, 57f, 138t, 139t
bond ETFs, 46, 46f, 47f, 140t, 141t, 142t
bond funds
401(k) asset allocation, 105–6, 105f
capital gains paid and reinvested, 159t
closed-end fund shareholder ownership of, 60, 60f
demand for, 22, 29–30, 29f
dividends paid and reinvested, 158t, 199f, 201
ETF shareholder ownership of, 50, 50f
exchange redemptions, 154t
exchange sales, 152t
expense ratios, 64–65, 64f, 65f, 68, 68f
individual accounts, 184t
institutional accounts, 96f, 184t, 185t
international assets, with, 8
investor age and risk tolerance, 30
IRA investments in, 115f
liquidity, 144t, 145t
net flows correlation to bond returns, 29–30, 29f
net new cash flow, 15f, 24, 29–30, 29f, 146t, 149t, 150t, 180t, 181t
new sales, 151t
number of funds, 132t, 133t, 180t
number of share classes, 134t, 135t, 180t
number of shareholder accounts, 136t, 137t
portfolio holdings and share of total net assets, 157t
redemptions, 153t, 155t
retirement assets, 119, 119f, 180t
tax-exempt, 201
total net assets, 130t, 131t, 180t, 184t
total portfolio, common stock and other securities: purchases, sales, and net purchases, 163t
variable annuity, 182t, 183t

225INDEX
bond funds of funds, 172t, 173t
bond index funds, 32, 32f, 33f, 174t, 175t, 176t, 177t
bonds, 214directly held, 8, 10f, 13, 50, 50f, 60, 60f, 115, 115f
returns on, 24
borrowing, 108, 207–8
breakpoints, 215break the dollar, 215brokerage firms
discount, 66, 73, 75, 86, 86f
full-service, 66, 86, 86f
as fund intermediaries, 13f
IRA assets at, 112, 112f
broker-dealers, 58, 195, 215Build America Bonds program, 30
bull market, 215business corporation assets, 185t, 186t
Ccapital appreciation equity funds
exchange redemptions, 154t
exchange sales, 152t
liquidity, 145t
net new cash flow, 150t
new sales, 151t
number of funds, 133t
number of share classes, 135t
number of shareholder accounts, 137t
redemptions, 153t
total net assets, 131t
capital gains distributions, 8, 159t, 198, 200f, 215catch-up contributions, 215CDSL (contingent deferred sales load), 74, 215certificates of deposit (CDs), 115f, 170t, 171t, 215CFTC (Commodity Futures Trading Commission), 41
Class A, B, or C shares. See share classes
closed-end funds, 215auction market preferred stock (AMPS), 57–60, 59f
bond funds, 52f, 55, 55f, 56, 56f, 57, 57f, 138t, 139t
common shares, 57, 58f
definition and overview, 53, 192
disclosure and transparency, 202n3
domestic bond, 56, 56f
domestic equity, 55f, 56, 56f, 138t, 139t
equity funds, 55, 55f, 56, 56f, 57f, 138t, 139t
investments by, 54
investor characteristics, 60–61, 60f, 61f
issuance, 8, 54, 56, 56f, 138t
leveraging by, 54, 57, 208
market segments, 55f
number of funds, 16, 16f, 56, 57f, 139t
preferred shares, 57–60, 58f
pricing, 54, 203
taxable bond, 55f, 59, 138t, 139t
tax-exempt, 55f, 56, 59, 60
total net assets, 9f, 54–56, 55f, 58f, 138t
commercial paper, 12, 12f, 170t, 171t, 215commission, 215commodity ETFs, 41, 46, 46f, 47f, 48, 49f, 140t, 141t, 142t
Commodity Futures Trading Commission (CFTC), 41
common stock
as portfolio holdings, 156t, 157t
purchases, sales, and net purchases of, 160t, 161t, 162t, 163t
compliance programs, 206
compounding, 215contingent deferred sales load (CDSL), 74, 215corporate bonds, 12f, 13, 24, 29–30, 156t, 157t
corporate bond funds
exchange redemptions, 154t
exchange sales, 152t
liquidity, 145t
net new cash flow, 150t
new sales, 151t
number of funds, 133t
number of share classes, 135t
number of shareholder accounts, 137t
redemptions, 153t
total net assets, 131t
corporate notes, 170t, 171t
cost basis, 201
Coverdell Education Savings Accounts (ESAs), 120–23, 123f, 216creation units, 42, 43f, 216credit risk, 216credit spread, 216custodians, 193f, 208–9, 216
Ddefault, 216defined benefit (DB) plans, 101f, 102, 102f, 216defined contribution (DC) plans, 216. See also 401(k) plans; 403(b) plans; 457 plans
assets, 101f, 102–4, 104f
closed-end fund shareholder ownership of, 61f
distributions from, 108–9, 109f
ETF shareholder ownership of, 50, 51f
household ownership of, 9, 102–3, 102f, 103f, 118f
Internet access with household ownership of, 92–94, 92f, 93f, 94f
lifestyle funds in, 120, 121f
mutual fund assets, 9, 11f, 84, 85, 118, 118f, 119, 119f
mutual fund purchases through, 85, 85f, 86, 86f
overview, 103–4
target date funds in, 120, 121f
demographics of 401(k) plan participants, 105–6, 105f
age and investment risk, 27, 27f, 30
of closed-end fund investors, 60–61, 60f, 61f
of education savings plan owners, 123f
of ETF-owning households, 50, 50f, 51f
Internet usage by shareholders, 92–94, 92f, 93f, 94f
of IRA investors, 115, 115f
of mutual fund shareholders, 80, 81f, 82–84, 83f, 84f, 92f
of retirement plan owners, 102–3, 103f
savings goals of mutual fund investors, 84, 84f

226 INDEX
depreciation, 216disclosure, 202–3
discount brokers, 66, 73, 75, 86, 86f
distributions, 216dividend/capital gains, 8, 158t, 159t, 169t, 198–200, 199f, 200f
from retirement plans, 109, 109f, 116–17, 116f, 117f
distributors, 195
diversification, 210, 216dividends paid and reinvested, 8, 158t, 169t, 198, 199f, 201
dollar-cost averaging, 216domestic bond closed-end funds, 56, 56f
domestic equity closed-end funds, 55f, 56, 56f, 138t, 139t
domestic equity ETFs, 46, 46f, 47f, 140t, 141t, 142t
domestic equity index funds, 32, 32f, 33f, 174t, 175t, 176t, 177t
domestic equity funds, 22, 23f, 26, 72, 72f, 119, 119f
domestic municipal bond closed-end funds, 55f, 138t, 139t
domestic taxable bond closed-end funds, 55f, 138t, 139t
EEBRI (Employee Benefit Research Institute), 105
economic recovery, 24
EDGAR (Electronic Data Gathering, Analysis, and Retrieval) system, 202, 203
education IRAs, 216Coverdell Education Savings Accounts, 120–23, 123f
Section 529 plans, 96f, 120–23, 122f, 123f
effective load, 65
emerging markets, 24, 27
emerging markets ETFs, 46, 47f
Employee Benefit Research Institute (EBRI), 105
Employee Retirement Income Security Act (ERISA), 112
employer-sponsored retirement plans. See also 401(k) plans; 403(b) plans; 457 plans; defined contribution plans
assets, 100–102
household ownership of, 102, 102f, 103f
Keoghs, 86f, 103–4, 104f, 112f, 118f, 119f
load discounts or waivers for, 65, 74
mutual fund assets, 85, 85f, 118, 118f, 119, 119f
mutual fund purchases through, 85, 85f, 86, 86f
mutual fund share classes and, 74–75
no-load fund investments, 75
employment, investment industry, 17–19, 17f, 18f, 19f
equities. See stock
equity closed-end funds, 55, 55f, 56, 56f, 57f, 138t, 139t
equity ETFs, 46, 46f, 47f, 49f, 140t, 141t, 142t
equity funds, 216. See also stock (equity) funds
equity funds of funds, 172t, 173t
equity index funds
demand for, 32, 32f, 33, 33f
expenses and net new cash flow, 67, 67f
new sales and exchange sales, 176t
number of funds and share classes, 175t
redemptions and exchange redemptions, 177t
total net assets and net new cash flow, 174t
ERISA (Employee Retirement Income Security Act), 112
Eurodollar CDs, 170t, 171t
European economic recovery, 24
exchange privilege, 217exchange-traded funds (ETFs), 217
actively managed, 40, 42, 48, 140t, 141t, 142t
arbitrage opportunities, 44
assets under management, 45
authorized participants, 42, 43f, 44
broad-based equity, 46, 46f, 140t, 141t, 142t
commodity-based, 41, 46, 46f, 47f, 48, 49f, 140t, 141t, 142t
creation of, 42, 43f, 46, 47f
definition and overview, 40, 192
demand for, 45–49
domestic equity, 46, 46f, 47f, 140t, 141t, 142t
emerging market, 46, 47f
funds of funds structure, 48, 140t, 141t, 142t
global/international equity, 46, 46f, 47f, 140t, 141t, 142t
as hedging vehicle, 45
hybrid, 46, 46f, 47f, 140t, 141t, 142t
index-based, 40, 42, 140t, 141t, 142t
institutional investor usage, 11, 42
investment objectives, 42, 46
IRA investments in, 115f
legal structure of, 41, 41f
liquidations of, 46, 47f
mutual funds compared with, 43
net issuance, 45, 45f, 46, 46f, 142t
nonregistered, 41, 41f, 48, 140t, 141t, 142t
number of funds, 16, 16f, 40, 41f, 46, 47f, 141t
overview, 39
pricing, 43, 44, 203, 204n7
prospectuses, 202
redemption baskets, 42, 44
registered, 41, 41f, 43, 140t, 141t, 142t
regulation of, 205, 207–8, 210
sector, 46, 46f, 48, 49f, 140t, 141t, 142t
shareholder characteristics, 50, 50f, 51f
sponsors, 42, 48
total net assets, 8, 9f, 38f, 40–41, 41f, 46, 47f, 140t
trading, 42, 43, 43f, 44
transparency, 40, 44, 202
ex-dividend date, 217expense ratio, 217. See also mutual fund fees and expenses; specific classification, such as hybrid funds
Fface value, 217fair value, 217family of funds, 217federal funds, 217federal funds rate, 24
federal government employee retirement plans, 101f, 102
Federal Reserve, 24, 30
financial advisers
asset-based fees, 66
distribution structure and, 73–77, 73f, 75f, 76f
as intermediaries, 13–16, 13f, 72
as sources for fund ownership, 86, 86f, 87, 87f

227INDEX
Financial Industry Regulatory Authority (FINRA), 205, 206, 217financial institution assets, 95, 96f, 185t, 186t
fixed annuities, 50, 50f, 60, 60f, 115f
fixed-income funds. See bond funds
fixed-income securities, 30
forward pricing, 204, 217front-end load, 218front-end load funds, 65, 65f, 73–77, 76f, 77f
full-service brokerage firms, 66, 86, 86f
funds of funds, 30–31, 31f, 172t, 173t, 218ETF funds of funds, 48, 140t, 141t, 142t
fund sponsors, 14–15, 14f, 15f, 22–24, 194
fund supermarkets, 66, 75, 218
GGICs (guaranteed investment contracts), 105–6, 105f
global/international bond closed-end funds, 55f, 56, 56f, 138t, 139t
global/international equity closed-end funds, 55f, 56, 56f, 138t, 139t
global/international equity ETFs, 46, 46f, 47f, 140t, 141t, 142t
global/international equity index funds, 32, 32f, 33f, 174t, 175t, 176t, 177t
global/international equity funds, 23f, 27, 68, 68f, 119, 119f
government agency security holdings, 12f, 13, 170t, 171t
government bond funds
exchange redemptions, 154t
exchange sales, 152t
liquidity, 145t
net new cash flow, 150t
new sales, 151t
number of funds, 133t
number of share classes, 135t
number of shareholder accounts, 137t
redemptions, 153t
total net assets, 131t
government bonds as portfolio holdings, 156t, 157t
government employee retirement plans, 101f, 102
government money market funds, 13, 36, 36f, 164t, 165t, 166t, 167t, 170t
growth and income funds, 68f
growth funds, 68, 68f
guaranteed investment contracts (GICs), 105–6, 105f
Hhedge funds, 218Herfindahl-Hirschman Index, 22–23
high-yield bond funds
exchange redemptions, 154t
exchange sales, 152t
liquidity, 145t
net new cash flow, 150t
new sales, 151t
number of funds, 133t
number of share classes, 135t
number of shareholder accounts, 137t
redemptions, 153t
total net assets, 131t
household financial assets. See also demographics; mutual fund shareholders
asset location, 85–88, 85f, 86f
by asset type, 9f
bonds directly held, 8–9
capital gains distributions, 200f
closed-end funds, 9f, 60–61, 60f, 61f
dividend distributions, 198, 199f
ETFs, 9f, 50, 50f, 51f
first purchases, 81f, 85, 85f
index funds, 32
Internet access and, 92–94, 92f, 93f, 94f
investment company investments, 8–9, 10f
investments, 66, 75, 78f, 80, 80f, 96f
investor savings goals, 84, 85
money market funds, 96f, 118, 118f
municipal bond holdings, 13
net investments in funds, bonds, and stock, 10f
purchase sources, 86f, 87
in retirement accounts, 9, 11f, 102–3, 102f, 103f, 118, 118f, 119f
risk tolerance and, 27, 27f, 30, 89–91, 89f, 90f, 91f
stocks directly held, 8–9, 10f, 50, 50f, 60, 60f, 115, 115f
taxable accounts, 9
unit investment trusts, 9f
HSAs (health savings accounts), 218hybrid ETFs, 46, 46f, 47f, 140t, 141t, 142t
hybrid funds, 218
capital gains paid and reinvested, 159t
closed-end fund shareholder ownership of, 60, 60f
demand for, 8, 22, 30
dividends paid and reinvested, 158t
ETF shareholder ownership of, 50, 50f
exchange redemptions, 154t
exchange sales, 152t
expense ratios, 64f, 66, 66f, 67f, 68f
household ownership of, 96f
individual accounts, 184t
institutional accounts, 96f, 184t, 185t
IRA investments in, 115f
lifestyle (target risk), 31, 120, 121f, 178t, 179t
liquidity, 144t, 145t
net new cash flow, 15f, 30, 67f, 146t, 148t, 150t, 180t, 181t
new sales, 151t
number of funds, 132t, 133t, 180t
number of share classes, 134t, 135t, 180t
number of shareholder accounts, 136t, 137t
portfolio holdings and share of total net assets, 157t
redemptions, 153t, 155t
retirement assets, 119, 119f
retirement mutual funds, 180t
total net assets, 130t, 131t, 180t, 184t
total portfolio, common stock and other securities: purchases, sales, and net purchases, 162t
variable annuity, 182t, 183t
hybrid funds of funds, 31, 172t, 173t
hybrid index funds, 32f, 33f, 174t, 175t, 176t, 177t

228 INDEX
Iincome distributions, 218independent directors, 194, 206, 218independent fund advisers, 13f
independent public accountants, 193f
index ETFs, 40, 42, 140t, 141t, 142t
index funds, 218demand for, 32–33, 32f, 33f
domestic equity, 32, 32f, 33f, 174t, 175t, 176t, 177t
net new cash flow, 174t
new sales and exchange sales, 176t
number of funds, 175t
number of share classes, 175t
redemptions and exchange redemptions, 177t
S&P 500, 33, 33f, 70–71, 70f, 71f, 174t, 175t, 176t, 177t
total net assets, 174t
individual investors, 95, 184t, 186t. See also household financial assets
individual retirement accounts (IRAs), 218assets, 100–102, 101f, 112–13, 112f, 115, 115f
closed-end fund shareholder ownership of, 61f
contributions to, 113
DC plan distributions as rollovers, 109, 109f
distributions from, 116–17, 116f, 117f
ETF shareholder ownership of, 51f
household ownership of, 9, 102–3, 102f, 103f, 113 –115, 113f
investor demographics, 84, 84f, 115
in lifestyle funds, 120, 121f
in money market funds, 84
mutual fund assets, 9, 11f, 85, 85f, 112, 112f, 118, 118f, 119, 119f, 120, 121f
mutual fund market share, 112, 112f
overview, 112
rollovers, 114, 114f
Roth IRAs, 102f, 112–13, 113f
SAR-SEP IRA, 85f, 86f, 102f, 113, 113f
SEP IRA, 85f, 86f, 113, 113f
SIMPLE IRA, 85f, 86f, 102f, 113, 113f
in target date funds, 120, 121f
individual stock. See stock: directly held
inflation risk, 218initial public offering (IPO), 218institutional investors, 218
ETF investments by, 11, 45
long-term mutual fund assets, 95, 96f
mutual fund expense ratio and account balances, 69
net new cash flow, no-load funds, 76f
nonfinancial business assets, 37, 37f, 95, 96f
total net assets, 184t, 185t, 186t
total net assets, no-load funds, 77f
institutional money market funds
demand for, 24, 36–37, 36f, 37f
government, 166t, 167t
net new cash flow, 34f, 36, 36f, 167t
non-government, 166t, 167t
ownership, 95, 96f
institutional money market funds (continued)
tax-exempt, 166t, 167t
total net assets, 36f, 166t, 184t, 185t, 186t
U.S. business short-term assets, 37f
insurance agents or companies, 13f, 86, 86f, 95
interest rate risk, 218interest rates, 29, 30, 34, 35f
intermediaries, 13, 13f, 72, 73, 73f
international bond funds. See global/international bond closed-end funds
international equity funds. See global/international equity entries
Internet usage by mutual fund shareholders, 92–94, 92f, 93f, 94f
Intraday Indicative Value (IIV), 44, 218investment advisers, 193f, 195, 207, 218. See also financial advisers
Investment Advisers Act of 1940, 191
investment club assets, 95
investment companies, 218. See also closed-end funds; exchange-traded funds; mutual fund entries; regulation of investment companies; unit investment trusts
employment, 17–19, 17f, 18f, 19f
history, 211–13
household investments in, 8–9, 10f
industry statistics, 231f
investor reliance on, 8–11
municipal bond holdings, 13
new cash flow, 14, 15f
number of, 13–16, 16f
number of fund sponsors, 14–15, 14f, 15f
pooled investing origins, 190–91
roles, 12–13
total market securities held, 12–13, 12f
total net assets by type, 8, 9f
types of, 13–16, 13f, 16f, 192
U.S. corporate equity share, 6f, 12f
Investment Company Act of 1940
ETF regulation under, 40, 41, 41f
mutual fund operations, 191, 194
regulatory requirements, 204, 206, 207–8, 209, 210
Rule 12b-1 adoption, 73
investment objectives, 219investment risk, 27, 27f, 30
IPO (initial public offering), 218IRAs. See individual retirement accounts
issuers, 219
KKeoghs, 86f, 103–4, 104f, 112f, 118f, 119f, 219
Llarge-cap equity portfolios, 46, 47f, 69, 70
level-load funds, 74, 76f, 77f
leveraging, 54, 57, 207–8
lifecycle funds. See target date funds
life insurance company IRA assets, 112, 112f
lifestyle (target risk) funds, 31, 120, 121f, 178t, 179t, 219liquid assets as portfolio holdings, 156t, 157t

229INDEX
liquidity, 144t, 145t, 219load (sales charge), 64–66, 74, 219load funds, 65, 65f, 70, 70f, 71f, 73–76, 75f, 76f, 77f, 219local government employee retirement plans, 101f, 102
long-term mutual funds, 219. See also bond funds; hybrid funds; index funds; mutual fund entries; stock (equity) funds
demand for, 26–33
fund size and account balance, 69, 69f
household ownership of, 84, 96f
IRA assets in, 115, 115f, 118, 118f
net new cash flow, 8, 24, 26, 76, 76f
retirement assets in, 84, 118, 118f
total net assets, 77f
long-term U.S. government bonds, 156t, 157t
Mmanagement fees, 219market value, 219maturity, 219mid-cap equity portfolios, 47f, 69
money market, 219money market funds, 219. See also institutional money market funds
401(k) asset allocation, 105–6, 105f
asset composition of, 170t, 171t
closed-end fund shareholder ownership of, 60, 60f
demand for, 22, 34–37, 34f, 35f, 36f, 37f
dividends paid and reinvested, 169t, 199f
ETF shareholder ownership of, 50, 50f
expense ratios, 68, 68f
government, 13, 36, 36f, 164t, 165t, 166t, 167t, 170t
household ownership of, 96f
household savings goals and, 84
individual accounts, 184t
investor shift to bond funds from, 29
liquidity requirements, 205n10
net new cash flow, 24, 34, 34f, 35f, 167t, 168t, 180t, 181t
nonfinancial business holdings, 11
non-government, 36, 36f, 164t, 165t, 166t, 167t, 171t
number of funds, 132t, 133t, 165t, 180t
number of share classes, 134t, 135t, 165t, 180t
number of shareholder accounts, 136t, 137t, 164t
retail, 34–35, 34f, 35f, 166t, 167t
retirement assets, 84, 115f, 118, 118f, 119, 119f, 180t
taxable, 164t, 165t, 166t, 167t
tax-exempt, 164t, 165t, 166t, 167t
total net assets, 8, 130t, 131t, 164t, 166t, 180t, 184t
variable annuity, 182t, 183t
yields, 34, 35f
Morgan Stanley Capital International (MSCI) world indexes, 26n2, 27
Morningstar, 203
MTP (MuniFund Term Preferred) shares, 59, 219municipal bond, 12f, 13, 30, 156t, 157t
municipal bond closed-end funds, 55f, 56, 59, 60
municipal bond funds, 68f, 201. See also national municipal bond funds; state municipal bond funds
MuniFund Term Preferred (MTP) shares, 59, 219mutual fund, 220mutual fund characteristics
creation of, 194
custody, 208–9
definition and overview, 192
disclosure and transparency, 202–3
diversification, 210
ETFs compared with, 43
history, 190–91, 211–13
legislation governing, 191
leverage limits, 207–8
liquidity requirements, 205
net asset value, 43, 192, 204
organizational structure, 192–95
oversight and accountability, 205–7
pricing, 43, 192, 203–5
prohibited transactions, 209
share classes, 74–75
tax features, 196–201
trading, 43, 201
valuation and liquidity, 203–5
mutual fund companies, 86, 86f, 87, 88f, 89, 89f
mutual fund complexes, 13, 13f, 15f, 22–24, 23f
mutual fund data. See also bond funds; exchange-traded funds; hybrid funds; money market funds; retirement mutual funds; stock (equity) funds
assets, 8, 69
assets at larger complexes, 22–24
capital gains paid and reinvested, 8, 159t, 198, 200f
closed-end fund shareholder ownership of mutual funds, 60, 60f
commercial paper holdings, 12, 12f
corporate bond holdings, 12f, 13
dividends paid and reinvested, 8, 158t, 198, 199f
education savings plan investments, 120–23, 123f
exchange redemptions, 129t, 154t
exchange sales, 129t, 152t
fund size and account balance, 69f
funds leaving or entering industry, 15f
household taxable accounts, 9
individual accounts, 184t
institutional accounts, 166t, 184t, 185t, 186t
liquidated funds, 15, 15f
liquidity, 144t, 145t
merged funds, 15, 15f
net new cash flow, 15f, 24, 25f, 26, 146t, 150t
new funds, 15, 15f
new sales, 8, 129t, 151t
no-load share classes, 76f, 77f
number of funds, 16, 16f, 128t, 132t, 133t
number of funds leaving or entering industry, 15
number of share classes, 128t, 134t, 135t, 165t, 180t
number of shareholder accounts, 66, 128t, 136t, 137t
number of sponsors, 15
portfolio holdings and share of total net assets, 156t, 157t
redemptions, 129t, 153t, 155t

230 INDEX
mutual fund data (continued)
tax-exempt funds, 13, 201
total net assets, 9f, 77f, 128t, 130f, 131t, 184t
total portfolio, common stock and other securities: purchases, sales, and net purchases, 160t
total sales, 129t
U.S. corporate equity holdings, 6f, 12f
U.S. municipal security holdings, 12f, 13
U.S. Treasury and government agency security holdings, 12f, 13
mutual fund fees and expenses
12b-1 fees, 72–75, 73f, 75f
in 401(k) plans, 109–11, 111f
distribution structure changes, 73–77
downward trend of, 62, 64–67, 64f, 65f, 66f, 67f
expense ratios, 64, 64f, 66–67, 66f
expense ratios and fund size, 69–72, 72f
expense ratios by investment objective, 68–69, 68f
factors influencing, 68–72
fund size and account balances, 69, 69f
overview, 63
share classes, 74–75
of S&P 500 index funds, 70–71, 70f, 71f
trends, 64–66
mutual fund retirement accounts. See retirement mutual funds
mutual fund shareholders. See also demographics; specific classification, such as bond funds
asset location, 85–88, 85f, 86f
average age of account, 88, 88f
average tenure with fund companies, 88, 88f
financial adviser contact, 87–88, 87f
first fund purchases, 81f, 85, 85f
institutional owners, 95–96, 96f
lower cost demands by, 66–67, 66f, 76, 76f
median fund investment, 80
overview, 79, 81f
purchase sources, 87, 87f
risk tolerance, 27, 27f, 30, 89–91, 89f, 90f, 91f
savings goals of, 84–85
shareholder sentiment, 89–91, 89f, 90f, 91f
voting rights, 194
mutual fund supermarkets, 66, 75, 218mutual funds worldwide, 22, 23f, 26f, 187t, 188t, 189t
mutual fund trends
bond funds, 22, 29–30, 29f
equity funds, 20f, 22, 26–27
fees and expenses, 64–66
funds of funds, 31, 31f
hybrid funds, 8, 22, 30
index funds, 32–33, 32f, 33f
money market funds, 22, 34–37, 34f, 35f, 36f, 37f
net flows, 24, 25f, 26f
overview, 21
U.S. assets, 22–24
NNASDAQ Composite Index, 26
national municipal bond funds
exchange redemptions, 154t
exchange sales, 152t
liquidity, 145t
net new cash flow, 150t
new sales, 151t
number of funds, 133t
number of share classes, 135t
number of shareholder accounts, 137t
redemptions, 153t
total net assets, 131t
net asset value (NAV), 43, 192, 204, 220net new cash flow, 220. See also specific classification, such as bond funds
no-load funds, 66, 70–71, 72, 74, 75, 75f, 76, 76f, 77f, 220nonfinancial business assets, 11, 37, 37f, 95, 96f
non-government money market funds, 36, 36f, 164t, 165t, 166t, 167t, 171t
nonprofit organization assets, 95, 96f, 185t, 186t
non-U.S. fund advisers, 13f
number of funds. See mutual fund data; specific classification, such as hybrid funds
Oopen-end investment companies, 192, 220. See also mutual fund entries
operating expenses, 220organization of mutual funds, 192–95, 193f
Ppayroll deduction plans, 220Pension Protection Act (PPA), 120
pooled investing, 190–91, 220portfolio, 220portfolio manager, 220portfolio turnover, 28, 28f, 220preferred stock, 57–60, 156t, 157t
prepayment risk, 220principal, 220principal underwriters, 193f, 195
profit sharing plans, 104f
prospectus, 202, 220puttable preferred stock, 59–60, 221
Qquality, 221
Rreal estate investments, 50, 50f, 60, 60f
rebalancing, 31
redeem, 221redemption price, 221registered investment companies. See investment companies
registration statements, 202
regulated investment companies (RICs), 196, 198, 210

231INDEX
regulation of investment companies
custody, 208–9
daily valuation and liquidity, 203–5
diversification, 210
leverage limits, 207–8
oversight and accountability, 205–7
prohibited transactions, 209
transparency, 202–3
reinvestment privilege, 221repurchase agreements, 170t, 171t, 221required minimum distributions (RMDs), 116, 221research publications, xii–xiv
retail investors, 69, 71, 76, 77
retail money market funds, 34–35, 34f, 35f, 166t, 167t
retirement mutual funds. See also 401(k) plans; defined contribution (DC) plans; individual retirement accounts; specific classification, such as bond funds
assets, 9, 11f, 84, 112–13, 112f, 118, 118f, 119, 119f
household accounts, 9, 11f, 102–3, 102f, 103f, 118, 118f, 119f
IRA investments, by type, 115, 115f
IRA market share, 112, 112f
lifestyle funds, 120, 121f
market share, 118
money market funds, 84, 115f, 118, 118f, 119, 119f, 180t
net new cash flow, 180t, 181t
number of funds, 180t
number of share classes, 180t
retirement assets, 119, 119f
target date funds, 120, 121f
total net assets, 180t
retirement plans. See defined benefit plans; defined contribution plans; employer-sponsored retirement plans; individual retirement accounts
RICs (regulated investment companies), 196, 198, 210
risk management, 31
risk/return tradeoff, 221risk tolerance, 27, 27f, 30, 89–90, 89f, 90f, 91f
RMDs (required minimum distributions), 116, 221rollover, 221Roth IRAs, 102f, 113, 113f, 221
SSAI (statement of additional information), 202, 222sales charges (load), 64–66, 74, 221Sarbanes-Oxley Act, 207
SAR-SEP IRA (salary reduction simplified employee pension plan), 85f, 86f, 102f, 113, 113f, 221secondary market, 221Section 529 plans, 96f, 120–23, 122f, 123f, 217sector ETFs, 46, 46f, 48, 49f, 140t, 141t, 142t
sector funds, 68, 68f
Securities Act of 1933, 41, 191, 194
Securities and Exchange Commission (SEC), 40–41, 73, 194, 198, 221. See also regulation of investment companies
Securities Exchange Act of 1934, 191, 195
securitization, 221semiannual reports, 222
senior securities, 207
SEP IRA (simplified employee pension plan), 85f, 86f, 102f, 113, 113f, 222series funds, 222share classes, 74–75, 128t, 134t, 135t, 165t, 180t, 222shareholder accounts, 66, 128t, 136t, 137t, 164t
shareholders, 193f, 194, 201, 222. See also mutual fund shareholders
shareholder sentiment, 89–91, 89f, 90f, 91f
shareholder services, 73, 73f
short-term funds, 222SIMPLE IRA (savings incentive match plan for employees), 85f, 86f, 102f, 112–13, 113f, 222simplified employee pension plan (SAR-SEP IRA), 85f, 86f, 102f, 113, 113f, 221small-cap equity portfolios, 47f, 69
Social Security benefits, 100, 100f
S&P 500 index, 33, 33f, 89–90, 89f, 90f, 222S&P 500 index funds, 33, 33f, 70–71, 70f, 71f, 174t, 175t, 176t, 177t
sponsors, 14f, 193f, 194
stable value funds, 105–6, 105f
Standard & Poor’s 500 index, 33, 33f, 89–90, 89f, 90f, 222state government employee retirement plans, 101f, 102
statement of additional information (SAI), 202, 222state municipal bond funds
exchange redemptions, 154t
exchange sales, 152t
liquidity, 145t
net new cash flow, 150t
new sales, 151t
number of funds, 133t
number of share classes, 135t
number of shareholder accounts, 137t
redemptions, 153t
total net assets, 131t
stock (equities), 222401(k) asset allocation, 106, 106f
company, 105–6, 105f
directly held, 8, 10f, 50, 50f, 60, 60f, 115, 115f
held by investment companies, 12f
as portfolio holdings, 156t, 157t
price performance, 8, 24, 26, 26f, 89–90, 89f, 90f
stock bonus plans, 104f
stock (equity) funds, 222. See also capital appreciation equity funds; global/international equity entries
401(k) asset allocation, 105–6, 105f
capital gains paid and reinvested, 159t
closed-end fund shareholder ownership of, 60, 60f
closed-end proceeds from issuance by fund type, 138t
closed-end total net assets, 138t
demand for, 20f, 22, 26–27
dividends paid and reinvested, 158t
domestic, 22, 23f, 26, 72, 72f
ETF shareholder ownership of, 50, 50f
exchange redemptions, 154t
exchange sales, 152t

232 INDEX
stock (equity) funds (continued)
expense ratios, 64–65, 64f, 65f, 66–67, 66f, 67f, 68, 68f
household ownership of, 8, 96f
individual accounts, 184t
institutional accounts, 96f, 184t, 185t
international assets, with, 8
IRA assets in, 115, 115f
liquidity, 144t, 145t
net new cash flow, 15f, 26–28, 26f, 67, 67f, 146t, 147t, 150t, 180t, 181t
new sales, 151t
number of funds, 132t, 133t, 180t
number of share classes, 134t, 135t, 180t
number of shareholder accounts, 136t, 137t
portfolio holdings and share of total net assets, 157t
redemptions, 153t, 155t
retirement assets, 119, 119f
retirement mutual funds, 180t
sector funds, 68, 68f
stock price performance and net flow, 26, 26f
total net assets, 130t, 131t, 180t, 184t
total portfolio, common stock, and other securities: purchases, sales, and net purchases, 161t
turnover rate, 28, 28f
variable annuity, 182t, 183t
strategic income bond funds
exchange redemptions, 154t
exchange sales, 152t
liquidity, 145t
net new cash flow, 150t
new sales, 151t
number of funds, 133t
number of share classes, 135t
number of shareholder accounts, 137t
redemptions, 153t
total net assets, 131t
summary prospectus, 202, 222
Ttarget date (lifecycle) funds, 219, 222
in 401(k) plans, 105–7, 105f, 106–7, 107f
assets, 120, 121f
expense ratios, 67, 67f
net new cash flow, 67, 67f, 179t
overview, 31, 106–7, 107f, 120, 121f
total net assets, net new cash flow, number of funds, share classes, 178t
target risk (lifestyle) funds, 222. See also lifestyle funds
taxable bond closed-end funds, 55f, 59, 138t, 139t
taxable capital gains distributions, 198, 200f
taxable dividend distributions, 198, 199f
taxable money market funds
asset composition, 170t, 171t
dividends paid and reinvested, 169t
government, 170t
institutional investors, 166t, 186t
non-government, 171t
taxable money market funds (continued)
number of funds, 133t
number of share classes, 135t, 165t
number of shareholder accounts, 137t, 164t
total net assets, 131t, 164t, 166t, 186t
tax-deferred mutual funds, 84, 197f
tax-exempt bond closed-end funds, 55f, 56, 59, 60
tax-exempt money market funds
dividends paid and reinvested, 169t
net new cash flow, 167t
number of funds, 133t, 165t
number of share classes, 135t, 165t
number of shareholder accounts, 137t, 164t
total net assets, 131t, 164t, 166t
tax-exempt mutual funds, 13, 199f, 200f, 201
tax features of mutual funds, 196–201
Thrift Savings Plan, 101f, 102
total net assets, 222. See also mutual fund data; specific classification, such as closed-end funds
total return, 223total return equity funds
exchange redemptions, 154t
exchange sales, 152t
liquidity, 145t
net new cash flow, 150t
new sales, 151t
number of funds, 133t
number of share classes, 135t
number of shareholder accounts, 137t
redemptions, 153t
total net assets, 131t
traditional IRAs, 223. See also individual retirement accounts
transfer agents, 193f, 195, 223transparency, 202–3
Treasury bill (T-bill), 223Treasury securities, 12f, 13, 24, 170t, 171t
turnover rate, 28, 28f, 110
Uunderwriters, 73, 73f, 195, 223unit investment trusts (UITs), 8, 9f, 16, 16f, 143t, 192, 202n3, 223U.S. government agency issues, 12f, 13, 170t, 171t
U.S. government bond funds. See government bond funds
U.S. government bonds as portfolio holdings, 156t, 157t
U.S. government money market funds. See government money market funds
U.S. mutual fund assets. See mutual fund data
U.S. retirement system, 100–103, 101f
U.S. savings bonds, 115f
U.S. Securities and Exchange Commission (SEC), 40–41, 73, 194, 198, 223U.S. Treasury securities, 12f, 13, 24, 170t, 171t
Vvariable annuities, 50, 50f, 60, 60f, 76, 76f, 77f, 96f, 115f, 118f, 223variable annuity funds, 182t, 183t
Variable Rate Demand Preferred (VRDP) shares, 59, 60, 223

233INDEX
WWilshire 5000 Total Market Index, 24
withdrawal plans, 223world bond funds
exchange redemptions, 154t
exchange sales, 152t
liquidity, 145t
net new cash flow, 150t
new sales, 151t
number of funds, 133t
number of share classes, 135t
number of shareholder accounts, 137t
redemptions, 153t
total net assets, 131t
world equity funds
exchange redemptions, 154t
exchange sales, 152t
liquidity, 145t
net new cash flow, 150t
new sales, 151t
number of funds, 133t
number of share classes, 135t
number of shareholder accounts, 137t
redemptions, 153t
total net assets, 131t
worldwide mutual fund data, 22, 23f, 26f, 187t, 188t, 189t
Yyield, 223


1401 H Street, NW, Suite 1200 Washington, DC 20005 202/326-5800 www ici org
Copyright © 2011 by the Investment Company Institute