2011. lactate biomarker and potential therapeutic target
TRANSCRIPT
Lactate: Biomarkerand PotentialTherapeutic Target
Okorie Nduka Okorie, MDa,b,*, Phil Dellinger, MDc,d
KEYWORDS
� Lactate � Hypoperfusion � Critically ill � Biomarker
Critical illness is characterized by disruptions in homeostasis that result in single- ormultiple-organ injury and reversible or irreversible organ dysfunction. To a largeextent, the duration of exposure to injurious stimuli/conditions determines the revers-ibility or irreversibility of organ dysfunction in critical illness. Therefore, it is highlyimportant that organ system dysfunction in critically ill patients is recognized as earlyas possible and appropriate therapeutic interventions are applied to improveoutcomes in these patients. Traditionally, recognition of organ dysfunction in patientshas relied on its clinical signs and symptoms (eg, oliguria and/or elevated creatininelevels for the kidney). Historically, recognition of circulatory failure and the likelihoodof tissue hypoperfusion relied on the presence of persistent or refractory (to fluidresuscitation) hypotension. This approach is complicated by a relative lack of sensi-tivity of clinical signs and symptoms to predict the presence or absence of organ injuryor tissue hypoperfusion. In addition, some clinical examination techniques lack stan-dardization, for example, the assessment of capillary refill time (CRT) as an index ofperipheral hypoperfusion. In one study, it was noted that clinicians used severaldifferent methods to assess CRT, including either finger “pulp” or finger “nail”pressure.1 The same study showed substantial interobserver variability betweenmeasurements of CRT when a cutoff value of 2 seconds was used in patients present-ing to an emergency department (ED). The cutoff values used to define normal CRThave been variously listed, with values between 2 and 6 seconds.2,3 Few clinicalexamination measurements used at present in critically ill patients have been sub-jected to rigorous standards of validation.
a Florida State University School of Medicine, Orlando, FL, USAb Department of Critical Care Medicine, Orlando Regional Medical Center, 86 West UnderwoodStreet, Suite 102, Orlando, FL, USAc University of Medicine and Dentistry of New Jersey, Robert Wood Johnson Medical School,Camden, NJ, USAd Division of Critical Care Medicine, Cooper University Hospital, Camden, NJ, USA* Corresponding author. Department of Critical Care Medicine, Orlando Regional MedicalCenter, 86 West Underwood Street, Suite 102, Orlando, FLE-mail address: [email protected]
Crit Care Clin 27 (2011) 299–326doi:10.1016/j.ccc.2010.12.013 criticalcare.theclinics.com0749-0704/11/$ – see front matter � 2011 Elsevier Inc. All rights reserved.
Okorie & Dellinger300
It is against this background that measurements of serum lactate either singly orserially may have a role as a biomarker to estimate the likelihood and extent of tissuehypoperfusion, as well as in the judgment of treatment response and prognosis.Traditionally, the terms lactate and lactic acid are used interchangeably. Lactic acid
is a weak acid, which means that it only partially dissociates in water. Lactic aciddissociates in water resulting in ion lactate and H1. Depending on the environmentalpH, weak acids, such as lactic acid, are present as either acid in their undissociatedform at low pH or ion salt at higher pH. The pH at which 50% of the acid is dissociatedis called the pKa, which for lactic acid is 3.85. The pKa of lactic acid is much lower thanthat of cells and the extracellular fluid compartment, and thus, it exists predominantlyin the ionized state. This reaction can be illustrated by the Henderson-Hasselbalchequation:
pH 5 pKa 1 log [H1][A�]/[HA].
The ratio of lactate to lactic acid at physiologic pH (7.4) and the lowest limits of pHcompatible with life over a protracted period (6.8) can be calculated as follows:
7.4 5 3.85 1 log [(lactate)/(lactic acid)] 5 3548:1
6.8 5 3.85 1 log [(lactate)/(lactic acid)] 5 891:1
From these equations, it is clear that lactic acid in human subjects exists predom-inantly in its ionized form even in severely low pH states. Accordingly, measurementsare made of blood or plasma lactate, not lactic acid.This review discusses the role of lactate as a biomarker in diagnosing and assessing
the severity of systemic hypoperfusion, as well as the role of serum lactate measure-ments in guiding clinical care and enabling prognosis in critically ill patients.
HISTORICAL PERSPECTIVE
Lactate was first described in 1780 as a substance in sour milk by the Swedishchemist, Karl Wilhelm Scheele.4 This discovery was followed by its first descriptionin animals by another Swedish chemist, Jons Jacob Berzelius, in 1807, when hediscovered it in the muscle tissue of hunted stags.5 The Japanese chemist, TrasaburoAraki, demonstrated that in states of oxygen deprivation, no matter how, mammalsproduced and excreted lactate.6–9 The findings were replicated in experiments con-ducted by Hermann Zillessen.10 The works done by Araki and Zillessen serve as theearliest demonstrations of the relationship between tissue hypoxia and lactateproduction.The German chemist and physician, Joseph Scherer,11 in 1843, first demonstrated
the presence of lactate in human blood (post mortem) in a series of case reportsinvolving 7 young women who died of puerperal fever. In 1851, he subsequentlyreported the same finding in the tissue fluids of a patient who had died of leukemia.12
This report was followed by demonstration of elevated lactate levels in the blood ofa living patient by Carl Folwarczny in 1858.13 These observations were the basis forthe understanding of the significance of elevated lactate levels in critically ill patients.Essentially, hyperlactatemia was viewed primarily as the result of anaerobic metab-
olism due to inadequate tissue oxygen delivery.14 This understanding persisted formost of the last century, and it was only in the later half of the last century that theunderstanding of the significance of elevated serum lactate levels was modified toinclude disease states other than tissue hypoxia.15 Further work on lactate metabo-lism elucidated the role of hyperlactatemia as a product of metabolic adjustment incritical illness.16,17
Lactate: Biomarker and Potential Therapeutic Target 301
LACTATE PRODUCTION, METABOLISM, AND EXCRETION
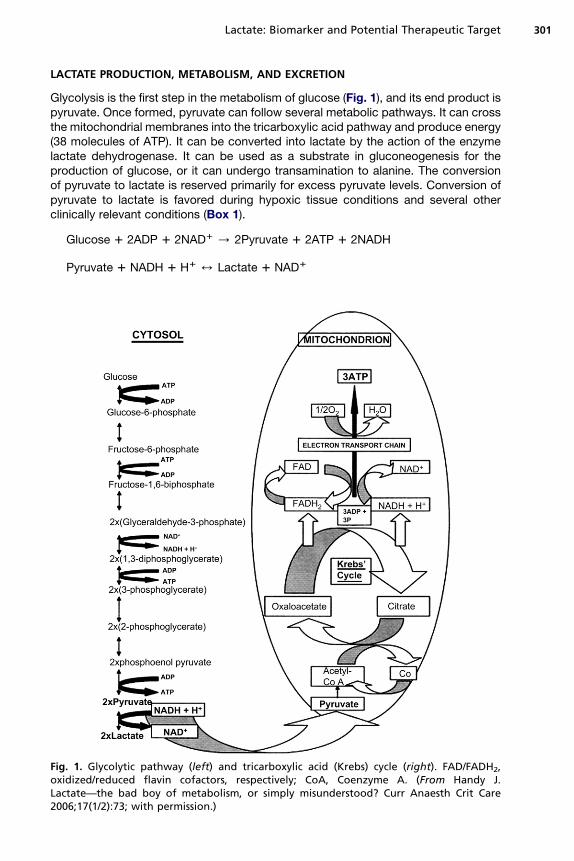
Glycolysis is the first step in the metabolism of glucose (Fig. 1), and its end product ispyruvate. Once formed, pyruvate can follow several metabolic pathways. It can crossthe mitochondrial membranes into the tricarboxylic acid pathway and produce energy(38 molecules of ATP). It can be converted into lactate by the action of the enzymelactate dehydrogenase. It can be used as a substrate in gluconeogenesis for theproduction of glucose, or it can undergo transamination to alanine. The conversionof pyruvate to lactate is reserved primarily for excess pyruvate levels. Conversion ofpyruvate to lactate is favored during hypoxic tissue conditions and several otherclinically relevant conditions (Box 1).
Glucose 1 2ADP 1 2NAD1 / 2Pyruvate 1 2ATP 1 2NADH
Pyruvate 1 NADH 1 H1 4 Lactate 1 NAD1
Fig. 1. Glycolytic pathway (left) and tricarboxylic acid (Krebs) cycle (right). FAD/FADH2,oxidized/reduced flavin cofactors, respectively; CoA, Coenzyme A. (From Handy J.Lactate—the bad boy of metabolism, or simply misunderstood? Curr Anaesth Crit Care2006;17(1/2):73; with permission.)
Box 1
Conditions favoring the conversion of pyruvate to lactate
Systemic hypoperfusion necessitating anaerobic metabolism
Regional hypoperfusion and microcirculatory dysfunction
Increased aerobic glycolysis, with pyruvate production exceeding pyruvate dehydrogenasecapacity. This condition may be seen in response to cytokine release, increased circulatingcatecholamine levels, or the accumulation of leukocytes at the site of inflammation/infection
Mitochondrial dysfunction shunting pyruvate away from the tricarboxylic acid cycle, whichmay be seen in sepsis and drug toxicity
Impaired activity of pyruvate dehydrogenase, which is essential for the conversion of pyruvateinto acetyl coenzyme A, a necessary step in aerobic metabolism. This condition may be seen inexcessive alcohol use and cofactor deficiency states (beriberi)
Okorie & Dellinger302
The serum arterial lactate concentration reflects the balance between net lactateproduction and net lactate consumption/clearance. This concentration is generallyless than 2 mmol/L. The daily production of lactate is about 1400 mmol, and althoughall tissues can produce lactate, physiologic lactate production is primarily from skeletalmuscle (25%), skin (25%), brain (20%), intestine (10%), and red blood cells (20%).18 Inpathologic conditions, significant lactate production occurs in other organs.In the critically ill, lactate is produced in tissues outside the “usual lactate
producers,” including the lungs, white blood cells, and splanchnic organs. Physiologiclactate production by the lungs is negligible leading to an arteriovenous difference inlactate levels close to zero across the lungs under physiologic conditions.19 In criticallyill patients, Weil and colleagues20 observed that venous blood samples from a pulmo-nary artery catheter yielded lactate concentrations equivalent to those in arterialblood. This finding has been replicated in subsequent works in patients with severesepsis and acute lung injury/acute respiratory distress syndrome,21–23 as well as inpatients without significant hypoxemia.24
Similarly, lactate is released in supraphysiologic amounts from the sites of infectionand inflammation and is thought to be related to the augmented glycolysis in therecruited and activated leukocytes at the sites of infection. White blood cells havea limited capacity for aerobic (mitochondrial) ATP generation. When activated, thesecells rely primarily on augmented anaerobic glycolysis to meet energy requirements,which leads to the production of large amounts of lactate unrelated to oxygen depri-vation. In experimental models, following exposure to endotoxin, significant increaseswere noted in blood lactate levels25 and were thought to be a result of augmentedleukocyte lactate production.Lactate is metabolized primarily in the liver (60%), kidneys (30%), and heart (10%).
In the liver, the periportal hepatocytes directly use lactate to produce glycogen andglucose via the Cori cycle. In patients with chronic liver disease, lactate clearancemay be diminished and this can lead to its elevated blood levels.26,27 Levraut andcolleagues28 challenged hemodynamically stable septic patients with an externallactate load and found that in patients with normal lactate clearance, normal lactatelevels were noted. However, mildly elevated levels (2–4 mEq/L) were observed inpatients with reduced lactate clearance. In otherwise healthy ambulatory patientswith severely impaired liver function, a normal lactate level is the norm. The limitedcontribution of reduced clearance to elevating lactate levels in critically ill patientswas convincingly demonstrated by Revelly and colleagues.29 They compared 7
Lactate: Biomarker and Potential Therapeutic Target 303
patients with septic shock and 7 patients with cardiogenic shock to 7 healthy controls.The subjects were given 13C-radiolabeled lactate and 2H-labeled glucose infusions,and it was noted that the increase in lactate levels resulted from overproduction oflactate and that lactate clearance was similar in all 3 groups.The renal cortex also uses lactate via the gluconeogenetic pathway to produce
glucose.30 The renal cortex is very sensitive to reduction in renal blood flow, and renallactate clearance can be impaired in critically ill patients with compromised renalblood flow, leading to elevated lactate levels. Lactate can be excreted by the kidneyif the renal threshold is exceeded (approximately 5–6 mmol/L). The serum concentra-tion of lactate is generally less than 2 mmol/L; hence, lactate is not excreted in theurine in physiologic states.From the ongoing, it is clear that elevated serum lactate levels are a product of some
combination of excess production and reduced clearance. Most of the conditionsresulting in excess production and reduced clearance of lactate are predominantlypathologic and reflect tissue hypoxia or nonhypoxic tissue injury. This finding is thebasis of the use of serum lactate as a biomarker in critically ill patients.
LACTATE AS A BIOMARKER
A biomarker has been defined as “a characteristic that is objectively measured andevaluated as an indicator of normal biologic processes, pathogenic processes, orpharmacologic responses to a therapeutic intervention.”31 The International SepsisForum Colloquium on Biomarkers of Sepsis described the roles that may be servedby any given biomarker (Box 2).32 In this review of the role of lactate as a biomarkerin critically ill patients, the authors describe the performance of serum lactate levelsin each of the roles described in Box 2.
Lactate as a Diagnostic Biomarker in Critically Ill Patients
For a biomarker to be used in the diagnosis of a clinical condition or pathophysiologicstate, the entity to be diagnosed needs to be defined with gold standard criteria orcriterion and there has to be a control group in which the condition or pathophysiologic
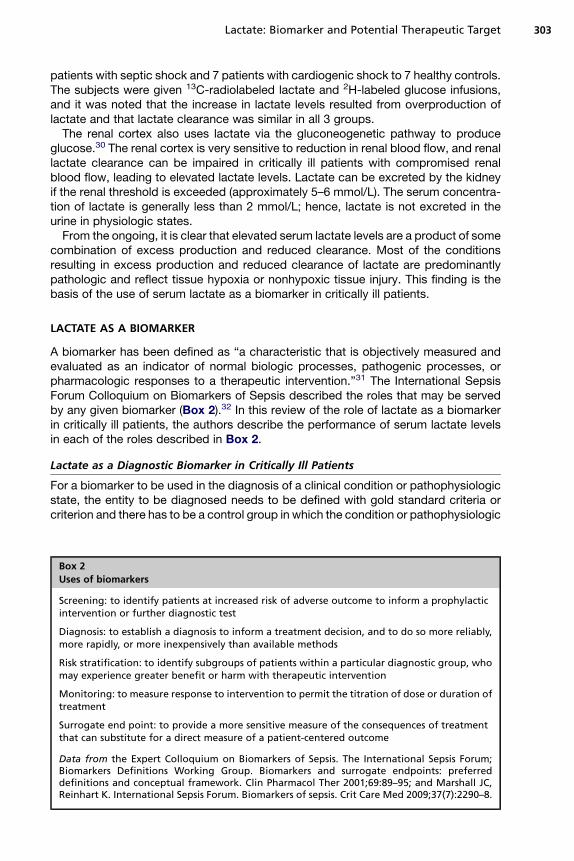
Box 2
Uses of biomarkers
Screening: to identify patients at increased risk of adverse outcome to inform a prophylacticintervention or further diagnostic test
Diagnosis: to establish a diagnosis to inform a treatment decision, and to do so more reliably,more rapidly, or more inexpensively than available methods
Risk stratification: to identify subgroups of patients within a particular diagnostic group, whomay experience greater benefit or harm with therapeutic intervention
Monitoring: to measure response to intervention to permit the titration of dose or duration oftreatment
Surrogate end point: to provide a more sensitive measure of the consequences of treatmentthat can substitute for a direct measure of a patient-centered outcome
Data from the Expert Colloquium on Biomarkers of Sepsis. The International Sepsis Forum;Biomarkers Definitions Working Group. Biomarkers and surrogate endpoints: preferreddefinitions and conceptual framework. Clin Pharmacol Ther 2001;69:89–95; and Marshall JC,Reinhart K. International Sepsis Forum. Biomarkers of sepsis. Crit Care Med 2009;37(7):2290–8.
Okorie & Dellinger304
state is absent. These conditions were infrequently met in the literature reviewed toascertain the role of lactate as a diagnostic biomarker in critically ill patients. First,the authors have established that elevated serum lactate levels may be because ofincreased anaerobic or aerobic production, as well as decreased clearance. Furthercomplicating this finding is the fact that increased production may be driven by anyof the several organs, and this possibility applies to reductions in clearance as well.Although this review acknowledges the confounding potential aerobic excessiveproduction of lactate and the contribution of reduced lactate clearance in hyperlacti-nemic patients, it focuses on the use of lactate levels as a diagnostic biomarker forsystemic oxygen imbalance.Hyperlactatemia is typically present in shock states when oxygen consumption
becomes critically dependent on oxygen delivery. In this state, accumulated pyruvatefrom anaerobic metabolism is shunted predominantly toward lactate formation. Thisshunt leads to cytoplasmic accumulation of lactate and subsequent excretion downits concentration gradient into the circulation. In this state, elevated serum lactatelevels are reflective of tissue hypoxia.Lactate levels as a measure of inadequate perfusion and tissue hypoxia has been
supported by observations in both experimental and clinical settings. In experimentsin dogs, systemic oxygen delivery was reduced by inducing hypoxia and/or anemiauntil tissue oxygen demands could no longer be met. Serial lactate levels wereobtained, and it was noted that at the point the oxygen consumption in the animalswas limited by systemic oxygen delivery, there was a sharp increase in lactatelevels.33,34 Similar results were noted in another experiment with dogs, in which hemo-dynamic conditions in early septic shock were replicated by inducing a low–cardiacoutput state and injecting endotoxin.35 Similar findings have been demonstrated inhumans. As far back as 1927, in experiments investigating the responses to exercisein healthy subjects as well as patients with circulatory failure, Meakins and Long36
reported that once oxygen delivery could not be increased to meet metabolicdemands, lactate levels increased in proportion to the severity of the circulatory failure.More recently, Ronco and colleagues37were able to replicate in humans the correlationbetween low systemic oxygen delivery and elevated lactate levels seen in animals. Crit-ically ill patients were examined after life support was discontinued. Oxygen consump-tion (determined by indirect calorimetry), oxygen delivery (calculated from the Fickequation), and concentrations of arterial plasma lactate were simultaneously deter-mined at 5- to 20-minute intervals while life support was discontinued. It was notedthat at the point oxygen consumption became dependent on oxygen delivery, furtherdecrease in systemic oxygen delivery coincided with an increase in lactate levels.Other observations supporting this correlation include the following: (1) Levy andcolleagues38 demonstrated that hemodynamically unstable patients with septic orcardiogenic shock had increased lactate to pyruvate ratio (40:1) compared withcontrols (10:1) and (2) in the study on early goal-directed therapy in the managementof patients with septic shock, elevated lactate levels in severe sepsis or septic shockbefore resuscitation coincided with a low central venous oxygen saturation (ScvO2),and increases in oxygen delivery were associated with reductions in lactate levels.39
Serum Lactate Levels as a Tool for Screening, Risk Stratification, and Prognosis
Clinical evaluation of critically ill patients is limited by the fact that established clinicalfindings associated with widespread tissue hypoperfusion may not be evident in theearly reversible stages of shock.40,41 Lactate levels may be elevated in hemodynam-ically stable patients, helping identify a state of occult shock,42 a condition associatedwith increased mortality.

Lactate: Biomarker and Potential Therapeutic Target 305
Elevated lactate levels may serve as a screening tool by identifying patients withunderlying tissue hypoperfusion before the development of clinical findings. It mayalso be used to distinguish severely ill patients from less severely ill patients. In fulfillingthese roles, lactate may serve not only as a screening and risk-stratifying biomarkerbut also as a prognostic biomarker in critically ill patients. Multiple studies havebeen conducted on the use of serum lactate levels for screening, risk stratification,and prognostication. The use of lactate measurements or any other biomarker asa screening tool must take into consideration the fact that the posttest probability ofan elevated value representing tissue hypoperfusion in a given patient depends onthe index patient’s pretest probability and likelihood ratio. Given that the patientsbeing tested have been determined by their treating clinicians to be at higher riskfor tissue hypoperfusion, elevated lactate levels in these patients are generallyaccepted to indicate tissue hypoperfusion, and most studies assess the predictivevalue of lactate levels for outcomes such as mortality. Studies on the use of lactatemeasurements for prognostic purposes can be divided into 3 distinct time phases:
1. Prehospital setting2. ED3. Intensive care unit (ICU).
Prognostic value of lactate levels checked in the prehospital settingIt is acknowledged that early identification of tissue hypoperfusion or shock followedby aggressive early resuscitation is key in improving survival in critically ill patients. Thepathophysiologic cascades that result in tissue injury do not necessarily start whenpatients arrive at the ED. Most prehospital triage systems for trauma and nontraumapatients are based mainly on clinical parameters, which, as discussed previously,leave a lot to be desired. Incorporating lactate measurements in risk stratifying thesepatients may allow the prompt initiation of life saving therapy. The first study to assessthe feasibility of lactate measurements in the prehospital setting was performed byCoats and colleagues,43 involving the prehospital capillary lactate levels in traumapatients. They observed a moderate correlation (R2 5 0.44) between lactate levelsand injury severity in patients who might otherwise be difficult to triage. This studywas followed more recently in the study by Jansen and colleagues,44 in which thevenous or capillary blood lactate concentration in 124 patients before hospital arrivalwas measured by ambulance staff using a handheld battery-powered device. It wasreported that the prehospital blood lactate level was associated with in-hospitalmortality and provided prognostic information superior to that provided by thepatient’s vital signs. In study, although higher lactate levels were noted in the patientswho died, in multivariate analysis, it was the change in serum lactate levels, betweenthe first measurement in the ambulance and the second on hospital arrival, that wasindependently associated with death. Based on this work, it can be concluded thatlactate levels of 3.5 mmol/L or higher were associated with increased mortality atboth time points compared with lactate levels less than 3.5 mmol/L (T1: 41% vs12% and T2: 47% vs 15%), and in addition, failure to clear lactate may be more signif-icant than an isolated elevated lactate value. The prognostic significance of lactateclearance over time has also been demonstrated in other studies.45,46 It is the authors’opinion that in the prehospital setting, the ability of a single lactate value to trigger theearly initiation of specific treatment algorithm makes it more clinically useful in theprehospital setting than the possible prognostic information derived from lactateclearance measurements. Other works done in the prehospital setting confirm therole of prehospital lactate measurements as a prognostic biomarker.47,48
Okorie & Dellinger306
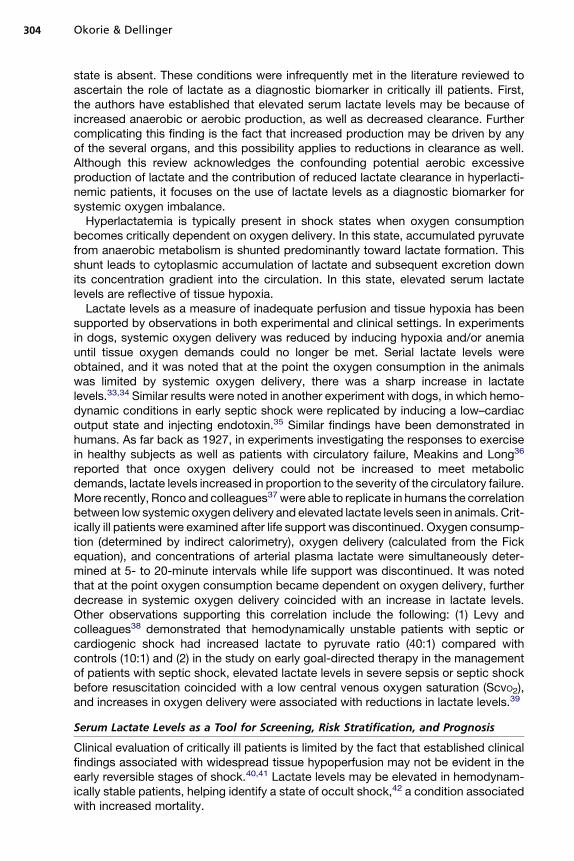
Prognostic value of lactate levels checked in the EDIn a work done by 1 of the authors of this article (P. R. D.),49 initial serum lactate levelsin more than 1100 patients, seen in the ED, the ICU, and general hospital wards ofa large teaching hospital were reviewed.Lactate levels were divided into low (0–2 mmol/L), intermediate (2.1–3.9 mmol/L),
and high (�4.0 mmol/L). A lactate level of 4 mmol/L or more was found to be highlyspecific (89%–99%) for predicting the acute phase of death and in-hospital death inall 3 groups (Fig. 2).Similar findings were noted in an ED-only population studied by Shapiro and
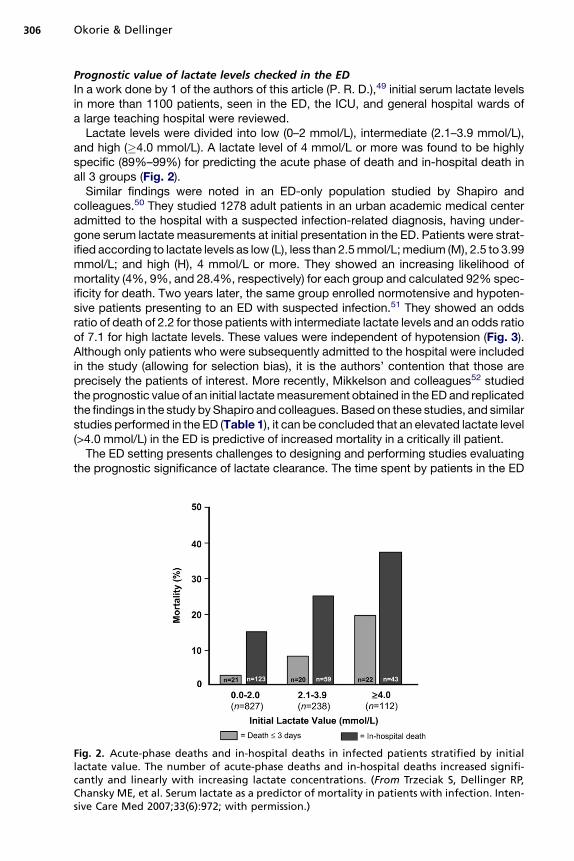
colleagues.50 They studied 1278 adult patients in an urban academic medical centeradmitted to the hospital with a suspected infection-related diagnosis, having under-gone serum lactate measurements at initial presentation in the ED. Patients were strat-ified according to lactate levels as low (L), less than 2.5mmol/L;medium (M), 2.5 to 3.99mmol/L; and high (H), 4 mmol/L or more. They showed an increasing likelihood ofmortality (4%, 9%, and 28.4%, respectively) for each group and calculated 92% spec-ificity for death. Two years later, the same group enrolled normotensive and hypoten-sive patients presenting to an ED with suspected infection.51 They showed an oddsratio of death of 2.2 for those patients with intermediate lactate levels and an odds ratioof 7.1 for high lactate levels. These values were independent of hypotension (Fig. 3).Although only patients who were subsequently admitted to the hospital were includedin the study (allowing for selection bias), it is the authors’ contention that those areprecisely the patients of interest. More recently, Mikkelson and colleagues52 studiedthe prognostic value of an initial lactatemeasurement obtained in the ED and replicatedthe findings in the study byShapiro and colleagues. Based on these studies, and similarstudies performed in the ED (Table 1), it can be concluded that an elevated lactate level(>4.0 mmol/L) in the ED is predictive of increased mortality in a critically ill patient.The ED setting presents challenges to designing and performing studies evaluating
the prognostic significance of lactate clearance. The time spent by patients in the ED
Fig. 2. Acute-phase deaths and in-hospital deaths in infected patients stratified by initiallactate value. The number of acute-phase deaths and in-hospital deaths increased signifi-cantly and linearly with increasing lactate concentrations. (From Trzeciak S, Dellinger RP,Chansky ME, et al. Serum lactate as a predictor of mortality in patients with infection. Inten-sive Care Med 2007;33(6):972; with permission.)

Fig. 3. Lactate as a predictor of mortality. For 28-day in-hospital mortality, 105 (8.2%) of 1278of patients died; deathwithin 3 days occurred in 55 (4.3%) of 1278 patients. (From Shapiro NI,Howell MD, Talmor D, et al. Serum lactate as a predictor of mortality in emergency depart-ment patients with infection. Ann Emerg Med 2005;45(5):524–8; with permission.)
Lactate: Biomarker and Potential Therapeutic Target 307
may be affected by issues such as bed availability in the ICU, and if fewer ICUs areavailable, less severely ill patients are likely to be left in the ED for longer periods,leading to a selection bias. Hence, efforts have been made to evaluate the prognosticvalue of a 2-hour lactate clearance in acute cardiopulmonary insufficiency. In a recentstudy by Scott and colleagues,59 2-hour lactate clearance was evaluated as a prog-nostic marker in patients presenting to the ED with acute respiratory insufficiency orhemodynamic instability. Patients admitted through the ED into a high-dependencymonitoring unit and ICU were included in the study. Arterial lactate levels weremeasured on ED arrival and at 1, 2, 6, and 24 hours later. The predictive value of 2-hour lactate clearance was evaluated for negative outcomes defined as hospitalmortality or need for endotracheal intubation versus positive outcomes defined asdischarge or transfer to a general medical ward. From logistic regression and receiveroperating characteristic curves, it was found that a 2-hour lactate clearance of morethan 15% was a strong predictor of negative outcome (P<.001), with a sensitivity of86% (95% confidence interval [CI], 67%–95%), specificity of 91% (95% CI, 82%–96%), positive predictive value of 80% (95% CI, 61%–92%), and negative predictivevalue of 92% (95% CI, 84%–98%). In this study, the 2-hour lactate clearance provedmore accurate than baseline lactate levels, the shock index, mean arterial pressure(MAP), and the base excess (Fig. 4). Notably, the 2-hour clearance was reliableeven when the baseline lactate level was only mildly elevated at 3 mmol/L. The resultsmay not be generalizable to all severely ill patients presenting in the ED because thestudy population was relatively older with multiple comorbidities and reduced physi-ologic reserves, but they demonstrate the feasibility of obtaining 2-hour lactate clear-ance in the ED setting, a finding that has been replicated in other studies.60
Prognostic value of lactate levels checked in the ICU settingMultiple studies have evaluated the prognostic value of hyperlactatemia in diverse crit-ically ill populations in the ICU (Table 2).In the ICU setting, area under the receiver operating characteristic curve varied from
as low as 0.5381 to as high as 0.86,74 which indicates poor to moderately good prog-nostic performance. Given the time dependency of outcomes in critically ill patients,the limited prognostic values of lactate levels in some patient populations may havebeen influenced by the pre-ICU management of these patients. Another possibility
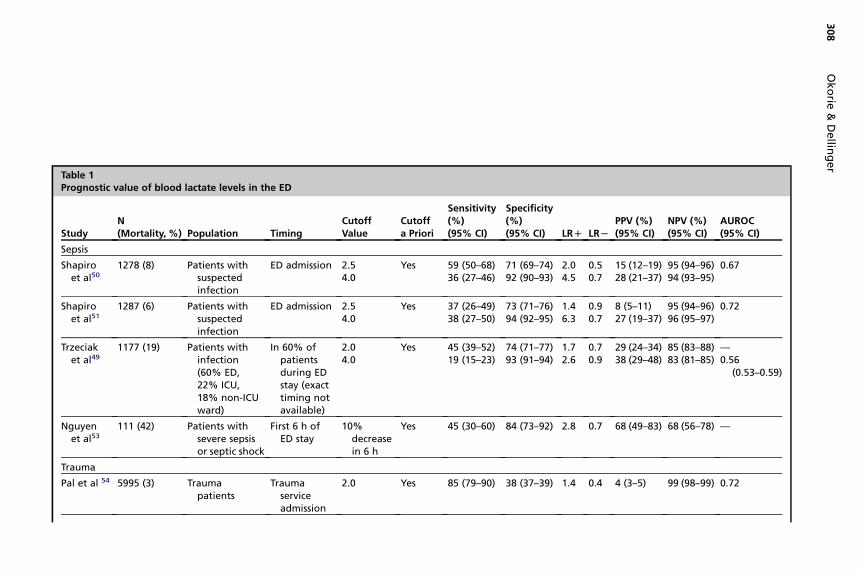
Table 1Prognostic value of blood lactate levels in the ED
StudyN(Mortality, %) Population Timing
CutoffValue
Cutoffa Priori
Sensitivity(%)(95% CI)
Specificity(%)(95% CI) LRD LRL
PPV (%)(95% CI)
NPV (%)(95% CI)
AUROC(95% CI)
Sepsis
Shapiroet al50
1278 (8) Patients withsuspectedinfection
ED admission 2.54.0
Yes 59 (50–68)36 (27–46)
71 (69–74)92 (90–93)
2.04.5
0.50.7
15 (12–19)28 (21–37)
95 (94–96)94 (93–95)
0.67
Shapiroet al51
1287 (6) Patients withsuspectedinfection
ED admission 2.54.0
Yes 37 (26–49)38 (27–50)
73 (71–76)94 (92–95)
1.46.3
0.90.7
8 (5–11)27 (19–37)
95 (94–96)96 (95–97)
0.72
Trzeciaket al49
1177 (19) Patients withinfection(60% ED,22% ICU,18% non-ICUward)
In 60% ofpatientsduring EDstay (exacttiming notavailable)
2.04.0
Yes 45 (39–52)19 (15–23)
74 (71–77)93 (91–94)
1.72.6
0.70.9
29 (24–34)38 (29–48)
85 (83–88)83 (81–85)
—0.56
(0.53–0.59)
Nguyenet al53
111 (42) Patients withsevere sepsisor septic shock
First 6 h ofED stay
10%decreasein 6 h
Yes 45 (30–60) 84 (73–92) 2.8 0.7 68 (49–83) 68 (56–78) —
Trauma
Pal et al 54 5995 (3) Traumapatients
Traumaserviceadmission
2.0 Yes 85 (79–90) 38 (37–39) 1.4 0.4 4 (3–5) 99 (98–99) 0.72
308
Okorie
&Dellin
ger
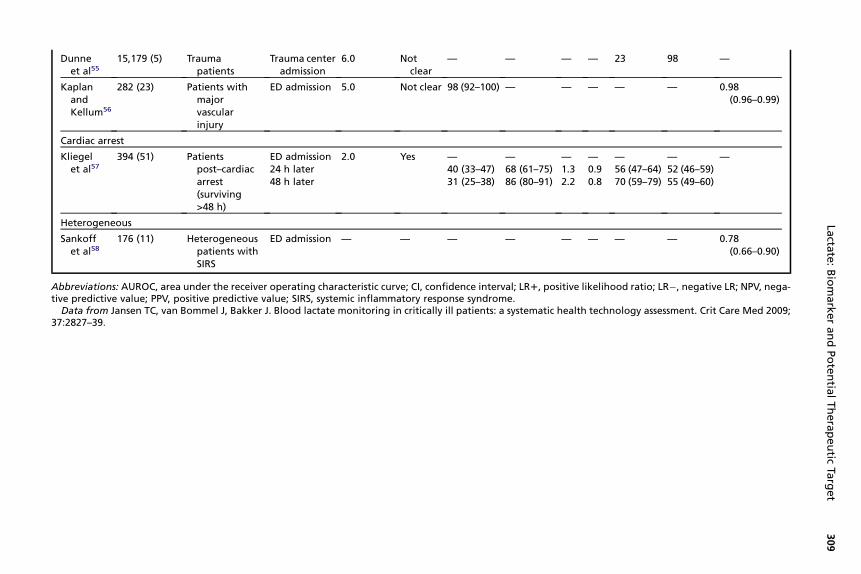
Dunneet al55
15,179 (5) Traumapatients
Trauma centeradmission
6.0 Notclear
— — — — 23 98 —
KaplanandKellum56
282 (23) Patients withmajorvascularinjury
ED admission 5.0 Not clear 98 (92–100) — — — — — 0.98(0.96–0.99)
Cardiac arrest
Kliegelet al57
394 (51) Patientspost–cardiacarrest(surviving>48 h)
ED admission24 h later48 h later
2.0 Yes —40 (33–47)31 (25–38)
—68 (61–75)86 (80–91)
—1.32.2
—0.90.8
—56 (47–64)70 (59–79)
—52 (46–59)55 (49–60)
—
Heterogeneous
Sankoffet al58
176 (11) Heterogeneouspatients withSIRS
ED admission — — — — — — — — 0.78(0.66–0.90)
Abbreviations: AUROC, area under the receiver operating characteristic curve; CI, confidence inter al; LR1, positive likelihood ratio; LR�, negative LR; NPV, nega-tive predictive value; PPV, positive predictive value; SIRS, systemic inflammatory response syndro e.
Data from Jansen TC, van Bommel J, Bakker J. Blood lactate monitoring in critically ill patients: systematic health technology assessment. Crit Care Med 2009;37:2827–39.
309
Lacta
te:BiomarkerandPotentia
lTherapeutic
Target
vma
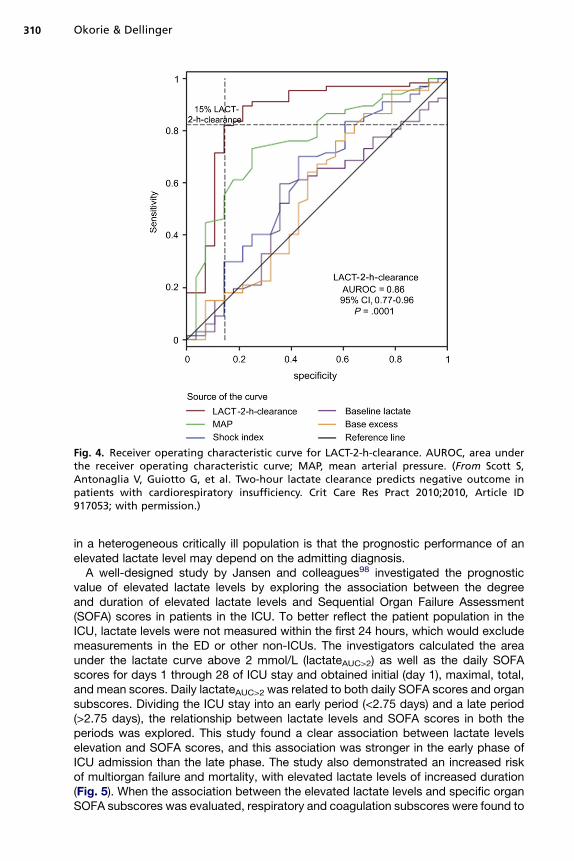
Fig. 4. Receiver operating characteristic curve for LACT-2-h-clearance. AUROC, area underthe receiver operating characteristic curve; MAP, mean arterial pressure. (From Scott S,Antonaglia V, Guiotto G, et al. Two-hour lactate clearance predicts negative outcome inpatients with cardiorespiratory insufficiency. Crit Care Res Pract 2010;2010, Article ID917053; with permission.)
Okorie & Dellinger310
in a heterogeneous critically ill population is that the prognostic performance of anelevated lactate level may depend on the admitting diagnosis.A well-designed study by Jansen and colleagues98 investigated the prognostic
value of elevated lactate levels by exploring the association between the degreeand duration of elevated lactate levels and Sequential Organ Failure Assessment(SOFA) scores in patients in the ICU. To better reflect the patient population in theICU, lactate levels were not measured within the first 24 hours, which would excludemeasurements in the ED or other non-ICUs. The investigators calculated the areaunder the lactate curve above 2 mmol/L (lactateAUC>2) as well as the daily SOFAscores for days 1 through 28 of ICU stay and obtained initial (day 1), maximal, total,and mean scores. Daily lactateAUC>2 was related to both daily SOFA scores and organsubscores. Dividing the ICU stay into an early period (<2.75 days) and a late period(>2.75 days), the relationship between lactate levels and SOFA scores in both theperiods was explored. This study found a clear association between lactate levelselevation and SOFA scores, and this association was stronger in the early phase ofICU admission than the late phase. The study also demonstrated an increased riskof multiorgan failure and mortality, with elevated lactate levels of increased duration(Fig. 5). When the association between the elevated lactate levels and specific organSOFA subscores was evaluated, respiratory and coagulation subscores were found to

Lactate: Biomarker and Potential Therapeutic Target 311
be the most strongly associated (Tables 3 and 4). There was no strong correlationbetween elevated lactate levels and the cardiovascular subscore. These findings raiseseveral interesting thoughts. First, the absence of a strong correlation betweenelevated lactate levels and cardiovascular SOFA subscores may be related to thefact that cardiovascular SOFA subscores are a measure of macrovascular circulatoryadequacy and in some conditions, notably sepsis, microcirculatory dysfunction andexist in spite of acceptable macrocirculatory indices. Second, in critically ill patients,there may be increased production of lactate by nonusual lactate-producing organs,such as the lungs, and the strong association between the elevated lactate level andan increased respiratory SOFA score may reflect the presence of lactate productionnot related to tissue hypoxia or even acute lung injury, which may significantly alteroutcome. Similarly, severe critical illness, especially sepsis, may be associated withdysfunction of the coagulation pathways (which may lead to microcirculatory dysfunc-tion), and in these patients, the SOFA coagulation subscore may reflect the severity ofthe critical illness, which may explain the strong correlation between lactate levels andcoagulation SOFA subscores. From the ongoing, it may be expected that in a diverseICU population, elevated lactate levels may be more prognostic in disease conditionsassociated with microcirculatory dysfunction and increased lactate production notrelated to tissue hypoxia such as severe sepsis. This is consistent with findingsreported by Jansen and colleagues99 in a separate study in which they evaluatedthe prognostic value of elevated lactate levels in patients in a multidisciplinary ICUand in sepsis as compared with hemorrhage and other low–oxygen-transport states.In 394 patients, the investigators measured blood lactate levels at admission to theICU (lactate at T0) and the reduction of lactate levels 12 hours later (DLacT0–12)and between 12 and 24 hours (DLacT12–24) and related these values to in-hospitalmortality. They found that regardless of hemodynamic status, lactate levels reductionduring the first 24 hours of ICU stay was associated with improved outcome in septicpatients; however, it was not the same in patients with other conditions associatedwith low–oxygen-transport states (including hemorrhagic shock). These findings serveas a rational basis for efforts aimed at guiding therapy in selected populations basedon blood lactate levels and are discussed in the following section.
Lactate as a Tool for Monitoring Interventions in the Critically IllPatient/Lactate-Guided Therapy in the Critically Ill Patient
Efforts are aimed at developing novel biomarkers and surrogates for diseaseseverity to enable clinicians diagnose conditions associated with organ dysfunctionearly and by early intervention, lead to improved outcomes. The most discriminatingbiomarker, unless coupled to a rational therapeutic response, is worthless at thebedside. Thus, efforts at studying the role of various biomarkers in critically illpatients need to include a therapeutic response coupled to a predefined elevationin the level of that biomarker. In addition, these studies have to be performed indisease conditions in which lactate levels elevation is more prognostic and prefer-ably early in the course of disease in which outcomes may be changes by the rightintervention. Several observational cohort studies have been published describingthe implementation of a lactate-guided oxygen delivery therapy algorithm(Table 5). In all these studies, guiding therapy based on lactate levels was associ-ated with better outcomes (decreased mortality, decreased infection rates,improved tissue oxygenation indices) in the normolactatemic group. However, thesestudies are subject to the limitations of observational studies. Also, one of thestudies100 compared the cohort to a historical control group and reported benefitsmay arguably reflect changes in standards of care over time. It was thus necessary
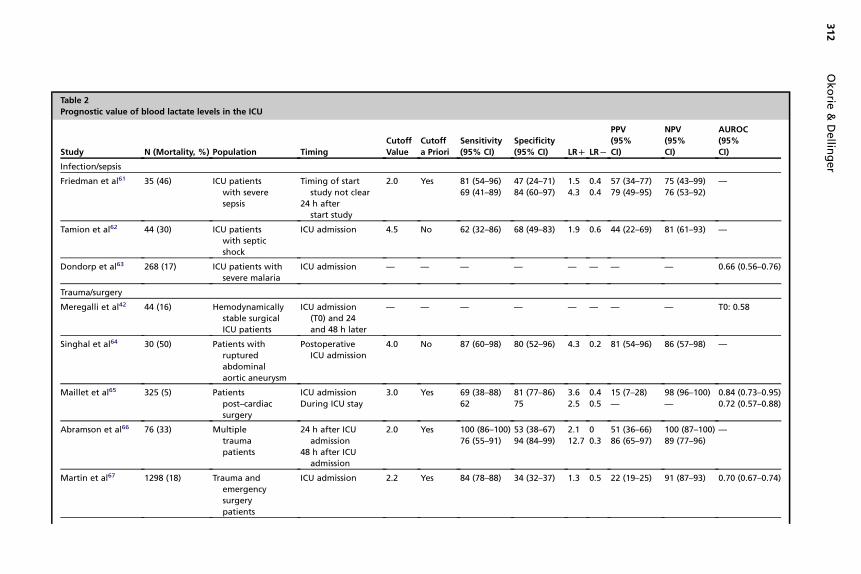
Table 2
Prognostic value of blood lactate levels in the ICU
Study N (Mortality, %) Population Timing
Cutoff
Value
Cutoff
a Priori
Sensitivity
(95% CI)
Specificity
(95% CI) LRD LRL
PPV
(95%
CI)
NPV
(95%
CI)
AUROC
(95%
CI)
Infection/sepsis
Friedman et al61 35 (46) ICU patients
with severe
sepsis
Timing of start
study not clear
24 h after
start study
2.0 Yes 81 (54–96)
69 (41–89)
47 (24–71)
84 (60–97)
1.5
4.3
0.4
0.4
57 (34–77)
79 (49–95)
75 (43–99)
76 (53–92)
—
Tamion et al62 44 (30) ICU patients
with septic
shock
ICU admission 4.5 No 62 (32–86) 68 (49–83) 1.9 0.6 44 (22–69) 81 (61–93) —
Dondorp et al63 268 (17) ICU patients with
severe malaria
ICU admission — — — — — — — — 0.66 (0.56–0.76)
Trauma/surgery
Meregalli et al42 44 (16) Hemodynamically
stable surgical
ICU patients
ICU admission
(T0) and 24
and 48 h later
— — — — — — — — T0: 0.58
Singhal et al64 30 (50) Patients with
ruptured
abdominal
aortic aneurysm
Postoperative
ICU admission
4.0 No 87 (60–98) 80 (52–96) 4.3 0.2 81 (54–96) 86 (57–98) —
Maillet et al65 325 (5) Patients
post–cardiac
surgery
ICU admission
During ICU stay
3.0 Yes 69 (38–88)
62
81 (77–86)
75
3.6
2.5
0.4
0.5
15 (7–28)
—
98 (96–100)
—
0.84 (0.73–0.95)
0.72 (0.57–0.88)
Abramson et al66 76 (33) Multiple
trauma
patients
24 h after ICU
admission
48 h after ICU
admission
2.0 Yes 100 (86–100)
76 (55–91)
53 (38–67)
94 (84–99)
2.1
12.7
0
0.3
51 (36–66)
86 (65–97)
100 (87–100)
89 (77–96)
—
Martin et al67 1298 (18) Trauma and
emergency
surgery
patients
ICU admission 2.2 Yes 84 (78–88) 34 (32–37) 1.3 0.5 22 (19–25) 91 (87–93) 0.70 (0.67–0.74)
312
Okorie
&Dellin
ger

Blow et al68 79 (10%) Major trauma
patients,
hemodynamically
stable
ICU admission
24 h later
2.5 Yes 100 (63–100)
100 (63–100)
30 (19–42)
92 (83–97)
1.4
12.5
0
0
14 (6–25)
57 (29–82)
100 (84–100)
100 (94–100)
_
Claridge et al69 364 (3) Major trauma
patients
ICU admission
24 h later
2.5 Yes 92 (64–100)
54 (25–81)
33 (28–39)
86 (82–89)
1.4
3.9
0.2
0.5
5 (3–8)
12 (5–24)
99 (95–100)
98 (96–99)
—
Wahl et al70 169 (11) Postoperative
ICU patients
ICU admission — — — — — — — — 0.79
Murillo-Cabezas
et al71210 (14) Hemodynamically
stable patients
with moderate
or severe head
injury
During first
48 h ICU stay
2.2 Yes 53 (34–72) 56 (49–63) 1.2 0.8 17 (10–26) 88 (80–93) —
Liver disease
Bernal et al72 93 (39), 85
at T12
99 (21), 85
at T12
Paracetamol-induced
acute liver failure
(initial sample)
� ICU admission
�12 h later
3.5
3.0
No 86 (71–95)
82 (65–93)
91 (81–97)
96 (87–100)
9.8
20.5
0.2
0.2
86 (71–95)
93 (77–99)
91 (81–97)
89 (78–96)
—
—
Paracetamol-induced
acute liver
failure (validation
sample)
� ICU admission
�12 h later
3.5
3.0
Yes 67 (43–85)
76 (53–92)
95 (87–99)
97 (89–100)
13.4
25.3
0.3
0.2
78 (52–94)
89 (65–99)
91 (83–96)
93 (83–98)
—
—
Watanabe et al73 151 (7) Patients
post–liver
resection
ICU admission — — — — — — — — 0.86
Funk et al74 181 (50) ICU patients
with liver
cirrhosis
ICU admission 8.9 No 36 (26–46) 99 (94–100) 36.0 0.6 97 (84–100) 61 (53–69) 0.81 (0.75–0.87)
Kruse et al75 38 (68) ICU patients
with liver
disease
Maximum
value during
ICU stay
2.2
7.0
No 80 (59–93)
52 (31–72)
62 (32–86)
100 (75–100)
2.1
N
0.3
0.5
80 (59–93)
100 (75–100)
62 (32–86)
52 (31–72)
—
Heterogeneous
Smith et al76 T0: 148 (35)
T24: 131 (31)
Heterogeneous
ICU patients
T0: 1.5
T24: 1.0
No 69 (54–81)
68 (52–82)
77 (68–85)
83 (74–90)
3.0
4.0
0.4
0.4
61 (48–74)
65 (49–79)
82 (73–90)
85 (76–92)
0.78
—
(continued on next page)
313
Lacta
te:BiomarkerandPotentia
lTherapeutic
Target
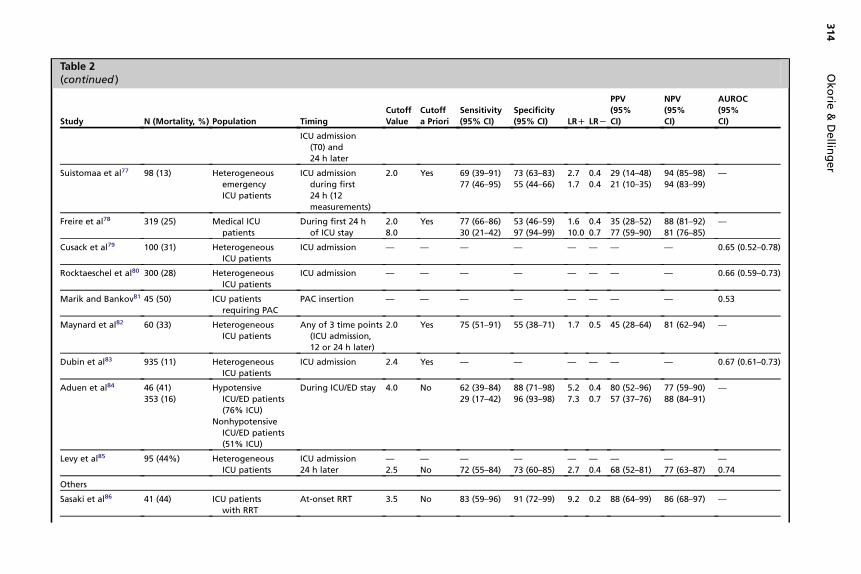
Table 2(continued )
Study N (Mortality, %) Population Timing
Cutoff
Value
Cutoff
a Priori
Sensitivity
(95% CI)
Specificity
(95% CI) LRD LRL
PPV
(95%
CI)
NPV
(95%
CI)
AUROC
(95%
CI)
ICU admission
(T0) and
24 h later
Suistomaa et al77 98 (13) Heterogeneous
emergency
ICU patients
ICU admission
during first
24 h (12
measurements)
2.0 Yes 69 (39–91)
77 (46–95)
73 (63–83)
55 (44–66)
2.7
1.7
0.4
0.4
29 (14–48)
21 (10–35)
94 (85–98)
94 (83–99)
—
Freire et al78 319 (25) Medical ICU
patients
During first 24 h
of ICU stay
2.0
8.0
Yes 77 (66–86)
30 (21–42)
53 (46–59)
97 (94–99)
1.6
10.0
0.4
0.7
35 (28–52)
77 (59–90)
88 (81–92)
81 (76–85)
—
Cusack et al79 100 (31) Heterogeneous
ICU patients
ICU admission — — — — — — — — 0.65 (0.52–0.78)
Rocktaeschel et al80 300 (28) Heterogeneous
ICU patients
ICU admission — — — — — — — — 0.66 (0.59–0.73)
Marik and Bankov81 45 (50) ICU patients
requiring PAC
PAC insertion — — — — — — — — 0.53
Maynard et al82 60 (33) Heterogeneous
ICU patients
Any of 3 time points
(ICU admission,
12 or 24 h later)
2.0 Yes 75 (51–91) 55 (38–71) 1.7 0.5 45 (28–64) 81 (62–94) —
Dubin et al83 935 (11) Heterogeneous
ICU patients
ICU admission 2.4 Yes — — — — — — 0.67 (0.61–0.73)
Aduen et al84 46 (41)
353 (16)
Hypotensive
ICU/ED patients
(76% ICU)
Nonhypotensive
ICU/ED patients
(51% ICU)
During ICU/ED stay 4.0 No 62 (39–84)
29 (17–42)
88 (71–98)
96 (93–98)
5.2
7.3
0.4
0.7
80 (52–96)
57 (37–76)
77 (59–90)
88 (84–91)
—
Levy et al85 95 (44%) Heterogeneous
ICU patients
ICU admission
24 h later
—
2.5
—
No
—
72 (55–84)
—
73 (60–85)
—
2.7
—
0.4
—
68 (52–81)
—
77 (63–87)
—
0.74
Others
Sasaki et al86 41 (44) ICU patients
with RRT
At-onset RRT 3.5 No 83 (59–96) 91 (72–99) 9.2 0.2 88 (64–99) 86 (68–97) —
314
Okorie
&Dellin
ger
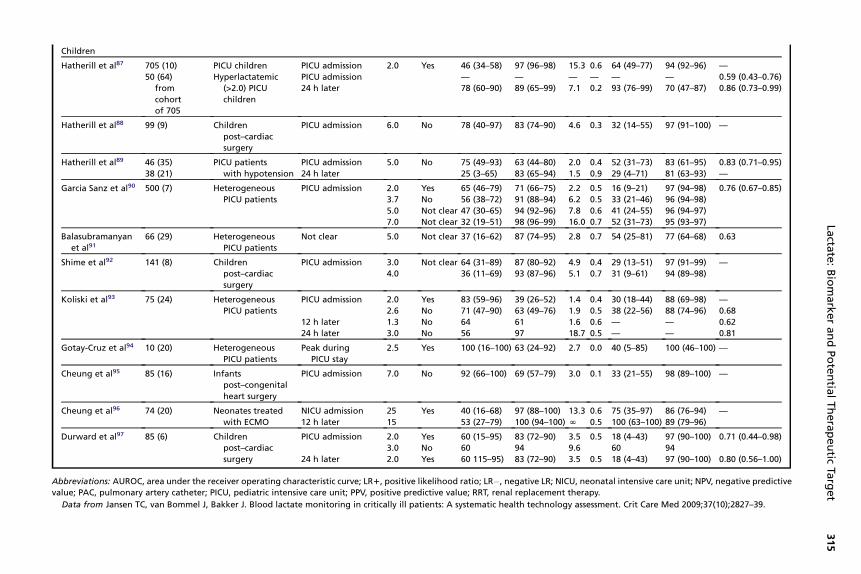
Children
Hatherill et al87 705 (10)
50 (64)
from
cohort
of 705
PICU children
Hyperlactatemic
(>2.0) PICU
children
PICU admission
PICU admission
24 h later
2.0 Yes 46 (34–58)
—
78 (60–90)
97 (96–98)
—
89 (65–99)
15.3
—
7.1
0.6
—
0.2
64 (49–77)
—
93 (76–99)
94 (92–96)
—
70 (47–87)
—
0.59 (0.43–0.76)
0.86 (0.73–0.99)
Hatherill et al88 99 (9) Children
post–cardiac
surgery
PICU admission 6.0 No 78 (40–97) 83 (74–90) 4.6 0.3 32 (14–55) 97 (91–100) —
Hatherill et al89 46 (35)
38 (21)
PICU patients
with hypotension
PICU admission
24 h later
5.0 No 75 (49–93)
25 (3–65)
63 (44–80)
83 (65–94)
2.0
1.5
0.4
0.9
52 (31–73)
29 (4–71)
83 (61–95)
81 (63–93)
0.83 (0.71–0.95)
—
Garcia Sanz et al90 500 (7) Heterogeneous
PICU patients
PICU admission 2.0
3.7
5.0
7.0
Yes
No
Not clear
Not clear
65 (46–79)
56 (38–72)
47 (30–65)
32 (19–51)
71 (66–75)
91 (88–94)
94 (92–96)
98 (96–99)
2.2
6.2
7.8
16.0
0.5
0.5
0.6
0.7
16 (9–21)
33 (21–46)
41 (24–55)
52 (31–73)
97 (94–98)
96 (94–98)
96 (94–97)
95 (93–97)
0.76 (0.67–0.85)
Balasubramanyan
et al9166 (29) Heterogeneous
PICU patients
Not clear 5.0 Not clear 37 (16–62) 87 (74–95) 2.8 0.7 54 (25–81) 77 (64–68) 0.63
Shime et al92 141 (8) Children
post–cardiac
surgery
PICU admission 3.0
4.0
Not clear 64 (31–89)
36 (11–69)
87 (80–92)
93 (87–96)
4.9
5.1
0.4
0.7
29 (13–51)
31 (9–61)
97 (91–99)
94 (89–98)
—
Koliski et al93 75 (24) Heterogeneous
PICU patients
PICU admission 2.0
2.6
Yes
No
83 (59–96)
71 (47–90)
39 (26–52)
63 (49–76)
1.4
1.9
0.4
0.5
30 (18–44)
38 (22–56)
88 (69–98)
88 (74–96)
—
0.68
12 h later 1.3 No 64 61 1.6 0.6 — — 0.62
24 h later 3.0 No 56 97 18.7 0.5 — — 0.81
Gotay-Cruz et al94 10 (20) Heterogeneous
PICU patients
Peak during
PICU stay
2.5 Yes 100 (16–100) 63 (24–92) 2.7 0.0 40 (5–85) 100 (46–100) —
Cheung et al95 85 (16) Infants
post–congenital
heart surgery
PICU admission 7.0 No 92 (66–100) 69 (57–79) 3.0 0.1 33 (21–55) 98 (89–100) —
Cheung et al96 74 (20) Neonates treated
with ECMO
NICU admission
12 h later
25
15
Yes 40 (16–68)
53 (27–79)
97 (88–100)
100 (94–100)
13.3
N
0.6
0.5
75 (35–97)
100 (63–100)
86 (76–94)
89 (79–96)
—
Durward et al97 85 (6) Children
post–cardiac
surgery
PICU admission 2.0
3.0
Yes
No
60 (15–95)
60
83 (72–90)
94
3.5
9.6
0.5 18 (4–43)
60
97 (90–100)
94
0.71 (0.44–0.98)
24 h later 2.0 Yes 60 115–95) 83 (72–90) 3.5 0.5 18 (4–43) 97 (90–100) 0.80 (0.56–1.00)
Abbreviations: AUROC, area under the receiver operating characteristic curve; LR1, positive likelihood ratio; LR�, negative LR; NICU, neonatal intensive care unit; NPV, negative predictive
value; PAC, pulmonary artery catheter; PICU, pediatric intensive care unit; PPV, positive predictive value; RRT, renal replacement therapy.
Data from Jansen TC, van Bommel J, Bakker J. Blood lactate monitoring in critically ill patients: A systematic health technology assessment. Crit Care Med 2009;37(10);2827–39.
315
Lacta
te:BiomarkerandPotentia
lTherapeutic
Target
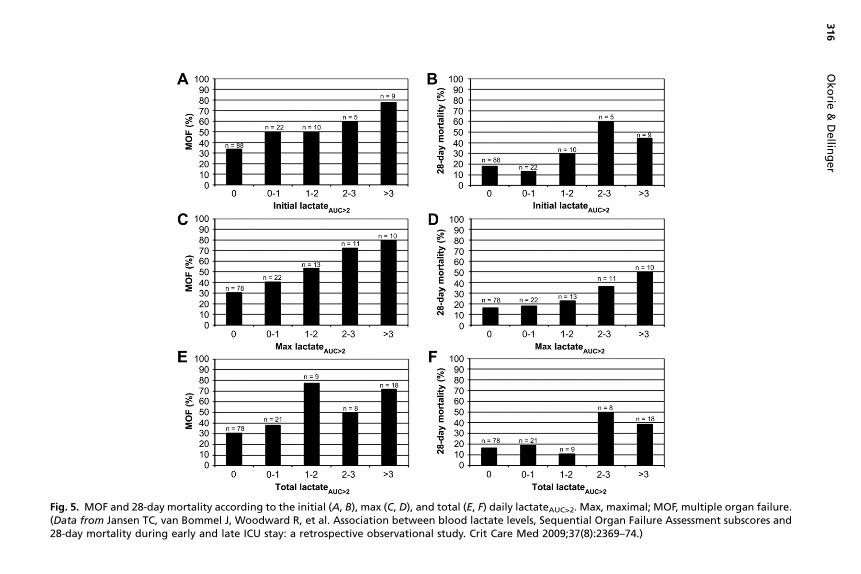
Fig. 5. MOF and 28-day mortality according to the initial (A, B), max (C, D), and total (E, F) daily lactateAUC>2. Max, maximal; MOF, multiple organ failure.(Data from Jansen TC, van Bommel J, Woodward R, et al. Association between blood lactate levels, Sequential Organ Failure Assessment subscores and28-day mortality during early and late ICU stay: a retrospective observational study. Crit Care Med 2009;37(8):2369–74.)
316
Okorie
&Dellin
ger
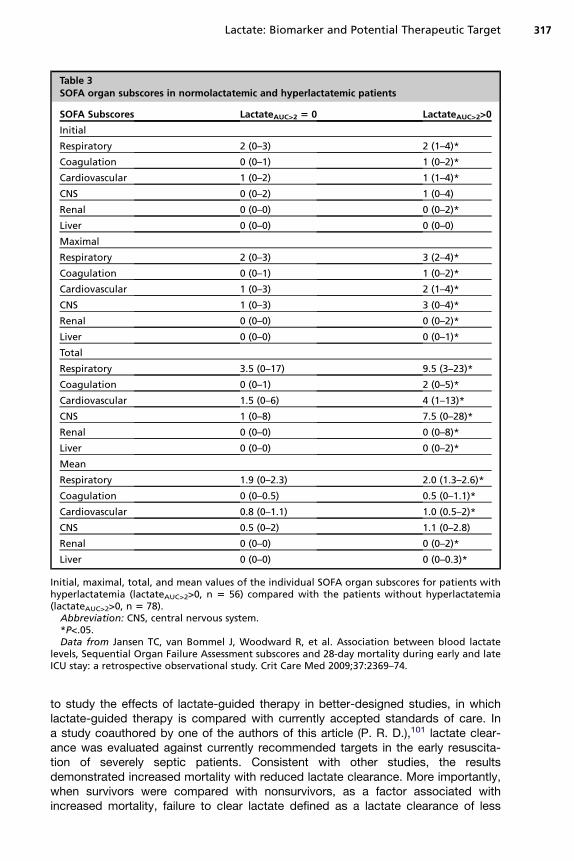
Table 3SOFA organ subscores in normolactatemic and hyperlactatemic patients
SOFA Subscores LactateAUC>2 5 0 LactateAUC>2>0
Initial
Respiratory 2 (0–3) 2 (1–4)*
Coagulation 0 (0–1) 1 (0–2)*
Cardiovascular 1 (0–2) 1 (1–4)*
CNS 0 (0–2) 1 (0–4)
Renal 0 (0–0) 0 (0–2)*
Liver 0 (0–0) 0 (0–0)
Maximal
Respiratory 2 (0–3) 3 (2–4)*
Coagulation 0 (0–1) 1 (0–2)*
Cardiovascular 1 (0–3) 2 (1–4)*
CNS 1 (0–3) 3 (0–4)*
Renal 0 (0–0) 0 (0–2)*
Liver 0 (0–0) 0 (0–1)*
Total
Respiratory 3.5 (0–17) 9.5 (3–23)*
Coagulation 0 (0–1) 2 (0–5)*
Cardiovascular 1.5 (0–6) 4 (1–13)*
CNS 1 (0–8) 7.5 (0–28)*
Renal 0 (0–0) 0 (0–8)*
Liver 0 (0–0) 0 (0–2)*
Mean
Respiratory 1.9 (0–2.3) 2.0 (1.3–2.6)*
Coagulation 0 (0–0.5) 0.5 (0–1.1)*
Cardiovascular 0.8 (0–1.1) 1.0 (0.5–2)*
CNS 0.5 (0–2) 1.1 (0–2.8)
Renal 0 (0–0) 0 (0–2)*
Liver 0 (0–0) 0 (0–0.3)*
Initial, maximal, total, and mean values of the individual SOFA organ subscores for patients withhyperlactatemia (lactateAUC>2>0, n 5 56) compared with the patients without hyperlactatemia(lactateAUC>2>0, n 5 78).
Abbreviation: CNS, central nervous system.*P<.05.Data from Jansen TC, van Bommel J, Woodward R, et al. Association between blood lactate
levels, Sequential Organ Failure Assessment subscores and 28-day mortality during early and lateICU stay: a retrospective observational study. Crit Care Med 2009;37:2369–74.
Lactate: Biomarker and Potential Therapeutic Target 317
to study the effects of lactate-guided therapy in better-designed studies, in whichlactate-guided therapy is compared with currently accepted standards of care. Ina study coauthored by one of the authors of this article (P. R. D.),101 lactate clear-ance was evaluated against currently recommended targets in the early resuscita-tion of severely septic patients. Consistent with other studies, the resultsdemonstrated increased mortality with reduced lactate clearance. More importantly,when survivors were compared with nonsurvivors, as a factor associated withincreased mortality, failure to clear lactate defined as a lactate clearance of less
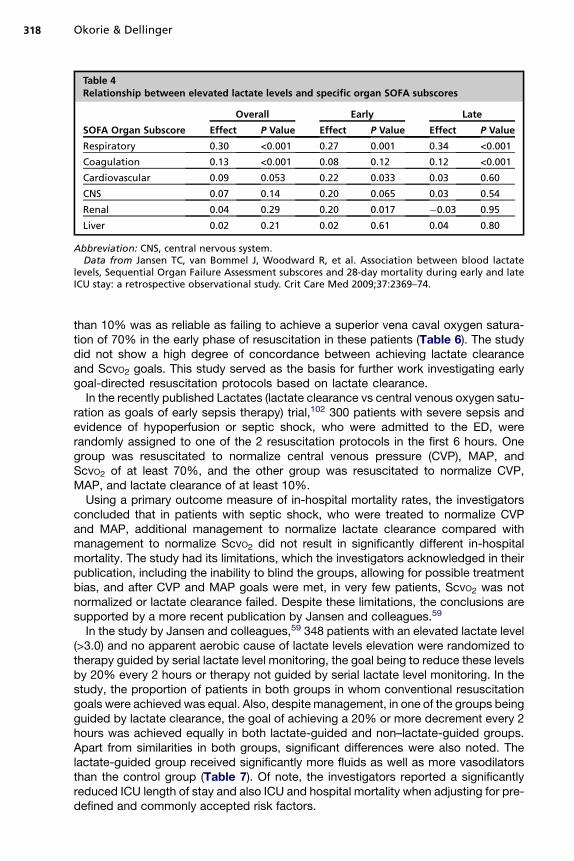
Table 4Relationship between elevated lactate levels and specific organ SOFA subscores
SOFA Organ Subscore
Overall Early Late
Effect P Value Effect P Value Effect P Value
Respiratory 0.30 <0.001 0.27 0.001 0.34 <0.001
Coagulation 0.13 <0.001 0.08 0.12 0.12 <0.001
Cardiovascular 0.09 0.053 0.22 0.033 0.03 0.60
CNS 0.07 0.14 0.20 0.065 0.03 0.54
Renal 0.04 0.29 0.20 0.017 �0.03 0.95
Liver 0.02 0.21 0.02 0.61 0.04 0.80
Abbreviation: CNS, central nervous system.Data from Jansen TC, van Bommel J, Woodward R, et al. Association between blood lactate
levels, Sequential Organ Failure Assessment subscores and 28-day mortality during early and lateICU stay: a retrospective observational study. Crit Care Med 2009;37:2369–74.
Okorie & Dellinger318
than 10% was as reliable as failing to achieve a superior vena caval oxygen satura-tion of 70% in the early phase of resuscitation in these patients (Table 6). The studydid not show a high degree of concordance between achieving lactate clearanceand ScvO2 goals. This study served as the basis for further work investigating earlygoal-directed resuscitation protocols based on lactate clearance.In the recently published Lactates (lactate clearance vs central venous oxygen satu-
ration as goals of early sepsis therapy) trial,102 300 patients with severe sepsis andevidence of hypoperfusion or septic shock, who were admitted to the ED, wererandomly assigned to one of the 2 resuscitation protocols in the first 6 hours. Onegroup was resuscitated to normalize central venous pressure (CVP), MAP, andScvO2 of at least 70%, and the other group was resuscitated to normalize CVP,MAP, and lactate clearance of at least 10%.Using a primary outcome measure of in-hospital mortality rates, the investigators
concluded that in patients with septic shock, who were treated to normalize CVPand MAP, additional management to normalize lactate clearance compared withmanagement to normalize ScvO2 did not result in significantly different in-hospitalmortality. The study had its limitations, which the investigators acknowledged in theirpublication, including the inability to blind the groups, allowing for possible treatmentbias, and after CVP and MAP goals were met, in very few patients, ScvO2 was notnormalized or lactate clearance failed. Despite these limitations, the conclusions aresupported by a more recent publication by Jansen and colleagues.59
In the study by Jansen and colleagues,59 348 patients with an elevated lactate level(>3.0) and no apparent aerobic cause of lactate levels elevation were randomized totherapy guided by serial lactate level monitoring, the goal being to reduce these levelsby 20% every 2 hours or therapy not guided by serial lactate level monitoring. In thestudy, the proportion of patients in both groups in whom conventional resuscitationgoals were achieved was equal. Also, despite management, in one of the groups beingguided by lactate clearance, the goal of achieving a 20% or more decrement every 2hours was achieved equally in both lactate-guided and non–lactate-guided groups.Apart from similarities in both groups, significant differences were also noted. Thelactate-guided group received significantly more fluids as well as more vasodilatorsthan the control group (Table 7). Of note, the investigators reported a significantlyreduced ICU length of stay and also ICU and hospital mortality when adjusting for pre-defined and commonly accepted risk factors.
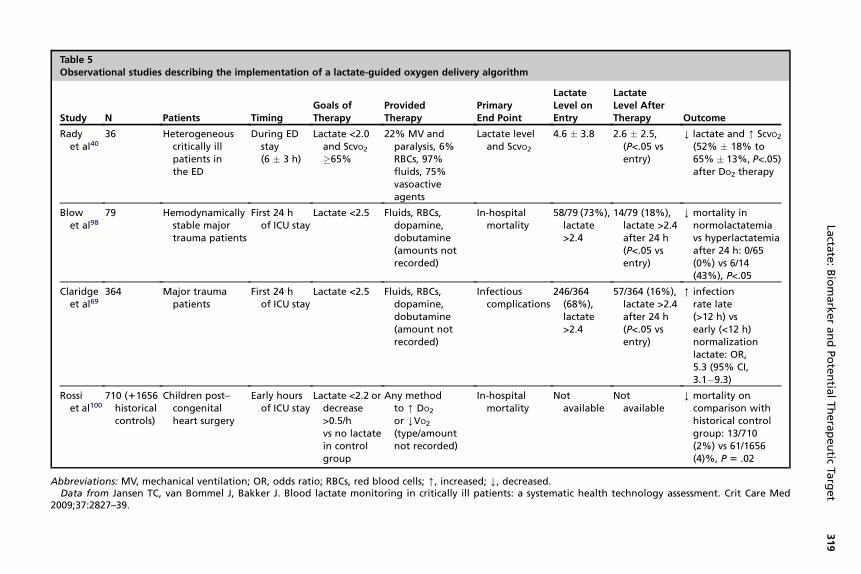
Table 5Observational studies describing the implementation of a lactate-guided oxygen delivery algorithm
Study N Patients TimingGoals ofTherapy
ProvidedTherapy
PrimaryEnd Point
LactateLevel onEntry
LactateLevel AfterTherapy Outcome
Radyet al40
36 Heterogeneouscritically illpatients inthe ED
During EDstay(6 � 3 h)
Lactate <2.0and ScvO2�65%
22% MV andparalysis, 6%RBCs, 97%fluids, 75%vasoactiveagents
Lactate leveland ScvO2
4.6 � 3.8 2.6 � 2.5,(P<.05 vsentry)
Y lactate and [ ScvO2(52% � 18% to65% � 13%, P<.05)after DO2 therapy
Blowet al98
79 Hemodynamicallystable majortrauma patients
First 24 hof ICU stay
Lactate <2.5 Fluids, RBCs,dopamine,dobutamine(amounts notrecorded)
In-hospitalmortality
58/79 (73%),lactate>2.4
14/79 (18%),lactate >2.4after 24 h(P<.05 vsentry)
Y mortality innormolactatemiavs hyperlactatemiaafter 24 h: 0/65(0%) vs 6/14(43%), P<.05
Claridgeet al69
364 Major traumapatients
First 24 hof ICU stay
Lactate <2.5 Fluids, RBCs,dopamine,dobutamine(amount notrecorded)
Infectiouscomplications
246/364(68%),lactate>2.4
57/364 (16%),lactate >2.4after 24 h(P<.05 vsentry)
[ infectionrate late(>12 h) vsearly (<12 h)normalizationlactate: OR,5.3 (95% CI,3.1�9.3)
Rossiet al100
710 (11656historicalcontrols)
Children post–congenitalheart surgery
Early hoursof ICU stay
Lactate <2.2 ordecrease>0.5/hvs no lactatein controlgroup
Any methodto [ DO2
or YVO2
(type/amountnot recorded)
In-hospitalmortality
Notavailable
Notavailable
Y mortality oncomparison withhistorical controlgroup: 13/710(2%) vs 61/1656(4)%, P 5 .02
Abbreviations: MV, mechanical ventilation; OR, odds ratio; RBCs, red blood cells; [, increased; Y, decreased.Data from Jansen TC, van Bommel J, Bakker J. Blood lactate monitoring in critically ill patients: a systematic health technology assessment. Crit Care Med
2009;37:2827–39.
Lacta
te:BiomarkerandPotentia
lTherapeutic
Target
319
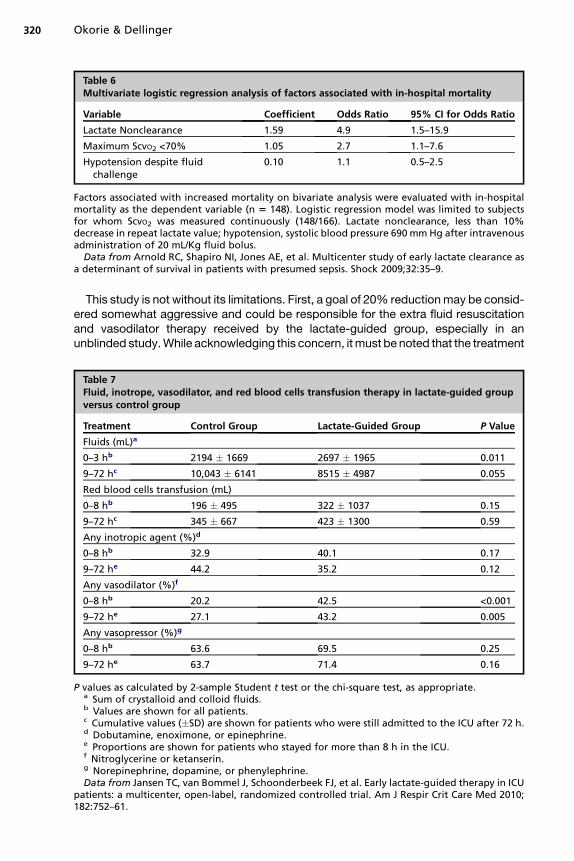
Table 6Multivariate logistic regression analysis of factors associated with in-hospital mortality
Variable Coefficient Odds Ratio 95% CI for Odds Ratio
Lactate Nonclearance 1.59 4.9 1.5–15.9
Maximum ScvO2 <70% 1.05 2.7 1.1–7.6
Hypotension despite fluidchallenge
0.10 1.1 0.5–2.5
Factors associated with increased mortality on bivariate analysis were evaluated with in-hospitalmortality as the dependent variable (n 5 148). Logistic regression model was limited to subjectsfor whom ScvO2 was measured continuously (148/166). Lactate nonclearance, less than 10%decrease in repeat lactate value; hypotension, systolic blood pressure 690 mmHg after intravenousadministration of 20 mL/Kg fluid bolus.
Data from Arnold RC, Shapiro NI, Jones AE, et al. Multicenter study of early lactate clearance asa determinant of survival in patients with presumed sepsis. Shock 2009;32:35–9.
Okorie & Dellinger320
This study is not without its limitations. First, a goal of 20% reductionmay be consid-ered somewhat aggressive and could be responsible for the extra fluid resuscitationand vasodilator therapy received by the lactate-guided group, especially in anunblinded study.While acknowledging this concern, itmust be noted that the treatment
Table 7Fluid, inotrope, vasodilator, and red blood cells transfusion therapy in lactate-guided groupversus control group
Treatment Control Group Lactate-Guided Group P Value
Fluids (mL)a
0–3 hb 2194 � 1669 2697 � 1965 0.011
9–72 hc 10,043 � 6141 8515 � 4987 0.055
Red blood cells transfusion (mL)
0–8 hb 196 � 495 322 � 1037 0.15
9–72 hc 345 � 667 423 � 1300 0.59
Any inotropic agent (%)d
0–8 hb 32.9 40.1 0.17
9–72 he 44.2 35.2 0.12
Any vasodilator (%)f
0–8 hb 20.2 42.5 <0.001
9–72 he 27.1 43.2 0.005
Any vasopressor (%)g
0–8 hb 63.6 69.5 0.25
9–72 he 63.7 71.4 0.16
P values as calculated by 2-sample Student t test or the chi-square test, as appropriate.a Sum of crystalloid and colloid fluids.b Values are shown for all patients.c Cumulative values (�SD) are shown for patients who were still admitted to the ICU after 72 h.d Dobutamine, enoximone, or epinephrine.e Proportions are shown for patients who stayed for more than 8 h in the ICU.f Nitroglycerine or ketanserin.g Norepinephrine, dopamine, or phenylephrine.Data from Jansen TC, van Bommel J, Schoonderbeek FJ, et al. Early lactate-guided therapy in ICU
patients: a multicenter, open-label, randomized controlled trial. Am J Respir Crit Care Med 2010;182:752–61.
Lactate: Biomarker and Potential Therapeutic Target 321
algorithm of the lactate-guided group did not result in faster lactate clearance whencompared with control group, despite the use of more fluids and vasodilators in thelactate-guided group. Second, although the use of vasodilators for microcirculatoryrecruitment may be viewed as a departure from standard care and a limitation withregard to the applicability of these results in other settings, in the centerwhere the studywas conducted vasodilators represented the local standard of care and were usedmore in the lactate-guided group simply because of persistent lactate levels elevation.It is the authors’ opinion that the results of these studies provide a rational basis
for the use of lactate-guided therapy in critically ill patients, especially those withsepsis-induced tissue hypoperfusion. This argument may be made more strong insettings with limited capability to rapidly place central venous access for ScvO2measurement. In these cases, rather than blindly administering fluids and vasopres-sors, lactate-guided therapy may be of clinical relevance.
SUMMARY
Lactate levels are frequently elevated in critically ill patients and correlate well withdisease severity. Elevated lactate levels are prognostic in prehospital, ED, and ICUsettings and in selected critically ill patients, lactate levels may be used to guide earlyresuscitation therapy.
REFERENCES
1. Anderson B, Kelly A, Kerr D, et al. Impact of patient and environmental factorson capillary refill time in adults. Am J Emerg Med 2008;26:62–5.
2. Lewin J, Maconochie I. Capillary refill time in adults. Emerg Med J 2008;25:325–6.
3. Tibby SM, Hatherill M, Murdoch IA. Capillary refill and core–peripheral temper-ature gap as indicators of haemodynamic status in paediatric intensive carepatients. Arch Dis Child 1999;80:163–6.
4. Scheele KW. Opuscula chemica et physica. Leipzig (Germany): KessingerPublishing Company; 1789. p. 316.
5. Philosophical Magazine Series 4. Taylor & Francis; 1851.6. Araki T. Ueber die Bildung von Milchsaure und Glycose im Organismus bei Sau-
erstoffmangel. Z Physiol Chem 1891;15:335–70 [in German].7. Araki T. Ueber die Bildung von Milchsaure und Glycose im Organismus bei Sau-
erstoffmangel. Zweite Mittheilung: Ueber die Wirkung von Morphium, Amylnitrit,Cocain. Z Physiol Chem 1891;15:546–61 [in German].
8. Araki T. Ueber die Bildung von Milchsaure und Glycose im Organismus bei Sau-erstoffmangel. Dritte Mittheilung. Z Physiol Chem 1892;16:453–9 [in German].
9. Araki T. Ueber Bildung von Glycose und Milchsaure bei Sauerstoff mangel. En-tgegnung. Z Physiol Chem 1892;16:201–4 [in German].
10. Zillessen H. Ueber die Bildung von Milchsaure und Glykose in den Organen bei-gestorter Circulation und bei der Blausaurevergiftung. Z Physiol Chem 1891;15:387–404 [in German].
11. Scherer JJ. Chemische und Mikroskopische Untersuchungen zur Pathologie an-gestellt an den Kliniken des Julius-Hospitales zu Wurzburg. Heidelberg(Germany): C.F. Winter; 1843.
12. Scherer JJ. Eine Untersuchung des Blutes bei Leukamie. Verhandlungen derPhysikalisch-Medicinischen Gesellschaft im Wurzburg 1851;2:321–5 [inGerman].
Okorie & Dellinger322
13. Folwarczny Carl. Handbuch Der Physiologischen Chemie, Mit Rucksicht AufPathologische Chemie Und Analytische Methoden. Wien (Switzerland): Verlagvon Sallmayer & Comp; 1863.
14. Mizock BA, Falk JL. Lactic acidosis in critical illness. Crit Care Med 1992;20(1):80–93.
15. Woods HF, Cohen R. Clinical and biochemical aspects of lactic acidosis. Oxford(UK): Blackwell Scientific; 1976.
16. Gladden LB. Lactate metabolism – a new paradigm for the third millennium.J Physiol 2004;558:5–30.
17. Handy J. Lactate—the bad boy of metabolism, or simply misunderstood? CurrAnaesth Crit Care 2006;17(1–2):71–6.
18. Levy B. Lactate and shock state: the metabolic view. Curr Opin Crit Care 2006;12(4):315–21.
19. Harris P, Bailey T, Bateman M, et al. Lactate, pyruvate, glucose, and free fattyacid in mixed venous and arterial blood. J Appl Physiol 1963;18:933–6.
20. Weil MH, Michaels S, Rackow EC. Comparison of blood lactate concentrationsin central venous, pulmonary artery, and arterial blood. Crit Care Med 1987;15:489–90.
21. Nimmo GR, Armstrong IR, Grant IS. Sampling site for blood lactate estimation:arterial or mixed venous? Clin Intensive Care 1993;4:8–9.
22. Brown SD, Clark C, Gutierrez G. Pulmonary lactate release in patients withsepsis and the adult respiratory distress syndrome. J Crit Care 1996;11:2–8.
23. Douzinas EE, Tsidemiadou PD, Pitaridis MT, et al. The regional production ofcytokines and lactate in sepsis-related multiple organ failure. Am J Respir CritCare Med 1997;155:53–9.
24. De Backer D, Creteur J, Zhang H, et al. Lactate production by the lungs in acutelung injury. Am J Respir Crit Care Med 1997;156(4 Pt 1):1099–104.
25. Haji-Michael PG, Ladriere L, Senerb A, et al. Leukocyte glycolysis and lactateoutput in animal sepsis and ex vive humanblood.Metabolism1999;48(6):779–85.
26. Mizock BA. Hyperlactatemia in acute liver failure: decreased clearance versusincreased production. Crit Care Med 2001;29(11):2225–6.
27. Bihari D,GimsonAE, Lindridge J, et al. Lactic acidosis in fulminant hepatic failure.Some aspects of pathogenesis and prognosis. J Hepatol 1985;1(4):405–16.
28. Levraut J, Ciebiera JP, Chave S, et al. Mild hyperlactatemia in stable septicpatients is due to impaired lactate clearance rather than overproduction. AmJ Respir Crit Care Med 1998;157:1021–6.
29. Revelly JP, Tappy L, Martinez A, et al. Lactate and glucose metabolism in severesepsis and cardiogenic shock. Crit Care Med 2005;33(10):2235–40.
30. Bellomo R. Bench-to-bedside review: lactate and the kidney. Crit Care 2002;6(4):322–6.
31. Biomarkers Definitions Working Group. Biomarkers and surrogate endpoints:preferred definitions and conceptual framework. Clin Pharmacol Ther 2001;69:89–95.
32. Marshall JC, Reinhart K, International Sepsis Forum. Biomarkers of sepsis. CritCare Med 2009;37(7):2290–8.
33. Cain SM. Appearance of excess lactate in anesthetized dogs during anemicand hypoxic hypoxia. Am J Physiol 1965;209:604–8.
34. Cain SM. Oxygen delivery and uptake in dogs during anemic and hypoxichypoxia. J Appl Physiol 1977;42:228–34.
35. Zhang H, Vincent JL. Oxygen extraction is altered by endotoxin duringtamponade-induced stagnant hypoxia in the dog. Circ Shock 1993;40(3):168–76.

Lactate: Biomarker and Potential Therapeutic Target 323
36. Meakins J, Long CN. Oxygen consumption, oxygen debt and lactic acid incirculatory failure. J Clin Invest 1927;4(2):273–93.
37. Ronco JJ, Fenwick JC, Tweeddale MG, et al. Identification of the critical oxygendelivery for anaerobic metabolism in critically ill septic and nonseptic humans.JAMA 1993;270(14):1724–30.
38. Levy B, Sadoune LO, Gelot AM, et al. Evolution of lactate/pyruvate and arterialketone body ratios in the early course of catecholamine-treated septic shock.Crit Care Med 2000;28(1):114–9.
39. Rivers E, Nguyen B, Havstad S, et al. Early goal-directed therapy in the treat-ment of severe sepsis and septic shock. N Engl J Med 2001;345(19):1368–77.
40. Rady MY, Rivers EP, Nowak RM. Resuscitation of the critically ill in the ED:responses of blood pressure, heart rate, shock index, central venous oxygensaturation, and lactate. Am J Emerg Med 1996;14:218–25.
41. Rixen D, Siegel JH. Bench-to-bedside review: oxygen debt and its metaboliccorrelates as quantifiers of the severity of hemorrhagic and post-traumaticshock. Crit Care 2005;9:441–53.
42. Meregalli A, Oliveira RP, Friedman G. Occult hypoperfusion is associated withincreased mortality in hemodynamically stable, high-risk, surgical patients.Crit Care 2004;8:R60–5.
43. Coats TJ, Smith JE, Lockey D, et al. Early increases in blood lactate followinginjury. J R Army Med Corps 2002;148:140–3.
44. Jansen TC, van Bommel J, Mulder PG, et al. The prognostic value of bloodlactate levels relative to that of vital signs in the pre-hospital setting: a pilot study.Crit Care 2008;12:R160.
45. Bakker J, Coffernils M, Leon M, et al. Blood lactate levels are superior tooxygen-derived variables in predicting outcome in human septic shock. Chest1991;99(4):956–62.
46. Bakker J, Gris P, Coffernils M, et al. Serial blood lactate levels can predict thedevelopment of multiple organ failure following septic shock. Am J Surg 1996;171(2):221–6.
47. Van Beest PA, Mulder PJ, Oetomo SB. Measurement of lactate in a prehospitalsetting is related to outcome. Eur J Emerg Med 2009;16(6):318–22.
48. Gunnerson KJ, Brant S, Greenfield N. Pre-hospital lactate levels are betterpredictors of mortality and hospital admission than traditional vital signs[abstract P84]. Circulation 2009;120:51459.
49. Trzeciak S, Dellinger RP, Chansky ME, et al. Serum lactate as a predictor ofmortality in patients with infection. Intensive Care Med 2007;33(6):970–7.
50. Shapiro NI, Howell MD, Talmor D, et al. Serum lactate as a predictor of mortalityin emergency department patients with infection. Ann Emerg Med 2005;45(5):524–8.
51. Shapiro NI, Howell MD, Donnino M, et al. Occult hypoperfusion and mortality inpatients with suspected infection. Intensive Care Med 2007;33(11):1892–9.
52. Mikkelsen ME, Miltiades AN, Gaieski DF, et al. Serum lactate is associated withmortality in severe sepsis independent of organ failure and shock. Crit CareMed 2009;37(5):1670–7.
53. Nguyen HB, Rivers EP, Knoblich BP, et al. Early lactate clearance is associatedwith improved outcome in severe sepsis and septic shock. Crit Care Med 2004;32:1637–42.
54. Pal JD, Victorino GP, Twomey P, et al. Admission serum lactate levels do notpredict mortality in the acutely injured patient. J Trauma 2006;60:583–7 [discus-sion: 587–9].
Okorie & Dellinger324
55. Dunne JR, Tracy JK, Scalea TM, et al. Lactate and base deficit in trauma: doesalcohol or drug use impair their predictive accuracy? J Trauma 2005;58:959–66.
56. Kaplan LJ, Kellum JA. Initial pH, base deficit, lactate, anion gap, strong iondifference, and strong ion gap predict outcome from major vascular injury.Crit Care Med 2004;32:1120–4.
57. Kliegel A, Losert H, Sterz F, et al. Serial lactate determinations for prediction ofoutcome after cardiac arrest. Medicine 2004;83:274–9.
58. Sankoff JD, Goyal M, Gaieski DF, et al. Validation of the Mortality in EmergencyDepartment Sepsis (MEDS) score in patients with the systemic inflammatoryresponse syndrome (SIRS). Crit Care Med 2008;36:421–6.
59. Jansen TC, van Bommel J, Schoonderbeek FJ, et al. Early lactate-guidedtherapy in ICU patients: a multicenter, open-label, randomized controlled trial.Am J Respir Crit Care Med 2010;182(6):752–61.
60. Scott S, Antonaglia V, Guiotto G, et al. Two-hour lactate clearance predictsnegative outcome in patients with cardiorespiratory insufficiency. Crit CareRes Pract 2010;2010. Article ID 917053.
61. Friedman G, Berlot G, Kahn RJ, et al. Combined measurements of blood lactateconcentrations and gastric intramucosal pH in patients with severe sepsis. CritCare Med 1995;23:1184–93.
62. Tamion F, Le Cam-Duchez V, Menard JF, et al. Erythropoietin and renin as bio-logical markers in critically ill patients. Crit Care 2004;8(5):R328–35.
63. Dondorp AM, Chau TT, Phu NH, et al. Unidentified acids of strong prognosticsignificance in severe malaria. Crit Care Med 2004;32:1683–8.
64. Singhal R, Coghill JE, Guy A, et al. Serum lactate and base deficit as predictorsof mortality after ruptured abdominal aortic aneurysm repair. Eur J Vasc Endo-vasc Surg 2005;30:263–6.
65. Maillet JM, Le Besnerais P, Cantoni M, et al. Frequency, risk factors,and outcome of hyperlactatemia after cardiac surgery. Chest 2003;123:1361–6.
66. Abramson D, Scalea TM, Hitchcock R, et al. Lactate clearance and survivalfollowing injury. J Trauma 1993;35:584–8.
67. Martin MJ, FitzSullivan E, Salim A, et al. Discordance between lactate and basedeficit in the surgical intensive care unit: which one do you trust? Am J Surg2006;191:625–30.
68. Blow O, Magliore L, Claridge JA, et al. The golden hour and the silver day:detection and correction of occult hypoperfusion within 24 hours improvesoutcome from major trauma. J Trauma 1999;47:964–9.
69. Claridge JA, Crabtree TD, Pelletier SJ, et al. Persistent occult hypoperfusion isassociated with a significant increase in infection rate and mortality in majortrauma patients. J Trauma 2000;48:8–14 [discussion: 14–5].
70. Wahl W, Pelletier K, Schmidtmann S, et al. [Experiences with various scores inevaluating the prognosis of postoperative intensive care patients]. Chirurg1996;67:710–7 [discussion: 718] [in German].
71. Murillo-Cabezas F, Amaya-Villar R, Rincon-Ferrari MD, et al. [Evidence of occultsystemic hypoperfusion in head injured patients]. Preliminary study. Neurociru-gia (Astur) 2005;16:323–32 [in Spanish].
72. Bernal W, Donaldson N, Wyncoll D, et al. Blood lactate as an early predictor ofoutcome in paracetamol-induced acute liver failure: a cohort study. Lancet2002;359:558–63.
73. Watanabe I, Mayumi T, Arishima T, et al. Hyperlactemia can predict the prog-nosis of liver resection. Shock 2007;28:35–8.
Lactate: Biomarker and Potential Therapeutic Target 325
74. Funk GC, Doberer D, Kneidinger N, et al. Acid-base disturbances in critically illpatients with cirrhosis. Liver Int 2007;27:901–9.
75. Kruse JA, Zaidi SA, Carlson RW. Significance of blood lactate levels in criticallyill patients with liver disease. Am J Med 1987;83:77–82.
76. Smith I, Kumar P, Molloy S, et al. Base excess and lactate as prognostic indi-cators for patients admitted to intensive care. Intensive Care Med 2001;27:74–83.
77. Suistomaa M, Ruokonen E, Kari A, et al. Time-pattern of lactate and lactate topyruvate ratio in the first 24 hours of intensive care emergency admissions.Shock 2000;14:8–12.
78. Freire AX, Bridges L, Umpierrez GE, et al. Admission hyperglycemia and otherrisk factors as predictors of hospital mortality in a medical ICU population. Chest2005;128:3109–16.
79. Cusack RJ, Rhodes A, Lochhead P, et al. The strong ion gap does not haveprognostic value in critically ill patients in a mixed medical/surgical adult ICU.Intensive Care Med 2002;28:864–9.
80. Rocktaeschel J, Morimatsu H, Uchino S, et al. Unmeasured anions in critically illpatients: can they predict mortality? Crit Care Med 2003;31:2131–6.
81. Marik PE, Bankov A. Sublingual capnometry versus traditional markers of tissueoxygenation in critically ill patients. Crit Care Med 2003;31:818–22.
82. Maynard N, Bihari D, Beale R, et al. Assessment of splanchnic oxygenation bygastric tonometry in patients with acute circulatory failure. JAMA 1993;270:1203–10.
83. Dubin A, Menises MM, Masevicius FD, et al. Comparison of three differentmethods of evaluation of metabolic acid-base disorders. Crit Care Med 2007;35:1264–70.
84. Aduen J, Bernstein WK, Khastgir T, et al. The use and clinical importance ofa substrate-specific electrode for rapid determination of blood lactate concen-trations. JAMA 1994;272:1678–85.
85. Levy B, Gawalkiewicz P, Vallet B, et al. Gastric capnometry with air-automatedtonometry predicts outcome in critically ill patients. Crit Care Med 2003;31:474–80.
86. Sasaki S, Gando S, Kobayashi S, et al. Predictors of mortality in patients treatedwith continuous hemodiafiltration for acute renal failure in an intensive caresetting. ASAIO J 2001;47:86–91.
87. Hatherill M, McIntyre AG, Wattie M, et al. Early hyperlactataemia in critically illchildren. Intensive Care Med 2000;26:314–8.
88. Hatherill M, Sajjanhar T, Tibby SM, et al. Serum lactate as a predictor of mortalityafter paediatric cardiac surgery. Arch Dis Child 1997;77:235–8.
89. Hatherill M, Waggie Z, Purves L, et al. Mortality and the nature of metabolicacidosis in children with shock. Intensive Care Med 2003;29:286–91.
90. Garcia Sanz C, Ruperez Lucas M, Lopez-Herce Cid J, et al. [Prognostic value ofthe pediatric index of mortality (PIM) score and lactate values in critically-ill chil-dren]. An Esp Pediatr 2002;57:394–400 [in Spanish].
91. Balasubramanyan N, Havens PL, Hoffman GM. Unmeasured anions identifiedby the Fencl-Stewart method predict mortality better than base excess, aniongap, and lactate in patients in the pediatric intensive care unit. Crit Care Med1999;27:1577–81.
92. Shime N, Ashida H, Hiramatsu N, et al. Arterial ketone body ratio for the assess-ment of the severity of illness in pediatric patients following cardiac surgery.J Crit Care 2001;16:102–7.
Okorie & Dellinger326
93. Koliski A, Cat I, Giraldi DJ, et al. Blood lactate concentration as prognosticmarker in critically ill children. J Pediatr (Rio J) 2005;81:287–92.
94. Gotay-Cruz F, Aviles-Rivera DH, Fernandez-Sein A. Lactic acid levels as a prog-nostic measure in acutely ill patients. P R Health Sci J 1991;10:9–13.
95. Cheung PY, Chui N, Joffe AR, et al. Postoperative lactate concentrations predictthe outcome of infants aged 6 weeks or less after intracardiac surgery: a cohortfollow-up to 18 months. J Thorac Cardiovasc Surg 2005;130:837–43.
96. Cheung PY, Etches PC, Weardon M, et al. Use of plasma lactate to predict earlymortality and adverse outcome after neonatal extracorporeal membraneoxygenation: a prospective cohort in early childhood. Crit Care Med 2002;30:2135–9.
97. Durward A, Tibby SM, Skellett S, et al. The strong ion gap predicts mortality inchildren following cardiopulmonary bypass surgery. Pediatr Crit Care Med2005;6:281–5.
98. Jansen TC, van Bommel J, Woodward R, et al. Association between bloodlactate levels, Sequential Organ Failure Assessment subscores and 28-daymortality during early and late ICU stay: a retrospective observational study.Crit Care Med 2009;37(8):2369–74.
99. Jansen TC, van Bommel J, Mulder PG, et al. Prognostic value of blood lactatelevels: does the clinical diagnosis at admission matter? J Trauma 2009;66(2):377–85.
100. Rossi AF, Khan DM, Hannan R, et al. Goal directed medical therapy and point-of-care testing improve outcomes after congenital heart surgery. Intensive CareMed 2005;31:98–104.
101. Arnold RC, Shapiro NI, Jones AE, et al. Multicenter study of early lactate clear-ance as a determinant of survival in patients with presumed sepsis. Shock 2009;32(1):35–9.
102. Jones AE, Shapiro NI, Trzeciak S, et al. Lactate clearance vs central venousoxygen saturation as goals of early sepsis therapy. JAMA 2010;303(8):739–46.