2011 left behind- unequal opportunity in higher ed
TRANSCRIPT
8/3/2019 2011 Left Behind- Unequal Opportunity in Higher Ed
http://slidepdf.com/reader/full/2011-left-behind-unequal-opportunity-in-higher-ed 1/14

8/3/2019 2011 Left Behind- Unequal Opportunity in Higher Ed
http://slidepdf.com/reader/full/2011-left-behind-unequal-opportunity-in-higher-ed 2/14
Left Behind
Unequal Opportunity in Higher Education
The 1965 Higher Education Act, which is slated to be reauthorized later this year,
has sought to ensure that no student would be denied a college education because
of his or her financial condition. President Lyndon B. Johnson set out the ambitious
goal that “a high school student anywhere in this great land of ours can apply to
any college or any university in any of the fifty states and not be turned away
because his family is poor.”1
Today, almost forty years later, America has failed to make good on that promise of
equal opportunity. The benefits of having a college education are greater than ever,
but low-income students continue to lag in three major areas: their college enroll-
ment rates are low; their degree completion rates are low; and their enrollment and
graduation rates from selective colleges are particularly low.
The Benefits of College Are Greater than Ever
The fact that greater educational attainment brings significant financial rewards is
truer today than ever, as Figure 1 shows (see page 2). While it was an advantage to
have more education in the mid-1970s, the premium associated with educational
attainment has grown significantly over time.
R e a l i t y
C h e c k
1. Lyndon Baines Johnson, quoted in A. Clayton Spencer, “Policy Priorities and Political Realities,” inDonald E. Heller, ed., Condition of Access: Higher Education for Lower Income Students (Westport,Conn.: American Council on Education and Praeger Publishers, 2002), p. 166.

8/3/2019 2011 Left Behind- Unequal Opportunity in Higher Ed
http://slidepdf.com/reader/full/2011-left-behind-unequal-opportunity-in-higher-ed 3/14
The income for high school graduates
between 1975 and 1999 was flat, while the
income of those with bachelor’s degrees rose
substantially and the income of those withadvanced degrees skyrocketed.
Which college a student attends also matters.
While community colleges are advertised as
gateways to four-year colleges, less than one-
tenth of community college students
ultimately receive a bachelor’s degree. Among
the universe of four-year colleges, attending
a top-tier institution provides recipients with
a wage premium of 5 percent to 20 percent,
representing the value added from attending
a competitive school (controlling for initial
ability). Even studies that find a small wage
premium on average show that low-income
students gain disproportionately fromattending more selective schools.
2
10,000
20,000
30,000
40,000
50,000
60,000
70,000
80,000
Advanced degree
Bachelor’s degree
Some college/associate’s degree
High school graduate
Not a high school graduate
C o n s t a n t d o l l a r s
1 9 9
9
1 9 9 5
1 9 9
0
1 9 8
5
1 9 8 0
1 9 7 5
Source: U.S. Census Bureau Web site, www.census.gov/population/socdemo/education/tableA-3.txt.
Figure 1. Income by Educational Attainmentfor Persons Eighteen Years Old and Over,
1975 to 1999 (Inflation Adjusted for 2001)
8/3/2019 2011 Left Behind- Unequal Opportunity in Higher Ed
http://slidepdf.com/reader/full/2011-left-behind-unequal-opportunity-in-higher-ed 4/14
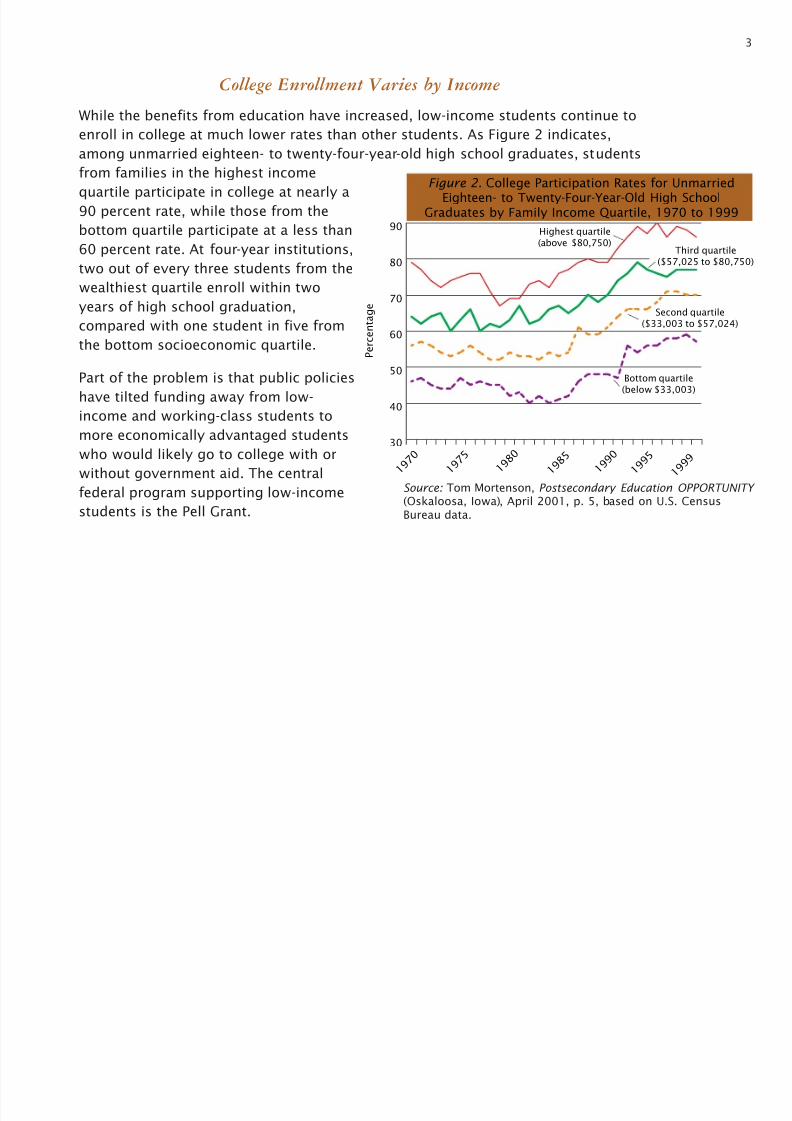
College Enrollment Varies by Income
While the benefits from education have increased, low-income students continue to
enroll in college at much lower rates than other students. As Figure 2 indicates,among unmarried eighteen- to twenty-four-year-old high school graduates, students
from families in the highest income
quartile participate in college at nearly a
90 percent rate, while those from the
bottom quartile participate at a less than
60 percent rate. At four-year institutions,
two out of every three students from the
wealthiest quartile enroll within two
years of high school graduation,
compared with one student in five from
the bottom socioeconomic quartile.
Part of the problem is that public policies
have tilted funding away from low-
income and working-class students tomore economically advantaged students
who would likely go to college with or
without government aid. The central
federal program supporting low-income
students is the Pell Grant.
3
30
40
50
60
70
80
90Highest quartile(above $80,750)
Third quartile($57,025 to $80,750)
Second quartile($33,003 to $57,024)
Bottom quartile(below $33,003)
1 9 9 9
1 9 9 5
1 9 9 0
1 9 8 5
1 9 8 0
1 9 7
5
1 9 7 0
P e r c e n t a g e
Source: Tom Mortenson, Postsecondary Education OPPORTUNITY (Oskaloosa, Iowa), April 2001, p. 5, based on U.S. CensusBureau data.
Figure 2. College Participation Rates for UnmarriedEighteen- to Twenty-Four-Year-Old High School
Graduates by Family Income Quartile, 1970 to 1999

8/3/2019 2011 Left Behind- Unequal Opportunity in Higher Ed
http://slidepdf.com/reader/full/2011-left-behind-unequal-opportunity-in-higher-ed 5/14
Some 90 percent of benefits for dependent Pell Grant recipients go to families with
incomes below $41,000.2 And yet, federal policies have allowed the purchasing
power of the maximum Pell Grant to fall precipitously from 1970s levels, as Figure
3 demonstrates.
In the mid-1970s, the maximum Pell
Grant for low-income and working-class
families covered nearly 40 percent of the
average cost of attending a four-year
private college; now it covers about 15
percent. Among public four-year
colleges, the maximum Pell Grant
covered nearly 60 percent of total costs
in the mid-1980s, but it covers only
about 40 percent today.
4
0
10
20
30
40
50
60
70
80
90
Private four-year institution
Public four-year institution
0 0 – 0 1
9 8 – 9 9
9 3 – 9 4
8 8 – 8 9
8 3 – 8 4
7 8 – 7 9
7 3 – 7 4
P e r c e n t a g e 50% cap on costs
60% cap on costs
Note: Until 1986, the Higher Education Act limited the Pell Grantaward to no more than 50 percent of a student’s cost of attendance.That limit was increased to 60 percent from 1986 to 1992, andthereafter it was removed altogether.
Source: The College Board, Trends in Student Aid 2001 (New York:College Board, 2001), p. 13.
Figure 3. The Maximum Pell Grant as a Share of Cost of Attendance, 1973–74 to 2000–2001
2. Donald E. Heller, “Pell Grant Recipients inSelective Colleges and Universities,”Appendix, in Richard D. Kahlenberg, ed.,America’s Untapped Resource: Low-IncomeStudents in Higher Education (New York:Century Foundation Press, 2004), p. 159.

8/3/2019 2011 Left Behind- Unequal Opportunity in Higher Ed
http://slidepdf.com/reader/full/2011-left-behind-unequal-opportunity-in-higher-ed 6/14
Increasingly, federal resources have
shifted away from grants for the poor to
loans often benefiting the middle and
upper-middle class. Whereas twentyyears ago the federal mix was 55
percent grants and 41 percent loans,
today the reverse holds true, with loans
accounting for 58 percent and grants 41
percent (see Figure 4). Because only
about one-quarter of Americans hold a
bachelor’s degree, the subsidy providedto upper-middle-class students who
could otherwise afford to attend college
essentially constitutes a transfer of
wealth from the general public to a
small elite.
5
35
40
45
50
55
60
65
Loans, 58%
Grants, 41%
0 0 – 0 1
9 8 – 9 9
9 6 – 9 7
9 4 – 9 5
9 2 – 9 3
9 0 – 9 1
8 8 – 8 9
8 6 – 8 7
8 4 – 8 5
8 2 – 8 3
8 0 – 8 1
P e r c e n t a g e
Source: The College Board, Trends in Student Aid 2001 (NewYork: College Board, 2001), p. 13.
Figure 4. Percentage Share of Grants vs. Loans,1980–81 to 2000–2001

8/3/2019 2011 Left Behind- Unequal Opportunity in Higher Ed
http://slidepdf.com/reader/full/2011-left-behind-unequal-opportunity-in-higher-ed 7/14
Pell funding, which was once thought of as the mainstay of aid policy, has been
dwarfed by other, less-targeted forms of aid. Federal education tax breaks, which
benefit mostly the middle and upper-middle class, have ballooned in the past
decade to an $11 billion entitlement, now on a par with the entire Pell Grantprogram. Meanwhile, state subsidies to higher education, which keep tuition low for
all students, poor and middle class alike, total more than $50 billion (see Figure 5).
Loans stand at roughly $40 billion, though
most are repaid and the annual cost to the
government is roughly $2 billion.3
Meanwhile, colleges are beginning to act less
like nonprofit educational institutions and
more like market players, using financial aid
as a way of attracting talented students
away from competitors rather than as a
method of helping those who need it most.
6
0
10
20
30
40
50
60
S
p e n d i n g
i n
b i l l i o n s
o f d o l l a r s
State tuitionsubsidies
Federal educationtax breaks
PellGrants
$11 billion $11 billion
$56 billion
Source: Richard D. Kahlenberg, ed., America’s Untapped
Resource: Low-Income Students in Higher Education (New
York: Century Foundation Press, 2004), pp. xv, 57, 85,
177n4.
Figure 5. Major Spending on Higher Education
3. Kahlenberg, America’s Untapped Resource,pp. xv, 56.

8/3/2019 2011 Left Behind- Unequal Opportunity in Higher Ed
http://slidepdf.com/reader/full/2011-left-behind-unequal-opportunity-in-higher-ed 8/14
College Completion Varies by Income
While low-income students are less likely to enroll in college, those who do manage
to do so are less likely to graduate than their middle-class peers. As Figure 6indicates, low-income and minority students are considerably less likely to receive
a bachelor’s degree or higher five years after entering college than wealthy and
non-Hispanic white students.
The low completion rates of low-
income students reflect in
significant measure lower levels
of academic preparation. Low-income students are less likely on
average to receive a high quality
K–12 education, and the two
federal programs that seek to
improve the academic preparation
and persistence of low-income
students in secondary and tertiaryeducation—Trio and Gaining Early
Awareness and Readiness for
Undergraduate Programs (GEAR-
UP)—receive little financial
support. Trio—which since 1965
has established higher education
7
0
10
20
30
40
50
White, non-Hispanic
HispanicBlack, non-Hispanic
Highestquartile
Middlequartiles
Lowestquartile
Socioeconomic status Race/ethnicity
P e r c e n t
Source: National Center for Education Statistics, Descriptive Summary of 1989–90 Beginning Postsecondary Students: 5 Years Later (Washington,D.C.: U.S. Department of Education, May 1996), Table 1.3, p. 34.
Figure 6. Percentage of 1989 Beginning PostsecondaryStudents Who Received a Bachelor’s Degree or Higher
as of 1994, by Socioeconomic Status and Race/Ethnicity

8/3/2019 2011 Left Behind- Unequal Opportunity in Higher Ed
http://slidepdf.com/reader/full/2011-left-behind-unequal-opportunity-in-higher-ed 9/14
information centers in poor communities,
identified talented low-income high school
students, and provided mentoring and advice—
remains a demonstration project, reaching only10 percent of those eligible.4 As Figure 7
shows, GEAR-UP, which since 1998 has sought
to build on the Trio idea to create mentoring
and tutoring partnerships between colleges
and businesses and middle schools with high
rates of poverty, receives less than 5 percent of
the resources devoted to the Pell program—which itself is underfunded.5
Spending on Trio and GEAR-UP combined totals
about $1 billion, compared with the $11 billion
that is devoted to Pell Grants.
8
0
2
4
6
8
10
12
F e d e r
a l s p e n d i n g
i n
b i l l i o n s
o f d o
l l a r s
Pellspending
Trio and GEAR-UPspending
(collectively)
Source: Richard D. Kahlenberg, ed., America’s Untapped Resource: Low-Income Students in Higher Education (New York: Century Foundation Press,2004), pp. 83, 177n4.
Figure 7. Funding of Academic Support vs.Financial Aid for Low-Income Students
Types of support for low-income students
4. Ibid., p. 81.
5. Ibid., pp. 64, 177n4.
8/3/2019 2011 Left Behind- Unequal Opportunity in Higher Ed
http://slidepdf.com/reader/full/2011-left-behind-unequal-opportunity-in-higher-ed 10/14
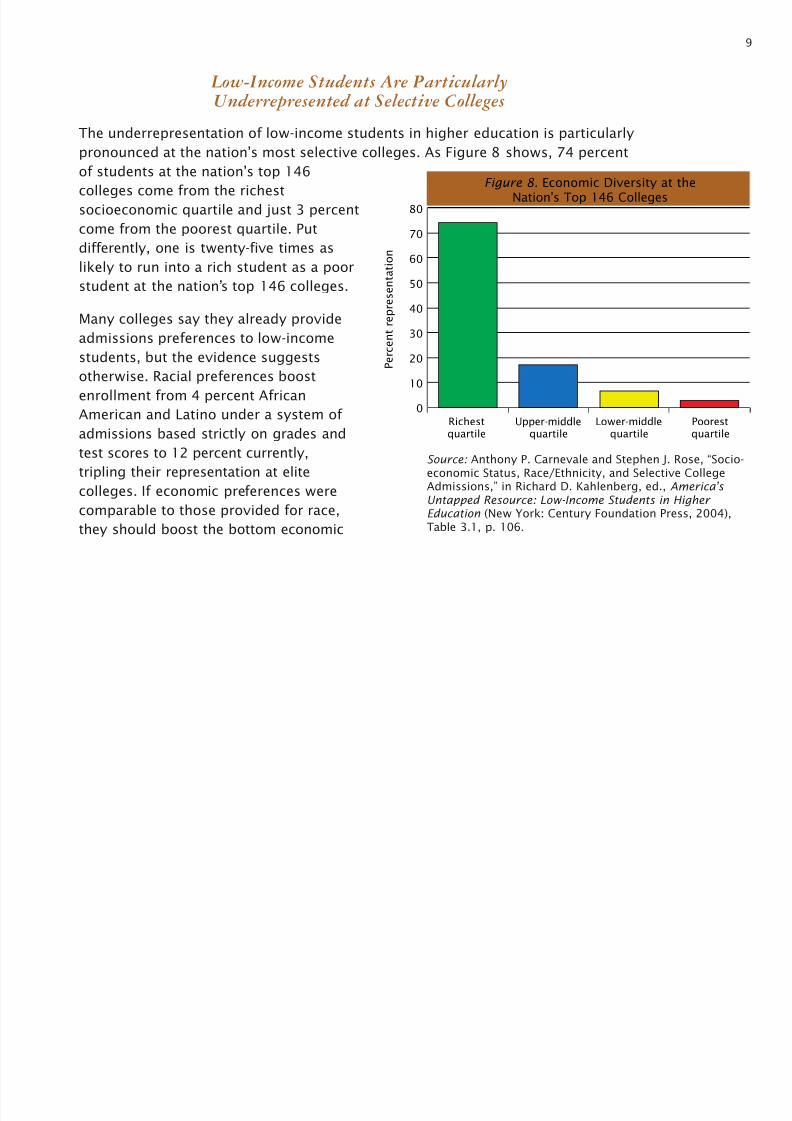
Low-Income Students Are ParticularlyUnderrepresented at Selective Colleges
The underrepresentation of low-income students in higher education is particularlypronounced at the nation’s most selective colleges. As Figure 8 shows, 74 percent
of students at the nation’s top 146
colleges come from the richest
socioeconomic quartile and just 3 percent
come from the poorest quartile. Put
differently, one is twenty-five times as
likely to run into a rich student as a poor
student at the nation’s top 146 colleges.
Many colleges say they already provide
admissions preferences to low-income
students, but the evidence suggests
otherwise. Racial preferences boost
enrollment from 4 percent African
American and Latino under a system of admissions based strictly on grades and
test scores to 12 percent currently,
tripling their representation at elite
colleges. If economic preferences were
comparable to those provided for race,
they should boost the bottom economic
9
0
10
20
30
40
50
60
70
80
P e r c e n t r e p r e s e n t a t i o n
Richestquartile
Upper-middlequartile
Lower-middlequartile
Poorestquartile
Figure 8. Economic Diversity at theNation’s Top 146 Colleges
Source: Anthony P. Carnevale and Stephen J. Rose, “Socio-economic Status, Race/Ethnicity, and Selective CollegeAdmissions,” in Richard D. Kahlenberg, ed., America’s Untapped Resource: Low-Income Students in Higher Education (New York: Century Foundation Press, 2004),Table 3.1, p. 106.
8/3/2019 2011 Left Behind- Unequal Opportunity in Higher Ed
http://slidepdf.com/reader/full/2011-left-behind-unequal-opportunity-in-higher-ed 11/14
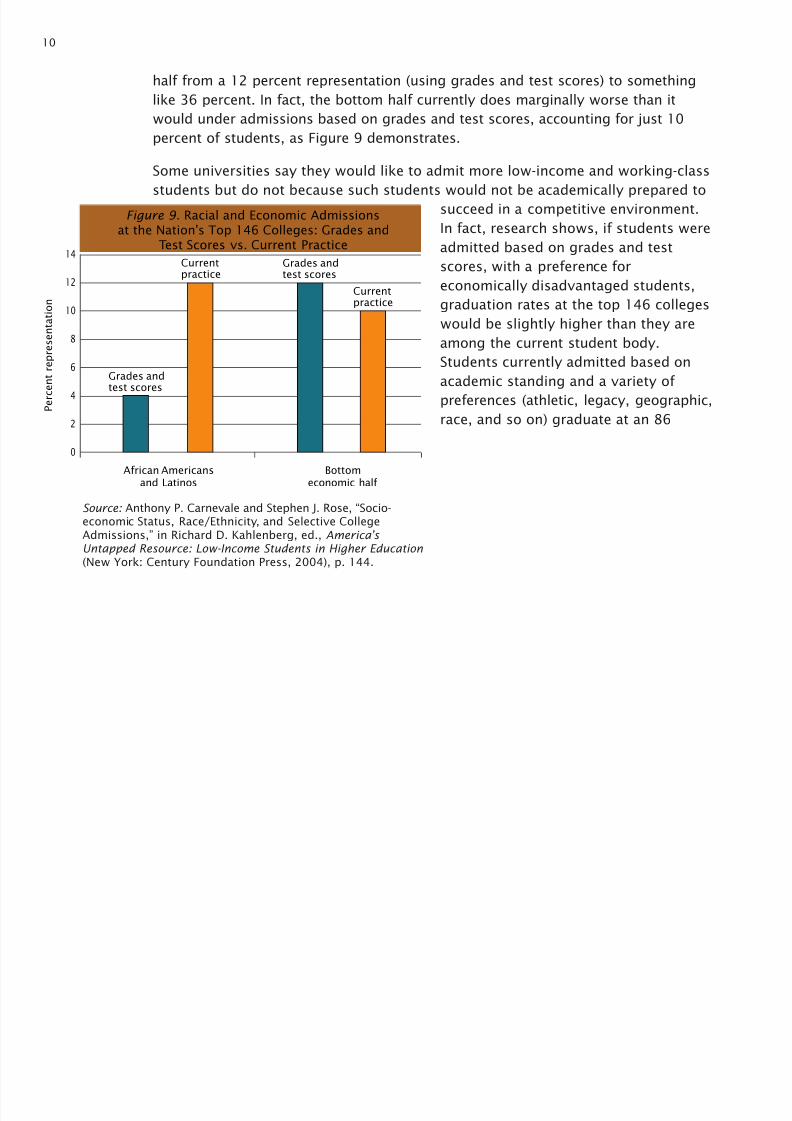
half from a 12 percent representation (using grades and test scores) to something
like 36 percent. In fact, the bottom half currently does marginally worse than it
would under admissions based on grades and test scores, accounting for just 10
percent of students, as Figure 9 demonstrates.
Some universities say they would like to admit more low-income and working-class
students but do not because such students would not be academically prepared to
succeed in a competitive environment.
In fact, research shows, if students were
admitted based on grades and test
scores, with a preference for
economically disadvantaged students,
graduation rates at the top 146 colleges
would be slightly higher than they are
among the current student body.
Students currently admitted based on
academic standing and a variety of
preferences (athletic, legacy, geographic,
race, and so on) graduate at an 86
10
0
2
4
6
8
10
12
14Current
practiceCurrentpractice
Grades andtest scores
Grades and
test scores
Bottomeconomic half
African Americansand Latinos
P e r c e n t r e p r e s e n t a t i o n
Source: Anthony P. Carnevale and Stephen J. Rose, “Socio-economic Status, Race/Ethnicity, and Selective CollegeAdmissions,” in Richard D. Kahlenberg, ed., America’s
Untapped Resource: Low-Income Students in Higher Education(New York: Century Foundation Press, 2004), p. 144.
Figure 9. Racial and Economic Admissionsat the Nation’s Top 146 Colleges: Grades and
Test Scores vs. Current Practice
8/3/2019 2011 Left Behind- Unequal Opportunity in Higher Ed
http://slidepdf.com/reader/full/2011-left-behind-unequal-opportunity-in-higher-ed 12/14
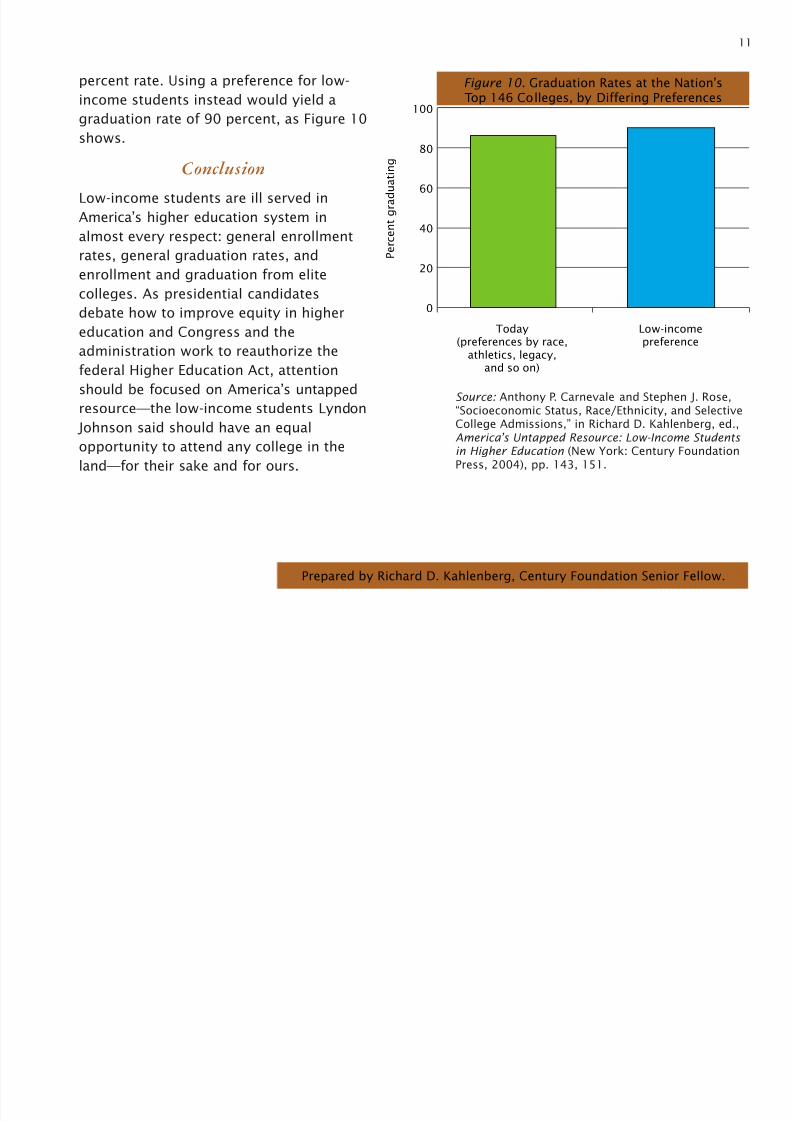
percent rate. Using a preference for low-
income students instead would yield a
graduation rate of 90 percent, as Figure 10
shows.
Conclusion
Low-income students are ill served in
America’s higher education system in
almost every respect: general enrollment
rates, general graduation rates, and
enrollment and graduation from elitecolleges. As presidential candidates
debate how to improve equity in higher
education and Congress and the
administration work to reauthorize the
federal Higher Education Act, attention
should be focused on America’s untapped
resource—the low-income students Lyndon Johnson said should have an equal
opportunity to attend any college in the
land—for their sake and for ours.
11
0
20
40
60
80
100
Low-incomepreference
Today(preferences by race,
athletics, legacy,and so on)
P e r c e n t g r a d u a t i n g
Source: Anthony P. Carnevale and Stephen J. Rose,
“Socioeconomic Status, Race/Ethnicity, and SelectiveCollege Admissions,” in Richard D. Kahlenberg, ed.,America’s Untapped Resource: Low-Income Students in Higher Education (New York: Century FoundationPress, 2004), pp. 143, 151.
Figure 10. Graduation Rates at the Nation’sTop 146 Colleges, by Differing Preferences
Prepared by Richard D. Kahlenberg, Century Foundation Senior Fellow.

8/3/2019 2011 Left Behind- Unequal Opportunity in Higher Ed
http://slidepdf.com/reader/full/2011-left-behind-unequal-opportunity-in-higher-ed 13/14
For more information on this topic and others,please visit our Web site at
http://www.tcf.org
THECENTURY FOUNDATION
HEADQUARTERS:41 East 70th Street
New York, New York 10021212-535-4441
WASHINGTON, D.C., OFFICE:
1755 Massachusetts Avenue, N.W.
Washington, D.C. 20036202-387-0400
Manufactured in the United States of America.
Copyright © 2004 by The Century Foundation, Inc. All rights reserved. No part of this publication
may be reproduced, stored in a retrieval system, or transmitted, in any form or by any means,
electronic, mechanical, photocopying, recording, or otherwise, without the prior written permissionof The Century Foundation.
Cover design and illustration: Claude Goodwin

8/3/2019 2011 Left Behind- Unequal Opportunity in Higher Ed
http://slidepdf.com/reader/full/2011-left-behind-unequal-opportunity-in-higher-ed 14/14