2011 montreal conference abstract book
TRANSCRIPT

8/13/2019 2011 Montreal Conference Abstract Book
http://slidepdf.com/reader/full/2011-montreal-conference-abstract-book 1/166

8/13/2019 2011 Montreal Conference Abstract Book
http://slidepdf.com/reader/full/2011-montreal-conference-abstract-book 2/166

8/13/2019 2011 Montreal Conference Abstract Book
http://slidepdf.com/reader/full/2011-montreal-conference-abstract-book 3/166
Table of ContentsScientific Committee . . . . . . . . . . . . . . . . . . . . . . . . . . . . . . . . . . . . . . . . . . . . . iii
Local Organizing Committee . . . . . . . . . . . . . . . . . . . . . . . . . . . . . . . . . . . . . .iii
Conference Office . . . . . . . . . . . . . . . . . . . . . . . . . . . . . . . . . . . . . . . . . . . . . . iv
Organization . . . . . . . . . . . . . . . . . . . . . . . . . . . . . . . . . . . . . . . . . . . . . . . . . . iv
General Information . . . . . . . . . . . . . . . . . . . . . . . . . . . . . . . . . . . . . . . . . . . . vi
Your Hosts . . . . . . . . . . . . . . . . . . . . . . . . . . . . . . . . . . . . . . . . . . . . . . . . . . . .viii
Sponsors . . . . . . . . . . . . . . . . . . . . . . . . . . . . . . . . . . . . . . . . . . . . . . . . . . . . .ix
Exhibitor and Friend of the Conference . . . . . . . . . . . . . . . . . . . . . . . . . . . . . .ix
Delegate Bags, Name Badges and Welcome Reception Sponsor . . . . . . . . . . x
Conference Supporter . . . . . . . . . . . . . . . . . . . . . . . . . . . . . . . . . . . . . . . . . . .xi
Floor Plan . . . . . . . . . . . . . . . . . . . . . . . . . . . . . . . . . . . . . . . . . . . . . . . . . . . . xiiProgram . . . . . . . . . . . . . . . . . . . . . . . . . . . . . . . . . . . . . . . . . . . . . . . . . . . . . . . 1
Posters . . . . . . . . . . . . . . . . . . . . . . . . . . . . . . . . . . . . . . . . . . . . . . . . . . . . . . 16
Pre-Conference Workshops . . . . . . . . . . . . . . . . . . . . . . . . . . . . . . . . . . . . . . 17Workshop A . . . . . . . . . . . . . . . . . . . . . . . . . . . . . . . . . . . . . . . . . . . . . . . . 17Workshop B . . . . . . . . . . . . . . . . . . . . . . . . . . . . . . . . . . . . . . . . . . . . . . . . 18Workshop C . . . . . . . . . . . . . . . . . . . . . . . . . . . . . . . . . . . . . . . . . . . . . . . . 18Workshop D . . . . . . . . . . . . . . . . . . . . . . . . . . . . . . . . . . . . . . . . . . . . . . . . 19Workshop E . . . . . . . . . . . . . . . . . . . . . . . . . . . . . . . . . . . . . . . . . . . . . . . . 20Workshop F . . . . . . . . . . . . . . . . . . . . . . . . . . . . . . . . . . . . . . . . . . . . . . . . 21Workshop G . . . . . . . . . . . . . . . . . . . . . . . . . . . . . . . . . . . . . . . . . . . . . . . . 21Workshop H . . . . . . . . . . . . . . . . . . . . . . . . . . . . . . . . . . . . . . . . . . . . . . . . 22
Abstracts . . . . . . . . . . . . . . . . . . . . . . . . . . . . . . . . . . . . . . . . . . . . . . . . . . . . . 23Thursday, October 20, 2011 . . . . . . . . . . . . . . . . . . . . . . . . . . . . . . . . . . . 23Friday, October 21, 2011 . . . . . . . . . . . . . . . . . . . . . . . . . . . . . . . . . . . . . . 51Saturday, October 22, 2011 . . . . . . . . . . . . . . . . . . . . . . . . . . . . . . . . . . . . 92
PCSI Conference 2011 Timetable . . . . . . . . . . . . . . . . . . . . . . . . . . . . . . . . . 141
Notes . . . . . . . . . . . . . . . . . . . . . . . . . . . . . . . . . . . . . . . . . . . . . . . . . . . . . . . 143

8/13/2019 2011 Montreal Conference Abstract Book
http://slidepdf.com/reader/full/2011-montreal-conference-abstract-book 4/166

8/13/2019 2011 Montreal Conference Abstract Book
http://slidepdf.com/reader/full/2011-montreal-conference-abstract-book 5/166
Each patient counts
2 7 t h P C S I C o n f e r e n c e | O c t o b e r 1 9 t o 2 2 , 2 0 1 1 | M o n t r é a l , Q u e b e c , C a n a d a
Scientific CommitteeJason Sutherland (Canada)
Poul Erik Hansen (Denmark)Dana Burdja (Romania)
Virginia Jordan (United Kingdom)
Jean Marie Rodrigues (France)
Brian McCarthy (Ireland)
Kriistina Kahur (Estonia)
Ceu Mateus (Portugal)
Olafr Steinum (Sweden)
Stephen Sutch (United Kingdom)
Martii Virtanen (Finland)Jiro Okocki (Japan)
Brian Ruff (South Africa)
Michel Wilke (Germany)
Darren Gerson (Canada)
Jeff Hatcher (Canada)
Paula Monteith (United Kingdom)
Local Organizing CommitteePoul Erik Hansen (PCSI)
Dana Burdja (PCSI)
Jason Sutherland (PCSI)
Darren Gerson (Chair) (CIHI)
Jeff Hatcher (CIHI)
Douglas Yeo (CIHI)
Claude Lemay (CIHI)
Julie Bazerly (CIHI)
Kent Maclean (CIHI)
Kim Mumford (CIHI)
Joanna Filion (CIHI)
Sandra Mitchell (CIHI)
8/13/2019 2011 Montreal Conference Abstract Book
http://slidepdf.com/reader/full/2011-montreal-conference-abstract-book 6/166iv
= ( WX ′ – – WY
β = ( WX ′ ) – XWY
= β + ε
= + ε
= + εQ75+ .5 x (Q.
5- Q
25
Q75 1.5 (Q
75 -
25)
2 7 t h P C S I C o n f e r e n c e | O c t o b e r 1 9 t o 2 2 , 2 0 1 1 | M o n t r é a l , Q u e b e c , C a n a d a
Each patient counts
Conference OfficeCIHI Ottawa495 Richmond Road, Suite 600
Ottawa, Ontario K2A 4H6Phone: 613-241-7860Fax: [email protected]
OrganizationPatient Classification Systems InternationalSSPIM-Bâtiment CIM 42CHU de St Etienne
Chemin de la Marandière42055 Saint Etienne Cedex 2Francewww.pcsinternational.org

8/13/2019 2011 Montreal Conference Abstract Book
http://slidepdf.com/reader/full/2011-montreal-conference-abstract-book 7/166
Each patient counts
2 7 t h P C S I C o n f e r e n c e | O c t o b e r 1 9 t o 2 2 , 2 0 1 1 | M o n t r é a l , Q u e b e c , C a n a d a
Dear Colleagues:
On behalf of the local organizing committee, we would like to welcomeyou to Montréal, Quebec, Canada, for the 27th annual Patient Classification SystemsInternational (PCSI) Conference. This is the first time the PCSI Conference will be
held in Canada, and we are excited to be hosting all of you in beautiful Montréal.
Montréal is the perfect location for this year’s conference, as the merging of historicOld Montréal with the modern downtown metropolis is a perfect symbol of the themeand topics that will be discussed. Under the banner Each Patient Counts, thescientific committee has developed a stimulating program that combines topics thathave had long-standing importance to policy-makers, funding initiatives and healthsystem planners with leading-edge discussions about emerging case-mix systemsacross the continuum of care. Additionally, we offer you the opportunity to do somein-depth learning about a wide array of topics through our pre-conference workshops.This year, an unprecedented number of workshops are being offered, and one ormore will surely appeal to you.
Of course, we must also remember to balance work with play. Be sure to take sometime to explore Montréal’s underground city, the exceptional shopping and fabulousrestaurants. On the night of October 21, the local organizing committee has arrangeda gala dinner and entertainment to remember. Plan to be there, as you will not want tomiss this event.
Finally, we would like to acknowledge the entire local organizing committee, the PCSIscientific committee and the PCSI executive committee for their support and dedicationto this conference. Their behind-the-scenes work made this event possible.
Come early for the workshops and stay late to play, network with old friends and makenew ones. Together we’ll make the 27th PCSI conference a truly remarkable experience.
Darren Gerson, Manager, Case Mix, CIHIChair, PCSI 2011 Conference LocalOrganizing Committee
Poul Eric Hansen, President,PCSI
8/13/2019 2011 Montreal Conference Abstract Book
http://slidepdf.com/reader/full/2011-montreal-conference-abstract-book 8/166vi
= ( WX ′ – – WY
β = ( WX ′ ) – XWY
= β + ε
= + ε
= + εQ75+ .5 x (Q.
5- Q
25
Q75 1.5 (Q
75 -
25)
2 7 t h P C S I C o n f e r e n c e | O c t o b e r 1 9 t o 2 2 , 2 0 1 1 | M o n t r é a l , Q u e b e c , C a n a d a
Each patient counts
General InformationVenue
The 27th annual Patient Classification Systems International (PCSI) Conference: EachPatient Counts is being held at Le Westin Montréal in Montréal, Quebec, located at270 St. Antoine Ouest. All meetings will take place at the hotel.
Registration and Information DeskThe registration desk is located on the 9th floor of Le Westin Montréal in the foyerarea. The desk will be open at the following times:
Wednesday, October 19: 7:30 a.m.–4 p.m.Thursday, October 20: 7:30 a.m.–4 p.m.Friday, October 21: 8 a.m.–4 p.m.
Saturday, October 22: 8:30 a.m.–2 p.m.
Event WebsiteComplete conference information is available on the PCSI event website(www.cihiconferences.ca/PCSI2011).
Language All conference presentations are in English, unless otherwise identified by thissymbol . Simultaneous interpretation will be available at all sessions denotedwith .
Certificate of Attendance A cer tificate of attendance will be distr ibuted with the conference documentationupon registration.
Name BadgesEach delegate will be given a name badge at the registration desk. Delegatesare kindly requested to wear their badges visibly throughout the conference foridentification purposes and admission to the various functions.
Speakers’ Room A speakers’ room has been reserved on the 9th floor of Le Westin Montréal. Thespeakers’ room is equipped with computers and internet service. It is recommendedthat speakers arrive approximately two hours prior to their sessions to check theirpresentation and/or update it if necessary. Technical support will be available.

8/13/2019 2011 Montreal Conference Abstract Book
http://slidepdf.com/reader/full/2011-montreal-conference-abstract-book 9/166v
Each patient counts
2 7 t h P C S I C o n f e r e n c e | O c t o b e r 1 9 t o 2 2 , 2 0 1 1 | M o n t r é a l , Q u e b e c , C a n a d a
InternetComplimentary internet is available in meeting rooms and public areas of the hotel.
BreakfastBreakfast on Thursday, October 20 is sponsored by the British Columbia HealthServices Purchasing Organization (BCHSPO).
LunchesLunches on Thursday, Friday and Saturday of the conference are included in theconference registrat ion fee and will be held on the 11th floor in Montréal Ballroom.
Morning coffee will be held at the following times:
Thursday, October 20: 7:30 a.m.–8:30 a.m.
Friday, October 21: 8 a.m.–9 a.m.Saturday, October 22: 8:30 a.m.–9 a.m.
Lunches will be held at the following times:
Thursday, October 20: 12 noon–1 p.m.Friday, October 21: 12:30 p.m.–1:30 p.m.Saturday, October 22: 1 p.m.–2 p.m.
Coffee BreaksBreaks have been scheduled throughout the event to allow delegates to network andview the exhibits and poster sessions. They will be held in Montreal Ballroom, 11th floor.
Welcome ReceptionPlease join us for refreshments and the opportunity to network with colleagueson Wednesday, October 19, starting at 4:30 p.m. in Montréal Ballroom.
Gala DinnerJoin us for a truly memorable evening with Cirque Éloize.
Positioned at the heart of the renewal of circus arts, Cirque Éloize has been creatingmoving performances filled with magic since 1993.
Based on the multidisciplinary talents of its artists, Cirque Éloize expresses itsinnovative nature through theatricality and humanity, and combines circus arts withmusic, dance and theatre in a path-breaking and original manner. With seven originalproductions to its credit, Cirque Éloize has presented more than 4,000 performancesin 395 cities and 31 countries located around the world.

8/13/2019 2011 Montreal Conference Abstract Book
http://slidepdf.com/reader/full/2011-montreal-conference-abstract-book 10/166viii
= ( WX ′ – – WY
β = ( WX ′ ) – XWY
= β + ε
= + ε
= + εQ75+ .5 x (Q.
5- Q
25
Q75 1.5 (Q
75 -
25)
2 7 t h P C S I C o n f e r e n c e | O c t o b e r 1 9 t o 2 2 , 2 0 1 1 | M o n t r é a l , Q u e b e c , C a n a d a
Each patient counts
In addition to its tour performances, Cirque Éloize develops personalized conceptsfor international special events. To date, more than 1,250 events have taken place.
Since 2004, Cirque Éloize’s head office and creative studio are located in the GareDalhousie, a historical building. The Dalhousie train station, a former Canadian
Pacific (CP) station marks the northeastern edge of Old Montréal and illustrates itslong-standing role as one of the city’s railway hubs. In 1886, the first trans-Canadatrain pulled out of the new Dalhousie Station for Vancouver. From 1986 to 2003,this building housed the National School for Circus Arts of Montreal.
Location:Cirque Eloize, 417 rue Berri(Located in the heart of Old Montréal, within walking distance from the hotel)Reception starting at 7:30 p.m.Dinner at 8:30 p.m.
Poster PresentationsPosters are located on the 11th floor in the Montréal C and D room. They will beavailable for viewing from Wednesday, October 19, to Saturday, October 22.
Best Poster Award
The best poster award will be presented during the poster session onThursday, October 20.
ExhibitsExhibits are located on the 11th floor. Representatives from the followingorganizations will be available:
PowerHealth SolutionsDriving more effective healthcare
8/13/2019 2011 Montreal Conference Abstract Book
http://slidepdf.com/reader/full/2011-montreal-conference-abstract-book 11/166
Each patient counts
2 7 t h P C S I C o n f e r e n c e | O c t o b e r 1 9 t o 2 2 , 2 0 1 1 | M o n t r é a l , Q u e b e c , C a n a d a
Your HostsPatient Classification Systems International (PCSI)
Patient Classification Systems Europe (PCSE) was founded in 1987 in Lisbon. Theorganization created a network of researchers and users of the casemix concept fromhealth administration, government agencies and academia. From an initial focus ondiagnosis-related groups (DRGs), the organization’s goals have expanded to includea broader interest in clustering and grouping techniques of clinical and administrativedata for health care management and financing. As such, PCSE stimulated the use andrefinement of the science of grouping patients within dif ferent levels of the health system.
Expansion of the organization throughout the world brought a name change to PatientClassification Systems International (PCSI). It is the only worldwide organizationaddressing case-mix issues. In the last few years, the annual international conferencehas brought together a growing number of active participants from all over the world.
Originally a group of six idealists from Western Europe and the United States, theorganization has now grown to hundreds of members from five continents. Theorganization hosts one annual conference and offers educational opportunitiesthrough its summer and winter school programs.
Canadian Institute for Health Information (CIHI)
Who We Are
Established in 1994, CIHI is an independent, not-for-profit corporation that providesessential information on Canada’s health system and the health of Canadians.
Funded by federal, provincial and territorial governments, we are guided by a Boardof Directors made up of health leaders across the country.
Our Vision
To help improve Canada’s health system and the well-being of Canadians by beinga leading source of unbiased, credible and comparable information that will enablehealth leaders to make better-informed decisions.

8/13/2019 2011 Montreal Conference Abstract Book
http://slidepdf.com/reader/full/2011-montreal-conference-abstract-book 12/166x
= ( WX ′ – – WY
β = ( WX ′ ) – XWY
= β + ε
= + ε
= + εQ75+ .5 x (Q.
5- Q
25
Q75 1.5 (Q
75 -
25)
2 7 t h P C S I C o n f e r e n c e | O c t o b e r 1 9 t o 2 2 , 2 0 1 1 | M o n t r é a l , Q u e b e c , C a n a d a
Each patient counts
SponsorsThe 27th annual Patient Classification Systems International (PCSI) Conference wouldlike to express sincere appreciation to the following organizations for their support:
Exhibitor and Friend of the Conference
PowerHealth SolutionsDriving more effective healthcare
Established in 1995, PowerHealth Solutions (PHS) has been a leading and innovative
player in the health care industry, specializing in business management, decisionsupport and application integration solutions for hospitals and other health careenterprises. Operating solely in the health care industry, and with a wealth ofexperience and leading-edge technology, PHS has consistently demonstratedits ability to successfully implement its products in any setting.
At PHS, our mission is to help our clients deliver the highest-quality care at thelowest operational costs. We specialize in billing, costing and reporting solutions,with the purpose of improving health care efficiency. Our two principal products arePowerBilling and Revenue Collection (an enterprise-wide tier 1 patient billing solutionthat is designed to fill the health-industry gaps evident in most generic ERP andfinancial systems) and PowerPerformance Management (a true patient- and service-
level patient costing and revenue management system). Our products deliver apositive return on investment, regardless of organization size.
In addition, PHS is a dynamic and growing organization with a mature customer basein Australia and New Zealand, steady growth in the United States and England, and asuccessful entrance to Ireland, Hong Kong and the Middle East.
Finally, PHS is ISO 9001:2000 cert ified (Certi fication Number QEC14045), with quality-assured systems and processes. Through annual external audits, PHS consistentlyreceives commendations on our excellent levels of process management, especiallyin systems development, delivery and support.
8/13/2019 2011 Montreal Conference Abstract Book
http://slidepdf.com/reader/full/2011-montreal-conference-abstract-book 13/166x
Each patient counts
2 7 t h P C S I C o n f e r e n c e | O c t o b e r 1 9 t o 2 2 , 2 0 1 1 | M o n t r é a l , Q u e b e c , C a n a d a
Delegate Bags, Name Badges andWelcome Reception Sponsor
MedAssets works with health care providers and health plans to achieve sustainablefinancial and operational performance improvement. The company’s mission is topartner with hospitals and health systems to enhance their financial strength throughimproved operating margins.
To achieve that mission, the company focuses on enabling its customers to deliverhigh-quality, affordable health care through a comprehensive suite of evidence-basedbest practice technologies and services designed to optimize revenues, secure
reimbursement, reduce waste and manage total cost of care.
MedAssets understands that managing costs goes hand in hand with changinghuman behaviours and understands provider processes and work flows for bothrevenue cycle and supply chain management. MedAssets’ customers reflect healthcare providers of all sizes, including integrated delivery networks and health systems,physician offices, as well as alternate care providers. MedAssets Solutions aredelivered and supported through a best-practice operations framework, specializedclinical consulting expertise, shared procurement services, e-commerce, advancedspend analytics and transformational or outsourced services.
MedAssets Spend and Clinical Resource Management Solutions provide a
comprehensive suite of offerings that reduce the overall cost of patient care bylowering supply chain expenses, managing the utilization of spend and clinicalresources, and integrating episode-of-care analytics.
MedAssets Decision Support Solutions integrates financial, clinical and utilizationinformation for enterprise-wide analysis and decision-making to improve day-to-dayoperations and operational effectiveness and positively impact future performance.In addition, MedAssets’ solution for Decision Support and Performance Analyticsprovides an integrated suite of web-based tools to efficiently manage costs, third-party payer contracts and revenues as well as evaluate payer performance acrossservice lines and manage profitability for sustained growth.
MedAssets serves more than 180 health systems, 4,000 hospitals and 90,000 non-acute health care providers, including a case-costing solution for the Ontario Ministryof Health and Long-Term Care and 48 facilities in Ontario. Visit www.medassets.com.

8/13/2019 2011 Montreal Conference Abstract Book
http://slidepdf.com/reader/full/2011-montreal-conference-abstract-book 14/166xii
= ( WX ′ – – WY
β = ( WX ′ ) – XWY
= β + ε
= + ε
= + εQ75+ .5 x (Q.
5- Q
25
Q75 1.5 (Q
75 -
25)
2 7 t h P C S I C o n f e r e n c e | O c t o b e r 1 9 t o 2 2 , 2 0 1 1 | M o n t r é a l , Q u e b e c , C a n a d a
Each patient counts
Conference SupporterThursday, October 20 Breakfast Sponsor
The British Columbia Health Services Purchasing Organization (BCHSPO) wasincorporated under the Society Act in January 2010. The BCHSPO was registeredto oversee the implementation of patient-focused funding. Under a patient-focusedfunding approach, hospitals receive financial incentives for delivering acute-care
services for a competitive, set price primarily based upon Resource Intensity Weights.
Conference SupporterJacob Hofdijk
www.casemix.nl
8/13/2019 2011 Montreal Conference Abstract Book
http://slidepdf.com/reader/full/2011-montreal-conference-abstract-book 15/166
x
Each patient counts
2 7 t h P C S I C o n f e r e n c e | O c t o b e r 1 9 t o 2 2 , 2 0 1 1 | M o n t r é a l , Q u e b e c , C a n a d a
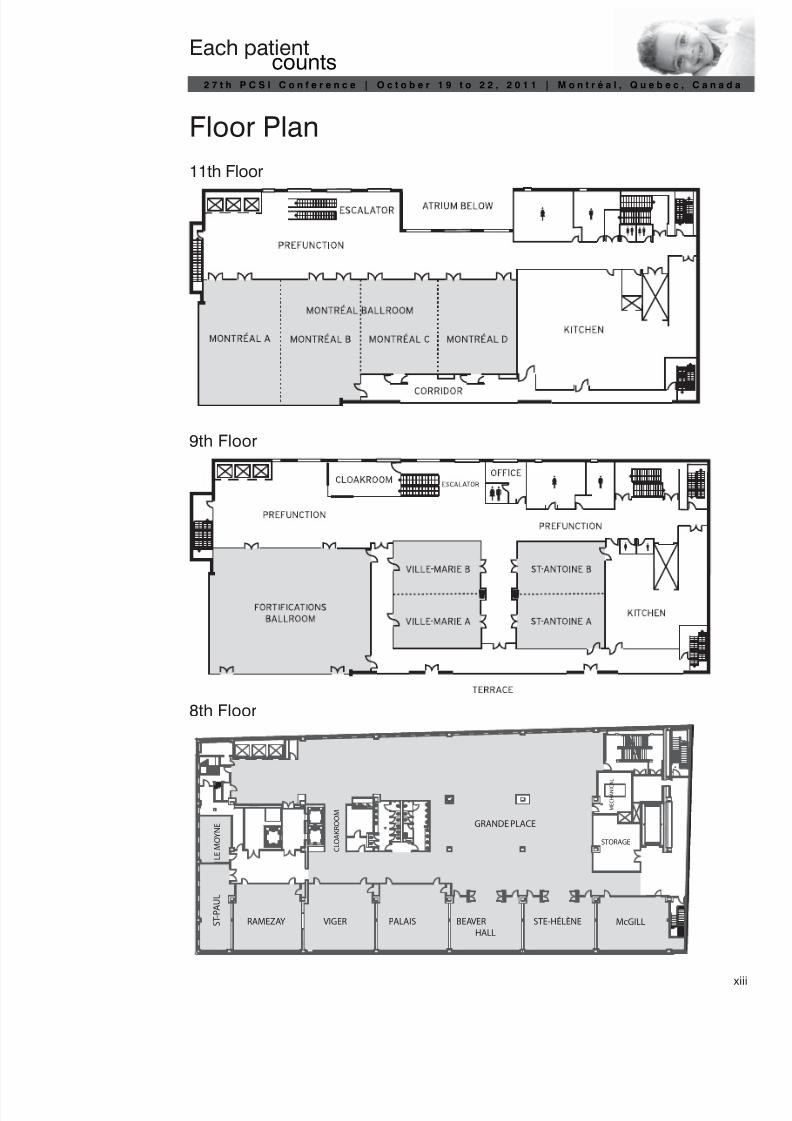
Floor Plan
11th Floor
9th Floor
8th Floor
GRANDE PLACE
RAMEZAY VIGER PALAIS BEAVER
HALL
STE-HÉLÈNE McGILL S T - P A U L
L E M O Y N E
C L O A K R O O M
STORAGE
M E C H A N I C A
L

8/13/2019 2011 Montreal Conference Abstract Book
http://slidepdf.com/reader/full/2011-montreal-conference-abstract-book 16/166

8/13/2019 2011 Montreal Conference Abstract Book
http://slidepdf.com/reader/full/2011-montreal-conference-abstract-book 17/166
Each patient counts
2 7 t h P C S I C o n f e r e n c e | O c t o b e r 1 9 t o 2 2 , 2 0 1 1 | M o n t r é a l , Q u e b e c , C a n a d a
ProgramWednesday, October 19, 2011
7:30 a.m.–4 p.m. Registration
9 a.m.–12 noon Pre-Conference Workshops
Ville-Marie AMeeting Room9th Floor
Workshop AHow to Harmonise Classifications of Procedures for Case MixApplications? From the Present Situation to the ICHI (InternationalClassification of Health Intervention) InitiativeFacilitator: Jean Marie Rodrigues, University of Saint Etienne, CHU,Department of Public Health and Medical Informatics, Saint Etienne, France;WHO Collaborating Centre for International Classifications in FrenchLanguage, Paris, France
St-Antoine AMeeting Room9th Floor
Workshop BProfiling Devices, Drugs, Implants as a Additional Profile of CasemixTools Using GS1Facilitators: Jacob Hofdijk (Casemix, the Netherlands), Ulrike Kreysa (GS1)and representatives of Covidien, Meditech and BISLIFE
St-Antoine BMeeting Room9th Floor
Workshop C—starts at 10 a.m.Costing Patient Care Services—An Introduction Using WorkedExamplesFacilitator: Nigel Michell, Director, PowerHealth Solutions Ltd.
Ville-Marie BMeeting Room9th Floor
Workshop DFrom Case Mix to Clinical CareFacilitator: Dr. Michael Wilke
8/13/2019 2011 Montreal Conference Abstract Book
http://slidepdf.com/reader/full/2011-montreal-conference-abstract-book 18/1662
= ( WX ′ – – WY
β = ( WX ′ ) – XWY
= β + ε
= + ε
= + εQ75+ .5 x (Q.
5- Q
25
Q75 1.5 (Q
75 -
25)
2 7 t h P C S I C o n f e r e n c e | O c t o b e r 1 9 t o 2 2 , 2 0 1 1 | M o n t r é a l , Q u e b e c , C a n a d a
Each patient counts
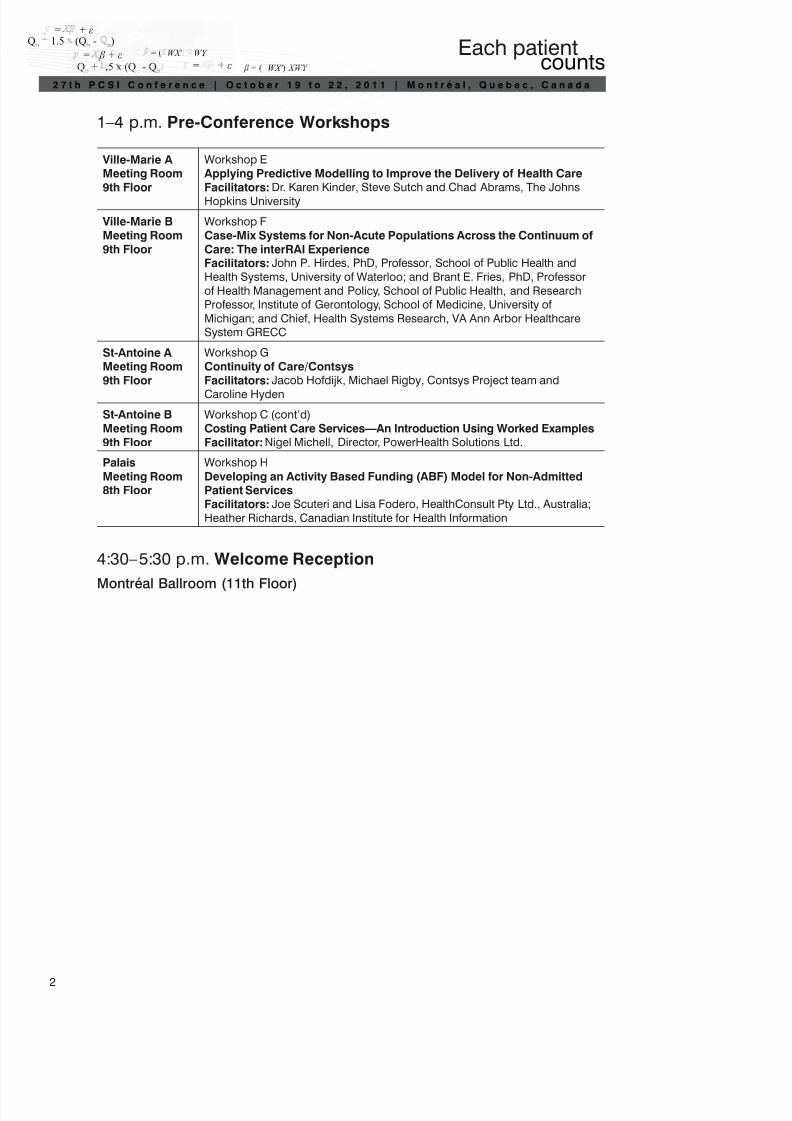
1–4 p.m. Pre-Conference Workshops
Ville-Marie AMeeting Room9th Floor
Workshop EApplying Predictive Modelling to Improve the Delivery of Health CareFacilitators: Dr. Karen Kinder, Steve Sutch and Chad Abrams, The JohnsHopkins University
Ville-Marie BMeeting Room9th Floor
Workshop FCase-Mix Systems for Non-Acute Populations Across the Continuum ofCare: The interRAI ExperienceFacilitators: John P. Hirdes, PhD, Professor, School of Public Health andHealth Systems, University of Waterloo; and Brant E. Fries, PhD, Professorof Health Management and Policy, School of Public Health, and ResearchProfessor, Institute of Gerontology, School of Medicine, University ofMichigan; and Chief, Health Systems Research, VA Ann Arbor HealthcareSystem GRECC
St-Antoine AMeeting Room9th Floor
Workshop GContinuity of Care/ContsysFacilitators: Jacob Hofdijk, Michael Rigby, Contsys Project team and
Caroline HydenSt-Antoine BMeeting Room9th Floor
Workshop C (cont’d)Costing Patient Care Services—An Introduction Using Worked ExamplesFacilitator: Nigel Michell, Director, PowerHealth Solutions Ltd.
PalaisMeeting Room8th Floor
Workshop HDeveloping an Activity Based Funding (ABF) Model for Non-AdmittedPatient ServicesFacilitators: Joe Scuteri and Lisa Fodero, HealthConsult Pty Ltd., Australia;Heather Richards, Canadian Institute for Health Information
4:30–5:30 p.m. Welcome Reception
Montréal Ballroom (11th Floor)

8/13/2019 2011 Montreal Conference Abstract Book
http://slidepdf.com/reader/full/2011-montreal-conference-abstract-book 19/166
Each patient counts
2 7 t h P C S I C o n f e r e n c e | O c t o b e r 1 9 t o 2 2 , 2 0 1 1 | M o n t r é a l , Q u e b e c , C a n a d a
Thursday, October 20, 2011
7:30 a.m.–4 p.m. Registration
7:30–8:30 a.m. Coffee, Posters and Exhibit Viewing Montréal Ballroom (11th Floor)
8:30–9 a.m. Welcome and Opening Remarks Fortifications Ballroom (9th Floor)
Moderator
Dr. Jason Sutherland
Speakers
Mr. John WrightPresident and CEO, Canadian Institute for Health Information (CIHI)
John Wright joined the Canadian Institute for Health Information (CIHI) as Presidentand CEO on January 1, 2010.
Mr. Wright has more than 30 years of public-sector experience, including asdeputy minister of Health and deputy minister of Finance for the Government ofSaskatchewan. He also served as president and CEO of several crown agenciesin that province, including SaskPower, Crown Investments Corporation andSaskatchewan Government Insurance. Before joining CIHI, he was a lecturer ineconomics at the University of Regina.
Mr. Wright has served on the boards of governors for the University of Regina andthe University of Saskatchewan. He holds a master’s degree in economics from theUniversity of Alberta and an honours bachelor of economics from the University ofWestern Ontario.
8/13/2019 2011 Montreal Conference Abstract Book
http://slidepdf.com/reader/full/2011-montreal-conference-abstract-book 20/1664
= ( WX ′ – – WY
β = ( WX ′ ) – XWY
= β + ε
= + ε
= + εQ75+ .5 x (Q.
5- Q
25
Q75 1.5 (Q
75 -
25)
2 7 t h P C S I C o n f e r e n c e | O c t o b e r 1 9 t o 2 2 , 2 0 1 1 | M o n t r é a l , Q u e b e c , C a n a d a
Each patient counts
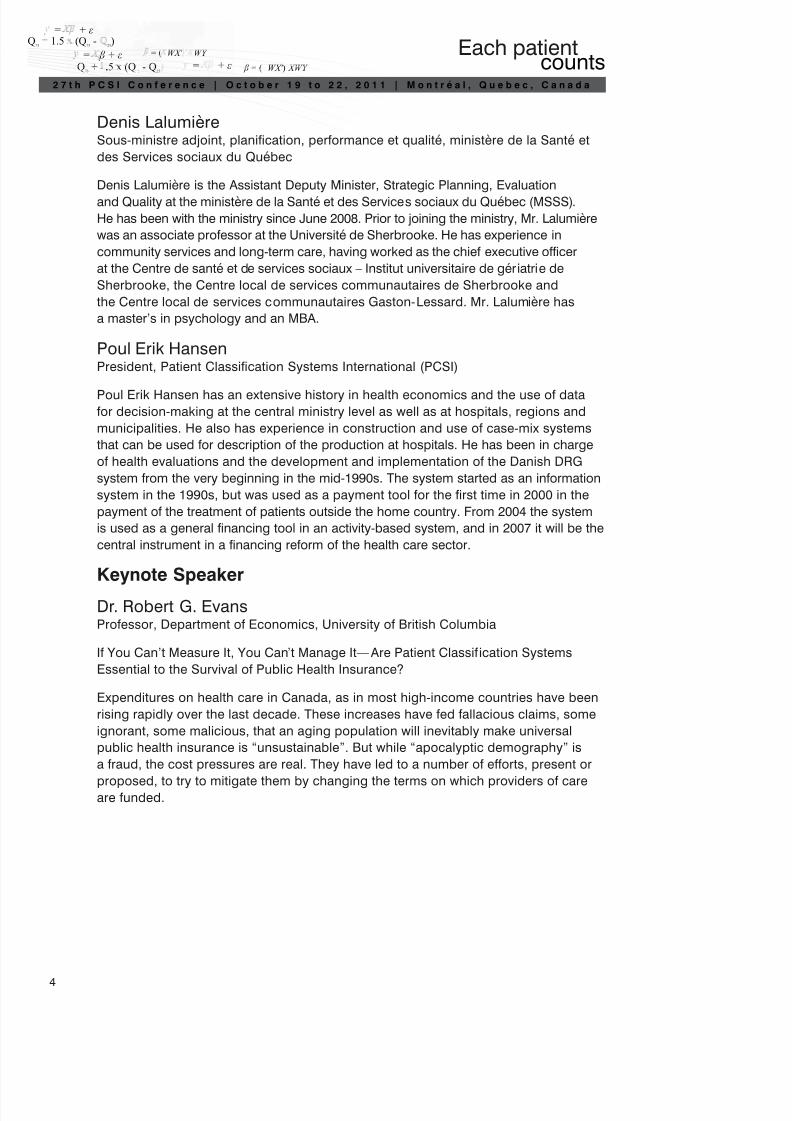
Denis LalumièreSous-ministre adjoint, planification, performance et qualité, ministère de la Santé etdes Services sociaux du Québec
Denis Lalumière is the Assistant Deputy Minister, Strategic Planning, Evaluationand Quality at the ministère de la Santé et des Services sociaux du Québec (MSSS).He has been with the ministry since June 2008. Prior to joining the ministry, Mr. Lalumièrewas an associate professor at the Université de Sherbrooke. He has experience incommunity services and long-term care, having worked as the chief executive officerat the Centre de santé et de services sociaux – Institut universitaire de gériatrie deSherbrooke, the Centre local de services communautaires de Sherbrooke andthe Centre local de services communautaires Gaston-Lessard. Mr. Lalumière hasa master’s in psychology and an MBA.
Poul Erik HansenPresident, Patient Classification Systems International (PCSI)
Poul Erik Hansen has an extensive history in health economics and the use of datafor decision-making at the central ministry level as well as at hospitals, regions andmunicipalities. He also has experience in construction and use of case-mix systemsthat can be used for description of the production at hospitals. He has been in chargeof health evaluations and the development and implementation of the Danish DRGsystem from the very beginning in the mid-1990s. The system started as an informationsystem in the 1990s, but was used as a payment tool for the first time in 2000 in thepayment of the treatment of patients outside the home country. From 2004 the systemis used as a general financing tool in an activity-based system, and in 2007 it will be thecentral instrument in a financing reform of the health care sector.
Keynote Speaker
Dr. Robert G. EvansProfessor, Department of Economics, University of British Columbia
If You Can’t Measure It, You Can’t Manage It—Are Patient Classif ication SystemsEssential to the Survival of Public Health Insurance?
Expenditures on health care in Canada, as in most high-income countries have beenrising rapidly over the last decade. These increases have fed fallacious claims, someignorant, some malicious, that an aging population will inevitably make universalpublic health insurance is “unsustainable”. But while “apocalyptic demography” isa fraud, the cost pressures are real. They have led to a number of efforts, present or
proposed, to try to mitigate them by changing the terms on which providers of careare funded.

8/13/2019 2011 Montreal Conference Abstract Book
http://slidepdf.com/reader/full/2011-montreal-conference-abstract-book 21/166
Each patient counts
2 7 t h P C S I C o n f e r e n c e | O c t o b e r 1 9 t o 2 2 , 2 0 1 1 | M o n t r é a l , Q u e b e c , C a n a d a
In particular, many governments are exploring greater use of payment byprocedure or case to encourage and reward greater efficiency. The Achilles Heelof all such proposals is the difficulty of establishing reliable measures of the costof particular units of health care system outputs in different settings. The perverseincentives created by divergences between reimbursement rates and actual costsof production are well understood. But “getting the prices right” is a very tough nutto crack. Yet without better information on the reasonable costs of the services ourhealth care systems are buying, continuing “mediflation” may put those systemsat risk. The consequences could be dire, as the experience of the United Stateshas demonstrated.
A founding member of the Centre for Health Services and Policy Research (CHSPR)at UBC, Robert G. Evans is a lifelong leader in academia and an internationallyesteemed health economist. His groundbreaking comparative studies of health caresystems and funding strategies have shaped policy in Canada and provided insightto governments and health agencies worldwide. A decorated academic, ProfessorEvans is the recipient of Canada’s highest honour for lifetime achievement as anOfficer of the Order of Canada. He also served as a member of the British ColumbiaRoyal Commission on Health Care and Costs in 1990, and of the National Forum onHealth, chaired by the prime minister of Canada, f rom 1994 to 1997. His canonicalworks, “Strained Mercy: The Economics of Canadian Health Care” and “Why AreSome People Healthy and Others Not? The Determinants of Health of Populations,”are considered classics in the field.
In addition to serving as an Officer of the Order of Canada, he is a Fellow of the RoyalSociety of Canada and an Institute Fellow of the Canadian Institute for AdvancedResearch, where he was director of the Population Health Program from 1987 to1997. He is also an honorary life member of the Canadian College of Health ServiceExecutives and of the Canadian Health Economics Research Association, and he isa member of the National Academy of Social Insurance (U.S.). In 2001, he becamethe first Canadian (and the second non-American) to win the Baxter InternationalFoundation Prize for Health Services Research.
As a University Killam Professor at UBC, Dr. Evans is a prolif ic author and an activeprofessor, researcher and consultant with the UBC Centre for Health Services andPolicy Research and the Department of Economics.
Dr. Evans received his undergraduate degree in political economy from the Universityof Toronto and a PhD in Economics f rom Harvard University.

8/13/2019 2011 Montreal Conference Abstract Book
http://slidepdf.com/reader/full/2011-montreal-conference-abstract-book 22/1666
= ( WX ′ – – WY
β = ( WX ′ ) – XWY
= β + ε
= + ε
= + εQ75+ .5 x (Q.
5- Q
25
Q75 1.5 (Q
75 -
25)
2 7 t h P C S I C o n f e r e n c e | O c t o b e r 1 9 t o 2 2 , 2 0 1 1 | M o n t r é a l , Q u e b e c , C a n a d a
Each patient counts
10–10:30 a.m. Posters, Exhibit Viewing and Coffee Break
Montréal Ballroom (11th Floor)
10:30 a.m.–12 noon Concurrent Sessions 1
Ville-Marie AMeeting Room9th Floor
1A: Morbidity Burden and Case MixModerator: Brian RuffProfiling High Morbidity Burden in Primary Care: Calibration of a Case-Mix Model, Ran BalicerMeasuring the Case-Mix of Physician Practices in Primary Care ReformModels in Ontario, Canada, Lyn SibleyAnalysing the Emergence of Complex Morbidities. A 30 Years’ Follow-Up on a Defined Population in Sweden, Lennart Carlsson
Ville-Marie BMeeting Room9th Floor
1B: Health System Planning and FundingModerator: Jason SutherlandUnderstanding the Episode of Care for Transplant Patients, Irene BlaisPlanning for ABF as Part of Reforming the Australian Health CareSystem, Lisa FoderoCase Mix Funding in Ireland: From Retrospective to Prospective?Progress Since 2010, Brian DonovanPlanning for the Future in Switzerland: Adapting the Facilities to theDemand of the Patient, Jean-Claude Rey
St-Antoine AMeeting Room9th Floor
1C: International Experiences With Case MixModerator: Paula MonteithRomania: Experience and New Steps in the International PatientClassification System Context, Nona ChiriacInitial Results and Experiences From the World Bank–Financed DRGPilot Project in the Republic of Moldova, Mircea BugaFeasibility of Implementing Casemix System to Support APEXProgramme of HUSM in Malaysia Using UNU-CBG Casemix Grouper, Rosminah Mohamed
Analysis of the FONDO NACIONAL DE RECURSOS Reimbursement inUruguay Using UNU-CBG Casemix System, Zafar Ahmed
12 noon–1 p.m. Posters, Exhibit Viewing and Lunch
Montréal Ballroom (11th Floor)
1–2 p.m. Plenary 2
Fortifications Ballroom (9th Floor)

8/13/2019 2011 Montreal Conference Abstract Book
http://slidepdf.com/reader/full/2011-montreal-conference-abstract-book 23/166
8/13/2019 2011 Montreal Conference Abstract Book
http://slidepdf.com/reader/full/2011-montreal-conference-abstract-book 24/1668
= ( WX ′ – – WY
β = ( WX ′ ) – XWY
= β + ε
= + ε
= + εQ75+ .5 x (Q.
5- Q
25
Q75 1.5 (Q
75 -
25)
2 7 t h P C S I C o n f e r e n c e | O c t o b e r 1 9 t o 2 2 , 2 0 1 1 | M o n t r é a l , Q u e b e c , C a n a d a
Each patient counts
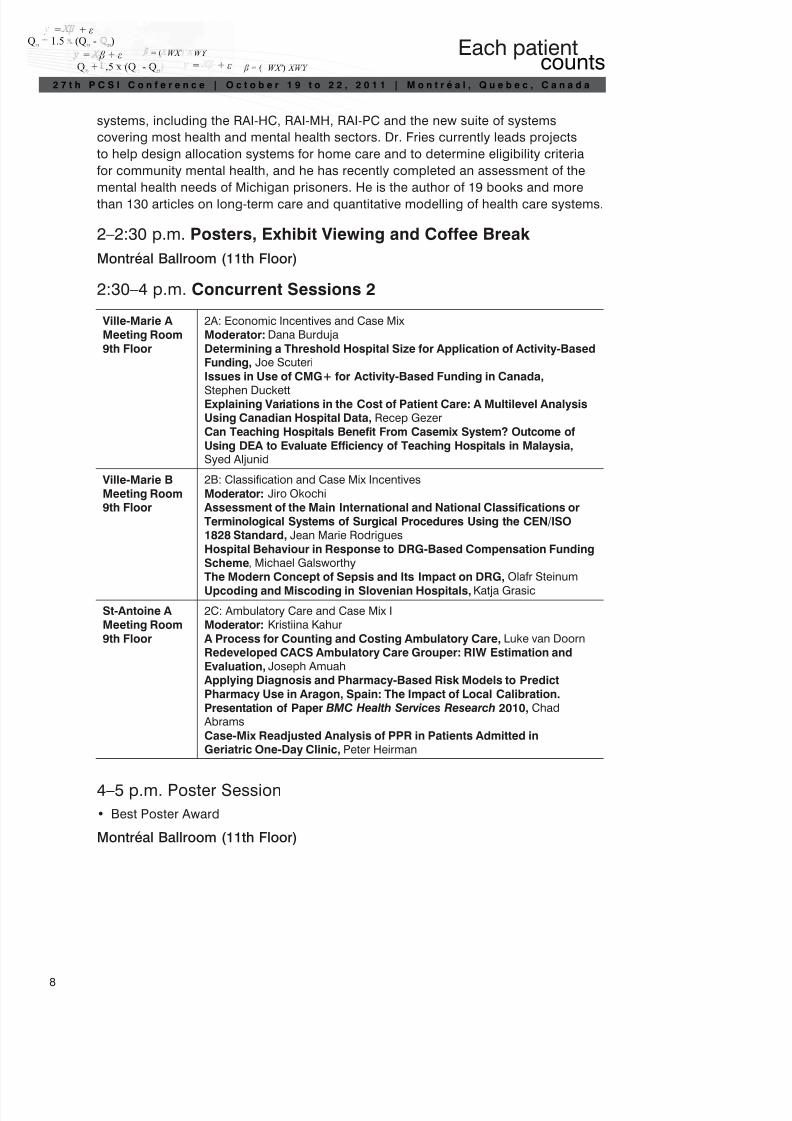
systems, including the RAI-HC, RAI-MH, RAI-PC and the new suite of systemscovering most health and mental health sectors. Dr. Fries currently leads projectsto help design allocation systems for home care and to determine eligibility criteriafor community mental health, and he has recently completed an assessment of themental health needs of Michigan prisoners. He is the author of 19 books and morethan 130 articles on long-term care and quantitative modelling of health care systems.
2–2:30 p.m. Posters, Exhibit Viewing and Coffee Break
Montréal Ballroom (11th Floor)
2:30–4 p.m. Concurrent Sessions 2
Ville-Marie AMeeting Room9th Floor
2A: Economic Incentives and Case MixModerator: Dana BurdujaDetermining a Threshold Hospital Size for Application of Activity-BasedFunding, Joe ScuteriIssues in Use of CMG+ for Activity-Based Funding in Canada,
Stephen DuckettExplaining Variations in the Cost of Patient Care: A Multilevel AnalysisUsing Canadian Hospital Data, Recep GezerCan Teaching Hospitals Benefit From Casemix System? Outcome ofUsing DEA to Evaluate Efficiency of Teaching Hospitals in Malaysia, Syed Aljunid
Ville-Marie BMeeting Room9th Floor
2B: Classification and Case Mix IncentivesModerator: Jiro OkochiAssessment of the Main International and National Classifications orTerminological Systems of Surgical Procedures Using the CEN/ISO1828 Standard, Jean Marie RodriguesHospital Behaviour in Response to DRG-Based Compensation FundingScheme, Michael GalsworthyThe Modern Concept of Sepsis and Its Impact on DRG, Olafr SteinumUpcoding and Miscoding in Slovenian Hospitals, Katja Grasic
St-Antoine AMeeting Room9th Floor
2C: Ambulatory Care and Case Mix IModerator: Kristiina KahurA Process for Counting and Costing Ambulatory Care, Luke van DoornRedeveloped CACS Ambulatory Care Grouper: RIW Estimation andEvaluation, Joseph AmuahApplying Diagnosis and Pharmacy-Based Risk Models to PredictPharmacy Use in Aragon, Spain: The Impact of Local Calibration.Presentation of Paper BMC Health Services Research 2010, Chad AbramsCase-Mix Readjusted Analysis of PPR in Patients Admitted inGeriatric One-Day Clinic, Peter Heirman
4–5 p.m. Poster SessionBest Poster Award•
Montréal Ballroom (11th Floor)

8/13/2019 2011 Montreal Conference Abstract Book
http://slidepdf.com/reader/full/2011-montreal-conference-abstract-book 25/166
Each patient counts
2 7 t h P C S I C o n f e r e n c e | O c t o b e r 1 9 t o 2 2 , 2 0 1 1 | M o n t r é a l , Q u e b e c , C a n a d a
Friday, October 21, 2011
8–9 a.m. Coffee, Posters and Exhibit Viewing Montréal Ballroom (11th Floor)
9–10 a.m. Plenary 3
Fortifications Ballroom (9th Floor)
EuroDRG Project PresentationThe EuroDRG Project: Comparing European Casemix Systems
If they are to form the basis for hospital reimbursement, DRGs need to reflectaccurately the resources used in treating a group of similar patients. But ever morecountries are developing their own variant of DRGs. Is this because each country’spatients or patterns of treatment are truly distinct or are some DRG systems better
than others? In the EuroDRG project we analyse patient-level data from 11 Europeancountries and for 10 episodes of care to understand why resource use (costs orlength of stay) varies for patients who are receiving the same treatment. We specifymulti-level econometric models that recognise the clustering of patients in hospitalsand examine how much of the variat ion in resource use is captured by: the DRG towhich the patient is allocated; their socio-demographic characteristics; diagnosticcharacteristics and co-morbidities; quality and adverse events; and the hospital inwhich they are treated. The analysis yields insights into: the important features ofdifferent DRG systems; the characteristics of patients that drive variation in resourceuse; and the relative efficiency of individual hospitals.
Moderator
Ceu Mateus
Speaker
Andrew StreetProfessor of Health Economics and Director, Health Policy Team, Centre for HealthEconomics; Director, Economics of Social and Health Care Research Unit (ESHCRU),National Institute for Health Research
Andrew Street is a Professor of Health Economics and Director of the Health Policyteam in the Centre for Health Economics and Director of Economics of Social
and Health Care Research Unit (ESHCRU), a joint collaboration with the PersonalSocial Services Research Unit (PSSRU) at the London School of Economics andthe University of Kent. He is an editor of the Journal of Health Economics, and hecurrently serves as a committee member for the Department of Health’s analyticalsub-group for payment by results and as a board member of the NIHR HealthServices Research program.

8/13/2019 2011 Montreal Conference Abstract Book
http://slidepdf.com/reader/full/2011-montreal-conference-abstract-book 26/16610
= ( WX ′ – – WY
β = ( WX ′ ) – XWY
= β + ε
= + ε
= + εQ75+ .5 x (Q.
5- Q
25
Q75 1.5 (Q
75 -
25)
2 7 t h P C S I C o n f e r e n c e | O c t o b e r 1 9 t o 2 2 , 2 0 1 1 | M o n t r é a l , Q u e b e c , C a n a d a
Each patient counts
Dr. Street’s research covers measurement of health system productivity, evaluation ofactivity-based funding mechanisms, analysis of organizational efficiency and criticalappraisal of health policy. He is currently working on the EuroDRG project, which isfunded under the 7th EU Framework program.
He has an MSc in health economics (1990), an MA in public administration and publicpolicy (2000) and a PhD in economics (2002), all awarded by the University of York. After completing his MSc, Dr. Street spent three years in Australia working at theNational Centre for Health Program Evaluation, Monash University, and the VictorianDepartment of Health and Community Services. This was followed by a five-yearspell with the York Health Economics Consortium. He joined the Centre for HealthEconomics in April 1999. From 1999 to 2003, he held a special training fellowshipawarded by the Medical Research Council and Northern and Yorkshire Region. In2005, he worked part time in the Delivery Analytical Team in the English Departmentof Health.
10–10:30 a.m. PCSI General Assembly Part I: Introduction ofCandidates for Election
Fortifications Ballroom (9th Floor)
10:30–11 a.m. Posters, Exhibit Viewing and Coffee Break
Montréal Ballroom (11th Floor)
11 a.m.–12:30 p.m. Concurrent Sessions 3
Ville-Marie AMeeting Room9th Floor
3A: Care Quality and Case MixModerator: Jiro OkochiIncremental Costs of Hospital-Acquired Complications in Alberta,
Canada, Terri JacksonUsing Hospital Readmission Rates to Track Quality of Care in PublicHospitals in Singapore, Dr. Shamim Chowdhurg and Ms. Mok Wi YingHealth Status and Performance Using Clinical Risk Groups (ACRG3)for the Madrid Region, Marc BerlinguetFirst German Hospital Infection Benchmark Based on DRG RoutineData, Michael Wilke
Ville-Marie BMeeting Room9th Floor
3B: Refining Case Mix SystemsModerator: Poul Erik HansenA Methodology for Refining AR-DRG, Christopher AisbettDevelopment of a Classification of Clinical Specialties: Service-RelatedGroups (SRGs) and Enhanced Service-Related Groups (ESRGs), DenizaMazevska
Counting Chronic Diagnoses Is Not Enough: Classifying the EntirePatient Population With a Morbidity Spectrum Measure, Efrat ShadmiShould There Be a Limit for DRG Split? A Case of Thai DRG Versions 3to 5, Supasit Pannarunothai

8/13/2019 2011 Montreal Conference Abstract Book
http://slidepdf.com/reader/full/2011-montreal-conference-abstract-book 27/1661
Each patient counts
2 7 t h P C S I C o n f e r e n c e | O c t o b e r 1 9 t o 2 2 , 2 0 1 1 | M o n t r é a l , Q u e b e c , C a n a d a
St-Antoine AMeeting Room9th Floor
3C: Health System Planning and Case MixModerator: Dana BurdujaPerceptions of the Casemix System by Clinicians After the First Year ofImplementation in Hong Kong: A Survey, Mr. Ken FanCase Mix Innovation: Shifting to Integrated Care, Jacob Hofdijk
Can Clinical Pathways Enhance the Implementation of a Case MixSystem? A Case Study in a Teaching Hospital in Malaysia , Syed AljunidHow Population-Based Case Mix Has Proven Itself in Canada,Karen Kinder
St-Antoine BMeeting Room9th Floor
3D: Case Mix Methodologies and Their UseModerator: Claude LemayIntroduction en douceur à la méthodologie des systèmes dits“Casemix”pour les nouveaux venus, Jean Marie Rodrigues, University ofSaint Etienne, CHU, Department of Public Health and Medical InformaticsUtilisation de regroupements d’épisode de soins dans le cadre dufinancement du réseau de la santé et des services sociaux du Québec,Normand Lantagne, Directeur de l’allocation des ressources par intérim,ministère de la Santé et des Services sociaux du Québec
12:30–1:30 p.m. Posters, Exhibit Viewing and Lunch
Montréal Ballroom (11th Floor)
1:30–2:30 p.m. PCSI Featured Abstracts
Fortifications Ballroom (9th Floor)
Moderator
Jason Sutherland
Patient Pathway Aggregation—Building on a Firm Foundation,• Paula MonteithAnalysis of the Variability of Nursing Care by Pathology in a Sample of Nine•
Belgian Hospitals, Magali Pirson
2:30–3 p.m. Posters, Exhibit Viewing and Coffee Break
Montréal Ballroom (11th Floor)

8/13/2019 2011 Montreal Conference Abstract Book
http://slidepdf.com/reader/full/2011-montreal-conference-abstract-book 28/16612
= ( WX ′ – – WY
β = ( WX ′ ) – XWY
= β + ε
= + ε
= + εQ75+ .5 x (Q.
5- Q
25
Q75 1.5 (Q
75 -
25)
2 7 t h P C S I C o n f e r e n c e | O c t o b e r 1 9 t o 2 2 , 2 0 1 1 | M o n t r é a l , Q u e b e c , C a n a d a
Each patient counts
3–4:30 p.m. Concurrent Sessions 4
Ville-Marie AMeeting Room9th Floor
4A: Economic Incentives and Case Mix IIModerator: Kristiina KahurCase Mix–Based Economic Incentives That Work, Poul HansenPay-for-Performance Quality Incentive Program—One-Year PilotProgram, Dr. K. H. LeePaying for Quality, Patrick PowerThe Use of Case Mix Data for Identifying Variations in Hospital Care forElderly Having COPD, Nona Chiriac
Ville-Marie BMeeting Room9th Floor
4B: Long-Term Care and Case MixModerator: Stephen SutchAging, Disability and Long-Term Care, Dália NogueiraTransitioning to a New Case Mix Grouper to Fund Long-Term CareHomes in Ontario, Canada, San Adeline TsuiUsing the Adjusted Clinical Groups to Describe Newly Admitted NursingHome Residents in Stockholm, Gunnar LjunggrenImplementation of Activity-Based Funding for Long-Term Care in
Alberta, Stephen Duckett
St-Antoine AMeeting Room9th Floor
4C: Case Mix and Data QualityModerator: Michael WilkeAuditing in the Irish Case Mix Budget Models, Mark O’ConnorCoded Data Quality for Case Mix Payment: Insights From Two ExternalAudits, Beth ReidClinical Documentation Manual Audit, Ken FanData Quality Considerations With Increasing Access and Timeliness ofIrish Hospital Activity Data, Deirdre Murphy
St-Antoine BMeeting Room9th Floor
4D: Cost Data and Cost WeightsModerator: Darren GersonA Comparison: Estimated Costs Using Case Mix Tools Versus theCanadian Patient Cost Database, Bob RenThe Australian Hospital Patient Costing Standards and SupportingQuality Framework, Jo MurrayNational DRG Cost Weights in Finland, Tapio PitkärantaCost Weights for Activity-Based Funding in Canada—Building UponWhat We Have, Kevin Murphy
4:30–5:30 p.m. PCSI General Assembly Part II
Fortifications Ballroom (9th Floor)
8/13/2019 2011 Montreal Conference Abstract Book
http://slidepdf.com/reader/full/2011-montreal-conference-abstract-book 29/1661
Each patient counts
2 7 t h P C S I C o n f e r e n c e | O c t o b e r 1 9 t o 2 2 , 2 0 1 1 | M o n t r é a l , Q u e b e c , C a n a d a
7:30–11 p.m. Social EventGala Dinner
Join us for a truly memorable evening with Cirque Éloize.
Positioned at the heart of the renewal of circus arts, Cirque Éloize has been creatingmoving performances filled with magic since 1993.
Based on the multidisciplinary talents of its artists, Cirque Éloize expresses itsinnovative nature through theatricality and humanity, and combines circus arts withmusic, dance and theatre in a path-breaking and original manner. With seven originalproductions to its credit, Cirque Éloize has presented more than 4,000 performancesin 395 cities and 31 countries located around the world.
In addition to its tour performances, Cirque Éloize develops personalized conceptsfor international special events. To date, more than 1,250 events have taken place.
Since 2004, Cirque Éloize’s head office and creative studio are located in the GareDalhousie, a historical building. The Dalhousie train station, a former CanadianPacific (CP) station marks the northeastern edge of Old Montréal and illustrates itslong-standing role as one of the city’s railway hubs. In 1886, the first trans-Canadatrain pulled out of the new Dalhousie Station for Vancouver. From 1986 to 2003, thisbuilding housed the National School for Circus Arts of Montreal.
Location:Cirque Eloize, 417 rue Berri(Located in the heart of Old Montréal, within walking distance from the hotel)Reception star ting at 7:30 p.m.Dinner at 8:30 p.m.
8/13/2019 2011 Montreal Conference Abstract Book
http://slidepdf.com/reader/full/2011-montreal-conference-abstract-book 30/16614
= ( WX ′ – – WY
β = ( WX ′ ) – XWY
= β + ε
= + ε
= + εQ75+ .5 x (Q.
5- Q
25
Q75 1.5 (Q
75 -
25)
2 7 t h P C S I C o n f e r e n c e | O c t o b e r 1 9 t o 2 2 , 2 0 1 1 | M o n t r é a l , Q u e b e c , C a n a d a
Each patient counts
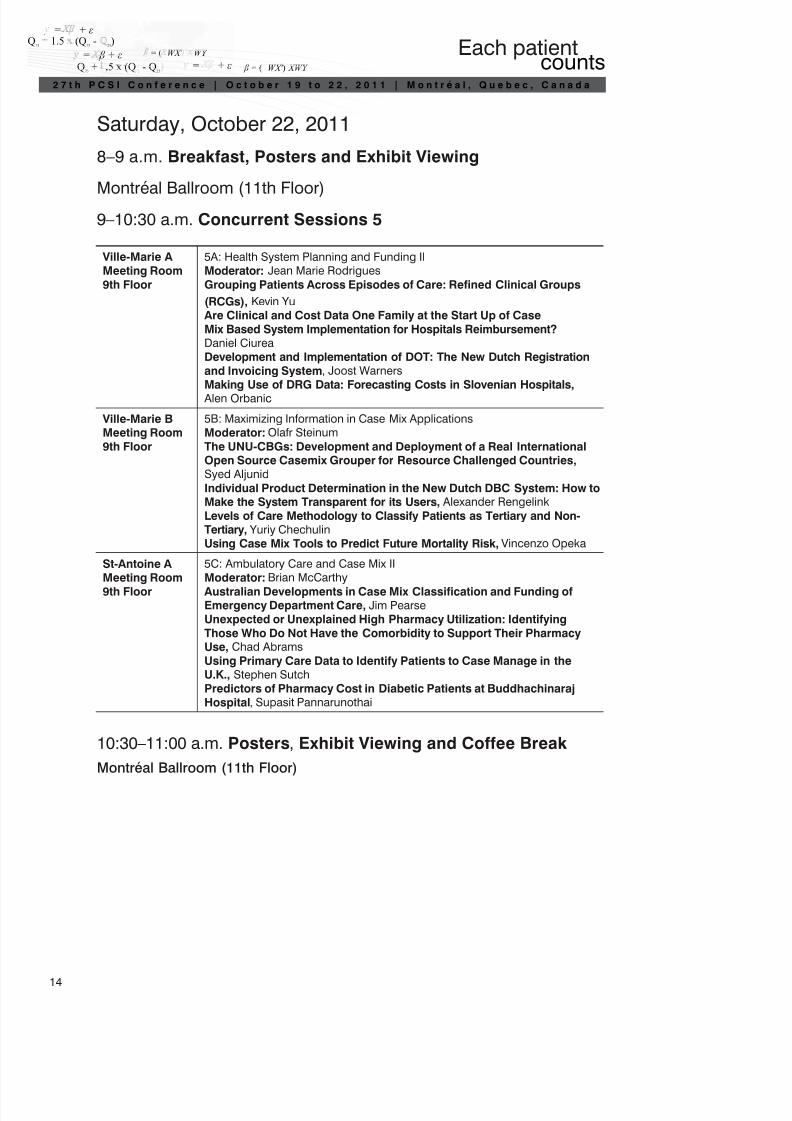
Saturday, October 22, 2011
8–9 a.m. Breakfast, Posters and Exhibit Viewing
Montréal Ballroom (11th Floor)9–10:30 a.m. Concurrent Sessions 5
Ville-Marie AMeeting Room9th Floor
5A: Health System Planning and Funding IIModerator: Jean Marie RodriguesGrouping Patients Across Episodes of Care: Refined Clinical Groups
(RCGs), Kevin YuAre Clinical and Cost Data One Family at the Start Up of CaseMix Based System Implementation for Hospitals Reimbursement? Daniel CiureaDevelopment and Implementation of DOT: The New Dutch Registrationand Invoicing System, Joost WarnersMaking Use of DRG Data: Forecasting Costs in Slovenian Hospitals, Alen Orbanic
Ville-Marie BMeeting Room9th Floor
5B: Maximizing Information in Case Mix ApplicationsModerator: Olafr SteinumThe UNU-CBGs: Development and Deployment of a Real InternationalOpen Source Casemix Grouper for Resource Challenged Countries, Syed AljunidIndividual Product Determination in the New Dutch DBC System: How toMake the System Transparent for its Users, Alexander RengelinkLevels of Care Methodology to Classify Patients as Tertiary and Non-Tertiary, Yuriy ChechulinUsing Case Mix Tools to Predict Future Mortality Risk, Vincenzo Opeka
St-Antoine AMeeting Room
9th Floor
5C: Ambulatory Care and Case Mix IIModerator: Brian McCarthyAustralian Developments in Case Mix Classification and Funding ofEmergency Department Care, Jim PearseUnexpected or Unexplained High Pharmacy Utilization: IdentifyingThose Who Do Not Have the Comorbidity to Support Their PharmacyUse, Chad AbramsUsing Primary Care Data to Identify Patients to Case Manage in theU.K., Stephen SutchPredictors of Pharmacy Cost in Diabetic Patients at BuddhachinarajHospital, Supasit Pannarunothai
10:30–11:00 a.m. Posters, Exhibit Viewing and Coffee Break
Montréal Ballroom (11th Floor)

8/13/2019 2011 Montreal Conference Abstract Book
http://slidepdf.com/reader/full/2011-montreal-conference-abstract-book 31/166
1
Each patient counts
2 7 t h P C S I C o n f e r e n c e | O c t o b e r 1 9 t o 2 2 , 2 0 1 1 | M o n t r é a l , Q u e b e c , C a n a d a
11 a.m.–12:30 p.m. Concurrent Sessions 6
Ville-Marie AMeeting Room9th Floor
6A: Innovation in Case Mix ApplicationsModerator: Paula MonteithEnabling Transparency and System Evaluation With NationalImplementation of Inpatient Rehabilitation Grouping Methodologies, Ian JoinerComparative Analysis of Rehabilitation Groupers, Klara DimitrovovaReal-Time Monitoring of Patient Outcome—VLAD, Deacons YeungTaking Care of Hip Fractures: 12 Years of Practice in France (1998–2009), Philippe Oberlin
Ville-Marie BMeeting Room9th Floor
6B: Health System Planning and Case Mix IIModerator: Virginia JordanEpisode Grouping and Assessing Appropriateness of Patient Care, Tresa StaevenCollecting Hospital Patient Data in Ireland—The Next Generation, Philip DunneIs the Disability Profile an Important Issue for Projecting Costs With
Aging? Dália Nogueira
St-Antoine AMeeting Room9th Floor
6C: Cost Weight CalculationsModerator: Stephen SutchPatient-Level Costing for Thai Diagnosis-Related Group in Thailand:A Micro-Costing Approach, Orathai KhiaocharoenDevelopment of the Australian All Product Costing Process,Karen ChudleighAdjusting Non-Standardized Data to Facilitate National Reporting, Sheril PerryReal-Time Cost-Database—An Advantage for DRG-Tariffs and HospitalBudgets, Maria Larsen
St-Antoine BMeeting Room9th Floor
6D: Care Quality and Case Mix IIModerator: Heather RichardsMeasurement of the Elderly’s Participation in the Community: NewDomain of Quality of Life Becomes Measurable, Jiro OkochiEvaluating Quality of Care in Hong Kong Through Identification ofPotentially Preventable Readmissions Within the Current UnplannedReadmissions Indicator Framework, Dr. K. H. LeePotentially Preventable Readmissions in Madrid, Marc BerlinguetA Costing Study of Neonatal Intensive Care for Newborn Infants WithBirth Weight Between 500–1500 grams, Kathy Conway
12:30–1 p.m. Closing Plenary
Fortifications Ballroom (9th Floor)
1–2 p.m. Lunch
Montréal Ballroom (11th Floor)
8/13/2019 2011 Montreal Conference Abstract Book
http://slidepdf.com/reader/full/2011-montreal-conference-abstract-book 32/16616
= ( WX ′ – – WY
β = ( WX ′ ) – XWY
= β + ε
= + ε
= + εQ75+ .5 x (Q.
5- Q
25
Q75 1.5 (Q
75 -
25)
2 7 t h P C S I C o n f e r e n c e | O c t o b e r 1 9 t o 2 2 , 2 0 1 1 | M o n t r é a l , Q u e b e c , C a n a d a
Each patient counts
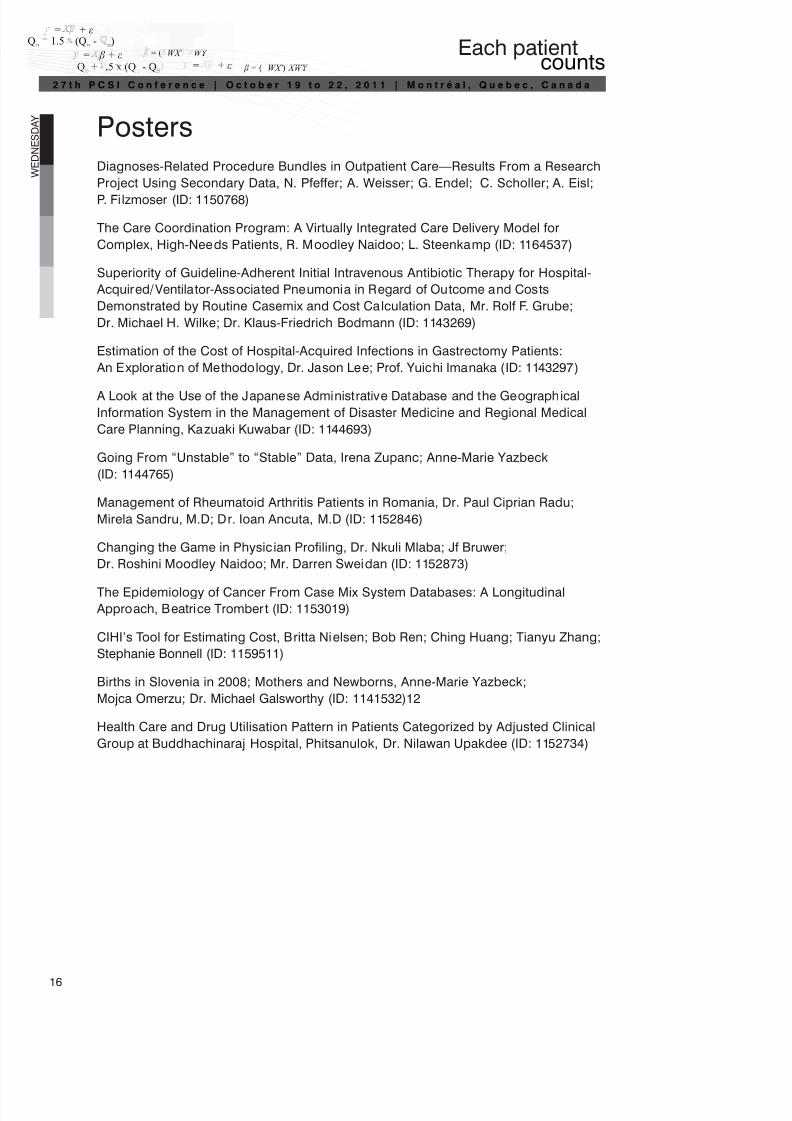
W E D N E S D A Y Posters
Diagnoses-Related Procedure Bundles in Outpatient Care—Results From a ResearchProject Using Secondary Data, N. Pfeffer; A. Weisser; G. Endel; C. Scholler; A. Eisl;
P. Filzmoser (ID: 1150768)
The Care Coordination Program: A Virtually Integrated Care Delivery Model forComplex, High-Needs Patients, R. Moodley Naidoo; L. Steenkamp (ID: 1164537)
Superiority of Guideline-Adherent Initial Intravenous Antibiotic Therapy for Hospital- Acquired/Ventilator-Associated Pneumonia in Regard of Outcome and CostsDemonstrated by Routine Casemix and Cost Calculation Data, Mr. Rolf F. Grube;Dr. Michael H. Wilke; Dr. Klaus-Friedrich Bodmann (ID: 1143269)
Estimation of the Cost of Hospital-Acquired Infections in Gastrectomy Patients: An Exploration of Methodology, Dr. Jason Lee; Prof. Yuichi Imanaka (ID: 1143297)
A Look at the Use of the Japanese Administrative Database and the GeographicalInformation System in the Management of Disaster Medicine and Regional MedicalCare Planning, Kazuaki Kuwabar (ID: 1144693)
Going From “Unstable” to “Stable” Data, Irena Zupanc; Anne-Marie Yazbeck(ID: 1144765)
Management of Rheumatoid Arthritis Patients in Romania, Dr. Paul Ciprian Radu;Mirela Sandru, M.D; Dr. Ioan Ancuta, M.D (ID: 1152846)
Changing the Game in Physician Profiling, Dr. Nkuli Mlaba; Jf Bruwer;Dr. Roshini Moodley Naidoo; Mr. Darren Sweidan (ID: 1152873)
The Epidemiology of Cancer From Case Mix System Databases: A Longitudinal Approach, Beatrice Tromber t (ID: 1153019)
CIHI’s Tool for Estimating Cost, Britta Nielsen; Bob Ren; Ching Huang; Tianyu Zhang;Stephanie Bonnell (ID: 1159511)
Births in Slovenia in 2008; Mothers and Newborns, Anne-Marie Yazbeck;Mojca Omerzu; Dr. Michael Galsworthy (ID: 1141532)12
Health Care and Drug Utilisation Pattern in Patients Categorized by Adjusted ClinicalGroup at Buddhachinaraj Hospital, Phitsanulok, Dr. Nilawan Upakdee (ID: 1152734)
8/13/2019 2011 Montreal Conference Abstract Book
http://slidepdf.com/reader/full/2011-montreal-conference-abstract-book 33/1661
Each patient counts
2 7 t h P C S I C o n f e r e n c e | O c t o b e r 1 9 t o 2 2 , 2 0 1 1 | M o n t r é a l , Q u e b e c , C a n a d a
Pre-Conference WorkshopsWednesday, October 19, 2011
Workshop AHow to Harmonise Classifications of Procedures for Case Mix Applications? From the Present Situation to the ICHI (InternationalClassification of Health Intervention) Initiative
Facilitator/moderator: Jean Marie Rodrigues, University of Saint Etienne, CHU,Department of Public Health and Medical Informatics, Saint Etienne, France; WHOCollaborating Centre for International Classifications in French Language, Paris, France
Co-presenters: Martti Virtanen, CEO, Nordic Case Mix Centre, Helsinki, Finland; Lori
Moskal, Canadian Institute for Health Information, Ottawa, Canada; Olafr Steinum,diaQualos AB, Goteborg, Sweden; Dana Burduja, Programs Director, Centre forHealth Policy and Services, Bucharest, Romania
Relevance to PCSI objectives and expected audience: The diversity ofclassifications of procedures is the main obstacle to the dissemination of casemix systems around the world and to their comparison. The expected audience isbroad, from coders to decision-makers, researchers and academia, case mix offices’technical staff, etc.
Objectives: The workshop is meant to present the ICHI initiative based oninternational terminological resources standards to harmonise, at a world level, thedifferent classifications of procedures and to ask the different stakeholder presenters
(WHO collaborative centres, national reference information centres, case mix offices,coders and health care professionals and international organization case mix systemsimplementers) to comment on the present situation and the ICHI initiative.
Overview
Introduction: Standardization in Health Care Terminologies: Jean Marie Rodrigues
ICHI initiative: Jean Marie Rodrigues and Lori Moskal
Comment from a case mix office: Martti Virtanen
Comment from a national reference information system: Lori Moskal
Comment from a health care professional coder: Olafr Steinum
Comment from an international organization case mix system implementer: Dana Burduja
General discussions

8/13/2019 2011 Montreal Conference Abstract Book
http://slidepdf.com/reader/full/2011-montreal-conference-abstract-book 34/16618
= ( WX ′ – – WY
β = ( WX ′ ) – XWY
= β + ε
= + ε
= + εQ75+ .5 x (Q.
5- Q
25
Q75 1.5 (Q
75 -
25)
2 7 t h P C S I C o n f e r e n c e | O c t o b e r 1 9 t o 2 2 , 2 0 1 1 | M o n t r é a l , Q u e b e c , C a n a d a
Each patient counts
W E D N E S D A Y Workshop B
Profiling Devices, Drugs, Implants as an Additional Profile ofCasemix Tools Using GS1
Facilitator/Moderator: Jacob Hofdijk (Casemix, the Netherlands), Ulrike Kreysa (GS1)and representatives of Covidien, Meditech, BISLIFE (names to be confirmed)
For many years, both nationally and internationally, it has been an issue to includeinnovative devices, drugs and implants within casemix systems. It has beentechnically problematic to include the devices with the coding system for procedures.With the introduction of the GS1 system, each device can have a unique code.Recently, we have started the initiative to add an additional profile of devices,implants and drugs based on the GS1 code, which can be linked to each device fromthe market introduction. The workshop will focus on the potential of this additionalprofile to deal with innovations in casemix systems.
Workshop C
Costing Patient Care Services—An Introduction Using WorkedExamples
Facilitator/Moderator: Nigel Michell, Director, PowerHealth Solutions Ltd.
Co-presenter/co-moderator: Patrick Power, Executive Director, PowerHealthSolutions (fluent French speaker)
Relevance to PCSI objectives and expected audience: The workshop will be
particularly relevant to PCSI attendees from all disciplines, as it will provide anoverview of patient costing principles using worked examples and attendeeparticipation.
Objectives: Following participation in the project, attendees willHave an understanding of patient costing principles and their application to•different patient settings;Understand the concept of the GL cost allocation process, including the concept•of overhead and patient care cost centres, the use of cost allocations statisticssuch as floor area, number of meals served, etc., the need to refine the GL forpatient costing purposes and the methodologies for reconciling each step;Have an understanding of the patient-level data feeds required and their elements;•
Be able to set up linking rules to allow feeder-level data (theatre, imaging,• pathology, etc.) to be linked to the correct inpatient or outpatient attendance;Understand the concept of relative value units (RVUs) and their application to•patient costing;Understand the creation of services for patient costing purposes and the•assignment of these to the various patient care areas; andUnderstand the methodologies to be used to reconcile the patient-level costs•back to the general ledger.
8/13/2019 2011 Montreal Conference Abstract Book
http://slidepdf.com/reader/full/2011-montreal-conference-abstract-book 35/1661
Each patient counts
2 7 t h P C S I C o n f e r e n c e | O c t o b e r 1 9 t o 2 2 , 2 0 1 1 | M o n t r é a l , Q u e b e c , C a n a d a
Overview: Participants will take an active role in defining the GL and patient costingmethodologies to be used in the worked example. Feedback from this process willbe used to set up and run the patient costing application. Questions will be used toensure that participants have a good understanding of each step of the process.
Handouts will be provided. The workshop will assume that participants have anawareness of patient costing principles but little understanding of them.
Workshop D
From Case-Mix to Clinical Applications
Presenter: Dr. Michael Wilke
Objective: To find out which added value for clinical work and for the measurementof quality in health care systems can be drawn out of casemix routine data.
Items to be covered:
Presentations on the use of casemix data in clinical contexts•Background information on existing methods of quality evaluation in health care•Collaborative discussion•Creating inspiration for the participants•Possibilities for international collaboration•
Audience:
Clinicians dealing with casemix•IT experts•Casemix economists•Clinical coding staff•
Ideally, participants should be knowledgeable of their respective local casemix•system; have some clinical background; have some knowledge of data structuresand content that is today mainly used for casemix.
Workshop presentation:
The following topics should be reflected:Extending the benefits of casemix data•
Quality indicators (AHRQ, OECD, others)–
Prevalence or incidence statistics drawn out of the data–
Implementation of innovations–
Casemix effects of introducing new clinical practices–
Chances and limitations• Are the allegations among clinical researchers real limitations or is it a question–
of communication culture?What could be done to promote the multidisciplinary use of the data?–
International implications•Where do we have data that could be used even for international comparisons?–

8/13/2019 2011 Montreal Conference Abstract Book
http://slidepdf.com/reader/full/2011-montreal-conference-abstract-book 36/16620
= ( WX ′ – – WY
β = ( WX ′ ) – XWY
= β + ε
= + ε
= + εQ75+ .5 x (Q.
5- Q
25
Q75 1.5 (Q
75 -
25)
2 7 t h P C S I C o n f e r e n c e | O c t o b e r 1 9 t o 2 2 , 2 0 1 1 | M o n t r é a l , Q u e b e c , C a n a d a
Each patient counts
W E D N E S D A Y Workshop E
Applying Predictive Modelling to Improve theDelivery of Health Care
Presenters: Dr. Karen Kinder, Steve Sutch and Chad Abrams,The Johns Hopkins University
Objective: The advantages that predictive modelling offer to more efficientmanagement of patient care are not restricted to predicting costs. As has beendemonstrated in both public and private health care systems around the globe,predictive modelling contributes to improved clinical, financial and managerialmanagement. These include the ability to
Predict high-risk individuals for inclusion in care management, pharmacy•management and disease management programs;Estimate future resource use;•Identify individuals at risk of hospitalization;•Identify patients whose pharmacy expenditures are greater than what is predicted•based upon their morbidity profile alone; andEstablish equitable budgeting.•
The aim of this workshop is to provide an insight into the numerous applicationsof predictive modelling in the ambulatory health care sector, from integrated carenetworks to primary care clinics and, finally, at the individual provider level.
Methods: The workshop will open with an introductory presentation on the numerousapplications of predictive modelling within the integrated and ambulatory caresectors. Provided that sufficient interest is demonstrated in terms of participation,the workshop would be divided into individual sessions based on three applications:
Financial management/budgeting•Pharmacy management/patient identification•Case management/patient identification•
Each session will be comprised of presentations illustrating real-world case-mixapplications. The workshop would conclude with a plenary session which wouldsummarize the take-home messages of the three sessions and include a discussionon the future of predictive modelling.
Presentations: Applicable results wil l be presented from several countries, includingCanada, the U.S., Malaysia, Sweden and the U.K.
Conclusions: The participants will experience first-hand how to apply case-mix toclinical, financial and managerial decisions.
8/13/2019 2011 Montreal Conference Abstract Book
http://slidepdf.com/reader/full/2011-montreal-conference-abstract-book 37/1662
Each patient counts
2 7 t h P C S I C o n f e r e n c e | O c t o b e r 1 9 t o 2 2 , 2 0 1 1 | M o n t r é a l , Q u e b e c , C a n a d a
Workshop F
Case-Mix Systems for Non-Acute Populations Across theContinuum of Care: The interRAI Experience
Presenters: John P. Hirdes, PhD, Professor, School of Public Health and HealthSystems, University of Waterloo; and Brant E. Fries, Professor of Health Managementand Policy, School of Public Health, and Research Professor, Institute of Gerontology,School of Medicine, University of Michigan; and Chief, Health Systems Research, VA Ann Arbor Healthcare System GRECC
Objectives: This workshop examines case-mix systems developed by the interRAIresearch group (www.interrai.org) for various care settings serving non-acutepopulations, including nursing homes, complex continuing care hospitals, home careand inpatient psychiatry. The clinical assessment systems developed by interRAIhave been adopted by numerous jurisdictions internationally, including Canada,where data from interRAI assessments is managed nationally by the CanadianInstitute for Health Information (CIHI).
Three case-mix systems will be examined: a) Resource Utilization Groups (RUG-IIIand the more recent RUG-IV system); b) Resource Utilizat ion Groups for Home Care(RUG-III/HC); and c) the System for Classification of In-Patient Psychiatry (SCIPP).The discussion will include technical details on the methods used to estimate andpredict costs in each of the three systems using staff time measurement studies(in the case of RUG-III/IV and SCIPP) and combined formal and informal care costs(in the case of RUG-III/HC). It will also consider the relationship of case-mix systemswith clinical practice, performance measurement and payment systems. In addition,the workshop will explore inter-connections between different sectors of the healthcare system and examine the possibilities and limitations of pan-sector case-mixsolutions for non-acute populations. Finally, the potential application of knowledgegained from the non-acute settings to case mix for the frail elderly and persons withdisabilities in acute care settings will be considered.
Workshop G
Continuity of Care/Contsys
Facilitators/Moderators: Jacob Hofdijk, Michael Rigby, Contsys Project Team andCaroline Hyden (names to be confirmed)
Based on the new developments of the CEN 13940, a new workshop will beorganized about the concepts and the implementation of continuity of care systemswithin health care, integrating prevention, health promotion, health care and socialcare. The workshop will deal with concepts and practical experience.

8/13/2019 2011 Montreal Conference Abstract Book
http://slidepdf.com/reader/full/2011-montreal-conference-abstract-book 38/16622
= ( WX ′ – – WY
β = ( WX ′ ) – XWY
= β + ε
= + ε
= + εQ75+ .5 x (Q.
5- Q
25
Q75 1.5 (Q
75 -
25)
2 7 t h P C S I C o n f e r e n c e | O c t o b e r 1 9 t o 2 2 , 2 0 1 1 | M o n t r é a l , Q u e b e c , C a n a d a
Each patient counts
W E D N E S D A Y Workshop H
Developing an Activity Based Funding (ABF) Model forNon-Admitted Patient Services
Facilitator/moderator: Joe Scuteri, HealthConsult Pty Ltd., Australia
Co-presenter/co-moderator: Lisa Fodero, HealthConsult Pty Ltd.; Heather Richards,Canadian Institute for Health Information. Additional presenters to be confirmed.
Relevance to PCSI and expected audience: Coders, clinical costing staff, decision-makers, IT, researchers and academia, case-mix offices’ technical staff, etc.
This topic is expected to be very relevant to PCSI, as it incorporates case-mixdevelopment principles and involves an international team of experts sharingtheir experiences in developing ABF models for non-admitted services. It drawstogether the key components of case mix, i.e. counting, classifying and costing
services to produce an ABF model. We’d expect that the audience would be madeup of a mixture of health professionals, including medical and non-medical staff,finance staff, clinical costing staff, clinical coders, decision-makers, researchers,academia, etc.
Objectives:
To discuss a framework for building an activity based model for hospital-based•non-admitted patient services; andTo share international experience of building the various components of an• ABF model for non-admitted patient services (e.g. count ing rules, classificationsystems, costing, funding model, etc.).
Overview: Australia is currently embarking on a national health reform. The nationalhealth reform is largely focused on reforming the financing of health care servicesin Australia. As part of this work, Australia is developing ABF models for all healthwork streams (e.g. acute admitted, sub-acute, non-admitted and emergency).Thisworkshop would involve sharing some of the experiences in Australia with regard tobuilding an activity based funding model for hospital-based non-admitted patientservices. Presenters from within and outside Australia would share their experiencein building various components of the ABF model. For example: Australian speakeron counting rules, a Canadian speaker on classification systems, a U.S. speaker oncosting and perhaps a U.K. speaker on funding.
8/13/2019 2011 Montreal Conference Abstract Book
http://slidepdf.com/reader/full/2011-montreal-conference-abstract-book 39/1662
Each patient counts
2 7 t h P C S I C o n f e r e n c e | O c t o b e r 1 9 t o 2 2 , 2 0 1 1 | M o n t r é a l , Q u e b e c , C a n a d a
Abstracts
Thursday, October 20, 2011SESSION 1A—Morbidity Burden and Case Mix
ID:1151322
Profiling High Morbidity Burden in Primary Care: Calibrationof a Case Mix Model to Account for the Burden Primary CarePhysicians Are Faced With
Introduction: Primary care encounters are more complex than those of specialists.Primary care physicians (PCPs) face a diverse patient population, are tasked with
diagnosing and treating a wide array of health conditions and are in charge ofintegrating all aspects of care. The Johns Hopkins University Adjusted ClinicalGroups® (ACG) system provides a number of patient classification tools. Our aimwas to calibrate the mutually exclusive ACG categories using counts of morbiditytypes in order to represent the burden PCPs cope with.
Methods: EMR-based diagnoses from all medical encounters (primary, specialty,and hospital care), as well as cost and healthcare utilization data were attained fromClalit’s data warehouse for a representative sample of 300,000 adult Clalit members(~10%) in 2009. The entire sample was classified into one of 70 ACGs. We identi fiedlarge variations in the number of morbidity types (another component of the systemtermed Aggregate Diagnostic Groups (ADGs)), with an average of 4.58 (SD: 3.24)
ADGs in each ACG cell. These variations in the non-mutually exclusive morbiditytypes were shown to be highly correlated with various types of resource use. Toaccount for this variability we calibrated the ACG cells according to the number of ADGs. Each ACG was thus divided to 1-9 sub-groups according to the number of ADGs, result ing in 233 new categories. We then assigned a weighted score to eachnew category. The weighted score was the average 2-year relative total cost (totalambulatory and hospital costs for 2009-2010 divided by the average 2-year costsfor the entire sample). The 233 categories were divided to 10 bands according to10th percentiles of the relative resource use weights. Regression models were usedto assess R2 of the weighted score based on these 10 bands in determining annualconcurrent and prospective cost, drug utilization, and PCP visits. All utilization wastrimmed at 3 SD above the mean to reduce the effects of outliers. The explanation
of resource use provided by the 10 band weighted score was compared with theclassification of the original ACG’s weighted scores.
Results: The calculated weights ranged from 0.12 to 3.6 in the ten bands, andresulted in an R2 of 25.8%, 34.8%, 39.8%, 43.2% for total costs, community carecosts, PCP visits and drug consumption, respectively. These outcomes were betterthan outcomes attained with the original ACG weighted score, in explaining variabilityin community care, drugs, and PCP visits (R2 of 31.0%, 18.1%, 15.7%, and 27.9% fortotal costs, community care costs, PCP visits and drug consumption, respectively).
8/13/2019 2011 Montreal Conference Abstract Book
http://slidepdf.com/reader/full/2011-montreal-conference-abstract-book 40/16624
= ( WX ′ – – WY
β = ( WX ′ ) – XWY
= β + ε
= + ε
= + εQ75+ .5 x (Q.
5- Q
25
Q75 1.5 (Q
75 -
25)
2 7 t h P C S I C o n f e r e n c e | O c t o b e r 1 9 t o 2 2 , 2 0 1 1 | M o n t r é a l , Q u e b e c , C a n a d a
Each patient counts
T H U R
S D A Y
Average patient weight among all patients of a single physician ranged from 0.52 to1.88. Sum of weights of all patients for a single physician was a practical measure forthe burden on a single physician, and ranged from 588 to 2982, with minimal year-to-year variability. This single parameter proves to be a useful, stable, easy to interpretand acceptable morbidity measure for resource allocation among PCPs.
Conclusions: Morbidity type count is a strong predictor of morbidity burden inprimary care, and a powerful modifier within non-homogenous ACGs. Weights basedon these modified ACGs grouped into ten relative resource bands are a useful tool forfair allocation of resources in primary care based on overall patient morbidity burden.
AUTHORS/INSTITUTIONS: R. D. Balicer ([email protected]); H. Bitterman([email protected]), Epidemiology, Ben-Gurion University of the Negev,Beer-Sheva, ISRAEL; E. Shadmi ([email protected]), Faculty of Social Welfareand Health Sciences, Haifa University, Haifa, ISRAEL; C. Abrams ([email protected]); K. Kinder ([email protected]); J. P. Weiner ([email protected]), HealthPolicy and Management, Johns Hopkins School of Public Health, Baltimore, MD;
O. Jacobson ([email protected]), Community Division, Clalit Health. Services,Tel Aviv, ISRAEL.
1165286
Measuring the Case Mix of Physician Practices in Primary-CareReform Models in Ontario, Canada
Introduction: A number of di fferent blended-payment models for primary-caredelivery have been introduced in Ontario, Canada over the last decade. These modelshave different incentives and, therefore, have attracted different physicians andpatients, depending upon their geographical location and practice characteristics.
As policy-makers at the Ministry of Health and Long-Term Care evaluate and considerpossible changes to these models, it is important that they be able to characterizethe Casemix of patients who are enrolled to them, and to understand the healthcareneeds of those who have not enrolled with a primary-care model. This study evaluatesa method for summarizing the Casemix of primary-care rosters, and it examines thevariations of Casemix between and within the different model types.
Methods: The study population includes all residents of Ontario who were registeredwith the Ontario Health Insurance Plan (OHIP) on March 31, 2010, and all primary-carephysicians who belonged to a primary-care reform model on the same date. Eachindividual in the province was assigned a morbidity weight using the Johns Hopkins
Adjusted Clinical Groups (ACG) Casemix System along with diagnosis data collectedduring the previous year. The Casemix of each physician’s roster was summarizedwith a Standardized ACG Morbidity Index (SMI), which is the standardized averagemorbidity weight of all patients on the roster. The roster SMIs were compared acrossand within the three following group types: enhanced fee-for-service, capitation, andteam-based capitation.

8/13/2019 2011 Montreal Conference Abstract Book
http://slidepdf.com/reader/full/2011-montreal-conference-abstract-book 41/1662
Each patient counts
2 7 t h P C S I C o n f e r e n c e | O c t o b e r 1 9 t o 2 2 , 2 0 1 1 | M o n t r é a l , Q u e b e c , C a n a d a
Results: The study sample included 6,579 physician rosters which consisted of9,225,428 patients. The mean SMI of enhanced fee-for-service rosters was higherthan the SMI for both types of capitation groups (1.22 vs. 1.03; p<0.001). Theinterquartile range of the enhanced fee-for-service rosters (1.30-0.93) was greaterthan both the capitation rosters (1.20-0.88) and the team-based capitation rosters(1.18-0.88). The 95th percent ile of the enhanced fee-for-service rosters was 1.74 withthe other two groups having a 95th percentile of 1.52.
Conclusions: The rosters of physicians in enhanced fee-for-service groups have ahigher average morbidity burden and greater variation in morbidity than the capitationgroup rosters. Being able to easily and reliably measure the morbidity burden allowsdecision makers to identify and fairly reimburse physicians whose patients have ahigher burden of illness.
AUTHORS/INSTITUTIONS: L. Sibley, R.H. ([email protected]); Glazier, Institutefor Clinical Evaluative Sciences, Sunnybrook Health Sciences Centre, Toronto,Ontario, CANADA
R.H. Glazier, ([email protected]; Department of Family and CommunityMedicine, University of Toronto, Toronto, Ontario, CANADAB. Hutchison ([email protected]), Centre of Health Economics and Policy Analysis,McMaster University, Department of Family Medicine, McMaster University, Hamilton,Ontario, CANADA
1152929
Analysing the Emergence of Complex Morbidities. A 30 Years’Follow-Up on a Defined Population in Sweden
Introduction: Background: Many studies have been made on the diagnosis level.Few studies have clarified the patient aspect with the not so unusual mix of combineddiagnoses. Even fewer studies have displayed the continuity of care over time in thepatient’s perspective.
Objectives: The overall aim was to display the pattern of morbidity in a definedpopulation over time, based on each individual’s combined diagnoses registered inall types of care. The objective of this study was to explore and analyse which typesand combinations of morbidities lead to a very complex multimorbidity status later on.
Methods: Methods and materials: Longitudinal data from a database with morethan 20,000 individuals were used, comprising all health care delivered to them intheir county within a 30-year-period. Diagnoses were grouped by the Johns Hopkins
ACG case-mix system, version 9.0.1i. 1,000 patients, selected by the most complexmorbidity states at the end of the period, were analysed in detail.
Results: Results: The pattern of the burden of morbidity could be displayed during a30-year-period in terms of more or less complex morbidity categories. The multimorbiditypatterns could be traced back to the first emergence of combined diseases.
8/13/2019 2011 Montreal Conference Abstract Book
http://slidepdf.com/reader/full/2011-montreal-conference-abstract-book 42/16626
= ( WX ′ – – WY
β = ( WX ′ ) – XWY
= β + ε
= + ε
= + εQ75+ .5 x (Q.
5- Q
25
Q75 1.5 (Q
75 -
25)
2 7 t h P C S I C o n f e r e n c e | O c t o b e r 1 9 t o 2 2 , 2 0 1 1 | M o n t r é a l , Q u e b e c , C a n a d a
Each patient counts
T H U R
S D A Y
Conclusions: Conclusions: Analyses of longitudinal patient medical records revealchanges in terms of complexity in the burden of morbidity in defined populationsover time, which might lead to better understanding of multi- and co-morbitity amongindividuals.
Discussion: Numbers of specific diagnoses were shown to differ over time, althoughthey did not influence very much the types of morbidities. This first work-through ofthe database from the individual patient’s perspective revealed some gaps in thecontinuity of registering into the store, not found earlier.Further research: Some types of morbidity were seen as more common than othersas a trigger for a more complex multimorbidity among patient groups. This might be agood start to launch projects aiming at understanding the emergence of co-morbidityand multimorbidity among patients.
AUTHORS/INSTITUTIONS: L. Carlsson ([email protected]), G.H. Nilsson([email protected]), Neurobiology, Care sciences and Community, Center forFamily and Community Medicine, Stockholm, Sweden, SWEDEN;
SESSION 1B—Health System Planning and Funding
ID:1165288
Understanding the Episode of Care for Transplant Patients
Introduction: Funders and policy makers are looking for ways to manage increasinghealthcare costs and provide funding for entire episodes of care that extend beyonda single stay or visit at a healthcare institution. In Ontario hospital funding is based onglobal funding, which is a lump sum distributed annually to hospitals. A small percentageof funding in Ontario is based on volume and fixed fees for selected procedures.
In a departure from the current funding policies, the Ontario Ministry of Healthand Long-Term Care (MoHLTC) is formulating a strategy to increase patient basedfunding. This init iative is known as Patient based Payment (PbP). To execute thischange in funding policy, the MoHLTC is extensively using patient level cost data todevelop strategy and funding models. To gather evidence based information, theMoHTLC has funded a case-costing project to assist 48 facilities produce patientlevel cost data.
The current information systems and reporting standards in Canada are designedto record patient-care information by patient type during a single stay or visit inone institution. Although patients may receive health care from multiple healthcare
providers, patient information is not linked or accessible by the multiple healthcareproviders. The limitations of the current information systems have resulted in patientdata that is difficult to access even within a single healthcare facility.
The single episode of care (one stay or visit) is not representative of the healthcareneeded, or the entire cost of care related to a condition. This is particularly true forpatients living with chronic diseases, or patients who have received complex medicalprocedures such as transplants and, ultimately, the healthcare services receivedthroughout a patient’s life.
8/13/2019 2011 Montreal Conference Abstract Book
http://slidepdf.com/reader/full/2011-montreal-conference-abstract-book 43/1662
Each patient counts
2 7 t h P C S I C o n f e r e n c e | O c t o b e r 1 9 t o 2 2 , 2 0 1 1 | M o n t r é a l , Q u e b e c , C a n a d a
The transplant process is complex and can be divided into four phases: pre-transplant, assessment and waiting period; donor procurement; peri-operative;and post-discharge phase. Pre- and post-transplant healthcare services are notincluded in the procedure based funding and may be provided by multiple healthcare
providers. Moreover, post-transplant care has increased as a result of improvedsurvival rate resulting in continued healthcare.
In response, we propose to develop a linking of patient data describing completecare for all activities related to transplant. We suggest that a new model for episodiccare is needed that provides funding for an entire episode of care. This will result inthe proper incentives for improved care between providers. In this paper, we identifychallenges and opportunities for this type of work in the future.
Method: In 2008, The Hospital for Sick Children in Toronto (SickKids) examinedthe cost of transplant patients, including pre- and post-transplant healthcareservices. This was done in order to understand the cost of the various organ
transplantations throughout the full continuum of care. Using the SickKids transplantregistry, 356 transplant patients were in this study. The study analyzed pre- andpost-transplantation activity including inpatient admissions, outpatient activity(medical daycare and clinics), diagnostics, and allied health services (e.g. socialwork, physiotherapy, child life, dietetics). A full year of patient activity was linkedto 44 transplantations encounters. The combined transplant and patient activitydata was linked to the cost data.
Result: The study demonstrated that the cost of transplantation for the peri-operative phase accounted for only 41.1% of the hospital’s total costs for treatingtransplantation patients. Pre- and post-inpatient activity accounted for 26.4% of thehospital’s costs, while ambulatory and diagnostic activity accounted for 32.5% of thehospital’s costs.
Conclusion: Reporting systems currently in place limit the ability to describeresource intensity and clinical care for the full continuity of care. With the variouscomplex and chronic patient populations that exist today, including transplants, thereis an increasing demand on the healthcare system. Information systems need to beenhanced to link episodes in order to appropriately measure and fund patient activityand costs throughout a patient’s disease management.
The Hospital for Sick Children has extensive experience providing the continuum ofcare from initial diagnosis through to post-treatment care. Some of this care is deliveredto patients over many years and in consultation and coordination with other healthcareproviders. Yet despite this extensive clinical experience, the understanding of the delivery
of care is difficult because of the disparate and silo-ed patient information. Funders,healthcare and information management providers should work together to poolknowledge and experiences and collaboratively design episode of care models. Theepisode of care model can be the catalyst for new approaches to delivering healthcare.
AUTHORS/INSTITUTIONS: P. Weeks, MedAssets, Toronto, Ontario, CANADA([email protected]);I. Blais, The Hospital for Sick Children, Toronto, Ontario, CANADA ([email protected]).

8/13/2019 2011 Montreal Conference Abstract Book
http://slidepdf.com/reader/full/2011-montreal-conference-abstract-book 44/16628
= ( WX ′ – – WY
β = ( WX ′ ) – XWY
= β + ε
= + ε
= + εQ75+ .5 x (Q.
5- Q
25
Q75 1.5 (Q
75 -
25)
2 7 t h P C S I C o n f e r e n c e | O c t o b e r 1 9 t o 2 2 , 2 0 1 1 | M o n t r é a l , Q u e b e c , C a n a d a
Each patient counts
T H U R
S D A Y
1152570)
Planning for ABF as Part of Reforming the AustralianHealthcare System
Introduction: A key part of Australia’s nat ional health reform policy is to implementactivity-based funding (ABF) for public hospitals from 1st July 2012. The Councilof Australian Governments (COAG) established the Health Reform ImplementationGroup (HRIG) to oversee the execution of the reforms. HRIG, in turn, created an ABFSub Group to advise on implementing ABF.
The HRIG ABF Sub Group established five Advisory Working Groups (AWGs) alignedto the following workstreams: subacute, emergency, non-admitted, and mental healthcare. As well, the groups were aligned to the National Hospital Cost Data Collection(NHCDC). The terms of reference for the AWGs included “the development of a workplan for the implementation of ABF”, which will contribute to an “overall national workplan to implement ABF”.
Methods: The HRIG ABF Sub Group decided that the proxy classifications systems tobe used in the initial ABF implementation were Australian Refined-Diagnosis RelatedGroups (AR-DRGs) for acute admitted, Australian National Sub-Acute and Non-AcutePatient Classification System (AN-SNAP) for subacute, NHCDC Tier 2 Clinics for non-admitted, and Urgency Related Groups (URGs) for emergency services. Work Planswere needed to determine what was required to implement ABF by 1st July 2012using the proxy classifications.
The planning methodology consisted of five parts. First, designing and distributing asurvey for each workstream to assess the existing data collection and the availabilityof support infrastructure across states/territories. Second, preparing a scoping/
gap analysis paper by analysing survey responses and interviewing state/territoryrepresentatives. Third, preparing the five draft Work Plans. Fourth, reviewing thedraft Work Plans at the final meetings of the AWGs. Fifth, developing the OverarchingWork Plan.
Results: Across three meetings with the AWGs, Work Plans were developed whichdefined the projects that must be done to attain the minimum position in terms of ABFinfrastructure in each workstream under the following headings: scope and data setcoverage; classification; counting rules and unit of count; costing; funding model;support infrastructure; data quality assurance; and governance.
The planning process revealed the state-of-play across the ABF workstreams as:Subacute – The initial focus of AN-SNAP will need to be on activity occurring in•
designated services. Implementation will be easier to achieve for rehabilitationcare and palliative care, where there is a relatively wide level of data collection.Considerable work is required to address issues for geriatric evaluation andmanagement and psychogeriatric care.
8/13/2019 2011 Montreal Conference Abstract Book
http://slidepdf.com/reader/full/2011-montreal-conference-abstract-book 45/1662
Each patient counts
2 7 t h P C S I C o n f e r e n c e | O c t o b e r 1 9 t o 2 2 , 2 0 1 1 | M o n t r é a l , Q u e b e c , C a n a d a
Non-admitted – The proxy classification is not yet completed, and the existing•version is not used in any routine data collection. All the data available for NHCDCTier 2 Clinics are produced by mapping from source data, which is collectedusing another classification system. This situation poses considerable challenges,particularly as there will be no historical data. and approaches to counting non-admitted patients vary greatly across states/territories.Emergency – Most states and territories have data collection systems that include•the ‘Emergency Depar tment (ED) diagnosis’, which is required to assign URGs.Initially, URGs can only be used in hospitals that have a recognised ED. UDGs(diagnosis not required) can be used for other emergency services. URGs will stillneed to be refined and updated prior to being used for ABF.Mental Health – The initial approach for mental health services is to use the proxy•classification systems for the workstream into which the service falls. However, thebest data on mental health services is in program-specific data collections, not inmainstream hospital systems. Also, there are significant limitations that need tobe addressed in the classification systems in relation to mental health care .
NHCDC – The challenge is to generate costs data to be used as an input to• developing national cost weights and setting efficient prices. There is littleconsistency in the costing methodologies used by states/territories to generatethe existing costs data. Extra studies undertaken to address this issue, and toadd to the coverage of existing costs data, need to be finished by end of 2011.This poses sizeable challenges in terms of the capacity and capability of theavailable resources.
The Overarching Plan presents the minimum infrastructure needed to implement ABFwithin each workstream. It integrates the 99 projects identified across the five AWGWork Plans into 35 higher-level projects. It also identifies projects that are consideredessential in order to enable national ABF implementation by the target date. In addition,
a risk analysis is presented.Conclusions: The Work Plans show that it will be difficult to achieve a commonstarting point across states/territories for ABF by 1st July 2012. ABF readiness alsovaries across workstreams. Implementation strategies need to challenge states/territories to reach minimum position, but also be sufficiently flexible to allow for ABF to start even where the required data are not available.
Disclaimer: The abstract does not necessarily represent the views of any AustralianGovernment agency.
AUTHORS/INSTITUTIONS: L. Fodero1, ([email protected])
J. Scuteri1, ( [email protected]); Jim Pearse2 (jpearse@healthpolicy.
com.au); Deniza Mazevska2 ([email protected])
1. HealthConsult, Sydney, New South Wales, AUSTRALIA
Health Policy Analysis, New South Wales, AUSTRALIA2.
8/13/2019 2011 Montreal Conference Abstract Book
http://slidepdf.com/reader/full/2011-montreal-conference-abstract-book 46/16630
= ( WX ′ – – WY
β = ( WX ′ ) – XWY
= β + ε
= + ε
= + εQ75+ .5 x (Q.
5- Q
25
Q75 1.5 (Q
75 -
25)
2 7 t h P C S I C o n f e r e n c e | O c t o b e r 1 9 t o 2 2 , 2 0 1 1 | M o n t r é a l , Q u e b e c , C a n a d a
Each patient counts
T H U R
S D A Y
1151821
Case Mix Funding in Ireland: From Retrospective to Prospective?Progress since 2010
Introduction: We presented on this topic at last years’ conference in Munich andthis presentation will cover the progress since last year.
The current Health Funding in Ireland will be summarized to give some context.The funding methodology is a historical Block Grant with adjustments for inflation/deflation, new developments, one offs and an adjustment for Case Mix.
Case Mix funding in Ireland is Budget Neutral which means that it is a zero sumgame. Funding is redistributed between hospitals based on the calculated measureof efficiency by comparing each hospital’s costs and activity against their peers. Activity is Case Mix adjusted to reflect the variat ion in complexity within each hospitalto derive a Hospital Base Price
The Case Mix Funding System used in Ireland covers the areas of Inpatients,Daycases, Outpatients and ED activity. The National Case Mix Programme usesthe Australian Refined DRG Classification system and ICD –AM coding systemfor Inpatients and Daycases only. For Outpatients we use Treatment ResourceGroups which are essentially specialty based and weighted attendances for ED.
The requirement to move to a funding system whereby “Money follows the patient”is now Government policy. Work commenced in the journey from Historical BlockGrant Funding to Activity Based Funding in 2010 and is ongoing in 2011.
Methods: A Prospective Funding Group within the HSE identified the issues inmoving to such a system of funding. The Prospective Funding Group was chaired
by the CEO of one of the largest hospitals in the country. The group identified theissues from a number of perspectives including costing, coding, hospitals andfunders. These issues will be outlined in detail during the presentation. The groupidentified Patient level Costing as the key issue and the reasons will also be detailedin the presentation
The Group decided that the Prospective Funding objectives should be:The system be transparent, understood and reward providers fairly.•It should drive and support good clinical practice and financial efficiency•Should reward appropriate high quality care•
International Developments in relation to Case Mix Funding was also a driving factor
for moving to Prospective funding with most of the leading countries in Europe usingDRG based funding systems.
Results: Progress to Date.
The Report on the first Patient Level Costing Study which commenced in 2010 hasbeen completed and the recommendations contained therein accepted. The reportincluded a “gap analysis” of issues to be addressed by hospitals going forwardwill be discussed at the Conference. A second study is under way at present andexpected to be completed by October 2011.
8/13/2019 2011 Montreal Conference Abstract Book
http://slidepdf.com/reader/full/2011-montreal-conference-abstract-book 47/1663
Each patient counts
2 7 t h P C S I C o n f e r e n c e | O c t o b e r 1 9 t o 2 2 , 2 0 1 1 | M o n t r é a l , Q u e b e c , C a n a d a
In the mean time a new Government has been elected whose policy is that moneyallows the patient. This is in line with recommendations from the previous Minister'sExpert Group on Resource Allocation .
The Ministry of Health have also requested that the HSE implement prospective
funding for a number of elective Orthopaedic DRG’S on a prospective funding basisfor the second half of 2011. This will be used as test run for what issues are likelyto arise on full implementation of a Prospective Funding system and will be coveredin detail in the presentation.
Conclusions: Case Mix Funding has been in operation in Ireland on a retrospectivebasis since 1995 and the move to a prospective an Activity based funding willrepresent a sea change. Essentially we will be moving from an incremental basisof funding to bottom up approach with funding following the patient. The journey fromretrospective to prospective is in the early stages and we will be seeking to learn fromthe experiences of other countries at this conference to assist us along the way.
The commencement of Prospective Funding for selected Or thopaedic DRG’S in 2011is the first step on the road to full implementation.
AUTHORS/INSTITUTIONS: B. Donovan ([email protected]),F. Bane ([email protected])Finance, Health Services Executive (HSE) Ireland, Naas, IRELAND;
1154416
Planning for the Future in Switzerland: Adapting the Facilitiesto the Demand of the Patient
Introduction: Together with a new nationwide financing system to be introduced for
acute and long-term care in Switzerland in 2012, a new planning for facilities will beimposed on the “cantons” (regional authorities in charge of healthcare): they will have toprovide lists of care centers chosen to meet their patients’ demand. Only these selectedcenters will then be financed by insurances and cantons (dual financing system).
Methods: With such financial implications, fine-tuning the planning of adequatefacilities becomes of high importance. A new solution has been developed usingactivity-based data and insurance data to forecast future demand, in particular inthe field of rehabilitation after cardiac problems.
Results: Using routine data, a combination of medical data (MDC 5), insurancedata on patient insurance coverage (private, semi-private and basic) and hospitaldischarge data (to which type of non-acute facility was the patient discharged)allowed to predict the size, specialties and structure of the necessary facilities.
Conclusions: The paper will describe the method, present examples of actualsituations and discuss the limits.
AUTHORS/INSTITUTIONS: J. Rey ([email protected]);H. Guillain([email protected]), isesuisse, Zurich, SWITZERLAND

8/13/2019 2011 Montreal Conference Abstract Book
http://slidepdf.com/reader/full/2011-montreal-conference-abstract-book 48/16632
= ( WX ′ – – WY
β = ( WX ′ ) – XWY
= β + ε
= + ε
= + εQ75+ .5 x (Q.
5- Q
25
Q75 1.5 (Q
75 -
25)
2 7 t h P C S I C o n f e r e n c e | O c t o b e r 1 9 t o 2 2 , 2 0 1 1 | M o n t r é a l , Q u e b e c , C a n a d a
Each patient counts
T H U R
S D A Y
SESSION 1C—International Experiences WithCase Mix
1152825
Romania – Experience and New Steps in the Context of theInternational Patient Classification System
Introduction: Over the last 10 years many countries, including Romania, haveintroduced various models of Casemix financing based on DRGs and, as a result,Romanian specialists became PCSI members over 10 years ago. The first DRG pilotprojects in Romania occurred between 1996–1999, and in 2002 Romania officiallyintroduced the DRG system.
The PCSI association and its annual conferences represented not only a “school” forRomanian specialists, but also a place to share local developments, successes, and
problems encountered in theimplementation of DRG in Romania. Now, however, it istime for Romania to share its recent experience of introducing its own DRG system –RO.vi.DRG – which began in 2010.
Methods: The authors have done a comparative analysis between Romania and othercountries which use, or are in the process of adopting, the DRG system. For both theRomanian situation and a comparison with other countries, the authors conducteda review of available literature. The authors also performed a quantitative analysisto highlight critical issues in system functioning and the impact of introducingRomanian classification.
Results: The following is a list of the results obtained by the study.Romania is a country with 10 years of experience in DRG utilization. Its health1.
system is no longer in the beginning stages of DRG utilization. Romania’s newclassification system is based on the AR DRG v.5 classification, and althoughsome adaptations have been made for the Romanian situation, more still needsto be done.Ongoing DRG system development and refinement activities require important2.resources. These resources are not only financial, but also human. Humanresources, both at the central and hospital levels, are necessary to realize thenext level of benefits from DRGs in Romania. A coherent, regular and strongtraining system is no longer just a requirement; it is an imperative necessity,not only for adequate financing, but also for the improvement and local adoptionof the AR DRG classification system, so that it better reflects the Romanianhospital reality.There are some prerequisites for obtaining correct results in hospital financing3.when using the DRG system. These are complete transparency of hospital-fundsallocation, and the existence of a clear policy with defined objectives and long-termgoals regarding hospital financing. The DRG system in Romania has currently beenextended from 291 to 371 hospitals, but the total amount of money available forreimbursement still seems to be insufficient. As well, the reporting and financingsystem is not familiar enough to every hospital, and the benchmarking mechanismis insufficiently developed.
8/13/2019 2011 Montreal Conference Abstract Book
http://slidepdf.com/reader/full/2011-montreal-conference-abstract-book 49/1663
Each patient counts
2 7 t h P C S I C o n f e r e n c e | O c t o b e r 1 9 t o 2 2 , 2 0 1 1 | M o n t r é a l , Q u e b e c , C a n a d a
The experience of other countries where the DRG system works and produces4.good results shows that it is mandatory to have strong institutions involved inhospital-report monitoring. In addition, it is necessary to develop a clear set ofregulations regarding the entire process of documentation, classification, coding,data processing and collection of patient-level clinical information. As long as Romanian legislation considers the upgrading of a patient’s pathology5.in order to gain more funds just “an error” (which, in a worst-case situation,could lead to the return of the funds), up-coding will increase and create moredissatisfaction at the hospital-sector level. Starting in 2011, some analysis fromNational School of Public Health, Management and Professional Development inHealth Bucharest(NSPHMPDHB) triggered controls of National Insurance House(NIH) at the hospital level. However, a concrete and planned mechanism forauditing coding is missing at the national level.Continuous development of the DRG system is not merely a trend; it is a necessity.6.In order to have this development, it is essential to build effective communicationpathways with hospitals in order to understand their reality, and to increase the
capacity of the central institutions (NHIH, Ministry of Health, etc.) to design andrespond to the new challenges.Potential areas for development could be the following: emphasizing equitable7.hospital financing based on DRG; improving the accuracy of the patient classificationsystem; improving the monitoring system; and increasing hospital efficiency.
Conclusions: We could say that Romania started in the right direction by introducingand developing the DRG system. However, it is necessary to push for a strongereffort, and more professionalism and support, from the decision makers in orderto not only keep the system working, but also to be sure of achieving the goalsestablished at the moment of its implementation.
AUTHORS/INSTITUTIONS: N.D. Chiriac, ([email protected]);
S.N Musat ([email protected]),Center for Health Research and Evaluation,
National School of Public Health, Management and Professional Development
in Health Bucharest, ROMANIA; J. Shah([email protected]),Nimitt Consulting, Inc.,
Washington DC; C. Vladescu ([email protected]),National School of Public
Health, Management and ProfessionalDevelopment in Health Bucharest, ROMANIA
1165093
Initial Results and Experiences from the World BankFinanced DRG Pilot Project in the Republic of Moldova(July 2010 – June 2012)
Introduction: The main aim of this two year pilot project is to determine whethercase-mix concepts, and underlying data requirements (clinical coding, cost datamodeling, case mix classification etc.) can be implemented and obtained fromthe nine pilot project hospitals and whether Moldovan decision-makers decide toimplement a form of case-mix based financing beginning in a limited fashion withsound transition polic ies beginning January 2012 or January 2013.
8/13/2019 2011 Montreal Conference Abstract Book
http://slidepdf.com/reader/full/2011-montreal-conference-abstract-book 50/16634
= ( WX ′ – – WY
β = ( WX ′ ) – XWY
= β + ε
= + ε
= + εQ75+ .5 x (Q.
5- Q
25
Q75 1.5 (Q
75 -
25)
2 7 t h P C S I C o n f e r e n c e | O c t o b e r 1 9 t o 2 2 , 2 0 1 1 | M o n t r é a l , Q u e b e c , C a n a d a
Each patient counts
T H U R
S D A Y
Methods: This paper discusses the current and ongoing experience of case mixpilot activities in Moldova, beginning with the following activities that make up thekey work conducted to date and the work that is ongoing with the current ninehospital pilot project:
Main Activities:Selection a representative group of 9 hospitals to pilot all necessary case-mix•concepts, including coding, data collection, grouping, costing, analysis activities,and policy developmentICD 10 coding training was provided to all pilot project hospitals, along with•procedure coding training according to the Australian procedure coding system(research licensed awarded by the Commonwealth Government)Collection of clinical data began in March 2011 with a slow uptake as expected,•but as of June 2011, about 70% of five months of clinical data is available fromalmost all of the pilot project hospitalsDRG grouping of the clinical data will occur starting in July using the research•version of the AR-DRG grouper and will be ongoingInitial development of cost weights and relative values for case-mix calculations•is expected to begin in late 2011, early 2012The necessary technology infrastructure and development of software to collect•data has been achieved
Results: Project decisions related to the technical activities outlined above were takentogether between international experts and local authorities in order to respect the localcontext, including cultural and political issues, which is critical for long-term sustainability.
Clinical coding and clinical data collection started March 2011 so preliminaryDRG grouped data results from these Hospitals are expected to be producedaround July 2011, in time for final presentation and paper.
Cost data collect ion and modeling will start July 2011, so probably individualhospital costing data and simulation can be presented at the Conference.
By the time of the Conference, preliminary decisions based on initial results areexpected in respect with continuation and extension of the ongoing work: paymentand reimbursement to be based on case mix data for pilot hospitals and extensionat national level of standardized clinical coding and data collection (clinical andcost data)
Conclusions: In Moldova, the government has taken full responsibility from thebeginning in driving case-mix efforts before first pilot project was even implemented.Having decision-makers highly proficient in case-mix principles before the technicalstaff is involved is critical in garnering the type of support needed for a large scalefinancing reform, which is the ultimate aim of both the MOH and the NHIC. Thecurrent pilot project can be thought of as more than just a pilot since decision-makersare keen on moving quickly towards implementation.

8/13/2019 2011 Montreal Conference Abstract Book
http://slidepdf.com/reader/full/2011-montreal-conference-abstract-book 51/1663
Each patient counts
2 7 t h P C S I C o n f e r e n c e | O c t o b e r 1 9 t o 2 2 , 2 0 1 1 | M o n t r é a l , Q u e b e c , C a n a d a
The proficient decision makers still need the project support in order to stabilize thetechnical components before expanding and going forward and more than this, tobuild up local capacity able to take over at all levels: technical day to day activities,adaptation and localization, reimbursement mechanism design and implementationand long term development of the system.
AUTHORS/INSTITUTIONS: M. Buga ([email protected])National HealthInsurance Company, Chisinau, MOLDOVA; D. Farcasanu,([email protected]),Center for Health Policies and Services Foundation, Bucharest, ROMANIA; A. Usatii ([email protected])Ministry of Health, Chisinau, MOLDOVA; .J. Shah ([email protected])Nimitt Consulting, Washington DC, DC;
1164632
Feasibility of Implementing Casemix System to Support APEX Programme of HUSM in Malaysia using UNU-CBG
Case Mix Grouper.Introduction: Hospital USM (HUSM), established in 1983, is the second oldestteaching hospital in Malaysia. The 747-bed hospital is owned by University of ScienceMalaysia (USM). HUSM is located in the Kelantan, one of the least developed statein the north east region of Malaysia. In 2011, HUSM has decided to implement thecasemix system as one of the initiative to improve quality and efficiency of its servicesin line with the status of the USM as the premier university in Malaysia awarded with APEX (Accelerated Programme for Excellence) status by Ministry of Higher Educationof Malaysia. Under APEX, USM, is given autonomy and flexibility in administrationand access to additional funding from the government. The long term objective is totransform the university into a centre of excellence at par with top universities of the
world. HUSM in collaboration with United Nations University-International Institute forGlobal Health and International Centre for Casemix and Clinical Coding of NationalUniversity of Malaysia has developed a three year programme to gradually implementcasemix system in the hospital. A pilot study was carried out to assess the feasibilityof using UNU-CBG Grouper as the grouping tool in HUSM.
Methods: The pilot project was started with a series of workshops to introduce thecasemix concept to the management and all the staff of HUSM. A high level SteeringCommittee was formed to monitor the project. Four working groups were establishedfor the implementation: the Coding, Costing, Clinical Pathway and InformationTechnology Groups. All in-patient medical records for patients discharged in 2009and 2010 were reviewed and selected for the pilot study. Two trained coders coded
the diagnosis using ICD10 and procedures using ICD9-CM classifications. In UNU-CBGs the first level of classification is Casemix Main Group (CMG) and the secondlevel with higher degree of granularity is Case-Based Group (CBG).

8/13/2019 2011 Montreal Conference Abstract Book
http://slidepdf.com/reader/full/2011-montreal-conference-abstract-book 52/16636
= ( WX ′ – – WY
β = ( WX ′ ) – XWY
= β + ε
= + ε
= + εQ75+ .5 x (Q.
5- Q
25
Q75 1.5 (Q
75 -
25)
2 7 t h P C S I C o n f e r e n c e | O c t o b e r 1 9 t o 2 2 , 2 0 1 1 | M o n t r é a l , Q u e b e c , C a n a d a
Each patient counts
T H U R
S D A Y
Results: A total of 43, 273 medical records contained adequate information tobe grouped using the UNU-CBG Groupers. This represents 60.6% of the totaldischarges for the two years period. 60% were female. Most the patients were ofyounger age group with 29.7% below the age of 20 years, 21.2% between the ageof 21-30 years and only 14.5% are above 60years. Most of patients were dischargedwell (96.8%), 2.6% died and 0.6% took at own risk (AOR) discharged against theadvice of doctors. The average length of stays for most of cases (79.3%) are lessthan 5 days, 13.9% stayed between 6 to 10 days, 3.3% stayed between 11 to 15 daysand only 3.5% stayed more than 15 days. Three most common cases grouped inCMGs are CMG-O for Deliveries (20.7%), CMG-W for Diseases of Female ReproductiveSystem (10%) and CMG-M for Diseases of Musculoskeletal System and ConnectiveTissue Groups (7.3%). The top five CBGs are CBG O-6 -13-I Vaginal Deliveries-Mild (11.3%), CBG P-8-17-I Neonatal Conditions-Mild (4.1%), CBG O-6-13-II VaginalDeliveries – Moderate (3.1%), CBG W-4-16-I Prepartum Diseases (3.1%) and O-6-12-IVaginal Deliveries with other procedures – Mild (2.5%). A total of 1,806 dischargeswere ungroupable. Common reasons for ungroupable are coding errors of principle
diagnosis (49.7%), no birth weight for babies (33.5%), coding errors for deliveries(7.9%) and wrong gender (5.5%).
Conclusions: The outcome of this pilot study showed that it is feasible to implementthe casemix system using UNU-CBG grouper in HUSM. The medical records systemin the hospital could be further enhanced by ensuring that the minimum data set forcasemix system is captured routinely. Although the rate of ungroupable is quite low,more efforts should be made to train the coders on the coding rules as required bythe casemix groupers.
AUTHORS/INSTITUTIONS: S.M. Aljunid ([email protected]); A.M. Nur ([email protected]) , UNU-IIGH, UNU-InternationalInstitute For Global Health, Kuala Lumpur, Federal Territory, MALAYSIA;S.M. Aljunid, R. Mohamed, S.M. Hamzah Aljunid ([email protected])S. Sulong([email protected])A.M. Nur, International Case-mix and Clinical Coding Centre,Universiti Kebangsaan Malaysia, Kuala Lumpur, Federal Territory, MALAYSIA;R. Mohamed ([email protected])Centre For Health Sciences, Universiti SainsMalaysia, Kubang Kerian, Kelantan, MALAYSIA
8/13/2019 2011 Montreal Conference Abstract Book
http://slidepdf.com/reader/full/2011-montreal-conference-abstract-book 53/1663
Each patient counts
2 7 t h P C S I C o n f e r e n c e | O c t o b e r 1 9 t o 2 2 , 2 0 1 1 | M o n t r é a l , Q u e b e c , C a n a d a
1164657
Analysis of the FONDO NACIONAL DE RECURSOSReimbursement in Uruguay Using UNU-CBG Case
Mix SystemIntroduction: Uruguay has a health system that integrates services provided by bothpublic and private healthcare organizations. The Fondo Nacional de Recursos (FNR)is funding the resource intensive specialized care for the entire population of Uruguay,with input from all organizations providing health services – public and private- inUruguay. It is managed by an honorary committee composed of representatives ofthe Ministry of Health, Ministry of Finance, Highly Specialized Institutes of Medicine(IMAEs) and others. Periodically, the IMAEs - which are those providing the service ofhighly specialized medicine - negotiate the reimbursement rate per delivery with FNR.The criteria used for the determination of the reimbursement rate is not very patientcentric, and therefore there is only one reimbursement rate for a particular disease,irrespective of the severity of the disease.
Methods: Sanatorio Americano, an IMAE hospital, has been involved in theimplementation of DRG base case mix system for the last 2 years. We in our hospitalused the severity based DRG system to do the patient level costing. In year 2009, thehospital was attended by 8,657 inpatients. We use UNU-CBG Case-Mix grouper togenerate case-mix groups. For the costing purpose all the inpatients are divided intofour (4) different categories. These are a) Non IMAE patients (patients not reimbursedwith FNR rate) (n= 4,513), b) Cardiac IMAE patients (n= 2,892), c) Orthopaedic IMAEpatients (n= 1,107), and d) Other IMAE patients (n= 145). The last three categories ofpatients are reimbursed using the FNR reimbursement rate.
Results: The average cost of treatment of the Non IMAE patients is 60,258 Pesos,
for Cardiac IMAE is 78,842 Pesos, for Or thopedic IMAE is 62,197 Pesos, and forother IMAE patients is 73,253 Pesos. The FNR reimbursement is done at a flat rate,irrespective of the clinical severity of the patients.TThe highest reimbursement to costratio is 1.27 for Cardiac IMAE cases of mild conditions followed by 0.99 for Or topedicIMAE cases of moderate conditions. The lowest reimbursement to cost ratio is 0.04for Other IMAE severe cases.
Conclusions: DRG system with severity adjustment can better describe the realresource consumption of the patient. Here we compare the reimbursement doneby the FNR against the cost of treatment calculated using the DRG base costing.It is evident that the reimbursement rate specially for the higher severity are notrepresentative of the recourse intensity of these cases.
AUTHORS/INSTITUTIONS: S.M. Aljunid, Z. Ahmed, A.M. Nur, UNU-IIGH, UNU-International Insti tute For Global Health, Kuala Lumpur, Federal Territory, MALAYSIA;S.M. Aljunid ([email protected]);Z. Ahmed ([email protected]);A.M. Nur([email protected]);International Case-mix and Clinical Coding Centre,Universiti Kebangsaan Malaysia, Kuala Lumpur, Federal Territory, MALAYSIA; A. Alvarez ([email protected]); R. Uruguay ([email protected]);A. Scasso([email protected]);F. Francisco ([email protected]);G. Diego ([email protected]);R. Mariana ([email protected]); C. Santiago ([email protected]);, M. Lucy ([email protected]) ; M. Rosario ([email protected]);D.S. Pablo ([email protected]);Sanatorio Americano S.A, Montevideo, URUGUAY;

8/13/2019 2011 Montreal Conference Abstract Book
http://slidepdf.com/reader/full/2011-montreal-conference-abstract-book 54/16638
= ( WX ′ – – WY
β = ( WX ′ ) – XWY
= β + ε
= + ε
= + εQ75+ .5 x (Q.
5- Q
25
Q75 1.5 (Q
75 -
25)
2 7 t h P C S I C o n f e r e n c e | O c t o b e r 1 9 t o 2 2 , 2 0 1 1 | M o n t r é a l , Q u e b e c , C a n a d a
Each patient counts
T H U R
S D A Y
SESSION 2A—Economic Incentive and Case Mix
1152588
Determining a Threshold Hospital Size for the Applicationof Activity-Based Funding
Introduction: Under the Heads of Agreement – National Health Reform, reached atthe Council of Australian Governments’ meeting on 13th February 2011, the Australianand State/Territory Governments agreed to establish a national approach to activity-based funding (ABF). They also agreed to fund, wherever possible from 1st July 2012,public hospitals on the basis of a national efficient price for each service provided toa public patient.
Clause 30 of that Agreement states that “some small rural hospitals will continue to befunded by block grants where ABF alone would not enable these hospitals to maintaincommunity services obligations (CSOs)”. To move forward on ABF implementation, the
Australian Government Department of Health and Ageing (DoHA) commissioned a projectto determine which hospitals should be block-funded (that is, termed CSO hospitals).
Methods: Based on a review of the relevant literature, in the context ofimplementation of ABF, a CSO was defined as:
“…a public hospital that, due to factors outside the control of local management,is unlikely to be financially viable under an activity based funding arrangementthat reflects an efficient price set at the national or jurisdictional level.”
Once the definition was in place, the problem was then to identify the factors that arelikely to result in a public hospital not being financially viable under ABF. The potentialfactors considered were volume of services; variability in acute-patient separationsand bed days; number of DRGs with five or more acute patients per year; differencesin the average cost per weighted separation; road distance to nearest regionalhospital; and Remoteness Region of the Statistical Local Area in which the hospitalis located.
These factors were chosen because they were potentially relevant, and also becausethey could be measured using available data. To assess the importance of thefactors, potential CSO hospital profiles were constructed using data from nationalminimum data sets (NMDSs), as well as other sources, for the three most recentlyavailable years (2006/07 – 2008/09).

8/13/2019 2011 Montreal Conference Abstract Book
http://slidepdf.com/reader/full/2011-montreal-conference-abstract-book 55/1663
Each patient counts
2 7 t h P C S I C o n f e r e n c e | O c t o b e r 1 9 t o 2 2 , 2 0 1 1 | M o n t r é a l , Q u e b e c , C a n a d a
Results: There were 427 smaller hospitals located in regional and remote areasassessed for CSO status. The data analysis produced clear evidence that ‘scale’is the most important factor driving two of the key statistics that influence thefinancial viability of a hospital under ABF arrangements (these statistics being costs-per-episode and degree- of-variation in activity). Several measures of scale, includingannual separations and bed-days, were tested and found to be correlated. Afterconsideration, annual acute Casemix-adjusted separations was chosen as the scalemeasure, since it was also the principal grouping variable used to define existinghospital peer groups.
We then tackled the question of setting a scale threshold below which hospitalswould be defined as CSO. Five approaches were used: examining the criteriaemployed to define existing peer groups; looking for discontinuities in the distributionof acute Casemix-adjusted separations across the 427 hospitals; modeling Casemix-based payments to determine how many hospitals might be disadvantaged by ABF;modeling the relationship between average costs and hospital scale; and consideringself-reported CSO status. Across all factors, the analysis suggested that a CSO-hospital threshold of between 1,700 and 2,000 annual acute Casemix-adjustedseparations was most suitable.
Although a scale threshold was determined, flexibili ty is required in interpreting thedefinition, since no mechanistic formula can appropriately reflect the circumstancesthat might apply to a hospital at a particular time. Also, it is recognized that thereare problems with a definition that includes a scale measure based entirely on acuteCasemix-adjusted separations. However, given the limitations of the existing data,it was not possible to consider a scale measure that incorporated activity levels fornon-admitted and sub- / non-acute care services. These programs usually representa significant portion of the services provided by small regional and rural hospitals,and a better definition of CSO hospitals would include these activities.
Conclusions: Approximately 349 of the 427 facilit ies met the proposed definitionof a CSO hospital. The key statistics for these hospitals show that the definitionidentifies a different group of hospitals from those not classified as CSOs. Therewill always be some debate at the boundary, but key statistics such as beds; staffnumbers; admitted episodes; and even emergency-department, outpatient andcommunity-health services numbers, show very significant scale differences.
Not surprisingly, there are also large differences in average cost and activity levelsbetween CSO and non-CSO hospitals. Nonetheless, as national approaches tocounting and costing of sub- / non-acute and non-admitted patient care servicesare agreed upon and implemented under ABF arrangements, the CSO definition
and thresholds can be further improved.
AUTHORS/INSTITUTIONS: J. Scuteri ([email protected]);L. Fodero, ([email protected])HealthConsult, Sydney, New SouthWales, AUSTRALIA; J. Pearse ([email protected])Health Policy Analysis,Sydney , New South Wales, AUSTRALIA

8/13/2019 2011 Montreal Conference Abstract Book
http://slidepdf.com/reader/full/2011-montreal-conference-abstract-book 56/16640
= ( WX ′ – – WY
β = ( WX ′ ) – XWY
= β + ε
= + ε
= + εQ75+ .5 x (Q.
5- Q
25
Q75 1.5 (Q
75 -
25)
2 7 t h P C S I C o n f e r e n c e | O c t o b e r 1 9 t o 2 2 , 2 0 1 1 | M o n t r é a l , Q u e b e c , C a n a d a
Each patient counts
T H U R
S D A Y
1152749
Issues in Use of CMG+ for Activity Based Funding in Canada
Introduction: There is increasing interest in introducing Activity Based Funding in
Canada. Canada's case mix classification system CMG+ performs extremely wellas a way of describing cost variation. But as interest in introducing Activity BasedFunding increases, there is now some question about how suitable is the CMG+classification system for this new purpose. Does CMG+ require any modification?What sorts of options might there be?
Methods: There are common statistical criteria for evaluating case mixclassifications, in this paper we advance five policy-oriented criteria for evaluatingcase mix classifications for payment purposes: simplicity and transparency; stability;minimize susceptibility to gaming; minimizing inappropriate rewards; and recognizinglegitimate variation.
Results: The current CMG+ system is complex but two thirds of cases are in thesimplest category (no adjustments to base CMG). In terms of stability, data on howweights for a CMG vary over a four year period will be presented. Issues relating toinappropriate rewards will be highlighted
Conclusions: Options for potential enhancements of the CMG+ system to improvetransparency, stability and inappropriate rewards are outlined.
AUTHORS/INSTITUTIONS: S. Duckett ([email protected])Schoolof Public Health, University of Alberta, Edmonton, Alberta, CANADA;J. Hatcher ([email protected]);K. Murphy ([email protected]);H. Richards ([email protected]) Canadian Institute for HealthInformation, Ottawa, Ontario, CANADA;
1152604
Explaining Variations in the Cost of Patient Care... A Multilevel Analysis Using Canadian Hospital Data
Introduction: Increasing health care spending in Canada, as in other developedcountries, has created pressure to restrain costs. In order to control costs we needto know what drives them and why they vary from patient to patient. For cost ofhospitalization most of the driving force and variation can be explained by patient-level factors such as age, comorbidities, severity of illness and by hospital-levelfactors such as labour costs, size and hospital type. Unexplained variation in costs –at least unexplained by the econometric models – may be due to unmeasured factorsand differences in effectiveness, efficiency, and appropriateness of the care provided.
8/13/2019 2011 Montreal Conference Abstract Book
http://slidepdf.com/reader/full/2011-montreal-conference-abstract-book 57/1664
Each patient counts
2 7 t h P C S I C o n f e r e n c e | O c t o b e r 1 9 t o 2 2 , 2 0 1 1 | M o n t r é a l , Q u e b e c , C a n a d a
Methods: In this research we will try to answer why patient costs vary due tomeasured patient and hospital-level factors. We will use patient level cost datasubmitted to Canadian Institute for Health Information by participating case-costinghospitals from Ontario, Alberta, and British Columbia. Challenges of modeling healthcare costs will be discussed. We will use mixed model analysis since our modelincludes both fixed and random effects.
Results: Apart from the effects of demographics we will measure the ef fects ofvarious conditions categorized by casemix systems, various high-cost interventions,length of stay and hospital type. The focus will be on costs of patients with diseasesand disorders of the circulatory system. Results will include the individual andcombined effects of covariates on cost of hospitalization.
Conclusions: The results are expected to shed a light on the reasons for costvariation among patients with similar conditions.
AUTHORS/INSTITUTIONS: R. Gezer [email protected]) Canadian Institute for Health
Information, Victoria, British Columbia, CANADA;J. Hatcher ([email protected]) Activity Based Funding, Canadian Institute for HealthInformation, Ottawa, Ontario, CANADA;
1152628
Can Teaching Hospitals Benefit From Case Mix System?Outcome of Using DEA to Evaluate Efficiency of TeachingHospitals in Malaysia.
Introduction: The analysis of efficiency in hospitals can make a major contributionto improving health services. Casemix system can help to enhance efficiency ofhospitals services by encouraging clinicians to reduce variations of care and useof unnecessary resources. UKMMC is the first teaching hospital in Malaysia to usecasemix system to enhance quality and efficiency of services.
Methods: Data Envelopment Analysis (DEA) model under the assumption of constantand variable return to scale model was used to compare the efficiency scores of threeteaching hospitals in Malaysia. Two of the teachings hospitals, HUSM and UMMC hasnot implemented casemix system while UKMMC embarked of casemix system since2002. Average efficiency scores of at least at least six clinical departments betweenthe period of 1998 to 2006 were imputed and compared. DEA model was then usedto compare the efficiency scores of the three hospitals before and after 2002, theyear when casemix system was first introduced in UKMMC. It is hypothesized that
hospitals using casemix system would have higher level of efficiency than thosewhich do not use the system.
8/13/2019 2011 Montreal Conference Abstract Book
http://slidepdf.com/reader/full/2011-montreal-conference-abstract-book 58/16642
= ( WX ′ – – WY
β = ( WX ′ ) – XWY
= β + ε
= + ε
= + εQ75+ .5 x (Q.
5- Q
25
Q75 1.5 (Q
75 -
25)
2 7 t h P C S I C o n f e r e n c e | O c t o b e r 1 9 t o 2 2 , 2 0 1 1 | M o n t r é a l , Q u e b e c , C a n a d a
Each patient counts
T H U R
S D A Y
Results: The mean efficiency scores for HUSM, UMMC and UKMMC were 76.0percent (range 50.3 – 96.9) , 92.7 percent (range 75.0 – 100) and 91.2 percent (range85.2-100) respectively. After the implementation of casemix system, the efficiencyscores of UKMMC increased by 6.4 percent while scores in the other two hospitals;HUSM and UMMC remained at 2.8 percent and 1.5 percent respectively.
Conclusions: Casemix system has some positive impact in improving the efficiencyof teaching hospitals in Malaysia. The gain in the efficiency would have been greaterif the system is used hospital budgeting and providers’ reimbursements.
AUTHORS/INSTITUTIONS: S.M. Aljunid ([email protected]); H. Moshiri([email protected])UNU-IIGH, UNU-International Institute For Global Health,Kuala Lumpur, Federal Territory, MALAYSIA;S.M. Aljunid, H. Moshiri, International Case-mix and Clinical Coding Centre, UniversityKebangsaan Malasyaia, Kuala Lumpur, Federal Territory, MALAYSIA;
SESSION 2B—Classification and Case Mix Incentives1143312
Assessment of the Main International and National Classificationsor Terminological Systems of Surgical Procedures Using the CEN/ISO 1828 Standard
Introduction: There is a growing need to compare data produced at national andinternational levels on a range of shared concerns relating, for instance to populationbased indicators, Electronic Health Record safety, OECD (Organisation of EconomicCooperation and Development), trans border migration of population, case mix and
procedure payment .Clinical terminology systems, classifications and coding systems that are drawnupon to that end have unfortunately been developed using independent, divergentor uncoordinated approaches which have produced non reusable systems withoverlapping fields for different requirements. For some decades, several broadpre-coordinated or compositional systems have been proposed to users targetingdifferent goals.At the same time most of developed countries have continued tomaintain, update and modify their own coding systems for procedures and theirnational adaptations of ICD, in order to manage and to fund their health care delivery.
Methods: To compare major national and international classifications orterminological systems of surgical procedures we use the latest standard on
terminologies of surgical procedures currently pending final approval ENISO 1828.We present the standard in section 2 and the results of the assessment in the lightof that standard in section 3. Finally we discuss the role that standard could play notonly to support the comparison of classifications and coding systems of surgicalprocedures but, to facilitate their harmonization towards a more complete semanticinteroperability.
8/13/2019 2011 Montreal Conference Abstract Book
http://slidepdf.com/reader/full/2011-montreal-conference-abstract-book 59/166

8/13/2019 2011 Montreal Conference Abstract Book
http://slidepdf.com/reader/full/2011-montreal-conference-abstract-book 60/16644
= ( WX ′ – – WY
β = ( WX ′ ) – XWY
= β + ε
= + ε
= + εQ75+ .5 x (Q.
5- Q
25
Q75 1.5 (Q
75 -
25)
2 7 t h P C S I C o n f e r e n c e | O c t o b e r 1 9 t o 2 2 , 2 0 1 1 | M o n t r é a l , Q u e b e c , C a n a d a
Each patient counts
T H U R
S D A Y
Results: The largest changes in terms of hospital coding occurred in maternity wardswith an overall increase in codes per patient (newborn) by approximately 200%.This appeared to be caused by two factors: 1) a lack of recording of diagnoses insome hospitals before the transition and 2) an apparent surge in upcoding in somehospitals after the transition. We also note a wide variety of patterns between thedifferent hospitals.
Conclusions: Better regulatory systems are needed in order to ensure patient safety,quality and validity of data, and fairness in financing.
AUTHORS/INSTITUTIONS: M. Galsworthy ([email protected]);A. Yazbeck([email protected]);M. Omerzu ([email protected])National Institute ofPublic Health, Ljubljana, SLOVENIA;
1145898
The Modern Concept of Sepsis and its Impact on DRG
Introduction: The concept of sepsis has gone through a profound change asa consequence of the 1992 definitions of SIRS (Systemic Inflammatory ResponseSyndrome). The most important change is the shift of sepsis being considereda severe disease to its recognition as a continuum of generalised body reactionscaused by infectious disease.
Methods: Sepsis:
The continuum is defined in three stages which can be expressed asSepsis defined as infection causing at least two of four criteria (fever, increased1.heart rate, increased respiratory rate (or hypocapnea) and leucocytosis)
Severe sepsis, is sepsis with hypotension and organ impairement and2. Septic shock, is severe sepsis with circulatory failure and high mortality (the end stage)3.
For sepsis, the focus is now on the etiology (pneumonia, meningitis, acute tonsillitis,acute pyelonephritis etc ), rather than the generalised body reaction of the infection.The internationally recommended ICD-10 coding is that sepsis, severe sepsis (R65.1)and septic shock (R57.2) are additional codes to the infection causing sepsis. Twological consequences of coding sepsis can be identified:
Severe infections such as pneumonia and meningitis will per se fill the criteria1.of sepsis - an additional code for the first stage of reaction will be superfluous.Only in cases with infections stated as with severe sepsis or with septic shock,the additional codes are recommended.
The traditional ICD-10 sepsis codes A40.- - A41.- shall only be used when the origin2. of infection causing sepsis cannot be established.
Results: Impact on the DRG systems:The DRG groups depending on A40-A41 as markers for sepsis (e.g. Medicare DRGs416 and 417) will not identi fy cases of severe sepsis or septic shock when the originalorgan infection is coded according to the recommended sequence (coded first).

8/13/2019 2011 Montreal Conference Abstract Book
http://slidepdf.com/reader/full/2011-montreal-conference-abstract-book 61/166

8/13/2019 2011 Montreal Conference Abstract Book
http://slidepdf.com/reader/full/2011-montreal-conference-abstract-book 62/166

8/13/2019 2011 Montreal Conference Abstract Book
http://slidepdf.com/reader/full/2011-montreal-conference-abstract-book 63/1664
Each patient counts
2 7 t h P C S I C o n f e r e n c e | O c t o b e r 1 9 t o 2 2 , 2 0 1 1 | M o n t r é a l , Q u e b e c , C a n a d a
Step six was to develop a database with all the above components and run theinformation through a cost modeling application to generate the desired costweights for each clinic and the average cost for all clinic encounters.
Step seven was to obtain a similar output from another country or service and
compare the difference, where there are wide variations investigate that clinic anddetermine what has cause this variation.
In step eight, after obtaining the final cost weight and average cost, the future patientactivity for each clinic was determined and the cost weight and average cost wereassigned to this activity. Finally the movement between the allocation of funds to theclinics and the previous allocation were compared.
Results: In our experience using this approach we have seen movements of up toand beyond 10% in the allocation of funds. Additionally the classification of patientsto inappropriate clinics has also resulted in clinics being underfunded.
Conclusions: As we indicated in the introduction this may not be the ideal approachbut it is an approach that becomes inclusive for all organisations to participate. Thebenefits to an organisation utilising this approach assists them in the appropriateclassification of their patients to the correct clinics, the correct assignment of funds,and identifies the short coming of non direct allocation from feeder systems thatprovide a service but are not integrated to the main patient administrative systems.We have found this a useful tool in progressing towards activity based funding.
AUTHORS/INSTITUTIONS: L. van Doorn ([email protected]); C. Aisbet t([email protected]),Laeta PTY LTD, Sydney, New South Wales, AUSTRALIA;B. Donovan ([email protected]), Casemix/HIPE, Irish Health Service Executive,Dublin, Dublin, IRELAND;
1150792
Redeveloped CACS Ambulatory Care Grouper: RIW Estimationand Evaluation
Introduction: The grouping methodology for ambulatory data, Comprehensive Ambulatory Care System (CACS), used by the Canadian Institute for HealthInformation (CIHI) has recently been redeveloped. Although CACS, originallydeveloped in 2001, has been updated annually to account for changes in clinicalpractice and to accommodate client feedback, a true redevelopment had not beenperformed since it was launched. This, along with the fact that data from additional
ambulatory care patient types was being submitted to the National AmbulatoryCare Reporting System (NACRS) database by Alberta, determined the need forredevelopment of grouping and RIW estimation.
CACS consists of 239 cells organized into 23 Major Ambulatory Clusters (MAC) basedon the body system involved or functional grouping. Each MAC is composed of anumber of related cells formed on the basis of various combinations of the groupingdata elements.
8/13/2019 2011 Montreal Conference Abstract Book
http://slidepdf.com/reader/full/2011-montreal-conference-abstract-book 64/16648
= ( WX ′ – – WY
β = ( WX ′ ) – XWY
= β + ε
= + ε
= + εQ75+ .5 x (Q.
5- Q
25
Q75 1.5 (Q
75 -
25)
2 7 t h P C S I C o n f e r e n c e | O c t o b e r 1 9 t o 2 2 , 2 0 1 1 | M o n t r é a l , Q u e b e c , C a n a d a
Each patient counts
T H U R
S D A Y
This paper will describe the statistical analyses done to calculate RIWs for CACS 2011and its evaluation. It will also describe in detail the regression analyses, the factorsused in the regression models, how statistical outliers were determined, and theevaluation of the CACS 2011 RIWs in comparison to CACS 2010 RIWs.
Methods: We used data submitted to NACRS between FY 2007-08 and FY 2008-09 from the provinces of Alberta and Ontario. The RIW regression model used wasadditive. The factors applied in the RIW modeling were Age, anaesthetic technique(AT), and investigative technology (IT). Total cost (adjusted for facility effects) wasused as the dependent variable to fit a weighted least squares (WLS) regressionusing CACS cells, AT, IT and selected interactions between them as predictors.CACS 2011 and CACS 2010 RIWs were compared using goodness-of-fit (GOF)metrics (e.g. bias, mean square error, mean absolute error and r-square) by CACScells, MACs, CACS Logic Type, and facilities.
Results: At the overall system level, CACS 2011 explains cost variation better thanCACS 2010 by approximately 11% (69% for 2011 versus 58% for 2010). Also, the MAE
associated with CACS 2011 estimates is $130.72 compared to $154.68 for CACS 2010.CACS 2011 RIWs are slightly less biased than CACS 2010 RIWs. In both Ontario and Alberta, CACS 2011 explains cost variation better than CACS 2010 by at least 10%. At the CACS Logic Type, facility and MAC levels, CACS 2011 predicts average costsbetter than CACS 2010.
Conclusions: The evaluation results demonstrated substantial improvement inexplaining ambulatory care costs when CACS 2011 methodology is used. As thecurrent methodology evolves, the RIW estimation methodology will be refined toimprove cost estimates for a few CACS cells with poor cost estimates. In addition,given that the approach used in RIW calculation is additive, there is more potentialfor it to be compared to other international systems.
AUTHORS/INSTITUTIONS: J.E. Amuah ([email protected])Case Mix, CanadianInstitute for Health Information, Ottawa, Ontario, CANADA
1152975
Applying Diagnosis and Pharmacy-Based Risk Models to PredictPharmacy Use in Aragon, Spain: The Impact of Local Calibration.Presentation of Paper BMC Health Services Research 2010
Introduction: In the financing of a national health system, where pharmaceuticalspending is one of the main cost containment targets, predicting pharmacy costs forindividuals and populations is essential for budget planning and care management. Although most ef forts have focused on risk adjustment applying diagnostic data, thereliability of this information source has been questioned in the primary care setting.We sought to assess the usefulness of incorporating pharmacy data into claims-based predictive models (PMs). Developed primarily for the U.S. health care setting,a secondary objective was to evaluate the benefit of a local calibration in order toadapt the PMs to the Spanish health care system.
8/13/2019 2011 Montreal Conference Abstract Book
http://slidepdf.com/reader/full/2011-montreal-conference-abstract-book 65/1664
Each patient counts
2 7 t h P C S I C o n f e r e n c e | O c t o b e r 1 9 t o 2 2 , 2 0 1 1 | M o n t r é a l , Q u e b e c , C a n a d a
Methods: The population was drawn from patients within the primary care settingof Aragon, Spain (n = 84,152). Diagnostic, medication and prior cost data were usedto develop PMs based on the Johns Hopkins ACG methodology. Model performancewas assessed through r-squared statistics and predictive ratios. The capacity toidentify future high-cost patients was examined through c-statistic, sensitivity andspecificity parameters.
Results: The PMs based on pharmacy data had a higher capacity to predictfuture pharmacy expenses and to identify potential high-cost patients than themodels based on diagnostic data alone and a capacity almost as high as that ofthe combined diagnosis-pharmacy-based PM. PMs provided considerably betterpredictions when calibrated to Spanish data.
Conclusions: Understandably, pharmacy spending is more predictable usingpharmacy-based risk markers compared with diagnosis-based risk markers.Pharmacy-based PMs can assist plan administrators and medical directorsin planning the health budget and identifying high-cost-risk patients amenable
to care management programs.
AUTHORS/INSTITUTIONS: C. Abrams ([email protected]); J.P. Weiner, ( jweiner@ jhsph.edu)Health Policy & Management, Johns Hopkins University, Bal timore , MD; A. Calderón-Larrañaga ([email protected]); B. Poblador-Plou ([email protected]); A. Prados-Torres ([email protected]) , Aragon Health Science Institute,Zaragoza, SPAIN;
1152726
Case Mix Readjusted Analysis of PPR in Patients Admittedin Geriatric One-Day Clinic
Introduction: A new kind of one-day hospitalization was introduced in 2007 inBelgium legislation specifically aimed at the elderly patient. Its purpose is thediagnostic evaluation, therapeutic adjustment and rehabilitation in a multidisciplinaryfashion. This should prevent a number of hospitalizations for the target population.This study aims at comparing the number of readmission and potentially preventablereadmissions (PPR ™3M) for patients with the same case-mix admitted or not in thegeriatric one-day
Methods: We retain de data of the year 2009 of the Centre Hospitalier Regional dela Citadelle (Liège). These are processed using the APR-DRG grouper (™3M), whichis used in Belgium for the official DRG payment system. The PPR indicators are
generated by 3M specific software.These are compared to a benchmark of 45 Belgian hospitals. We also identify theDRG’s where the risk off PPR is the highest.Secondly, we divide our population in two categories: patients aged 75 or more whoare treated in the geriatric one-day clinic an those patients aged 75 plus or more whoare not. We compare the number of readmissions and PPR to examine if this one-dayclinic succeeds in diminishing the number of hospitalizations in this population. Wedo this globally and case-mix readjusted

8/13/2019 2011 Montreal Conference Abstract Book
http://slidepdf.com/reader/full/2011-montreal-conference-abstract-book 66/16650
= ( WX ′ – – WY
β = ( WX ′ ) – XWY
= β + ε
= + ε
= + εQ75+ .5 x (Q.
5- Q
25
Q75 1.5 (Q
75 -
25)
2 7 t h P C S I C o n f e r e n c e | O c t o b e r 1 9 t o 2 2 , 2 0 1 1 | M o n t r é a l , Q u e b e c , C a n a d a
Each patient counts
T H U R
S D A Y
Results: The Centre Hospitalier Regional de la Citadelle (Liège) had in 2009 380.030admissions. 29.212 of these were not planned. They represent the visits of 27.170patients. With an 30d interval 544 patients had chains and 9 even more than 1 chain. An average of 2.137 admissions per chain was observed. 2.42% of the patients withunplanned admissions had chains, while in the benchmark this is 2.46%. If in a chainplanned readmissions are eliminated the number of patients with a chain are reducedwith 41.64% (40.33% in the Bench). The readmission are consequently lower (albeitlittle) than the averaged of the benchmark
The top 5 of our initial medical DRG’s which start a chain are : 140 (chron. obstructivepulm. disease), 133 (pulmonary edema & resp. fail.), 194 (heart failure), 721 (post-op/post-trauma/dev. Infect) and 139 (other pneumonia). The top 5 for chirurgical initialDRG’s are 813 ( other comp. of treatment), 194 (heart fai lure), 143 (other resp. dx exc.Sign/sym/minor), 139 (other pneumonia) and 254 (other digestive system dx).Of the 2831 patients aged 75 or more, 133 were admitted at least once in the geriatricone-day clinic. 36.09% of these were multiple times hospitalized. Of the 2698 otherseniors only 29.79% were more than once hospitalized. This higher number ofreadmissions was observed, even if we selected only a subset with severity 2 orhigher or if we compared per DRG
Conclusions: Geriatric one-day patients in our hospital have a higher risk of beingreadmitted in hospitalization, compared to a similar case-mix group (DRG, severity,age category). The clinic doesn’t succeed in reducing this risk to the level of patientsnot included. However the selection of patients to go or not in the one-day clinicis not random but clinically. A comparison between hospitals with and without ageriatric one-day clinic should be able to help indicate if a one-day clinic effectivelyreduces the number of readmissions or rather increases it.
AUTHORS/INSTITUTIONS: P. Heirman ([email protected]) Medical
Department, CHR la Citadelle, Liège, Liège, BELGIUM;C. Licoppe ([email protected]);Y. Delcourte ([email protected]);J. Heylen ([email protected]), Health Information Systems, 3M Belgium,Brussels, Brussels, BELGIUM;

8/13/2019 2011 Montreal Conference Abstract Book
http://slidepdf.com/reader/full/2011-montreal-conference-abstract-book 67/1665
Each patient counts
2 7 t h P C S I C o n f e r e n c e | O c t o b e r 1 9 t o 2 2 , 2 0 1 1 | M o n t r é a l , Q u e b e c , C a n a d a
Friday, October 21, 2011SESSION 3A—Care Quality and Case Mix
1163651
Incremental Costs of Hospital-Acquired Complicationsin Alberta, Canada
Background: Hospital-acquired diagnoses (HAD) not only lengthen inpatients’recovery times but also incur significant additional costs of care. The focus ofprevious research has been on ‘highly preventable’ indicator conditions and thecost of individual episodes, rather than on the entire spectrum of unintentionalpatient harm. As well, little attention has been paid to the frequency of HADsand resulting total costs.
Objective: The objective of this study was to estimate the incremental cost,aggregated system costs, and length-of-stay effects of hospital-acquireddiagnoses in eight Alberta (Canada) hospitals.
Methods: Routinely coded diagnosis data, combined with a Present-on-Admission(POA) flag, were used to group 206,011 inpatient records into the 144 classes of theClassification of Hospital Acquired Diagnoses (CHADx). In Alberta’s larger hospitals,costs are measured using sophisticated bottom-up, patient-level costing systems.
We employed a generalized linear model (GLM) with a gamma distribution usinga log link relationship between the total cost of hospitalization and all 144 CHADxgroups, after controlling for in-hospital death, one-day hospitalization, and the mean
of uncomplicated cases in each CaseMix Group (CMG).Results: Nearly a quarter of the sample (23.9%) had at least one recorded hospital-acquired diagnosis. Across all cases, any HAD was associated with increased costsof C$10,866, more than double the mean cost of an uncomplicated admission, witha mean of 4.7 additional days of stay. CHADx representing the highest per-episodemedian incremental cost included multi-drug resistant Staph aureus (CHADx 4.3,C$11,357), falls with fractured neck of femur (CHADx 3.1, C$6,679), and pressureulcers (CHADx 8.1, C$6,512). Twenty-two CHADx added > 2 days to the medianfor a similar but uncomplicated stay.
Taking the volume of cases into account, and using an approximation of the meanincremental cost to capture all system costs, urinary tract infection (CHADx 9.2) was
the most costly, adding C$19.3 million to system costs. CHADx responsible for thegreatest extension of LOS (length of stay) across the system were similar to thoseadding the greatest costs, with the notable additions of Clostridium difficile infection(CHADx 7.3, +8,813 days) and septicaemia (CHADx 4.1, +6,284).
8/13/2019 2011 Montreal Conference Abstract Book
http://slidepdf.com/reader/full/2011-montreal-conference-abstract-book 68/16652
= ( WX ′ – – WY
β = ( WX ′ ) – XWY
= β + ε
= + ε
= + εQ75+ .5 x (Q.
5- Q
25
Q75 1.5 (Q
75 -
25)
2 7 t h P C S I C o n f e r e n c e | O c t o b e r 1 9 t o 2 2 , 2 0 1 1 | M o n t r é a l , Q u e b e c , C a n a d a
Each patient counts
F R I D A Y
High-level grouping of CHADx showed hospital-acquired infections to be the mostlycostly type of complication, adding C$49.6 million, although this finding is sensitive tothe way in which HAD conditions are grouped.
Discussion: Few hospital-acquired diagnoses are preventable in every case, but
most have been shown to be amenable to a reduction in their rates. POA flags onroutine diagnosis data considerably improve the ability to identify compromisedpatient care, although such data will remain controversial without further effortsto improve medical record documentation. Adding financial and length-of-staydimensions to discussions about hospital quality improvement may strengthenefforts to reduce harm to patients, as will timely access to local data.
Acknowledgements: The authors wish to thank Alberta Health Services for accessto de-identified patient-level data. However, we note that this paper is not endorsedby Alberta Health Services, nor does it represent official AHS policy.
This study was granted ethical approval by the Human Research Ethics Board
of the University of Alberta.Authors
Terri Jackson1,2 ([email protected]);Andrew Fong3 ([email protected]);MingFu Liu3 ([email protected]);Kaaren Murray4 ([email protected]); Laurie Walz3 ([email protected]); Chris Houston3 ([email protected])and Stafford Dean3 ([email protected]) and Kim Walker ([email protected])
Authors Af fi liations
1. Division of Pulmonary Medicine, Faculty of Medicine and Dentistry, University
of Alberta, Edmonton, Alberta, Canada2. Health Policy and Management, School of Public Health, University of Alberta,
Edmonton, Canada3. Data Integration Measurement and Reporting, Strategy and Performance,
Alberta Health Services, Calgary, Alberta, Canada4. Provincial Operations, Standards, and Strategies, Health Information,
Alberta Health Services, Calgary, Alberta, Canada
1163906
Using Hospital Readmission Rates to Track the Quality of Care
in Public Hospitals in SingaporeResearch Objectives: Singapore introduced Casemix-based financing for inpatientand day-surgery cases in the public sector in 1999. The application of Casemix hassince been extended beyond financing to fields such as benchmarking, clinicalquality and utilization review. Casemix data has been invaluable in enabling thetracking and better understanding of quality of care of healthcare providers, aswell as providing a view to better managing them.

8/13/2019 2011 Montreal Conference Abstract Book
http://slidepdf.com/reader/full/2011-montreal-conference-abstract-book 69/1665
Each patient counts
2 7 t h P C S I C o n f e r e n c e | O c t o b e r 1 9 t o 2 2 , 2 0 1 1 | M o n t r é a l , Q u e b e c , C a n a d a
In this paper, we discuss the use of Casemix data based on a recent study of hospitalreadmission rates. The study subsequently led to the incorporation of this indicatorinto the Ministry of Health’s Scorecard for Acute Hospitals.
Methods: Hospital administrative data of inpatients admitted to public hospitals in
Singapore during 2006–2010 were analyzed. 30-day readmission rates were calculatedafter excluding ‘transfers-out’, ‘in-hospital deaths’, and cases with certain underlyingconditions that might potentially affect the risk of readmission (for example, cancer,HIV, trauma). The rates were further adjusted for pat ients’ Casemix using multivariatelogistic linear regression modeling to ensure like-for-like comparisons when comparinghospitals and evaluating trends over time. Factors for adjustment included age, gender,Charlson comorbidity index, and past hospitalization.
Readmission rates were analysed at the ‘All cause’ level as well as at the ‘Condition-specific’ level; i.e., for seven selected conditions: asthma, AMI, CHF, COPD, diabetes,pneumonia, and stroke.
Results: In 2010 the crude ‘All cause’ 30-day readmission rate was 11.6%. Of thosereadmitted, the admission of 27.3% was due to the same principal diagnosis, and 83.6%returned to the same index hospital. It was found that rates were higher with increasingage. Also identified as the most significant risk factors affecting readmissions werehospitalization in past year, the Charlson comorbidity index, and principal diagnosesof index episodes. In those aged 65 years and older, the readmission rate in Singaporewas 19.0%, slightly lower than in the United States (19.6%).
The study also highlighted differences in readmission rates between hospitals,indicating a likely variation in quality of care. This was present at both the ‘All cause’and the ‘Condition-specific’ levels.
Conclusion: Readmission rate was assessed as to its validity as an effective ‘Big Dot’measure for inclusion in the Ministry of Health’s performance measurement andquality improvement framework for acute hospitals. The findings for this indicatorhave since been shared with the hospitals which subsequently worked out targetedsolutions to close performance gaps, with the ultimate goal of raising the qualityof patient care. The indicators will continue to be reviewed regularly, and theperformance of hospitals will be tracked to monitor improvement over time.
Author: Dr. (Doctor) Lim Eng Kok ([email protected]), Ministry of HealthSingapore, Singapore
Co-authors:
Dr. Niti Matthew ([email protected]) Ministry of Health Singapore
Ms. Mok Wei Ying ([email protected]) Ministry of Health SingaporeMs. Lee Wai Yen, Denise ([email protected])Ministry of Health SingaporeDr. Shamim Chowdhury ([email protected])Ministry of Health Singapore

8/13/2019 2011 Montreal Conference Abstract Book
http://slidepdf.com/reader/full/2011-montreal-conference-abstract-book 70/16654
= ( WX ′ – – WY
β = ( WX ′ ) – XWY
= β + ε
= + ε
= + εQ75+ .5 x (Q.
5- Q
25
Q75 1.5 (Q
75 -
25)
2 7 t h P C S I C o n f e r e n c e | O c t o b e r 1 9 t o 2 2 , 2 0 1 1 | M o n t r é a l , Q u e b e c , C a n a d a
Each patient counts
F R I D A Y
AUTHORS/INSTITUTIONS: E. Lim, N. Matthew, W. Mok, S. Chowdhury,D. Lee, Healthcare Performance Group, Ministry of Health Singapore,Singapore, SINGAPORE;
References
1. Canadian Institute for Health Information. Health Indicators 2010 Ottawa: CIHI, 2010. Westert GP, et al.2. An international study of hospi tal readmiss ions and rela ted ut ilization in Europe andthe USA. Health Policy 2002;61:269-78. Jencks SF, et al.3. Rehospitalization among patients in the Medicare Fee-for-Service Program. N EngJ Med 2009;360:1418-28.Rumball-Smith J, et al.4. The validity of readmission rate as a marker of the qualit y of hospital care, and a recommendation for i ts def inition. J New Zealand Med Assoc 2009;122:1289.U.S. Department of Health & Human Services. Hospital compare. Retrieved 6 April 2011, from5.www.hospitalcompare.hhs.gov. (Rates were for the period July 1, 2006 - June 30, 2009).
1151617
Health Status and Performance Using Clinical RiskGroups(ACRG3) for the Madrid Region
Introduction: More than 90% of the population is treated by the public sector in theMadrid region. The Madrid Community is evaluating a population based grouper toenable better description of health status of its population for planning, performanceevaluation, utilization review and primary care new funding mechanisms.
Population-based groupers use as input the same Minimum Basic Data Set (MBDS)information from inpatient and day surgery and Medicine discharges as do DRGencounter groupers. Also they can input the multiple diagnoses coming from “carta”,annual primary care and specialized consultations clinical documentation sheets.
Methods: In addition to the clinical information from all 6 325 079 public patients
from the Madrid region in 2009, we obtained the units and estimated costs from allsectors, namely from ambulatory sector: outpatient drugs, primary care visits andspecialized consultations, external consultations from hospitals, emergency visits,other diagnostic and therapeutic services; and from inpatient sector using the APDRG classification and US cost weights.
The CRG methodology from 3M Inc is used for this study. This is a categorical modelenabling the identification of only one group for each patient. There are close to 1100CRG groups, including their combination with respective severity of illness level. Thisclassification collapses also into so-called Aggregated CRGs. We document in thisstudy only the coarsest granularity, the nine status levels (ACRG3s).
Results: Table 1 provides the overall distribution for all public sector registeredpatients in Madrid. 498 128 patients has one or more acute illnesses documented byStatus 2. For level 3 and above, we observe, with few exceptions, the normal patternof monotonic decrease in the number of cases as the status increases and as thelevel increase within each status , the cells with a zero count means that there areno severity level for that status.

8/13/2019 2011 Montreal Conference Abstract Book
http://slidepdf.com/reader/full/2011-montreal-conference-abstract-book 71/1665
Each patient counts
2 7 t h P C S I C o n f e r e n c e | O c t o b e r 1 9 t o 2 2 , 2 0 1 1 | M o n t r é a l , Q u e b e c , C a n a d a
The average cost for inpatient stay is 2,913,54 euros; for one consultation in familymedecine, it is 45,06 euros; for nursing consultation, 15,53 euros; for specializedconsulation at hospital, 130,69 euros, etc. All units for each registered public healthcare services Madrid inhabitant are documented and enable the analysis of costs inrelation to CRG status.
Table 2 demonstrates the expected pattern of increase in average cost per registeredindividual as the status level increases (except between status of multiple minor chronicproblems and one major/dominant chronic disease) by Madrid district. As an example,the North district has the lowest costs (or best production performance) for all Statuslevels, except for the patients with one major chronic problem.
Conclusions: CRGs are a useful tool to evaluate the patient structure of chronicproblems and adjust for the relative production performance evaluation of variousgeographical sectors in the Madrid region.
AUTHORS/INSTITUTIONS: C. Bienzobas ([email protected])
Health Services Research Unit, Madrid Health Services, Madrid Community,Madrid, SPAIN;M. Berlinguet ([email protected])International Business Unit, 3M HIS,Wallingford, CT; A. Albarracín ([email protected]); Health Information Unit,Madrid Health Services, Madrid Community, Madrid, SPAIN;
1145645
First German Hospital Infection Benchmark Based on DRGRoutine Data
Introduction: Hospital infections are a serious health problem in most countries.Clinical outcome and survival are much worse than in patients without infections.Especially in DRG - based budget environments, many studies have shown, thatpatients with infections often are cost or LOS-outliers.
In Germany there is a long tradition of benchmarking on DRG-level but very fewanalyses exist that allow clinical comparisons. Clinical data collections usuallydo not contain economical information
Methods: We developed an algorithm to identify infections and classify them ascommunity acquired (ca), hospital acquired (ha) or potentially hospital acquired (pha).
By using an existing hospital database that contains data from 174 hospitals and3.4 Mio. Patients per year we developed a benchmarking tool for the comparisonof infections.
We use the following parameters for comparisons:no. of and percentage of certain infections in the hospital•distribution of infections by ca, ha, pha•variations in LOS for patients w and w/o infections•extent of deviations from the ALOS of the DRGs•occurrence of multiresistent bacteria•

8/13/2019 2011 Montreal Conference Abstract Book
http://slidepdf.com/reader/full/2011-montreal-conference-abstract-book 72/16656
= ( WX ′ – – WY
β = ( WX ′ ) – XWY
= β + ε
= + ε
= + εQ75+ .5 x (Q.
5- Q
25
Q75 1.5 (Q
75 -
25)
2 7 t h P C S I C o n f e r e n c e | O c t o b e r 1 9 t o 2 2 , 2 0 1 1 | M o n t r é a l , Q u e b e c , C a n a d a
Each patient counts
F R I D A Y
for each parameter distribution graphs are drawn. Each hospital can determinethe own 'rank' in the group of hospitals.
Results: The project is ongoing. Momentarily we are implementing the algorithmin the database and in Jluy we do the queries.
We expect the results to be ready by end of August 2011.Special interest will be the comparison of the data (DRG) driven analyses withother sources, like the German hospital infection surveillance system (KISS).
Conclusions: Conclusions will deal with feasibility, accuracy of the results,implications for clinical practice and transferability in international context.
AUTHORS/INSTITUTIONS: M.H. Wilke ([email protected]) CEO, Dr. Wilke -inspiring.health, Munich, GERMANY;C. Birner ([email protected])IT Management, InMed GmbH,Hamburg, GERMANY;
SESSION 3B—Refining Case Mix Systems1163312
A Methodology for Refining AR-DRG
Introduction: Previous reviews of AR-DRG, such as that by Aisbett, Wiley et al (2007),have shown prior versions of AR-DRG to be among the world’s best in practice,and that further major improvements in grouper performance are unlikely to haveoccurred. More recent work, such as that by Aisbett, Aisbett, Sutch et al (2008),has shown that hospitals dealing with (age) restricted sub-populations may bedisadvantaged by funding mechanisms based on AR-DRG.
The understanding here is that DRG systems rely on population-samplingassumptions (as well as matching on influential variables and mathematicalmodeling) to reduce the risk of biased comparisons of health services. Aisbett’smethodology can be used to identify sets of medical conditions (and procedures)that are associated particularly with increased risk of bias. The research findings alsoencourage development of AR-DRG along the lines of age-dependent complicationlevels, so it is appropriate to examine how this knowledge can be implemented toachieve effective refinement.
The ultimate aim of this work is to make changes to the current grouper that will leadto better performance as evaluated under the criteria used in the two publications
referred to above.

8/13/2019 2011 Montreal Conference Abstract Book
http://slidepdf.com/reader/full/2011-montreal-conference-abstract-book 73/1665
Each patient counts
2 7 t h P C S I C o n f e r e n c e | O c t o b e r 1 9 t o 2 2 , 2 0 1 1 | M o n t r é a l , Q u e b e c , C a n a d a
Methods: National and international studies have provided lists of medical codesassociated with complication of care. These data can often be sourced for use inresearch. For example, one outcome of the work in The Information Centre, CasemixService, National Health Service UK (2007), is the tabulations of secondary diagnosiscodes associated with extra-care requirements in paediatrics. These data are directlyuseful, as demonstrated in Aisbett et al (2008), or as stimulus material for subjectmatter experts.
Large Australian data sets also allow for the further exploitation of the methodsoutlined in Aisbett et al (2008). These were based on the examination of resourcerelativities as exhibited across the health system, and within particular subsetsof the system. Aisbett's Generalized Least Squares (GLS) method identifies whenthe assumption that there are no material interactions between AR-DRG resourcerelativities and episode-of-care sub-population fails. This knowledge can then beused in conjunction with code frequency-based partitions of resource use data toidentify codes that have age-specific complicating effects.
The process of evaluation of a code’s complication and comorbidity level (CCL)(or the impact of a group of codes) can be outlined as follows:
Divide the AR-DRGs into a High and a Low set according to the (relative) frequency1.of the code as a secondary diagnosis in that particular AR-DRG in the wholecollection.Divide the collection into subsets according to demographic/health service2.variables of interest.Conduct Aisbett’s GLS analysis using only the AR-DRGs in each set (High and3.Low), but use the same demographic/health service variable breakdowns asepisode-of-care subsets (sub-populations).Identify whether the resource relativities assumption fails in the High frequency set.4.For each sub-population, identify whether the Casemix-adjusted cost per episode5.differs for the High and Low frequency partition. Analyse the outputs above to see if there are interaction ef fects.6.
Results: Detailed results are available in Chapter 4 of the publication available atthe following web address:
http://www.pc.gov.au/__data/assets/pdf_file/0017/90611/sub021-attachment.pdf.
In essence, groups of codes associated with the distortion of AR-DRG resourcerelativities may be identified even when individual codes have a low frequencyof occurrence.
Conclusions: The approach developed in this research may be applied to a widerange of grouper development initiatives.
AUTHORS/INSTITUTIONS: C.W. Aisbett ([email protected])Laeta Pty Ltd,Randwick, New South Wales, AUSTRALIA & Casemix Unit, Health Service Executive,Palmerston, Dublin, IRELAND

8/13/2019 2011 Montreal Conference Abstract Book
http://slidepdf.com/reader/full/2011-montreal-conference-abstract-book 74/16658
= ( WX ′ – – WY
β = ( WX ′ ) – XWY
= β + ε
= + ε
= + εQ75+ .5 x (Q.
5- Q
25
Q75 1.5 (Q
75 -
25)
2 7 t h P C S I C o n f e r e n c e | O c t o b e r 1 9 t o 2 2 , 2 0 1 1 | M o n t r é a l , Q u e b e c , C a n a d a
Each patient counts
F R I D A Y
1152590
Development of a Classification of Clinical Specialties: ServiceRelated Groups (SRGs) and Enhanced Service Related Groups
(ESRGs)Introduction: Service Related Groups (SRGs) and Enhanced Service Related Groups(ESRGs) have been used in New South Wales (NSW), Australia, since the early 1990s,and were adopted nationally in the late 1990s. SRGs reflect clinical specialties, whileESRGs provide more detail of major conditions and procedures within the specialties.Both classifications are based on grouping of AR-DRGs but are differentiated fromDRGs in that the classes are exhaustive with respect to other types of admittedpatient care other than acute (i.e. sub and non acute and psychiatric/mental healthadmissions), and that SRGs are designed to mimic clinical specialties within hospitals.
The SRG and ESRG classifications provide the health system with a commonlanguage to converse about health planning issues. They standardise local variation
in classification of health services and/or designation of patients to those services.They also provide the data structure upon which health departments can developtools to assist planners in applying standardised approaches to identifying needin the population and constructing health service plans. A good example of this isthe development of activity projections, which are aimed at quantifying the futuredemand for admitted patient activity given projected population growth and ageing,epidemiology, technology and other factors influencing the demand and supply ofservices. Another potential area is workforce planning, which is a growing issuegiven the demands on the health system.
Methods: This project reviewed the SRG and ESRG classifications used in NSW.The main drivers for the review were:
(1) Currency of the existing classification systems. The classifications were reviewedto ensure their currency in a rapidly evolving environment (i.e. including changes inclinical practice, use of technology, and epidemiology of the population);
(1) Changes to underlying classification and coding systems. SRGs and ESRGsare (predominantly) groupings of Australian Refined (AR-)DRGs, which are in turnconstructed through a complex logic involving patients’ diagnoses and interventionsamong other key variables. Diagnoses and interventions in Australia are coded usingthe International Classification of Diseases – 10th Revision – Australian Modification(ICD-10-AM). There were revis ions of both AR-DRGs and ICD-10-AM versions sincethe last major reviews of SRGs and ESRGs in about mid the 2000s. Therefore,
a review of these underlying classifications and coding systems was necessaryto ensure that their allocations are still appropriate.
The current review was a major one in that it involved a re-examination of thestructure of both SRGs and ESRGs. To do this, we reviewed data from NSW hospi talsof the structure of their clinical departments and reviewed national and internationalwork on classifications of clinical specialties.

8/13/2019 2011 Montreal Conference Abstract Book
http://slidepdf.com/reader/full/2011-montreal-conference-abstract-book 75/1665
Each patient counts
2 7 t h P C S I C o n f e r e n c e | O c t o b e r 1 9 t o 2 2 , 2 0 1 1 | M o n t r é a l , Q u e b e c , C a n a d a
After construct ing an init ial list of SRGs, we again examined NSW data to analysethe most frequent assignments to clinical specialties for each DRG by individualhospitals. This initial assignment was reviewed internally and some overrides weremade based on specific criteria. We then consulted widely with key stakeholders,including clinicians and health service planners.
Results: The final SRGs include classes for acute, sub and non-acute andpsychiatric/mental health care episodes. Within these, ESRGs have been identified,grouping major conditions and procedures in the case of acute care, and forsubacute care, we identify a methodology to subset admitted episodes according toimpairment category for rehabilitation for example, using routinely collected admittedpatient data. The criteria we use for subsetting ESRGs include major conditions/procedures, use of specialist suite/resources and potentially trends in activity,while maintaining sufficient volumes within each class.
Conclusions: While there are more than 650 AR-DRGs for acute care, the SRGclassification has 45 classes and ESRGs 141 classes across acute, sub and non
acute and psychiatry/mental health, making them a more manageable and focusedset of classes for planning health care services.
AUTHORS/INSTITUTIONS: D. Mazevska ([email protected]); J. Pearse ([email protected]), Health Policy Analysis Pty Ltd,St Leonards, New South Wales, AUSTRALIA;J. Pearse, Centre for Health Services Development, University of Wollongong,Sydney, New South Wales, AUSTRALIA;
1152988
Counting Chronic Diagnoses is Not Enough: Classifying theEntire Patient Population With a Morbidity Spectrum MeasureIntroduction: Persons with similar chronic conditions differ in their overall morbidity.The study examined the degree of variation in the full spectrum of morbidity and inassociated health care use among persons with multiple chronic conditions.
Methods: A retrospective cross-sectional analyses. Data from electronic medicalrecords from all medical encounters of a representative sample of 279,241 adultenrolees of Clalit Health Services, Israel's largest health plan. The full spectrumof morbidity was measured using the Johns-Hopkins University Adjusted ClinicalGroups® (ACGs) System based on one year’s (2009) diagnostic information. Chroniccondition counts were based on data from the Clalit's chronic disease registries,
which align information from several sources, including electronic medical recordsfrom physician visits and hospitalisations, data on prescription drugs, and informationfrom diagnostic and lab tests. For cohorts classified as having varying numbersof chronic conditions, morbidity was categorized as low, medium or high andassociated relative resource use was calculated for each category

8/13/2019 2011 Montreal Conference Abstract Book
http://slidepdf.com/reader/full/2011-montreal-conference-abstract-book 76/16660
= ( WX ′ – – WY
β = ( WX ′ ) – XWY
= β + ε
= + ε
= + εQ75+ .5 x (Q.
5- Q
25
Q75 1.5 (Q
75 -
25)
2 7 t h P C S I C o n f e r e n c e | O c t o b e r 1 9 t o 2 2 , 2 0 1 1 | M o n t r é a l , Q u e b e c , C a n a d a
Each patient counts
F R I D A Y
Results: On average, adult enrollees had two chronic conditions and about fivedifferent types of morbidity (as measured by the Aggregated Diagnoses Groups(ADG) component of the ACG System). Having more chronic conditions was notas highly related to increased resource use as was having a more varied morbidityspectrum (i.e.,. greater variety of types of conditions): Most adults had at least onechronic condition. Only 14.5% of those with no chronic conditions were categorisedwith no morbidity, representing about 5.6 percent of the adult population. Havingmore chronic conditions, on average, was associated with greater relative resourceuse. Yet, inconsistencies are noted. Morbidity spectrum, however, was more stronglyrelated to resource use - patients in higher morbidity spectrum groups had greaterrelative resource use than patients in lower morbidity spectrum groups in eachchronic conditions stratum for each of the resource use variables
Conclusions: A greater variety of co-occurring morbidity types contributesmuch more to resource use than a sum of individual chronic diseases. For caremanagement and research applications, it is more useful to know about the entiremorbidity spectrum rather than to focus only on chronic conditions
AUTHORS/INSTITUTIONS: E. Shadmi, Social Welfare and Health Sciences,Haifa University, Haifa, ISRAEL;E. Shadmi ([email protected]); R.D. Balicer ([email protected])Clalit Research Institute, Clalit Health Services, Tel Aviv, ISRAEL;K. Kinder ([email protected]);C. Abrams ([email protected]);S. Sutch (ssutch@ jhsph.edu); B. Starfield ([email protected]); J.P. Weiner ([email protected]) HealthPolicy and Management, Johns Hopkins School of Public Health, Baltimore, MD;
1152770
Should there be a Limit for DRG Split? A Case of ThaiDRG Versions 3 to 5
Introduction: The provider payment method based on diagnosis related group inThailand has faced serious consideration how many groups of DRGs are acceptableto key providers since the development of Thai DRG version 4 in 2007 and the ThaiDRG version 5 in 2010. The more refined groups would make a shif t of resources fromsmaller hospitals to bigger hospitals. Should the decision on a limit for DRG split bemade at the development phase or the implementation of the payment phase? Thisstudy aimed to compare the DRG splits of Thai DRG versions 3, 4 and 5.
Methods: Inpatient data of 2010 were passed through DRG groupers of versions 3,4 and 5. The numbers of DRGs in each Major Diagnostic Category were traced usingthe average length of stay and relative weight as the outcome measure.
8/13/2019 2011 Montreal Conference Abstract Book
http://slidepdf.com/reader/full/2011-montreal-conference-abstract-book 77/1666
Each patient counts
2 7 t h P C S I C o n f e r e n c e | O c t o b e r 1 9 t o 2 2 , 2 0 1 1 | M o n t r é a l , Q u e b e c , C a n a d a
Results: Inpatient data of 5.65 million discharge cases were grouped into 1,275DRGs of the Thai DRG version 3, 1,917 DRGs of version 4 (a 50% increase f rom theprevious version) and 2,449 DRGs of version 5 (a 28% increase). The developmentof version 4 delivered more splits in MDC08 (new 69 DRGs) and MDC06 (66 newDRGs). The development of version 5 led to reduction of DRGs in MDC00 (22DRGs) but more in MDC01 (65 new DRGs) and MDC28 (new 57 DRGs). Controllingfor disease clusters (DCs or the first four digits of DRGs) to highlight the effects ofcomorbidities and complications on severity of disease (the fifth digit), 89.4% of thetotal cases remained in the same DCs when compared version 3 with version 4, and94.5% remained unchanged when compared version 4 with version 5. For cases withseverity changes, the newer versions (especially version 5) toned down the effects ofCC, i.e., 3% of 5.05 million cases saw a reduction of severity by version 4, and 15%of 5.34 million cases saw a reduction by version 5 while the increment of severitywas 1% for both versions. The wider range of RW by version 4 led to a 5% increaseof average RW in patients with same DRGs, and a 40% increase of average RW inpatients with DRG changes. A slightly narrower range of RW by version 5 led to a
4% reduction of average RW in patients with same DRGs, and a 24% reductionof average RW in patients with DRG changes. Finally, newer DRG versions betterpredicted the hospital resource use: bed-days (r-square of 0.186 for version 3,0.254 for version 4 and 0.277 for version 5).
Conclusions: Newer versions of Thai DRG resulted in more number of groups inmany MDCs, a reduction of groups in the pre-MDC (MDC00), and a limit on severityof cases as the influence of the CC. The average relative weight does not alwaysincrease as the number of groups increase. More groups better predict hospitalresource use.
AUTHORS/INSTITUTIONS: S. Pannarunothai ([email protected]) Faculty ofMedicine, Naresuan University, Mueang Phitsanulok, THAILAND;
SESSION 3C—Health System Planning and Case Mix
1164862
Perceptions of the Case Mix System by Clinicians after the First Year of Implementation in Hong Kong: A Survey
Introduction: The Hong Kong Hospital Authority (HA) introduced a Pay-for-Performance (P4P) resource- allocation policy using a Casemix system in late 2008.Clinicians played a vital role in its implementation, especially with regard to the
accuracy of clinical data. The purpose of this study was to: Assess the short-term impact of Casemix-based funding as perceived by clinicians1.on clinical practice and quality of patient care after one year of implementation.Examine any association between the characteristics of the clinicians (rank and2.specialty) and their perceived impact of the Casemix system on clinical service.Identify the barriers encountered by clinicians on the effective implementation of3.this new policy.

8/13/2019 2011 Montreal Conference Abstract Book
http://slidepdf.com/reader/full/2011-montreal-conference-abstract-book 78/16662
= ( WX ′ – – WY
β = ( WX ′ ) – XWY
= β + ε
= + ε
= + εQ75+ .5 x (Q.
5- Q
25
Q75 1.5 (Q
75 -
25)
2 7 t h P C S I C o n f e r e n c e | O c t o b e r 1 9 t o 2 2 , 2 0 1 1 | M o n t r é a l , Q u e b e c , C a n a d a
Each patient counts
F R I D A Y
Methodology: A pilot quantitative study was done in March 2010 on a large, publicgeneral hospital in Hong Kong. All clinicians working in the hospital were recruited. A self-administered questionnaire, developed using recommendations from availableliterature, was used. Three aspects were looked at: the background characteristicsof the clinicians, their perceptions about the impact of the Casemix system, and theclinicians’ knowledge of the Casemix system.
Five-point Likert scale, true-false, and open-ended questions were used. Analyseswere performed to examine the relationship between the variables using Pearson’schi-square test or Fisher’s exact test, where appropriate.
Results:
520 questionnaires were sent out and the response rate was 17.3%.1.More than 2/3 of the respondents did not perceive any change in their clinical2.practice or the quality of care, efficiency of work, or fairness of resource allocation.More than 2/3 of the respondents agreed that there was improvement in clinical3.documentation, but at the expense of their time.
60% of the respondents did not agree that the system induce gaming.4.Participants’ knowledge of the Casemix system was generally poor, particularly5.among junior clinicians who, in addition, had a lower participation rate in theCasemix promulgation session conducted by the HA Casemix Office. The juniorclinicians also expressed anxiety about having to carry out clinical documentationwithout being given clear guidance.
Conclusions: After the first-year implementation of the P4P/Casemix policy inHA, clinicians did not perceive any negative impact on patient service, and theyagreed that there was improvement in clinical documentation. The perceived lackof both knowledge and access to knowledge among the junior clinicians needsto be addressed. Lastly, a post-implementation survey was found to be useful in
providing evidence to facilitate the formulation of communication strategies in theimplementation of a corporate Casemix system.
AUTHORS/INSTITUTIONS: G. Lam ([email protected]); , S. Lee ([email protected]);D. Yeung ([email protected]) Finance, The Hong Kong Hospital Authority,Hong Kong, HONG KONG;
1165413
Case Mix Innovation: Shifting to Integrated Care
Introduction: The vested interests of both hospitals and medical specialists in the
current system are blocking a breakthrough to a real patient-centred approach withinhealthcare. Adapting the funding system to cut across traditional silos of healthcareseems to be the key; however, these vested interests are prevent ing the introductionof a process of change which is needed for this paramount innovation.
This national approach will be presented to assess its international potential, sinceall countries face the same long-term care crisis of a lack of resources to meet thehealth needs of their populations. It will also be presented as an innovative approachto Casemix, as the clustering of patients is done based on clinical dimensions, andnot on groups defined by statistical analysis of available data.

8/13/2019 2011 Montreal Conference Abstract Book
http://slidepdf.com/reader/full/2011-montreal-conference-abstract-book 79/166

8/13/2019 2011 Montreal Conference Abstract Book
http://slidepdf.com/reader/full/2011-montreal-conference-abstract-book 80/16664
= ( WX ′ – – WY
β = ( WX ′ ) – XWY
= β + ε
= + ε
= + εQ75+ .5 x (Q.
5- Q
25
Q75 1.5 (Q
75 -
25)
2 7 t h P C S I C o n f e r e n c e | O c t o b e r 1 9 t o 2 2 , 2 0 1 1 | M o n t r é a l , Q u e b e c , C a n a d a
Each patient counts
F R I D A Y
Conclusions: The Dutch approach has created a new dimension in the applicationof Casemix. It has created direct links between healthcare delivery, costs, andoutcomes. The method taken for chronic diseases has linked prevention andhealthcare, and it provides a way to extend the paradigm shift of demand-orientedcare delivery across the traditional silos.
Another important breakthrough is the creation of a new dimension in Casemixtools. Instead of developing Casemix classification systems primarily based on thestatistical analysis of the costs involved in providing care, the new integrated-careapproach is based on clinical standards.
So, in the end, the dreams of Codman and Weed will come true. The next generationwill be provided with a sustainable healthcare system that involves the patient anduses problem-oriented records, even across institutions.
AUTHORS/INSTITUTIONS: J. Hofdijk ([email protected]) Casemix,Utrecht, NETHERLANDS
1151430
Can Clinical Pathways Enhance the Implementation of a CaseMix System? A Case Study in a Teaching Hospital in Malaysia
Introduction: A Clinical Pathway (CP) is a multidisciplinary plan of care based onbest clinical practice for a specified group of patients with a particular diagnosis. A CP is designed to minimize delays, optimize resource utilization, and maximizequality of care. CPs support the implementation of Casemix by reducing variationsof care, increasing homogeneity of cases, improving quality of Casemix data, andenhancing costing analysis in Casemix.
Methods: Universiti Kebangsaan Malaysia Medical Centre (UKMMC) in collaborationwith United Nations University International Institute For Global Health (UNU-IIGH)has developed, implemented, and evaluated four clinical pathways. These are STElevation Myocardial Infarction (STEMI); Chronic Obstructive Pulmonary Diseases(COPD); Elective Lower Segment Caesarean Sect ion (LSCS); and Elective Total KneeReplacement (TKR).
This non-randomized, single-blind, controlled study used enrolled patients fromJanuary 2008 to December 2008 as a control group (non-CP group). CP wasassigned to all new patients admitted with the above diseases from the year 2009until 2010.
Results: There was a significant reduction in the average length of stay (ALOS) of theCOPD CP group (5.85 ±1.92 days) when compared to the non-CP group (7.31 ±2.75days, Z= -3.893, P<0.001). In STEMI, the ALOS for patients in the non-CP group was8.15 ±2.25 days, while in the CP group it was 5.52 ±1.42 days (t = -4.85, P<0.001).There was also a significant difference in ALOS in LSCS, with the CP group staying4.04 ±0.61 days compared to the non-CP group staying 4.99 ±2.94 (Z = -3.221,P<0.001). In TKR, though, there was no significant difference between the ALOSof the CP and non-CP groups (9.93 ±4.32 days vs. 9.05 ±3.59 days). However, theage of the patient, co-morbidity, readmission, and complication rates did not differsignificantly between CP and non-CP groups.
8/13/2019 2011 Montreal Conference Abstract Book
http://slidepdf.com/reader/full/2011-montreal-conference-abstract-book 81/1666
Each patient counts
2 7 t h P C S I C o n f e r e n c e | O c t o b e r 1 9 t o 2 2 , 2 0 1 1 | M o n t r é a l , Q u e b e c , C a n a d a
Conclusions: There was significantly shorter ALOS among patients in CP groupscompared to non CP groups – except for TKR. In general, the implementation of CPshas had a positive impact in increasing the homogeneity of cases being managed inUKMMC. Hence, we conclude that the use of Clinical Pathways has enhanced andsupported the implementation of the Casemix system in the hospital.
AUTHORS/INSTITUTIONS: S.M. Aljunid ([email protected]);A. Ismail ([email protected]); , S. Sulong ([email protected])UNU-IIGH, UNU-International Insti tuteFor Global Health, Kuala Lumpur, Federal Territory, MALAYSIA;
A. Ismail, Dept of Community Health, University Kebangsaan Malasyaia,Kuala Lumpur, Federal Territory, MALAYSIAS.M. Aljunid, S. Sulong, International Casemix and Clinical Coding Centre, University
Kebangsaan Malasyaia, Kuala Lumpur, Federal Territory, MALAYSIA
1152303
How Population Based Case Mix has Proven Itself in CanadaIntroduction: Since 1998, the ACG® System has been successfully applied in8 Canadian provinces. Used by provincial health authorities as well as researchersat numerous Universities and research organizations, case mix has proven valuableto achieve numerous project objectives. Applications include:
Characterizing the use of health care services and identifying high utilizers.•Comparing the illness burden as measured by case-mix with patient•reported information.Predicting mortality• Assessing dif ferences by group size for patient access to care, continuity•of care, and provision of comprehensive primary care,
Establishing clinical baseline indicator data for improved provision of care•protocols and integrated health service plans,Support morbidity based capitation systems•Monitoring mental health status amongst specific populations•Identify and quantify patterns of use of public services• Assessing performance of primary care providers•Detecting fraud and abuse within the provision of health care services.•Control for morbidity in research studies•
Methods: Examples cited throughout the presentation will include results fromstudies performed in British Columbia, Manitoba, Ontario and Quebec.
Results: Through adaption to the local context including incorporation of localweights, recognition of local coding systems (i.e. ICD-10 and DIN), and local practicepatterns, the results have demonstrated the robustness and value of the ACG System.
Conclusions: The ability to apply case-mix to routinely collected diagnostic andpharmacy codes has provided valuable information to facilitate clinical, financial,and managerial decision making in Canada
AUTHORS/INSTITUTIONS: K. Kinder ([email protected])Bloomberg School ofPublic Health, Johns Hopkins University, Serrig, GERMANY;C. Abrams ([email protected]) , Bloomberg School of Public Health,Johns Hopkins University, Baltimore, MD;

8/13/2019 2011 Montreal Conference Abstract Book
http://slidepdf.com/reader/full/2011-montreal-conference-abstract-book 82/16666
= ( WX ′ – – WY
β = ( WX ′ ) – XWY
= β + ε
= + ε
= + εQ75+ .5 x (Q.
5- Q
25
Q75 1.5 (Q
75 -
25)
2 7 t h P C S I C o n f e r e n c e | O c t o b e r 1 9 t o 2 2 , 2 0 1 1 | M o n t r é a l , Q u e b e c , C a n a d a
Each patient counts
F R I D A Y
SESSION 3D—Case Mix Methodologies andTheir UseIntroduction en douceur à la méthodologie des systèmes dits “Casemix”pour
les nouveaux venus”Author(s): Prof. Dr. Jean Marie RODRIGUES, University Of Saint Etienne, CHU,Department Of Public Health and Medical Informatics, Saint Etienne, France,NSERM UMR 872 Eq 20, Paris, France. WHO Collaborating Center For InternationalClassifications In French Language Paris France.
Associate Professor Dr. Béatrice Trombert Paviot , University of Saint Etienne,CHU, Department of public health and medical informatics, Saint Etienne, France,INSERM UMR 872 Eq 20, Paris, France;
Dr. Dana Burduja, MSc, Programs Director Center for Health Policy and ServicesBucharest Romania, Saint Etienne PhD student
Overview: This session will be delivered in French language and it is intendedto introduce new comers (in their native language) to the basics principles andapplications of Case mix systems. Recommendations will be given during theworkshop about possible more extensive training, during further summer and winterschools organized by PCSI. The audience is broad, from clinical coders and costaccounting specialist from the health sector to decision and policy makers, especiallywhen using French as their working language.
Summary: Introduction: DRGs and Case mix, definitions, similarities, differences•History of DRGs and case Mix•
Basic principles in defining and asigning cases to DRGs• Implementation and utilization of Case Mix systems in different countries - overview•Case mix and quality of care•Topics of the PCSI Winter and Summer School•Q&As, discussions•
Take home messages: This session is aimed at providing French language speakerswith the basic principles of case mix development, implementation and uses- fromtheory to practical application in different health care settings. In-depth knowledgeand international experiences sharing can be further achieved by participants byparticipating in the association Winter or Summer Schools, with different topicsand teaching levels.
8/13/2019 2011 Montreal Conference Abstract Book
http://slidepdf.com/reader/full/2011-montreal-conference-abstract-book 83/1666
Each patient counts
2 7 t h P C S I C o n f e r e n c e | O c t o b e r 1 9 t o 2 2 , 2 0 1 1 | M o n t r é a l , Q u e b e c , C a n a d a
Utilisation de regroupements d’épisode de soins dansle cadre du financement du réseau de la santé et desservices sociaux du Québec
Presenter: Norman Lantagne, Directeur de l'allocation des ressources par intérim,Ministère de la Santé et des Services sociaux du Québec
Le Ministère de la santé et des Services Sociaux du Québec utilise depuis plusieursannées le système de classification DRG (Diagnostic Related Group) dans sesanalyses. Cet outil a d’abord permis d’établir un modèle de comparaison du coûtpar patient en prenant en considération le principal facteur expliquant les variationsde coût entre les établissements soit le niveau relatif des ressources utilisées.La lourdeur de la clientèle est aussi un élément important dans la déterminationd’un indicateur régional de besoins permettant le calcul des volumes attendus pourle programme de santé physique. Les résultats de performance des établissements
et les volumes attendus obtenus selon une approche populationnelle sont pris encompte dans l’allocation des ressources qui, depuis 2004-2005, a pour objet deremplacer progressivement la budgétisation historique des établissements.
La présentation fera le point sur les aspects du mode d’allocation des ressourceset d’autres outils de financement comme le programme d’accès à la chirurgie enlien avec le regroupement d’épisodes de soins. Plus particulièrement, il sera questionde l’utilisation des APR-DRG (All Patient Revised – Diagnostic Related Group) àla base du calcul de la lourdeur de la clientèle et l’apport de cette lourdeur auxméthodes de financement du réseau de la santé et des services sociaux.
PCSI 2011 Featured Abstracts1151751
Patient Pathway Aggregation – Building on a Firm Foundation
Introduction: Healthcare Resource Groups (HRGs) are the mechanism by whichpatient activity is classified according to Casemix in England. They are derivedfrom care-activity data, primarily ICD-10 diagnosis codes and the United Kingdom’sOPCS-4 intervention and procedure codes, recorded in local hospital systems. Careevents are recorded in standard datasets and processed through the HRG4 groupingalgorithm to assign appropriate HRGs for each event.
HRGs are the primary funding mechanism for acute care in the English National HealthService (NHS) under the Department of Health’s Payment by Results (PbR) national
policy. In the 2011/12 financial year, this covers admitted patient care, outpatient
procedures and emergency medicine, with a total estimated expenditure of £30 billion.
8/13/2019 2011 Montreal Conference Abstract Book
http://slidepdf.com/reader/full/2011-montreal-conference-abstract-book 84/16668
= ( WX ′ – – WY
β = ( WX ′ ) – XWY
= β + ε
= + ε
= + εQ75+ .5 x (Q.
5- Q
25
Q75 1.5 (Q
75 -
25)
2 7 t h P C S I C o n f e r e n c e | O c t o b e r 1 9 t o 2 2 , 2 0 1 1 | M o n t r é a l , Q u e b e c , C a n a d a
Each patient counts
F R I D A Y
As a precursor to calculating the national tari ff for HRG4 “currencies”, where a“currency” is defined in the Department of Health’s PbR Guidance for 2011-12 as “theunit of healthcare for which a payment is made”, the Department collects annual costdata (Reference Costs) from every NHS provider of care. It uses this data as the basisfor setting a national tariff and its related price.
The change in Government in the UK in May 2010 has resulted in a transformationin intended healthcare policy, with planned changes including the responsibility forcommissioning of NHS and Specialist Services being transferred to Clinical Consortiaand the newly established NHS Commissioning Board. At the same time, the State’srole in direct financial management is expected to be reduced as responsibility fornational price setting under the current Department of Health Payment by Results(PbR) policy transfers to Monitor, currently an independent regulator.
As highlighted by the proposed Health Bi ll for 2011, the desire to move to outcome-based payments for healthcare based on patient pathways that are informed byclinical and financial best practice has not waned. In addition, the renewed emphasis
on the patient journey, rather than its constituent parts, has led the Casemix team toreconsider the HRG4 classification in light of the new commissioner audience.
Methods: In keeping with the fundamental principles of a Casemix classificationbeing manageable in number, while retaining and indeed pursuing clinical relevance,the NHS Information Centre’s Casemix team recognises the inherent tension betweenthe level of specificity required in a classification to effectively deliver and monitorhealthcare provision and performance, and that required to commission healthcareservices for a targeted population at the patient level. If a healthcare providernecessarily needs to understand service inputs in order to maximise efficiency andquality, yet ultimately minimise costs, a commissioner will and arguably should adopta healthcare output, if not a healthcare outcome, perspective.
Previous attempts at developing patient pathways as a mechanism for fundinghealthcare in England have, however, been compromised by an inability to identifythe cost of the component elements of healthcare contained therein, or at least ona consistent basis and applicable nationally. They have also been hampered by alack of available standardised data beyond the traditional hospital setting, especiallywhere care is transferred beyond the hospital and into the community, or to anotherhealthcare provider.
As a result of the divergent classification requirements of healthcare provider andhealthcare commissioner in the new NHS, coupled with a need to provide a pathwayfunding solution for costing and ultimately pricing identified pathways of care, the
members of the Casemix team are investigating Patient Pathway Groups (PPGs) thatcan be assembled from the HRG4 classification.
8/13/2019 2011 Montreal Conference Abstract Book
http://slidepdf.com/reader/full/2011-montreal-conference-abstract-book 85/1666
Each patient counts
2 7 t h P C S I C o n f e r e n c e | O c t o b e r 1 9 t o 2 2 , 2 0 1 1 | M o n t r é a l , Q u e b e c , C a n a d a
While this approach has many advantages, those most notable include the ability to:Use national Reference Costs at an HRG4 level, including those for unbundled•events additional to the core care episode, to provide a variable ‘value’ unit forthe patient pathwayBase the elements of proposed pathway groups upon robust, clinically•endorsed HRGs Adopt an incremental and modular approach to development so that existing•datasets can be utilised to provide relatively “quick wins”, with the option toextend the pathway to new settings and service areas as more data becomeavailable over time
Results: Early findings indicate that in all likelihood PPGs will utilise selectivediagnosis entry criteria with event-based pathway modifiers to provide three levelsof patient pathway stratification covering routine to complex care, although thishas yet to be fully evaluated. Pilot resul ts for a number of pathways are expectedin autumn 2011.
Conclusions: What is clear is that PPGs offer the possibility of providing asophisticated aggregate commissioning currency for healthcare that overlays andbuilds upon the comprehensive HRG4 classification that remains pivotal to provider-level costing.
AUTHORS/INSTITUTIONS: P. Monteith ([email protected]) NHS InformationCentre, Leeds, UNITED KINGDOM
1152765
Analysis of the Variability of Nursing Care by Pathologyin a Sample of Nine Belgian Hospitals
Introduction: In 2010, a Belgian study i explored the feasibility of introducing all-inclusive case-based payments for Belgian hospitals. In this kind of financing system,hospital services and patient mix are described in a simplified way through DiagnosisRelated Groups (DRGs). A tariff is fixed in advance for each DRG. DRGs are groupsof patients based on economic and clinical homogeneity. Clinical homogeneity isachieved on the basis of medical diagnosis, co-morbidities, medical procedures,complications, etc.Economic homogeneity is achieved by using, first of all, the lengthof stay (LOS) or cost (or charges) of hospitalization as a classification criterion.
i. Sermeus W., Gillet P., Tambeur W., Gillain D., Grietens J., Laport N, et al. Financement des soinsinfirmiers hospitaliers. Health Services Research (HSR). Bruxelles: Centre fédéral d'expertise dessoins de santé (KCE);2007. KCE reports 53B (D/2006/10.273/07).

8/13/2019 2011 Montreal Conference Abstract Book
http://slidepdf.com/reader/full/2011-montreal-conference-abstract-book 86/16670
= ( WX ′ – – WY
β = ( WX ′ ) – XWY
= β + ε
= + ε
= + εQ75+ .5 x (Q.
5- Q
25
Q75 1.5 (Q
75 -
25)
2 7 t h P C S I C o n f e r e n c e | O c t o b e r 1 9 t o 2 2 , 2 0 1 1 | M o n t r é a l , Q u e b e c , C a n a d a
Each patient counts
F R I D A Y
As soon as DRGs were introduced, most nursing research revealed that DRGswere not very amenable to homogeneous integration with nursing care. DRGs onlyexplained 20% to 40% of the variability in nursing care. Coefficients of variation fornursing care per DRG have been reported as varying from 0,22 to 2,56 ii, iii, iv, v,. Thisis the reason why some researchers try to refine DRG classification into classes ofnursing cost per DRG vi. However, it is difficult to find recent data that deals with this.
The objectives of this study are to:Discover if nursing activity is homogeneous by DRG and severity of illness.1.Evaluate the correlation between LOS of patients and nursing activity per patient.2.
Methods: Nursing minimum datasets of nine hospitals were used for the year 2008. APR-DRGs of inpatients were also transmitted by hospitals. The sample is composedof 12734 complete stays (the nursing minimum dataset is only obligatory 4 * 15 daysa year per hospital). The transformation of nurse activity into nursing time was madeby using existing time-by-nurse statistics from two reports published by the Ministryof Public Health (Win vii and Welame viii reports).
To evaluate the homogeneity of nursing activity by DRG, an analysis of percentilesand coefficients-of-variation was carried out on DRGs and the severities of illness thatincluded more than 100 patients (3135 patients). A selection of high and low out lierswas also done. The 75th percentile +1,5* interquartile range was used to select highoutliers; the 25th percenti le -1,5* interquartile range was used to select low out liers.The Pearson coefficient was used to evaluate the correlation between nursing activityand the LOS of patients.
Results: The heterogeneity of the nursing activity is high within DRGs. Coefficients ofvariation vary between 0,47 and 1,40 according to DRG. Interquartile ranges vary from71 to 455 minutes according to DRG. The correlation between nurse activity and LOS
is good (r=0,69, p<0,001). The intensity of the correlation is, however, variable fromone DRG to another, varying from 0,05 (P>0,05) to 0,65 (p<0,001). The percentageof LOS outliers is more important than the percentage of nursing activity outliers(5,6 against 5,2%). Only 31,10% of high nursing act ivity outliers are also high LOSoutliers. Only 32, 48% of high LOS outliers are also high nursing activity outliers.
ii. McKibben RC, Brimmer PF, Galiher JM, Hartley SS, Clinton J. Nursing costs and DRG payments. American Journal of Nurs ing. 1985; 85(12): 1353-1356.
iii. Mowry MN, Korpman RA.. Do DRG reimbursement rates reflect nursing costs? Journal of Nursing Administration. 1985; 15(7,8): 29-35.
iv. Sovie M, Tarcinale M, Vanputte A, Stunden A.. Amalgam of nursing acuity, DRG's and costs. NursingManagement. 1985; 16(3): 22-42.
v. Wolf GA, Lesic LK.. Determining the cost of nursing care within DRGs. In: Shaffer FA. Eds.Patients &purse strings: patient classification and cost management. New York: National League for Nursing;1986. 165-180.
vi. Sermeus W., Gillet P., Tambeur W., Gillain D., Grietens J., Laport N, et al. Financement des soinsinfirmiers hospitaliers. Health Services Research (HSR). Bruxelles: Centre fédéral d'expertise dessoins de santé (KCE); 2007. KCE reports 53B (D/2006/10.273/07).
vii. Schouppe, L., Defloor, T., Gobert, M., Van Goubergen, D. Workload Indicator for Nursing. RapportSFP-FOD. Brussel: Federaal Overheidsdienst Wetenschapsbeleid ten behoove van de FederaleOverheidsdienst Volksgezondheid, Leefmilieu en Veiligheid van de voedselketen, 2007.
viii. Myny, D., Defloor, T., Alvarez-Irusta, L., Annys, D., Demeyere, F., DeVreese, I., Proenca, V.,Vandermolen, M., Vanderwee, K., Van Hecke, A., Gobert, M. Rapport final . Welame, FODWetenschapsbeleid, Gent, p. 282.

8/13/2019 2011 Montreal Conference Abstract Book
http://slidepdf.com/reader/full/2011-montreal-conference-abstract-book 87/1667
Each patient counts
2 7 t h P C S I C o n f e r e n c e | O c t o b e r 1 9 t o 2 2 , 2 0 1 1 | M o n t r é a l , Q u e b e c , C a n a d a
Conclusions: As was foreseeable, nursing activity was proven to be heterogeneouswithin DRGs. This is the reason why nurses often reject all-in financing systems.Nevertheless, the variability of LOS inside DRGs seems quite as important, and LOSby DRG is, however, the basis of the funding system in Belgium (justi fied days). Usingsuch an argument to reject all-in systems is not very scientific. The weight of thenursing minimum dataset is marginal inside hospital budgets.
The complete study upon which this abstract is based will thoroughly analyze thevariability of activity, hospital by hospital, in order to neutralize the coding effect. As well, an analysis of outliers’ prof iles will be carried out.
Authors: Pirson M, Delo C, Di Pierdomenico L, Biloque V, Martins D, Eryuruk U,Leclercq P
AUTHORS/INSTITUTIONS: M. Pirson ([email protected]);C. Delo([email protected]); L. Di Pierdomenico ([email protected]); D. Martins([email protected]);P. Leclercq ([email protected]), Health Economics,
Universite Libre de Bruxelles, Brussels, BELGIUM;
Session 4A—Economic Incentives and Case Mix II
1164589
Case Mix-Based Economic Incentives That Work
Introduction: Since 2001, the Danish healthcare system has been characterized bya focus on the reduction of waiting lists. By introducing activity-based funding of theregions and hospitals, there has been an increase in activity, a reasonably positivedevelopment in productivity, a high degree of patient and citizen satisfaction, and a
successful reduction of waiting lists. One of the reasons for this success is that it waspossible to use Casemix-based economic incentives actively.
Methods: Over the last few years, this development has been supplemented bya wish to prevent and avoid unnecessary admission to hospitals by including themunicipalities as active participants in the healthcare sector. This has been done byusing a regulation that makes the municipalities co-financing partners of the regionsand hospitals. Since 2012, they have had to pay almost 20% of the regional budgetas activity-based financing. Every time a citizen uses the hospital, or a GP, etc., themunicipality has to pay.
Over the same period, there has been discussion about whether it is possible to find
incentives that will lead to the proper treatment of a patient. This can be seen as aresponse to quality problems that persist in clinical practice.

8/13/2019 2011 Montreal Conference Abstract Book
http://slidepdf.com/reader/full/2011-montreal-conference-abstract-book 88/16672
= ( WX ′ – – WY
β = ( WX ′ ) – XWY
= β + ε
= + ε
= + εQ75+ .5 x (Q.
5- Q
25
Q75 1.5 (Q
75 -
25)
2 7 t h P C S I C o n f e r e n c e | O c t o b e r 1 9 t o 2 2 , 2 0 1 1 | M o n t r é a l , Q u e b e c , C a n a d a
Each patient counts
F R I D A Y
To support this development, there will be some experimentation with Pay-for-Performance (P4P) schemes that tie a portion of provider payments to performancebased on measures of quality. Several key issues will be considered in determiningthe optimal design and implementation methods for P4P programs. These include:
Choice of clinical practice area1.Size of financial incentives and who should receive them2.Selection of quality measures and performance thresholds that determine3.incentive eligibilityData collection methods4.Best mix of financial and non-financial incentives5.
Results: In order to move it onto a politically acceptable path, the financing modelin the healthcare sector will be changed accordingly, . Economic incentives will beused whenever possible. The introduction of these incentives will be done as partof an evolution of the healthcare system, not as a revolution of the system.
Conclusions: The Ministry of Interior and Health finds that the use of economic
incentives can support the movement of the healthcare sector in a politicallyspecified direction.
AUTHORS/INSTITUTIONS: M. Hansen ([email protected])P.E. Hansen ([email protected])Ministry of Interior and Health, Denmark, Copenhagen K, DENMARK
1151391
Pay-for-Performance Quality Incentive Program – One-YearPilot Program
Introduction: The Hospital Authority (HA) is a statutory body that was established
under the Hospital Authority Ordinance. It has managed public hospitals in HongKong since 1991. Hospitals in Hong Kong are divided into seven geographicallybased clusters. HA has designed a “Pay-for-Performance (P4P) model” whichincludes incentives to promote productivity and quality. In the second year of thismodel’s implementation, financial incentives have been introduced to strengthenits focus on quality indicators.
Methods: A set of 11 Quality Performance Indicators (QPI) was selected anddeveloped from a framework of existing Key Performance Indicators (KPI) thatwere agreed upon by the HA Board of Hospitals and their senior executives.There are two systems of performance measurement:
Cluster hospitals whose achievement is close to target.1.
Cluster hospitals that show improvement over their prior year’s performance level.2.
Performance targets to be achieved by clusters were set for each QPI. Withdual measurement, an innovative method for measuring and rewarding qualityperformance was developed.

8/13/2019 2011 Montreal Conference Abstract Book
http://slidepdf.com/reader/full/2011-montreal-conference-abstract-book 89/1667
Each patient counts
2 7 t h P C S I C o n f e r e n c e | O c t o b e r 1 9 t o 2 2 , 2 0 1 1 | M o n t r é a l , Q u e b e c , C a n a d a
Results: There were improvements in all except two indicators in the program, andall clusters showed improvement in three indicators. The HA overall result achievedpreset targets in five indicators. The reward received by individual clusters from thisprogram ranged from 63% to 88% of their total maximum potential quality reward.
Conclusions: This paper gives an overview of HA’s P4P Quality Incentive Program.The results af ter a one-year pilot were mixed; however, there was more improvementthan deterioration in performance measurement in the entire QPI. The programhas been successful in fostering a culture among clusters to continuously strive forquality, and HA will continue to assess the impact of the program. The program willthen be refined and broadened as more data and feedback are gathered.
AUTHORS/INSTITUTIONS: Y.S. Choi ([email protected]); K.H. Lee ([email protected]); S. Gillett, ([email protected]);G. Lam ([email protected])Hospital Authority, Hong Kong, HONG KONG
1143854Paying for Quality
Introduction: In the US, Medicare is introducing Value Based Purchasing wherebya portion of a hospital's reimbursement will be linked to quality, in the form of QualityIndicators (70%) and Patient Satisfact ion (30%).In Australia, the Council of Australian Governments (COAG) Heads of Agreement:National Health Reform (February 2011) have agreed in principle to the followingQuality related reforms, namely:
An expert panel is to be established to advise COAG on the effective•implementation of the national standards and the right balance between rewardand facilitation payments.
The Australian Commission on Safety and Quality in Health Care will develop•national standards for clinical safety and quality improvement.The National Performance Authority (NPA), which is to be established from1 July 2011, will monitor performance of Medicare Locals and Local Health andHospital Networks, and produce public reports on the performance of hospitalsand health care services that are uploaded to the MyHospitals website.
Methods: Value based purchasing in the US is designed to be budget neutral.Medicare will “withhold” 1% of a hospital's payment in 2013. Hospitals will get greaterthan 100% of their “withhold” back at the end of the year if their combination ofQuality Indicators and Patient Satisfaction falls in the top 25% of hospitals in the USA.
For those hospitals that fall below the top quartile, they will receive the appropriatepercent back based on their percentile position for the year. Therefore some hospitalswill stand to loose significant amounts of their “withhold”.

8/13/2019 2011 Montreal Conference Abstract Book
http://slidepdf.com/reader/full/2011-montreal-conference-abstract-book 90/16674
= ( WX ′ – – WY
β = ( WX ′ ) – XWY
= β + ε
= + ε
= + εQ75+ .5 x (Q.
5- Q
25
Q75 1.5 (Q
75 -
25)
2 7 t h P C S I C o n f e r e n c e | O c t o b e r 1 9 t o 2 2 , 2 0 1 1 | M o n t r é a l , Q u e b e c , C a n a d a
Each patient counts
F R I D A Y
Whilst the US appears to have their Quality payment framework in place, Australiahas yet to provide any clear definitions around the model. It appears clear thatthe creation of the NPA should result in the introduction of rigorous performanceindicators at a national level, which will drive both health system quality andperformance in Australia, however at this time there is very little information regardingthe areas for performance measurement and whether Australian public hospitals willbe rewarded, through the efficient price, for quality.
What is clear is that the ‘efficient price’ will be derived from the current costingsystems used in Australia. Given the well known issues around the lack of qualityand consistency across Australian hospital's costing information, it seems clear thatrewarding hospitals for the production of robust costing information should also fallunder the NPA's purview.
Results: Whilst it is difficult at this time to ascertain what hospitals will need to putin place in order to manage quality, it is clear that a focus on quality will bring positiveresults, both for the patient and the organisation as a whole. At Community Hospital
Anderson in the US, where Dr VanNess is CEO, their focus on quality has facilitatedan average cost per adjusted discharge of US$1,800 less than their peers.
For Australia, hindsight is a wonderful thing. The past fifteen years has provided Australian hospitals and Health Departments with several valuable lessons regarding theimplementation of Casemix and patient costing system. Some of these lessons include:
Focus on the purpose, not only the model.1.Clinical Engagement2.Limited pool of costing resources.3.Critical mass.4.Career path.5.Mix of staff.6.
Five year plan.7.Frequency of costing.8.Local ownership.9.
Conclusions: As a physician, who also happens to be a hospital CEO, Dr VanNesshas always felt that the focus should always be on quality and patient satisfactionwhile maintaining cost effectiveness. 'We don’t know exactly where healthcare reformwill take us but I do believe that if an organization is to be successful they must havestrong performance on established quality and patient indicators accompanied bylow costs. To accomplish these goals, accurate “real time” information to make well-informed decisions will be critical!'
Like the US, Australia needs to link the efficient price in some way with quality. Simplyreporting on clinical quality indicators is not enough.
8/13/2019 2011 Montreal Conference Abstract Book
http://slidepdf.com/reader/full/2011-montreal-conference-abstract-book 91/1667
Each patient counts
2 7 t h P C S I C o n f e r e n c e | O c t o b e r 1 9 t o 2 2 , 2 0 1 1 | M o n t r é a l , Q u e b e c , C a n a d a
Therefore, under ABF, Australian hospitals should also be rewarded for submittingquality data. If the past 15 years under casemix funding has taught us anything,it’s that a national approach with a focus on standardising the use of the informationnationally to better manage hospitals, rather than on the development of the fundingmodel itself; alongside the concept of "central processing/local ownership" and a ten-year plan for ongoing improvements and refinements in the costing process, is what'srequired if ABF is to deliver the anticipated gains for which it is being put in place.
AUTHORS/INSTITUTIONS: P. Power ([email protected])PHS, Adelaide, South Australia, AUSTRALIA;W.C. VanNess ([email protected])Community Hospital Anderson, Anderson, IN;
1152904
The Use of Casemix Data for Identifying Variations in Hospital Care
for Elderly Having COPDIntroduction: The introduction of DRG system starting with 2003, and its extensionnationwide for Romanian hospitals, made possible to perform various analysisconcerning hospital activity based on the data reported. In the context of internationalconcerns for evaluation of hospital performance and practice variation, even inRomania decision makers should be aware about geographic variations in hospitalcare, resource consumption and should try to evaluate and solve unjustifieddifferences. Since the population all over the world, and in Romania as well, isageing, the study is providing a detailed analysis about the hospital care for agedpeople having COPD.
Methods: The authors have done literature review about the prevalence and burdenof COPD, especially for old patients. Then, a descriptive analysis was performed forthe year 2008. All cases reported from all acute care hospitals in Romania, having 60years and more, with COPD (principal diagnosis ICD 10AM in J40-J47), were includedin the study (only valid cases). Gross rates of cases was standardized af ter sex . Theassociation between the number of cases and the standard of living was tested withPearson correlation test. T test was used to test differences between the ALOS ofcases with COPD versus all cases discharged by hospitals. The multivariate analysis(ANOVA) was used to test if the type of the hospital (city, district, institute, singlespecialty, private) influence volume of cases. The estimation of the amount of moneyreimbursed by the insurance fund and the evaluation of territorial differences wasperformed using the weighted cases from every district and the mean tariff per case
at national level.
8/13/2019 2011 Montreal Conference Abstract Book
http://slidepdf.com/reader/full/2011-montreal-conference-abstract-book 92/16676
= ( WX ′ – – WY
β = ( WX ′ ) – XWY
= β + ε
= + ε
= + εQ75+ .5 x (Q.
5- Q
25
Q75 1.5 (Q
75 -
25)
2 7 t h P C S I C o n f e r e n c e | O c t o b e r 1 9 t o 2 2 , 2 0 1 1 | M o n t r é a l , Q u e b e c , C a n a d a
Each patient counts
F R I D A Y
Results: There are differences between districts (after the district of hospital)concerning the volume of cases and the average length of stay. Districts from theNorth East of the country have more cases and districts in the Center of the countryand Bucharest have less cases, reported on the total number of cases dischargedfrom hospitals. The length of stay also varies, between 7,21 and 11,6, while the ALOSat national level is 9,02+-0,91 days.The ALOS for cases having COPD is significantdifferent from ALOS for all elderly cases discharged from hospital.
No significant correlation was found between the standard of living and the volumeof cases. There are significant differences in number of cases, after the type of thehospital, the most of the cases are discharged by city hospitals.
The amount of money that should be reimbursed by the insurance fund if all thesecases would be reimbursed through DRG system was about 16.211.657 euro, mostof them in Bucharest, Prahova and Cluj,
Conclusions: Case mix data used for the analysis of clinical activity of hospitals,
and together with economic and statistic data can provide valuable information todecision makers for resource allocation and the planning of health services.
AUTHORS/INSTITUTIONS: N.D. Chiriac ([email protected]); M. Ciutan ([email protected]);M. Dosius ([email protected]);C. Vladescu ([email protected])Center for Health Research and Evaluation, National School of Public Health,Management and Development in Health Bucharest, Romania, Bucharest, ROMANIA;
SESSION 4B—Long-Term Care and Case Mix
1153080
Aging, Disability and Long-Term CareIntroduction: The probability of entering a nursing home is not the same for everyone. Age, being a woman, and living alone are all risk factors. These risk factors are alsointerrelated: women have a higher probability of entering a nursing home, largelybecause they live longer and are more likely to live alone during their last years.
Disability also increases the risk of entering a nursing home. The more assistancea person needs, the greater the risk of being institutionalized. Certain types ofdisabilities have also been associated with increased risk of nursing home admission.For example, people who are cognitively impaired have a greater probability of enteringa nursing home because cognitive disorders usually require constant supervision.
The existence of informal caregivers reduces the risk of nursing home use. Manystudies have closely examined the role of informal caregivers in reducing the probabilityof nursing home admission. These studies also show that the attitude families havetowards nursing homes influences the institutionalization of a family member.

8/13/2019 2011 Montreal Conference Abstract Book
http://slidepdf.com/reader/full/2011-montreal-conference-abstract-book 93/1667
Each patient counts
2 7 t h P C S I C o n f e r e n c e | O c t o b e r 1 9 t o 2 2 , 2 0 1 1 | M o n t r é a l , Q u e b e c , C a n a d a
Most users of nursing-home care have multiple and severe impairments, and theyare dependent for care in more than three activities of daily living. In relation to generalhealth, the institutionalized elderly have a multiple variety of diagnoses. The morecommon are diseases of the circulatory system, along with the mental disordersassociated with that problem. Those with dementia normally have behavioral problems.
Many recent studies have estimated that nursing home utilization rates may bedeclining, and that the decline will continue to occur even though the number of veryold is increasing. However, it is difficult to find a simple reason to explain trends ininstitutionalization. Declining utilization rates can be better explained by a reductionof supply, rather than by a decrease in the of prevalence of severe disabili ty.
Financing of nursing home care – and who pays for it– is a particularly salient issuewith regard to public expenses. Admission control, and payment for complexity,thus become priorities for those who manage this type of long-term care. The groupincludes family members, providers, and care-payers. In Portugal, the payment forlong-term care is a co-payment divided between the elderly, or their family members,
and the state.
Method: This paper describes the profile of Portuguese elderly admitted to nursinghomes that belong to the non-profit sector.
The main objective of the research was to describe the elderly in terms of theirgeneral health conditions and motor and cognitive impairment, and to determine thelevels of disability (clinical complexity) that were associated with the different levelsof utilization of resources. Recognizing the diversity of the elderly with functionalimpairments is essential in order to develop policies that are responsive to the rangeof needs that exist among the elderly.
To establish the disability profile, approximately 200 elderly, residing in variousnursing homes, were evaluated. Areas considered were general health, frailty,risk and consequences of falls, swallowing disorders, communication profile,performance of the activities of daily living, cognitive ability levels and depression.The instruments used were a general questionnaire, the Lawton scale, Katz Index,Barthel Index, Mini-Mental State Examination, Geriatric Depression Scale, Verbal Association Test, Braden Scale, and a Swallowing Assessment. In addition, therewas also a frailty indicator.
In order to identify the resources that were utilized for the different levels of care,a questionnaire was given to the managers of the institutions.
Results and Conclusions: Based on the different instruments used, and the functional
impairments found, different levels of complexity were discovered among nursinghome residents. However, the payment of care remains almost the same among theseresidents, except for small differences that do not reflect levels of assistance.

8/13/2019 2011 Montreal Conference Abstract Book
http://slidepdf.com/reader/full/2011-montreal-conference-abstract-book 94/16678
= ( WX ′ – – WY
β = ( WX ′ ) – XWY
= β + ε
= + ε
= + εQ75+ .5 x (Q.
5- Q
25
Q75 1.5 (Q
75 -
25)
2 7 t h P C S I C o n f e r e n c e | O c t o b e r 1 9 t o 2 2 , 2 0 1 1 | M o n t r é a l , Q u e b e c , C a n a d a
Each patient counts
F R I D A Y
The range of disability within the institutionalized elderly is extremely wide. Serviceprograms and financing mechanisms must reflect the vast range of service needswhich the disabled elderly require. For policy purposes, it is generally useful to thinkof the disabled elderly in three large groups:
Elderly with mild impairments who do not require the active help of others.•Elderly with moderate impairments who do not need 24-hour assistance.•Elderly with severe limitations who require 24-hour intensive levels of care.•
The most important conclusion the study reached is that the institutionalizedelderly, since they have different levels of dependency, need flexible responses. Thepolicies adopted, the planning of services, and their provision must be related to theassistance the institutionalized elderly need. The frequency and intensity of care isdiverse, and these factors have a different impact on public and family spending thatmust be considered along with a systematic assessment of the dependency levels ofthe elderly.
AUTHORS/INSTITUTIONS:
Nogueira, D (PhD) ([email protected])ISCTE-IUL UNIDE-IUL, Lisboa Portugal;ESSA Escola Superior de Saúde de Alcoitão, Estoril, PortugalReis, E (PhD) ([email protected]) ISCTE-IUL UNIDE-IUL, Lisboa Portugal Atalaia, H (MSc) ([email protected])ESSA Escola Superior de Saúde de Alcoitão, Estoril, PortugalRaposo, P. (MSc) ([email protected]) Pulido Valente Hospital, Lisboa PortugalSerrasqueiro, R(MSc) : ISCTE-IUL
1165539
Transitioning to a New Case Mix Grouper to Fund Long-Term Care
Homes in Ontario, Canada.Introduction: Health system accountability and the capacity to care for the elderlywith increasingly complex care needs is a challenge across many jurisdictions.The move to increasing accountability has necessitated greater and improvedmeasurement of healthcare processes and outcomes. In 2005, the response bythe Ontario Ministry of Health and Long-Term Care was to implement the Resident Assessment Instrument (RAI)-Minimum Data Set (MDS) 2.0. One purpose for theintroduction of the assessment tool was to facilitate the transition to a new Casemixgrouper with associated weights.
In long-term care in Ontario, homes are funded based on an envelope system.The majority of expenses related to resident care are provided for in the Nursingand Personal Care (NPC) envelope, which is 100% adjusted for resident acuity.The NPC envelope represents approximately 60% of envelope funding in the sector.Since 1993, this adjustment was based on the Alberta Resident Classification System(ARCS). Assessors from the Ministry measured ARCS once a year and, from thesedata, residents were classified into one of seven Casemix groups to formulate theprovince’s Casemix measurement. Long-term care (LTC) homes are funded basedon their specific Casemix measure relative to the provincial Casemix measure.

8/13/2019 2011 Montreal Conference Abstract Book
http://slidepdf.com/reader/full/2011-montreal-conference-abstract-book 95/1667
Each patient counts
2 7 t h P C S I C o n f e r e n c e | O c t o b e r 1 9 t o 2 2 , 2 0 1 1 | M o n t r é a l , Q u e b e c , C a n a d a
Over time the validity of ARCS, and the ability to fairly and equitably distributefunding based on it, came into question. The introduction of the RAI-MDS 2.0, andthe Casemix grouping algorithms associated with it, provided alternatives in orderto improve the allocation of funding based on Casemix .
In collaboration with sector representatives, the Ministry determined that theResource Utilization Groups (RUGs) 34-group model was best suited to Casemix-adjusted activity in long-term care. A transition model was developed andimplemented in order to ensure system stability.
Methods: The transition plan was developed in collaboration with the long-termcare home sector. An advisory group, supported by a technical group, oversaw thedevelopment of options for the transition. The plan was based on the following principles:
Simplicity: The plan was to be as simple as possible in terms of the number and•complexity of components. The fewer the components, and the less complex theywere, the easier the plan would be to understand, communicate and implement.Stability: The plan was to mitigate any instability that would be introduced into•
the system by switching to RUG III (e.g., corridors).Transparency: The plan was to be transparent in that all components of the model•were to be known and communicated to all stakeholders.Sufficient Notice: In advance of implementation of the transition plan, sufficient•notice was to be provided to LTC homes and other stakeholders regardingimplementation dates and impact of the plan on homes.Revenue Neutral to the Province: Casemix transition was not to increase costs•to the NPC envelope.
Results: Due to the phased implementation of the MDS 2.0 assessment, the plan wasimplemented in two waves. In total, 217 homes were transitioned beginning April 2010(Phase 1 – V homes). The remaining homes (400+) will transition starting April 2012.
The transition will last for three years for each wave. Therefore, the first group ofhomes will be through transition as of April 2013. During transition, a 5% corridoris being applied to the Casemix Index (CMI) so that the difference in CMI from yearto year cannot be greater than, or less than, 5%. As a result of applying the corridorto the first group of homes, there were no homes whose funding decreased by morethan 1% in the first year of transition.
Homes that began their transition in 2010 are now in their second year. The maximumdecrease in funding after applying the corridor was greater than in the first year,although this was mitigated by an incremental funding allocation.
Conclusions: To date, the plan has been successful in transitioning the long-term care sector to a new Casemix grouping methodology. Successful strategiesemployed included involving sector representatives in developing the plan;communicating widely; providing detailed face-to-face education on the plan,its components and impact; and keeping the plan simple.

8/13/2019 2011 Montreal Conference Abstract Book
http://slidepdf.com/reader/full/2011-montreal-conference-abstract-book 96/16680
= ( WX ′ – – WY
β = ( WX ′ ) – XWY
= β + ε
= + ε
= + εQ75+ .5 x (Q.
5- Q
25
Q75 1.5 (Q
75 -
25)
2 7 t h P C S I C o n f e r e n c e | O c t o b e r 1 9 t o 2 2 , 2 0 1 1 | M o n t r é a l , Q u e b e c , C a n a d a
Each patient counts
F R I D A Y
This presentation will discuss the details of the development of the plan, as well asthe year-two and -three estimates of funding changes as a result of the applicationof the corridor. Ongoing and emerging challenges will be described.
AUTHORS/INSTITUTIONS: S. Tsui ([email protected]); J. Walker
([email protected]);P. Temple ([email protected]);K. Yu ([email protected]);C. Hoy ([email protected]);M. Alshurafa ([email protected])Health Data Branch, Ministry of Health and Long-Term Care, Toronto, Ontario, CANADAJ. Walker, Dalla Lana School of Public Health, University of Toronto, Toronto,Ontario, CANADA
1152462
Using the Adjusted Clinical Groups, ACGs, to Describe Newly Admitted Nursing Home Residents in Stockholm, Sweden
Introduction: The Adjusted Clinical Groups case-mix system, ACGs, were developedby researchers at Johns Hopkins to predict future use of health care. This systemgroups patients on their present and former diagnoses within a certain time frame,e.g. one year. The focus, at least in Sweden, has been to validate its use in paymentmodels in primary care. However, the ACG system is able to visualize a lot of clinicalinformation, particularly in the newest version 9. Therefore, we wanted to test if theStockholm county patient registry data might be used to describe the outcome ofnursing home residents by the ACG programme.
Methods: Within the Stockholm County, there are about 400 nursing homes (NH)with a total number of beds of 15,000. For all 5242 newly admitted residents in theyear 2009 all diagnoses (49,000 in-patient diagnoses, 22,900 out-patient diagnosesand 30,800 diagnoses from primary care) were collected 365 days prior to the NHplacement date. For patients that had died (up to May 2011), that date was linked tothe data set. This material was then used in the ACG software available and several ofthe outcome measures were used in Lifetest analyses, using SAS statistical software.
Results: Of all patients, admitted to NH in Stockholm during 2009, 1803 were men(mean age 83.0) and 3439 were women (mean age 86.4). 2278 of the patients diedin NH after an average of 275 days (median 226). Several of the indicators in ACGshowed a significantly higher mortality (e.g. Resource Utilization Band (RUB), numberof Major ADGs, hospital-dominant diagnoses, number of chronic conditions, andseveral of the most complex ACG groups) but also some diagnosis groups, e.g.,Congestive heart failure, COPD, Renal insufficiency, and Ischemic heart disease.Other indicators did not significantly differentiate the patients regarding mortality,e.g. the Frailty flag, Asthma, Arthritis, Depression, or Hypertension. The results forDiabetes as a whole gave an unclear picture.
8/13/2019 2011 Montreal Conference Abstract Book
http://slidepdf.com/reader/full/2011-montreal-conference-abstract-book 97/1668
Each patient counts
2 7 t h P C S I C o n f e r e n c e | O c t o b e r 1 9 t o 2 2 , 2 0 1 1 | M o n t r é a l , Q u e b e c , C a n a d a
Conclusions: ACG as a system for predicting future health care resources was testedon mortality in nursing home residents for the first time. Several of the ACG indicatorsand diagnoses were clearly predicting a shorter length of stay in the nursing home,while others were not. However, at least for this frail group of older persons, othercircumstances should also be taken into account. Among these are the physicalfunctional capacity (ADLs), the cognitive function, pain, and signs of delirium. Theseare easily caught through a comprehensive geriatric assessment, a technology thatcould be used more of ten than today.
AUTHORS/INSTITUTIONS: G. Ljunggren ([email protected]) Deptartmentof Health Care Development, Stockholm County Council, Stockholm, SWEDEN;G. Ljunggren ([email protected]) , Medical Management Centre, KarolinskaInstitutet, Stockholm, SWEDEN;L. Carlsson ([email protected]) Center for Family and Community Medicine(CeFAM), Karolinska Insti tutet, Stockholm, SWEDEN;
1152754
Implementation of Activity Based Funding for Long-Term Carein Alberta
Introduction: On its creation, Alberta Health Services inherited a number of differentpayment systems for long term care facilities across the province from the previousnine regional health authorities. As part of the merger process, Alberta HealthServices moved to introduce a single method of payment for the province. Thechosen method was activity based funding using the InterRAI 2.0 RUG III system.This paper describes the issues involved in implementation.
Methods: Data were collected from all 180 long term care facilities in the province.
Results: Considerable differences were found in the average cost per raw andacuity-weighted resident day across the province. Characteristics of high and lowcost facilities were explored (e.g. ownership, size). Some long term care facilities werealso providing specialty care (inconsistently captured in RAI system). The differentcosts of these were identified and ways of handling this will be discussed. AlbertaHealth Services is aiming to change the case mix of long term care facilities as more'supported living' facilities are opened. This issue will also be discussed. Phase-inarrangements will also be highlighted.
Conclusions: Activity based funding for long term care in Alberta is being introducedover a six year period. Issues involved in the implementation involve complex
tradeoffs which are discussed

8/13/2019 2011 Montreal Conference Abstract Book
http://slidepdf.com/reader/full/2011-montreal-conference-abstract-book 98/16682
= ( WX ′ – – WY
β = ( WX ′ ) – XWY
= β + ε
= + ε
= + εQ75+ .5 x (Q.
5- Q
25
Q75 1.5 (Q
75 -
25)
2 7 t h P C S I C o n f e r e n c e | O c t o b e r 1 9 t o 2 2 , 2 0 1 1 | M o n t r é a l , Q u e b e c , C a n a d a
Each patient counts
F R I D A Y
AUTHORS/INSTITUTIONS: S. Duckett ([email protected])School of Public Health,
University of Alberta, Edmonton, Alberta, CANADA;
L. Sarnecki (liesje.sarnecki@albe rtahealthservices.ca)A. Kempton (annalise.kempton@
albe rtahealthservices.ca);G. Kramer (gordon.kramer@albert ahealthservices.ca)Activity
Based Funding Branch, Alberta Health Services, Edmonton, Alberta, CANADA;
SESSION 4C—Case Mix and Data Quality
1120544
Auditing in the Irish Casemix Budget Models
Introduction: Casemix in Ireland is run on a retrospective basis. Budget adjustmentsare made that relate to costs and activity for the calendar year two years previously.This is presently changing to a prospective funding model which will be informed bya Patient Level Costing project currently in progress.
The Irish Casemix budget models are subject to a rigorous audit process. A uniqueaspect of Casemix in Ireland is that it is budget neutral. The effect of this is that theperformance of one hospital affects all of its peer hospitals. To ensure confidencein the process, there is a detailed audit done on the costs and activity of eachhospital. Cost audits have been part of the annual Casemix process since Casemixwas introduced in Ireland in 1991. In recent years, the National Casemix Programme(NCP) has put an increased focus on activity auditing.
The staff in the NCP have direct access to and regular communication with costingand coding staff in each hospital. This access is essential in enabling a thoroughaudit process.
Methods
Costing
The NCP has a number of large, standardised Excel files – designed in house– in which each hospital must return its costs broken down by specialty. Thecompletion of these files must be in accordance with the Costing Manual, whichis updated annually. A detailed review of each file is conducted against the previousyear. This results in a list of queries being sent to the costing staff in each hospital,with a particular focus on costs being allocated to areas outside Casemix, orwhere exposure to Casemix is low. This is repeated until the process is concluded.During this process, comparisons between hospitals are conducted to ensurea consistent approach is being applied.
Activity
Activity is returned by each individual hospital in a monthly download. A monthly setof audit files is compiled by NCP statisticians to show hospital, MDC, and DRG datafrom a wide range of perspectives. These files allow top-down systematic and ad hocinterrogations of the data to be made. From the files, detailed annual queries to whichhospitals must respond are drawn up on DRGs where:

8/13/2019 2011 Montreal Conference Abstract Book
http://slidepdf.com/reader/full/2011-montreal-conference-abstract-book 99/1668
Each patient counts
2 7 t h P C S I C o n f e r e n c e | O c t o b e r 1 9 t o 2 2 , 2 0 1 1 | M o n t r é a l , Q u e b e c , C a n a d a
There is a significant increase/decrease in DRG activity and value.1.There is a significant increase/decrease in activity and value across an2. Australian
Refined Diagnosis Related Group system ( AR-DRG).There is a trend towards more/less complexity within an AR-DRG.3.
There should be a direct relationship between changes in activity and changesin cost. Unexplained increases in activity, and monetary value related to theseincreases, can be targeted for on-site auditing and, if necessary, amended orexcluded. The NCP employs a ‘Dampening’ principle which allows for the removalof unexplained increases in activity; as well, there is the addition of activity wheresignificant decreases threaten a hospital’s funding base.
Results
Detailed cost-review queries are sent annually to nominated staff at each hospital.1.Responses and further queries are exchanged until this process is finalised.On-site costing audits are carried out if issues remain.2.
The suite of audit files allows a top-down audit of hospital activity and direct3. attention toward areas requiring further analysis.The activity audit files sent to hospitals focus on possible cases of DRG creep.4.These files bring attention to activity increases or decreases which will have apositive or negative impact on Casemix performance.The costing file allows analysis of cost per case to ensure that it is consistent and5.reasonable in all hospitals. This improves the quality of costs in the budget models.The ‘Dampening’ rule ensures that unexplained increases or decreases in activity are6.removed. This results in relative consistency of funding for hospitals year on year.
Conclusions
A credible Casemix model requires a high degree of visible audit.1.
The standardised file structure supported by a detailed Costing Manual allows2. confidence in how costs are reported to the NCP.The cost audit process ensures that reliable costs are entered in the budget models.3.The activity audit process focuses attention on areas of activity which will have4.a positive or negative impact on Casemix performance.Further resources are required to expand the audit work carried out, particularly with5.the results from the Patient Level Costing project and the shif t to Prospective Funding.
My presentation will display the approach taken by the Irish NCP to ensure theintegrity of the budget models.
AUTHORS/INSTITUTIONS: M.D. O'Connor ([email protected]);
E. Burke ([email protected]); E. Gallagher ([email protected]);
F. Bane ([email protected]); J. Johnson ( [email protected]) Health ServiceExecutive, Naas, IRELAND
8/13/2019 2011 Montreal Conference Abstract Book
http://slidepdf.com/reader/full/2011-montreal-conference-abstract-book 100/16684
= ( WX ′ – – WY
β = ( WX ′ ) – XWY
= β + ε
= + ε
= + εQ75+ .5 x (Q.
5- Q
25
Q75 1.5 (Q
75 -
25)
2 7 t h P C S I C o n f e r e n c e | O c t o b e r 1 9 t o 2 2 , 2 0 1 1 | M o n t r é a l , Q u e b e c , C a n a d a
Each patient counts
F R I D A Y
1152236
Coded Data Quality for Case Mix Payment: Insights from TwoExternal Audits
Introduction: Australia is currently undergoing a change in the Casemix paymentenvironment. This is the result of an agreement to move to a more nationally-consistent approach to activity-based funding (ABF) for services provided in publichospitals. ABF for acute inpatients will be based on the Australian Refined DRGCasemix system, which is derived from the coded clinical data from each hospitaladmission. Thus, there will be a need to audit the clinical coding to assess the qualityof the data in order to determine if the payments based on that coding are correct.
In 2009 and 2010, Pavilion Health conducted two major audits of clinical codingin NSW and Queensland. Together, these audits included 55 hospitals and 6,300records. This paper discusses the insights gained from these two audits.
Discussion: Errors in the coded data are not random. Some clinical conditionsare more difficult to code than others, and some Major Diagnostic Categories (bodysystems) have more errors than others. Also, errors within hospitals are not randomeither. For example, one hospital had a relatively low predicted DRG mismatch of5.6%, compared to 5.9% for the whole sample. However, it had a relatively largeimpact on case-weight change representing nearly A$8 million less in funding.One error in a high value DRG, repeated many times, was responsible.
The education and training of clinical coders varied. The resources needed by theclinical coding teams were not sufficient for the implementation of activity-basedfunding. In an ABF environment, additional tasks such as internal auditing, analysis,and consultation with clinicians require different and additional skill sets compared
with the skills required to code competently.Conclusions: In order for Clinical Coders to meet submission deadlines and provideappropriate coding, they rely on comprehensive and timely clinical documentation.Clinicians and specialties have a responsibility to learn about coding and providegood documentation. There is a case for responsibility by Clinical Governance toaudit clinical documentation for accuracy and completeness. Clinician engagement inand education on improving medical documentation is critical in order to improve thevariation in Clinical Coding precision.
External coding audits are expensive to conduct and should be aligned with internalaudits to gain the maximum educational value from the audits. Other tools suchas error checking, both at the time of coding and later using the entire data set of
the hospitals, also offer opportunities for improving coding accuracy beyond thatafforded by external audits.
AUTHORS/INSTITUTIONS: B. Reid ([email protected]);A. Coyote ([email protected]);P. O'Connor ([email protected]);D. Henry ([email protected]);C. Aisbett ([email protected]); , J. Berry ([email protected])Pavilion Health, Sydney, New South Wales, AUSTRALIAC. Aisbett, Laeta, Sydney, New South Wales, AUSTRALIA

8/13/2019 2011 Montreal Conference Abstract Book
http://slidepdf.com/reader/full/2011-montreal-conference-abstract-book 101/1668
Each patient counts
2 7 t h P C S I C o n f e r e n c e | O c t o b e r 1 9 t o 2 2 , 2 0 1 1 | M o n t r é a l , Q u e b e c , C a n a d a
(ID:1164847
Clinical Documentation Manual Audit
Introduction: Preliminary audit studies in HA (Hospital Authority) hospitals have shown
that diagnosis and procedure data reported in the electronic records were very accurate.However, appropriateness is as important as accuracy in clinical documentation.
With the introduction of internal resource allocation based on Casemix Pay forPerformance (P4P), the relevance of clinical documentation became apparent.During the first year under the new P4P, there was signif icant improvement in clinicaldocumentation, but large variations were observed between clusters in the extent towhich specific clinical conditions were reported.
In addition, clinicians were puzzled by the perverse incentives to report diagnosesand procedures entirely for financial reasons. As a consequence, HA introducedthe concept of grouping standards, that is, a series of agreed upon rules that woulddescribe when specific International Classification of Diseases codes carry significantresource implications.
Objective: During 2010-11, 22 grouping standards were developed throughconsultation with clusters and representatives of clinical specialties. In order tovalidate these standards, and to assess the accuracy and appropriateness of currentdocumentation practices, a second and major manual audit was conducted.
Methodology: This manual audit of approximately 10,000 patient records wasundertaken in January and March 2011. A stratified, randomized sample of recordswas extracted, with approximately 30 records applied against each of the majorhospitals. Each hospital’s records were audited using a predefined methodology bystaff from other clusters or Hospital Authority Head Office.
Results: This paper describes the manual audit and examines the implications of its
results for appropriate clinical documentation.
Conclusions: Auditing is an important tool in ascertaining the accuracy and
appropriateness of clinical documentation practices, as well as in validating existing
grouping standards.
AUTHORS/INSTITUTIONS: K. Fan ([email protected]); M. Wu ([email protected]);L. Lau ([email protected]); K. Lee ([email protected]) , Finance, The Hong KongHospital Authority, Hong Kong, HONG KONG;G. Steve ([email protected])Finance, Former employee of The Hong KongHospital Authority, Hong Kong, HONG KONG;
8/13/2019 2011 Montreal Conference Abstract Book
http://slidepdf.com/reader/full/2011-montreal-conference-abstract-book 102/16686
= ( WX ′ – – WY
β = ( WX ′ ) – XWY
= β + ε
= + ε
= + εQ75+ .5 x (Q.
5- Q
25
Q75 1.5 (Q
75 -
25)
2 7 t h P C S I C o n f e r e n c e | O c t o b e r 1 9 t o 2 2 , 2 0 1 1 | M o n t r é a l , Q u e b e c , C a n a d a
Each patient counts
F R I D A Y
1152835
Data Quality Considerations With Increasing Access andTimeliness of Irish Hospital Activity Data
Introduction: The Health Research and Information Division (HRID) at the Economicand Social Research Institute (ESRI) in Dublin, Ireland are in a unique position ofbeing responsible for the collection, collation, monitoring and distribution of thenational public hospital activity data through the Hospital InPatient Enquiry (HIPE)program. This gives the HRID the opportunity to monitor collection of hospital activitydata from collection of individual patient discharge data through to preparationand provision of national HIPE data sets. This is achieved through clinical codereducation, support and development of HIPE software and also through audit,data quality programs.
Methods: These HIPE data are being used more than ever before by an increasingnumber of parties. With value for money and Key Performance Indicators high
priorities for many, these data are recognised as a critical tool in Irish health servicestoday. These users are demanding faster turnaround of HIPE data putting pressureson hospitals and the ESRI to provide data faster while still maintaining the samehigh quality standards. Some fascinating insights have been provided by these datausers and researchers using HIPE. With HIPE data deadlines being shortened andturnaround time from patient discharge to data dissemination reducing new issuesand challenges arise both at hospital level and within the HRID to support the peopleand systems providing the data.
This paper will explore some the issues uncovered by the HRID and by HIPE datausers which have highlighted issues around:
Coder compliance to standards•
Data interpretation by researchers• Use of hospital feeder systems to automatically provide data to HIPE•Data set control•
Results: Lessons have been learned for the ESRI, particularly for the coder educatorsand the HRID IT team. Projects are now in place to implement stronger checks ondata entry, coordinate with hospitals on data quality issues as they arise and in a newinitiative to provide tailored education to data users on all aspects of the complexitiesof these datasets including use of the classification (currently ICD-10-AM/ACHI/ACS) andinterpretation of these data. Another major issue now facing HIPE is the interfacing,in a meaningful and useful way, with electronic health records to ensure qualityof data is maintained and a balance is attained between automation and human
interaction on the reporting on the individual patient record. Finally a challenge thatneeds to be addressed is how best to address data quality issues both at hospitaland more particularly at national dataset level.

8/13/2019 2011 Montreal Conference Abstract Book
http://slidepdf.com/reader/full/2011-montreal-conference-abstract-book 103/1668
Each patient counts
2 7 t h P C S I C o n f e r e n c e | O c t o b e r 1 9 t o 2 2 , 2 0 1 1 | M o n t r é a l , Q u e b e c , C a n a d a
Conclusions: With resources limited and demands increasing the challenge facingHIPE now is to maintain truly timely and accurate hospital activity data to inform,monitor and manage hospital services in Ireland. This paper will present some ofthe challenges and solutions to the issue of maintain data quality while meetingincreasing demands for data in a changing environment.
AUTHORS/INSTITUTIONS: D. Murphy ([email protected]);J. Curley([email protected])HRID, ESRI, Dublin , IRELAND;
SESSION 4D—Cost Data and Cost Weights
1151887
A Comparison: Estimated Average Inpatient Costs Using CIHI’sCase Mix tools vs. Inpatient Costs from the Canadian Patient
Cost DatabaseIntroduction: The Canadian Institute for Health Information’s web tool, the PatientCost Estimator provides a simple approach to estimating the inpatient cost ofdifferent case mix groups. The tool combines two of CIHI’s key products, the resourceintensity weight (RIW) for each inpatient case, and the cost per weighed case(CPWC). CIHI also collects patient level costs housed in CIHI’s Canadian Patient CostDatabase (CPCD) from over forty costing facilities in Canada. This study comparesthe patient level costs with the patient level estimates.
By comparing the costs from these sources, we may achieve the following goals:1. to evaluate the CPWC and RIW methodologies, 2. to isolate scenarios wherethe costs may not be well estimated using the described methodology, and3. to understand variations in the estimates in order to enhance the CPWC andRIW methodologies and to understand the limitations of using these tools toestimate inpatient costs.
Methods:
Hospital Level Financial Data 2008 (CPWC)Canadian Patient Cost Database Financial Data 2008Clinical Data 2008, grouped by Case Mix Grouping Methodology Plus (CMG+) 2010
The two costs were compared at the level of major clinical category (MCC), case mixgroup (CMG), Facility, Age and length of stay (LOS).
Only cases from those hospitals that also submit patient level cost data for inpatientsto the CPCD were included in the study.
8/13/2019 2011 Montreal Conference Abstract Book
http://slidepdf.com/reader/full/2011-montreal-conference-abstract-book 104/16688
= ( WX ′ – – WY
β = ( WX ′ ) – XWY
= β + ε
= + ε
= + εQ75+ .5 x (Q.
5- Q
25
Q75 1.5 (Q
75 -
25)
2 7 t h P C S I C o n f e r e n c e | O c t o b e r 1 9 t o 2 2 , 2 0 1 1 | M o n t r é a l , Q u e b e c , C a n a d a
Each patient counts
F R I D A Y
The estimated average cost is calculated by calculating the average RIW by case mixgroup and age for each case within a specific jurisdiction. This average RIW is thenmultiplied by the jurisdiction’s CPWC to arrive at an estimated cost.
Corresponding inpatient total costs are calculated using the CPCD as well by case
mix group and age for each case within a specific jurisdiction. Those values are thencompared with the estimated costs.
Two criteria are used in determining if a cost difference is significant. The first is therelative difference ratio of the two costs in specific categorical groups; the moresophisticated method, the student T-test is also conducted and related p-values arecomputed, a small p-value (< 0.01 or 0.05) indicates the related cost dif ference issignificant.
Results: Summary result tables for the cost dif ferences, the T-Test p-values andrelative ratios, graphs of plots by age, MCC and facility are present in the file. Someexamples of scenarios where big cost differences occurred are highlighted.
Conclusions:
Overall, the estimated CPWC*RIW costs are close to actual costs for almost1.all patient ages. The CPWC and RIW methodologies work quite successfully.Significant differences occurred in some MCC / CMG and some facilities groups.2.Further study may be conducted to probe the deep reason based on this study.3.
AUTHORS/INSTITUTIONS: B. Ren ([email protected]) Canadian Institute for Healthinformation,Ottawa, Ontario, CANADA
1155407
The Australian Hospital Patient Costing Standards and supportingQuality Framework
Introduction: Since late 2008 the Australian Government and all states and territorieshave been working towards the development of a national approach to activity basedfunding (ABF) for public hospital services to commence on 1 July 2012.
As part of this reform process, the Australian Hospital Patient Costing Standards (theStandards’) were developed by the National Hospital Cost Data Collection TechnicalWorking Group (NHCDC TWG) and approved for implementat ion from 1 July 2009 orNHCDC Round 14 (2009-10).
Methods: During 2010 and 2011 the NHCDC TWG identified a number of areas for
improvement and the Standards were enhanced with Version 2.0 being released inJune 2011. Some of the minor revisions were agreed for collection from 1 July 2010(Round 15), and major changes such as the application of depreciation rates havebeen agreed for prospective collection from 1 July 2011.

8/13/2019 2011 Montreal Conference Abstract Book
http://slidepdf.com/reader/full/2011-montreal-conference-abstract-book 105/1668
Each patient counts
2 7 t h P C S I C o n f e r e n c e | O c t o b e r 1 9 t o 2 2 , 2 0 1 1 | M o n t r é a l , Q u e b e c , C a n a d a
Further, in 2010 the NHCDC TWG identified the need to develop a QualityFramework to assess the adherence to the Standards as an indication of quality andappropriateness of the data being provided to the NHCDC. (In particular could thedata be used for classification development, price setting, determining relative valueunits and/or cost weight development?).
Results: Given the intended use of the Quality Framework, the NHCDC TWG assistedwith the development of a weighting system that would allow scores for individualhospitals to be collated, providing an indicator of the quality of their NHCDC data. A small pilot test was undertaken in late 2010 to establish the validity and fitness forpurpose of the draft NHCDC Quality Framework scoring system, with the outcomebeing a decision to further refine the Quality Framework.
In May 2011 there was agreement to conduct a broader trial on a larger sample ofhospitals using the Round 14 NHCDC hospitals to further test, refine and finalise thetool ready for possible national implementation.
Conclusions: The purpose of this paper is to provide an update on the Standards,some of the challenges and hurdles in implementing the Standards and importantlythe development of principles and processes around the development of the QualityFramework, and outcomes from the broader trial.
AUTHORS/INSTITUTIONS: J. Murray ( [email protected]); K. Chudleigh([email protected])Transition Office, Australian Department of Healthand Ageing, Woden, Australian Capital Territory, AUSTRALIA
1152872
National DRG Cost Weights in Finland
Introduction: In Finland special healthcare is organized by 20 hospital districts thathave implemented CaseMix systems for management and reimbursement purposeswithin recent years. FCG1 runs the Finnish national DRG center2 that is funded by the Association of Finnish Local and Regional Authorities 3, which indirectly represents alarge portion of special care funding,
Each year the national DRG center performs cost weight calculation from patientmaterials collected from hospital districts. A summary of the calculation resultsare published as Finnish national DRG cost weights. Those hospitals that do nothave the resources to calculate their own DRG cost weights can apply national costweights in their management and reimbursement processes.
Methods: In the NordDRG4 system there are two different DRG groupers. The“inpatient only” grouper is named the classic grouper and “inpatient and outpatientgrouper” is named the full grouper. In the cost weight calculation the materials aredivided into two sub-materials that are named in the same way:
classic material contains inpatients•full material contains inpatients and outpatients•
8/13/2019 2011 Montreal Conference Abstract Book
http://slidepdf.com/reader/full/2011-montreal-conference-abstract-book 106/16690
= ( WX ′ – – WY
β = ( WX ′ ) – XWY
= β + ε
= + ε
= + εQ75+ .5 x (Q.
5- Q
25
Q75 1.5 (Q
75 -
25)
2 7 t h P C S I C o n f e r e n c e | O c t o b e r 1 9 t o 2 2 , 2 0 1 1 | M o n t r é a l , Q u e b e c , C a n a d a
Each patient counts
F R I D A Y
Materials are also combined based on hospital groups. The most accurate costcalculations are received from the university hospitals. The combined universityhospital materials form the basis for the national Finnish DRG cost weights.The cost weights are calculated using three different algorithms:
Raw cost weights: no outlier handling is performed and all patient cases are•included in the average cost weigthsStandard deviation: algorithm involves outlier handling in two phases based•on cost standard deviation.In first phase +/- 3 * STDDEV cases are considered outliers and filtered from•the materialIn second phase +/- 2 * STDDEV cases are considered outliers and filtered•from the materialoutlier cutof f points are +/- 2 * STDDEV•Variation coefficient: algorithm involves different cost weight handling based•on the DRG group cost variation coefficient (varcoef):varcoef < 50%: no outlier handling•50% < varcoef < 100%: Outlier points are def ined by filtering out 10% of•cheapest and most expensive patient cases100% < varcoef < 150%: Outlier points are defined by fil tering out 25% of cheapest•and most expensive patient casesvarcoef < 150%: the DRG group is discarded•
Results: Using three different algorithms and two sub-materials the processproduces six DRG cost weight series per one input material. In addition to theirown cost weights, hospitals receive the national cost weigh series and comparisonbetween their own cost weights and the national weights. In Finland the forerunner inapplying DRG systems has been the Hospital District of Helsinki and Uusimaa (HUS).The cost weights from HUS have been used as defacto standard in many nationaland international comparisons. Therefore also the cost weights HUS are delivered toall hospitals.
Conclusions: Each year the national DRG center performs cost weight calculationfrom patient materials collected from hospital districts. A summary of the calculationresults are published as Finnish national DRG cost weights. Those hospitals that donot have the resources to calculate their own DRG cost weights can apply nationalcost weights in their management and reimbursement processes.
References
FCG: Finnish Consulting Group: http://fcg.fi/1.National DRG Center: http://norddrg.fi/2.
Finnish Association of Local Authorities, Kuntaliitto, http://www.kunnat.net/3.Nordic Casemix Centre: NordDRG - The Nordic casemix system:4.http://www.nordcase.org/
AUTHORS/INSTITUTIONS: T. Pitkäranta ([email protected]); M. Sjöblom([email protected]); M. Virtanen ([email protected])Helsinki University of Technology, Espoo, FINLAND;

8/13/2019 2011 Montreal Conference Abstract Book
http://slidepdf.com/reader/full/2011-montreal-conference-abstract-book 107/1669
Each patient counts
2 7 t h P C S I C o n f e r e n c e | O c t o b e r 1 9 t o 2 2 , 2 0 1 1 | M o n t r é a l , Q u e b e c , C a n a d a
1144979
Cost Weights for Activity-Based Funding in Canada – BuildingUpon What We Have
Introduction: Canada’s acute-care inpatient grouping methodology CMG+ wasdeveloped with an emphasis on explaining cost variations while aggregating in-patients with similar clinical characteristics. After the case mix group has beenassigned, a basic cost weight is assigned followed by a series of factor adjustments.
For jurisdictions considering Activity Based Funding within Canada, a simplermethodology for the assignment of payment weights may be desired.
This paper describes how an ABF methodology containing payment groups andweights can be defined within the existing CMG+ methodology.
Methods: Decision-tree software was used interactively to analyze data from twomajor clinical categories, cardiac and respiratory. A set of payment groups wasdefined within the existing CMG+ methodology and associated payment weightswere created. Further data analysis was performed to determine the materiality of theproposed groups before accepting the payment groups. Historical case-cost datawas reviewed to determine if the payment weights would be stable from year to year.
Results: Results include a comparison of the CMG+ cost weights and the newpayment weights. Included in the analysis is a review of the overall goodness of fit,the bias and materiality of the payment groups and weights. As expected, the simpler ABF payment groups and weights explain somewhat less variation in total cost thanthe CMG+ cost weights. However, the overall methodology is much simpler, with themultiple factor adjustments eliminated and only a moderate increase in the number of ABF payment groups compared to the CMG+ methodology
Conclusions: The construction of ABF payment groups and weights within theCMG+ grouping methodology is feasible, and this approach could be used to createpan-Canadian payment weights
AUTHORS/INSTITUTIONS: K.G. Murphy ([email protected]) Activity BasedFunding Unit, Canadian Institute for Health Information, Ottawa, Ontario, CANADA;S. Sutch ([email protected]) Sutch Consulting International, London,UNITED KINGDOM;

8/13/2019 2011 Montreal Conference Abstract Book
http://slidepdf.com/reader/full/2011-montreal-conference-abstract-book 108/16692
= ( WX ′ – – WY
β = ( WX ′ ) – XWY
= β + ε
= + ε
= + εQ75+ .5 x (Q.
5- Q
25
Q75 1.5 (Q
75 -
25)
2 7 t h P C S I C o n f e r e n c e | O c t o b e r 1 9 t o 2 2 , 2 0 1 1 | M o n t r é a l , Q u e b e c , C a n a d a
Each patient counts
S A T U R D A Y
Saturday, October 22, 2011SESSION 5A—Health System Planning and Funding II
1151013
Grouping Patients Across Episodes of Care: Refined ClinicalGroups (RCGs)
Introduction: Under the Health System Funding Strategy, Ontario recently introduceda new funding methodology, the Health Based Allocation Model (HBAM) for hospitaland community care. In the hospital sector, there are five care types or modules,covering services in acute inpatient and day surgery, the emergency room, inpatientadult mental health, inpatient adult rehabilitation and complex continuing care.These modules consist of two components: a service component and a unit cost
component. The service component is based on aggregating episodes of care for anindividual over a specified period of time. This collection of encounters with the healthsystem is called the person profile.
Refined Clinical Groups (RCGs) are the grouping methodology used to assign asingle group to the person profile. This methodology builds on the individual episodelevel case mix grouping methodology specific to each care type when estimatingexpected levels of service, or weighted cases.
Methods: There are two steps to the RCG grouping methodology. The first step is toassign an RCG to each episode of care within each person profile. As a result, eachepisode of care has an episode level case mix group assignment and an episode level
RCG group assignment. RCGs are assigned at this level based on most responsiblediagnosis associated with the episode.
The second step is to assign an RCG to the person profile. Where there is only oneepisode of care within a person profile, the RCG assignment at the person profile levelis equivalent to the RCG assignment at the episode level.
Where there is more than one episode of care within a person profile, RCG assignmentis based on a ranking system. RCG rankings were determined based on three yearsof data specific to each care type and on the provincial mean weight assigned to eachRCG. Rankings are specific to either the paediatric or adult population.
Once RCGs are assigned to the person profile, initial expected weighted activity is
determined by assigning the three-year average weighted activity for each RCG/agegroup. This represents an initial expected weighted activity prior to adjustments suchas socioeconomic status and rurality.

8/13/2019 2011 Montreal Conference Abstract Book
http://slidepdf.com/reader/full/2011-montreal-conference-abstract-book 109/1669
Each patient counts
2 7 t h P C S I C o n f e r e n c e | O c t o b e r 1 9 t o 2 2 , 2 0 1 1 | M o n t r é a l , Q u e b e c , C a n a d a
Results: RCG rankings were specific to each care type. Table #1 shows the 20 top-ranked RCGs for the adult population in acute inpatient and day surgery. These ranksare based on three-year average weights for each RCG. In this care type, weightsare based on HBAM Inpatient Grouper (HIG) weights for acute inpatient activity andOntario modified resource intensity weights for day surgery activity. As an example,a person profile with two acute inpatient episodes of care with RCG assignments of131 and 127, would be assigned RCG 131 overall at the person profile level becauseof its higher rank (3).
Conclusions: The RCG grouping methodology is being used across episodes of carewithin a care type. Its purpose is to assign a single group at an individual level thataccommodates more than one encounter with the health system. This presentationwill focus on the application of the methodology across care types and the impacton initial expected weighted activity, in particular by facility types such as teachingand large community.
AUTHORS/INSTITUTIONS: K. Yu ([email protected]);J. Walker (jan-walker@
rogers.com); S. Tsui ([email protected]);C. Hoy ([email protected])Health Data Branch, Ministry of Health and Long-Term Care, Toronto, Ontario, CANADA;
J. Walker, Dalla Lana School of Public Health, University of Toronto, Toronto,
Ontario, CANADA;
1165066
Are Clinical and Cost Data One Family At The Start Up Of CaseMix Based System Implementation For Hospitals Reimbursement?
Introduction: Different scenarios are being investigated after 12 months of pilotproject activities, as to determine the appropriateness of changing already theparameters for hospitals services contracting and reimbursement with case mixbased ones.
The analysis of preliminary data will show at Conference time whether usingindividual hospitals clinical and cost data at the same time in the start up iscompulsory, needed or subject to further refinements before reimbursementcan be directly linked with both.
Methods: The main methods used to determine utilization of a new paymentmechanism:
9-12 months of data analysis from pilot hospitals, clinical and cost data•(January 1st to September 30th, 2011)
Policy review at the Government, Ministry of Health and National Health•Insurance Agency
Results: Achieving efficiency and transparency in the health sector are importantobjectives for both the Ministry of Health (MOH) and the National Health InsuranceCompany (NHIC) in Moldova and one way to begin achieving these objectives isto study and test the use of case-mix based principles to first understand and thenpossibly finance the production/ services of hospitals for acute care inpatients.

8/13/2019 2011 Montreal Conference Abstract Book
http://slidepdf.com/reader/full/2011-montreal-conference-abstract-book 110/16694
= ( WX ′ – – WY
β = ( WX ′ ) – XWY
= β + ε
= + ε
= + εQ75+ .5 x (Q.
5- Q
25
Q75 1.5 (Q
75 -
25)
2 7 t h P C S I C o n f e r e n c e | O c t o b e r 1 9 t o 2 2 , 2 0 1 1 | M o n t r é a l , Q u e b e c , C a n a d a
Each patient counts
S A T U R D A Y
Clinical coding and clinical data collection started March 2011 so preliminary DRGgrouped data results from these Hospitals are expected to be produced aroundJuly 2011, in time for final presentation and paper.
Cost data collect ion and modeling will start July 2011, so probably individual hospital
costing data and simulation can be presented at the Conference.
Conclusions: This paper discusses the current and ongoing experience of casemix pilot activities in Moldova, in the light of the potential change in the financingmechanism star ting with 2012:
Main Activities:Collection of clinical data began in March 2011 (for data starting with January)•with a slow uptake as expected, but as of June 2011, five months of clinical datais available from almost all of the pilot project hospitalsDRG grouping of the clinical data will occur starting in July using a research•version of the AR-DRG v.7 grouper license and will be ongoing
Cost modeling first exercise will begin in late July/early August with initial first• round being finalized in the fall of 2011Initial development of first payment mode is expected to begin in the fall and•be finalized before contracting the Hospitals by the National Health Insurance Agency in January 2012 Acquiring necessary licenses and issuing regulations to support the•project activities
Project decisions related to the technical activities outlined above were takentogether between international experts and local authorities in order to respect thelocal context, including cultural and political issues, which is critical for long-termsustainability.
In addition to the current case-mix pilot project work, a major health reform initiativeis underway in Moldova and involves the transformation of the existing network ofhospitals. The DRG case-mix pilot project is therefore seen as providing substantialsupport to the current Government efforts in increasing transparency of the servicesbeing provided and in coming up with tariffs/prices for these services.
The major focus if payment is linked to DRGs will than move to improving clinical dataquality and collection of clinical and cost data and institutional support and capacitybuilding to the existing institutions
There is an expectation that the current project will somehow expand to includeadditional hospitals, at least from a coding, clinical data collection, and grouping
perspective as at least a dozen additional hospitals have asked to participate inthe project on a volunteer basis (both public and private hospitals). By June 2012 adecision will be taken by the government to continue moving forward with case-mix orto move on to other methods to achieve ef ficiency, transparency, and financing.
AUTHORS/INSTITUTIONS: D. Ciurea, ([email protected])Center for HealthPolicies and Services Foundation, Bucharest, ROMANIA;C. Vladescu, ([email protected]) , National School of Public Health,Bucharest, ROMANIA;V. Sava, ([email protected])SDC Moldova, Chisinau, MOLDOVA; A. Sarco, ([email protected])Nimitt Consulting, Chisinau, MOLDOVA;
8/13/2019 2011 Montreal Conference Abstract Book
http://slidepdf.com/reader/full/2011-montreal-conference-abstract-book 111/1669
Each patient counts
2 7 t h P C S I C o n f e r e n c e | O c t o b e r 1 9 t o 2 2 , 2 0 1 1 | M o n t r é a l , Q u e b e c , C a n a d a
1152928
Development and Implementation of DOT: the New DutchRegistration and Invoicing System
Introduction: In 2005 a new casemix system for hospital was introduced in theNetherlands. This so-called DBC-system had been designed to meet specific localneeds. It includes care for outdoor patients and is meant for not only registering,but also paying for delivered care. This first version lived up to the expectations, butturned out to be fairly complex in daily use. This led to the development of DOT, animproved DBC-system which is easier to work with and is also more closely related tointernational standards. Due to the fall of the Dutch Government in 2010, introductionof this second generation casemix system has been postponed until January 2012.
Along with the DBC-system market principles were introduced for par t of the care:the so-called B segment. Prices in this segment are not fixed, but negotiable betweenprovider and insurer. The B segment grew from 10 percent of annual hospital turnover
in 2005 to 34 percent in 2010 and an expected 70 percent in 2012.
Yet other relevant developments in recent years included that the overall expenditureon care in the Netherlands exceeded the budgets, which in part was due to the useof the DBC-system.
The development of the new DOT system was carried out in this context of achanging political landscape and new insights and ideas regarding desiredcontainment of expenditure of medical costs.
Methods: DBC-Onderhoud, in cooperation with the government and relevant parties,launched a large-scale project for improving the casemix system: DOT (DBC’s Opweg naar Transparantie, or DBC’s towards Transparency). The shortcomings of
the original system were addressed in close cooperation with those who use thesystem in their daily practice: hospitals, docters, insturance companies, etc. InDOT the myriad DBC’s are replaced by only a few thousand Zorgproducten (CareProducts). The rather complicated and not foolproof process of registrating, validatingen invoicing DBC’s is replaced by a sleeker procedure in with the care product isautomatically deduced from the activities done by a grouper. These improvementsmake the system much easier to manage.
Another improvement is the connection with the international classification of diagnosesICD10. Although DBC’s strictly speaking do no longer exist within DOT, the casemixsystem is still called a DBC-system because the care products are as before definedby diagnosis and treatment. The main difference is that the term DBC gets a more
generic meaning.
Results: The DOT system for 2012 was finally delivered in July 2011. It meets therequirements of improved manageability and facilitating the negotiations betweeninsurance companies and care providers. Currently the implementation of thesystem is ongoing, still focused on going live in January 2012. Even now changesin legislation are made to facilitate the required changes.
8/13/2019 2011 Montreal Conference Abstract Book
http://slidepdf.com/reader/full/2011-montreal-conference-abstract-book 112/16696
= ( WX ′ – – WY
β = ( WX ′ ) – XWY
= β + ε
= + ε
= + εQ75+ .5 x (Q.
5- Q
25
Q75 1.5 (Q
75 -
25)
2 7 t h P C S I C o n f e r e n c e | O c t o b e r 1 9 t o 2 2 , 2 0 1 1 | M o n t r é a l , Q u e b e c , C a n a d a
Each patient counts
S A T U R D A Y
Conclusions: The new DOT system is ready for take-off. The development of thesystem, which is a complex project in any circumstances, was further complicatedby changing constraints throughout the development process. Even so, at the time ofwriting (June 2011), all signals are green for introduction in 2012. In this presentationwe will provide an overview of the new system as well as an update on the currentstatus of implementation.
AUTHORS/INSTITUTIONS: J. Warners ([email protected])SystemDevelopment and Intake, DBC-Onderhoud, Utrecht, Utrecht, NETHERLANDS
1143916
Making Use of DRG Data: Forecasting Costs in SlovenianHospitals
Introduction: After seven years of DRG implementation in the Slovenian healthcare system, policy-makers are keen to find out on the basis of DRGs what thefuture trends in the acute settings are. The present DRG system is now consideredstable with more reliable data. Forecasting is important for short-term and long-termplanning. Our aim was to find out in the retrospective DRG data what the trends areand compare them to the actual collected data and analyze the deviations from thesimulations and actual standing of the DRGs on the national level.
Methods: On the basis of the data we ran several simulations and projections todetermine the most suitable algorithm for the implementation of possible futureforecasting methods. We evaluated the existing methods for medical costs predictionand applied them to the specific Slovenian health care environment. Our model isbased on the multiple regression analysis and random forests with the help of severalanalytical tools, i.e. Weka, SPSS, R and MatLab.
Results: In the first four years we notice deviations between the hospital data andthe simulations (projections). This is due to unstable data resulting from the initialproblems and stage of introduction and implementing DRG's. In the subsequentyears this deviation is minimized, which illustrates a closer and more realisticforecast.
Conclusions: Although a lot of DRG related data is available in Slovenia, therehas not yet been a proper use of this data. We have shown, through use of variousalgorithms that valid predictions about future health care costs can be made usingretrospective DRG data.
AUTHORS/INSTITUTIONS: A. Yazbeck ([email protected]) Health CareSystem Development, National Institute of Public Health, Ljubljana, SLOVENIA; A. Orbanic ([email protected])Department for Research and Technology,IMFM, Institute of Mathematics,, Ljubljana, SLOVENIA;K. Grasic ([email protected]); B. Horvat ([email protected])Primorska Institute ofNatural Sciences and Technology (PINT), University of Primorska (Univerza naPrimorskem), Koper, SLOVENIA;

8/13/2019 2011 Montreal Conference Abstract Book
http://slidepdf.com/reader/full/2011-montreal-conference-abstract-book 113/1669
Each patient counts
2 7 t h P C S I C o n f e r e n c e | O c t o b e r 1 9 t o 2 2 , 2 0 1 1 | M o n t r é a l , Q u e b e c , C a n a d a
SESSION 5B—Maximizing Informationin Case Mix Applications
1151106
The UNU-CBGs: Development and Deployment of a RealInternational Open Source Case Mix Grouper for ResourceChallenged Countries
Introduction: Although the Casemix system has been in existence for more thanthree decades, the deployment of this system in developing countries is very erratic. A call by internat ional donors to enhance the efficiency of existing social insuranceschemes by introducing the prospective payment method has prompted manydeveloping countries to use the Casemix system. Unfortunately, the lack of a low-cost, reliable and customizable Casemix grouper, based on an open source, is amajor obstacle to the adoption of the Casemix system in these developing countries.
Methods: UNU-IIGH (United Nations University International Institute for GlobalHealth), in collaboration with the International Centre on Casemix and Clinical Codingof UKM (Universiti Kebangsaan Malaysia) and UNU-IIST (United Nations UniversityInternational Institute for Software Technology), has developed a Casemix groupertargeted for use in developing countries. The UNU Casemix grouper is a universal,dynamic and advanced grouper employing ICD-10 for disease classification, andICD-9CM for procedure classification. The grouper covers a wide range of healthcareservices in primary, secondary and tertiary settings. These include ambulatoryservices, in-patient services, daycare surgery, chemotherapy, rehabilitation andmental health.
Results: The UNU Casemix grouper is the first grouper that covers acute, sub-acuteand chronic long-stay patients. The grouper extends beyond the classical DRG(Diagnosis Related Groups) classification system by taking into account not onlydiagnoses and procedures for the creation of ISO-resource groups, but also specialprostheses, special investigations and high-cost drugs.
The grouper is structured around 32 CMG (Casemix Major Groups) and 1220 refinedgroups called CBGs (Case-Based Groups). For each of these CBGs, the severity andresource intensity level ranges from three to a maximum of eight. This is to providegreater flexibility and the more refined classification required when the system is usedfor provider payment and resource allocations.
Also, the grouper includes three additional sof tware applications to facil itate theimplementation of the Casemix system in developing countries. These are Data ToolPro. Version 2.0 for data collection; CCM Version 2.0 for clinical costing; and Code Assist, which is a digital coding tool to aid coders in enhancing their productivi ty.
8/13/2019 2011 Montreal Conference Abstract Book
http://slidepdf.com/reader/full/2011-montreal-conference-abstract-book 114/16698
= ( WX ′ – – WY
β = ( WX ′ ) – XWY
= β + ε
= + ε
= + εQ75+ .5 x (Q.
5- Q
25
Q75 1.5 (Q
75 -
25)
2 7 t h P C S I C o n f e r e n c e | O c t o b e r 1 9 t o 2 2 , 2 0 1 1 | M o n t r é a l , Q u e b e c , C a n a d a
Each patient counts
S A T U R D A Y
Initially launched in 2009, this grouper is currently being deployed in four countries(Indonesia, the Philippines, Uruguay and Malaysia). Six other countries are in theplanning stages of adopting the system.
Conclusions: The development and deployment of the universal, dynamic and
advanced UNU Casemix grouper has enabled more developing countries with limitedfinancial resource to implement and sustain the use of a Casemix system and reapthe long-term benefits of this health management tool.
AUTHORS/INSTITUTIONS: S.M. Aljunid, S.M. Hamzah, S.A. Mutalib, A.M. Nur, N.Shafie, S. Sulong, UNU-IIGH, UNU-International Institute for Global Health, KualaLumpur, Federal Territory, MALAYSIAS.M. Aljunid,([email protected]); S.M. Hamzah ([email protected]);S.A. Mutalib([email protected]);A.M. Nur,([email protected]);N. Shafie, ([email protected]);S. Sulong, ([email protected])International Case-mix and ClinicalCoding Centre, Universiti Kebangsaan Malaysia, Kuala Lumpur, Federal Territory,MALAYSIA
1164435
Individual Product Determination in the New Dutch DBC System:How to Make the System Transparent for its Users
Introduction: On January 1st, 2012, the Dutch declaration system (diagnosistreatment combination), which was introduced in 2005, will be converted. Theinitial development of this conversion was begun in 2007/2008. In all phases of theconversion, Information technology has supported and will continue to support thesystem (that is, in early development, in transit ion, and from 2012 on into production).In our presentation, we would like to detail information regarding the development ofthis new system and the support given its development by information technology.
Methods: The initial developments that were part of the new DBC (in English:“Diagnosis Treatment Combination”) system were done in 2007. These developmentswere the result of an agreement between all the authorities involved in the Dutchsystem: hospitals, insurance companies, and the government. The developmentwas called ‘Project DOT’, which can be roughly translated as ‘DBC’s On Their Way toTransparency’. DOT was to be developed based on ICD-10 chapters and registrationin the current DBC system.
The new system would incorporate three large and interdependent changes: A new basic model, RSAD (in English: Register, Extract, Deduce and Declare)1.
A new product structure to determine products2.New rules of registration to determine when to declare3.
For the second part – the product structure – DBC-Onderhoud used the ICD-10chapters and registration available in the current system from the DBC InformationSystem (DIS) to develop decision trees. These trees determine the products for asingle period of patient care. This new product structure consists of a number ofrelevant elements.

8/13/2019 2011 Montreal Conference Abstract Book
http://slidepdf.com/reader/full/2011-montreal-conference-abstract-book 115/1669
Each patient counts
2 7 t h P C S I C o n f e r e n c e | O c t o b e r 1 9 t o 2 2 , 2 0 1 1 | M o n t r é a l , Q u e b e c , C a n a d a
The next step was to open the discussion to specialists, and to decide whether theseproducts were logical, and whether they should be expanded or cut in the first drafts.To enable a discussion between different parties, DBC-Onderhoud needed an onlinetool that was able to make the product structure transparent. This tool, called the“care product viewer”, was built in cooperation with Casemix, a Dutch consultancyorganization. It allowed everyone, literally, to see what was built, what had beenchanged, and what needed to be changed.
Results: The discussions and iterations on the first draft resulted in the creationof a product structure for inpatient and out patient hospital care which includedapproximately 4400 singular products in 123 product groups. These product groupsconsist of decision trees. Within decision trees, conditions are checked (for example,a registered diagnosis code, or a performed certain-care activity). In the productstructure, there are almost 2500 current diagnosis codes, and more than 3000 activitycodes, that are used.
This structure can be roughly divided into three categories:
Intensive, surgical products.1.Conservative inpatient care products (diagnostics and small treatment for inpatient2.care; no large surgery).Conservative outpatient care products (diagnostics and small treatment for3.outpatient care; no large surgery)
A patient is treated in the hospital and all provided care is registered (suchasdiagnosis, diagnostics, outpatient consultation, surgeries, patient days, and soon). After a given period, decided by automatic registration rules, the patient datasetis sentto a central web application, the grouper. The grouper supports the rules ofthe product structure and determines a care product. For many people this feels likebeing in a black box, and they want to see how a determination works to be able to
understand it.
As a result, an online tool was created to al low everyone who was interested tosee how a product was determined. The tool shows possible products that canbe declared and which type of care – at minimum – should be provided to be ableto declare a product. In addition, a wide variety of underlying information aboutproducts and product groups is made available.
Because of the possibilities of this tool, today (in 2011) it is being used by hospitals,consultants, hospital representatives, and insurance companies to analyze the impacton their production of the transition to the new system. As well, the tool will allowhospitals to analyze their production from 2012 onward and evaluate whether a faulty
or unexpected product has been determined.The initial product structure will be ready for implementation in 2012. However, weknow that additional changes will be needed, and that these will lead to a newerversion of the product and changes to its structure. As well, all parties involved willneed to be informed of these changes in a timely and accurate manner, so that theycan assess them. In addition, transparency will be needed regarding the changes.DBC-Onderhoud has provided that via the online tool.
8/13/2019 2011 Montreal Conference Abstract Book
http://slidepdf.com/reader/full/2011-montreal-conference-abstract-book 116/166100
= ( WX ′ – – WY
β = ( WX ′ ) – XWY
= β + ε
= + ε
= + εQ75+ .5 x (Q.
5- Q
25
Q75 1.5 (Q
75 -
25)
2 7 t h P C S I C o n f e r e n c e | O c t o b e r 1 9 t o 2 2 , 2 0 1 1 | M o n t r é a l , Q u e b e c , C a n a d a
Each patient counts
S A T U R D A Y
Conclusions: When the new system goes ‘live’ in 2012, we will provide Dutchhospitals with a system built from their own registrations, and approved byall representatives involved in Dutch healthcare. This was possible becauserepresentatives were able collectively to decide on the development of the system.We will also provide to everyone interested a tool that shows, in great detail,the products and their underlying structural information. ICT has supported thedevelopment of this system, and ITC will continue to support and service the productthroughout the transition period and into production.
AUTHORS/INSTITUTIONS: R. Swiers ([email protected]) DBC-Onderhoud,Utrecht, NETHERLANDS;R. Kleijwegt ([email protected]) Casemix BV, Utrecht, Utrecht,NETHERLANDS
1114345
Levels of Care Methodology to Classify Patients as Tertiary andNon-tertiary
Introduction: Quite often there is a need to identify tertiary (quaternary and tertiary)and non-tertiary (secondary and primary) levels of care (LOC) for health systemplanning, funding allocation models and clinical purposes. Tertiary care is generallydefined as the types of healthcare provided by specialists working in sophisticatedmedical centers equipped with personnel and facilities for special investigation andtreatments. Tertiary care patients are usually referred from primary or secondary careprofessionals. In contrast, primary care refers to the work of healthcare professionals,usually general practitioners, who act as the patients’ first point of contact with thehealthcare system. Secondary care is somewhere in between. It includes services
provided by medical specialists who generally take patients from primary careprofessionals. We present a methodology that enables patients’ classification byquaternary, tertiary, secondary and primary levels of care.
Methods: Using data from the Discharge Abstract Database, the LOC methodologysegments cells which are created by a combination of CMG+ (Case Mix Groupplus) and age groups. Two age groups are used: adults (ages 18+) and children(ages 0-17). Several indicators are used in determining cells’ LOC. The first one isthe concentration of care of a cell, which is measured by the relative distribution.The identified attribute is the number of cases of a given cell among hospitals; thereference attribute is the number of all cases among hospitals. Study units (hospitals)are sorted by reference attribute, cumulative distributions of identified and reference
attributes are normalized according to sort order, and the cumulative distribution ofidentified attribute vs. the cumulative distribution of reference attribute are plotted.Using this approach, the Gini coefficient is computed for each cell by calculatingarea between curve and 45 degree line. The Gini coefficient can range from 0 to 1.Based on their Gini coefficients, the CMG/age cells are ranked from highest tolowest concentration of care. Another important indicator used is the overall levelof care of the settings in which cases in a cell are treated. This indicator is called Average Hospital Tert iariness and is derived based on the concentration of care ofindividual cells measured by the Gini coefficient. This can be understood intuitively

8/13/2019 2011 Montreal Conference Abstract Book
http://slidepdf.com/reader/full/2011-montreal-conference-abstract-book 117/166
8/13/2019 2011 Montreal Conference Abstract Book
http://slidepdf.com/reader/full/2011-montreal-conference-abstract-book 118/166102
= ( WX ′ – – WY
β = ( WX ′ ) – XWY
= β + ε
= + ε
= + εQ75+ .5 x (Q.
5- Q
25
Q75 1.5 (Q
75 -
25)
2 7 t h P C S I C o n f e r e n c e | O c t o b e r 1 9 t o 2 2 , 2 0 1 1 | M o n t r é a l , Q u e b e c , C a n a d a
Each patient counts
S A T U R D A Y
Methods: A generalize linear model is used on 2009 healthcare data for a selectgroup of patients with similar healthcare benefits to create an expected mortalityusing both the existing life demographic factors, age and gender, and a separateexpected mortality using the following case mix tools:(1) Discovery Episode Groups (DEGs)The Discovery Episode Groups is software technology using proprietary logic toorganize claims data into diagnostically and chronologically related episodes of care.They are initiated by a health care practitioner when a patient first presents for care;
(2) The Johns Hopkins Adjusted Clinical Group (ACG) Case-Mix SystemThe Johns Hopkins Adjusted Clinical Group (ACG) Case-Mix System is a statisticallyvalid, diagnosis-based, case-mix methodology that allows healthcare providers,funders and policy makers to describe or predict a population’s past or futurehealthcare needs, utilisation and costs. The ACG System is also widely used byresearchers and analysts to compare various patient populations’ prior healthresource use, while taking into account morbidity or illness burden.).
The results were then applied to the 2010 data set to understand the sensitivity andspecificity of the prediction.
Results: There is superior performance in explanatory power when using DEGs andRUB to predict mortality
Conclusions: Overlaying the Discovery Episode Groups (DEG’s) and ResourceUtilisation Bands (RUBs) on to the current underwriting factors provides a moreaccurate prediction of death and thus enables the life insurance business to pricemore competitively.
AUTHORS/INSTITUTIONS: V. Opeka ([email protected]); B. Ruf f ([email protected]); S. Ginsberg ([email protected]); L. Steenkamp ([email protected]); C. Nel ([email protected]); P. Bunyonyo ([email protected]); R. Morgan ([email protected]) Risk Intelligence, DiscoveryHoldings, Johannesburg, Gauteng, SOUTH AFRICA;
SESSION 5C—Ambulatory Care and Case Mix II
1152597
Australian Developments in Case Mix Classification and Fundingof Emergency Department Care
Introduction: Emergency departments provide initial treatment for a range ofillnesses and injuries. On one spectrum, they provide care for patients with life-threatening illnesses, who may need resuscitation. On the other hand, they substitutefor primary care services, when these are inaccessible (e.g. where they do not existor the patient cannot access them for whatever reason). Therefore, the complexity ofpatients requiring treatment in an emergency department varies widely, and so do thecosts to treat them.

8/13/2019 2011 Montreal Conference Abstract Book
http://slidepdf.com/reader/full/2011-montreal-conference-abstract-book 119/16610
Each patient counts
2 7 t h P C S I C o n f e r e n c e | O c t o b e r 1 9 t o 2 2 , 2 0 1 1 | M o n t r é a l , Q u e b e c , C a n a d a
Due to the ‘drop in’ nature of emergency departments and the need for services to beavailable around the clock, they have tended to be funded on a ‘historical’ or ‘block’basis. However, in recent years, countries are applying activity-based approachesto funding them. A building block for activity-based funding is casemix classification.
Methods: This paper will examine systems to classify emergency department activityinternationally, and focus on historical developments in Australia in this area, leading tothe most recent decision to fund this activity using patient diagnosis in addition to triageand disposition (i.e. destination post initial treatment in the emergency department).
Specifically, we will draw on recent work that we have undertaken for the Australianand New South Wales (NSW) governments, the former regarding the funding ofemergency department activity, and the latter regarding counting, classification,costing and funding. In the NSW project, we undertook grouping of NSW data to thenational ‘proxy’ classification for emergency department care – Urgency RelatedGroups – and a patient level costing study.
Results: In this paper we will discuss the issues that we encountered in usingdiagnosis as a basis for differentiating patients requiring different levels of resources,how well this explains cost, and the implications of this for funding emergencydepartment activity.
Conclusions: We conclude with identifying what is missing in the classification andfunding of emergency department services, namely capture of patient complexityand flexibility to enable innovative models of care that assist with better flow andtreatment of patients through emergency departments. We provide recommendationsfor how this may occur.
AUTHORS/INSTITUTIONS: J. Pearse ([email protected]); D. Mazevska([email protected]) , Health Policy Analysis Pty Ltd, St Leonards,New South Wales, AUSTRALIA;J. Pearse, Centre for Health Services Development, University of Wollongong,Sydney, New South Wales, AUSTRALIA
1152952
Unexpected or Unexplained High Pharmacy Utilization:Identifying Those Who Do Not Have the Comorbidity toSupport their Pharmacy Use
Introduction: There is much in the literate demonstrating the potential benefits of
identifying individuals who are consuming more pharmacy services than might beexpected given their morbidity (termed “outlier”) and how identifying such patientsmight be useful for improving outcomes and better managing limited healthcareresources. The goal of this paper is to assess the usefulness of a model specificallycalibrated to identify unusually high pharmacy utilizers and to contrast this techniquewith traditional predictive modeling techniques for identifying individuals at risk forhigh pharmacy utilization.
8/13/2019 2011 Montreal Conference Abstract Book
http://slidepdf.com/reader/full/2011-montreal-conference-abstract-book 120/166104
= ( WX ′ – – WY
β = ( WX ′ ) – XWY
= β + ε
= + ε
= + εQ75+ .5 x (Q.
5- Q
25
Q75 1.5 (Q
75 -
25)
2 7 t h P C S I C o n f e r e n c e | O c t o b e r 1 9 t o 2 2 , 2 0 1 1 | M o n t r é a l , Q u e b e c , C a n a d a
Each patient counts
S A T U R D A Y
Methods: The unexpected high pharmacy user model was developed via a two partprocess using a split half validation technique using the PharMetrics Patient-CentricDatabase representing the medical and pharmacy claims and enrollment across 85geographically diverse health care delivery organizations within the United States.Simplistically, pharmacy ‘outlier’ users were identified and then traditional modelingtechniques were applied to calibrate a model specifically to predict this subset.Results of these efforts were then applied to data from Aragon Spain to assess theapplicability of this model in real world settings.
Results: The unexpected high pharmacy model yielded similar performance statistics(PPV, sensitivity and specificity) to traditional predictive modeling techniques foridentifying high cost pharmacy patient. However, an important distinction betweenthe modeling techniques was that there was little overlap in “who” was being identified.
Conclusions: Simplistically, traditional predictive modeling techniques and the newunexpected high pharmacy utilization model were identifying different subsets ofindividuals both at similar risk for future high pharmacy. The combination of the two
models can help to provide a better sense of the population at risk for high pharmacyuse and potentially greater intervention opportunities.
AUTHORS/INSTITUTIONS: C. Abrams ([email protected]);H. Chang (hchang2@ jhsph.edu); Health Policy & Management, Johns Hopkins University, Bal timore , MD; A. Calderon ([email protected]); B. Poblador-Plou ([email protected]); A. Prados-Torres ([email protected]); Aragon Health Science Institute, ,Zaragoza, SPAIN;
1163265
Using Primary Care Data to Identify Patients toCase Manage in the UK Introduction: The aim of this paper is to demonstrate the use of population baseddata to identify individuals with high probability of care management, and theexperience of teams in the UK is working with primary care physicians.
Case management is one of the potential applications of population groupingsystems and risk protection models. This has been adopted as an approach inprograms in the UK to compliment current clinical methods to identify patients
Methods: The ACG system uses person-based longitudinal data primary care andhospital data.
These data were grouped using the ACG grouper. In addition to the morbidityaetiology, morbidity burden and disease groups, the ACG system also providesoutput from predictive risk models. The predictive models provide a likelihood ofhigh/risk of cost in the future 12 month period and also an estimation of the cost. A patient case management list is reported from the output for review by generalpractitioners (primary care providers).

8/13/2019 2011 Montreal Conference Abstract Book
http://slidepdf.com/reader/full/2011-montreal-conference-abstract-book 121/16610
Each patient counts
2 7 t h P C S I C o n f e r e n c e | O c t o b e r 1 9 t o 2 2 , 2 0 1 1 | M o n t r é a l , Q u e b e c , C a n a d a
Results: The case management list have provided support to GPs in identifyingpatients at risk of high future utilization. These provide an affirmation of those patientsalready being managed, and provides a list of patients who require review and havenot previously been identified by the GP/practice.
Conclusions: The method of case management identification is a useful and rigorous(quantifiable) approach to providing additional information to primary care physiciansto enhance existing methods. Its provision of summary information related to apatients multiple morbidities and risk variables provides useful summary clinicalinformation.Future enhanced models can provide tailored solutions to local and health systemrequirements.
AUTHORS/INSTITUTIONS: S. Sutch ([email protected])Department of Health Policyand Management, Johns Hopkins University, Bloomberg School of Public Health,Chandler's Ford, UNITED KINGDOM;
1152865
Predictors of Pharmacy Cost in Diabetic Patientsat Buddhachinaraj Hospital
Introduction: Diabetic patients need proper long-term treatment to control bloodsugar level and their complications. Patients with higher morbidity burden are morecomplex cases and more costly to take care. This study aimed to find predictors ofpharmacy cost in treating diabetic patients at Buddhachinaraj Hospital, a medicaleducation centre of Naresuan University, Phitsanulok, Thailand.
Methods: Adult diabetic pat ients aged 20 and higher who attended outpatient clinic
at Buddhachinaraj Hospital in 2010 were recruited. Electronic data on demographiccharacteristics, clinical conditions and dispensed pharmacies during 12 months wereanalysed by the Johns Hopkins ACG (Adjusted Clinical Group) version 9. Multipleregressions were used to fit the models for predicting annual pharmacy costs.
Results: There were 7,804 cases recruited, 62% were female and 22% aged 65and higher. The average outpatient visits were as high as 14.0 visits per person peryear (sd 10.8, median 13, range 1-146). The average counts for chronic condit ionswere 2.3 per person (sd 1.7, median 3, range 0-10), however, the average majorcondition (by major ADG count) was 0.45 per person (sd 0.67, median 0, range 0-4).The average numbers of drug therapy were 4.0 (sd 2.6, median 4, range 0-10). Theaverage pharmacy cost was as high as 42,615 baht (US$1,421) per person per year
(sd 74,355, median 12,118, range 0-995,613). The predictors of annual pharmacy costincluded the number of drug therapy, the number of major condition, being male,the number of chronic condition, the number of outpatient visit and age respectively(r-square 0.32, p<0.01).
8/13/2019 2011 Montreal Conference Abstract Book
http://slidepdf.com/reader/full/2011-montreal-conference-abstract-book 122/166106
= ( WX ′ – – WY
β = ( WX ′ ) – XWY
= β + ε
= + ε
= + εQ75+ .5 x (Q.
5- Q
25
Q75 1.5 (Q
75 -
25)
2 7 t h P C S I C o n f e r e n c e | O c t o b e r 1 9 t o 2 2 , 2 0 1 1 | M o n t r é a l , Q u e b e c , C a n a d a
Each patient counts
S A T U R D A Y
Conclusions: The number of chronic conditions and major morbidity partiallypredicted the annual cost. These clinical features influenced on the number of drugsdispensed and the number of visit. Unexplained factors such as being male shouldbe explored to increase efficiency of ambulatory care delivery.
AUTHORS/INSTITUTIONS: S. Pannarunothai ([email protected]); Faculty ofMedicine, Naresuan University, Mueang Phitsanulok, THAILAND;R. Pannarunothai ([email protected])Pharmacy, Buddhachinaraj Hospital,Phitsanulok, THAILAND;
SESSION 6A—Innovative in Case Mix Applications
1153121
Enabling Transparency and System Evaluation with NationalImplementation of Inpatient Rehabilitation Grouping Methodologies
Introduction: For over ten years, inpatient adult rehabilitation facilities across Canadahave had access to standardized, comparative indicators, in part, based on twogenerations of case mix grouping methodologies. The evolution of this reportingsystem has most recently enabled transparent integration with data and indicatorsfrom other levels of hospital-based services.
Methods: In collaboration with a broad range of Canadian and Americancollaborators, the Canadian Institute for Health Information (CIHI) developed theNational Rehabilitation Reporting System (NRS) in the late 1990's. In part due to adearth of inpatient rehabilitation grouping methodologies at the time, and also thesimilarities between data sets, a decision was made to adopt the existing FunctionRelated Groups (FRG). Over the subsequent decade, the maturation of availableCanadian data and information for the inpatient rehabilitation lead to the evaluationand development of a new methodology. Developed primarily in one provincial jurisdiction, the new Rehabilitation Patient Groups (RPG) methodology was adoptedfor pan-Canadian comparative reporting.
Results: Over 100 inpatient rehabilitation facilities access comparative indicatorreports based partly on the Rehabilitation Patient Groups (RPGs) methodology. Although full inclusion in either retrospective of prospective payment models has notyet occurred in Canada, use of the RPGs and related cost weights as stratificationvariables for risk adjustment have taken root. Limitations of the RPG methodology,including uncertainties regarding the potential use of diagnostic co-morbidity tiersand gaps in data for the shortest of inpatient epsisodes, will likely drive the nextevolution of the methodology. Inclusion of RPG-based indicators in a broader,facility-identifiable reporting application alongside inpatient acute and emergencydepartment grouping methodologies have provided additional opportunities forcritical assessment of the strengths and areas for enhancement.

8/13/2019 2011 Montreal Conference Abstract Book
http://slidepdf.com/reader/full/2011-montreal-conference-abstract-book 123/16610
Each patient counts
2 7 t h P C S I C o n f e r e n c e | O c t o b e r 1 9 t o 2 2 , 2 0 1 1 | M o n t r é a l , Q u e b e c , C a n a d a
Conclusions: Although relatively early in its implementation in pan-Canadianreporting, when compared to inpatient acute methodologies, the RehabilitationPatient Groups (RPGs) have provided a new variable on which to develop fundingand facility, regional and system-wide program evaluation initiatives. Furtherintegration into performance scorecards for the inpatient rehabilitation sector, alongwith additional critical assessment of the applicability of the current cost weightsacross all jurisdictions will provide potential enhancements. Initiatives to furtherexpose clinicians, researchers, system planners, and other key stakeholders to themethodology are ongoing. Comparative assessment of similar methodologies forthe inpatient rehabilitation sector in other countries, may uncover additional clinicalvariables to enhance the data set and related applications.
AUTHORS/INSTITUTIONS: I. Joiner ([email protected]) Canadian Institute for HealthInformation, Ottawa, Ontario, CANADA;
1143005
Comparative Analysis of Rehabilitation Groupers
Introduction: In recent years, the number of elderly has been growing, as the numberof people with chronic diseases and/or with potentially disabling diseases. All thesechanges led to the development of the concept of rehabilitation and the need tocreate facilities to provide such care. In the USA, in 1983, with the appearance ofthe prospective payment system (PPS) through DRGs to finance the acute care,the rehabilitation care, among others, were left out of this payment model, sinceDRGs were not suitable to classify these patients. In Portugal, we can find the samesituation, and even today rehabilitation patients are paid retrospectively, on a perdiem basis, without any adjustment depending on their complexity. With this type of
payment, it is impossible to know what is exactly being paid, and this probably leadsto excessive costs and waste of resources.
The aim of this study is to perform a comparative analysis of patient classificationsystems (PCS) developed for inpatient rehabilitation for PPS; and discuss whichone of these classificat ion systems would address better the Portuguese reality.
Methods: A literature search was performed in bibliographic databases and greyliterature in Portuguese and English, to conduct a literature review on: patientclassification systems for inpatient rehabilitation; patient assessment tools, andfunctional evaluation instruments. It was also necessary to contact experts inPortugal, Australia and Canada via email.

8/13/2019 2011 Montreal Conference Abstract Book
http://slidepdf.com/reader/full/2011-montreal-conference-abstract-book 124/166108
= ( WX ′ – – WY
β = ( WX ′ ) – XWY
= β + ε
= + ε
= + εQ75+ .5 x (Q.
5- Q
25
Q75 1.5 (Q
75 -
25)
2 7 t h P C S I C o n f e r e n c e | O c t o b e r 1 9 t o 2 2 , 2 0 1 1 | M o n t r é a l , Q u e b e c , C a n a d a
Each patient counts
S A T U R D A Y
Results: Two patient classification systems developed exclusively for inpatientrehabilitation were found: Case-mix Groups (CMGs) developed in the USA, andRehabilitation Patient Groups (RPGs) developed in Canada. The CMGs are used for PPS(per episode) since 2002 for all Medicare inpatient rehabilitation, and RPGs are in theprocess of being implemented with the same purpose. Two more patient classificationsystems not exclusive to inpatient rehabilitation, but with “rehabilitation categories” intheir structure were found: the Australian National Sub-Acute and Non-Acute Patientcasemix classification (AN-SNAP) developed in Australia, and the Resource UtilizationGroups (RUGs) developed in the USA. The AN-SNAP pretends to classify all post acuteand non acute care, and the implementation of the “rehabilitation branch” for fundingpurposes is in process. The RUGs are used for the PPS of Skilled Nursing Facilities since1998, and also has groups for inpatient rehabilitation. Regarding CMGs, RPGs and AN-SNAP, it was found that all include in their classification the variable “functional status”,measured by FIM instrument. The other common variables used for patients grouping are“impairment” and “age”. The RUGs also uses as grouping variables “functional status”,but measures it by an ADL instrument. The variables “time of therapy received” and “type
of care” are the other items used for grouping in RUG, because these are considered tobe the major cost drivers.
Conclusions: In Portugal, the number of rehabilitation facilities is growing, yet theystill cannot meet the demand. This trend, together with the inadequacy of the currentfunding system, supports the need to implement a PCS for rehabilitation care. Fromthe analysis undertaken in this study, it is considered that the most appropriatesystem to implement in Portugal would be the CMGs, since: it is designed exclusivelyfor inpatient rehabilitation; it has been used for funding purposes for several years;it has an adjustment by co-morbid conditions for establishment of different relativeweighs; and allows a cost estimate of 50%. We can also conclude that the RPG wasdeveloped based on the CMGs, and that the rehabilitation branch of AN-SNAP has
many similarities with it. That is, there is an overall agreement of the instrument tobe used for measuring functional status, and which variables that should be usedfor grouping. Thus, in Portugal, due to limited financial resources, the CMGs systemshould be adopted without major changes, as it happened with DRGs.
AUTHORS/INSTITUTIONS: K. Dimitrovova ([email protected]);C. Mateus ([email protected]), Universidade Nova de Lisboa - Escola Nacionalde Saúde Pública, Lisbon, PORTUGAL;

8/13/2019 2011 Montreal Conference Abstract Book
http://slidepdf.com/reader/full/2011-montreal-conference-abstract-book 125/16610
Each patient counts
2 7 t h P C S I C o n f e r e n c e | O c t o b e r 1 9 t o 2 2 , 2 0 1 1 | M o n t r é a l , Q u e b e c , C a n a d a
1151480
Real-time Monitoring of Patient Outcome - VLAD
Introduction: Comparisons of hospital-specific performance are typically presented
using cross-sectional analyses; however, they can be inadequate in quality caremonitoring. This might due to: 1) averaging over time can “hide” important variationsin the clinical experience of individual patients; 2) even if a problem is identified,the traditional approach might not give front line doctors any help in identifyingwhich patients were involved. To overcome these issues, we needed to monitorperformance in terms of the sequences of good and bad outcomes over time, aswell as targeting specific patients for clinical review. This can be applied in realtime if required.
Traditionally, this has been done by using cumulative sum (CUSUM) charts. However,these charts are difficult to understand from a clinician’s point of view. Recently, thereis increasing interest in an alternative approach - Variable Life-Adjusted Displays
(VLAD) with statistical control limits. These charts are much easier to interpretclinically and use a real-time monitoring manner.
In this paper, we explored the concept of VLAD as applied to measuring the outcome(in-hospital mortality) of in-patients with Acute Myocardial Infarction (AMI) in HongKong Hospital Authority hospitals.
Methods: We used 4000 acute in-patients with AMI as principal diagnosis(500 consecutive AMI cases per 8 major hospitals), starting from April 2009,to investigate the VLAD approach. The VLAD chart with control limits showingcumulative differences between expected and observed mortality of patients.The expected mortality calculated from risk model based on age, sex, riskof mortality (3M™ International Refined-DRGs (IRDRGs)), 5 DRGs* (commonprocedures undertake) for prediction of the in-hospital mortality of AMI. Controllimits were set to allow one false positive every 1,200 patients (or one everytwo years for major hospitals), based upon a Markov Chain Monte Carlo Simulation.
Remarks: *- DRG04120: IP NON-COMPLEX RESPIRATORY SYSTEMPROCEDURES; DRG05115: IP CARDIAC CATHETERIZATION; DRG05106: IP OTHERCARDIOTHORACIC PROCEDURES; DRG04102: IP LONG TERM MECHANICALVENTILATION WITHOUT TRACHEOSTOMY; DRG05140: IP PERCUTANEOUSCARDIOVASCULAR PROCEDURES.
Results: For these 8 major hospitals, half of them did not flag a signal, i.e. VLADwithin control limits. Three of them hit the lower control limit, i.e. these three hospitals
had sufficiently cumulatively more deaths than expected; while one of them hit theupper control limit.

8/13/2019 2011 Montreal Conference Abstract Book
http://slidepdf.com/reader/full/2011-montreal-conference-abstract-book 126/166110
= ( WX ′ – – WY
β = ( WX ′ ) – XWY
= β + ε
= + ε
= + εQ75+ .5 x (Q.
5- Q
25
Q75 1.5 (Q
75 -
25)
2 7 t h P C S I C o n f e r e n c e | O c t o b e r 1 9 t o 2 2 , 2 0 1 1 | M o n t r é a l , Q u e b e c , C a n a d a
Each patient counts
S A T U R D A Y
Conclusions: The VLAD charts can provide a useful visual tool for real-timemonitoring of patient outcomes. By identifying the changes in pattern of outcomesover time we can flag specific groups of patients for clinical review. This couldpotentially provide earlier identification of factors impacting on the quality of patientcare and leading to improved patient outcomes.
AUTHORS/INSTITUTIONS: K. Wong ([email protected]); S. Gillett ([email protected]); K.H. Lee ([email protected]); D. Yeung ([email protected]);Department of Finance, Casemix Office, Hong Kong Hospital Authority, Kowloon,HONG KONG;
1156288
Taking Care of Hip Fractures: 12 Years of Practicein France (1998-2009)
Introduction: Hip fracture is a major concern for public health: immediate andone-year mortality remains high and, despite extended intensive rehabilitation care,patients frequently suffer from diminished abilities. Ageing of the population addsto the burden of this pathology on the health care system. Looking at the long-timeevolution of hip fracture incidence and treatment will allow possible improvementsfor the future.
Methods: Based on the medico-administrative data bases, which cover all the publicand private French hospitals, this study looked at the 1998-2009 period.
Patients 55 years or older, discharged from acute care hospital with the primarydiagnosis of hip fracture (S72.0, S72.1 and S72.2 ICD-10 codes) were selected, evenif they had no operation. Patients without primary diagnosis of hip fracture, but with
specific procedures (i.e. hip hemi-arthroplasty or femoral neck osteosynthesis) werealso included (<5 % of the total number of stays). Periprosthetic, peri- implant ortumoral fractures were excluded.
Results: Acute care stays increased from 75,200 in 1998 to 79,200 in 2009, mainlyfor men (+ 3,000). During the same time, standardized hospitalization rate decreasedfrom 46.2 to 36.7 for 10,000 inhabitants. This fall was much more important forwomen (55.4 to 43.2) than for men (29.5 to 25.1).
Non university public hospitals were still predominant in treatment of hip fracture,with an increasing part attaining 54 % in 2009. University hospitals increased slightly(+2 pts) while private hospitals decreased (for profit: -9 pts) since 1998.
During the same time, acute care mortality decreased from 5.7% to 4.5%. A small part(5%, stable) of the patients had no operation, often due to their bad general status(15% mortality in this group, hal f of deaths <5th day).
Considering surgical treatment, osteosynthesis increased from 51% to 55% in 12years, and prostheses lowered from 45% to 43%.

8/13/2019 2011 Montreal Conference Abstract Book
http://slidepdf.com/reader/full/2011-montreal-conference-abstract-book 127/16611
Each patient counts
2 7 t h P C S I C o n f e r e n c e | O c t o b e r 1 9 t o 2 2 , 2 0 1 1 | M o n t r é a l , Q u e b e c , C a n a d a
Types of fractures were coded in ICD10: in 2009, 36% were coded as “extracapsular”fractures (S72.1 or S72.2) and 64% as “intracapsular or not other specif ied (NOS)”(S72.0). But coding practices varied largely according to each hospital and cannot beconsidered absolutely precise.
Nevertheless, osteosynthesis was predominant for the “extracapsular coded”fractures, (94% in public hospitals and 84% in private in 2009). In this group, withall other things being equal, probability to have prosthesis increased when thepatient suffered coxarthrosis and was hospitalized in private hospitals.
For the other types of fractures (i.e. coded “intracapsular and NOS”), prosthesis waspredominant (>63%), either total or hemi- ar throplasty. Total arthroplasty was usedin 24% of this group in private for profit hospitals, 20% in private non for profit ones,15% in university hospitals and 11% in non university hospitals. With all other thingsbeing equal, probability to have total arthroplasty decreased with the age of thepatient, but doubled if coxarthrosis was present. When hospitalized in non universityhospital, probability to have total versus hemi- arthroplasty diminished.
Regional variations in hip fracture incidence are slight, but variations in treatmentmethods are more important.
Conclusions: One of the goals, when French health plan was defined in 2004,“decreasing hip fracture incidence of 10 % in 5 years”, was reached. Preventionand treatment of osteoporosis and public campaigns on falls prevention, largelydeveloped during that time, could explain a large part of these results.
But, despite professional recommendations, there are still variations in treatmentmethods among regions or categories of hospitals.
AUTHORS/INSTITUTIONS: P. Oberlin ([email protected]) ;M. Mouquet
([email protected]),BESP-DREES Ministry of Health,Paris,FRANCE
SESSION 6B—Health System Planning and Case Mix II
Episode Grouping and Assessing Appropriateness of Patient Care
Episode Grouping and Assessing Appropriateness of Patient Care will encompassa description of the methods behind episode construction specific to the ThomsonReuters Medical Episode Grouper (MEG) product.An episode is defined as a clinically
homogenous and meaningful unit of analysis that can be used to evaluate thecomplete picture of a patient’s condition by grouping together inpatient, outpatientand pharmaceutical claims data.The methods described will include an emphasis onthe disease classification system, which is centered around the clinical and severitybased methodology of Disease Staging.

8/13/2019 2011 Montreal Conference Abstract Book
http://slidepdf.com/reader/full/2011-montreal-conference-abstract-book 128/166112
= ( WX ′ – – WY
β = ( WX ′ ) – XWY
= β + ε
= + ε
= + εQ75+ .5 x (Q.
5- Q
25
Q75 1.5 (Q
75 -
25)
2 7 t h P C S I C o n f e r e n c e | O c t o b e r 1 9 t o 2 2 , 2 0 1 1 | M o n t r é a l , Q u e b e c , C a n a d a
Each patient counts
S A T U R D A Y
The use of MEG will be discussed through the illustration of various customer usescenarios.Patient level analytics that are applicable with MEG encompass thefollowing areas:
Evaluate return on disease-management programs• Analyze cost and use•Conduct provider profiling•Evaluate quality of care•Identify higher risk patients•Evaluate appropriateness of care•
An in-depth walkthrough will be given to depict how MEG can be used retrospectivelyto evaluate the appropriateness of care rendered to a patient and steps outlined forthe types of intervention that could be applicable to the scenario for the patient, theprovider of care, or the payer of care.This example illustrates not only the variationof care rendered, but also the opportunities for intervention that exist within thehealthcare continuum to ensure the rendering of appropriate and effective care.
AUTHORS/INSTITUTIONS: Tresa Staeven (tresa.staeven@thomsonreuters)Thomson Reuters
ID: 1151188
Collecting Hospital Patient Data in Ireland – The Next Generation
Introduction: A significant challenge for all hospital patient activi ty collectionsystems is to remain relevant in the dynamic area of health information systems.The on-going improvements to computer technology coupled with rapidly changinguser requirements necessitate a constant need for data systems to be upgraded andto adapt to change. This paper reports on the recent Irish experience in upgrading
the national hospital activity collection database and reviews some of the benefitsgained from this.
In Ireland, the HIPE (Hospital In-Patient Enquiry) national data collection projectcollects almost 1.5 million records on in-patient and day case activity annually from60 acute and non-acute hospitals. The information including diagnoses, proceduresand administration data is collected by trained clinical coders who input these datainto software developed and supported by the Health Research and InformationDivision at the ESRI. Collated national file data are used extensively within the ESRIfor reporting and research and are also transmitted to the Irish health authorities ona monthly basis where they are used for multiple purposes included national analysisand CASEMIX.
Methods: The previous data entry system, referred as Windows HIPE, was developedand released to all hospitals in 2000 for the collection and reporting of HIPE data.However the changing and new user requirements led to the redevelopment of thesystem using current computer technologies. The new HIPE Portal was released in2010 and one of its main aims is to facilitate greater multi-user access to the HIPEdata. The migration of the software and databases in all the hospital nationally waschallenging, taking a number of months in a phased implementation.
8/13/2019 2011 Montreal Conference Abstract Book
http://slidepdf.com/reader/full/2011-montreal-conference-abstract-book 129/16611
Each patient counts
2 7 t h P C S I C o n f e r e n c e | O c t o b e r 1 9 t o 2 2 , 2 0 1 1 | M o n t r é a l , Q u e b e c , C a n a d a
Results: The new HIPE Portal represents a major undertaking and is a platformfor future developments in the HIPE project. A new feature is a series of additionaldata collection screens, attached to HIPE records, facilitating the collection ofdetailed clinical information for a number of national specialties. The inclusion ofthese screens is one example of how the HIPE Portal is facilitating greater use of thehospital activity data in Ireland by an increasing number of stakeholders who canaccess the core HIPE data set in conjunction with these additional data. For example,the Irish national stroke register have a tailored additional screen to collect detailedinformation on patients in hospital being treated for stroke/TIA.
Conclusions: The HIPE portal builds upon the previous data entry system andsignificantly extends it, introducing an enhanced, more flexible and expandablesystem that meets the challenge of providing a robust and adaptable data collectionand reporting system. This system is needed to meet the demands of the changinghealth information systems in use in Ireland.
AUTHORS/INSTITUTIONS: P. Dunne ([email protected]);J. Hunter (joe.hunter@
esri.ie); B. McCarthy ([email protected]);S. McDermott ([email protected]);M. McKenna ([email protected]) , HRID, Esri, Dublin 1, Ireland, IRELAND;
1153029
Is the Disability Profile an Important Issue for ProjectingCosts with Aging?
Introduction: The increase of the very old that tend to be more dependent and theprevalence of more chronic diseases are likely to determine a higher prevalence ofdisability. The consequences are not only the necessity of different levels of care,but also a greater impact on public expenses.
Although many people are able to maintain high levels of physical and mentalfunctioning to very old ages, for others, the aging process results in a reducedability to live independently. Elderly that find difficulties to perform the activitiesof daily living require some type of care. One important issues to take into accountis that the disability is heterogeneous, requires different levels of care and hasdifferent consequences on social expenses.
Methods: The main objectives of this research are to characterize the disability profileof the Portuguese population over 65 years in order to identify factors that influencedisability in old age, analyze the impact of different levels of disability and point outthe necessity of defining profiles of disability in order to control public expenditures.
The data was obtained from the National Health Surveys (NHS) carried out between1987 and 2005.

8/13/2019 2011 Montreal Conference Abstract Book
http://slidepdf.com/reader/full/2011-montreal-conference-abstract-book 130/166114
= ( WX ′ – – WY
β = ( WX ′ ) – XWY
= β + ε
= + ε
= + εQ75+ .5 x (Q.
5- Q
25
Q75 1.5 (Q
75 -
25)
2 7 t h P C S I C o n f e r e n c e | O c t o b e r 1 9 t o 2 2 , 2 0 1 1 | M o n t r é a l , Q u e b e c , C a n a d a
Each patient counts
S A T U R D A Y
The study includes a characterization of those aged 65 or more and a comparisonof the results from NHS. The NHS includes questions about the performance ofthe activities of daily living . The assessment of performance on the activities ofdaily living is made by a set of questions (which evaluate each activity) that havethe same weight in the final score. This is important insofar as the number ofdisabled elderly and the type of disability they have, vary depending upon the waydisability is measured. For the purpose of the present research two major levelswere defined: No disabilities referred, and at least one disability referred. Those whowere dependent were classified as having mild disability (1 to 5), moderate disability(6 to 12) and severe disability (more than 13)
Results: For data gathered in the last health survey , the final disability scoreswere explained by a set of variables, according to the estimation of a multipleregression model.
The disability profiles that emerge from the analysis support the development ofprospective scenarios to project the economic impact of the use of long term care
on public expenditures, in the period between the base year 2010 and 2060.
Data analysis showed a predominance of females, low levels of literacy and self-perceived health status concentrated on ‘reasonable’ and ‘bad’. The analysis of long-term disabilities reveals that age, sex, education, income, some chronic illnesses andself-perception of health status are the variables that best explain the disability score(adjusted R2=0.32).
Data also shows a higher prevalence of severe disabilities such as being confinedto bed and/or dependent on feeding. The percentage of elderly that reported to haveany kind of disability reveals an average annual growth rate of -2.7% between 1987and 1995, 3.12% between 1995 and 1998 and -0.82% between 1998 and 2005.
According to the population projections until 2060, and assuming that all elderlydependent of care will actually receive it, the analysis of public expenditure showsthat spending could increase 76% if health conditions remain similar to those of thelast health survey. If a scenario of expansion of morbidity is to be observed, publicexpenditure could increase 198%. In a scenario of compression of morbidity, publicexpenditure may decline 43%, and if levels of disability were in line with the lastsurvey but with less severity, public expenditure could grow 32 %.
Conclusions: According to the data provided by the dif ferent National HealthSurveys this study shows the impossibility of identifying a clear trend in elderlyhealth and dependency profiles.
Many studies have been showing that the resources needed to support the frailelderly have a higher socioeconomic burden than health spending with aging ingeneral. Thus, this study has also shown that the disability must have a properfield of analysis and the dependency profiles must be determined in order toallocate different types of care and funding must be sustained in these profiles.
8/13/2019 2011 Montreal Conference Abstract Book
http://slidepdf.com/reader/full/2011-montreal-conference-abstract-book 131/16611
Each patient counts
2 7 t h P C S I C o n f e r e n c e | O c t o b e r 1 9 t o 2 2 , 2 0 1 1 | M o n t r é a l , Q u e b e c , C a n a d a
If we intend to make a more complete analysis of the impact of disability on publicexpenditures, the disability profile must be extended at more specific levels. The NHShave a generic view of the problem itself and should be a starting point rather than afinal element of analysis.
Many of the results are estimated according to data based on samples of households.However, household surveys may underestimate the elderly living in nursing homesand others that are not licensed as nursing homes. This research alerts to the needof surveys specially designed to the elderly that covers not only those who are livingin households but also those who receive any type of long term care.
AUTHORS/INSTITUTIONS: D.S. Nogueira ([email protected]);E.A. Reis ([email protected]) UNIDE, ISCTE-IUL, Lisboa, Lisboa, PORTUGAL;D.S. Nogueira, Speech Therapy, ESSA, Cascais, Cascais, PORTUGAL;
SESSION 6C—Cost Weight Calculations
1149283
Patient-Level Costing for the Thai Diagnosis Related Groupin Thailand: A Micro-Costing Approach
Cost estimation is important in assessing a health system’s performance. However,most of the costing system that presently exists presumes that all patients consumeexactly the same amount of resources, and little attention is paid to costs at thepatient level. Thailand has used Thai DRG for the prospective payment of inpatientcare with a closed end, but there is a growing need to have patient-level cost datato calculate relative weight.
This report presents a brief summary of the technical details involved in patient-levelcosting for Thai DRG version 5. Cost methodology focused on a provider perspective,and cost data were collected from nine hospitals in the North, Central and Northeastof Thailand. These comprised two medical school hospitals, three communityhospitals, two provincial hospitals, and two regional hospitals.
The primary data collected included the proportion of working time to apportionedlabour cost, patient demographic characteristics, and medical data from 349,275inpatients. Secondary data included hospital expenditures and the total number ofmedical services provided by each hospital unit in the fiscal year 2009. Cost analysesconsisted of four major processes.
First, hospital cost was analysed using a standard top-down approach. Cost centreidentification, direct, indirect, and total cost determination for 14 chargeable serviceunits were examined. Second, the cost-to-charge ratio (RCC) was calculated bydividing the total cost by the total charge for each of 14 service groups. Third, amicro-costing method was employed for patient-level costing. To determine cost,the charge of each service group was converted to a cost by multiplying the chargeby the corresponding RCC. This was then summed up to derive the total cost for eachpatient. Finally, all patient data were grouped into Thai DRG version 5, and then theaverage cost per admission, average cost per DRG, and RW were calculated.

8/13/2019 2011 Montreal Conference Abstract Book
http://slidepdf.com/reader/full/2011-montreal-conference-abstract-book 132/166116
= ( WX ′ – – WY
β = ( WX ′ ) – XWY
= β + ε
= + ε
= + εQ75+ .5 x (Q.
5- Q
25
Q75 1.5 (Q
75 -
25)
2 7 t h P C S I C o n f e r e n c e | O c t o b e r 1 9 t o 2 2 , 2 0 1 1 | M o n t r é a l , Q u e b e c , C a n a d a
Each patient counts
S A T U R D A Y
Recommendation: Micro-costing with a cost-to-charge ratio can be used for costestimation and calibration of the relative weight of a DRG to establish a hospitalpayment policy.
AUTHORS/INSTITUTIONS: O. Khiaocharoen ([email protected]) , Research
division, Phitsanulok Provincial Health Office, Phitsanulok, Phitsanulok, THAILAND;S. Pannarunothai ([email protected])Centre for Health Equity Monitoring (CHEM)Faculty of Medicine, Naresuan University, Muang, Phitsanulok, THAILAND;C. Zungsontiporn ([email protected]) , Central Office for HealthcareInformation, Health Systems Research Institute (HSRI) , Nonthaburi, Nonthaburi,THAILAND; A. Riewpaiboon ([email protected])Faculty of Pharmacy, Mahidol University ,Bangkok, Bangkok, THAILAND
1155487
Development of the Australian All Product Costing ProcessIntroduction: The National Hospital Costa Data Collection (NHCDC) has beenundertaken in Australia on a voluntary basis since the initial National Cost studyin 1992-93. The collection is now in its 14th annual round (2009-10) and currentlyreports over 90% of all admitted acute episodes treated in public hospitals, and 70%of all episodes in private hospitals. Most of the costs in the public sector are reportedwithin episode level cost studies (85%).
The NHCDC’s primary focus over many years has been the collection and analysisof acute inpatient admitted costs – largely because the classification was welldeveloped and the production of national cost weights for the Australian RefinedDiagnosis Related Groups (AR-DRGs) was seen as a major benefit for the industry
as a whole. Other product data such as emergency departments and outpatients hasbeen collected for several years but in the absence of robust classification systemsthere was minimal focus on the results.
Methods: In 2010 during the development of the Australian Quality Framework,the NHCDC Technical Working Group (TWG) identified problems with currentapproaches to product fractioning that could potentially result in material differencesin the full range of product costs. Historically hospitals might only cost one or twoproduct categories for the purpose of submitting data to the NHCDC. There are twoinherent risks in this approach. The first is that there are inconsistent approachesto determining the product fractions, creating potential distortions in the costingof all product classes. The second is that if all a hospital’s products were costed,
the fractioning may result in more or less than 100% of the hospital’s general ledgerexpenditure being absorbed by the costing process.

8/13/2019 2011 Montreal Conference Abstract Book
http://slidepdf.com/reader/full/2011-montreal-conference-abstract-book 133/16611
Each patient counts
2 7 t h P C S I C o n f e r e n c e | O c t o b e r 1 9 t o 2 2 , 2 0 1 1 | M o n t r é a l , Q u e b e c , C a n a d a
Results: In 2010 during the development of the Australian Quality Framework,the NHCDC Technical Working Group (TWG) identified problems with currentapproaches to product fractioning that could potentially result in material differencesin the full range of product costs. Historically hospitals might only cost one or twoproduct categories for the purpose of submitting data to the NHCDC. There are twoinherent risks in this approach. The first is that there are inconsistent approachesto determining the product fractions, creating potential distortions in the costing ofall product classes. The second is that if all a hospital’s products were costed, thefractioning may result in more or less than 100% of the hospital’s general ledgerexpenditure being absorbed by the costing process.
Conclusions: This paper will present data highlighting the distortions that can occurif individual product costing is done in isolation and the impact of differences inapproach to the treatment of non-patient products, and will discuss the developmentof the all product process and the subsequent effects on the costing results.
AUTHORS/INSTITUTIONS: K. Chudleigh ([email protected]);
J. Murray ( [email protected])Transition Office, Australian Department ofHealth and Ageing, Woden, Australian Capital Territory, AUSTRALIA;
1162385
Adjusting Non-Standardized Data to Facilitate National Reporting
Introduction: The project highlights how simple adjustments to grouping featurescan be applied to address systematic coding differences across jurisdictions. Inthe Province of Quebec data are captured such that diagnosis and interventionclassification systems are the same as the rest of the country. However, differencesin how this information is submitted to the Canadian Institute for Health Information
create fundamental reporting differences. Specifically, for data submitted from theprovince of Quebec the differentiation between significant and non-significant pre-admission comorbid conditions cannot be made whereas in the rest of the countrythis differentiation is possible. As a result, Quebec data, when grouped to CMG+significantly overestimates the diagnosis driven comorbidity adjustments, resultingin higher estimates of cost and length of stay.
Methods: To address this difference in coding standards, the diagnostic informationsubmitted by Quebec was compared to that of other jurisdictions in Canada. A simpleCMG specific modification was applied to the Quebec data to adjust the comorbiditydistribution towards that of the other jurisdictions. After careful review of data trends andoptions, the referent jurisdiction for Quebec was defined as the province of Ontario for all
but the mental health CMGs. The comorbidity level distribution in Quebec was matchedas closely as possible to the Ontario comorbidity level distribution.
8/13/2019 2011 Montreal Conference Abstract Book
http://slidepdf.com/reader/full/2011-montreal-conference-abstract-book 134/166118
= ( WX ′ – – WY
β = ( WX ′ ) – XWY
= β + ε
= + ε
= + εQ75+ .5 x (Q.
5- Q
25
Q75 1.5 (Q
75 -
25)
2 7 t h P C S I C o n f e r e n c e | O c t o b e r 1 9 t o 2 2 , 2 0 1 1 | M o n t r é a l , Q u e b e c , C a n a d a
Each patient counts
S A T U R D A Y
Results: The adjustments applied to the CMG+ logic resulted in the desireddecrease in proportion of cases assigned to comorbidity levels greater than 1inQuebec. This type of principle, when applied at a CMG or DRG level, can effectivelyremove the bias associated with data that does not conform to standards whileachieving the benefits of the other components of the case mix methodology. Analysisof the results support that the adjustments made also resulted in the desired changesto CMG+ indicators, and are comparable to this jurisdictions peer and appropriate forcomparative reporting.
Conclusions: This correction is only to reduce the portion of Quebec comorbidityadjusted cases, and allow for meaningful indicator assignment. The underlyingQuebec data, as stored in the data warehous have not been modified, and as a resultthere remain more diagnosis reported than other jurisdictions. Any analysis includingreporting of significant diagnosis codes other than the MRDx will remain higher inQuebec data.
AUTHORS/INSTITUTIONS: S. Perry ([email protected]); D. Gerson ([email protected]);
C. Homan ([email protected]); J.E. Amuah ([email protected]); D.G. Paton ([email protected]); Case Mix, Canadian Institute for Health Information, Ottawa, Ontario, CANADA
1152481
Real-Time Cost-Database - An Advantage for DRG-Tariffs andHospital Budgets
Introduction: The Danish DRG-tariffs are based on a cost-database formed bycombining activity data from the hospitals and activity based distributed accountssubmitted once a year by the hospitals to the Ministry of Interior and Health. Thequality of the cost-database has developed over the last ten years starting with datafrom only three hospitals until today where all Danish hospitals participate. However,the quality of the cost-database is still not sufficient given the importance of the DRG-tariffs in the funding of the Danish hospitals.
Thus, to improve the quality of the cost-database a project has been started to enablea real-time update of the cost-database. The goal for the next two years is that thecost-database is updated once a month with both updated activity and cost data.
Methods: The method to ensure a real-time cost-database is to expand the Ministryof Interior and Health database containing activity data from the hospitals. It isimportant to have a steady flow of data that describes the treatment and proceduresprovided at the hospitals. At the same time it is important to have a dialog with the
hospitals on how to raise the quality of the activity based distributed accounts.
Results: The motivation for the project is to make the cost-database more relevant forthe hospitals in their day to day budgeting etc., and hereby create an incentive for thehospitals to ensure correct information in the distributed activity based accounts.
8/13/2019 2011 Montreal Conference Abstract Book
http://slidepdf.com/reader/full/2011-montreal-conference-abstract-book 135/16611
Each patient counts
2 7 t h P C S I C o n f e r e n c e | O c t o b e r 1 9 t o 2 2 , 2 0 1 1 | M o n t r é a l , Q u e b e c , C a n a d a
Conclusions: The Ministry of Interior and Health sees three advantages from thisproject. Firstly more accurate DRG-tariffs, secondly better information for eachhospital on there unit cost of their production and finally a good benchmarking toolthat can encourage best practice to be shared between hospitals.
AUTHORS/INSTITUTIONS: M.F. Larsen ([email protected])Department of Healtheconomics, Ministry of Interior and Health, Copenhagen, DENMARK;
SESSION 6D—Care Quality and Case Mix II
1151636
Measurement of the Elderly's Participation in the Community -New Domain of Quality of Life Becomes Measurable
Introduction: The goal of community based care for the elderly persons is to
retain their activity and participation levels in the community. Aim of this study is toincorporate activity and participation domain of the ICF as a goal of rehabilitationfor case-management. Since PCSI 2009, the authors has constructed health-measurement scales for elderly persons using the ICF concept and its codes. Thisyear, we have added participation in these scales.
Methods: To construct a care-management tool based on the ICF, we developedlist of participation in three domains, leisure activity (12 items such as watching TV),social participation (7 items such as participation in voting) and communication (9item such as conversation with friends) . The Participants were 3499 elderly personsusing institutional or day services of long-term care insurance in Japan. Raschanalysis was performed with RUMM2030 software.
Results: Data were obtained from 1590 institutionalized (man 317, female 1273,average age 86) and 1818 day service users (man 317, female 1041 average age 81).Of these randomly selected 300 data were used for Rasch analysis. Table 1 showsthe location and item fit of leisure activity. Traveling was the most difficult item, whileWatching TV was the easiest items.
Conclusions: Most of the participation related items of leisure, social activity andcommunication showed good fit to the Rasch model and therefore these items canbe used for scaling participation of the elderly persons. With this new measurementscales, health care professionals can now count participation in their care-managementmodel. When we use conventional ADL assessments, such as FIM or the Barthel index,
users can only determine whether they require help for a certain disability, such as bedtransfer or toileting. With these new tools, we can now have a clear image of whetherpatients are participating in leisure, social activity or communication.
AUTHORS/INSTITUTIONS: J. Okochi (PXU14045@nif ty.com)TatsumanosatoGeriatric Health Facility, Daito Osaka, Osaka, JAPAN;

8/13/2019 2011 Montreal Conference Abstract Book
http://slidepdf.com/reader/full/2011-montreal-conference-abstract-book 136/166120
= ( WX ′ – – WY
β = ( WX ′ ) – XWY
= β + ε
= + ε
= + εQ75+ .5 x (Q.
5- Q
25
Q75 1.5 (Q
75 -
25)
2 7 t h P C S I C o n f e r e n c e | O c t o b e r 1 9 t o 2 2 , 2 0 1 1 | M o n t r é a l , Q u e b e c , C a n a d a
Each patient counts
S A T U R D A Y
1152756
Evaluating quality of care in Hong Kong through identification ofPotentially Preventable Readmissions within the current unplanned
readmissions indicator frameworkIntroduction: Potentially preventable readmissions (defined as readmissions thatcould likely have been prevented by better care during the initial admission, improveddischarge planning, or improved post-discharge care) can provide important hospitalquality information. and is compared overall and at hospital cluster level with thecurrently used indicator in Hong Kong: the unplanned readmission indicator.
Methods: We used all 2010 acute care admissions, 590,247 stays from all 22major acute hospitals of Hong Kong, collapsed in 7 hospital clusters. We used thePotentially Preventable Readmissions (PPR) from 3M Inc. as the method to designatehospital readmissions within 30 days of an initial admission (IA) as preventableor not. The PPR method necessitates the All-Patient Refined Diagnosis Related
Groups (APR DRGs), a grouping classification from the same developers of theInternational Refined DRGs (IRDRG), currently used to group and measure case-mixin Hong Kong. Hence, we examine all possible combinations of categories of IAsand readmissions. The readmission is defined as potentially preventable if there isa plausible clinical relationship between the patient’s APR DRG during the IA and the APR DRG during the readmission. (HCF Review 2008; 30;75-91). The US Florida statepublishes state-wide adjusted PPR rates for public hospitals and we use its 2008norm to compare with our PPR rates.(www.floridahealthfinder.gov/compareCare/SelectProcedureCondition.aspx).
Some limitation in the comparison with the Florida norm is warranted given therelatively high number of ungroupable stays in the APRDRG classification , 43657
stays or 7.4% of all cases. This may be due to post-coding mapping using valid codesfrom different years, this being acceptable by the IRDRG grouper but not acceptedby the APRDRG grouper.
The Hong Kong Hospital Authority (HA) used unplanned re-admissions for acutecare as an important performance indicator for several years. However in 2010,HA introduced a new definition of “unplanned readmissions” to more closelylink performance to specific hospitals. Under this new definition an unplannedreadmission is documented when an acute admission occurs through the emergencydepartment within 28 days and when the admission specialty of the subsequentepisode is the same as the discharge specialty of the initial admission.
Results: Using the current HA indicator, in 2010, overall crude unplannedreadmission rate is 10.4% with a range between 8.2% and 11.4% by hospital cluster.The observed PPR rate is 8.74% (34 352 PPR/ 392 958 “at risk” stays (once logicalclinical exclusions are applied); and between 6.9 and 10.4% by hospital cluster.

8/13/2019 2011 Montreal Conference Abstract Book
http://slidepdf.com/reader/full/2011-montreal-conference-abstract-book 137/16612
Each patient counts
2 7 t h P C S I C o n f e r e n c e | O c t o b e r 1 9 t o 2 2 , 2 0 1 1 | M o n t r é a l , Q u e b e c , C a n a d a
The indirect standardized rate (using Florida norm) is 1.52 ( cluster range: 1.24 to 1.73).In ranking the best cluster in PPR is third using URR; the less performing is the same;two cluster change 2 ranks or more.
Conclusions: We do observe a significant reduction of the percentage of clinically
defined potentially preventable readmissions in relation to the broader, but lessspecific, unplanned readmission rate (URR).
Quality indicator measuring readmission rate is important. The current measurementof unplanned readmissions in Hong Kong may benefit from refinements to identifyclinically related potentially preventable readmissions
AUTHORS/INSTITUTIONS: M. Berlinguet, International Business Unit, 3M HIS,Wallingford, CT;H. Lee, Chief Manager Cluster Performance , Hospital Authority, HONG KONG;L. Wang, Casemix Project Assistant, Hospital Authority, HONG KONG;K. Mitchell, , 3M Health Information Systems, Atlanta, GA;
1152332
Potentially Preventables Readmissions in Madrid
Introduction: Readmissions are an important quality of care problem and animportant cost to the region. In Madrid the current official definition before this studywas any urgent readmission that occurs within 30 days in the same major DiagnosticCategory in same hospital. We evaluate here an alternate method on all public 2009Madrilenian acute care hospitalizations within all public hospitals.
Methods: Potentially Preventable Readmissions (PPR) methodology from 3M Inc.
enables to identify readmissions who have a clinical relationship with the previousinitial admission within a given interval of time and is identified only if the subsequentepisode may be preventable. Then, readmission chains are created, namely initialadmissions followed by readmissions that are in same time interval (either 15 or30 days) and are clinically linked and not planned (transfers to another acute carefacility). The All Patient Refined DRG (APR DRG) classification served as the granularunit in the matrix to link initial admission to following readmission as clinically relevantor not. Out of the close to 98,000 possible combinations, less than 24,000 aredeemed associated clinically by an expert group of clinicians who helped buildthe logic of the system.
Results: First,10,3% of 482,240 discharges were discarded : of these, 5% were related
to HIV infections, 59% to malignant cancers (not all cancers discharges were excluded),21% for neonates admissions, 15% other exclusions, and 1 % due to discharges againstmedical advice. Within an interval of 30 days for readmissions within same hospital, ofthe remaining 431123 discharges (89,4% after exclusions out), 91% were not followedby a readmission, 4,2% initiated a chain, and 5,2% could be considered as PotentiallyPreventable Readmissions(PPR): 18,136 such chains resulted in 22,254 readmissions foran average of 1,23 PPRs per chain. 84,3% of these readmissions chains had only onereadmission, 11,9% had 2 PPRs, 2,5% had 3 PPRs.

8/13/2019 2011 Montreal Conference Abstract Book
http://slidepdf.com/reader/full/2011-montreal-conference-abstract-book 138/166122
= ( WX ′ – – WY
β = ( WX ′ ) – XWY
= β + ε
= + ε
= + εQ75+ .5 x (Q.
5- Q
25
Q75 1.5 (Q
75 -
25)
2 7 t h P C S I C o n f e r e n c e | O c t o b e r 1 9 t o 2 2 , 2 0 1 1 | M o n t r é a l , Q u e b e c , C a n a d a
Each patient counts
S A T U R D A Y
Overall, the percentage of PPRs reduces from 4,7% of all discharges to 3,2% for timeinterval 30 days and 15 days. The PPR rate for 30 days interval increases from 4,7%if only within same hospital to 5,2% across hospitals.
Table 1 documents, for 30 days interval and across hospital, by Major Diagnostic
Category(MDC)the most frequent initial admissions, as well the PPRs. The clinicalrelationship/ reason for the subsequent readmission is also identified for the sub-total (85,4% of total ) of PPRs due to a medical problem (rather than a surgicalissue): readmission for a medical stay (as opposed to surgical stay); PPR becauseof continuation or recurrence of a previous episode, 32,8%; medical complicationfrom a previous admission, 24,4%; sensitive conditions that could have been takencare by an ambulatory encounter rather than a readmission as defined by AHRQstandards, 16.6%; worsening of another chronic problem , 11,7%. Of the sub-totalof PPRs that are rather linked to a surgical episode (9,6 % of total), 5,5% are dueto a surgical process with a continuation or recurrence of a previous episode; and3,5% are due to a complication of a previous surgical episode. Finally, 5,5% of totalof PPRs are linked to a mental health problem or substance abuse. Table 2 providesthe distribution of the most frequent PPRs (out of total of 222 PPRs) for one initialDRG (Cardiac Insufficiency) for one hospital. The number of excess days translatesinto 513 beds. These results are available for each clinical service of each hospital.
Conclusions: Potentially Preventable Readmissions (PPR) enables to identifyhospitals, clinical services and processes where the readmission rate is superiorto what might be expected.
AUTHORS/INSTITUTIONS: A. Albarracín ([email protected]),Health Information Systems Department, Madrid Health Services, Madrid, MadridCommunity, SPAIN;M. Berlinguet ([email protected])International Business Unit, 3M HIS,
Wallingford, CT;O. Weiser ([email protected]) HIS-Europe, 3M , Frankfurt, GERMANY;
A costing study of neonatal intensive care for newborn infantswith birth weight between 500 – 1500grams.
Background: Premature birth and extremely low birth-weight (ELBW) is a wellrecognised financial burden on health care in the developed world. In this eraof increasing healthcare costs, the role of economic evaluations has becomeincreasingly important. The purpose of this study was to investigate whether thetotal cost estimate of care provided for newborn infants, with birth weight between
500 – 1500grams remains reliable, when the cost components of gross costing werereplaced by cost components of microcosting and accurately calculate the cost ofextremely low birth weight infants (ELBW), in neonatal intensive care in a tertiary careteaching hospital. Secondly the objective of this study was to determine if currentlevels of funding accurately reflect the costs incurred in providing care for theseinfants by comparing current funding calculated using Diagnostic Related Groupsand a microcosting approach.

8/13/2019 2011 Montreal Conference Abstract Book
http://slidepdf.com/reader/full/2011-montreal-conference-abstract-book 139/16612
Each patient counts
2 7 t h P C S I C o n f e r e n c e | O c t o b e r 1 9 t o 2 2 , 2 0 1 1 | M o n t r é a l , Q u e b e c , C a n a d a
Study’s Aim: The aims of the study are to
(a) Investigate whether the total cost estimate of newborn infants, with birth weightbetween 500 and 1500grams remains reliable, when the cost components of grosscosting were replaced by cost components of microcosting.
Accurately calculate the cost of caring for very low birth weight infants, in theneonatal intensive care unit in a tertiary referral teaching hospital.
Assess the feasibility of microcosting for use in a neonatal population
.Research Method: A quantitative design was chosen for the purpose of undertakingthis study and a non-experimental, retrospective design was used. A randomsample of infants was selected under three birth weight categories (500g -1,000g,1,001g to 1,250g and 1,251g to 1,500g). The main source of data was the individualpatient healthcare records. A template was devised to capture all the interventionsundertaken and each one was individually costed.
Results: A vast amount of data was collected and analysed. Microcosting assignshigher overall costs to the care of infants in two of the three birth weight categoriesused (500g to 1,000 g and 1,001g to 1,250g). Diagnostic related group (DRG)reimbursement is greater than overall microcosting for infants in the 1,251g to 1,500gbirth weight category. However, the overall costs attributable to caring for infants inthese groups increase with the lowering of the birth weight category. The intensityof care required (intensive, high dependency or special care) and the length of stayhave the greatest impact on costs. Therefore, by applying a bottom up approach tocosting, more reliable total cost estimates can be ascertained.
Conclusion: Microcosting is more reliable and reflective of actual costs than thecurrent system of gross costing. There was an overall dif ference of 11.09% between
the gross costing and microcosting methods applied to the infants in the study. Thehistorical funding basis is inadequate. The feasibility of microcosting care for very lowbirth weight infants is possible and worthwhile. A form of prospective, activity basedpayments and casemix funding is the recommended financing method of very lowbirth weight infants.
Author/Institution: Kathy Conway (2010) M.Sc. In Health Services Management,Trinity College, Dublin.

8/13/2019 2011 Montreal Conference Abstract Book
http://slidepdf.com/reader/full/2011-montreal-conference-abstract-book 140/166124
= ( WX ′ – – WY
β = ( WX ′ ) – XWY
= β + ε
= + ε
= + εQ75+ .5 x (Q.
5- Q
25
Q75 1.5 (Q
75 -
25)
2 7 t h P C S I C o n f e r e n c e | O c t o b e r 1 9 t o 2 2 , 2 0 1 1 | M o n t r é a l , Q u e b e c , C a n a d a
Each patient counts
Posters
1150768
Diagnoses-Related Procedure Bundles in Outpatient Care –Results from a Research Project Using Secondary Data
Introduction: Currently, one aspect of the discussion concerning healthcarereform in Austria focuses on strengthening the provision of ambulatory healthcare.Consequently, legal changes aim at fostering the development of new structuresin healthcare (group practices), as well as implementing alternative paymentmechanisms for those entities.
In 2009, we started a research project in the field of diagnosis-related mechanismsof payment for ambulatory care. The project focuses on episodes of care for chronic
diseases. The main objectives of this project are to show the feasibility of theavailable administrative healthcare data, to develop a statistical toolkit in order toidentify diagnoses-related procedure bundles in ambulatory care, and to calculatecosts for the procedure bundles.
Methods: We use a pseudonymous dataset that contains a full record of ambulatoryhealth data as well as hospital data for 2006–2007. The data is linked using a uniquepatient identifier.
When calculating procedure bundles, only costly procedures from outpatient carewere included. Therefore, we used descriptive statistics to identify the relevantprocedures for each specialty. Diagnoses were obtained from ATC-Codes ofprescription data and were assigned to each patient via his or her personal record
of medication. We limited our research to a number of common chronic diseases(e.g., diabetes, COPD/asthma, dementia).
Three different approaches were used to include patients in the data sample:Patients with no other disease than the disease in question for the time1.t0 +/- 6 monthsPatients with no other disease than the disease in question for the time2.t0 +/- 1 month All patients having the disease in question for the time t0 regardless of3.any other disease
Next, we applied linear regression to identify those procedures that are significantly
related to the single diagnoses included in the sample (within a time span of-90 days/ +180 days from the diagnosis). The signif icance was measured bythe frequency of a particular procedure with respect to all diagnoses of a diseaseincluded in the sample.
Finally, we defined procedure bundles as all procedures to the left of the mostsignificant difference between two adjacent procedures.

8/13/2019 2011 Montreal Conference Abstract Book
http://slidepdf.com/reader/full/2011-montreal-conference-abstract-book 141/16612
Each patient counts
2 7 t h P C S I C o n f e r e n c e | O c t o b e r 1 9 t o 2 2 , 2 0 1 1 | M o n t r é a l , Q u e b e c , C a n a d a
Results: Results show that for most of the diseases we considered procedurebundles can be identified using the methods described above. To a large extent,significant procedures for each diagnosis represent technical procedures, suchas determining laboratory values or ECGs. In addition, expected non-technicalprocedures (e.g., eye treatment for diabetes patients) could be allocated to therelevant diagnoses. However, we were unable to find feasible bundles for diagnoseswhere “quasi-unique” ATC-Codes do not exist. The bundles did not vary substantiallyacross the three methods used to include diagnoses in the sample.
Conclusions: The results obtained can be seen as the first step towards describingprocedure bundles related to a number of chronic diseases. In the next step,experts will need to refine the bundles. These bundles provide a solid ground for thecalculation of costs for diagnosis-related procedure bundles in ambulatory care. Themethods used can be implemented in other data sets as well, and are therefore notlimited to the context of the Austrian healthcare system.
AUTHORS/INSTITUTIONS: N. Pfeffer ([email protected]); A. Weisser
([email protected]); G. Endel ([email protected]); C.Scholler ([email protected]) Main Association of the Austrian SocialInsurance Institutions, Vienna, AUSTRIA A. Eisl ([email protected]) University of Economics and Business, Vienna, AUSTRIAP. Filzmoser ([email protected]) Vienna University of Technology, Vienna, AUSTRIA
1164537
The Care Coordination Program: A Virtually Integrated CareDelivery Model for Complex, High-Needs Patients
Background: The South African healthcare sector is fragmented.
The increasing prominence of non-communicable, or chronic, diseases in both theprivate and public healthcare sectors contributes to the country’s complex and costly“quadruple burden of disease” (the others being HIV/AIDS, tuberculosis, maternal andchild mortality, and violence). These chronic diseases, once they have progressed,are inherently difficult to manage due to their underlying psychosocial componentsand their characteristically complex co-morbidities. High costs, without the desiredimproved clinical outcomes, are common.
Elsewhere in the world, such as in the United States, where similar fragmentedsystems exist, new care-delivery models have emerged to better manage patientswith complex conditions. These include vertical payer-provider integration, patient-
centered medical homes, and accountable care organizations. Enablers of similarstructural reforms are lacking in South Africa, however, where regulatory rules barthe employment of salaried doctors by hospital networks. Moreover, a loomingnation-wide dearth of healthcare professionals diminishes the potential for systemicstructural changes to the status quo.
8/13/2019 2011 Montreal Conference Abstract Book
http://slidepdf.com/reader/full/2011-montreal-conference-abstract-book 142/166

8/13/2019 2011 Montreal Conference Abstract Book
http://slidepdf.com/reader/full/2011-montreal-conference-abstract-book 143/16612
Each patient counts
2 7 t h P C S I C o n f e r e n c e | O c t o b e r 1 9 t o 2 2 , 2 0 1 1 | M o n t r é a l , Q u e b e c , C a n a d a
Figure 1: Disease Burden Index for CCP members compared to the rest of theDH population
Figure 2: 2010 Average FIM score gains across clinical impairment class
AUTHORS/INSTITUTIONS: R. Moodley Naidoo ([email protected]);
L. Steenkamp, ([email protected])Risk and Quality Management,Discovery Health, Sandton, SOUTH AFRICA
1143269

8/13/2019 2011 Montreal Conference Abstract Book
http://slidepdf.com/reader/full/2011-montreal-conference-abstract-book 144/166128
= ( WX ′ – – WY
β = ( WX ′ ) – XWY
= β + ε
= + ε
= + εQ75+ .5 x (Q.
5- Q
25
Q75 1.5 (Q
75 -
25)
2 7 t h P C S I C o n f e r e n c e | O c t o b e r 1 9 t o 2 2 , 2 0 1 1 | M o n t r é a l , Q u e b e c , C a n a d a
Each patient counts
Superiority of Guideline-adherent Initial Intravenous AntibioticTherapy for Hospital-acquired/Ventilator-associated Pneumonia inRegard of Outcome and Costs demonstrated by Routine Casemixand Cost Calculation Data
Introduction: Hospital-acquired pneumonia (HAP) often occurring as ventilator-associated pneumonia (VAP) is the most frequent hospital infection in intensivecare units (ICU). Early adequate antimicrobial therapy is an essential determinant ofclinical outcome. Organizations like the German PEG or ATS/IDSA provide guidelinesfor the initial calculated treatment in the absence of pathogen identification. Weconducted a retrospective chart review for patients with HAP/VAP based on chartreviews, casemix and cost data and assessed whether the initial intravenousantibiotic therapy (IIAT) was adequate according to the PEG guidelines.
Methods: We collected data from 5 tertiary care hospitals. Electronic data filteringidentified 895 patients with potential HAP/VAP from routine casemix data. After chart
review we finally identified 221 patients meeting the definition of HAP/VAP. Primarystudy endpoints were clinical improvement, survival and length of stay. Secondaryendpoints included duration of mechanical ventilation, total costs, costs incurredon the intensive care unit (ICU), costs incurred on general wards and drug costs.
Results: We found that 107 patients received adequate initial intravenous antibiotictherapy (IIAT) vs. 114 with inadequate IIAT. Baseline characteristics of both groupsrevealed no significant differences and good comparability. Clinical improvementwas 64% over all patients and 82% (85/104) in the subpopulation with adequateIIAT while only 47% (48/103) inadequately treated patients improved (p< 0.001).The odds ratio of therapeutic success with GA versus NGA treatment was 5.821(p<0.001, [95% CI: 2.712-12.497]). Survival was 80% for the total population, 86%
in the adequately treated (92/107) and 74% in the inadequately treated subpopulation(p = 0.021). The odds ratio of mortali ty for GA vs. NGA treatment was 0.565(p=0.117, [95% CI: 0.276-1.155]). Adequately treated patients had a significantlyshorter length of stay (LOS) (23.9 vs. 28.3 days; p = 0.022), require significantly lesshours of mechanical ventilation (175 vs. 274; p = 0.001), incurred lower total costs(EUR 28,033 vs. EUR 36,139, p = 0.006) and lower ICU-related costs (EUR 13,308vs. EUR 18,666, p = 0.003). The most frequent types of inadequate therapy weremonotherapy instead of combination therapy, wrong type of penicillin and wrongtype of cephalosporin.
Conclusions: Guideline-adherent initial intravenous antibiotic therapy is clinicallysuperior, saves lives and is cheaper than non-guideline adherent therapy. Using a
CPRS score can be a useful tool to determine the right choice of initial intravenousantibiotic therapy. The net effect on the German healthcare system per year isestimated at up to 2,042 lives and EUR 125,819,000 saved if guideline-adherentinitial therapy for HAP/VAP were established in all German ICUs.
AUTHORS: Mr.Rolf F. Grube ([email protected]); Dr. Michael H. Wilke ([email protected]);Dr.Klaus-Friedrich Bodmann ([email protected])
8/13/2019 2011 Montreal Conference Abstract Book
http://slidepdf.com/reader/full/2011-montreal-conference-abstract-book 145/16612
Each patient counts
2 7 t h P C S I C o n f e r e n c e | O c t o b e r 1 9 t o 2 2 , 2 0 1 1 | M o n t r é a l , Q u e b e c , C a n a d a
1143297
Estimation of the Cost of Hospital-Acquired Infectionsin Gastrectomy Patients: An Exploration of Methodology
Introduction: Hospital-Acquired Infections (HAIs) result in higher morbidity andmortality in patients, as well as a greater economic burden to patients, providers andpayers. Problems associated with these infections are further complicated with therise of multidrug-resistant pathogens in hospitals. While various interventions havebeen shown to be effective in reducing infections, limitations in available resourcesmean that the cost-effectiveness of these interventions must be ensured.
Cost of HAI (COHAI) estimation studies have therefore become increasingly relevant,and this has been reflected in the proliferation in such studies in the past few years.These estimates can be used directly to assess the magnitude of the infectionburden, or in downstream applications such as cost-effectiveness analyses ofinfection control measures. The accuracy of these estimates is of critical importance,
as inaccuracies can introduce bias and affect intervention development. However,a review of the existing literature has shown a large degree of variation in COHAIestimation methodologies, ranging from simple comparisons between uninfectedand infected patients to the highly complex using various statistical measures.
Different analytical methodologies may result in different COHAI estimates, therebygiving rise to problems of accuracy. The objective of this study was to estimate theadditional economic burden associated with HAIs in a large-scale multi-institutionalanalysis, and to explore the difference in unadjusted and case-mix adjusted COHAIestimates.
Methods: We utilized hospital administrative data from the Quality Indicator/
Improvement Project (QIP), which is a program administrated by our department.In this program, member hospitals from all around Japan voluntarily provide theiradministrative data for analysis. These data include claims data for diagnoses andprocedures for each admission, with records of all medications administered on adaily basis.
Our study sample included 14,282 patients with stomach cancer who weredischarged from 257 QIP member hospitals f rom April 2007 to April 2010. Minorsbelow 20 years of age at the point of admission, patients with below eight days andover 90 days of length of hospital stay (LOS), patients who had other surgeries beforegastrectomy, and patients who were administered antibiotics before gastrectomy.Hospitals with fewer than 30 cases were also excluded from analysis.
Post-surgical HAIs were identified using a novel method based on antibiotic utilizationpatterns that we had developed.
COHAI was measured in Japanese Yen, and converted to US Dollars usingPurchasing Power Parities. We compared COHAI estimates produced using a simplecomparison (with no case-mix adjustments), with those produced using regressionanalysis (which take patient case-mix variations into account). These estimates wereproduced for the entire sample, as well as at the hospital level.
8/13/2019 2011 Montreal Conference Abstract Book
http://slidepdf.com/reader/full/2011-montreal-conference-abstract-book 146/166
8/13/2019 2011 Montreal Conference Abstract Book
http://slidepdf.com/reader/full/2011-montreal-conference-abstract-book 147/16613
Each patient counts
2 7 t h P C S I C o n f e r e n c e | O c t o b e r 1 9 t o 2 2 , 2 0 1 1 | M o n t r é a l , Q u e b e c , C a n a d a
Critical care could not be delivered adequately without electric power to providedirect support to the cardiac, respiratory and renal systems of some patients, jeopardizing their survival. Physicians and policy-makers were responsible fortransporting them to the appropriate nearby hospitals that were still able tomanage such case-mixes and to respond to the unexpected burden imposedby these transfers.
To process such interventions without any delay in future disasters, policy-makersneed to maintain awareness of the critical care resources available among hospitalsin their geographic area. In addition, they need to be able to predict the incrementalburdens in the event that one or more hospitals are subject to the disaster, obligedto stop critical care delivery, and required to transfer their patients to other nearbyhospitals. In such situations, the administrative database and the geographicalinformation system (GIS) are promising tools for contributing to these predictions,particularly when the database contains the patient postal code and the date orquantity of medical care items.
We explored the feasibility of using the Japanese administrative database formedical care planning in response to a disaster. In this study, assuming that onthe day of October xx, 2010, the use of critical care devices for ventilation (VENT)was interrupted, we measured the impact on the critical care burden of the nearbyhospitals that would be expected to receive the critical care patients from thehospitals involved in the disaster.
Methods: Using the Japanese administrative database in 2010 from July toDecember including 3,181,847 hospitalized patients among 952 hospitals thatvoluntarily participated in our research, we analyzed VENT administered in Iwate,Miyagi and Fukushima prefectures on October xx, 2010. These three prefectureswere so heavily harmed that the number of victims and missing people was very
high. We quantified the maximum daily volume of VENT during the 6 study monthsand calculated the maximum affordable capacity for the number of VENT. We alsoestimated the VENT volume administered on October xx.
Using the GIS, we measured the straight line distances (SLDs; Km) between thehospitals and identified the hospitals most adjacent to those damaged in the threeprefectures. Supposing that VENT patients were transferred to the closest hospitals,we measured the increase in numbers of VENT patients and the operating rate(%) out of the maximum affordable number of VENT. The averaged SLD betweenhospitals and patient postal codes was compared before and after the simulateddisaster. The additional number of VENT patients received from adjacent hospitalsand the additional average SLD (Km) per patient were also examined for every
hospital most adjacent to the damaged hospitals.

8/13/2019 2011 Montreal Conference Abstract Book
http://slidepdf.com/reader/full/2011-montreal-conference-abstract-book 148/166

8/13/2019 2011 Montreal Conference Abstract Book
http://slidepdf.com/reader/full/2011-montreal-conference-abstract-book 149/16613
Each patient counts
2 7 t h P C S I C o n f e r e n c e | O c t o b e r 1 9 t o 2 2 , 2 0 1 1 | M o n t r é a l , Q u e b e c , C a n a d a
Results: The results are comparable with the experience of other countries thatadopted DRGs. In our case, we notice that the number of acute care cases increasedthrough the five-year period, and parallel so does the number of treated patients. Thetrend is steadier in terms of identifying the average DRG weight trough those 5 years.In terms of the length of stay drops rather quickly between 2003 and 2008; whereasthe rate of day care in 2003, 6,70% increases to 10,56 % in 2008. When it comes toreferrals to other hospitals, data illustrate that there the rate between 2003 and 2008is rather stable, 2,26% in 2003 and 2,47% in 2008; whereas discharging patientshome remains at a constant between 93,92% in 2003, and slightly drops in 2008 to94,73% of patients, who go directly home.
Conclusions: When introducing DRGs the MoH's Project on the Health SectorManagement who introduced DRGs did envisage these changes in the healthcaresystem: drop in the length of stay, increased number of cases and treated patients,and most importantly an increase in the rate of day care.
AUTHORS: Irena Zupanc;Anne-Marie Yazbeck ([email protected])
1152846
Management of Rheumatoid Arthritis Patients in Romania
Introduction: Rheumatoid Arthritis is a chronic disease with long evolution whichproduces important consequences at the level of patient and society, a disease withseveral available therapeutic options, but not all of them having the same effects.The therapeutic measures are applied on a long term basis and they are, in most of thetime, the result of medical practice guidelines developed at local or international level.
Methods: The authors made a revision of the local and international speciality
literature regarding rheumatoid arthritis and studied the legal framework in Romaniaregarding the medical practice guidelines, therapeutic protocols and treatmentreimbursement conditions.
Results: In Romania the management of patient with rheumatoid arthritis is basedon several clinical and administrative decisions, reflected into the medical practiceguidelines and therapeutic protocols with normative value. Because of high costs,the availability of biologic therapies for the rheumatoid arthritis patients is restrictedonly to these patients with approved treatment by the public payer, according tospecific therapeutic protocols developed by the Ministry of Health and National
8/13/2019 2011 Montreal Conference Abstract Book
http://slidepdf.com/reader/full/2011-montreal-conference-abstract-book 150/166134
= ( WX ′ – – WY
β = ( WX ′ ) – XWY
= β + ε
= + ε
= + εQ75+ .5 x (Q.
5- Q
25
Q75 1.5 (Q
75 -
25)
2 7 t h P C S I C o n f e r e n c e | O c t o b e r 1 9 t o 2 2 , 2 0 1 1 | M o n t r é a l , Q u e b e c , C a n a d a
Each patient counts
Health Insurance House. The limited available financial resources in the social healthinsurance system create the conditions for waiting lists of the patients with medicalrecommendation for expensive therapies.
Conclusions: The management of patient with rheumatoid arthritis is a complex
process related with patient factors, but also with the health system functionality.In Romania, the usage of newly and expensive treatments requires the utilizationof some medical practice guidelines and therapeutic protocols which shouldrely more and more on the effectiveness rather than the efficacy of treatments,considering the fact that clinical data regarding effectiveness of drugs treatmentsstarted to be available.
AUTHORS: Dr.Paul Ciprian Radu ([email protected]); Mirela Sandru, M.D.([email protected]); Dr.Ioan Ancuta, M.D. ([email protected]).
(ID: 1152873)Changing the Game in Physician Profiling
Introduction: The SA voluntary private healthcare sector is characterized by systemiccost increases significantly higher than general inflation and economic growth. Thecosts are largely driven by escalating clinician, pharmaceutical and private hospitalcosts. In 2009, the overall claims paid out to specialist healthcare providers paid outby the health insurer for which work, Discovery Health, increased by 19.1% whencompared to 2008 against a backdrop of 6% general inflation. Discovery Healthprovides insurance cover to over 2, 5 million people.
Physician profiling has emerged as one of the effective levers to control healthcare
costs since it makes clear differences in individual doctor practice relative to theirpeers. This approach requires a method for analyzing physicians’ costs and aclassification system for determining which physicians have higher relative costs.Rather than using this tool as a punitive mechanism, we decided to collaborate withhealthcare providers, providing them with a platform to participate in the developmentand improvement of the profiles. This approach not only leads to robust profiling butincreases the likelihood of altering provider behaviour.
Methods: Three main risk factors used in provider profiles are:
Discovery Episode Groups (DEGs:
The Discovery Episode Groups is software technology using proprietary logic to
organize claims data about individual patients into diagnostically and chronologicallyrelated episodes of care. They are initiated by a health care practitioner when apatient first presents for care and then submits a claim with related diagnosis andprocedure codes.
8/13/2019 2011 Montreal Conference Abstract Book
http://slidepdf.com/reader/full/2011-montreal-conference-abstract-book 151/16613
Each patient counts
2 7 t h P C S I C o n f e r e n c e | O c t o b e r 1 9 t o 2 2 , 2 0 1 1 | M o n t r é a l , Q u e b e c , C a n a d a
The Johns Hopkins Adjusted Clinical Group (ACG) Case-Mix System, which Systemclusters patients with similar co-morbidities into groups that have similar resourcerequirements and clinical characteristics. Mutually exclusive groups of patients arethen categorized into six (6) Resource Utilisation Bands (RUBs). A grouped RUBmeasure is used in profiles with two groups for healthy to moderate users (RUB 0-3)and High & Very High users (RUB 4&5).
Plan option groups are also taken into account as each plan option offers differentaccess to clinical services.
The main measures currently used are admission rate, annual bed days and referredpathology and radiology costs. Attribution rules are used to allocate admissions andreferred costs to the provider deemed responsible for the admission or related costs.Judgments on practice efficiency are made based on a ratio of observed to expectedcosts from the tools discussed above.Profiles are peer-reviewed by a clinical advisory committee from the providerprofessional organisations before dissemination.
Results: Annual profi les are produced and outlier providers are identified usingstatistical methods. Our key principle is to direct efforts at potentially remediableutilization patterns, thus outlier individual and/or provider practices are targeted withthe intention of changing their behaviour thereby reducing healthcare expenditure. A process is in place involving coaching and mentoring of outliers by influential andrespected providers in the different disciplines.
Conclusions: Although it is early days (3 years), evidence of cost containmenthas been observed. The collaborative effort and transparency in engaging clinicianshas established a foundation of trust and a shared responsibility for sustainablehealthcare. Efficiency profiling is incomplete without quality measures and these
are being incrementally incorporated. This move will assist monitor the quality of careprovided to our members and, further unlock more potential utilization of the profiles.
AUTHORS: Dr.Nkuli Mlaba ([email protected]); Jf Bruwer ([email protected]);Dr.Roshini Moodley Naidoo ([email protected]); Mr.Darren Sweidan([email protected])
1153019
The Epidemiology of Cancer from Case Mix System Databases: A Longitudinal Approach
Introduction: The use of French Case Mix databases, apart from financial purposes,has recently been improved since a unique anonymous patient identification numberhas been created for each inpatient in case mix database. The group for cancerepidemiological observation in the Rhône-Alpes area, (ONC-EPI group) aims toestimate cancer incidence and prevalence especially by using Case Mix data withother data (arising from cancer registries, administrative databases). Improvingalgorithms for cancer case identification in the Case Mix databases is an essentialpreliminary stage.
8/13/2019 2011 Montreal Conference Abstract Book
http://slidepdf.com/reader/full/2011-montreal-conference-abstract-book 152/166136
= ( WX ′ – – WY
β = ( WX ′ ) – XWY
= β + ε
= + ε
= + εQ75+ .5 x (Q.
5- Q
25
Q75 1.5 (Q
75 -
25)
2 7 t h P C S I C o n f e r e n c e | O c t o b e r 1 9 t o 2 2 , 2 0 1 1 | M o n t r é a l , Q u e b e c , C a n a d a
Each patient counts
Methods: Remaining difficulties in the use of case mix data for epidemiologicalpurposes are related to a lack of quality of data, especially coding of diagnoses.These errors come from missing or inappropriate codes, or out of keeping withcoding rules (causing an over- or under-reporting or inconsistencies in coding overtime).
For identify cancer cases, we consider a longitudinal approach based on analysisof database over several years and using the whole information off all patient stays.The chaining over several years allows, by tracing the hospital path of the patient, todetect and correct inaccuracies, errors and missing values, and to set the beginningof the episode of care.
The case identification algorithm is specific of the cancer location. A complexselection process includes several steps:
The first step of cases selection is based on the national anonymous unique•patient identifier.The second one consists in retrieving all hospital stays for every case.•
The third step detects inconsistencies in the coding of the primary localization.• At last, an algorithm based on the ICD-10 code using the hospital admission•diagnosis is applied to rule out hospitalization unrelated to cancer.
Results: Results for breast cancer and colorectal cancer are presented showingvariations across French regions. A detailed description of the chronology andreasons for hospitalizations is described in order to know which periods show agenuine need for care.
Conclusions: A limitation of this approach is the fact that ambulatory radiotherapytreatments carried out in private for-profit hospitals were not registered in the Frenchcase mix databases because of the funding differences between public and private
institutions. Furthermore, ambulatory care (visits, hormonotherapy, ambulatorychemotherapy) were not measured by the case mix system.
Subject to adapt the selection algorithm to the national coding rules, the method maybe applied to the case mix data in other countries.
AUTHORS: Beatrice Trombert ([email protected]); O. nc-Epi Group

8/13/2019 2011 Montreal Conference Abstract Book
http://slidepdf.com/reader/full/2011-montreal-conference-abstract-book 153/166
8/13/2019 2011 Montreal Conference Abstract Book
http://slidepdf.com/reader/full/2011-montreal-conference-abstract-book 154/166138
= ( WX ′ – – WY
β = ( WX ′ ) – XWY
= β + ε
= + ε
= + εQ75+ .5 x (Q.
5- Q
25
Q75 1.5 (Q
75 -
25)
2 7 t h P C S I C o n f e r e n c e | O c t o b e r 1 9 t o 2 2 , 2 0 1 1 | M o n t r é a l , Q u e b e c , C a n a d a
Each patient counts
The PCE combines both of these accounting approaches to provide the estimatedaverage costs, using the jurisdiction-level CPWCs to bring dollar values to theresource intensity for each patient group.
Results: Outcomes, results, lessons learned
Estimated average costs per Case Mix Group (CMG) by jurisdiction and age group;1. Average length of stay by CMG by jurisdiction and age group;2.Volumes by CMG by jurisdiction and age group;3.Summary reports displaying the most frequently occurring CMGs by jurisdiction4.and age group; andSummary reports displaying the CMGs incurring the highest and lowest estimated5.in-hospital average costs by jurisdiction and age group.
Conclusions: We hope the patient cost estimator can be used as a tool to supportyour planning activities at the facility level, and if you are interested in broaderprovincial planning, we hope you can use the PCE as a good starting point fordiscussions about patient costs.
AUTHORs: .Britta Nielsen ([email protected]); Bob Ren ([email protected]); Ching Huang([email protected]); Tianyu Zhang ([email protected]); Stephanie Bonnell ([email protected])
(ID: 1141532)
Births in Slovenia in 2008; mothers and newborns
Introduction: Many cross hospital analysis of patients profiles were carried out sincethe introduction of DRGs in 2004. Maternity wards called for special attention. Usingnetwork analysis find out the description of profiles of births.
Methods: For the purpose of this study we extracted DRG case describing births(O01A-O01D and O02Z, O60A-O60C.
Results: The main finding is that there is little consistency in terms of the nature andthe number of secondary diagnosis. The patient profile is influenced by the hospitalin which mothers give birth indicating very low hospital collaboration in terms of theutilization of secondary diagnostic codes.
Conclusions: We list the second most common diagnosis overall so that we canprovide a list of recommendations: a checklist of most common secondary diagnosis.Better regulatory systems are needed in order to ensure patient safety, quality andvalidity of data and fairness in financing.
AUTHORS: Anne-Marie Yazbeck ([email protected]); Mojca Omerzu([email protected]);Dr. Michael Galsworthy ([email protected])

8/13/2019 2011 Montreal Conference Abstract Book
http://slidepdf.com/reader/full/2011-montreal-conference-abstract-book 155/16613
Each patient counts
2 7 t h P C S I C o n f e r e n c e | O c t o b e r 1 9 t o 2 2 , 2 0 1 1 | M o n t r é a l , Q u e b e c , C a n a d a
(ID: 1152734)
Health care and drug utilisation pattern in patients categorized by Adjusted Clinical Group at Buddhachinaraj Hospital, Phitsanulok
Introduction: This study was to study patterns of health care and drug utilisationclassified by Adjusted Clinical Group (ACG) and to examine variations in drugutilisation at Buddhachinaraj Hospital, Phitsanulok..
Methods: This study employed quantitative and qualitative approaches. Forquantitative study, outpatient service electronic database in the fiscal year 2009 wasused. Patients were grouped according to their morbidity of illness using ACG version9.0. Descriptive statistics were employed to present the total cost and total drug cost(Baht/year) and average total cost and total drug cost per person (Baht/person).For qualitative study, an in-depth interview with purposive sampling in providers andpatients (diabetes mellitus type 2 and hypertension) was used. The analysis of thetext and sentences from the interviews was analyzed to explore factors affecting
health care utilisation and patients’ access to drug.
Results: The total cost and drug cost were 616,092,534 Baht/year and 40,147,379 Baht/year, respectively. Average total cost and drug cost per person per year were 3,965.89Baht and 258.44 Baht, respectively. Patients perceived that medical benefit scheme,severity of disease and their knowledge of disease involved in health care utilizationand access to drug. Factors affecting the variation in drug utilisation from health careproviders perspective included severity of disease, patients’ age, medical benefitscheme, restriction of prescribing in hospital, and list of essential drugs in hospital.
Conclusions: This study showed pattern of total cost and total drug cost accordingto morbidity burden by Adjusted Clinical Group. Apart from the morbidity burden,
there were other factors that could be affect health care and drug utilisation.AUTHORS: Dr .Nilawan Upakdee, Naresuan University ([email protected])

8/13/2019 2011 Montreal Conference Abstract Book
http://slidepdf.com/reader/full/2011-montreal-conference-abstract-book 156/166
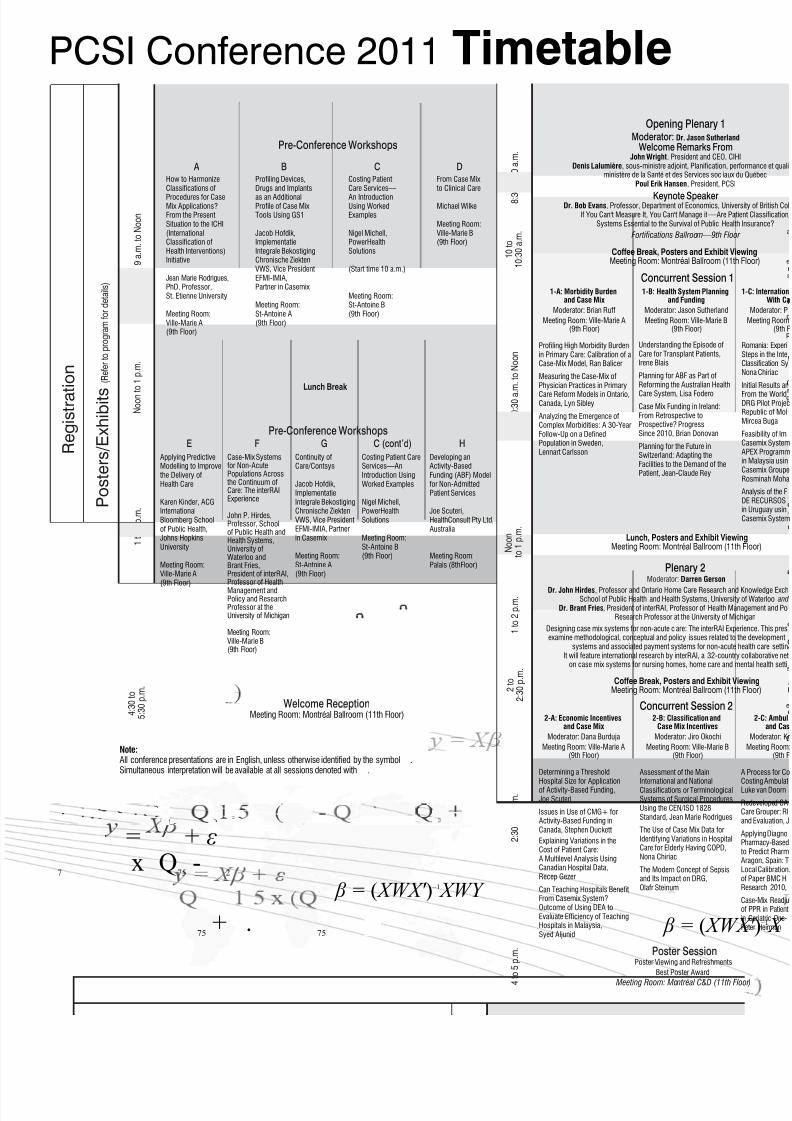
8/13/2019 2011 Montreal Conference Abstract Book
http://slidepdf.com/reader/full/2011-montreal-conference-abstract-book 157/166
PCSI Conference 2011 Timetable
β = ( XWX
= + ε
75+ .
75
25
7 x Q
75-
2
β = ( XWX ′ ) –1 XWY
9 a . m . t o N o o n
8 : 3
0 t o 1 0 a . m .
1 0 : 3 0 a . m . t o N o o n
1 t o 4 p . m .
2 : 3 0 t o 4 p . m .
1 t o 2 p . m .
4 : 3 0 t o
5 : 3 0 p . m .
R e g i s t r a t
i o n
P o s t e r s / E x h i b i t s
( R e f e r t o p r o g r a m f o r d e t a i l s )
Wednesday, October 19 Thursday, October 20
4 t o 5 p . m .
Moderator: Darren Gerson
Dr. John Hirdes, Professor and Ontario Home Care Research and School of Public Health and Health Systems, University
Dr. Brant Fries, President of interRAI, Professor of Health ManResearch Professor at the University of Mic
Designing case mix systems for non-acute c are: The interRAI Expeexamine methodological, conceptual and policy issues related to t
systems and associated payment systems for non-acute hIt will feature international research by interRAI, a 32-country
on case mix systems for nursing homes, home care and m
N o o n t
o 1 p . m .
1 0 t o
1 0 : 3 0 a . m .
N o o n
t o 1 p . m .
2 t o
2 : 3 0 p . m .
Lunch Break
Opening Plenary 1
Pre-Conference Workshops
Pre-Conference Workshops
Welcome ReceptionMeeting Room: Montréal Ballroom (11th Floor)
Concurrent Session 2
Concurrent Session 11-A: Morbidity Burden
and Case Mix
Moderator: Brian Ruff
Meeting Room: Ville-Marie A(9th Floor)
Lunch, Posters and Exhibit ViewinMeeting Room: Montréal Ballroom (11th
Coffee Break, Posters and Exhibit VieMeeting Room: Montréal Ballroom (11th
Poster Session
Plenary 2
FE C (cont’d) HG
Moderator: Dr. Jason Sutherland
Welcome Remarks FromJohn Wright, President and CEO, CIH
Denis Lalumière, sous-ministre adjoint, Planification, perministère de la Santé et des Services soc iaux d
Poul Erik Hansen, President, PCSI
Keynote SpeakerDr. Bob Evans, Professor, Department of Economics, Univer
If You Can't Measure It, You Can't Manage it —Are PatiSystems Essential to the Survival of Public Health
Fortifications Ballroom—9th Floor
1-B: Health System Planningand Funding
Moderator: Jason Sutherland
Meeting Room: Ville-Marie B(9th Floor)
2-A: Economic Incentivesand Case Mix
Moderator: Dana Burduja
Meeting Room: Ville-Marie A(9th Floor)
2-B: Classification andCase Mix Incentives
Moderator: Jiro Okochi
Meeting Room: Ville-Marie B(9th Floor)
Coffee Break, Posters and Exhibit VieMeeting Room: Montréal Ballroom (11th
AHow to HarmonizeClassifications of
Procedures for CaseMix Applications?From the PresentSituation to the ICHI(InternationalClassification ofHealth Interventions)Initiative
Jean Marie Rodrigues,PhD, Professor,St. Etienne University
Meeting Room:Ville-Marie A(9th Floor)
CCosting PatientCare Services—
An IntroductionUsing WorkedExamples
Nigel Michell,PowerHealthSolutions
(Start time 10 a.m.)
Meeting Room:St-Antoine B(9th Floor)
BProfiling Devices,Drugs and Implants
as an AdditionalProfile of Case MixTools Using GS1
Jacob Hofdik,ImplementatieIntegrale BekostigingChronische ZiektenVWS, Vice PresidentEFMI-IMIA,Partner in Casemix
Meeting Room:St-Antoine A(9th Floor)
DFrom Case Mix to Clinical Care
Michael Wilke
Meeting Room:Ville-Marie B(9th Floor)
Applying PredictiveModelling to Improve the Delivery ofHealth Care
Karen Kinder, ACGInternationalBloomberg Schoolof Public Health,Johns HopkinsUniversity
Meeting Room:Ville-Marie A(9th Floor)
Case-Mix Systemsfor Non-AcutePopulations Across the Continuum ofCare: The interRAIExperience
John P. Hirdes,Professor, Schoolof Public Health andHealth Systems,University ofWaterloo andBrant Fries,President of interRAI,Professor of HealthManagement andPolicy and ResearchProfessor at theUniversity of Michigan
Meeting Room:Ville-Marie B(9th Floor)
Continuity ofCare/Contsys
Jacob Hofdik,ImplementatieIntegrale BekostigingChronische ZiektenVWS, Vice PresidentEFMI-IMIA, Partnerin Casemix
Meeting Room:St-Antoine A(9th Floor)
Costing Patient CareServices—AnIntroduction UsingWorked Examples
Nigel Michell,PowerHealthSolutions
Meeting Room:St-Antoine B(9th Floor)
Developing anActivity-BasedFunding (ABF) Modelfor Non-AdmittedPatient Services
Joe Scuteri,HealthConsult Pty Ltd,Australia
Meeting Room:Palais (8thFloor)
Understanding the Episode ofCare for Transplant Patients,Irene Blais
Planning for ABF as Part ofReforming the Australian Health
Care System, Lisa Fodero
Case Mix Funding in Ireland:From Retrospective toProspective? ProgressSince 2010, Brian Donovan
Planning for the Future inSwitzerland: Adapting theFacilities to the Demand of thePatient, Jean-Claude Rey
Profiling High Morbidity Burdenin Primary Care: Calibration of aCase-Mix Model, Ran Balicer
Measuring the Case-Mix ofPhysician Practices in Primary
Care Reform Models in Ontario,Canada, Lyn Sibley
Analyzing the Emergence ofComplex Morbidities: A 30-YearFollow-Up on a DefinedPopulation in Sweden,Lennart Carlsson
Determining a Threshold
Hospital Size for Applicationof Activity-Based Funding,Joe Scuteri
Issues in Use of CMG+ forActivity-Based Funding inCanada, Stephen Duckett
Explaining Variations in theCost of Patient Care:A Multilevel Analysis UsingCanadian Hospital Data,Recep Gezer
Can Teaching Hospitals BenefitFrom Casemix System?Outcome of Using DEA toEvaluate Efficiency of TeachingHospitals in Malaysia,Syed Aljunid
Assessment of the Main
International and NationalClassifications or TerminologicalSystems of Surgical ProceduresUsing the CEN/ISO 1828Standard, Jean Marie Rodrigues
The Use of Case Mix Data forIdentifying Variations in HospitalCare for Elderly Having COPD,Nona Chiriac
The Modern Concept of Sepsisand Its Impact on DRG,Olafr Steinum
Poster Viewing and Refreshments
Best Poster Award
Meeting Room: Montréal C&D (11th Flo
Note:All conference presentations are in English, unless otherwise identified by the symbol .Simultaneous interpretation will be available at all sessions denoted with .

8/13/2019 2011 Montreal Conference Abstract Book
http://slidepdf.com/reader/full/2011-montreal-conference-abstract-book 158/166
1 1 a . m . t o 1 2 : 3 0 p . m .
1 : 3 0 t o
2 : 3 0 p . m .
3 : 0 0 t o 4
: 3 0 p . m .
Friday, October 21 Saturday, October 22
1 0 t o
1 0 : 3 0 a . m
.
9 t o
1 0 a . m .
9 t o 1 0 : 3 0 a . m .
1 1 a . m . t o 1 2 : 3 0 p . m .
1 2 : 3 0 t o
1 p . m .
4 : 3 0 t o
5 : 3 0 p . m .
r,
illx
7 : 3 0
p . m .
2 : 3 0 t o
3 p . m .
1 2 : 3 0 t o
1 : 3 0 p . m .
1 0 : 3 0 t o
1 1 a . m .
1 0 : 3 0 t o
1 1 a . m .
1
t o 2 p . m .
Concurrent Session 5
PCSI General Assembly Part I—Introduction of Candidates for Election Fortifications Ballroom—9th Floor
Coffee Break, Posters and Exhibit ViewingMeeting Room: Montréal Ballroom (11th Floor)
LunchMeeting Room: Montreal Ballroom (11th Floor)
Lunch, Posters and Exhibit ViewingMeeting Room: Montréal Ballroom (11th Floor)
Concurrent Session 6
Gala Dinner (Starting at 7:30 p.m.)
Closing Plenary(Including an Introduction from the PCSI 2012 host, the PCSI Winter School and PCSI Summer School)
Fortifications Ballroom—9th Floor
Coffee Break, Posters and Exhibit ViewingMeeting Room: Montréal Ballroom (11th Floor)
PCSI General Assembly Part II Fortifications Ballroom—9th floor
Concurrent Session 4
nces
eith
ne A
ur
e A
Plenary 3 EURODRG Project PresentationModerator: Ceu Mateus
Andrew Street, Professor of Health Economics and Director of the Health Policy teamCentre for Health Economics and Director of the Economics of Social and Health Care
Research Unit (ESHCRU), National Institute for Health Research
Fortifications Ballroom—9th Floor
Concurrent Session 3
PCSI Featured Abstracts
5-A: Health System Planningand Funding II
Moderator: Jean Marie Rodrigues
Meeting Room: Ville-Marie A
(9th Floor)
5-B: Maximizing Informationin Case Mix Applications
Moderator: Olafr Steinum
Meeting Room: Ville-Marie B(9th Floor)
5-C: Ambulatory Care andCase Mix II
Moderator: Brian McCarthy
Meeting Room: St-Antoine A(9th Floor)
Coffee Break, Posters and Exhibit ViewingMeeting Room: Montréal Ballroom (11th Floor)
6-A: Innovation in CaseMix Applications
Moderator:Paula Monteith
Meeting Room:Ville-Marie A (9th Floor)
6-B: Health SystemPlanning and Case Mix II
Moderator:Virginia Jordan
Meeting Room:Ville-Marie B (9th Floor)
6-C: Cost WeightCalculations
Moderator:Stephen Sutch
Meeting Room:St-Antoine A (9th Floor)
6-D: Care Qualityand Case Mix II
Moderator:Heather Richards
Meeting Room:St-Antoine B (9th Floor)
Newatient
ext,
ces
nced
rtMG
IONALmentGunid
d
atoryionuah
els
ofion
cesms
ysisd
3-A: Care Qualityand Case Mix
Moderator:Jiro Okochi
Meeting Room:Ville-Marie A (9th Floor)
3-B: RefiningCase Mix Systems
Moderator:Poul Erik Hansen
Meeting Room:Ville-Marie B (9th Floor)
3-C: Health SystemPlanning and Case Mix
Moderator: Dana Burduja
Meeting Room:St-Antoine A (9th Floor)
3D: Case MixMethodologiesand Their Use
Moderator:Claude Lemay
Meeting Room:St-Antoine B (9th Floor)
Incremental Costs ofHospital-AcquiredComplications inAlberta, Canada,Terri Jackson
Using Hospital
Readmission Rates to Track Qualityof Care in PublicHospitals in Singapore,Dr. Shamim Chowdhuryand Ms. Mok Wei Ying
Health Status andPerformance UsingClinical Risk Groups(ACRG3) for theMadrid Region,Marc Berlinguet
First German HospitalInfection BenchmarkBased on DRG RoutineData, Michael Wilke
A Methodology forRefining AR-DRG,Christopher Aisbett
Development of aClassification ofClinical Specialties:
Service-Related Groups(SRGs) and EnhancedService-Related Groups(ESRGs),Deniza Mazevska
Counting ChronicDiagnoses Is NotEnough: Classifying theEntire Patient PopulationWith a MorbiditySpectrum Measure,Efrat Shadmi
Should There Be a Limitfor DRG Split? A Case ofThai DRG Versions 3 to 5,Supasit Pannarunothai
Perceptions of theCasemix System byClinicians after the First Year of Implementationin Hong Kong: a Survey,K. H. Lee
Case Mix Innovation:Shifting to IntegratedCare, Jacob Hofdik
Can Clinical PathwaysEnhance the Implemen- tation of a Case MixSystem? A Case Study ina Teaching Hospital inMalaysia, Syed Aljunid
How Population-BasedCase Mix Has ProvenItself in Canada,Karen Kinder
Introduction en douceur à la méthodologiedes systèmes dits“Casemix” pour lesnouveaux venusJean Marie Rodrigues,University of
Saint Etienne, CHU,Department ofPublic Health andMedical Informatics
Utilisation deregroupementsd’épisode de soins dansle cadre du financementdu réseau de la santéet des services sociaux du QuébecNormand Lantagne,Directeur de l'allocationdes ressources parintérim, Ministèrede la Santé et desServices sociauxdu Québec
Moderator: Jason Sutherland
Patient Pathway Aggregation—Building on a Firm Foundation, Paula MonteithAnalysis of the Variability of Nursing Care by Pathology in a Sample of Nine Belgian Hospitals, Magali Pirson
Fortifications Ballroom—9th Floor
4-A: Economic Incen-tives and Case Mix II
Moderator:Kristiina Kahur
Meeting Room:Ville-Marie A (9th Floor)
4-B: Long-Term Careand Case Mix
Moderator:Stephen Sutch
Meeting Room:Ville-Marie B (9th Floor)
4-C: Case Mixand Data Quality
Moderator:Michael Wilke
Meeting Room:St-Antoine A (9th Floor)
4-D: Cost Data andCost Weights
Moderator:Darren Gerson
Meeting Room:St-Antoine B (9th Floor)
Case Mix–BasedEconomic IncentivesThat Work, Poul Hansen
Pay-for-PerformanceQuality IncentiveProgram—One-YearPilot Program,Dr. K. H. Lee
Paying for Quality,Patrick Power
Aging, Disability andLong-Term Care,Dália Nogueira
Transitioning to a NewCase Mix Grouper toFund Long-Term CareHomes in Ontario,Canada, San Adeline Tsui
Using the AdjustedClinical Groups toDescribe Newly AdmittedNursing Home Residentsin Stockholm,Gunnar Ljunggren
Implementation ofActivity-Based Fundingfor Long-Term Care inAlberta, Stephen Duckett
Auditing in the IrishCase Mix Budget Models,Mark O’Connor
Coded Data Quality forCase Mix Payment:Insights From TwoExternal Audits, Beth Reid
Clinical DocumentationManual Audit, Ken Fan
Data QualityConsiderations WithIncreasing Access andTimeliness of IrishHospital Activity Data,Deirdre Murphy
A Comparison: EstimatedCosts Using Case MixTools Versus theCanadian Patient Cost
Database, Bob Ren
The Australian HospitalPatient CostingStandards andSupporting QualityFramework, Jo Murray
National DRG CostWeights in Finland,Tapio Pitkäranta
Cost Weights forActivity-Based Fundingin Canada—BuildingUpon What We Have,Kevin Murphy
Grouping Patients AcrossEpisodes of Care: RefinedClinical Groups (RCGs), Kevin Yu
Are Clinical and Cost Data OneFamily During Implementationof Case Mix? Daniel Ciurea
Development and Implementationof DOT: The New DutchRegistration and InvoicingSystem, Joost Warners
The UNU-CBGs: Development andDeployment of a Real InternationalOpen Source Casemix Grouperfor Resource ChallengedCountries, Syed Aljunid
Individual Product Determinationin the New Dutch DBC System:How to Make the SystemTransparent for Its Users,Alexander Rengelink
Levels of Care Methodology toClassify Patients as Tertiary andNon-Tertiary, Yuriy Chechulin
Using Case Mix Tools to PredictFuture Mortality Risk,Vincenzo Opeka
Australian Developments in CaseMix Classification and Fundingof Emergency Department Care,Jim Pearse
Unexpected or Unexplained HighPharmacy Utilization: IdentifyingThose Who Do Not Have theComorbidity to Support TheirPharmacy Use, Chad Abrams
Using Primary Care Data toIdentify Patients to Case Managein the U.K., Stephen Sutch
Predictors of Pharmacy Cost inDiabetic Patients at BuddhachinaraHospital, Supasit Pannarunothai
Enabling Transparencyand System EvaluationWith InpatientRehabilitation Case Mix,Ian Joiner
Comparative Analysis ofRehabilitation Groupers,Klara Dimitrovova
Real-Time Monitoringof Patient Outcome—VLAD, Deacons Yeung
Taking Care of HipFractures: 12 Years ofPractice in France(1998–2009),Philippe Oberlin
Episode Grouping andAssessing Appropriate-ness of Patient Care,Tresa Staeven
Collecting HospitalPatient Data in Ireland—The Next Generation,Philip Dunne
Is the Disability Profilean Important Issuefor Projecting CostsWith Aging?
Dália Nogueira
Patient-Level Costing forThai Diagnosis–RelatedGroup in Thailand: AMicro-Costing Approach,Orathai Khiaocharoen
Development of theAustralian All ProductCosting Process,Karen Chudleigh
Adjusting Non-Standardized Data toFacilitate National
Reporting, Sheril Perry
Real-Time Cost-Database—AnAdvantage for DRG-Tariffs and HospitalBudgets, Maria Larsen
Measurement of theElderly’s Participation in the Community: NewDomain of Quality of LifeBecomes Measurable,Jiro Okochi
Evaluating Quality of Carein Hong Kong ThroughIdentification ofPotentially PreventableReadmissions Within theCurrent Unplanned
Readmissions IndicatorFramework , Dr. K. H. Lee
Potentially PreventableReadmissions in Madrid,Marc Berlinguet
A costing study ofneonatal intensive carefor newborn infants withbirth weight between500–1500 grams.Kathy Conway

8/13/2019 2011 Montreal Conference Abstract Book
http://slidepdf.com/reader/full/2011-montreal-conference-abstract-book 159/16614
Each patient counts
2 7 t h P C S I C o n f e r e n c e | O c t o b e r 1 9 t o 2 2 , 2 0 1 1 | M o n t r é a l , Q u e b e c , C a n a d a
Notes

8/13/2019 2011 Montreal Conference Abstract Book
http://slidepdf.com/reader/full/2011-montreal-conference-abstract-book 160/166144
= ( WX ′ – – WY
β = ( WX ′ ) – XWY
= β + ε
= + ε
= + εQ75+ .5 x (Q.
5- Q
25
Q75 1.5 (Q
75 -
25)
2 7 t h P C S I C o n f e r e n c e | O c t o b e r 1 9 t o 2 2 , 2 0 1 1 | M o n t r é a l , Q u e b e c , C a n a d a
Each patient counts
Notes

8/13/2019 2011 Montreal Conference Abstract Book
http://slidepdf.com/reader/full/2011-montreal-conference-abstract-book 161/16614
Each patient counts
2 7 t h P C S I C o n f e r e n c e | O c t o b e r 1 9 t o 2 2 , 2 0 1 1 | M o n t r é a l , Q u e b e c , C a n a d a
Notes

8/13/2019 2011 Montreal Conference Abstract Book
http://slidepdf.com/reader/full/2011-montreal-conference-abstract-book 162/166146
= ( WX ′ – – WY
β = ( WX ′ ) – XWY
= β + ε
= + ε
= + εQ75+ .5 x (Q.
5- Q
25
Q75 1.5 (Q
75 -
25)
2 7 t h P C S I C o n f e r e n c e | O c t o b e r 1 9 t o 2 2 , 2 0 1 1 | M o n t r é a l , Q u e b e c , C a n a d a
Each patient counts
Notes

8/13/2019 2011 Montreal Conference Abstract Book
http://slidepdf.com/reader/full/2011-montreal-conference-abstract-book 163/16614
Each patient counts
2 7 t h P C S I C o n f e r e n c e | O c t o b e r 1 9 t o 2 2 , 2 0 1 1 | M o n t r é a l , Q u e b e c , C a n a d a
Notes

8/13/2019 2011 Montreal Conference Abstract Book
http://slidepdf.com/reader/full/2011-montreal-conference-abstract-book 164/166148
= ( WX ′ – – WY
β = ( WX ′ ) – XWY
= β + ε
= + ε
= + εQ75+ .5 x (Q.
5- Q
25
Q75 1.5 (Q
75 -
25)
2 7 t h P C S I C o n f e r e n c e | O c t o b e r 1 9 t o 2 2 , 2 0 1 1 | M o n t r é a l , Q u e b e c , C a n a d a
Each patient counts
Notes

8/13/2019 2011 Montreal Conference Abstract Book
http://slidepdf.com/reader/full/2011-montreal-conference-abstract-book 165/166

8/13/2019 2011 Montreal Conference Abstract Book
http://slidepdf.com/reader/full/2011-montreal-conference-abstract-book 166/166