2011 mutual fund stewardship grade research...
TRANSCRIPT
©2011 Morningstar, Inc. All rights reserved. The information in this document is the property of Morningstar, Inc. Reproduction or transcription by
any means, in whole or in part, without the prior consent of Morningstar, Inc. is prohibited.
Laura Pavlenko LuttonKatie RushkewiczKailin LiuXin Ling
Morningstar Fund ResearchMarch 2011
2011 Mutual Fund Stewardship Grade Research Paper
2
2011 Stewardship Grade Research Paper I April 13, 2011
©2011 Morningstar, Inc. All rights reserved. The information in this document is the property of Morningstar, Inc. Reproduction or transcription by any means, in whole or in part, without the prior consent of Morningstar, Inc. is prohibited.
Table of Contents
Executive Summary 3
Studying Stewardship 4
Stewardship Coverage Details 4
Methodology Changes 5
Determining the Grades 6
Testing the Methodology 6
Corporate Culture 8
Growth at What Price? 9
Fund Board Quality 13
Investing in Fund Shares 14
From the Bench 18
Manager Incentives 19
Assessing Skin in the Game 19
Parsing the Pay Plan 20
Studying Incentives 21
Pay Influencing Performance 24
Fees 27
Regulatory History 30
Morningstar Stewardship Grades for Mutual Funds 32
Morningstar Stewardship Grades for Mutual Funds—Average Grade by Fund Family 34
3
2011 Stewardship Grade Research Paper I April 13, 2011
©2011 Morningstar, Inc. All rights reserved. The information in this document is the property of Morningstar, Inc. Reproduction or transcription by any means, in whole or in part, without the prior consent of Morningstar, Inc. is prohibited.
Morningstar Stewardship Grade methodology intends to measure whether a fund will treat its shareholders’ capital with care. Some may equate care of capital with growth of capital, but fund performance isn’t a central theme of the Stewardship Grades. Rather, the grades establish whether a fund is run by an organization that’s investor-centric and law-abiding, whether it’s governed by a highly independent fund board, and whether it’s charging a fair fee. The methodology also considers whether management’s incentives are aligned with fundholders’.
When Morningstar launched the Stewardship Grades in 2004, it expected that funds with these shareholder-friendly attributes—and thus top Stewardship Grades—should be more successful for fundholders, and that has been the case. In fact, funds with failing Stewardship Grades were very often killed off by merger or liquidation, while those earning A’s almost always survived. In the years after the grades were issued, funds earning high grades were very likely to garner Morningstar Ratings of at least 3 stars, demonstrating that on a risk-adjusted basis, the funds kept up with or surpassed peer funds with similar strategies. And the top-graded funds had calendar-year category and investor returns that edged past peers as well.
Morningstar would never suggest making an investment decision solely on a fund’s Stewardship Grade. Investors first have to evaluate whether a fund’s strategy is sensible and whether its manager is capable. But from there, the Stewardship Grades can help shareholders narrow down their choices to funds that are likely to treat them like owners—not like just another dollar through the door. At a minimum, the Stewardship Grades can help identify which funds are likely to be around for a while, and if the survivors have a performance edge as well, all the better.
Executive Summary
4
2011 Stewardship Grade Research Paper I April 13, 2011
©2011 Morningstar, Inc. All rights reserved. The information in this document is the property of Morningstar, Inc. Reproduction or transcription by any means, in whole or in part, without the prior consent of Morningstar, Inc. is prohibited.
Morningstar Stewardship Grades for mutual funds were born from scandal. In 2003 and 2004, industry regulators found that a handful of prominent mutual fund companies harmed fundholders by allowing hedge funds and others to trade fund shares on terms not allowed to the general public. Some firms allowed some fundholders to trade after the industry’s 4 p.m. deadline. Others traded shares more quickly than the funds’ prospectus said would be tolerated. The episode was a black eye for the fund industry, which previously had few regulatory problems.
The firms accused of wrongdoing by regulators had a few traits in common. They were all anxious to gather— or retain—assets under management. They also shared weaker compliance cultures: Leaders at the firms were focused on the bottom line at the expense of fundholders’ well-being. Many of the firms’ growth investment strategies also were under pressure in the bear market.
With these common traits in mind, Morningstar set out to develop a methodology that would grade mutual funds based on their likelihood to be strong caretakers of capital. Morningstar’s intention was to identify which funds were more apt to treat their shareholders well, identifying the fund industry’s best stewards of capital with A Stewardship Grades and the worst with F grades.
The resulting methodology examines five areas that Morningstar expected would have the most impact on a fund’s stewardship practices: (1) the corporate culture of the fund’s parent organization; (2) the quality of the board of directors overseeing the fund; (3) the fund managers’ financial incentives; (4) the fund’s fees; and (5) the fund firm’s regulatory history. The methodology combines quantitative and qualitative inputs, the details of which are described in the corresponding sections of this report. Each of the five methodology sections—corpo-rate culture, fund board quality, manager incentives, fees, and regulatory history—earn individual grades. The scores associated with each section are combined to arrive at an overall Stewardship Grade.
This research paper serves as a checkup on the Stewardship Grade methodology and an examination of current industry stewardship practices. Specifically, Morningstar looked at each criterion of the Stewardship Grade methodology to see whether it in fact led to good shareholder experiences such as stronger risk-adjusted returns, better investor (or cash-weighted) returns, lower fees, and/or higher survivorship rates. The results indicate that some areas of the methodology have been more predictive than others.
Stewardship Coverage DetailsTo best interpret the results of this study, it’s important to consider which mutual funds have received Steward-ship Grades. Morningstar’s objective is to issue grades to the funds that are most widely held and that are well-known by Morningstar’s mutual fund analysts because the analysts conduct the research associated with each grade. Morningstar has assigned Stewardship Grades to about 1,000 funds from more than 40 families. The funds that receive Stewardship Grades are actively followed by a Morningstar fund analyst, meaning an analyst researches and writes an analysis for each fund at least once per year. The coverage list is biased toward the
Studying Stewardship
5
2011 Stewardship Grade Research Paper I April 13, 2011
©2011 Morningstar, Inc. All rights reserved. The information in this document is the property of Morningstar, Inc. Reproduction or transcription by any means, in whole or in part, without the prior consent of Morningstar, Inc. is prohibited.
industry’s largest funds from the largest firms, with funds from Fidelity and Vanguard composing about a fourth of Morningstar Stewardship Grade coverage.
As is the case with all of Morningstar’s qualitative Analyst Ratings, the methodology for the Stewardship Grades does not force a bell-curve distribution of the final grades, but the most common grade among all funds receiving Stewardship Grades is C. Within the tails of the curve, however, there are more A’s and B’s than D’s and F’s (see Table 1). That distribution isn’t too surprising given the selection bias in the coverage list. Many of the industry’s largest funds and largest fund companies got that way because they’ve been decent stewards of fundholders’ capital.
1. Distribution of Morningstar Stewardship Grades for Mutual Funds by Overall Grade
Overall Stewardship Grade Number of Funds
A 90
B 359
C 455
D 145
F 2
Data as of 3/25/11. Source: Morningstar, Inc.
Methodology ChangesIt’s also worth noting that Morningstar has made two rounds of changes to the Stewardship Grade methodo-logy since the grades’ August 2004 launch. In 2006, Morningstar made a relatively straightforward change in how it compared funds’ expense ratios. From 2004 to 2006, Morningstar compared the funds’ fees to category peers, but since 2006, the comparison has been to supercategories that combine funds that invest in similar types of securities or execute similar strategies. For example, all large-cap funds are in the same supercategory, regardless of investment style. And all specialty funds are in the same supercategory, regardless of which sector they’ve targeted for investment. From there, Morningstar divides the supercategories by share class type, or distribution channel, so shares sporting front-loads are in one peer group, retail investor shares are in another group, and so on.
Morningstar made more substantial changes to its methodology in 2007, changing the weighting of some sections of the methodology as well as a few of the underlying criteria. Specifically, Morningstar placed more emphasis (4 of 10 points, up from 2 of 10 points) on the corporate culture section of the methodology. The 2007 methodology also included tweaks to the fund board quality, fee, and regulatory history sections. These changes were designed to reflect the industry’s best stewardship practices and made it tougher to get an A or a B grade overall.
6
2011 Stewardship Grade Research Paper I April 13, 2011
©2011 Morningstar, Inc. All rights reserved. The information in this document is the property of Morningstar, Inc. Reproduction or transcription by any means, in whole or in part, without the prior consent of Morningstar, Inc. is prohibited.
Determining the GradesIn the early years of the Stewardship Grades, teams of analysts covering funds offered by the same fund com-pany worked together to issue grades to the funds on each analyst’s coverage list. Since early 2007, however, the task of assigning Stewardship Grades to funds in a family has rested predominantly with the lead analyst for that family. This lead analyst typically coordinates an in-person due-diligence visit to the fund company, gathers the data necessary to evaluate each fund, and proposes a set of scores—and text to support them—to a committee of analysts who oversee the methodology. The Stewardship Grade committee works to ensure that the method-ology is fairly applied to funds across a very diverse industry. The current members of the Stewardship Grade Committee follow:
3 Laura Pavlenko Lutton Editorial Director3 Katie Rushkewicz Senior Analyst3 Bridget Hughes, CFA Associate Director3 Josh Charlson Senior Analyst3 Andrew Gogerty Senior Analyst3 David Kathman, CFA Senior Analyst3 Courtney Goethals Dobrow Analyst3 Ryan Leggio Analyst3 Kailin Liu Analyst
Because much of the data that support the Stewardship Grade methodology come from funds’ Statement of Additional Information, a regulatory filing made annually with the Securities and Exchange Commission, Morn-ingstar aims to update funds’ Stewardship Grades annually. Sometimes analysts revisit grades before a year has lapsed, but often updates are delayed for a number of reasons, such as a change in control at a fund company, a change in coverage at Morningstar, or real-world scheduling difficulties.
Testing the MethodologyTo determine whether portions of the Stewardship Grade methodology—as well as the overall grades—were predictive of better shareholder experiences, Morningstar looked at several data points in the years that fol-lowed. To start, Morningstar looked at how many funds survived the period. For funds earning D’s and F’s in 2004, a fourth to a third of the funds were merged away or killed off in subsequent years. This created considerable survivorship bias in the data because presumably the worst funds did not survive and therefore are not included in some of the subsequent data that Morningstar considered, such as the Morningstar Rating.
The other challenge to testing the Stewardship Grade methodology is selection bias. Morningstar has issued Stewardship Grades to about 1,000 mutual funds, many of which are the industry’s very best funds. This creates considerable selection bias. In fact, the funds getting the worst Stewardship Grades that have survived have not been complete failures when it comes to performance and other measures.
7
2011 Stewardship Grade Research Paper I April 13, 2011
©2011 Morningstar, Inc. All rights reserved. The information in this document is the property of Morningstar, Inc. Reproduction or transcription by any means, in whole or in part, without the prior consent of Morningstar, Inc. is prohibited.
To test at a basic level whether good stewards have delivered good shareholder experiences, Morningstar looked at funds’ Morningstar Rating success ratios. For the purposes of this study, Morningstar defined successful funds as those with Morningstar Ratings of 3 stars or higher. Funds deemed unsuccessful were those earning 2 stars or lower, as well as funds that didn’t survive to today. By taking the total number of successful funds and dividing it by the total number of funds, one arrives at the Morningstar Rating ratio. This success ratio intends to identify funds where the shareholder has had a reasonably good ownership experience, as measured by performance relative to peers, adjusted for risk—the basis of the Morningstar Rating. To be sure, some funds with Morning-star Ratings of 3 stars have underperformed the category average over the period on a risk-adjusted basis, but not to the extent that it would cause reasonable shareholders to view their investments as unsuccessful over the period.
Another way to gauge performance is through category rank. Funds with category ranks less than 50 produced returns that were better than their average category peer. This comparison intends to group funds with similar investment objectives and strategies. For the study, Morningstar looked at funds’ category rank by calendar year and calculated a simple average of these results to measure how well the funds had performed in the years since the Stewardship Grades were issued.
Morningstar also looked at the funds’ investor returns for the calendar years after the Stewardship Grades were issued. Investor returns are cash-weighted returns, designed to show whether the average investor captured the fund’s total returns. Funds with investor returns that are worse than the fund’s average total return indicate that most shareholders didn’t capture all of the fund’s good performance—perhaps cash moved into the fund after it had posted significant gains and/or cash moved out after the fund had posted losses. Strong investor returns are a signal of good stewardship of capital—especially among funds with unusual strategies—as they can indicate that the fund did a good job informing shareholders about its investment process, so they were less likely to sell, for example, when the fund underperformed.
Finally, this study looked primarily at Stewardship Grades issued as of Dec. 31, 2004—the first year of the methodology—and as of Dec. 31, 2007—a few months after the methodology was revised.
8
2011 Stewardship Grade Research Paper I April 13, 2011
©2011 Morningstar, Inc. All rights reserved. The information in this document is the property of Morningstar, Inc. Reproduction or transcription by any means, in whole or in part, without the prior consent of Morningstar, Inc. is prohibited.
Corporate Culture
Morningstar’s Stewardship Grade methodology surmises that the corporate culture of an investment firm has the biggest impact on fund shareholders’ experience. It stands to reason that firms that treat their fund shareholders like owners of their business—rather than just a dollar through the door—will be better stewards of capital.
In almost all cases, Morningstar issues a single corporate culture grade to all funds in a family, so while the Stewardship Grades are assigned to individual funds, funds in the same firm typically have the same corporate culture grade. Morningstar measures corporate culture through a combination of qualitative and quantitative components, but the qualitative analysis carries more weight in determining the final grade for corporate culture. The qualitative analysis is similar to a study of organizational behavior. Morningstar analysts look at whether shareholder service is the main driver of a fund company’s corporate culture. Because nearly every fund company tells Morningstar that their organization’s drive comes from serving shareholders well, Morningstar analysts have to dig deeper to compare one firm’s actions to the industry’s best practices.
As part of Morningstar’s stewardship due-diligence process, a team of analysts typically meets with fund company executives, investment leaders (like chief investment officers), securities analysts, portfolio managers, compliance officials, fund board leadership, sales chiefs, and others. The goal of these meetings is to complement the knowledge of a firm that Morningstar has ascertained from 25 years of fund-by-fund analysis—researching portfolios, studying data trends, and interviewing fund managers. (Today, Morningstar’s mutual fund analysts actively follow 1,750 open-end mutual funds—and issue Stewardship Grades to about 1,000 of those funds.)
Spending a day (or two) at a fund company helps Morningstar better understand the firm’s business goals, investing expertise, distribution strategy, risk-management philosophy and techniques, and compensation structure. Informally, the meetings allow analysts to better understand the culture within the firm, specifically whether it’s competitive, collegial, bold, or passive. Morningstar has visited firms during the peak of their success and at the depths of crisis, and each of these meetings contributes to the analysts’ broad and deep knowledge of the industry’s prominent firms.
Beyond establishing how and why a fund firm works, Morningstar analysts examine aspects of corporate culture that are easier to measure. The analysts, for example, study a fund family’s lineup of investment options to see if the investments have served shareholders well through peer-beating performance. Morningstar not only looks at whether funds have performed well relative to peers on a risk-adjusted basis, but also looks to see whether investors have owned the funds well. Morningstar Investor Returns are cash-weighted to better capture the typical shareholder’s experience based on cash flows in and out of a fund. Most investors buy into funds after they’ve performed well for a time and then sell after a period of losses, so funds’ investor returns are often worse than the funds’ total returns.
9
2011 Stewardship Grade Research Paper I April 13, 2011
©2011 Morningstar, Inc. All rights reserved. The information in this document is the property of Morningstar, Inc. Reproduction or transcription by any means, in whole or in part, without the prior consent of Morningstar, Inc. is prohibited.
In addition to studying performance, Morningstar also considers which funds the firm has launched recently to see if those offerings play to the firm’s investment strength. Morningstar has more confidence in new funds when they’re run by managers who have experience executing the strategy well. Similarly, Morningstar is skeptical of niche funds that investors typically don’t own well. Investor returns for trendy funds can be particularly bad. For example, U.S. fund investors lost $5 billion in real estate funds between January 1999 and December 2008—arguably the biggest boom of a generation. Thirty-one of the real estate category’s 79 funds were launched during that period.
Strong stewards of capital approach their fund launches thoughtfully and prudently. Therefore, it’s not surprising that funds with high corporate culture grades have been more likely to survive, while those with poor grades are often merged away. Among the 20 funds that earned F’s for corporate culture in 2004, only 14 still existed five years later, and only 12 exist today. In contrast, 93% of the 277 funds that earned A’s in 2004 are still around. The funds offered by firms with top corporate cultures usually are built to last.
Growth at What Price?The fund family’s lineup is often indicative of its business strategy. Firms that aim to grow quickly can do so by launching trendy funds that appeal to investors who chase short-term gains—even if the funds are unlikely to turn in an extended winning streak. Other fund companies stick with their winners too long. They leave hot funds open to new investments after the funds have grown so large that management’s ability to execute its investment strategy is compromised. Others attract assets through flashy advertisements touting short-term returns—or returns that were earned by a previous manager.
All of these practices can harm long-term shareholders. As temperamental assets slosh in and out of funds, they can cause management to incur higher trading costs, rack up short-term capital gains, and limit investment options because of liquidity constraints. Shareholders are much better served by funds that grow because the funds have demonstrated that they’re leaders in their fields, employing repeatable, patient, risk-aware invest-ment processes. Dodge & Cox is an example of a firm with a top corporate culture that’s managed its growth well, closing its funds when necessary and limiting its lineup to funds where it has expertise.
Morningstar also looks to see whether the fund-management personnel at the firm is stable. Presumably, firms with high manager retention rates have happy employees who have performed well. (Morningstar’s manager retention rate is a firmwide calculation that considers which managers were named to funds on Dec. 31 of each year and calculates the percentage of managers that remain on the fund one year later. Morningstar calculates a five-year average to measure longer-term retention trends at a firm.) Shareholders who buy funds offered by firms with high manager retention rates can have more confidence that the manager running the fund today is likely to be at the firm years later. When managers change, fundholders have to revisit their investment to determine if the new skipper is experienced and the strategy unchanged. Such re-assessments are disruptive and not in shareholders’ best interest.
10
2011 Stewardship Grade Research Paper I April 13, 2011
©2011 Morningstar, Inc. All rights reserved. The information in this document is the property of Morningstar, Inc. Reproduction or transcription by any means, in whole or in part, without the prior consent of Morningstar, Inc. is prohibited.
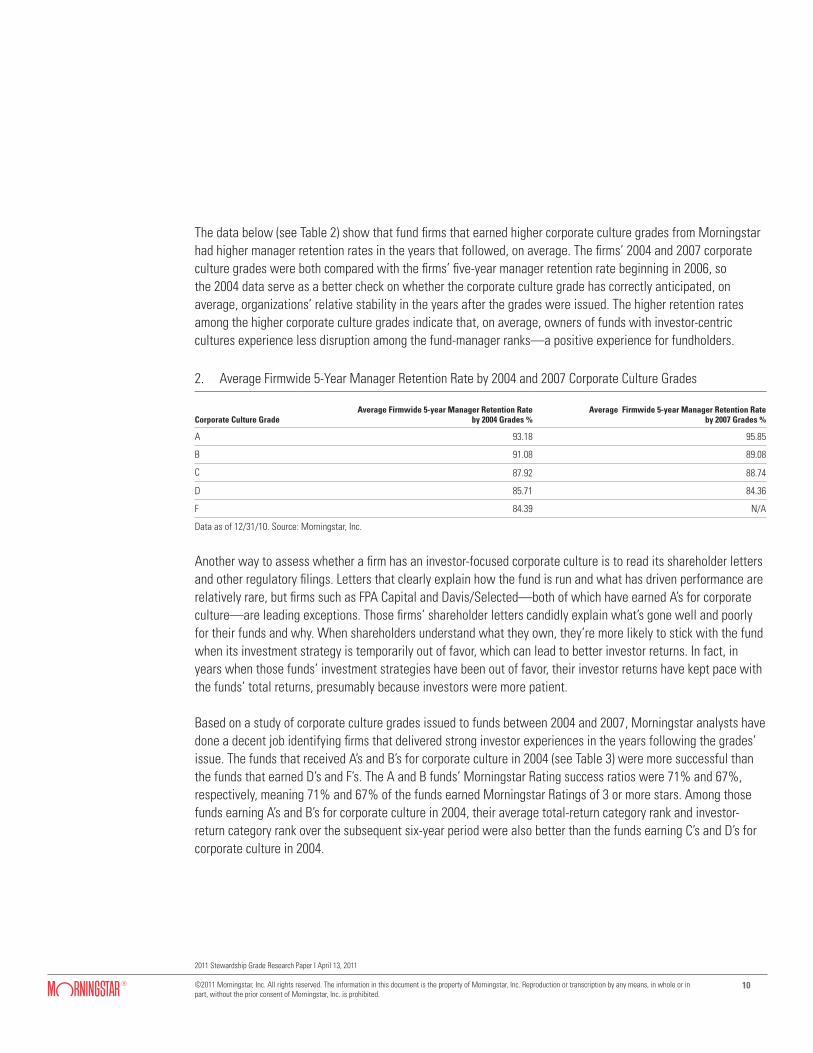
The data below (see Table 2) show that fund firms that earned higher corporate culture grades from Morningstar had higher manager retention rates in the years that followed, on average. The firms’ 2004 and 2007 corporate culture grades were both compared with the firms’ five-year manager retention rate beginning in 2006, so the 2004 data serve as a better check on whether the corporate culture grade has correctly anticipated, on average, organizations’ relative stability in the years after the grades were issued. The higher retention rates among the higher corporate culture grades indicate that, on average, owners of funds with investor-centric cultures experience less disruption among the fund-manager ranks—a positive experience for fundholders.
2. Average Firmwide 5-Year Manager Retention Rate by 2004 and 2007 Corporate Culture Grades
Corporate Culture GradeAverage Firmwide 5-year Manager Retention Rate
by 2004 Grades %Average Firmwide 5-year Manager Retention Rate
by 2007 Grades %
A 93.18 95.85
B 91.08 89.08
C 87.92 88.74
D 85.71 84.36
F 84.39 N/A
Data as of 12/31/10. Source: Morningstar, Inc.
Another way to assess whether a firm has an investor-focused corporate culture is to read its shareholder letters and other regulatory filings. Letters that clearly explain how the fund is run and what has driven performance are relatively rare, but firms such as FPA Capital and Davis/Selected—both of which have earned A’s for corporate culture—are leading exceptions. Those firms’ shareholder letters candidly explain what’s gone well and poorly for their funds and why. When shareholders understand what they own, they’re more likely to stick with the fund when its investment strategy is temporarily out of favor, which can lead to better investor returns. In fact, in years when those funds’ investment strategies have been out of favor, their investor returns have kept pace with the funds’ total returns, presumably because investors were more patient.
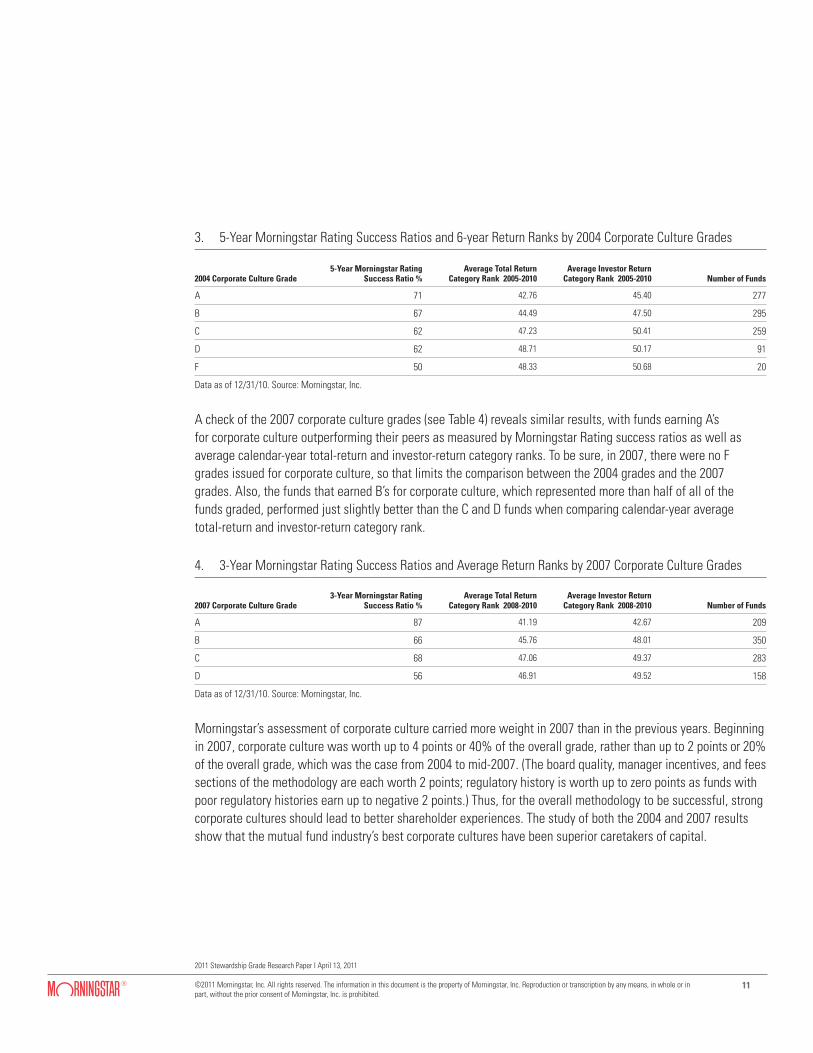
Based on a study of corporate culture grades issued to funds between 2004 and 2007, Morningstar analysts have done a decent job identifying firms that delivered strong investor experiences in the years following the grades’ issue. The funds that received A’s and B’s for corporate culture in 2004 (see Table 3) were more successful than the funds that earned D’s and F’s. The A and B funds’ Morningstar Rating success ratios were 71% and 67%, respectively, meaning 71% and 67% of the funds earned Morningstar Ratings of 3 or more stars. Among those funds earning A’s and B’s for corporate culture in 2004, their average total-return category rank and investor-return category rank over the subsequent six-year period were also better than the funds earning C’s and D’s for corporate culture in 2004.
11
2011 Stewardship Grade Research Paper I April 13, 2011
©2011 Morningstar, Inc. All rights reserved. The information in this document is the property of Morningstar, Inc. Reproduction or transcription by any means, in whole or in part, without the prior consent of Morningstar, Inc. is prohibited.
3. 5-Year Morningstar Rating Success Ratios and 6-year Return Ranks by 2004 Corporate Culture Grades
2004 Corporate Culture Grade5-Year Morningstar Rating
Success Ratio %Average Total Return
Category Rank 2005-2010Average Investor Return
Category Rank 2005-2010 Number of Funds
A 71 42.76 45.40 277
B 67 44.49 47.50 295
C 62 47.23 50.41 259
D 62 48.71 50.17 91
F 50 48.33 50.68 20
Data as of 12/31/10. Source: Morningstar, Inc.
A check of the 2007 corporate culture grades (see Table 4) reveals similar results, with funds earning A’s for corporate culture outperforming their peers as measured by Morningstar Rating success ratios as well as average calendar-year total-return and investor-return category ranks. To be sure, in 2007, there were no F grades issued for corporate culture, so that limits the comparison between the 2004 grades and the 2007 grades. Also, the funds that earned B’s for corporate culture, which represented more than half of all of the funds graded, performed just slightly better than the C and D funds when comparing calendar-year average total-return and investor-return category rank.
4. 3-Year Morningstar Rating Success Ratios and Average Return Ranks by 2007 Corporate Culture Grades
2007 Corporate Culture Grade3-Year Morningstar Rating
Success Ratio %Average Total Return
Category Rank 2008-2010Average Investor Return
Category Rank 2008-2010 Number of Funds
A 87 41.19 42.67 209
B 66 45.76 48.01 350
C 68 47.06 49.37 283
D 56 46.91 49.52 158
Data as of 12/31/10. Source: Morningstar, Inc.
Morningstar’s assessment of corporate culture carried more weight in 2007 than in the previous years. Beginning in 2007, corporate culture was worth up to 4 points or 40% of the overall grade, rather than up to 2 points or 20% of the overall grade, which was the case from 2004 to mid-2007. (The board quality, manager incentives, and fees sections of the methodology are each worth 2 points; regulatory history is worth up to zero points as funds with poor regulatory histories earn up to negative 2 points.) Thus, for the overall methodology to be successful, strong corporate cultures should lead to better shareholder experiences. The study of both the 2004 and 2007 results show that the mutual fund industry’s best corporate cultures have been superior caretakers of capital.
12
2011 Stewardship Grade Research Paper I April 13, 2011
©2011 Morningstar, Inc. All rights reserved. The information in this document is the property of Morningstar, Inc. Reproduction or transcription by any means, in whole or in part, without the prior consent of Morningstar, Inc. is prohibited.
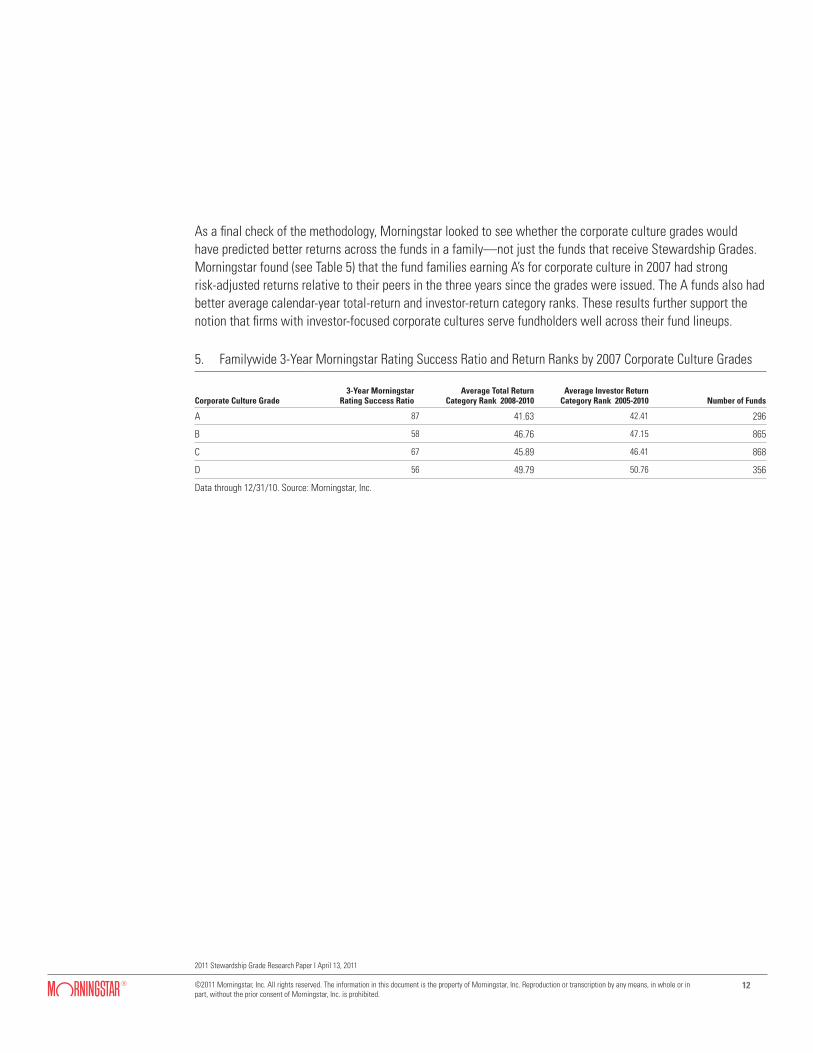
As a final check of the methodology, Morningstar looked to see whether the corporate culture grades would have predicted better returns across the funds in a family—not just the funds that receive Stewardship Grades. Morningstar found (see Table 5) that the fund families earning A’s for corporate culture in 2007 had strong risk-adjusted returns relative to their peers in the three years since the grades were issued. The A funds also had better average calendar-year total-return and investor-return category ranks. These results further support the notion that firms with investor-focused corporate cultures serve fundholders well across their fund lineups.
5. Familywide 3-Year Morningstar Rating Success Ratio and Return Ranks by 2007 Corporate Culture Grades
Corporate Culture Grade3-Year Morningstar
Rating Success RatioAverage Total Return
Category Rank 2008-2010Average Investor Return
Category Rank 2005-2010 Number of Funds
A 87 41.63 42.41 296
B 58 46.76 47.15 865
C 67 45.89 46.41 868
D 56 49.79 50.76 356
Data through 12/31/10. Source: Morningstar, Inc.
13
2011 Stewardship Grade Research Paper I April 13, 2011
©2011 Morningstar, Inc. All rights reserved. The information in this document is the property of Morningstar, Inc. Reproduction or transcription by any means, in whole or in part, without the prior consent of Morningstar, Inc. is prohibited.
Fund Board Quality
Mutual funds are structured like corporations, with independent boards of directors overseeing them. Most fund companies have a single fund board overseeing their mutual funds, but firms that have grown via acquisi-tion often have multiple boards. And at the American Funds, each fund has its own board—known internally as “clusters”—though most directors sit on more than one fund’s board.
Morningstar has changed its approach to assessing fund boards over the years. Prior to 2004, Morningstar’s fund analysts had little interaction with fund board directors, but since then, the analysts have interviewed directors from the majority of the boards overseeing funds that receive Stewardship Grades. Those conversations have provided critical insights into the fund-governance process and have helped Morningstar better assess fund boards and their actions.
For example, prior to 2007, the Stewardship Grade methodology considered how many funds directors oversee. Morningstar initially surmised that boards overseeing dozens, if not hundreds of funds, were spread too thin to be effective. But Morningstar found that boards had taken structural steps—dividing into committees or appointing internal experts on types of strategies—that allowed them to efficiently manage their workload. What’s more, some boards with long dockets of funds to oversee had demonstrated an ability to effectively serve fundholders’ best interests and wield more power over the funds’ advisor, while other boards with just a few funds to govern had not done as well. As such, Morningstar amended the Stewardship Grade methodology in 2007 to remove the work-load criteria and instead place more emphasis on whether the directors had done a good job for fundholders—regardless of how many funds they oversee.
Since mid-2007, Morningstar has considered three criteria when assessing fund boards. Those questions, and methodology weightings, follow:
3 Is the board highly independent? (25% of board quality score)3 Do the independent directors invest meaningfully in fund shares? (25% of board quality score)3 Has the board served fundholders well? (50% of board quality score)
One of the methodology changes Morningstar implemented in 2007 was to take a harder line on independent leadership of fund boards. Specifically, Morningstar looks to see whether the board is governed by an independent chairman and at least 75% independent directors. This is a standard that has been suggested by regulators but has never been enforced due to litigation in the mid-2000s by the U.S. Chamber of Commerce. Morningstar views independent leadership and a supermajority of independent directors to be an industry best practice because it helps the board manage (or mitigate) the conflicts of interest between the fund’s advisor and the fundholders. What may be good for the advisor’s bottom line, including higher fund fees and trendy funds intended to gather assets quickly, is not necessarily in fundholders’ best interest; and interested fund-board leadership cannot practically avoid this conflict. The fund board’s chief responsibility is to hire the funds’ advisor, and Morningstar finds it highly improbable that an interested fund board chairman would ever move to fire his employer.
14
2011 Stewardship Grade Research Paper I April 13, 2011
©2011 Morningstar, Inc. All rights reserved. The information in this document is the property of Morningstar, Inc. Reproduction or transcription by any means, in whole or in part, without the prior consent of Morningstar, Inc. is prohibited.
To meet Morningstar’s standard for independence, directors must have had no professional or financial ties to the firm that offers the funds they’re overseeing. This rule is stricter than that required by the SEC. For example, a former fund company executive who has been retired for five years would be considered independent by the SEC, but Morningstar would consider that director interested. The same goes for family members with ties to the funds’ parent company.
Investing in Fund SharesIn addition to assessing a board’s independence, Morningstar looks to see whether the independent fund directors invest in the funds they oversee. To earn credit for investment in fund shares, at least three fourths of the independent fund directors must invest in fund shares the equivalent of what they got paid for one year of fund-board service.
It can be difficult to tell whether many directors in fact meet this requirement because the maximum fund-share ownership range reported to the SEC in the funds’ annual Statement of Additional Information is “more than $100,000,” and most of the directors on boards that receive Stewardship Grades earn more than $100,000 per year for their work on the fund board. Morningstar assumes that directors who indicate they have more than $100,000 invested in fund shares meet Morningstar’s investment requirement.
Morningstar found that of the funds receiving Stewardship Grades in 2007, 92% were governed by fund boards that met the ownership standard. This suggests that at least among the firms that Morningstar studies for the Stewardship Grades, the independent directors have done a good job aligning their own financial interests with fundholders’. One might go so far as to suggest that such investments have become standard practice among fund boards. When shareholder-friendly moves become standard practice in the fund industry, Morningstar has dropped those criteria from its Stewardship Grade methodology, so the methodology rewards industry best practices—not standard operating procedures. The Stewardship Grade Committee may consider doing that with the director-investment criterion as well.
In addition to considering the board’s independence and investments in fund shares, Morningstar assesses the board’s service to shareholders. Fund boards that get high scores for serving shareholders well govern funds with fees that are lower than the peer-group norm. Boards that serve shareholders well also oversee a sensible lineup of funds—those with proven, repeatable investment processes that don’t harness fleeting market trends. Morningstar also considers the board’s record on closing funds with strategies that may be capacity constrained. Should a fund board go so far as to fire the advisor of a fund because of poor management, Morningstar would consider that a shareholder-friendly move as well, but that’s happened only a handful of times over the past 15 years.
Morningstar looked at each of these criteria to see if there was any correlation between aspects of the board governance and positive shareholder experiences. (Morningstar tested the individual components of the 2007
15
2011 Stewardship Grade Research Paper I April 13, 2011
©2011 Morningstar, Inc. All rights reserved. The information in this document is the property of Morningstar, Inc. Reproduction or transcription by any means, in whole or in part, without the prior consent of Morningstar, Inc. is prohibited.
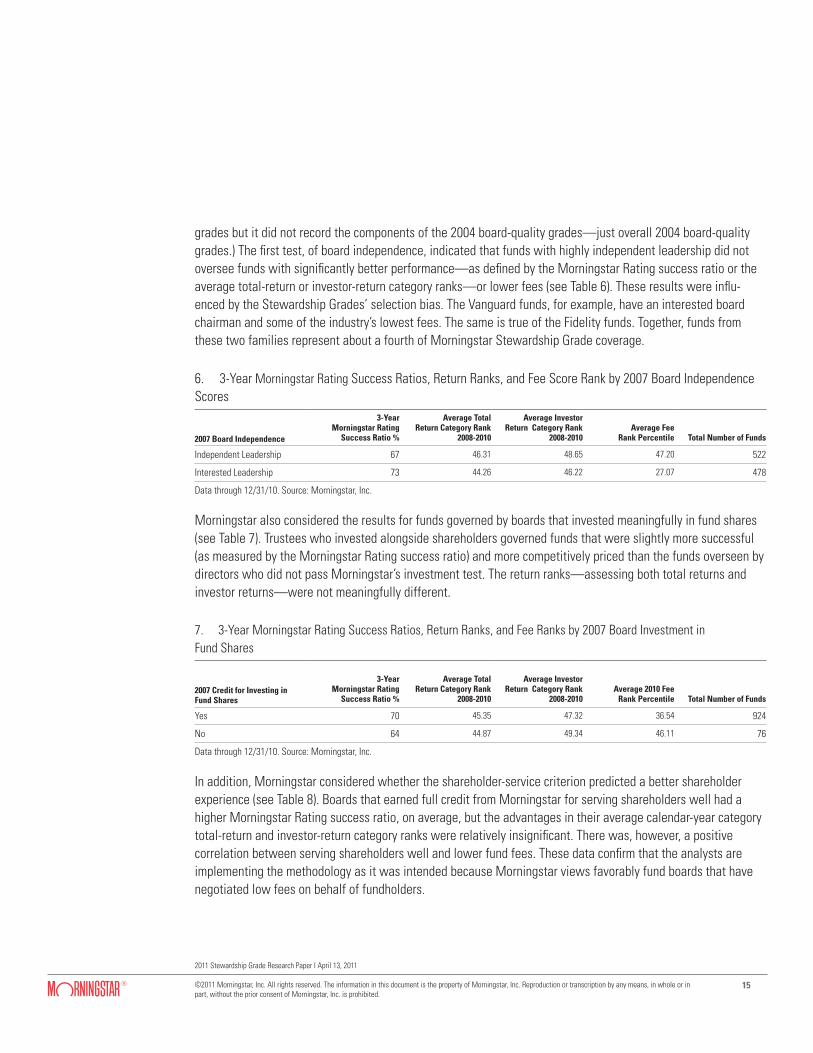
grades but it did not record the components of the 2004 board-quality grades—just overall 2004 board-quality grades.) The first test, of board independence, indicated that funds with highly independent leadership did not oversee funds with significantly better performance—as defined by the Morningstar Rating success ratio or the average total-return or investor-return category ranks—or lower fees (see Table 6). These results were influ-enced by the Stewardship Grades’ selection bias. The Vanguard funds, for example, have an interested board chairman and some of the industry’s lowest fees. The same is true of the Fidelity funds. Together, funds from these two families represent about a fourth of Morningstar Stewardship Grade coverage.
6. 3-Year Morningstar Rating Success Ratios, Return Ranks, and Fee Score Rank by 2007 Board Independence Scores
2007 Board Independence
3-Year Morningstar Rating
Success Ratio %
Average Total Return Category Rank
2008-2010
Average Investor Return Category Rank
2008-2010Average Fee
Rank Percentile Total Number of Funds
Independent Leadership 67 46.31 48.65 47.20 522
Interested Leadership 73 44.26 46.22 27.07 478
Data through 12/31/10. Source: Morningstar, Inc.
Morningstar also considered the results for funds governed by boards that invested meaningfully in fund shares (see Table 7). Trustees who invested alongside shareholders governed funds that were slightly more successful (as measured by the Morningstar Rating success ratio) and more competitively priced than the funds overseen by directors who did not pass Morningstar’s investment test. The return ranks—assessing both total returns and investor returns—were not meaningfully different.
7. 3-Year Morningstar Rating Success Ratios, Return Ranks, and Fee Ranks by 2007 Board Investment in Fund Shares
2007 Credit for Investing in Fund Shares
3-Year Morningstar Rating
Success Ratio %
Average Total Return Category Rank
2008-2010
Average Investor Return Category Rank
2008-2010Average 2010 Fee
Rank Percentile Total Number of Funds
Yes 70 45.35 47.32 36.54 924
No 64 44.87 49.34 46.11 76
Data through 12/31/10. Source: Morningstar, Inc.
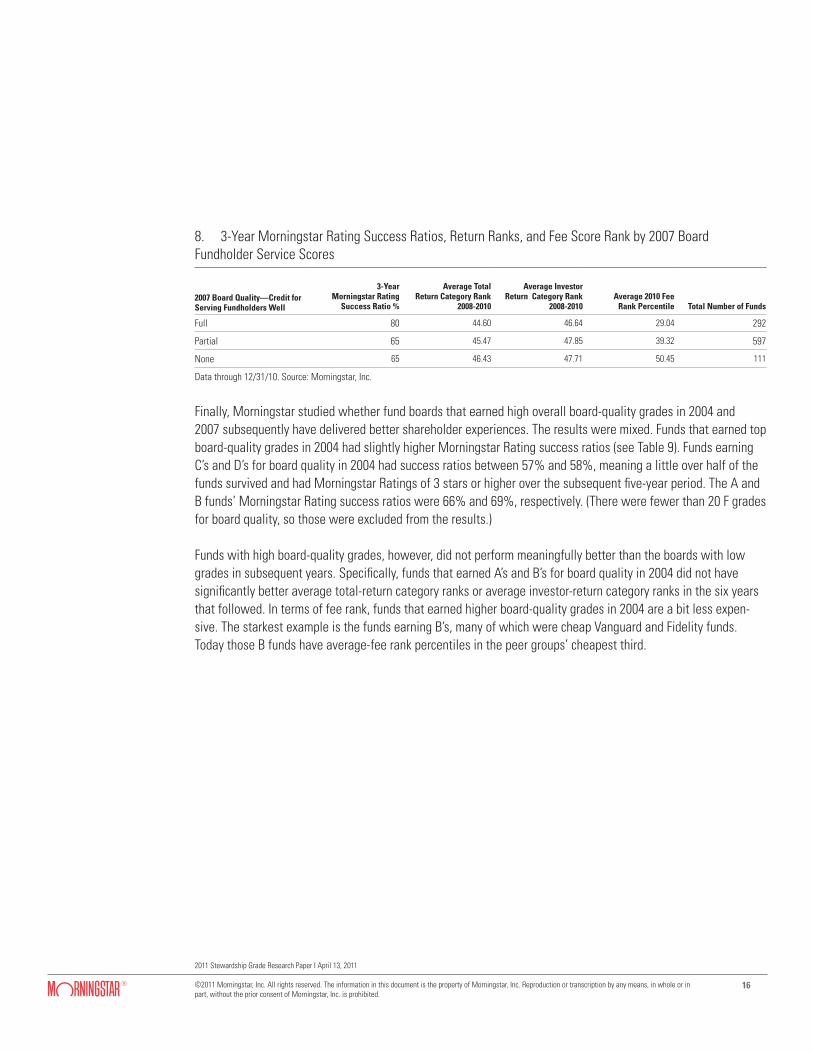
In addition, Morningstar considered whether the shareholder-service criterion predicted a better shareholder experience (see Table 8). Boards that earned full credit from Morningstar for serving shareholders well had a higher Morningstar Rating success ratio, on average, but the advantages in their average calendar-year category total-return and investor-return category ranks were relatively insignificant. There was, however, a positive correlation between serving shareholders well and lower fund fees. These data confirm that the analysts are implementing the methodology as it was intended because Morningstar views favorably fund boards that have negotiated low fees on behalf of fundholders.
16
2011 Stewardship Grade Research Paper I April 13, 2011
©2011 Morningstar, Inc. All rights reserved. The information in this document is the property of Morningstar, Inc. Reproduction or transcription by any means, in whole or in part, without the prior consent of Morningstar, Inc. is prohibited.
8. 3-Year Morningstar Rating Success Ratios, Return Ranks, and Fee Score Rank by 2007 Board Fundholder Service Scores
2007 Board Quality—Credit for Serving Fundholders Well
3-Year Morningstar Rating
Success Ratio %
Average Total Return Category Rank
2008-2010
Average Investor Return Category Rank
2008-2010Average 2010 Fee
Rank Percentile Total Number of Funds
Full 80 44.60 46.64 29.04 292
Partial 65 45.47 47.85 39.32 597
None 65 46.43 47.71 50.45 111
Data through 12/31/10. Source: Morningstar, Inc.
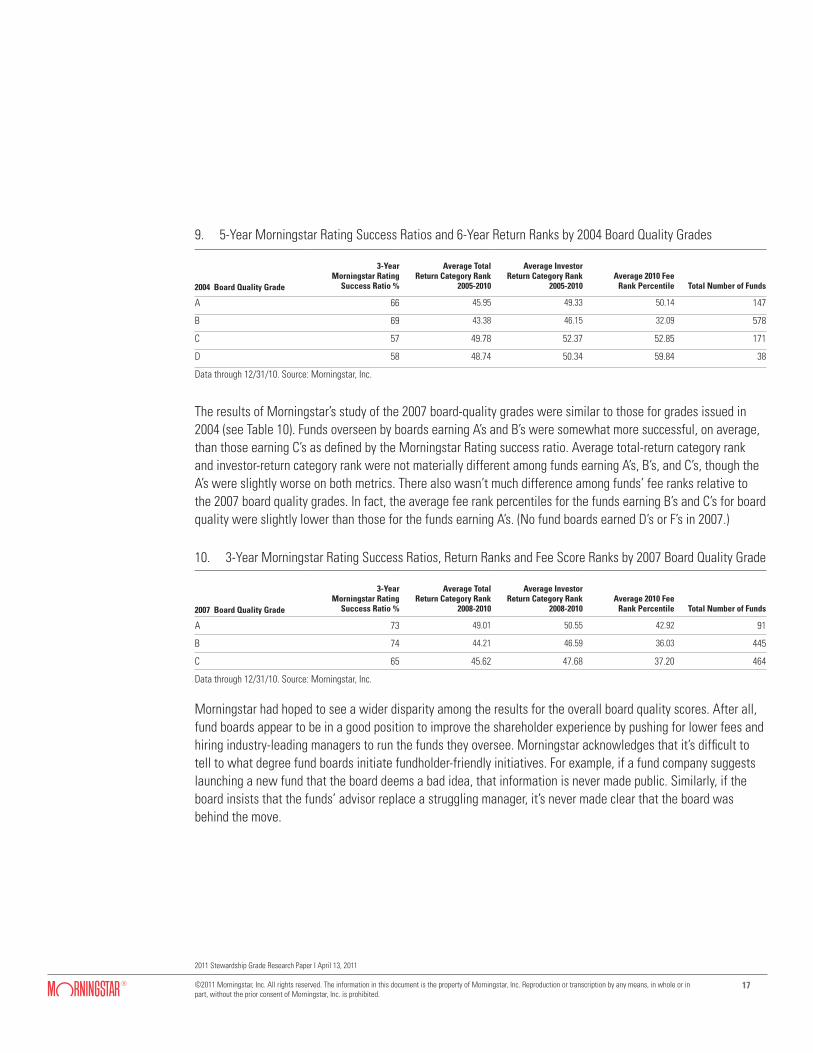
Finally, Morningstar studied whether fund boards that earned high overall board-quality grades in 2004 and 2007 subsequently have delivered better shareholder experiences. The results were mixed. Funds that earned top board-quality grades in 2004 had slightly higher Morningstar Rating success ratios (see Table 9). Funds earning C’s and D’s for board quality in 2004 had success ratios between 57% and 58%, meaning a little over half of the funds survived and had Morningstar Ratings of 3 stars or higher over the subsequent five-year period. The A and B funds’ Morningstar Rating success ratios were 66% and 69%, respectively. (There were fewer than 20 F grades for board quality, so those were excluded from the results.)
Funds with high board-quality grades, however, did not perform meaningfully better than the boards with low grades in subsequent years. Specifically, funds that earned A’s and B’s for board quality in 2004 did not have significantly better average total-return category ranks or average investor-return category ranks in the six years that followed. In terms of fee rank, funds that earned higher board-quality grades in 2004 are a bit less expen-sive. The starkest example is the funds earning B’s, many of which were cheap Vanguard and Fidelity funds. Today those B funds have average-fee rank percentiles in the peer groups’ cheapest third.
17
2011 Stewardship Grade Research Paper I April 13, 2011
©2011 Morningstar, Inc. All rights reserved. The information in this document is the property of Morningstar, Inc. Reproduction or transcription by any means, in whole or in part, without the prior consent of Morningstar, Inc. is prohibited.
9. 5-Year Morningstar Rating Success Ratios and 6-Year Return Ranks by 2004 Board Quality Grades
2004 Board Quality Grade
3-Year Morningstar Rating
Success Ratio %
Average Total Return Category Rank
2005-2010
Average Investor Return Category Rank
2005-2010Average 2010 Fee
Rank Percentile Total Number of Funds
A 66 45.95 49.33 50.14 147
B 69 43.38 46.15 32.09 578
C 57 49.78 52.37 52.85 171
D 58 48.74 50.34 59.84 38
Data through 12/31/10. Source: Morningstar, Inc.
The results of Morningstar’s study of the 2007 board-quality grades were similar to those for grades issued in 2004 (see Table 10). Funds overseen by boards earning A’s and B’s were somewhat more successful, on average, than those earning C’s as defined by the Morningstar Rating success ratio. Average total-return category rank and investor-return category rank were not materially different among funds earning A’s, B’s, and C’s, though the A’s were slightly worse on both metrics. There also wasn’t much difference among funds’ fee ranks relative to the 2007 board quality grades. In fact, the average fee rank percentiles for the funds earning B’s and C’s for board quality were slightly lower than those for the funds earning A’s. (No fund boards earned D’s or F’s in 2007.)
10. 3-Year Morningstar Rating Success Ratios, Return Ranks and Fee Score Ranks by 2007 Board Quality Grade
2007 Board Quality Grade
3-Year Morningstar Rating
Success Ratio %
Average Total Return Category Rank
2008-2010
Average Investor Return Category Rank
2008-2010Average 2010 Fee
Rank Percentile Total Number of Funds
A 73 49.01 50.55 42.92 91
B 74 44.21 46.59 36.03 445
C 65 45.62 47.68 37.20 464
Data through 12/31/10. Source: Morningstar, Inc.
Morningstar had hoped to see a wider disparity among the results for the overall board quality scores. After all, fund boards appear to be in a good position to improve the shareholder experience by pushing for lower fees and hiring industry-leading managers to run the funds they oversee. Morningstar acknowledges that it’s difficult to tell to what degree fund boards initiate fundholder-friendly initiatives. For example, if a fund company suggests launching a new fund that the board deems a bad idea, that information is never made public. Similarly, if the board insists that the funds’ advisor replace a struggling manager, it’s never made clear that the board was behind the move.
18
2011 Stewardship Grade Research Paper I April 13, 2011
©2011 Morningstar, Inc. All rights reserved. The information in this document is the property of Morningstar, Inc. Reproduction or transcription by any means, in whole or in part, without the prior consent of Morningstar, Inc. is prohibited.
From the BenchIt’s also difficult to tell whether fund-board directors drive hard bargains on fund fees. The peer groups that they construct to compare fees are not disclosed. In the Jones v. Harris fund-fee case, which was heard by the U.S. Supreme Court in November 2009, it was revealed that Oakmark Equity & Income, one of 295 moderate-allocation funds in Morningstar’s database, was only compared to 11 other funds as part of the board’s fee-review process. In another fee case, this one involving the American Funds, U.S. District Judge Gary Feess blasted the fund’s directors for not inquiring about compensation costs at the firm, and wrote in a December 2009 opinion that the board’s fee negotiation “seems less a true negotiation and more an elaborate exercise in checking off boxes.”
These court cases address an extremely small sample of fund boards’ work, and the boards involved in the litigation had each earned a B grade for board quality from Morningstar. Each met the standard for independence and board investment, though neither earned full credit for serving shareholders well. In fact, Morningstar specifically mentioned Oakmark’s higher fees as reason for withholding full credit for serving shareholders well. Meanwhile, Morningstar has been critical of the American Funds boards’ lack of attention to the funds’ massive size, particularly among the equity funds.
This broader study indicates that the board quality section of the Stewardship Grade did predict good sharehold-er experiences as measured by the Morningstar Rating success ratio, but the results here were not as strong as some other sections of the methodology. Morningstar believes, however, that the methodology may have had more-subtle benefits that are more difficult to measure. For example, it’s possible that Morningstar’s look at fund boards may have prompted better results for fundholders, even on the margins. Fund boards that know their service to shareholders is being scrutinized publicly by an independent researcher perhaps have additional incentive to do their jobs well.
19
2011 Stewardship Grade Research Paper I April 13, 2011
©2011 Morningstar, Inc. All rights reserved. The information in this document is the property of Morningstar, Inc. Reproduction or transcription by any means, in whole or in part, without the prior consent of Morningstar, Inc. is prohibited.
Manager Incentives
It stands to reason that mutual fund managers who have their own financial interests aligned with fundholders’ are more likely to serve those fundholders well. To determine whether the managers’ own financial success is aligned with fund shareholders’, Morningstar examines the managers’ investments in fund shares as well as the details of the managers’ pay plans. Both of these manager incentives are disclosed in the funds’ Statements of Additional Information, which are filed annually with the Securities and Exchange Commission.
The fund share ownership and pay plan disclosures are relatively new, first required only in 2005. Prior to this disclosure, Morningstar analysts informally asked fund managers about their ownership of fund shares, and beginning in mid-2004, Morningstar surveyed fund companies for this information. Not surprisingly, firms that were proud of their pay-plan structures and manager ownership of fund shares completed Morningstar’s survey, but most firms did not.
Assessing Skin in the GameSince fund firms began disclosing the fund managers’ ownership of fund shares in 2005, Morningstar has studied this disclosure for the manager-incentives portion of the Stewardship Grades. Managers who invest in the funds they run show conviction in their strategies and are more likely to act in the long-term interest of shareholders.
Manager ownership of fund shares is reported to the SEC in a series of ranges: zero; $0 to $10,000; $10,001 to $50,000; $50,001 to $100,000; $100,001 to $500,000; $500,001 to $1 million; and more than $1 million. These ownership bands do a reasonably good job measuring the absolute wealth managers have invested in the funds they run, but they don’t signal the investment’s significance relative to the fund manager’s investable assets.
In its initial 2004 survey for fund manager ownership details, Morningstar primarily was interested in whether the fund manager’s investment in fund shares represented more than one third of the manager’s liquid net worth because compensation can vary widely. Morningstar recognizes that just-promoted fund managers may have relatively little liquid net worth to commit to their fund, making a smaller investment a more-significant portion of the manager’s wealth. At the same time, seasoned, successful managers often earn millions per year, so even a $1 million commitment to a fund is relatively small, given the manager’s total net worth.
The type of fund a manager runs also may be relevant to whether or not he or she invests—and how much. Funds that would take on a core role in a manager’s portfolio earn full credit from Morningstar if management has more than $1 million invested in the fund, half credit if management has between $500,000 and $1 million in the fund, and no credit if the manager invests less than $500,000. In cases where funds are team-managed, credit for manager ownership of fund shares depends on where the majority of the managers’ investments fall. If a team-managed fund has a lead manager, that manager’s investment is weighted more heavily in determining the credit. Managers who do not meet the dollar-range standards for credit but have more than one third of their liquid net worth invested in the fund are eligible for credit so long as that information is provided to Morningstar and verified by the legal or compliance staff at the fund firm.
20
2011 Stewardship Grade Research Paper I April 13, 2011
©2011 Morningstar, Inc. All rights reserved. The information in this document is the property of Morningstar, Inc. Reproduction or transcription by any means, in whole or in part, without the prior consent of Morningstar, Inc. is prohibited.
Managers of funds that belong to noncore categories, peer groups that Morningstar’s fund analysts wouldn’t expect to be central to an individual’s portfolio—such as high-yield bonds or sector equity funds—are held to a different ownership standard. Those managers can earn full credit for ownership of noncore fund shares if they invest at least $100,000 in shares of the noncore fund and more than $1 million across the funds offered by the fund family. (Firmwide fund ownership disclosure is not required to the SEC, but it is voluntarily reported by firms such as T. Rowe Price. Morningstar views this additional public disclosure as an industry best practice because it demonstrates managers’ conviction in the fund family’s investment process. Other firms privately report firmwide ownership of fund shares directly to Morningstar.)
Morningstar analysts also look to see whether managers have exposure to their strategy through ownership of a similar fund. For example, if a fund manager runs three large-growth funds in a similar style but owns shares worth more than $1 million in just one of the three funds, Morningstar would grant all three funds credit for manager investment in fund shares when issuing Stewardship Grades to these funds. This is especially relevant for subadvised funds, where a manager may invest in the fund he runs that is offered directly by his employer, but not invest in other funds that he manages as a subadvisor using the same strategy.
Morningstar analysts do not consider fund managers’ investments in their strategies outside of mutual fund shares. Some fund managers invest in private investment vehicles, such as separately managed accounts, but these investments may be able to avoid some taxable events common at mutual funds and almost always sport lower fees that make it easier for the SMA to outperform. Managers who invest directly in fund shares support an industry best practice because the fund manager and the fundholder share the same ownership experience.
Parsing the Pay PlanIn addition to studying the managers’ ownership of fund shares, Morningstar also studies the managers’ compensation structure. Specifically, the analysts are looking to see whether the majority of a manager’s bonus compensation is dependent on the fund performing well over longer-term periods. (Morningstar has defined “longer term” as periods of four years or longer.) Morningstar has assumed that managers who get paid to deliver strong long-term returns are more likely to do so.
Similarly, Morningstar maintains that some incentive structures can work against shareholders’ best interests. Fund managers who get paid to deliver returns over relatively short periods, such as over a single calendar year, have incentive to trade more frequently (which can be expensive) and may produce more-volatile returns because they’re stretching for a strong short-term gain. Other pay plans reward managers for running more assets, poten-tially encouraging managers to spend more time selling their funds instead of researching investment ideas.
Managers paid based on assets under management also have incentive to keep their fund open to new investors well past the asset size where a fund’s strategy can be managed well. While some descriptions of
21
2011 Stewardship Grade Research Paper I April 13, 2011
©2011 Morningstar, Inc. All rights reserved. The information in this document is the property of Morningstar, Inc. Reproduction or transcription by any means, in whole or in part, without the prior consent of Morningstar, Inc. is prohibited.
managers’ bonus plans focus on criteria that aren’t well aligned with fundholders’ best interests, others simply lack meaningful detail or are extremely qualitative.
Fund managers who are compensated with equity in the asset manager also have incentives that don’t necessarily mesh with fundholders’. Specifically, the manager has incentive to grow the asset-management company’s assets under management so that his or her investment in the firm also appreciates. To be sure, it usually takes strong performance to achieve growth, and fundholders can benefit from such growth, particu-larly because larger funds often pass along economies of scale to fundholders via lower expense ratios. Fund managers with equity in the asset-management firm also may be less likely to leave for a competitor down the street, which could be a loss for fundholders. But potential conflicts also exist, particularly with regard to growing funds beyond a practical size—a sign that the fund’s manager is putting his own financial gain ahead of fundholders’ best interests.
Since 2007, Morningstar’s interpretation of the SAI disclosure has been relatively strict. Firms that specifically disclose that longer-term performance drives the majority of the managers’ bonus payment earn full credit for that portion of the manager-incentives grade. In cases where fund performance is a factor in determining bonus compensation, it’s often based on periods shorter than four years, or there’s no mention of which time periods are emphasized in the calculation. In these instances, the fund receives partial credit for aligning management’s compensation plan with fundholders’ best interests. In cases where fund performance is not a factor in determin-ing the bonus, the fund earns no credit for its manager-compensation plan.
There are a couple of exceptions to these criteria. One pertains to managers running index funds. Those manag-ers’ objective is not to outperform the index but to track it closely, so Morningstar looks to see whether the pay plan rewards managers for sticking close to the benchmark. Other exceptions have been granted based on additional, nonpublic information that a handful of fund firms submit to Morningstar to further describe the fund managers’ pay criteria beyond what’s included in the SAI. This additional information is helpful, but preferably it would be included in the SAI, so it’s available for all fund shareholders to consider.
Studying IncentivesMorningstar has studied fund manager incentives—particularly manager ownership of fund shares—several times since the disclosures were required by the SEC. The most recent study, in January 2011, found that funds with significant manager ownership have stronger performance records. (See “Want Fund Managers on Your Side? Pick Those That Walk the Line” on Morningstar.com, Jan. 10, 2011.) The study looked at fund manager ownership of core equity and fixed-income funds because managers of these core funds are most likely to use them as a primary investment in their own portfolios. Morningstar considered the equity and fixed-income funds independently because manager ownership in equity funds is more common. Only 25 bond funds were run by a manager with more than $1 million invested, while 392 equity funds met that test.
22
2011 Stewardship Grade Research Paper I April 13, 2011
©2011 Morningstar, Inc. All rights reserved. The information in this document is the property of Morningstar, Inc. Reproduction or transcription by any means, in whole or in part, without the prior consent of Morningstar, Inc. is prohibited.
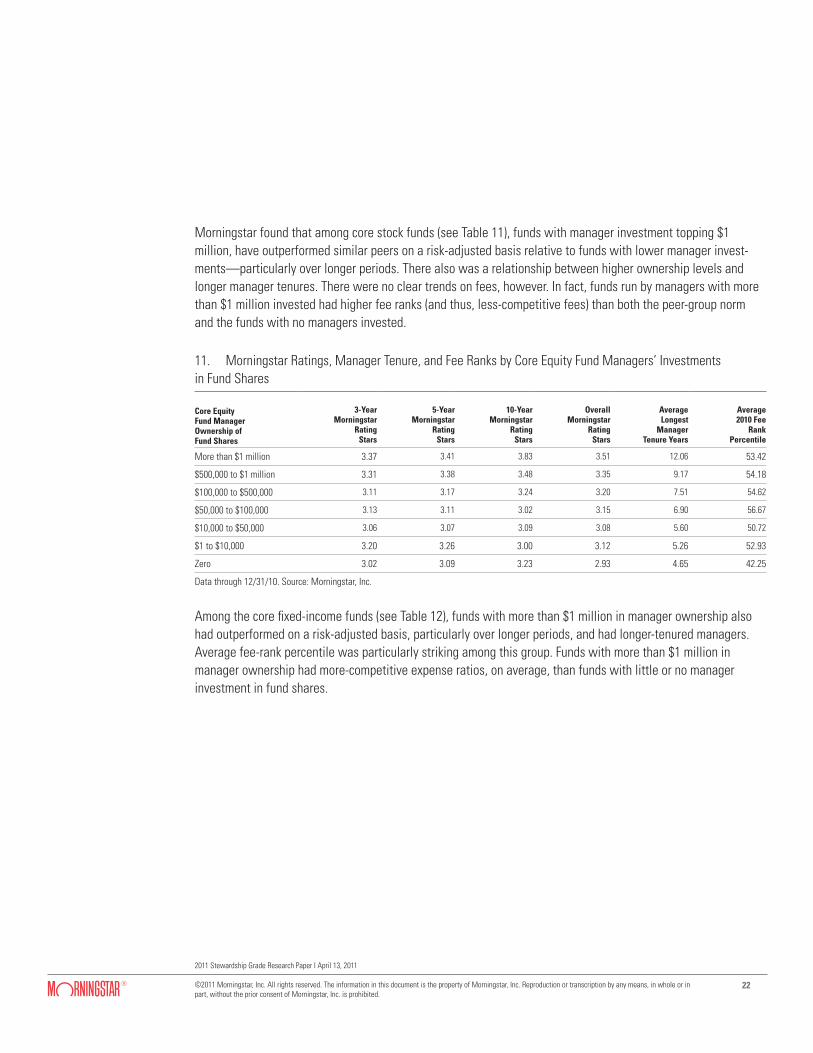
Morningstar found that among core stock funds (see Table 11), funds with manager investment topping $1 million, have outperformed similar peers on a risk-adjusted basis relative to funds with lower manager invest-ments—particularly over longer periods. There also was a relationship between higher ownership levels and longer manager tenures. There were no clear trends on fees, however. In fact, funds run by managers with more than $1 million invested had higher fee ranks (and thus, less-competitive fees) than both the peer-group norm and the funds with no managers invested.
11. Morningstar Ratings, Manager Tenure, and Fee Ranks by Core Equity Fund Managers’ Investments in Fund Shares
Core EquityFund Manager Ownership of Fund Shares
3-Year Morningstar
Rating Stars
5-Year Morningstar
Rating Stars
10-Year Morningstar
Rating Stars
Overall Morningstar
RatingStars
Average Longest
Manager Tenure Years
Average 2010 Fee
Rank Percentile
More than $1 million 3.37 3.41 3.83 3.51 12.06 53.42
$500,000 to $1 million 3.31 3.38 3.48 3.35 9.17 54.18
$100,000 to $500,000 3.11 3.17 3.24 3.20 7.51 54.62
$50,000 to $100,000 3.13 3.11 3.02 3.15 6.90 56.67
$10,000 to $50,000 3.06 3.07 3.09 3.08 5.60 50.72
$1 to $10,000 3.20 3.26 3.00 3.12 5.26 52.93
Zero 3.02 3.09 3.23 2.93 4.65 42.25
Data through 12/31/10. Source: Morningstar, Inc.
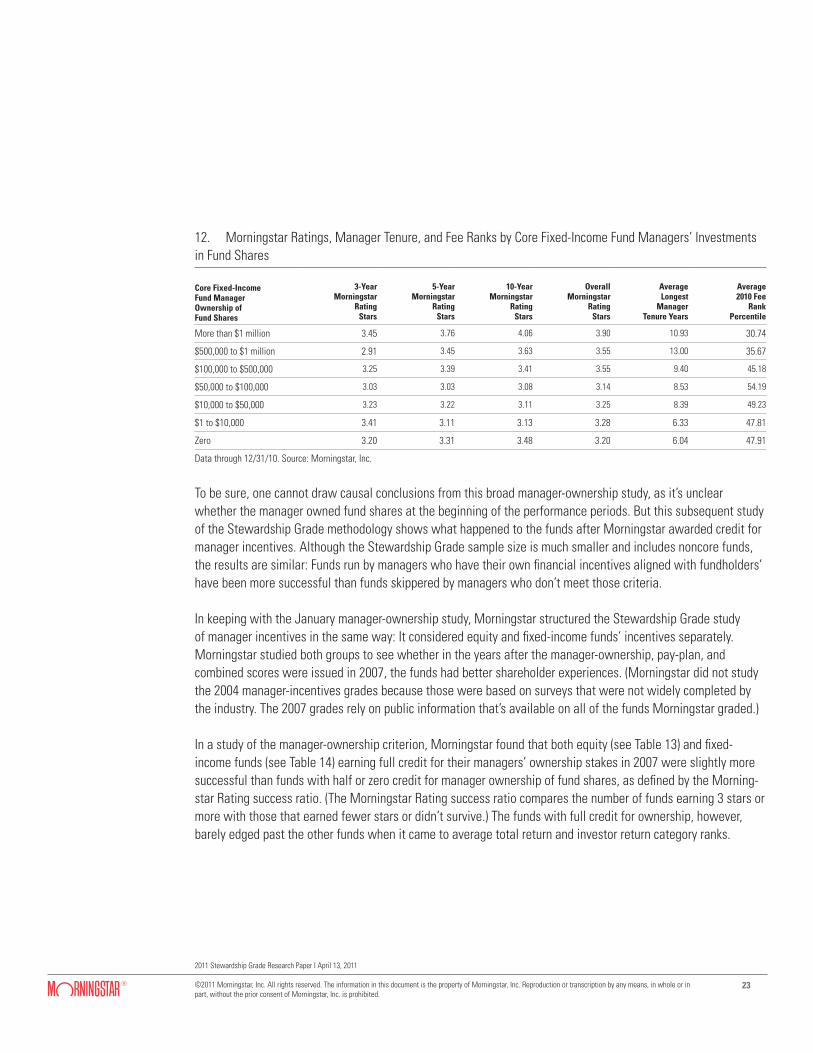
Among the core fixed-income funds (see Table 12), funds with more than $1 million in manager ownership also had outperformed on a risk-adjusted basis, particularly over longer periods, and had longer-tenured managers. Average fee-rank percentile was particularly striking among this group. Funds with more than $1 million in manager ownership had more-competitive expense ratios, on average, than funds with little or no manager investment in fund shares.
23
2011 Stewardship Grade Research Paper I April 13, 2011
©2011 Morningstar, Inc. All rights reserved. The information in this document is the property of Morningstar, Inc. Reproduction or transcription by any means, in whole or in part, without the prior consent of Morningstar, Inc. is prohibited.
12. Morningstar Ratings, Manager Tenure, and Fee Ranks by Core Fixed-Income Fund Managers’ Investments in Fund Shares
Core Fixed-Income Fund Manager Ownership of Fund Shares
3-Year Morningstar
Rating Stars
5-Year Morningstar
Rating Stars
10-Year Morningstar
Rating Stars
Overall Morningstar
RatingStars
Average Longest
Manager Tenure Years
Average 2010 Fee
Rank Percentile
More than $1 million 3.45 3.76 4.06 3.90 10.93 30.74
$500,000 to $1 million 2.91 3.45 3.63 3.55 13.00 35.67
$100,000 to $500,000 3.25 3.39 3.41 3.55 9.40 45.18
$50,000 to $100,000 3.03 3.03 3.08 3.14 8.53 54.19
$10,000 to $50,000 3.23 3.22 3.11 3.25 8.39 49.23
$1 to $10,000 3.41 3.11 3.13 3.28 6.33 47.81
Zero 3.20 3.31 3.48 3.20 6.04 47.91
Data through 12/31/10. Source: Morningstar, Inc.
To be sure, one cannot draw causal conclusions from this broad manager-ownership study, as it’s unclear whether the manager owned fund shares at the beginning of the performance periods. But this subsequent study of the Stewardship Grade methodology shows what happened to the funds after Morningstar awarded credit for manager incentives. Although the Stewardship Grade sample size is much smaller and includes noncore funds, the results are similar: Funds run by managers who have their own financial incentives aligned with fundholders’ have been more successful than funds skippered by managers who don’t meet those criteria.
In keeping with the January manager-ownership study, Morningstar structured the Stewardship Grade study of manager incentives in the same way: It considered equity and fixed-income funds’ incentives separately. Morningstar studied both groups to see whether in the years after the manager-ownership, pay-plan, and combined scores were issued in 2007, the funds had better shareholder experiences. (Morningstar did not study the 2004 manager-incentives grades because those were based on surveys that were not widely completed by the industry. The 2007 grades rely on public information that’s available on all of the funds Morningstar graded.)
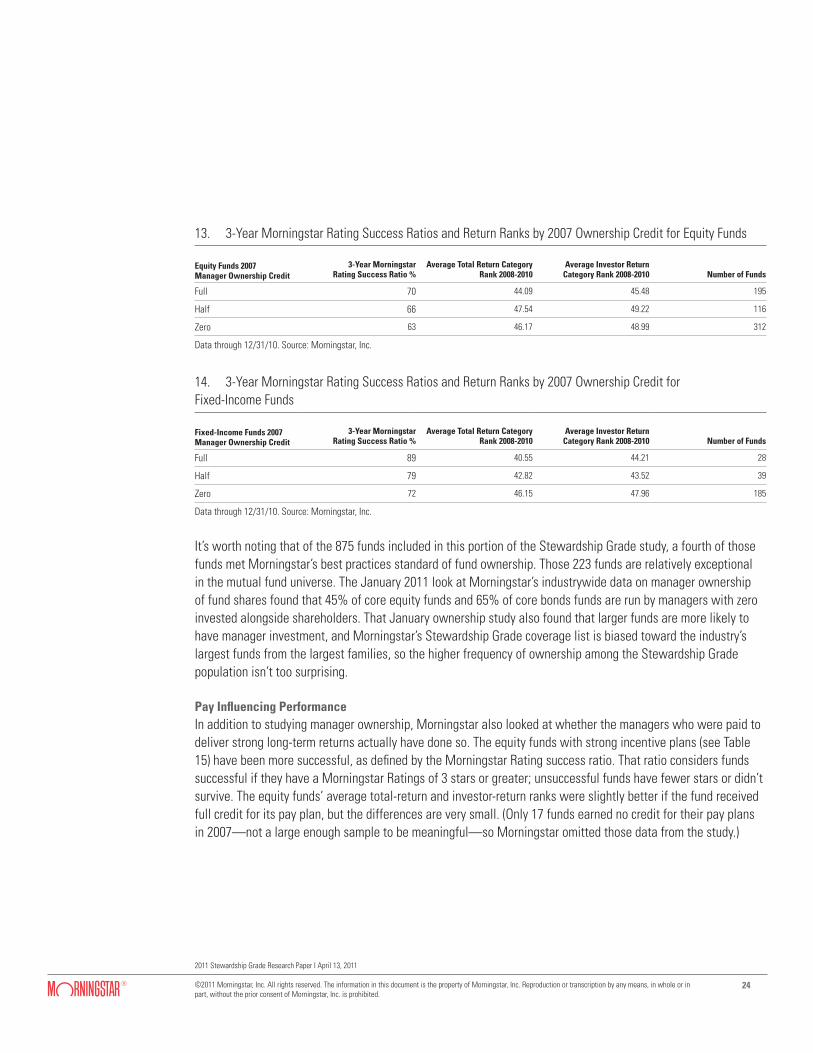
In a study of the manager-ownership criterion, Morningstar found that both equity (see Table 13) and fixed-income funds (see Table 14) earning full credit for their managers’ ownership stakes in 2007 were slightly more successful than funds with half or zero credit for manager ownership of fund shares, as defined by the Morning-star Rating success ratio. (The Morningstar Rating success ratio compares the number of funds earning 3 stars or more with those that earned fewer stars or didn’t survive.) The funds with full credit for ownership, however, barely edged past the other funds when it came to average total return and investor return category ranks.
24
2011 Stewardship Grade Research Paper I April 13, 2011
©2011 Morningstar, Inc. All rights reserved. The information in this document is the property of Morningstar, Inc. Reproduction or transcription by any means, in whole or in part, without the prior consent of Morningstar, Inc. is prohibited.
13. 3-Year Morningstar Rating Success Ratios and Return Ranks by 2007 Ownership Credit for Equity Funds
Equity Funds 2007 Manager Ownership Credit
3-Year Morningstar Rating Success Ratio %
Average Total Return Category Rank 2008-2010
Average Investor Return Category Rank 2008-2010 Number of Funds
Full 70 44.09 45.48 195
Half 66 47.54 49.22 116
Zero 63 46.17 48.99 312
Data through 12/31/10. Source: Morningstar, Inc.
14. 3-Year Morningstar Rating Success Ratios and Return Ranks by 2007 Ownership Credit for Fixed-Income Funds
Fixed-Income Funds 2007 Manager Ownership Credit
3-Year Morningstar Rating Success Ratio %
Average Total Return Category Rank 2008-2010
Average Investor Return Category Rank 2008-2010 Number of Funds
Full 89 40.55 44.21 28
Half 79 42.82 43.52 39
Zero 72 46.15 47.96 185
Data through 12/31/10. Source: Morningstar, Inc.
It’s worth noting that of the 875 funds included in this portion of the Stewardship Grade study, a fourth of those funds met Morningstar’s best practices standard of fund ownership. Those 223 funds are relatively exceptional in the mutual fund universe. The January 2011 look at Morningstar’s industrywide data on manager ownership of fund shares found that 45% of core equity funds and 65% of core bonds funds are run by managers with zero invested alongside shareholders. That January ownership study also found that larger funds are more likely to have manager investment, and Morningstar’s Stewardship Grade coverage list is biased toward the industry’s largest funds from the largest families, so the higher frequency of ownership among the Stewardship Grade population isn’t too surprising.
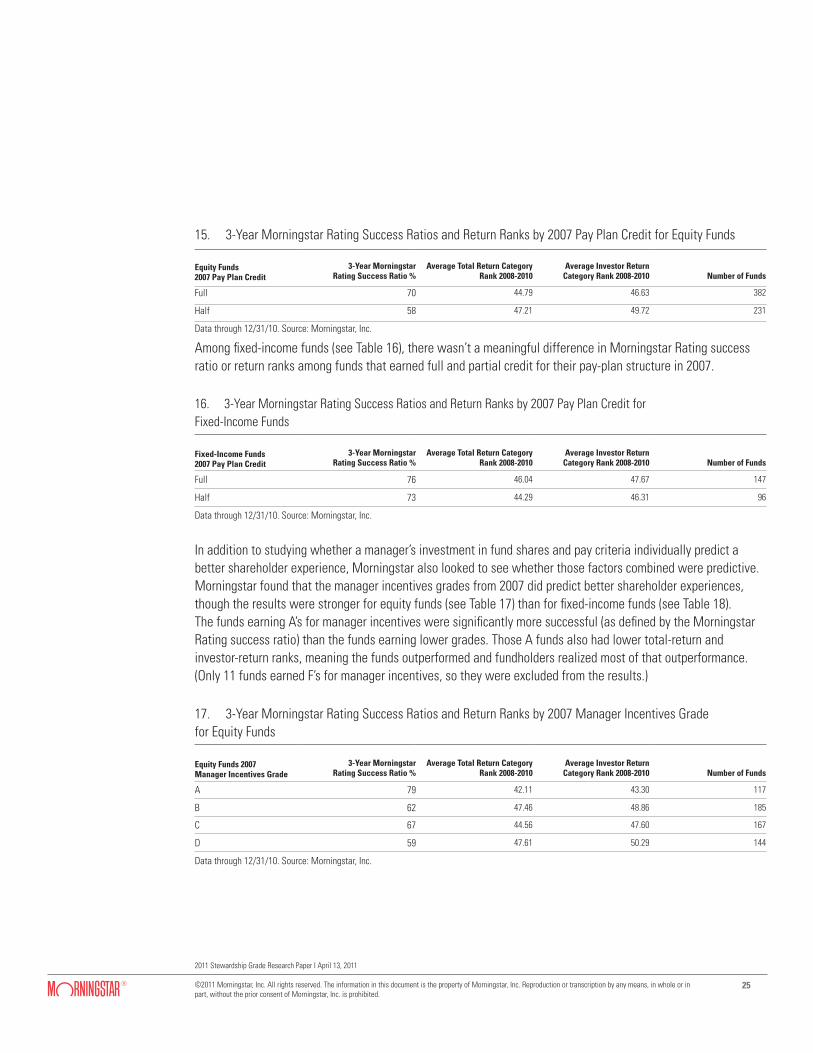
Pay Influencing PerformanceIn addition to studying manager ownership, Morningstar also looked at whether the managers who were paid to deliver strong long-term returns actually have done so. The equity funds with strong incentive plans (see Table 15) have been more successful, as defined by the Morningstar Rating success ratio. That ratio considers funds successful if they have a Morningstar Ratings of 3 stars or greater; unsuccessful funds have fewer stars or didn’t survive. The equity funds’ average total-return and investor-return ranks were slightly better if the fund received full credit for its pay plan, but the differences are very small. (Only 17 funds earned no credit for their pay plans in 2007—not a large enough sample to be meaningful—so Morningstar omitted those data from the study.)
25
2011 Stewardship Grade Research Paper I April 13, 2011
©2011 Morningstar, Inc. All rights reserved. The information in this document is the property of Morningstar, Inc. Reproduction or transcription by any means, in whole or in part, without the prior consent of Morningstar, Inc. is prohibited.
15. 3-Year Morningstar Rating Success Ratios and Return Ranks by 2007 Pay Plan Credit for Equity Funds
Equity Funds2007 Pay Plan Credit
3-Year Morningstar Rating Success Ratio %
Average Total Return Category Rank 2008-2010
Average Investor Return Category Rank 2008-2010 Number of Funds
Full 70 44.79 46.63 382
Half 58 47.21 49.72 231
Data through 12/31/10. Source: Morningstar, Inc.
Among fixed-income funds (see Table 16), there wasn’t a meaningful difference in Morningstar Rating success ratio or return ranks among funds that earned full and partial credit for their pay-plan structure in 2007.
16. 3-Year Morningstar Rating Success Ratios and Return Ranks by 2007 Pay Plan Credit for Fixed-Income Funds
Fixed-Income Funds2007 Pay Plan Credit
3-Year Morningstar Rating Success Ratio %
Average Total Return Category Rank 2008-2010
Average Investor Return Category Rank 2008-2010 Number of Funds
Full 76 46.04 47.67 147
Half 73 44.29 46.31 96
Data through 12/31/10. Source: Morningstar, Inc.
In addition to studying whether a manager’s investment in fund shares and pay criteria individually predict a better shareholder experience, Morningstar also looked to see whether those factors combined were predictive. Morningstar found that the manager incentives grades from 2007 did predict better shareholder experiences, though the results were stronger for equity funds (see Table 17) than for fixed-income funds (see Table 18). The funds earning A’s for manager incentives were significantly more successful (as defined by the Morningstar Rating success ratio) than the funds earning lower grades. Those A funds also had lower total-return and investor-return ranks, meaning the funds outperformed and fundholders realized most of that outperformance. (Only 11 funds earned F’s for manager incentives, so they were excluded from the results.)
17. 3-Year Morningstar Rating Success Ratios and Return Ranks by 2007 Manager Incentives Grade for Equity Funds
Equity Funds 2007 Manager Incentives Grade
3-Year Morningstar Rating Success Ratio %
Average Total Return Category Rank 2008-2010
Average Investor Return Category Rank 2008-2010 Number of Funds
A 79 42.11 43.30 117
B 62 47.46 48.86 185
C 67 44.56 47.60 167
D 59 47.61 50.29 144
Data through 12/31/10. Source: Morningstar, Inc.
26
2011 Stewardship Grade Research Paper I April 13, 2011
©2011 Morningstar, Inc. All rights reserved. The information in this document is the property of Morningstar, Inc. Reproduction or transcription by any means, in whole or in part, without the prior consent of Morningstar, Inc. is prohibited.
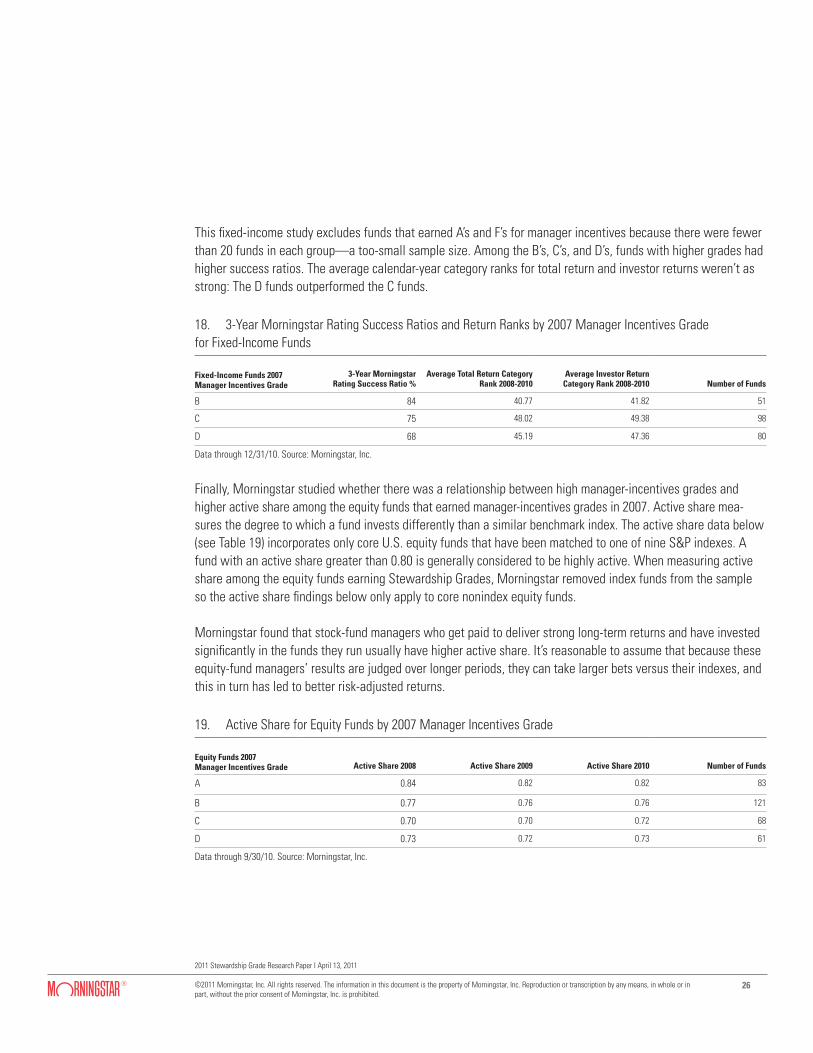
This fixed-income study excludes funds that earned A’s and F’s for manager incentives because there were fewer than 20 funds in each group—a too-small sample size. Among the B’s, C’s, and D’s, funds with higher grades had higher success ratios. The average calendar-year category ranks for total return and investor returns weren’t as strong: The D funds outperformed the C funds.
18. 3-Year Morningstar Rating Success Ratios and Return Ranks by 2007 Manager Incentives Grade for Fixed-Income Funds
Fixed-Income Funds 2007 Manager Incentives Grade
3-Year Morningstar Rating Success Ratio %
Average Total Return Category Rank 2008-2010
Average Investor Return Category Rank 2008-2010 Number of Funds
B 84 40.77 41.82 51
C 75 48.02 49.38 98
D 68 45.19 47.36 80
Data through 12/31/10. Source: Morningstar, Inc.
Finally, Morningstar studied whether there was a relationship between high manager-incentives grades and higher active share among the equity funds that earned manager-incentives grades in 2007. Active share mea-sures the degree to which a fund invests differently than a similar benchmark index. The active share data below (see Table 19) incorporates only core U.S. equity funds that have been matched to one of nine S&P indexes. A fund with an active share greater than 0.80 is generally considered to be highly active. When measuring active share among the equity funds earning Stewardship Grades, Morningstar removed index funds from the sample so the active share findings below only apply to core nonindex equity funds.
Morningstar found that stock-fund managers who get paid to deliver strong long-term returns and have invested significantly in the funds they run usually have higher active share. It’s reasonable to assume that because these equity-fund managers’ results are judged over longer periods, they can take larger bets versus their indexes, and this in turn has led to better risk-adjusted returns.
19. Active Share for Equity Funds by 2007 Manager Incentives Grade
Equity Funds 2007 Manager Incentives Grade Active Share 2008 Active Share 2009 Active Share 2010 Number of Funds
A 0.84 0.82 0.82 83
B 0.77 0.76 0.76 121
C 0.70 0.70 0.72 68
D 0.73 0.72 0.73 61
Data through 9/30/10. Source: Morningstar, Inc.
27
2011 Stewardship Grade Research Paper I April 13, 2011
©2011 Morningstar, Inc. All rights reserved. The information in this document is the property of Morningstar, Inc. Reproduction or transcription by any means, in whole or in part, without the prior consent of Morningstar, Inc. is prohibited.
Fees
In its decades of research on mutual funds, Morningstar consistently has been a proponent of low mutual fund fees because the lower the fund fee, the more likely a fund is to outperform its peers. Fee levels also are a good litmus test for fund companies, specifically how they manage the conflict between their own business interests (which benefit from higher fees) and their fundholders (who benefit from lower fees). It’s no surprise, therefore, that fees would play a central role in the Stewardship Grade methodology.
Technically, Morningstar looks at fees three times as part of the Stewardship Grade methodology: once in the corporate culture section as a broad gauge of a firm’s fundholder-friendliness; second, as a test of whether the mutual fund board is serving shareholders well; and third, in the fees portion of the methodology. Granted, those first two looks are smaller pieces of a larger qualitative analysis, so fees play a supporting role in the assessments of corporate culture and the board’s service to shareholders. In the fees portion of the Stewardship Grade methodology, the fund’s expense ratio plays a starring role.
The Stewardship Grades’ fee methodology has evolved over the years. It began as a relatively simple comparison of fees by Morningstar category as well as a look at a fund’s fees relative to its asset size. Funds that lowered their fees as assets grew were rewarded by the original 2004 methodology, as were funds with breakpoint schedules, which guaranteed that fees would go down as the fund’s assets expanded.
About a year after the Stewardship Grades’ launch, however, Morningstar made some changes to its fee com-parisons. Rather than comparing funds simply by category, Morningstar broadened the peer groups to include funds in the same market-cap range, across investment styles. So previously, large-value funds would be compared against one another; but later, Morningstar expanded the comparison group to include all large-cap funds (value, blend, and growth) because the costs of running a large-cap fund—regardless of investment style—should be similar.
Morningstar also changed the fee comparison so that it grouped fund share classes that are sold to similar types of investors. Within the supercategories, Morningstar separated funds by share class type, so, for example, no-load investor shares are corralled in the same peer group, as are high-minimum institutional shares, front-load shares, and so on. This approach acknowledges that fundholders who invest on their own are unlikely to consider buying front-load A shares from an advisor-sold fund company and vice versa.
This move to compare fund fees by supercategory and share class type has rewarded some funds with higher grades than they would have earned under the previous methodology. For example, value funds have easier comparisons because they’re on average cheaper than the growth funds that invest in the same market-cap range. (The average large-value fund, for example, sports an annual expense ratio of 1.27%, while the average large-growth fund charges 1.33%.) Advisor-sold share classes also have easier comparisons. Within a peer group that includes all types of share classes, A and B shares usually are more expensive than Investor shares or Institutional shares. But by limiting a peer group to just A shares, the cheapest among that share class type
28
2011 Stewardship Grade Research Paper I April 13, 2011
©2011 Morningstar, Inc. All rights reserved. The information in this document is the property of Morningstar, Inc. Reproduction or transcription by any means, in whole or in part, without the prior consent of Morningstar, Inc. is prohibited.
are able to earn A fee grades from Morningstar. Meanwhile, Investor share classes that are more expensive than the Investor-shares norm end up with poor grades, even though relative to A and B shares, those more-expensive Investor shares still look cheap.
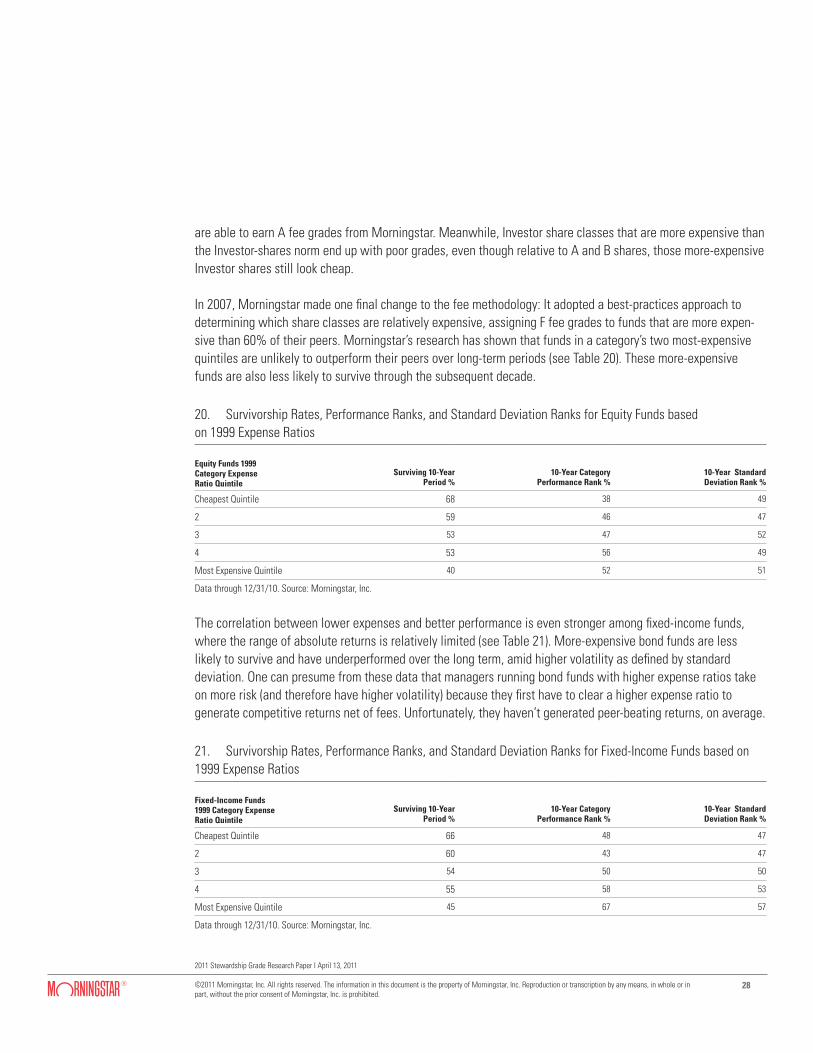
In 2007, Morningstar made one final change to the fee methodology: It adopted a best-practices approach to determining which share classes are relatively expensive, assigning F fee grades to funds that are more expen-sive than 60% of their peers. Morningstar’s research has shown that funds in a category’s two most-expensive quintiles are unlikely to outperform their peers over long-term periods (see Table 20). These more-expensive funds are also less likely to survive through the subsequent decade.
20. Survivorship Rates, Performance Ranks, and Standard Deviation Ranks for Equity Funds based on 1999 Expense Ratios
Equity Funds 1999Category Expense Ratio Quintile
Surviving 10-Year Period %
10-Year Category Performance Rank %
10-Year Standard Deviation Rank %
Cheapest Quintile 68 38 49
2 59 46 47
3 53 47 52
4 53 56 49
Most Expensive Quintile 40 52 51
Data through 12/31/10. Source: Morningstar, Inc.
The correlation between lower expenses and better performance is even stronger among fixed-income funds, where the range of absolute returns is relatively limited (see Table 21). More-expensive bond funds are less likely to survive and have underperformed over the long term, amid higher volatility as defined by standard deviation. One can presume from these data that managers running bond funds with higher expense ratios take on more risk (and therefore have higher volatility) because they first have to clear a higher expense ratio to generate competitive returns net of fees. Unfortunately, they haven’t generated peer-beating returns, on average.
21. Survivorship Rates, Performance Ranks, and Standard Deviation Ranks for Fixed-Income Funds based on 1999 Expense Ratios
Fixed-Income Funds 1999 Category Expense Ratio Quintile
Surviving 10-Year Period %
10-Year Category Performance Rank %
10-Year Standard Deviation Rank %
Cheapest Quintile 66 48 47
2 60 43 47
3 54 50 50
4 55 58 53
Most Expensive Quintile 45 67 57
Data through 12/31/10. Source: Morningstar, Inc.
29
2011 Stewardship Grade Research Paper I April 13, 2011
©2011 Morningstar, Inc. All rights reserved. The information in this document is the property of Morningstar, Inc. Reproduction or transcription by any means, in whole or in part, without the prior consent of Morningstar, Inc. is prohibited.
As part of this Stewardship Grade study, Morningstar tested to see whether the performance trends by fee quintile among categories were similar to performance trends among funds sorted by supercategory and share class type. Morningstar went beyond the funds receiving Stewardship Grades and tested all of the expense ratios in its mutual fund universe on Dec. 31, 2010. Morningstar started by sorting the fund universe by supercat-egory and share class type, per the fee methodology for the Stewardship Grades. Then it calculated the average Morningstar Risk-Adjusted Return, or MRAR, for each peer group based on three-, five-, and 10-year returns. Then Morningstar looked to see what percentage of the funds—by fee rank quintile—had MRARs that exceeded the peer-group average.
As the name suggests, MRAR compares peers’ performance on a risk-adjusted basis. Morningstar chose it for this comparison because earlier fee studies suggest that managers running funds with higher expense ratios often take additional risk to generate higher returns—particularly among fixed-income funds.
The results (see Table 22) were fairly consistent with those in the category-based comparisons above. Funds in the cheapest quintiles were more likely to outperform the average MRARs, particularly over the longer periods. Over a decade, for example, 63% of the cheapest funds in each peer group had MRARs that were better than the peer-group average MRARs. Meanwhile, only 41% of the most-expensive funds’ MRARs were better than the peer-group average over the subsequent 10-year period. These results support the philosophy behind the fee methodology for the Stewardship Grades: Funds with higher fees are unlikely to outperform their peers over long periods.
22. Percentage of Funds with Morningstar Risk-Adjusted Returns Beating Average by Supercategory and Share Class Type
Fee Quintile by Supercat-egory and Share Class Type
3-Year MRAR Beats Peer Group Average %
5-year MRAR Beats Peer Group Average %
10-year MRAR BeatsPeer Group Average %
Cheapest Quintile 60 64 63
2 56 58 58
3 55 55 53
4 55 53 51
Most Expensive Quintile 48 44 41
Data through 12/31/10. Source: Morningstar, Inc.
It’s worth noting that under the fee methodology, funds in the fourth and most-expensive quintiles would both earn F grades, though the long-term returns for the third and fourth quintile are not significantly different. The most-expensive quintile certainly is to be avoided as most funds in that group did not outperform on a risk-adjusted basis.
30
2011 Stewardship Grade Research Paper I April 13, 2011
©2011 Morningstar, Inc. All rights reserved. The information in this document is the property of Morningstar, Inc. Reproduction or transcription by any means, in whole or in part, without the prior consent of Morningstar, Inc. is prohibited.
Regulatory History
Given the Stewardship Grades’ roots in the industry’s market-timing and fast-trading scandal, the methodology unsurprisingly considers funds’ regulatory history. Firms that have complied with the letter and spirit of fund regulation have demonstrated that they treat their fundholders fairly.
Like other sections of the methodology, Morningstar’s approach to assessing funds’ compliance records has shifted over the years. When the grades first launched in 2004, funds had an opportunity to earn up to 2 points toward the 10-point Stewardship Grade if their compliance record was perfect. Firms that had major regulatory mishaps in the recent past had up to 2 points subtracted from the overall score.
In 2007, Morningstar amended the methodology so that the maximum regulatory history score was zero. This change was consistent with the idea that the methodology should reward best practices and that following industry regulation should be standard operating procedure for any member of the industry—not a best practice. As such, Morningstar altered the methodology so that firms facing regulatory scrutiny or accused of wrongdoing earned regulatory history grades less than an A and had up to 2 points taken away from the overall Stewardship Grade. (The maximum overall points each fund can earn has remained 10.)
For firms that were accused of wrongdoing in the past, Morningstar has raised their funds’ regulatory scores as they’ve demonstrated that past problems are unlikely to be repeated. Fund companies that were involved in the market-timing and fast-trading scandal of 2003 and 2004 often upgraded their compliance efforts—at regulators’ insistence—and most dismissed senior leaders that endorsed the trading practices that violated the funds’ prospectuses. Such actions demonstrated a greater commitment to changing the firms’ culture of compliance, and over a period of six to seven years, those firms’ regulatory history scores were raised to zero.
Morningstar studied how funds fared in the years after the regulatory history grades were issued, and funds with very poor regulatory history grades often didn’t survive. Of the 52 funds that earned regulatory history scores of zero or lower in 2004, 29% have either been merged into other offerings or have been liquidated. (The survival rate for funds with strong regulatory history scores is about 90% for the 2004 and 2007 periods.) Investors may conclude from this data that funds with poor regulatory histories are to be avoided primarily because they may not survive and therefore would need to be replaced in one’s portfolio.
Because the survival rate for funds with poor regulatory history scores is so low, it’s difficult to draw other conclusions about the funds because the sample size is so small. Also, the high death rate among the funds creates significant survivorship bias in the data set as industry-leading funds are rarely merged away. Thus, the remaining funds face stiffer competition because the weaker offerings are gone. Even so, Morningstar would not expect there to be a strong connection between regulatory compliance and performance. A fund company that values compliance as part of its culture is indeed more fundholder-friendly, but that does not have a direct impact on performance in the same manner as corporate culture, fund board quality, manager incentives, and fees do.
31
2011 Stewardship Grade Research Paper I April 13, 2011
©2011 Morningstar, Inc. All rights reserved. The information in this document is the property of Morningstar, Inc. Reproduction or transcription by any means, in whole or in part, without the prior consent of Morningstar, Inc. is prohibited.
One would hope that fund firms with poor regulatory histories would be less likely to have similar infractions going forward because of improvements in compliance and a once-bitten, twice-shy mentality. This has been true for most of the firms accused of wrongdoing during the market-timing era, including AllianceBernstein, Federated, Janus, MFS, and Putnam.
But other firms have been repeat offenders since 2003 and 2004, including Schwab and the Evergreen Funds, which are now part of the Wells Fargo Advantage family. Most recently, Schwab has faced controversy over some of its fixed-income funds, particularly a YieldPlus fund that regulators say was marketed as a money-market alternative, even though it invested in riskier, higher-yielding securities that posted steep losses in the 2007-08 market crash. During the same liquidity crisis, Evergreen was accused of mispricing illiquid securities of one of its fixed-income funds. When the firm later repriced the fund’s holdings, it informed only some fund-holders of the reasons behind the fluctuations in the fund’s net asset value.
The current regulatory history grades, which are detailed in the final section of this paper, are nearly all A’s as the industry has been relatively light on scandal since the market-timing era. (Schwab and Wells Fargo Advantage funds currently do not receive Stewardship Grades from Morningstar.) But Morningstar intends to maintain this section of the methodology. At a minimum, the text supporting this section of the Stewardship Grades details a firm’s past infractions, which were strong examples of the firms putting their own interests before fundholders’.
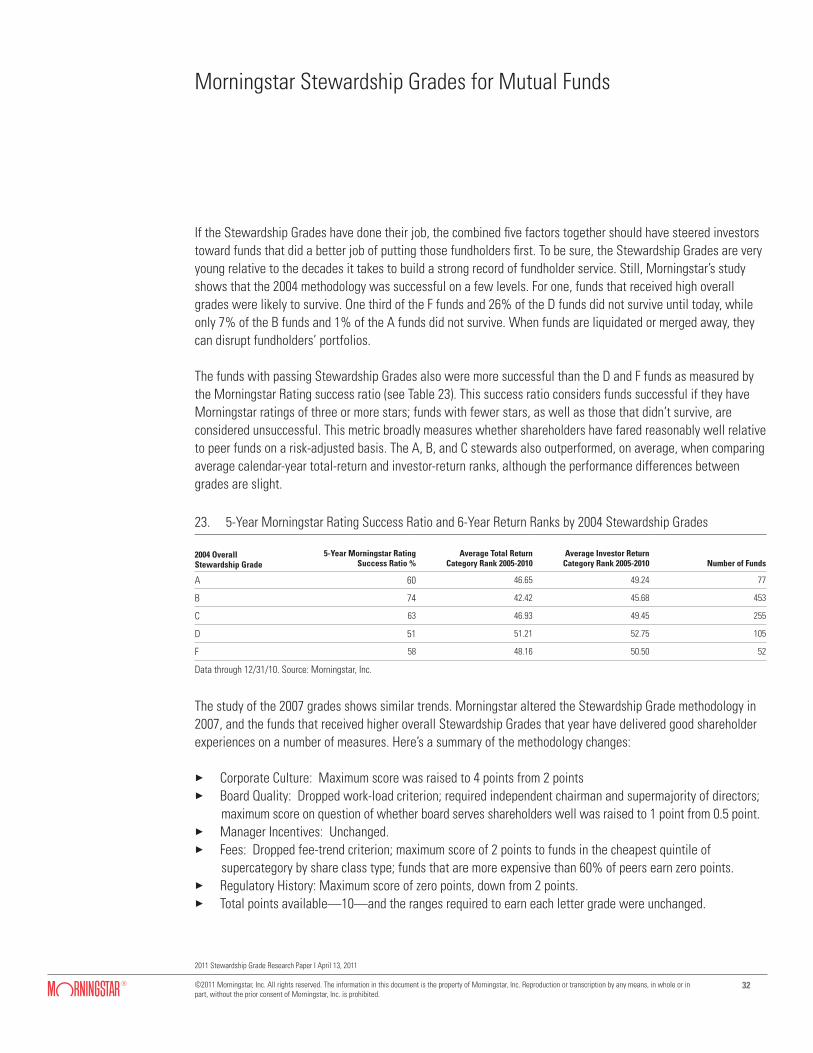
32
2011 Stewardship Grade Research Paper I April 13, 2011
©2011 Morningstar, Inc. All rights reserved. The information in this document is the property of Morningstar, Inc. Reproduction or transcription by any means, in whole or in part, without the prior consent of Morningstar, Inc. is prohibited.
Morningstar Stewardship Grades for Mutual Funds
If the Stewardship Grades have done their job, the combined five factors together should have steered investors toward funds that did a better job of putting those fundholders first. To be sure, the Stewardship Grades are very young relative to the decades it takes to build a strong record of fundholder service. Still, Morningstar’s study shows that the 2004 methodology was successful on a few levels. For one, funds that received high overall grades were likely to survive. One third of the F funds and 26% of the D funds did not survive until today, while only 7% of the B funds and 1% of the A funds did not survive. When funds are liquidated or merged away, they can disrupt fundholders’ portfolios.
The funds with passing Stewardship Grades also were more successful than the D and F funds as measured by the Morningstar Rating success ratio (see Table 23). This success ratio considers funds successful if they have Morningstar ratings of three or more stars; funds with fewer stars, as well as those that didn’t survive, are considered unsuccessful. This metric broadly measures whether shareholders have fared reasonably well relative to peer funds on a risk-adjusted basis. The A, B, and C stewards also outperformed, on average, when comparing average calendar-year total-return and investor-return ranks, although the performance differences between grades are slight. 23. 5-Year Morningstar Rating Success Ratio and 6-Year Return Ranks by 2004 Stewardship Grades
2004 Overall Stewardship Grade
5-Year Morningstar RatingSuccess Ratio %
Average Total Return Category Rank 2005-2010
Average Investor Return Category Rank 2005-2010 Number of Funds
A 60 46.65 49.24 77
B 74 42.42 45.68 453
C 63 46.93 49.45 255
D 51 51.21 52.75 105
F 58 48.16 50.50 52
Data through 12/31/10. Source: Morningstar, Inc.
The study of the 2007 grades shows similar trends. Morningstar altered the Stewardship Grade methodology in 2007, and the funds that received higher overall Stewardship Grades that year have delivered good shareholder experiences on a number of measures. Here’s a summary of the methodology changes:
3 Corporate Culture: Maximum score was raised to 4 points from 2 points3 Board Quality: Dropped work-load criterion; required independent chairman and supermajority of directors; maximum score on question of whether board serves shareholders well was raised to 1 point from 0.5 point.3 Manager Incentives: Unchanged.3 Fees: Dropped fee-trend criterion; maximum score of 2 points to funds in the cheapest quintile of supercategory by share class type; funds that are more expensive than 60% of peers earn zero points.3 Regulatory History: Maximum score of zero points, down from 2 points.3 Total points available—10—and the ranges required to earn each letter grade were unchanged.
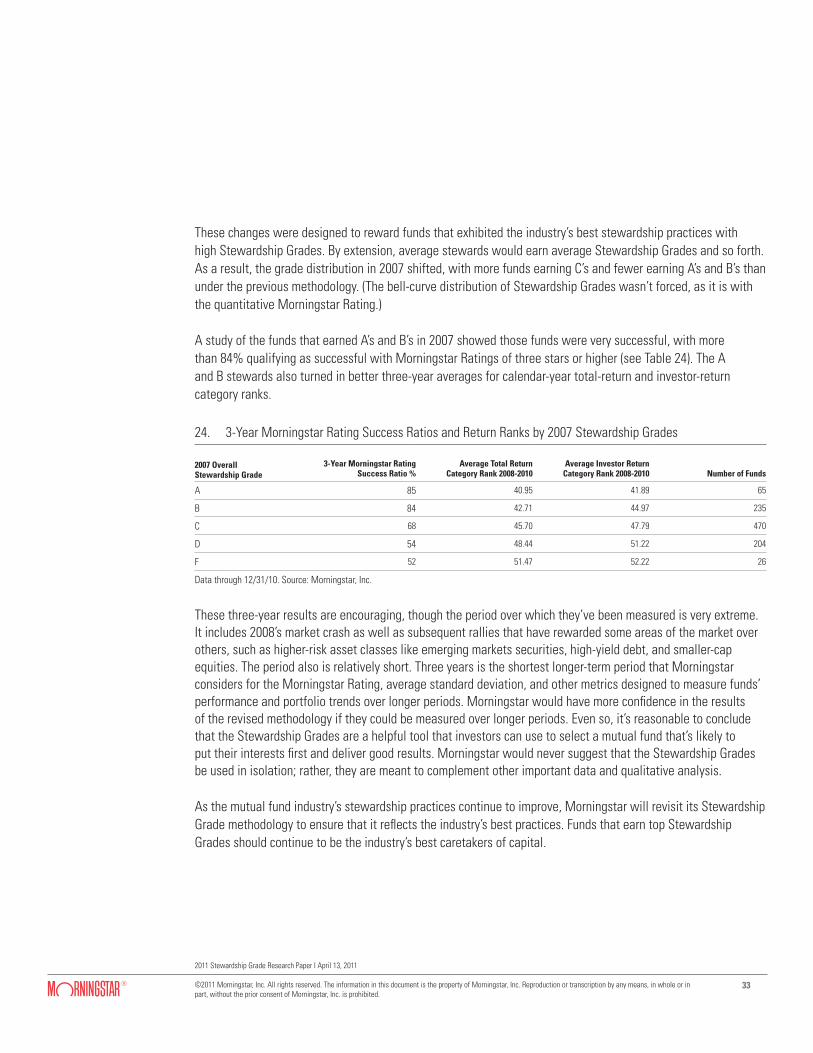
33
2011 Stewardship Grade Research Paper I April 13, 2011
©2011 Morningstar, Inc. All rights reserved. The information in this document is the property of Morningstar, Inc. Reproduction or transcription by any means, in whole or in part, without the prior consent of Morningstar, Inc. is prohibited.
These changes were designed to reward funds that exhibited the industry’s best stewardship practices with high Stewardship Grades. By extension, average stewards would earn average Stewardship Grades and so forth. As a result, the grade distribution in 2007 shifted, with more funds earning C’s and fewer earning A’s and B’s than under the previous methodology. (The bell-curve distribution of Stewardship Grades wasn’t forced, as it is with the quantitative Morningstar Rating.)
A study of the funds that earned A’s and B’s in 2007 showed those funds were very successful, with more than 84% qualifying as successful with Morningstar Ratings of three stars or higher (see Table 24). The A and B stewards also turned in better three-year averages for calendar-year total-return and investor-return category ranks.
24. 3-Year Morningstar Rating Success Ratios and Return Ranks by 2007 Stewardship Grades
2007 Overall Stewardship Grade
3-Year Morningstar RatingSuccess Ratio %
Average Total Return Category Rank 2008-2010
Average Investor Return Category Rank 2008-2010 Number of Funds
A 85 40.95 41.89 65
B 84 42.71 44.97 235
C 68 45.70 47.79 470
D 54 48.44 51.22 204
F 52 51.47 52.22 26
Data through 12/31/10. Source: Morningstar, Inc.
These three-year results are encouraging, though the period over which they’ve been measured is very extreme. It includes 2008’s market crash as well as subsequent rallies that have rewarded some areas of the market over others, such as higher-risk asset classes like emerging markets securities, high-yield debt, and smaller-cap equities. The period also is relatively short. Three years is the shortest longer-term period that Morningstar considers for the Morningstar Rating, average standard deviation, and other metrics designed to measure funds’ performance and portfolio trends over longer periods. Morningstar would have more confidence in the results of the revised methodology if they could be measured over longer periods. Even so, it’s reasonable to conclude that the Stewardship Grades are a helpful tool that investors can use to select a mutual fund that’s likely to put their interests first and deliver good results. Morningstar would never suggest that the Stewardship Grades be used in isolation; rather, they are meant to complement other important data and qualitative analysis.
As the mutual fund industry’s stewardship practices continue to improve, Morningstar will revisit its Stewardship Grade methodology to ensure that it reflects the industry’s best practices. Funds that earn top Stewardship Grades should continue to be the industry’s best caretakers of capital.
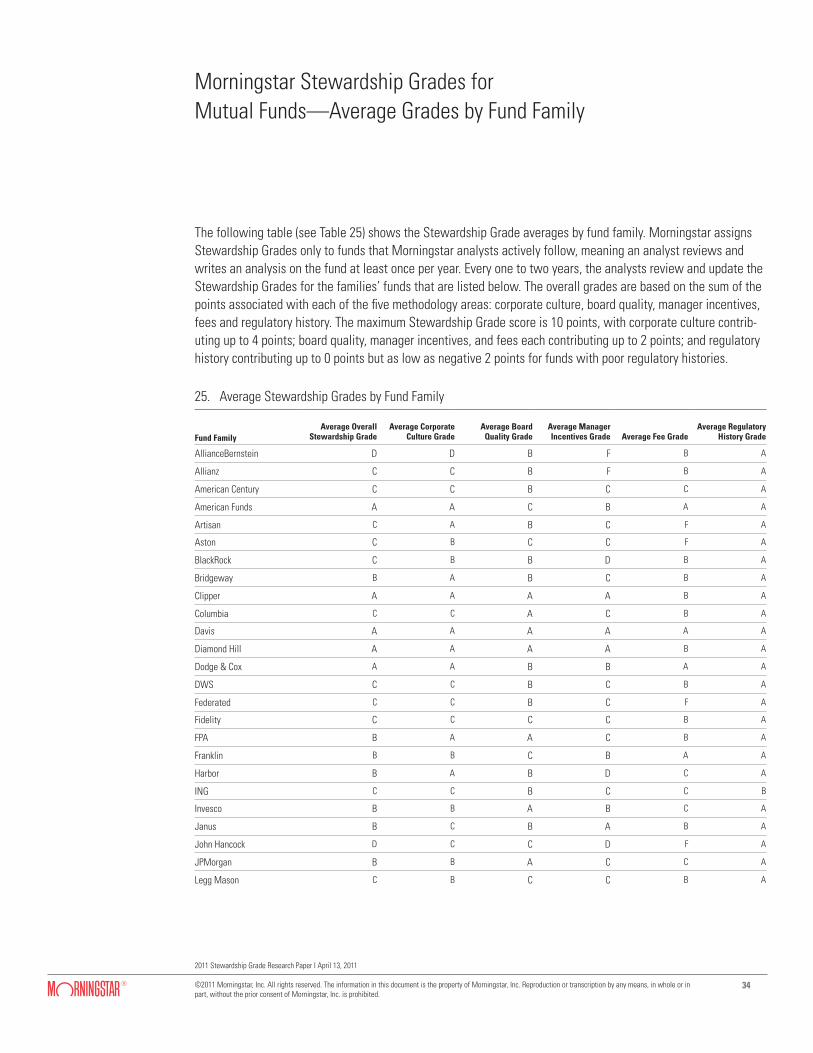
34
2011 Stewardship Grade Research Paper I April 13, 2011
©2011 Morningstar, Inc. All rights reserved. The information in this document is the property of Morningstar, Inc. Reproduction or transcription by any means, in whole or in part, without the prior consent of Morningstar, Inc. is prohibited.
Morningstar Stewardship Grades for Mutual Funds—Average Grades by Fund Family
The following table (see Table 25) shows the Stewardship Grade averages by fund family. Morningstar assigns Stewardship Grades only to funds that Morningstar analysts actively follow, meaning an analyst reviews and writes an analysis on the fund at least once per year. Every one to two years, the analysts review and update the Stewardship Grades for the families’ funds that are listed below. The overall grades are based on the sum of the points associated with each of the five methodology areas: corporate culture, board quality, manager incentives, fees and regulatory history. The maximum Stewardship Grade score is 10 points, with corporate culture contrib-uting up to 4 points; board quality, manager incentives, and fees each contributing up to 2 points; and regulatory history contributing up to 0 points but as low as negative 2 points for funds with poor regulatory histories.
25. Average Stewardship Grades by Fund Family
Fund FamilyAverage Overall
Stewardship GradeAverage Corporate
Culture GradeAverage Board
Quality GradeAverage Manager Incentives Grade Average Fee Grade
Average Regulatory History Grade
AllianceBernstein D D B F B A
Allianz C C B F B A
American Century C C B C C A
American Funds A A C B A A
Artisan C A B C F A
Aston C B C C F A
BlackRock C B B D B A
Bridgeway B A B C B A
Clipper A A A A B A
Columbia C C A C B A
Davis A A A A A A
Diamond Hill A A A A B A
Dodge & Cox A A B B A A
DWS C C B C B A
Federated C C B C F A
Fidelity C C C C B A
FPA B A A C B A
Franklin B B C B A A
Harbor B A B D C A
ING C C B C C B
Invesco B B A B C A
Janus B C B A B A
John Hancock D C C D F A
JPMorgan B B A C C A
Legg Mason C B C C B A
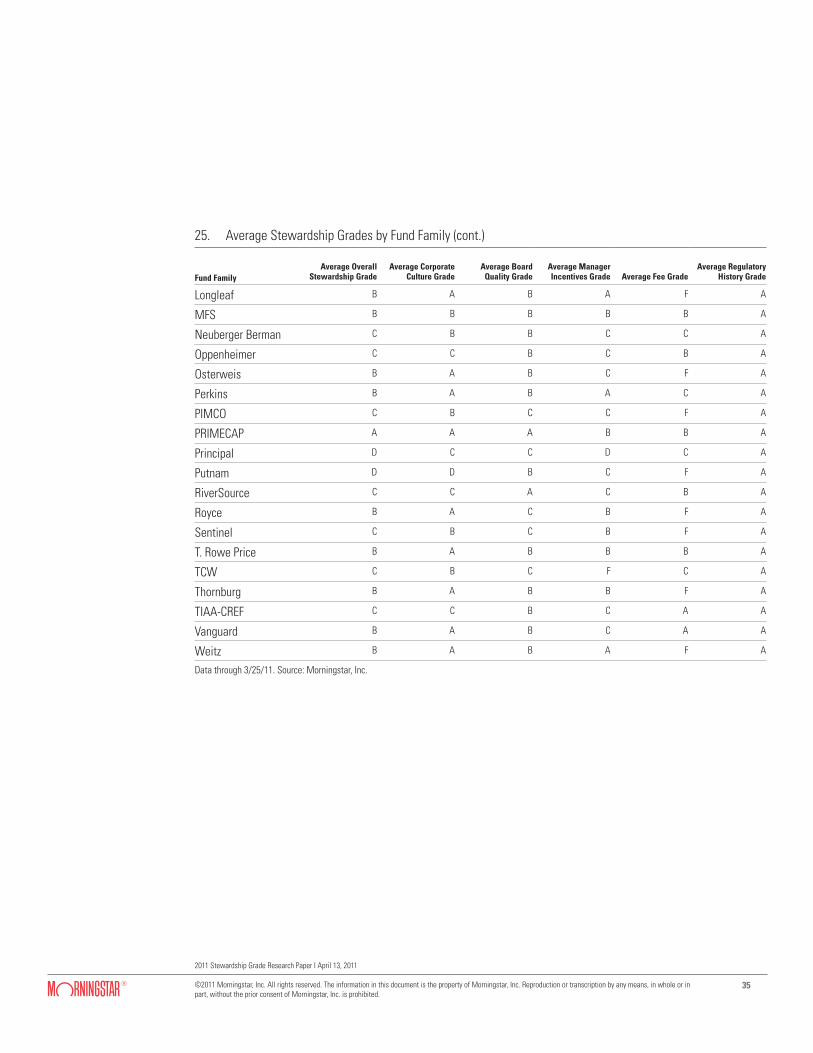
35
2011 Stewardship Grade Research Paper I April 13, 2011
©2011 Morningstar, Inc. All rights reserved. The information in this document is the property of Morningstar, Inc. Reproduction or transcription by any means, in whole or in part, without the prior consent of Morningstar, Inc. is prohibited.
25. Average Stewardship Grades by Fund Family (cont.)
Fund FamilyAverage Overall
Stewardship GradeAverage Corporate
Culture GradeAverage Board
Quality GradeAverage Manager Incentives Grade Average Fee Grade
Average Regulatory History Grade
Longleaf B A B A F A
MFS B B B B B A
Neuberger Berman C B B C C A
Oppenheimer C C B C B A
Osterweis B A B C F A
Perkins B A B A C A
PIMCO C B C C F A
PRIMECAP A A A B B A
Principal D C C D C A
Putnam D D B C F A
RiverSource C C A C B A
Royce B A C B F A
Sentinel C B C B F A
T. Rowe Price B A B B B A
TCW C B C F C A
Thornburg B A B B F A
TIAA-CREF C C B C A A
Vanguard B A B C A A
Weitz B A B A F A
Data through 3/25/11. Source: Morningstar, Inc.