2011 peer city review. mid/dsa dashboard liveworkshopplay
TRANSCRIPT

2011 Peer City Review

MID/DSA Dashboard
Live
Work
Shop
Play

Peer Cities
Geographic
Diversity
Similar Economic Compositi
on
Similar Size
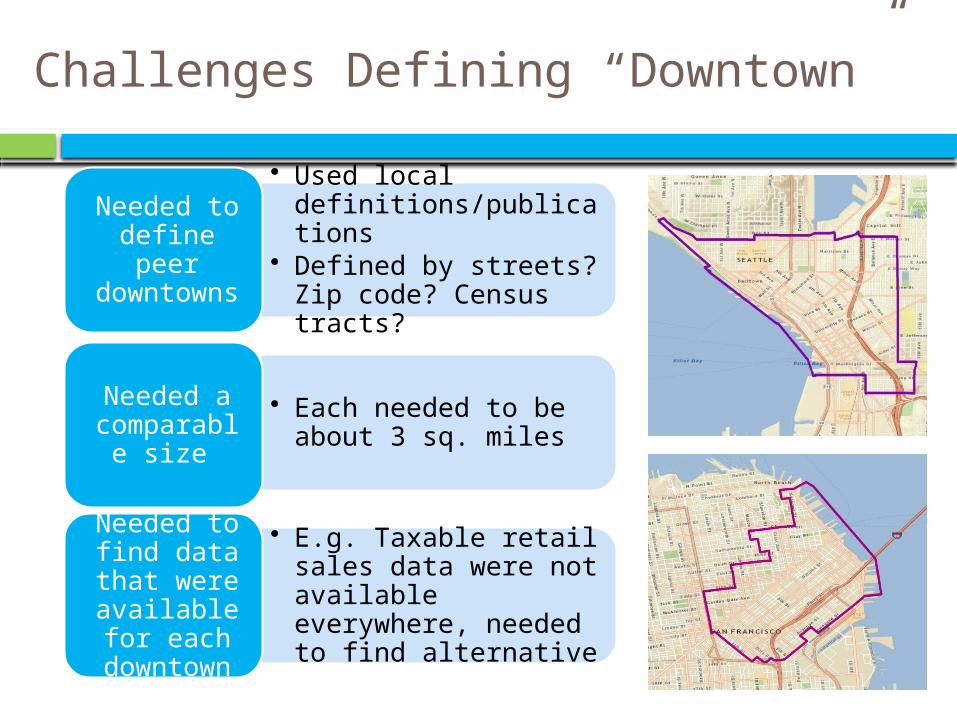
Challenges Defining “Downtown”
• Used local definitions/publications
• Defined by streets? Zip code? Census tracts?
Needed to define peer downtowns
• Each needed to be about 3 sq. miles
Needed a comparable
size
• E.g. Taxable retail sales data were not available everywhere, needed to find alternative
Needed to find data that were
available for each
downtown

Live
Seattle ranked 2nd in total downtown residents (59,884) and 3rd in resident population density
San Francisco Seattle Philadelphia Boston San Diego Denver Portland Minneapolis Charlotte -
10,000
20,000
30,000
40,000
50,000
60,000
70,000
80,000
Total Estimated Population Total Residents per Square Mile
Figure 1. Total Downtown Population and Resident Density (2011)

Live
Downtown Seattle experienced a 26% increase in residents since 2000 yet ranked 2nd in the absolute number of new residents
Seattle is highest of downtowns with populations above 30,000 residents
Charlo
tte
San D
iego
Denve
r
Portla
nd
Min
neap
olis
Seattle
San F
ranc
isco
Phila
delp
hia
Bosto
n0%
10%
20%
30%
40%
50%
60%
70%
80%
90%
Figure 2. Percent Growth in Downtown Residents (2000 -2011)

Work
Bosto
n*
San
Fran
cisco
Phila
delphia
Seat
tle
Minne
apolis
Denve
r
Portl
and
San
Diego
Charlo
tte -
50,000
100,000
150,000
200,000
250,000
300,000
Total Employees Employees per sq. mile
Figure 3. Downtown Employment and Job Density (2009)
One of the most productive downtowns in the United States, over 202,000 jobs
Room to improve employment density, rank 4th amongst peer cities

Work
Min
neap
olis
San F
ranc
isco
Bosto
n*
Seattle
Phila
delp
hia
Denve
r
Portla
nd
Charlo
tte
San D
iego
0%
10%
20%
30%
40%
50%
Figure 4. Average Percent of Total City Employment Located Downtown (2002-2009)
Downtown Seattle is home to more than 45 percent of Seattle’s total jobs
Downtown Seattle employees earned more than $11.3 billion in salaries and benefits in 2009

Work
Most downtowns are centers for the finance and professional services sectorsDowntown Seattle has the largest healthcare sector amongst peer cities
Figure 5. Average Percent of Total City Employment Located Downtown (2002-2009)
Seattle Portland San Francisco San Diego Denver Minneapolis Charlotte Philadelphia0%
10%
20%
30%
40%
50%
60%
70%
80%
90%
100%
Professional, Scientific and Technical Services Finance and Insurance Public Administration Healthcare and Social Assistance
Retail Trade Accomodations and Food Services Educational Services Admin and Support, Waste Management
Information Other
Shop
60,000 80,000 100,000 120,000 140,000 160,000 180,000 200,000 220,000 240,000 260,000 -
2,000
4,000
6,000
8,000
10,000
12,000
14,000
16,000
18,000
20,000
Seattle
Portland
San Francisco
San DiegoDenver
Minneapolis
Charlotte
Philadelphia
Boston
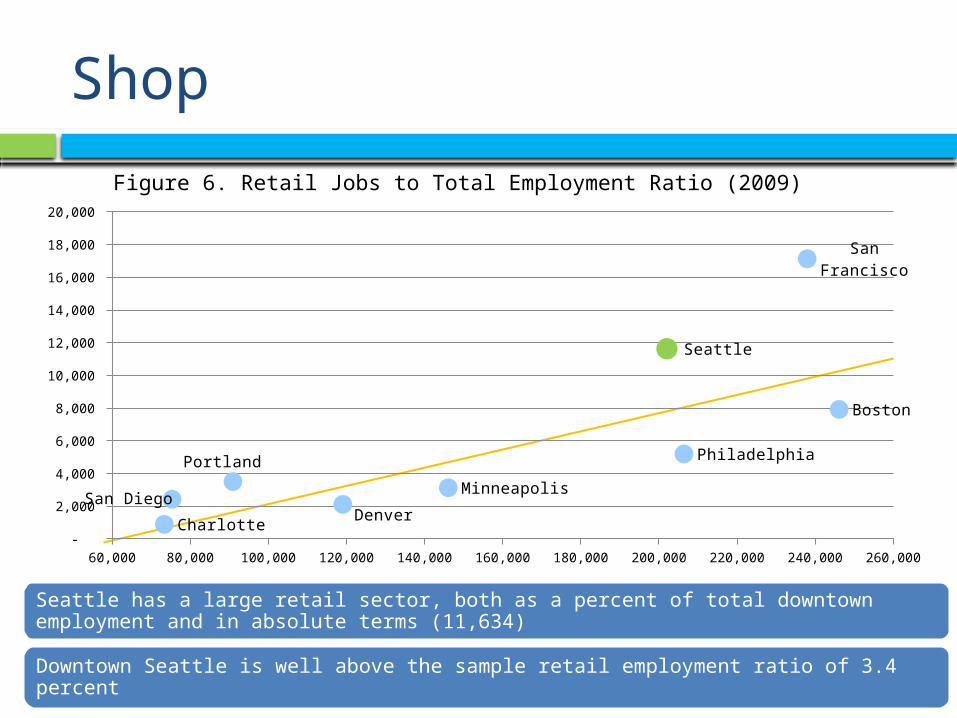
Figure 6. Retail Jobs to Total Employment Ratio (2009)
Seattle has a large retail sector, both as a percent of total downtown employment and in absolute terms (11,634)
Downtown Seattle is well above the sample retail employment ratio of 3.4 percent

Play
Downtown Seattle is below the sample entertainment employment ratio, although SoDo was not included in the sample
Entertainment sector combines traditional arts & entertainment with accommodations and restaurants
60,000 80,000 100,000 120,000 140,000 160,000 180,000 200,000 220,000 240,000 260,000 -
5,000
10,000
15,000
20,000
25,000
30,000
35,000
Seattle
Portland
San Francisco
San DiegoDenver Minneapolis
Charlotte
Philadelphia
Boston
Figure 7. Entertainment Sector Ratio (2009)

Key Findings
Downtown Seattle has a large downtown population that continues to grow (59,800+)
Downtown has more than 202,000 employees, edging closer to San Francisco and Boston
Room to improve downtown employment density, rank 4th
Downtown Seattle is a major retail center
Lower percent of downtown economy devoted to entertainment sector than peer cities

Thank you for your time
Any Questions?