2011 quadrennial revenue review - home - city of auburn manager’s revenue review message..... 1...
TRANSCRIPT

The City of Auburn,
Alabama
2011 Quadrennial
Revenue Review


The City of Auburn 2011 Revenue Review
Introduction City Manager’s Revenue Review Message ........................................................................... 1 Follow‐up to 2007 Revenue Review ..................................................................................... 9 2011 Key Issues/Decisions .................................................................................................. 11
The Revenue Environment Revenue Overview and Top 4 Revenue Sources ................................................................ 13 General Fund
General Fund ‐ Changes in Fund Balance .................................................................. 23 General Fund History – Fiscal Years 2001‐2010 ......................................................... 24 General Fund Projection – Fiscal Years 2011‐2016 .................................................... 25
Revenue Rate and Fee Schedules ....................................................................................... 26
The Expenditure Environment Expenditure Overview and Assumptions ........................................................................... 27 Expenditure History Projections – Fiscal Years 2006‐2016 ................................................ 37 Capital Improvement Plan – Fiscal Years 2011‐2016 ......................................................... 39 Debt .................................................................................................................................... 45
Proposed Changes Sales and Use Tax ............................................................................................................... 47 Business License ................................................................................................................. 49 Liquor Wholesale Tax ......................................................................................................... 51 Public Safety Fees
Communications Fees – E911 ..................................................................................... 53 Revenue Collection in the Police Jurisdiction ............................................................. 55
Downtown Parking ............................................................................................................. 63
Future Considerations ................................................................................................. 67


MMiissssiioonn SSttaatteemmeenntt The mission of the City of Auburn is to provide economical delivery of quality services, created and designed in response to the needs of its citizens, rather than by habit or tradition. We will achieve this by:
• encouraging planned and managed growth as a means of developing an attractive built‐environment and by protecting and conserving our natural resources;
• creating diverse employment opportunities leading to an increased tax base; • providing and maintaining reliable and appropriate infrastructure; • providing and promoting quality housing, education, cultural and recreational
opportunities; • providing quality public safety services; • operating an adequately funded city government in a financially responsible and
fiscally sound manner; • recruiting and maintaining a highly motivated work force, committed to excellence; • facilitating citizen involvement.
VViissiioonn SSttaatteemmeenntt
The City of Auburn is committed to being an attractive, environmentally conscious community
that is progressive, responsible and hospitable.
This community desires for all citizens:
safe and attractive neighborhoods with adequate housing, quality educational opportunities, diverse cultural and recreational opportunities, vibrant economic opportunities, and active involvement of all citizens.


Citizens of Auburn
Organization Chart
CityAttorney*
Finance Authorities,Boards,and
City Council
City ManagerMunicipal Judge
WaterRevenue
Pl i
Information Technology
and Commissions
Office of theCity Manager
EconomicDevelopment
Judicial
Planning
HumanResources Public Safety
EnvironmentalS i
Public Works
GIS
Library
Parks
Administration AdministrationAdministration
Construction
RiskManagement
Water
Public SafetyServices
Public Works
andRecreation
Administration
Recycling
Solid Waste
Police
Fire
Constructionand
Maintenance
EngineeringDesign
ResourceManagement
Administration
Animal Control
Right‐of‐WayMaintenance
Communications
CodesEnforcement
Inspection
Traffic Engineering
LeisureServices
Parks andFacilities
WaterOperations
Sewer Maintenance
Fleet Services
Facilities
Policy or Judicial Authority Department Division or Sub‐Departmental UnitLegend:
Watershed Management
* City Attorney services are contracted outside
the organization


To:
From:
Date:
Subject:
It has lonfoundationus well dueconomic Therefore,FY2016 anobjectives We begin,and a despresent a sources: SFees. It is projectionbalance ov In order toplace. Thucontext offunding foto the reve
Goals for t
1. Evaluaability assumPlan (C
2. Identif3. Develo
foreca4. Develo
approp
City Co
Charles
March
2011 Q
ng been then of fiscal reuring the reposition we, the reportnd examineof the City C
, as part of tscription of survey of thales and Usin this sectis of revenuver the next
o properly evus, within thf the City’s or various prenue structu
the 2011 Re
te the adeqto provide pptions, as wCIP). fy revenue‐rop recommested revenuop recommepriate.
uncilmembe
s M. Duggan
30, 2011
Quadrennial R
e goal of thesponsibilityecent globae must budt before youes how wellCouncil, the
this Introduthe results
he City’s Gese Taxes, Ocion where wues and expsix years.
valuate the Che framewoMission Statrojects and iure and prop
venue Revie
uacy of the cpublic servicell as the ca
elated issueendations fore deficiencieendations for
M E M
ers
, Jr., City Ma
Revenue Rev
his Council y and financl economic dget cautiouu presents tl those reveManageme
ction, with a of that effneral Fund ccupational Lwe offer an penditures t
City’s revenurk of this retement andinitiatives. Fpose areas fo
ew
current Genes at the curpital needs o
s that need r changes in es. r changes in
M O R A N D U
anager
view
and City Mcial conservauncertainty
usly and takthe City’s penues fund nt Team, an
an update ofort. Next, Revenue strLicense Feesassessment through FY2
ues, an analyeport we dis how the obinally, we ofor further st
eral Fund rerrent level, bof the City a
further studthe Genera
the City’s re
U M
Management atism. This py. To continke a careful rojected rev the expend the citizen
of the 2007 in the Reveructure focus, Ad Valoreof the City’
2016 and de
ysis of our pscuss the Exbjectives of ffer specific udy in order
evenue strucbased on hisas adopted b
dy. l Fund reven
evenue adm
to anchor pragmatic apnue to opelook at ouvenue positnditures reqns of Auburn
Revenue Reenue Envirousing on ourem Taxes, an’s General Fetails their
planned expexpenditure the City Co recommenr to achieve
cture to suppstorical trendby the Capita
nue structur
ministration p
City servicepproach hasrate from ar revenue rion from nouired to mn.
eview Key Donment sectr four main nd Business Fund which ieffect on o
enditures mEnvironmenouncil transldations for those objec
port the Cityds and reasoal Improvem
re to address
processes wh
es on a s served a strong realities. ow until
meet the
Decisions tion, we revenue License includes our fund
ust take nt in the ate into changes ctives.
y’s onable ment
s any
here
Introduction
2011 Revenue Review
Page 1

General Fund Overview In today’s economic environment significant changes have taken place, and are still underway, with regard to the consumer and business behaviors that fueled strong growth over the past decade. Due to those changes, we project a level of revenue growth that is insufficient to provide the services and investments necessary to meet the objectives of the City Council and the needs of our citizens. Revenue Outlook: Although serious, our situation is not dire and we are fortunate to have time to be proactive as we work to keep our economic position strong. The local economy is expected to improve, albeit not at the rapid pace seen earlier in the decade. Local sales tax revenues continue to rebound and are projected to be above budget for the biennium. Occupational License fee revenues show strong growth as new jobs are announced and the unemployment rate declines. Conversely, Ad Valorem tax revenue growth has slowed considerably from the double digit increases seen this past decade to single digit or flat growth projections for the foreseeable future. Business License revenues remain depressed and the slowdown in the building market is reflected in significant decreases in construction permit revenues. In light of anticipated reduced, sluggish, or negative growth, in the different revenue areas, projections included in this review prudently assume, at best, an overall sustained, gradual, improvement to our local economy. General Fund revenues are detailed in the Revenue Environment section of this document (beginning on page 13), and include several assumptions used in the projections, summarized as follows:
On average, locally levied tax revenue is projected to be 2.9% higher than budgeted in FY2011, and 3.8% higher than budgeted in FY2012. For projections FY2013 to FY2016, locally levied tax revenues increase by 2.6 ‐ 2.7% annually. See page 25 for additional details. Sales tax revenues are anticipated to increase by 2.5% annually for the projection period.
To enable us to evaluate the sufficiency of the current tax rates, no rate changes are included in the assumptions for the revenue projections.
Expenditure Outlook: General Fund expenditures are detailed in the Expenditure Environment section of this document (beginning on page 27) and include several assumptions used in the projections, summarized as follows with more detail appearing below:
Personnel costs will increase 3% annually; no cost‐of‐living adjustment is included, nor are new positions assumed.
Departmental contractual services and commodities spending will increase by 2%, with additional increases projected for energy costs. The only additional costs included are for the operation of new facilities as they are constructed according to the CIP.
Debt service expenditures are projected for debt issued to construct projects according to
the CIP, including Auburn Technology Park West ($2,800,000), replacement of Moores Mill
and Gay Street bridges ($8,028,500), and road/intersection projects ($4,546,950).
According to the CIP, expenditures from the General Fund on infrastructure projects will resume in FY2013. Projects funded conditionally, and dependent upon collection of sufficient revenues, are not included and could be delayed if resources are unavailable.
Capital equipment replacement expenditures will also resume in FY2013.
Introduction
Page 2
2011 Revenue Review

The expenditure environment section of this document reviews several future expenditures tied to the City’s objectives that were unfunded, underfunded, or funded through deficit spending (drawdowns on the General Fund Balance). A summary of those future expenditures and their funding status is as follows:
Auburn Technology Park West: Current debt service capacity can only fund the next phase at $2.8 million while the total estimate to finish the park is approximately $5,000,000. To see the park to completion, an annual increase of debt service is required by an estimated $282,000. This unfunded debt service is not included in the expenditure projections.
Land acquisition for a future technology park: Estimated at $8,000,000, this expenditure will need to be considered in the next five years as the available sites at existing parks become occupied. Assuming 5% interest over ten years, debt service is estimated at just over $1.0 million annually, and is not included in the expenditure projections.
Expansion of commercial development activities: additional staff and operating funds (minimum $60,000 per year) are not included in the expenditure projections.
Road resurfacing and restriping: The CIP currently includes funding for $1.5 ‐ 2.0 million in resurfacing annually; the City Engineer’s recently completed 5‐year Resurfacing Plan recommends an annual expenditure of $3.0 million, based on calculations to resurface all streets according to a 20‐year cycle. The $1.0 ‐ 1.5 million shortfall is not included in the expenditure projections.
Police facility expansion: The Douglas J. Watson Municipal Complex will require replacement of the HVAC system and minor renovations prior to the expansion of the Police Division. Some future Five Mill capacity is available, but the CIP includes up to $500,000 being financed by a federal grant program that will likely be discontinued by the current Congress.
Conditionally‐funded capital projects: The CIP contains an average of $620,000 in projects that will be funded only upon receipt of sufficient revenues. All are important projects, but shrinking budget‐to‐actual variances (money budgeted but not spent each year) will decrease the availability of funding. Conditionally‐funded projects are not included in the expenditure projections.
Grant‐funded projects: FY2013 ‐ FY2016 of the CIP contain over $3.8 million in projects for which the City will seek federal grants; these projects are primarily pedestrian and bicycle facilities and, based on past successes, would stand a reasonable chance of being funded. Budget constraints and soaring deficits at the federal level are likely to reduce the available funding and increase competition. The City needs to be prepared to either fund these projects locally or reconsider including them on the CIP.
Capital infrastructure investment and equipment replacement: The short‐term reliance on the Special Five Mill Fund to provide funding for infrastructure investment will end shortly and the cost of these projects will shift back to the General Fund in FY2013 (per the CIP), along with approximately $750,000 in equipment replacement needs. While these costs are included in the expenditure projections, they are a significant contributing factor in the continued drawdown of the fund balance.
Introduction
2011 Revenue Review
Page 3

Fund Baladevelopedbudgets managemereserves trecession potential service ensecond kewas to temtransportacapital eqSpecial Fivapproach spending ocapital eqbiennium. fund balan
Our fund over the pemphasizeequal cashFund inclwhich is hdrawn dow2) amountexpenses, projected property
Reserved for:
Inventories
Prepaid exp
Encumbranc
Advances
Advance to
Advance to
Advance to
Property for
Permanent Re
Unreserved/U
Total adjust
Ending Fu
Res.) a
ance Outlod the pasa key
ent’s strategto absorb tin order decreases
njoyed by oy componenmporarily moation infrastuipment reve Mill Fundmid‐bienniuon infrastrucquipment anThis necess
nce.
balance copast severaled that the h. The fundudes: 1) thhighly liquidwn to level ts reserved and encubased on
held for re
:
penses
ces
IDB
Indian Pines
SWMF
r resale
eserve
Undesignated
Ending Fund
ted reserved fun
P
und Balance (exc
as % of Adj. Expen
ook: As thest two bicomponen
gy was to rhe impact oto reduceto the lev
our residentnt of this stove the burructure andplacement t and other sum in FY201cture. In FY2nd infrastrusary level of
omposition years, and fund balan balance inhe Permaned but is cufund the scfor inventoumbrances, n historic aesale, which
A
2,
4,
7,
4,
11,
d Balance 23,
d balance
Projected Ge
cl. Perm.
nditures
e City iennial t of ely on of the e any vel of s. The rategy den of some to the special reve2, the City m2013 ‐ FY20ucture incref funding di
has changeit should b
nce does no the Generaent Reserverrently beinchool systemories, prepai
which araverages, 3h consists o
Actual
2010 2
15,919
4,010
183,062 7
537,853 2,4
337,173 3
216,892 2
131,127 4,
426,037 7,9
682,899 4,3
265,468 7,5
374,404 19,8
33.06%
neral Fund Ba
nue funds wmust begin 14, the City easing to ovirectly contr
ed be ot al e, ng m, id re 3) of
2011 201
19,336 19
14,588 14
771,106 771
462,853 2,377
313,192 287
216,892 173
131,127 4,131
929,095 7,775
350,402 4,080
569,216 7,336
848,714 19,192
27.53% 27
alance Comp
where excespreparing fo will need tover $5.5 mributes to th
12 2013
9,336 19,33
4,588 14,58
1,106 771,10
7,853 2,211,35
7,921 261,29
3,514 130,13
1,127 4,131,12
5,446 7,538,93
0,729 4,141,94
6,631 5,347,99
2,806 17,028,87
7.96% 22.64
Pro
osition FY201
s capacity wor the Geneo spend alm
million for the projected
2014
36 19,336
88 14,588
06 771,106
53 2,044,853
91 233,229
35 86,757
27 4,131,127
38 7,300,997
40 4,204,069
94 3,348,354
72 14,853,420
4% 18.23%
ojected
10‐FY2016
was availableeral Fund to most $2.8 mthe FY2015d drawdown
2015
19,336
14,588
771,106
1,878,353 1
203,658
43,378
4,131,127 4
7,061,548 6
4,267,130 4
706,477
12,035,155 10
12.83%
e. As we resume illion on ‐ 2016
n of the
2016
19,336
14,588
771,106
1,711,853
172,497
‐
4,131,127
6,820,508
4,331,137
(814,221)
0,337,425
9.86%
Introduction
Page 4
2011 Revenue Review

several outparcels at the mall, and 4) advances to other City entities, which the General Fund is recovering over various repayment plans. What remains after subtracting all of these items is the unreserved/undesignated fund balance. This is the amount available to finance other projects and operations, and is generally considered highly liquid. The table above shows the projected fund balance under the projected revenue and projected expenditure environments. Note that, beginning in FY2016, the projected unreserved and undesignated amount becomes negative; if that occurred, the permanent reserve would have to be tapped to finance ongoing operations. The City Council has formally established the policy goal that minimum net ending fund balance (excluding permanent reserve) be equal to 20% of total expenditures or higher, with management’s unofficial target being 25%. This strong reserve policy was adopted in recognition that more than 40% of the General Fund’s total revenues are derived from a single source – sales tax, and that sales tax is highly sensitive to general and local economic conditions. Under the current projections, the ending fund balance falls below the Council’s target in FY2014. Even though the City’s practice of conservatively projecting revenues and realistically planning for expenditures has typically resulted in better than expected performance, the City has been spending at a deficit since FY2008. These planned drawdowns of Fund Balance were acceptable and well‐managed but cannot be sustained. Without higher‐than‐predicted revenue performance, or some combination of significant reductions in the cost of services and reductions in the planned capital and economic development investments, the drawdown of fund balance will continue. Summary of Options and Proposals In order to proactively address the continued projected decline of our reserves, several options and/or proposals are included as part of this review.
1. Sales Tax Increase – Of the major revenue sources, only the top four (Occupational License, Business License, Property Tax and Sales & Use Tax) contribute the funds necessary to eliminate the spending deficit and fund the growth in Auburn City Schools. Sales Tax currently accounts for approximately 40% of General Fund revenues and is able to be changed by a vote of the City Council whereas Property Tax would additionally require legislative and voter approval. Increases in Business License and Occupational License fees are also available options but neither would be expected to raise sufficient revenue on its own. A detailed summary of each option, as well as comparative rates, begins on page 47. A one penny increase in Sales Tax would generate an estimated $7.03 million annually, based on FY2010 actual receipts, and would still allow Auburn to remain competitive in commercial and retail development with our neighbors. If such an increase were split evenly between the City and ACS it would be sufficient to fund their short‐term expansion needs and help with funding shortfalls brought on by the State’s financial difficulties. The City’s portion would eliminate the projected continued deficit spending, allow for street resurfacing projects to be aligned with the City’s needs, to fund continued economic development activities, and reduce the amounts needed for future debt to fund such projects as the replacement of Moores Mill Bridge at I‐85.
Introduction
2011 Revenue Review
Page 5

2. Business License – The proposed changes are not anticipated to generate any significant revenues but are proposed to more closely align our general issuance fee with the state guidelines, and, if deemed desirable, begin to equalize our Commercial and Residential Rental Business License fee rates. See page 49 for more information.
3. Liquor Wholesale Tax ‐ Staff recommends increasing this tax from 3% to 7%. This will generate an estimated increase of $117,583 in FY2012, and will help to offset the costs of providing public safety services to our alcohol establishments, especially downtown bars and restaurants, as well as bring this tax closer to those of our peer communities. See page 51 for more information.
4. E‐911 Communications Fee – Staff recommends equalizing this fee to that charged in Lee County and Opelika. This will generate an estimated $90,984, and will help cover the costs of operating the City’s 911 Call Center. Fees established to cover this cost currently generate about 2/3 of the Communications Division expenditures. See page 53 for more information.
5. Revenue Collection in the Police Jurisdiction – With an increase in policing needs in the police jurisdiction, the City Council needs to consider levying Sales & Use taxes and Business License Fees as allowed by law. Locations in the police jurisdiction, but outside the City limits, accounted for about 5% of all calls for service while contributing no revenue. The recommendation is to develop a more comprehensive study to determine the full consequences of police jurisdiction taxing and revenue collection. A detailed discussion of the initial research, including maps, incident counts and a comparison of the cost of services and revenue estimates, is presented on page 55.
6. Downtown Parking Revenues – In follow‐up to the Downtown Parking Review presented to the Council in 2009, staff recommends revising the City’s parking ordinance with the intent of adjusting meter rates and enhancing enforcement and collection activities. Additional revenues will be used to fund parking‐related capital projects, addressing a major priority in the Citizen Survey. See page 63 for more information.
7. Solid Waste Fund Rate Study recommendations ‐ In order to continue providing excellent solid waste and recycling services, staff recommends increasing residential curbside collection rates by $3.00 per month and backdoor collection rates by $3.50 per month beginning in October, 2011, with future rate adjustments phased in as outlined in the 2011 Solid Waste Rate Study report presented earlier this week. Please see the report from the City’s consultant for additional information.
8. Sewer Fund Rate Study recommendations – To allow the City to continue planned capital improvements to the wastewater infrastructure, staff recommends increasing the average individually‐metered residential service rate by $1.20 per month beginning in October, 2011, with future rate adjustments phased in as outlined in the 2011 Sewer Rate Study Update presented earlier this week. Please see the report from the City’s consultant for additional information.
Introduction
Page 6
2011 Revenue Review

ConclusionIn the 20satisfactionational afunding nedelivery orecommencontinue tproposals intended t
n 11 Citizen Sn with the oaverage. Theeeds. To conof City servndations puto earn thehave been bto not hinde
Survey, ouroverall valuee priorities tntinue to purvices and ht forth in th citizen’s trbalanced to r our local e
r citizens coe received fothat our resrsue the haligh citizen his documerust in respoavoid undueconomy’s on
S
C C
ontinued to or their tax dsidents voiclmarks of ousatisfactionnt are presonsibly prove impact on ngoing recov
incerely,
Charles M. DCity Manager
rank City dollars was 3ced in the sur municipan, some chented as a viding essenany single svery from th
uggan, Jr. r
services ver33 percentagsurvey inevitl governmenanges will plan whichntial governector of ourhe recession
ry highly ange points abtably translant, excellencbe necessa allows thement servicr population .
nd their bove the ate into ce in the ary. The City to ces. The and are
Introduction
2011 Revenue Review
Page 7

Introduction
Page 8
2011 Revenue Review

City of Auburn
2011 Revenue Review
Follow‐up to 2007 Key Decisions
Yes No
1. Should the staff study the effect of a business license ordinance amendment to provide for a “small vendor” business license category? __8__ __0__
The Revenue Office studied the option of providing this license category by looking at how many existing taxpayers would be affected, analyzing the amount of revenue that would be lost for various fee levels of a proposed small vendor business license, and evaluating the impact of this additional license category on the administration of the business license ordinance. After completing this evaluation, City Staff discovered that the City of Auburn already made concessions within the City Code that promoted small businesses and created exemptions for many businesses that would potentially fit into this category. In addition, no cities within Alabama had implemented a “small vendor” business license category because of difficulty experienced while trying to define the term “small vendor”. Therefore, since the City Code has concessions for small vendors, the City staff determined not to propose this category to Council for consideration.
2. Should the staff study the effect of a business license ordinance amendment to provide for a “true up” of the first year’s business license fee at the time the second year’s business license is obtained? __5__ __3__
Research determined that this would be an administrative burden on both the taxpayer and the City (based on current staff size) to enforce and manage this method for calculating the business license fee. Staff believed the use of many estimates and valuations would be confusing to the first time business owner. Therefore this amendment was not pursued. 3. Should the business license ordinance be amended to require a special
license for a business to hold a going out of business or distressed merchandise sale? __3__ __5__
Based on the Council decision, the Finance Department did not to propose a special license for a going out of business sale.
4. Should the City staff conduct a study to determine the most feasible
(technologically and cost‐beneficial) method by which to enable the City’s taxpayers to file tax returns and remit tax payments via the Internet? __8__ __0__
The City staff researched this question and determined the State’s online filing system for self‐administered cities to be the best first step toward implementing a complete online filing package for the City of Auburn’s taxpayers. The final phases of testing are currently in progress and the Finance Department expects to ‘go live’ within the next 60 days. This system will allow businesses to electronically file and pay sales, use, rental and leasing, and lodging taxes. As part of the broader
Introduction
2011 Revenue Review
Page 9
initiative, the Finance and Information Technology departments are continuing to develop a means by which the taxpayers can file business license returns and remit most City of Auburn taxes via the Internet. 5. Should the City staff conduct an analysis of building permit, planning,
engineering and inspection fees to determine the adequacy of Auburn’s fees as compared with those charged by other cities and the costs to provide these services? __7__ __1__
Staff has conducted initial reviews of several of the fees for permitting and inspection services and determined that the fee schedules are not properly aligned with the cost of services provided. With the creation of the Neighborhood, Development, Growth and Infrastructure Business Unit, staff recommends waiting until any departmental reorganization has been finalized to revisit these fees.
Introduction
Page 10
2011 Revenue Review

City of Auburn
2011 Revenue Review
Key Decisions
1. Should the City’s Sales Tax rate be increased by 1 cent to provide additional funding for Auburn City Schools and infrastructure investment? (Page 47.)
Yes No
2. Business License Fees – Commercial Rental (Page 49.)
a. Should the commercial rental license fees be increased to .50% of gross receipts for FY2012?
Yes No
b. After FY2012, should the commercial rental license fees be increased over the next 4 years to bring the fees inline with residential rental license fees at 1.5% of gross receipts?
Yes No
3. Should the business license issuance fee be increased to $10? (Page 49.)
Yes No
4. Should the Liquor Wholesale Tax be increased to 7% of gross wholesales? (Page 51.)
Yes No
5. Public Safety Fees – E‐911 Fees(Page 53.)
a. Should the wired E‐911 Fee be increased to equalize with the Opelika and Lee County rates?
Yes No
b. If proposed legislation now under consideration (SB101 and HB114) is passed in a form that will reduce the City’s Wireless E‐911 revenues, should the wired E‐911 rates be increased to offset this loss?
Yes No
6. Should staff pursue the the recovery of costs incurred in providing police services in the police jurisdiction, but outside City limits? (Page 55.)
Yes No
7. Should staff study changes to the City’s parking ordinance, with the intent of developing a comprehensive proposal for revisions to meter rates, penalties, and enforcement practices? (Page 63.)
Yes No
Introduction
2011 Revenue Review
Page 11

City of Auburn
Key Decisions (Continued)
8. Should Solid Waste Rates be increased to cover some or all of the costs associated with collection services?
Yes No If yes, please choose one of the following:
a. Option 1 (All Allocated Expenses & Replacements – No General Fund Subsidy) Residential Curbside waste pickup fee increase of $5.00 and Residential Backdoor waste pickup fee increase of $5.50.
b. Option 2 (All Allocated Expenses & Replacements – $350,000/yr General Fund
Subsidy) Residential Curbside waste pickup fee increase of $3.00 and Residential Backdoor waste pickup fee increase of $3.50.
c. Option 3 (Replacements but no Additional Allocated Exp – $619,000‐$650,000/yr GF Subsidy) Residential Curbside waste pickup fee increase of $1.50 and Residential Backdoor waste pickup fee increase of $2.00.
d. Option 4 (No Add Allocated Exp or Replacements – $619,000‐$650,000/yr GF Subsidy plus vehicles)
Residential Curbside waste pickup fee increase of $0.50 and Residential Backdoor waste pickup fee increase of $1.00
9. Should Sewer Rates be increased to meet the projected system revenue requirements for the projected period?
Yes No
If yes, please choose one of the following:
a. Option 1 Residential monthly bill increase by an average of $1.20 (6.9%)
b. Option 2 Residential monthly bill increase by an average of $0.68 (3.9%)
c. Option 3 Residential monthly bill increase by an average of $1.68 (9.9%)
Recommended Option
Introduction
Page 12
2011 Revenue Review

City of Auburn
2011 Revenue Review
Revenue Overview
Purpose The purpose of the City’s quadrennial revenue review is to conduct a comprehensive examination of the General Fund’s revenue structure in order to determine its adequacy to finance the City’s operations and capital plans for the current and subsequent biennial budget periods. The assessment of the General Fund revenue structure shall be performed within the context of:
the Fund’s long‐term financial projections;
the biennial budget in effect at the time of the revenue review;
the approved long‐term capital improvement plan in effect at the time of the review; and
other relevant long‐term planning documentation and information. The revenue review process shall also examine Auburn’s revenue structure in comparison with that of other Alabama cities of similar size and shall consider options for changes in Auburn’s revenue structure for recommendation to the City Council. City staff may also make recommendations to the Council concerning revenue administration issues for additional study. In addition to the quadrennial revenue review, the City’s revenue structure may be studied, and recommendations for changes therein developed, during the biennial budget process and the mid‐biennium budget review process, as well as at other times as the City Manager may deem appropriate.
General Fund Revenue Structure The City’s General Fund revenue finances the basic services provided by the City: public safety, public works, environmental services, planning, parks and recreation, library, and general administrative services, including economic development. Consequently, the adequacy of the General Fund’s revenue sources to support the level of services expected by citizens is a cornerstone of short‐term and long‐term financial planning. The State of Alabama has the legal authority to establish the municipalities’ revenue sources. The State may set maximum rates, require voter approval to increase specific revenue rates, or allow city councils to change revenue rates simply by ordinance. The State levies some taxes and fees which it shares with the counties and municipalities, calculating each local government’s share by a legally mandated formula. For some revenue sources, such as property taxes and sales taxes, there is no direct correlation between the amount of tax paid and the amount of services received by the taxpayer. For other types of revenues, like parking fees and gasoline taxes, there is a direct relationship between the service provided and the fee paid.
Revenue Environment
2011 Revenue Review
Page 13

Before deciding how much money to spend in providing services to citizens, the Council must know how much revenue is estimated to be available to finance the costs of those services. To develop those revenue estimates, the Finance staff maintains detailed records of General Fund revenues, by source, for each fiscal year. The staff analyzes revenue trends over years as a preliminary step in developing revenue projections for the budget. The revenue trend information is used in conjunction with information about the various economic factors that are likely to affect revenue growth to develop estimates of how much revenue the City is projected to have available in future years. Alabama cities and counties are sales tax dependent; that is, sales tax revenue provides a significant percentage of the total revenues received. Auburn’s sales tax typically provides about 40% of the total General Fund revenue each year. This is an important factor in developing revenue estimates, since sales tax revenue is highly sensitive to changes in the economy. For example, if there is a recession that causes businesses and industries to lay off employees, people have less income to spend, which causes sales tax revenue to decrease. Likewise, if gasoline prices increase significantly some people will cut back their spending on other items and thus reducing sales tax revenue to the City. To minimize the risks of sales tax dependency, it is important for the City to have a variety of revenue sources that are not as sensitive to changes in the economy as is sales tax. This rationale is the basis for the City’s concentrated effort to develop a diversified industrial base to generate revenue from occupation license fees and business license fees. Economic and non‐economic factors interact, producing a synergy that has meant stability in all of the City’s revenue sources. The top four revenue sources of the General Fund typically comprise about 75‐80% of the total projected resources available to finance the annual expenditures of the Fund:
Table 1.General FundRevenue Sources
AmountAs % of
Total Rev AmountAs % of
Total Rev AmountAs % of
Total RevSales tax 21,081,232$ 39.9% 21,250,000$ 40.6% 21,541,500$ 40.5%Occupation license fee 8,448,505 16.0% 8,615,000 16.5% 8,873,000 16.7%Business license fee 8,112,960 15.3% 8,059,500 15.4% 8,139,500 15.3%Ad valorem (property) tax 4,092,017 7.7% 4,226,150 8.1% 4,278,067 8.0%
Total - Top 4 sources 41,734,714 78.9% 42,150,650 80.6% 42,832,067 80.6%
Total Revenues 52,895,467$ 100.0% 52,294,284$ 100.0% 53,155,597$ 100.0%
FY 2010 FY 2011 FY 2012Mid-Biennium Projected BudgetAudited Actual
In order to help management understand these important sources of income to the City of Auburn and prepare for how fluctuations to these income streams impact the ability of the City of Auburn to provide basic services, school funding and future projects, the following pages contain detailed information concerning the top four revenue sources: sales and use tax, occupation license fee, business license fee and Ad Valorem tax.
Page 14
2011 Revenue Review
Revenue Environment
Since the last Revenue Review in 2007 two significant changes have occurred in the general fund accounting that affects total revenue for this fund.
First, an enterprise fund was created at the beginning of fiscal year 2009 to account for the solid waste and recycling activities of the City of Auburn. The solid waste collection fees were moved out of the General Fund revenues to the Solid Waste Management Fund. This decreased revenues in the General Fund by approximately $3 million each fiscal year.
Second, at the beginning of 2009 all grant funding was moved to a special revenue fund. This modification actually made the general fund revenues more predictable as grants tend to be an irregular source of income designed for particular projects or assets.
All the numbers appearing in the document have been adjusted to reflect these two changes creating comparable totals.
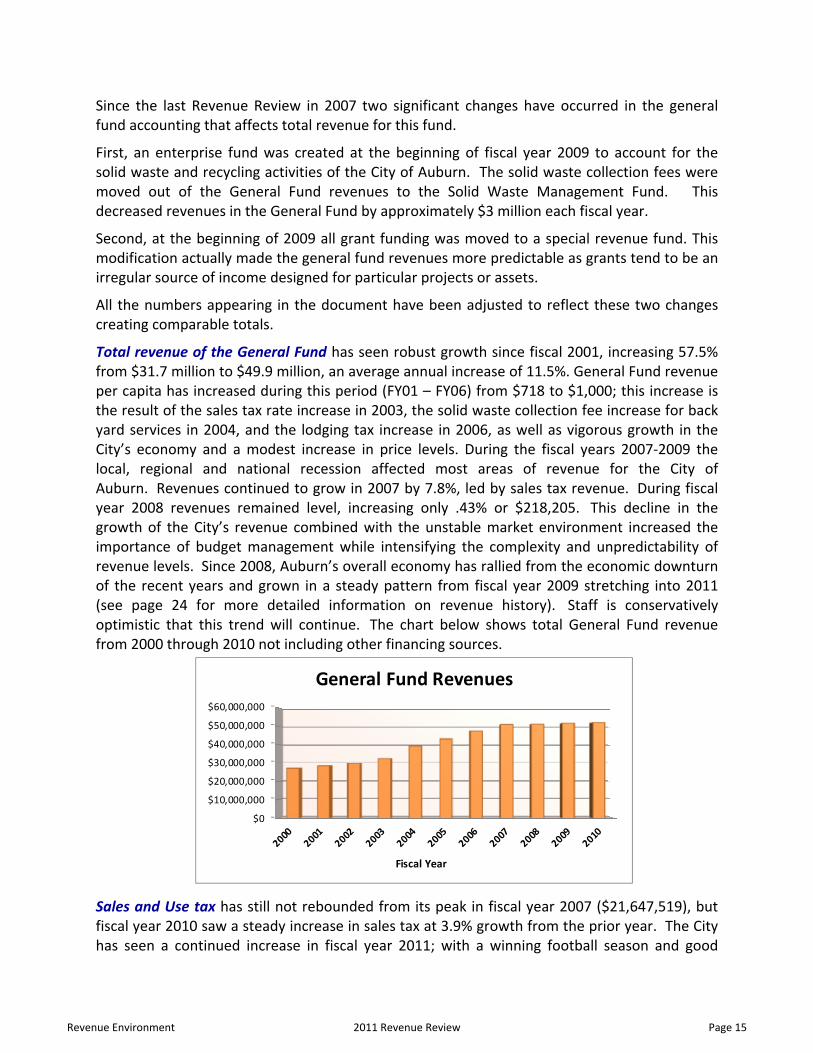
Total revenue of the General Fund has seen robust growth since fiscal 2001, increasing 57.5% from $31.7 million to $49.9 million, an average annual increase of 11.5%. General Fund revenue per capita has increased during this period (FY01 – FY06) from $718 to $1,000; this increase is the result of the sales tax rate increase in 2003, the solid waste collection fee increase for back yard services in 2004, and the lodging tax increase in 2006, as well as vigorous growth in the City’s economy and a modest increase in price levels. During the fiscal years 2007‐2009 the local, regional and national recession affected most areas of revenue for the City of Auburn. Revenues continued to grow in 2007 by 7.8%, led by sales tax revenue. During fiscal year 2008 revenues remained level, increasing only .43% or $218,205. This decline in the growth of the City’s revenue combined with the unstable market environment increased the importance of budget management while intensifying the complexity and unpredictability of revenue levels. Since 2008, Auburn’s overall economy has rallied from the economic downturn of the recent years and grown in a steady pattern from fiscal year 2009 stretching into 2011 (see page 24 for more detailed information on revenue history). Staff is conservatively optimistic that this trend will continue. The chart below shows total General Fund revenue from 2000 through 2010 not including other financing sources.
$0
$10,000,000
$20,000,000
$30,000,000
$40,000,000
$50,000,000
$60,000,000
Fiscal Year
General Fund Revenues
Sales and Use tax has still not rebounded from its peak in fiscal year 2007 ($21,647,519), but fiscal year 2010 saw a steady increase in sales tax at 3.9% growth from the prior year. The City has seen a continued increase in fiscal year 2011; with a winning football season and good
Revenue Environment
2011 Revenue Review
Page 15

Christmas sales the pattern is very positive at growth of 4.5% over FY2010. Total annual sales tax collected for 2010 was $20,781,087, up 3.9% from fiscal year 2009.
Occupation license fee revenue tends to follow general unemployment trends in the local area. However, with the stability of Auburn University and the diversified mix of commercial and industrial base within the City, collections of occupation license fee saw very little fluctuation overall during the recession. The City’s ability to recruit new industries even in the economic downturn played an important role in stabilizing this revenue source. The last five years have seen average growth in occupation license fee income of 4.5%. Fiscal year 2010 saw collections rise to $8.5 million. With the continued announcements of companies such as GE Aviation and Viper Motorsports investing in the City of Auburn this revenue source has a stable economic outlook.
Business License fees are a lagging indicator of the economy because the current year’s license fees are based on the amount of the business’ previous year’s gross receipts. Typically, this revenue source reflects changes in the prior year’s economic conditions, an increase or decrease in the number of businesses conducting operations in Auburn, the success of individual businesses, and the Finance Department’s business license enforcement efforts.
Included within the amount listed in Table 1 are General Business License fees, Franchise fees, and Residential and Commercial rental tax. Under a recent change, State law requires all fees based on gross receipts to be collected annually; therefore, the majority of these fees are collected in January and February of each year. General Business License fees revenue has shown average growth of 8.2% over the past five years with slowing of the progress in fiscal years 2010 and 2011. This fee comprises the greatest annual collection in this category; for fiscal year 2010 general City businesses remitted $5,494,869. Franchise fees are established by agreement. The City has standing contracts with utility and telecom companies based on gross receipts or cost per feet for use of the right‐of‐ways across Auburn. These agreements are renegotiated as they lapse and can vary in complexity and length with each enterprise. At September 30, 2010, these agreements totaled approximately $960,000 each year. With the introduction and growth of the telecom industries in this market, revenues could have a high probability of increasing over time; however, the powerful lobbying efforts by this industry have complicated and diluted this revenue stream. The last large contributor to business license fees are companies or individuals that rent to the Auburn residential community. Annualizing a change in timing of remittances, collections have increased by an average 7.6% per year in the last five years earning $1,158,176 in fiscal year 2010.
Ad Valorem taxes have seen steady increases in the last four years. With the presence of a highly acclaimed City education system, strong economy, major university and ample recreational opportunities, the City of Auburn is a highly desirable place to live and work. The City of Auburn has benefited from this stable base and been able to weather the housing crisis
Sales taxes FY2006 FY2007 FY2008 FY2009 FY2010Base Year
Year to date (YTD) 20,805,169$ 21,706,790$ 21,044,830$ 20,143,854$ 21,058,710$
YTD‐change from prior year 901,621 (661,960) (900,976) 914,856
Change from FY07 n/a ‐ (1,562,936) (648,080)
Page 16
2011 Revenue Review
Revenue Environment
with minimal effect on real estate values in the City limits. This is advantageous in multiple ways since Ad Valorem not only provides revenue to the City’s General Fund, but also to the City’s Debt Service Fund and to Auburn’s Board of Education. In fiscal year 2010, Ad Valorem taxes collected for the general fund equaled $3,704,717, an increase over the prior year of 6.3%. Prior to fiscal year 2010, this revenue source saw double digit increases each year; however, growth continues to slow in fiscal year 2011 to an increase of about 1%.
Less significant (in terms of percentages of total revenue) General Fund revenue sources include court fines; building permit fees; lodging, gasoline, liquor and cigarette taxes; interest on idle funds; other fees for services; and revenues shared by the State government. Of these less significant revenue sources, the Public Safety fee charged to Auburn University for services provided by the police and fire divisions on campus has a substantial impact to the General Fund revenues at $2 million in fiscal year 2010. This agreement continues to be negotiated as changes in services provided occur.
The City of Auburn’s General Fund has a relatively diversified revenue base. Although the General Fund is heavily reliant on sales tax revenues, the significant percentages of revenue generated by occupation license fees and business license fees are mediating factors. With the exception of property taxes, a significant majority of the remaining revenue sources can be changed by vote of the Council, which gives Auburn the flexibility to respond to changing economic conditions in the City. The City’s conservative budgetary approach and effective use of the budget to control expenditures has provided an adequate fund balance to see the City through possible natural disasters as well as short‐lived economic challenges. Taking this prudent approach means that constantly increasing tax and fee rates is not necessary.
Revenue Environment
2011 Revenue Review
Page 17
Sales and Use Tax
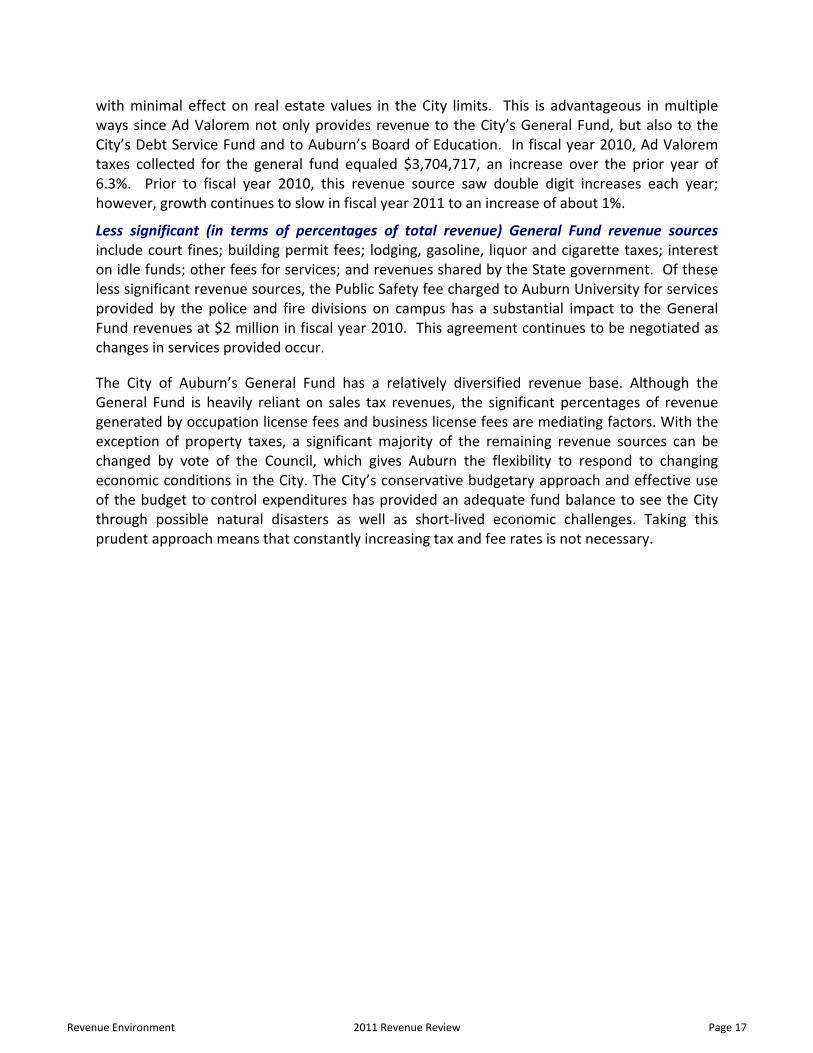
General Description: Sales taxes are levied on gross receipts resulting from the retail sale of tangible personal property within the corporate limits or police jurisdiction of a municipality. Use taxes are levied on gross receipts resulting from the retail sale of tangible personal property outside of a municipality that is subsequently brought into a municipality for use, storage or consumption by the purchaser. The City’s sales and use tax rate is 3.0%. The State sales tax rate is 4% and the county sales tax rate is 1%, for a combined sales tax rate within the City of 8.0%. This rate is comparable to that levied in our neighboring city and compares favorably with other Alabama cities nearby. The City sales tax is administered by the Finance Department staff. Growth in sales tax revenue is attributed to the economic development of the City.
Authority by which revenue imposed (State or City Code section): State Code: §11‐51‐200 through 207 §40‐23‐2 and §40‐23‐61 City Code: §12‐81
Process required for rate change: Ordinance change; Council approval
Date and ordinance number of last rate change: May 6, 2003 (Ord. #2118) changed the sales tax rate for the City of Auburn from 2.5% to 3.0%. Remitted by: Business owners generally monthly, but in some rare circumstances there are collections of sales tax on a quarterly or annual basis.
Fiscal Year Revenue Rate % change
2001 12,554,602.45 2.5%
2002 13,160,761.16 2.5% 4.8%
2003 14,589,314.80 2.5%, 3% 10.9%
2004 17,959,076.45 3% 23.1%
2005 18,429,012.64 3% 2.6%
2006 20,773,723.96 3% 12.7%
2007 21,784,156.76 3% 4.9%
2008 21,044,830.43 3% ‐3.4%
2009 20,143,853.98 3% ‐4.3%
2010 21,081,231.64 3% 4.7%
Ten‐year History
Rates charged by other Alabama cities (in total): Montgomery – 10.0% Tuscaloosa – 9.0% Birmingham – 10.0% Dothan – 9.0% Opelika – 8.0% Increase in current rates would yield (based on 2010 revenues): ¼% ‐ $1.76 million annually ½% ‐ $3.51 million annually 1% ‐ $7.03 million annually
$10.00
$12.00
$14.00
$16.00
$18.00
$20.00
$22.00
$24.00
2001
2002
2003
2004
2005
2006
2007
2008
2009
2010
Millions
Page 18
2011 Revenue Review
Revenue Environment

Occupational License Fee
General Description: A license fee assessed against a person that engages in any trade, occupation, or profession within the City for the privilege of engaging in such activities. The City’s occupational license fee is 1% and is half a percent (.5%) less than that levied in our neighboring city. The City occupational license fee is administered by the Finance Department staff. Growth in occupational license fee revenue is attributed to business expansion and economic development of the City. Authority by which revenue imposed (State or City Code section): State Code: §11‐51‐90 City Code: §12‐34 Process required for rate change: Ordinance change; Council approval Date and ordinance number of last rate change: Jan 20, 1970 (Ord. #416) set the Occupational license fee in the City of Auburn 1.0% of gross wages. Remitted by: Business owners and individuals employed by the Federal government on quarterly basis
Fiscal Year Revenue Rate % change
2001 5,063,471.96 1.0%
2002 4,981,415.09 1.0% ‐1.6%
2003 5,557,851.15 1.0% 11.6%
2004 7,197,943.09 1.0% 29.5%
2005 6,785,102.64 1.0% ‐5.7%
2006 7,402,470.13 1.0% 9.1%
2007 7,826,656.41 1.0% 5.7%
2008 8,174,202.00 1.0% 4.4%
2009 8,107,024.32 1.0% ‐0.8%
2010 8,448,504.92 1.0% 4.2%
Ten‐year History
Rates charged by other Alabama cities (in total): Montgomery – 1.5% Gadsden – 2.0% Birmingham – 1.0% Opelika – 1.5% Increase in current rates would yield (based on 2010 revenues): ⅛% ‐ $1.06 million annually ¼% ‐ $2.11 million annually ½% ‐ $4.22 million annually
$4.00
$4.50
$5.00
$5.50
$6.00
$6.50
$7.00
$7.50
$8.00
$8.50
$9.00
2001
2002
2003
2004
2005
2006
2007
2008
2009
2010
Millions
Revenue Environment
2011 Revenue Review
Page 19

Ad Valorem – Property Tax
General Description: A tax levied upon the appraised value of real and personal property located inside the corporate limits of a municipality. The City’s property tax rate is 26 mills with 16 mills going to education. The State property tax rate is 6.5 mills and the county property tax rate is 21.5 mills, for a combined property tax rate within the City of 54 mills. This rate is comparable to that levied in our neighboring city. The City property tax fee is administered by the Lee County Revenue Commissioner’s Office. Growth in property tax revenue is attributed to geographical expansion (annexations) and increased property development in the City.
Authority by which revenue imposed (State or City Code section): State Code: §11‐51‐1 and §11‐51‐42 City Ordinance: #94
Process required for rate change: Legislature approval Ordinance change; Council approval Citizen Approval
Date and ordinance number of last rate change: Oct. 1, 1996 (Ord. #1628) established an additional 6 mills, for a total of 11 mills, for the additional special school tax
Remitted by: Lee County Revenue Commissioner on a monthly basis
Fiscal Year Revenue Rate % change
2001 1,844,582.12 5 mills
2002 1,930,709.50 5 mills 4.7%
2003 2,045,241.78 5 mills 5.9%
2004 2,433,164.01 5 mills 19.0%
2005 2,893,435.93 5 mills 18.9%
2006 2,730,686.66 5 mills ‐5.6%
2007 3,140,581.32 5 mills 15.0%
2008 3,586,577.23 5 mills 14.2%
2009 3,828,736.81 5 mills 6.8%
2010 4,092,017.37 5 mills 6.9%
Ten‐year History
Rates charged by other Alabama cities (in total): Montgomery – 36.5 mills Dothan – 33 mills Birmingham – 69.5 mills Opelika – 54 mills Hoover (Jeff. Co.) – 72.6 mills Mt. Brook – 99 mills Vestavia Hills (Jeff. Co.) – 92.6 mills Hoover (Shelby Co.) – 66.5 mills Vestavia Hills (Shelby Co.) – 79.3 mills
Increase in current rates would yield (based on 2010 revenues): ¼ mill ‐ $204,600 annually ½ mill ‐ $409,201 annually 1 mill ‐ $818,403 annually
$1.50
$2.00
$2.50
$3.00
$3.50
$4.00
$4.502001
2002
2003
2004
2005
2006
2007
2008
2009
2010
Millions
Page 20
2011 Revenue Review
Revenue Environment

Business License Fee
General Description: A license fee levied against any company or person conducting business in the City. The City’s business license fee for most new businesses is $100, plus a $5 issuance fee. The renewal fee is based on the business’s prior year’s gross receipts and varies depending on the type of business; however, certain categories have flat renewal fee. These rates are comparable to those levied in our neighboring city. The City business license fee is administered by the Finance Department staff. Growth in business license revenue is attributed to business expansion and economic development of the City. Authority by which revenue imposed (State or City Code section): State Code: §11‐51‐90 to §11‐51‐185 City Ordinance: #885 Process required for rate change: Ordinance change; Council approval Date and ordinance number of last rate change: Oct 16, 2007 (Ord. #2521) changed the due date and penalty amounts for renewals and added a delivery services category Remitted by: Business owners on an annual basis
Fiscal Year Revenue Rate % change
2001 2,898,315.32 GR and Flat
2002 3,096,276.70 GR and Flat 6.8%
2003 3,257,389.92 GR and Flat 5.2%
2004 3,454,303.99 GR and Flat 6.0%
2005 3,667,937.68 GR and Flat 6.2%
2006 3,916,911.99 GR and Flat 6.8%
2007 4,584,524.34 GR and Flat 17.0%
2008 4,911,150.90 GR and Flat 7.1%
2009 5,304,898.42 GR and Flat 8.0%
2010 5,494,868.43 GR and Flat 3.6%
Ten‐year History
$2.50
$3.00
$3.50
$4.00
$4.50
$5.00
$5.50
$6.00
2001
2002
2003
2004
2005
2006
2007
2008
2009
2010
Millions
Revenue Environment
2011 Revenue Review
Page 21

Page 22
2011 Revenue Review
Revenue Environment

FY10^ FY11 FY12 FY13 FY14 FY15 FY16
$ $ $
Beginning Fund Balance* 25,686,771 23,374,405 19,848,716 19,192,808 17,028,872 14,853,420 12,035,155
Revenues 52,114,937 52,294,284 53,155,567 54,511,225 56,006,932 57,493,825 58,973,182
Other Financing Sources (OFS) 2,111,250 466,250 241,250 244,650 248,118 251,655 255,263
Total Revenues & OFS 54,226,187 52,760,534 53,396,817 54,755,875 56,255,050 57,745,480 59,228,445
Expenditures 46,971,169 48,201,717 45,793,564 48,298,435 49,592,028 51,508,842 51,655,326
Other Financing Uses (OFU) 9,567,384 8,084,506 8,259,161 8,621,377 8,838,474 9,054,903 9,270,849
Total Expenditures & OFU 56,538,553 56,286,223 54,052,725 56,919,811 58,430,502 60,563,745 60,926,175 Excess of Revenues & OFS over
Expenditures & OFU (2,312,366) (3,525,689) (655,908) (2,163,936) (2,175,452) (2,818,265) (1,697,730)
Ending Fund Balance 23,374,405 19,848,716 19,192,808 17,028,872 14,853,420 12,035,155 10,337,425 Less: Permanent Reserve Fund** 4,682,899 4,350,402 4,080,729 4,141,940 4,204,069 4,267,130 4,331,137 Net Ending Fund Balance 18,691,506 15,498,314 15,112,079 12,886,932 10,649,351 7,768,024 6,006,288
Net Ending Fund Balance as a % of
Expenditures and OFU 33.06% 27.53% 27.96% 22.64% 18.23% 12.83% 9.86%
* Beginning fund balances include the Permanent Reserve.
** Permanent Reserve interest earnings are compounded at an estimated 1.5% annually.^ For easier trend analysis, revenues and expenditures do not include approximately $13.3 million due to debt restructuring transactions occuring in 2010. This occurred to
take advantage of the current downward trend in lending rates and reduce the City's interest costs.
City of AuburnGeneral Fund (Fund 100 only) ‐ Changes in Fund Balance
The City Council's approach to determining the level of fund balance to be maintained in the City's General Fund is two‐fold: 1) a strong budget administration and
monitoring process that enables timely management responses to changing economic conditions; and 2) commitment to taxation levels that will support the
provision of services and facilities, as well as provide appropriate reserves. Management strives to maintain a fund balance that is 20‐25% of expenditures. In 2001,
the Council created a Permanent Reserve, to be used only in times of natural disaster or significant, unexpected economic stress. Maintaining strong reserves is a
strategy that has worked well over the years. In the 1990s, this approach sustained the City during recovery from hurricanes and is helping to mitigate the effects of
the current recession.
Projected
Actual
Audited
‐
10
20
30
40
50
60
70
FY10^ FY11 FY12 FY13 FY14 FY15 FY16
Beginning Fund Balance Total Revenues & OFS Total Expenditures & OFU Ending Fund Balance
ProjectedActual
Millions$
Revenue Environment
2011 Revenue Review
Page 23

City of Auburn
General Fund (Fund 100 only) ‐ Revenue History
Fiscal Years 2005‐2010
Actual (Audited
)
FY 2005
FY 2006
FY 2007
FY 2008
FY 2009
FY 2010
Amount
As %
Avg %
Amount
As %
Revenues
Sales taxes
18,429,013
$
20,773,724
$
21,784,156
$
21,044,830
$
20,143,854
$
21,081,232
$
2,652,219
$
14.4%
2.9%
937,378
$
4.5%
Occupation license fees
6,785,103
7,402,470
7,826,657
8,174,202
8,107,024
8,448,505
1,663,402
24.5%
4.9%
341,481
4.2%
Business licen
se fees
6,080,533
5,770,776
7,182,638
7,443,091
8,277,159
8,122,444
2,041,911
33.6%
6.7%
(154,716)
‐2.1%
Property taxes
2,893,436
2,730,687
3,140,582
3,586,677
3,828,737
4,092,017
1,198,581
41. 4%
8.3%
263,281
7.3%
Solid
waste collection fees*
2,441,380
2,557,582
2,665,251
2,762,401
‐
‐
(2,441,380)
‐100.0%
‐20.0%
‐
n/a
Court and parking fines
1,013,374
1,083,225
1,335,799
1,471,164
1,411,047
1,323,298
309,924
30.6%
6.1%
(87,749)
‐6.0%
Construction permits
794,430
942,508
1,015,305
674,493
866,284
495,582
(298,848)
‐37.6%
‐7.5%
(370,703)
‐55.0%
E‐911 fees
429,971
415,753
429,522
530,753
553,486
570,795
140,824
32.8%
6.6%
17,310
3.3%
Ren
tal and leasing tax
426,891
499,315
488,266
484,973
427,743
408,718
(18,173)
‐4.3%
‐0.9%
(19,026)
‐3.9%
Public safety charges
2,032,035
2,165,192
2,295,703
2,373,847
2,335,554
2,390,973
358,938
17.7%
3.5%
55,419
2.3%
Interest
449,946
814,558
811,561
572,988
415,463
244,203
(205,743)
‐45.7%
‐9.1%
(171,260)
‐29.9%
Lodging taxes
668,094
1,085,062
1,369,273
1,425,637
1,184,540
1,253,511
585,417
87.6%
17.5%
68,970
4.8%
State shared
taxes
774,585
1,040,720
919,494
950,199
1,166,771
654,127
(120,458)
‐15.6%
‐3. 1%
(512,644)
‐54.0%
Grants^
520,061
321,314
235,479
450,412
‐
‐
(520,061)
‐100.0%
‐20.0%
‐
0.0%
Corrections "fund" fees
168,531
181,448
210,383
203,802
207,270
232,024
63,493
37.7%
7.5%
24,754
12.1%
Other Fees for Services
418,174
688,228
604,317
997,858
1,194,710
1,239,336
821,162
196.4%
39.3%
44,626
4.5%
Other reven
ues
1,619,961
1,644,827
1,498,447
1,201,514
1,544,064
1,558,173
(61,788)
‐3.8%
‐0.8%
14,109
1.2%
Total reven
ues
45,945,518
50,117,389
53,812,833
54,348,842
51,663,707
52,114,937
6,169,419
13. 4%
2.7%
451,230
0.8%
Other finan
cing sources (OFS)
‐
Transfers in from other funds
509,450
1,070,272
605,995
753,375
293,307
241,250
(268,200)
‐52.6%
‐10.5%
(52,057)
‐6.9%
Borrowing proceed
s15,869,000
‐
7,000,000
23,468,100
2,031,270
1,870,000
(13,999,000)
‐88.2%
‐17.6%
(161,270)
‐0.7%
Total O
FS16,378,450
1,070,272
7,605,995
24,221,475
2,324,577
2,111,250
(14,267,200)
‐87.1%
‐17.4%
(213,327)
‐0.9%
‐
Total revenues an
d OFS
62,323,968
$
51,187,661
$
61,418,828
$
78,570,316
$
53,988,284
$
54,226,187
$
(8,097,781)
$
‐13.0%
‐2.6%
237,903
$
0.3%
* Th
e Solid
Waste collection fees were moved to the Solid
Waste M
anagement Fund during FY 2009.
^ Grant funding was m
oved from the General Fund to its own Special Revenue Fund during FY 2009.
Increase FY10 > FY05
Increase FY10 > FY09
$‐
$5,00
0,00
0 $10
,000
,000
$15
,000
,000
$20
,000
,000
$25
,000
,000
$30
,000
,000
$35
,000
,000
$40
,000
,000
$45
,000
,000
$50
,000
,000
$55
,000
,000
Gen
eral Fund Reven
ue Trends ‐Fiscal Years 2005‐2010
Sales taxes
Occupation license
fees
Business license fees
Property taxes
All Other Reven
ue
Page 24
2011 Revenue Review
Revenue Environment

City of Auburn
General Fund (Fund 100 only) ‐ Revenue and Expenditure Projections
Fund 100 only
2010
2011
2013‐2016
2011
2012
2013
2014
2015
2016
Budget
Actual at
% of Budg
Projection
Revenues
Feb 28 11
at 41.7% of yr
5‐yr avg
1 yr ▲
Factors
Sales taxes
21,081,232
$
20,625,000
$
9,714,416
$
47.1%
2.9%
4.5%
2.5%
21,250,000
$
21,541,500
$
22,080,038
$
22,632,038
$
23,197,839
$
23,777,785
$
Occupation license fees
8,448,505
8,256,000
3,982,528
48.2%
4.9%
4.2%
3.5%
8,615,000
8,873,000
9,183,555
9,504,979
9,837,654
10,181,972
Business licen
se fees
8,122,444
8,149,500
6,650,275
81.6%
6.7%
‐2.1%
3.2%
8,059,500
8,139,500
8,399,964
8,668,763
8,946,163
9,232,440
Property taxes
4,092,017
4,126,150
3,693,080
89.5%
8.3%
7.3%
1.9%
4,226,150
4,278,067
4,357,211
4,437,820
4,519,919
4,603,538
Court and parking fines
1,323,298
1,040,000
457,939
44.0%
6.1%
‐6.0%
2.5%
1,072,000
1,108,640
1,135,802
1,163,629
1,192,138
1,221,345
Construction permits
495,582
630,000
168,275
26.7%
‐7.5%
‐55.0%
0.0%
475,000
480,000
480,000
480,000
480,000
480,000
E‐911 fees
570,795
545,000
221,383
40.6%
6.6%
3.3%
0.0%
540,000
435,000
435,000
435,000
435,000
435,000
Ren
tal and leasing tax
408,718
411,000
182,445
44.4%
‐0.9%
‐3.9%
2.0%
411,000
441,000
449,820
458,816
467,993
477,353
Public safety charges
2,390,973
2,317,000
1,340,543
57.9%
3.5%
2.3%
1.1%
2,577,000
2,579,000
2,607,369
2,636,050
2,665,047
2,694,362
Interest
244,203
255,628
55,140
21.6%
‐10.2%
‐29.9%
0.0%
167,130
166,840
166,890
166,940
166,990
167,040
Lodging taxes
1,253,511
1,151,000
600,944
52.2%
17.5%
4.8%
2.0%
1,376,000
1,403,500
1,431,570
1,460,201
1,489,405
1,519,194
State shared
taxes
654,127
674,140
277,262
41.1%
‐2.8%
‐54.0%
5.9%
632,140
635,640
672,952
712,454
754,275
798,551
"Corrections fund" fees
232,024
200,000
84,324
42.2%
7.5%
12.1%
5.0%
200,000
210,000
220,500
231,525
243,101
255,256
Other Fees for Services
1,239,336
1,142,750
495,282
43.3%
9.2%
4.5%
n/a
1,172,750
1,172,206
1,189,285
1,206,757
1,224,632
1,242,919
Other reven
ues
1,558,173
1,456,214
638,949
43.9%
‐3.4%
1.2%
n/a
1,520,614
^1,691,674
1,701,270
1,811,959
1,873,668
1,886,426
Total revenues
52,114,937
50,979,382
28,562,787
56.0%
2.3%
0.8%
52,294,284
53,155,567
54,511,225
56,006,932
57,493,825
58,973,182
Other finan
cing sources (OFS)
Transfers in from other funds
241,250
466,250
164,583
35.3%
‐10.5%
‐6.9%
gas tax only
466,250
241,250
244,650
248,118
251,655
255,263
Borrowing proceed
s1,870,000
‐
n/a
‐
‐
Total O
FS2,111,250
466,250
164,583
35.3%
466,250
241,250
244,650
248,118
251,655
255,263
Total revenues an
d OFS
54,226,187
51,445,632
28,727,370
55.8%
52,760,534
53,396,817
54,755,875
56,255,050
57,745,480
59,228,445
Expenditures
Departm
ental
Personal
26,477,101
27,812,948
23.3%
3.7%
27,829,418
27,631,428
28,460,371
29,314,182
30,193,607
31,099,416
Contractual
4,513,744
4,717,567
25.2%
4.1%
5,036,054
4,859,994
5,134,898
5,306,843
5,436,224
5,569,319
Commodities
2,705,371
2,997,079
6.3%
4.3%
3,013,933
2,814,745
2,987,944
3,101,974
3,195,868
3,293,870
Capital Outlay
635,852
‐
‐30.0%
61.1%
1,439,890
‐
750,000
772,500
795,675
819,545
Projects
19,981
115,000
‐91.9%
‐41.7%
115,000
15,000
15,300
100,606
15,918
16,237
Agency Support
218,016
262,274
201.7%
‐ 5.4%
276,643
276,643
282,176
282,176
287,819
287,819
Total D
epartm
ental
34,570,064
35,904,868
19.8%
4.4%
37,710,938
35,597,810
37,630,689
38,878,282
39,925,113
41,086,206
Non‐departm
ental
‐
‐
‐
‐
‐
‐
‐
‐
Gen
eral Operations
3,263,945
1,621,886
‐47.8%
146.9%
1,612,812
1,581,294
1,561,714
1,609,153
1,677,228
1,726,626
Gen
eral Ops Personal Services
106,208
125,829
24.8%
118.9%
125,829
124,802
102,655
83,804
74,988
76,207
PW Project Operations
1,792,632
531,147
32.2%
‐34.4%
5,000
‐
565,000
658,334
2,050,000
1,890,000
Outside Agencies
812,921
859,125
‐31.0%
‐32.7%
894,125
848,410
909,500
863,587
928,259
882,512
Deb
t Service
6,425,398
6,302,501
‐66.2%
0.1%
7,853,013
7,641,248
7,528,877
7,498,869
6,853,254
5,993,776
Total N
on‐Departm
ental
12,401,105
9,440,488
‐55.5%
5.7%
10,490,779
10,195,754
10,667,745
10,713,747
11,583,729
10,569,120
Total Expenditures
46,971,169
45,345,356
‐17.2%
4.7%
48,201,717
45,793,564
48,298,435
49,592,028
51,508,842
51,655,326
Other Finan
cing Uses (OFU
)‐
‐
‐
‐
‐
‐
‐
‐
Transfers
2,516,625
2,084,246
481.2%
453.1%
1,033,746
1,208,401
1,390,801
1,409,505
1,428,711
1,448,434
Auburn City Schools
7,050,759
7,050,760
18.7%
0.9%
7,050,760
7,050,760
7,230,576
7,428,969
7,626,192
7,822,416
Total O
FU9,567,384
9,135,006
163.9%
132.1%
8,084,506
8,259,161
8,621,377
8,838,474
9,054,903
9,270,849
Total Expenditures an
d OFU
56,538,553
54,480,362
6.8%
27.7%
56,286,223
54,052,725
56,919,811
58,430,502
60,563,745
60,926,175
(2,312,366)
(3,034,730)
(3,525,689)
(655,908)
(2,163,936)
(2,175,452)
(2,818,265)
(1,697,730)
^ Projected
fiscal years are based
on the projection percentages listed.
Excess of Revenues & OFS over
Expendutires & OFU
Percent change
* For easier trend analysis, O
ther Financing Sources and Other Financing Uses do not include approximately $13.3 m
illion due to deb
t restructuring transactions occuring in 2010. This occurred
to take
advantage of the curren
t downward trend in
lending rates and red
uce the City's interest costs.
Actual
(audited
)*
2011
Historical
Mid Bi. Projected
Projected
^
Revenue Environment
2011 Revenue Review
Page 25

Effective Date of
Most Recent
Revenue Source City County State Total City Rate Change
General Fund
Sales Tax general items 3% 1% 4% 8% August 1, 2003
automobiles 1.1% 0.25% 2% 3.35%
manufacturing and farm machines 1.5% 0.25% 1.5% 3.25%
Occupation License Fee 1% 1% January 20, 1970
Business License Fees January 1, 2000
Ad valorem (property) tax 5 mills 21.5 mills 6.5 mills 33 mills Prior to 1948
Lodging Tax 7% (1% is committed to the Visitors Bureau) 2% 4% 13% February 1, 2006
Cigarette Tax* $.04 per pack ‐ 0 ‐ 42.5¢ 46.5¢ March 10, 1981
Rental and Leasing Tax 1 1/4% of lease amount on automobiles 1.5% 3.75% April 1, 20012 1/2% of lease amount on all other items 4% 6.5%
linens/clothing 2% 4.5%video rental 10¢
Gasoline Taxes* ‐ 0 ‐ 16¢ 18¢ March 23, 1976
Building Permit Fees 1990
Leased Parking $100/month, effective October 1, 2008 October 1, 2008
Parking Fines $5, meter violation ($10 if not paid in 48 hours) November 5, 2002
$50, parking in leased space
$100, parking in handicapped space
Library Fees September 2008
Planning Fees various January 1, 2003
Inspection Fees March 16, 2004
Five Mill Tax Fund
Ad valorem (property) tax 5 mills 5 mills Prior to 1948
Special School Tax FundAd valorem (property) tax 11 mills 11 mills October 1, 1996
Additional School Tax Fund
Ad valorem (property) tax 5 mills 5 mills October 1, 1960
Property Tax Summary City County State Total
General Fund 5 mills 6.5 mills 2.5 mills 14 mills
Education 16 mills 5 mills 3 mills 24 mills
Auburn district shools 3 mills 3 mills
Roads and bridges 3 mills 3 mills
Debt retirement 5 mills 5 mills
County hospital 2.5 mills 2.5 mills
Veterans' pension 1 mill 1 mill
Dependent children 1.5 mills 1.5 mills
Totals 26 mills 21.5 mills 6.5 mills 54 mills
* The City also collects these taxes from businesses in the Police Jurisdiction at half the rate levied against businesses in the corporate limits
Rates
Overdue fees are $.50 per day for DVD's and
videos; $.10 per day for all other items.
Graduated base fee + additional fee. Up
Library cards for individuals not living in or working
in the City or attending Auburn University are $25
annually.
First and second inspections included in building
permit fee; $25 for third inspection; $100
various percentages of gross receipts,
$100 minimum
City of Auburn
Schedule of Tax and Fee Rates
2¢ per gallon (1¢ to General Fund, 1¢ to City Gas
Tax Fund)
Revenue Environment
Page 26
2011 Revenue Review

City of Auburn
2011 Revenue Review
Expenditure Environment
This section of the document contains the expenditure assumptions that form the foundation of the long‐term financial projections. The Revenue Review is designed to present a conservative, yet balanced, look at the City’s revenue position, and how well those revenues will fund the level of expenditures required to meet the objectives of the City Council, the Management Team, and our residents. The expenditure environment is discussed in the context of the City’s Mission Statement and how the different objectives of the Council are translated into projects and initiatives. Following this narrative, you will find the City’s Working Capital Improvement Plan (CIP) and a comprehensive debt service schedule. The debt service schedule includes existing debt to maturity, future debt as dictated by the CIP, and “other” debt, which are payments to other entities for the City’s share of debt they incurred on cooperative initiatives. In addition, debt is also presented grouped by functional activity, to allow a more complete picture of the types of projects the debt was used to fund. Expenditure Environment and the Mission of the City of Auburn We undertake the Revenue Review to critically evaluate the capacity of the City’s revenue sources to achieve the stated goals of the City Council and the City’s administration. In the short‐term we reflect these goals through the current Biennial Budget; in the medium term through the Capital Improvement Plan (CIP); and in the long‐term through the City’s Mission Statement. Thus, this section of the document provides an overview of the various expenditures proposed in the short‐ and medium‐term (Biennial Budget and CIP) to meet the long‐term objectives of the Mission Statement. The mission of the City of Auburn is to provide economical delivery of quality services, created and designed in response to the needs of its citizens, rather than by habit or tradition. We will achieve this by:
Encouraging planned and managed growth as a means of developing an attractive built environment and by protecting and conserving our natural resources. In 2009, the Office of the City Manager announced its intent to reorganize several departments whose services centered on growth and development‐related issues and infrastructure provision. The Neighborhood, Growth, Development and Infrastructure (NGDI) Business Unit include Water Resource Management, Public Works, Environmental Services, and Planning Departments, and will include the Codes Enforcement Division of the Public Safety Department. While the City has done an excellent job in these individual areas, the strong growth we have experienced in Lee County, coupled with changing economic and environmental realities, require us to adapt our organization and workforce to operate more efficiently, cooperatively, and without duplication of services. A key part of this
Expenditure Environment
2011 Revenue Review
Page 27

initiative requires co‐locating several of these departments, now spread across multiple sites, into a single facility. The Alabama Street facility, acquired by the Council in August of 2010, will not only have significant organizational advantages, but with the Bailey‐Alexander Water Sewer Complex just down the road, also offer a convenient location for the development community and residents to obtain permitting and inspection services. A contract for the preliminary programmatic design has already been approved by Council, and the first phase of the facility renovation is expected to occur in FY2012. Currently, this first phase is budgeted at $2,000,000 and will be funded, if approved by the voters, with the next Special Five Mill bond issue. Subsequent phases are not currently funded. The space vacated by these reorganized departments will be used to expand the Police Division offices. Additional operational costs for this new facility are estimated at $150,000 annually and are included in the expenditure projections; at this time, no additional departmental spending is anticipated as savings are expected through the elimination of duplication and added efficiency.
Creating diverse employment opportunities leading to an increased tax base. While cities across the country have responded to huge revenue declines and budget deficits through layoffs, furloughs, tax increases, and service reductions, Auburn has been fortunate to avoid many of these tough choices. This is due in part to our Council’s support of an aggressive and innovative approach to economic development. The City’s continued effort to attract and retain quality, technology‐based industries has complemented the economic strength and stability provided by Auburn University, and helped buoy the City’s fiscal position through the current recession. While the City has announced several high‐profile industrial projects in the past few years, it is important to recognize that we cannot rest on these accomplishments. Industrial development in the Southeast continues to be extremely competitive, and we must develop and market our technology parks in order to realize new jobs and revenue. The completion of Auburn Technology Park West (ATPW), at a cost of $2,800,000, is currently on our CIP for FY2013 and debt service is included in the expenditure projections; revised estimates for the park’s ultimate completion include an additional $2,200,000 that is currently not funded. The construction of a new interchange to serve ATPW and Auburn’s south side is underway; however, $5,000,000 in additional funding for West Veterans Extension to further expand industrial access has not yet been identified. Additionally, the City will need to identify and secure significant acreage for the future construction of our fourth technology park in the next five years; this is conservatively estimated at $8,000,000 and is currently not funded. Commercial development continues to be vitally important as well. While the City has had some successes in commercial development, our efforts need to be increased if we are to remain competitive. With locally‐levied sales taxes providing over 40% of the revenues to the General Fund, targeted commercial development activities, including additional staff and funding, will need to increase in the coming years. Additional funding for these
Expenditure Environment
Page 28
2011 Revenue Review

activities has not been included in the projections, as a funding source has not been identified. The CIP and expenditure projections currently include only the completion of ATPW. Operational costs of the Industrial Development Board and Commercial Development Authority are projected to increase only .5% due to current budget constraints. In responding the 2011 Citizen Survey question of how or whether the City’s efforts to pursue commercial and industrial projects should change in the future, 87% felt they should either stay the same or increase. With all of the above in mind, the Council will need to determine how best to move the City’s economic base forward. Providing and maintaining appropriate infrastructure. While the general condition of our infrastructure is better than that of many of our peer communities, 43% of residents continue to identify street maintenance as the area of City maintenance requiring the most emphasis. Road reconstruction and resurfacing tied with downtown parking as their highest priority projects. In recent years, the City has undertaken numerous major projects in an effort to improve our transportation and utility infrastructure; residents have noticed these initiatives, as the number of residents who believe the City is building appropriate infrastructure to keep up with growth increased by 10%, according to the 2011 survey. While the City has been able to keep up with infrastructure needs during the current downturn, it is important to keep in mind the management’s budget strategy since the recession began. In 2008, in response to resident demands and declining revenues, infrastructure spending was funded largely through proceeds of the Special Five Mill bond referendum, not from the General Fund. This was anticipated to be a short‐term measure and would not be sustainable beyond FY2012. As our infrastructure needs have been funded by the Special Five Mill for the past three years, adjusted General Fund expenditures on capital projects over the last three years have been at their lowest levels since FY2002. In a recent report to the City Manager, the City Engineer recommended approximately $3,000,000 in street resurfacing needs each fiscal year in order to properly maintain the City’s road network; based on the current funding identified in the CIP, this results in an annual funding deficit of between $1,000,000 and $1,500,000. Under the current funding scenario, these unfunded resurfacing projects would aggregate until debt service capacity was available to fund a large‐scale resurfacing effort in FY2016‐FY2017. Other long‐term infrastructure needs are identified as well. The CIP (later in this section) shows all planned projects and their funding sources. Debt is proposed to fund several larger projects, most notably the replacement of Moores Mill Bridge. Also, in FY2013, the funding for several capital infrastructure projects will again be provided by the General Fund. Both the direct capital funding and debt service for the projects on the CIP are included in the long‐term General Fund expenditure projections and are major contributing factors in the continuing drawdown of fund balance over time.
Expenditure Environment
2011 Revenue Review
Page 29
Providing and promoting quality housing, education, cultural and recreational opportunities. The overwhelmingly positive results from the 2011 Citizen Survey continued to prove that the City Council and administration are heading in the right direction in providing services directed at maintaining a high quality of life in our city. Although citizen priorities for recreation‐based projects continue to lag behind transportation infrastructure and public safety projects, our residents nevertheless demand quality parks and community‐based recreation opportunities. The current CIP includes several recreation projects, as well as an increased emphasis on pedestrian and bicycle facilities. A major expansion of the Frank Brown Recreation Center and construction of the Senior Center will be presented to voters this year as part of the 2011 Special Five Mill Referendum. Our City K‐12 education continues to be among the best in the state, but fiscal pressure continues on Auburn City Schools (ACS) due to declining state revenues and increasing enrollment. In October of 2010, officials with ACS presented their concerns to the Council and, in the past several months, numerous meetings have been held between ACS and City officials regarding how best to address their funding needs in the future. While the long‐term expansion plans are still being developed, it is clear that funding will be needed to purchase land and construct a new elementary school, as well as secure land for a future high school. The current estimate for these short‐term needs is approximately $17,500,000, and no funding capacity is available. Providing quality public safety services. The City’s provision of public safety services has continually resulted in the efficient delivery of innovative, effective, high quality police and fire services. Residents recognize this as an area of government that adds to our high quality of life and overall satisfaction with police, fire, and ambulance service was 88% in the 2011 survey, compared with the national average of 80%. In every category measured, police services outperformed the national averages. The Citizen Survey statistics, coupled with our low crime rates, attest to the high level of skill and professionalism embodied in our Police Division. Our Fire Division delivers excellent services as well, and is able to do so with a high level of efficiency due to innovative programs, such as the Student Firefighter Program. Recent efforts at better integrating the City’s Geographic Information System (GIS) into determining response areas have significantly reduced response times, while an ongoing effort to have onsite pre‐fire building plans available in frontline vehicles will allow first responders to more safely and effectively operate in the field. As with transportation and utility infrastructure, public safety services are increasingly feeling the pressures of population and area growth. Public Safety divisions have been roughly level funded since FY08 while service area and population have steadily increased. In Police and Fire Divisions, personnel costs account for roughly 90% of their overall budgets (65‐75% in other City departments), leaving little flexibility for adjusting expenditures to meet challenges such as the rising cost of fuel (over $300,000 in FY2010). Service area expansions due to frequent annexations and the rise of incidents in the police jurisdiction also add to costs. Additionally, the merger of the City’s Police Division with Auburn
Expenditure Environment
Page 30
2011 Revenue Review
University’s Department of Public Safety increased Police staff size by 40% requiring additional space and facilities. While general operating and personnel costs make up the vast majority of public safety spending, facility expansion and equipment replacement needs remain the highest priority budgetary challenge. In the 2011 Citizen Survey, 52% of residents identified the expansion of police protection and facilities as their highest priority project. The relocation of the departments of the NGDI Business Unit to the future Alabama Street facility will allow our Public Safety divisions, primarily Police, to fully occupy the Douglas J. Watson Municipal Complex (DJWMC), more than doubling their current office space. Funding is tentatively included in the CIP for a portion of the eventual renovation of the DJWMC, but additional funds will be required to fully modify the existing facility to their needs. Equipment replacement is another major need that is projected to become underfunded. The severe duty conditions in which emergency vehicles operate require an accelerated replacement schedule. Rapidly advancing technology, changing federal standards, and a continually evolving operating environment require constant attention to equipment, facilities and training needs. The CIP contains $5,763,550 in public safety projects through FY2016, with $1,508,550 of this amount funded either conditionally upon sufficient revenues or with potential grant funding. The current method of funding replacement equipment conditionally based on sufficient prior year revenue will not provide the stability of a dedicated funding level.
Operating an adequately funded city government in a financially responsible and fiscally sound manner. One of the most concise measures of citizen satisfaction with government is whether they feel they receive good value for their money. The 2011 Citizen Survey found that 78% of Auburn residents are satisfied with the value they receive for their tax dollars, compared to the national average of 45%. In order to continue earning exceptional scores, an honest assessment of the City’s long‐term expenditure expectations is required.
General Expenditure Environment: General operating expenditures are projected to increase at a predictable rate, with the exception of escalating energy prices (both fuel and electricity). Realistic escalators for fuel and electricity components (7‐10% and 5%, respectively) are included in the projections, while the general expenditure projections include 2% annual increases in other contractual and commodities accounts. Personal services, including wages and benefits, are projected to increase at 3%, and do not factor in a cost‐of‐living adjustment (COLA), or additional new positions. The assumption is that new positions or a COLA will only be considered if actual revenues are sufficiently in excess of projected revenues. Operating projections also include the additional costs of operating any new facilities as they are planned according to the CIP. Capital Equipment Replacement and Capital Projects: In the current and previous biennial budget, the General Fund has been largely relieved of capital spending as these projects and equipment purchases were shifted to other funds with available capacity.
Expenditure Environment
2011 Revenue Review
Page 31

This was a key component of the strategy to deal with the recession, and was intended to be short‐term. $531,147 was budgeted in the General Fund for either capital equipment replacement or capital projects for the FY2011‐FY2012 Biennial Budget. In FY2013, General Fund expenditures on capital assets are scheduled to resume. Generally speaking, $750,000 (in 2011 dollars) in annual capital equipment replacement are required to optimize our fleet value and minimize service disruptions and maintenance costs. The CIP contains $5,163,334 in General Fund capital projects from FY2013‐FY2016. The resumption of General Fund capital expenditures is a significant component of the continued projected fund balance drawdown and will need to be considered in revenue decisions. Enterprise Activities: The City’s sewer operations have long been accounted for as a business‐type activity, and rates have been set in order to recover operating and capital costs. In FY2009, the Council approved the staff recommendation to transition the City’s solid waste and recycling activities to an enterprise fund as well. The purpose of this was to isolate the costs associated with those activities and better match the rates to the services provided. In October of 2010, a rate study was initiated to meet this objective. The recommendations from that study included a rate increase in order to reduce the General Fund subsidy of these activities over time and eventually provide for more efficient equipment replacement. The recommended rate and its impact on the General Fund are not included in the General Fund projections. Our residents have consistently opted for increasing the availability and scope of our recycling program. According to the 2011 Citizen Survey, 30% of residents choose expanding the recycling program and facilities as their highest priority. As recycling activities are still overwhelmingly subsidized by solid waste revenues, any expansion to the recycling program will require additional funding, either through general taxes and revenues (General Fund subsidy) or rate increases. Over the long‐term, it is anticipated that the costs associated with solid waste disposal will increase, even as recycling participation improves and commodity revenues increase. Improving the fiscal health of these business‐type activities and reducing their reliance on General Fund revenues by more closely aligning their rates with their operating costs are key components of the City’s long‐term financial strategy. Debt: Since FY2000, spending on debt service has increased from 4.7% of total adjusted expenditures to 11.7% in FY2010, and is currently budgeted at 14.4% in FY2011. While some of this increase results from moving solid waste expenditures into an enterprise fund, and refinancing debt from the Industrial Development Board (previously accounted for as a transfer), our debt levels are currently at their peak. While our debt levels are still very manageable, the City needs to avoid issuing further debt until capacity becomes available, with an ultimate target of debt service as 10% or less of total expenditures. Future debt issues are planned in accordance with available capacity and scheduled projects on the CIP, and include:
Expenditure Environment
Page 32
2011 Revenue Review
$2,800,000 in FY2013 to complete Phase II of Auburn Technology Park West;
$8,028,500 in FY2014 to replace Moores Mill Bridge at I‐85 and Gay Street at Town Creek;
$4,546,950 in FY2015 for various road reconstruction and intersection improvement projects.
Also planned, but beyond the timeline of the CIP, is an additional borrowing of approximately $9,000,000 to cover the estimated aggregate shortfall in annual resurfacing according to the 5‐year resurfacing plan needs and actual projected funding levels. This is anticipated to occur in FY2016‐FY2017. A more complete picture of the General Fund debt is included on page 45.
While our debt levels are elevated, they are still manageable and are scheduled to decrease as existing debt is retired at a faster rate than new debt is added. Meeting the expenditure needs arising from the planned resumption of General Fund capital spending in FY2013 will be an additional challenge.
Recruiting and maintaining a highly motivated work force, committed to excellence. It is clear from the positive trends in the Citizen Survey that our employees continue to be the foundation of Auburn City government. With the third year of targeted budget reductions underway, staff continues to improvise and adapt, making better use of scarce resources. The Council has made a commitment that employees should be compensated commensurate with their expectations and those of the citizenry, should have opportunities through training and development for personal and professional growth, and should have excellent benefits. The City’s reputation as a quality employer is reflected in the statistics on longevity. Over 30% of the City’s regular workforce has been with the City for ten years or longer. The classification and compensation study was performed in FY2009 to ensure the City was not only well‐positioned to attract and retain a quality workforce at the time, but also to make sure that we would emerge from the economic downturn with our excellent staff intact. As the economy begins to recover, it is important to keep in mind that private sector opportunities will continue to improve, thereby creating a potential threat to our workforce. While the City has been forced to remove a cost‐of‐living adjustment (COLA) from the proposed budgets for FY2010‐FY2012, it will become increasingly important to begin reconsidering this position as the economy and revenues rebound. While full funding of the merit plan is included in the assumptions for the expenditure projections, a COLA is not. Also not included is the addition of any new positions. As we continue to expect our employees to do more with less, we will to need consider at what point that will compromise delivery of services to citizens and the corresponding decrease in satisfaction levels. Facilitating citizen involvement. The City continues to offer numerous avenues for residents to get involved in the direction of their government. Whether through service on
Expenditure Environment
2011 Revenue Review
Page 33

one of the City’s advisory boards or commissions, or through their participation in municipal elections or referendums, the priorities of our residents determine how and where their resources are directed. The municipal elections in 2010 reflected a desire to maintain the significant progress made over the last decade in economic development, community beautification, and the provision of basic services and the quality of our schools. More recently, the 2011 Citizen Survey gauged the priorities and demands of our residents, and most are reflected in tangible ways through our spending priorities. According to survey results, residents felt that the areas that should receive the most emphasis over the next two years were: 1) flow of traffic and congestion management, 2) the maintenance of City streets and facilities, and 3) the quality of the City school system. In responding to strong growth, residents also felt that City officials should concentrate our efforts on, according to the percentage of residents who rated the item as the highest priority, the City’s school system (56%), traffic management (27%) and police protection (23%). This review presents a recommendation for funding school growth, while the expenditure projections continue to place an emphasis on transportation infrastructure and quality police and public safety services. The 2011 Special Five Mill referendum will again include a majority of road improvement projects, as well as projects which will facilitate the expansion of the Police Division.
General Fund Expenditure Assumptions The expenditure projections were built on assumptions of cost increases over time. Where possible, historical cost indexes were used to help estimate how costs would escalate. Projects on the CIP also impacted how and when certain expenditures, such as additional operating expenditures or debt service, would occur. The following assumptions were made in developing the expenditure projections:
1. FY2011 Approved Budget has been adjusted to reflect planned adjustments, including FY2010 carryover expenditures, principal refinancing, and other budgetary events.
2. FY2012 Approved Budget will remain as adopted, with the exception of adjustments planned to account for debt service and transfer budgets associated with the refinancing of debt owed by the Industrial Development Board.
3. Departmental Expenditures:
a. Personal Services expenditures will grow by 3% annually. This amount does not include a cost‐of‐living adjustment (COLA), nor the addition of any new positions. It is assumed that any COLA or new positions will only occur if revenues exceed the projected amount and will have little to no impact on ending fund balance.
b. Contractual Services will increase by 2% annually, with the exception of electricity line item accounts, which will increase by 5% annually.
c. Commodities will increase by 2% annually, with the exception of fuel line item accounts, which will increase by 10% over FY10 actual amounts, then 7% thereafter.
d. Additional operating expenditures to provide for new facilities, per the CIP, to include the Senior Center, Frank Brown Expansion, and the Alabama Street facility.
Expenditure Environment
Page 34
2011 Revenue Review
4. Debt service for debt issued to construct projects according to the CIP is amortized as follows:
a. Auburn Technology Park West, $2,800,000 over 10‐years at an assumed rate of interest of 5% with semi‐annual payments.
b. Moores Mill Bridge at I‐85 and Gay Street at Town Creek Bridges, $8,028,500 over 15‐years at an assumed rate of interest of 5% with semi‐annual payments.
c. Road/Intersection Projects, $4,546,950 over 10‐years at an assumed rate of interest of 5% with semi‐annual payments.
5. Projects listed on the CIP as funded contingent upon sufficient revenues are not included in General Fund expenditures. It is assumed that they will only by funded if revenues exceed projections and will have little to no impact on ending fund balance.
6. General Operations non‐departmental spending will increase at rates similar to departmental, except for West Pace tax sharing payments, which will increase by 10% annually as buildout occurs.
7. Operational transfers to the IDB increase by 0.5% per year. Transfers to the other funds increase by 3% annually.
8. Transfers to the Board of Education increase by the same percentage as overall General Fund revenues.
9. Support for Outside Agencies increase 2% for each biennium, with the exception of the Convention and Visitors Bureau, whose appropriation increases at the same rate as the Lodging Tax projection.
Expenditure Environment
2011 Revenue Review
Page 35

Expenditure Environment
Page 36
2011 Revenue Review

City of Auburn
General Fund (Fund 100 only) ‐ Expenditure History and Projections
Fiscal Years 2006‐2016
Category
FY 2006
FY 2007
FY 2008
FY 2009
FY 2010
FY 2011
FY 2012
FY 2013
FY 2014
FY 2015
FY 2016
FY 2006
FY 2011
FY 2016
Departm
ental
Personal
23,015,907
23,929,007
26,006,304
25,532,874
26,477,101
27,829,418
27,631,428
28,460,371
29,314,182
30,193,607
31,099,416
45.4%
49.4%
51.0%
Contractual
4,059,663
3,978,653
4,098,960
4,334,871
4,513,744
5,036,054
4,859,994
5,134,898
5,306,843
5,436,224
5,569,319
8.0%
8.9%
9.1%
Commodities
3,057,112
3,248,932
3,984,964
2,594,733
2,705,371
3,013,933
2,814,745
2,987,944
3,101,974
3,195,868
3,293,870
6.0%
5.4%
5.4%
Capital Outlay^
2,306,566
2,230,910
1,163,444
394,674
635,852
1,439,890
‐
750,000
772,500
795,675
819,545
4.5%
2.6%
1.3%
Projects
178,413
45,280
102,571
34,258
19,981
115,000
15,000
15,300
100,606
15,918
16,237
0.4%
0.2%
0.0%
Agency Support
91,772
89,737
86,545
230,375
218,016
276,643
276,643
282,176
282,176
287,819
287,819
0.2%
0.5%
0.5%
Total D
epartm
ental
32,709,433
33,522,518
35,442,789
33,121,785
34,570,064
37,710,938
35,597,810
37,630,689
38,878,282
39,925,113
41,086,206
64.5%
67.0%
67.4%
Non‐departm
ental
Gen
eral Operations
941,664
1,062,183
2,924,670
1,322,014
3,263,945
1,612,812
1,581,294
1,561,714
1,609,153
1,677,228
1,726,626
1.9%
2.9%
2.8%
Gen
.Ops. ‐ Personal Services
62,364
51,649
44,552
48,516
106,208
125,829
124,802
102,655
83,804
74,988
76,207
0.1%
0.2%
0.1%
PW Project Operations
954,217
1,367,083
1,743,960
2,730,771
1,792,632
5,000
‐
565,000
658,334
2,050,000
1,890,000
1.9%
0.0%
3.1%
Outside Agencies
1,647,115
1,371,446
1,410,281
1,207,208
812,921
894,125
848,410
909,500
863,587
928,259
882,512
3.2%
1.6%
1.4%
Deb
t Service*
5,378,585
6,142,549
7,535,057
6,419,251
6,425,398
7,853,013
7,641,248
7,528,877
7,498,869
6,853,254
5,993,776
10.6%
14.0%
9.8%
Total N
on‐Departm
ental
8,983,945
9,994,910
13,658,521
11,727,761
12,401,105
10,490,779
10,195,754
10,667,745
10,713,747
11,583,729
10,569,120
17.7%
18.6%
17.3%
Total Expenditures
41,693,378
43,517,428
49,101,310
44,849,546
46,971,169
48,201,717
45,793,564
48,298,435
49,592,028
51,508,842
51,655,326
82.2%
85.6%
84.8%
Other Finan
cing Uses (OFU
)
Transfers**
2,222,309
2,372,396
2,326,308
2,856,780
2,516,625
1,033,746
1,208,401
1,390,801
1,409,505
1,428,711
1,448,434
4.4%
1.8%
2.4%
Auburn City Schools
6,795,523
6,795,523
6,795,523
6,988,003
7,050,759
7,050,760
7,050,760
7,230,576
7,428,969
7,626,192
7,822,416
13.4%
12.5%
12.8%
Total O
FU9,017,832
9,167,919
9,121,831
9,844,783
9,567,384
8,084,506
8,259,161
8,621,377
8,838,474
9,054,903
9,270,849
17.8%
14.4%
15.2%
Total Expenditures an
d OFU
50,711,210
52,685,347
58,223,140
54,694,328
56,538,553
56,286,223
54,052,725
56,919,811
58,430,502
60,563,745
60,926,175
100.0%
100.0%
100.0%
^ Capital O
utlay expenditures include capital lease paym
ents from FY2005‐FY2006
* Debt service adjusted
to exclude principal refinancings
** Transfers adjusted
to elim
inate the effect of in/out transfers made to the Industrial D
evelopment Board for debt restructuring and borrowing proceeds.
% of total expen
ditures
Mid‐Bien. P
rojected
Projected
Actual (Audited)
Expenditure Environment
2011 Revenue Review
Page 37

Expenditure Environment
Page 38
2011 Revenue Review

Breakdown by Funding Source FY11 FY12 FY13 FY14 FY15 FY16 Total
1,836,000 620,000 1,402,400 700,000 700,000 700,000 5,958,400
55,000 ‐ ‐ ‐ ‐ ‐ 55,000
3,925,873 ‐ ‐ ‐ ‐ ‐ 3,925,873
866,145 120,000 153,000 ‐ ‐ ‐ 1,139,145
628,786 ‐ ‐ ‐ ‐ ‐ 628,786
‐ 5,074,400 1,315,000 456,000 1,213,000 868,175 8,926,575
40,880 111,000 111,000 194,333 111,000 111,000 679,213
40,880 111,000 111,000 194,333 111,000 111,000 679,213
462,662 ‐ 592,000 658,334 2,050,000 1,890,000 5,652,996
4,181,200 2,848,254 3,874,030 1,410,000 997,000 4,091,995 17,402,479
‐ ‐ 2,800,000 8,028,500 3,102,323 1,444,650 15,375,473
‐ 776,000 1,312,550 856,000 426,000 671,600 4,042,150
‐ 1,000,000 ‐ ‐ ‐ ‐ 1,000,000
1,346,836 ‐ ‐ ‐ ‐ ‐ 1,346,836
125,000 ‐ ‐ ‐ ‐ ‐ 125,000
Total Projects 13,509,262 10,660,654 11,670,980 12,497,500 8,710,323 9,888,420 66,937,139
Funding Source Key ALDOT/MPO Grant Funding Secured
General Fund Conditional Future 5 Mill
Projects FY11 FY12 FY13 FY14 FY15 FY16 Total
350,000 350,000
50,000 50,000
25,000 25,000
40,000 40,000
90,000 90,000
75,000 950,000 1,025,000
50,000 50,000
Drafting Pit at Drill Field (Training Aid) 18,550 18,550
Back up Generator (Fire Station 1) 40,000 40,000
500,000 500,000
500,000 500,000
385,000 385,000
180,000 180,000
425,000 425,000
195,000 195,000
750,000 750,000
90,000 90,000
425,000 425,000
165,000 165,000
35,000 400,000 435,000
465,000 215,000 2,608,550 1,020,000 840,000 590,000 5,738,550
3,250,000 3,250,000
50,000 50,000
140,000 140,000
497,000 497,000
350,000 4,000,000 4,350,000
3,250,000 50,000 140,000 ‐ 847,000 4,000,000 8,287,000
Grant Funding Sought
Water Works Board
Sewer Fund
General Fund
Future 5 Mill
General Obligation Debt Issue ‐ General Fund
Console Expansion
Back up Generators
Custom Pumper for Station 1
Haz Mat/ Rescue Vehicle
Fire Station Number 6
Antenna/Cable Relocation
DJW Facility Renovation/HVAC/Energy Efficiency Retrofit
Energy Efficiency & Conservation Block Grant Portion
Custom Fire Pumper North
Public Safety Training Center Drill Towers
Custom Pumper for Station 4
Expansion of Current Burn Building
Replacement of Ladder 2
Frank Brown Expansion/Senior Center/Park
Yarbrough Tennis Center Court Resurfacing
Samford Pool Renovations
Duck Samford Baseball Renovations
Lake Wilmore Community Center
Working Capital Improvement PlanFiscal Years 2011‐2016
Sewer Fund Grant Funding Sought General Obligation Debt Other Capital Projects Funds Water Works Board W. Tech Cap. Projects Fund
2009 5 Mill General Fund Funded by Developer
Funded by Auburn University
Public SafetyCustom Pumper for Station 3
Remodel Fire Station 1
Frequency Expansion
Public Safety Security Camera System
Alabama Department of Transportation/AOMPO
Other Capital Projects Funds
2009 5 Mill
Developer Contribution (Development Agreements)
Grant Funding Secured
General Fund, contingent upon sufficient revenues (conditional)
Solid Waste Management Fund
Funded by Lee County
Classroom Building
Leisure Facilities
The City of Auburn maintains a Capital Improvement Plan (CIP) which covers a six‐year, or 3 biennia, period. This plan details both the timing and funding sources of variouscapital infrastructure needs of the City, as determined by the City's management team and professional engineering staff, and is reflective of the priorities of City Council and residents. Through annual updating and continual monitoring of infrastructure conditions, funding status and a changing urban environment, the CIP is a flexible tool for developing an attractive built‐environment, while realizing the constraints imposed by limited resources.
The table below offers a summary of funding capacity from a number of sources, and is organized by year. Projects are grouped into category by type and the funding source available is identified by the color‐coding in the table below. Only projects with an identified funding source appear in the first biennium, with the exception of those projects of low to medium priority which are funded conditionally based on sufficient revenues to the General Fund. The last four years represent a reasonable assumption of available funding, both from internal and external sources. The current recession has limited available funding from the General Fund in the current biennium as well as resulted in a more conservative outlook in future years as the availability of other revenue sources may become less certain.
The Working Capital Improvement Plan version includes updates for the current biennium, showing actual project costs and changes made to the adopted CIP based on changing infrastructure needs and funding availability. The Working CIP contains no conditionally funded projects in the current fiscal year.
Expenditure Environment
2011 Revenue Review
Page 39

Funding Source Key ALDOT/MPO Grant Funding Secured
General Fund Conditional Future 5 Mill
Projects FY11 FY12 FY13 FY14 FY15 FY16 Total
Sewer Fund Grant Funding Sought General Obligation Debt Other Capital Projects Funds Water Works Board W. Tech Cap. Projects Fund
2009 5 Mill General Fund Funded by Developer
2,782,604 2,782,604
1,346,836 1,346,836
50,000 ‐ 50,000
7,536,500 7,536,500
880,000 880,000
220,000 220,000
492,000 492,000
5,279,440 ‐ ‐ 8,028,500 ‐ ‐ 13,307,940
80,000 80,000
27,000 27,000
151,849 151,849
38,100 38,100
91,900 91,900
101,700 101,700
‐
125,000 125,000
125,000 125,000
98,254 98,254
375,000 375,000
233,000 233,000
181,000 181,000
65,230 65,230
26,000 26,000
40,250 40,250
255,000 255,000
124,000 124,000
77,000 77,000
69,750 69,750
475,000 475,000
91,995 91,995
314,000 314,000
76,600 76,600
868,175 868,175
660,549 178,254 880,230 566,000 475,000 1,350,770 4,110,803
511,000 595,000 1,300,000 1,300,000 1,300,000 1,300,000 6,306,000
700,000 700,000 700,000 700,000 2,800,000
148,000 148,000
592,000 592,000
91,000 91,000
364,000 364,000
98,000 98,000
392,000 392,000
57,000 57,000
228,000 228,000
41,200 41,200
164,800 164,800
326,145 ‐
47,500 88,200 88,200
352,800
46,200
184,800
1,120,100 1,120,100
510,400 510,400
400,000 400,000
299,700 299,700
2,079,645 1,370,000 2,878,000 2,000,000 3,520,100 2,810,100 14,657,845
Auburn‐Opelika MPO portion
Farmville Road Resurfacing
Auburn‐Opelika MPO portion
N. Donahue Drive Resurfacing: Shug Jordan to School
Auburn‐Opelika MPO portion
Bragg Ave Widening: N. Donahue to N College/Mitcham Ave
Cox Rd Improvements: Wire Rd to Veterans Blvd
Dean Rd Improvements: Thach Ave to Terrace Acres
N Donahue Dr Widening: Cary Dr to Bedell Ave
Moores Mill Rd Resurfacing: Dean Rd to Samford Ave
Auburn‐Opelika MPO portion
Mrs. James Road Resurfacing: Farmville west to City Limits
Auburn‐Opelika MPO portion
Shelton Mill Road Resurfacing
Auburn‐Opelika MPO portion
Subdivision Completion Project ‐ Subdivision Bond‐funded
Hamilton Rd Improvements
Auburn‐Opelika MPO portion
N Donahue Dr M‐U Path: Farmville Rd to Yarbrough School
Byrd St Sidewalk: MLK Blvd to Magnolia Ave
Annalue Drive Sidewalk: Dean to University
Magnolia Ave Sidewalk: Byrd St to Beech St
Saugahatchee Greenway
Road ReconstructionStreet Resurfacing and Restriping
Auburn‐Opelika MPO portion
Glenn Ave Resurfacing/Widening: N College St to N Donahue Dr
EUD, Oak, Sanders & Zellars Sidewalks ‐ SRTS Grant
S. College Street Sidewalk ‐ City portion
ARRA Transportation Enhancement Grant
Downtown Pedestrian Improvements Project (EECBG)
Campus & Downtown Pedestrian Safety Project
Magnolia Avenue Segment ‐ City Portion
Drake Ave Sidewalk: Perry St to N. College St
Tucker Ave Sidewalk: Zellars Ave to Foster St
E University Dr Sidewalk: Glenn Ave to Samford Ave
Magnolia Avenue Segment ‐ University Portion
Hamilton Rd M‐U Path: Moores Mill Rd to Barkley Crest Dr
Wire Rd Bikeway: Cox Rd to Webster Rd
W. Glenn Ave Sidewalk: Hemlock Dr to N. Donahue Dr
Harper Ave Sidewalk: Ross St to Dean Rd
Camellia Dr Sidewalk: Wrights Mill Rd to Gay St
Lunsford Dr Sidewalk: 849 Lunsford to Bedell Ave
Janet Dr Sidewalk: Hollon Ave to Heard Ave
N College St Sidewalk: Drake Ave to Shelton Mill Rd
Lee County portion
Bent Creek Rd at Moores Mill Creek Bridge Maintenance
Moores Mill Road Bridge Replacement
ROW Acquisition ‐ AOMPO‐funded portion
ROW Acquisition ‐ City portion
Gay St at Town Creek Bridge Replacement
Pedestrian & Bicycle FacilitiesByrd St Sidewalk: MLK Blvd to Zellars Ave
Moores Mill Rd Multi‐Use Path: CVS to Bent Brooke
BridgesNorth Donahue Bridge Replacement & Roadway Widening
Expenditure Environment
Page 40
2011 Revenue Review

Funding Source Key ALDOT/MPO Grant Funding Secured
General Fund Conditional Future 5 Mill
Projects FY11 FY12 FY13 FY14 FY15 FY16 Total
Sewer Fund Grant Funding Sought General Obligation Debt Other Capital Projects Funds Water Works Board W. Tech Cap. Projects Fund
2009 5 Mill General Fund Funded by Developer
95,000 824,500 919,500
40,000 40,000
456,000 456,000
861,223 861,223
361,000 361,000
143,550 143,550
135,000 ‐ 824,500 ‐ 1,317,223 504,550 2,781,273
500,000 500,000
55,000 55,000
4,994,400 4,994,400
738,000 738,000
555,000 4,994,400 ‐ ‐ 738,000 ‐ 6,287,400
46,782 46,782
100,000 100,000
110,269 110,269
100,000 150,000 150,000
250,000 2,000,000 2,250,000
1,000,000 1,000,000
400,000 400,000
2,800,000 2,800,000
‐ 150,000 150,000
407,051 3,100,000 3,300,000 150,000 150,000 ‐ 7,107,051
154,200 154,200
44,910 44,910
16,400 16,400
145,000 145,000
88,000 88,000
58,700 58,700
50,000 50,000 50,000 50,000 200,000
55,000 55,000
120,000 120,000
215,510 ‐ 396,700 50,000 50,000 170,000 882,210
100,000 100,000
26,000 26,000
75,000
120,000 120,000
150,000 150,000
27,000 27,000
153,000 153,000
130,000 130,000
100,000 100,000
165,000 165,000
100,000 100,000
130,000 130,000
* Pending ALDOT approval 101,000 370,000 310,000 100,000 265,000 130,000 1,276,000
40,880 83,334 124,214
40,880 83,333 124,213
40,880 83,333 124,213
238,427 238,427
111,000 111,000 111,000 111,000 111,000 555,000
111,000 111,000 111,000 111,000 111,000 555,000
111,000 111,000 111,000 111,000 111,000 555,000
50,000 50,000
125,000 125,000
50,000 50,000
361,067 383,000 333,000 583,000 508,000 333,000 2,501,067 13,509,262 10,660,654 11,670,980 12,497,500 8,710,323 9,888,420 66,937,139
GPS Utility Inventory Project ‐ General Fund Portion
Sewer Fund Portion
Water Works Board Portion
S College St/Beehive Rd Traffic Signal Installation*
Cox Rd/Wire Rd Traffic Signal Installation
N Donahue Dr/Farmville Rd Traffic Signal Installation*
OtherAerial Photography ‐ GIS
Sewer Fund Portion
Water Works Board Portion
LED Streetlight Retrofit Project (EECBG)
Darden Avenue Drainage Improvements
Green St at E University Dr Drainage Improvement
Opelika Rd at Guthrie's Drainage Improvements
Payne St Drainage Improvements
Mitcham Ave/Gay St Drainage Improvements
CIPP ‐ Cured‐In‐Place‐Pipe Drainage Improvements
Mim's Trail/West Pace Dev. Agreement Portion
N College St/Farmville Rd Traffic Signal Installation*
Hwy 14/Willow Creek Traffic Signal Installation*
Parking Meter Replacement
Public Works/Environmental Services Building
SWMF portion (pending revised cost estimate and avail. funding
Surface Parking Expansion and Landscaping
Auburn Technology Park West ‐ Phase II
Parking Deck Design
Drainage & Watershed ImprovementsWright St Drainage Improvements
Wetland Bank Study
Comprehensive Drainage Study
Traffic Signals/SignageW Samford Ave/Shug Jordan Pkwy Traffic Signal Installation*
EdgeLit Street Signs ‐ 8 Downtown Intersections
Dean/Annalue Traffic Signal
S College St/Timberwood Traffic Signal Installation*
Wayfinding Signage Project
S College St/Shell Toomer Pkwy Traffic Signal Installation*
Intersection ImprovementsS College St/Longleaf Dr Intersection Improvements
Fairfield Development Agreement
E University Dr/Opelika Rd Intersection Improvements
S College St/Shug Jordan Pkwy Intersection Improvements
Hwy 14/Webster Rd Intersection Improvements
Hwy 14/Shug Jordan Pkwy Intersection Improvements
Future Roads
Alabama St Retaining Wall
Comprehensive Traffic Study
Update ADT (Average Daily Traffic)
Total ‐ Projects
Longleaf Extension to Cox Road ‐ Developer Portion
City portion (sewer, sidewalk and additional width; Fund 424)
Veterans Extension: Cox Rd to Tech Park West
Outerloop Corridor Study ‐ Grant Funding
City Buildings/FacilitiesCity Hall Sealant and Wall Restoration Program
City Hall Roof Recoating
Downtown Parking Enhancements/Parking Deck Maintenance
Expenditure Environment
2011 Revenue Review
Page 41

Expenditure Environment
Page 42
2011 Revenue Review

Recreational Facilities Road Reconstruction
Town Creek Park Phase II Samford Ave Widening
Lake Wilmore Pool and Splash Pad Sandhill Road: Mill Creek to South College
Lake Wilmore Trails East Glenn Avenue Median
Jan Dempsey Community Arts Center Expansion Gay Street Widening: Ross to Dekalb
Kiesel Park Improvements Shug Jordan Pkwy: N. College to S. College
Performing Arts Center Donahue Drive: Bragg to Bedell
Pedestrian & Bicycle Facilities Intersection Improvements
Hamilton Road Bike Lanes: Bent Creek to Moores Mill North Ross/Magnolia Avenue
Shelton Road Multi‐use Path Hamilton Road/Bent Creek Road
Hwy 14 Bikeway: Webster Road to Shug Jordan Byrd Street/Hwy 14
East University Drive Multi‐use Path North College/Drake
North Donahue Dr Bikeway Glenn Avenue/Dean
Cox Road Bikeway: Wire Road to Longleaf Shug Jordan Pkwy/Ware Drive
Glenn Ave Bikeway: EUD to Bent Creek Rd S College St/Samford Ave
Webster Rd Bikeway S College St/Southparke
Parkerson Mill Creek Greenway N College St/Shelton Mill Rd
Rock Fence Rd Multi‐use Path: Fairway to Ogletree
Binford Dr Bikeway Bridge Improvements
Harper Ave Bike Lanes Bent Creek Rd at Moores Mill Creek
Chadwick Lane Bikeway
Magnolia Ave Sidewalk: Byrd St. to Donahue Dr. Future Roads
Perry St .Sidewalk: Drake Ave. to Opelika Road Southview Dr Extension
Foster St. Sidewalk: Pleasant Ave. to Bedell Ave. Outerloop Rd: Cox Rd to Wire Rd
N. Ross St Sidewalk: Opelika Rd. to Mary Ln. N. Dean Rd. Extension: EUD to Academy Dr.
Opelika Road Sidewalk: Dean Rd. to Old Stage Rd. Academy Drive Ext: Lee Scott to Shelton Mill
Opelika Road Sidewalk: EUD to Commerce
Moores Mill Rd. Multi‐use Path: Bent Brooke to E. Lake Other
Annalue Sidewalk Intelligent Transportation System Project
Gay Street Streetscape Project
Traffic Signal South College Street Lighting: I‐85 to Samford
Dean Road/Stage Road City Records Retention Facility
Blue Sign Replacement Project
Capital Improvement Plan ‐ Future ProjectsBeyond Fiscal Year 2016
Projects appearing on the Capital Improvement Plan ‐ Future Projects include projects for which no significant
design or detailed cost estimation has been performed. Typically, these projects have been identified through one
or more long‐range studies or conceptual plans and are part of the City's long‐term plans. As projects on the current
CIP are completed, these projects are evaluated for further consideration and funding.
Expenditure Environment
2011 Revenue Review
Page 43

Expenditure Environment
Page 44
2011 Revenue Review

Outstanding Principal (at beginning FY) 52,044,532 47,196,458 41,281,295 35,330,214 29,417,183 23,830,741 19,316,871 15,772,381 12,064,344 8,734,793 6,936,693 5,425,570 4,172,409 2,861,423 1,678,739 523,269 267,110 ‐ ‐
General Fund Debt Service (paid out FY26) FY10 FY11 FY12 FY13 FY14 FY15 FY16 FY17 FY18 FY19 FY20 FY21 FY22 FY23 FY24 FY25 FY26 FY27 FY28
57175‐5820 New City Hall Furn/Equip 121,036 127,039 10,866
57175‐9320 GO Wr 99/City Hall & Proj 4.1M 200,000 210,000 220,000 230,000 245,000 260,000 275,000 290,000 305,000 320,000
57175‐9540 GO Warrant 05 ‐ $6.0M ‐ ATPW 657,477 681,938 707,308 733,622 760,915 194,612
57175‐9541 GO Warrants 06 ‐ AU Research 543,198 565,780 589,300 613,798 639,315 274,163
57175‐9630 GO Warrant 03 6.3 Mill ‐ 421 657,890 684,588 712,212 741,272 189,960
57175‐9648 Samford Avenue Extension 2M 267,637 278,818 290,467 302,603 315,245 314,211
57175‐9649 GO Warr 06 ‐ Tenn Ctr ‐ AU Portion* 136,717 142,562 148,656 155,011 161,637 168,546 175,751 183,264 191,098 199,267 207,785 216,668 225,930 235,587 245,658 256,159 267,110
57175‐9651 GO Warr 08 Refin Mall Perm Financing 738,726 773,587 810,094 848,323 888,356 930,278 974,179 1,020,151 796,584
57175‐9652 GO Warr 08 CDA LOC Perm Financing 750,924 786,361 823,470 862,331 903,025 945,640 990,265 1,036,997 809,738
57175‐9653 GO Warr 08 4,211,050 (Various) 718,755 744,508 680,092 426,322 441,598 341,551
57175‐9654 GO Warr 2010‐B Refunding IDB $3.01M 20,690 264,025 271,785 279,772 287,994 296,458 305,170 314,139 323,371 332,874 313,722
57175‐9655 GO Warr 2010‐C Refunding IDB $10.275M 35,023 526,342 551,453 580,438 609,571 640,166 671,324 705,991 741,425 778,638 817,154 858,733 901,833 947,097 909,811
57175‐9656 GO Warr 2010‐D Alabama St Building $1.87M ‐ 129,614 135,380 139,539 143,826 148,245 152,800 157,495 162,334 167,321 172,462 177,761 183,222
Total Principal 4,848,074 5,915,163 5,951,082 5,913,031 5,586,442 4,513,870 3,544,490 3,708,037 3,329,550 1,798,101 1,511,123 1,253,161 1,310,985 1,182,685 1,155,470 256,159 267,110
Interest ‐ 57176‐5820 New City Hall Furn/Equip 9,891 3,889 44
57176‐9320 GO Wr 99/City Hall & Proj 139,515 129,315 118,395 106,736 94,430 81,200 66,640 51,240 35,000 17,920
57176‐9540 GO Warrant 05 ‐ $6.0M 125,720 101,260 75,890 49,575 22,282 1,188
57176‐9541 GO Warrants 06 ‐ AU Research 121,519 98,938 75,417 50,919 25,403 2,803
57176‐9630 GO Warrant 03 6.3 Mill 107,045 80,346 52,722 23,662 1,273
57176‐9648 Samford Avenue Extension 2M 67,536 56,354 44,704 32,570 19,928 6,759
57176‐9649 GO Warr 06 ‐ Tenn Ctr ‐ AU Portion* 138,896 133,051 126,957 120,603 113,976 107,067 99,862 92,349 84,515 76,346 67,828 58,946 49,684 40,026 29,955 19,454 8,504
57176‐9651 GO Warr 08 Refin Mall Perm Financing 343,937 309,075 272,569 234,340 194,307 152,384 108,484 62,511 15,413
57176‐9652 GO Warr 08 CDA LOC Perm Financing 349,616 314,179 277,070 238,210 197,515 154,901 110,275 63,544 15,667
57176‐9653 GO Warr 08 4,211,050 (Various) 106,665 80,911 54,502 35,795 20,520 5,037
57176‐9654 GO Warr 2010‐B Refunding IDB 8,245 83,199 75,440 67,452 59,230 50,766 42,054 33,085 23,853 14,350 4,567
57176‐9655 GO Warr 2010‐C Refunding IDB 49,731 490,702 465,592 436,607 407,474 376,879 345,721 311,054 275,619 238,406 199,891 158,312 115,211 69,947 22,480
57176‐9656 GO Warr 2010‐D Alabama St Building ‐ 56,629 50,864 46,704 42,417 37,998 33,443 28,749 23,910 18,922 13,781 8,483 3,021
Total Interest 1,568,315 1,937,850 1,690,165 1,443,173 1,198,755 976,982 806,479 642,532 473,978 365,945 286,067 225,740 167,916 109,973 52,434 19,454 8,504
Total Non‐Departmental Debt Service 6,425,398 7,853,013 7,641,247 7,356,204 6,785,197 5,490,852 4,350,969 4,350,569 3,803,528 2,164,045 1,797,190 1,478,901 1,478,901 1,292,658 1,207,904 275,613 275,613
$ change over prior year 6,147 1,427,615 (211,766) (285,043) (571,007) (1,294,346) (1,139,883) (400) (547,041) (1,639,482) (366,855) (318,289) ‐ (186,243) (84,754) (932,291) ‐
Debt Service as % of total adjusted expenditures 11.7% 14.4% 14.3%
IDB 1,104,666 85,000 91,000 166,500 166,500 166,500 166,500 166,500 166,500 300,000 300,000 300,000 300,000 300,000 ‐ ‐ ‐ ‐
Lee County Jail ‐ Debt service from PS‐Admin (paid out FY25) 379,230 378,630 377,480 375,970 378,875 376,113 378,063 379,303 376,803 378,803 375,053 375,803 375,803 375,053 376,028 376,020 ‐ ‐
RGP Airport ‐ Terminal Expansion Debt Svc. (paid out FY28) 100,000 100,000 100,000 100,000 100,000 100,000 100,000 100,000 100,000 100,000 100,000 100,000 100,000 100,000 100,000 100,000 100,000 100,000 100,000
Total ‐ Other General Fund debt service 1,583,896 563,630 568,480 642,470 645,375 642,613 644,563 645,803 643,303 778,803 775,053 775,803 775,803 775,053 476,028 476,020 100,000 100,000 100,000
Grand Total ‐ All General Fund debt service 8,009,294 8,416,643 8,209,727 7,998,674 7,430,572 6,133,464 4,995,531 4,996,371 4,446,830 2,942,848 2,572,242 2,254,704 2,254,704 2,067,710 1,683,932 751,633 375,613 100,000 100,000
Grand Total ‐ All General Fund debt service (adjusted) 8,009,294 8,416,643 8,209,727 7,998,674 7,430,572 6,133,464 4,995,531 4,996,371 4,446,830 2,942,848 2,572,242 2,254,704 2,254,704 2,067,710 1,683,932 751,633 375,613 100,000 100,000
Debt Svc (inc. other debt) as % of total adjusted expenditures 14.6% 15.4% 15.3%
Existing Debt Service Breakdown (includes GF & Other GF) FY10 FY11 FY12 FY13 FY14 FY15 FY16 FY17 FY18 FY19 FY20 FY21 FY22 FY23 FY24 FY25 FY26 FY27 FY28
General Government OCM, IT, FIN, HR, JUD, Planning 177,283 168,253 48,133 37,041 37,337 37,532 37,580 37,536 37,400 37,171 ‐ ‐ ‐ ‐ ‐ ‐ ‐ ‐ ‐
as a % of total debt service 2.2% 2.0% 0.6% 0.5% 0.5% 0.6% 0.8% 0.8% 0.8% 1.3% 0.0% 0.0% 0.0% 0.0% 0.0% 0.0% 0.0% 0.0% 0.0%
Economic Development 5,026,802 5,257,716 5,263,823 5,339,260 5,339,260 4,407,423 3,813,972 3,813,972 3,268,171 1,764,269 1,735,334 1,417,045 1,417,045 1,417,045 1,032,291 100,000 100,000 100,000 100,000
as a % of total debt service 62.8% 62.5% 64.1% 66.8% 71.9% 71.9% 76.3% 76.3% 73.5% 60.0% 67.5% 62.8% 62.8% 68.5% 61.3% 13.3% 26.6% 100.0% 100.0%
Public Safety 423,720 423,120 410,831 375,970 378,875 376,113 378,063 379,303 376,803 378,803 375,053 375,803 375,803 375,053 376,028 376,020 ‐ ‐ ‐
as a % of total debt service 5.3% 5.0% 5.0% 4.7% 5.1% 6.1% 7.6% 7.6% 8.5% 12.9% 14.6% 16.7% 16.7% 18.1% 22.3% 50.0% 0.0% 0.0% 0.0%
Public Works 1,654,969 1,841,042 1,789,543 1,636,048 1,305,591 1,023,136 476,637 476,297 475,243 473,475 186,243 186,243 186,243 ‐ ‐ ‐ ‐ ‐ ‐
as a % of total debt service 20.7% 21.9% 21.8% 20.5% 17.6% 16.7% 9.5% 9.5% 10.7% 16.1% 7.2% 8.3% 8.3% 0.0% 0.0% 0.0% 0.0% 0.0% 0.0%
Parks, Leisure and Cultural P&R, Library, GW/BW 726,520 726,512 697,397 610,355 369,508 289,261 289,279 289,263 289,213 289,130 275,613 275,613 275,613 275,613 275,613 275,613 275,613 ‐ ‐
as a % of total debt service 9.1% 8.6% 8.5% 7.6% 5.0% 4.7% 5.8% 5.8% 6.5% 9.8% 10.7% 12.2% 12.2% 13.3% 16.4% 36.7% 73.4% 0.0% 0.0%
Total 8,009,294 8,416,643 8,209,727 7,998,674 7,430,572 6,133,464 4,995,531 4,996,371 4,446,830 2,942,848 2,572,242 2,254,704 2,254,704 2,067,710 1,683,932 751,633 375,613 100,000 100,000
Proposed Future Debt
Auburn Technology Park West ($2.8M @ 5%, 10yrs, semi‐annual) 172,673 345,346 345,346 345,346 345,346 345,346 345,346 345,346 345,346 345,346 172,673
Bridge Replacements ($8,028,500 @ 5%, 15yrs, semi‐annual) 368,326 736,651 736,651 736,651 736,651 736,651 736,651 736,651 736,651 736,651 736,651 736,651 736,651 736,651 736,651
Road Recon. & Int. Impr. ($4,546,950 @ 5%, 10yrs, semi‐annual) 280,405 560,810 560,810 560,810 560,810 560,810 560,810 560,810 560,810 560,810 280,405
Proposed Future Debt Service 172,673 713,672 1,362,402 1,642,807 1,642,807 1,642,807 1,642,807 1,642,807 1,642,807 1,642,807 1,470,134 1,297,461 1,017,056 736,651 736,651 736,651
Grand Total Existing + Future 7,528,877 7,498,869 6,853,254 5,993,776 5,993,376 5,446,335 3,806,852 3,439,997 3,121,708 3,121,708 2,762,792 2,505,365 1,292,669 1,012,264 736,651 736,651
As a % of Projected Expenditures 13.2% 12.8% 11.3% 9.8%
Grant Total Existing + Future + Other 8,171,347 8,144,244 7,495,866 6,638,338 6,639,178 6,089,637 4,585,655 4,215,049 3,897,511 3,897,511 3,537,844 2,981,393 1,768,689 1,112,264 836,651 836,651
As a % of Projected Expenditures 14.4% 13.9% 12.4% 10.9%
General Fund Debt Service Amortization and Categorical Breakdown FY2010‐Payout
Other General Fund‐paid Debt Service (includes payments to other entities for debt incurred on cooperative initiatives)
Expenditure Environment
2011 Revenue Review
Page 45

Expenditure Environment
Page 46
2011 Revenue Review

Sales an
Key Issue Currentobjectivon the discusse
Analysis Legal Amuniciptangiblepersonastorageuse tax ordinan Currentare theCity, acFund rethe chathe past BecauseUse receconomin consimproveto upgr$21,100forecast Using Fthe cu$7.03 m AlternaFour revBusineshave infrastrfuture gSales animpact recruitinlocal ref
nd Use Tax
t total Generaves of the CityCity’s Capitaed in greater
uthority: Thpalities authoe personal pral property o or consumprates of 3.0%nce change an
t Revenues: e largest singcounting for evenues. Tnges in Salest 10 years.
e they are receipts act as my and are hiumer spendiements in recrade the fore0,000 and ts are still bel
Y2010 actualrrent rate wmillion annual
tive Revenuvenue sourcess License Febases capaucture needgrowth of thend Use taxesthe current eng. Any propferendum.
x Rate
al Fund reveny Council andl Improvemedetail in the
e Code of Alaority to levy roperty and uutside of a mtion by the p%, with the mnd approval b
Sales and Ugle revenue about 40% ohe charts to s and Use tax
emitted mona baromete
ighly suscepting patterns.ceipts have lecasts for FY2$21,416,500low the FY200
revenues, a would yield ly.
es: While es (Occupatioees and Ad Vable of sus of the Cite school syste. Increases teconomic recoposed change
ues are insuf residents as ent Plan. TheExpenditure E
abama 1975 sales taxes use taxes on municipality tpurchaser. Thost recent chby a majority o
Use tax receipsource for tof total Genethe right shox revenues ov
nthly, Sales aer for the loible to chang While receed City offici2011‐FY2012 0 respective07 peak.
1% increase approximate
the other Tonal License aValorem Taxeupporting ty and fundiem, none preto the Occupaovery and mas in Ad Valore
fficient to methey are expe necessary Environment
§11‐51‐200 ton the grossgross receiphat is subseqhe Code of thange occurrinof the City Co
pts the ral ow ver
nd cal ges ent als to
ely,
in ely
op nd es) he ng sent the oppational Licensake Auburn leem would req
Fiscal Ye
2001
2002
2003
2004
2005
2006
2007
2008
2009
2010
et the needs ressed in inveexpendituressection of th
through 207,s receipts repts resulting fquently broughe City of Aung in May of ouncil is requi
ortunity for rse and Business competitivquire a legisla
ar Reven
12,554,
13,160,
14,589,
17,959,
18,429,
20,773,
21,784,
21,044,
20,143,
21,081,
T
of Auburn Ciestment initias to meet thehis document.
§40‐23‐2, ansulting from from the retaght into a muburn §12‐81 2003 (an incrired to enact
revenue enhaess License fve in industriative act at th
ue R
,602.45
,761.16
,314.80 2
,076.45
,012.64
,723.96
,156.76
,830.43
,853.98
,231.64
Ten‐year Histo
ity Schools anatives and proese objective.
nd §40‐23‐61the retail saail sale of tanunicipality foimposes salerease of 0.5%a rate change
ancement foufee may negaial and commhe state level
Rate % ch
2.5%
2.5%
.5%, 3%
3%
3%
3%
3%
3%
3%
3%
ory
nd the ojects es are
gives ale of ngible r use, es and %). An e.
und in atively mercial and a
hange
4.8%
10.9%
23.1%
2.6%
12.7%
4.9%
‐3.4%
‐4.3%
4.7%
Proposed Changes
2011 Revenue Review
Page 47

Rate Comparisons: As seen in the table below, the sales tax rate currently compares very favorably with the rates in neighboring communities. When comparing to locations considered in competition with Auburn for retail and commercial development such as Montgomery or Prattville, Auburn’s rate is low. It is important to keep in mind the different tax structures in each state when making comparisons to municipalities in Georgia, where property tax rates are significantly higher.
Proposal Staff recommends an increase in the Sales and Use tax rate of 1.0%, increasing the total City rate to 4.0% and the total rate, including state and county, to 9.0%. The resulting increase in revenues would be divided between the City and Auburn City Schools; the City’s portion would largely be used to fund infrastructure investment and reduce the need to incur additional debt.
Municipality County SPLOST
Auburn Lee 3.0% 1.0% 4.0% 8.0%
Opelika Lee 3.0% 1.0% 4.0% 8.0%
n/a 3.0% 4.0% 7.0%
Phenix City Lee 3.0% 1.0% 4.0% 8.0%
Smiths Station Lee 1.0% 3.0% 4.0% 8.0%
Prattville** Autauga 3.5% 2.0% 4.0% 9.5%
Lanett Chambers 4.0% 1.0% 4.0% 9.0%
Valley Chambers 4.0% 1.0% 4.0% 9.0%
n/a 2.0% 4.0% 6.0%
Birmingham* Jefferson 4.0% 2.0% 4.0% 10.0%
Hoover* Jefferson 3.0% 2.0% 4.0% 9.0%
Mountain Brook Jefferson 3.0% 2.0% 4.0% 9.0%
Vestavia* Jefferson 3.0% 2.0% 4.0% 9.0%
Montgomery Montgomery 3.5% 2.5% 4.0% 10.0%
Birmingham* Shelby 4.0% 1.0% 4.0% 9.0%
Hoover* Shelby 3.0% 1.0% 4.0% 8.0%
Vestavia* Shelby 3.0% 1.0% 4.0% 8.0%
Alexander City Tallapoosa 3.5% 1.0% 4.0% 8.5%
Dadeville Tallapoosa 3.5% 1.0% 4.0% 8.5%
Marietta, GA Cobb 0.0% 2.0% 4.0% 1.0% 7.0%
Newnan, GA Coweta 0.0% 3.0% 4.0% 1.0% 8.0%
Atlanta, GA Fulton 1.0% 3.0% 4.0% 1.0% 9.0%
Alpharetta, GA Fulton 0.0% 3.0% 4.0% 7.0%
Sandy Springs, GA Fulton 0.0% 3.0% 4.0% 7.0%
Columbus, GA Muscogee 0.0% 2.0% 4.0% 1.0% 7.0%
LaGrange, GA Troup 0.0% 3.0% 4.0% 1.0% 8.0%
Note: these rates are for general sales only, not vending, car sales, or any specialized sales
* denotes Cities that span multiple counties, l isted seperately for each county
** Prattvil le added 1% Sales Tax, effective May 2011, ending April 2012
̂County rate is for all sales made outside the Auburn/Opelika/Phenix City city l imits
and outside the Opelika/Phenix City Police Jurisdiction
Jefferson County
Lee County^
Comparison of General Sales Tax Rates among Selected Comparable Cities
CountyCity State Total
Sales Tax
Proposed Changes
Page 48
2011 Revenue Review

Business License: Commercial Rental & Business License Issuance Fees
Key Issue State Code §11‐51‐90 authorizes all municipalities to license any exhibition, trade, business, vocation, occupation, or profession not prohibited by the Constitution or laws of the state which may be carried on in the municipality. This same code section authorizes the municipalities to charge a fee of not more than ten dollars ($10) for the issuance of said licenses. Commercial Rental License Fee: The commercial rental fee is the license tax levied on businesses engaged in the rental of commercial buildings to other businesses for a fee. The annual rate charged to entities engaged in this type of business activity is 1/40 of 1% of the gross rental receipts received during the previous year. This commercial fee is extremely low compared to the rate charged to the City’s taxpayers who are engaged in the business of leasing residential property to others. This annual business license fee is 1.5% of gross rental receipts received during the previous year. Over the past years there has been strong opposition to the differences in the two rates for the same “type” of business activity. The question is whether the commercial rental business license fee should be increased to 1.5% of gross commercial property rental receipts which would equal the rate paid by those engaged in the rental of residential property. Business License Issuance Fee: According to §11‐51‐90 (2) of the State Code, the issuance fee shall be increased once every five years by the Department of Revenue by an amount equal to the percentage increase, if any, in the U.S. Department of Labor’s Producer Price Index during that five‐year period rounded to the nearest dollar. In order to be in line with State Code and to cover the administrative cost of managing the issuance of business licenses in the City of Auburn, the City will need to comply with the initial increase authorized by the State four years ago. By increasing the business license issuance fee from $5 to $10, the city’s revenue stream would increase by approximately $25,000 a year.
Analysis Commercial Rental License Fee: Increasing the commercial rental fee business license rate to 1.5% of gross receipts over the next five years would considerably increase revenues. Using this rate on the gross receipts amounts submitted for the 2010 business license fees, the City would see an increase of over 450% in this revenue source over the next five years. There were several businesses paying the minimum license fee because the base gross receipts had to equal more than $410,000 in order for the business license fee to be more than $100. These businesses would experience the largest increase in their business license fee during the first year of implementation. The average business license fee for commercial rental was $127 in 2010. Using the proposed model, the average business license fee for 2012 would be $913. However, over the remaining four years of the increase, the average amount of the business license increases will be $530 per year. The chart at the bottom displays the proposed revenues with incremental increases implemented over the next five years. The charts includes an increase in gross revenues of 3% each year for the businesses Staff research gathered from cities with a college presence, revealed no government that made distinctions in rates between residential rental and commercial rental as a business activity. Although the gross receipts from commercial rental and residential rental are taxed at the same rate, all rates appeared to be higher than the City’s commercial rate and lower than the City’s residential rate.
Proposed Changes
2011 Revenue Review
Page 49

Business License Issuance Fee: The average cost to process a business license is approximately $9.07. The current issuance fee is $5. All cities registered with the Alabama Municipal Revenue Officer’s Association, with the exception of three, have increased their business license issuance fee to $10, the top amount set by the State of Alabama. By increasing the fee in January 2012, not only will the City capture more of the administrative cost to process all business licenses, but additional increases as allowed by the State could be treated in a more uniform manner.
Proposal:
1. Commercial Rental License Fee – The proposed rate change for commercial rental license fee should be implemented over the next five years, beginning October 1, 2012. The rate will move to .50% of gross receipts in 2012 and increase by .25% each year for the next four years until the rate reaches 1.5% of gross receipts, which will equal the residential rental license fee rate.
2. Business License Issuance Fee – The proposed rate for the business license issuance fee will rise to $10.00 effective for the business licenses issued for 2012.
Baseline Projection
FY11 FY12 FY13 FY14 FY15 FY16
Projected Revenues 9,500$ 9,500$ 9,785$ 10,079$ 10,381$ 10,692$
Proposed rate increases to begin in FY2012
New Rates 0.50% 0.75% 1.00% 1.25% 1.50%
Projected Revenues 9,500 62,128 95,301 130,470 167,725 207,139
Increase in Revenues ‐$ 52,628$ 85,516$ 120,391$ 157,344$ 196,447$
Proposed Changes
Page 50
2011 Revenue Review

Liquor Wholesale Tax
Key Issue The current rate for liquor wholesale tax does not provide sufficient revenues considering the additional demands businesses engaged in liquor sales place on the City’s public safety resources. Auburn’s current tax rate of 3% is significantly less than the rates in our peer communities.
Analysis Licenses and taxes are levied to regulate an activity and/or to generate revenue. The State of Alabama allows municipalities to levy an additional tax on the sale of liquor within the municipality or the police jurisdiction. In April 2008, the City instituted a 3% tax on the wholesale liquor purchases. This tax was designed to serve both as a regulatory tax and a revenue generating tax. As a revenue generator: For its first two full fiscal years the liquor wholesale tax has generated revenue of $85,000 in 2009 and $83,500 in 2010 for the City. This amount represents approximately 0.16% of the total general fund revenue for both years contributing very little to maintain the services provided by the City of Auburn. As a regulator: The State of Alabama mandates that all liquor retailers licensed by the State ABC Board make their purchases solely from the State stores. Each month a report of the wholesale liquor purchases made by each retailer is distributed to the cities that request the report. Each month the report is reviewed and compared by City staff to liquor taxes remitted by each liquor retailer to ensure that the proper amount of tax is remitted. Additionally, an analysis of the amount of liquor purchased by each retailer is done to assess if there could be a potential problem of the business operating under an inappropriate license type. For example, upon review it is found that a retailer with a license designation as a restaurant consistently purchases as much liquor as a lounge; given that type of disparity, further inquiry and analysis will be performed. If the entity is found in violation of City or Alabama State Code, the City staff can pursue necessary means to bring the licensee into compliance. This could include protesting the renewal of the retailer’s State license to sell liquor as a restaurant.
In accordance with State Code 28‐3‐1, several Alabama cities have chosen to levy a tax on the sale of liquor. The average wholesale tax among the sampled poll of cities is 6%. Rates for chosen cities are listed below.
0%
2%
4%
6%
8%
10%
12%
Liquor Tax rates
Proposed Changes
2011 Revenue Review
Page 51

Huntsville and Tuscaloosa charge a liquor tax on the retail sale of each drink and their rates are 10% and 7% respectively. As a regulatory item of tracking wholesale liquor sales within the City of Auburn, the tax has performed well. However, as a revenue generator, the tax does not contribute even 1/3 of a percentage point to the general fund. With the inherent additional cost of public safety demands associated with businesses whose primary activity is the retail sales of liquor aligning the cost of increased services with liquor consumption is a central concern. An increase in liquor tax would have minimal impact on the average citizen of Auburn. Retailers have the choice of adding this increase to the price of each sale of alcohol, but the change would have minimal effect on the consumer.
Proposal The City staff proposes to increase the Liquor Wholesale Tax from 3% to 7%. This increase would generate additional revenues and align associated costs of services. Each additional percentage increase or decrease would change the revenue totals by approximately $28,000.
Baseline Projection
FY11 FY12 FY13 FY14 FY15 FY16
Projected Revenues (3%) 85,000 86,700 88,868 91,089 93,366 95,701
Proposed rate = 7% wholesale implemented in FY12
Projected Revenues 85,000 204,283 210,412 216,724 223,226 229,923
Increase in Revenues ‐ 117,583 121,544 125,635 129,859 134,222
Proposed Changes
Page 52
2011 Revenue Review

E911 Service Fees Key Issue The revenue collected from the City’s locally levied E911 Service Fees does not sufficiently contribute to covering the costs incurred to operate and maintain the City’s emergency 911 call center.
Analysis Legal Authority: Section 11‐98‐5 of the Code of Alabama 1975 gives a local E911 Board the power to set E911 services rates up to the threshold needed to run, and cover the expenditures of, a public safety answering point. The Public Safety Department’s Communication Division operates the city’s 911 call center, while the City Council acts as the local E911 Board. The comparative table below lists several similarly sized E911 boards in the State of Alabama and includes the current and proposed rates for the City.
Revenue History and Projections: From FY2005 to FY2010, the City of Auburn has seen a decrease of 37%, or $155,042, in the locally levied E911 service fee revenue, while the Public Safety Department’s Communications Division costs increased by 45%, or $259,834. City staff has conservatively projected that the E911 Service Fee revenues will have minimal to no decline per fiscal year, see the Baseline Projection table below, with annual projected revenues of $237,500 in FY16 if the rates are left unchanged.
E911 Rates and Fees Comparison
Business Rates Residential Rates
E911 Board Rate per line E911 Board Rate per line
Hoover 5.08 Hoover 2.68
Decatur 4.35 Decatur 2.50
Vestavia Hills 4.35 Vestavia Hills 2.30
Prattville 3.50 Phenix City 2.00
Gadsden 3.48 Prattville 1.85
Florence 3.10 Gadsden 1.84
Opelika 3.05 Florence 1.70
Auburn ‐ Proposed 3.05 Opelika 1.61
Phenix City 2.50 Auburn ‐ Proposed 1.61
Auburn ‐ Current 2.43 Mobile 1.24
Dothan 2.21 Auburn ‐ Current 0.98
Huntsville 2.20 Dothan 0.84
Madison 2.20 Huntsville 0.82
Mobile 2.17 Madison 0.82
Tuscaloosa 0.50 Tuscaloosa 0.50
Montgomery ‐ Montgomery ‐
Average 2.76 Average 1.46
Baseline Projection
Scenario: Current rates left unchangedBreakdown by subscriber type FY11 FY12 FY13 FY14 FY15 FY16
Revenues from business 167,500 159,125 159,125 159,125 159,125 159,125
Revenues from residential 82,500 78,375 78,375 78,375 78,375 78,375
Total Revenues 250,000 237,500 237,500 237,500 237,500 237,500
Proposed Changes
2011 Revenue Review
Page 53
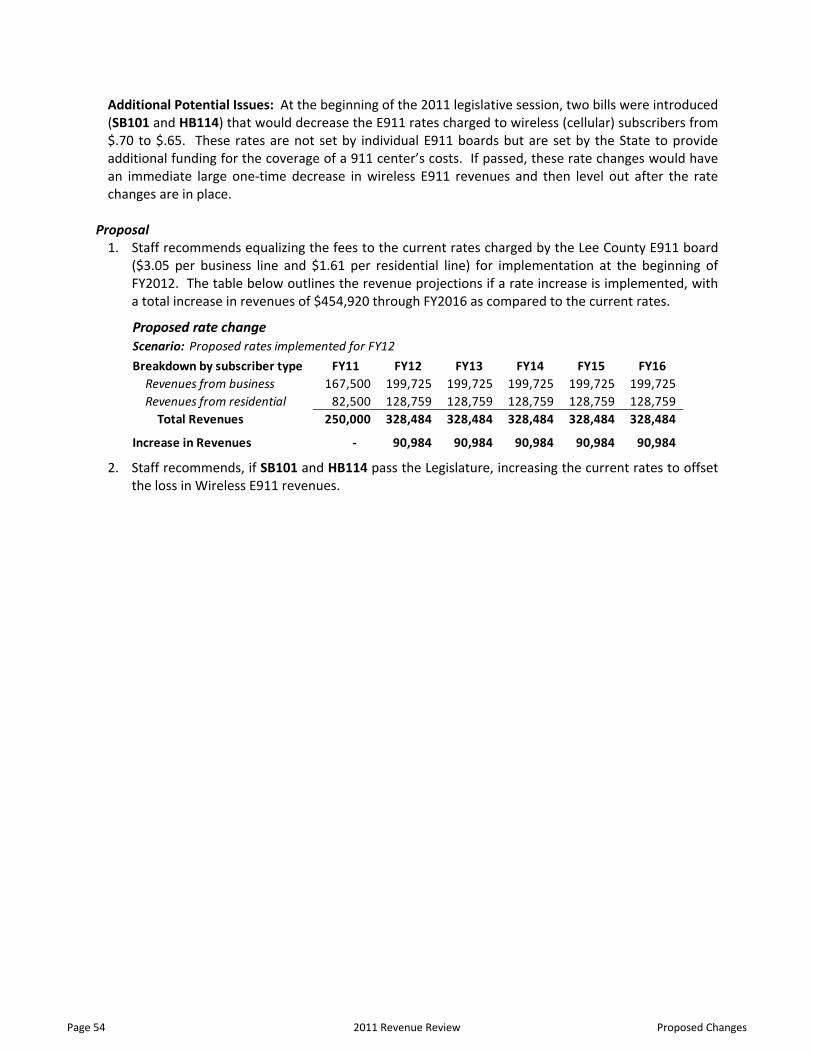
Additional Potential Issues: At the beginning of the 2011 legislative session, two bills were introduced (SB101 and HB114) that would decrease the E911 rates charged to wireless (cellular) subscribers from $.70 to $.65. These rates are not set by individual E911 boards but are set by the State to provide additional funding for the coverage of a 911 center’s costs. If passed, these rate changes would have an immediate large one‐time decrease in wireless E911 revenues and then level out after the rate changes are in place.
Proposal 1. Staff recommends equalizing the fees to the current rates charged by the Lee County E911 board
($3.05 per business line and $1.61 per residential line) for implementation at the beginning of FY2012. The table below outlines the revenue projections if a rate increase is implemented, with a total increase in revenues of $454,920 through FY2016 as compared to the current rates.
2. Staff recommends, if SB101 and HB114 pass the Legislature, increasing the current rates to offset the loss in Wireless E911 revenues.
Proposed rate changeScenario: Proposed rates implemented for FY12
Breakdown by subscriber type FY11 FY12 FY13 FY14 FY15 FY16
Revenues from business 167,500 199,725 199,725 199,725 199,725 199,725
Revenues from residential 82,500 128,759 128,759 128,759 128,759 128,759
Total Revenues 250,000 328,484 328,484 328,484 328,484 328,484
Increase in Revenues ‐ 90,984 90,984 90,984 90,984 90,984
Proposed Changes
Page 54
2011 Revenue Review

Revenue Collection in the Police Jurisdiction
Key Issue The City’s Police Division routinely performs law enforcement duties in the police jurisdiction, which extends up to three miles beyond the City’s corporate limits. The City’s Police Division has no legal requirement to provide services in this area, but elects to do so in cooperation with neighboring agencies and because doing so enhances the general safety of the areas within the corporate limits. While state law allows the levy of certain sales taxes and business license fees in the police jurisdiction to aid in recovering costs, at present only a very small amount of revenues in the form of wholesale fuel and cigarette taxes are collected. Police services provided to locations in the unincorporated police jurisdiction have been steadily rising, and in FY2010 accounted for roughly 5% of all calls for service. As the unincorporated areas surrounding the City continue to experience population growth, demands for service in these areas will continue to rise. There are also a number of commercial entities located in enclaves within City limits from which the City receives no direct revenues.
Analysis Legal Authority: Section 11‐40‐10(a) of the Code of Alabama 1975 establishes a municipality’s police jurisdiction to cover all adjoining territory within three miles of the corporate limits. Sections 11‐51‐91 and 11‐51‐206 authorize the City to collect up to ½ the business license fees and sales and use taxes, respectively, of the City provided that the revenues collected do not exceed the cost of services provided. Numerous Attorney General Opinions (AGO) have affirmed this1, and Alabama courts have reiterated this principal and clarified the intent.2 Defining Police Jurisdiction: Staff does not recommend, for various reasons, extending any services outside Lee County, and prefers to establish police jurisdiction in cooperation with the Lee County Sheriff’s Office and other neighboring jurisdiction, using logical geographic boundaries to determine which agency patrols which area. AGOs, citing Alabama Supreme Court rulings, have held that the three mile rule must be observed and that county lines are not barriers to the exercise of police powers within the police jurisdiction.3 Using these criteria, the City’s police jurisdiction extends beyond our preferred and customary patrol and response area. However, several cities and towns have reduced their corporate limits by local act, and these reductions typically have ended the police jurisdiction at county lines, highways or natural boundaries such as rivers or other bodies of water.4 These acts have typically been crafted to provide manageable police jurisdiction boundaries for the purposes of public safety and municipal service provision, as well as aid the establishment of local taxation and licensing ordinances. If the City of Auburn desired to levy taxes or require business licenses in the police jurisdiction and avoid the problems associated with crossing county lines and limit the jurisdiction to points within three miles, a local act5 would need to be approved by the State Legislature. Impact on Services: AGO’s and case law have held that if any taxes or fees are levied in the police jurisdiction, they must be applied equally across the entire jurisdiction and services must be provided equally to all areas as well. This would require an equal amount of services to be provided across the service area. The determination of the level of service provide in the police jurisdiction is solely the decision of the City Council.6 Police Services in the Police Jurisdiction: Calls have increased in recent years; while total Computer‐Aided Dispatch (CAD) police‐only entries have risen 31% from FY2006 to FY2010, police services to the police jurisdiction have increased 111%. A large number of these are provided to the various mobile
Proposed Changes
2011 Revenue Review
Page 55

home parks. A recent update to the mobile home park inventory in the police jurisdiction found 37 separate parks with a capacity of over 2,543 residential units. In addition to the mobile home parks, there are several convenience stores, gas stations, used auto dealers, restaurants, lounges and retail businesses. In 2010, Police Division personnel responded to 6,411 incidents outside the corporate limits. Additionally, while no E‐911 fees are collected from phone lines in the police jurisdiction, nor is the unincorporated population considered when the state distributes Wireless E‐911 fees to the local Emergency Communications Districts (ECD), calls to 911 made from the police jurisdiction are routed to the City’s 911 Center/Communications Division.
Recovery of the Cost of Services: A preliminary review of the legal requirements for the degree of cost accounting necessary to justify expenditures in providing services to the police jurisdiction indicates that the burden on City staff will be minimal. For the purposes of this analysis, a simple, conservative method of calculating costs based on a weighted average of call volume and standby capacity7, where actual service calls comprise 95% of the weighted total. The table below shows the total cost of providing police services to the City and an allocation of these costs to the police jurisdiction based on both direct service (% of services) and standby (equal % of areas and residences served). The Cost Recovery portion compares the revenue already collected through fuel and cigarette taxes with the costs of service provision, resulting in an estimated unrecovered amount of $716,640, or 96% of total costs.
Estimates of Potential Revenues from the Police Jurisdiction: Given the difficulties in navigating in the unincorporated areas due to lack of signage and inadequate lighting, Public Safety maintains a database of landmarks in the police jurisdiction to assist in responding to calls for service and track incident responses. Some of these landmarks are simple locations, such as cow or goat pastures, but
Total Police Costs 11,361,984$
Cost Allocation % in P.J. Importance Weighted
Direct Service (95%)
Police Calls for Service 4.9% 95.00% 4.7%
Standby Capacity (5%)
Acreage 68.7% 1.25% 0.9%
Street Miles 47.5% 1.25% 0.6%
Parcels 18.3% 1.25% 0.2%
Homes 14.8% 1.25% 0.2%
total P.J. portion 6.5%
Police Protection Cost in Police Jurisdiction in FY2010 743,990
Cost Recovery
Current Revenues
Cigarette Tax 1,117
Wholesale Fuel Tax 26,233
Total Revenues Collected 27,350
Unrecovered Costs 716,640
% of unrecovered costs 96%
Page 56
2011 Revenue Review
Proposed Changes
137 of these landmarks are ongoing commercial operations. Using this list, staff analyzed the applicable licenses that would be required and compared to like businesses in the City limits and conservatively estimated the revenues they would produce. In the case of utility companies, homesteaded parcels were used to determine the number of households served and gross receipts estimated based on remittances made to the City by these utilities; this ignores the utilities provided to commercial parcels and mobile home parks, resulting in an ultra‐conservative estimate. Residential rental license fees on the mobile home parks and RV parks were estimated as well using comparable data from businesses within the City limits. Use taxes for the several manufacturers and one quarry were ignored. The result is a very conservative estimate of $589,184, based on receipts from FY2010. This is well under the estimated cost of services provided. Following this analysis are maps indicating the location and concentration of businesses and mobile home parks in the police jurisdiction.
Potential Issues with Revenue Collection in the Police Jurisdiction: There are potential problems with collecting revenues in the police jurisdiction.
Defining the Boundary: The City is not interested in providing services outside of Lee County. Also, frequent annexations will create a moving target for revenue enforcement if the three mile rule is observed. In order to effectively provide services and efficiently collect revenues, the City would have to lobby our delegation to sponsor a local act limiting our police jurisdiction to an area mutually agreeable to the City and neighboring jurisdictions.
Revenue Enforcement: Obviously, expanding the area in which to collect fees and taxes presents additional enforcement issues and will likely lead to an increased burden on the City’s Revenue Office staff.
Political and Legal Considerations: If the City determines to abandon portions of the existing police jurisdiction that will increase the burden on neighboring agencies. When the City of Opelika pulled their services from the unincorporated police jurisdiction, Lee County Sheriff’s Office was forced to increase their presence in the area, and thus decrease their presence elsewhere. Also, a number of large and profitable businesses currently receive free police services in the police jurisdiction; if this changes, there may be political pressure and legal challenges.
Proposal If the Council is interested in pursuing the collection of revenue from the police jurisdiction, staff will need to conduct additional research and investigate how other jurisdictions approach taxation and licensing in the police jurisdiction. Specifically, the following will need to occur:
1. Refine revenue estimates and identify enforcement needs. 2. Clarify what level of cost accounting will be required to justify revenue collection and what
additional burden this will place on existing staff. 3. Determine support of local legislative delegation to sponsoring a local act limiting the police
jurisdiction.
If, upon completion of these tasks, staff still recommends moving forward, the legislature would have to approve a local act limiting the police jurisdiction, and staff would present an ordinance (or series of ordinances) to implement the police jurisdiction initiative.
Proposed Changes
2011 Revenue Review
Page 57

1 The Odenville Police Department May Provide Only Emergency Services in Its Police Jurisdiction If the Revenue Collected in the Police Jurisdiction “Reflects Reasonable Compensation” to the Town for the Cost of the Emergency Services Provided. The Monies Collected Must Do No More Than Recoup the Costs of Providing the Emergency Response Services, Ala. Att’y Gen. Op. No. 2008‐007 (October 19, 2007). A.G No. 99‐0104; 2 Ex Parte City of Mobile, 37 So. 3d 150 (Ala. 2009) stated that a municipality may collect business license taxes from businesses within its police jurisdiction so long as the amount of the tax reflects only reasonable compensation to the municipality for expenses related to exercising supervision over the police jurisdiction. The tax may be no more than half of the tax collected from businesses within the corporate limits of the municipality. The tax may not be for the purpose of raising general revenue. Municipalities must only demonstrate the costs of service to the aggregate police jurisdiction rather than individual businesses within the police jurisdiction. There is no mandated method of determining this estimate; it is left to the municipality to determine. 3City May Not Reduce the Limits of Its Police Jurisdiction to an Area Less Than Those Limits Set by Statute, Ala. Att’y Gen. Op. No. 87‐00305 (September 2, 1987). ; City of Birmingham v. Lake, 10 So. 2d 24 (1942); A.G. No. 83‐00282; 4 Act 98‐302, p.496 s1., codified in Section 45‐1‐233. Act 92‐260, p. 617, s1., codified in Section 45‐13‐160. Act 2000‐471, p. 895, s1., codified in Section 45‐1A‐42. Act 97‐865, ast sp.Sess., p. 205, 1‐4, codified 45‐2A‐60.20. 5 Local Act Supersedes General Act When Local Act Limits the Extent of the Police Jurisdiction, Ala. Att’y Gen. Op. No. 98‐00114 (March 26, 1998). 6 A Municipality Is Not Required to Provide Sewer Service Outside Its Corporate Limits, Ala. Att’y Gen. Op. No. 2001‐126 (April 22, 2004). 7 A.G. No. 89‐00057 stated that reasonable compensation also necessarily includes a consideration for the value of standby facilities.
Page 58
2011 Revenue Review
Proposed Changes

Public Safety Landmark Map – Businesses in Police Jurisdiction
This map illustrates the location of landmarks used by Public Safety to dispatch in the police jurisdiction
and track incidents and are common geographic identifiers used in lieu of a reliable addressing and
street sign system, as found in the county. Landmarks are nearly all businesses, but in some cases the
landmarks may refer to long‐time residences, or even livestock pastures. The color of the dot used is
determined by the number of dispatches to that location (see legend inset).
Proposed Changes
2011 Revenue Review
Page 59

Park Name Address # of lots
ALLEN'S TRAILER PARK 55 LEE RD 59, Auburn
ARROW HEAD TRAILER PARK 4477 LEE RD 137, Auburn 63
ARROW HEAD TRAILER PARK 2 3000 LEE RD 10, Auburn 101
BARRONS TRAILER PARK 2045 LEE RD 137, Auburn 116
BEEHIVE TRAILER PARK 1400 LEE RD 10, Auburn unknown
BRENTWOOD ESTATES TP 3526 LEE RD 137, Auburn 35
CAMPUS TRAILER COURT 1865 LEE RD 137, Auburn 160
COLLEGE MOBILE HOME PARK 1987 LEE RD 137, Auburn 45
CONWAY ACRES TRAILER PARK (NEW, LOTS 100-399) 2038 LEE RD 137, Auburn 182
CONWAY ACRES TRAILER PARK (OLD LOTS 1-99&400+) 2330 LEE RD 137, Auburn 147
CONWAY FARMS TRAILER PARK 2110 LEE RD 137, Auburn 6
COTTON CREEK TRAILER PARK 900 LEE RD 9, Auburn 15
COUNTRYSIDE ESTATES TRAILER PARK 30 LEE RD 671, Auburn 11
DAWSON TRAILER PARK 2155 LEE RD 12, Auburn 32
DUBOSE TRAILER PARK 851 LEE RD 10, Auburn 13
FOURTEEN TRAILER PARK 29 LEE RD 676, Auburn 25
GENTILLY I TRAILER PARK(LOTS 1-499) 501 LEE RD 53, Auburn 324
GENTILLY II TRAILER PARK(LOTS 500+) 1960 LEE RD 137, Auburn 64
JERRY'S TRAILER PARK 1203 LEE RD 10, Auburn 12
MACANALLY TRAILER PARK 770 LEE RD 10, Auburn 4
MAGNOLIA ESTATES TP 3286 LEE RD 137, Auburn 14
MURPHY TRAILER PARK 719 LEE RD 10, Auburn 9
ORCHARD WAY TP 533 LEE RD 57, Auburn 202
PECAN ISLAND TRAILER PARK 765 LEE RD 10, Auburn 10
RED BIRD TRAILER PARK 3350 LEE RD 137, Auburn 3
SADDLEBROOK II TRAILER PARK LEE RD 953 19
SADDLEBROOK TRAILER PARK LEE RD 952, Auburn 22
SAND DOLLAR TRAILER PARK 1220 LEE RD 51, Auburn 14
SMITH'S TRAILER PARK 2017 LEE RD 137, Auburn 8
SOUTHRIDGE TRAILER PARK 676 LEE RD 191, Auburn 48
SUSANNA VILLAGE TP 838 LEE RD 672, Auburn 16
SWANNS TRAILER PARK (LOTS 1-399) 1617 LEE RD 12, Auburn 166
SWANNS TRAILER PARK II (LOTS 500+) 1885 LEE RD 12, Auburn 46
SWANNS TRIANGLE TP (LOTS 400-499) 1613 LEE RD 12, Auburn 20
TIGER TRAILER PARK 1945 LEE RD 137, Auburn 51
UNIVERSITY STATION 3160 HIGHWAY 14 W, Auburn 325
WHISPERING PINES TP 737 LEE RD 394, Auburn 16
WINDOVER FARMS TP 2727 LEE RD 12, Auburn 199
Total lots 2543
Mobile Home Parks in Police Jurisdiction
Mobile Home parks in the Police Jurisdiction but outside the City limits account for 20‐25% of dispatches to the Police
Jurisdiction. While no revenues are currently collected, the City can legally impose Residential Rental Business License fees on
the owners of these parks, and preliminary estimates indicate the City could receive up to $200,000 in revenues to help offset
the costs of providing police services.
Proposed Changes
Page 60
2011 Revenue Review

Mobile Home Parks in Police Jurisdiction
This map illustrates the locations and concentration of mobile home parks in the police jurisdiction but
outside the City limits.
Proposed Changes
2011 Revenue Review
Page 61

Proposed Changes
Page 62
2011 Revenue Review

Downtown Parking Meter Rates and Enforcement Revenues
Key Issue Residents continue to identify a need for additional downtown parking; 55% of respondents identified additional downtown parking as one of the top two priority projects. While some short and medium‐term projects will result in better utilization of current parking assets, in the long‐term a new parking deck will be required. Current revenues from parking activities are insufficient to provide for the long‐term capital needs, and the City’s existing enforcement mechanisms are inadequate to optimize both revenues and adherence to the City’s parking ordinance.
Analysis Legal Authority: The Code of Alabama 1975 § 32‐5‐1(e) gives the City authority to regulate parking. The Alabama Rules of Judicial Administration Rule 19(B) states that the governing body of a municipality shall have the power to establish a fine and cost schedule for the summary disposition of all municipal parking offenses. ARJA Rule 19 further states that, in municipalities retaining municipal courts (as does Auburn); municipal court magistrates shall administratively process all municipal parking offenses wherein a dispute arises. Attorney General Opinions (AGO) have held that municipal court magistrates may compel the owner of a ticketed vehicle to appear in court and enforce payment of fines, and that, if a defendant fails to appear, issue a supplemental summons followed by arrest in the event of another failure to appear.1 Further penalties include additional fines and jail time, subject to the provisions of the Alabama Rules of Criminal Procedure. There are no prohibitions against impoundment or installation of immobilizing devices, or “booting”, on vehicles in violation of a municipal parking ordinance. Enforcement of overtime parking violation: Vehicles parked in violation of the City’s overtime parking ordinances are subject to a written citation and fine of five dollars for the first violation, $20 for the second, and $40 for the third, provided that the successive violations occur in the same location at least two hours subsequent to the prior violation. If the fine is not paid within two days, the amount doubles. Violations in leased spaces are fined $50 for each violation, although these rarely occur since the City installed new gated access and card readers designed to prevent access to the leased spaces. Tickets are handwritten by enforcement personnel and entered again by hand into the municipal court database in batches by municipal court staff. Tickets are recorded by license plate number. Unpaid tickets result in letters being sent to registered owners. The Municipal Judge estimates that approximately 35‐40% of parking tickets due will be collected, and due to the lack of modern handheld technology, enforcement personnel have no efficient way of knowing whether a vehicle/registered owner parked in violation has outstanding tickets. Except in rare circumstances, no further action is taken in order to collect these revenues or penalize the violators. Recently, due to the vigilance of enforcement personnel, records searches were done on several vehicles known to be habitually parked in violation of the ordinance; the four license plate searches returned a combined total of 117 outstanding parking tickets and $1,550 in fines. The City has 36,838 parking tickets outstanding, with penalties (under the current ordinance) owed totaling $698,730. In FY2010 alone, 4,890 tickets were not paid, resulting in $92,370 in uncollected revenues, or about 62% outstanding. Current revenues and rates: The City currently collects revenues from downtown parking activities through three different sources: meter revenue, parking space rental, and fines received for violating the parking ordinance. Meter rates are currently set at $0.25/hour; spaces lease for $100/month; and, as discussed below, fine revenue varies.
Proposed Changes
2011 Revenue Review
Page 63

Current and Future Downtown Parking Operational Costs and Capital Projects: Future capital projects on the City’s Capital Improvement Plan include upgrades to the parking meter system, renovations to the surface parking lots, and design of a future replacement deck. Currently, most of the capital projects are conditionally funded, and will compete against other projects for available resources. The personal services, commodities and contractual services costs are currently funded through the budgets of the Public Safety and Environmental Services Departments, and non‐departmental accounts. The City does not currently dedicate revenues derived from parking activities to fund parking‐related operational and capital costs. The table below shows a comparison of projected parking revenues and parking costs.
2009 Downtown Parking Review: The 2011 Citizen Survey identified additional downtown parking as one of two highest priority projects for the City. However, demand studies have found that there is adequate capacity to meet current demand and that the City’s downtown parking assets are underutilized. In presenting the 2009 Downtown Parking Review to the City Council in 2009, staff recommended a comprehensive strategy with four key principals:
1. Improve management and operation of existing public parking facilities. 2. Improve the appearance of existing public parking facilities. 3. Construct additional parking facilities 4. Reduce parking demand.
Significant steps have been taken in all areas. Ongoing maintenance and beautification projects have improved the overall appearance, while several projects aimed at improving the overall functionality of the off‐street lots and parking deck have been successfully completed. Efforts to reduce overall demand have included coordinated efforts in cooperation with Auburn University to improve the Tiger Transit service, as well as the $250,000 Downtown Pedestrian/LED Streetlight Project (approved by Council in February) and the upcoming Magnolia Avenue Pedestrian Improvements Project. Based on current demand, a new deck will not become necessary until 2020, although it is recommended to begin identifying funding sources as soon as practical. Another key recommendation from the 2009 Downtown Parking Review was the deployment of new parking meter technology. Modern multi‐space metering technologies will help to improve revenue collection and enforcement activities, while offering a substantially more convenient experience for
Actual
FY10 FY11 FY12 FY13 FY14 FY15 FY16
Revenues
Leased Parking 178,032 140,000 170,000 170,000 170,000 170,000 170,000
Metered Parking 78,676 87,000 87,000 91,350 95,918 100,713 105,749
Parking Ticket Fines 63,954 62,000 74,400 78,120 82,026 86,127 90,434
Total Revenues 320,662 289,000 331,400 339,470 347,944 356,840 366,183
Expenditures
Personal Services 44,887 46,233 47,419 48,703 50,027 51,389 52,793
Contractual 28,898 43,435 28,988 44,558 30,144 45,749 31,371
Commodities (estimated) 10,680 11,000 11,175 11,355 11,541 11,731 11,928
Capital Outlay 140,815 20,000 185,000 500,000 15,000 150,000 15,000
Debt Service on Drive‐thru 259,096 259,096 259,096 259,096 259,096 194,257 ‐
Total Expenditures 484,375 379,764 531,678 863,712 365,807 453,126 111,092
Excess(deficit) of revenues over exp. (163,713) (90,764) (200,278) (524,242) (17,863) (96,286) 255,091
Downtown Parking Expenditures and Revenues Comparison
Projected
Proposed Changes
Page 64
2011 Revenue Review

residents and visitors patronizing downtown businesses. These new systems will also facilitate pricing and time limit adjustments, which will help to optimize the turnover in the on‐street spaces while encouraging use of the underutilized off‐street spaces.
Proposal In order to fund current and future downtown parking costs, staff recommends that further study be performed on optimal meter rate structures, meter and enforcement technologies, and penalty rates, with the intent of revising the City’s Parking Ordinance to increase all or some of these amounts and provide more stringent penalties for non‐payment of citations. Council will have an opportunity to review staff recommendations prior to any changes, and will ultimately vote to adopt any recommended revisions to the ordinance.
1 A.G. No. 2007‐103.
Proposed Changes
2011 Revenue Review
Page 65

Proposed Changes
Page 66
2011 Revenue Review

City of Auburn
2011 Revenue Review
Future Considerations
Overview As of the publication of this document, information on several important revenue issues had not been fully developed, and therefore recommendations could not be offered as part of this review. This section of the document is intended to provide a general overview of the issues you, as the City Council, will be faced with in the near future, as well as a brief summary of the steps staff will be undertaking to develop recommendations and the timelines envisioned. School System Expansion Funding Depending on the direction that the City Council decides to take in changing future school system funding, the current funding formula will need to be revised. With the addition of enterprise funds and other accounting changes, the overall revenue base currently used to calculate the 13% of total General Fund revenues has changed sufficiently to warrant a evaluation of the formula in order to protect the schools revenues and provide certainty for the City’s budgeting process. Staff will develop recommendations for consideration prior to FY11‐12 Mid‐Biennium Budget Adjustment process. Planning and Development Fees and Related Revenue During the 2007 Revenue Review, Council elected to conduct an analysis of building permit, planning, engineering and inspection fees to determine the adequacy of Auburn’s fees as compared with those charged by other cities and the costs to provide these services. Staff has conducted initial reviews of several of the fees for permitting and inspection services and determined that the fee schedules are not properly aligned with the cost of services provided. The reorganization of departments within the Neighborhood, Growth, Development and Infrastructure Business Unit will significantly impact how permitting and inspection activities are handled. This will, in turn, impact the costs associated with these activities. Within the next two years, construction is expected to begin on the Alabama Street facility, which will house those departments involved in planning and development activities. Staff recommends waiting until the reorganization is complete and the new facility in operation before revisiting these fees. Enforcement Activities With the transition to a new Finance Director in March of this year, the City Manager has asked that current staffing and administrative priorities be examined to ensure that the City’s financial activities are operating at peak efficiency. One component of this will be to ensure that we are optimizing our current auditing and enforcement efforts towards existing tax and fee payers. While the overwhelming percentage of Auburn’s businesses reliably meet their obligation to the community, there are always a few that, either willfully or through a lack of understanding of our regulations, do not remit their fair share of municipal taxes or fees. FY2010 revenues from tax and fee‐payer audits were at an all‐time high, resulting in $369,784 in collections that otherwise would have not been remitted. As the number of taxpayers increase, the demands on existing staff will continue to increase, and increased emphasis on enforcement will require either an expansion of current Finance capacity, a realignment of existing capacity, or increased utilization of outside contractors. It is management’s intention to present a recommendation to the Council in FY2012.
Future Considerations
2011 Revenue Review
Page 67