2011 robbins
TRANSCRIPT
8/3/2019 2011 Robbins
http://slidepdf.com/reader/full/2011-robbins 1/6
Don’t Throw Out the Baby with the
Bathwater: Estimating Fertility fromSubadult Skeletons
GWEN ROBBINS*
Department of Anthropology, Appalachian State University, Boone, NC 28608, USA
ABSTRACT Recent research interest has focused on the bioarchaeology of children. Although paleodemography isessential for accurate reconstructions of lifestyle and health in past populations, currently there is no publishedtechnique for estimating fertility and life expectancy at birth for skeletal populations in which adults are under-enumerated. This paper provides a formula to predict Gross Reproductive Rate (GRR) from the proportion ofyounginfantsto subadults in a skeletal population. Theformulawas developedfrom 98 of Coale andDemeny’sFemale Model West Life Tables, which represented diverse fertility and mortality rates. The formula’s accuracywas examined using independent samples from historical and archaeological cemeteries. Estimates of GRRfrom the subadult fertility formula were compared with estimates from Bocquet-Appel and Masset’s juveni-le:adult ratio. Results indicate that the subadult fertility formula predicts GRR with consistent accuracy(R 2 ¼ 0.98) and precision (Æ 1 offspring) in the model life tables, across diverse subadult age structuresand demographic characteristics. The formula is useful for subadult populations with a proportion ofperinates:subadults between 0.12 and 0.45. The adult component of the sample is not included in theanalysis and thus the formula is similarly useful in cases where adults are under-enumerated, or not. Whenapplied to historical and archaeological populations, estimates for GRR are similar to previous estimates fromthe juvenile:adult ratio. Because crude birth rate and life expectancy at birth can be calculated from GRR usingestablished fertility centred approaches to demography, the subadult fertility formula allows skeletal popu-lations of diverse composition to be included in demographic research, essential for understanding of howmortality and fertility are affecting the morbidity profiles of subadult samples and for comparative bioarch-aeological analyses. Copyright ß 2010 John Wiley & Sons, Ltd.
Key words: bioarchaeology; children; demography; fertility
Introduction
Bioarchaeologists use age and sex estimates from thehuman skeleton to construct demographic profiles whichdescribe mortality and fertility rates in past popu-lations. Paleodemography represents a particularlydifficult challenge but it is a necessary componentof bioarchaeology because both mortality and fertilitycan have significant impacts on the pathological pro-files (Wood et al., 1992; Saunders & Hoppa, 1993;Cohen et al., 1994; Cohen, 1997; Wright & Yoder,2003; Lukacs, 2008). The various techniques for paleo-demography have been subject to much criticism overthe years (Bocquet-Appel & Masset, 1982; Buikstraet al., 1986; Hoppa & Vaupel, 2002; McCaa, 2002;Bocquet-Appel, 2007). Many critiques have focused on
assumptions of stability and stationarity. Others havepointed out the circularity of ‘shoehorning’ popu-lations, fitting them to model life tables, which effecti-vely eliminates the potential for recognising andstudying variation. In addition, it is widely recognisedthat adult skeletons are problematic for demographybecause age estimation methods have a centrist tend-ency, which leads to a preponderance of individuals inthe 30–45 year age bracket and an under-enumerationof older adults.
In response to the numerous critiques and difficultiesof doing paleodemography, the field has evolvedsubstantially and innovative statistical approaches tothe age pyramid have been developed (Sattenspiel &Harpending, 1983; Jackes, 1986; Jackes, 1992; Konigs-berg & Frankenberg, 1992; Konigsberg & Frankenberg,1994; Paine & Harpending, 1996; Paine, 1997; Meindl& Russell, 1998; Hoppa & Vaupel, 2002) includingfertility centred approaches to the age structure ofskeletal populations (Sattenspiel & Harpending, 1983;
International Journal of OsteoarchaeologyInt. J. Osteoarchaeol. (2010)Published online in Wiley InterScience(www.interscience.wiley.com) DOI: 10.1002/oa.1181
* Correspondence to: Department of Anthropology, 416 Sanford Hall, 225Locust Street, Appalachian State University, Boone, NC 28608, USA.e-mail: [email protected]
Copyright # 2010 John Wiley & Sons, Ltd. Received 16 April 2009
Revised 6 April 2010 Accepted 26 April 2010

8/3/2019 2011 Robbins
http://slidepdf.com/reader/full/2011-robbins 2/6
Horowitz et al., 1988; McCaa, 1998, 2002). One areathat has received less research attention in paleode-mography is subadult skeletal populations, samplescomprised of a large proportion of subadults in whichadults are under-enumerated.
This paper provides a method (the subadult fertilityformula) for estimating Gross Reproductive Rate1
(GRR) for such skeletal populations. Once GRR hasbeen estimated from the age pyramid, Total FertilityRates (TFR) and life expectancy at birth (eo) can becalculated using a published technique to derive thoseestimates from GRR (McCaa, 1998). In previous publi-cations including the Health in the Western Hemi-sphere project (McCaa, 2002), GRR was estimatedusing the juvenility index (5–14D20þ), the proportionof individuals who died between the ages of 5 and14 years to dead adults> 20 years (Bocquet-Appel &Masset, 1982). This method, like most methods for
paleodemography, deliberately ignores young infantsand children because they ‘should be’ under-rep-resented in archaeological populations (Angel, 1969;Weiss, 1973). Despite the perception that subadults arenot often preserved, McCaa found that subadultsrepresented almost half of the assemblages (mean ¼0.48; range between 0.22 and 0.56) in a meta-analysisof 51 skeletal populations (McCaa, 1998). This paperprovides a technique for constructing demographicprofiles for skeletal populations in which subadults arewell represented and for populations in which adultskeletons are under-enumerated.
Materials and methods
The subadult fertility formula was developed usingFemale Model West Life Tables (Coale & Demeny,1983), data commonly used for developing methods inpaleodemography (Bocquet-Appel & Masset, 1982;Buikstra et al., 1986; McCaa, 1998). The range of modellife tables was restricted to populations that fit with theexpectations for archaeological samples. The sampleincluded 98 tables from populations with growth rateswithin the range of À1 to 2% and mortality levels 1–14.
Growth rates were restricted because archaeologicalpopulations are not expected to grow at a rate fasterthan 2% (the population is doubling every generation)(Livi-Bacci, 2007). Tables with mortality rates outsidethe range of 1–14 were excluded because those pop-
ulations had a higher proportion of individuals in the70 þ age range and that age structure is uncommonin paleopopulations (McCaa, 2002; Steckel & Rose,2002). The tables included in this sample had diverseage structure; the proportion of perinates (0–1 yearsold) to subadults (2–20 years old) ranged from 0.06–0.78.
To estimate the proportion of perinates in thesubadult population, the adult age categories (20 þ )were excluded and only the subadult (0–19 years) agepyramid was considered. Data collected from the tablesincluded the number of deaths in each subadult agecategory, population growth rate, mortality level, obs-erved GRR, crude birth rate and crude death rate. Theproportion of young infants:subadults was calculated as
0–1D2–19, or the proportion of infant deaths in the firstyear of life (0–1 year) divided by the sum of subadultdeaths (2–19 years). This proportion was used to dev-
elop the formula to predict GRR, based on quadraticregression analysis.
The subadult fertility formula was tested using anindependent skeletal sample from St. Thomas’ Angli-can Church in Belleville, Ontario (Saunders et al.,2002). The sample for this analysis consisted of 575individuals excavated from 579 grave shafts prior to theconstruction of a parish hall in 1989 (Saunders et al.,2002). This sample is derived from what was a largecemetery, with 1564 individuals buried between 1821and 1874. Detailed historical records about age and sexare available (Saunders et al., 1995). The proportion of
perinates:subadults was calculated as 0–1D2–19. GRR was then estimated using the subadult fertility formulaand the juvenile:adult ratio (5–14D20þ) and the accuracyof the two estimates was compared. Accuracy wasdefined as the absolute value of the difference betweenobserved and predicted GRR.
The accuracy of estimates for GRR from the subadultfertility formula was also evaluated in 11 populationsfrom the Health in the Western Hemisphere project(McCaa, 1998, 2002). GRR estimates from the subadultfertility formula were compared with previous esti-mates of GRR made using Bocquet-Appel’s juvenile:a-dult ratio (5–14D20þ) (McCaa, 1998, 2002). The sample
included populations from diverse regions and timeperiods (described in the Health in Western Hemi-sphere project (McCaa, 1998, 2002)) including askeletal population from the Neolithic (4387–3788B.P.) in France (Loisy en Brie), Classic Period (1200–650 B.P.) village populations from Central and NorthAmerica (Chiribaya, Dickson Mound, Estaquina,Maitas, Monongahela, Pearson), an Historic eracemetery (1000 B.P.) in England (Scarborough), andHistoric Era (100–400 B.P.) Native North American
1GRR is defined as the average number of female offspring born to eachwoman, assuming she survived to the end of her childbearing years,conformed to differences in age-specific fertility rates and there was a105:100 sex ratio at birth (Last, 2001).
Copyright # 2010 John Wiley & Sons, Ltd. Int. J. Osteoarchaeol. (2010)
G. Robbins

8/3/2019 2011 Robbins
http://slidepdf.com/reader/full/2011-robbins 3/6
populations (Amelia Island and Hawikku). Thesepopulations also had diverse composition in regardto the age pyramid, with the proportion of perina-tes:subadults ranging from 0.24 to 0.52.
Results
The following quadratic equation was developed toestimate GRR from the proportion of perinates in thesubadult population
GPR ¼ À2:78 þ 7:71 Â0À1 D2À19ð Þ
þ 34:26 Â0À1 D22À19
À Á(1)
Results of a one-way ANOVA suggest that the pro-portion of perinates in the subadult component of apopulation is a significant predictor of GRR ( F ¼ 81.25,p< 0.001). Figure 1 demonstrates that the subadult
fertility formula is a good predictor of GRR in theCoale and Demeny model life tables ( R2 ¼ 0.9805,p< 0.001). Table 1 provides descriptive statistics onthe proportion of perinates, crude birth and deathrates, observed and predicted GRR, mean SE of theprediction and an estimate of accuracy. Accuracywas defined here as the absolute value of thedifference between the actual value of the dependentvariable (Y ) and the predicted value Y
, Y À Y
,
given the proportion of perinates in the subadultsample ( X ). Despite the diverse age compositionof the reference population, the formula performedwith fairly consistent accuracy (range was 0.8–1.7offspring).
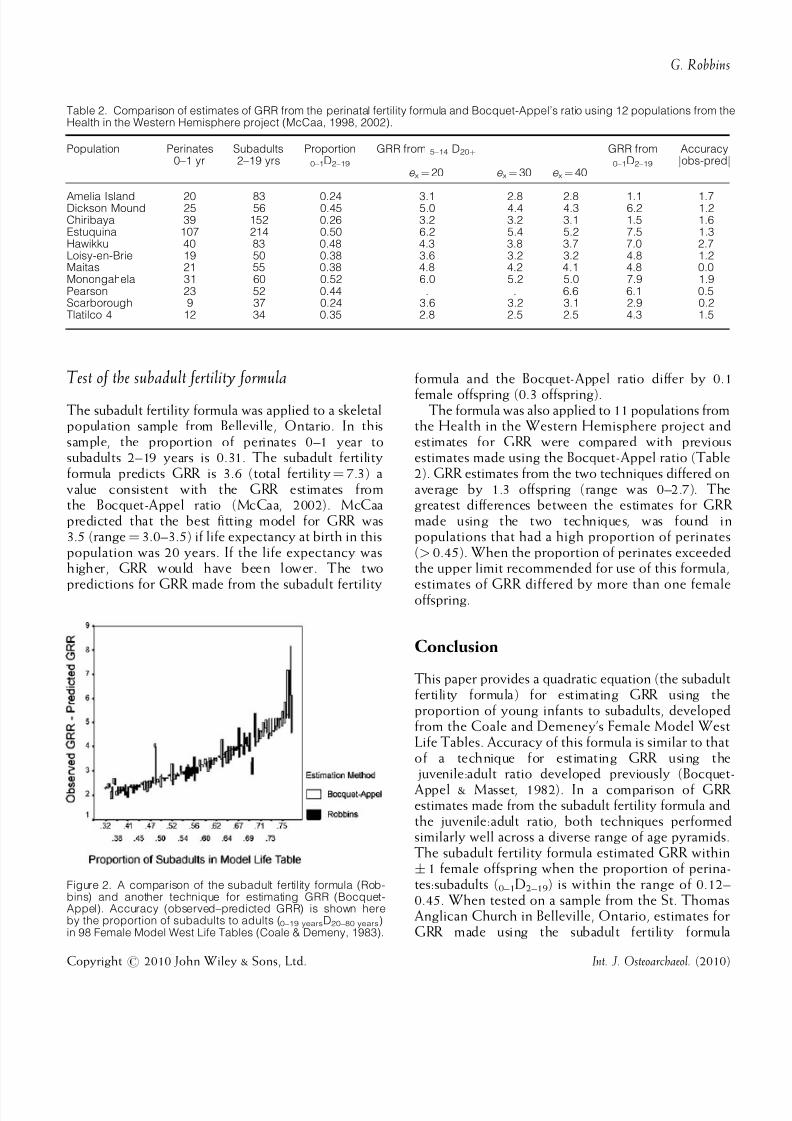
Using the Coale and Demeney life tables, acomparison was made of estimates of GRR from thesubadult fertility formula with estimates made fromBocquet-Appel and Masset’s ratio (5–14D20þ) (Bocquet-
Appel & Masset, 1982). The two techniques performedsimilarly well for model life tables with a proportion ofperinates:subadults between 0.32 and 0.75 (Figure 2).The subadult fertility formula has the highest level ofaccuracy in populations with GRR between 2 and 4(total fertility rates between 4 and 8 offspring). WhenGRR is less than 2, the subadult fertility formula tendsto underestimate GRR and the Bocquet-Appel andMasset’s ratio performs better. On the other hand,when GRR is greater than 2, the Bocquet-Appel ratiotends to underestimate GRR and the subadult fertilityformula performs better. If the proportion of perina-
tes:subadults is less than 0.12, the estimate for GRR from the subadult fertility formula will be less than 1.4female offspring (total fertility ¼ 2.7). When theproportion of perinates exceeds 0.45, the estimate ofGRR will be ! 8.0 (total fertility ! 16.0 offspring).Thus the subadult fertility formula is most accurate andappropriate for estimating GRR in populations with aproportion of perinates to subadults between 0.12 and0.45.
Figure 1. Observed versus estimated GRR in 98 Female ModelWest Life Tables (Coale & Demeny, 1983).
Table 1. Descriptive statistics for estimates of gross reproductive rate (GRR) from the subadult fertility formula.
Proportion ofperinates
CBR CDR Observedmean GRR
Predictedmean GRR
Mean SEE Accuracyjobs-predj
0.13–0.14 21 24 1.42 2.36 0.005 0.950.15–0.19 24 25 1.61 2.45 0.014 0.840.20–0.24 30 26 1.94 2.73 0.027 0.790.25–0.29 36 28 2.33 3.21 0.040 0.880.30–0.34 42 34 2.72 3.81 0.057 1.080.35–0.39 49 36 3.25 4.54 0.077 1.300.40–0.44 60 45 3.98 5.55 0.123 1.560.45–0.49 73 55 5.1 6.76 0.214 1.71
Note : CBR, crude birth rate; CDR, crude death rate; SEE, standard error of the estimate; obs, observed; pred, predicted.
Copyright # 2010 John Wiley & Sons, Ltd. Int. J. Osteoarchaeol. (2010)
Paleodemography for Subadult Populations from India
8/3/2019 2011 Robbins
http://slidepdf.com/reader/full/2011-robbins 4/6
Test of the subadult fertility formula
The subadult fertility formula was applied to a skeletalpopulation sample from Belleville, Ontario. In thissample, the proportion of perinates 0–1 year tosubadults 2–19 years is 0.31. The subadult fertilityformula predicts GRR is 3.6 (total fertility ¼ 7.3) avalue consistent with the GRR estimates fromthe Bocquet-Appel ratio (McCaa, 2002). McCaapredicted that the best fitting model for GRR was3.5 (range ¼ 3.0–3.5) if life expectancy at birth in thispopulation was 20 years. If the life expectancy washigher, GRR would have been lower. The two
predictions for GRR made from the subadult fertility
formula and the Bocquet-Appel ratio differ by 0.1
female offspring (0.3 offspring).The formula was also applied to 11 populations from
the Health in the Western Hemisphere project andestimates for GRR were compared with previousestimates made using the Bocquet-Appel ratio (Table2). GRR estimates from the two techniques differed onaverage by 1.3 offspring (range was 0–2.7). Thegreatest differences between the estimates for GRR made using the two techniques, was found inpopulations that had a high proportion of perinates(> 0.45). When the proportion of perinates exceededthe upper limit recommended for use of this formula,
estimates of GRR differed by more than one femaleoffspring.
Conclusion
This paper provides a quadratic equation (the subadultfertility formula) for estimating GRR using theproportion of young infants to subadults, developedfrom the Coale and Demeney’s Female Model WestLife Tables. Accuracy of this formula is similar to thatof a technique for estimating GRR using the
juvenile:adult ratio developed previously (Bocquet-
Appel & Masset, 1982). In a comparison of GRR estimates made from the subadult fertility formula andthe juvenile:adult ratio, both techniques performedsimilarly well across a diverse range of age pyramids.The subadult fertility formula estimated GRR withinÆ 1 female offspring when the proportion of perina-tes:subadults (0–1D2–19) is within the range of 0.12–0.45. When tested on a sample from the St. ThomasAnglican Church in Belleville, Ontario, estimates forGRR made using the subadult fertility formula
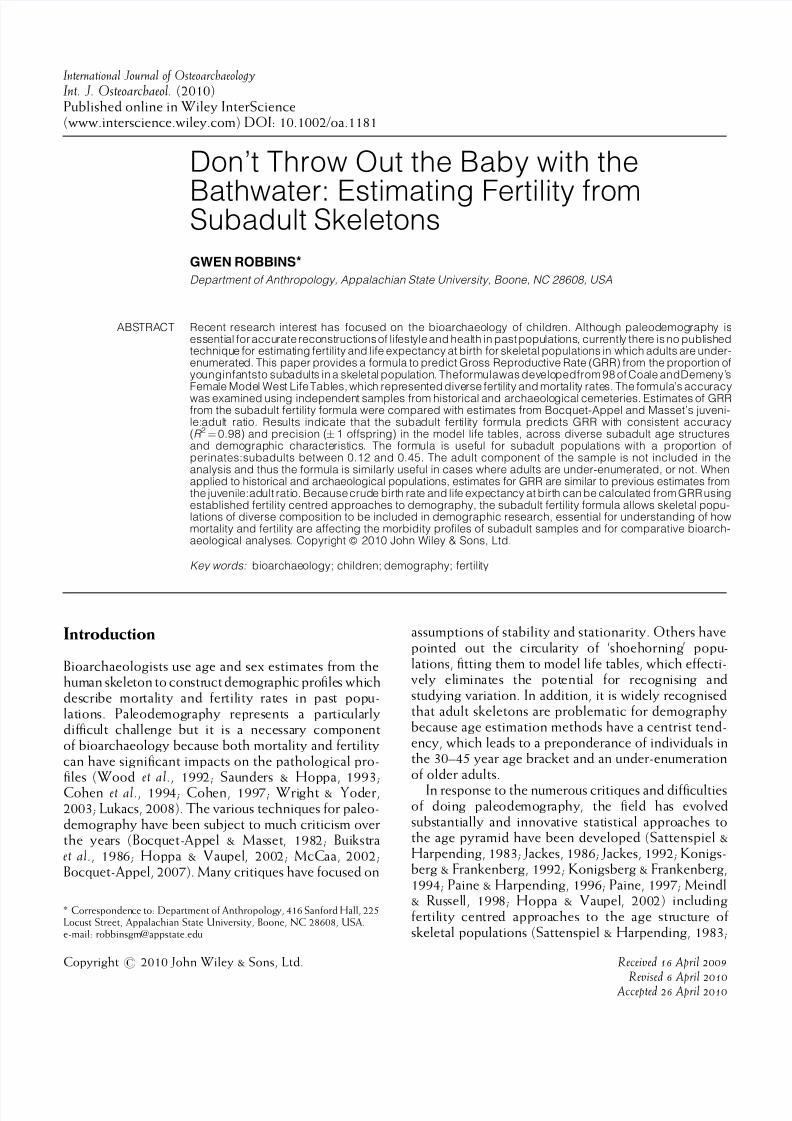
Table 2. Comparison of estimates of GRR from the perinatal fertility formula and Bocquet-Appel’s ratio using 12 populations from theHealth in the Western Hemisphere project (McCaa, 1998, 2002).
Population Perinates0–1 yr
Subadults2–19 yrs
Proportion
0–1D2–19
GRR from 5–14 D20þ GRR from
0–1D2–19
Accuracyjobs-predj
e x ¼ 20 e x ¼ 30 e x ¼ 40
Amelia Island 20 83 0.24 3.1 2.8 2.8 1.1 1.7Dickson Mound 25 56 0.45 5.0 4.4 4.3 6.2 1.2Chiribaya 39 152 0.26 3.2 3.2 3.1 1.5 1.6Estuquina 107 214 0.50 6.2 5.4 5.2 7.5 1.3Hawikku 40 83 0.48 4.3 3.8 3.7 7.0 2.7Loisy-en-Brie 19 50 0.38 3.6 3.2 3.2 4.8 1.2Maitas 21 55 0.38 4.8 4.2 4.1 4.8 0.0Monongahela 31 60 0.52 6.0 5.2 5.0 7.9 1.9Pearson 23 52 0.44 . . 6.6 6.1 0.5Scarborough 9 37 0.24 3.6 3.2 3.1 2.9 0.2Tlatilco 4 12 34 0.35 2.8 2.5 2.5 4.3 1.5
Figure 2. A comparison of the subadult fertility formula (Rob-bins) and another technique for estimating GRR (Bocquet-Appel). Accuracy (observed–predicted GRR) is shown hereby the proportion of subadults to adults ( 0–19 yearsD20–80 years)in 98 Female Model West Life Tables (Coale & Demeny, 1983).
Copyright # 2010 John Wiley & Sons, Ltd. Int. J. Osteoarchaeol. (2010)
G. Robbins

8/3/2019 2011 Robbins
http://slidepdf.com/reader/full/2011-robbins 5/6
compared favorably with those made previously usingthe juvenile:adult ratio (5–14D20þ), within 0.13 femaleoffspring. In a comparison of GRR estimates madeusing both techniques in 11 samples from the Health inthe Western Hemisphere project, the estimates werecomparable (mean difference
¼1.3 female offspring).
Thus in populations with a proportion of perinates:su-badults within the range of 0.12–0.45, the subadultfertility formula is useful for estimating GRR. Inpopulations for which the proportion of perinates:subadults falls outside this range, or in cases wherefertility is very high or very low (GRR <2 or GRR > 8),the accuracy of the formula declines significantly andthe Bocquet-Appel ratio should be preferred forestimating GRR. The subadult fertility formula canbe applied to populations in which adults are under-enumerated, or not, because the formula only reliesupon the subadult age pyramid. Thus, this method can
be applied in cases where there is independentevidence that the adult age pyramid is not representa-tive of the population as a whole due to burial practices,catastrophic mortality of adults, or other issues ofpreservation and representation.
Acknowledgements
The author thanks Jeanne Pierre Bocquet-Appel, JohnLukacs, S.R. Walimbe, Clark Larsen, Mark NathanCohen, Michael Pietrusewsky, Stephen Frost, J. JoshSnodgrass and Frances White for comments on aprevious version of this paper. She also acknowledgesthe anonymous reviewers for their valuable commentson the paper as well. This research was sponsored bythe American institute of Indian Studies, the GeorgeFranklin Dales Foundation, Fulbright IIE and the Uni-versity of Oregon Graduate School.
References
Angel JL. 1969. The bases of paleodemography. American Journal of Physical Anthropology 30: 427–437.
Bocquet-Appel JP. 2007. Recent Advances in Paleodemography: Data, Techniques and Patterns. Springer: Dordrecht.
Bocquet-Appel JP, Masset C. 1982. Farewell to paleodemo-graphy. Journal of Human Evolution 11: 321–333.
Buikstra JE, Konigsberg LW, Bullington J. 1986. Fertility andthe development of agriculture in the prehistoric midwest.
American Antiquity 51: 528–546.Coale AJ, Demeny P. 1983. Regional Model Life Tables and Stable
Populations. Academic Press: New York.Cohen MN. 1997. Does paleopathology measure com-
munity health? A rebuttal of ‘the osteological paradox’
and its implications for world prehistory. In Integrating Archaeological Demography: Multidisciplinary Approaches to Pre-historic Population, Paine RR (ed.). Southern Illinois Uni-versity: Carbondale; 242–262.
Cohen MN, Wood JW, Milner GR. 1994. The osteologicalparadox reconsidered. Current Anthropology 35: 629–637.
Hoppa RD, Vaupel JW. 2002. Paleodemography: Age Distri-butions from Skeletal Samples. Cambridge University Press:New York.
Horowitz S, Armelagos G, Wachter K. 1988. On generatingbirth rates from skeletal populations. American Journal of
Physical Anthropology 76: 189–196. Jackes M. 1986. The mortality of Ontario archaeological
populations. Canadian Journal of Anthropology 5: 33–48.
Jackes M. 1992. Palaeodemography: problems and tech-niques. In Skeletal Biology of Past Peoples: Research Methods,Saunders SR, Katzenberg A (eds). Wiley Liss, Inc.: NewYork; 189–224.
Konigsberg LW, Frankenberg SR. 1992. Estimation of agestructure in anthropological demography. American Journalof Physical Anthropology 89: 235–256.
Konigsberg LW, Frankenberg SR. 1994. Paleodemography:‘Not quite dead’. Evolutionary Anthropology 3: 92–105.
Last JM., 2001. A Dictionary of Epidemiology. Oxford UniversityPress: Oxford.
Livi-Bacci M. 2007. A Concise History of World Population.Blackwell: Oxford.
Lukacs JR. 2008. Fertility and agriculture accentuate sexdifferences in dental caries rates. Current Anthropology 49:901–914.
McCaa R. 1998. Calibrating paleodemography: the unifor-mitarian challenge turned. American Association of Physical
Anthropology Annual Meeting, Salt Lake City.McCaa R. 2002. Paleodemography of the Americas. In The
Backbone of History: Health and Nutrition in the Western Hemi-sphere, Steckel RH, Rose JC (eds). Cambridge UniversityPress: New York; 94–126.
Meindl RS, Russell KF. 1998. Recent advances in methodand theory in paleodemography. Annual review of Anthro-pology 27: 375–399.
Paine RR. 1997. Integrating Archaeological Demography: Multi-disciplinary Approaches to Prehistoric Population. SIU: Carbon-dale, IL.
Paine RR, Harpending HC. 1996. The reliability of paleo-demographic fertility estimators. American Journal of
Physical Anthropology 101: 151–160.Sattenspiel L, Harpending H. 1983. Stable populations and
skeletal age. American Antiquity 48: 489–498.Saunders SR, Hoppa RD. 1993. Growth deficit in survivors
and non-survivors: biological mortality bias in subadultskeletal samples. Yearbook of Physical Anthropology 2000. 36(S17): 127–151.
Saunders SR, Herring DA, Boyce G. 1995. Can skeletalsamples accurately represent the living population theycome from? The St. Thomas Cemetery site, Belleville,Ontario. In Bodies of Evidence: Reconstructing History Through
Copyright # 2010 John Wiley & Sons, Ltd. Int. J. Osteoarchaeol. (2010)
Paleodemography for Subadult Populations from India

8/3/2019 2011 Robbins
http://slidepdf.com/reader/full/2011-robbins 6/6
Skeletal Analysis, Grauer AL (ed.). Wiley-Liss: New York;69–89.
Saunders SR, Herring A, Sawchuk L, Boyce G, Hoppa R,Klepp S. 2002. The St. Thomas Anglican Church project.In The Backbone of History: Health and Nutrition in the Western
Hemisphere, Steckel RH, Rose JC (eds). Cambridge
University Press: New York.Steckel RH, Rose JC. 2002. The Backbone of History: Health and
Nutrition in the Western Hemisphere. Cambridge UniversityPress: New York.
Weiss KM. 1973. Demographic Models for Anthropology. Societyfor American Archaeology: San Fransisco, CA.
Wood JW, Milner GR, Harpending H, Weiss KM. 1992.The osteological paradox: problems of inferring prehis-toric health from skeletal samples. Current Anthropology 33:343–370.
Wright L, Yoder C. 2003. Recent progress in bioarchaeol-ogy: approaches to the osteological paradox. Journal of
Archaeological Research 11: 1059–1061.
Copyright # 2010 John Wiley & Sons, Ltd. Int. J. Osteoarchaeol. (2010)
G. Robbins